Embed Size (px)
Citation preview
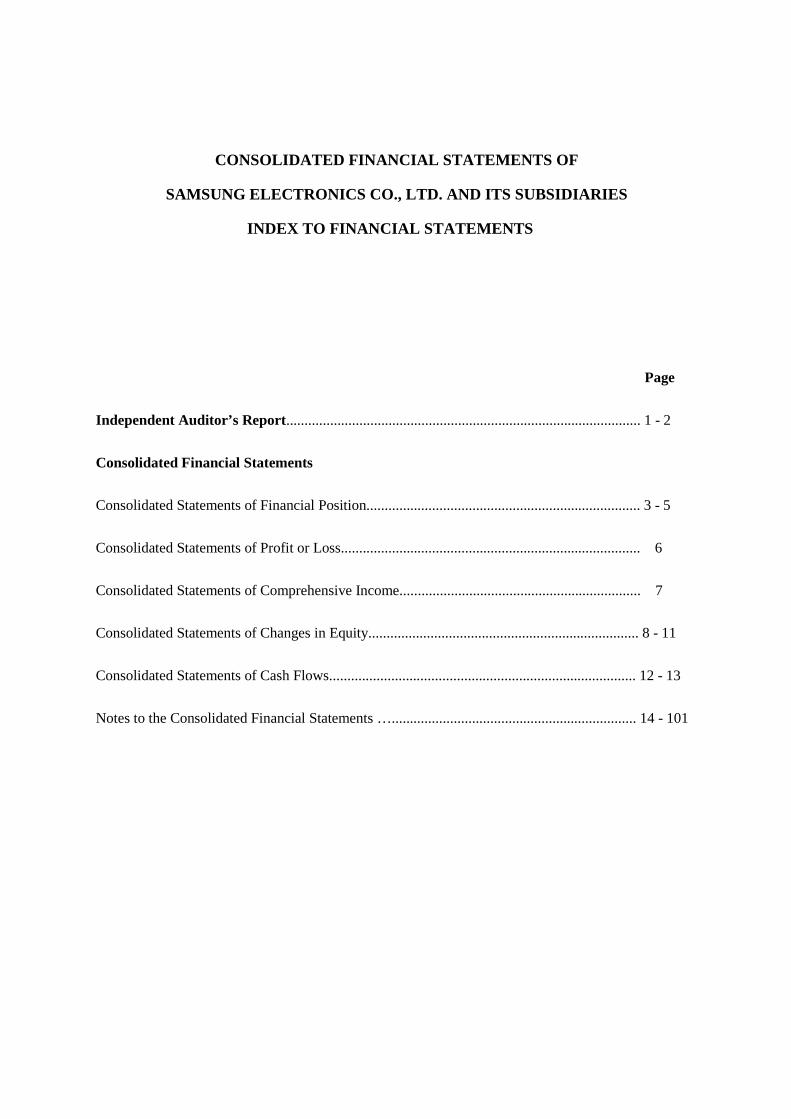
CONSOLIDATED FINANCIAL STATEMENTS OF
SAMSUNG ELECTRONICS CO., LTD. AND ITS SUBSIDIARIES
INDEX TO FINANCIAL STATEMENTS
Page
Independent Auditor’s Report................................................................................................. 1 - 2
Consolidated Financial Statements
Consolidated Statements of Financial Position........................................................................... 3 - 5
Consolidated Statements of Profit or Loss.................................................................................. 6
Consolidated Statements of Comprehensive Income.................................................................. 7
Consolidated Statements of Changes in Equity.......................................................................... 8 - 11
Consolidated Statements of Cash Flows.................................................................................... 12 - 13
Notes to the Consolidated Financial Statements …................................................................... 14 - 101
1
Independent Auditor’s Report
(English Translation of a Report Originally Issued in Korean)
To the Board of Directors and Shareholders of
Samsung Electronics Co., Ltd.
We have audited the accompanying consolidated financial statements of Samsung Electronics Co., Ltd.
and its subsidiaries (collectively referred to as the "Company"), which comprise the consolidated
statements of financial position as at December 31, 2017 and 2016, and the consolidated statements of
comprehensive income and profit or loss, consolidated statements of changes in equity and consolidated
statements of cash flows for the years then ended, and notes to the consolidated financial statements,
including a summary of significant accounting policies and other explanatory information, expressed in
Korean Won.
Management’s Responsibility for the Financial Statements
Management is responsible for the preparation and fair presentation of the consolidated financial
statements in accordance with International Financial Reporting Standards as adopted by the Republic
of Korea (“Korean IFRS”), and for such internal control as management determines is necessary to
enable the preparation of financial statements that are free from material misstatement, whether due to
fraud or error.
Auditor’s Responsibility
Our responsibility is to express an opinion on the consolidated financial statements based on our audits.
We conducted our audits in accordance with Korean Standards on Auditing. Those standards require
that we comply with ethical requirements, and plan and perform the audit to obtain reasonable assurance
about whether the consolidated financial statements are free from material misstatement.
An audit involves performing procedures to obtain audit evidence about the amounts and disclosures in
the consolidated financial statements. The procedures selected depend on the auditor's judgment,
including the assessment of the risks of material misstatement of the consolidated financial statements,
whether due to fraud or error. In making those risk assessments, the auditor considers internal control
relevant to the entity's preparation and fair presentation of the consolidated financial statements in order
to design audit procedures that are appropriate in the circumstances, but not for the purpose of
expressing an opinion on the effectiveness of the entity's internal control. An audit also includes
evaluating the appropriateness of accounting policies used and the reasonableness of significant
accounting estimates made by management, as well as evaluating the overall presentation of the
consolidated financial statements.

2
We believe that the audit evidence we have obtained is sufficient and appropriate to provide a basis for
our audit opinion.
Opinion
In our opinion, the accompanying consolidated financial statements present fairly, in all material
respects, the consolidated financial position of the Company as at December 31, 2017 and 2016, and its
consolidated financial performance and its consolidated cash flows for the years then ended in
accordance with Korean IFRS.
Auditing standards and their application in practice vary among countries. The procedures and practices
used in the Republic of Korea to audit such financial statements may differ from those generally
accepted and applied in other countries.
February 27, 2018
Seoul, Korea
This report is effective as of February 27, 2018, the audit report date. Certain subsequent events orcircumstances, which may occur between the audit report date and the time of reading this report, could have amaterial impact on the accompanying consolidated financial statements and notes thereto. Accordingly, thereaders of the audit report should understand that there is a possibility that the above audit report may have tobe revised to reflect the impact of such subsequent events or circumstances, if any.
3
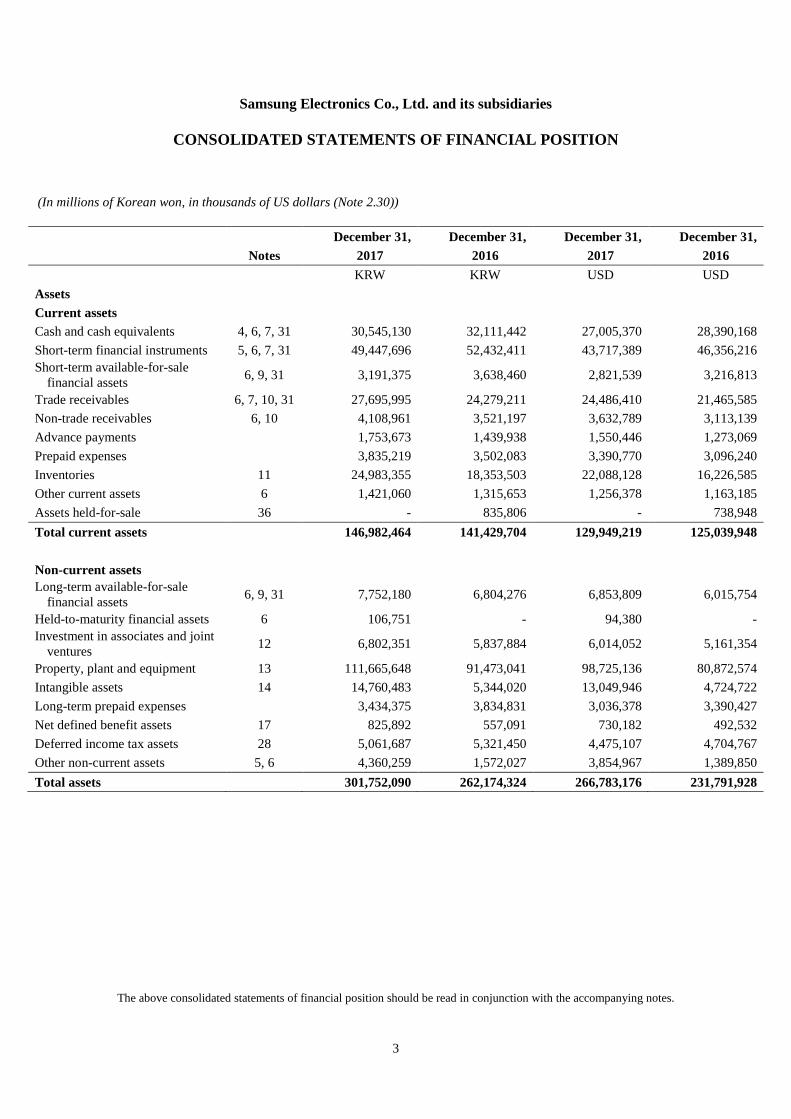
Samsung Electronics Co., Ltd. and its subsidiaries
CONSOLIDATED STATEMENTS OF FINANCIAL POSITION
(In millions of Korean won, in thousands of US dollars (Note 2.30))
December 31, December 31, December 31, December 31,
Notes 2017 2016 2017 2016
KRW KRW USD USD
Assets
Current assets
Cash and cash equivalents 4, 6, 7, 31 30,545,130 32,111,442 27,005,370 28,390,168
Short-term financial instruments 5, 6, 7, 31 49,447,696 52,432,411 43,717,389 46,356,216
Short-term available-for-salefinancial assets
6, 9, 31 3,191,375 3,638,460 2,821,539 3,216,813
Trade receivables 6, 7, 10, 31 27,695,995 24,279,211 24,486,410 21,465,585
Non-trade receivables 6, 10 4,108,961 3,521,197 3,632,789 3,113,139
Advance payments 1,753,673 1,439,938 1,550,446 1,273,069
Prepaid expenses 3,835,219 3,502,083 3,390,770 3,096,240
Inventories 11 24,983,355 18,353,503 22,088,128 16,226,585
Other current assets 6 1,421,060 1,315,653 1,256,378 1,163,185
Assets held-for-sale 36 - 835,806 - 738,948
Total current assets 146,982,464 141,429,704 129,949,219 125,039,948
Non-current assets
Long-term available-for-salefinancial assets
6, 9, 31 7,752,180 6,804,276 6,853,809 6,015,754
Held-to-maturity financial assets 6 106,751 - 94,380 -
Investment in associates and jointventures
12 6,802,351 5,837,884 6,014,052 5,161,354
Property, plant and equipment 13 111,665,648 91,473,041 98,725,136 80,872,574
Intangible assets 14 14,760,483 5,344,020 13,049,946 4,724,722
Long-term prepaid expenses 3,434,375 3,834,831 3,036,378 3,390,427
Net defined benefit assets 17 825,892 557,091 730,182 492,532
Deferred income tax assets 28 5,061,687 5,321,450 4,475,107 4,704,767
Other non-current assets 5, 6 4,360,259 1,572,027 3,854,967 1,389,850
Total assets 301,752,090 262,174,324 266,783,176 231,791,928
The above consolidated statements of financial position should be read in conjunction with the accompanying notes.

4
Samsung Electronics Co., Ltd. and its subsidiaries
CONSOLIDATED STATEMENTS OF FINANCIAL POSITION
(In millions of Korean won, in thousands of US dollars (Note 2.30))
December 31, December 31, December 31, December 31,
Notes 2017 2016 2017 2016
KRW KRW USD USD
Liabilities and Equity
Current liabilities
Trade payables 6, 31 9,083,907 6,485,039 8,031,207 5,733,512
Short-term borrowings 6, 8, 15, 31 15,767,619 12,746,789 13,940,369 11,269,612
Other payables 6, 31 13,899,633 11,525,910 12,288,857 10,190,216
Advances received 1,249,174 1,358,878 1,104,412 1,201,403
Withholdings 6 793,582 685,028 701,617 605,643
Accrued expenses 6 13,996,273 12,527,300 12,374,298 11,075,558
Income tax payable 7,408,348 2,837,353 6,549,822 2,508,543
Current portion of long-termliabilities
6, 15, 16, 31 278,619 1,232,817 246,331 1,089,950
Provisions 18 4,294,820 4,597,417 3,797,109 4,064,640
Other current liabilities 6 403,139 351,176 356,421 310,478
Liabilities held-for-sale 36 - 356,388 - 315,088
Total current liabilities 67,175,114 54,704,095 59,390,443 48,364,643
Non-current liabilities
Debentures 6, 16, 31 953,361 58,542 842,880 51,758
Long-term borrowings 6, 15, 31 1,814,446 1,244,238 1,604,177 1,100,048
Long-term other payables 6, 31 2,043,729 3,317,054 1,806,889 2,932,653
Net defined benefit liabilities 17 389,922 173,656 344,735 153,532
Deferred income tax liabilities 28 11,710,781 7,293,514 10,353,663 6,448,296
Provisions 18 464,324 358,126 410,515 316,624
Other non-current liabilities 6 2,708,985 2,062,066 2,395,050 1,823,101
Total liabilities 87,260,662 69,211,291 77,148,352 61,190,655
The above consolidated statements of financial position should be read in conjunction with the accompanying notes.

5
Samsung Electronics Co., Ltd. and its subsidiaries
CONSOLIDATED STATEMENTS OF FINANCIAL POSITION
(In millions of Korean won, in thousands of US dollars (Note 2.30))
December 31, December 31, December 31, December 31,
Notes 2017 2016 2017 2016
KRW KRW USD USD
Equity attributable to owners ofthe parent
Preference shares 20 119,467 119,467 105,622 105,622
Ordinary shares 20 778,047 778,047 687,882 687,882
Share premium 4,403,893 4,403,893 3,893,542 3,893,542
Retained earnings 21 215,811,200 193,086,317 190,801,652 170,710,271
Other components of equity 23 (13,899,191) (11,934,586) (12,288,465) (10,551,532)
Accumulated other comprehensiveincome attributable to assets held-for-sale
36 - (28,810) - (25,471)
207,213,416 186,424,328 183,200,233 164,820,314
Non-controlling interests 7,278,012 6,538,705 6,434,591 5,780,959
Total equity 214,491,428 192,963,033 189,634,824 170,601,273
Total liabilities and equity 301,752,090 262,174,324 266,783,176 231,791,928
The above consolidated statements of financial position should be read in conjunction with the accompanying notes.
6
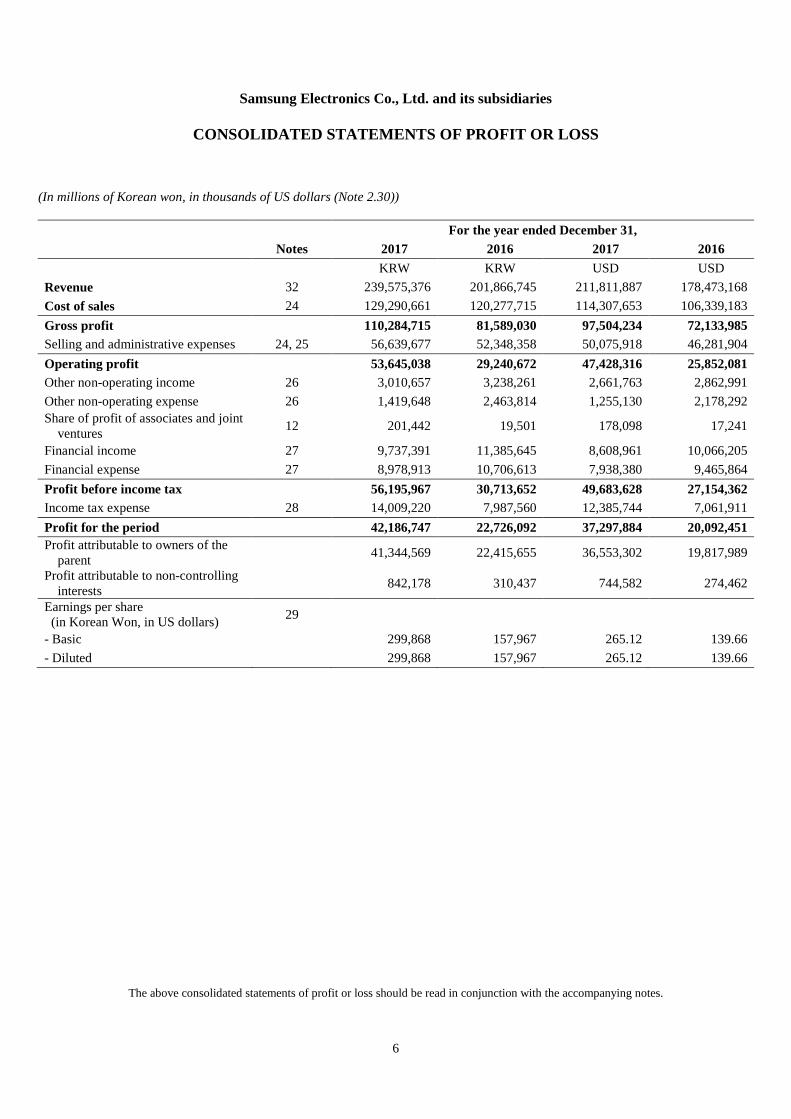
Samsung Electronics Co., Ltd. and its subsidiaries
CONSOLIDATED STATEMENTS OF PROFIT OR LOSS
(In millions of Korean won, in thousands of US dollars (Note 2.30))
For the year ended December 31,
Notes 2017 2016 2017 2016
KRW KRW USD USD
Revenue 32 239,575,376 201,866,745 211,811,887 178,473,168
Cost of sales 24 129,290,661 120,277,715 114,307,653 106,339,183
Gross profit 110,284,715 81,589,030 97,504,234 72,133,985
Selling and administrative expenses 24, 25 56,639,677 52,348,358 50,075,918 46,281,904
Operating profit 53,645,038 29,240,672 47,428,316 25,852,081
Other non-operating income 26 3,010,657 3,238,261 2,661,763 2,862,991
Other non-operating expense 26 1,419,648 2,463,814 1,255,130 2,178,292
Share of profit of associates and jointventures
12 201,442 19,501 178,098 17,241
Financial income 27 9,737,391 11,385,645 8,608,961 10,066,205
Financial expense 27 8,978,913 10,706,613 7,938,380 9,465,864
Profit before income tax 56,195,967 30,713,652 49,683,628 27,154,362
Income tax expense 28 14,009,220 7,987,560 12,385,744 7,061,911
Profit for the period 42,186,747 22,726,092 37,297,884 20,092,451
Profit attributable to owners of theparent
41,344,569 22,415,655 36,553,302 19,817,989
Profit attributable to non-controllinginterests
842,178 310,437 744,582 274,462
Earnings per share(in Korean Won, in US dollars)
29
- Basic 299,868 157,967 265.12 139.66
- Diluted 299,868 157,967 265.12 139.66
The above consolidated statements of profit or loss should be read in conjunction with the accompanying notes.
7
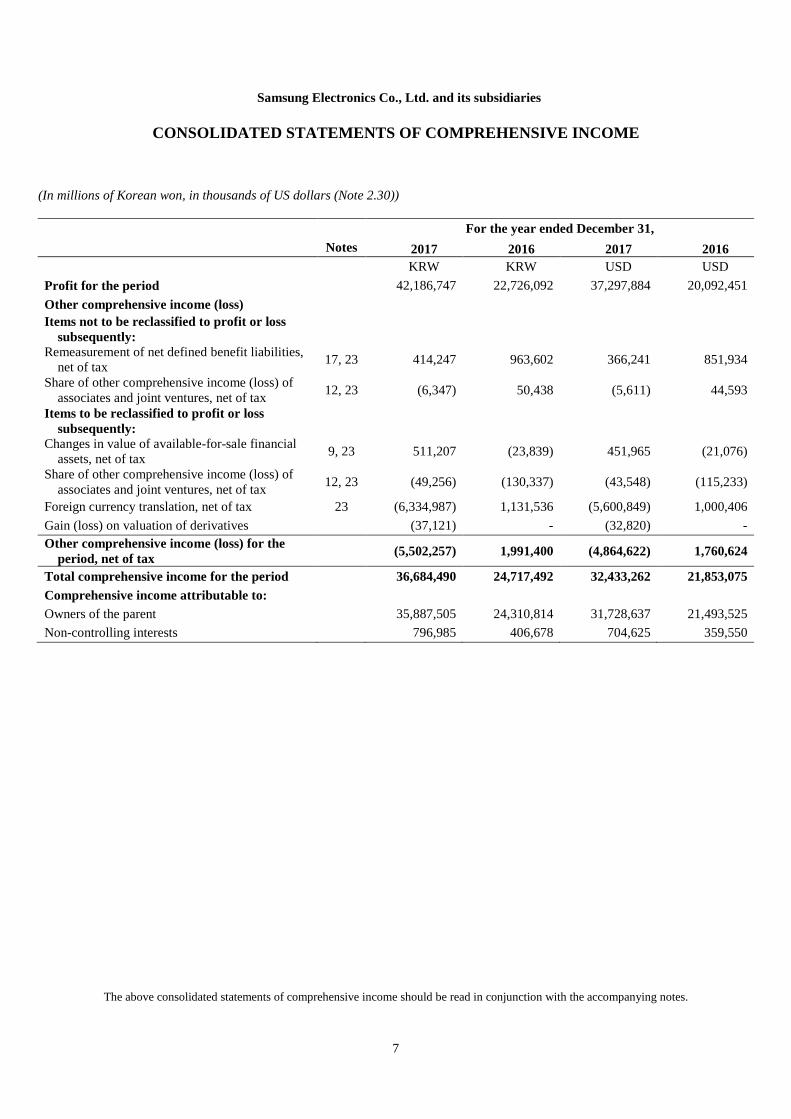
Samsung Electronics Co., Ltd. and its subsidiaries
CONSOLIDATED STATEMENTS OF COMPREHENSIVE INCOME
(In millions of Korean won, in thousands of US dollars (Note 2.30))
For the year ended December 31,
Notes 2017 2016 2017 2016
KRW KRW USD USD
Profit for the period 42,186,747 22,726,092 37,297,884 20,092,451
Other comprehensive income (loss)
Items not to be reclassified to profit or losssubsequently:
Remeasurement of net defined benefit liabilities,net of tax
17, 23 414,247 963,602 366,241 851,934
Share of other comprehensive income (loss) ofassociates and joint ventures, net of tax
12, 23 (6,347) 50,438 (5,611) 44,593
Items to be reclassified to profit or losssubsequently:
Changes in value of available-for-sale financialassets, net of tax
9, 23 511,207 (23,839) 451,965 (21,076)
Share of other comprehensive income (loss) ofassociates and joint ventures, net of tax
12, 23 (49,256) (130,337) (43,548) (115,233)
Foreign currency translation, net of tax 23 (6,334,987) 1,131,536 (5,600,849) 1,000,406
Gain (loss) on valuation of derivatives (37,121) - (32,820) -
Other comprehensive income (loss) for theperiod, net of tax
(5,502,257) 1,991,400 (4,864,622) 1,760,624
Total comprehensive income for the period 36,684,490 24,717,492 32,433,262 21,853,075
Comprehensive income attributable to:
Owners of the parent 35,887,505 24,310,814 31,728,637 21,493,525
Non-controlling interests 796,985 406,678 704,625 359,550
The above consolidated statements of comprehensive income should be read in conjunction with the accompanying notes.

8
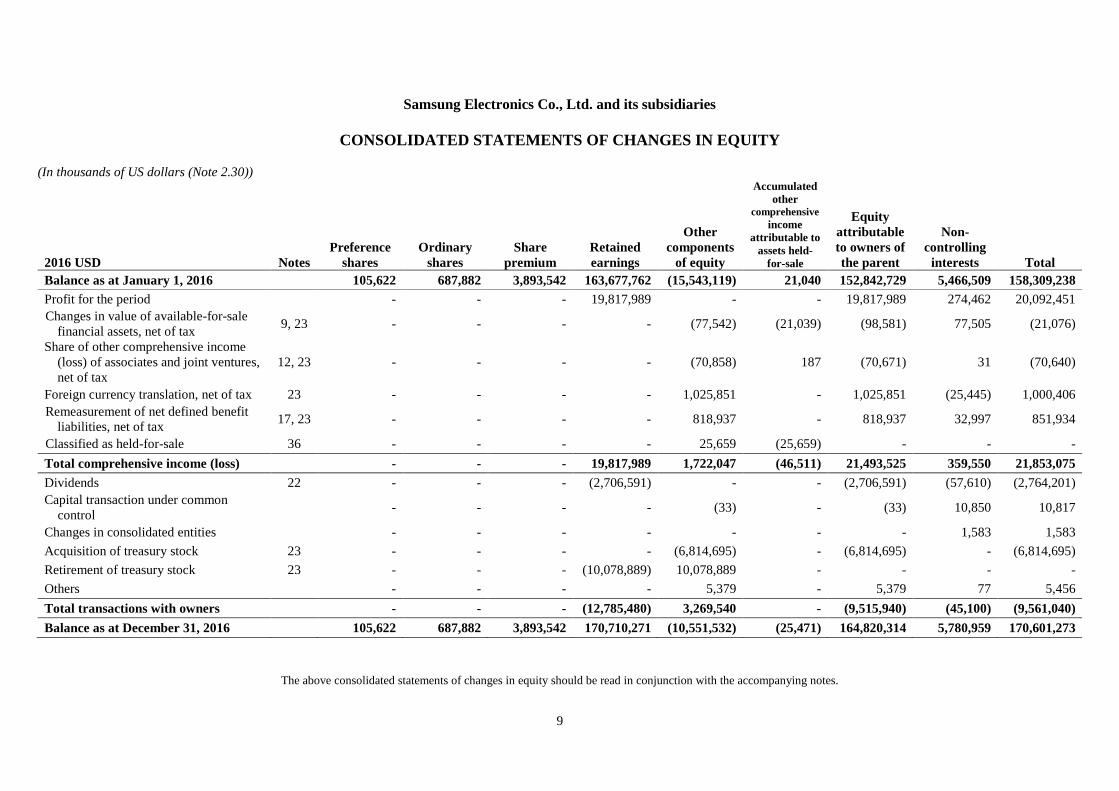
Samsung Electronics Co., Ltd. and its subsidiaries
CONSOLIDATED STATEMENTS OF CHANGES IN EQUITY
(In millions of Korean won)
2016 KRW NotesPreference
sharesOrdinary
sharesShare
premiumRetainedearnings
Othercomponents
of equity
Accumulatedother
comprehensiveincome
attributable toassets held-
for-sale
Equityattributableto owners ofthe parent
Non-controlling
interests Total
Balance as at January 1, 2016 119,467 778,047 4,403,893 185,132,014 (17,580,451) 23,797 172,876,767 6,183,038 179,059,805
Profit for the period - - - 22,415,655 - - 22,415,655 310,437 22,726,092
Changes in value of available-for-salefinancial assets, net of tax
9, 23 - - - - (87,706) (23,797) (111,503) 87,664 (23,839)
Share of other comprehensive income(loss) of associates and joint ventures,net of tax
12, 23 - - - - (80,146) 212 (79,934) 35 (79,899)
Foreign currency translation, net of tax 23 - - - - 1,160,316 - 1,160,316 (28,780) 1,131,536
Remeasurement of net defined benefitliabilities, net of tax
17, 23 - - - - 926,280 - 926,280 37,322 963,602
Classified as held-for-sale 36 - - - - 29,022 (29,022) - - -
Total comprehensive income (loss) - - - 22,415,655 1,947,766 (52,607) 24,310,814 406,678 24,717,492
Dividends 22 - - - (3,061,361) - - (3,061,361) (65,161) (3,126,522)
Capital transaction under commoncontrol
- - - - (37) - (37) 12,272 12,235
Changes in consolidated entities - - - - - - - 1,790 1,790
Acquisition of treasury stock 23 - - - - (7,707,938) - (7,707,938) - (7,707,938)
Retirement of treasury stock 23 - - - (11,399,991) 11,399,991 - - - -
Others - - - - 6,083 - 6,083 88 6,171
Total transactions with owners - - - (14,461,352) 3,698,099 - (10,763,253) (51,011) (10,814,264)
Balance as at December 31, 2016 119,467 778,047 4,403,893 193,086,317 (11,934,586) (28,810) 186,424,328 6,538,705 192,963,033
The above consolidated statements of changes in equity should be read in conjunction with the accompanying notes.
9
Samsung Electronics Co., Ltd. and its subsidiaries
CONSOLIDATED STATEMENTS OF CHANGES IN EQUITY
(In thousands of US dollars (Note 2.30))
2016 USD NotesPreference
sharesOrdinary
sharesShare
premiumRetainedearnings
Othercomponents
of equity
Accumulatedother
comprehensiveincome
attributable toassets held-
for-sale
Equityattributableto owners ofthe parent
Non-controlling
interests Total
Balance as at January 1, 2016 105,622 687,882 3,893,542 163,677,762 (15,543,119) 21,040 152,842,729 5,466,509 158,309,238
Profit for the period - - - 19,817,989 - - 19,817,989 274,462 20,092,451
Changes in value of available-for-salefinancial assets, net of tax
9, 23 - - - - (77,542) (21,039) (98,581) 77,505 (21,076)
Share of other comprehensive income(loss) of associates and joint ventures,net of tax
12, 23 - - - - (70,858) 187 (70,671) 31 (70,640)
Foreign currency translation, net of tax 23 - - - - 1,025,851 - 1,025,851 (25,445) 1,000,406
Remeasurement of net defined benefitliabilities, net of tax
17, 23 - - - - 818,937 - 818,937 32,997 851,934
Classified as held-for-sale 36 - - - - 25,659 (25,659) - - -
Total comprehensive income (loss) - - - 19,817,989 1,722,047 (46,511) 21,493,525 359,550 21,853,075
Dividends 22 - - - (2,706,591) - - (2,706,591) (57,610) (2,764,201)
Capital transaction under commoncontrol
- - - - (33) - (33) 10,850 10,817
Changes in consolidated entities - - - - - - - 1,583 1,583
Acquisition of treasury stock 23 - - - - (6,814,695) - (6,814,695) - (6,814,695)
Retirement of treasury stock 23 - - - (10,078,889) 10,078,889 - - - -
Others - - - - 5,379 - 5,379 77 5,456
Total transactions with owners - - - (12,785,480) 3,269,540 - (9,515,940) (45,100) (9,561,040)
Balance as at December 31, 2016 105,622 687,882 3,893,542 170,710,271 (10,551,532) (25,471) 164,820,314 5,780,959 170,601,273
The above consolidated statements of changes in equity should be read in conjunction with the accompanying notes.

10
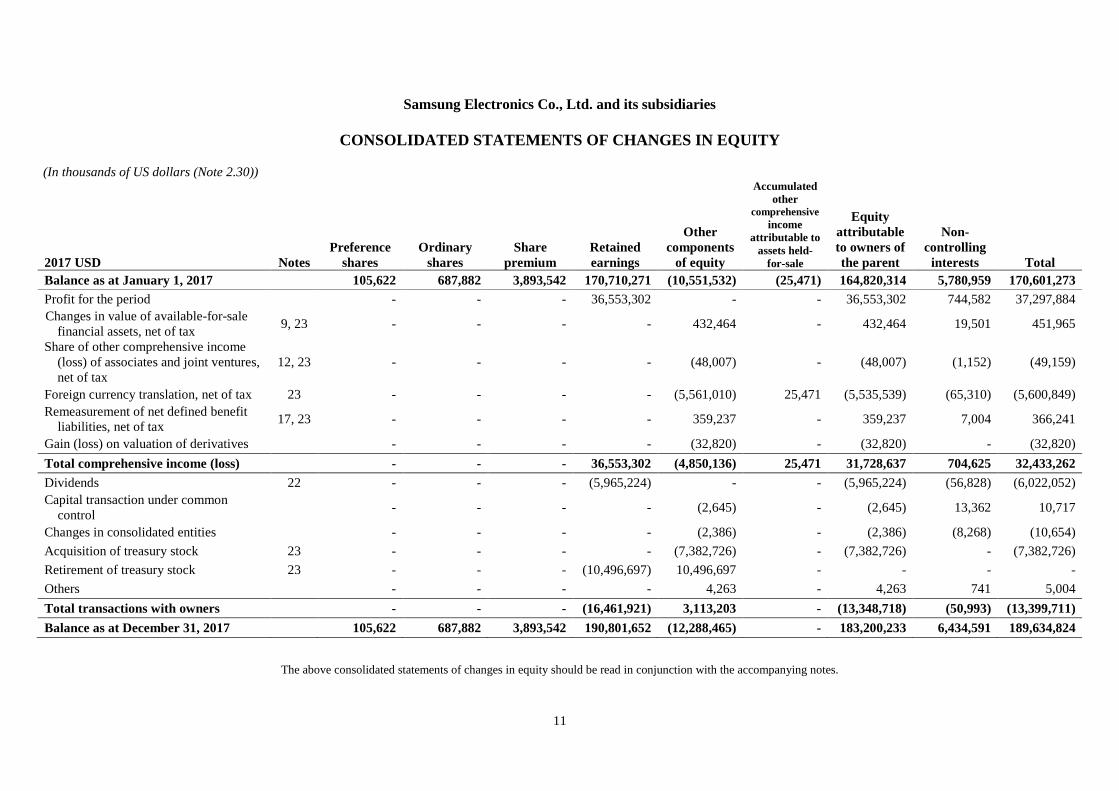
Samsung Electronics Co., Ltd. and its subsidiaries
CONSOLIDATED STATEMENTS OF CHANGES IN EQUITY
(In millions of Korean won)
2017 KRW NotesPreference
sharesOrdinary
sharesShare
premiumRetainedearnings
Othercomponents
of equity
Accumulatedother
comprehensiveincome
attributable toassets held-
for-sale
Equityattributableto owners ofthe parent
Non-controlling
interests Total
Balance as at January 1, 2017 119,467 778,047 4,403,893 193,086,317 (11,934,586) (28,810) 186,424,328 6,538,705 192,963,033
Profit for the period - - - 41,344,569 - - 41,344,569 842,178 42,186,747
Changes in value of available-for-salefinancial assets, net of tax
9, 23 - - - - 489,150 - 489,150 22,057 511,207
Share of other comprehensive income(loss) of associates and joint ventures,net of tax
12, 23 - - - - (54,300) - (54,300) (1,303) (55,603)
Foreign currency translation, net of tax 23 - - - - (6,289,926) 28,810 (6,261,116) (73,871) (6,334,987)
Remeasurement of net defined benefitliabilities, net of tax
17, 23 - - - - 406,323 - 406,323 7,924 414,247
Gain (loss) on valuation of derivatives - - - - (37,121) - (37,121) - (37,121)
Total comprehensive income (loss) - - - 41,344,569 (5,485,874) 28,810 35,887,505 796,985 36,684,490
Dividends 22 - - - (6,747,123) - - (6,747,123) (64,277) (6,811,400)
Capital transaction under common control - - - - (2,992) - (2,992) 15,114 12,122
Changes in consolidated entities - - - - (2,699) - (2,699) (9,352) (12,051)
Acquisition of treasury stock 23 - - - - (8,350,424) - (8,350,424) - (8,350,424)
Retirement of treasury stock 23 - - - (11,872,563) 11,872,563 - - - -
Others - - - - 4,821 - 4,821 837 5,658
Total transactions with owners - - - (18,619,686) 3,521,269 - (15,098,417) (57,678) (15,156,095)
Balance as at December 31, 2017 119,467 778,047 4,403,893 215,811,200 (13,899,191) - 207,213,416 7,278,012 214,491,428
The above consolidated statements of changes in equity should be read in conjunction with the accompanying notes.
11
Samsung Electronics Co., Ltd. and its subsidiaries
CONSOLIDATED STATEMENTS OF CHANGES IN EQUITY
(In thousands of US dollars (Note 2.30))
2017 USD NotesPreference
sharesOrdinary
sharesShare
premiumRetainedearnings
Othercomponents
of equity
Accumulatedother
comprehensiveincome
attributable toassets held-
for-sale
Equityattributableto owners ofthe parent
Non-controlling
interests Total
Balance as at January 1, 2017 105,622 687,882 3,893,542 170,710,271 (10,551,532) (25,471) 164,820,314 5,780,959 170,601,273
Profit for the period - - - 36,553,302 - - 36,553,302 744,582 37,297,884
Changes in value of available-for-salefinancial assets, net of tax
9, 23 - - - - 432,464 - 432,464 19,501 451,965
Share of other comprehensive income(loss) of associates and joint ventures,net of tax
12, 23 - - - - (48,007) - (48,007) (1,152) (49,159)
Foreign currency translation, net of tax 23 - - - - (5,561,010) 25,471 (5,535,539) (65,310) (5,600,849)
Remeasurement of net defined benefitliabilities, net of tax
17, 23 - - - - 359,237 - 359,237 7,004 366,241
Gain (loss) on valuation of derivatives - - - - (32,820) - (32,820) - (32,820)
Total comprehensive income (loss) - - - 36,553,302 (4,850,136) 25,471 31,728,637 704,625 32,433,262
Dividends 22 - - - (5,965,224) - - (5,965,224) (56,828) (6,022,052)
Capital transaction under commoncontrol
- - - - (2,645) - (2,645) 13,362 10,717
Changes in consolidated entities - - - - (2,386) - (2,386) (8,268) (10,654)
Acquisition of treasury stock 23 - - - - (7,382,726) - (7,382,726) - (7,382,726)
Retirement of treasury stock 23 - - - (10,496,697) 10,496,697 - - - -
Others - - - - 4,263 - 4,263 741 5,004
Total transactions with owners - - - (16,461,921) 3,113,203 - (13,348,718) (50,993) (13,399,711)
Balance as at December 31, 2017 105,622 687,882 3,893,542 190,801,652 (12,288,465) - 183,200,233 6,434,591 189,634,824
The above consolidated statements of changes in equity should be read in conjunction with the accompanying notes.
12
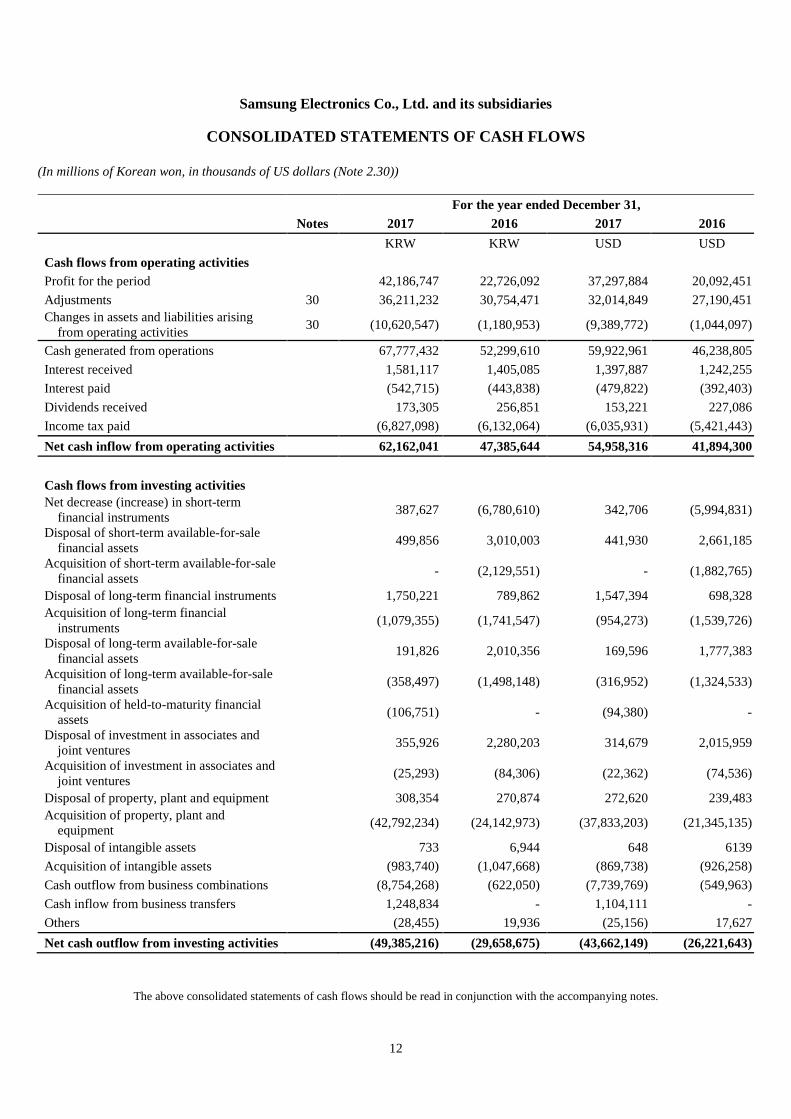
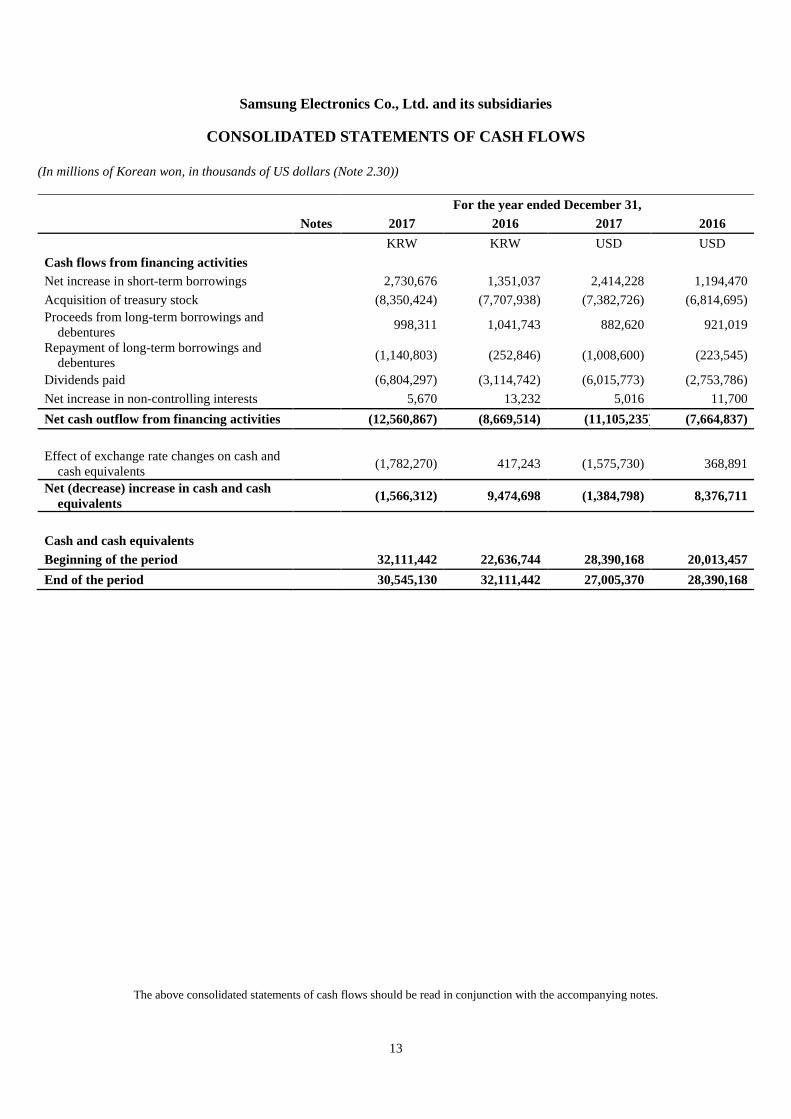
Samsung Electronics Co., Ltd. and its subsidiaries
CONSOLIDATED STATEMENTS OF CASH FLOWS
(In millions of Korean won, in thousands of US dollars (Note 2.30))
For the year ended December 31,
Notes 2017 2016 2017 2016
KRW KRW USD USD
Cash flows from operating activities
Profit for the period 42,186,747 22,726,092 37,297,884 20,092,451
Adjustments 30 36,211,232 30,754,471 32,014,849 27,190,451
Changes in assets and liabilities arisingfrom operating activities
30 (10,620,547) (1,180,953) (9,389,772) (1,044,097)
Cash generated from operations 67,777,432 52,299,610 59,922,961 46,238,805
Interest received 1,581,117 1,405,085 1,397,887 1,242,255
Interest paid (542,715) (443,838) (479,822) (392,403)
Dividends received 173,305 256,851 153,221 227,086
Income tax paid (6,827,098) (6,132,064) (6,035,931) (5,421,443)
Net cash inflow from operating activities 62,162,041 47,385,644 54,958,316 41,894,300
Cash flows from investing activities
Net decrease (increase) in short-termfinancial instruments
387,627 (6,780,610) 342,706 (5,994,831)
Disposal of short-term available-for-salefinancial assets
499,856 3,010,003 441,930 2,661,185
Acquisition of short-term available-for-salefinancial assets
- (2,129,551) - (1,882,765)
Disposal of long-term financial instruments 1,750,221 789,862 1,547,394 698,328
Acquisition of long-term financialinstruments
(1,079,355) (1,741,547) (954,273) (1,539,726)
Disposal of long-term available-for-salefinancial assets
191,826 2,010,356 169,596 1,777,383
Acquisition of long-term available-for-salefinancial assets
(358,497) (1,498,148) (316,952) (1,324,533)
Acquisition of held-to-maturity financialassets
(106,751) - (94,380) -
Disposal of investment in associates andjoint ventures
355,926 2,280,203 314,679 2,015,959
Acquisition of investment in associates andjoint ventures
(25,293) (84,306) (22,362) (74,536)
Disposal of property, plant and equipment 308,354 270,874 272,620 239,483
Acquisition of property, plant andequipment
(42,792,234) (24,142,973) (37,833,203) (21,345,135)
Disposal of intangible assets 733 6,944 648 6139
Acquisition of intangible assets (983,740) (1,047,668) (869,738) (926,258)
Cash outflow from business combinations (8,754,268) (622,050) (7,739,769) (549,963)
Cash inflow from business transfers 1,248,834 - 1,104,111 -
Others (28,455) 19,936 (25,156) 17,627
Net cash outflow from investing activities (49,385,216) (29,658,675) (43,662,149) (26,221,643)
The above consolidated statements of cash flows should be read in conjunction with the accompanying notes.
13
Samsung Electronics Co., Ltd. and its subsidiaries
CONSOLIDATED STATEMENTS OF CASH FLOWS
(In millions of Korean won, in thousands of US dollars (Note 2.30))
For the year ended December 31,
Notes 2017 2016 2017 2016
KRW KRW USD USD
Cash flows from financing activities
Net increase in short-term borrowings 2,730,676 1,351,037 2,414,228 1,194,470
Acquisition of treasury stock (8,350,424) (7,707,938) (7,382,726) (6,814,695)
Proceeds from long-term borrowings anddebentures
998,311 1,041,743 882,620 921,019
Repayment of long-term borrowings anddebentures
(1,140,803) (252,846) (1,008,600) (223,545)
Dividends paid (6,804,297) (3,114,742) (6,015,773) (2,753,786)
Net increase in non-controlling interests 5,670 13,232 5,016 11,700
Net cash outflow from financing activities (12,560,867) (8,669,514) (11,105,235) (7,664,837)
Effect of exchange rate changes on cash andcash equivalents
(1,782,270) 417,243 (1,575,730) 368,891
Net (decrease) increase in cash and cashequivalents
(1,566,312) 9,474,698 (1,384,798) 8,376,711
Cash and cash equivalents
Beginning of the period 32,111,442 22,636,744 28,390,168 20,013,457
End of the period 30,545,130 32,111,442 27,005,370 28,390,168
The above consolidated statements of cash flows should be read in conjunction with the accompanying notes.
Samsung Electronics Co., Ltd. and its Subsidiaries
NOTES TO THE CONSOLIDATED FINANCIAL STATEMENTS
14
1. General Information
1.1 Company Overview
Samsung Electronics Co., Ltd. (the “Company”) was incorporated under the laws of the Republic of Korea in 1969
and listed its shares on the Korea Stock Exchange in 1975. SEC and its subsidiaries (collectively referred to as the
“Company”) operate four business divisions: Consumer Electronics (“CE”), Information technology & Mobile
communications (“IM”), Device Solutions (“DS”) and Harman. The CE division includes digital TVs, monitors, air
conditioners and refrigerators and the IM division includes mobile phones, communication systems, and computers.
The DS division includes products such as Memory, Foundry and System LSI in the semiconductor business
(“Semiconductor”), and LCD and OLED panels in the display business (“DP”). The Harman division includes
connected car systems, audio and visual products, enterprise automation solutions and connected services. The
Company is domiciled in the Republic of Korea and the address of its registered office is Suwon, the Republic of
Korea.
These consolidated financial statements have been prepared in accordance with Korean International Financial
Reporting Standards (“Korean IFRS”) 1110, Consolidated Financial Statements. SEC, as the controlling company,
consolidates its 270 subsidiaries including Samsung Display and Samsung Electronics America. The Company also
applies the equity method of accounting for its 41 associates, including Samsung Electro-Mechanics.
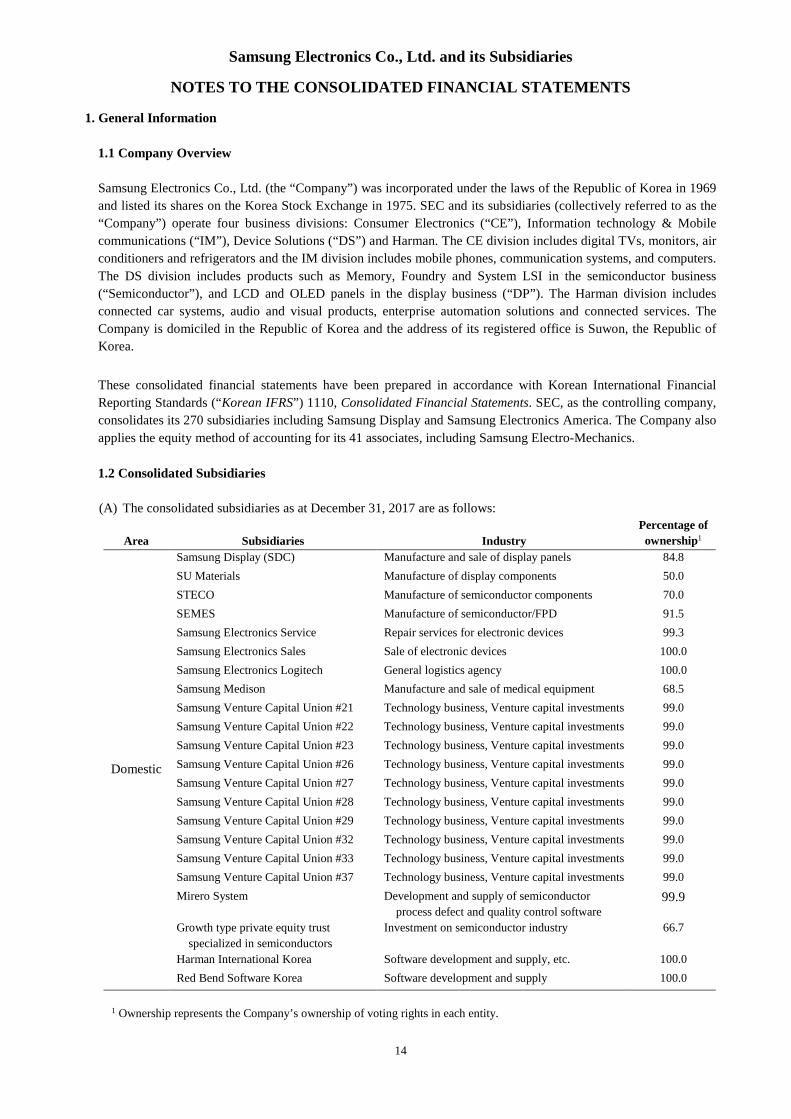
1.2 Consolidated Subsidiaries
(A) The consolidated subsidiaries as at December 31, 2017 are as follows:
Area Subsidiaries Industry
Percentage of
ownership1
Domestic
Samsung Display (SDC) Manufacture and sale of display panels 84.8
SU Materials Manufacture of display components 50.0
STECO Manufacture of semiconductor components 70.0
SEMES Manufacture of semiconductor/FPD 91.5
Samsung Electronics Service Repair services for electronic devices 99.3
Samsung Electronics Sales Sale of electronic devices 100.0
Samsung Electronics Logitech General logistics agency 100.0
Samsung Medison Manufacture and sale of medical equipment 68.5
Samsung Venture Capital Union #21 Technology business, Venture capital investments 99.0
Samsung Venture Capital Union #22 Technology business, Venture capital investments 99.0
Samsung Venture Capital Union #23 Technology business, Venture capital investments 99.0
Samsung Venture Capital Union #26 Technology business, Venture capital investments 99.0
Samsung Venture Capital Union #27 Technology business, Venture capital investments 99.0
Samsung Venture Capital Union #28 Technology business, Venture capital investments 99.0
Samsung Venture Capital Union #29 Technology business, Venture capital investments 99.0
Samsung Venture Capital Union #32 Technology business, Venture capital investments 99.0
Samsung Venture Capital Union #33 Technology business, Venture capital investments 99.0
Samsung Venture Capital Union #37 Technology business, Venture capital investments 99.0
Mirero System Development and supply of semiconductor
process defect and quality control software99.9
Growth type private equity trust
specialized in semiconductors
Investment on semiconductor industry 66.7
Harman International Korea Software development and supply, etc. 100.0
Red Bend Software Korea Software development and supply 100.0
1 Ownership represents the Company’s ownership of voting rights in each entity.
Samsung Electronics Co., Ltd. and its Subsidiaries
NOTES TO THE CONSOLIDATED FINANCIAL STATEMENTS
15
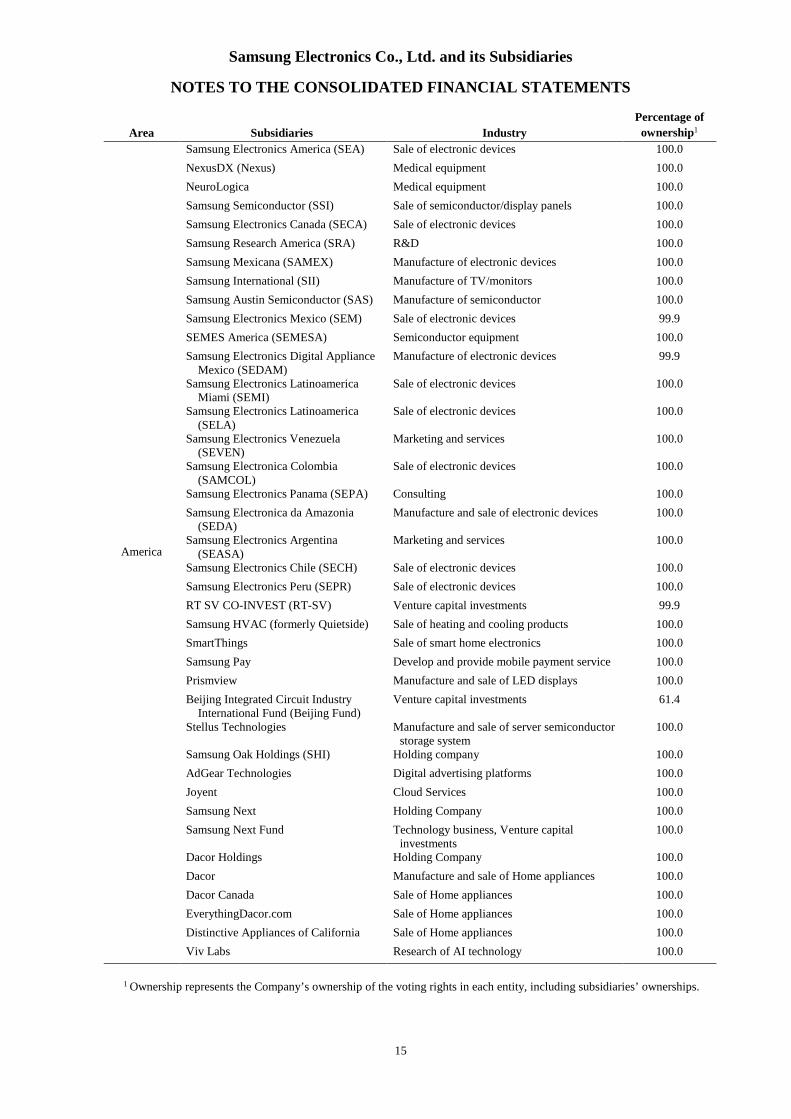
Area Subsidiaries Industry
Percentage of
ownership1
America
Samsung Electronics America (SEA) Sale of electronic devices 100.0
NexusDX (Nexus) Medical equipment 100.0
NeuroLogica Medical equipment 100.0
Samsung Semiconductor (SSI) Sale of semiconductor/display panels 100.0
Samsung Electronics Canada (SECA) Sale of electronic devices 100.0
Samsung Research America (SRA) R&D 100.0
Samsung Mexicana (SAMEX) Manufacture of electronic devices 100.0
Samsung International (SII) Manufacture of TV/monitors 100.0
Samsung Austin Semiconductor (SAS) Manufacture of semiconductor 100.0
Samsung Electronics Mexico (SEM) Sale of electronic devices 99.9
SEMES America (SEMESA) Semiconductor equipment 100.0
Samsung Electronics Digital ApplianceMexico (SEDAM)
Manufacture of electronic devices 99.9
Samsung Electronics LatinoamericaMiami (SEMI)
Sale of electronic devices 100.0
Samsung Electronics Latinoamerica(SELA)
Sale of electronic devices 100.0
Samsung Electronics Venezuela(SEVEN)
Marketing and services 100.0
Samsung Electronica Colombia(SAMCOL)
Sale of electronic devices 100.0
Samsung Electronics Panama (SEPA) Consulting 100.0
Samsung Electronica da Amazonia(SEDA)
Manufacture and sale of electronic devices 100.0
Samsung Electronics Argentina(SEASA)
Marketing and services 100.0
Samsung Electronics Chile (SECH) Sale of electronic devices 100.0
Samsung Electronics Peru (SEPR) Sale of electronic devices 100.0
RT SV CO-INVEST (RT-SV) Venture capital investments 99.9
Samsung HVAC (formerly Quietside) Sale of heating and cooling products 100.0
SmartThings Sale of smart home electronics 100.0
Samsung Pay Develop and provide mobile payment service 100.0
Prismview Manufacture and sale of LED displays 100.0
Beijing Integrated Circuit IndustryInternational Fund (Beijing Fund)
Venture capital investments 61.4
Stellus Technologies Manufacture and sale of server semiconductorstorage system
100.0
Samsung Oak Holdings (SHI) Holding company 100.0
AdGear Technologies Digital advertising platforms 100.0
Joyent Cloud Services 100.0
Samsung Next Holding Company 100.0
Samsung Next Fund Technology business, Venture capitalinvestments
100.0
Dacor Holdings Holding Company 100.0
Dacor Manufacture and sale of Home appliances 100.0
Dacor Canada Sale of Home appliances 100.0
EverythingDacor.com Sale of Home appliances 100.0
Distinctive Appliances of California Sale of Home appliances 100.0
Viv Labs Research of AI technology 100.0
1 Ownership represents the Company’s ownership of the voting rights in each entity, including subsidiaries’ ownerships.
Samsung Electronics Co., Ltd. and its Subsidiaries
NOTES TO THE CONSOLIDATED FINANCIAL STATEMENTS
16
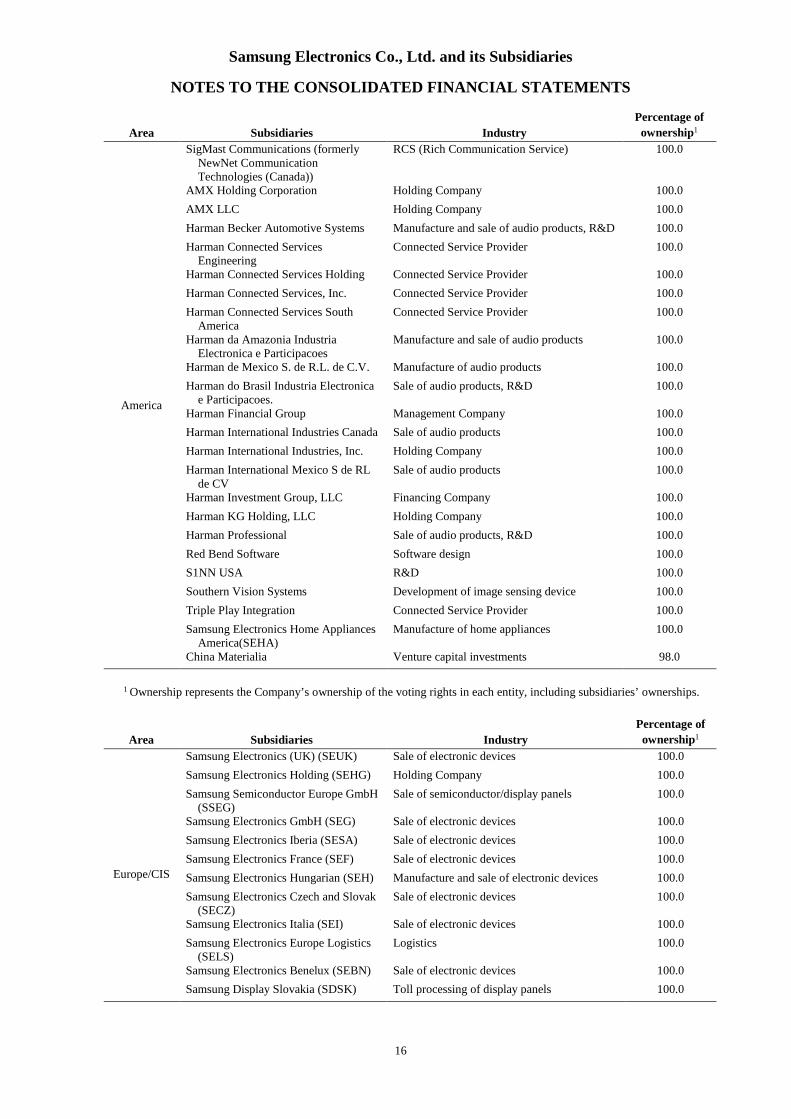
Area Subsidiaries Industry
Percentage of
ownership1
America
SigMast Communications (formerlyNewNet CommunicationTechnologies (Canada))
RCS (Rich Communication Service) 100.0
AMX Holding Corporation Holding Company 100.0
AMX LLC Holding Company 100.0
Harman Becker Automotive Systems Manufacture and sale of audio products, R&D 100.0
Harman Connected ServicesEngineering
Connected Service Provider 100.0
Harman Connected Services Holding Connected Service Provider 100.0
Harman Connected Services, Inc. Connected Service Provider 100.0
Harman Connected Services SouthAmerica
Connected Service Provider 100.0
Harman da Amazonia IndustriaElectronica e Participacoes
Manufacture and sale of audio products 100.0
Harman de Mexico S. de R.L. de C.V. Manufacture of audio products 100.0
Harman do Brasil Industria Electronicae Participacoes.
Sale of audio products, R&D 100.0
Harman Financial Group Management Company 100.0
Harman International Industries Canada Sale of audio products 100.0
Harman International Industries, Inc. Holding Company 100.0
Harman International Mexico S de RLde CV
Sale of audio products 100.0
Harman Investment Group, LLC Financing Company 100.0
Harman KG Holding, LLC Holding Company 100.0
Harman Professional Sale of audio products, R&D 100.0
Red Bend Software Software design 100.0
S1NN USA R&D 100.0
Southern Vision Systems Development of image sensing device 100.0
Triple Play Integration Connected Service Provider 100.0
Samsung Electronics Home AppliancesAmerica(SEHA)
Manufacture of home appliances 100.0
China Materialia Venture capital investments 98.0
1 Ownership represents the Company’s ownership of the voting rights in each entity, including subsidiaries’ ownerships.
Area Subsidiaries Industry
Percentage of
ownership1
Europe/CIS
Samsung Electronics (UK) (SEUK) Sale of electronic devices 100.0
Samsung Electronics Holding (SEHG) Holding Company 100.0
Samsung Semiconductor Europe GmbH(SSEG)
Sale of semiconductor/display panels 100.0
Samsung Electronics GmbH (SEG) Sale of electronic devices 100.0
Samsung Electronics Iberia (SESA) Sale of electronic devices 100.0
Samsung Electronics France (SEF) Sale of electronic devices 100.0
Samsung Electronics Hungarian (SEH) Manufacture and sale of electronic devices 100.0
Samsung Electronics Czech and Slovak(SECZ)
Sale of electronic devices 100.0
Samsung Electronics Italia (SEI) Sale of electronic devices 100.0
Samsung Electronics Europe Logistics(SELS)
Logistics 100.0
Samsung Electronics Benelux (SEBN) Sale of electronic devices 100.0
Samsung Display Slovakia (SDSK) Toll processing of display panels 100.0
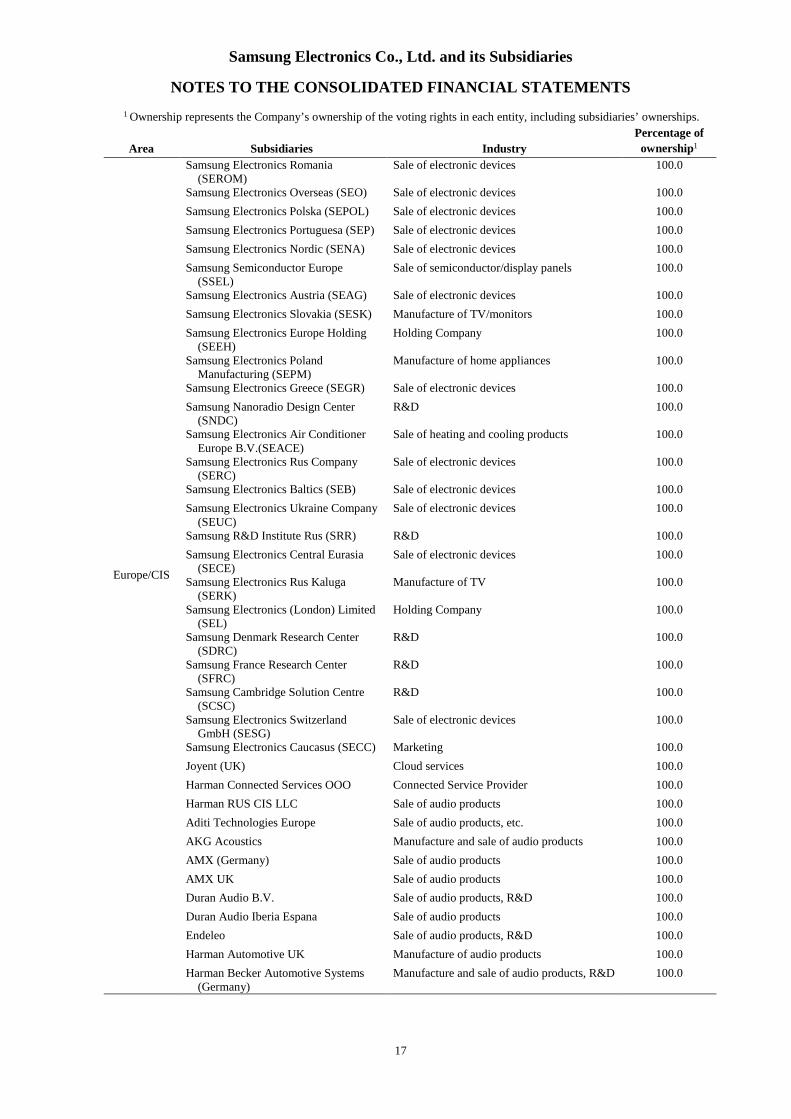
Samsung Electronics Co., Ltd. and its Subsidiaries
NOTES TO THE CONSOLIDATED FINANCIAL STATEMENTS
17
1 Ownership represents the Company’s ownership of the voting rights in each entity, including subsidiaries’ ownerships.
Area Subsidiaries Industry
Percentage of
ownership1
Europe/CIS
Samsung Electronics Romania(SEROM)
Sale of electronic devices 100.0
Samsung Electronics Overseas (SEO) Sale of electronic devices 100.0
Samsung Electronics Polska (SEPOL) Sale of electronic devices 100.0
Samsung Electronics Portuguesa (SEP) Sale of electronic devices 100.0
Samsung Electronics Nordic (SENA) Sale of electronic devices 100.0
Samsung Semiconductor Europe(SSEL)
Sale of semiconductor/display panels 100.0
Samsung Electronics Austria (SEAG) Sale of electronic devices 100.0
Samsung Electronics Slovakia (SESK) Manufacture of TV/monitors 100.0
Samsung Electronics Europe Holding(SEEH)
Holding Company 100.0
Samsung Electronics PolandManufacturing (SEPM)
Manufacture of home appliances 100.0
Samsung Electronics Greece (SEGR) Sale of electronic devices 100.0
Samsung Nanoradio Design Center(SNDC)
R&D 100.0
Samsung Electronics Air ConditionerEurope B.V.(SEACE)
Sale of heating and cooling products 100.0
Samsung Electronics Rus Company(SERC)
Sale of electronic devices 100.0
Samsung Electronics Baltics (SEB) Sale of electronic devices 100.0
Samsung Electronics Ukraine Company(SEUC)
Sale of electronic devices 100.0
Samsung R&D Institute Rus (SRR) R&D 100.0
Samsung Electronics Central Eurasia(SECE)
Sale of electronic devices 100.0
Samsung Electronics Rus Kaluga(SERK)
Manufacture of TV 100.0
Samsung Electronics (London) Limited(SEL)
Holding Company 100.0
Samsung Denmark Research Center(SDRC)
R&D 100.0
Samsung France Research Center(SFRC)
R&D 100.0
Samsung Cambridge Solution Centre(SCSC)
R&D 100.0
Samsung Electronics SwitzerlandGmbH (SESG)
Sale of electronic devices 100.0
Samsung Electronics Caucasus (SECC) Marketing 100.0
Joyent (UK) Cloud services 100.0
Harman Connected Services OOO Connected Service Provider 100.0
Harman RUS CIS LLC Sale of audio products 100.0
Aditi Technologies Europe Sale of audio products, etc. 100.0
AKG Acoustics Manufacture and sale of audio products 100.0
AMX (Germany) Sale of audio products 100.0
AMX UK Sale of audio products 100.0
Duran Audio B.V. Sale of audio products, R&D 100.0
Duran Audio Iberia Espana Sale of audio products 100.0
Endeleo Sale of audio products, R&D 100.0
Harman Automotive UK Manufacture of audio products 100.0
Harman Becker Automotive Systems(Germany)
Manufacture and sale of audio products, R&D 100.0
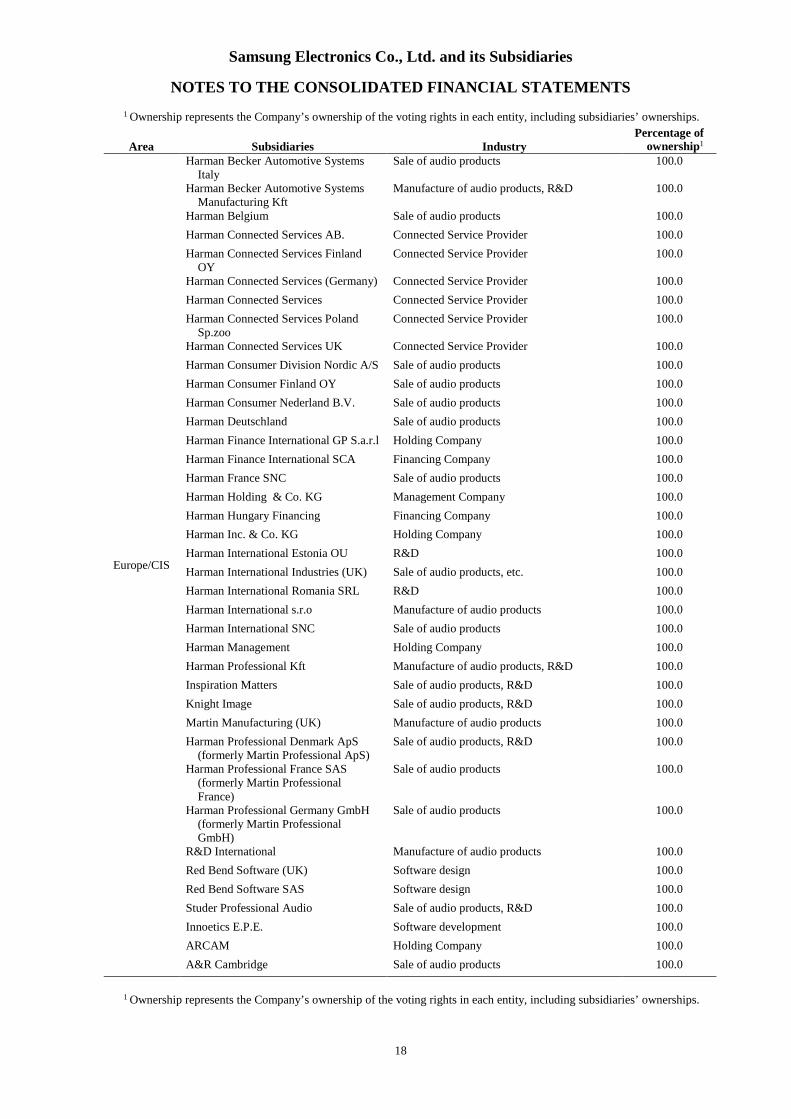
Samsung Electronics Co., Ltd. and its Subsidiaries
NOTES TO THE CONSOLIDATED FINANCIAL STATEMENTS
18
1 Ownership represents the Company’s ownership of the voting rights in each entity, including subsidiaries’ ownerships.
Area Subsidiaries IndustryPercentage of
ownership1
Europe/CIS
Harman Becker Automotive SystemsItaly
Sale of audio products 100.0
Harman Becker Automotive SystemsManufacturing Kft
Manufacture of audio products, R&D 100.0
Harman Belgium Sale of audio products 100.0
Harman Connected Services AB. Connected Service Provider 100.0
Harman Connected Services FinlandOY
Connected Service Provider 100.0
Harman Connected Services (Germany) Connected Service Provider 100.0
Harman Connected Services Connected Service Provider 100.0
Harman Connected Services PolandSp.zoo
Connected Service Provider 100.0
Harman Connected Services UK Connected Service Provider 100.0
Harman Consumer Division Nordic A/S Sale of audio products 100.0
Harman Consumer Finland OY Sale of audio products 100.0
Harman Consumer Nederland B.V. Sale of audio products 100.0
Harman Deutschland Sale of audio products 100.0
Harman Finance International GP S.a.r.l Holding Company 100.0
Harman Finance International SCA Financing Company 100.0
Harman France SNC Sale of audio products 100.0
Harman Holding & Co. KG Management Company 100.0
Harman Hungary Financing Financing Company 100.0
Harman Inc. & Co. KG Holding Company 100.0
Harman International Estonia OU R&D 100.0
Harman International Industries (UK) Sale of audio products, etc. 100.0
Harman International Romania SRL R&D 100.0
Harman International s.r.o Manufacture of audio products 100.0
Harman International SNC Sale of audio products 100.0
Harman Management Holding Company 100.0
Harman Professional Kft Manufacture of audio products, R&D 100.0
Inspiration Matters Sale of audio products, R&D 100.0
Knight Image Sale of audio products, R&D 100.0
Martin Manufacturing (UK) Manufacture of audio products 100.0
Harman Professional Denmark ApS(formerly Martin Professional ApS)
Sale of audio products, R&D 100.0
Harman Professional France SAS(formerly Martin ProfessionalFrance)
Sale of audio products 100.0
Harman Professional Germany GmbH(formerly Martin ProfessionalGmbH)
Sale of audio products 100.0
R&D International Manufacture of audio products 100.0
Red Bend Software (UK) Software design 100.0
Red Bend Software SAS Software design 100.0
Studer Professional Audio Sale of audio products, R&D 100.0
Innoetics E.P.E. Software development 100.0
ARCAM Holding Company 100.0
A&R Cambridge Sale of audio products 100.0
1 Ownership represents the Company’s ownership of the voting rights in each entity, including subsidiaries’ ownerships.

Samsung Electronics Co., Ltd. and its Subsidiaries
NOTES TO THE CONSOLIDATED FINANCIAL STATEMENTS
19
Area Subsidiaries Industry
Percentage of
ownership1
Middle East
and Africa
Samsung Electronics West Africa
(SEWA)
Marketing 100.0
Samsung Electronics East Africa
(SEEA)
Marketing 100.0
Samsung Gulf Electronics (SGE) Sale of electronic devices 100.0
Samsung Electronics Egypt (SEEG) Manufacture and sale of electronic devices 100.0
Samsung Electronics Israel (SEIL) Marketing 100.0
Samsung Electronics Tunisia (SETN) Marketing 100.0
Samsung Electronics Pakistan (SEPAK) Marketing 100.0
Samsung Electronics South Africa
(SSA)
Sale of electronic devices 100.0
Samsung Electronics Turkey (SETK) Sale of electronic devices 100.0
Samsung Semiconductor Israel R&D
Center (SIRC)
R&D 100.0
Samsung Electronics Levant (SELV) Sale of electronic devices 100.0
Samsung Electronics Maghreb Arab
(SEMAG)
Sale of electronic devices 100.0
Samsung Electronics South Africa
Production (SSAP)
Manufacture of TV/monitors 100.0
Broadsense Service 100.0
Global Symphony Technology Group Holding Company 100.0
Harman Connected Services Morocco Connected Service Provider 100.0
Harman Industries Holdings Mauritius Holding Company 100.0
iOnRoad R&D 100.0
iOnRoad Technologies R&D 100.0
Red Bend Manufacture of audio products 100.0
Towersec (Israel) R&D 100.0
1 Ownership represents the Company’s ownership of the voting rights in each entity, including subsidiaries’ ownerships.
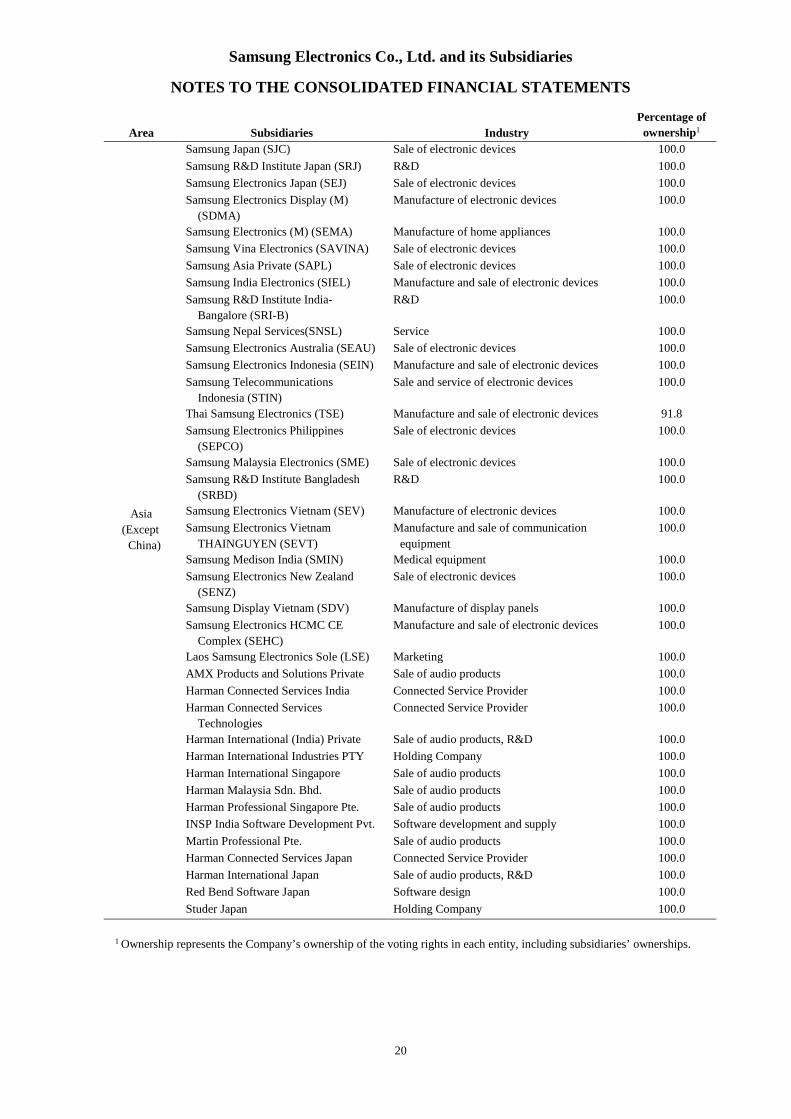
Samsung Electronics Co., Ltd. and its Subsidiaries
NOTES TO THE CONSOLIDATED FINANCIAL STATEMENTS
20
Area Subsidiaries Industry
Percentage of
ownership1
Asia
(Except
China)
Samsung Japan (SJC) Sale of electronic devices 100.0
Samsung R&D Institute Japan (SRJ) R&D 100.0
Samsung Electronics Japan (SEJ) Sale of electronic devices 100.0
Samsung Electronics Display (M)
(SDMA)
Manufacture of electronic devices 100.0
Samsung Electronics (M) (SEMA) Manufacture of home appliances 100.0
Samsung Vina Electronics (SAVINA) Sale of electronic devices 100.0
Samsung Asia Private (SAPL) Sale of electronic devices 100.0
Samsung India Electronics (SIEL) Manufacture and sale of electronic devices 100.0
Samsung R&D Institute India-
Bangalore (SRI-B)
R&D 100.0
Samsung Nepal Services(SNSL) Service 100.0
Samsung Electronics Australia (SEAU) Sale of electronic devices 100.0
Samsung Electronics Indonesia (SEIN) Manufacture and sale of electronic devices 100.0
Samsung Telecommunications
Indonesia (STIN)
Sale and service of electronic devices 100.0
Thai Samsung Electronics (TSE) Manufacture and sale of electronic devices 91.8
Samsung Electronics Philippines
(SEPCO)
Sale of electronic devices 100.0
Samsung Malaysia Electronics (SME) Sale of electronic devices 100.0
Samsung R&D Institute Bangladesh
(SRBD)
R&D 100.0
Samsung Electronics Vietnam (SEV) Manufacture of electronic devices 100.0
Samsung Electronics Vietnam
THAINGUYEN (SEVT)
Manufacture and sale of communication
equipment
100.0
Samsung Medison India (SMIN) Medical equipment 100.0
Samsung Electronics New Zealand
(SENZ)
Sale of electronic devices 100.0
Samsung Display Vietnam (SDV) Manufacture of display panels 100.0
Samsung Electronics HCMC CE
Complex (SEHC)
Manufacture and sale of electronic devices 100.0
Laos Samsung Electronics Sole (LSE) Marketing 100.0
AMX Products and Solutions Private Sale of audio products 100.0
Harman Connected Services India Connected Service Provider 100.0
Harman Connected Services
Technologies
Connected Service Provider 100.0
Harman International (India) Private Sale of audio products, R&D 100.0
Harman International Industries PTY Holding Company 100.0
Harman International Singapore Sale of audio products 100.0
Harman Malaysia Sdn. Bhd. Sale of audio products 100.0
Harman Professional Singapore Pte. Sale of audio products 100.0
INSP India Software Development Pvt. Software development and supply 100.0
Martin Professional Pte. Sale of audio products 100.0
Harman Connected Services Japan Connected Service Provider 100.0
Harman International Japan Sale of audio products, R&D 100.0
Red Bend Software Japan Software design 100.0
Studer Japan Holding Company 100.0
1 Ownership represents the Company’s ownership of the voting rights in each entity, including subsidiaries’ ownerships.

Samsung Electronics Co., Ltd. and its Subsidiaries
NOTES TO THE CONSOLIDATED FINANCIAL STATEMENTS
21
Area Subsidiaries IndustryPercentage of
ownership1
China
Samsung Display Dongguan (SDD) Manufacture of display panels 100.0
Samsung Display Tianjin (SDT) Manufacture of display panels 95.0
Samsung Electronics Hong Kong(SEHK)
Sale of electronic devices 100.0
Suzhou Samsung Electronics (SSEC) Manufacture of home appliances 88.3
Samsung Suzhou Electronics Export(SSEC-E)
Manufacture of home appliances 100.0
Samsung (China) Investment (SCIC) Sale of electronic devices 100.0
Samsung Mobile R&D Center China-Guangzhou (SRC-Guangzhou)
R&D 100.0
Samsung Tianjin Mobile DevelopmentCenter (STMC)
R&D 100.0
Samsung R&D Institute China-Shenzhen(SRC-Shenzhen)
R&D 100.0
Samsung Electronics SuzhouSemiconductor (SESS)
Toll processing of semiconductor 100.0
Samsung Electronics Huizhou (SEHZ) Manufacture of electronic devices 99.9
Tianjin Samsung Electronics (TSEC) Manufacture of TV/monitors 91.2
Samsung Electronics Taiwan (SET) Sale of electronic devices 100.0
Beijing Samsung Telecom R&D Center(BST)
R&D 100.0
Tianjin Samsung Telecom Technology(TSTC)
Manufacture of communication equipment 90.0
Shanghai Samsung Semiconductor(SSS)
Sale of semiconductor/display panels 100.0
Samsung Electronics Suzhou Computer(SESC)
Manufacture of electronic devices 100.0
Samsung Suzhou Module (SSM) Toll processing of display panels 100.0
Samsung Suzhou LCD (SSL) Manufacture of display panels 60.0
Shenzhen Samsung ElectronicsTelecommunication (SSET)
Manufacture of communication equipment 95.0
Samsung Semiconductor (China) R&D(SSCR)
R&D 100.0
Samsung Electronics China R&DCenter (SCRC)
R&D 100.0
Samsung (China) Semiconductor (SCS) Manufacture of semiconductor 100.0
Samsung Electronics (Beijing) Service(SBSC)
Services 100.0
Tianjin Samsung LED (TSLED) Manufacture of LED 100.0
SEMES (Xian) Semiconductor equipment 100.0
Samsung Semiconductor Xian (SSCX) Sale of semiconductor/display panels 100.0
Harman (China) Technologies Manufacture of audio products 100.0
Harman (Suzhou) Audio andInfotainment Systems
Sale of audio products 100.0
Harman Automotive Electronic Systems(Suzhou)
Manufacture of audio products, R&D 100.0
Harman Commercial (Shanghai) Sale of audio products 100.0
Harman Connected Services Taiwan Connected Service Provider 100.0
Harman Holding Sale of audio products 100.0
Harman International (China) Holdings Sale of audio products, R&D 100.0
Harman Automotive InfoTech (Dalian)(formerly Harman NeusoftAutomotive Infotech (Dalian))
Software development and supply 100.0
Harman Technology (Shenzhen) Sale of audio products, R&D 100.0
Harman Connected Services Solutions(Beijing)
Connected Service Provider 100.0
Harman Connected Services Solutions(Chengdu)
Connected Service Provider 100.0
1 Ownership represents the Company’s ownership of the voting rights in each entity, including subsidiaries’ ownerships.

Samsung Electronics Co., Ltd. and its Subsidiaries
NOTES TO THE CONSOLIDATED FINANCIAL STATEMENTS
22
(B) A summary of financial data of major consolidated subsidiaries is as follows:
(1) 2017
(In millions of Korean won)
2017
Assets Liabilities Sales
Net Income
(Loss)
Samsung Display (SDC) 50,723,199 12,243,688 30,111,427 3,352,802
Samsung Electronics America (SEA) 26,266,636 8,980,828 33,329,340 (70,198)
Harman and its subsidiaries1 14,676,715 5,391,669 7,103,437 209,015
Samsung (China) Investment (SCIC) 13,409,281 11,297,307 5,133,676 268,481
Samsung Display Vietnam (SDV) 10,460,755 9,495,803 18,193,257 1,257,300
Samsung Semiconductor (SSI) 10,125,193 5,376,696 28,870,987 83,113
Samsung Electronics VietnamTHAINGUYEN (SEVT)
10,044,337 2,325,221 28,323,302 3,043,210
Samsung Electronics Vietnam (SEV) 9,592,074 1,875,105 19,344,045 2,007,876
Samsung Electronics Europe Holding(SEEH)
9,474,960 7,241,753 - 18,294
Samsung (China) Semiconductor (SCS) 8,076,107 1,499,220 4,513,291 1,359,007
Samsung Electronics Huizhou (SEHZ) 6,440,564 980,064 13,521,077 689,594
Samsung India Electronics (SIEL) 6,200,351 3,406,484 10,393,877 654,408
Samsung Asia Private (SAPL) 6,138,652 481,546 1,848,905 1,293,924
Samsung Electronica da Amazonia(SEDA)
5,838,533 1,514,891 7,108,691 1,449,426
Shanghai Samsung Semiconductor (SSS) 5,169,438 4,182,832 24,198,255 236,410
Samsung Austin Semiconductor (SAS) 4,943,576 448,772 3,473,545 197,729
Thai Samsung Electronics (TSE) 2,191,519 371,379 4,594,861 164,627
Samsung Electronics Slovakia (SESK) 2,019,572 1,051,361 3,237,384 100,617
Samsung Suzhou LCD (SSL) 2,019,262 852,618 1,802,543 107,677
Samsung Electronics Europe Logistics(SELS)
1,927,321 1,810,014 14,060,511 6,718
Samsung Electronics Hungarian (SEH) 1,823,278 238,383 2,768,150 459,848
Samsung Electronics HCMC CEComplex (SEHC)
1,784,883 1,282,489 3,940,762 302,674
Samsung Electronics GmbH (SEG) 1,743,138 1,685,252 6,536,684 530
Samsung Electronics (UK) (SEUK) 1,615,723 1,094,995 4,843,150 99,024
Samsung Electronics Indonesia (SEIN) 1,562,037 1,002,213 3,025,611 77,149
1 Consolidated financial data of an intermediate company that includes Harman International Industries, Inc. and its subsidiaries.
Samsung Electronics Co., Ltd. and its Subsidiaries
NOTES TO THE CONSOLIDATED FINANCIAL STATEMENTS
23
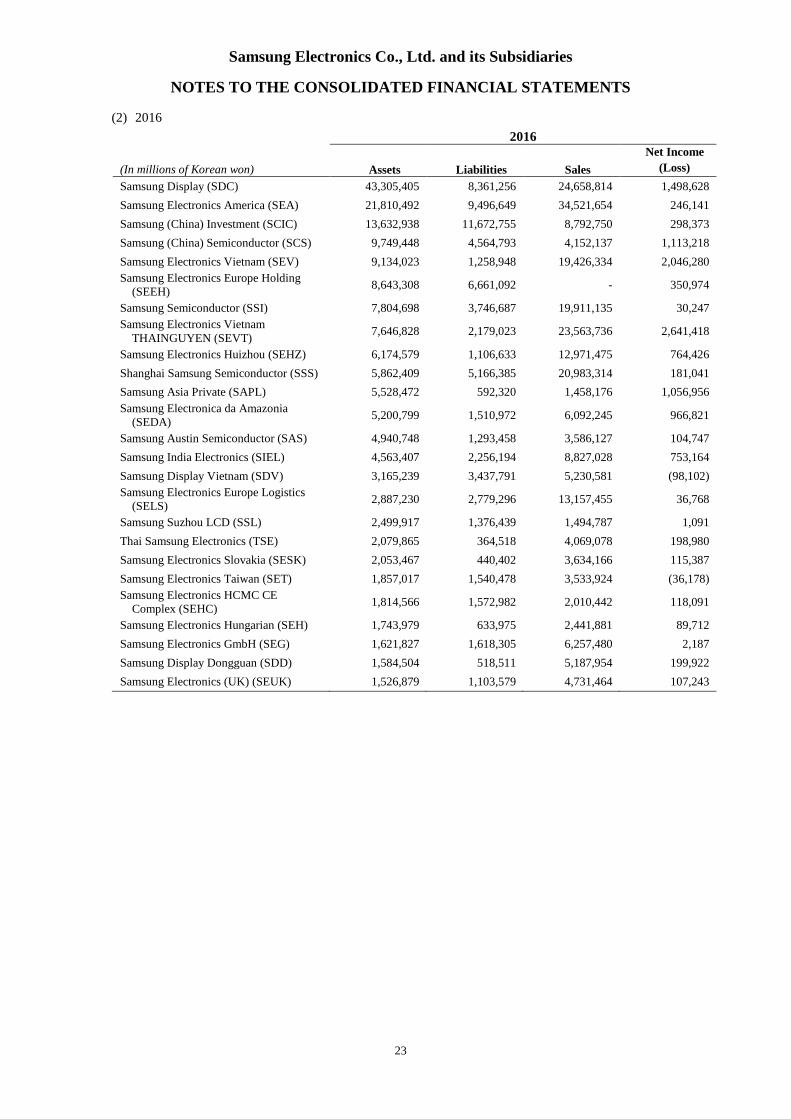
(2) 2016
(In millions of Korean won)
2016
Assets Liabilities Sales
Net Income
(Loss)
Samsung Display (SDC) 43,305,405 8,361,256 24,658,814 1,498,628
Samsung Electronics America (SEA) 21,810,492 9,496,649 34,521,654 246,141
Samsung (China) Investment (SCIC) 13,632,938 11,672,755 8,792,750 298,373
Samsung (China) Semiconductor (SCS) 9,749,448 4,564,793 4,152,137 1,113,218
Samsung Electronics Vietnam (SEV) 9,134,023 1,258,948 19,426,334 2,046,280
Samsung Electronics Europe Holding(SEEH)
8,643,308 6,661,092 - 350,974
Samsung Semiconductor (SSI) 7,804,698 3,746,687 19,911,135 30,247
Samsung Electronics VietnamTHAINGUYEN (SEVT)
7,646,828 2,179,023 23,563,736 2,641,418
Samsung Electronics Huizhou (SEHZ) 6,174,579 1,106,633 12,971,475 764,426
Shanghai Samsung Semiconductor (SSS) 5,862,409 5,166,385 20,983,314 181,041
Samsung Asia Private (SAPL) 5,528,472 592,320 1,458,176 1,056,956
Samsung Electronica da Amazonia(SEDA)
5,200,799 1,510,972 6,092,245 966,821
Samsung Austin Semiconductor (SAS) 4,940,748 1,293,458 3,586,127 104,747
Samsung India Electronics (SIEL) 4,563,407 2,256,194 8,827,028 753,164
Samsung Display Vietnam (SDV) 3,165,239 3,437,791 5,230,581 (98,102)
Samsung Electronics Europe Logistics(SELS)
2,887,230 2,779,296 13,157,455 36,768
Samsung Suzhou LCD (SSL) 2,499,917 1,376,439 1,494,787 1,091
Thai Samsung Electronics (TSE) 2,079,865 364,518 4,069,078 198,980
Samsung Electronics Slovakia (SESK) 2,053,467 440,402 3,634,166 115,387
Samsung Electronics Taiwan (SET) 1,857,017 1,540,478 3,533,924 (36,178)
Samsung Electronics HCMC CEComplex (SEHC)
1,814,566 1,572,982 2,010,442 118,091
Samsung Electronics Hungarian (SEH) 1,743,979 633,975 2,441,881 89,712
Samsung Electronics GmbH (SEG) 1,621,827 1,618,305 6,257,480 2,187
Samsung Display Dongguan (SDD) 1,584,504 518,511 5,187,954 199,922
Samsung Electronics (UK) (SEUK) 1,526,879 1,103,579 4,731,464 107,243
Samsung Electronics Co., Ltd. and its Subsidiaries
NOTES TO THE CONSOLIDATED FINANCIAL STATEMENTS
24
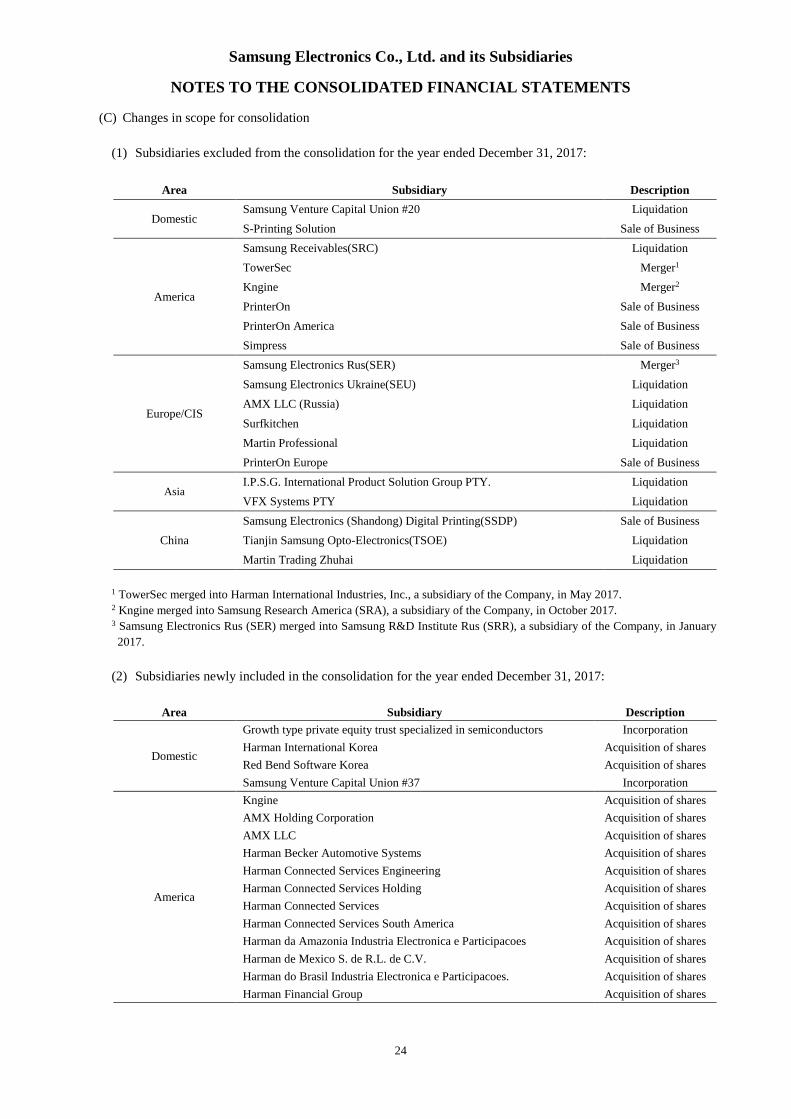
(C) Changes in scope for consolidation
(1) Subsidiaries excluded from the consolidation for the year ended December 31, 2017:
Area Subsidiary Description
DomesticSamsung Venture Capital Union #20 Liquidation
S-Printing Solution Sale of Business
America
Samsung Receivables(SRC) Liquidation
TowerSec Merger1
Kngine Merger2
PrinterOn Sale of Business
PrinterOn America Sale of Business
Simpress Sale of Business
Europe/CIS
Samsung Electronics Rus(SER) Merger3
Samsung Electronics Ukraine(SEU) Liquidation
AMX LLC (Russia) Liquidation
Surfkitchen Liquidation
Martin Professional Liquidation
PrinterOn Europe Sale of Business
AsiaI.P.S.G. International Product Solution Group PTY. Liquidation
VFX Systems PTY Liquidation
China
Samsung Electronics (Shandong) Digital Printing(SSDP) Sale of Business
Tianjin Samsung Opto-Electronics(TSOE) Liquidation
Martin Trading Zhuhai Liquidation
1 TowerSec merged into Harman International Industries, Inc., a subsidiary of the Company, in May 2017.2 Kngine merged into Samsung Research America (SRA), a subsidiary of the Company, in October 2017.3 Samsung Electronics Rus (SER) merged into Samsung R&D Institute Rus (SRR), a subsidiary of the Company, in January
2017.
(2) Subsidiaries newly included in the consolidation for the year ended December 31, 2017:
Area Subsidiary Description
Domestic
Growth type private equity trust specialized in semiconductors Incorporation
Harman International Korea Acquisition of shares
Red Bend Software Korea Acquisition of shares
Samsung Venture Capital Union #37 Incorporation
America
Kngine Acquisition of shares
AMX Holding Corporation Acquisition of shares
AMX LLC Acquisition of shares
Harman Becker Automotive Systems Acquisition of shares
Harman Connected Services Engineering Acquisition of shares
Harman Connected Services Holding Acquisition of shares
Harman Connected Services Acquisition of shares
Harman Connected Services South America Acquisition of shares
Harman da Amazonia Industria Electronica e Participacoes Acquisition of shares
Harman de Mexico S. de R.L. de C.V. Acquisition of shares
Harman do Brasil Industria Electronica e Participacoes. Acquisition of shares
Harman Financial Group Acquisition of shares
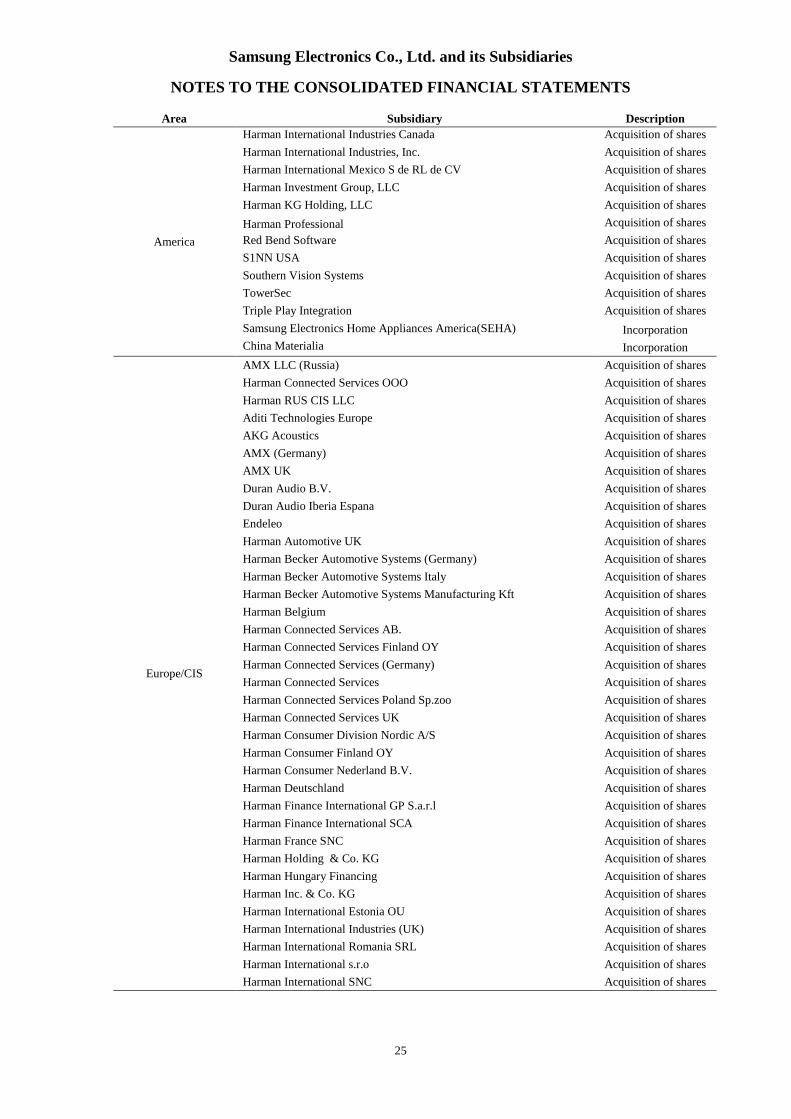
Samsung Electronics Co., Ltd. and its Subsidiaries
NOTES TO THE CONSOLIDATED FINANCIAL STATEMENTS
25
Area Subsidiary Description
America
Harman International Industries Canada Acquisition of shares
Harman International Industries, Inc. Acquisition of shares
Harman International Mexico S de RL de CV Acquisition of shares
Harman Investment Group, LLC Acquisition of shares
Harman KG Holding, LLC Acquisition of shares
Harman Professional Acquisition of shares
Red Bend Software Acquisition of shares
S1NN USA Acquisition of shares
Southern Vision Systems Acquisition of shares
TowerSec Acquisition of shares
Triple Play Integration Acquisition of shares
Samsung Electronics Home Appliances America(SEHA) Incorporation
China Materialia Incorporation
Europe/CIS
AMX LLC (Russia) Acquisition of shares
Harman Connected Services OOO Acquisition of shares
Harman RUS CIS LLC Acquisition of shares
Aditi Technologies Europe Acquisition of shares
AKG Acoustics Acquisition of shares
AMX (Germany) Acquisition of shares
AMX UK Acquisition of shares
Duran Audio B.V. Acquisition of shares
Duran Audio Iberia Espana Acquisition of shares
Endeleo Acquisition of shares
Harman Automotive UK Acquisition of shares
Harman Becker Automotive Systems (Germany) Acquisition of shares
Harman Becker Automotive Systems Italy Acquisition of shares
Harman Becker Automotive Systems Manufacturing Kft Acquisition of shares
Harman Belgium Acquisition of shares
Harman Connected Services AB. Acquisition of shares
Harman Connected Services Finland OY Acquisition of shares
Harman Connected Services (Germany) Acquisition of shares
Harman Connected Services Acquisition of shares
Harman Connected Services Poland Sp.zoo Acquisition of shares
Harman Connected Services UK Acquisition of shares
Harman Consumer Division Nordic A/S Acquisition of shares
Harman Consumer Finland OY Acquisition of shares
Harman Consumer Nederland B.V. Acquisition of shares
Harman Deutschland Acquisition of shares
Harman Finance International GP S.a.r.l Acquisition of shares
Harman Finance International SCA Acquisition of shares
Harman France SNC Acquisition of shares
Harman Holding & Co. KG Acquisition of shares
Harman Hungary Financing Acquisition of shares
Harman Inc. & Co. KG Acquisition of shares
Harman International Estonia OU Acquisition of shares
Harman International Industries (UK) Acquisition of shares
Harman International Romania SRL Acquisition of shares
Harman International s.r.o Acquisition of shares
Harman International SNC Acquisition of shares
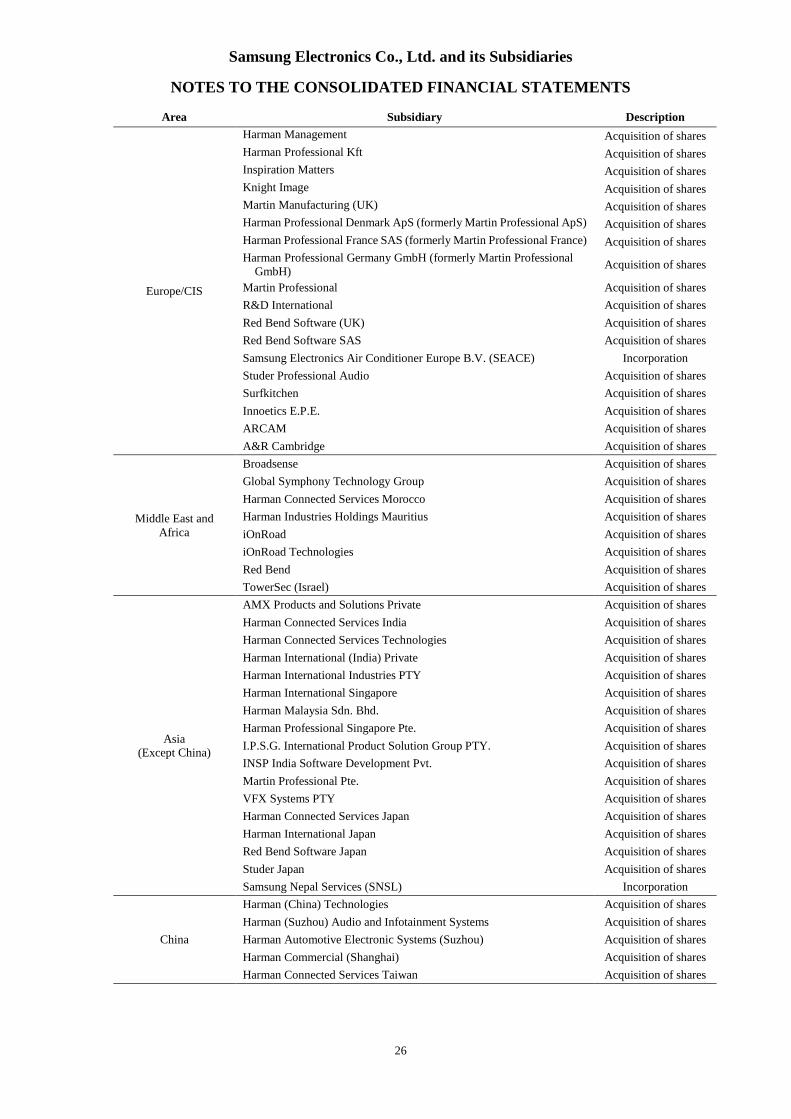
Samsung Electronics Co., Ltd. and its Subsidiaries
NOTES TO THE CONSOLIDATED FINANCIAL STATEMENTS
26
Area Subsidiary Description
Europe/CIS
Harman Management Acquisition of shares
Harman Professional Kft Acquisition of shares
Inspiration Matters Acquisition of shares
Knight Image Acquisition of shares
Martin Manufacturing (UK) Acquisition of shares
Harman Professional Denmark ApS (formerly Martin Professional ApS) Acquisition of shares
Harman Professional France SAS (formerly Martin Professional France) Acquisition of shares
Harman Professional Germany GmbH (formerly Martin ProfessionalGmbH)
Acquisition of shares
Martin Professional Acquisition of shares
R&D International Acquisition of shares
Red Bend Software (UK) Acquisition of shares
Red Bend Software SAS Acquisition of shares
Samsung Electronics Air Conditioner Europe B.V. (SEACE) Incorporation
Studer Professional Audio Acquisition of shares
Surfkitchen Acquisition of shares
Innoetics E.P.E. Acquisition of shares
ARCAM Acquisition of shares
A&R Cambridge Acquisition of shares
Middle East andAfrica
Broadsense Acquisition of shares
Global Symphony Technology Group Acquisition of shares
Harman Connected Services Morocco Acquisition of shares
Harman Industries Holdings Mauritius Acquisition of shares
iOnRoad Acquisition of shares
iOnRoad Technologies Acquisition of shares
Red Bend Acquisition of shares
TowerSec (Israel) Acquisition of shares
Asia(Except China)
AMX Products and Solutions Private Acquisition of shares
Harman Connected Services India Acquisition of shares
Harman Connected Services Technologies Acquisition of shares
Harman International (India) Private Acquisition of shares
Harman International Industries PTY Acquisition of shares
Harman International Singapore Acquisition of shares
Harman Malaysia Sdn. Bhd. Acquisition of shares
Harman Professional Singapore Pte. Acquisition of shares
I.P.S.G. International Product Solution Group PTY. Acquisition of shares
INSP India Software Development Pvt. Acquisition of shares
Martin Professional Pte. Acquisition of shares
VFX Systems PTY Acquisition of shares
Harman Connected Services Japan Acquisition of shares
Harman International Japan Acquisition of shares
Red Bend Software Japan Acquisition of shares
Studer Japan Acquisition of shares
Samsung Nepal Services (SNSL) Incorporation
China
Harman (China) Technologies Acquisition of shares
Harman (Suzhou) Audio and Infotainment Systems Acquisition of shares
Harman Automotive Electronic Systems (Suzhou) Acquisition of shares
Harman Commercial (Shanghai) Acquisition of shares
Harman Connected Services Taiwan Acquisition of shares
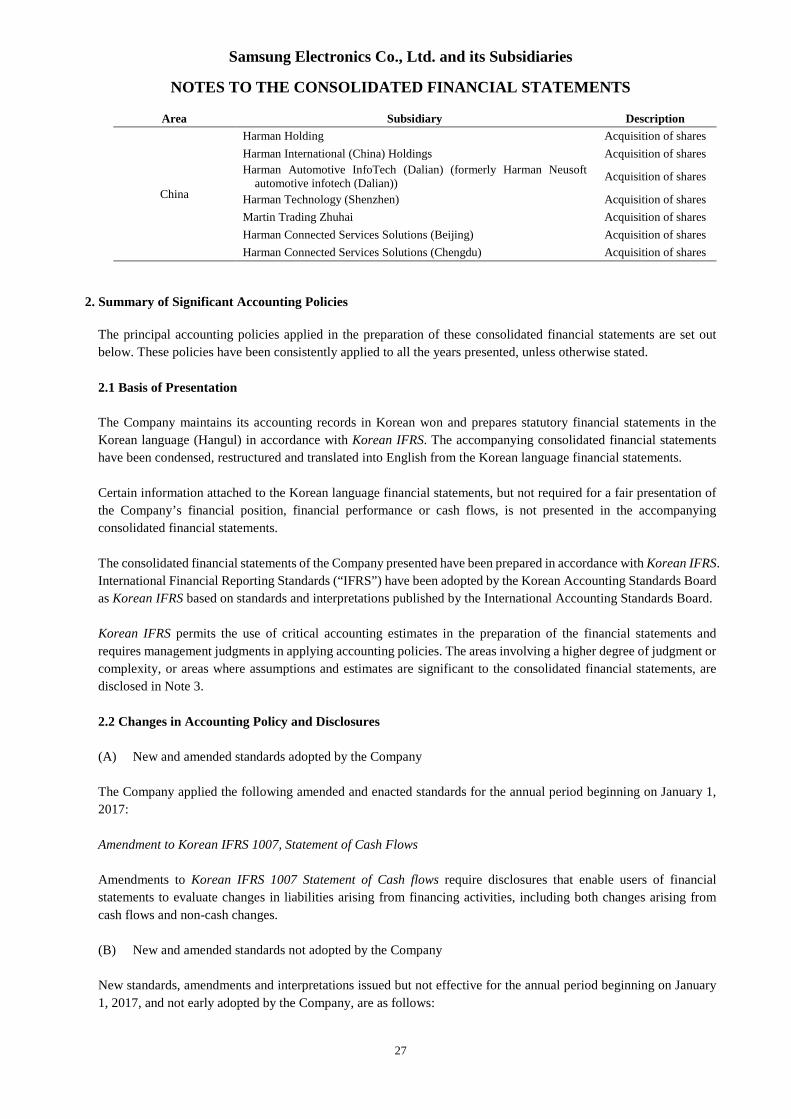
Samsung Electronics Co., Ltd. and its Subsidiaries
NOTES TO THE CONSOLIDATED FINANCIAL STATEMENTS
27
Area Subsidiary Description
China
Harman Holding Acquisition of shares
Harman International (China) Holdings Acquisition of shares
Harman Automotive InfoTech (Dalian) (formerly Harman Neusoftautomotive infotech (Dalian))
Acquisition of shares
Harman Technology (Shenzhen) Acquisition of shares
Martin Trading Zhuhai Acquisition of shares
Harman Connected Services Solutions (Beijing) Acquisition of shares
Harman Connected Services Solutions (Chengdu) Acquisition of shares
2. Summary of Significant Accounting Policies
The principal accounting policies applied in the preparation of these consolidated financial statements are set out
below. These policies have been consistently applied to all the years presented, unless otherwise stated.
2.1 Basis of Presentation
The Company maintains its accounting records in Korean won and prepares statutory financial statements in the
Korean language (Hangul) in accordance with Korean IFRS. The accompanying consolidated financial statements
have been condensed, restructured and translated into English from the Korean language financial statements.
Certain information attached to the Korean language financial statements, but not required for a fair presentation of
the Company’s financial position, financial performance or cash flows, is not presented in the accompanying
consolidated financial statements.
The consolidated financial statements of the Company presented have been prepared in accordance with Korean IFRS.
International Financial Reporting Standards (“IFRS”) have been adopted by the Korean Accounting Standards Board
as Korean IFRS based on standards and interpretations published by the International Accounting Standards Board.
Korean IFRS permits the use of critical accounting estimates in the preparation of the financial statements and
requires management judgments in applying accounting policies. The areas involving a higher degree of judgment or
complexity, or areas where assumptions and estimates are significant to the consolidated financial statements, are
disclosed in Note 3.
2.2 Changes in Accounting Policy and Disclosures
(A) New and amended standards adopted by the Company
The Company applied the following amended and enacted standards for the annual period beginning on January 1,
2017:
Amendment to Korean IFRS 1007, Statement of Cash Flows
Amendments to Korean IFRS 1007 Statement of Cash flows require disclosures that enable users of financial
statements to evaluate changes in liabilities arising from financing activities, including both changes arising from
cash flows and non-cash changes.
(B) New and amended standards not adopted by the Company
New standards, amendments and interpretations issued but not effective for the annual period beginning on January
1, 2017, and not early adopted by the Company, are as follows:
Samsung Electronics Co., Ltd. and its Subsidiaries
NOTES TO THE CONSOLIDATED FINANCIAL STATEMENTS
28
Korean IFRIC 2122, Foreign Currency Transaction and Advance Consideration
According to these enactments, the date of the transaction for the purpose of determining the exchange rate to use on
initial recognition of the related asset, expense or income (or part of it) is the date on which an entity initially
recognizes the non-monetary asset or non-monetary liability arising from the payment or receipt of advance
consideration. If there are multiple payments or receipts in advance, the entity shall determine a date of the transaction
for each payment or receipt of advance consideration. These enactments will be effective for annual periods beginning
on or after January 1, 2018, with early adoption permitted. The Company does not expect the enactments to have a
significant impact on the financial statements.
Korean IFRS 1109, Financial Instruments
The new standard for financial instruments issued on September 25, 2015 is effective for annual periods beginning
on or after January 1, 2018 with early application permitted. This standard will replace Korean IFRS 1039 Financial
Instruments: Recognition and Measurement. The Company will apply the standard for the annual periods beginning
on or after January 1, 2018.
The standard requires retrospective application with some exceptions. For example, the entity is not required to restate
prior periods in relation to classification, measurement and impairment of financial instruments. The standard requires
prospective application of its hedge accounting requirements for all hedging relationships except the accounting for
time value of options and other exceptions.
Korean IFRS 1109 Financial Instruments requires all financial assets to be classified and measured on the basis of
the entity’s business model for managing financial assets and the contractual cash flow characteristics of the financial
assets. A new impairment model, an expected credit loss model, is introduced and any subsequent changes in expected
credit losses will be recognized in profit or loss. Also, hedge accounting rules were amended to extend the hedging
relationship, which consists only of eligible hedging instruments and hedged items, for determining what qualifies
for hedge accounting.
An effective implementation of Korean IFRS 1109 requires preparation processes including financial impact
assessment, accounting policy establishment, accounting system development and system stabilization. The impact
on the Company’s financial statements due to the application of the standard is dependent on judgements made in
applying the standard, financial instruments held by the Company and macroeconomic variables.
With the implementation of Korea IFRS 1109, the Company prepared for changes to internal management processes
and completed modification of its accounting system for financial instruments reporting. The Company performed
an impact assessment to identify potential financial impacts of applying Korean IFRS 1109. The assessment was
performed based on available information as at December 31, 2017, and the results of the assessment are explained
as below.
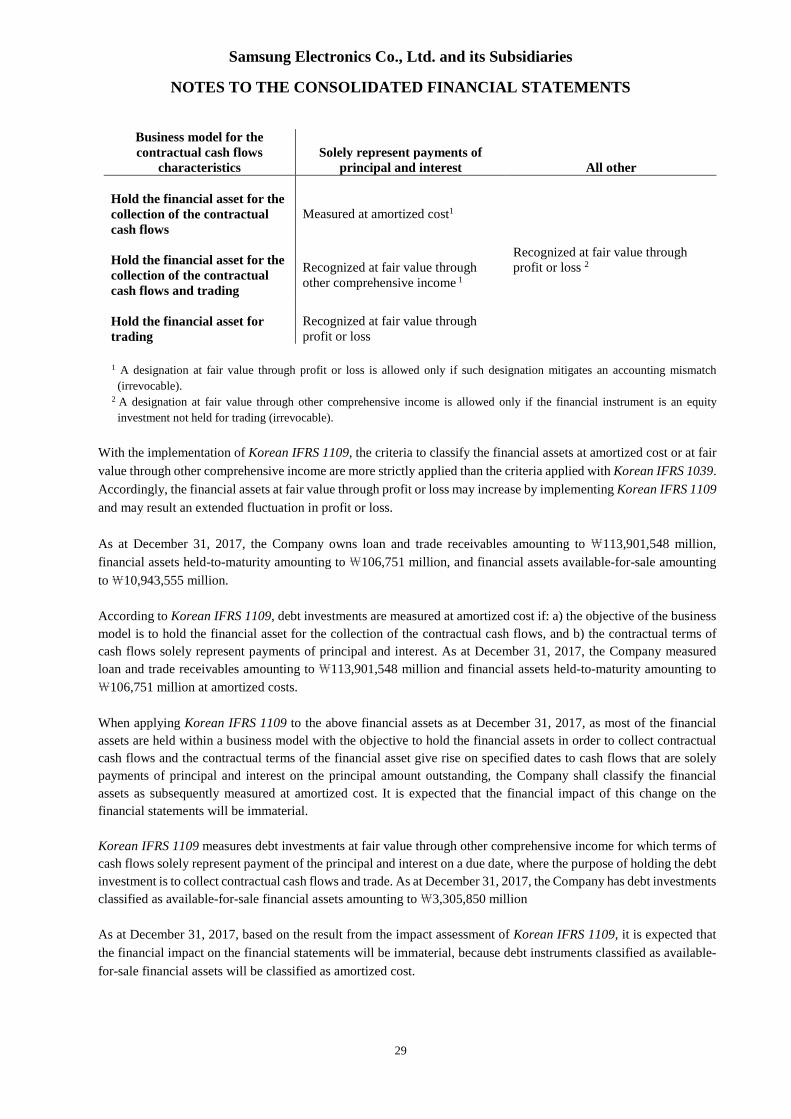
(a) Classification and Measurement of Financial Assets
When implementing Korean IFRS 1109, the classification of financial assets will be driven by the Company’s
business model for managing the financial assets and contractual terms of cash flow. The following table shows the
classification of financial assets measured subsequently at amortized cost, at fair value through other comprehensive
income and at fair value through profit or loss. If a hybrid contract contains a host that is a financial asset, the
classification of the hybrid contract shall be determined for the entire contract without separating the embedded
derivative.
Samsung Electronics Co., Ltd. and its Subsidiaries
NOTES TO THE CONSOLIDATED FINANCIAL STATEMENTS
29
Business model for thecontractual cash flows
characteristicsSolely represent payments of
principal and interest All other
Hold the financial asset for thecollection of the contractualcash flows
Measured at amortized cost1
Recognized at fair value throughprofit or loss 2Hold the financial asset for the
collection of the contractualcash flows and trading
Recognized at fair value throughother comprehensive income 1
Hold the financial asset fortrading
Recognized at fair value throughprofit or loss
1 A designation at fair value through profit or loss is allowed only if such designation mitigates an accounting mismatch
(irrevocable).2 A designation at fair value through other comprehensive income is allowed only if the financial instrument is an equity
investment not held for trading (irrevocable).
With the implementation of Korean IFRS 1109, the criteria to classify the financial assets at amortized cost or at fair
value through other comprehensive income are more strictly applied than the criteria applied with Korean IFRS 1039.
Accordingly, the financial assets at fair value through profit or loss may increase by implementing Korean IFRS 1109
and may result an extended fluctuation in profit or loss.
As at December 31, 2017, the Company owns loan and trade receivables amounting to \113,901,548 million,
financial assets held-to-maturity amounting to \106,751 million, and financial assets available-for-sale amounting
to\10,943,555 million.
According to Korean IFRS 1109, debt investments are measured at amortized cost if: a) the objective of the business
model is to hold the financial asset for the collection of the contractual cash flows, and b) the contractual terms of
cash flows solely represent payments of principal and interest. As at December 31, 2017, the Company measured
loan and trade receivables amounting to \113,901,548 million and financial assets held-to-maturity amounting to
\106,751 million at amortized costs.
When applying Korean IFRS 1109 to the above financial assets as at December 31, 2017, as most of the financial
assets are held within a business model with the objective to hold the financial assets in order to collect contractual
cash flows and the contractual terms of the financial asset give rise on specified dates to cash flows that are solely
payments of principal and interest on the principal amount outstanding, the Company shall classify the financial
assets as subsequently measured at amortized cost. It is expected that the financial impact of this change on the
financial statements will be immaterial.
Korean IFRS 1109 measures debt investments at fair value through other comprehensive income for which terms of
cash flows solely represent payment of the principal and interest on a due date, where the purpose of holding the debt
investment is to collect contractual cash flows and trade. As at December 31, 2017, the Company has debt investments
classified as available-for-sale financial assets amounting to\3,305,850 million
As at December 31, 2017, based on the result from the impact assessment of Korean IFRS 1109, it is expected that
the financial impact on the financial statements will be immaterial, because debt instruments classified as available-
for-sale financial assets will be classified as amortized cost.
Samsung Electronics Co., Ltd. and its Subsidiaries
NOTES TO THE CONSOLIDATED FINANCIAL STATEMENTS
30
According to Korean IFRS 1109, equity investments not being held for trading may be given an irrevocable election
to be classified as financial instruments measured at fair value through other comprehensive income at initial
recognition and the cumulative gain or loss previously recognized in other comprehensive income is not subsequently
recycled from equity to profit or loss as a reclassification adjustment. As at December 31, 2017, the Company's equity
investments classified as available-for-sale financial assets amount to \7,637,705 million and the cumulative
unrealized profit or loss on available-for-sale equity investments amounting to \3,199 million was recycled from
equity to profit or loss as a reclassification adjustment for the year ended December 31, 2017.
The Company plans to designate long-term equity instruments held for long-term investment purposes, which account
for most of the available-for-sale equity instruments, as financial instruments measured at fair value through other
comprehensive income. Therefore, the Company expects the application of Korean IFRS 1109 on these financial
assets will not have a material impact on the financial statements. However, the Company has identified that some
available-for-sale equity instruments will have increased profit or loss variability, as they are classified as fair value
through profit or loss.
According to Korean IFRS 1109, debt investments for which the contractual terms of cash flows are not solely
representing payments of principal and interest, or which are held for trading, are classified as fair value through
profit or loss. Equity investments not designated at fair value through comprehensive income are also measured at
fair value through profit or loss. As at December 31, 2017, the Company did not have debt or equity investments
classified as financial instruments at fair value through profit or loss.
(b) Classification and Measurement of Financial Liabilities
Korean IFRS 1109 requires the change in the liability’s fair value attributable to changes in the credit risk to be
recognized in other comprehensive income, unless this treatment of the credit risk component creates or enlarges a
measurement mismatch. Amounts presented in other comprehensive income are not subsequently transferred to profit
or loss.
Under Korean IFRS 1039, all the fair value movements for financial liabilities designated to be measured at fair value
through profit or loss, were recognized through profit or loss. However, under Korean IFRS 1109, certain fair value
movements will be recognized in other comprehensive income thus profit or loss from fair value movements may
decrease.
As at December 31, 2017, total financial liabilities account for\52,705,258 million of which\525,579 million are
designated to be measured at fair value through profit or loss.
According to the result of the impact assessment, financial liabilities measured at fair value through profit and loss
for the current terms as at December 31, 2017 have mostly short maturities and the credit risk fluctuation of financial
liabilities is insignificant. Therefore, it is expected that the impact of adopting Korean IFRS 1109 will not be
significant.
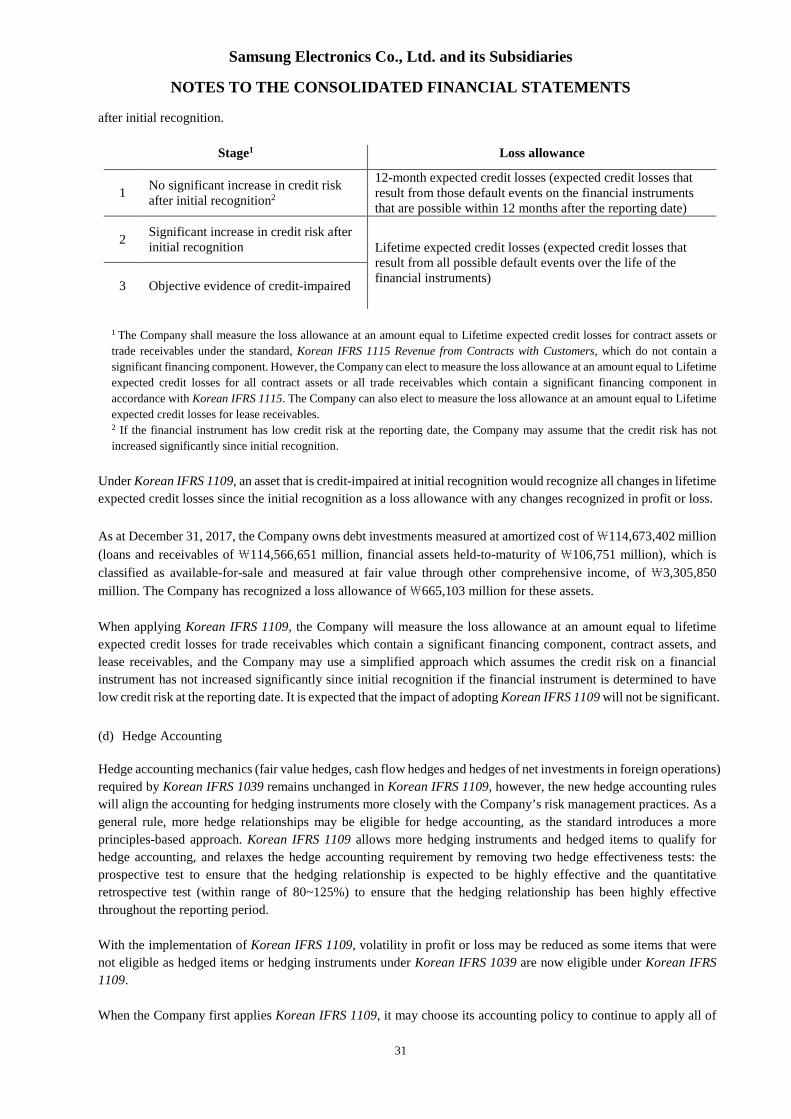
(c) Impairment: Financial Assets and Contract Assets
The new impairment model requires the recognition of impairment provisions based on expected credit losses (ECL)
rather than only incurred credit losses as is the case under Korean IFRS 1039. It applies to financial assets classified
at amortized cost, debt instruments measured at fair value through other comprehensive income, lease receivables,
contract assets, loan commitments and certain financial guarantee contracts.
Under Korean IFRS 1109, a credit event (or impairment ‘trigger’) no longer has to occur before credit losses are
recognized. The Company will always recognize (at a minimum) 12-month expected credit losses in profit or loss.
Lifetime expected credit losses will be recognized on assets for which there is a significant increase in credit risk
Samsung Electronics Co., Ltd. and its Subsidiaries
NOTES TO THE CONSOLIDATED FINANCIAL STATEMENTS
31
after initial recognition.
Stage1 Loss allowance
1No significant increase in credit riskafter initial recognition2
12-month expected credit losses (expected credit losses thatresult from those default events on the financial instrumentsthat are possible within 12 months after the reporting date)
2Significant increase in credit risk afterinitial recognition Lifetime expected credit losses (expected credit losses that
result from all possible default events over the life of thefinancial instruments)
3 Objective evidence of credit-impaired
1 The Company shall measure the loss allowance at an amount equal to Lifetime expected credit losses for contract assets or
trade receivables under the standard, Korean IFRS 1115 Revenue from Contracts with Customers, which do not contain a
significant financing component. However, the Company can elect to measure the loss allowance at an amount equal to Lifetime
expected credit losses for all contract assets or all trade receivables which contain a significant financing component in
accordance with Korean IFRS 1115. The Company can also elect to measure the loss allowance at an amount equal to Lifetime
expected credit losses for lease receivables.2 If the financial instrument has low credit risk at the reporting date, the Company may assume that the credit risk has not
increased significantly since initial recognition.
Under Korean IFRS 1109, an asset that is credit-impaired at initial recognition would recognize all changes in lifetime
expected credit losses since the initial recognition as a loss allowance with any changes recognized in profit or loss.
As at December 31, 2017, the Company owns debt investments measured at amortized cost of\114,673,402 million
(loans and receivables of \114,566,651 million, financial assets held-to-maturity of \106,751 million), which is
classified as available-for-sale and measured at fair value through other comprehensive income, of \3,305,850
million. The Company has recognized a loss allowance of\665,103 million for these assets.
When applying Korean IFRS 1109, the Company will measure the loss allowance at an amount equal to lifetime
expected credit losses for trade receivables which contain a significant financing component, contract assets, and
lease receivables, and the Company may use a simplified approach which assumes the credit risk on a financial
instrument has not increased significantly since initial recognition if the financial instrument is determined to have
low credit risk at the reporting date. It is expected that the impact of adopting Korean IFRS 1109 will not be significant.
(d) Hedge Accounting
Hedge accounting mechanics (fair value hedges, cash flow hedges and hedges of net investments in foreign operations)
required by Korean IFRS 1039 remains unchanged in Korean IFRS 1109, however, the new hedge accounting rules
will align the accounting for hedging instruments more closely with the Company’s risk management practices. As a
general rule, more hedge relationships may be eligible for hedge accounting, as the standard introduces a more
principles-based approach. Korean IFRS 1109 allows more hedging instruments and hedged items to qualify for
hedge accounting, and relaxes the hedge accounting requirement by removing two hedge effectiveness tests: the
prospective test to ensure that the hedging relationship is expected to be highly effective and the quantitative
retrospective test (within range of 80~125%) to ensure that the hedging relationship has been highly effective
throughout the reporting period.
With the implementation of Korean IFRS 1109, volatility in profit or loss may be reduced as some items that were
not eligible as hedged items or hedging instruments under Korean IFRS 1039 are now eligible under Korean IFRS
1109.
When the Company first applies Korean IFRS 1109, it may choose its accounting policy to continue to apply all of

Samsung Electronics Co., Ltd. and its Subsidiaries
NOTES TO THE CONSOLIDATED FINANCIAL STATEMENTS
32
the hedge accounting requirements of Korean IFRS 1039 instead of the requirements of Korean IFRS 1109.
With the implementation of Korean IFRS 1109, the Company has aligned the application of hedge accounting
requirements more closely with risk management practices. It is expected that the impact of adopting Korean IFRS
1109 will not be significant.
Korean IFRS 1115, Revenue from Contracts with Customers
Korean IFRS 1115, Revenue from Contracts with Customers issued on November 6, 2015 is effective for annual
periods beginning on or after January 1, 2018 with early adoption permitted. This standard replaces Korean IFRS
1018 Revenue, Korean IFRS 1011 Construction Contracts, Interpretation 2031 Revenue-Barter Transactions
Involving Advertising Services, Interpretation 2113 Customer Loyalty Programs, Interpretation 2115 Agreements for
the Construction of Real Estate and Interpretation 2118 Transfers of assets from customers.
The Company will apply Korean IFRS 1115 to the annual period beginning January 1, 2018 and will recognize the
cumulative impact of initially applying the standard as an adjustment to retained earnings (or other component of
equity, as appropriate) as at January 1, 2018, the period of initial application. Under this transition method, the
Company will elect to apply this standard retrospectively only to contracts that are not completed at the date of initial
application.
Korean IFRS 1018 and other current revenue standards identify revenue as income that arises in the course of ordinary
activities of an entity and provides guidance on a variety of different types of revenue, such as sale of goods, rendering
of services, interest, dividends, royalties and construction contracts. However, the Company shall recognize revenue
in accordance with the new standard by applying the following 5 steps: ①Identify the contract with the customer,
②Identify the separate performance obligations, ③Determine the transaction price of the contract, ④Allocate the
transaction price to each of the separate performance obligations, and⑤Recognize the revenue as each performance
obligation is satisfied.
As at December 31, 2017, for the preparation of implementing Korean IFRS 1115, the Company formed a task force
team which consists of members of the accounting department, the accounting firm which serves as an external
advisor, and also other practical departments such as the IT department, if necessary. An assessment was performed,
by revenue stream, and the Company has subsequently aligned certain internal management processes and modified
part of its accounting system based on the results of the assessment.
Korean IFRS 1115 will affect overall business practices including accounting treatment, sales strategy and operations.
Therefore, the Company provides training for changes due to the application of the new standard to employees, and
periodically reports the plans and progress of the implementation to the management team.
(a) Identification of performance obligations
The Company exports various products and merchandise in accordance with Incoterms Group C trading conditions
(Incoterms CIF, etc.). According to Korean IFRS 1115, since the seller provides the shipping service after control of
the product or merchandise has been transferred to the customer, the shipping service (including insurance) must be
recognized as a separate performance obligation.
As a result of analyzing Incoterms Group C trading condition (Incoterms CIF, etc.) contracts, the Company considers
it appropriate to recognize the transportation service after the control has been transferred as a separate performance
obligation apart from the sale of the goods. The adoption of Korean IFRS 1115 for these arrangements is not expected
to have a material impact on the financial statements.
Samsung Electronics Co., Ltd. and its Subsidiaries
NOTES TO THE CONSOLIDATED FINANCIAL STATEMENTS
33
(b) A performance obligation is satisfied over time: CE Operating Segment
The CE segment of the Company delivers products to customers and installs them in accordance with the system air
conditioner contracts awarded by the Public Procurement Service. According to Korean IFRS 1115, the Company
can recognize revenue over time if the Company’s performance creates or enhances an asset (for example, work in
progress) that the customer controls as the asset is created or enhanced
As a result of the analysis of the contract terms, the Company considers that it should recognize the revenue from
system air conditioner installation over time as the customer controls the outcome of the service. The adoption of
Korean IFRS 1115 for these arrangements is not expected to have a material impact on the financial statements.
(c) A performance obligation is satisfied over time - custom-order semiconductor supply contracts: DS Operating
Segment
The DS segment of the Company supplies semiconductor products according to customer orders. According to
Korean IFRS 1115, the Company can recognize revenue over time if the Company’s performance does not create an
asset with an alternative use to the entity and the entity has an enforceable right to payment for performance completed
to date.
As a result of analyzing the agreement terms, the Company considers the revenue from custom-order semiconductor
supply contracts with no alternative use and an enforceable right to payment should be recognized over time. The
adoption of Korean IFRS 1115 is not expected to have a material impact on the financial statements.
(d) Variable consideration
According to Korean IFRS 1115, the Company shall recognize a refund liability if the entity receives consideration
from a customer and expects to refund some or all of the consideration to the customer. The Company recognizes an
asset (refund asset) for the Company’s right to recover the products from the customer when the refund liability is
paid.
The Company considers that the refund asset should be classified and presented separately from the refund liability.
The adoption of Korean IFRS 1115 is not expected to have a material impact on the financial statements.
Enactment of Korean IFRS 1116, Leases
Korean IFRS 1116 Leases issued on May 22, 2017 is effective for annual periods beginning on or after January 1,
2019, with early adoption permitted. This standard will replace Korean IFRS 1017 Leases, Interpretation 2104
Determining whether an Arrangement contains a Lease, Interpretation 2015 Operating Leases-Incentives, and
Interpretation 2027 Evaluating the Substance of Transactions Involving the Legal Form of a Lease.
At inception of a contract, the Company shall assess whether the contract is, or contains, a lease. Also, at the date of
initial application, the Company shall assess whether the contract is, or contains, a lease in accordance with the
standard. However, the Company will not need to reassess all contracts with applying the practical expedient because
the Company elected to apply the practical expedient only to contracts entered before the date of initial application.
For a contract that is, or contains, a lease, the Company shall account for each lease component within the contract
as a lease separately from non-lease components of the contract. A lessee is required to recognize a right-of-use asset
representing its right to use the underlying leased asset and a lease liability representing its obligation to make lease
Samsung Electronics Co., Ltd. and its Subsidiaries
NOTES TO THE CONSOLIDATED FINANCIAL STATEMENTS
34
payments. The lessee may elect not to apply the requirements to short-term leases (a lease term of 12 months or less
at the commencement date) and low value assets (e.g. underlying assets below $5,000). In addition, as a practical
expedient, the lessee may elect, by class of underlying asset, not to separate non-lease components from lease
components, and instead account for each lease component and any associated non-lease components as a single lease
component.
The accounting standard as a lessor did not change significantly from Korean IFRS 1017 Leases.
(a) Lessee accounting
A lessee shall apply this standard to its leases either: a) retrospectively to each prior reporting period presented
applying Korean IFRS 1008 Accounting Policies, Changes in Accounting Estimates and Errors (Full retrospective
application) or b) retrospectively with the cumulative effect of initially applying the standard recognized at the date
of initial application. The Company has not yet elected an adoption method.
The Company is in the process of performing a preliminary assessment of potential financial impact of applying
Korean IFRS 1116 to the 2017 financial statements.
(b) Lessor accounting
When applying Korean IFRS 1116, the Company does not expect the enactments to have a significant impact on the
financial statements as the accounting standard as a lessor did not change significantly from IFRS 1017.
2.3 Consolidation
The Company prepares the consolidated financial statements in accordance with Korean IFRS 1110, Consolidated
Financial Statements.
(A) Subsidiaries
Subsidiaries are all entities (including special purpose entities) over which the Company has control. The Company
controls the corresponding investee when it is exposed, or has rights, to variable returns from its involvement with
the investee and has the ability to affect those returns through its power over the investee. Consolidation of a
subsidiary begins from the date the Company obtains control of a subsidiary and ceases when the Company loses
control of the subsidiary.
The Company applies the acquisition method to account for business combinations. The consideration transferred is
measured at the fair values of the assets transferred, and identifiable assets acquired and liabilities and contingent
liabilities assumed in a business combination are initially measured at their fair values at the acquisition date. The
Company recognizes any non-controlling interest in the acquiree on an acquisition-by-acquisition basis in the event
of liquidation at the non-controlling interest’s proportionate share of the recognized amounts of acquiree’s identifiable
net assets. Acquisition-related costs are expensed as incurred.
Goodwill is recognized as the excess of (1) the aggregate of i) the consideration transferred, ii) the amount of any
non-controlling interest in the acquiree and iii) the acquisition-date fair value of the Company’s previously held equity
interest in the acquiree over (2) the net identifiable assets acquired. If this consideration (1) is lower than the fair
value of the acquiree’s net assets in (2), the difference is recognized in profit or loss.

Samsung Electronics Co., Ltd. and its Subsidiaries
NOTES TO THE CONSOLIDATED FINANCIAL STATEMENTS
35
Balances of receivables and payables, income and expenses and unrealized gains or losses on transactions between
the Company subsidiaries are eliminated. Accounting policies of subsidiaries are changed where necessary to ensure
consistency with the policies adopted by the Company.
(B) Changes in ownership interests in subsidiaries without change of control
Transactions with non-controlling interests that do not result in loss of control are accounted for as equity transactions
– that is, as transactions with the owners in their capacity as owners. The difference between fair value of any
consideration paid and the relevant share acquired of the carrying value of net assets of the subsidiary is recorded in
equity. Gains or losses on disposals of non-controlling interests are also recorded in equity.
(C) Disposal of subsidiaries
If the Company loses control of a subsidiary, any investment continuously retained in the subsidiary is re-measured
at its fair value at the date when control is lost and any resulting differences are recognized in profit or loss. Such fair
value becomes the initial carrying amount for the subsequent measurement of the retained interest accounted for as
an associate, joint venture, or financial asset. In addition, any amounts previously recognized in other comprehensive
income in respect of such entity are accounted for as if the Company had directly disposed of the related assets or
liabilities. As a result, the previously recognized other comprehensive income are reclassified into profit or loss.
(D) Non-controlling interests
Each component of profit or loss and other comprehensive income is attributed to owners of the parent and to non-
controlling interests. Total comprehensive income is attributed to owners of the parent and to non-controlling interests
even if this results in a negative balance of non-controlling interests.
(E) Associates
Associates are all entities over which the Company has significant influence but does not have control, generally
investees of which from 20% to 50% of voting stock is owned by the Company . Investments in associates are initially
recognized at acquisition cost using the equity method. Unrealized gains on transactions between the Company and
its associates are eliminated to the extent of the Company’s interest in the associates. If there is any objective evidence
that the investment in the associate is impaired, the Company recognizes the difference between the recoverable
amount of the associate and its book value as impairment loss.
(F) Joint arrangements
A joint arrangement of which two or more parties have joint control is classified as either a joint operation or a joint
venture. A joint operator has rights to the assets, and obligations for the liabilities, relating to the joint operation and
recognizes the assets, liabilities, revenues and expenses relating to its interest in a joint operation. A joint venturer
has rights to the net assets relating to the joint venture and accounts for that investment using the equity method.
2.4 Foreign Currency Translation
(A) Functional and presentation currency
Items included in the financial statements of each of the Company’s entities are measured using the currency of the
primary economic environment in which each entity operates (the “functional currency”). The consolidated financial
statements are presented in Korean won, which is the parent company’s functional and presentation currency.
Samsung Electronics Co., Ltd. and its Subsidiaries
NOTES TO THE CONSOLIDATED FINANCIAL STATEMENTS
36
(B) Transactions and balances
Foreign currency transactions are translated into the functional currency using the exchange rates prevailing at the
dates of the transactions or valuation where items are re-measured. Foreign exchange gains and losses resulting from
the settlement of such transactions and from the translation at year-end exchange rates of monetary assets and
liabilities denominated in foreign currencies are recognized in profit or loss.
Exchange differences arising on non-monetary financial assets and liabilities such as equity instruments at fair value
through profit or loss and available-for-sale equity instruments are recognized in profit or loss and other
comprehensive income, respectively, as part of the fair value gain or loss.
(C) Translation into the presentation currency
The results and financial position of all the foreign entities that have a functional currency different from the
presentation currency of the Company are translated into the presentation currency as follows:
Assets and liabilities for each statement of financial position presented are translated at the closing rate at the
end of the reporting date.
Income and expenses for each statement of income are translated at average exchange rates, unless this average
is not a reasonable approximation of the cumulative effect of the rates prevailing on the transaction dates, in
which case income and expenses are translated at the rate on the dates of the transactions.
All resulting exchange differences are recognized in other comprehensive income.
2.5 Cash and Cash Equivalents
Cash and cash equivalents include cash on hand, deposits held at call with banks, and other short-term highly liquid
investments that are readily convertible to a known amount of cash and are subject to an insignificant risk of change
in value.
2.6 Financial Assets
(A) Classification
The Company classifies its financial assets in the following categories: financial assets at fair value through profit or
loss, loans and receivables, available-for-sale financial assets, and held-to-maturity financial assets. The classification
depends on the terms of the instruments and purpose for which the financial assets were acquired. Management
determines the classification of its financial assets at initial recognition.
(1) Financial assets at fair value through profit or loss
Financial assets at fair value through profit or loss are financial assets held for trading. A financial asset is classified
in this category if acquired principally for the purpose of selling in the short-term. Derivatives not subject to hedge
accounting and derivatives separated from financial instruments, such as embedded derivatives, are also categorized
as held for trading. Assets in this category are classified as current assets.
(2) Loans and receivables
Loans and receivables are non-derivative financial assets with fixed or determinable payments that are not quoted in
an active market. They are included in current assets, except for those with maturities greater than 12 months after
the end of the reporting period which are classified as non-current assets.

Samsung Electronics Co., Ltd. and its Subsidiaries
NOTES TO THE CONSOLIDATED FINANCIAL STATEMENTS
37
(3) Available-for-sale financial assets
Available-for-sale financial assets are non-derivative financial assets that are either designated in this category or not
classified in any of the other categories. They are included in non-current assets unless an investment matures or
management intends to dispose of it within 12 months of the end of the reporting period.
(B) Recognition and measurement
Regular purchases and sales of financial assets are recognized on the trade date. At initial recognition, financial assets
are measured at fair value plus, in the case of financial assets not carried at fair value through profit or loss, transaction
costs. Transaction costs of financial assets carried at fair value through profit or loss are expensed in the statement of
income. After the initial recognition, available-for-sale financial assets and financial assets at fair value through profit
or loss are subsequently carried at fair value. Loans and receivables and held-to-maturity investments are
subsequently carried at amortized cost using the effective interest method.
Changes in fair value of financial assets at fair value through profit or loss are recognized in profit or loss and changes
in fair value of available-for-sale financial assets are recognized in other comprehensive income. When the available-
for-sale financial assets are sold or impaired, the fair value adjustments recorded in equity are reclassified into profit
or loss.
Interest on available-for-sale financial assets and held-to-maturity financial assets calculated using the effective
interest method is recognized in the statement of income as part of financial income. Dividends on available-for-sale
financial assets are recognized in the statement of income as part of other non-operating income when the Company’s
right to receive payments is established.
(C) Offsetting financial instruments
Financial assets and liabilities are offset, and the net amount reported in the statement of financial position, when
there is a legally enforceable right to offset the recognized amounts and there is an intention to settle on a net basis,
or realize the asset and settle the liability simultaneously. The legally enforceable right must not be contingent on
future events and must be enforceable in the normal course of business and in the event of default, insolvency or
bankruptcy of the Company or the counterparty.
(D) Derecognition of financial assets
If the Company transfers a financial asset and the transfer does not result in derecognition because the Company has
retained substantially all of the risks and rewards of ownership of the transferred asset due to a recourse in the event
the debtor defaults, the Company continues to recognize the transferred asset in its entirety and recognizes a financial
liability for the consideration received. The related financial liability is classified as ‘borrowings’ in the statement of
financial position.
2.7 Impairment of Financial Assets
The Company assesses at the end of each reporting period whether there is objective evidence that a financial asset
or group of financial assets is impaired. A financial asset or a group of financial assets is impaired and impairment
loss is recognized only if there is objective evidence and that loss event (or events) has an impact on the estimated
future cash flows of the financial asset or group of financial assets that can be reliably estimated.
Impairment of loans and receivables is presented as a deduction in an allowance account. Impairment of other
financial assets is directly deducted from their carrying amount. The Company writes off financial assets when the
assets are determined to no longer be recoverable.
Samsung Electronics Co., Ltd. and its Subsidiaries
NOTES TO THE CONSOLIDATED FINANCIAL STATEMENTS
38
The objective evidence that a financial asset is impaired includes significant financial difficulty of the issuer or obligor,
a delinquency in interest or principal payments, or the disappearance of an active market for that financial asset
because of financial difficulties. A significant and prolonged decline below its cost in the fair value of an available-
for-sale equity instrument is also objective evidence of impairment.
2.8 Trade Receivables
Trade receivables are amounts due from customers for merchandise sold or services performed in the ordinary course
of business. If collection is expected in one year or less, they are classified as current assets. If collection is expected
beyond one year, they are presented as non-current assets. Trade receivables are recognized initially at fair value and
subsequently measured at amortized cost using the effective interest method, less provision for impairment.
2.9 Inventories
Inventories are stated at the lower of cost and net realizable value. Cost is determined using the average cost method,
except for materials in transit. The cost of finished goods and work in progress comprises raw materials, direct labor,
other direct costs and related production overheads (based on normal operating capacity). It excludes costs of idle
plant and abnormal waste. Net realizable value is the estimated selling price in the ordinary course of business, less
applicable variable selling expenses.
Inventories are reduced for the estimated losses arising from excess, obsolescence, and decline in value. This
reduction is determined by estimating market value based on future customer demand. The losses on inventory
obsolescence are recorded as a part of cost of sales.
2.10 Disposal Group Held-for-Sale
Non-current assets (or disposal groups) are classified as assets held-for-sale when their carrying amount is to be
recovered principally through a sale transaction and a sale is considered highly probable. The assets are measured at
the lower of their carrying amount and the fair value less costs to sell.
2.11 Property, Plant and Equipment
Property, plant and equipment are stated at cost less accumulated depreciation and accumulated impairment losses.
Historical cost includes expenditures that are directly attributable to the acquisition of the items. Subsequent costs
are included in the asset’s carrying amount or recognized as a separate asset, as appropriate, only when it is probable
that future economic benefits associated with the item will flow to the Company and the cost of the item can be
measured reliably. The carrying amount of those parts that are replaced is derecognized and repairs and maintenance
expenses are recognized in profit or loss in the period they are incurred.
Depreciation on tangible assets is calculated using the straight-line method to allocate the difference between their
cost and their residual values over their estimated useful lives. Land is not depreciated. Costs that are directly
attributable to the acquisition, construction or production of a qualifying asset, including capitalized interest costs,
form part of the cost of that asset and are amortized over the estimated useful lives.
The Company’s policy is that property, plant and equipment should be depreciated over the following estimated
useful lives:
Estimated useful lives
Buildings and structures 15, 30 years
Machinery and equipment 5 years
Other 5 years
Samsung Electronics Co., Ltd. and its Subsidiaries
NOTES TO THE CONSOLIDATED FINANCIAL STATEMENTS
39
The depreciation method, residual values and useful lives of property, plant and equipment are reviewed, and adjusted
if appropriate, at the end of each reporting period. An asset’s carrying amount is written down immediately to its
recoverable amount if the asset’s carrying amount is greater than its estimated recoverable amount. Gains and losses
on disposals are determined by comparing the proceeds with the carrying amount and are recognized within the
statement of income as part of other non-operating income and expenses.
2.12 Borrowing Costs
General and specific borrowing costs that are directly attributable to the acquisition, construction or production of aqualifying asset are capitalized during the period of time that is required to complete and prepare the asset for itsintended use or sale. Investment income earned on the temporary investment of specific borrowings pending theirexpenditure on qualifying assets is deducted from the borrowing costs eligible for capitalization. Other borrowingcosts are expensed in the period in which they are incurred.
2.13 Intangible Assets
Goodwill represents the excess of the cost of an acquisition over the fair value of the Company’s share of the net
identifiable assets of the acquired subsidiary, associates, joint ventures and businesses at the date of acquisition.
Goodwill on acquisitions of subsidiaries and businesses is included in intangible assets and goodwill on acquisition
of associates and joint ventures is included in the investments in associates and joint ventures.
Intangible assets, except for goodwill, are initially recognized at their historical cost and carried at cost less
accumulated amortization and accumulated impairment losses.
Internally generated development costs are the aggregate costs recognized after meeting the asset recognition criteria,
including technical feasibility, and determined to have future economic benefits. Membership rights and certain
trademarks are regarded as intangible assets with an indefinite useful life and not amortized because there is no
foreseeable limit to the period over which the assets are expected to be utilized. Intangible assets with definite useful
lives such as trademarks and licenses, are amortized using the straight-line method over their estimated useful lives.
The Company’s policy is that intangible assets should be amortized over the following estimated useful lives:
Estimated useful lives
Development costs 2 years
Trademarks, licenses and other intangible assets 5 - 10 years
2.14 Impairment of Non-Financial Assets
Goodwill or intangible assets with indefinite useful lives are not subject to amortization and are tested annually for
impairment. Assets that are subject to amortization are reviewed for impairment whenever events or changes in
circumstances indicate that the carrying amount may not be recoverable. An impairment loss is recognized for the
amount by which the asset’s carrying amount exceeds its recoverable amount. The recoverable amount is the higher
of an asset’s fair value less costs to sell and value in use. For the purposes of assessing impairment, assets are grouped
at the lowest levels for which there are separately identifiable cash flows (cash-generating units). Non-financial assets
other than goodwill for which an impairment charge was previously recorded are reviewed for possible reversal of
the impairment at each reporting date.

Samsung Electronics Co., Ltd. and its Subsidiaries
NOTES TO THE CONSOLIDATED FINANCIAL STATEMENTS
40
2.15 Financial Liabilities
(A) Classification and measurement
Financial liabilities at fair value through profit or loss are financial instruments held for trading. Financial liabilities
are classified in this category if incurred principally for the purpose of repurchasing them in the near term. Derivatives
that are not designated as hedges or bifurcated from financial instruments containing embedded derivatives are also
categorized as held-for-trading.
The Company classifies non-derivative financial liabilities, except for financial liabilities at fair value through profit
or loss, financial guarantee contracts and financial liabilities that arise when a transfer of financial assets does not
qualify for derecognition, as financial liabilities carried at amortized cost and presented as ‘trade payables’,
‘borrowings’, and ‘other financial liabilities’ in the statement of financial position.
(B) Derecognition
Financial liabilities are removed from the statement of financial position when they are extinguished, for example,
when the obligation specified in the contract is discharged, cancelled or expires or when the terms of an existing
financial liability are substantially modified.
2.16 Trade Payables
Trade payables are amounts due to suppliers for merchandise purchased or services received in the ordinary course
of business. If payment is expected in one year or less, they are classified as current liabilities. If payment is expected
beyond one year, they are presented as non-current liabilities. Non-current trade payables are recognized initially at
fair value and subsequently measured at amortized cost using the effective interest method.
2.17 Borrowings
Borrowings are recognized initially at fair value, net of transaction costs, and are subsequently measured at amortized
cost. Any difference between cost and the redemption value is recognized in the statement of income over the period
of the borrowings using the effective interest method. If the Company has an indefinite right to defer payment for a
period longer than 12 months after the end of the reporting date, such liabilities are recorded as non-current liabilities,
otherwise, they are recorded as current liabilities.
2.18 Provisions
A provision is recognized when the Company has a present legal or constructive obligation as a result of a past event,
it is probable that an outflow of resources embodying economic benefits will be required to settle the obligation, and
a reliable estimate can be made of the amount of the obligation. Provisions are not recognized for future operating
losses.
Provisions are measured at the present value of the expenditures expected to be required to settle the obligation using
a pre-tax rate that reflects current market assessments of the time value of money and the risks specific to the
obligation. The increase in the provision due to passage of time is recognized as interest expense.
When it is probable that an outflow of economic benefits will occur due to a present obligation resulting from a past
event, and the amount is reasonably estimable, a corresponding provision is recognized in the financial statements.
However, when such outflow is dependent upon a future event that is not certain to occur, or cannot be reliably
estimated, a disclosure regarding the contingent liability is made in the notes to the financial statements.

Samsung Electronics Co., Ltd. and its Subsidiaries
NOTES TO THE CONSOLIDATED FINANCIAL STATEMENTS
41
2.19 Employee Benefits
The Company has a variety of retirement pension plans including defined benefit and defined contribution plans. A
defined contribution plan is a pension plan under which the Company pays fixed contributions into a separate entity.
The Company has no legal or constructive obligations to pay further contributions if the fund does not hold sufficient
assets to pay all employees the benefits relating to employee service in the current and prior periods. For defined
contribution plans, the Company pays contributions to annuity plans that are managed either publicly or privately on
a mandatory, contractual or voluntary basis. The Company has no further future payment obligations once the
contributions have been paid. The contributions are recognized as employee benefit expense when they are due.
Prepaid contributions are recognized as an asset to the extent that a cash refund or a reduction in the future payments
is available.
A defined benefit plan is a pension plan that is not a defined contribution plan. Typically defined benefit plans define
an amount of pension benefit that an employee will receive on retirement, usually dependent on one or more factors
such as age, years of service and compensation. The liability recognized in the statement of financial position in
respect to defined benefit pension plans is the present value of the defined benefit obligation at the end of the reporting
period less the fair value of plan assets. The defined benefit obligation is calculated annually by independent actuaries
using the projected unit credit method. The present value of the defined benefit obligation is determined by
discounting the estimated future cash outflows using interest rates of high-quality corporate bonds that are
denominated in the currency in which the benefits will be paid and that have terms to maturity approximating to the
terms of the related pension obligation.
Actuarial gains and losses resulting from the changes in actuarial assumptions, and the differences between the
previous actuarial assumptions and what has actually occurred, are recognized in other comprehensive income in the
period in which they were incurred. Past service costs are immediately recognized in profit or loss.
2.20 Financial Guarantee Contract
Financial guarantee contracts are contracts that require the issuer to make specified payments to reimburse the holder
for a loss it incurs because a specified debtor fails to make payments when due. Financial guarantees are initially
recognized in the financial statements at fair value on the date the guarantee was given. If the amount measured in
subsequent periods exceeds the unamortized balance of the amount initially recognized, the excess is classified as
other financial liability.
2.21 Current and Deferred Tax
The tax expense for the period comprises current and deferred tax. Tax is recognized on the profit for the period in
the statement of income, except to the extent that it relates to items recognized in other comprehensive income or
directly in equity, in which case the tax is also recognized in other comprehensive income or directly in equity,
respectively. The tax expense is calculated on the basis of the tax laws enacted or substantively enacted at the end of
the reporting period.
Deferred tax is recognized for temporary differences arising between the tax bases of assets and liabilities and their
carrying amounts as expected tax consequences at the recovery or settlement of the carrying amounts of the assets
and liabilities. However, deferred tax assets and liabilities are not recognized if they arise from initial recognition of
an asset or liability in a transaction other than a business combination that at the time of the transaction affects neither
accounting nor taxable profit or loss. Deferred tax assets are recognized only to the extent that it is probable that
future taxable profit will be available against which the temporary differences can be utilized.
A deferred tax liability is recognized for taxable temporary differences associated with investments in subsidiaries,
associates, and interests in joint ventures, except to the extent that the Company is able to control the timing of the
reversal of the temporary differences and it is probable that the temporary difference will not reverse in the foreseeable
future. In addition, a deferred tax asset is recognized for deductible temporary differences arising from such
Samsung Electronics Co., Ltd. and its Subsidiaries
NOTES TO THE CONSOLIDATED FINANCIAL STATEMENTS
42
investments to the extent that it is probable the temporary difference will reverse in the foreseeable future and taxable
profit will be available against which the temporary difference can be utilized.
Deferred tax assets and liabilities are offset when there is a legally enforceable right to offset current tax assets against
current tax liabilities and when the deferred income taxes assets and liabilities relate to income taxes levied by the
same taxation authority on either the same taxable entity or different taxable entities where there is an intention to
settle the balances on a net basis.
2.22 Derivative Instruments
Derivatives are initially recognized at fair value on the date when a derivative contract is entered into and are
subsequently remeasured at their fair value at the end of each reporting period. Changes in the fair value of any
derivative instrument that does not qualify for hedge accounting are recognized immediately in profit or loss.
The Company applies cash flow hedge accounting to hedge the foreign currency risk of forecasted transactions
including hedging the price risk associated with forecast inventory purchase. The effective portion of changes in fair
value of derivatives that are designated and qualify as cash flow hedges is recognized in other comprehensive income,
and the ineffective portion is recognized in financial income or cost.
2.23 Dividend
Dividend distribution to the Company’s shareholders is recognized as a liability when the dividends are approved.
2.24 Share Capital
Ordinary shares and preference shares with no repayment obligations are classified as equity. When the Company
purchases its ordinary shares, the acquisition costs, including direct transaction costs, are deducted from equity until
the redemption or reissuance as treasury shares. Consideration received on the subsequent sale or issuance of treasury
shares is credited to equity.
2.25 Revenue Recognition
Revenue mainly comprises the fair value of the consideration received or receivable for the sale of goods in the
ordinary course of the Company’s activities. Revenue is shown net of value-added tax, returns, sales incentives and
discounts and after eliminating intercompany transactions.
The Company recognizes revenue when the amount of revenue can be reliably measured; when it is probable that
future economic benefits will flow to the entity; and when specific criteria have been met for each of the Company’s
activities, as described below. The Company measures revenue by reliably estimating the contingencies associated
with revenue based on historical results, taking into consideration the type of customer, the type of transaction and
the specifics of each arrangement.
Where multiple-element arrangements exist, the fair values of each element are determined based on the current
market price of each of the elements when sold separately. When the fair values of each element are indeterminable,
the fair values of deliverables which have already been provided are calculated in such way that the fair values of
elements which are yet to be provided are subtracted from total contract value of the arrangement.
(A) Sales of goods
Sales of products and merchandise are recognized upon delivery when the significant risks and rewards of ownership
of goods have transferred to the buyer. Revenue is recognized net of discounts and returns, estimated at the time of
sale based on past experience.
Samsung Electronics Co., Ltd. and its Subsidiaries
NOTES TO THE CONSOLIDATED FINANCIAL STATEMENTS
43
(B) Sales of services
Revenues from rendering services are generally recognized using the percentage-of-completion method based on the
percentage of costs to date compared to the total estimated costs, contractual milestones or performance.
(C) Interest income
Interest income is recognized using the effective interest method according to the time passed. When a loan or
receivable is impaired, the Company reduces the carrying amount to its recoverable amount and continues unwinding
the discount as interest income. Interest income on impaired loans and receivables is recognized using the original
effective interest rate.
(D) Royalty income
Royalty income is recognized on an accrual basis in accordance with the substance of the relevant agreements.
(E) Dividend income
Dividend income is recognized when the right to receive payment is established.
2.26 Leases
A lease is an agreement, whereby the lessor conveys to the lessee, in return for a payment or series of payments, the
right to use an asset for an agreed period of time. Leases in which a significant portion of the risks and rewards of
ownership are not transferred to the Company are classified as operating leases. Payments made under operating
leases are charge to profit or loss on a straight-line basis over the period of lease.
Leases where the Company, as lessee, has substantially all the risks and rewards of ownership are classified as finance
leases. Finance leases are capitalized at the lease’s inception at the fair value of the leased property or, if lower, the
present value of the minimum lease payments. The corresponding rental obligations, net of finance charges, are
included in other short-term and long-term payables. Each lease payment is allocated between the liability and
financial expense.
If the Company is a lessor, a lease is classified as a finance lease if it transfers substantially all the risks and rewardsincidental to ownership at the inception of the lease. A lease other than a finance lease is classified as an operatinglease. Lease income from operating leases is recognized in income on a straight-line basis over the lease term.Initial direct costs incurred by the lessor in negotiating and arranging an operating lease is added to the carryingamount of the leased asset and recognized as an expense over the lease term on the same basis as the lease income.
2.27 Government Grants
Government grants are recognized at their fair values when there is reasonable assurance that the grant will be
received and the Company will comply with the conditions attached to it. Government grants relating to costs are
deferred and recognized in the income statement over the period necessary to match them with the costs that they are
intended to compensate. Government grants relating to assets are recognized in liabilities as deferred income
government grants and are credited to the income statement on a straight– line basis over the expected lives of the
related assets.
Samsung Electronics Co., Ltd. and its Subsidiaries
NOTES TO THE CONSOLIDATED FINANCIAL STATEMENTS
44
2.28 Earnings per Share
Basic earnings per share is calculated by dividing net profit for the period available to ordinary shareholders by the
weighted-average number of ordinary shares outstanding during the year. Diluted earnings per share is calculated
using the weighted-average number of ordinary shares outstanding adjusted to include the potentially dilutive effect
of common equivalent shares outstanding.
2.29 Operating Segments
Operating segments are disclosed in the manner reported to the chief operating decision-maker. The chief operating
decision-maker is responsible for making strategic decisions on resource allocation and performance assessment of
the operating segments. The Management Committee, which makes strategic decisions, is regarded as the chief
operating decision-maker.
2.30 Convenience Translation into United States Dollar Amounts
The Company operates primarily in Korean won and its official accounting records are maintained in Korean won.
The US dollar amounts provided in the financial statements represent supplementary information solely for the
convenience of the reader. All Korean won amounts are expressed in U.S. dollars at the rate of₩1131.08 to US $1,
the average exchange rate for the year ended December 31, 2017. Such presentation is not in accordance with
generally accepted accounting principles, and should not be construed as a representation that the Korean won
amounts shown could be readily converted, realized or settled in US dollars at this or at any other rate.
2.31 Approval of the Consolidated Financial Statements
These consolidated financial statements were approved by the Board of Directors on January 31, 2018.
3. Critical Accounting Estimates and Assumptions
The Company makes estimates and assumptions concerning the future. The estimates and assumptions are
continuously assessed, considering historical experience and other factors, including expectations of future events
that are believed to be reasonable under the circumstances. The resulting accounting estimates will, by definition,
seldom equal the related actual results. The estimates and assumptions that have a significant risk of causing a material
adjustment to the carrying amounts of assets and liabilities within the next financial year are addressed below.
(A) Revenue recognition
The Company uses the percentage-of-completion method in accounting for its contracts to deliver installation services.
Use of the percentage-of-completion method requires the Company to estimate the services performed to date as a
proportion of the total services to be performed. Revenues and earnings are subject to significant change, effected by
early steps in a long-term projects, change in scope of a project, cost, period, and plans of the customers.
(B) Provision for warranty
The Company recognizes provision for warranty on products sold. The Company accrues provision for warranty
based on the best estimate of amounts necessary to settle future and existing claims. The amounts are estimated based
on past experience.
Samsung Electronics Co., Ltd. and its Subsidiaries
NOTES TO THE CONSOLIDATED FINANCIAL STATEMENTS
45
(C) Fair value of financial instruments
The fair value of financial instruments that are not traded in an active market is determined by using a variety of
methods and assumptions that are mainly based on market conditions existing at the end of each reporting period.
(D) Net defined benefit liabilities (assets)
The net defined benefit liabilities (assets) depend on a number of factors that are determined on an actuarial basis
using a number of assumptions including the discount rate. Any changes in these assumptions will impact the carrying
amount of the net defined benefit liability. The Company, in consideration of the interest rates of high-quality
corporate bonds, determines the appropriate discount rate at the end of each year. This is the interest rate that is used
to determine the present value of estimated future cash outflows expected to be required to settle the net defined
benefit liabilities (assets). The principal actuarial assumptions associated with the net defined benefit liabilities (assets)
are based on the current market expectations.
(E) Impairment of goodwill
At the end of each reporting period, the Company tests whether goodwill has become impaired by comparing the
carrying amounts of cash-generating units to the recoverable amounts. The recoverable amounts of cash-generating
units have been determined based on value-in-use calculations, and these calculations are based on estimates.
(F) Income taxes
Income taxes on the Company’s taxable income from operating activities are subject to various tax laws and
determinations of each tax authority across various countries throughout the world. There is uncertainty in
determining the eventual tax effects on the taxable income from operating activities. The Company has recognized
current tax and deferred tax at the end of the fiscal year based on the best estimation of future taxes payable as a result
of operating activities. However, the resulting deferred income tax assets and liabilities may not equal the actual
future taxes payable and such difference may impact the current tax and deferred income tax assets and liabilities
upon the determination of eventual tax effects.
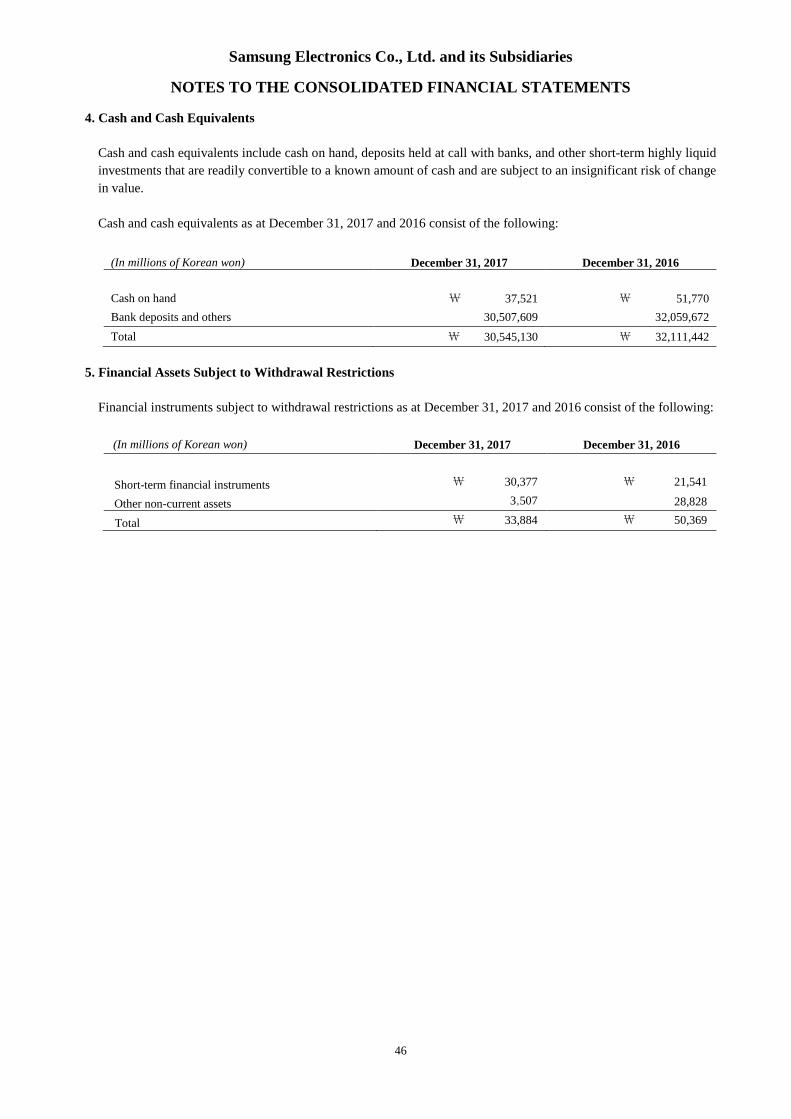
Samsung Electronics Co., Ltd. and its Subsidiaries
NOTES TO THE CONSOLIDATED FINANCIAL STATEMENTS
46
4. Cash and Cash Equivalents
Cash and cash equivalents include cash on hand, deposits held at call with banks, and other short-term highly liquid
investments that are readily convertible to a known amount of cash and are subject to an insignificant risk of change
in value.
Cash and cash equivalents as at December 31, 2017 and 2016 consist of the following:
(In millions of Korean won) December 31, 2017 December 31, 2016
Cash on hand \ 37,521 ₩ 51,770
Bank deposits and others 30,507,609 32,059,672
Total \ 30,545,130 ₩ 32,111,442
5. Financial Assets Subject to Withdrawal Restrictions
Financial instruments subject to withdrawal restrictions as at December 31, 2017 and 2016 consist of the following:
(In millions of Korean won) December 31, 2017 December 31, 2016
Short-term financial instruments \ 30,377 ₩ 21,541
Other non-current assets 3,507 28,828
Total \ 33,884 ₩ 50,369
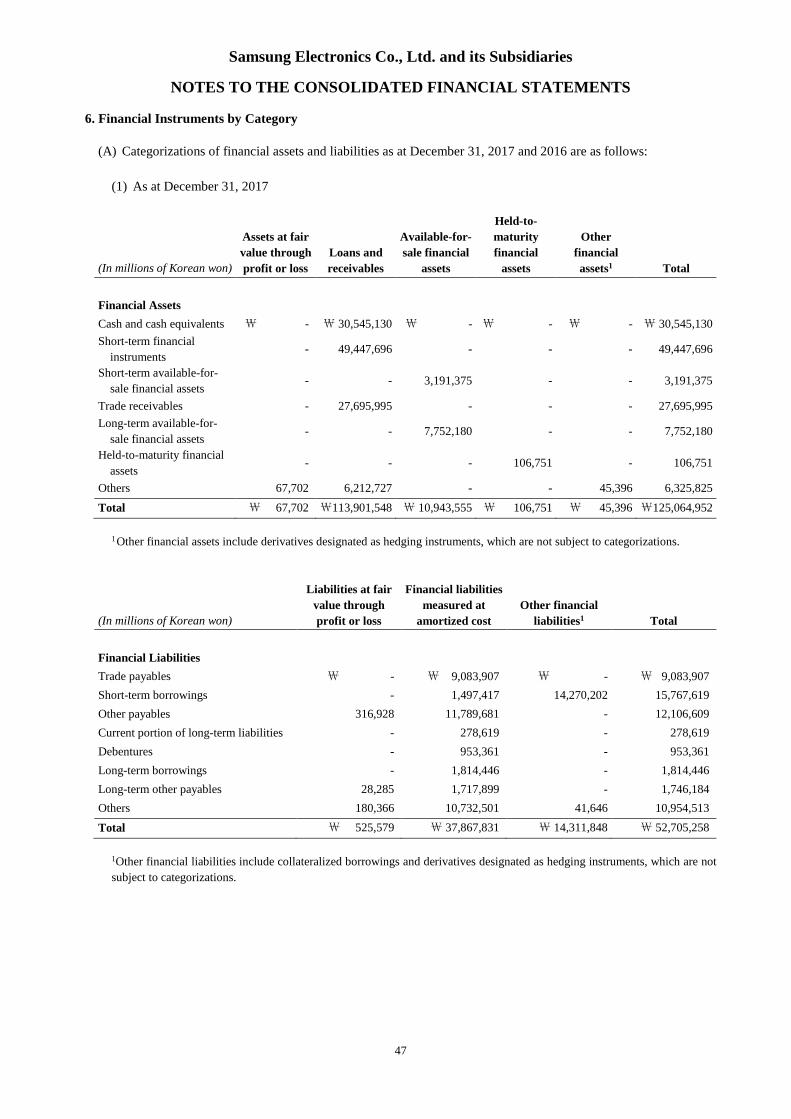
Samsung Electronics Co., Ltd. and its Subsidiaries
NOTES TO THE CONSOLIDATED FINANCIAL STATEMENTS
47
6. Financial Instruments by Category
(A) Categorizations of financial assets and liabilities as at December 31, 2017 and 2016 are as follows:
(1) As at December 31, 2017
(In millions of Korean won)
Assets at fair
value through
profit or loss
Loans and
receivables
Available-for-
sale financial
assets
Held-to-
maturity
financial
assets
Other
financial
assets1 Total
Financial Assets
Cash and cash equivalents ₩ - ₩ 30,545,130 ₩ - ₩ - ₩ - ₩ 30,545,130
Short-term financial
instruments- 49,447,696 - - - 49,447,696
Short-term available-for-
sale financial assets- - 3,191,375 - - 3,191,375
Trade receivables - 27,695,995 - - - 27,695,995
Long-term available-for-
sale financial assets- - 7,752,180 - - 7,752,180
Held-to-maturity financial
assets- - - 106,751 - 106,751
Others 67,702 6,212,727 - - 45,396 6,325,825
Total ₩ 67,702 ₩113,901,548 ₩ 10,943,555 ₩ 106,751 ₩ 45,396 ₩125,064,952
1Other financial assets include derivatives designated as hedging instruments, which are not subject to categorizations.
(In millions of Korean won)
Liabilities at fair
value through
profit or loss
Financial liabilities
measured at
amortized cost
Other financial
liabilities1 Total
Financial Liabilities
Trade payables ₩ - ₩ 9,083,907 ₩ - ₩ 9,083,907
Short-term borrowings - 1,497,417 14,270,202 15,767,619
Other payables 316,928 11,789,681 - 12,106,609
Current portion of long-term liabilities - 278,619 - 278,619
Debentures - 953,361 - 953,361
Long-term borrowings - 1,814,446 - 1,814,446
Long-term other payables 28,285 1,717,899 - 1,746,184
Others 180,366 10,732,501 41,646 10,954,513
Total ₩ 525,579 ₩ 37,867,831 ₩ 14,311,848 ₩ 52,705,258
1Other financial liabilities include collateralized borrowings and derivatives designated as hedging instruments, which are not
subject to categorizations.
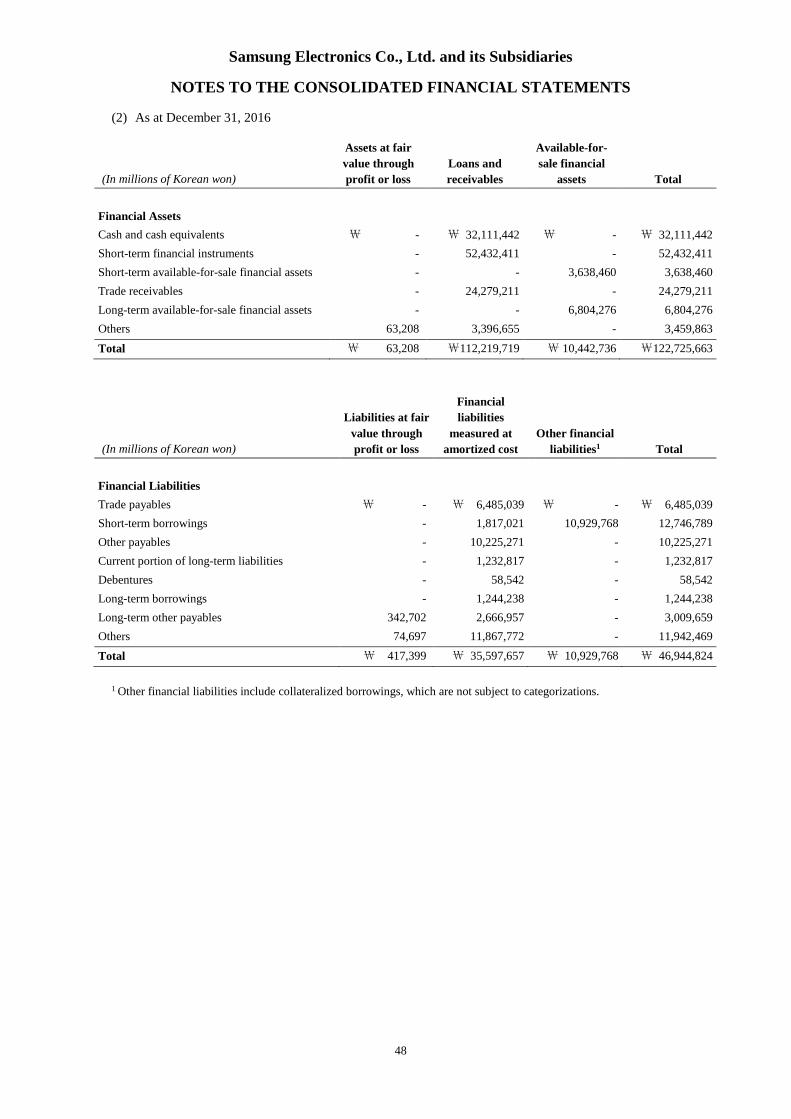
Samsung Electronics Co., Ltd. and its Subsidiaries
NOTES TO THE CONSOLIDATED FINANCIAL STATEMENTS
48
(2) As at December 31, 2016
(In millions of Korean won)
Assets at fair
value through
profit or loss
Loans and
receivables
Available-for-
sale financial
assets Total
Financial Assets
Cash and cash equivalents ₩ - ₩ 32,111,442 ₩ - ₩ 32,111,442
Short-term financial instruments - 52,432,411 - 52,432,411
Short-term available-for-sale financial assets - - 3,638,460 3,638,460
Trade receivables - 24,279,211 - 24,279,211
Long-term available-for-sale financial assets - - 6,804,276 6,804,276
Others 63,208 3,396,655 - 3,459,863
Total ₩ 63,208 ₩112,219,719 ₩ 10,442,736 ₩122,725,663
(In millions of Korean won)
Liabilities at fair
value through
profit or loss
Financial
liabilities
measured at
amortized cost
Other financial
liabilities1 Total
Financial Liabilities
Trade payables ₩ - ₩ 6,485,039 ₩ - ₩ 6,485,039
Short-term borrowings - 1,817,021 10,929,768 12,746,789
Other payables - 10,225,271 - 10,225,271
Current portion of long-term liabilities - 1,232,817 - 1,232,817
Debentures - 58,542 - 58,542
Long-term borrowings - 1,244,238 - 1,244,238
Long-term other payables 342,702 2,666,957 - 3,009,659
Others 74,697 11,867,772 - 11,942,469
Total ₩ 417,399 ₩ 35,597,657 ₩ 10,929,768 ₩ 46,944,824
1 Other financial liabilities include collateralized borrowings, which are not subject to categorizations.
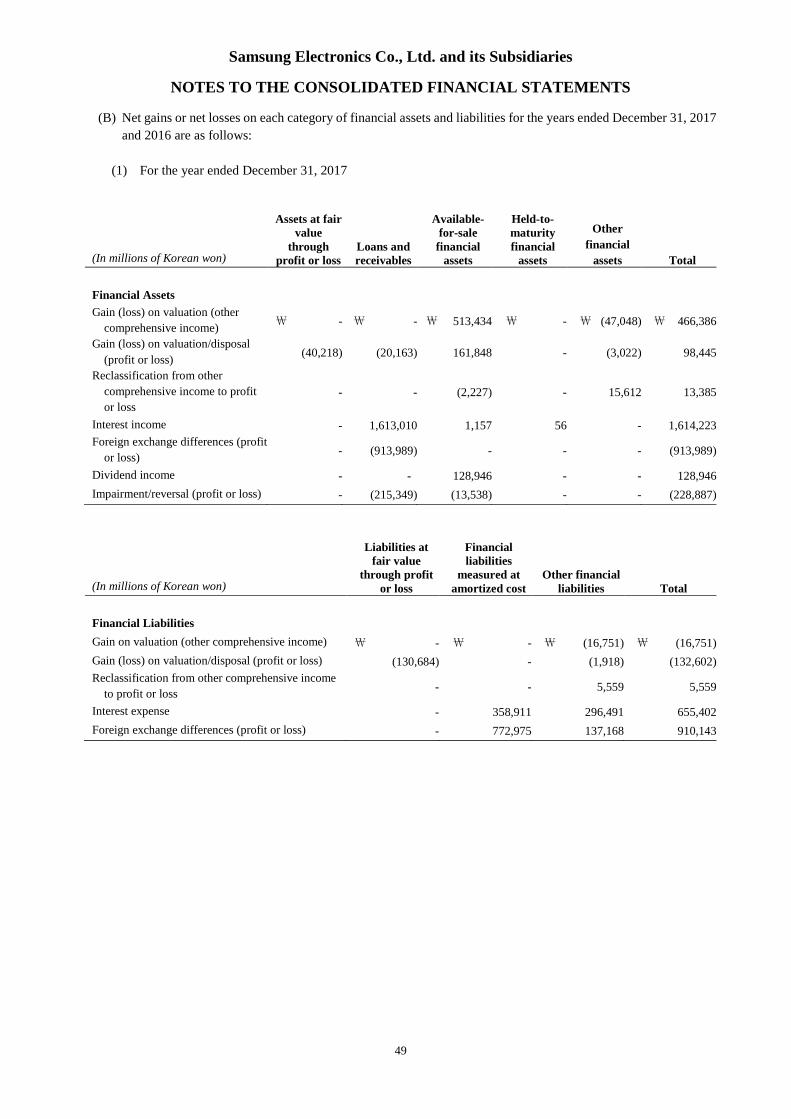
Samsung Electronics Co., Ltd. and its Subsidiaries
NOTES TO THE CONSOLIDATED FINANCIAL STATEMENTS
49
(B) Net gains or net losses on each category of financial assets and liabilities for the years ended December 31, 2017
and 2016 are as follows:
(1) For the year ended December 31, 2017
(In millions of Korean won)
Assets at fairvalue
throughprofit or loss
Loans andreceivables
Available-for-sale
financialassets
Held-to-maturityfinancial
assets
Other
financial
assets Total
Financial Assets
Gain (loss) on valuation (other
comprehensive income)₩ - ₩ - ₩ 513,434 ₩ - ₩ (47,048) ₩ 466,386
Gain (loss) on valuation/disposal
(profit or loss)(40,218) (20,163) 161,848 - (3,022) 98,445
Reclassification from other
comprehensive income to profit
or loss- - (2,227) - 15,612 13,385
Interest income - 1,613,010 1,157 56 - 1,614,223
Foreign exchange differences (profit
or loss)- (913,989) - - - (913,989)
Dividend income - - 128,946 - - 128,946
Impairment/reversal (profit or loss) - (215,349) (13,538) - - (228,887)
(In millions of Korean won)
Liabilities atfair value
through profitor loss
Financialliabilities
measured atamortized cost
Other financialliabilities Total
Financial Liabilities
Gain on valuation (other comprehensive income) ₩ - ₩ - ₩ (16,751) ₩ (16,751)
Gain (loss) on valuation/disposal (profit or loss) (130,684) - (1,918) (132,602)
Reclassification from other comprehensive income
to profit or loss- - 5,559 5,559
Interest expense - 358,911 296,491 655,402
Foreign exchange differences (profit or loss) - 772,975 137,168 910,143
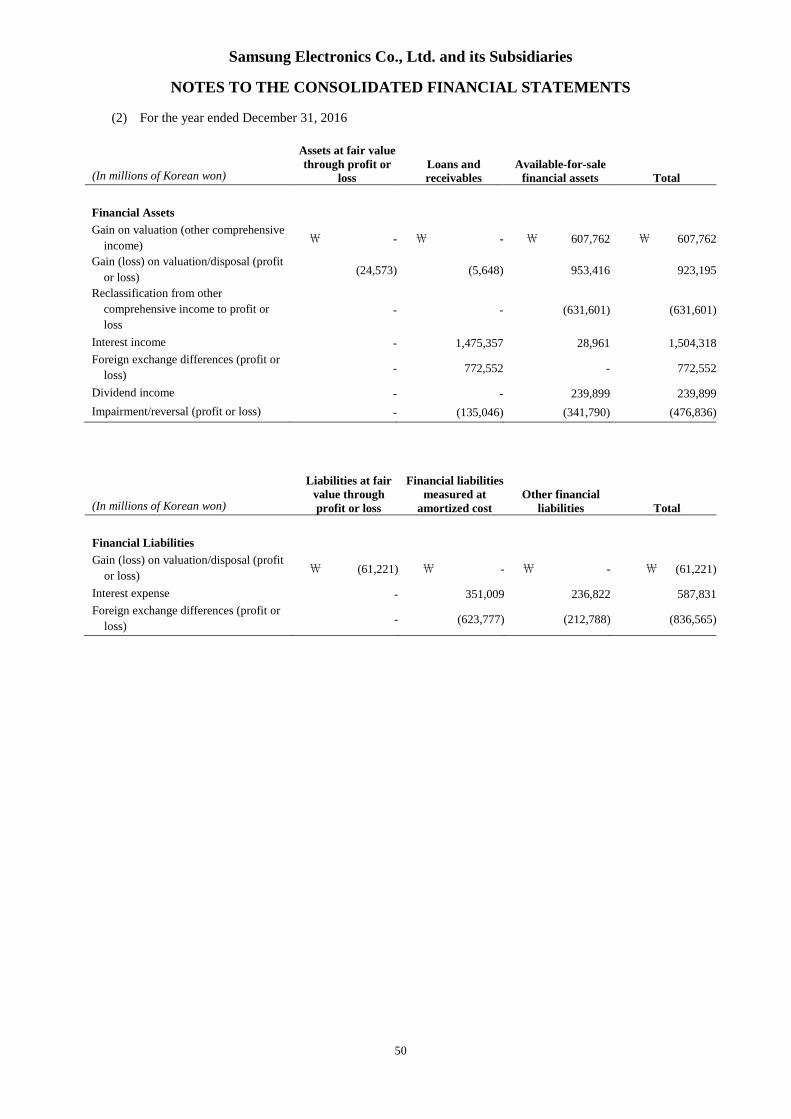
Samsung Electronics Co., Ltd. and its Subsidiaries
NOTES TO THE CONSOLIDATED FINANCIAL STATEMENTS
50
(2) For the year ended December 31, 2016
(In millions of Korean won)
Assets at fair valuethrough profit or
lossLoans andreceivables
Available-for-salefinancial assets Total
Financial Assets
Gain on valuation (other comprehensive
income)₩ - ₩ - ₩ 607,762 ₩ 607,762
Gain (loss) on valuation/disposal (profit
or loss)(24,573) (5,648) 953,416 923,195
Reclassification from other
comprehensive income to profit or
loss- - (631,601) (631,601)
Interest income - 1,475,357 28,961 1,504,318
Foreign exchange differences (profit or
loss)- 772,552 - 772,552
Dividend income - - 239,899 239,899
Impairment/reversal (profit or loss) - (135,046) (341,790) (476,836)
(In millions of Korean won)
Liabilities at fairvalue throughprofit or loss
Financial liabilitiesmeasured at
amortized costOther financial
liabilities Total
Financial Liabilities
Gain (loss) on valuation/disposal (profit
or loss)₩ (61,221) ₩ - ₩ - ₩ (61,221)
Interest expense - 351,009 236,822 587,831
Foreign exchange differences (profit or
loss)- (623,777) (212,788) (836,565)

Samsung Electronics Co., Ltd. and its Subsidiaries
NOTES TO THE CONSOLIDATED FINANCIAL STATEMENTS
51
7. Credit Quality of Financial Assets
The credit quality of financial assets that are neither past due nor impaired is assessed by reference to external credit
ratings as at December 31, 2017 and 2016 as follows:
- Superior ability to repay: Aaa~Aa (Moody’s), AAA~AA (S&P, Fitch), A1 (Credit rating agencies in Korea)
- Strong ability to repay: A (Moody’s, S&P, Fitch), A2 (Credit rating agencies in Korea)
- Acceptable ability to repay: Baa (Moody’s), BBB (S&P, Fitch), A3 (Credit rating agencies in Korea)
- Currently having the ability to repay: Ba or below (Moody’s), BB or below (S&P, Fitch), B or below (Credit
rating agencies in Korea)
- Group 1: Customers not having experienced capital erosion or default risk
- Group 2: Customers having experienced capital erosion or default risk, where all default risk is relieved as the
trade payables are guaranteed by credit insurance or collateral.
(A) Trade receivables
(In millions of Korean won) December 31, 2017 December 31, 2016
Counterparties managed by external credit rating:
Superior ability to repay ₩ 4,772,359 ₩ 2,743,633
Strong ability to repay 2,642,998 3,170,573
Acceptable ability to repay 3,810,177 3,839,674
Currently having the ability to repay 1,812,583 2,744,783
Subtotal 13,038,117 12,498,663
Counterparties managed by internal credit rating:
Group 1 13,990,823 8,465,341
Group 2 178,452 239,626
Subtotal 14,169,275 8,704,967
Total ₩ 27,207,392 ₩ 21,203,630
(B) Cash equivalents and short-term financial instruments
(In millions of Korean won) December 31, 2017 December 31, 2016
Superior ability to repay ₩ 5,596,487 ₩ 9,319,341
Strong ability to repay 72,204,793 70,916,126
Acceptable ability to repay 1,983,351 4,040,000
Currently having the ability to repay 66,139 171,393
Other1 104,534 45,223
Total ₩ 79,955,304 ₩ 84,492,083
1 Short-term financial instruments held at financial institutions (such as credit unions) without an external credit rating.
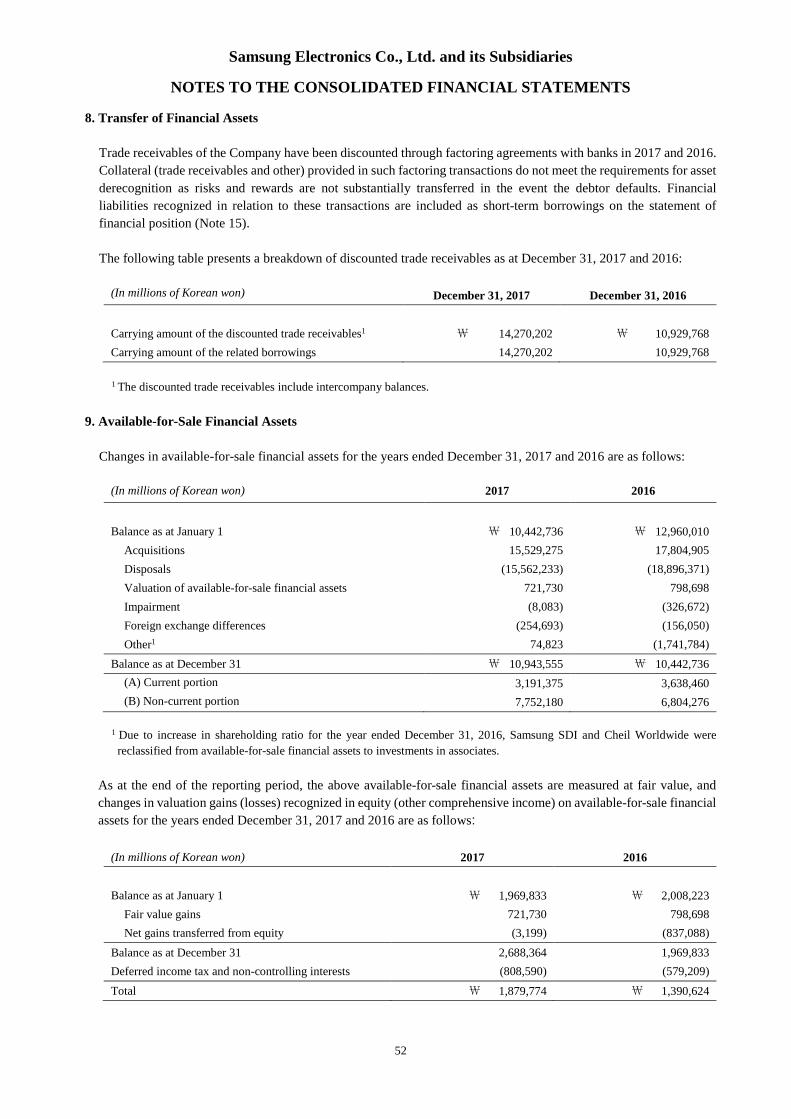
Samsung Electronics Co., Ltd. and its Subsidiaries
NOTES TO THE CONSOLIDATED FINANCIAL STATEMENTS
52
8. Transfer of Financial Assets
Trade receivables of the Company have been discounted through factoring agreements with banks in 2017 and 2016.
Collateral (trade receivables and other) provided in such factoring transactions do not meet the requirements for asset
derecognition as risks and rewards are not substantially transferred in the event the debtor defaults. Financial
liabilities recognized in relation to these transactions are included as short-term borrowings on the statement of
financial position (Note 15).
The following table presents a breakdown of discounted trade receivables as at December 31, 2017 and 2016:
(In millions of Korean won) December 31, 2017 December 31, 2016
Carrying amount of the discounted trade receivables1 ₩ 14,270,202 ₩ 10,929,768
Carrying amount of the related borrowings 14,270,202 10,929,768
1 The discounted trade receivables include intercompany balances.
9. Available-for-Sale Financial Assets
Changes in available-for-sale financial assets for the years ended December 31, 2017 and 2016 are as follows:
(In millions of Korean won) 2017 2016
Balance as at January 1 ₩ 10,442,736 ₩ 12,960,010
Acquisitions 15,529,275 17,804,905
Disposals (15,562,233) (18,896,371)
Valuation of available-for-sale financial assets 721,730 798,698
Impairment (8,083) (326,672)
Foreign exchange differences (254,693) (156,050)
Other1 74,823 (1,741,784)
Balance as at December 31 ₩ 10,943,555 ₩ 10,442,736
(A) Current portion 3,191,375 3,638,460
(B) Non-current portion 7,752,180 6,804,276
1 Due to increase in shareholding ratio for the year ended December 31, 2016, Samsung SDI and Cheil Worldwide were
reclassified from available-for-sale financial assets to investments in associates.
As at the end of the reporting period, the above available-for-sale financial assets are measured at fair value, and
changes in valuation gains (losses) recognized in equity (other comprehensive income) on available-for-sale financial
assets for the years ended December 31, 2017 and 2016 are as follows:
(In millions of Korean won) 2017 2016
Balance as at January 1 ₩ 1,969,833 ₩ 2,008,223
Fair value gains 721,730 798,698
Net gains transferred from equity (3,199) (837,088)
Balance as at December 31 2,688,364 1,969,833
Deferred income tax and non-controlling interests (808,590) (579,209)
Total ₩ 1,879,774 ₩ 1,390,624
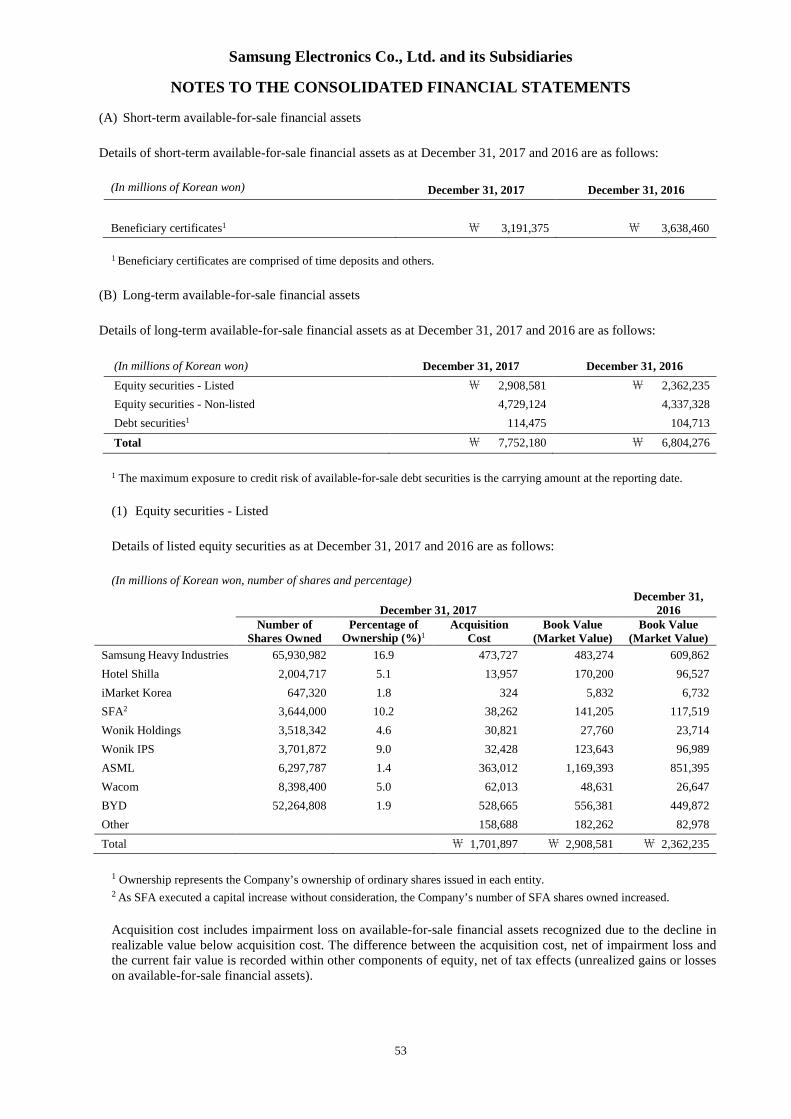
Samsung Electronics Co., Ltd. and its Subsidiaries
NOTES TO THE CONSOLIDATED FINANCIAL STATEMENTS
53
(A) Short-term available-for-sale financial assets
Details of short-term available-for-sale financial assets as at December 31, 2017 and 2016 are as follows:
(In millions of Korean won) December 31, 2017 December 31, 2016
Beneficiary certificates1 ₩ 3,191,375 ₩ 3,638,460
1 Beneficiary certificates are comprised of time deposits and others.
(B) Long-term available-for-sale financial assets
Details of long-term available-for-sale financial assets as at December 31, 2017 and 2016 are as follows:
(In millions of Korean won) December 31, 2017 December 31, 2016
Equity securities - Listed ₩ 2,908,581 ₩ 2,362,235
Equity securities - Non-listed 4,729,124 4,337,328
Debt securities1 114,475 104,713
Total ₩ 7,752,180 ₩ 6,804,276
1 The maximum exposure to credit risk of available-for-sale debt securities is the carrying amount at the reporting date.
(1) Equity securities - Listed
Details of listed equity securities as at December 31, 2017 and 2016 are as follows:
(In millions of Korean won, number of shares and percentage)
December 31, 2017December 31,
2016Number of
Shares OwnedPercentage of
Ownership (%)1Acquisition
CostBook Value
(Market Value)Book Value
(Market Value)
Samsung Heavy Industries 65,930,982 16.9 473,727 483,274 609,862
Hotel Shilla 2,004,717 5.1 13,957 170,200 96,527
iMarket Korea 647,320 1.8 324 5,832 6,732
SFA2 3,644,000 10.2 38,262 141,205 117,519
Wonik Holdings 3,518,342 4.6 30,821 27,760 23,714
Wonik IPS 3,701,872 9.0 32,428 123,643 96,989
ASML 6,297,787 1.4 363,012 1,169,393 851,395
Wacom 8,398,400 5.0 62,013 48,631 26,647
BYD 52,264,808 1.9 528,665 556,381 449,872
Other 158,688 182,262 82,978
Total ₩ 1,701,897 ₩ 2,908,581 ₩ 2,362,235
1 Ownership represents the Company’s ownership of ordinary shares issued in each entity.2 As SFA executed a capital increase without consideration, the Company’s number of SFA shares owned increased.
Acquisition cost includes impairment loss on available-for-sale financial assets recognized due to the decline inrealizable value below acquisition cost. The difference between the acquisition cost, net of impairment loss andthe current fair value is recorded within other components of equity, net of tax effects (unrealized gains or losseson available-for-sale financial assets).
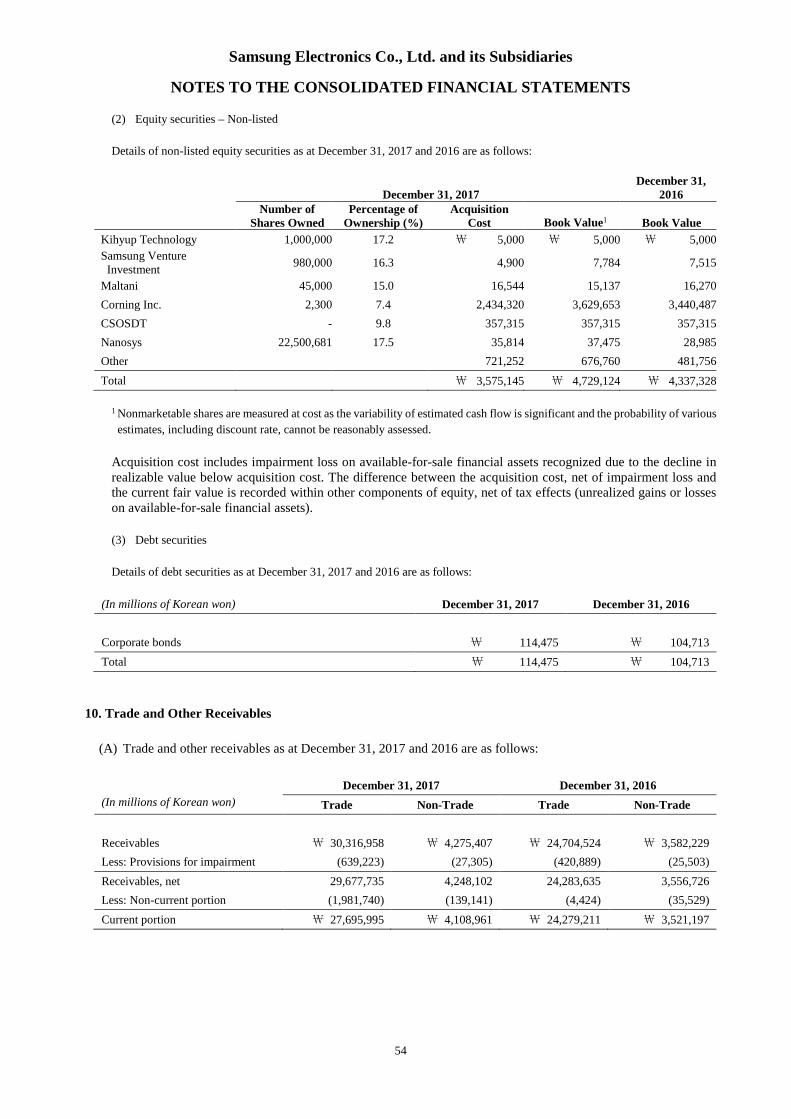
Samsung Electronics Co., Ltd. and its Subsidiaries
NOTES TO THE CONSOLIDATED FINANCIAL STATEMENTS
54
(2) Equity securities – Non-listed
Details of non-listed equity securities as at December 31, 2017 and 2016 are as follows:
December 31, 2017December 31,
2016Number of
Shares OwnedPercentage of
Ownership (%)Acquisition
Cost Book Value1 Book Value
Kihyup Technology 1,000,000 17.2 ₩ 5,000 ₩ 5,000 ₩ 5,000
Samsung VentureInvestment
980,000 16.3 4,900 7,784 7,515
Maltani 45,000 15.0 16,544 15,137 16,270
Corning Inc. 2,300 7.4 2,434,320 3,629,653 3,440,487
CSOSDT - 9.8 357,315 357,315 357,315
Nanosys 22,500,681 17.5 35,814 37,475 28,985
Other 721,252 676,760 481,756
Total ₩ 3,575,145 ₩ 4,729,124 ₩ 4,337,328
1 Nonmarketable shares are measured at cost as the variability of estimated cash flow is significant and the probability of various
estimates, including discount rate, cannot be reasonably assessed.
Acquisition cost includes impairment loss on available-for-sale financial assets recognized due to the decline inrealizable value below acquisition cost. The difference between the acquisition cost, net of impairment loss andthe current fair value is recorded within other components of equity, net of tax effects (unrealized gains or losseson available-for-sale financial assets).
(3) Debt securities
Details of debt securities as at December 31, 2017 and 2016 are as follows:
(In millions of Korean won) December 31, 2017 December 31, 2016
Corporate bonds \ 114,475 \ 104,713
Total \ 114,475 \ 104,713
10. Trade and Other Receivables
(A) Trade and other receivables as at December 31, 2017 and 2016 are as follows:
December 31, 2017 December 31, 2016
(In millions of Korean won) Trade Non-Trade Trade Non-Trade
Receivables ₩ 30,316,958 ₩ 4,275,407 ₩ 24,704,524 ₩ 3,582,229
Less: Provisions for impairment (639,223) (27,305) (420,889) (25,503)
Receivables, net 29,677,735 4,248,102 24,283,635 3,556,726
Less: Non-current portion (1,981,740) (139,141) (4,424) (35,529)
Current portion ₩ 27,695,995 ₩ 4,108,961 ₩ 24,279,211 ₩ 3,521,197
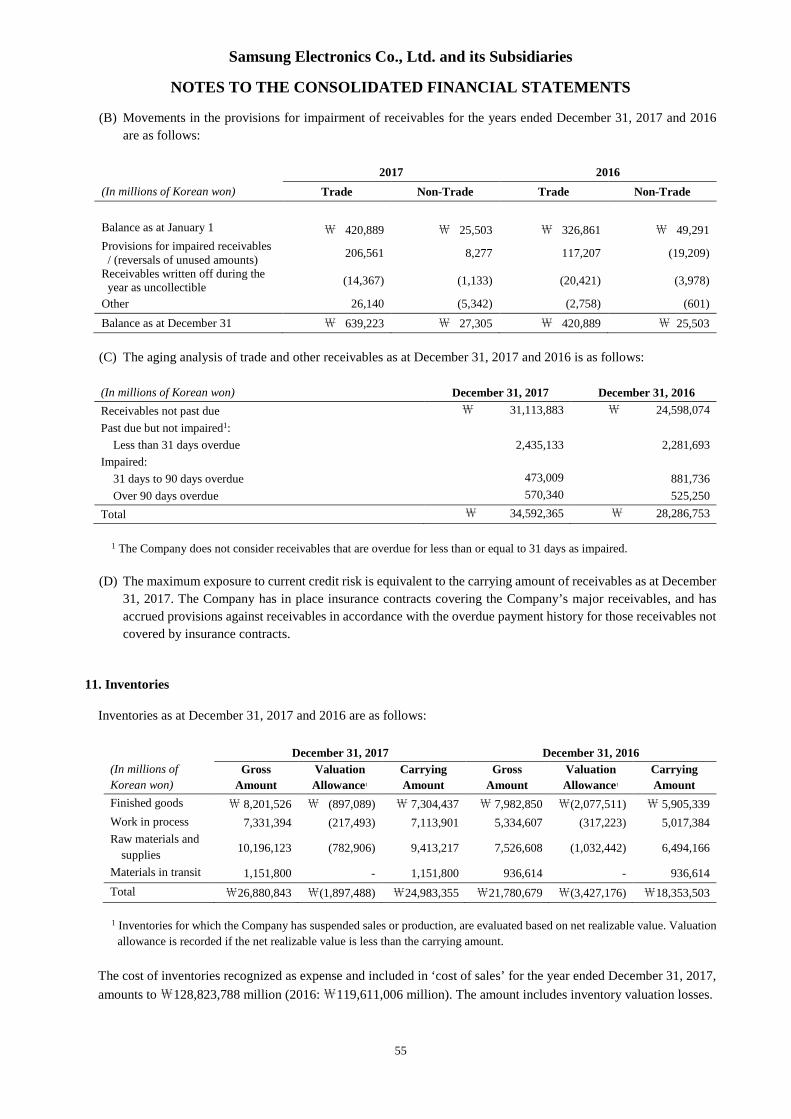
Samsung Electronics Co., Ltd. and its Subsidiaries
NOTES TO THE CONSOLIDATED FINANCIAL STATEMENTS
55
(B) Movements in the provisions for impairment of receivables for the years ended December 31, 2017 and 2016
are as follows:
2017 2016
(In millions of Korean won) Trade Non-Trade Trade Non-Trade
Balance as at January 1 ₩ 420,889 ₩ 25,503 ₩ 326,861 ₩ 49,291
Provisions for impaired receivables/ (reversals of unused amounts)
206,561 8,277 117,207 (19,209)
Receivables written off during theyear as uncollectible
(14,367) (1,133) (20,421) (3,978)
Other 26,140 (5,342) (2,758) (601)
Balance as at December 31 ₩ 639,223 ₩ 27,305 ₩ 420,889 ₩ 25,503
(C) The aging analysis of trade and other receivables as at December 31, 2017 and 2016 is as follows:
(In millions of Korean won) December 31, 2017 December 31, 2016
Receivables not past due ₩ 31,113,883 ₩ 24,598,074
Past due but not impaired1:
Less than 31 days overdue 2,435,133 2,281,693
Impaired:
31 days to 90 days overdue 473,009 881,736
Over 90 days overdue 570,340 525,250
Total ₩ 34,592,365 ₩ 28,286,753
1 The Company does not consider receivables that are overdue for less than or equal to 31 days as impaired.
(D) The maximum exposure to current credit risk is equivalent to the carrying amount of receivables as at December
31, 2017. The Company has in place insurance contracts covering the Company’s major receivables, and has
accrued provisions against receivables in accordance with the overdue payment history for those receivables not
covered by insurance contracts.
11. Inventories
Inventories as at December 31, 2017 and 2016 are as follows:
(In millions of
Korean won)
December 31, 2017 December 31, 2016
Gross
Amount
Valuation
Allowance1
Carrying
Amount
Gross
Amount
Valuation
Allowance1
Carrying
Amount
Finished goods ₩ 8,201,526 ₩ (897,089) ₩ 7,304,437 ₩ 7,982,850 ₩(2,077,511) ₩ 5,905,339
Work in process 7,331,394 (217,493) 7,113,901 5,334,607 (317,223) 5,017,384
Raw materials and
supplies10,196,123 (782,906) 9,413,217 7,526,608 (1,032,442) 6,494,166
Materials in transit 1,151,800 - 1,151,800 936,614 - 936,614
Total ₩26,880,843 ₩(1,897,488) ₩24,983,355 ₩21,780,679 ₩(3,427,176) ₩18,353,503
1 Inventories for which the Company has suspended sales or production, are evaluated based on net realizable value. Valuation
allowance is recorded if the net realizable value is less than the carrying amount.
The cost of inventories recognized as expense and included in ‘cost of sales’ for the year ended December 31, 2017,
amounts to₩128,823,788 million (2016:₩119,611,006 million). The amount includes inventory valuation losses.

Samsung Electronics Co., Ltd. and its Subsidiaries
NOTES TO THE CONSOLIDATED FINANCIAL STATEMENTS
56
12. Investments in Associates and Joint Ventures
(A) Changes in investments in associates and joint ventures for the years ended December 31, 2017 and 2016 are as
follows:
(In millions of Korean won) 2017 2016
Balance as at January 1 ₩ 5,837,884 ₩ 5,276,348
Acquisition 25,293 84,306
Disposal1 (53,187) (1,343,936)
Share of profit 201,442 19,501
Others2 790,919 1,801,665
Balance as at December 31 ₩ 6,802,351 ₩ 5,837,884
1 The Company sold its entire stake in Samsung Card for the year ended December 31, 2016.2 Others consist of dividends, impairment, reversal of impairment and reclassification.
(B) Major investments in associates and joint ventures as at December 31, 2017 are as follows:
(1) Investments in associates
Investee Nature of Relationship with Associate
Percentage of
Ownership1
(%)
Principal
Business
Location
The End of
Reporting
Period
Samsung Electro-
Mechanics
Manufacture and supply electronic components
including passive components, circuit boards, and
modules
23.7 Korea December
Samsung SDS
Provide IT services including computer
programming, system integration and management
and logistical services
22.6 Korea December
Samsung Biologics New business investment 31.5 Korea December
Samsung SDI2 Manufacture and supply electronics including
secondary cell batteries19.6 Korea December
Cheil Worldwide Advertising agency 25.2 Korea December
1 Ownership represents the Company’s ownership of ordinary shares issued by each entity.2 The Company’s ownership of ordinary shares outstanding is 20.6%.
(2) Investments in joint ventures
Investee Nature of Relationship with Joint Venture
Percentage of
Ownership1
(%)
Principal
Business
Location
The End of
Reporting
Period
Samsung Corning
Advanced GlassManufacture and supply industrial glass devices 50.0 Korea December
1 Ownership represents the Company’s ownership of ordinary shares issued by each entity.
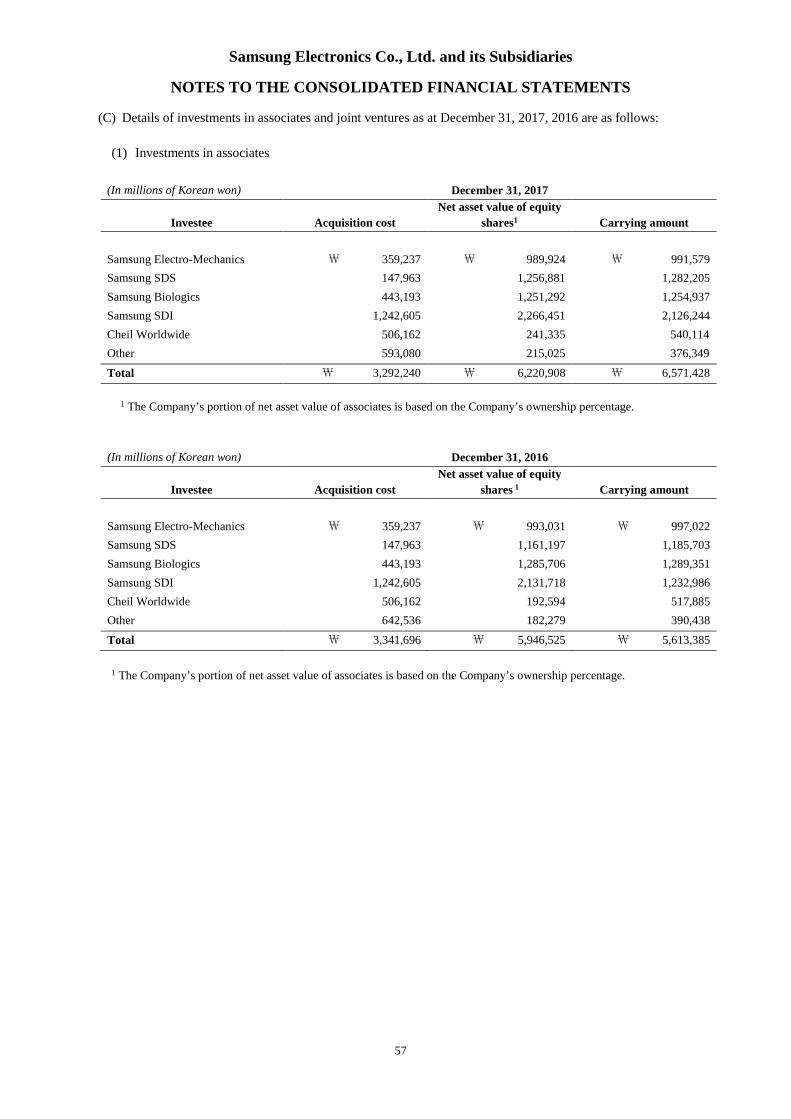
Samsung Electronics Co., Ltd. and its Subsidiaries
NOTES TO THE CONSOLIDATED FINANCIAL STATEMENTS
57
(C) Details of investments in associates and joint ventures as at December 31, 2017, 2016 are as follows:
(1) Investments in associates
(In millions of Korean won) December 31, 2017
Investee Acquisition cost
Net asset value of equity
shares1 Carrying amount
Samsung Electro-Mechanics ₩ 359,237 ₩ 989,924 ₩ 991,579
Samsung SDS 147,963 1,256,881 1,282,205
Samsung Biologics 443,193 1,251,292 1,254,937
Samsung SDI 1,242,605 2,266,451 2,126,244
Cheil Worldwide 506,162 241,335 540,114
Other 593,080 215,025 376,349
Total ₩ 3,292,240 ₩ 6,220,908 ₩ 6,571,428
1 The Company’s portion of net asset value of associates is based on the Company’s ownership percentage.
(In millions of Korean won) December 31, 2016
Investee Acquisition cost
Net asset value of equity
shares 1 Carrying amount
Samsung Electro-Mechanics ₩ 359,237 ₩ 993,031 ₩ 997,022
Samsung SDS 147,963 1,161,197 1,185,703
Samsung Biologics 443,193 1,285,706 1,289,351
Samsung SDI 1,242,605 2,131,718 1,232,986
Cheil Worldwide 506,162 192,594 517,885
Other 642,536 182,279 390,438
Total ₩ 3,341,696 ₩ 5,946,525 ₩ 5,613,385
1 The Company’s portion of net asset value of associates is based on the Company’s ownership percentage.

Samsung Electronics Co., Ltd. and its Subsidiaries
NOTES TO THE CONSOLIDATED FINANCIAL STATEMENTS
58
(2) Investments in joint ventures
(In millions of Korean won) December 31, 2017
Investee Acquisition cost
Net asset value of
equity shares 1 Carrying amount
Samsung Corning Advanced Glass ₩ 215,000 ₩ 170,440 ₩ 170,425
Others 259,994 65,106 60,498
Total ₩ 474,994 ₩ 235,546 ₩ 230,923
1 The Company’s portion of net asset value of joint ventures is based on the Company’s ownership percentage.
(In millions of Korean won) December 31, 2016
Investee Acquisition cost
Net asset value of
equity shares 1 Carrying amount
Samsung Corning Advanced Glass ₩ 215,000 ₩ 169,521 ₩ 169,485
Others 259,977 59,342 55,014
Total ₩ 474,977 ₩ 228,863 ₩ 224,499
1 The Company’s portion of net asset value of joint ventures is based on the Company’s ownership percentage.
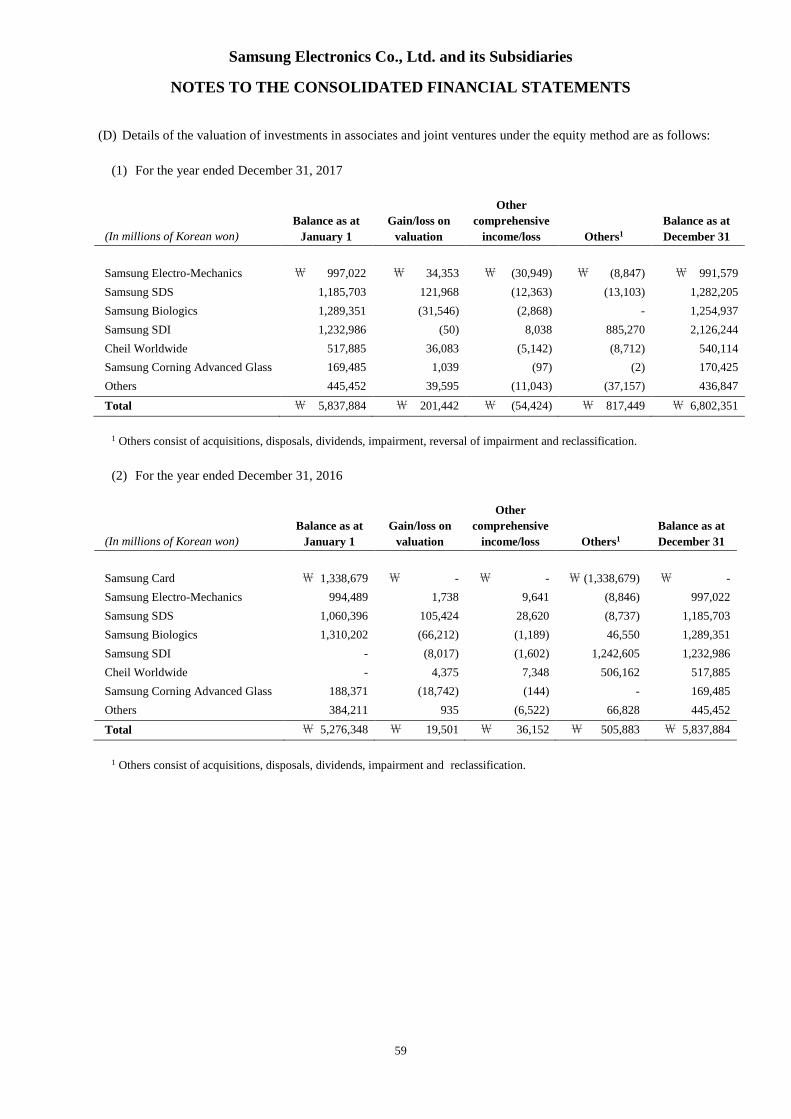
Samsung Electronics Co., Ltd. and its Subsidiaries
NOTES TO THE CONSOLIDATED FINANCIAL STATEMENTS
59
(D) Details of the valuation of investments in associates and joint ventures under the equity method are as follows:
(1) For the year ended December 31, 2017
(In millions of Korean won)
Balance as at
January 1
Gain/loss on
valuation
Other
comprehensive
income/loss Others1
Balance as at
December 31
Samsung Electro-Mechanics ₩ 997,022 ₩ 34,353 ₩ (30,949) ₩ (8,847) ₩ 991,579
Samsung SDS 1,185,703 121,968 (12,363) (13,103) 1,282,205
Samsung Biologics 1,289,351 (31,546) (2,868) - 1,254,937
Samsung SDI 1,232,986 (50) 8,038 885,270 2,126,244
Cheil Worldwide 517,885 36,083 (5,142) (8,712) 540,114
Samsung Corning Advanced Glass 169,485 1,039 (97) (2) 170,425
Others 445,452 39,595 (11,043) (37,157) 436,847
Total ₩ 5,837,884 ₩ 201,442 ₩ (54,424) ₩ 817,449 ₩ 6,802,351
1 Others consist of acquisitions, disposals, dividends, impairment, reversal of impairment and reclassification.
(2) For the year ended December 31, 2016
(In millions of Korean won)
Balance as at
January 1
Gain/loss on
valuation
Other
comprehensive
income/loss Others1
Balance as at
December 31
Samsung Card ₩ 1,338,679 ₩ - ₩ - ₩ (1,338,679) ₩ -
Samsung Electro-Mechanics 994,489 1,738 9,641 (8,846) 997,022
Samsung SDS 1,060,396 105,424 28,620 (8,737) 1,185,703
Samsung Biologics 1,310,202 (66,212) (1,189) 46,550 1,289,351
Samsung SDI - (8,017) (1,602) 1,242,605 1,232,986
Cheil Worldwide - 4,375 7,348 506,162 517,885
Samsung Corning Advanced Glass 188,371 (18,742) (144) - 169,485
Others 384,211 935 (6,522) 66,828 445,452
Total ₩ 5,276,348 ₩ 19,501 ₩ 36,152 ₩ 505,883 ₩ 5,837,884
1 Others consist of acquisitions, disposals, dividends, impairment and reclassification.

Samsung Electronics Co., Ltd. and its Subsidiaries
NOTES TO THE CONSOLIDATED FINANCIAL STATEMENTS
60
(E) Summary of condensed financial information of major associates and joint ventures
(1) A summary of condensed financial information of major associates and dividends received from associates as
at December 31, 2017 and 2016, and for the years ended December 31, 2017 and 2016 is as follows:
2017
(In millions of Korean won)
Samsung
Electro-
Mechanics
Samsung
SDS
Samsung
Biologics
Samsung
SDI
Cheil
Worldwide
1. Condensed financial information
Condensed statements of financial position:
Current assets ₩ 2,478,798 ₩ 5,117,499 ₩ 620,995 ₩ 3,605,076 ₩ 1,889,096
Non-current assets 5,288,605 2,160,262 6,562,096 12,146,401 349,197
Current liabilities 2,454,110 1,324,862 2,287,442 2,670,360 1,281,293
Non-current liabilities 981,802 233,469 919,198 1,629,117 101,012
Non-controlling interests 99,848 161,151 - 194,698 9,927
Condensed statements of comprehensive income:
Revenue ₩ 6,838,474 ₩ 9,299,206 ₩ 464,629 ₩ 6,321,561 ₩ 3,374,987
Profit or loss from continuing
operations1 161,739 530,348 (96,972) 657,236 127,153
Other comprehensive income(loss)1 (132,298) (63,585) (8,957) 27,870 (25,115)
Total comprehensive income(loss)1 29,441 466,763 (105,929) 685,106 102,038
2. Details of adjustments from the book value of investments in associates
Net assets (a) 4,231,643 5,558,279 3,976,451 11,257,302 846,061
Ownership percentage (b) 2 23.4% 22.6% 31.5% 20.1% 28.7%
Net assets of equity shares (a x b) 989,924 1,256,881 1,251,292 2,266,451 241,335
Goodwill 7,081 26,801 3,645 - 298,779
Intercompany transactions and
others3 (5,426) (1,477) - (140,207) -
Book value of associates 991,579 1,282,205 1,254,937 2,126,244 540,114
3. Dividends from associates
Dividends ₩ 8,847 ₩ 13,104 ₩ - ₩ 13,463 ₩ 8,711
1 Income (loss) attributable to owners of the parent.2 Ownership percentage includes ordinary and preference shares.3 Consists of unrealized gains and losses and other differences.
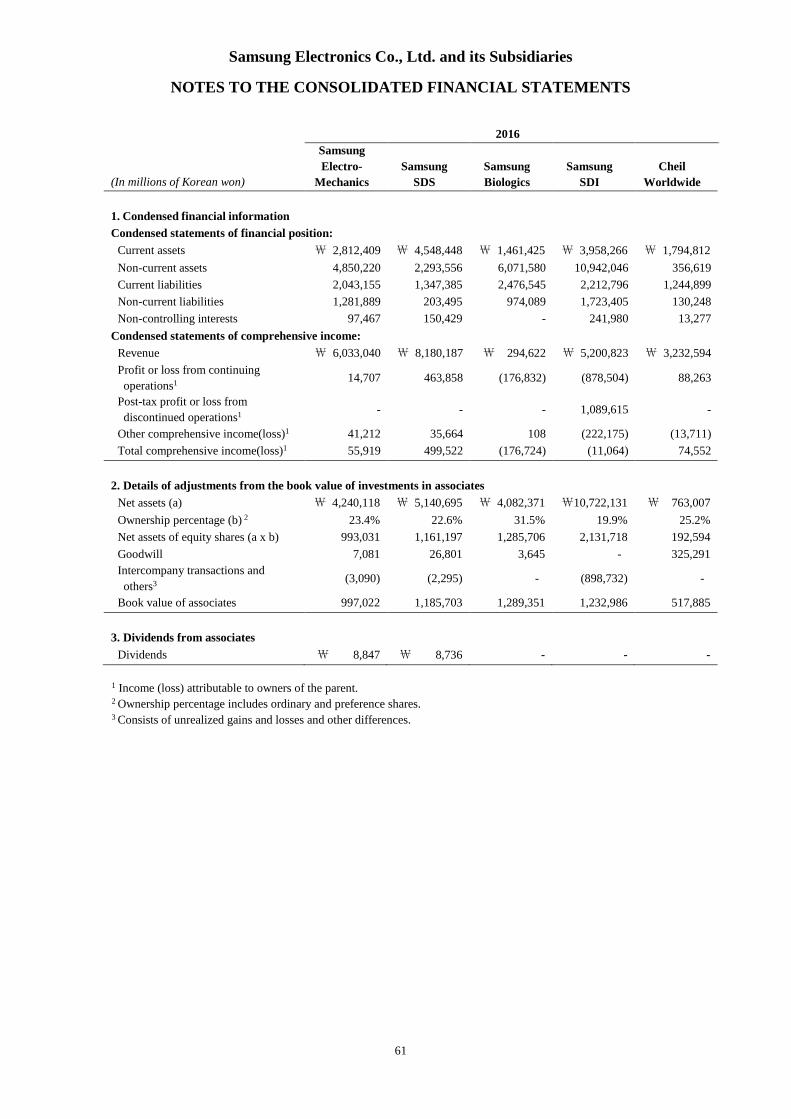
Samsung Electronics Co., Ltd. and its Subsidiaries
NOTES TO THE CONSOLIDATED FINANCIAL STATEMENTS
61
2016
(In millions of Korean won)
Samsung
Electro-
Mechanics
Samsung
SDS
Samsung
Biologics
Samsung
SDI
Cheil
Worldwide
1. Condensed financial information
Condensed statements of financial position:
Current assets ₩ 2,812,409 ₩ 4,548,448 ₩ 1,461,425 ₩ 3,958,266 ₩ 1,794,812
Non-current assets 4,850,220 2,293,556 6,071,580 10,942,046 356,619
Current liabilities 2,043,155 1,347,385 2,476,545 2,212,796 1,244,899
Non-current liabilities 1,281,889 203,495 974,089 1,723,405 130,248
Non-controlling interests 97,467 150,429 - 241,980 13,277
Condensed statements of comprehensive income:
Revenue ₩ 6,033,040 ₩ 8,180,187 ₩ 294,622 ₩ 5,200,823 ₩ 3,232,594
Profit or loss from continuing
operations1 14,707 463,858 (176,832) (878,504) 88,263
Post-tax profit or loss from
discontinued operations1 - - - 1,089,615 -
Other comprehensive income(loss)1 41,212 35,664 108 (222,175) (13,711)
Total comprehensive income(loss)1 55,919 499,522 (176,724) (11,064) 74,552
2. Details of adjustments from the book value of investments in associates
Net assets (a) ₩ 4,240,118 ₩ 5,140,695 ₩ 4,082,371 ₩10,722,131 ₩ 763,007
Ownership percentage (b) 2 23.4% 22.6% 31.5% 19.9% 25.2%
Net assets of equity shares (a x b) 993,031 1,161,197 1,285,706 2,131,718 192,594
Goodwill 7,081 26,801 3,645 - 325,291
Intercompany transactions and
others3 (3,090) (2,295) - (898,732) -
Book value of associates 997,022 1,185,703 1,289,351 1,232,986 517,885
3. Dividends from associates
Dividends ₩ 8,847 ₩ 8,736 - - -
1 Income (loss) attributable to owners of the parent.2 Ownership percentage includes ordinary and preference shares.3 Consists of unrealized gains and losses and other differences.

Samsung Electronics Co., Ltd. and its Subsidiaries
NOTES TO THE CONSOLIDATED FINANCIAL STATEMENTS
62
(2) A summary of the condensed financial information of major joint ventures and dividends received from joint
ventures as at December 31, 2017 and 2016, and for the years ended December 31, 2017 and 2016 is as
follows:
Samsung Corning Advanced Glass
(In millions of Korean won) 2017 2016
1. Condensed financial information
Condensed statements of financial position:
Current assets ₩ 128,499 ₩ 170,614
- Cash and cash equivalent 11,035 16,021
Non-current assets 253,840 209,881
Current liabilities 41,325 41,076
- Current financial liabilities1 18,900 14,779
Non-current liabilities 134 377
Condensed statements of comprehensive income2:
Revenue ₩ 242,452 ₩ 257,041
Depreciation and amortization 1,356 2,202
Interest income 738 1,433
Income tax expense 129 (8,841)
Profit or loss from continuing operations2 2,034 (37,531)
Other comprehensive income(loss)2 - -
Total comprehensive loss2 2,034 (37,531)
1 Trade payables, other payables, and provisions are excluded.2 Income(loss) attributable to owners of the parent.
Samsung Corning Advanced Glass
(In millions of Korean won) 2017 2016
2. Details of adjustments from the book value of investments in joint ventures
Net assets(a) ₩ 340,880 ₩ 339,042
Ownership percentage(b) 50.0% 50.0%
Net assets of equity shares(a x b) 170,440 169,521
Intercompany transactions and others1 (15) (36)
Book value of joint ventures 170,425 169,485
3. Dividends from joint ventures
Dividends ₩ - ₩ -
1 Consists of unrealized gains and losses and other differences.
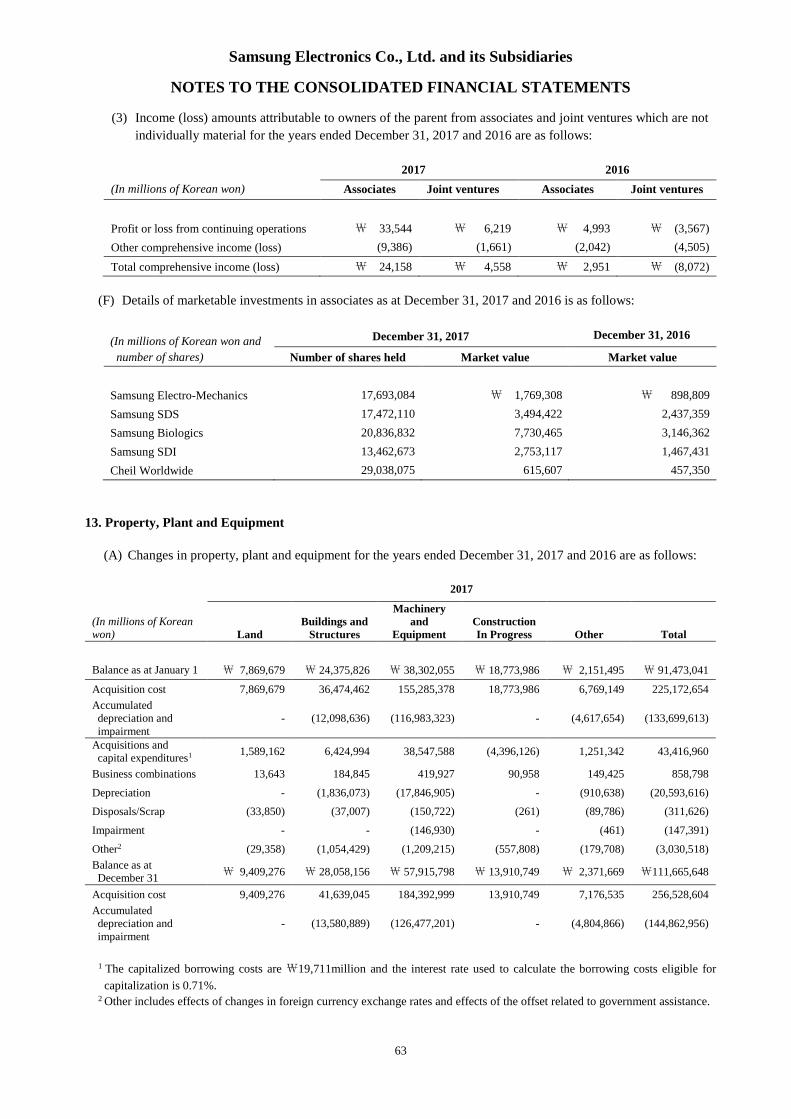
Samsung Electronics Co., Ltd. and its Subsidiaries
NOTES TO THE CONSOLIDATED FINANCIAL STATEMENTS
63
(3) Income (loss) amounts attributable to owners of the parent from associates and joint ventures which are not
individually material for the years ended December 31, 2017 and 2016 are as follows:
2017 2016
(In millions of Korean won) Associates Joint ventures Associates Joint ventures
Profit or loss from continuing operations ₩ 33,544 ₩ 6,219 ₩ 4,993 ₩ (3,567)
Other comprehensive income (loss) (9,386) (1,661) (2,042) (4,505)
Total comprehensive income (loss) ₩ 24,158 ₩ 4,558 ₩ 2,951 ₩ (8,072)
(F) Details of marketable investments in associates as at December 31, 2017 and 2016 is as follows:
(In millions of Korean won and
number of shares)
December 31, 2017 December 31, 2016
Number of shares held Market value Market value
Samsung Electro-Mechanics 17,693,084 ₩ 1,769,308 ₩ 898,809
Samsung SDS 17,472,110 3,494,422 2,437,359
Samsung Biologics 20,836,832 7,730,465 3,146,362
Samsung SDI 13,462,673 2,753,117 1,467,431
Cheil Worldwide 29,038,075 615,607 457,350
13. Property, Plant and Equipment
(A) Changes in property, plant and equipment for the years ended December 31, 2017 and 2016 are as follows:
2017
(In millions of Koreanwon) Land
Buildings andStructures
Machineryand
EquipmentConstructionIn Progress Other Total
Balance as at January 1 ₩ 7,869,679 ₩ 24,375,826 ₩ 38,302,055 ₩ 18,773,986 ₩ 2,151,495 ₩ 91,473,041
Acquisition cost 7,869,679 36,474,462 155,285,378 18,773,986 6,769,149 225,172,654
Accumulateddepreciation andimpairment
- (12,098,636) (116,983,323) - (4,617,654) (133,699,613)
Acquisitions andcapital expenditures1 1,589,162 6,424,994 38,547,588 (4,396,126) 1,251,342 43,416,960
Business combinations 13,643 184,845 419,927 90,958 149,425 858,798
Depreciation - (1,836,073) (17,846,905) - (910,638) (20,593,616)
Disposals/Scrap (33,850) (37,007) (150,722) (261) (89,786) (311,626)
Impairment - - (146,930) - (461) (147,391)
Other2 (29,358) (1,054,429) (1,209,215) (557,808) (179,708) (3,030,518)
Balance as atDecember 31
₩ 9,409,276 ₩ 28,058,156 ₩ 57,915,798 ₩ 13,910,749 ₩ 2,371,669 ₩111,665,648
Acquisition cost 9,409,276 41,639,045 184,392,999 13,910,749 7,176,535 256,528,604
Accumulateddepreciation andimpairment
- (13,580,889) (126,477,201) - (4,804,866) (144,862,956)
1 The capitalized borrowing costs are ₩19,711million and the interest rate used to calculate the borrowing costs eligible for
capitalization is 0.71%.2 Other includes effects of changes in foreign currency exchange rates and effects of the offset related to government assistance.
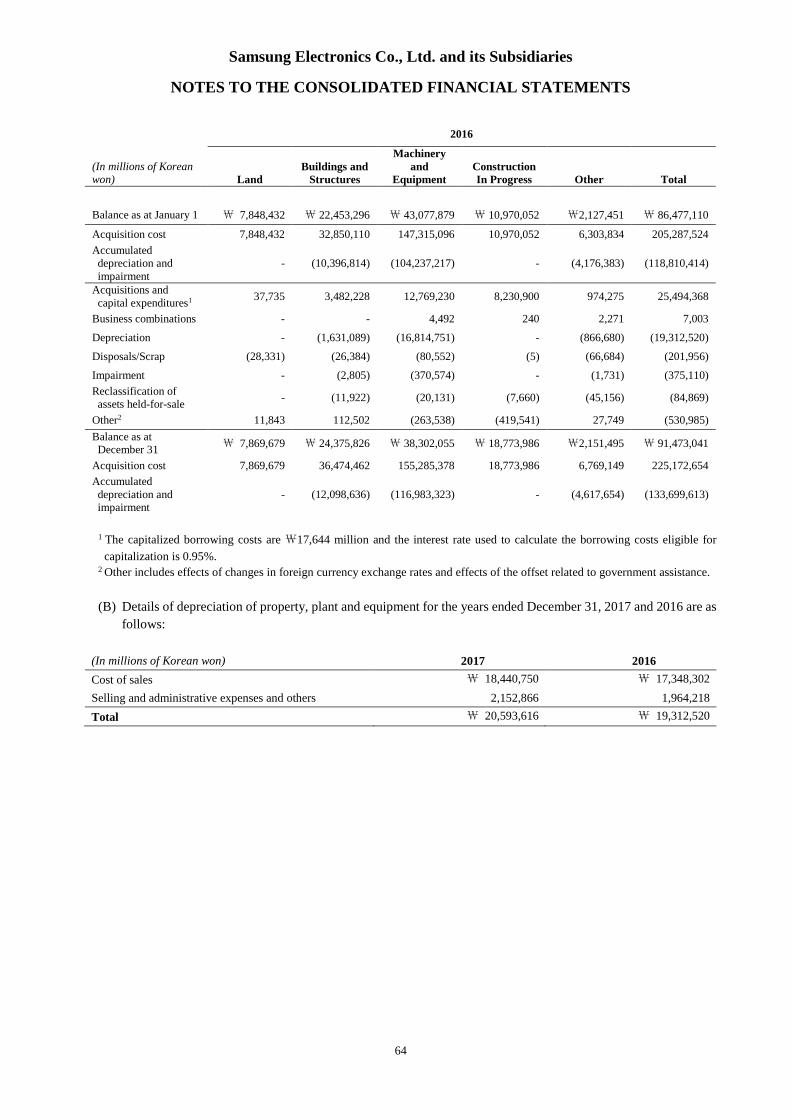
Samsung Electronics Co., Ltd. and its Subsidiaries
NOTES TO THE CONSOLIDATED FINANCIAL STATEMENTS
64
2016
(In millions of Koreanwon) Land
Buildings andStructures
Machineryand
EquipmentConstructionIn Progress Other Total
Balance as at January 1 ₩ 7,848,432 ₩ 22,453,296 ₩ 43,077,879 ₩ 10,970,052 ₩2,127,451 ₩ 86,477,110
Acquisition cost 7,848,432 32,850,110 147,315,096 10,970,052 6,303,834 205,287,524
Accumulateddepreciation andimpairment
- (10,396,814) (104,237,217) - (4,176,383) (118,810,414)
Acquisitions andcapital expenditures1 37,735 3,482,228 12,769,230 8,230,900 974,275 25,494,368
Business combinations - - 4,492 240 2,271 7,003
Depreciation - (1,631,089) (16,814,751) - (866,680) (19,312,520)
Disposals/Scrap (28,331) (26,384) (80,552) (5) (66,684) (201,956)
Impairment - (2,805) (370,574) - (1,731) (375,110)
Reclassification ofassets held-for-sale
- (11,922) (20,131) (7,660) (45,156) (84,869)
Other2 11,843 112,502 (263,538) (419,541) 27,749 (530,985)
Balance as atDecember 31
₩ 7,869,679 ₩ 24,375,826 ₩ 38,302,055 ₩ 18,773,986 ₩2,151,495 ₩ 91,473,041
Acquisition cost 7,869,679 36,474,462 155,285,378 18,773,986 6,769,149 225,172,654
Accumulateddepreciation andimpairment
- (12,098,636) (116,983,323) - (4,617,654) (133,699,613)
1 The capitalized borrowing costs are ₩17,644 million and the interest rate used to calculate the borrowing costs eligible for
capitalization is 0.95%.2 Other includes effects of changes in foreign currency exchange rates and effects of the offset related to government assistance.
(B) Details of depreciation of property, plant and equipment for the years ended December 31, 2017 and 2016 are as
follows:
(In millions of Korean won) 2017 2016
Cost of sales ₩ 18,440,750 ₩ 17,348,302
Selling and administrative expenses and others 2,152,866 1,964,218
Total ₩ 20,593,616 ₩ 19,312,520
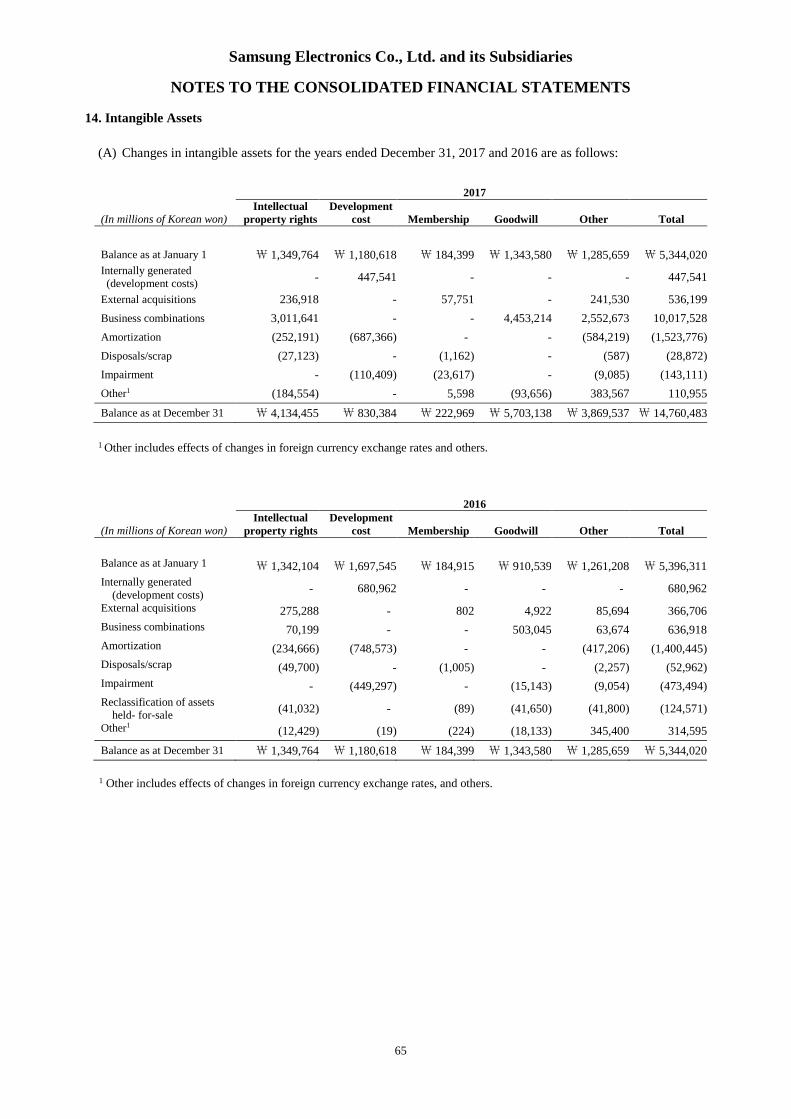
Samsung Electronics Co., Ltd. and its Subsidiaries
NOTES TO THE CONSOLIDATED FINANCIAL STATEMENTS
65
14. Intangible Assets
(A) Changes in intangible assets for the years ended December 31, 2017 and 2016 are as follows:
(In millions of Korean won)
2017Intellectual
property rightsDevelopment
cost Membership Goodwill Other Total
Balance as at January 1 ₩ 1,349,764 ₩ 1,180,618 ₩ 184,399 ₩ 1,343,580 ₩ 1,285,659 ₩ 5,344,020
Internally generated(development costs)
- 447,541 - - - 447,541
External acquisitions 236,918 - 57,751 - 241,530 536,199
Business combinations 3,011,641 - - 4,453,214 2,552,673 10,017,528
Amortization (252,191) (687,366) - - (584,219) (1,523,776)
Disposals/scrap (27,123) - (1,162) - (587) (28,872)
Impairment - (110,409) (23,617) - (9,085) (143,111)
Other1 (184,554) - 5,598 (93,656) 383,567 110,955
Balance as at December 31 ₩ 4,134,455 ₩ 830,384 ₩ 222,969 ₩ 5,703,138 ₩ 3,869,537 ₩ 14,760,483
1 Other includes effects of changes in foreign currency exchange rates and others.
(In millions of Korean won)
2016Intellectual
property rightsDevelopment
cost Membership Goodwill Other Total
Balance as at January 1 ₩ 1,342,104 ₩ 1,697,545 ₩ 184,915 ₩ 910,539 ₩ 1,261,208 ₩ 5,396,311
Internally generated(development costs)
- 680,962 - - - 680,962
External acquisitions 275,288 - 802 4,922 85,694 366,706
Business combinations 70,199 - - 503,045 63,674 636,918
Amortization (234,666) (748,573) - - (417,206) (1,400,445)
Disposals/scrap (49,700) - (1,005) - (2,257) (52,962)
Impairment - (449,297) - (15,143) (9,054) (473,494)
Reclassification of assetsheld- for-sale
(41,032) - (89) (41,650) (41,800) (124,571)
Other1(12,429) (19) (224) (18,133) 345,400 314,595
Balance as at December 31 ₩ 1,349,764 ₩ 1,180,618 ₩ 184,399 ₩ 1,343,580 ₩ 1,285,659 ₩ 5,344,020
1 Other includes effects of changes in foreign currency exchange rates, and others.

Samsung Electronics Co., Ltd. and its Subsidiaries
NOTES TO THE CONSOLIDATED FINANCIAL STATEMENTS
66
(B) Goodwill
Goodwill is allocated to cash-generating units at the end of the reporting period. Details of goodwill as at December
31, 2017 and 2016 are as follows:
(In millions of Korean won) December 31, 2017 December 31, 2016
CE ₩ 500,611 ₩ 532,669
IM 600,633 644,468
Semiconductor 81,142 82,400
DP 80,299 80,299
Harman 4,436,715 -
Other 3,738 3,744
Total ₩ 5,703,138 ₩ 1,343,580
Goodwill impairment reviews are undertaken annually, and the recoverable amounts of cash-generating units have
been determined based on value-in-use calculations. These calculations use pre-tax cash flow projections based on
financial budgets approved by management covering a five-year period. Cash flows beyond the five-year period are
extrapolated using the estimated growth rates stated below. The growth rate does not exceed the long-term average
growth rate for the industry. In addition, a constant growth rate assumption is used for perpetual cash flow calculation.
(C) Details of amortization of intangible assets for the years ended December 31, 2017 and 2016 are as follows:
(In millions of Korean won) 2017 2016
Cost of sales ₩ 894,529 ₩ 959,545
Selling and administrative expenses and others 629,247 440,900
Total ₩ 1,523,776 ₩ 1,400,445
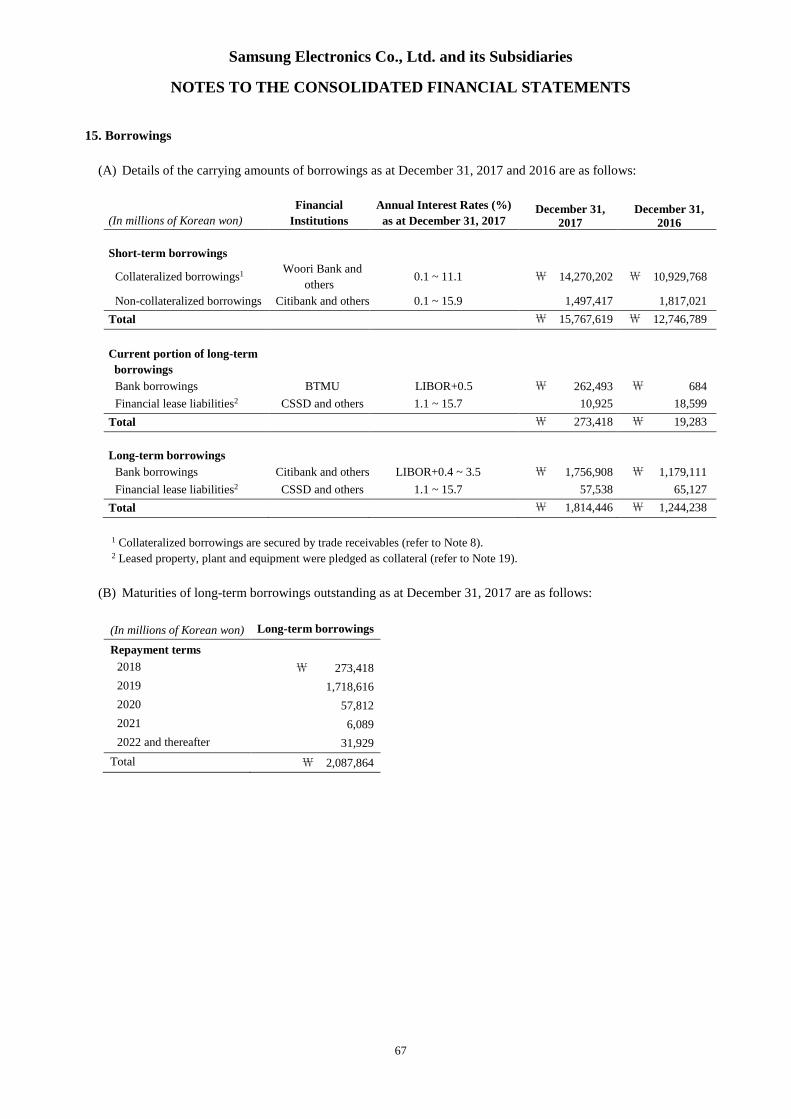
Samsung Electronics Co., Ltd. and its Subsidiaries
NOTES TO THE CONSOLIDATED FINANCIAL STATEMENTS
67
15. Borrowings
(A) Details of the carrying amounts of borrowings as at December 31, 2017 and 2016 are as follows:
(In millions of Korean won)
Financial
Institutions
Annual Interest Rates (%)
as at December 31, 2017December 31,
2017December 31,
2016
Short-term borrowings
Collateralized borrowings1 Woori Bank and
others0.1 ~ 11.1 ₩ 14,270,202 ₩ 10,929,768
Non-collateralized borrowings Citibank and others 0.1 ~ 15.9 1,497,417 1,817,021
Total ₩ 15,767,619 ₩ 12,746,789
Current portion of long-term
borrowings
Bank borrowings BTMU LIBOR+0.5 ₩ 262,493 ₩ 684
Financial lease liabilities2 CSSD and others 1.1 ~ 15.7 10,925 18,599
Total ₩ 273,418 ₩ 19,283
Long-term borrowings
Bank borrowings Citibank and others LIBOR+0.4 ~ 3.5 ₩ 1,756,908 ₩ 1,179,111
Financial lease liabilities2 CSSD and others 1.1 ~ 15.7 57,538 65,127
Total ₩ 1,814,446 ₩ 1,244,238
1 Collateralized borrowings are secured by trade receivables (refer to Note 8).2 Leased property, plant and equipment were pledged as collateral (refer to Note 19).
(B) Maturities of long-term borrowings outstanding as at December 31, 2017 are as follows:
(In millions of Korean won) Long-term borrowings
Repayment terms
2018 ₩ 273,418
2019 1,718,616
2020 57,812
2021 6,089
2022 and thereafter 31,929
Total ₩ 2,087,864

Samsung Electronics Co., Ltd. and its Subsidiaries
NOTES TO THE CONSOLIDATED FINANCIAL STATEMENTS
68
16. Debentures
(A) Details of foreign currency denominated debentures as at December 31, 2017 and 2016 are as follows:
(In millions of
Korean Won) Issue Date Due Date
Annual Interest Rates (%)
as at December 31, 2017 2017 2016
US dollar denominated
straight bonds1 1997.10.2 2027.10.1 7.7₩ 53,570
(US$50 million)
₩ 66,468
(US$55 million)
US dollar denominated
unsecured bonds2 2012.4.10 2017.4.10 -- 1,208,500
(US$1,000 million)
US dollar denominated
debenture bonds3 2015.5.6 2025.5.15 4.2428,560
(US$400 million)
-
EURO denominated
debenture bonds4 2015.5.20 2022.5.27 2.0447,739
(EUR€350 million)-
Less: Current Portion (5,357) (1,214,543)
Less: Discounts (1,405) (1,883)
More: Premium 30,254 -
Total ₩ 953,361 ₩ 58,542
1 US dollar denominated straight bonds are repaid annually for twenty years after a ten-year grace period from the date of issuance.
Interest is paid semi-annually.2 Samsung Electronics America issued dollar denominated unsecured bonds. The amount was repaid during 2017.3 Harman International Industries issued dollar denominated debenture bonds. Repayment of these debentures is due on the date
of maturity and interest is paid semi-annually.4 Harman Finance International SCA issued euro denominated debenture bonds. Repayment of these debentures is due on the date
of maturity and interest is paid annually.
(B) Maturities of debentures outstanding as at December 31, 2017 are as follows:
(In millions of Korean won) Debentures
Repayment Term
2018 ₩ 5,357
2019 5,357
2020 5,357
2021 5,357
2022 and thereafter 908,441
Total ₩ 929,869
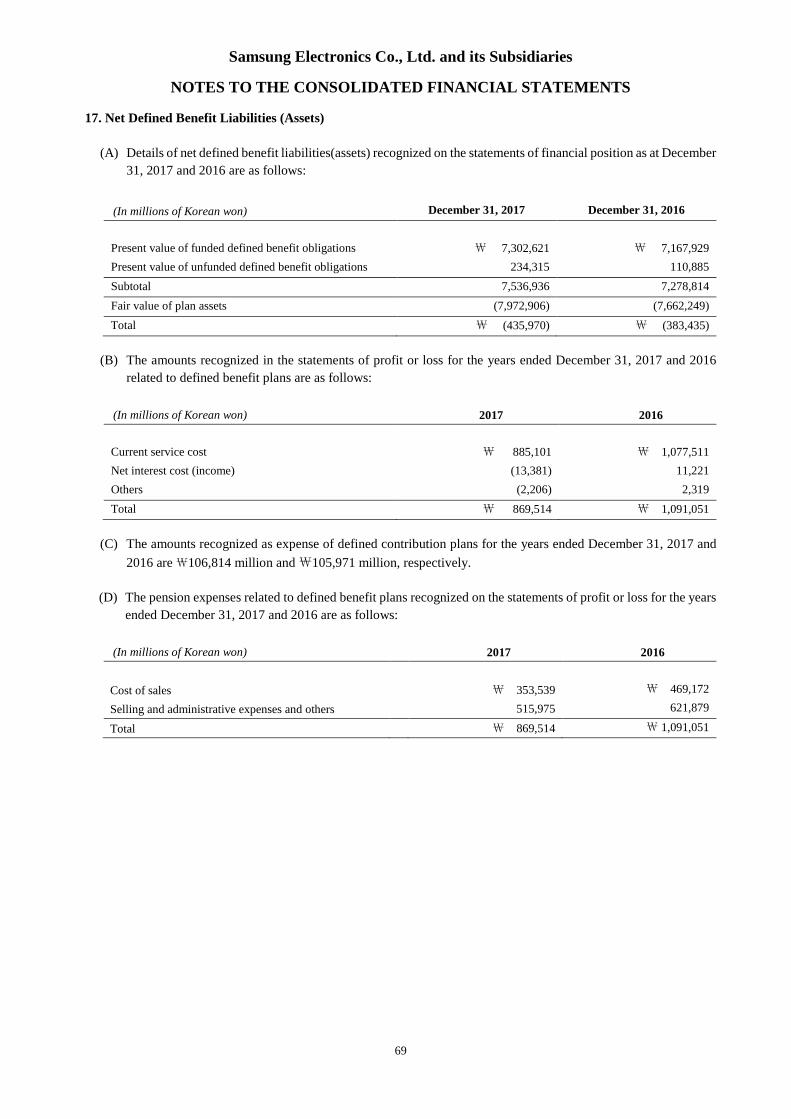
Samsung Electronics Co., Ltd. and its Subsidiaries
NOTES TO THE CONSOLIDATED FINANCIAL STATEMENTS
69
17. Net Defined Benefit Liabilities (Assets)
(A) Details of net defined benefit liabilities(assets) recognized on the statements of financial position as at December
31, 2017 and 2016 are as follows:
(In millions of Korean won) December 31, 2017 December 31, 2016
Present value of funded defined benefit obligations ₩ 7,302,621 ₩ 7,167,929
Present value of unfunded defined benefit obligations 234,315 110,885
Subtotal 7,536,936 7,278,814
Fair value of plan assets (7,972,906) (7,662,249)
Total ₩ (435,970) ₩ (383,435)
(B) The amounts recognized in the statements of profit or loss for the years ended December 31, 2017 and 2016
related to defined benefit plans are as follows:
(In millions of Korean won) 2017 2016
Current service cost ₩ 885,101 ₩ 1,077,511
Net interest cost (income) (13,381) 11,221
Others (2,206) 2,319
Total ₩ 869,514 ₩ 1,091,051
(C) The amounts recognized as expense of defined contribution plans for the years ended December 31, 2017 and
2016 are₩106,814 million and₩105,971 million, respectively.
(D) The pension expenses related to defined benefit plans recognized on the statements of profit or loss for the years
ended December 31, 2017 and 2016 are as follows:
(In millions of Korean won) 2017 2016
Cost of sales ₩ 353,539 ₩ 469,172
Selling and administrative expenses and others 515,975 621,879
Total ₩ 869,514 ₩ 1,091,051
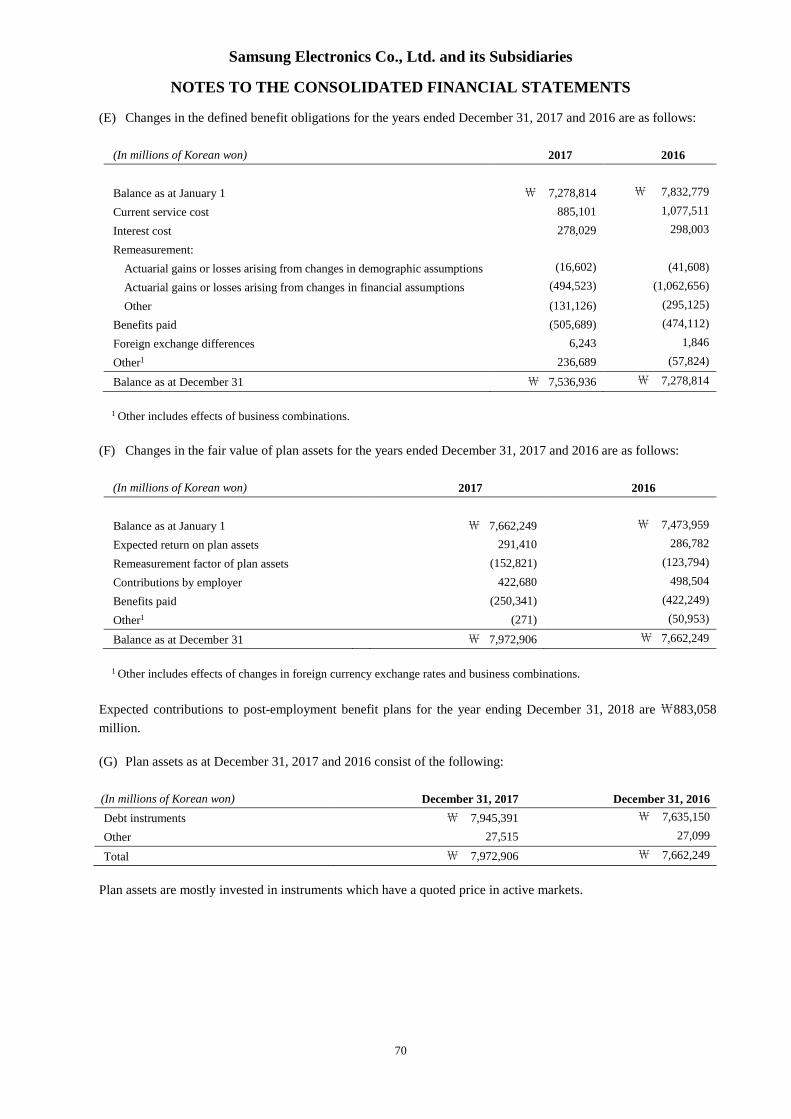
Samsung Electronics Co., Ltd. and its Subsidiaries
NOTES TO THE CONSOLIDATED FINANCIAL STATEMENTS
70
(E) Changes in the defined benefit obligations for the years ended December 31, 2017 and 2016 are as follows:
(In millions of Korean won) 2017 2016
Balance as at January 1 ₩ 7,278,814 ₩ 7,832,779
Current service cost 885,101 1,077,511
Interest cost 278,029 298,003
Remeasurement:
Actuarial gains or losses arising from changes in demographic assumptions (16,602) (41,608)
Actuarial gains or losses arising from changes in financial assumptions (494,523) (1,062,656)
Other (131,126) (295,125)
Benefits paid (505,689) (474,112)
Foreign exchange differences 6,243 1,846
Other1 236,689 (57,824)
Balance as at December 31 ₩ 7,536,936 ₩ 7,278,814
1 Other includes effects of business combinations.
(F) Changes in the fair value of plan assets for the years ended December 31, 2017 and 2016 are as follows:
(In millions of Korean won) 2017 2016
Balance as at January 1 ₩ 7,662,249 ₩ 7,473,959
Expected return on plan assets 291,410 286,782
Remeasurement factor of plan assets (152,821) (123,794)
Contributions by employer 422,680 498,504
Benefits paid (250,341) (422,249)
Other1 (271) (50,953)
Balance as at December 31 ₩ 7,972,906 ₩ 7,662,249
1 Other includes effects of changes in foreign currency exchange rates and business combinations.
Expected contributions to post-employment benefit plans for the year ending December 31, 2018 are ₩883,058
million.
(G) Plan assets as at December 31, 2017 and 2016 consist of the following:
(In millions of Korean won) December 31, 2017 December 31, 2016
Debt instruments ₩ 7,945,391 ₩ 7,635,150
Other 27,515 27,099
Total ₩ 7,972,906 ₩ 7,662,249
Plan assets are mostly invested in instruments which have a quoted price in active markets.
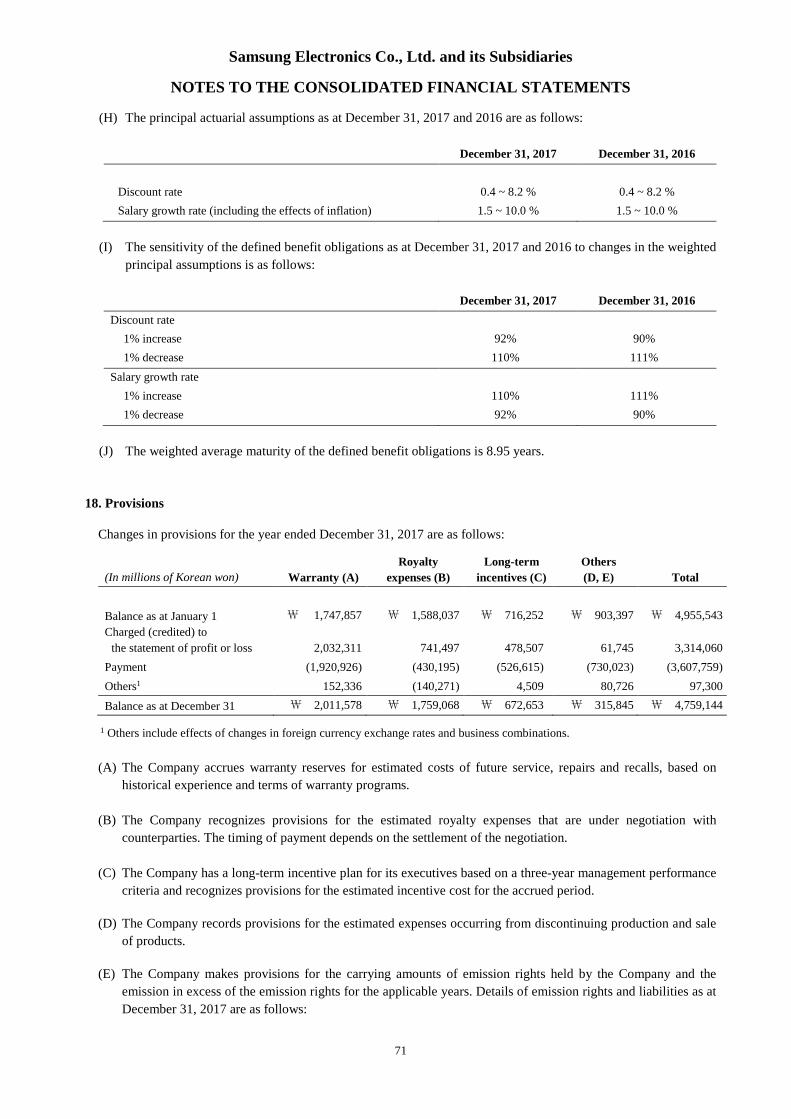
Samsung Electronics Co., Ltd. and its Subsidiaries
NOTES TO THE CONSOLIDATED FINANCIAL STATEMENTS
71
(H) The principal actuarial assumptions as at December 31, 2017 and 2016 are as follows:
December 31, 2017 December 31, 2016
Discount rate 0.4 ~ 8.2 % 0.4 ~ 8.2 %
Salary growth rate (including the effects of inflation) 1.5 ~ 10.0 % 1.5 ~ 10.0 %
(I) The sensitivity of the defined benefit obligations as at December 31, 2017 and 2016 to changes in the weighted
principal assumptions is as follows:
December 31, 2017 December 31, 2016
Discount rate
1% increase 92% 90%
1% decrease 110% 111%
Salary growth rate
1% increase 110% 111%
1% decrease 92% 90%
(J) The weighted average maturity of the defined benefit obligations is 8.95 years.
18. Provisions
Changes in provisions for the year ended December 31, 2017 are as follows:
(In millions of Korean won) Warranty (A)
Royalty
expenses (B)
Long-term
incentives (C)
Others
(D, E) Total
Balance as at January 1 ₩ 1,747,857 ₩ 1,588,037 ₩ 716,252 ₩ 903,397 ₩ 4,955,543
Charged (credited) to
the statement of profit or loss 2,032,311 741,497 478,507 61,745 3,314,060
Payment (1,920,926) (430,195) (526,615) (730,023) (3,607,759)
Others1 152,336 (140,271) 4,509 80,726 97,300
Balance as at December 31 ₩ 2,011,578 ₩ 1,759,068 ₩ 672,653 ₩ 315,845 ₩ 4,759,144
1 Others include effects of changes in foreign currency exchange rates and business combinations.
(A) The Company accrues warranty reserves for estimated costs of future service, repairs and recalls, based on
historical experience and terms of warranty programs.
(B) The Company recognizes provisions for the estimated royalty expenses that are under negotiation with
counterparties. The timing of payment depends on the settlement of the negotiation.
(C) The Company has a long-term incentive plan for its executives based on a three-year management performance
criteria and recognizes provisions for the estimated incentive cost for the accrued period.
(D) The Company records provisions for the estimated expenses occurring from discontinuing production and sale
of products.
(E) The Company makes provisions for the carrying amounts of emission rights held by the Company and the
emission in excess of the emission rights for the applicable years. Details of emission rights and liabilities as at
December 31, 2017 are as follows:
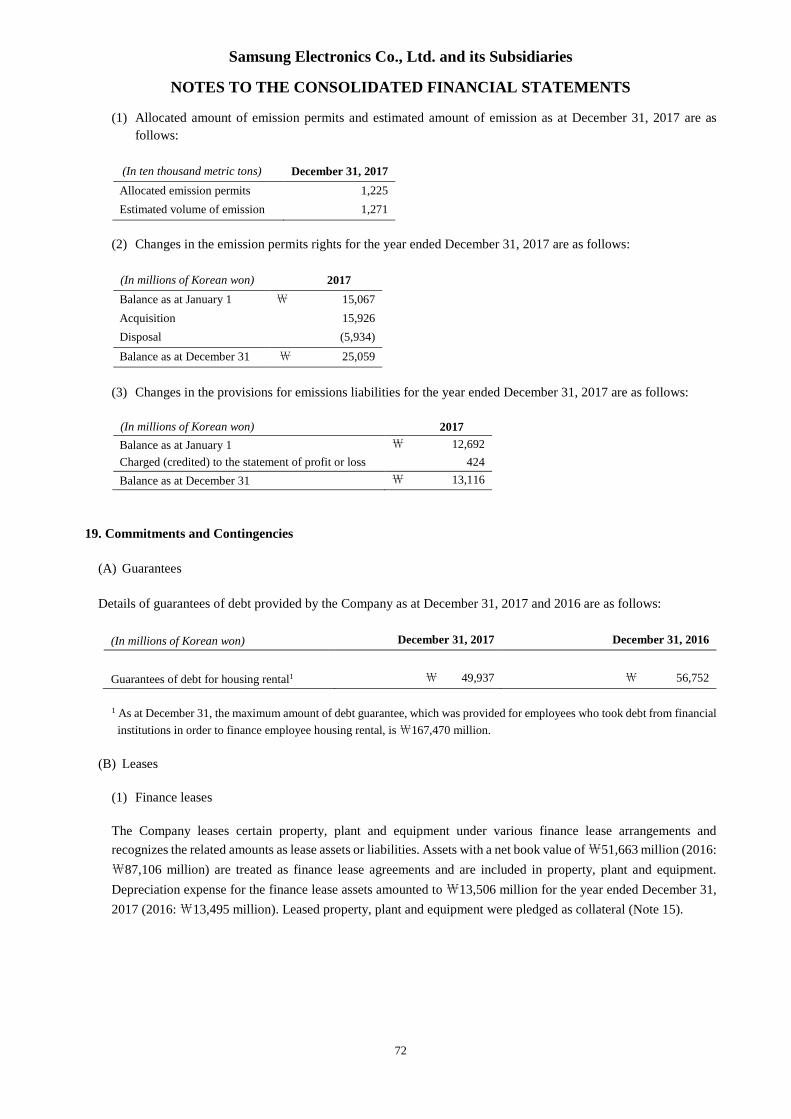
Samsung Electronics Co., Ltd. and its Subsidiaries
NOTES TO THE CONSOLIDATED FINANCIAL STATEMENTS
72
(1) Allocated amount of emission permits and estimated amount of emission as at December 31, 2017 are as
follows:
(In ten thousand metric tons) December 31, 2017
Allocated emission permits 1,225
Estimated volume of emission 1,271
(2) Changes in the emission permits rights for the year ended December 31, 2017 are as follows:
(In millions of Korean won) 2017
Balance as at January 1 ₩ 15,067
Acquisition 15,926
Disposal (5,934)
Balance as at December 31 ₩ 25,059
(3) Changes in the provisions for emissions liabilities for the year ended December 31, 2017 are as follows:
(In millions of Korean won) 2017
Balance as at January 1 ₩ 12,692
Charged (credited) to the statement of profit or loss 424
Balance as at December 31 ₩ 13,116
19. Commitments and Contingencies
(A) Guarantees
Details of guarantees of debt provided by the Company as at December 31, 2017 and 2016 are as follows:
(In millions of Korean won) December 31, 2017 December 31, 2016
Guarantees of debt for housing rental1 ₩ 49,937 ₩ 56,752
1 As at December 31, the maximum amount of debt guarantee, which was provided for employees who took debt from financial
institutions in order to finance employee housing rental, is₩167,470 million.
(B) Leases
(1) Finance leases
The Company leases certain property, plant and equipment under various finance lease arrangements and
recognizes the related amounts as lease assets or liabilities. Assets with a net book value of₩51,663 million (2016:
₩87,106 million) are treated as finance lease agreements and are included in property, plant and equipment.
Depreciation expense for the finance lease assets amounted to₩13,506 million for the year ended December 31,
2017 (2016:₩13,495 million). Leased property, plant and equipment were pledged as collateral (Note 15).
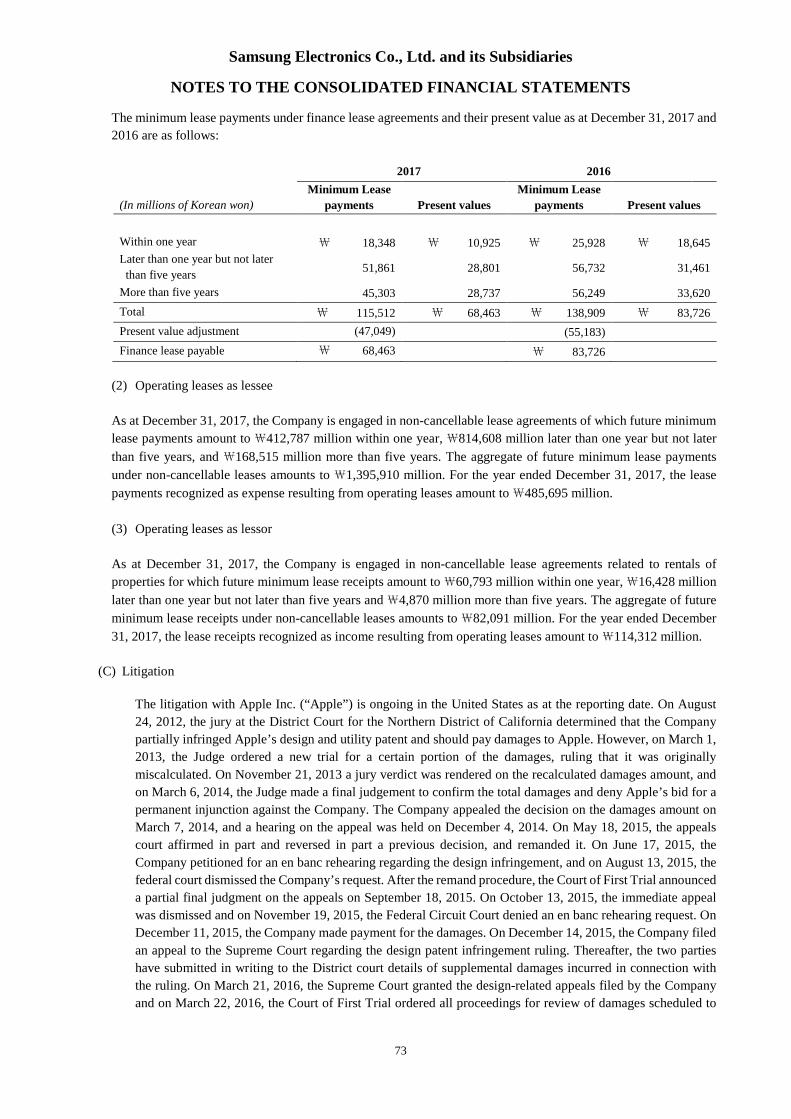
Samsung Electronics Co., Ltd. and its Subsidiaries
NOTES TO THE CONSOLIDATED FINANCIAL STATEMENTS
73
The minimum lease payments under finance lease agreements and their present value as at December 31, 2017 and
2016 are as follows:
(In millions of Korean won)
2017 2016
Minimum Lease
payments Present values
Minimum Lease
payments Present values
Within one year ₩ 18,348 ₩ 10,925 ₩ 25,928 ₩ 18,645
Later than one year but not later
than five years51,861 28,801 56,732 31,461
More than five years 45,303 28,737 56,249 33,620
Total ₩ 115,512 ₩ 68,463 ₩ 138,909 ₩ 83,726
Present value adjustment (47,049) (55,183)
Finance lease payable ₩ 68,463 ₩ 83,726
(2) Operating leases as lessee
As at December 31, 2017, the Company is engaged in non-cancellable lease agreements of which future minimum
lease payments amount to ₩412,787 million within one year, ₩814,608 million later than one year but not later
than five years, and ₩168,515 million more than five years. The aggregate of future minimum lease payments
under non-cancellable leases amounts to ₩1,395,910 million. For the year ended December 31, 2017, the lease
payments recognized as expense resulting from operating leases amount to₩485,695 million.
(3) Operating leases as lessor
As at December 31, 2017, the Company is engaged in non-cancellable lease agreements related to rentals of
properties for which future minimum lease receipts amount to₩60,793 million within one year,₩16,428 million
later than one year but not later than five years and ₩4,870 million more than five years. The aggregate of future
minimum lease receipts under non-cancellable leases amounts to ₩82,091 million. For the year ended December
31, 2017, the lease receipts recognized as income resulting from operating leases amount to₩114,312 million.
(C) Litigation
The litigation with Apple Inc. (“Apple”) is ongoing in the United States as at the reporting date. On August
24, 2012, the jury at the District Court for the Northern District of California determined that the Company
partially infringed Apple’s design and utility patent and should pay damages to Apple. However, on March 1,
2013, the Judge ordered a new trial for a certain portion of the damages, ruling that it was originally
miscalculated. On November 21, 2013 a jury verdict was rendered on the recalculated damages amount, and
on March 6, 2014, the Judge made a final judgement to confirm the total damages and deny Apple’s bid for a
permanent injunction against the Company. The Company appealed the decision on the damages amount on
March 7, 2014, and a hearing on the appeal was held on December 4, 2014. On May 18, 2015, the appeals
court affirmed in part and reversed in part a previous decision, and remanded it. On June 17, 2015, the
Company petitioned for an en banc rehearing regarding the design infringement, and on August 13, 2015, the
federal court dismissed the Company’s request. After the remand procedure, the Court of First Trial announced
a partial final judgment on the appeals on September 18, 2015. On October 13, 2015, the immediate appeal
was dismissed and on November 19, 2015, the Federal Circuit Court denied an en banc rehearing request. On
December 11, 2015, the Company made payment for the damages. On December 14, 2015, the Company filed
an appeal to the Supreme Court regarding the design patent infringement ruling. Thereafter, the two parties
have submitted in writing to the District court details of supplemental damages incurred in connection with
the ruling. On March 21, 2016, the Supreme Court granted the design-related appeals filed by the Company
and on March 22, 2016, the Court of First Trial ordered all proceedings for review of damages scheduled to
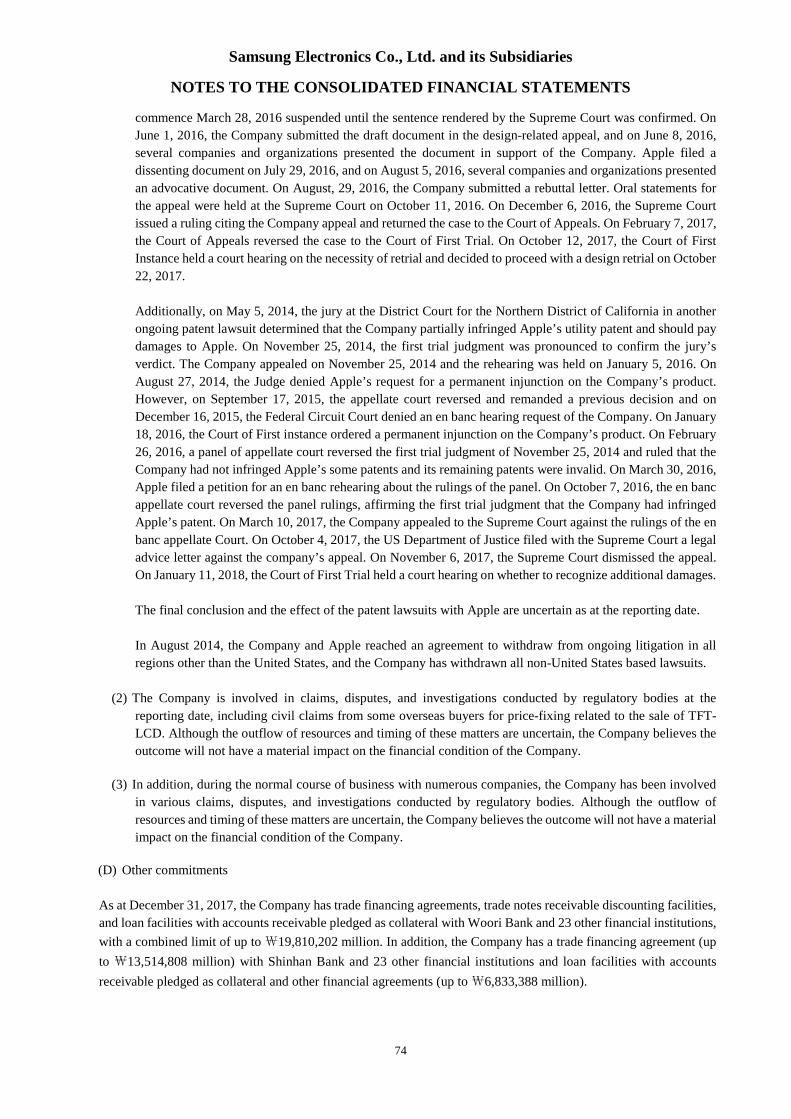
Samsung Electronics Co., Ltd. and its Subsidiaries
NOTES TO THE CONSOLIDATED FINANCIAL STATEMENTS
74
commence March 28, 2016 suspended until the sentence rendered by the Supreme Court was confirmed. On
June 1, 2016, the Company submitted the draft document in the design-related appeal, and on June 8, 2016,
several companies and organizations presented the document in support of the Company. Apple filed a
dissenting document on July 29, 2016, and on August 5, 2016, several companies and organizations presented
an advocative document. On August, 29, 2016, the Company submitted a rebuttal letter. Oral statements for
the appeal were held at the Supreme Court on October 11, 2016. On December 6, 2016, the Supreme Court
issued a ruling citing the Company appeal and returned the case to the Court of Appeals. On February 7, 2017,
the Court of Appeals reversed the case to the Court of First Trial. On October 12, 2017, the Court of First
Instance held a court hearing on the necessity of retrial and decided to proceed with a design retrial on October
22, 2017.
Additionally, on May 5, 2014, the jury at the District Court for the Northern District of California in another
ongoing patent lawsuit determined that the Company partially infringed Apple’s utility patent and should pay
damages to Apple. On November 25, 2014, the first trial judgment was pronounced to confirm the jury’s
verdict. The Company appealed on November 25, 2014 and the rehearing was held on January 5, 2016. On
August 27, 2014, the Judge denied Apple’s request for a permanent injunction on the Company’s product.
However, on September 17, 2015, the appellate court reversed and remanded a previous decision and on
December 16, 2015, the Federal Circuit Court denied an en banc hearing request of the Company. On January
18, 2016, the Court of First instance ordered a permanent injunction on the Company’s product. On February
26, 2016, a panel of appellate court reversed the first trial judgment of November 25, 2014 and ruled that the
Company had not infringed Apple’s some patents and its remaining patents were invalid. On March 30, 2016,
Apple filed a petition for an en banc rehearing about the rulings of the panel. On October 7, 2016, the en banc
appellate court reversed the panel rulings, affirming the first trial judgment that the Company had infringed
Apple’s patent. On March 10, 2017, the Company appealed to the Supreme Court against the rulings of the en
banc appellate Court. On October 4, 2017, the US Department of Justice filed with the Supreme Court a legal
advice letter against the company’s appeal. On November 6, 2017, the Supreme Court dismissed the appeal.
On January 11, 2018, the Court of First Trial held a court hearing on whether to recognize additional damages.
The final conclusion and the effect of the patent lawsuits with Apple are uncertain as at the reporting date.
In August 2014, the Company and Apple reached an agreement to withdraw from ongoing litigation in all
regions other than the United States, and the Company has withdrawn all non-United States based lawsuits.
(2) The Company is involved in claims, disputes, and investigations conducted by regulatory bodies at the
reporting date, including civil claims from some overseas buyers for price-fixing related to the sale of TFT-
LCD. Although the outflow of resources and timing of these matters are uncertain, the Company believes the
outcome will not have a material impact on the financial condition of the Company.
(3) In addition, during the normal course of business with numerous companies, the Company has been involved
in various claims, disputes, and investigations conducted by regulatory bodies. Although the outflow of
resources and timing of these matters are uncertain, the Company believes the outcome will not have a material
impact on the financial condition of the Company.
(D) Other commitments
As at December 31, 2017, the Company has trade financing agreements, trade notes receivable discounting facilities,
and loan facilities with accounts receivable pledged as collateral with Woori Bank and 23 other financial institutions,
with a combined limit of up to₩19,810,202 million. In addition, the Company has a trade financing agreement (up
to ₩13,514,808 million) with Shinhan Bank and 23 other financial institutions and loan facilities with accounts
receivable pledged as collateral and other financial agreements (up to₩6,833,388 million).
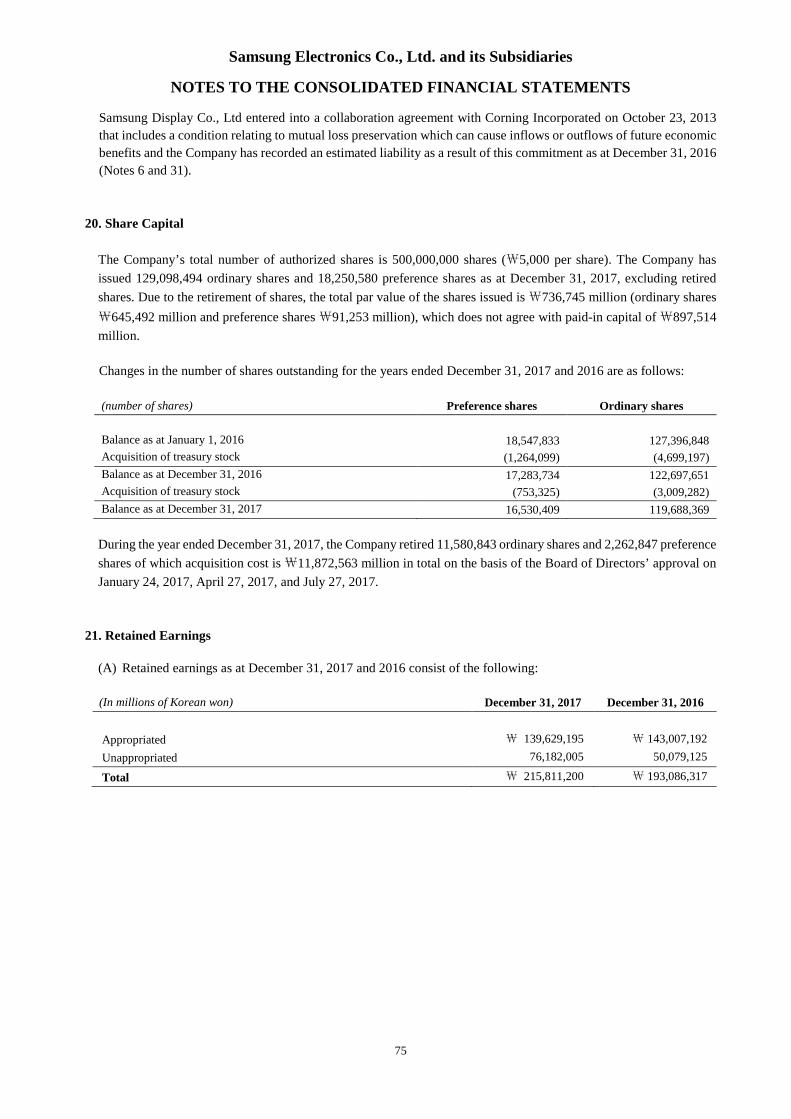
Samsung Electronics Co., Ltd. and its Subsidiaries
NOTES TO THE CONSOLIDATED FINANCIAL STATEMENTS
75
Samsung Display Co., Ltd entered into a collaboration agreement with Corning Incorporated on October 23, 2013
that includes a condition relating to mutual loss preservation which can cause inflows or outflows of future economic
benefits and the Company has recorded an estimated liability as a result of this commitment as at December 31, 2016
(Notes 6 and 31).
20. Share Capital
The Company’s total number of authorized shares is 500,000,000 shares (₩5,000 per share). The Company has
issued 129,098,494 ordinary shares and 18,250,580 preference shares as at December 31, 2017, excluding retired
shares. Due to the retirement of shares, the total par value of the shares issued is₩736,745 million (ordinary shares
₩645,492 million and preference shares₩91,253 million), which does not agree with paid-in capital of₩897,514
million.
Changes in the number of shares outstanding for the years ended December 31, 2017 and 2016 are as follows:
(number of shares) Preference shares Ordinary shares
Balance as at January 1, 2016 18,547,833 127,396,848
Acquisition of treasury stock (1,264,099) (4,699,197)
Balance as at December 31, 2016 17,283,734 122,697,651
Acquisition of treasury stock (753,325) (3,009,282)
Balance as at December 31, 2017 16,530,409 119,688,369
During the year ended December 31, 2017, the Company retired 11,580,843 ordinary shares and 2,262,847 preference
shares of which acquisition cost is₩11,872,563 million in total on the basis of the Board of Directors’ approval on
January 24, 2017, April 27, 2017, and July 27, 2017.
21. Retained Earnings
(A) Retained earnings as at December 31, 2017 and 2016 consist of the following:
(In millions of Korean won) December 31, 2017 December 31, 2016
Appropriated ₩ 139,629,195 ₩ 143,007,192
Unappropriated 76,182,005 50,079,125
Total ₩ 215,811,200 ₩ 193,086,317
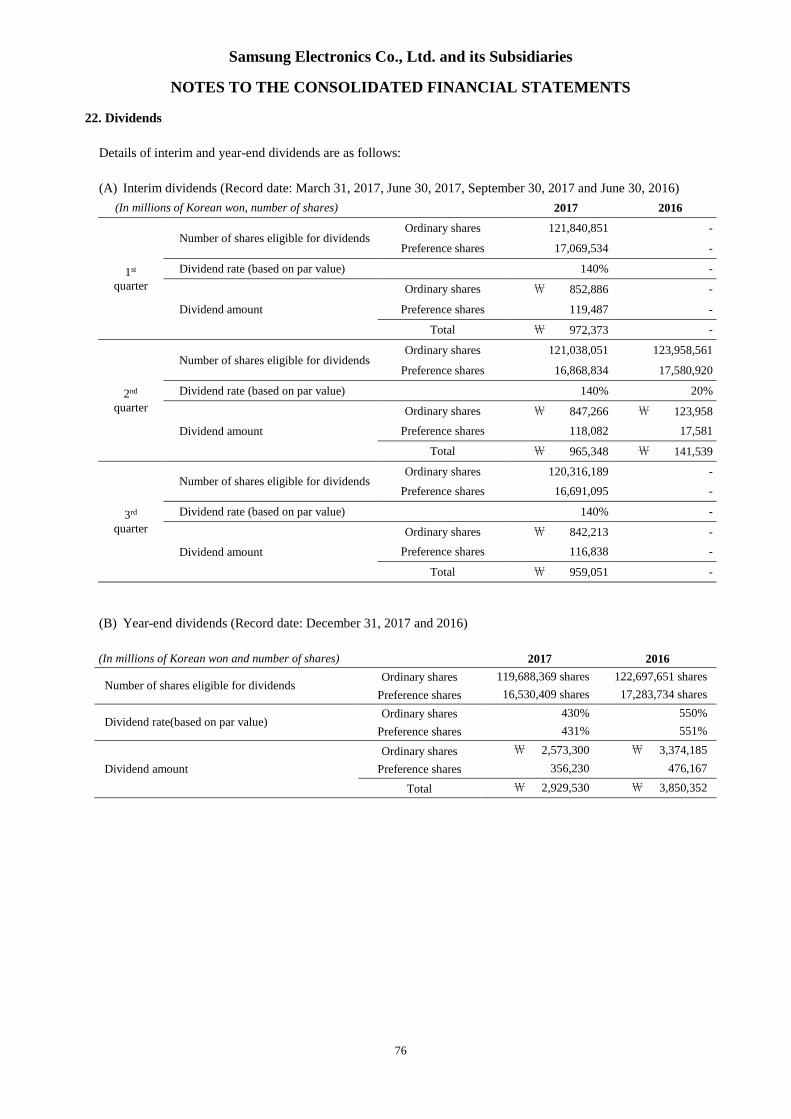
Samsung Electronics Co., Ltd. and its Subsidiaries
NOTES TO THE CONSOLIDATED FINANCIAL STATEMENTS
76
22. Dividends
Details of interim and year-end dividends are as follows:
(A) Interim dividends (Record date: March 31, 2017, June 30, 2017, September 30, 2017 and June 30, 2016)
(In millions of Korean won, number of shares) 2017 2016
1st
quarter
Number of shares eligible for dividendsOrdinary shares 121,840,851 -
Preference shares 17,069,534 -
Dividend rate (based on par value) 140% -
Dividend amount
Ordinary shares ₩ 852,886 -
Preference shares 119,487 -
Total ₩ 972,373 -
2nd
quarter
Number of shares eligible for dividendsOrdinary shares 121,038,051 123,958,561
Preference shares 16,868,834 17,580,920
Dividend rate (based on par value) 140% 20%
Dividend amount
Ordinary shares ₩ 847,266 ₩ 123,958
Preference shares 118,082 17,581
Total ₩ 965,348 ₩ 141,539
3rd
quarter
Number of shares eligible for dividendsOrdinary shares 120,316,189 -
Preference shares 16,691,095 -
Dividend rate (based on par value) 140% -
Dividend amount
Ordinary shares ₩ 842,213 -
Preference shares 116,838 -
Total ₩ 959,051 -
(B) Year-end dividends (Record date: December 31, 2017 and 2016)
(In millions of Korean won and number of shares) 2017 2016
Number of shares eligible for dividendsOrdinary shares 119,688,369 shares 122,697,651 shares
Preference shares 16,530,409 shares 17,283,734 shares
Dividend rate(based on par value)Ordinary shares 430% 550%
Preference shares 431% 551%
Dividend amount
Ordinary shares ₩ 2,573,300 ₩ 3,374,185
Preference shares 356,230 476,167
Total ₩ 2,929,530 ₩ 3,850,352
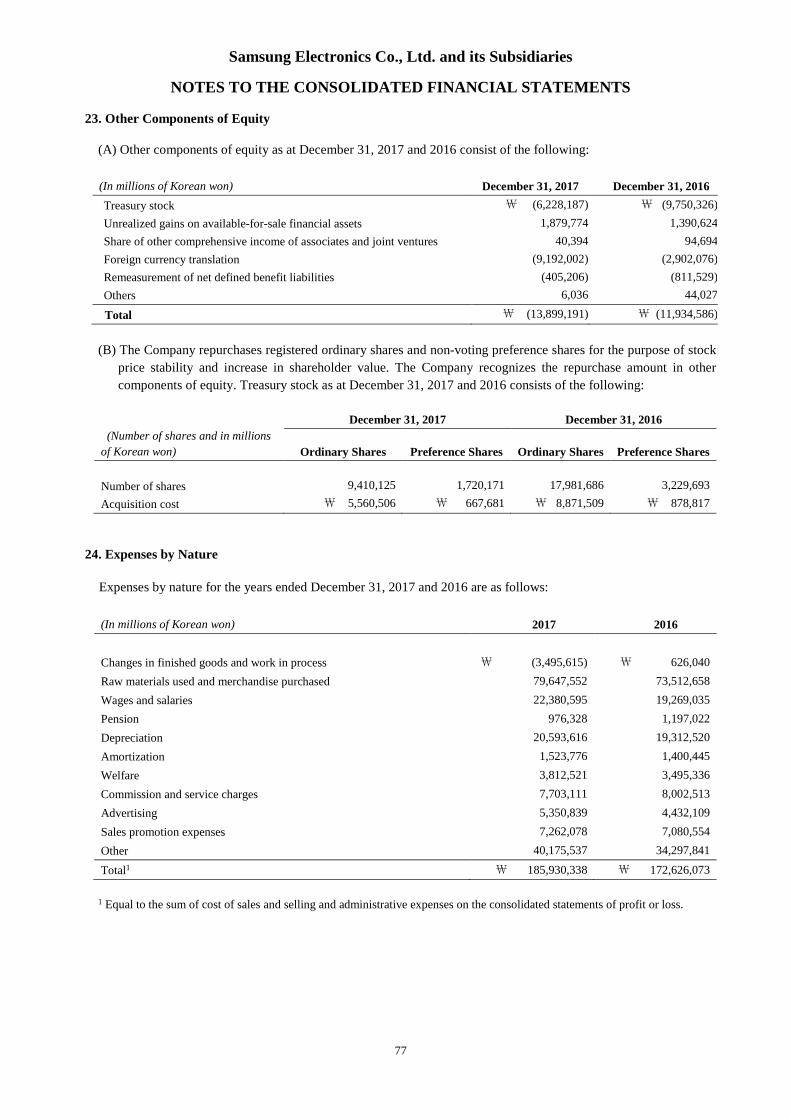
Samsung Electronics Co., Ltd. and its Subsidiaries
NOTES TO THE CONSOLIDATED FINANCIAL STATEMENTS
77
23. Other Components of Equity
(A) Other components of equity as at December 31, 2017 and 2016 consist of the following:
(In millions of Korean won) December 31, 2017 December 31, 2016
Treasury stock ₩ (6,228,187) ₩ (9,750,326)
Unrealized gains on available-for-sale financial assets 1,879,774 1,390,624
Share of other comprehensive income of associates and joint ventures 40,394 94,694
Foreign currency translation (9,192,002) (2,902,076)
Remeasurement of net defined benefit liabilities (405,206) (811,529)
Others 6,036 44,027
Total ₩ (13,899,191) ₩ (11,934,586)
(B) The Company repurchases registered ordinary shares and non-voting preference shares for the purpose of stock
price stability and increase in shareholder value. The Company recognizes the repurchase amount in other
components of equity. Treasury stock as at December 31, 2017 and 2016 consists of the following:
December 31, 2017 December 31, 2016
(Number of shares and in millions
of Korean won) Ordinary Shares Preference Shares Ordinary Shares Preference Shares
Number of shares 9,410,125 1,720,171 17,981,686 3,229,693
Acquisition cost ₩ 5,560,506 ₩ 667,681 ₩ 8,871,509 ₩ 878,817
24. Expenses by Nature
Expenses by nature for the years ended December 31, 2017 and 2016 are as follows:
(In millions of Korean won) 2017 2016
Changes in finished goods and work in process ₩ (3,495,615) ₩ 626,040
Raw materials used and merchandise purchased 79,647,552 73,512,658
Wages and salaries 22,380,595 19,269,035
Pension 976,328 1,197,022
Depreciation 20,593,616 19,312,520
Amortization 1,523,776 1,400,445
Welfare 3,812,521 3,495,336
Commission and service charges 7,703,111 8,002,513
Advertising 5,350,839 4,432,109
Sales promotion expenses 7,262,078 7,080,554
Other 40,175,537 34,297,841
Total1 ₩ 185,930,338 ₩ 172,626,073
1 Equal to the sum of cost of sales and selling and administrative expenses on the consolidated statements of profit or loss.
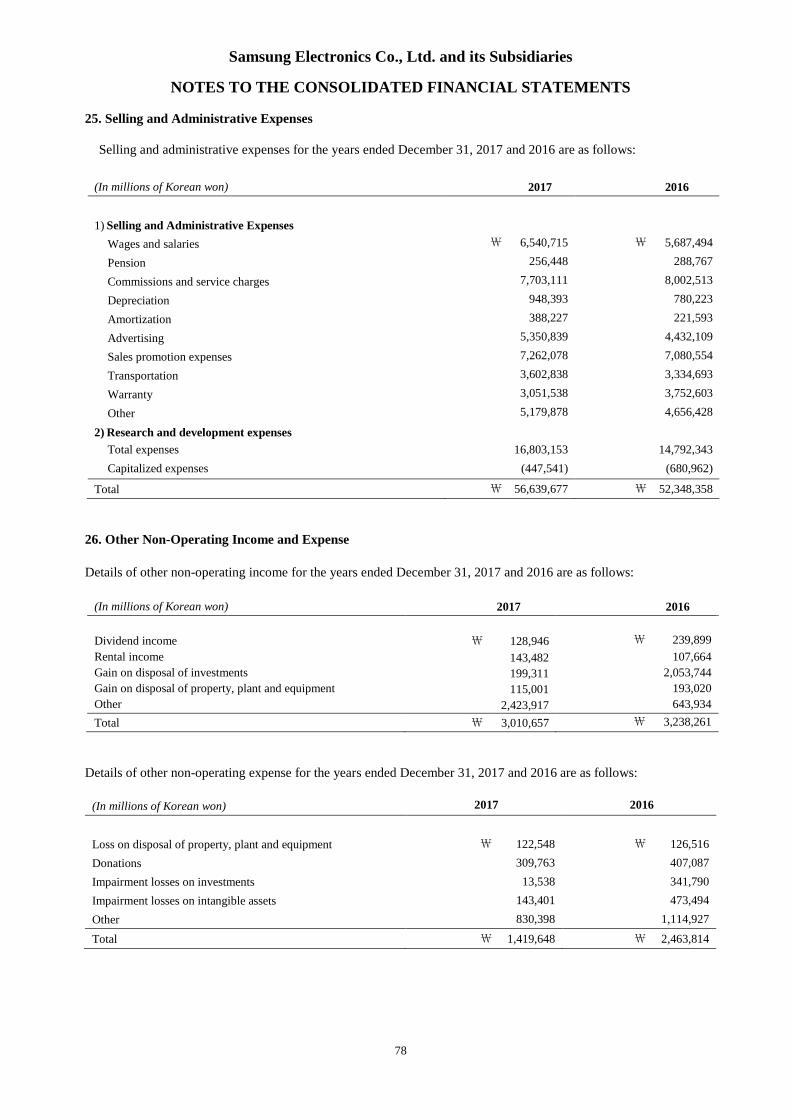
Samsung Electronics Co., Ltd. and its Subsidiaries
NOTES TO THE CONSOLIDATED FINANCIAL STATEMENTS
78
25. Selling and Administrative Expenses
Selling and administrative expenses for the years ended December 31, 2017 and 2016 are as follows:
(In millions of Korean won) 2017 2016
1) Selling and Administrative Expenses
Wages and salaries ₩ 6,540,715 ₩ 5,687,494
Pension 256,448 288,767
Commissions and service charges 7,703,111 8,002,513
Depreciation 948,393 780,223
Amortization 388,227 221,593
Advertising 5,350,839 4,432,109
Sales promotion expenses 7,262,078 7,080,554
Transportation 3,602,838 3,334,693
Warranty 3,051,538 3,752,603
Other 5,179,878 4,656,428
2) Research and development expenses
Total expenses 16,803,153 14,792,343
Capitalized expenses (447,541) (680,962)
Total ₩ 56,639,677 ₩ 52,348,358
26. Other Non-Operating Income and Expense
Details of other non-operating income for the years ended December 31, 2017 and 2016 are as follows:
(In millions of Korean won) 2017 2016
Dividend income ₩ 128,946 ₩ 239,899
Rental income 143,482 107,664
Gain on disposal of investments 199,311 2,053,744
Gain on disposal of property, plant and equipment 115,001 193,020
Other 2,423,917 643,934
Total ₩ 3,010,657 ₩ 3,238,261
Details of other non-operating expense for the years ended December 31, 2017 and 2016 are as follows:
(In millions of Korean won) 2017 2016
Loss on disposal of property, plant and equipment ₩ 122,548 ₩ 126,516
Donations 309,763 407,087
Impairment losses on investments 13,538 341,790
Impairment losses on intangible assets 143,401 473,494
Other 830,398 1,114,927
Total ₩ 1,419,648 ₩ 2,463,814
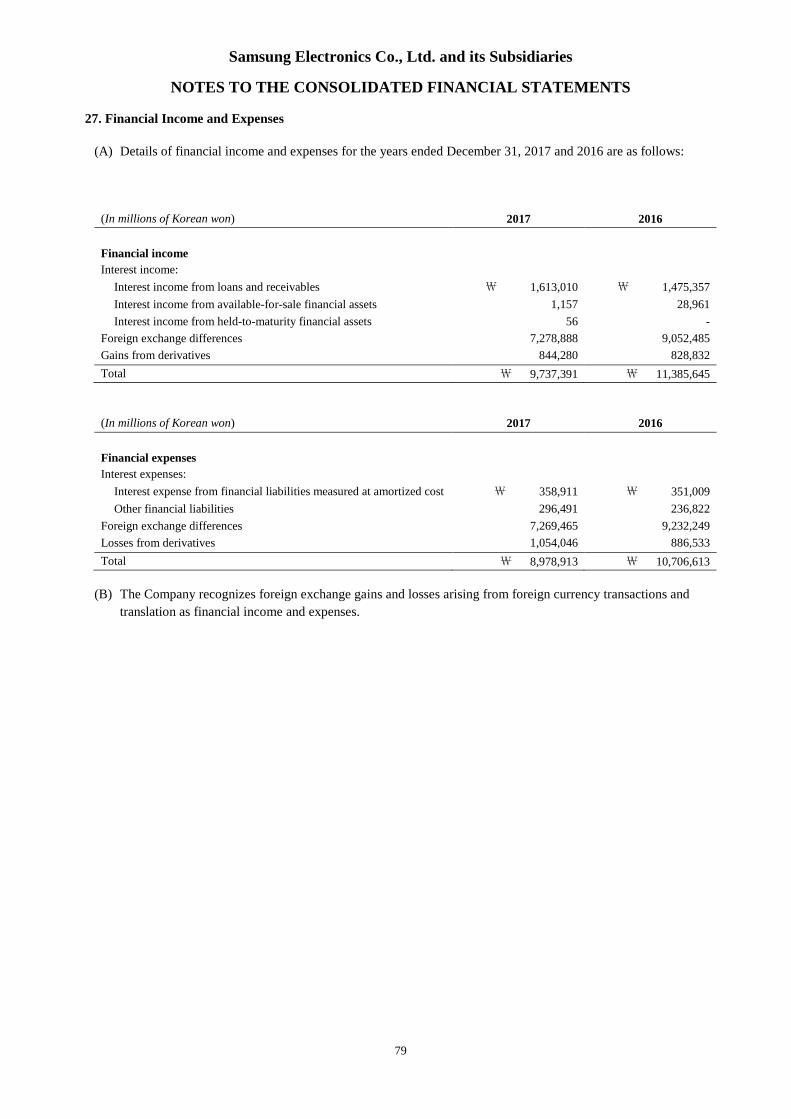
Samsung Electronics Co., Ltd. and its Subsidiaries
NOTES TO THE CONSOLIDATED FINANCIAL STATEMENTS
79
27. Financial Income and Expenses
(A) Details of financial income and expenses for the years ended December 31, 2017 and 2016 are as follows:
(In millions of Korean won) 2017 2016
Financial income
Interest income:
Interest income from loans and receivables ₩ 1,613,010 ₩ 1,475,357
Interest income from available-for-sale financial assets 1,157 28,961
Interest income from held-to-maturity financial assets 56 -
Foreign exchange differences 7,278,888 9,052,485
Gains from derivatives 844,280 828,832
Total ₩ 9,737,391 ₩ 11,385,645
(In millions of Korean won) 2017 2016
Financial expenses
Interest expenses:
Interest expense from financial liabilities measured at amortized cost ₩ 358,911 ₩ 351,009
Other financial liabilities 296,491 236,822
Foreign exchange differences 7,269,465 9,232,249
Losses from derivatives 1,054,046 886,533
Total ₩ 8,978,913 ₩ 10,706,613
(B) The Company recognizes foreign exchange gains and losses arising from foreign currency transactions and
translation as financial income and expenses.
Samsung Electronics Co., Ltd. and its Subsidiaries
NOTES TO THE CONSOLIDATED FINANCIAL STATEMENTS
80
28. Income Tax Expense
(A) Income tax expense for the years ended December 31, 2017 and 2016, consists of the following:
(In millions of Korean won) 2017 2016
Current taxes:
Current tax on profits for the year ₩ 10,642,009 ₩ 6,161,609
Adjustments in respect to prior years 301,924 (244,791)
Deferred taxes:
Changes in carryforward of unused tax credits (50,413) (166,206)
Changes in temporary differences 3,417,698 1,869,700
Changes in carryforward of unused tax losses (309,604) 397,329
Other 7,606 (30,081)
Items charged directly to equity - -
Income tax expense ₩ 14,009,220 ₩ 7,987,560
(B) The tax on the Company’s profit before tax differs from the amount that would arise using the weighted average
statutory tax rate applicable to profits of the Company as follows:
(In millions of Korean won) 2017 2016
Income before tax ₩ 56,195,967 ₩ 30,713,652
Tax calculated at weighted average of applicable tax rates1 14,425,196 7,009,003
Tax effects of:
Permanent differences (239,050) (687,901)
Temporary differences for which no deferred income tax was recognized (24,156) (12,825)
Tax credits (3,194,533) (608,218)
Results of interest in subsidiaries, associates and joint ventures 3,281,740 2,288,893
Impact of changes in tax rates (532,165) 1,280
Other 292,188 (2,672)
Income tax expense ₩ 14,009,220 ₩ 7,987,560
1 The weighted average of statutory tax rates are applied to the respective profits of the Company applicable to each tax
authority as at December 31, 2017 and 2016.
Samsung Electronics Co., Ltd. and its Subsidiaries
NOTES TO THE CONSOLIDATED FINANCIAL STATEMENTS
81
(C) Changes in deferred income tax assets and liabilities resulting from the tax effect of temporary differences for
the years ended December 31, 2017 and 2016 are as follows:
(1) 2017
Temporary Differences Deferred Income Tax Assets (Liabilities)
(In millions of Korean won)
Balance as at
January 1
Increase
(Decrease)
Balance as at
December 31
Balance as at
January 1
Increase
(Decrease)
Balance as at
December 31
Deferred tax arising from temporary differences
Special reserves appropriated for taxpurposes
₩ (368) ₩ - ₩ (368) ₩ (89) ₩ (12) ₩ (101)
Revaluation of land (3,444,254) 19,021 (3,425,233) (833,510) (108,429) (941,939)
Investments in subsidiaries, associatesand joint ventures1 (59,270,306) (12,634,105) (71,904,411) (7,536,737) (3,621,634) (11,158,371)
Depreciation 2,908,546 (6,462,748) (3,554,202) 644,126 (1,419,254) (775,128)
Accrued income (258,310) 66,156 (192,154) (78,971) 32,186 (46,785)
Provisions and accrued expenses 13,458,781 (746,637) 12,712,144 3,232,788 168,637 3,401,425
Foreign currency translation 165,558 (401,645) (236,087) 44,607 (107,490) (62,883)
Asset impairment losses 1,227,353 537,407 1,764,760 301,206 185,953 487,159
Other 1,479,671 2,077,446 3,557,117 650,132 115,501 765,633
Subtotal (43,733,329) (17,545,105) (61,278,434) (3,576,448) (4,754,542) (8,330,990)
Deferred tax arising from carryforwards
Unused tax losses ₩ 4,691,360 ₩ 582,852 ₩ 5,274,212 ₩ 1,098,647 ₩ 309,604 ₩ 1,408,251
Unused tax credits 873,455 27,182 900,637 721,247 50,413 771,660
Deferred tax recognized in other comprehensive income
Valuation of available-for-sale financial
instruments₩ (1,969,833) ₩ (718,531) ₩ (2,688,364) ₩ (446,756) ₩ (207,322) ₩ (654,078)
Actuarial valuation 1,023,559 (489,430) 534,129 231,246 (75,183) 156,063
Subtotal ₩ (946,274) ₩ (1,207,961) ₩ (2,154,235) ₩ (215,510) ₩ (282,505) ₩ (498,015)
Deferred tax assets ₩ 5,061,687
Deferred tax liabilities (11,710,781)
Total ₩(6,649,094)
1 Deferred tax assets were not recognized if it is probable that the temporary differences will not reverse in the foreseeable future
for investments in subsidiaries, associates and joint ventures.
Samsung Electronics Co., Ltd. and its Subsidiaries
NOTES TO THE CONSOLIDATED FINANCIAL STATEMENTS
82
(2) 2016Temporary Differences Deferred Income Tax Assets (Liabilities)
(In millions of Korean won)
Balance as at
January 1
Increase
(Decrease)
Balance as at
December 31
Balance as at
January 1
Increase
(Decrease)
Balance as at
December 31
Deferred tax arising from temporary differences
Special reserves appropriated for taxpurposes
₩ (7,368) ₩ 7,000 ₩ (368) ₩ (1,783) ₩ 1,694 ₩ (89)
Revaluation of land (3,455,958) 11,704 (3,444,254) (836,342) 2,832 (833,510)
Investments in subsidiaries, associatesand joint ventures1 (41,729,872) (17,540,434) (59,270,306) (5,173,897) (2,362,840) (7,536,737)
Depreciation 2,627,073 281,473 2,908,546 651,988 (7,862) 644,126
Accrued income (309,545) 51,235 (258,310) (71,086) (7,885) (78,971)
Provisions and accrued expenses 13,322,516 136,265 13,458,781 3,519,564 (286,776) 3,232,788
Foreign currency translation 221,793 (56,235) 165,558 58,567 (13,960) 44,607
Asset impairment losses 652,768 574,585 1,227,353 160,975 140,231 301,206
Other (193,612) 1,673,283 1,479,671 (14,734) 664,866 650,132
Subtotal (28,872,205) (14,861,124) (43,733,329) (1,706,748) (1,869,700) (3,576,448)
Deferred tax arising from carryforwards
Unused tax losses ₩ 6,178,327 ₩(1,486,967) ₩ 4,691,360 ₩ 1,495,976 ₩ (397,329) ₩ 1,098,647
Unused tax credits 631,362 242,093 873,455 555,041 166,206 721,247
Deferred tax recognized in other comprehensive income
Valuation of available-for-salefinancial instruments
₩(1,976,829) ₩ 6,996 ₩(1,969,833) ₩ (453,192) ₩ 6,436 ₩ (446,756)
Actuarial valuation 2,299,154 (1,275,595) 1,023,559 543,239 (311,993) 231,246
Subtotal 322,325 (1,268,599) (946,274) 90,047 (305,557) (215,510)
Deferred tax assets ₩ 5,321,450
Deferred tax liabilities (7,293,514)
Total ₩ (1,972,064)
1 Deferred tax assets were not recognized if it is probable that the temporary differences will not reverse in the foreseeable future
for investments in subsidiaries, associates and joint ventures.
The Company periodically assesses its ability to recover deferred tax assets. In the event of a significant uncertainty
regarding the Company’s ultimate ability to recover such assets, deferred tax assets are recognized only to the extent
that it is probable that future taxable profit will be available against which the temporary differences can be utilized.
Temporary differences whose deferred tax effects were not recognized due to uncertainty regarding the ultimate
realizability of such assets as at December 31, 2017 and 2016, are as follows:
(In millions of Korean won) 2017 2016
Unused tax losses1 ₩ 364,236 ₩ 58,969
Unused tax credits1 69,800 31,205
1 Expiry dates of unused tax losses and unused tax credits for which no deferred tax asset is recognized in the balance sheet are as
follows:
Samsung Electronics Co., Ltd. and its Subsidiaries
NOTES TO THE CONSOLIDATED FINANCIAL STATEMENTS
83
(In millions of Korean won) 2018 2019 2020 2021 and after
Undisposed accumulated deficit ₩ 233 ₩ 85 ₩ 85 ₩ 363,833
Tax credit carryforwards 13,019 10,656 20,784 25,341
(D) The liquidity analysis of deferred tax assets and deferred tax liabilities for the years ended December 31, 2017and 2016 is as follows:
(In millions of Korean won) 2017 2016
Deferred tax assets
Deferred tax assets to be recovered within 12 months ₩ 2,279,651 ₩ 3,066,577
Deferred tax assets to be recovered after more than 12 months 2,782,036 2,254,873
Subtotal 5,061,687 5,321,450
Deferred tax liabilities
Deferred tax liabilities to be recovered after more than 12 months (11,710,781) (7,293,514)
Subtotal (11,710,781) (7,293,514)
Total ₩ (6,649,094) ₩ (1,972,064)
29. Earnings per Share
(A) Basic earnings per share
Basic earnings per share for the years ended December 31, 2017 and 2016 are calculated as follows:
(1) Ordinary shares
(In millions of Korean won, thousands of number of shares) 2017 2016
Profit or loss attributable to owners of the Parent company ₩ 41,344,569 ₩ 22,415,655
Profit or loss available for ordinary shares 36,323,723 19,647,199
Weighted-average number of ordinary shares outstanding 121,132 124,375
Basic earnings per share(Korean won) ₩ 299,868 ₩ 157,967
(2) Preference shares
(In millions of Korean won, thousands of number of shares) 2017 2016
Profit or loss attributable to owners of the Parent company ₩ 41,344,569 ₩ 22,415,655
Profit or loss available for preference shares 5,020,846 2,768,456
Weighted-average number of preference shares outstanding 16,893 17,692
Basic earnings per preference share(Korean won) ₩ 297,217 ₩ 156,480
(B) Diluted earnings per share
The Company does not have potential ordinary shares and as a result, basic earnings per share and diluted earnings
per share are the same for the years ended December 31, 2017 and 2016.
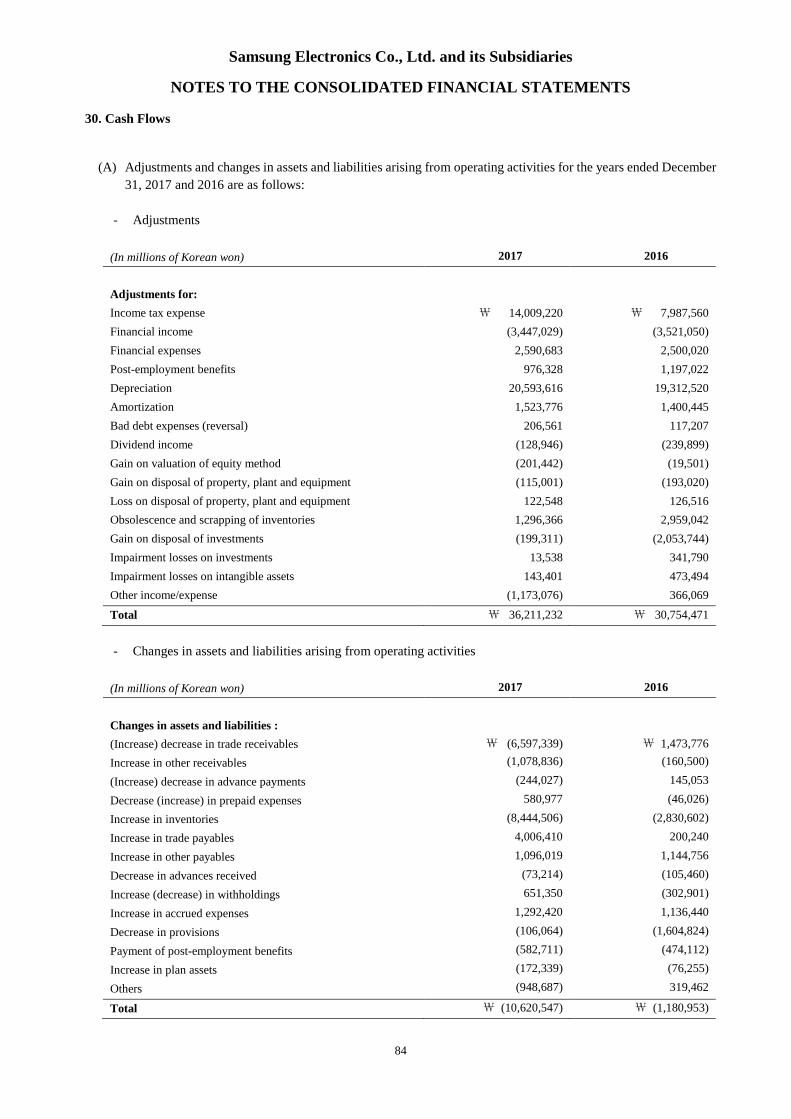
Samsung Electronics Co., Ltd. and its Subsidiaries
NOTES TO THE CONSOLIDATED FINANCIAL STATEMENTS
84
30. Cash Flows
(A) Adjustments and changes in assets and liabilities arising from operating activities for the years ended December
31, 2017 and 2016 are as follows:
- Adjustments
(In millions of Korean won) 2017 2016
Adjustments for:
Income tax expense ₩ 14,009,220 ₩ 7,987,560
Financial income (3,447,029) (3,521,050)
Financial expenses 2,590,683 2,500,020
Post-employment benefits 976,328 1,197,022
Depreciation 20,593,616 19,312,520
Amortization 1,523,776 1,400,445
Bad debt expenses (reversal) 206,561 117,207
Dividend income (128,946) (239,899)
Gain on valuation of equity method (201,442) (19,501)
Gain on disposal of property, plant and equipment (115,001) (193,020)
Loss on disposal of property, plant and equipment 122,548 126,516
Obsolescence and scrapping of inventories 1,296,366 2,959,042
Gain on disposal of investments (199,311) (2,053,744)
Impairment losses on investments 13,538 341,790
Impairment losses on intangible assets 143,401 473,494
Other income/expense (1,173,076) 366,069
Total ₩ 36,211,232 ₩ 30,754,471
- Changes in assets and liabilities arising from operating activities
(In millions of Korean won) 2017 2016
Changes in assets and liabilities :
(Increase) decrease in trade receivables ₩ (6,597,339) ₩ 1,473,776
Increase in other receivables (1,078,836) (160,500)
(Increase) decrease in advance payments (244,027) 145,053
Decrease (increase) in prepaid expenses 580,977 (46,026)
Increase in inventories (8,444,506) (2,830,602)
Increase in trade payables 4,006,410 200,240
Increase in other payables 1,096,019 1,144,756
Decrease in advances received (73,214) (105,460)
Increase (decrease) in withholdings 651,350 (302,901)
Increase in accrued expenses 1,292,420 1,136,440
Decrease in provisions (106,064) (1,604,824)
Payment of post-employment benefits (582,711) (474,112)
Increase in plan assets (172,339) (76,255)
Others (948,687) 319,462
Total ₩ (10,620,547) ₩ (1,180,953)
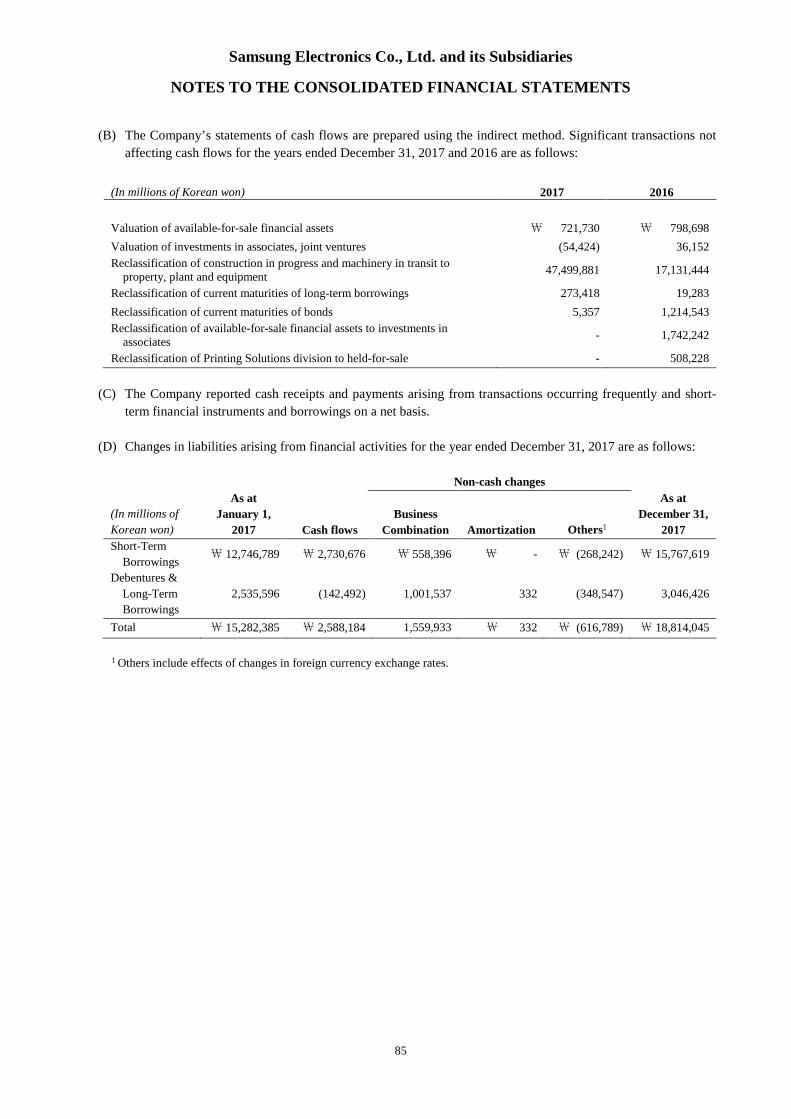
Samsung Electronics Co., Ltd. and its Subsidiaries
NOTES TO THE CONSOLIDATED FINANCIAL STATEMENTS
85
(B) The Company’s statements of cash flows are prepared using the indirect method. Significant transactions not
affecting cash flows for the years ended December 31, 2017 and 2016 are as follows:
(In millions of Korean won) 2017 2016
Valuation of available-for-sale financial assets \ 721,730 \ 798,698
Valuation of investments in associates, joint ventures (54,424) 36,152
Reclassification of construction in progress and machinery in transit toproperty, plant and equipment
47,499,881 17,131,444
Reclassification of current maturities of long-term borrowings 273,418 19,283
Reclassification of current maturities of bonds 5,357 1,214,543
Reclassification of available-for-sale financial assets to investments inassociates
- 1,742,242
Reclassification of Printing Solutions division to held-for-sale - 508,228
(C) The Company reported cash receipts and payments arising from transactions occurring frequently and short-
term financial instruments and borrowings on a net basis.
(D) Changes in liabilities arising from financial activities for the year ended December 31, 2017 are as follows:
(In millions of
Korean won)
Non-cash changes
As at
January 1,
2017 Cash flows
Business
Combination Amortization Others1
As at
December 31,
2017
Short-Term
Borrowings₩ 12,746,789 ₩ 2,730,676 ₩ 558,396 ₩ - ₩ (268,242) ₩ 15,767,619
Debentures &
Long-Term
Borrowings
2,535,596 (142,492) 1,001,537 332 (348,547) 3,046,426
Total ₩ 15,282,385 ₩ 2,588,184 1,559,933 ₩ 332 ₩ (616,789) ₩ 18,814,045
1 Others include effects of changes in foreign currency exchange rates.
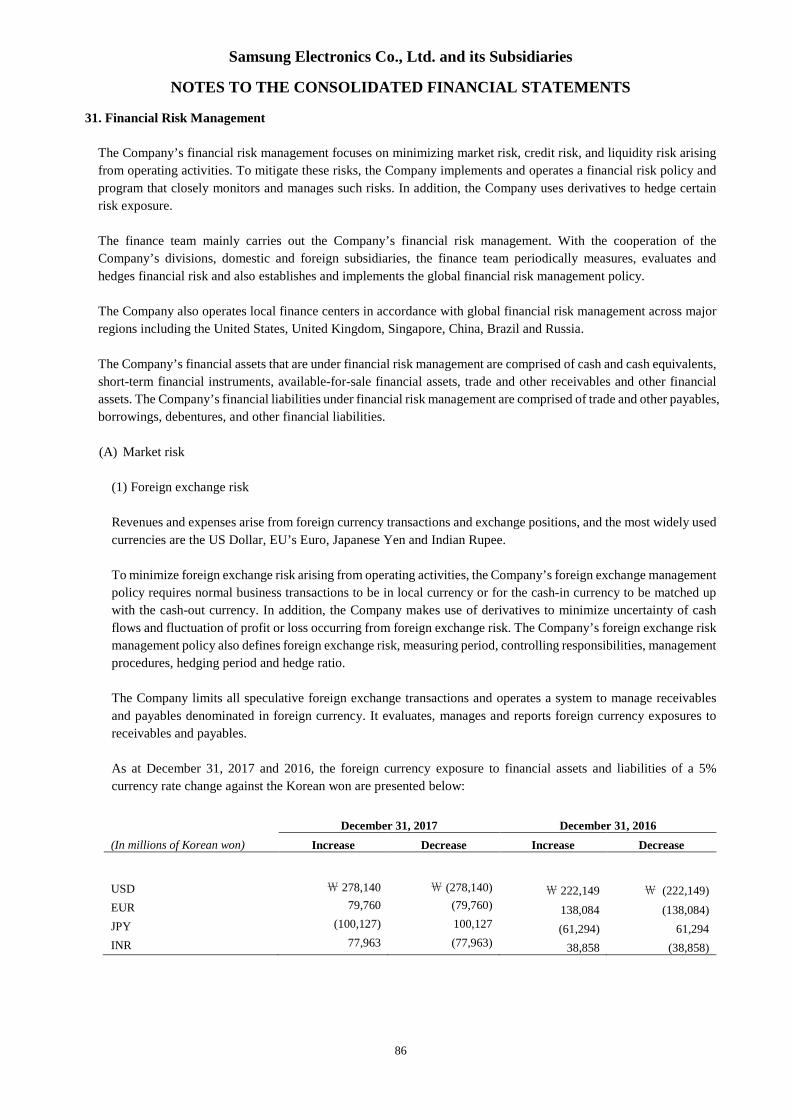
Samsung Electronics Co., Ltd. and its Subsidiaries
NOTES TO THE CONSOLIDATED FINANCIAL STATEMENTS
86
31. Financial Risk Management
The Company’s financial risk management focuses on minimizing market risk, credit risk, and liquidity risk arising
from operating activities. To mitigate these risks, the Company implements and operates a financial risk policy and
program that closely monitors and manages such risks. In addition, the Company uses derivatives to hedge certain
risk exposure.
The finance team mainly carries out the Company’s financial risk management. With the cooperation of the
Company’s divisions, domestic and foreign subsidiaries, the finance team periodically measures, evaluates and
hedges financial risk and also establishes and implements the global financial risk management policy.
The Company also operates local finance centers in accordance with global financial risk management across major
regions including the United States, United Kingdom, Singapore, China, Brazil and Russia.
The Company’s financial assets that are under financial risk management are comprised of cash and cash equivalents,
short-term financial instruments, available-for-sale financial assets, trade and other receivables and other financial
assets. The Company’s financial liabilities under financial risk management are comprised of trade and other payables,
borrowings, debentures, and other financial liabilities.
(A) Market risk
(1) Foreign exchange risk
Revenues and expenses arise from foreign currency transactions and exchange positions, and the most widely used
currencies are the US Dollar, EU’s Euro, Japanese Yen and Indian Rupee.
To minimize foreign exchange risk arising from operating activities, the Company’s foreign exchange management
policy requires normal business transactions to be in local currency or for the cash-in currency to be matched up
with the cash-out currency. In addition, the Company makes use of derivatives to minimize uncertainty of cash
flows and fluctuation of profit or loss occurring from foreign exchange risk. The Company’s foreign exchange risk
management policy also defines foreign exchange risk, measuring period, controlling responsibilities, management
procedures, hedging period and hedge ratio.
The Company limits all speculative foreign exchange transactions and operates a system to manage receivables
and payables denominated in foreign currency. It evaluates, manages and reports foreign currency exposures to
receivables and payables.
As at December 31, 2017 and 2016, the foreign currency exposure to financial assets and liabilities of a 5%
currency rate change against the Korean won are presented below:
(In millions of Korean won)
December 31, 2017 December 31, 2016
Increase Decrease Increase Decrease
USD ₩ 278,140 ₩ (278,140) ₩ 222,149 ₩ (222,149)
EUR 79,760 (79,760) 138,084 (138,084)
JPY (100,127) 100,127 (61,294) 61,294
INR 77,963 (77,963) 38,858 (38,858)

Samsung Electronics Co., Ltd. and its Subsidiaries
NOTES TO THE CONSOLIDATED FINANCIAL STATEMENTS
87
(2) Price risk
The Company’s investment portfolio consists of direct and indirect investments in equity securities classified as
available-for-sale, which is in line with the Company’s strategy.
As at December 31, 2017 and 2016, a price fluctuation in relation to marketable equity securities by 1% would
result in changes in other comprehensive income (before income tax) of₩29,086 million and₩23,622 million,
respectively.
(3) Interest rate risk
Risk of changes in interest rates for floating interest rate financial instruments is defined as the risk that the fair
value of components of the statement of financial position, and future cash flows of interest income (expenses) of
a financial instrument, will fluctuate because of changes in market interest rates. The Company’s position with
regard to interest rate risk exposure is mainly driven by its floating interest rate debt obligations and interest-
bearing deposits. The Company implemented policies and operates to minimize uncertainty arising from changes
in interest rates and financial expenses.
In order to avoid interest rate risk, the Company maintains minimum external borrowings by facilitating cash
pooling systems on a regional and global basis. The Company manages exposed interest rate risk via periodic
monitoring and handling risk factors on a timely basis.
The sensitivity risk of the Company is determined based on the following assumption:
Changes in market interest rates that could impact the interest income and expenses of floating interest rate
financial instruments
Based on the above assumption, changes to profit and net equity as a result of a 1% change in interest rates on
borrowings are presented below:
(In millions of Korean won)
December 31, 2017 December 31, 2016
Increase Decrease Increase Decrease
Financial assets ₩ 49,117 ₩ (49,117) ₩ 64,803 ₩ (64,803)
Financial liabilities (22,643) 22,643 (9,123) 9,123
Net effect ₩ 26,474 ₩ (26,474) ₩ 55,680 ₩ (55,680)
(B) Credit risk
Credit risk arises during the normal course of transactions and investing activities where clients or other parties fail
to discharge an obligation. The Company monitors and sets the client’s and counterparty’s credit limit on a periodic
basis based on the client’s and counterparty’s financial conditions, default history and other important factors.
Adequate insurance coverage is maintained for accounts receivables related to trading partners situated in higher risk
countries.
Credit risk can arise from transactions with financial institutions which include financial instrument transactions such
as cash and cash equivalents, savings, and derivative instruments. To minimize such risk, the Company transacts only
with banks which have strong international credit rating (S&P A and above), and all new transactions with financial
institutions with no prior transaction history are approved, managed and monitored by the Company’s finance team
and the local finance center. The Company requires separate approval for contracts with restrictions.
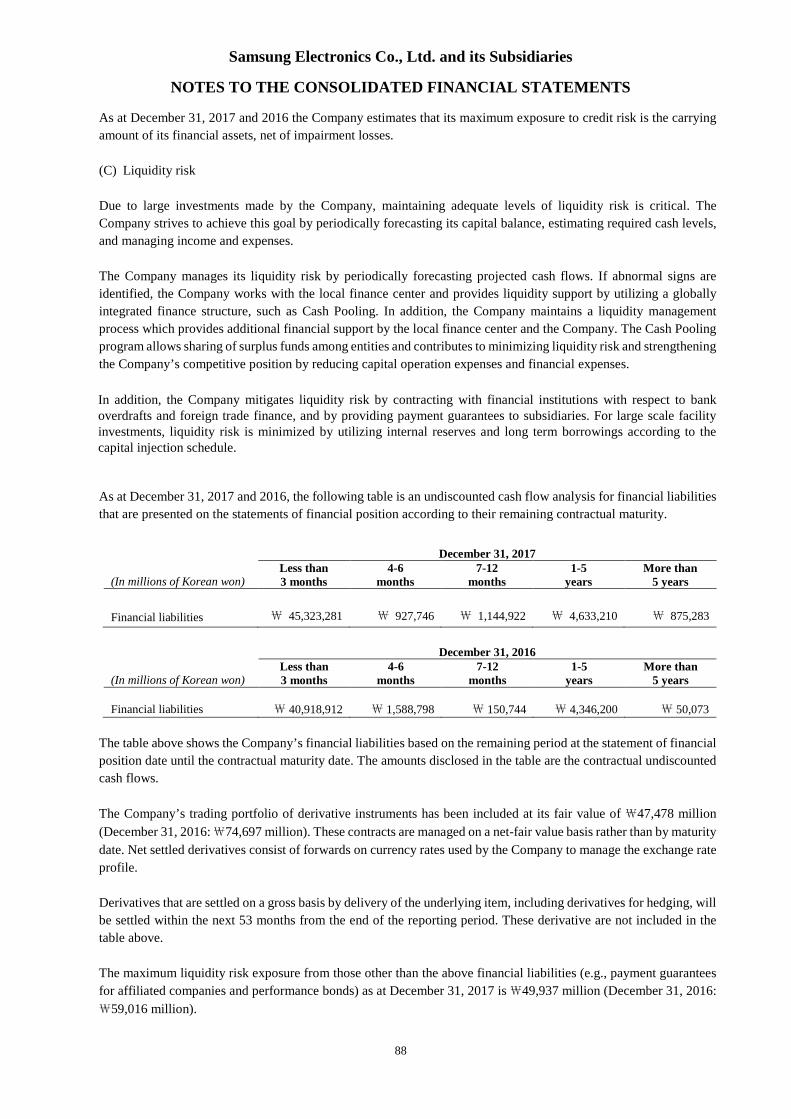
Samsung Electronics Co., Ltd. and its Subsidiaries
NOTES TO THE CONSOLIDATED FINANCIAL STATEMENTS
88
As at December 31, 2017 and 2016 the Company estimates that its maximum exposure to credit risk is the carrying
amount of its financial assets, net of impairment losses.
(C) Liquidity risk
Due to large investments made by the Company, maintaining adequate levels of liquidity risk is critical. The
Company strives to achieve this goal by periodically forecasting its capital balance, estimating required cash levels,
and managing income and expenses.
The Company manages its liquidity risk by periodically forecasting projected cash flows. If abnormal signs are
identified, the Company works with the local finance center and provides liquidity support by utilizing a globally
integrated finance structure, such as Cash Pooling. In addition, the Company maintains a liquidity management
process which provides additional financial support by the local finance center and the Company. The Cash Pooling
program allows sharing of surplus funds among entities and contributes to minimizing liquidity risk and strengthening
the Company’s competitive position by reducing capital operation expenses and financial expenses.
In addition, the Company mitigates liquidity risk by contracting with financial institutions with respect to bankoverdrafts and foreign trade finance, and by providing payment guarantees to subsidiaries. For large scale facilityinvestments, liquidity risk is minimized by utilizing internal reserves and long term borrowings according to thecapital injection schedule.
As at December 31, 2017 and 2016, the following table is an undiscounted cash flow analysis for financial liabilities
that are presented on the statements of financial position according to their remaining contractual maturity.
December 31, 2017
(In millions of Korean won)Less than3 months
4-6months
7-12months
1-5years
More than5 years
Financial liabilities ₩ 45,323,281 ₩ 927,746 ₩ 1,144,922 ₩ 4,633,210 ₩ 875,283
December 31, 2016
(In millions of Korean won)Less than3 months
4-6months
7-12months
1-5years
More than5 years
Financial liabilities ₩ 40,918,912 ₩ 1,588,798 ₩ 150,744 ₩ 4,346,200 ₩ 50,073
The table above shows the Company’s financial liabilities based on the remaining period at the statement of financial
position date until the contractual maturity date. The amounts disclosed in the table are the contractual undiscounted
cash flows.
The Company’s trading portfolio of derivative instruments has been included at its fair value of ₩47,478 million
(December 31, 2016:₩74,697 million). These contracts are managed on a net-fair value basis rather than by maturity
date. Net settled derivatives consist of forwards on currency rates used by the Company to manage the exchange rate
profile.
Derivatives that are settled on a gross basis by delivery of the underlying item, including derivatives for hedging, will
be settled within the next 53 months from the end of the reporting period. These derivative are not included in the
table above.
The maximum liquidity risk exposure from those other than the above financial liabilities (e.g., payment guarantees
for affiliated companies and performance bonds) as at December 31, 2017 is₩49,937 million (December 31, 2016:
₩59,016 million).
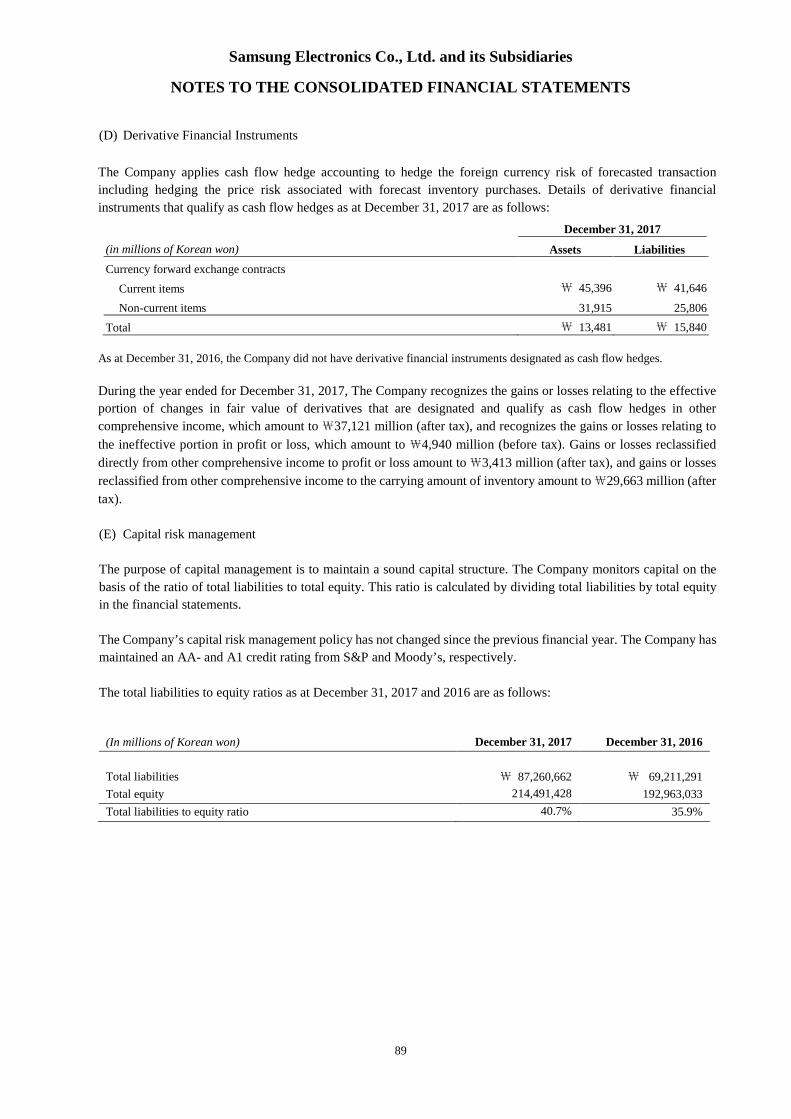
Samsung Electronics Co., Ltd. and its Subsidiaries
NOTES TO THE CONSOLIDATED FINANCIAL STATEMENTS
89
(D) Derivative Financial Instruments
The Company applies cash flow hedge accounting to hedge the foreign currency risk of forecasted transaction
including hedging the price risk associated with forecast inventory purchases. Details of derivative financial
instruments that qualify as cash flow hedges as at December 31, 2017 are as follows:
December 31, 2017
(in millions of Korean won) Assets Liabilities
Currency forward exchange contracts
Current items ₩ 45,396 ₩ 41,646
Non-current items 31,915 25,806
Total ₩ 13,481 ₩ 15,840
As at December 31, 2016, the Company did not have derivative financial instruments designated as cash flow hedges.
During the year ended for December 31, 2017, The Company recognizes the gains or losses relating to the effective
portion of changes in fair value of derivatives that are designated and qualify as cash flow hedges in other
comprehensive income, which amount to ₩37,121 million (after tax), and recognizes the gains or losses relating to
the ineffective portion in profit or loss, which amount to ₩4,940 million (before tax). Gains or losses reclassified
directly from other comprehensive income to profit or loss amount to₩3,413 million (after tax), and gains or losses
reclassified from other comprehensive income to the carrying amount of inventory amount to₩29,663 million (after
tax).
(E) Capital risk management
The purpose of capital management is to maintain a sound capital structure. The Company monitors capital on the
basis of the ratio of total liabilities to total equity. This ratio is calculated by dividing total liabilities by total equity
in the financial statements.
The Company’s capital risk management policy has not changed since the previous financial year. The Company has
maintained an AA- and A1 credit rating from S&P and Moody’s, respectively.
The total liabilities to equity ratios as at December 31, 2017 and 2016 are as follows:
(In millions of Korean won) December 31, 2017 December 31, 2016
Total liabilities ₩ 87,260,662 ₩ 69,211,291
Total equity 214,491,428 192,963,033
Total liabilities to equity ratio 40.7% 35.9%
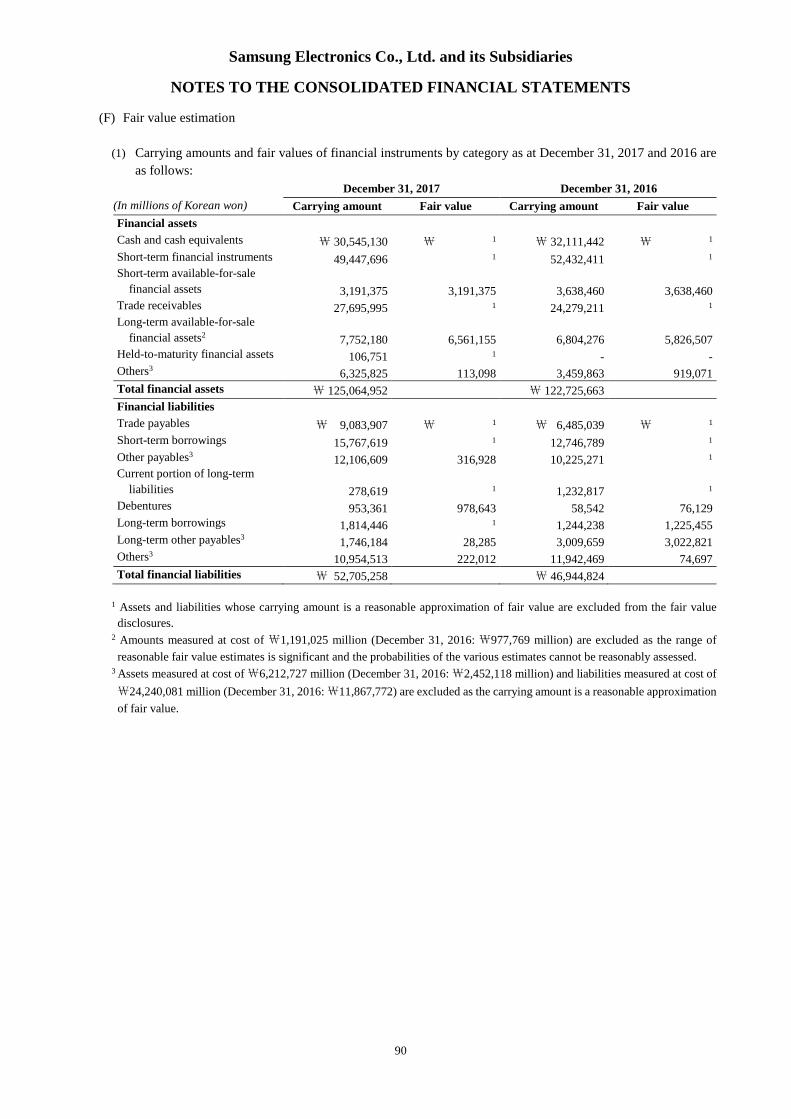
Samsung Electronics Co., Ltd. and its Subsidiaries
NOTES TO THE CONSOLIDATED FINANCIAL STATEMENTS
90
(F) Fair value estimation
(1) Carrying amounts and fair values of financial instruments by category as at December 31, 2017 and 2016 are
as follows:
December 31, 2017 December 31, 2016
(In millions of Korean won) Carrying amount Fair value Carrying amount Fair value
Financial assets
Cash and cash equivalents ₩ 30,545,130 ₩ 1 ₩ 32,111,442 ₩ 1
Short-term financial instruments 49,447,696 1 52,432,411 1
Short-term available-for-sale
financial assets 3,191,375 3,191,375 3,638,460 3,638,460Trade receivables 27,695,995 1 24,279,211 1
Long-term available-for-sale
financial assets27,752,180 6,561,155 6,804,276 5,826,507
Held-to-maturity financial assets 106,751 1 - -Others3
6,325,825 113,098 3,459,863 919,071
Total financial assets ₩ 125,064,952 ₩ 122,725,663
Financial liabilities
Trade payables ₩ 9,083,907 ₩ 1 ₩ 6,485,039 ₩ 1
Short-term borrowings 15,767,619 1 12,746,789 1
Other payables312,106,609 316,928 10,225,271 1
Current portion of long-term
liabilities 278,619 1 1,232,817 1
Debentures 953,361 978,643 58,542 76,129Long-term borrowings 1,814,446 1 1,244,238 1,225,455Long-term other payables3
1,746,184 28,285 3,009,659 3,022,821Others3
10,954,513 222,012 11,942,469 74,697
Total financial liabilities ₩ 52,705,258 ₩ 46,944,824
1 Assets and liabilities whose carrying amount is a reasonable approximation of fair value are excluded from the fair value
disclosures.2 Amounts measured at cost of ₩1,191,025 million (December 31, 2016: ₩977,769 million) are excluded as the range of
reasonable fair value estimates is significant and the probabilities of the various estimates cannot be reasonably assessed.3 Assets measured at cost of₩6,212,727 million (December 31, 2016:₩2,452,118 million) and liabilities measured at cost of
₩24,240,081 million (December 31, 2016:₩11,867,772) are excluded as the carrying amount is a reasonable approximation
of fair value.

Samsung Electronics Co., Ltd. and its Subsidiaries
NOTES TO THE CONSOLIDATED FINANCIAL STATEMENTS
91
(2) Fair value hierarchy classifications of the financial instruments that are measured at fair value or its fair value
is disclosed as at December 31, 2017 and 2016 are as follows :
December 31, 2017
(In millions of Korean won) Level 1 Level 2 Level 3 Total
1) Assets
Short-term available-for-sale financial assets ₩ - ₩ 3,191,375 ₩ - ₩ 3,191,375
Long-term available-for-sale financial assets 2,908,581 - 3,652,574 6,561,155
Others - 113,098 - 113,098
2) Liabilities
Other payables ₩ - ₩ - ₩ 316,928 ₩ 316,928
Debentures - 978,643 - 978,643
Long-term other payables - 28,285 28,285
Others - 215,307 6,705 222,012
December 31, 2016
(In millions of Korean won) Level 1 Level 2 Level 3 Total
1) Assets
Short-term available-for-sale financial assets ₩ - ₩ 3,638,460 ₩ - ₩ 3,638,460
Long-term available-for-sale financial assets 2,362,235 - 3,464,272 5,826,507
Others - 919,071 - 919,071
2) Liabilities
Debentures ₩ - ₩ 76,129 ₩ - ₩ 76,129
Long-term borrowings - 1,225,455 - 1,225,455
Long-term other payables - 2,680,119 342,702 3,022,821
Others - 74,697 - 74,697
The levels of the fair value hierarchy and its application to financial assets and liabilities are described below.
ㆍ Level 1: Quoted prices (unadjusted) in active markets for identical assets or liabilities
ㆍ Level 2: Inputs other than quoted prices included within Level 1 that are observable for the asset or liability,
either directly or indirectly
ㆍ Level 3: Inputs for the asset or liability that are not based on observable market data (that is, unobservable inputs)
The fair value of financial instruments traded in active markets is based on quoted market prices at the statement of
financial position date. A market is regarded as active if quoted prices are readily and regularly available from an
exchange, dealer, broker, industry group, pricing service, or regulatory agency, and those prices represent actual and
regularly occurring market transactions on an arm’s length basis. The quoted market price used for financial assets
held by the Company is the current bid price. These instruments are included in Level 1. Instruments included in
Level 1 are listed equity investments classified as trading securities or available-for-sale financial assets.
The fair value of financial instruments that are not traded in an active market (for example, over-the-counter
derivatives) is determined by using valuation techniques. These valuation techniques maximize the use of observable
market data where it is available and rely as little as possible on entity specific estimates. If all significant inputs
required to fair value an instrument are observable, the instrument is included in Level 2.
If one or more of the significant inputs are not based on observable market data, the instrument is included in Level 3.
The Company performs the fair value measurements required for financial reporting purposes, including Level 3 fair
values and discusses valuation processes and results at least once every quarter in line with the Company’s quarterly
reporting dates. The Company’s policy is to recognize transfers between levels at the end of the reporting period, if
corresponding events or changes in circumstances have occurred.
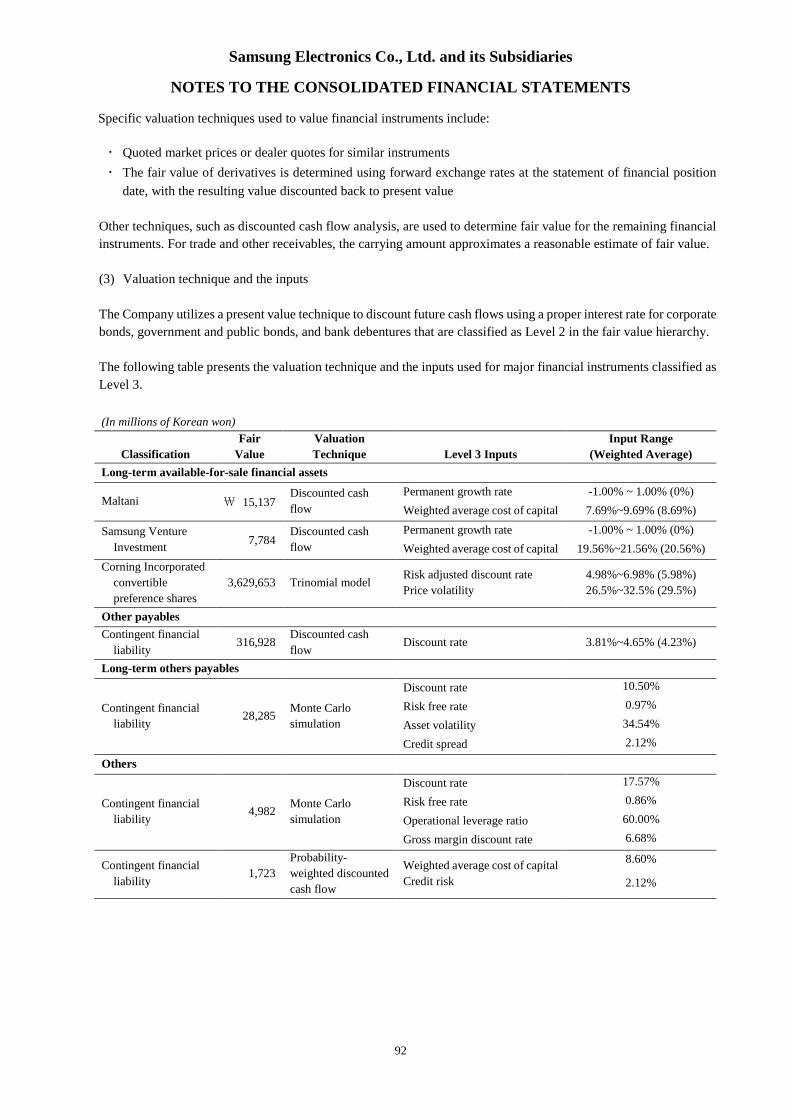
Samsung Electronics Co., Ltd. and its Subsidiaries
NOTES TO THE CONSOLIDATED FINANCIAL STATEMENTS
92
Specific valuation techniques used to value financial instruments include:
ㆍ Quoted market prices or dealer quotes for similar instruments
ㆍ The fair value of derivatives is determined using forward exchange rates at the statement of financial position
date, with the resulting value discounted back to present value
Other techniques, such as discounted cash flow analysis, are used to determine fair value for the remaining financial
instruments. For trade and other receivables, the carrying amount approximates a reasonable estimate of fair value.
(3) Valuation technique and the inputs
The Company utilizes a present value technique to discount future cash flows using a proper interest rate for corporate
bonds, government and public bonds, and bank debentures that are classified as Level 2 in the fair value hierarchy.
The following table presents the valuation technique and the inputs used for major financial instruments classified as
Level 3.
(In millions of Korean won)
Classification
Fair
Value
Valuation
Technique Level 3 Inputs
Input Range
(Weighted Average)
Long-term available-for-sale financial assets
Maltani \ 15,137Discounted cash
flow
Permanent growth rate -1.00% ~ 1.00% (0%)
Weighted average cost of capital 7.69%~9.69% (8.69%)
Samsung Venture
Investment7,784
Discounted cash
flow
Permanent growth rate -1.00% ~ 1.00% (0%)
Weighted average cost of capital 19.56%~21.56% (20.56%)
Corning Incorporated
convertible
preference shares
3,629,653 Trinomial modelRisk adjusted discount rate
Price volatility
4.98%~6.98% (5.98%)
26.5%~32.5% (29.5%)
Other payables
Contingent financial
liability316,928
Discounted cash
flowDiscount rate 3.81%~4.65% (4.23%)
Long-term others payables
Contingent financial
liability28,285
Monte Carlo
simulation
Discount rate 10.50%
Risk free rate 0.97%
Asset volatility 34.54%
Credit spread 2.12%
Others
Contingent financial
liability4,982
Monte Carlo
simulation
Discount rate 17.57%
Risk free rate 0.86%
Operational leverage ratio 60.00%
Gross margin discount rate 6.68%
Contingent financial
liability1,723
Probability-
weighted discounted
cash flow
Weighted average cost of capital
Credit risk
8.60%
2.12%
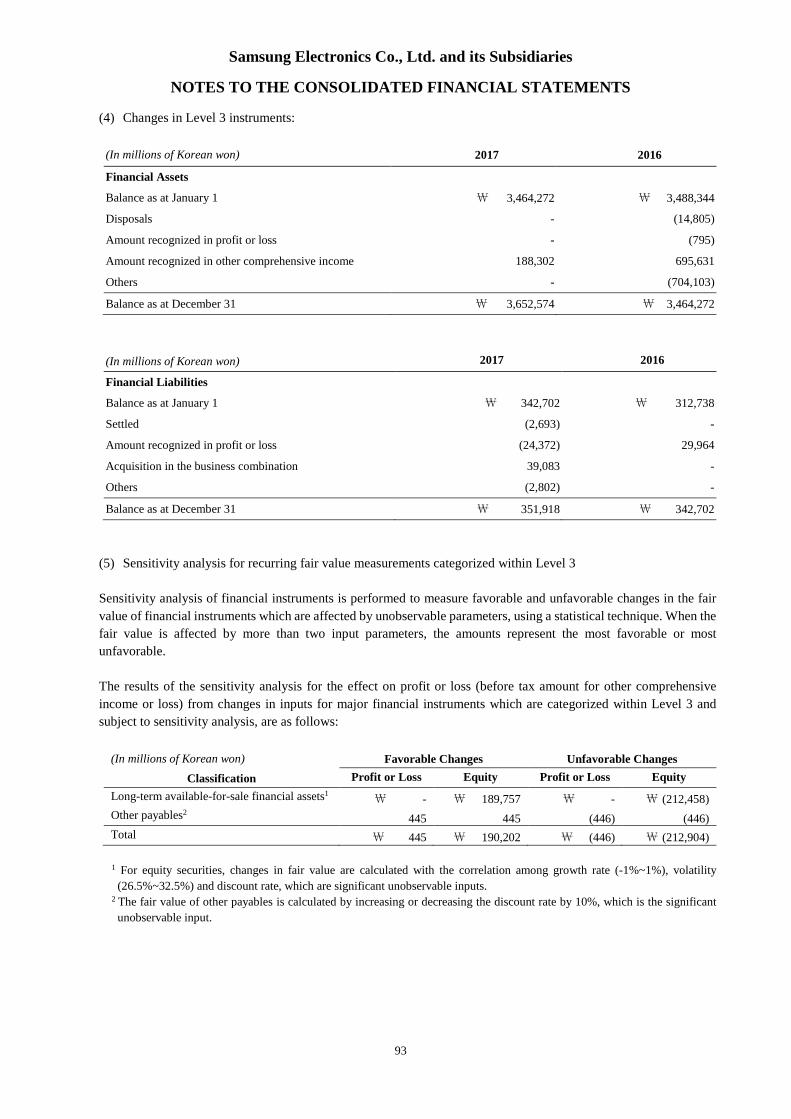
Samsung Electronics Co., Ltd. and its Subsidiaries
NOTES TO THE CONSOLIDATED FINANCIAL STATEMENTS
93
(4) Changes in Level 3 instruments:
(In millions of Korean won) 2017 2016
Financial Assets
Balance as at January 1 \ 3,464,272 \ 3,488,344
Disposals - (14,805)
Amount recognized in profit or loss - (795)
Amount recognized in other comprehensive income 188,302 695,631
Others - (704,103)
Balance as at December 31 \ 3,652,574 \ 3,464,272
(In millions of Korean won) 2017 2016
Financial Liabilities
Balance as at January 1 \ 342,702 \ 312,738
Settled (2,693) -
Amount recognized in profit or loss (24,372) 29,964
Acquisition in the business combination 39,083 -
Others (2,802) -
Balance as at December 31 \ 351,918 \ 342,702
(5) Sensitivity analysis for recurring fair value measurements categorized within Level 3
Sensitivity analysis of financial instruments is performed to measure favorable and unfavorable changes in the fair
value of financial instruments which are affected by unobservable parameters, using a statistical technique. When the
fair value is affected by more than two input parameters, the amounts represent the most favorable or most
unfavorable.
The results of the sensitivity analysis for the effect on profit or loss (before tax amount for other comprehensive
income or loss) from changes in inputs for major financial instruments which are categorized within Level 3 and
subject to sensitivity analysis, are as follows:
(In millions of Korean won) Favorable Changes Unfavorable Changes
Classification Profit or Loss Equity Profit or Loss Equity
Long-term available-for-sale financial assets1\ - \ 189,757 \ - \ (212,458)
Other payables2445 445 (446) (446)
Total \ 445 \ 190,202 \ (446) \ (212,904)
1 For equity securities, changes in fair value are calculated with the correlation among growth rate (-1%~1%), volatility
(26.5%~32.5%) and discount rate, which are significant unobservable inputs.2 The fair value of other payables is calculated by increasing or decreasing the discount rate by 10%, which is the significant
unobservable input.
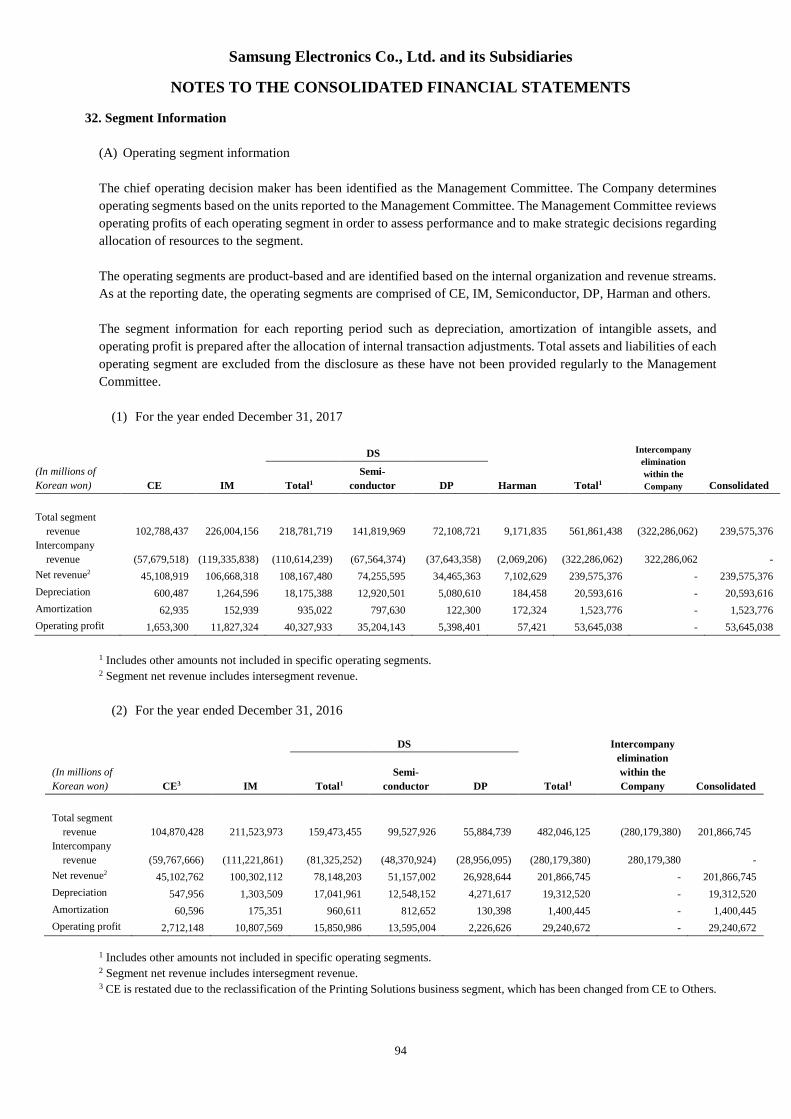
Samsung Electronics Co., Ltd. and its Subsidiaries
NOTES TO THE CONSOLIDATED FINANCIAL STATEMENTS
94
32. Segment Information
(A) Operating segment information
The chief operating decision maker has been identified as the Management Committee. The Company determines
operating segments based on the units reported to the Management Committee. The Management Committee reviews
operating profits of each operating segment in order to assess performance and to make strategic decisions regarding
allocation of resources to the segment.
The operating segments are product-based and are identified based on the internal organization and revenue streams.
As at the reporting date, the operating segments are comprised of CE, IM, Semiconductor, DP, Harman and others.
The segment information for each reporting period such as depreciation, amortization of intangible assets, and
operating profit is prepared after the allocation of internal transaction adjustments. Total assets and liabilities of each
operating segment are excluded from the disclosure as these have not been provided regularly to the Management
Committee.
(1) For the year ended December 31, 2017
(In millions of
Korean won) CE IM
DS
Harman Total1
Intercompany
elimination
within the
Company ConsolidatedTotal1
Semi-
conductor DP
Total segment
revenue 102,788,437 226,004,156 218,781,719 141,819,969 72,108,721 9,171,835 561,861,438 (322,286,062) 239,575,376
Intercompany
revenue (57,679,518) (119,335,838) (110,614,239) (67,564,374) (37,643,358) (2,069,206) (322,286,062) 322,286,062 -
Net revenue245,108,919 106,668,318 108,167,480 74,255,595 34,465,363 7,102,629 239,575,376 - 239,575,376
Depreciation 600,487 1,264,596 18,175,388 12,920,501 5,080,610 184,458 20,593,616 - 20,593,616
Amortization 62,935 152,939 935,022 797,630 122,300 172,324 1,523,776 - 1,523,776
Operating profit 1,653,300 11,827,324 40,327,933 35,204,143 5,398,401 57,421 53,645,038 - 53,645,038
1 Includes other amounts not included in specific operating segments.2 Segment net revenue includes intersegment revenue.
(2) For the year ended December 31, 2016
DS Intercompany
elimination
within the
Company
(In millions of
Korean won) CE3 IM Total1
Semi-
conductor DP Total1 Consolidated
Total segment
revenue 104,870,428 211,523,973 159,473,455 99,527,926 55,884,739 482,046,125 (280,179,380) 201,866,745
Intercompany
revenue (59,767,666) (111,221,861) (81,325,252) (48,370,924) (28,956,095) (280,179,380) 280,179,380 -
Net revenue245,102,762 100,302,112 78,148,203 51,157,002 26,928,644 201,866,745 - 201,866,745
Depreciation 547,956 1,303,509 17,041,961 12,548,152 4,271,617 19,312,520 - 19,312,520
Amortization 60,596 175,351 960,611 812,652 130,398 1,400,445 - 1,400,445
Operating profit 2,712,148 10,807,569 15,850,986 13,595,004 2,226,626 29,240,672 - 29,240,672
1 Includes other amounts not included in specific operating segments.2 Segment net revenue includes intersegment revenue.3 CE is restated due to the reclassification of the Printing Solutions business segment, which has been changed from CE to Others.

Samsung Electronics Co., Ltd. and its Subsidiaries
NOTES TO THE CONSOLIDATED FINANCIAL STATEMENTS
95
(B) Regional information
The regional segment information provided to the Management Committee for the reportable segments as at and for
the years ended December 31, 2017 and 2016 is as follows:
(1) For the year ended December 31, 2017
(In millions of Korean
won) Korea America Europe
Asia and
Africa China
Intercompany
elimination
within the
Company Consolidated
Net segment revenue 31,545,181 81,019,556 44,418,914 44,247,994 38,343,731 - 239,575,376
Non-current assets189,156,726 10,545,297 6,081,926 11,980,235 9,361,317 (699,370) 126,426,131
1 Total of non-current assets other than financial instruments, deferred tax assets, and investments in associates and joint ventures.
(2) For the year ended December 31, 2016
(In millions of Korean
won) Korea America Europe
Asia and
Africa China
Intercompany
elimination
within the
Company Consolidated
Net segment revenue 20,201,828 68,728,575 38,253,185 39,099,991 35,583,166 - 201,866,745
Non-current assets1 68,978,040 7,041,731 730,490 9,626,711 11,132,720 (483,191) 97,026,501
1 Total of non-current assets other than financial instruments, deferred tax assets, and investments in associates and joint ventures.
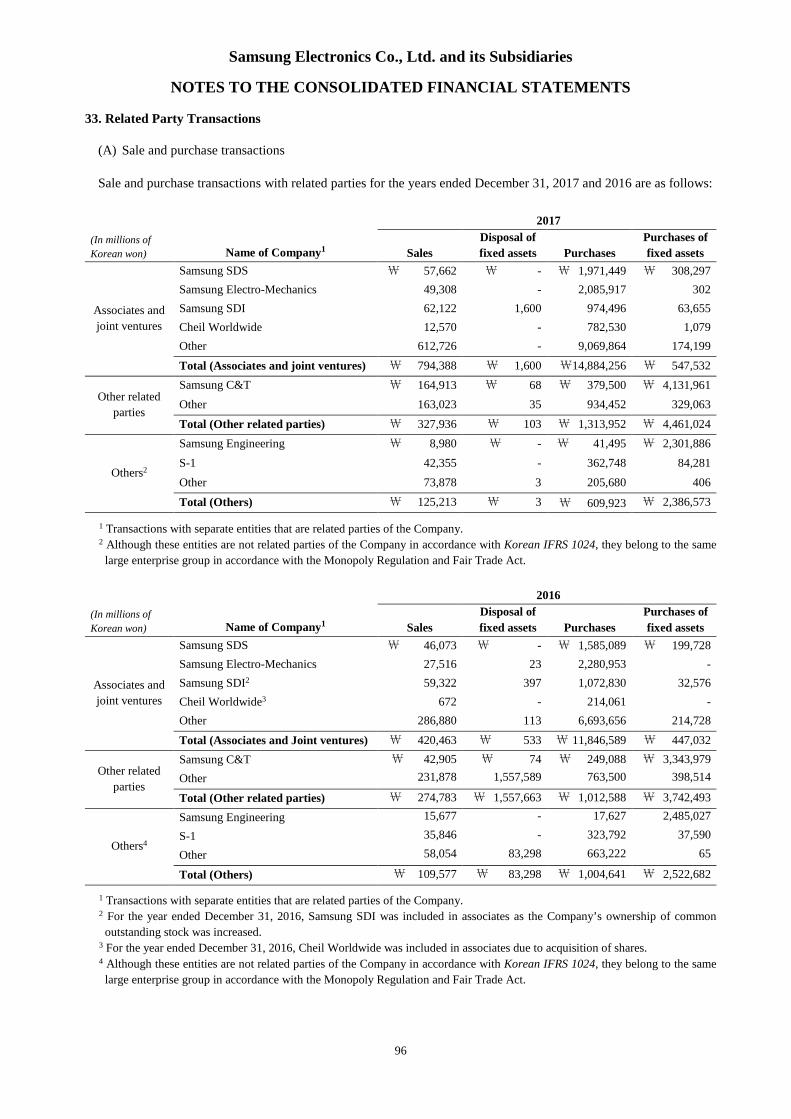
Samsung Electronics Co., Ltd. and its Subsidiaries
NOTES TO THE CONSOLIDATED FINANCIAL STATEMENTS
96
33. Related Party Transactions
(A) Sale and purchase transactions
Sale and purchase transactions with related parties for the years ended December 31, 2017 and 2016 are as follows:
(In millions of
Korean won) Name of Company1
2017
Sales
Disposal of
fixed assets Purchases
Purchases of
fixed assets
Associates and
joint ventures
Samsung SDS \ 57,662 \ - \ 1,971,449 \ 308,297
Samsung Electro-Mechanics 49,308 - 2,085,917 302
Samsung SDI 62,122 1,600 974,496 63,655
Cheil Worldwide 12,570 - 782,530 1,079
Other 612,726 - 9,069,864 174,199
Total (Associates and joint ventures) \ 794,388 \ 1,600 \14,884,256 \ 547,532
Other related
parties
Samsung C&T \ 164,913 \ 68 \ 379,500 \ 4,131,961
Other 163,023 35 934,452 329,063
Total (Other related parties) \ 327,936 \ 103 \ 1,313,952 \ 4,461,024
Others2
Samsung Engineering \ 8,980 \ - \ 41,495 \ 2,301,886
S-1 42,355 - 362,748 84,281
Other 73,878 3 205,680 406
Total (Others) \ 125,213 \ 3 \ 609,923 \ 2,386,573
1 Transactions with separate entities that are related parties of the Company.2 Although these entities are not related parties of the Company in accordance with Korean IFRS 1024, they belong to the same
large enterprise group in accordance with the Monopoly Regulation and Fair Trade Act.
(In millions of
Korean won) Name of Company1
2016
Sales
Disposal of
fixed assets Purchases
Purchases of
fixed assets
Associates and
joint ventures
Samsung SDS \ 46,073 \ - \ 1,585,089 \ 199,728
Samsung Electro-Mechanics 27,516 23 2,280,953 -
Samsung SDI2 59,322 397 1,072,830 32,576
Cheil Worldwide3 672 - 214,061 -
Other 286,880 113 6,693,656 214,728
Total (Associates and Joint ventures) \ 420,463 \ 533 \ 11,846,589 \ 447,032
Other related
parties
Samsung C&T \ 42,905 \ 74 \ 249,088 \ 3,343,979
Other 231,878 1,557,589 763,500 398,514
Total (Other related parties) \ 274,783 \ 1,557,663 \ 1,012,588 \ 3,742,493
Others4
Samsung Engineering 15,677 - 17,627 2,485,027
S-1 35,846 - 323,792 37,590
Other 58,054 83,298 663,222 65
Total (Others) \ 109,577 \ 83,298 \ 1,004,641 \ 2,522,682
1 Transactions with separate entities that are related parties of the Company.2 For the year ended December 31, 2016, Samsung SDI was included in associates as the Company’s ownership of common
outstanding stock was increased.3 For the year ended December 31, 2016, Cheil Worldwide was included in associates due to acquisition of shares.4 Although these entities are not related parties of the Company in accordance with Korean IFRS 1024, they belong to the same
large enterprise group in accordance with the Monopoly Regulation and Fair Trade Act.
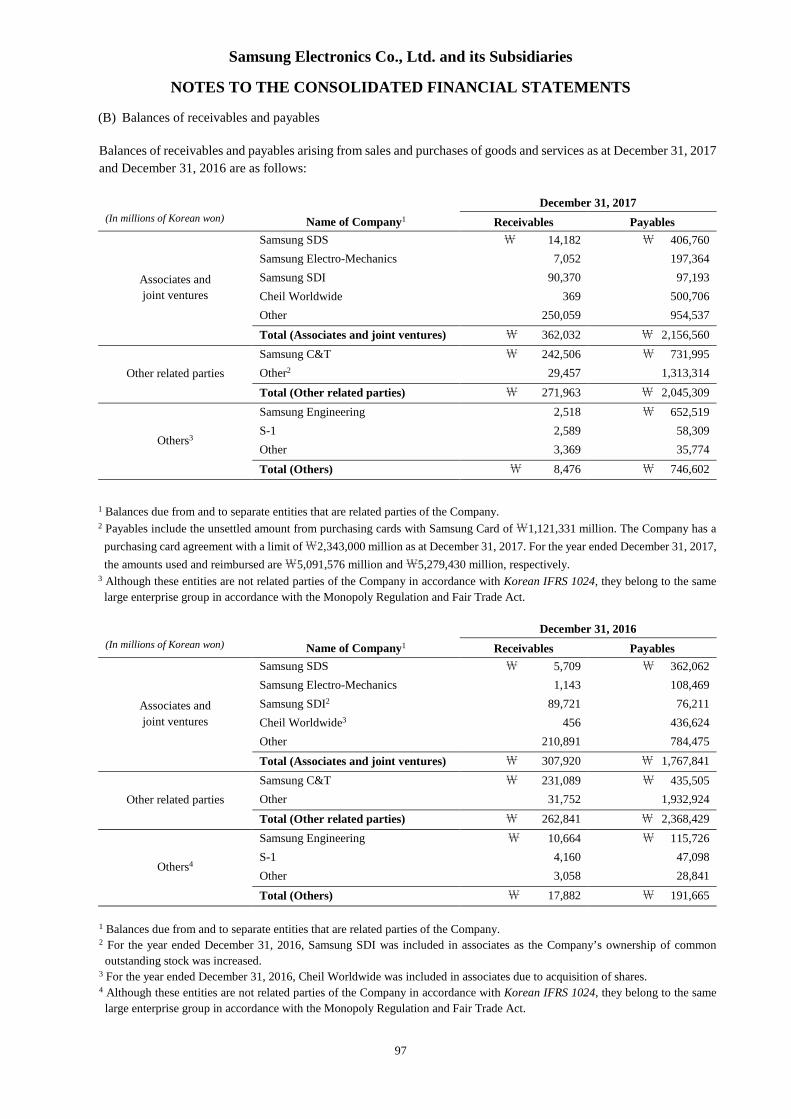
Samsung Electronics Co., Ltd. and its Subsidiaries
NOTES TO THE CONSOLIDATED FINANCIAL STATEMENTS
97
(B) Balances of receivables and payables
Balances of receivables and payables arising from sales and purchases of goods and services as at December 31, 2017
and December 31, 2016 are as follows:
December 31, 2017
(In millions of Korean won) Name of Company1 Receivables Payables
Associates and
joint ventures
Samsung SDS \ 14,182 \ 406,760
Samsung Electro-Mechanics 7,052 197,364
Samsung SDI 90,370 97,193
Cheil Worldwide 369 500,706
Other 250,059 954,537
Total (Associates and joint ventures) \ 362,032 \ 2,156,560
Other related parties
Samsung C&T \ 242,506 \ 731,995
Other2 29,457 1,313,314
Total (Other related parties) \ 271,963 \ 2,045,309
Others3
Samsung Engineering 2,518 \ 652,519
S-1 2,589 58,309
Other 3,369 35,774
Total (Others) \ 8,476 \ 746,602
1 Balances due from and to separate entities that are related parties of the Company.2 Payables include the unsettled amount from purchasing cards with Samsung Card of\1,121,331 million. The Company has a
purchasing card agreement with a limit of\2,343,000 million as at December 31, 2017. For the year ended December 31, 2017,
the amounts used and reimbursed are\5,091,576 million and\5,279,430 million, respectively.3 Although these entities are not related parties of the Company in accordance with Korean IFRS 1024, they belong to the same
large enterprise group in accordance with the Monopoly Regulation and Fair Trade Act.
December 31, 2016
(In millions of Korean won) Name of Company1 Receivables Payables
Associates and
joint ventures
Samsung SDS \ 5,709 \ 362,062
Samsung Electro-Mechanics 1,143 108,469
Samsung SDI2 89,721 76,211
Cheil Worldwide3 456 436,624
Other 210,891 784,475
Total (Associates and joint ventures) \ 307,920 \ 1,767,841
Other related parties
Samsung C&T \ 231,089 \ 435,505
Other 31,752 1,932,924
Total (Other related parties) \ 262,841 \ 2,368,429
Others4
Samsung Engineering \ 10,664 \ 115,726
S-1 4,160 47,098
Other 3,058 28,841
Total (Others) \ 17,882 \ 191,665
1 Balances due from and to separate entities that are related parties of the Company.2 For the year ended December 31, 2016, Samsung SDI was included in associates as the Company’s ownership of common
outstanding stock was increased.3 For the year ended December 31, 2016, Cheil Worldwide was included in associates due to acquisition of shares.4 Although these entities are not related parties of the Company in accordance with Korean IFRS 1024, they belong to the same
large enterprise group in accordance with the Monopoly Regulation and Fair Trade Act.
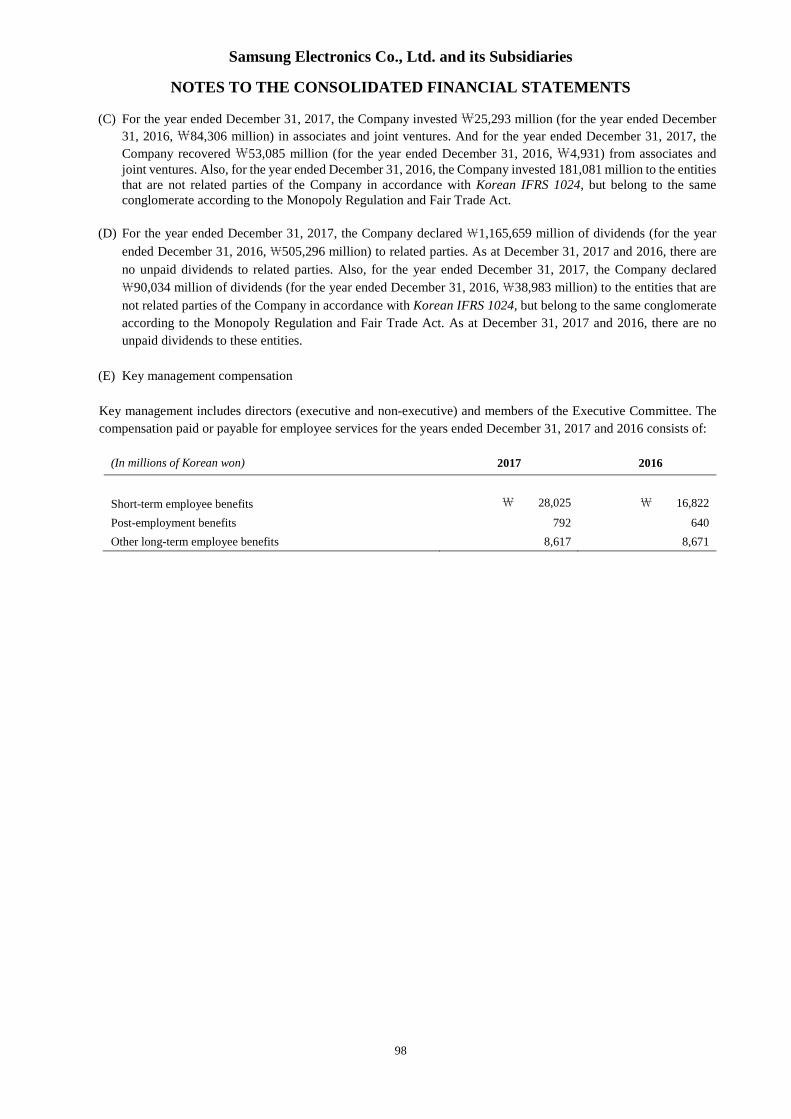
Samsung Electronics Co., Ltd. and its Subsidiaries
NOTES TO THE CONSOLIDATED FINANCIAL STATEMENTS
98
(C) For the year ended December 31, 2017, the Company invested\25,293 million (for the year ended December
31, 2016, \84,306 million) in associates and joint ventures. And for the year ended December 31, 2017, the
Company recovered \53,085 million (for the year ended December 31, 2016, \4,931) from associates andjoint ventures. Also, for the year ended December 31, 2016, the Company invested 181,081 million to the entitiesthat are not related parties of the Company in accordance with Korean IFRS 1024, but belong to the sameconglomerate according to the Monopoly Regulation and Fair Trade Act.
(D) For the year ended December 31, 2017, the Company declared \1,165,659 million of dividends (for the year
ended December 31, 2016, \505,296 million) to related parties. As at December 31, 2017 and 2016, there are
no unpaid dividends to related parties. Also, for the year ended December 31, 2017, the Company declared
\90,034 million of dividends (for the year ended December 31, 2016, \38,983 million) to the entities that are
not related parties of the Company in accordance with Korean IFRS 1024, but belong to the same conglomerate
according to the Monopoly Regulation and Fair Trade Act. As at December 31, 2017 and 2016, there are no
unpaid dividends to these entities.
(E) Key management compensation
Key management includes directors (executive and non-executive) and members of the Executive Committee. The
compensation paid or payable for employee services for the years ended December 31, 2017 and 2016 consists of:
(In millions of Korean won) 2017 2016
Short-term employee benefits \ 28,025 \ 16,822
Post-employment benefits 792 640
Other long-term employee benefits 8,617 8,671
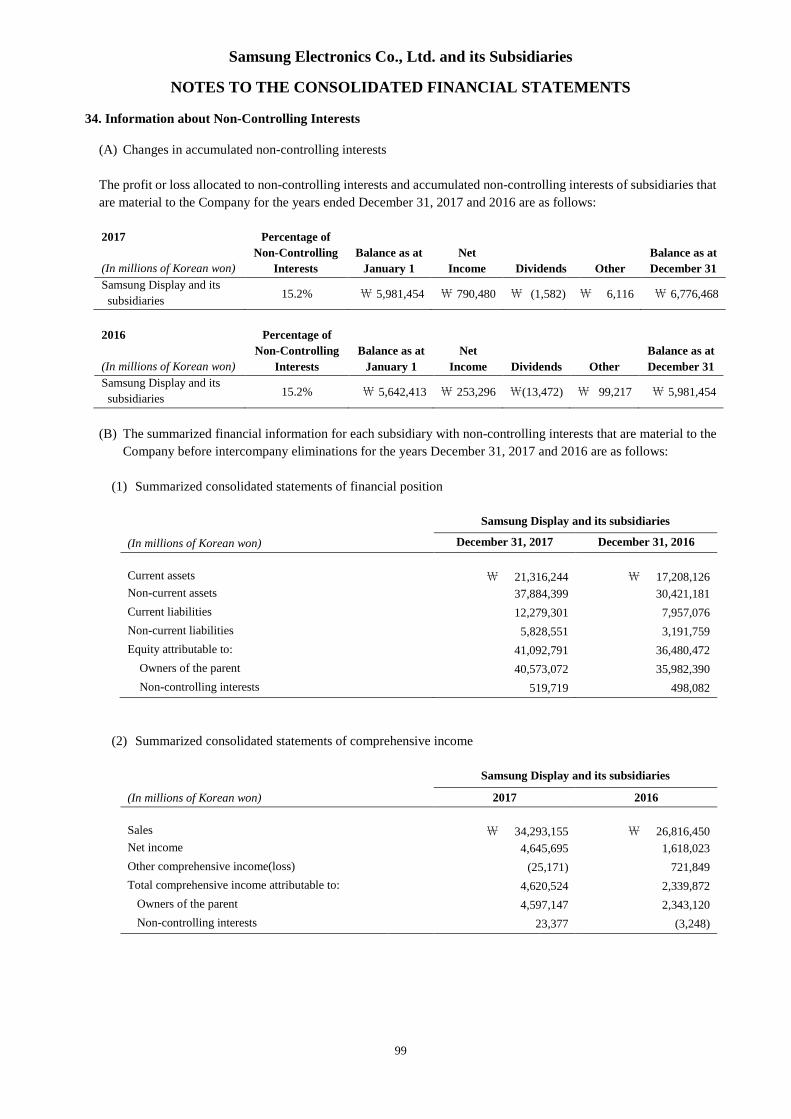
Samsung Electronics Co., Ltd. and its Subsidiaries
NOTES TO THE CONSOLIDATED FINANCIAL STATEMENTS
99
34. Information about Non-Controlling Interests
(A) Changes in accumulated non-controlling interests
The profit or loss allocated to non-controlling interests and accumulated non-controlling interests of subsidiaries that
are material to the Company for the years ended December 31, 2017 and 2016 are as follows:
2017
(In millions of Korean won)
Percentage of
Non-Controlling
Interests
Balance as at
January 1
Net
Income Dividends Other
Balance as at
December 31
Samsung Display and its
subsidiaries15.2% \ 5,981,454 \ 790,480 \ (1,582) \ 6,116 \ 6,776,468
2016
(In millions of Korean won)
Percentage of
Non-Controlling
Interests
Balance as at
January 1
Net
Income Dividends Other
Balance as at
December 31
Samsung Display and its
subsidiaries15.2% \ 5,642,413 \ 253,296 \(13,472) \ 99,217 \ 5,981,454
(B) The summarized financial information for each subsidiary with non-controlling interests that are material to the
Company before intercompany eliminations for the years December 31, 2017 and 2016 are as follows:
(1) Summarized consolidated statements of financial position
(In millions of Korean won)
Samsung Display and its subsidiaries
December 31, 2017 December 31, 2016
Current assets \ 21,316,244 \ 17,208,126
Non-current assets 37,884,399 30,421,181
Current liabilities 12,279,301 7,957,076
Non-current liabilities 5,828,551 3,191,759
Equity attributable to: 41,092,791 36,480,472
Owners of the parent 40,573,072 35,982,390
Non-controlling interests 519,719 498,082
(2) Summarized consolidated statements of comprehensive income
(In millions of Korean won)
Samsung Display and its subsidiaries
2017 2016
Sales \ 34,293,155 \ 26,816,450
Net income 4,645,695 1,618,023
Other comprehensive income(loss) (25,171) 721,849
Total comprehensive income attributable to: 4,620,524 2,339,872
Owners of the parent 4,597,147 2,343,120
Non-controlling interests 23,377 (3,248)
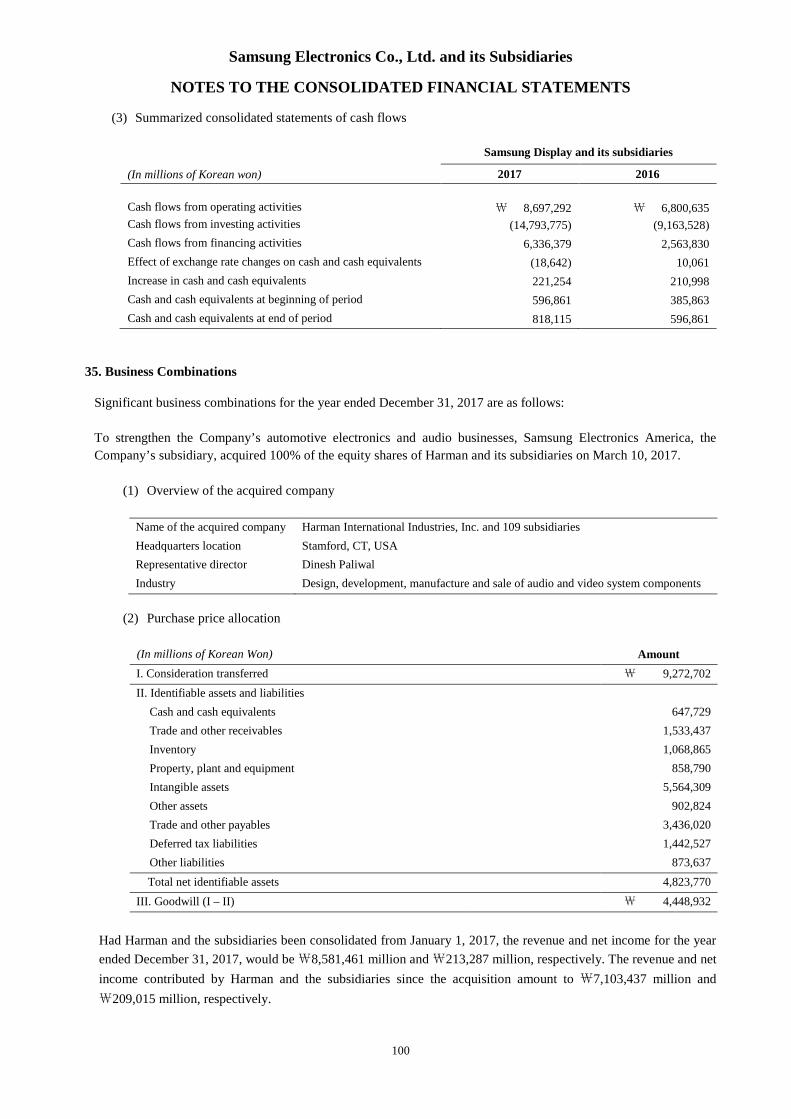
Samsung Electronics Co., Ltd. and its Subsidiaries
NOTES TO THE CONSOLIDATED FINANCIAL STATEMENTS
100
(3) Summarized consolidated statements of cash flows
(In millions of Korean won)
Samsung Display and its subsidiaries
2017 2016
Cash flows from operating activities \ 8,697,292 \ 6,800,635
Cash flows from investing activities (14,793,775) (9,163,528)
Cash flows from financing activities 6,336,379 2,563,830
Effect of exchange rate changes on cash and cash equivalents (18,642) 10,061
Increase in cash and cash equivalents 221,254 210,998
Cash and cash equivalents at beginning of period 596,861 385,863
Cash and cash equivalents at end of period 818,115 596,861
35. Business Combinations
Significant business combinations for the year ended December 31, 2017 are as follows:
To strengthen the Company’s automotive electronics and audio businesses, Samsung Electronics America, the
Company’s subsidiary, acquired 100% of the equity shares of Harman and its subsidiaries on March 10, 2017.
(1) Overview of the acquired company
Name of the acquired company Harman International Industries, Inc. and 109 subsidiaries
Headquarters location Stamford, CT, USA
Representative director Dinesh Paliwal
Industry Design, development, manufacture and sale of audio and video system components
(2) Purchase price allocation
Had Harman and the subsidiaries been consolidated from January 1, 2017, the revenue and net income for the year
ended December 31, 2017, would be₩8,581,461 million and₩213,287 million, respectively. The revenue and net
income contributed by Harman and the subsidiaries since the acquisition amount to ₩7,103,437 million and
₩209,015 million, respectively.
(In millions of Korean Won) Amount
I. Consideration transferred ₩ 9,272,702
II. Identifiable assets and liabilities
Cash and cash equivalents 647,729
Trade and other receivables 1,533,437
Inventory 1,068,865
Property, plant and equipment 858,790
Intangible assets 5,564,309
Other assets 902,824
Trade and other payables 3,436,020
Deferred tax liabilities 1,442,527
Other liabilities 873,637
Total net identifiable assets 4,823,770
III. Goodwill (I – II) ₩ 4,448,932
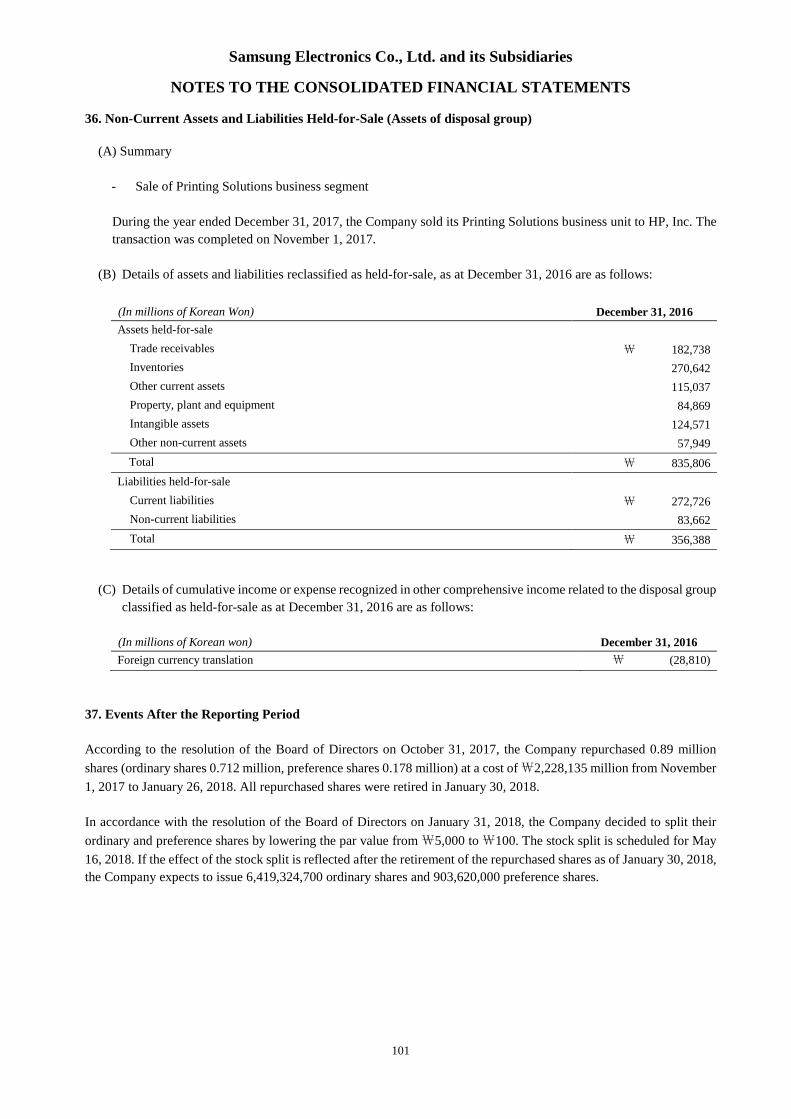
Samsung Electronics Co., Ltd. and its Subsidiaries
NOTES TO THE CONSOLIDATED FINANCIAL STATEMENTS
101
36. Non-Current Assets and Liabilities Held-for-Sale (Assets of disposal group)
(A) Summary
- Sale of Printing Solutions business segment
During the year ended December 31, 2017, the Company sold its Printing Solutions business unit to HP, Inc. The
transaction was completed on November 1, 2017.
(B) Details of assets and liabilities reclassified as held-for-sale, as at December 31, 2016 are as follows:
(In millions of Korean Won) December 31, 2016
Assets held-for-sale
Trade receivables ₩ 182,738
Inventories 270,642
Other current assets 115,037
Property, plant and equipment 84,869
Intangible assets 124,571
Other non-current assets 57,949
Total ₩ 835,806
Liabilities held-for-sale
Current liabilities ₩ 272,726
Non-current liabilities 83,662
Total ₩ 356,388
(C) Details of cumulative income or expense recognized in other comprehensive income related to the disposal group
classified as held-for-sale as at December 31, 2016 are as follows:
(In millions of Korean won) December 31, 2016
Foreign currency translation ₩ (28,810)
37. Events After the Reporting Period
According to the resolution of the Board of Directors on October 31, 2017, the Company repurchased 0.89 million
shares (ordinary shares 0.712 million, preference shares 0.178 million) at a cost of₩2,228,135 million from November
1, 2017 to January 26, 2018. All repurchased shares were retired in January 30, 2018.
In accordance with the resolution of the Board of Directors on January 31, 2018, the Company decided to split their
ordinary and preference shares by lowering the par value from₩5,000 to₩100. The stock split is scheduled for May
16, 2018. If the effect of the stock split is reflected after the retirement of the repurchased shares as of January 30, 2018,
the Company expects to issue 6,419,324,700 ordinary shares and 903,620,000 preference shares.