Embed Size (px)
Citation preview

125 Income Statement
125 Statement of Comprehensive Income
126 Balance Sheet
127 Statement of Changes in Equity
128 Cash Flow Statement
130 Notes to MVV’s 2018 Consolidated Financial Statements
141 Notes to Income Statement 145 Notes to Balance Sheet
200 Responsibility Statement
201 Directors and Officers
208 Independent Auditor’s Report
Consolidated Financial Statements
124
Annual Report 2018 | MVV

Income statement
Euro 000s 1 Oct 2017 to 30 Sep 2018 1 Oct 2016 to 30 Sep 2017 Notes
Sales 4,069,671 4,177,900
less electricity and natural gas taxes 166,911 168,384
Sales after electricity and natural gas taxes 3,902,760 4,009,516 1
Changes in inventories – 30,930 – 15,053 2
Own work capitalised 19,076 19,152 3
Other operating income 418,258 320,598 4
Cost of materials 2,957,761 3,078,743 5
Employee benefit expenses 422,744 418,678 6
Other operating expenses 459,323 408,141 7
Income from companies recognised at equity – 110 11,942 8
Other income from shareholdings 1,133 1,666 8
Restructuring result 821 –
EBITDA 471,180 442,259
Depreciation 180,680 182,748 9
EBITA 290,500 259,511
Goodwill amortisation 33,706 – 14
EBIT 256,794 259,511
of which result of IAS 39 derivative measurement 31,591 38,900
of which EBIT before result of IAS 39 derivative measurement 225,203 220,611
Financing income 12,577 14,624 10
Financing expenses 59,669 68,515 11
EBT 209,702 205,620
Taxes on income 77,289 73,135 12
Annual net income 132,413 132,485
of which non-controlling interests 2,411 11,145
of which earnings attributable to MVV Energie AG shareholders (annual net income after minority interests) 130,002 121,340 13
Basic and diluted earnings per share (Euro) 1.97 1.84
Statement of income and expenses recognised in group equity
Euro 000s 1 Oct 2017 to 30 Sep 2018 1 Oct 2016 to 30 Sep 2017
Annual net income 132,413 132,485
Cash flow hedges 24,195 32,266
Currency translation differences 1,376 2,814
Reclassifiable share of companies recognised at equity 166 –
Items that may subsequently be reclassified to profit or loss 25,737 35,080
Actuarial gains and losses 893 7,555
Non-reclassifiable share of companies recognised at equity 14,370 – 11,439
Items that will not be reclassified to profit or loss 15,263 – 3,884
Total comprehensive income 173,413 163,681
Non-controlling interests 7,369 17,644
Total comprehensive income attributable to MVV Energie AG shareholders 166,044 146,037
Income Statement
Statement of Comprehensive Income
125
Annual Report 2018 | MVV Income Statement | Statement of Comprehensive Income | CONSOLIDATED FINANCIAL STATEMENTS

Balance Sheet
Balance sheet
Euro 000s 30 September 2018 30 September 2017 Notes
Assets
Non-current assets
Intangible assets 315,923 345,064 14
Property, plant and equipment 2,588,247 2,519,369 15
Investment properties 2,451 2,404 16
Interests in companies recognised at equity 189,414 180,015 17, 18
Other financial assets 57,662 56,541 20
Other receivables and assets 309,020 189,270 21
Deferred tax assets 30,420 33,435 33
3,493,137 3,326,098
Current assets
Inventories 160,962 282,529 22
Trade receivables 381,729 351,104 23
Other receivables and assets 765,978 343,443 21
Tax receivables 27,586 18,908 24
Securities – 7
Cash and cash equivalents 310,589 370,301 25
Assets held for sale – 20,498 26
1,646,844 1,386,790
5,139,981 4,712,888
Equity and debt
Equity 27
Share capital 168,721 168,721
Capital reserve 455,241 455,241
Accumulated net income 777,222 705,028
Accumulated other comprehensive income – 20,761 – 56,772
Capital of MVV 1,380,423 1,272,218
Non-controlling interests 244,791 248,884
1,625,214 1,521,102
Non-current debt
Provisions 181,370 198,689 28, 29
Tax provisions – 4,987 28
Financial debt 1,163,138 1,299,227 30
Other liabilities 403,883 310,268 31
Deferred tax liabilities 173,809 162,983 33
1,922,200 1,976,154
Current debt
Other provisions 138,988 134,794 28, 29
Tax provisions 54,879 31,803 28
Financial debt 222,858 148,413 30
Trade payables 340,256 351,179 32
Other liabilities 835,147 548,369 31
Tax liabilities 439 1,074 33
1,592,567 1,215,632
5,139,981 4,712,888
Balance Sheet | CONSOLIDATED FINANCIAL STATEMENTS
126
Annual Report 2018 | MVV

Statement of changes in equity
Euro 000s
Equity contributed Equity generated
Accumulated other comprehensive income
Share capital of MVV
Energie AG
Capital reserve of MVV
Energie AG
Accumulated net income
Currency translation differences
Fair value measure-
ment of financial
instruments
Actuarial gains and
losses
Capital of MVV
Non- controlling
interests
Total capital
Balance at 1 Oct 2016 168,721 455,241 640,654 14,780 – 34,590 – 61,659 1,183,147 243,208 1,426,355
Other income and expenses recognised directly in equity – – – 2,717 27,627 – 5,647 24,697 6,499 31,196
Result of business operations – – 121,340 – – – 121,340 11,145 132,485
Total comprehensive income – – 121,340 2,717 27,627 – 5,647 146,037 17,644 163,681
Dividends paid – – – 59,316 – – – – 59,316 – 13,422 – 72,738
Change in scope of consolidation – – – 103 – – – – 103 21 – 82
Other changes – – 2,453 – – – 2,453 1,433 3,886
Balance at 30 Sep 2017 168,721 455,241 705,028 17,497 – 6,963 – 67,306 1,272,218 248,884 1,521,102
Balance at 1 Oct 2017 168,721 455,241 705,028 17,497 – 6,963 – 67,306 1,272,218 248,884 1,521,102
Other income and expenses recognised in equity – – – 1,089 19,909 15,044 36,042 4,958 41,000
Result of business operations – – 130,002 – – – 130,002 2,411 132,413
Total comprehensive income – – 130,002 1,089 19,909 15,044 166,044 7,369 173,413
Dividends paid – – – 59,316 – – – – 59,316 – 17,753 – 77,069
Capital increase/ reduction at subsidiaries – – – – – – – 8,634 8,634
Change in scope of consolidation – – 1,508 – 31 – – 1,477 – 2,343 – 866
Balance at 30 Sep 2018 168,721 455,241 777,222 18,555 12,946 – 52,262 1,380,423 244,791 1,625,214
Statement of Changes in Equity
Statement of Changes in Equity | CONSOLIDATED FINANCIAL STATEMENTS
127
Annual Report 2018 | MVV
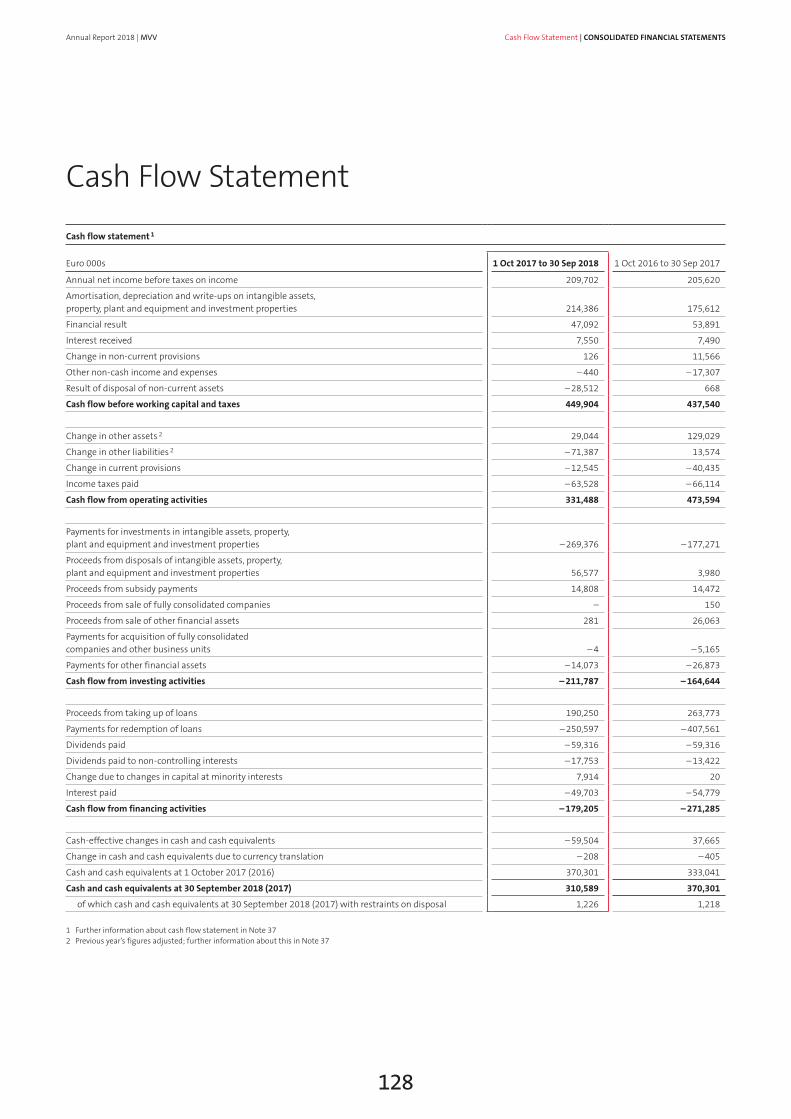
Cash flow statement 1
Euro 000s 1 Oct 2017 to 30 Sep 2018 1 Oct 2016 to 30 Sep 2017
Annual net income before taxes on income 209,702 205,620
Amortisation, depreciation and write-ups on intangible assets, property, plant and equipment and investment properties 214,386 175,612
Financial result 47,092 53,891
Interest received 7,550 7,490
Change in non-current provisions 126 11,566
Other non-cash income and expenses – 440 – 17,307
Result of disposal of non-current assets – 28,512 668
Cash flow before working capital and taxes 449,904 437,540
Change in other assets 2 29,044 129,029
Change in other liabilities 2 – 71,387 13,574
Change in current provisions – 12,545 – 40,435
Income taxes paid – 63,528 – 66,114
Cash flow from operating activities 331,488 473,594
Payments for investments in intangible assets, property, plant and equipment and investment properties – 269,376 – 177,271
Proceeds from disposals of intangible assets, property, plant and equipment and investment properties 56,577 3,980
Proceeds from subsidy payments 14,808 14,472
Proceeds from sale of fully consolidated companies – 150
Proceeds from sale of other financial assets 281 26,063
Payments for acquisition of fully consolidated companies and other business units – 4 – 5,165
Payments for other financial assets – 14,073 – 26,873
Cash flow from investing activities – 211,787 – 164,644
Proceeds from taking up of loans 190,250 263,773
Payments for redemption of loans – 250,597 – 407,561
Dividends paid – 59,316 – 59,316
Dividends paid to non-controlling interests – 17,753 – 13,422
Change due to changes in capital at minority interests 7,914 20
Interest paid – 49,703 – 54,779
Cash flow from financing activities – 179,205 – 271,285
Cash-effective changes in cash and cash equivalents – 59,504 37,665
Change in cash and cash equivalents due to currency translation – 208 – 405
Cash and cash equivalents at 1 October 2017 (2016) 370,301 333,041
Cash and cash equivalents at 30 September 2018 (2017) 310,589 370,301
of which cash and cash equivalents at 30 September 2018 (2017) with restraints on disposal 1,226 1,218
1 Further information about cash flow statement in Note 372 Previous year’s figures adjusted; further information about this in Note 37
Cash Flow Statement
Cash Flow Statement | CONSOLIDATED FINANCIAL STATEMENTS
128
Annual Report 2018 | MVV

Cash flow – aggregate presentation
Euro 000s 1 Oct 2017 to 30 Sep 2018 1 Oct 2016 to 30 Sep 2017
Cash and cash equivalents at 1 October 2017 (2016) 370,301 333,041
Cash flow from operating activities 331,488 473,594
Cash flow from investing activities – 211,787 – 164,644
Cash flow from financing activities – 179,205 – 271,285
Change in cash and cash equivalents due to currency translation – 208 – 405
Cash and cash equivalents at 30 September 2018 (2017) 310,589 370,301
Cash Flow Statement | CONSOLIDATED FINANCIAL STATEMENTS
129
Annual Report 2018 | MVV

Information about the companyMVV Energie AG has its legal domicile in Mannheim, Germany. Its business address is at Luisenring 49, 68159 Mannheim. It is the parent company of the MVV Group, which acts as an energy generator, distributor and service provider. Its business is managed in the reporting segments of Customer Solutions, New Energies, Supply Reliability, Strategic Investments and Other Activities.
Basis of preparationMVV’s consolidated financial statements have been prepared pursuant to § 315e (1) of the German Commercial Code (HGB) in accordance with the International Financial Reporting Standards (IFRS) issued by the International Accounting Standards Board (IASB) and the interpretations (IFRIC) of the IFRS Interpretations Committee (IFRS IC). The consolidated financial statements thus fully conform with the IFRS and IFRIC published by the IASB and the IFRS IC to the extent that these had been adopted by the European Union at the end of the period under report and required mandatory application as of 30 September 2018.
The consolidated financial statements have been prepared as of the balance sheet date for the annual financial statements of MVV Energie AG and refer to the 2018 financial year (1 Octo-ber 2017 to 30 September 2018). The consolidated financial statements are compiled in euros. Unless otherwise indicated, all amounts are stated in thousand euros (Euro 000s).
The income statement has been prepared using the total cost method. In the interests of clarity, individual items have been presented in summarised form in the income statement and balance sheet and listed and commented on separately in the notes.
The Executive Board of MVV Energie AG is responsible for the preparation, completeness and accuracy of the consolidated financial statements and the combined management report. The Executive Board prepared the consolidated financial statements and combined management report on 13 Novem-ber 2018 and subsequently forwarded these to the Supervisory Board for approval.
Changes in accounting policiesThe International Accounting Standards Board (IASB) and the IFRS Interpretations Committee (IFRS IC) have revised or newly adopted some standards and interpretations which require mandatory application for the first time in the 2018 financial year. None of the standards and interpretations not listed in the table below has any (material) implications for MVV:
Amended standards and interpretations
EU endorsement
Effective date 1
Implication
IAS 7 Disclosure Initiative
6 Nov 2017
1 Jan 2017
The amendments to IAS 7 require disclosures to be made on chan-ges in those financial liabilities whose incoming and outgoing payments are presented in the cash flow from financing activi-ties in the cash flow statement. Provided in the form of a table, this information will supplement the note disclosures on the cash flow statement.
1 Applicable in financial years beginning on or after the date stated
The IASB and the IFRS IC published standards and interpre-tations not yet requiring mandatory application in the 2018 financial year and of which no voluntary premature application has been made. None of the standards and interpretations not listed in the table below is expected to have any material implications for MVV:
Amended standards and interpretations
EU endorsement
Effective date 1
IFRS 9
Financial Instruments: Classification and Measurement of Financial Assets
22 Nov 2016
1 Jan 2018
IFRS 15 Revenue from Contracts with Customers
22 Sep 2016 1 Jan 2018
IFRS 15 Clarification to Revenue from Contracts with Customers
31 Oct 2017 1 Jan 2018
IFRS 16 Leases 31 Oct 2017 1 Jan 2019
1 Applicable in financial years beginning on or after the date stated
Notes to MVV’s 2018 Consolidated Financial Statements
Notes to Consolidated Financial Statements | CONSOLIDATED FINANCIAL STATEMENTS
130
Annual Report 2018 | MVV

The IASB published the definitive version of IFRS 9 “Financial Instruments” in July 2014. The new standard replaces the existing provisions of IAS 39 “Financial Instruments: Recogni-tion and Measurement” and requires mandatory application in financial years beginning on or after 1 January 2018. This standard was adopted into European law in November 2016. MVV Energie AG will make first-time application of the standard from the beginning of the 2019 financial year.
IFRS 9 includes revised provisions governing the classification and measurement of financial instruments, the impairment of financial assets and the recognition of hedge relationships.
In future, the classification of financial assets will be based on the business model and the contractual cash flow characteris-tics of the respective financial instrument. Where the require-ments for the “hold” business model and the contractual cash flow characteristics of the respective debt instrument are met, these debt instruments will continue to be recognised at amortised cost. Where, in respect of the business model, only the conditions for “hold and sell” and simultaneously the conditions for the contractual cash flow characteristics of the respective debt instrument are met, fair value changes for these debt instruments will be recognised in other comprehensive income with the exception of changes resulting from amended loss allowances. All other debt instruments will be recognised in future at fair value, with changes in value being credited or charged to the income statement. Equity instruments will require recognition at fair value in future. Here, fair value adjust-ments may be recognised either in the income statement or in other comprehensive income. The previous exception allowing equity instruments to be recognised at cost in specific circum-stances no longer applies. The requirements governing financial liabilities set out in IAS 39 have largely been retained. Apart from the exception relating to the classification of equity instruments, the new requirements for classifying financial instruments will not have any material quantitative implica-tions for MVV. Due to the amended requirements for equity instruments, we expect the value of other shareholdings to appreciate by a medium single-digit million euro amount.
Unlike IAS 39 requirements, the new impairment model in IFRS 9 accounts not only for losses that have already materialised, but also for expected losses (expected loss model). This means that impairments of financial assets are recognised at an earlier point in time. Moreover, when determining loss allowances greater reference will have to be made to prospective informa-tion. This will mainly affect trade receivables. Loss allowances for trade receivables without significant financing components and for contract assets are calculated using the simplified approach set out in IFRS 9. First-time application of the new impairment model will lead to an increase no greater than Euro 2 million in loss allowances. This item will be recognised in equity in the 2019 opening balance sheet.
The revised hedge accounting requirements are intended to create a closer relationship between a company’s risk manage-ment strategy and the conclusion of a hedging relationship. Furthermore, IFRS 9 has extended the range of hedged items eligible for hedge accounting and simplified the effectiveness measurement and thus the conditions governing eligibility for hedge accounting. MVV will be able to maintain its existing hedging relationships under IFRS 9. Furthermore, under IFRS 9 the changes in the fair value of an option designated as a hedging instrument have to be recognised as hedging costs in other comprehensive income. The amounts recognised in other comprehensive income are subsequently reflected in the hedged item either on a transaction or on a period basis. This adjustment requires retrospective implementation. MVV’s existing hedging relationships are affected to a very minor extent by this amendment.
The IASB published the new standard IFRS 15 “Revenue from Contracts with Customers” in May 2014. This was adopted in European law in September 2016. It includes completely revised revenue recognition requirements and replaces the existing standards and interpretations IAS 11 “Construction Contracts”, IAS 18 “Revenue”, IFRIC 13 “Customer Loyalty Pro-grammes”, IFRIC 15 “Agreements for the Construction of Real Estate”, IFRIC 18 “Transfers of Assets from Customers” and SIC-31 “Revenue – Barter Transactions Involving Advertising Services”. It lays down a framework to determine whether, when and at what amount revenues require recognition.
Notes to Consolidated Financial Statements | CONSOLIDATED FINANCIAL STATEMENTS
131
Annual Report 2018 | MVV
In future, the revenues requiring recognition will be determined by reference to a five-step model. Moreover, IFRS 15 includes extended note disclosure requirements. The standard requires first-time mandatory application in all financial years begin-ning after 1 January 2018. MVV will apply this standard for the first time at the beginning of the 2019 financial year. First-time application is basically required to be retrospective.
In April 2016, the IASB published clarifications to IFRS 15 relating in particular to the identification of separate perfor-mance obligations, the delineation of principals and agents and the recognition of licensing income. The EU adopted these clarifications in European law on 31 October 2017.
In a project addressing implementation of IFRS 15, MVV has assessed the potential implications of applying IFRS 15 for its consolidated financial statements. The following main implications were identified:
• For allocations in the renewable energies business, the clarifications relating to the constellation of principal or agent status will lead in future to a reduction in sales and an equivalent reduction in cost of materials. The level of netting will depend on future developments in the market premium and is expected to amount to between Euro 250 million and Euro 350 million.
• Balance sheet reclassifications will arise between the assets currently recognised and contractual assets and between the liabilities currently recognised and contractual liabilities.
These will result above all from building cost grants and advance payments received.
• The capitalisation of contract acquisition costs will result in a slight extension in the balance sheet. These costs will be amortised over the average contractual term. Contract acquisition costs for terms of less than one year will be directly expensed.
• Furthermore, in connection with the introduction of IFRS 15 we have also converted the period over which building cost grants are written back to 20 years. The resultant increase in equity amounts to around Euro 30 million.
MVV has selected the cumulative retrospective method for the initial application date.
The new standard IFRS 16 “Leasing” introduced new lease accounting requirements which will in future replace the existing requirements and definitions in IAS 17, IFRIC 4, SIC-15 and SIC-27. The previous classification of leases at the lessee as operating or finance leases has been abolished and replaced by a uniform right-of-use model. One exception relates to con-tracts with terms of less than twelve months and low-value assets. An accounting option is provided for these contracts. Implementation of the new standard will mean that in future operating leases will also trigger capital retention in the form of a right-of-use asset and a liability. This approach is largely comparable with that currently taken to recognise finance leases. For lessors, the accounting model does not differ to any significant extent from that in IAS 17 “Leases”.
The provisions of IFRS 16 will require mandatory application in financial years beginning on or after 1 January 2019. MVV will prematurely apply the new standard for the first time in its financial year beginning on 1 October 2018. This is because the company will also apply IFRS 15 for the first time from this date. One material implication identified is that the Group will recognise right-of use assets for its operating leases and lease liabilities in the same amount. This is expected to extend the balance sheet by between Euro 65 million and Euro 95 million. In the income statement, the new accounting requirements will lead to an amendment in the recognition of lease expenses. This is because IFRS 16 replaces straight-line expenses for operating leases in adjusted EBIT with the amortisation of right-of-use assets and interest expenses for lease liabilities.
Notes to Consolidated Financial Statements | CONSOLIDATED FINANCIAL STATEMENTS
132
Annual Report 2018 | MVV

No material implications are expected for finance leases.
MVV will draw on the options provided for current and low-value leases. With regard to the transitional requirements, MVV will apply the modified retrospective approach.
Consolidation methodsThe financial statements included in consolidation have been prepared on the basis of uniform accounting policies as of 30 September 2018.
Subsidiaries are fully consolidated upon acquisition, i.e. from the time when the Group gains control. Their inclusion in the consolidated financial statements ends when they are no longer controlled by the parent company. Capital consolidation is based on the purchase method. Non-controlling interests held in the earnings and net assets of fully consolidated companies are not attributable to the Group. In the consolidated balance sheet, they are recognised within equity, separately from the equity attributable to shareholders in the parent company. Subsidiaries that due to materiality considerations have not been fully consolidated in MVV’s consolidated financial state-ments have been reported under other majority shareholdings.
Interests in associates and joint ventures are consolidated using the equity method.
Shareholdings in companies not included by way of full con-solidation or by application of the equity method have been accounted for pursuant to IAS 39.
Receivables and liabilities between consolidated companies are offset against each other, as are income and expenses. Material intercompany results have also been eliminated.
Scope of consolidation and changes in scope of consolidationIn addition to MVV Energie AG, all material German and foreign subsidiaries in which MVV Energie AG directly or indirectly holds a majority of the voting rights have been included in MVV’s consolidated statements. Furthermore, subsidiaries at which contractual provisions result in control by MVV are included in the consolidated financial statements irrespective of whether MVV holds a majority of voting rights.
Scope of consolidation
Number of companiesFully consolidated
companiesCompanies
recognised at equity
30 September 2017 163 34
Additions 34 6
Disposals 25 3
30 September 2018 172 37
The acquired fully consolidated companies involve project companies acquired at the Juwi subgroup, the takeover of an existing energy from waste plant in Dundee/Scotland and a biogas plant in Dresden. The additions to fully consolidated companies also include newly founded companies – mainly project companies at the Juwi and Windwärts subgroups – and additions resulting from a change in the status of other majority shareholdings. The fully consolidated companies thereby added did not lead to any material changes in MVV’s net asset, financial and earnings situation. Disposals of fully consolidated companies mostly relate to mergers at the Juwi and Energieversorgung Offenbach subgroups.
The changes in companies recognised at equity also mainly relate to the Juwi subgroup. These involve sales and additions resulting from changes of status due to sales of shares.
Currency translationForeign currency transactions are recognised at the spot rate applicable at the time the consolidated companies executed the transaction. Monetary assets and liabilities stated in foreign currencies are translated at each balance sheet date at the rate valid on the balance sheet date. Currency translation dif-ferences are recognised either within operating earnings or in the financial result in line with their respective allocation.
Annual financial statements of foreign group companies are translated into euros (the reporting currency of the Group) in accordance with the functional currency concept and using the modified reporting date method. MVV determines the functional currency for each of its companies.
Notes to Consolidated Financial Statements | CONSOLIDATED FINANCIAL STATEMENTS
133
Annual Report 2018 | MVV

Assets and liabilities are translated from their respective national currencies into euros at the mean exchange rate valid on the balance sheet date. Income and expense items are translated using annual average exchange rates. Currency differences resulting from the use of different exchange rates for the balance sheet and the income statement are recognised directly in equity under accumulated other comprehensive income (currency translation differences).
Currency translation has been based on the following main exchange rates:
Currency translation
Reporting date rate Average rate
1 Euro
30 Sep 2018
30 Sep 2017
1 Oct 2017 to
30 Sep 2018
1 Oct 2016 to
30 Sep 2017
Czech crown (CZK) 25.731 25.981 25.591 26.671
British pound (GBP) 0.887 0.882 0.885 0.872
US dollar (USD) 1.158 1.181 1.190 1.105
South African rand (ZAR) 16.445 15.944 15.570 14.783
Source: European Central Bank
Accounting policiesAssets and liabilities are measured at amortised cost in all cases with the exception of certain assets, liabilities and derivative financial instruments which IAS 39 and IFRS 13 require to be measured at fair value where this can be reliably determined. Non-current receivables and debt are recognised at fair value. Assets and liabilities are netted where the relevant require-ments are met. Income and expenses derived from assets and liabilities are recognised under earnings from operations or in the financial result depending on the respective balance sheet item. Period deferrals are accounted for where necessary. Items are recognised directly in equity where International Accounting Standards so require and are presented separately in the statement of changes in equity.
The underlying principles of recognition and measurement applied when preparing MVV’s consolidated financial state-ments are set out below.
Intangible assetsIntangible assets were mainly acquired in return for payment and are carried at cost, reduced where appropriate by subsidies received. They are subject to straight-line amortisation based on their pattern of consumption. Useful lives are based on economic aspects or contract terms and range between 1 and 50 years. With the exception of goodwill, there are no intangible assets with useful lives classified as indefinite. Where MVV has to purchase CO2 emission rights with holding periods longer than one year, these are recognised as intangible assets at cost. Rights allocated free of charge are recognised at Euro 0. As the CO2 emission rights constitute non-amortisable assets, they are not subject to amortisation, but nevertheless reduced by any impairment losses arising pursuant to IAS 36.
Property, plant and equipmentProperty, plant and equipment is stated at cost, less propor-tionate depreciation to account for the decline in value of the assets. In the case of internally generated property, plant and equipment, the costs of manufacture are based on allocable direct costs and a commensurate share of directly allocable overhead expenses. Borrowing costs are recognised as a com-ponent of costs when they can be directly attributed to the acquisition or manufacture of a qualifying asset. Such costs are recognised as soon as the asset in question requires a signifi-cant period of time to be prepared for its intended use or sale. During the commissioning phase, the net balance of income and expenses incurred is capitalised. Income in excess of the expenses incurred is recognised not as a reduction to cost, but through profit or loss.
Notes to Consolidated Financial Statements | CONSOLIDATED FINANCIAL STATEMENTS
134
Annual Report 2018 | MVV

The cost of assets is reduced by public subsidies received (investment grants). Public subsidies are recognised when it is sufficiently certain that these will be granted and the relevant conditions have been met. Investment grants relate exclusively to asset-based subsidies. These grants are reported separately from investments in the non-current asset schedule.
Items of property, plant and equipment are subject to straight- line depreciation consistent with their pattern of consumption. Depreciation is undertaken pro rata temporis in the year of addition. Scheduled depreciation is based on the following useful lives:
Useful lives in years
Buildings 3 – 100
Technical equipment and machinery 2 – 50
Transmission grids 2 – 69
Plant and operating equipment 1 – 50
MVV leases specific items of property, plant and equipment (leased items). Lease contracts for items of property, plant and equipment in which MVV bears the main risks and rewards resulting from ownership of the leased item are classified as finance leases. Assets in connection with finance leases are capitalised at the beginning of the lease term at the lower of the fair value of the leased item and the present value of the minimum leasing payments, with equivalent lease liabilities being recognised under non-current and current liabilities.
Each leasing instalment is divided into its respective interest and principal components in such a way that the lease liabili-ties charge consistent interest. The interest component of the leasing instalment is expensed in the income statement. Items of property, plant and equipment governed by finance leases are depreciated over the shorter of their economic useful life or the term of the lease.
Investment propertiesInvestment properties are measured at amortised cost. In the context of impairment tests, their fair values are regularly determined by way of independent surveys. As these do not constitute observable market prices, measurement is allocable to Level 3 of the IFRS 13 measurement hierarchy.
Impairment of intangible assets, property, plant and equipment and investment propertiesThe carrying amounts of intangible assets, property, plant and equipment and investment properties are assessed for indications of impairment at each balance sheet date. An impairment test pursuant to IAS 36 is performed if there are any such indications. Goodwill and intangible assets with indefinite useful lives are not subject to scheduled amortisa-tion, but are rather tested for impairment at least once a year. This also applies when changes in circumstances or indications of impairment arise.
Where the carrying amount of an asset is higher than its recoverable amount (the higher of its fair value less disposal costs or its value in use), the carrying amount is written down to the recoverable amount. The fair value represents the best estimate of the recoverable amount. The recoverable amounts must be determined for each individual asset, unless the asset does not generate any largely independent cash flows. In this case, the amount should be stated for which an independent third party would acquire the cash generating unit at the balance sheet date. The fair values/values in use of the cash generating units are determined based on the cash flow fore-casts approved by the management and supervisory bodies of MVV Energie AG. Such cash flow forecasts are based on experience and results in previous financial years, as well as on expectations as to future market developments. They refer to the expected development in key macroeconomic figures derived from economic and financial studies.
Notes to Consolidated Financial Statements | CONSOLIDATED FINANCIAL STATEMENTS
135
Annual Report 2018 | MVV

Key assumptions used in the forecasts concern the develop-ment in the price of crude oil, natural gas and coal on the global markets, the price of electricity and gas on wholesale and end consumer markets and the development in market shares and the relevant regulatory framework.
The cash flow forecasts cover a detailed budgeting period of three years. Figures for subsequent financial years are based on an extrapolation of the results of the final financial year in the detailed budget period. Reference is made to current estimates of growth rates. These growth rates correspond to the average long-term growth rates in the markets in which the companies operate and are consistent with external sources of information concerning market expectations. Impairment losses are recognised when the recoverable amount of the asset falls short of its carrying amount. Where the recoverable amount exceeds the carrying amount in subsequent periods, the assets are written up to a maximum of amortised cost.
Goodwill is not written up. Should the carrying amount of a cash generating unit to which goodwill has been allocated exceed its recoverable amount, then the goodwill thereby allocated is written down first. Any further write-down require-ment is then accounted for by means of a prorated reduction in the carrying amounts of the other assets at the cash gener-ating unit. However, assets are not written down below their respective present values.
Receivables and other assetsReceivables and other assets include trade receivables, other receivables and assets and tax receivables. Apart from deriva-tive financial instruments, these are measured at amortised cost. Initial measurement is carried out as of the performance date. Any write-downs required are based on the expected level of default risk. The values of receivables are generally corrected by means of a write-down account.
Trade receivables include accruals/deferrals to cover energy and water sales not yet read or invoiced as of the balance sheet date. Part-payments made in the context of annual consump-tion invoicing are deducted from the receivables. Default risks existing at the balance sheet date are covered by adequate write-downs. Receivables are derecognised immediately upon becoming uncollectible. The carrying amounts reported are basically equivalent to their respective fair values.
CO2 emission rights with remaining terms of less than a year and requiring purchase or exchange by MVV are recognised at cost as other assets, while rights allocated free of charge have been recognised at Euro 0.
InventoriesInventories consist of raw materials and supplies, unfinished and finished products and services and project rights, advance payments made for such and commodity trading assets. They are measured at the lower of cost or net sale value. The com-modity trading assets are measured at fair value less disposal costs. Cost of acquisition or manufacture for raw materials is calculated using the average cost method. The manufacturing costs of unfinished and finished products and services and project rights comprise production-related full costs. These con-sist of allocable direct costs and a commensurate share of the material and production overheads required based on normal capacity utilisation rates. Risks resulting from any impairment in utility are accounted for with suitable deductions.
Cash and cash equivalentsCash and cash equivalents consist of cash on hand and credit balances at banks with original terms of less than three months.
Notes to Consolidated Financial Statements | CONSOLIDATED FINANCIAL STATEMENTS
136
Annual Report 2018 | MVV

Non-current assets and liabilities held for saleNon-current assets which can be sold in their current state and whose sale is highly probable are recognised as non-current assets held for sale. Liabilities due to be dispensed with in a transaction together with assets are reported separately as liabilities held for sale.
Unless the relevant specific standards are applicable, non- current assets held for sale are no longer subject to scheduled depreciation and amortisation. Unless stipulated in another standard, they are measured at fair value less expected dis-posal costs, where this is lower than the carrying amount. Gains or losses resulting from the measurement of individual non-current assets held for sale or disposal groups are recog-nised under earnings from continuing operations until their ultimate disposal. Any losses resulting from the measurement of discontinued operations at fair value less disposal costs are recognised as earnings from discontinued operations.
Deferred taxesDeferred taxes are stated for temporary differences between the tax balance sheets and IFRS balance sheets at individual companies arising from the measurement of assets and liabilities for tax purposes on the one hand and for external IFRS accounting on the other, as well as from consolidation processes impacting on earnings. Moreover, deferred tax assets are also recognised for tax reduction claims resulting from the expected utilisation in subsequent years of existing losses carried forward. Such claims are capitalised if the utilisation of these losses carried forward is certain within a five-year forecast horizon based on existing business plans. Deferred
taxes are calculated based on the tax rates valid or expected at the individual organisational units upon realisation. Account is taken of the tax regulations valid or already adopted at the balance sheet date.
ProvisionsProvisions are recognised for all legal or constructive obliga-tions to third parties at the balance sheet date as a result of past events, when it is probable that a future outflow of resources will be required to settle the obligations and the amounts can be reliably estimated. Provisions are recognised at their expected performance amounts and are not netted with refund claims. Provisions based on a large number of events of the same nature are recognised at the expected value of the potential results.
All non-current provisions are recognised at their expected per-formance amounts as of the balance sheet date. Non-current provisions are discounted.
Financial instruments Primary financial instruments: Loans, securities, trade receiv-ables, other cash receivables and cash and cash equivalents are measured at fair value upon addition, taking due account of transaction costs. Upon subsequent measurement, financial assets are recog-nised either at fair value or at amortised cost. The subsequent measurement of financial assets in the “financial assets avail-able for sale” category is generally based on their fair values.
Notes to Consolidated Financial Statements | CONSOLIDATED FINANCIAL STATEMENTS
137
Annual Report 2018 | MVV

Pursuant to IAS 39, changes in fair values are recognised directly in equity, taking due account of deferred taxes. Upon disposal, these changes are recognised through profit or loss. The asset is written down through profit or loss if there are any objective indications of impairment. Permanent recoveries in value are recognised with write-ups to amortised cost. Assets whose fair values cannot be reliably estimated are measured at amortised cost. The subsequent measurement of financial assets in the “loans and receivables” and “financial instruments held to maturity” categories is based on amortised cost, with application of the effective interest method where appropriate. The amortised cost of a financial asset is equivalent to the fair value of the consideration provided, adjusted to account for impairments, interest payments and principal repayments. Impairment losses are recognised for any identifiable risks, especially those resulting from expected payment defaults or reductions in expected cash flows. Impairment losses are charged directly to period earnings.
Purchases and sales of financial assets executed on customary market terms are recognised on the date of the transaction, i.e. on the date on which the company assumed the liability to purchase or sell the assets. Purchases and sales executed on customary market terms require transfer of the assets within a period determined by market regulations or conventions.
The fair values of financial instruments traded on organised markets are determined by reference to the bid prices listed on the stock market on the balance sheet date. The fair values of financial instruments for which there is no active market are estimated with due application of valuation techniques. These methods are based on recent transactions performed on customary market terms, on the current value of other instruments which are essentially the same instruments, on analysis of discounted cash flows or on option price models. Pursuant to IFRS 13, due account is also taken of market and credit risks when determining fair values.
Financial assets are retired when the contractual rights to cash flows from the asset expire or when the financial asset is trans-ferred, provided that all principal risks and rewards relating to ownership of the asset are also transferred and the power to dispose over the asset has been ceded.
Financial debt, trade payables and other financial liabilities are measured at amortised cost, with application of the effective interest method where appropriate. In the case of financial debt, cost is equivalent to the amount disbursed. In the case of trade payables and other liabilities, cost is equivalent to the fair value of the consideration received.
Financial liabilities are retired when the underlying obligation has been met, terminated or has expired.
No use is made of the fair value option.
Derivative financial instruments: Derivative financial instru-ments particularly include interest rate and currency deriva-tives, as well as commodity derivatives, in this case mainly for electricity, gas, coal and CO2. Derivative financial instruments are measured at fair value both upon initial recognition and in subsequent periods and are reported under other assets or other liabilities. The amounts recognised are derived from market values or using recognised valuation methods (present value method or option pricing models based on current market parameters). In particular, certain long-term energy contracts and interest rate derivatives are, where no market prices are available, measured using recognised valuation methods based on internal fundamentals. Changes in the value of interest rate and currency derivatives relating to operations are recog-nised as income or expenses under earnings from operations or in the financial result. Changes in the value of all other
Notes to Consolidated Financial Statements | CONSOLIDATED FINANCIAL STATEMENTS
138
Annual Report 2018 | MVV

derivative financial instruments are recognised as income or expenses under other operating income and expenses. Derivatives deployed in cash flow hedges have to be treated separately. Where they additionally meet IAS 39 hedge account-ing requirements, changes in the fair value of the effective portion of the hedging instrument are recognised directly in equity under fair value measurement of financial instruments. When the underlying transaction is recognised in the income statement, the hedging instrument is also recognised through profit or loss and thus compensates for the impact of the underlying transaction. Alongside cash flow hedge accounting, risks may also be hedged with fair value hedges. Here, changes in the fair values of derivatives serving to hedge a fair value and eligible to be qualified as fair value hedges are recognised through profit or loss at the same time as the risk thereby hedged. For fair value hedges, changes in the value of primary financial instruments arising due to exchange rate movements may additionally be hedged by the currency-related changes in other primary financial instruments or currency derivatives.
Pending transactions intended to secure market prices in the field of energy trading fall within the scope of IAS 39 and are recognised as derivative financial instruments, while the hedged items (sales contracts) are generally not covered by IAS 39. The accounting treatment under IAS 39 relates in par-ticular to commodities futures transactions. To limit volatility, application is made of the own use exemption or of cash flow hedge accounting, particularly in the electricity and gas businesses.
For closed foreign currency positions, fair value hedges are designated and recognised in accordance with fair value hedge accounting requirements.
Interest rate risks are limited by drawing in particular on interest swaps. These instruments secure the cash flow from financial liabilities with floating interest rates by means of cash flow hedges.
Discretionary decisions in the application of accounting policiesDiscretionary decisions have to be made when applying the accounting policies. This has not had any material influence on the values of the assets and liabilities reported in the financial statements.
Measurement uncertaintiesThe preparation of consolidated financial statements in accordance with IFRS requires assets and liabilities to be measured. Here, it is also necessary to make assumptions and estimates which could impact on the values stated for the assets and liabilities, income and expenses thereby recognised and the disclosure of contingent liabilities.
The following section provides information on the most important forward-looking assumptions and other major sources of uncertainty involved in estimates made at the balance sheet date, as a result of which there is a risk that a material adjustment will be required in the carrying amounts of assets and liabilities in the next financial year.
The fair values of assets and liabilities and the useful lives of assets have been determined on the basis of management assessment. The same applies to the calculation of any impair-ments of assets.
Notes to Consolidated Financial Statements | CONSOLIDATED FINANCIAL STATEMENTS
139
Annual Report 2018 | MVV

The impairment test performed on goodwill and assets requires an estimation of the recoverable amount of the cash generating unit to which the goodwill or asset is allocated. The recoverable amount is primarily calculated on the basis of the value in use of the cash generating unit. In special indi-vidual cases, it is calculated based on the fair value of the cash generating unit. For the impairment test, reference is made to the higher of the two values. To estimate the value in use, MVV has to estimate the cash flow surpluses expected to be generated by the cash generating unit in future and further-more to select an appropriate discount rate to calculate the present value of the cash flow. All assumptions and estimates are based on circumstances and assessments at the balance sheet date or at the date during the financial year on which event-specific impairment becomes necessary. Any deviation in underlying conditions could result in differences arising between such estimates and actual values. Appropriate amend-ments are made in such cases to the assumptions and if need be to the carrying amount of the goodwill and assets.
Moreover, assumptions also have to be made when calcu-lating actual and deferred taxes. In particular, the possibility of generating corresponding future taxable income plays a key role in the assessment as to whether it will be possible to use deferred taxes.
The uncertainties arising when measuring the provisions to be recognised are countered with the best possible estimates. Among other methods, the calculations have also been based on probability considerations.
The measurement of sales and cost of materials is dependent on estimates to the extent that consumption deferrals have been undertaken as of the balance sheet date for trade receiv-ables and payables already incurred but not yet invoiced.
Compensation liabilities for partnerships are recognised at prorated fair value. This is determined by compiling a company valuation, taking due account of current budgets and the yield curve.
When assessing measurement uncertainties, reference is always made to the best information available concerning circumstances at the balance sheet date. Actual amounts may differ from estimates. The carrying amounts recognised in the financial statements which are subject to these uncer-tainties have been stated in the balance sheet and the accom-panying information provided in the notes.
The amendments made to estimates in the 2018 financial year due to IAS 8 did not lead to any notable adjustments in the relevant income, expenses, assets or liabilities.
Notes to Consolidated Financial Statements | CONSOLIDATED FINANCIAL STATEMENTS
140
Annual Report 2018 | MVV

NOTES TO INCOME STATEMENT
1. Sales after electricity and natural gas taxesSales include all revenues generated by the typical business activities of the Group. They are recognised upon the transfer of significant risks and rewards to customers or upon perfor-mance of the respective services, provided that receipt of the payment can reliably be expected. The composition of sales broken down into individual segments can be found in Segment Reporting in Note 36.
MVV’s main products are electricity, heating energy, gas, water and waste incineration and disposal. Furthermore, the Group generates substantial sales from services and from solar and wind power project development services.
External sales by products are structured as follows:
Sales by product group
Euro 000s FY 2018 FY 2017
Electricity 2,094,628 2,147,090
Heating energy 359,409 371,210
Gas 547,945 647,841
Water 86,988 87,405
Other sales 813,790 755,970
3,902,760 4,009,516
Other sales mainly include sales from project development services and customer-specific construction contracts.
In group currency, sales at our foreign subsidiaries amounted to Euro 206,095 thousand (previous year: Euro 230,122 thousand). The reduction in this share of sales is chiefly due to the lower number of projects realised abroad.
Customer-specific construction contracts are recognised at percentage of completion. This means that prorated sales and the cost of sales incurred are recognised at the percentage of completion, based on the contractual arrangements with the customers, reached by the balance sheet date and as soon as the results of the construction contract can be reliably estimated.
Percentage of completion is calculated on the basis of the project costs incurred by the balance sheet date as a propor-tion of the total costs of the project. In the balance sheet, the sales posted in line with percentage of completion are reduced by advance payments received and recognised under trade receivables. As soon as the result of a construction contract cannot be reliably estimated, the revenues from the contract are only recognised at the level of contract costs incurred and probably collectible. Losses on contracts are immediately expensed in full as soon as they are expected.
Mainly due to the lower number of projects realised, sales from customer-specific construction contracts fell to Euro 56,629 thousand (previous year: Euro 110,562 thousand).
2. Changes in inventoriesChanges in inventories mainly relate to unfinished projects and project rights.
3. Own work capitalisedOwn work capitalised relates above all to the construction and expansion of distribution grids.
4. Other operating income
Other operating income
Euro 000s FY 2018 FY 2017
Income from IAS 39 derivatives 264,399 205,514
Reversal of provisions 42,851 45,490
Income from sales of assets held for sale 30,802 –
Reversal of write-downs and receipts of receivables already retired 13,058 10,149
Exchange rate gains 5,428 4,035
Reimbursements of damages claims 5,400 7,692
Agency agreements and personnel supplies 4,836 4,952
Benefits to employees 4,185 3,815
Rental income 3,667 3,864
Income from emission rights 2,996 58
Credits and refunds 2,756 3,946
Income from sales of assets and write-ups 1,734 10,398
Miscellaneous 36,146 20,685
418,258 320,598
Notes to Income Statement | Notes to Consolidated Financial Statements | CONSOLIDATED FINANCIAL STATEMENTS
141
Annual Report 2018 | MVV

Other operating income particularly relates to positive meas-urement items for energy trading transactions requiring measurement under IAS 39. Measurement items relating to energy transactions are reported on a gross basis. This valua-tion-dependent income is offset by corresponding expenses.
The income from sales of assets held for sale resulted from the sale of the fibre optic network at MVV Energie AG and of assets relating to multi-utility contracts at MVV ImmoSolutions GmbH.
5. Cost of materials
Cost of materials
Euro 000s FY 2018 FY 2017
Raw materials, supplies and purchased goods 2,115,723 2,270,860
Procurement of wind turbines and solar power systems 285,650 253,461
Purchased services 556,388 554,422
2,957,761 3,078,743
Expenses for purchased services mainly relate to expenses for grid utilisation fees, concession duties, maintenance and repair expenses, disposal costs for residual waste and other third-party services.
6. Employee benefit expenses
Employee benefit expenses
Euro 000s FY 2018 FY 2017
Wages and salaries 345,592 341,935
Social security expenses and welfare expenses 57,838 57,307
Pension expenses 19,314 19,436
422,744 418,678
MVV had an annual average of 6,006 employees (previous year: 6,057). This total includes 10 executives (previous year: 10), 5,680 employees (previous year: 5,727), 281 trainees (previous year: 292) and 35 interns/students (previous year: 38). The executives are members of the management in key functions, i.e. authorised representatives and division heads at MVV Energie AG.
7. Other operating expenses
Other operating expenses
Euro 000s FY 2018 FY 2017
Expenses for IAS 39 derivatives 232,808 166,614
Expenses for advisory services 32,634 24,886
Contributions, fees and duties 31,990 33,685
Rental, leasehold and leasing expenses 22,759 21,523
Maintenance, repair and IT service expenses 21,844 19,083
Additions to write-downs and receivables defaults 14,511 21,217
Operating taxes (including energy taxes) 12,819 11,535
Employee benefit and welfare expenses 12,312 11,618
Public relations expenses 11,411 12,460
Personnel supplies 10,008 10,620
Facility management 7,344 7,048
Exchange rate losses 7,169 4,320
Service contracts 5,397 6,012
Losses incurred on sales of assets 4,025 3,930
Hospitality expenses 2,186 1,952
Office materials and specialist literature 1,744 2,261
Expenses for emission rights 203 6,099
Miscellaneous 28,159 43,278
459,323 408,141
Other operating expenses include negative measurement items for energy trading transactions requiring measurement under IAS 39. Measurement items relating to energy trading transactions are reported on a gross basis. These valuation- dependent expenses are countered by other operating income offsetting this item.
Notes to Income Statement | Notes to Consolidated Financial Statements | CONSOLIDATED FINANCIAL STATEMENTS
142
Annual Report 2018 | MVV

8. Income from companies recognised at equity and other income from shareholdings
Interests in associates and joint ventures are recognised initially at cost and subsequently at the amortised value of the prorated net assets. The carrying amounts are increased or reduced annually to account for prorated earnings, divi-dends paid and other changes in equity. Any goodwill thereby recognised is included in the value of the shareholding, rather than being reported separately. Impairment losses are recog-nised on the at-equity carrying amount when the recoverable amount falls short of the carrying amount. When the reasons for impairment losses previously recognised on the at-equity carrying amount no longer apply, the carrying amount is correspondingly written up through profit or loss. This does not apply to any goodwill previously written down.
Income from companies recognised at equity and other income from shareholdings
Euro 000s FY 2018 FY 2017
Income from companies recognised at equity – 110 11,942
Income from other shareholdings 1,144 1,873
Expenses/income from sales of financial assets – 11 – 207
1,023 13,608
The changes in the income from companies recognised at equity were mainly due to the amended inclusion of Beegy GmbH and the subsequent measurement of those companies on which MVV exercises significant influence.
9. Depreciation and amortisation
Depreciation and amortisation
Euro 000s FY 2018 FY 2017
Depreciation 180,680 182,748
of which impairment losses – 2,565
10. Financing income
Financing income
Euro 000s FY 2018 FY 2017
Income from currency translation in connection with financing activities 3,547 4,591
Interest income from finance leases 3,240 3,238
Interest income from current account, overnight and fixed-term deposits 774 1,122
Income from IAS 39 measurement 625 1,008
Other interest and similar income 4,391 4,665
12,577 14,624
11. Financing expenses
Financing expenses
Euro 000s FY 2018 FY 2017
Interest expenses from current account, non-current and current loans 35,627 40,239
Expenses from currency translation in connection with financing activities 3,654 6,380
Compounding of provisions 2,826 2,113
Expenses for IAS 39 measurement 1,705 2,521
Other interest and similar expenses 15,857 17,262
59,669 68,515
The other interest and similar expenses were reduced by Euro 3,127 thousand due to the capitalisation of borrowing interest (previous year: Euro 1,489 thousand). The assumed financing cost rate ranged from 1.4 % to 1.9 % in the financial year under report and amounted to 1.4 % in the previous year.
Notes to Income Statement | Notes to Consolidated Financial Statements | CONSOLIDATED FINANCIAL STATEMENTS
143
Annual Report 2018 | MVV

12. Taxes on income
Taxes on income
Euro 000s FY 2018 FY 2017
Actual taxes 72,163 54,168
Deferred taxes 5,126 18,967
77,289 73,135
Current tax expenses include trade tax and corporate income tax, including the solidarity surcharge, as well as foreign taxes on income.
The calculation of deferred taxes in Germany is based on tax rates applicable at individual companies. This tax rate results from the unchanged corporate income tax rate of 15 %, the unchanged solidarity surcharge of 5.5 % and the respectively applicable trade tax rate (currently 12 % to 16 %). The equivalent calculations for foreign companies are based on the respective national tax rates. Where the requirements of IAS 12 are met, deferred tax assets and liabilities are stated on a net basis for each company or fiscal unit.
The deferred tax expenses result from tax expenses of Euro 6,673 thousand (previous year: Euro 10,048 thousand) that are attributable to the change in the write-down on losses carried forward and to the recognition through profit or loss of losses carried forward, as well as from deferred tax income of Euro 1,547 thousand (previous year: expenses of Euro 8,919 thousand) attributable to the arising and/or reversal of temporary differences.
Actual tax expenses were reduced by Euro 1,348 thousand by using tax losses not previously recognised (previous year: Euro 3,172 thousand).
The following table presents the reconciliation of expected tax expenses with those actually reported. The tax rate appli-cable for the tax reconciliation amounts to 30.3 % (previous year: 30.3 %) and comprises the corporate income tax rate, the solidarity surcharge and an average trade tax rate of 14.5 % (previous year: 14.5 %).
Reconciliation of income tax expenses
Euro 000s FY 2018 FY 2017
Earnings before taxes (EBT) 209,702 205,620
Expected tax expenses based on tax rate of 30.3 % (previous year: 30.3 %) 63,540 62,303
Deviations resulting from trade tax assessment base 1,851 1,759
Deviations from expected tax rate – 3,076 1,985
Utilisation of losses carried forward, change in write-downs for losses and losses for which no deferred taxes are recognised 6,590 10,066
Non-deductible expenses 3,300 5,336
Tax-exempt income – 6,939 – 15,267
Income from shareholdings recognised at equity 4,725 991
Permanent differences – 7,220 3,635
Taxes for previous years 5,510 1,446
Goodwill impairments 10,212
Miscellaneous – 1,204 881
Effective tax expenses 77,289 73,135
Effective tax rate (%) 36.9 35.6
13. Share of earnings attributable to MVV Energie AG shareholders and earnings per share
Share of earnings attributable to MVV Energie AG shareholders and earnings per share
FY 2018 FY 2017
Share of earnings attributable to MVV Energie AG shareholders (Euro 000s) 130,002 121,340
Number of shares (weighted average in 000s) 65,907 65,907
Earnings per share (Euro) 1.97 1.84
Dividend per share (Euro) 0.90 0.90
The number of individual registered shares in MVV Energie AG amounts to 65,906,796.
The dividend for the 2018 financial year is consistent with the proposal made by the Executive and Supervisory Boards and requires approval by the Annual General Meeting on 8 March 2019. The proposal provides for the distribution of a dividend of Euro 59,316 thousand. The proposals for the amount of dividend and appropriation of earnings for the 2017 financial year were approved by the Annual General Meeting held on 9 March 2018. Accordingly, a dividend of Euro 59,316 thousand was distributed.
Notes to Income Statement | Notes to Consolidated Financial Statements | CONSOLIDATED FINANCIAL STATEMENTS
144
Annual Report 2018 | MVV
NOTES TO BALANCE SHEET
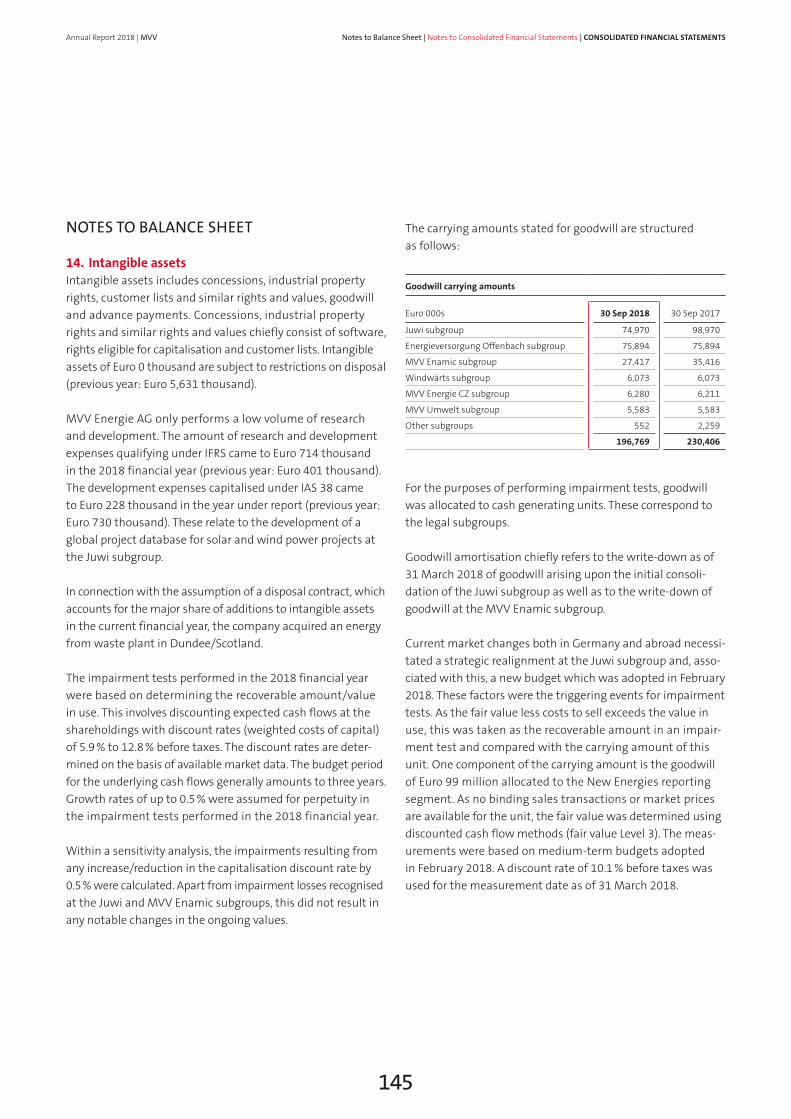
14. Intangible assetsIntangible assets includes concessions, industrial property rights, customer lists and similar rights and values, goodwill and advance payments. Concessions, industrial property rights and similar rights and values chiefly consist of software, rights eligible for capitalisation and customer lists. Intangible assets of Euro 0 thousand are subject to restrictions on disposal (previous year: Euro 5,631 thousand).
MVV Energie AG only performs a low volume of research and development. The amount of research and development expenses qualifying under IFRS came to Euro 714 thousand in the 2018 financial year (previous year: Euro 401 thousand). The development expenses capitalised under IAS 38 came to Euro 228 thousand in the year under report (previous year: Euro 730 thousand). These relate to the development of a global project database for solar and wind power projects at the Juwi subgroup.
In connection with the assumption of a disposal contract, which accounts for the major share of additions to intangible assets in the current financial year, the company acquired an energy from waste plant in Dundee/Scotland.
The impairment tests performed in the 2018 financial year were based on determining the recoverable amount/value in use. This involves discounting expected cash flows at the shareholdings with discount rates (weighted costs of capital) of 5.9 % to 12.8 % before taxes. The discount rates are deter-mined on the basis of available market data. The budget period for the underlying cash flows generally amounts to three years. Growth rates of up to 0.5 % were assumed for perpetuity in the impairment tests performed in the 2018 financial year.
Within a sensitivity analysis, the impairments resulting from any increase/reduction in the capitalisation discount rate by 0.5 % were calculated. Apart from impairment losses recognised at the Juwi and MVV Enamic subgroups, this did not result in any notable changes in the ongoing values.
The carrying amounts stated for goodwill are structured as follows:
Goodwill carrying amounts
Euro 000s 30 Sep 2018 30 Sep 2017
Juwi subgroup 74,970 98,970
Energieversorgung Offenbach subgroup 75,894 75,894
MVV Enamic subgroup 27,417 35,416
Windwärts subgroup 6,073 6,073
MVV Energie CZ subgroup 6,280 6,211
MVV Umwelt subgroup 5,583 5,583
Other subgroups 552 2,259
196,769 230,406
For the purposes of performing impairment tests, goodwill was allocated to cash generating units. These correspond to the legal subgroups. Goodwill amortisation chiefly refers to the write-down as of 31 March 2018 of goodwill arising upon the initial consoli-dation of the Juwi subgroup as well as to the write-down of goodwill at the MVV Enamic subgroup.
Current market changes both in Germany and abroad necessi-tated a strategic realignment at the Juwi subgroup and, asso-ciated with this, a new budget which was adopted in February 2018. These factors were the triggering events for impairment tests. As the fair value less costs to sell exceeds the value in use, this was taken as the recoverable amount in an impair-ment test and compared with the carrying amount of this unit. One component of the carrying amount is the goodwill of Euro 99 million allocated to the New Energies reporting segment. As no binding sales transactions or market prices are available for the unit, the fair value was determined using discounted cash flow methods (fair value Level 3). The meas-urements were based on medium-term budgets adopted in February 2018. A discount rate of 10.1 % before taxes was used for the measurement date as of 31 March 2018.
Notes to Balance Sheet | Notes to Consolidated Financial Statements | CONSOLIDATED FINANCIAL STATEMENTS
145
Annual Report 2018 | MVV

The goodwill write-down at the MVV Enamic subgroup was chiefly due to reduced earnings prospects following the sale of the GSW contract portfolio at this cash generating unit. Within the impairment test, the value in use was taken as the
recoverable amount and compared with the carrying amount of the MVV Enamic subgroup, which is allocated to the Cus-tomer Solutions reporting segment. The future value in use was determined using a discount rate of 6.4 % before taxes.
Intangible assets
Euro 000s
Concessions, industrial property
rights and similar rights and values
Goodwill
Advance payments
Total
Gross value at 1 October 2016 323,536 242,847 7,955 574,338
Change in scope of consolidation 2,193 4,919 128 7,240
Currency adjustments 55 363 – 418
Additions 5,733 – 2,869 8,602
Subsidy payments received – 78 – – – 78
Disposals – 1,168 – – – 1,168
Reclassifications 8,364 – – 7,437 927
Reclassifications pursuant to IFRS 5 – 4,318 – 4,892 – – 9,210
Gross value at 30 September 2017 334,317 243,237 3,515 581,069
Amortisation at 1 October 2016 – 210,419 – 12,738 – – 223,157
Currency adjustments – 68 – 93 – – 161
Scheduled amortisation – 15,237 – – – 15,237
Impairment losses – 771 – – – 771
Disposals 889 – – 889
Reclassifications pursuant to IFRS 5 2,432 – – 2,432
Amortisation at 30 September 2017 – 223,174 – 12,831 – – 236,005
Net value at 30 September 2017 111,143 230,406 3,515 345,064
Gross value at 1 October 2017 334,317 243,237 3,515 581,069
Currency adjustments 14 92 – 106
Additions 21,945 – 4,298 26,243
Disposals – 10,267 – – 34 – 10,301
Reclassifications 1,640 – – 1,455 185
Gross value at 30 September 2018 347,649 243,329 6,324 597,302
Amortisation at 1 October 2017 – 223,174 – 12,831 – – 236,005
Currency adjustments – 15 – 23 – – 38
Scheduled amortisation – 14,882 – – – 14,882
Impairment losses – – 33,706 – – 33,706
Disposals 3,252 – – 3,252
Amortisation at 30 September 2018 – 234,819 – 46,560 – – 281,379
Net value at 30 September 2018 112,830 196,769 6,324 315,923
Notes to Balance Sheet | Notes to Consolidated Financial Statements | CONSOLIDATED FINANCIAL STATEMENTS
146
Annual Report 2018 | MVV

15. Property, plant and equipment
Property, plant and equipment
Euro 000s
Land, leasehold rights and buildings,
including buildings on third-party land
Technical equipment and machinery
Other assets, plant and operating
equipment
Advance payments and construction
in progress
Total
Gross value at 1 October 2016 914,923 4,445,541 212,066 159,978 5,732,508
Change in scope of consolidation – 12 255 – 267
Currency adjustments 1,839 798 – 9 113 2,741
Additions 2,201 44,779 6,832 114,858 168,670
Subsidy payments received – 77 – 4,778 – 102 – – 4,957
Disposals – 8,536 – 61,927 – 9,534 – 633 – 80,630
Reclassifications 4,105 77,855 1,024 – 83,911 – 927
Reclassifications pursuant to IFRS 5 – – 2 – 29,467 – – 29,469
Gross value at 30 September 2017 914,455 4,502,278 181,065 190,405 5,788,203
Depreciation at 1 October 2016 – 404,304 – 2,634,815 – 154,081 – – 3,193,200
Currency adjustments – 1,983 – 4,043 – 35 – – 6,061
Scheduled depreciation – 23,103 – 130,322 – 11,521 – – 164,946
Write-ups – – 7,136 – 7,136
Impairment losses – – 1,794 – – – 1,794
Disposals 5,035 60,129 9,117 – 74,281
Reclassifications – 28 – 28 – –
Reclassifications pursuant to IFRS 5 – 2 15,748 – 15,750
Depreciation at 30 September 2017 – 424,355 – 2,710,815 – 133,664 – – 3,268,834
Net value at 30 September 2017 490,100 1,791,463 47,401 190,405 2,519,369
Gross value at 1 October 2017 914,455 4,502,278 181,065 190,405 5,788,203
Change in scope of consolidation – 500 154 – 654
Currency adjustments 483 236 – 1 – 46 672
Additions 10,528 47,829 7,714 182,691 248,762
Subsidy payments received – 10 – 5,854 – 81 – 316 – 6,261
Disposals – 1,423 – 24,019 – 10,310 – 3,217 – 38,969
Reclassifications 6,721 46,265 1,225 – 54,396 – 185
Gross value at 30 September 2018 930,754 4,567,235 179,766 315,121 5,992,876
Depreciation at 1 October 2017 – 424,355 – 2,710,815 – 133,664 – – 3,268,834
Currency adjustments – 479 – 944 – 10 – – 1,433
Scheduled depreciation – 24,455 – 131,105 – 10,238 – – 165,798
Disposals 1,355 19,926 10,155 – 31,436
Reclassifications 245 – 168 2 – 79 –
Depreciation at 30 September 2018 – 447,689 – 2,823,106 – 133,755 – 79 – 3,404,629
Net value at 30 September 2018 483,065 1,744,129 46,011 315,042 2,588,247
Notes to Balance Sheet | Notes to Consolidated Financial Statements | CONSOLIDATED FINANCIAL STATEMENTS
147
Annual Report 2018 | MVV

Property, plant and equipment up to an equivalent value of Euro 46 million (previous year: Euro 64 million) has been provided as security for financial debt. This involves land, buildings, technical equipment and machinery. Property, plant and equipment subject to restrictions on disposal amounts to Euro 119 million (previous year: Euro 128 million).
The reported subsidy payments received involve government grants received in the 2018 financial year chiefly in connection with urban planning measures for the distribution grid. There are no conditions that have not been met or other performance uncertainties in connection with these subsidy payments.
Apart from the construction of a gas-powered CHP plant in Kiel and an energy from waste plant in the UK, the largest additions to advance payments and construction in progress in the 2018 financial year also involved the connection of a CHP plant to the district heating grid in Mannheim.
16. Investment propertiesInvestment properties involve a piece of land let out in the USA. Rental income amounted to Euro 32 thousand in the financial year under report (previous year: Euro 34 thousand). Direct operating expenses came to Euro 0 thousand (previous year: Euro 0 thousand). The fair value of investment properties is at least equivalent to the carrying amount.
Investment properties
Euro 000s FY 2018 FY 2017
Gross value at 1 October 2,404 2,542
Currency adjustments 47 – 138
Gross value at 30 September 2,451 2,404
Depreciation at 1 October – –
Depreciation at 30 September – –
Net value at 30 September 2,451 2,404
17. Joint venturesMVV operates joint ventures with partners. In view of their size and influence on the Group, the following companies have been identified as material joint ventures:
Together with its shareholders, Uniper Kraftwerke GmbH and Stadtwerke Kiel AG, which is a subsidiary of MVV Energie AG, the company Gemeinschaftskraftwerk Kiel GmbH operates a hard coal-fired power plant in Kiel. Stadtwerke Kiel AG owns a 50 % share of the capital. All significant decisions have to be reached jointly by the shareholders.
Stadtwerke Ingolstadt is responsible for the energy supply in the Ingolstadt region. MVV Energie AG owns a 48.4 % share of the capital in Stadtwerke Ingolstadt Beteiligungen GmbH, which as the financial holding company pools several sub-sidiaries. All significant decisions have to be reached jointly by the shareholders.
The assets, liabilities, equity and sales, annual net income and other income and expenses at material joint ventures are presented in the following tables:
Notes to Balance Sheet | Notes to Consolidated Financial Statements | CONSOLIDATED FINANCIAL STATEMENTS
148
Annual Report 2018 | MVV

Statement of comprehensive income for material joint ventures
Euro 000s
Gemeinschaftskraftwerk Kiel GmbH, Kiel
Stadtwerke Ingolstadt Beteiligungen GmbH, Ingolstadt
Financial year Previous year Financial year Previous year
Sales excluding energy taxes 83,649 78,060 186,060 197,794
Scheduled depreciation and amortisation – 1,346 – 2,344 – 13,851 – 13,402
Interest income 2 10 99 106
Interest expenses – 4,936 – 4,840 – 1,112 – 1,127
Income tax expenses/income – 1,850 2,545 – 7,475 – 8,441
Annual net income 2,637 7,639 17,854 19,328
Other income and expenses – – – 5 95
Total comprehensive income for period 2,637 7,639 17,849 19,423
Dividends received from material joint ventures 767 767 9,025 9,135
Further key financial figures for material joint ventures
Euro 000s
Gemeinschaftskraftwerk Kiel GmbH, Kiel
Stadtwerke Ingolstadt Beteiligungen GmbH, Ingolstadt
Financial year Previous year Financial year Previous year
Assets 121,754 107,453 273,593 275,854
Non-current assets 6,804 8,136 231,451 223,500
Current assets 114,950 99,317 42,142 52,354
of which cash and cash equivalents 19,269 11,008 1,325 883
Equity and debt 121,754 107,453 273,593 275,903
Equity 24,081 22,978 65,787 66,584
Non-current provisions 57,794 56,301 5,232 5,053
Non-current debt and other liability items – – 99,462 121,474
of which non-current financial debt – – 26,366 43,168
Current provisions 30,414 25,981 301 58
Current debt and other liability items 9,465 2,193 102,811 82,734
of which current financial debt – – 72,128 58,928
Reconciliation of summarised key financial figures with carrying amounts of material joint ventures
Euro 000s
Gemeinschaftskraftwerk Kiel GmbH, Kiel
Stadtwerke Ingolstadt Beteiligungen GmbH, Ingolstadt
Financial year Previous year Financial year Previous year
Net assets at 1 October 22,978 16,873 66,584 66,036
Profit/loss for period 2,637 7,639 17,854 19,328
Distribution – 1,534 – 1,534 – 18,646 – 18,875
Other income and expenses – – – 5 95
Net assets at 30 September 24,081 22,978 65,787 66,584
Group share of net assets 12,041 11,489 31,841 32,227
Other items 322 322 – 154 – 154
Goodwill – – 53,759 53,759
Carrying amount of interest in joint ventures 12,363 11,811 85,446 85,832
Notes to Balance Sheet | Notes to Consolidated Financial Statements | CONSOLIDATED FINANCIAL STATEMENTS
149
Annual Report 2018 | MVV

The aggregate profit/loss, total comprehensive income and carrying amounts of non-material joint ventures are presented in the following table:
Summarised key financial figures for non-material joint ventures
Euro 000s Financial year Previous year
Profit/loss for period 9,806 – 4,657
Total comprehensive income for period 9,806 – 4,657
Carrying amount of interest in non-material joint ventures 44,897 34,301
18. AssociatesGiven its size and its influence on the Group, Grosskraftwerk Mannheim AG has been identified as a material associate.
Grosskraftwerk Mannheim AG operates what is one of Europe’s most efficient hard coal-fired power plants in Mannheim. Overall, MVV owns a 28 % share of the capital in this company. Grosskraftwerk Mannheim AG is a power plant jointly owned by the following shareholders: RWE Generation SE, Essen, EnBW Energie Baden-Württemberg AG, Karlsruhe, and MVV RHE GmbH, Mannheim. Due to its positions on the supervisory board and its votes at the annual general meeting, MVV RHE GmbH exercises significant influence on this company. The assets, liabilities, equity, sales, annual net income and other income and expenses of Grosskraftwerk Mannheim AG are as follows:
Statement of comprehensive income for material associates
Euro 000s
Grosskraftwerk Mannheim AG, Mannheim
Financial year Previous year
Sales excluding energy taxes 509,634 524,745
Scheduled depreciation and amortisation – 97,071 – 97,105
Interest expenses – 64,709 – 65,801
Income tax income 116 1
Annual net income – 62,574 – 4,662
Other income and expenses 51,330 – 41,019
Total comprehensive income for period – 11,244 – 45,681
Dividends received from material associates – –
Further key financial figures for material associates
Euro 000s
Grosskraftwerk Mannheim AG, Mannheim
Financial year Previous year
Assets 1,985,979 2,081,990
Non-current assets 1,817,686 1,919,335
Current assets 168,293 162,655
of which cash and cash equivalents 1,879 216
Equity and debt 1,985,979 2,081,990
Equity 116,029 127,273
Non-current provisions 629,536 705,497
Non-current debt and other liability items 228,972 1,105,856
of which non-current financial debt 154,000 1,035,000
Current provisions 73,761 79,796
Current debt and other liability items 937,681 63,568
of which current financial debt 876,280 30,285
Reconciliation of summarised key financial figures with carrying amounts of material associates
Euro 000s
Grosskraftwerk Mannheim AG, Mannheim
Financial year Previous year
Net assets at 1 October 127,273 172,954
Profit/loss for period – 62,574 – 4,662
Distribution – –
Other income and expenses 51,330 – 41,019
Other Group adjustments – –
Net assets at 30 September 116,029 127,273
Group share of net assets 32,488 35,636
Other items 1,897 1,897
Carrying amount of investment in associates 34,385 37,533
Notes to Balance Sheet | Notes to Consolidated Financial Statements | CONSOLIDATED FINANCIAL STATEMENTS
150
Annual Report 2018 | MVV

The aggregate profits, total comprehensive income and carrying amounts of non-material associates are presented in the following table:
Summarised key financial figures for non-material associates
Euro 000s Financial year Previous year
Profit/loss for period 1,992 4,333
Total comprehensive income for period 1,992 4,333
Carrying amount of investment in non-material associates 12,422 10,538
Other comprehensive income at material associates includes items resulting from the measurement of pension obligations and currency translation differences.
The income from shareholdings collected by MVV from asso-ciates amounted to Euro 4,852 thousand in the 2018 financial year (previous year: Euro 1,366 thousand).
MVV’s share of the contingent liabilities of companies meas-ured at equity amounted to Euro 1,568 thousand (previous year: Euro 1,042 thousand).
The joint venture Gemeinschaftskraftwerk Kiel GmbH and associate Gross kraftwerk Mannheim AG have financial years ending on 31 December, and thus deviating from MVV’s financial year. Their results have been recognised at the Group accordingly. As both these companies involve power plants whose costs are fully reimbursed and whose annual net income and distributions remain constant, the deviating balance sheet date does not have implications for MVV. As in the previous year, no publicly listed market prices were available.
19. Subsidiaries with non-controlling interests of material significance to the Group
Given their size and their influence on the Group, the follow-ing companies have been identified as material subsidiaries: Stadtwerke Kiel AG, Kiel, Energieversorgung Offenbach AG, Offenbach am Main, and Juwi AG, Wörrstadt.
The statements of comprehensive income and further key financial information concerning the non-controlled interests in the companies are presented in the following tables.
The figures stated represent amounts prior to consolidation.
Statement of comprehensive income for non-controlled interests in Energieversorgung Offenbach AG
Euro 000s1 Oct 2017 to
30 Sep 20181 Oct 2016 to
30 Sep 2017
Sales excluding energy taxes 312,318 344,982
Annual net income 17,573 13,637
Other income and expenses 451 2,364
Total comprehensive income for period 18,024 16,001
Total comprehensive income attributable to non-controlling interests 9,012 8,000
Dividends paid (to non-controlling shareholders) 5,468 5,288
Further key financial figures for non-controlled interests in Energieversorgung Offenbach AG
Euro 000s 30 Sep 2018 30 Sep 2017
Assets 366,392 345,315
Non-current assets 292,814 285,440
Current assets 73,578 59,875
of which cash and cash equivalents 12,597 14,418
Equity and debt 366,392 345,315
Equity 158,650 151,563
Non-current provisions 33,151 33,466
Non-current debt and other liability items 95,588 107,213
of which non-current financial debt 59,974 72,707
Current provisions 7,759 7,523
Current debt and other liability items 71,244 45,550
of which current financial debt 21,983 1,483
Notes to Balance Sheet | Notes to Consolidated Financial Statements | CONSOLIDATED FINANCIAL STATEMENTS
151
Annual Report 2018 | MVV

Statement of comprehensive income for non-controlled interests in Stadtwerke Kiel AG
Euro 000s1 Oct 2017 to
30 Sep 20181 Oct 2016 to
30 Sep 2017
Sales excluding energy taxes 650,892 715,580
Annual net income 29,235 16,035
Other income and expenses 53 2,002
Total comprehensive income for period 29,288 18,037
Total comprehensive income attributable to non-controlling interests 14,351 8,838
Dividends paid (to non-controlling shareholders) 9,629 4,802
Further key financial figures for non-controlled interests in Stadtwerke Kiel AG
Euro 000s 30 Sep 2018 30 Sep 2017
Assets 780,949 647,105
Non-current assets 635,817 571,760
Current assets 145,132 75,345
of which cash and cash equivalents 48,201 17,426
Equity and debt 780,949 647,105
Equity 240,718 215,424
Non-current provisions 24,082 29,626
Non-current debt and other liability items 350,483 295,253
of which non-current financial debt 305,664 253,585
Current provisions 10,617 11,464
Current debt and other liability items 155,049 95,338
of which current financial debt 36,136 28,910
Statement of comprehensive income for non-controlled interests in Juwi AG
Euro 000s1 Oct 2017 to
30 Sep 201818 Dec 2016 to
30 Sep 2017
Sales excluding energy taxes 248,826 33,990
Annual net income 14,863 – 27,345
Other income and expenses – 66 92
Total comprehensive income for period 14,797 – 27,253
Total comprehensive income attributable to non-controlling interests 5,457 – 10,051
Dividends paid (to non-controlling shareholders) – –
Further key financial figures for non-controlled interests in Juwi AG
Euro 000s 30 Sep 2018 30 Sep 2017
Assets 314,893 249,118
Non-current assets 103,602 82,937
Current assets 211,291 166,181
of which cash and cash equivalents 27,234 26,375
Equity and debt 314,893 249,118
Equity 138,875 96,904
Non-current provisions 4,695 597
Non-current debt and other liability items 36,753 84,030
of which non-current financial debt 36,614 83,801
Current provisions 37,306 5,071
Current debt and other liability items 97,264 62,516
of which current financial debt 60,462 58,379
Total non-controlled interests in subsidiaries amounted to Euro 244,787 thousand in the period under report, of which Euro 117,867 thousand related to Stadtwerke Kiel AG, Kiel, Euro 60,710 thousand to Energieversorgung Offenbach AG, Offenbach am Main, Euro 38,927 thousand to Juwi AG, Wörr-stadt, and Euro 27,286 thousand to non-material subsidiaries.
Notes to Balance Sheet | Notes to Consolidated Financial Statements | CONSOLIDATED FINANCIAL STATEMENTS
152
Annual Report 2018 | MVV

20. Other financial assetsWrite-downs and the development in other financial assets are reported in the following table, as well as under income from companies recognised at equity and other income from shareholdings (Note 8), financing income (Note 10) and financing expenses (Note 11).
Other financial assets
Euro 000sOther majority shareholdings
Other shareholdings
Loans in connection with finance leases
General loans and securities
Total
Gross value at 1 October 2016 1,347 7,240 42,458 7,305 58,350
Change in scope of consolidation – – – 6,595 6,595
Currency adjustments 16 – 1 – – 15
Additions 90 528 4,109 10,107 14,834
Disposals – 68 – 495 – – 17,847 – 18,410
Reclassifications – – – 3,052 – 390 – 3,442
Gross value at 30 September 2017 1,385 7,272 43,515 5,770 57,942
Amortisation at 1 October 2016 – 492 – 845 – 33 – – 1,370
Currency adjustments – 18 – – – – 18
Impairment losses – 5 – 8 – – – 13
Amortisation at 30 September 2017 – 515 – 853 – 33 – – 1,401
Net value at 30 September 2017 870 6,419 43,482 5,770 56,541
Gross value at 1 October 2017 1,385 7,272 43,515 5,770 57,942
Currency adjustments 6 2 – – 8
Additions 242 67 229 1,073 1,611
Disposals – 212 – 870 – – 79 – 1,161
Reclassifications – 7 – 379 156 – 216
Gross value at 30 September 2018 1,421 6,478 43,365 6,920 58,184
Amortisation at 1 October 2017 – 515 – 853 – 33 – – 1,401
Currency adjustments – 4 – – – – 4
Disposals 30 853 – – 883
Amortisation at 30 September 2018 – 489 – – 33 – – 522
Net value at 30 September 2018 932 6,478 43,332 6,920 57,662
Notes to Balance Sheet | Notes to Consolidated Financial Statements | CONSOLIDATED FINANCIAL STATEMENTS
153
Annual Report 2018 | MVV

Other financial assets comprise other majority shareholdings, other shareholdings, receivables in connection with finance leases and loans. These items are measured and categorised as follows:
Other majority shareholdings and other shareholdings are measured at amortised cost, corrected where necessary to account for impairments due to cash flows falling short of expectations or default risks materialising. The other share-holdings recognised under other financial assets involve minority shareholdings, associates and joint ventures not included in MVV’s consolidated financial statements due to materiality considerations.
The loans included in this line item are classified under loans and receivables, and the respective values are recognised at amortised cost, while leasing receivables are classified under leases. Finance leases are recognised as receivables in the amount of the present value of the minimum leasing payments (net investment value). Loans and leasing receivables have fixed interest rates, with an average interest rate of 4.4 % (pre-vious year: 4.2 %). The average period for which interest rates remain fixed amounts to 5.7 years in the case of fixed-interest loans (previous year: 6.7 years) and to 6.6 years in the case of finance leases (previous year: 6 years). Reclassifications mainly involve reclassifications of the aforementioned items to current financial assets in line with their respective maturities.
Default risks identifiable for financial assets are accounted for with write-downs recognised under income from shareholdings or in the financial result.
Further information about financial instruments can be found in Note 35.
As in the previous year, there were no restrictions on disposal or other encumbrances. Other financial assets also include the non-current share of finance leases. In several contracting projects, MVV acts as lessor in the context of finance lease agreements. The recon-ciliation of the present value of minimum leasing payments with gross investments in leases is as follows:
Reconciliation
Euro 000s 30 Sep 2018 30 Sep 2017
Present value of minimum leasing payments with maturities < 1 year 7,260 6,842
Present value of minimum leasing payments with maturities > 1 year
1 to 5 years 23,928 22,677
longer than 5 years 19,455 22,076
Present value of minimum leasing payments with maturities > 1 year 43,383 44,753
Total present value of minimum leasing payments 50,643 51,595
Financing income not yet realised 14,294 13,803
Gross investments in finance leases 64,937 65,398
Notes to Balance Sheet | Notes to Consolidated Financial Statements | CONSOLIDATED FINANCIAL STATEMENTS
154
Annual Report 2018 | MVV

21. Other receivables and assetsOther receivables and assets have been broken down into their respective contents and counterparties in the following tables. The hedging relationship has also been stated in the case of derivative financial instruments.
Financial and non-financial receivables and assets
30 September 2018 30 September 2017
Euro 000s Non-current Current Total Non-current Current Total
Financial receivables and assets
Derivative financial instruments 292,690 664,541 957,231 174,259 257,310 431,569
Receivables from security deposits for energy trading transactions – 194 194 – 126 126
Receivables in connection with finance leases – 6,916 6,916 – 6,430 6,430
Suppliers with debit balances – 6,484 6,484 – 4,312 4,312
Loans – 3,244 3,244 – 6,496 6,496
Receivables from employees – 352 352 – 207 207
Escrow accounts – – – – 48 48
Miscellaneous other assets 2,931 33,645 36,576 9,437 36,398 45,835
Non-financial receivables and assets
Other tax receivables – 33,306 33,306 – 22,936 22,936
Deferred expenses and accrued income 5,172 9,202 14,374 5,574 8,946 14,520
Emission rights – 5,475 5,475 – 234 234
Miscellaneous other non-financial assets 8,227 2,619 10,846 – – –
309,020 765,978 1,074,998 189,270 343,443 532,713
Derivative financial instruments (financial receivables and assets)
30 September 2018 30 September 2017
Euro 000s Non-current Current Total Non-current Current Total
Derivative financial instruments 292,690 664,541 957,231 174,259 257,310 431,569
of which without IAS 39 hedges 234,909 643,908 878,817 148,499 248,636 397,135
of which cash flow hedges 57,781 20,633 78,414 25,760 8,674 34,434
Derivative financial instruments rose in value compared with the previous year. This was due to higher market prices and the resultant increase in the fair values of energy trading transactions recognised under IAS 39. These items relate to interest, currency and commodity derivatives for electricity, gas, coal, CO2 and other certificates.
Further information about financial instruments can be found in Note 35.
Other tax receivables mainly include input tax and energy tax credits.
Non-financial miscellaneous other assets include expenses of Euro 6,818 thousand for the past extension and renewal of infrastructure assets at the two British power plants. These assets are not within MVV’s control but are essential for the supply of electricity and steam. The outlays thereby incurred are being deferred over the corresponding contractual term.
Furthermore, this line item also includes input taxes that are not yet deductible.
Notes to Balance Sheet | Notes to Consolidated Financial Statements | CONSOLIDATED FINANCIAL STATEMENTS
155
Annual Report 2018 | MVV

The current portion of leasing receivables and loans is reported under current financial other assets. Measurement of these items is based on the same principles as for the non-current portions. These principles are outlined under other financial assets.
Furthermore, miscellaneous financial other assets mainly relate to receivables due from a former shareholder of a subsidiary, securities in connection with tender processes and receivables due from third parties for building cost grants.
Other receivables and assets
30 September 2018 30 September 2017
Euro 000s Non-current Current Total Non-current Current Total
Other receivables and assets
from third parties 308,671 761,316 1,069,987 188,880 341,837 530,717
from other majority shareholdings – 976 976 – 449 449
from companies recognised at equity 349 3,640 3,989 390 1,132 1,522
from other shareholdings – 46 46 – 25 25
309,020 765,978 1,074,998 189,270 343,443 532,713
The write-downs and maturity structures for other receivables and assets have been presented in Note 35.
To reduce the counterparty risk involved in highly fluctuating fair values of energy trading derivatives, security deposits are exchanged with external trading partners. These involve margins. To reduce these counterparty risks, payments are made both within the European Energy Exchange (EEX) and in some cases within the framework of bilateral agreements. These are reflected in the receivables from security deposits for energy trading transactions line item. Receivables from security deposits showed a slight year-on-year increase to Euro 194 thousand (previous year: Euro 126 thousand).
There were no indications of impairment requirements for non-impaired other receivables and assets. All write-downs undertaken were calculated following consideration of each case and were not based on any general allowance.
22. Inventories
Inventories
Euro 000s 30 Sep 2018 30 Sep 2017
Raw materials and supplies 40,771 38,868
Finished and unfinished products and services (project rights) 44,977 75,676
Finished and unfinished products, services (other) and merchandise 46,089 51,316
Advance payments 19,421 114,813
Commodity trading assets 9,704 1,856
160,962 282,529
The change in inventories is mainly due to the reduction in the project business. Write-downs of Euro 745 thousand were recognised for inventories (previous year: Euro 150 thousand). Write-ups of Euro 3,725 thousand were included due to higher net disposal prices (previous year: Euro 312 thousand).
Notes to Balance Sheet | Notes to Consolidated Financial Statements | CONSOLIDATED FINANCIAL STATEMENTS
156
Annual Report 2018 | MVV

The commodity trading assets item includes inventories relat-ing to special gas storage transactions. These items have been measured by reference to wholesale prices as of the balance sheet date and involve Level 2 measurement. The definitions of individual measurement levels can be found in Note 35.
23. Trade receivables
Trade receivables
Euro 000s 30 Sep 2018 30 Sep 2017
Trade receivables 381,729 351,104
of which due from other majority shareholdings 293 501
of which due from companies recognised at equity 16,497 14,545
of which due from other shareholdings 697 453
The above table exclusively shows those trade receivables with terms of under one year. Trade receivables with terms of more than one year are of immaterial significance at the Group and have been recognised under other receivables and assets.
The trade receivables recognised as of 30 September 2018 include receivables of Euro 18,272 thousand (previous year: Euro 4,826 thousand) for the settlement of construction contracts in line with their percentage of completion. Revenues of Euro 56,629 thousand were recognised for construction contracts in the year under report (previous year: Euro 110,562 thousand). Total costs incurred for construction contracts not yet complete as of the balance sheet date came to Euro 41,776 thousand (previous year: Euro 33,684 thousand). Construction contracts not yet complete resulted in a profit of Euro 2,812 thousand (previous year: profit of Euro 4,234 thousand). Advance pay-ments received for construction contracts amounted to Euro 24,904 thousand at the balance sheet date (previous year: Euro 22,810 thousand).
Receivables with carrying amounts totalling Euro 499 thousand were sold within the framework of factoring agreements in the 2018 financial year (previous year: Euro 299 thousand). These receivables were fully retired.
The write-downs and maturity structures for trade receivables have been presented in Note 35. Receivables are written down on the basis of their actual age. Furthermore, large receivables are assessed individually to determine their specific write-down requirements. There were no indications of write-down requirements for non-impaired trade receivables.
24. Tax receivablesThe tax receivables of Euro 27,586 thousand (previous year: Euro 18,908 thousand) mainly relate to corporate income tax and trade tax refund claims. These have been recognised at nominal value.
The increase in income tax receivables is mainly due to one-off capital gains tax receivables at Juwi AG as a result of a capital reduction at Juwi Energieprojekte GmbH.
25. Cash and cash equivalentsCash and cash equivalents predominantly comprise credit balances at banks. The acquisition of fully consolidated com-panies and other business units resulted in the addition of cash and cash equivalents of Euro 824 thousand (previous year: Euro 992 thousand). The disposal of fully consolidated com-panies and other business units led to the retirement of cash and cash equivalents of Euro 1,269 thousand (previous year: Euro 5,946 thousand).
Within the framework of short-term liquidity management structures, credit balances are exclusively deposited at banks of impeccable creditworthiness. As in the previous year, such balances bear interest at interbank levels.
26. Assets held for sale The assets classified in the previous year as held for sale were sold in the current financial year. These involved the fibre optic network at MVV Energie AG and multi-utility contracts at MVV ImmoSolutions GmbH.
Notes to Balance Sheet | Notes to Consolidated Financial Statements | CONSOLIDATED FINANCIAL STATEMENTS
157
Annual Report 2018 | MVV

27. EquityThe structure and development of equity have been presented in the statement of changes in equity.
Share capital: The share capital of MVV Energie AG amounts to Euro 168,721 thousand and is divided into 65,906,796 individual registered shares of Euro 2.56 each. All registered shares are paid up in full. The City of Mannheim directly and indirectly owned 50.1 % of the shares as of 30 September 2018; EnBW Energie Baden-Württemberg AG held 28.8 % and RheinEnergie AG 16.3 % of the shares. The remaining 4.8 % of the shares were in free float.
Authorised capital II: By resolution dated 14 March 2014, the Annual General Meeting of MVV Energie AG authorised the Executive Board until 13 March 2019 to increase the share capital on one or several occasions by a total of up to Euro 51,200 thousand. Shareholders must generally be granted subscription rights; however, the Executive Board may exclude such rights on one or several occasions, in full or in part, for a total of Euro 13,180 thousand. The Executive Board of MVV Energie AG has not yet made any use of this authorisation.
Authorisation to buy back treasury stock: By resolution dated 13 March 2015, the Annual General Meeting authorised the Executive Board until 12 March 2020 to acquire treasury stock up to 10 % of existing share capital upon adoption of the reso-lution. The Executive Board of MVV Energie AG has not yet made any use of this authorisation.
Capital reserve: The capital reserve relates to MVV Energie AG. This reserve includes external flows of funds requiring inclusion under § 272 HGB. The variance of Euro 3,705 thousand to the capital reserve in the financial statements of MVV Energie AG is due to transaction costs for the capital increases executed in 2006 and 2007, which have been recognised as a reduction to the capital reserve.
Equity generated: In addition to the prorated revenue reserves and accumulated annual net income of MVV Energie AG and of other consolidated companies since the date of initial con-solidation, equity generated also includes cumulative changes recognised directly in equity as a result of the fair value meas-urement of financial instruments, mainly relating to hedge relationships recognised under IAS 39, as well as currency translation differences arising upon the translation of foreign financial statements and actuarial gains and losses for defined benefit plans. Income of Euro 19,909 thousand was recognised directly in equity in the financial year under report in connec-tion with the fair value measurement of financial instruments (previous year: income of Euro 27,627 thousand).
Notes to Balance Sheet | Notes to Consolidated Financial Statements | CONSOLIDATED FINANCIAL STATEMENTS
158
Annual Report 2018 | MVV

28. Provisions
Provisions
Euro 000s
Balance at 1 Oct 2017
Change in scope of
consolidation
Currency adjustments
Utilised
Reversed
Added
Reclassified
Interest component
Balance at 30 Sep 2018
Non-current provisions
Pensions and similar obligations 77,818 – – – 2,673 – 856 – 1,550 77,551
Tax provisions 4,987 – – – 4,987 – – – –
Other provisions
Personnel-related obligations 50,349 – – 3 – 440 1,319 2,863 – 11,376 999 41,073
Refurbishment, dismantling and warranty obligations 42,098 556 – 10 – 2,108 798 839 – 4,756 91 35,912
Provisions for litigation and contract risks 3,538 – – – 54 1,957 363 – 411 1 1,480
Miscellaneous contingencies 24,886 – 1 10 – 118 3,013 3,885 – 479 186 25,356
Total other provisions 120,871 555 – 3 – 2,720 7,087 7,950 – 17,022 1,277 103,821
Total non-current provisions 203,676 555 – 3 – 5,393 12,074 8,806 – 17,022 2,827 181,372
Current provisions
Tax provisions 31,803 – – 8 – 12,656 2,032 37,774 – – 54,881
Other provisions
Personnel-related obligations 43,125 – 1 – 39,478 2,948 29,685 11,376 – 41,761
Services not yet invoiced 24,317 – – 134 – 18,300 5,431 54,034 – – 54,486
Restructuring obligations 3,845 – – – 3,024 821 – – – –
Refurbishment, dismantling and warranty obligations 11,234 – 14 – 7,009 3,866 2,929 4,756 – 8,058
Provisions for litigation and contract risks 11,502 – – 3 – 1,764 5,923 1,594 411 – 5,817
Miscellaneous contingencies 40,771 – 57 – 8 – 18,745 17,521 23,943 479 – 28,862
Total other provisions 134,794 – 57 – 130 – 88,320 36,510 112,185 17,022 – 138,984
Total current provisions 166,597 – 57 – 138 – 100,976 38,542 149,959 17,022 – 193,865
Total provisions 370,273 498 – 141 – 106,369 50,616 158,765 – 2,827 375,237
Notes to Balance Sheet | Notes to Consolidated Financial Statements | CONSOLIDATED FINANCIAL STATEMENTS
159
Annual Report 2018 | MVV
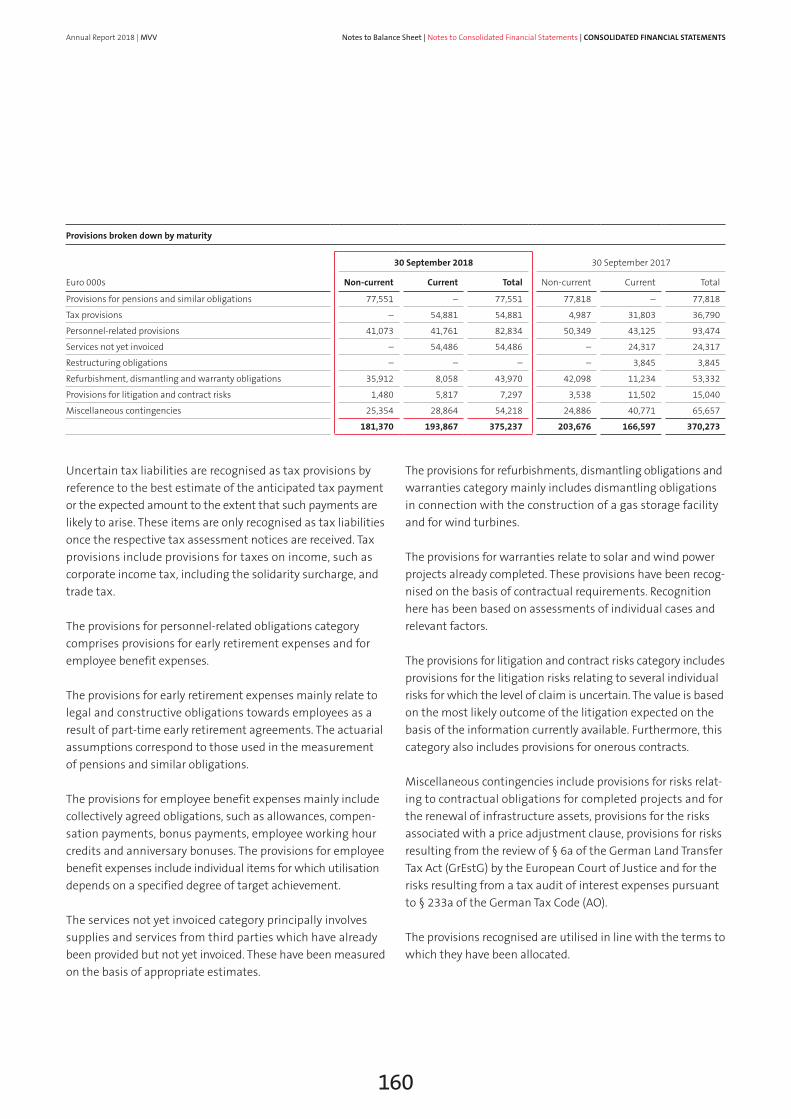
Provisions broken down by maturity
30 September 2018 30 September 2017
Euro 000s Non-current Current Total Non-current Current Total
Provisions for pensions and similar obligations 77,551 – 77,551 77,818 – 77,818
Tax provisions – 54,881 54,881 4,987 31,803 36,790
Personnel-related provisions 41,073 41,761 82,834 50,349 43,125 93,474
Services not yet invoiced – 54,486 54,486 – 24,317 24,317
Restructuring obligations – – – – 3,845 3,845
Refurbishment, dismantling and warranty obligations 35,912 8,058 43,970 42,098 11,234 53,332
Provisions for litigation and contract risks 1,480 5,817 7,297 3,538 11,502 15,040
Miscellaneous contingencies 25,354 28,864 54,218 24,886 40,771 65,657
181,370 193,867 375,237 203,676 166,597 370,273
Uncertain tax liabilities are recognised as tax provisions by reference to the best estimate of the anticipated tax payment or the expected amount to the extent that such payments are likely to arise. These items are only recognised as tax liabilities once the respective tax assessment notices are received. Tax provisions include provisions for taxes on income, such as corporate income tax, including the solidarity surcharge, and trade tax.
The provisions for personnel-related obligations category comprises provisions for early retirement expenses and for employee benefit expenses.
The provisions for early retirement expenses mainly relate to legal and constructive obligations towards employees as a result of part-time early retirement agreements. The actuarial assumptions correspond to those used in the measurement of pensions and similar obligations.
The provisions for employee benefit expenses mainly include collectively agreed obligations, such as allowances, compen-sation payments, bonus payments, employee working hour credits and anniversary bonuses. The provisions for employee benefit expenses include individual items for which utilisation depends on a specified degree of target achievement.
The services not yet invoiced category principally involves supplies and services from third parties which have already been provided but not yet invoiced. These have been measured on the basis of appropriate estimates.
The provisions for refurbishments, dismantling obligations and warranties category mainly includes dismantling obligations in connection with the construction of a gas storage facility and for wind turbines.
The provisions for warranties relate to solar and wind power projects already completed. These provisions have been recog-nised on the basis of contractual requirements. Recognition here has been based on assessments of individual cases and relevant factors.
The provisions for litigation and contract risks category includes provisions for the litigation risks relating to several individual risks for which the level of claim is uncertain. The value is based on the most likely outcome of the litigation expected on the basis of the information currently available. Furthermore, this category also includes provisions for onerous contracts. Miscellaneous contingencies include provisions for risks relat-ing to contractual obligations for completed projects and for the renewal of infrastructure assets, provisions for the risks associated with a price adjustment clause, provisions for risks resulting from the review of § 6a of the German Land Transfer Tax Act (GrEstG) by the European Court of Justice and for the risks resulting from a tax audit of interest expenses pursuant to § 233a of the German Tax Code (AO).
The provisions recognised are utilised in line with the terms to which they have been allocated.
Notes to Balance Sheet | Notes to Consolidated Financial Statements | CONSOLIDATED FINANCIAL STATEMENTS
160
Annual Report 2018 | MVV

29. Provisions for pensions and similar obligationsThe company pension plans consist of defined contribution and defined benefit plans.
The pension scheme for MVV employees is largely arranged in line with collective wage and salary agreements specific to the respective companies. This results in indirect pension obligations to employees which are covered almost exclusively by municipal supplementary pension companies (ZVKs). This requires allocations to be made for retirement periods. The pay-ments made in this context serve to finance current pension outlays. According to IFRS requirements, this type of pension plan represents a defined benefit plan, as the individual bene-fits provided by the ZVKs to former employees of member companies are not dependent on the level of contributions paid into the pension funds. Moreover, as the employees of several member companies are insured by the ZVKs, this type of pension plan is considered a multi-employer plan and thus requires the application of special regulations.
Given the redistribution of the benefits provided by ZVKs among member companies and the lack of adequate information about the age structures, personnel turnover rates and salaries of the employees thereby covered, no information is available on the proportion of future payment obligations (economic obli-gation) accruing to MVV. In view of this, IFRS does not permit recognition of provisions and the amounts therefore have to be treated by MVV as a defined contribution obligation, even though it is actually a defined benefit pension plan. Contri-butions to the pension plan are measured as a percentage of compensation subject to the additional pension premium and are borne by employees and employers. The percentage rate of contribution is determined by the ZVKs. MVV expects contributions in the 2019 financial year in the same amount as in the previous year. The contributions are used for the bene-ficiaries as a collective entity. Should the ZVKs have insufficient funds, then they could increase the mandatory contribution. Should MVV terminate its membership of the ZVKs, then they would be entitled to financial settlement. The amount of settlement is calculated as the present value of beneficiaries’ existing entitlement and future claims on the part of their surviving dependants and existing pension entitlements for vested claims at the time at which membership is terminated.
The payments made to municipal supplementary pension companies (ZVKs) and the state pension system are viewed as payments to defined contribution plans. These contributions are recognised as expenses and reported under employee benefit expenses. An amount of Euro 31,165 thousand was paid into the state pension systems in the 2018 financial year (previous year: Euro 30,168 thousand). Moreover, an amount of Euro 15,169 thousand was paid into defined contribution pension schemes (previous year: Euro 15,273 thousand).
Furthermore, there are direct pension obligations resulting from former collectively agreed provisions (measured in terms of duration of company service and employee compensation), as well as individual commitments made to Executive Board members.
Provisions for pensions and similar obligations are recognised exclusively for defined benefit plans.
The principal estimates used when measuring provisions for pensions and similar obligations relate in particular to the dis-count factor, biometric probabilities and trend assumptions. Any deviations in the development in these estimates could result in differences between the amounts recognised and the obligations actually arising over time. Actuarial gains and losses are fully recognised in the period in which they arise. They are recognised outside the income statement in the statement of income and expenses recognised in group equity. This means that any amendments in estimates have direct implications for MVV.
Pursuant to IAS 19, the pension provisions are calculated using the projected unit credit method. As well as pensions and vested claims known of at the balance sheet date, this method also accounts for pay rises and pension increases expected in future. The calculation made application of the 2018 G Heubeck mortality tables.
Notes to Balance Sheet | Notes to Consolidated Financial Statements | CONSOLIDATED FINANCIAL STATEMENTS
161
Annual Report 2018 | MVV

The main parameters used to calculate the defined benefit plans as of 30 September 2018 are:
Parameters
30 Sep 2018 30 Sep 2017
Discount rate 2.1 % 2.0 %
Future pay rises 2.1 – 3.0 % 2.0 – 3.0 %
Future pension increases 1.6 – 2.0 % 1.6 – 2.0 %
The expenses for these pensions and similar obligations struc-tured as defined benefit plans comprise the following items:
Pension provision expenses
Euro 000s FY 2018 FY 2017
Service cost 2,054 2,352
Interest expenses 1,550 1,201
3,604 3,553
The interest expenses for vested pension claims are reported in the income statement under financing expenses (other interest and similar expenses). The other expenses are recog-nised as employee benefit expenses.
The present value of the defined benefit obligations developed as follows:
Development in pension claims
30 September 2018 30 September 2017
Euro 000s
Present value of defined benefit
obligations
Fair value of plan assets
Total
Present value of defined benefit
obligations
Fair value of plan assets
Total
Balance at 1 October 78,401 583 77,818 87,973 512 87,461
Current service cost 2,054 – 2,054 2,352 – 2,352
Interest expenses (interest income) 1,550 – 1,550 1,201 – 1,201
Remeasurement
(i) Income from plan assets (excluding amounts included in interest income from plan assets) – 12 – 12 – 8 – 8
(ii) Actuarial gains/losses – 1,133 – 13 – 1,120 – 10,529 6 – 10,535
Payments made to beneficiaries – 2,673 – – 2,673 – 2,596 – – 2,596
Contributions to plan assets – 66 – 66 – 57 – 57
Balance at 30 September 78,199 648 77,551 78,401 583 77,818
Notes to Balance Sheet | Notes to Consolidated Financial Statements | CONSOLIDATED FINANCIAL STATEMENTS
162
Annual Report 2018 | MVV
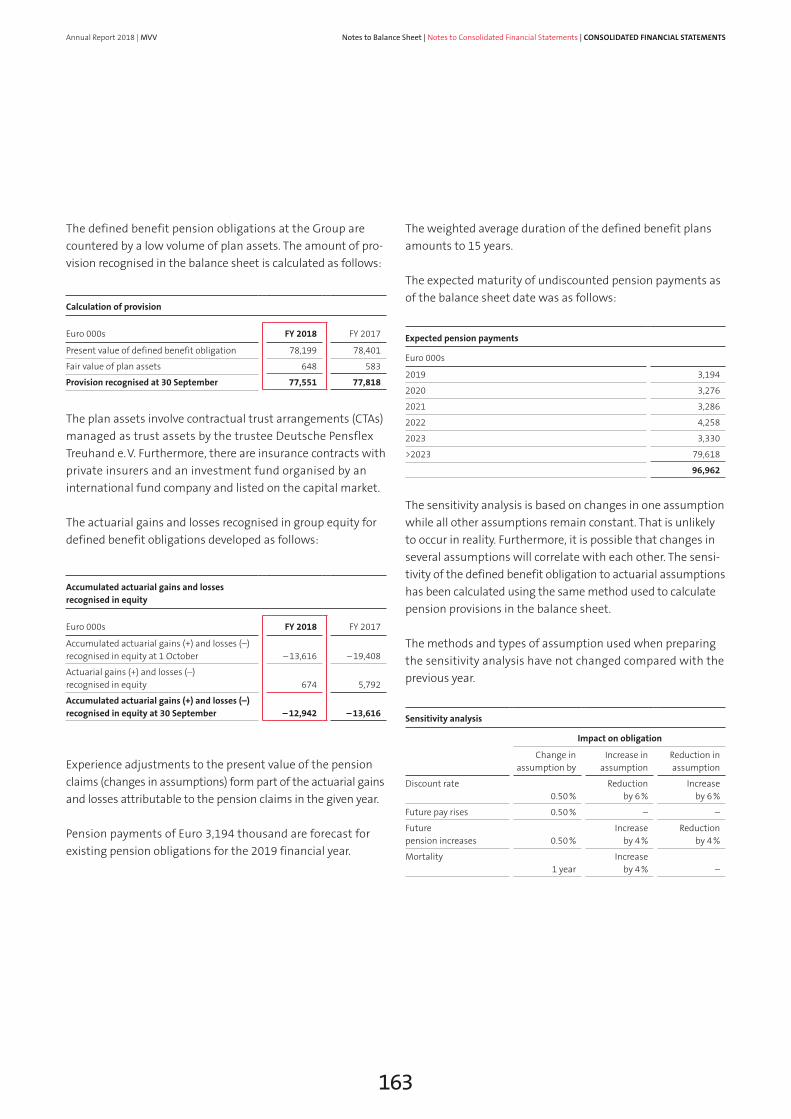
The defined benefit pension obligations at the Group are countered by a low volume of plan assets. The amount of pro-vision recognised in the balance sheet is calculated as follows:
Calculation of provision
Euro 000s FY 2018 FY 2017
Present value of defined benefit obligation 78,199 78,401
Fair value of plan assets 648 583
Provision recognised at 30 September 77,551 77,818
The plan assets involve contractual trust arrangements (CTAs) managed as trust assets by the trustee Deutsche Pensflex Treuhand e. V. Furthermore, there are insurance contracts with private insurers and an investment fund organised by an international fund company and listed on the capital market.
The actuarial gains and losses recognised in group equity for defined benefit obligations developed as follows:
Accumulated actuarial gains and losses recognised in equity
Euro 000s FY 2018 FY 2017
Accumulated actuarial gains (+) and losses (–)recognised in equity at 1 October – 13,616 – 19,408
Actuarial gains (+) and losses (–) recognised in equity 674 5,792
Accumulated actuarial gains (+) and losses (–)recognised in equity at 30 September – 12,942 – 13,616
Experience adjustments to the present value of the pension claims (changes in assumptions) form part of the actuarial gains and losses attributable to the pension claims in the given year.
Pension payments of Euro 3,194 thousand are forecast for existing pension obligations for the 2019 financial year.
The weighted average duration of the defined benefit plans amounts to 15 years.
The expected maturity of undiscounted pension payments as of the balance sheet date was as follows:
Expected pension payments
Euro 000s
2019 3,194
2020 3,276
2021 3,286
2022 4,258
2023 3,330
>2023 79,618
96,962
The sensitivity analysis is based on changes in one assumption while all other assumptions remain constant. That is unlikely to occur in reality. Furthermore, it is possible that changes in several assumptions will correlate with each other. The sensi-tivity of the defined benefit obligation to actuarial assumptions has been calculated using the same method used to calculate pension provisions in the balance sheet.
The methods and types of assumption used when preparing the sensitivity analysis have not changed compared with the previous year.
Sensitivity analysis
Impact on obligation
Change in
assumption by Increase in
assumptionReduction in assumption
Discount rate 0.50 %
Reduction by 6 %
Increase by 6 %
Future pay rises 0.50 % – –
Future pension increases 0.50 %
Increase by 4 %
Reduction by 4 %
Mortality 1 year
Increase by 4 % –
Notes to Balance Sheet | Notes to Consolidated Financial Statements | CONSOLIDATED FINANCIAL STATEMENTS
163
Annual Report 2018 | MVV
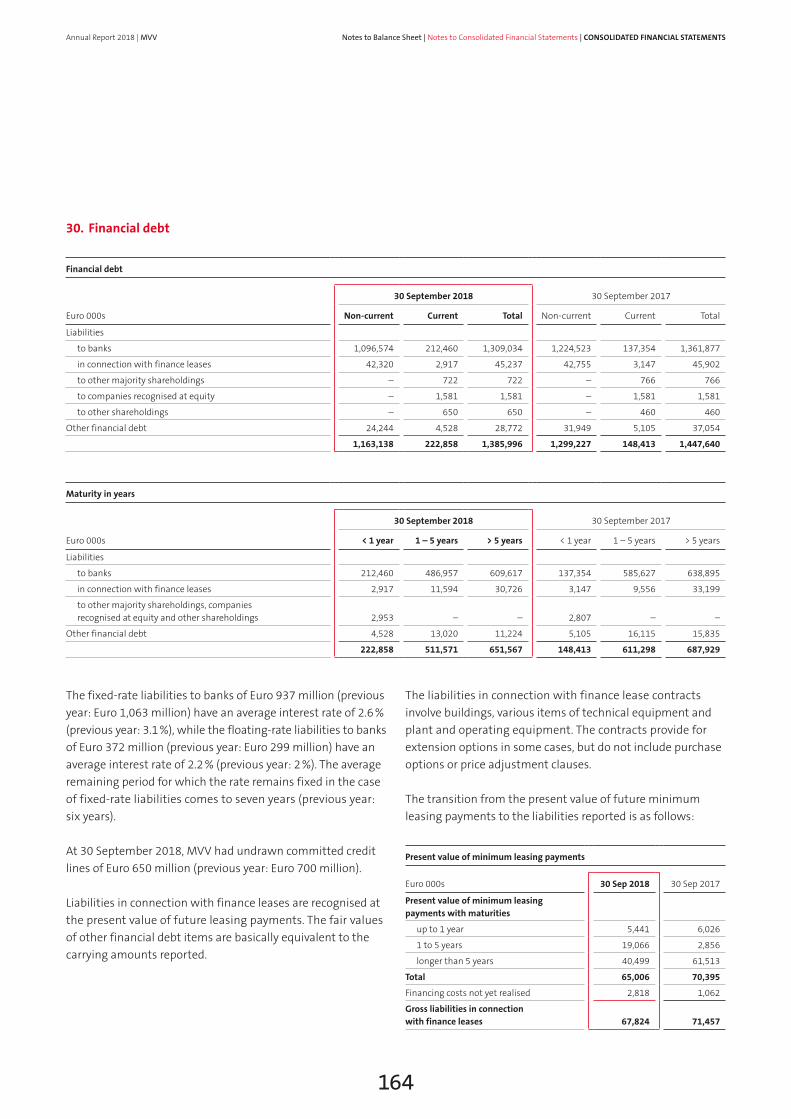
30. Financial debt
Financial debt
30 September 2018 30 September 2017
Euro 000s Non-current Current Total Non-current Current Total
Liabilities
to banks 1,096,574 212,460 1,309,034 1,224,523 137,354 1,361,877
in connection with finance leases 42,320 2,917 45,237 42,755 3,147 45,902
to other majority shareholdings – 722 722 – 766 766
to companies recognised at equity – 1,581 1,581 – 1,581 1,581
to other shareholdings – 650 650 – 460 460
Other financial debt 24,244 4,528 28,772 31,949 5,105 37,054
1,163,138 222,858 1,385,996 1,299,227 148,413 1,447,640
Maturity in years
30 September 2018 30 September 2017
Euro 000s < 1 year 1 – 5 years > 5 years < 1 year 1 – 5 years > 5 years
Liabilities
to banks 212,460 486,957 609,617 137,354 585,627 638,895
in connection with finance leases 2,917 11,594 30,726 3,147 9,556 33,199
to other majority shareholdings, companies recognised at equity and other shareholdings 2,953 – – 2,807 – –
Other financial debt 4,528 13,020 11,224 5,105 16,115 15,835
222,858 511,571 651,567 148,413 611,298 687,929
The fixed-rate liabilities to banks of Euro 937 million (previous year: Euro 1,063 million) have an average interest rate of 2.6 % (previous year: 3.1 %), while the floating-rate liabilities to banks of Euro 372 million (previous year: Euro 299 million) have an average interest rate of 2.2 % (previous year: 2 %). The average remaining period for which the rate remains fixed in the case of fixed-rate liabilities comes to seven years (previous year: six years). At 30 September 2018, MVV had undrawn committed credit lines of Euro 650 million (previous year: Euro 700 million).
Liabilities in connection with finance leases are recognised at the present value of future leasing payments. The fair values of other financial debt items are basically equivalent to the carrying amounts reported.
The liabilities in connection with finance lease contracts involve buildings, various items of technical equipment and plant and operating equipment. The contracts provide for extension options in some cases, but do not include purchase options or price adjustment clauses.
The transition from the present value of future minimum leasing payments to the liabilities reported is as follows:
Present value of minimum leasing payments
Euro 000s 30 Sep 2018 30 Sep 2017
Present value of minimum leasing payments with maturities
up to 1 year 5,441 6,026
1 to 5 years 19,066 2,856
longer than 5 years 40,499 61,513
Total 65,006 70,395
Financing costs not yet realised 2,818 1,062
Gross liabilities in connection with finance leases 67,824 71,457
Notes to Balance Sheet | Notes to Consolidated Financial Statements | CONSOLIDATED FINANCIAL STATEMENTS
164
Annual Report 2018 | MVV
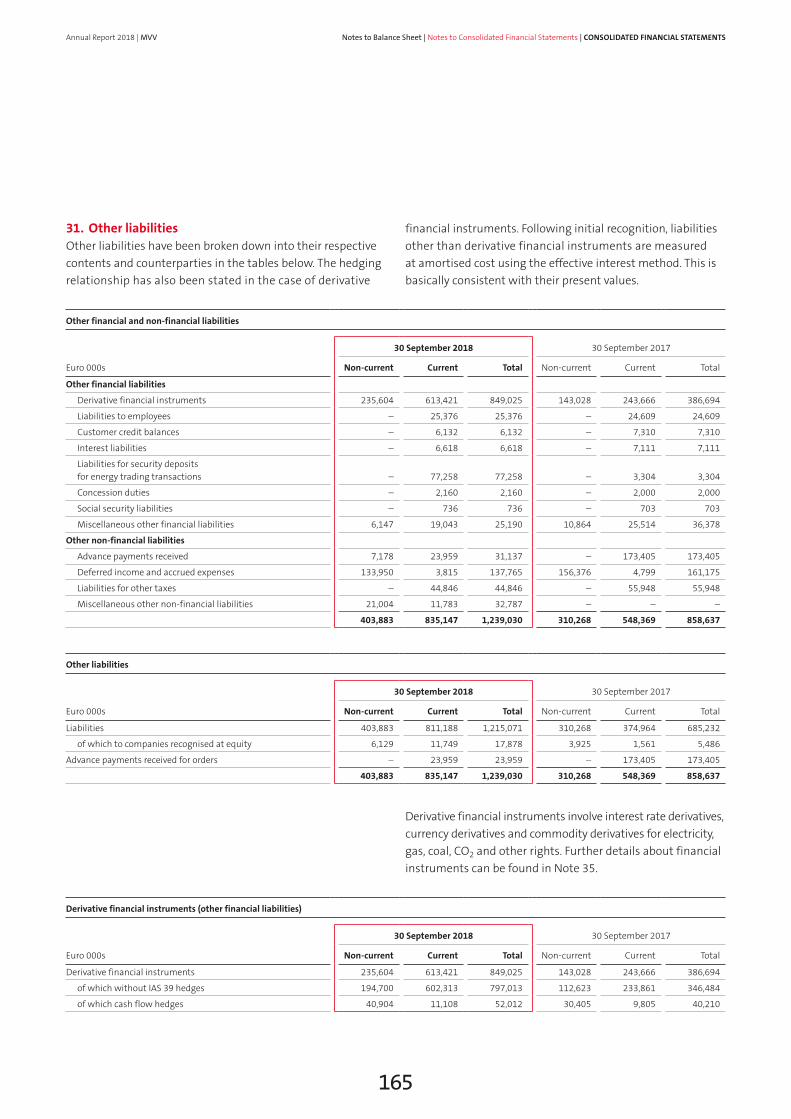
31. Other liabilitiesOther liabilities have been broken down into their respective contents and counterparties in the tables below. The hedging relationship has also been stated in the case of derivative
financial instruments. Following initial recognition, liabilities other than derivative financial instruments are measured at amortised cost using the effective interest method. This is basically consistent with their present values.
Other financial and non-financial liabilities
30 September 2018 30 September 2017
Euro 000s Non-current Current Total Non-current Current Total
Other financial liabilities
Derivative financial instruments 235,604 613,421 849,025 143,028 243,666 386,694
Liabilities to employees – 25,376 25,376 – 24,609 24,609
Customer credit balances – 6,132 6,132 – 7,310 7,310
Interest liabilities – 6,618 6,618 – 7,111 7,111
Liabilities for security deposits for energy trading transactions – 77,258 77,258 – 3,304 3,304
Concession duties – 2,160 2,160 – 2,000 2,000
Social security liabilities – 736 736 – 703 703
Miscellaneous other financial liabilities 6,147 19,043 25,190 10,864 25,514 36,378
Other non-financial liabilities
Advance payments received 7,178 23,959 31,137 – 173,405 173,405
Deferred income and accrued expenses 133,950 3,815 137,765 156,376 4,799 161,175
Liabilities for other taxes – 44,846 44,846 – 55,948 55,948
Miscellaneous other non-financial liabilities 21,004 11,783 32,787 – – –
403,883 835,147 1,239,030 310,268 548,369 858,637
Other liabilities
30 September 2018 30 September 2017
Euro 000s Non-current Current Total Non-current Current Total
Liabilities 403,883 811,188 1,215,071 310,268 374,964 685,232
of which to companies recognised at equity 6,129 11,749 17,878 3,925 1,561 5,486
Advance payments received for orders – 23,959 23,959 – 173,405 173,405
403,883 835,147 1,239,030 310,268 548,369 858,637
Derivative financial instruments involve interest rate derivatives, currency derivatives and commodity derivatives for electricity, gas, coal, CO2 and other rights. Further details about financial instruments can be found in Note 35.
Derivative financial instruments (other financial liabilities)
30 September 2018 30 September 2017
Euro 000s Non-current Current Total Non-current Current Total
Derivative financial instruments 235,604 613,421 849,025 143,028 243,666 386,694
of which without IAS 39 hedges 194,700 602,313 797,013 112,623 233,861 346,484
of which cash flow hedges 40,904 11,108 52,012 30,405 9,805 40,210
Notes to Balance Sheet | Notes to Consolidated Financial Statements | CONSOLIDATED FINANCIAL STATEMENTS
165
Annual Report 2018 | MVV
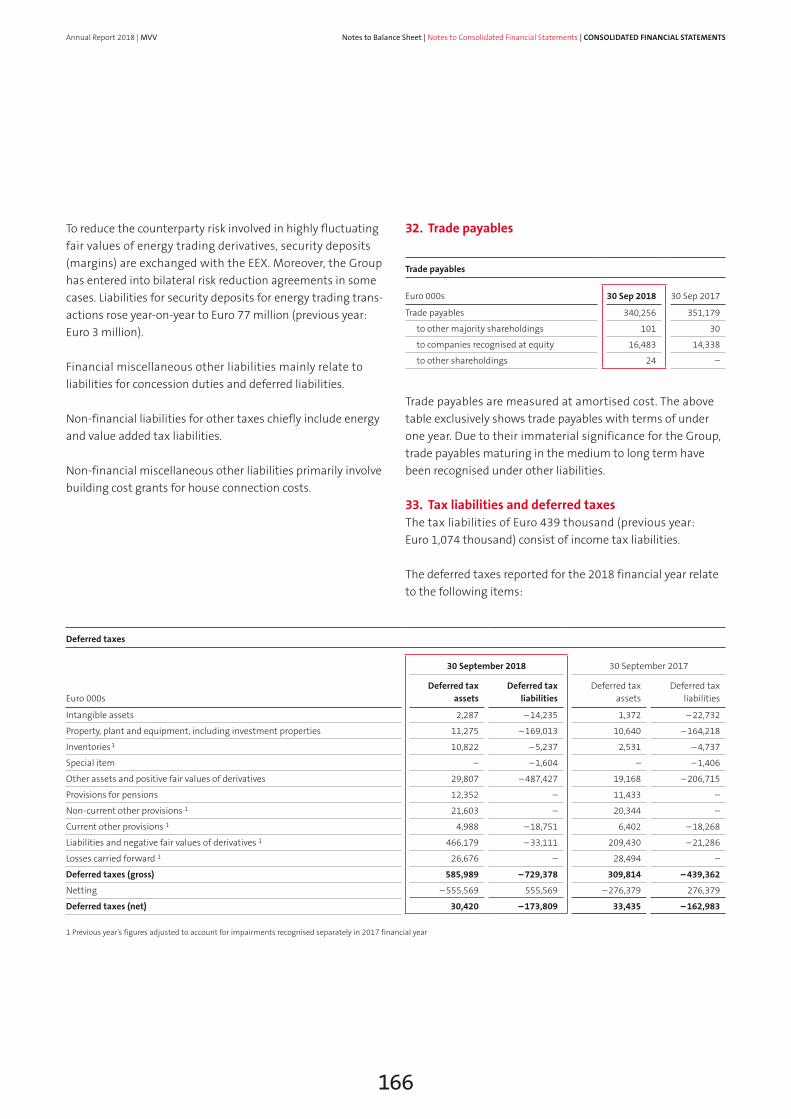
To reduce the counterparty risk involved in highly fluctuating fair values of energy trading derivatives, security deposits (margins) are exchanged with the EEX. Moreover, the Group has entered into bilateral risk reduction agreements in some cases. Liabilities for security deposits for energy trading trans-actions rose year-on-year to Euro 77 million (previous year: Euro 3 million).
Financial miscellaneous other liabilities mainly relate to liabilities for concession duties and deferred liabilities.
Non-financial liabilities for other taxes chiefly include energy and value added tax liabilities.
Non-financial miscellaneous other liabilities primarily involve building cost grants for house connection costs.
32. Trade payables
Trade payables
Euro 000s 30 Sep 2018 30 Sep 2017
Trade payables 340,256 351,179
to other majority shareholdings 101 30
to companies recognised at equity 16,483 14,338
to other shareholdings 24 –
Trade payables are measured at amortised cost. The above table exclusively shows trade payables with terms of under one year. Due to their immaterial significance for the Group, trade payables maturing in the medium to long term have been recognised under other liabilities.
33. Tax liabilities and deferred taxesThe tax liabilities of Euro 439 thousand (previous year: Euro 1,074 thousand) consist of income tax liabilities.
The deferred taxes reported for the 2018 financial year relate to the following items:
Deferred taxes
30 September 2018 30 September 2017
Euro 000sDeferred tax
assetsDeferred tax
liabilitiesDeferred tax
assetsDeferred tax
liabilities
Intangible assets 2,287 – 14,235 1,372 – 22,732
Property, plant and equipment, including investment properties 11,275 – 169,013 10,640 – 164,218
Inventories 1 10,822 – 5,237 2,531 – 4,737
Special item – – 1,604 – – 1,406
Other assets and positive fair values of derivatives 29,807 – 487,427 19,168 – 206,715
Provisions for pensions 12,352 – 11,433 –
Non-current other provisions 1 21,603 – 20,344 –
Current other provisions 1 4,988 – 18,751 6,402 – 18,268
Liabilities and negative fair values of derivatives 1 466,179 – 33,111 209,430 – 21,286
Losses carried forward 1 26,676 – 28,494 –
Deferred taxes (gross) 585,989 – 729,378 309,814 – 439,362
Netting – 555,569 555,569 – 276,379 276,379
Deferred taxes (net) 30,420 – 173,809 33,435 – 162,983
1 Previous year’s figures adjusted to account for impairments recognised separately in 2017 financial year
Notes to Balance Sheet | Notes to Consolidated Financial Statements | CONSOLIDATED FINANCIAL STATEMENTS
166
Annual Report 2018 | MVV

Of the (net) deferred taxes presented above, Euro 11,568 thousand (previous year: Euro 17,672 thousand) relate to non-current deferred tax assets and Euro 85,387 thousand (previous year: Euro 111,101 thousand) to non-current deferred tax liabilities.
No deferred tax assets have been recognised for corporate income tax loss carryovers of Euro 100,046 thousand (previous year: Euro 84,779 thousand), trade tax loss carryovers of Euro 108,351 thousand (previous year: Euro 87,457 thousand) or for international loss carryovers of Euro 82,128 thousand (previous year: Euro 84,395 thousand).
For temporary differences of Euro 11,008 thousand at share-holdings (previous year: Euro 11,340 thousand), no deferred tax liabilities have been stated for an amount of Euro 3,336 thou-sand (previous year: Euro 3,436 thousand), as such differences are unlikely to be reversed by dividend distributions or disposal of the companies in the foreseeable future.
Deferred tax assets of Euro 11,390 thousand (previous year: Euro 8,443 thousand) have been recognised as of the balance sheet date for companies that generated a loss in the financial year under report or the previous year. The realisation of these assets is exclusively dependent on the generation of future profits. Based on the budget figures available, we expect these assets to be realised.
Deferred taxes of Euro 2,010 thousand were debited directly to other comprehensive income in group equity in the 2018 financial year (previous year: Euro 7,791 thousand).
The income tax items within other comprehensive income in group equity can be broken down into their components as follows:
Income tax items
30 September 2018 30 September 2017
Euro 000s Income tax Gross Income tax Gross
Actuarial gains and losses – 226 1,120 – 2,979 10,534
Share of total comprehensive income attributable to companies recognised at equity – – 14,370 – – 11,439
Items that will not be reclassified to profit or loss – 226 15,490 – 2,979 – 905
Cash flow hedges – 9,574 33,770 – 12,335 44,601
Currency translation difference – 1,376 – 2,814
Share of total comprehensive income attributable to companies recognised at equity – – 166 – –
Items that will be reclassified to profit or loss – 9,574 34,980 – 12,335 47,415
Notes to Balance Sheet | Notes to Consolidated Financial Statements | CONSOLIDATED FINANCIAL STATEMENTS
167
Annual Report 2018 | MVV

34. Contingent claims, liabilities and financial obligations
The volume of obligations for contingent liabilities, claims and financial obligations listed below corresponds to the scope of liability pertaining at the balance sheet date. Contingent claims are treated by analogy with contingent liabilities.
Contingent liabilities involve potential obligations to third parties or existing obligations for which an outflow of resources is unlikely or whose amount cannot be reliably determined. Contingent liabilities are not recognised in the balance sheet.
The company has contingent liabilities of Euro 7 million for warranty agreements (previous year: Euro 7 million). It also has obligations of this nature in the form of guarantees amounting to Euro 1.1 million (previous year: Euro 1 million). As in the previous year, no collateral has been provided for third-party liabilities.
MVV’s has purchase commitments of Euro 177.4 million in connection with investment orders placed and financial obli-gations (previous year: Euro 46.0 million). This substantial increase mainly relates to investments in a new power plant in Scotland.
The Group has a contingent claim from the State of Baden- Württemberg and the City of Mannheim in connection with a land decontamination measure. This claim has a present value of Euro 3.8 million.
The financial obligations relating to operating leases primarily involve water grids, vehicle pools, IT equipment, land lease-hold payments and rental payments for buildings and storage facilities. The minimum leasing payments have the following maturity structure:
Financial obligations for operating leases
Nominal value
Euro 000s 30 Sep 2018 30 Sep 2017
Operating leases
up to 1 year 9,445 9,030
1 to 5 years 21,496 20,098
longer than 5 years 26,246 28,746
57,187 57,874
In leases where economic ownership remains with the lessor (operating leases), the assets thereby leased are recognised at the lessor. The leasing expenses incurred are expensed over the term of the lease.
The contracts provide for extension options in some cases but do not include any purchase options. In some cases, rental contracts include price adjustment clauses linked to the consumer price index.
Notes to Balance Sheet | Notes to Consolidated Financial Statements | CONSOLIDATED FINANCIAL STATEMENTS
168
Annual Report 2018 | MVV

35. Financial instrumentsFor interest hedges, existing underlying transactions have been included in cash flow hedges with terms of up to ten years as of 30 September 2018 (previous year: nine years). For commodity hedges, the terms of planned hedged items amount to up to three years (previous year: up to five years). Both interest rate hedging instruments and commodity deriva-tives require net settlements to be paid at contractually fixed dates largely congruent with the hedged items. The hedging instruments mostly involve swaps which generate cash flows throughout their contractual terms.
Income of Euro 24,195 thousand was recognised directly in equity in the 2018 financial year (previous year: income of Euro 32,266 thousand).
The amount reclassified from equity and recognised through profit or loss in the income statement in connection with cash flow hedge accounting was as follows:
Amount reclassified
Euro 000s FY 2018 FY 2017
Included in EBIT 20,811 3,231
Included in financial and tax results – 8,540 – 9,634
Total amounts withdrawn 12,271 – 6,403
The amounts recognised directly in equity and attributable reclassification amounts are presented in the following table:
Amounts recognised in equity
Euro 000s 30 Sep 2018 30 Sep 2017
Cash flow hedges 24,195 32,266
of which changes recognised in equity 36,466 25,863
of which changes recognised through profit or loss – 12,271 6,403
Income of Euro 18 thousand was recognised for the ineffective portion of cash flow hedges in the 2018 financial year (previous year: expenses of Euro 567 thousand). The results of ineffec-tive portions of cash flow hedges are recognised as other operating income or expenses to the extent that they exceed the cumulative fair value change in the respective hedged items. For interest rate hedges, the results are recognised under other interest income and expenses.
Fair value hedges were designated for closed foreign currency positions in the 2018 financial year. The following amounts were recognised in the income statement in connection with these hedging relationships:
Gains and losses recognised in income statement for fair value hedges
Euro FY 2018 FY 2017
Gains/losses on hedged item – 1,580 – 5,223
Gains/losses on hedging instrument 1,270 5,218
Notes to Balance Sheet | Notes to Consolidated Financial Statements | CONSOLIDATED FINANCIAL STATEMENTS
169
Annual Report 2018 | MVV
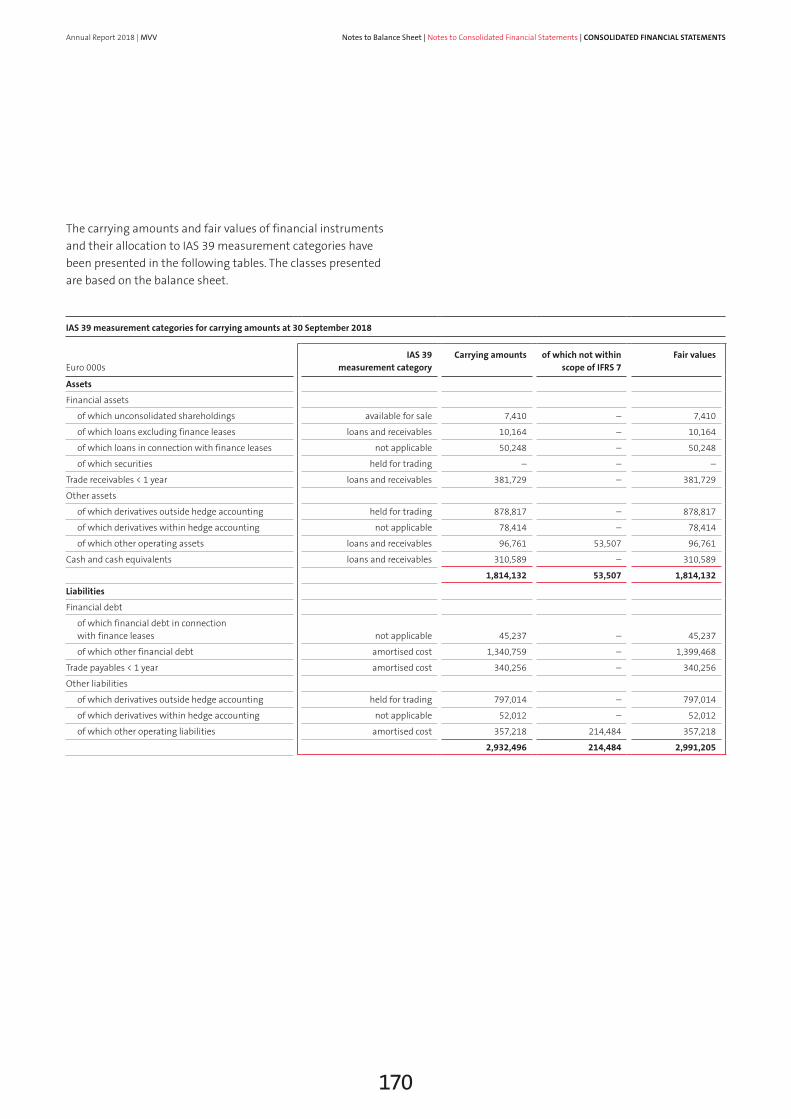
The carrying amounts and fair values of financial instruments and their allocation to IAS 39 measurement categories have been presented in the following tables. The classes presented are based on the balance sheet.
IAS 39 measurement categories for carrying amounts at 30 September 2018
Euro 000s
IAS 39 measurement category
Carrying amounts of which not within scope of IFRS 7
Fair values
Assets
Financial assets
of which unconsolidated shareholdings available for sale 7,410 – 7,410
of which loans excluding finance leases loans and receivables 10,164 – 10,164
of which loans in connection with finance leases not applicable 50,248 – 50,248
of which securities held for trading – – –
Trade receivables < 1 year loans and receivables 381,729 – 381,729
Other assets
of which derivatives outside hedge accounting held for trading 878,817 – 878,817
of which derivatives within hedge accounting not applicable 78,414 – 78,414
of which other operating assets loans and receivables 96,761 53,507 96,761
Cash and cash equivalents loans and receivables 310,589 – 310,589
1,814,132 53,507 1,814,132
Liabilities
Financial debt
of which financial debt in connection with finance leases not applicable 45,237 – 45,237
of which other financial debt amortised cost 1,340,759 – 1,399,468
Trade payables < 1 year amortised cost 340,256 – 340,256
Other liabilities
of which derivatives outside hedge accounting held for trading 797,014 – 797,014
of which derivatives within hedge accounting not applicable 52,012 – 52,012
of which other operating liabilities amortised cost 357,218 214,484 357,218
2,932,496 214,484 2,991,205
Notes to Balance Sheet | Notes to Consolidated Financial Statements | CONSOLIDATED FINANCIAL STATEMENTS
170
Annual Report 2018 | MVV

IAS 39 measurement categories for carrying amounts at 30 September 2017
Euro 000s
IAS 39 measurement category
Carrying amounts of which not within scope of IFRS 7
Fair values
Assets
Financial assets
of which unconsolidated shareholdings available for sale 7,289 – 7,289
of which loans excluding finance leases loans and receivables 12,266 – 12,266
of which loans in connection with finance leases not applicable 49,912 – 49,912
of which securities held for trading 7 – 7
Trade receivables < 1 year loans and receivables 351,104 – 351,104
Other assets
of which derivatives outside hedge accounting held for trading 397,135 – 397,135
of which derivatives within hedge accounting not applicable 34,434 – 34,434
of which other operating assets loans and receivables 88,218 37,897 88,218
Cash and cash equivalents loans and receivables 370,301 – 370,301
1,310,666 37,897 1,310,666
Liabilities
Financial debt
of which financial debt in connection with finance leases not applicable 45,902 – 45,902
of which other financial debt amortised cost 1,401,738 – 1,474,771
Trade payables < 1 year amortised cost 351,179 – 351,179
Other liabilities
of which derivatives outside hedge accounting held for trading 346,484 – 346,484
of which derivatives within hedge accounting not applicable 40,210 – 40,210
of which other operating liabilities amortised cost 471,943 391,231 471,943
2,657,456 391,231 2,730,489
Given the predominantly short-term remaining terms of trade receivables and payables, other operating receivables and liabilities and cash and cash equivalents, their carrying amounts as of the balance sheet date are basically equivalent to their fair values.
The fair value of other financial debt items is determined as their present value, taking due account of future payments. These items are discounted using the rate valid as of the balance sheet date (Level 2).
With regard to the fair value measurement of financial instruments, reference is made to the information provided on financial instruments in the accounting policies section of these notes.
The following table presents the key parameters for financial instruments measured at fair value. Pursuant to IFRS 7, the individual levels are defined as follows:
Level 1: Measurement based on prices listed on active markets and taken over without amendment
Level 2: Measurement based on directly or indirectly observable factors other than those in Level 1
Level 3: Measurement based on factors not observable on the market.
Notes to Balance Sheet | Notes to Consolidated Financial Statements | CONSOLIDATED FINANCIAL STATEMENTS
171
Annual Report 2018 | MVV

Measurement at cost: This category includes those financial instruments which IAS 39 requires to be measured at cost. On their transaction dates, these instruments were not in liquid markets, as a result of which their current recognition at cost approximates to their fair value. These items mainly involve other shareholdings and other majority shareholdings.
Fair value hierarchy at 30 September 2018
Euro 000s Level 1 Level 2 Level 3 At cost
Financial assets
Unconsolidated shareholdings – – – 7,410
Securities – – – –
Derivatives outside hedge accounting 235,679 642,309 829 –
Derivatives within hedge accounting 74,109 4,305 – –
Financial liabilities
Derivatives outside hedge accounting 202,363 594,401 250 –
Derivatives within hedge accounting 31,804 17,704 1,712 792
Fair value hierarchy at 30 September 2017
Euro 000s Level 1 Level 2 Level 3 At cost
Financial assets
Unconsolidated shareholdings – – – 7,289
Securities 7 – – –
Derivatives outside hedge accounting 97,157 299,950 28 –
Derivatives within hedge accounting 34,141 293 – –
Financial liabilities
Derivatives outside hedge accounting 105,315 240,653 516 –
Derivatives within hedge accounting 13,677 25,519 1,014 –
The derivatives of Euro 1,712 thousand in Level 3 hedge accounting include interest swaps with floor (previous year: Euro 1,014 thousand). The fair value of these derivatives amounts to Euro 1,712 thousand. Any upward or downward change in the volatility factored into the calculation by an absolute figure of 1 would increase the fair value by Euro 143 thousand or reduce it by Euro 138 thousand.
The following reconciliation presents the development in financial instruments recognised in Level 3.
Development in financial instruments recognised in Level 3
Euro 000s
Balance at 1 Oct
2017
Gains/ losses in
income statement
Gains/losses in other com-
prehensive income
Balance at 30 Sep
2018
Financial assets
Derivatives outside hedge accounting 28 801 – 829
Financial liabilities
Derivatives outside hedge accounting 516 974 – 1,490
Derivatives within hedge accounting 1,014 698 – 1,712
Development in financial instruments recognised in Level 3
Euro 000s
Balance at 1 Oct
2016
Gains/ losses in
income statement
Gains/losses in other com-
prehensive income
Balance at 30 Sep
2017
Financial assets
Derivatives outside hedge accounting 196 – 168 – 28
Financial liabilities
Derivatives outside hedge accounting 433 83 – 516
Derivatives within hedge accounting – 1,454 – 440 1,014
Notes to Balance Sheet | Notes to Consolidated Financial Statements | CONSOLIDATED FINANCIAL STATEMENTS
172
Annual Report 2018 | MVV

Gains and losses in income statement for Level 3 financial instruments FY 2018
Euro 000s
Total
of which still held at
30 Sep 2018
Other operating income 801 –
Other operating expenses – 974 –
Financing expenses – 698 –
– 871 –
Gains and losses in income statement for Level 3 financial instruments FY 2017
Euro 000s
Total
of which still held at
30 Sep 2017
Other operating income – –
Other operating expenses – 251 –
Financing expenses – 1,454 –
– 1,705 –
Impairments of financial assets
Euro 000sUnconsolidated
shareholdingsLoans Trade receivables
< 1 yearOther operating
assets
Balance at 1 October 2016 1,337 1,766 35,642 1,998
Utilisations/disposals – – 11,638 201
Net additions 31 341 14,306 1,892
Reclassifications – – – – 363
Balance at 30 September 2017 1,368 2,107 38,310 3,326
Balance at 1 October 2017 1,368 2,107 38,310 3,326
Utilisations/disposals 883 121 14,312 279
Net additions 4 285 11,260 301
Balance at 30 September 2018 489 2,271 35,258 3,348
Impairment losses recognised in the 2018 financial year for individual IFRS 7 categories amounted to Euro 0 thousand for unconsolidated shareholdings (previous year: Euro 13 thou-sand), Euro 13,796 thousand for trade receivables (previous year: Euro 18,619 thousand) and Euro 715 thousand for other operating assets (previous year: Euro 2,598 thousand).
Notes to Balance Sheet | Notes to Consolidated Financial Statements | CONSOLIDATED FINANCIAL STATEMENTS
173
Annual Report 2018 | MVV

Netting of financial assets and financial liabilitiesThe financial assets and financial liabilities listed below are subject to netting, enforceable master netting agreements or similar arrangements.
Netting of financial assets at 30 September 2018
Euro 000s
Gross amount of financial
assets reported
Gross amount of financial
liabilities reported that are netted
in balance sheet
Net amount of financial
assets reported in balance sheet
Related amounts not netted in balance sheet
Net amount Financial
instrumentsCash collateral
received
Loans excluding finance leases 10,164 – 10,164 – – 10,164
Trade receivables < 1 year 519,751 – 138,022 381,729 – – 381,729
Derivative financial instruments 957,231 – 957,231 – 738,786 – 104,659 113,786
Other operating assets 96,767 – 6 96,761 – – 96,761
Cash and cash equivalents 310,589 – 310,589 – 13,982 – 296,607
1,894,502 – 138,028 1,756,474 – 752,768 – 104,659 899,047
Netting of financial liabilities at 30 September 2018
Euro 000s
Gross amount of financial
liabilities reported
Gross amount of financial
assets reported that are netted
in balance sheet
Net amount of financial
liabilities reported in balance sheet
Related amounts not netted in balance sheet
Net amount Financial
instrumentsCash collateral
received
Financial debt 1,340,759 – 1,340,759 – 5,210 – 700 1,346,669
Trade payables < 1 year 460,230 – 119,974 340,256 – – 340,256
Derivative financial instruments 849,026 – 849,026 – 738,786 – 27,596 1,615,408
Other operating liabilities 375,272 – 18,054 357,218 – – 357,218
3,025,287 – 138,028 2,887,259 – 743,996 – 28,296 3,659,551
Notes to Balance Sheet | Notes to Consolidated Financial Statements | CONSOLIDATED FINANCIAL STATEMENTS
174
Annual Report 2018 | MVV

Netting of financial assets at 30 September 2017
Euro 000s
Gross amount of financial
assets reported
Gross amount of financial
liabilities reported that are netted
in balance sheet
Net amount of financial
assets reported in balance sheet
Related amounts not netted in balance sheet
Net amount Financial
instrumentsCash collateral
received
Loans excluding finance leases 12,266 – 12,266 – – 12,266
Securities 7 – 7 – – 7
Trade receivables < 1 year 528,014 – 190,140 337,874 – – 337,874
Derivative financial instruments 431,569 – 431,569 – 145,320 – 16,534 269,715
Other operating assets 101,448 – 101,448 – – 101,448
Cash and cash equivalents 370,301 – 370,301 – 12,620 – 357,681
1,443,605 – 190,140 1,253,465 – 157,940 – 16,534 1,078,991
Netting of financial liabilities at 30 September 2017
Euro 000s
Gross amount of financial
liabilities reported
Gross amount of financial
assets reported that are netted
in balance sheet
Net amount of financial
liabilities reported in balance sheet
Related amounts not netted in balance sheet
Net amount Financial
instrumentsCash collateral
received
Financial debt 1,401,738 – 1,401,738 – 5,684 – 594 1,408,016
Trade payables < 1 year 506,599 – 155,420 351,179 – – 351,179
Derivative financial instruments 386,694 – 386,694 – 145,320 – 13,356 545,370
Other operating liabilities 506,663 – 34,720 471,943 – – 471,943
2,801,694 – 190,140 2,611,554 – 151,004 – 13,950 2,776,508
Notes to Balance Sheet | Notes to Consolidated Financial Statements | CONSOLIDATED FINANCIAL STATEMENTS
175
Annual Report 2018 | MVV

Net results by measurement categoryFinancial instruments have been recognised in the income statement with the following net results pursuant to IFRS 7:
Net results (IFRS 7)
Euro 000s FY 2018 FY 2017
Financial assets and financial liabilities held for trading 33,468 41,954
Financial assets available for sale 868 1,433
Loans and receivables – 5,385 – 14,887
The presentation of net results takes due account of stand-alone derivatives included in the “financial assets and financial liabilities held for trading” measurement category. The net result in the “financial assets and financial liabilities held for trading” category is largely attributable to fair value measure-ment pursuant to IAS 39.
The net result in the “financial assets available for sale” category chiefly involves income and distributions from shareholdings, as well as disposal gains.
The net results in the “loans and receivables” category pre-dominantly relate to write-downs and additions.
The interest income and interest expenses in connection with financial assets and financial liabilities measured at cost chiefly result from the total interest income and expenses presented below.
Total interest income and expenses
Euro 000s FY 2018 FY 2017
Total interest income 8,392 8,980
Total interest expenses 41,735 47,222
The financial result also includes interest components for pro-visions not covered by IFRS 7 disclosure requirements, as a result of which the figures published here differ from the financial result. The interest income reported here mainly results from credit balances at banks, overnight and fixed-term deposits, and loans. The interest expenses largely relate to loan obliga-tions. As in the previous year, total interest income does not include interest on financial assets already impaired.
Financing and price risksGeneral information about financing and price risks: Due to its business activities, MVV is exposed to various financial risks. These comprise receivables default and liquidity risks, interest and exchange rate risks and market price risks on both pro-curement and sales markets. MVV’s risk management pursues the objective of identifying developments on financial markets at an early stage and of countering any resultant negative implications. This is stipulated in internal guidelines, discre-tionary frameworks, responsibilities, separations of functions and checks.
Derivative financial instruments are used to cover against market price risk. For interest rate risks, these mainly involve interest swaps. Currency risks are hedged by concluding forward currency transactions. Commodity derivatives are deployed in the field of energy trading. The use of commodity derivatives for proprietary energy trading is only permitted within narrow limits and is monitored and managed with a separate limit system.
Receivables default risks: The risk of economic loss arising as a result of a business partner failing to meet its contractual payment obligations is referred to as receivables default risk. This encompasses both the risk of direct default and the risk of reduced creditworthiness. In its trading activities, MVV maintains its business relationships predominantly with banks and other trading partners of good credit standing.
Notes to Balance Sheet | Notes to Consolidated Financial Statements | CONSOLIDATED FINANCIAL STATEMENTS
176
Annual Report 2018 | MVV

Receivables default risks towards contractual partners are inspected upon conclusion of the contract and monitored continuously. This risk is limited by setting trading limits for transactions with business partners and, where appropriate, by demanding cash collateral. Where possible, default risk is already reduced in advance by means of suitable framework agreements with trading partners. Risk clusters only apply to an immaterial extent at various subsidiaries that have sales contracts with just one customer.
MVV is exposed to receivables default risks in its sales busi-ness, as customers may potentially fail to meet their payment obligations. This risk is limited by regularly inspecting the creditworthiness of major items in our customer portfolio.
In the carrying amounts recognised in the balance sheet for financial assets (receivables, derivatives and other assets, as well as cash and cash equivalents and assets held for sale), default risks have already been recognised in the form of impair-ments. The volume of receivables defaults was immaterial both in the year under report and the previous year.
As derivatives may be subject to substantial fluctuations in their fair values, the counterparty risk of derivative financial assets has been presented in the following overview. Only recognised accounts have been included. Where netting agree-ments are in place with a trading partner, the actual risk, i.e. the net risk, has been presented. No account has been taken of counterparties with negative balances, i.e. where there is no counterparty risk. In all other cases, the figures have not been netted against negative fair values.
Counterparty risk at 30 September 2018
Euro 000s Total of which < 1 year of which 1 to 5 years
Counterparty rating as per Standard & Poor’s and/or Moody’s
Nominal value
Counterparty risk
Nominal value
Counterparty risk
Nominal value
Counterparty risk
AAA and Aaa to AA – and Aa3 308,847 112,939 220,000 81,704 88,847 31,235
A + and A1 to A – and A3 212,626 119,824 132,261 69,891 80,365 49,933
BBB + and Baa1 to BBB – and Baa3 115,144 31,477 84,293 23,320 30,851 8,157
BB + and Ba1 to BB – and Ba3 9,790 3,943 5,113 2,665 4,677 1,278
Other 1,744,237 759,176 1,204,832 552,393 539,405 206,783
2,390,644 1,027,359 1,646,499 729,973 744,145 297,386
Counterparty risk at 30 September 2017
Euro 000s Total of which < 1 year of which 1 to 5 years
Counterparty rating as per Standard & Poor’s and/or Moody’s
Nominal value
Counterparty risk
Nominal value
Counterparty risk
Nominal value
Counterparty risk
AAA and Aaa to AA – and Aa3 318,607 69,106 86,958 33,162 231,649 35,944
A + and A1 to A – and A3 44,951 9,338 14,207 4,038 30,744 5,300
BBB + and Baa1 to BBB – and Baa3 274,579 60,773 108,450 33,786 166,129 26,987
BB + and Ba1 to BB – and Ba3 – – – – – –
Other 923,782 186,162 277,162 79,680 646,620 106,482
1,561,919 325,379 486,777 150,666 1,075,142 174,713
Notes to Balance Sheet | Notes to Consolidated Financial Statements | CONSOLIDATED FINANCIAL STATEMENTS
177
Annual Report 2018 | MVV

As in the previous year, there are no receivables default risks with terms longer than five years. Major shares of the nominal derivative volumes in question involve trading partners for which external ratings are available. Internal ratings are avail-able for the nominal derivative volumes reported under “Other”.
For trading transactions concluded with stock exchanges, security payments are deposited in order to reduce any addi-tional receivables default risks.
The receivables default risks involved in financial assets and their maturities broken down by category are structured as follows:
Receivables default risks and maturities at 30 September 2018
Euro 000s
Loans
Trade receivables
< 1 year
Other operating
assets
Neither overdue nor impaired 60,412 297,158 41,493
Overdue but not impaired
≤ 6 months – 34,001 197
> 6 months ≤ 1 year – 4,500 –
> 1 year – 8,809 50
Net value of assets written down – 37,261 1,514
60,412 381,729 43,254
Receivables default risks and maturities at 30 September 2017
Euro 000s
Loans
Trade receivables
< 1 year
Other operating
assets
Neither overdue nor impaired 62,178 264,245 45,949
Overdue but not impaired
≤ 6 months – 39,290 928
> 6 months ≤ 1 year – 7,499 74
> 1 year – 4,314 1,618
Net value of assets written down – 35,756 1,752
62,178 351,104 50,321
Liquidity risks: Liquidity risk involves the risk of a company being unable to meet its financial obligations adequately. MVV is subject to liquidity risks as a result of its obligation to meet its liabilities in full and on time, as well as its obligation to service security payments (margins) from energy trading partners. Cash and liquidity management at MVV is respon-sible for maintaining the company’s solvency at all times. This involves calculating all cash requirements and all cash surpluses. The major subgroups have a cash pooling process which enables liquidity requirements and surpluses to be balanced at short notice, thus reducing bank transactions to a necessary minimum.
A financial budget is compiled for liquidity management pur-poses. Any financing requirements arising are covered by means of suitable liquidity management instruments. Alongside the liquidity available on a daily basis, MVV has further liquidity reserves in the form of committed credit lines. The volume of contractually committed credit lines is structured in such a way as to ensure that the Group has adequate liquidity reserves available at all times, even in a difficult market climate. In view of its available liquidity and existing credit lines, MVV does not see itself as being exposed to any material liquidity risks.
Covenants customary to the industry have been agreed with some of the financing banks. These entitle the banks to ter-minate the facilities in the event of any material deterioration in the company’s asset, financial and earnings position. All covenants had been complied with as of the balance sheet date on 30 September 2018.
MVV’s group companies are generally financed by banks and by MVV Energie AG.
Items of security have been provided to banks to limit their risks in connection with loans granted to MVV. These are subdivided into non-current assets, receivables and cash and cash equivalents with a total amount of Euro 11,576 thousand (previous year: Euro 9,776 thousand) and interests in sub-sidiaries amounting to Euro 3,337 thousand (previous year: Euro 14,045 thousand).
Notes to Balance Sheet | Notes to Consolidated Financial Statements | CONSOLIDATED FINANCIAL STATEMENTS
178
Annual Report 2018 | MVV

Contractually agreed outflows of funds for financial liabilities are presented in undiscounted form in the table below. The figures include the corresponding interest payments.
Undiscounted cash flows
30 September 2018 30 September 2017
Euro 000sMaturities
< 1 yearMaturities 1 – 5 years
Maturities > 5 years
Maturities < 1 year
Maturities 1 – 5 years
Maturities > 5 years
Non-derivative financial liabilities
Liabilities to banks 244,899 564,047 678,077 169,907 677,853 697,408
Liabilities in connection with finance leases 5,571 21,295 40,958 5,970 19,844 45,643
Trade payables 340,256 816 2,796 351,179 421 26
Other financial debt 7,455 13,616 11,224 8,456 17,313 15,835
Other financial liabilities 148,460 7,569 15,629 69,792 4,369 6,063
Derivative financial liabilities 573,261 180,666 27 237,412 121,211 39
1,319,902 788,009 748,711 842,716 841,011 765,014
Interest rate risk: Interest rate risks relate to credit balances at banks on the asset side and to floating-rate liabilities to banks on the liabilities side of the balance sheet.
The sensitivity analysis below presents the impact of changes in interest rates on annual earnings and equity. This analysis has been based on the assumption that there are no changes in any other parameters, such as exchange rates. The analysis only includes financial instruments where interest rate risk could impact on equity or annual earnings. For the calculation, we have assumed that interest rates are 10 % higher or lower throughout the financial year.
Any upward or downward variance in the level of interest rates in the euro area by 10 % as of the balance sheet date on 30 September 2018 would have led annual net income to deteriorate/improve by a total of Euro 0 thousand/Euro 0 thousand (previous year: Euro 0 thousand/Euro 0 thousand). This variance would have reduced/increased equity by a total of Euro 1,264 thousand/Euro 1,972 thousand (previous year: Euro 944 thousand/Euro 1,281 thousand).
Foreign currency risks: Foreign currency risks mainly relate to our UK projects. During the operating stage of the projects, cash flows are generated exclusively in British pounds. The resultant foreign currency risks are hedged by natural hedges in the form of currency-congruent financing and by using derivative financial instruments, which means that no material risk arises for MVV in this respect. In view of this, no disclosures of foreign currency risks have been provided.
Commodity price risks: Within the framework of our energy trading activities, energy trading contracts are concluded for the purposes of price risk management, adjustments to actual loads and margin optimisation. All transactions are governed by narrow, clearly defined limits which have to be adhered to at all times.
Notes to Balance Sheet | Notes to Consolidated Financial Statements | CONSOLIDATED FINANCIAL STATEMENTS
179
Annual Report 2018 | MVV

Price change risks chiefly arise in connection with the procure-ment and disposal of electricity and gas and the procurement of coal and emission rights. These price risks are hedged with suitable financial instruments by reference to the stipulated limits. Derivative hedging instruments were used in the year under report. The hedging instruments used mainly involved forwards, futures, swaps and options. We have set specific and differentiated limits and warning thresholds for the market risks associated with the commodities we trade. In this context, we also work with the value at risk (VaR) concept to calculate potential losses from commodities trading and use a confidence interval of 95 % for this purpose.
The sensitivity involved in the measurement of electricity, coal, gas and emission right derivatives is analysed in the following section. This analysis has been based on the assumption that there are no changes in all other parameters and that there is mutual dependency between the commodities. The analysis only includes derivatives for which fluctuations in market
values could impact on equity or annual earnings. These involve derivatives requiring mandatory recognition. The analysis does not include derivatives earmarked for the physical delivery of non-financial items in line with the company’s expected pro-curement, sale or utilisation (own use). These do not require recognition under IAS 39.
If the market price at the balance sheet date on 30 September 2018 had been 10 % higher/lower, this would have increased/decreased annual net income by Euro 19,140 thousand/ Euro 19,724 thousand (previous year: Euro 8,808 thousand/Euro 8,856 thousand). Equity as of the same reporting date would have increased/decreased by Euro 27,596 thousand/Euro 27,770 thousand (previous year: Euro 15,753 thousand/Euro 15,801 thousand).
The following table presents the nominal volumes and fair values of the derivatives used:
Nominal volumes and fair values
30 September 2018 30 September 2017
Nominal volumes Fair values Nominal volumes Fair values
Euro 000s
Total
of which with remaining
terms of more than 1 year
Total
of which with remaining
terms of more than 1 year
Interest derivatives 535,831 510,228 – 19,116 447,890 337,856 – 29,764
Commodity derivatives 4,679,378 1,398,691 128,312 3,900,442 953,409 74,231
Currency derivatives 16,725 1,423 – 990 20,954 57 408
5,231,934 1,910,342 108,206 4,369,286 1,291,322 44,875
Interest derivatives relate almost exclusively to interest swaps. Currency derivatives are mainly intended to hedge foreign exchange risks.
Notes to Balance Sheet | Notes to Consolidated Financial Statements | CONSOLIDATED FINANCIAL STATEMENTS
180
Annual Report 2018 | MVV

Commodity derivatives can be subdivided as follows:
Commodity derivatives
30 September 2018 30 September 2017
Euro 000sNominal volumes
Fair values
Nominal volumes
Fair values
Commodity derivatives
Electricity 2,837,379 32,912 2,581,052 46,194
Coal 38,678 35,160 25,472 19,313
Gas 1,643,190 7,895 1,242,506 4,051
CO2 rights 160,014 51,766 50,675 5,083
Other 1,499 579 737 – 411
4,680,760 128,312 3,900,442 74,230
Commodity derivatives
Futures 4,641,273 93,822 3,874,293 54,687
Swaps 39,487 34,490 25,472 19,313
Options – – 677 230
4,680,760 128,312 3,900,442 74,230
The positive fair values amounting to Euro 957,231 thousand (previous year: Euro 431,569 thousand) are countered by margining liabilities of Euro 77,258 thousand (previous year: Euro 3,304 thousand). These are reported under other liabilities. The negative fair values of Euro 849,025 thousand (previous year: Euro 386,694 thousand) are countered by cash collateral of Euro 194 thousand (previous year: Euro 126 thousand).
Capital managementMVV Energie AG is not subject to any statutory minimum capital requirements, but pursues its internal objective of using effective financial management to maintain its equity ratio at a level necessary to attain a good implicit rating on the financial market and to boost the company’s earnings strength.
The adjusted equity ratio referred to for management purposes represents adjusted consolidated equity as a proportion of ad- justed total assets. Adjusted equity consists of all equity items reported in the consolidated financial statements, including non-controlling and minority interests, but excluding non- operating IAS 39 derivative measurement items and the asso-ciated impact on deferred taxes. It is intended to maintain an adjusted equity ratio of at least 30 %.
Measures to comply with the targeted equity ratio initially take place within the business planning process and within the framework of investment budgeting in the case of major (unplanned) investment measures. By retaining earnings and issuing shares, the company can basically adjust its equity base to requirements.
The key figure used in our value-based corporate management and the capital management thereby required is the value spread. This key figure is calculated as the difference between the period-based adjusted return on capital employed (adjusted ROCE) and the weighted average cost of capital (WACC).
There were no changes in the underlying capital management requirements compared with the previous year.
Notes to Balance Sheet | Notes to Consolidated Financial Statements | CONSOLIDATED FINANCIAL STATEMENTS
181
Annual Report 2018 | MVV

36. Segment reportingMVV adjusted its segment reporting as of 1 October 2017. The reporting now reflects the consistent alignment of our sales activities to the needs of our customers. The new structure also accounts for the growing importance of our business activities in the fields of renewable energies and energy efficiency, as
well as our consistent and sustainable focus on ensuring high supply reliability.
The following overview presents segment reporting based on the previous reporting structure for the period from 1 October 2016 to 30 September 2017:
Segment report from 1 October 2016 to 30 September 2017
Euro 000sExternal sales
excl. energy taxesIntercompany sales
excl. energy taxesScheduled
depreciationImpairment
losses
Generation and Infrastructure 937,032 667,080 138,273 1,794
Trading and Portfolio Management 790,153 611,758 67 –
Sales and Services 2,175,306 447,619 15,937 771
Strategic Investments 103,937 3,646 11,207 –
Other Activities 3,088 25,632 14,699 –
Consolidation – – 1,755,735 – –
4,009,516 – 180,183 2,565
Euro 000s
Material non-cash income
and expenses
Adjusted EBIT
Income from companies
recognised at equity
Investments
Generation and Infrastructure 3,654 183,246 7,074 149,608
Trading and Portfolio Management 2,781 – 21,445 – 862 –
Sales and Services 12,910 36,190 – 4,668 24,786
Strategic Investments 1,110 24,192 9,842 6,983
Other Activities 4,063 2,158 556 12,087
Consolidation – 51 – –
24,518 224,392 11,942 193,464
Notes to Balance Sheet | Notes to Consolidated Financial Statements | CONSOLIDATED FINANCIAL STATEMENTS
182
Annual Report 2018 | MVV

The segment reporting based on the new reporting structure is presented below for the current financial year and for the previous year:
Segment report from 1 October 2017 to 30 September 2018
Euro 000sExternal sales
excl. energy taxesIntercompany sales
excl. energy taxesScheduled
depreciationImpairment
losses
Customer Solutions 2,819,400 148,373 14,812 9,364
New Energies 737,658 106,737 76,160 24,201
Supply Reliability 256,129 612,471 64,547 –
Strategic Investments 87,198 2,608 11,263 141
Other Activities 2,375 24,017 13,898 –
Consolidation – – 894,206 – –
3,902,760 – 180,680 33,706
Euro 000s
Material non-cash income
and expenses
Adjusted EBIT
Income from companies
recognised at equity
Investments
Customer Solutions 6,488 46,657 – 1,915 29,542
New Energies 3,040 89,596 4,159 81,244
Supply Reliability 14,213 62,545 – 11,549 156,772
Strategic Investments 2,198 25,357 9,183 10,525
Other Activities 1,529 3,776 12 11,495
Consolidation – – – –
27,468 227,931 – 110 289,578
Segment report from 1 October 2016 to 30 September 2017 (previous year adjusted)
Euro 000sExternal sales
excl. energy taxesIntercompany sales
excl. energy taxesScheduled
depreciationImpairment
losses
Customer Solutions 2,965,173 177,230 15,940 771
New Energies 670,245 94,897 72,237 1,794
Supply Reliability 267,073 672,085 66,100 –
Strategic Investments 103,937 3,646 11,207 –
Other Activities 3,088 25,632 14,699 –
Consolidation – – 973,490 – –
4,009,516 – 180,183 2,565
Euro 000s
Material non-cash income
and expenses
Adjusted EBIT
Income from companies
recognised at equity
Investments
Customer Solutions 14,803 42,478 – 4,668 24,786
New Energies – 241 87,047 3,420 20,952
Supply Reliability 3,067 68,466 2,792 128,656
Strategic Investments – 24,192 9,842 6,983
Other Activities 6,889 2,158 556 12,087
Consolidation – 51 – –
24,518 224,392 11,942 193,464
Notes to Balance Sheet | Notes to Consolidated Financial Statements | CONSOLIDATED FINANCIAL STATEMENTS
183
Annual Report 2018 | MVV

External reporting is based on the internal management structure, thus complying with the management approach pursuant to IFRS 8. Units are grouped in such a way that the pooling of suitable specialist competence under one roof forms the basis for stringent portfolio management at the Group. Business fields based on the respective energy industry value chain stages have been allocated to the reporting segments of Customer Solutions, New Energies, Supply Reliability, Strategic Investments and Other Activities. The characteristics used to identify and aggregate the segments relate to the type of prod-ucts and services, the type of production processes, the asset and capital intensity, customer structures and needs, the sales methods used and, where applicable, the regulatory framework.
Analytically, the business fields can be further broken down by subgroup and individual company with their products.
• The Customer Solutions reporting segment is subdivided into the business fields of commodities, retail and business. It comprises the retail and secondary distribution business with electricity, heating energy, gas and water, the solu-tions business for corporate customers and the service and trading business at MVV Trading GmbH.
The key focus of aggregation for these business fields relates to the service business and to customer needs. The customer is the key focus of the business, use is made of comparable services methods, activities and marketing processes for the customers are pooled and almost exclusively target external customers (e.g. sales to third parties).
• The energy from waste plants, biomass power plants, wind turbines, biomethane and biogas plants are allocated to the New Energies reporting segment. This reporting segment also includes the renewable energies project development and operations management activities.
The business fields aggregated in this segment focus on providing services, solutions and products in connection with renewable energies. The activities within this report-ing segment involve the planning, approval, development, construction and operation of technical plants to generate electricity and heating energy from sustainable/partly sustainable commodities such as wind, waste timber, non-recyclable forest timber, green cuttings, waste/RDF, biogas and sunshine. The processes are characterised by long planning, approval, construction and operating stages.
• In additional to conventional energy generation, the Supply Reliability reporting segment also includes grid facilities for electricity, heating energy, gas and water. It comprises combined heat and power generation, grid facilities and further facilities required to provide our customers with a secure supply of electricity, heating energy, gas and water.
The business fields aggregated in this segment serve to provide customers with a reliable and stable supply of various products. All facilities are characterised by high asset intensity, long technical lifecycles and long-term financing structures.
• The Strategic Investments reporting segment consists of the Köthen Energie and MVV Energie CZ subgroups and the at-equity results of select shareholdings in municipal utility companies.
• The Other Activities reporting segment consists in particu-lar of the shared service companies and cross-divisional functions.
• Consolidation includes figures for transactions with other reporting segments that are eliminated for consolidation purposes.
Intercompany sales represent the volume of sales between segments. The transfer prices between segments correspond to customary market terms. Segment sales prior to consolidation are equivalent to the total of intercompany and external sales.
Notes to Balance Sheet | Notes to Consolidated Financial Statements | CONSOLIDATED FINANCIAL STATEMENTS
184
Annual Report 2018 | MVV
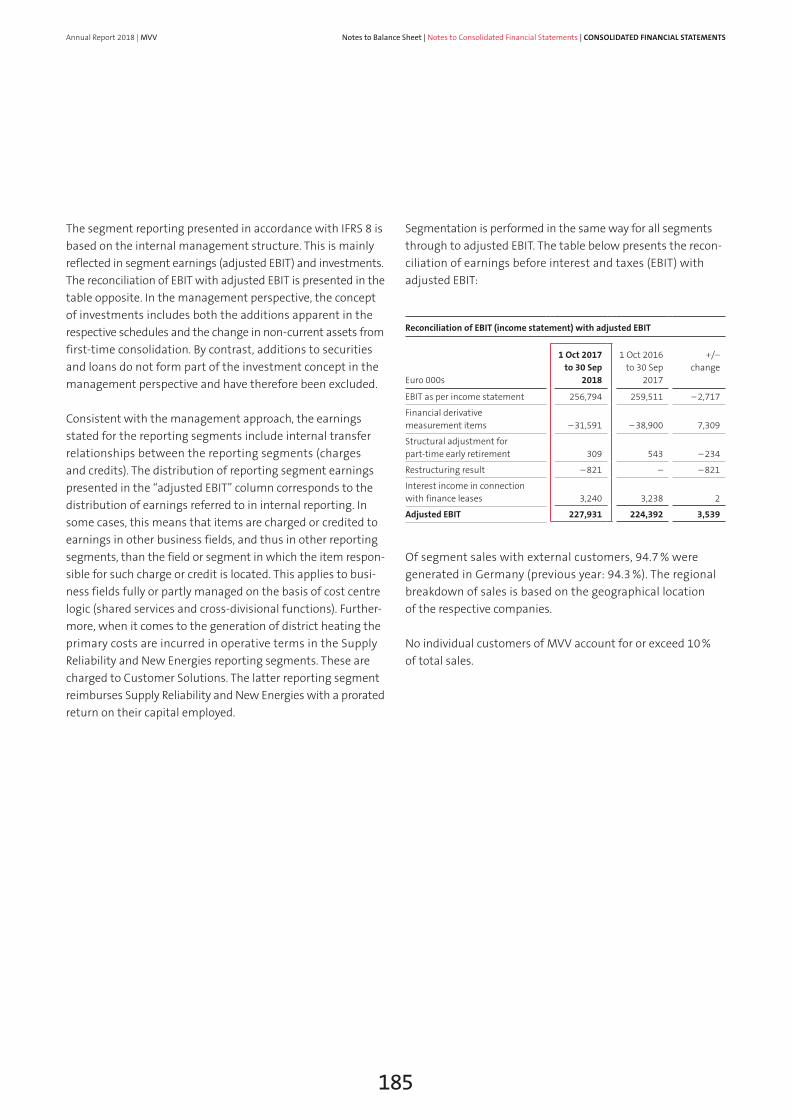
The segment reporting presented in accordance with IFRS 8 is based on the internal management structure. This is mainly reflected in segment earnings (adjusted EBIT) and investments. The reconciliation of EBIT with adjusted EBIT is presented in the table opposite. In the management perspective, the concept of investments includes both the additions apparent in the respective schedules and the change in non-current assets from first-time consolidation. By contrast, additions to securities and loans do not form part of the investment concept in the management perspective and have therefore been excluded.
Consistent with the management approach, the earnings stated for the reporting segments include internal transfer relationships between the reporting segments (charges and credits). The distribution of reporting segment earnings presented in the “adjusted EBIT” column corresponds to the distribution of earnings referred to in internal reporting. In some cases, this means that items are charged or credited to earnings in other business fields, and thus in other reporting segments, than the field or segment in which the item respon-sible for such charge or credit is located. This applies to busi-ness fields fully or partly managed on the basis of cost centre logic (shared services and cross-divisional functions). Further-more, when it comes to the generation of district heating the primary costs are incurred in operative terms in the Supply Reliability and New Energies reporting segments. These are charged to Customer Solutions. The latter reporting segment reimburses Supply Reliability and New Energies with a prorated return on their capital employed.
Segmentation is performed in the same way for all segments through to adjusted EBIT. The table below presents the recon-ciliation of earnings before interest and taxes (EBIT) with adjusted EBIT:
Reconciliation of EBIT (income statement) with adjusted EBIT
Euro 000s
1 Oct 2017 to 30 Sep
2018
1 Oct 2016 to 30 Sep
2017
+/– change
EBIT as per income statement 256,794 259,511 – 2,717
Financial derivative measurement items – 31,591 – 38,900 7,309
Structural adjustment for part-time early retirement 309 543 – 234
Restructuring result – 821 – – 821
Interest income in connection with finance leases 3,240 3,238 2
Adjusted EBIT 227,931 224,392 3,539
Of segment sales with external customers, 94.7 % were generated in Germany (previous year: 94.3 %). The regional breakdown of sales is based on the geographical location of the respective companies.
No individual customers of MVV account for or exceed 10 % of total sales.
Notes to Balance Sheet | Notes to Consolidated Financial Statements | CONSOLIDATED FINANCIAL STATEMENTS
185
Annual Report 2018 | MVV

37. Cash flow statementThe cash flow statement shows the flow of funds from oper-ating activities, investing activities and financing activities. The cash flows from investing and financing activities are calculated directly. The cash flow from operating activities, on the other hand, has been derived indirectly. The amount of cash and cash equivalents stated in the cash flow statement is consistent with the corresponding figure in the balance sheet.
Inflows and outflows of funds from the acquisition and disposal of consolidated companies are included in the cash flow from investing activities.
Following the elimination of non-cash income and expenses and the non-operating result, the slight increase in earnings before taxes (EBT) led to a cash flow before working capital and taxes of Euro 450 million.
The year-on-year reduction in the cash flow from operating activities by Euro 142 million was due to a lower inflow of funds from changes in other assets and other liabilities. The largest items related to a more marked increase in receivables, the change in prepayments received on orders for projects due to be implemented and the sharp fall in inventories. To enhance the presentation of the change in other assets and other liabilities, since the 2nd quarter of the 2018 financial year non-cash IAS 39 derivative measurement items have no longer been presented in the aforementioned line items. The previous year’s figures have been adjusted accordingly.
The development in the cash flow from investing activities was shaped by higher payments for investments – in particular for the construction of a new heat and power plant in the Scottish city of Dundee in conjunction with the takeover of a disposal contract and for the new coastal power plant Küstenkraftwerk K.I.E.L. The high volume of proceeds from the sale of other financial assets in the previous year’s period, which was not matched by any equivalent items in the current financial year, additionally reduced the cash flow from investing activities compared with the previous year’s figure. These factors were opposed above all by the inflow of funds generated from sales of non-current assets. Overall, the cash flow from investing activities decreased year-on-year by Euro 47 million.
The cash flow from financing activities rose by Euro 92 million compared with the 2017 financial year, a development largely due to higher net borrowing.
MVV reported cash and cash equivalents of Euro 311 million as of 30 September 2018 (30 September 2017: Euro 370 million).
The reconciliation of liabilities in connection with financing activities, a new requirement of the IAS 7 Disclosure Initiative, is summarised in the following overview:
Liabilities in connection with financing activities
Euro 000s
30 Sep 2017
Cash- effective changes
Non-cash-effective changes 30 Sep 2018
Change in scope of consoli-
dation
Changes in exchange
rates
Fair value changes
Liabilities to banks 1,361,877 – 51,434 – – 1,409 – 1,309,034
Liabilities in connection with finance leases 45,902 – 665 – – – 45,237
Other financial debt 39,861 – 8,248 115 –3 – 31,725
1,447,640 – 60,347 115 – 1,412 – 1,385,996
Notes to Balance Sheet | Notes to Consolidated Financial Statements | CONSOLIDATED FINANCIAL STATEMENTS
186
Annual Report 2018 | MVV

38. Related party disclosuresBusiness transactions performed between the parent company and its consolidated subsidiaries, which constitute related parties, are not outlined in this section, as they were eliminated in the course of consolidation.
The City of Mannheim is the sole shareholder in MKB Mann-heimer Kommunalbeteiligungen GmbH (previously: MVV GmbH). MKB Mannheimer Kommunalbeteiligungen GmbH owns 99.99 % of the shares in MV Mannheimer Verkehr GmbH (previously: MVV Verkehr GmbH), which in turn has a 50.1 % shareholding in MVV Energie AG. The City of Mannheim and the companies it controls therefore represent related parties as defined in IFRS.
Numerous contractually agreed legal relationships are in place between the MVV companies and the City of Mannheim and the companies it controls (electricity, gas, water and district heating supply agreements, rental, leasing and service agree-ments). Moreover, concession agreements are also in place between MVV Energie AG and the City of Mannheim.
The concession duties to the City of Mannheim amounted to Euro 18,314 thousand (previous year: Euro 19,040 thousand).
All business agreements have been concluded on customary market terms and are basically analogous to the supply and service agreements concluded with other companies.
Related party disclosures
Goods and services provided Receivables Liabilities
Income Expenses
Euro 000s1 Oct 2017 to
30 Sep 20181 Oct 2016 to
30 Sep 20171 Oct 2017 to
30 Sep 20181 Oct 2016 to
30 Sep 201730 Sep 2018 30 Sep 2017 30 Sep 2018 30 Sep 2017
City of Mannheim 14,910 13,956 23,599 23,518 938 331 5,276 9,857
Abfallwirtschaft Mannheim 7,593 6,385 1,617 877 1,243 1,297 403 149
GBG Mannheimer Wohnungsbau-gesellschaft mbH 12,625 13,473 166 145 841 117 – 12
m:con – mannheim: congress GmbH 4,022 3,952 419 425 6,540 6,764 – 1
MKB Mannheimer Kommunalbeteili-gungen GmbH (previously: MVV GmbH) 63 68 60 – – 1 – –
MV Mannheimer Verkehr GmbH (previously: MVV Verkehr GmbH) 29 34 6 5 – 5 – –
Rhein-Neckar-Verkehr GmbH 6,532 6,324 1,371 76 1,208 2,735 1,552 1,724
Stadtentwässerung Mannheim 1,545 1,410 414 429 74 78 – 11
Companies recognised at equity 74,205 80,514 229,239 231,561 21,568 16,437 35,942 21,405
Other related parties 25,854 23,972 3,490 4,666 5,085 4,587 1,513 1,930
147,378 150,088 260,381 261,702 37,497 32,352 44,686 35,089
Notes to Balance Sheet | Notes to Consolidated Financial Statements | CONSOLIDATED FINANCIAL STATEMENTS
187
Annual Report 2018 | MVV

The income and expenses with related parties include income of Euro 31 thousand (previous year: Euro 26 thousand) and expenses of Euro 374 thousand (previous year: Euro 395 thou-sand) for goods and services provided to management staff performing key functions.
Pursuant to IAS 24, related parties also include manage- ment staff performing key functions. Alongside the Executive Board, this group of persons at MVV also includes active heads of division and authorised company representatives of MVV Energie AG.
Customer contracts concerning the supply of electricity, gas, water and district heating have been concluded between MVV Energie AG and members of its Executive and Super-visory Boards and members of the management (division heads, authorised representatives). These have been concluded on customary market terms and do not differ from other cus-tomer contracts.
MVV has otherwise not concluded or performed any material related party transactions. In particular, as in the previous year no loans or advances had been granted to members of the Executive or Supervisory Boards as of 30 September 2018. As in the previous year, the company also did not issue any guaran-tees on behalf of Executive or Supervisory Board members.
MVV Energie AG has compiled a dependent company report in accordance with § 312 AktG for the financial year ending on 30 September 2018.
The disclosure requirements for the compensation of manage-ment staff performing key functions at the Group cover the compensation paid to active members of the Executive Board, the Supervisory Board, active division heads and authorised representatives.
Active members of the Executive Board members were com-pensated as follows:
Executive Board compensation
Euro 000s FY 2018 FY 2017
Short-term employee benefits 2,209 2,318
Post-employment benefits – 737
Total 2,209 3,055
The Executive Board members of MVV Energie AG do not receive any share-based payments.
Post-employment benefits correspond to the service cost resulting from pension provisions for active members of the Executive Board.
The compensation paid to active division heads and authorised representatives came to Euro 2,439 thousand in the year under report (previous year: Euro 2,928 thousand). Of this total, Euro 2,332 thousand involved current benefits (previous year: Euro 2,801 thousand).
Unless they are insured via municipal supplementary pension companies (ZVKs), management staff performing key functions receive a defined contribution company pension of up to 8.6 % of their fixed basic compensation. They can determine the biometric risks which should be covered. The expenses incurred for this amounted to Euro 107 thousand in the 2018 financial year (previous year: Euro 127 thousand).
Active members of the Supervisory Board were compensated as follows:
Supervisory Board compensation
Euro 000s FY 2018 FY 2017
Fixed compensation (including meeting allowances) 412 410
Individualised information and further details concerning the compensation of Executive and Supervisory Board members can be found in the audited Compensation Report, which forms part of the Combined Management Report.
Former members of the Executive Board received benefits of Euro 513 thousand in the year under report (previous year: Euro 468 thousand). Provisions totalling Euro 16,758 thousand have been stated for pension obligations towards former Executive Board members (previous year: Euro 16,784 thou-sand). A total of Euro 336 thousand was allocated to this item in the year under report (previous year: Euro 275 thousand).
Notes to Balance Sheet | Notes to Consolidated Financial Statements | CONSOLIDATED FINANCIAL STATEMENTS
188
Annual Report 2018 | MVV

39. MVV’s shareholdings
List of MVV’s shareholdings at 30 September 2018
Town/city Country Share of capital 1
%Footnote
Fully consolidated subsidiaries
Associates (Germany)
ABeG Abwasserbetriebsgesellschaft mbH Offenbach am Main Germany 51.00
AVA Abwasser- und Verwertungsanlagen GmbH Mörfelden-Walldorf Germany 100.00 4
BEEGY GmbH Mannheim Germany 100.00
BEG Gernsbacher Höhe UG (haftungsbeschränkt) & Co. KG Mainz Germany 0.00 5
BEG Haunetal UG (haftungsbeschränkt) & Co. KG Gundersheim Germany 0.00 5
BFE Institut für Energie und Umwelt GmbH Mühlhausen Germany 100.00 4
Biokraft Naturbrennstoffe GmbH Offenbach am Main Germany 100.00
Biomethananlage Barby GmbH Mannheim Germany 100.00
Biomethananlage Klein Wanzleben GmbH Mannheim Germany 100.00
Biomethananlage Kroppenstedt GmbH Mannheim Germany 100.00
Biomethananlage Staßfurt GmbH Mannheim Germany 100.00
Cerventus Naturenergie GmbH Offenbach am Main Germany 50.00
Cerventus Naturenergie Verwaltungs GmbH Offenbach am Main Germany 100.00
Dabit Grundstücksverwaltungsgesellschaft mbH & Co. Vermietungs KG Mainz Germany 94.00
econ solutions GmbH Germering (domicile: Mannheim) Germany 100.00
Energienetze Offenbach GmbH Offenbach am Main Germany 100.00 4
Energieversorgung Dietzenbach GmbH Dietzenbach Germany 50.00
Energieversorgung Offenbach Aktiengesellschaft Offenbach am Main Germany 48.42 2
eternegy GmbH Mannheim Germany 100.00
EVO Vertrieb GmbH Offenbach am Main Germany 100.00
FRASSUR GmbH Umweltschutz-Dienstleistungen Mörfelden-Walldorf Germany 100.00
Gasversorgung Offenbach GmbH Offenbach am Main Germany 74.90
Götzfried + Pitzer Entsorgung GmbH Ulm Germany 100.00
IGS Netze GmbH Gersthofen Germany 100.00 4
Infrastruktur Amöneburg-Roßdorf GmbH & Co. KG Wörrstadt Germany 28.56 6
Infrastruktur Callbach GmbH & Co. KG Wörrstadt Germany 71.40
Infrastruktur Fahlenberg GmbH & Co. KG Wörrstadt Germany 50.00
Infrastruktur Oberheimbach II GmbH & Co. KG Wörrstadt Germany 72.00
Infrastruktur Waldweiler GmbH & Co. KG Wörrstadt Germany 60.40
Infrastrukturgesellschaft Hungerberg GmbH & Co. KG Offenbach am Main Germany 100.00
Infrastrukturgesellschaft Schmölln GmbH & Co. KG Wörrstadt Germany 41.32
Infrastrukturgesellschaft Veldenz GmbH & Co. KG Wörrstadt Germany 61.86
juwi AG Wörrstadt Germany 63.12
juwi Bio Germany 19 GmbH & Co. KG Wörrstadt Germany 100.00
juwi Bio Service & Betriebs GmbH Wörrstadt Germany 100.00
juwi Green Energy GmbH Wörrstadt Germany 100.00 4
juwi Operations & Maintenance GmbH Wörrstadt Germany 100.00 4
juwi Verwaltungs GmbH Wörrstadt Germany 100.00
juwi Wind Germany 135 GmbH & Co. KG Wörrstadt Germany 88.00
juwi Wind Germany 162 GmbH & Co. KG Wörrstadt Germany 80.00
juwi Wind Germany 33 GmbH & Co. KG Wörrstadt Germany 100.00
Notes to Balance Sheet | Notes to Consolidated Financial Statements | CONSOLIDATED FINANCIAL STATEMENTS
189
Annual Report 2018 | MVV

List of MVV’s shareholdings at 30 September 2018
Town/city Country Share of capital 1
%Footnote
juwi Wind Germany 70 GmbH & Co. KG Wörrstadt Germany 100.00
juwi Wind Germany Verwaltungs GmbH Wörrstadt Germany 100.00
Köthen Energie GmbH Köthen Germany 100.00
MDW Muldendienst West GmbH Frankfurt am Main Germany 100.00
MVV Alpha fünfzehn GmbH Mannheim Germany 100.00 4
MVV Biogas Bernburg GmbHMannheim (domicile: Bernburg/Saale) Germany 90.00 5
MVV Biogas Dresden GmbH (previously: KOMPOTEC Dresden GmbH) Mannheim (domicile: Dresden) Germany 100.00 5
MVV decon GmbH Mannheim Germany 100.00
MVV Enamic GmbH Mannheim Germany 100.00 4
MVV Enamic Korbach GmbH Korbach Germany 100.00 4
MVV Enamic Ludwigshafen GmbH Mannheim Germany 100.00
MVV Enamic Naturenergie GmbH Mannheim Germany 100.00
MVV EnergySolutions GmbH Mannheim Germany 100.00 4
MVV Grünenergie GmbH Mannheim Germany 100.00 4
MVV ImmoSolutions GmbH Berlin Germany 100.00 4
MVV Industriepark Gersthofen GmbH Gersthofen Germany 100.00 4
MVV Netze GmbH Mannheim Germany 100.00 4
MVV RHE GmbH Mannheim Germany 100.00 4
MVV Trading GmbH Mannheim Germany 97.50 4
MVV Umwelt Asset GmbH Mannheim Germany 100.00 4
MVV Umwelt GmbH Mannheim Germany 100.00 4
MVV Umwelt Ressourcen GmbH Mannheim Germany 100.00 4
MVV Umwelt UK GmbH Mannheim Germany 100.00 4
MVV Windenergie Deutschland GmbH Mannheim Germany 100.00
MVV Windenergie GmbH Mannheim Germany 100.00 4
MVV Windpark Freudenberg GmbH Mannheim Germany 100.00
MVV Windpark Plauerhagen GmbH & Co. KG Ostseebad Rerik Germany 100.00
Netzgesellschaft Köthen mbH Köthen Germany 100.00 4, 6
New Breeze GmbH Wörrstadt Germany 100.00
New Breeze GmbH & Co. GreenPower 44 KG Wörrstadt Germany 100.00
Soluvia Billing GmbH Offenbach am Main Germany 100.00 4
Soluvia GmbH Mannheim Germany 100.00
Soluvia IT-Services GmbH Kiel Germany 100.00 4
Soluvia Metering GmbH Offenbach am Main Germany 100.00 4
Stadtwerke Kiel Aktiengesellschaft Kiel Germany 51.00
SWKiel Netz GmbH Kiel Germany 100.00 4
SWKiel Speicher GmbH Kiel Germany 100.00 4
Umspannwerk Kirchberg 2 GmbH & Co. KG Wörrstadt Germany 51.60
Windpark Albisheim GmbH & Co. KG Offenbach am Main Germany 100.00
Windpark Dirlammen GmbH & Co. KG Offenbach am Main Germany 100.00
Windpark Düste 2 GmbH & Co. KG Hanover Germany 100.00
Windpark Düste Infrastruktur GmbH & Co. KG Hanover Germany 50.00
Windpark Hungerberg I GmbH & Co. KG Offenbach am Main Germany 100.00
Windpark Hungerberg II GmbH & Co. KG Offenbach am Main Germany 100.00
Windpark Kirchberg GmbH & Co. KG Offenbach am Main Germany 100.00
Windpark Siegfriedeiche GmbH & Co. KG Hanover Germany 100.00 5
Notes to Balance Sheet | Notes to Consolidated Financial Statements | CONSOLIDATED FINANCIAL STATEMENTS
190
Annual Report 2018 | MVV

List of MVV’s shareholdings at 30 September 2018
Town/city Country Share of capital 1
%Footnote
Windwärts Energie GmbH Hanover Germany 100.00
Windwärts Photovoltaik GmbH Hanover Germany 100.00 5
WiWi Windkraft GmbH & Co. Herrnsheim KG Wörrstadt Germany 100.00
WiWi Windkraft GmbH & Co. Worms KG Wörrstadt Germany 100.00
Fully consolidated subsidiaries
Associates (international)
Cactus Garden Solar LLC Delaware USA 100.00
Českolipská teplárenská a.s Česká Lípa Czech Republic 75.00
Českolipské teplo a.s. Česká Lípa (domicile: Prague) Czech Republic 100.00
Corsoleil EURL Saint Florent France 100.00
CTZ s.r.o. Uherské Hradiště Czech Republic 50.96
e.services s.r.o. Děčín Czech Republic 100.00
Electaparc S.A. Montevideo Uruguay 100.00
ENERGIE Holding a.s. Prague Czech Republic 100.00
G-LINDE s.r.o. Prague Czech Republic 100.00
G-RONN s.r.o. Prague Czech Republic 100.00
IROMEZ s.r.o. Pelhrimov Czech Republic 100.00
JSI 01 Srl Verona Italy 100.00
JSI Construction Group LLC Delaware USA 100.00
JSI Equipment Solutions LLC Delaware USA 100.00
JSI Milford Realty Company LLC Delaware USA 100.00
JSI O&M Group LLC Delaware USA 100.00
juwi energias renovables de Chile S.R.L. Santiago de Chile Chile 100.00
juwi energias renovables S.L.U. Valencia Spain 100.00
juwi energie rinnovabili Srl Verona Italy 100.00
juwi Energii Regenerabile S.R.L. Bucharest Romania 99.00
juwi Energy Services (Pty) Ltd. Cape Town South Africa 80.00
juwi Hellas renewable energy sources A.E. Athens Greece 100.00
juwi Holding US LLC Delaware USA 100.00
juwi Inc. Delaware USA 100.00
juwi India Renewable Energies Private Limited Bangalore India 100.00
juwi Philippines Inc. Makati City Philippines 99.99
juwi Renewable Energies (Pty) Ltd. Cape Town South Africa 100.00
juwi Renewable Energies Ltd. London UK 100.00
juwi renewable Energies Malaysia SDN. BHD. Kuala Lumpur Malaysia 100.00
juwi renewable energies Pvt. Ltd. Singapore Singapore 100.00
juwi Renewable Energies Thai Co., Ltd. Bangkok Thailand 100.00
juwi Renewable Energy Pty. Ltd. Brisbane Australia 93.61
juwi Singapore Projects Pvt. Ltd. Singapore Singapore 100.00
Juwi Solar ZA Construction 1 (Pty) Ltd. Cape Town South Africa 80.00
Juwi Solar ZA Construction 2 (Pty) Ltd. Cape Town South Africa 92.00
Juwi Solar ZA Construction 3 (Pty) Ltd. Cape Town South Africa 80.00
juwi Solar ZA Construction 4 (Pty) Ltd. (previously: K2017516494 (Pty) Ltd.) Cape Town South Africa 60.00 5
Juwi Solar ZA O&M 1 (Pty) Ltd. Cape Town South Africa 76.00
juwi Wind LLC Delaware USA 100.00
Notes to Balance Sheet | Notes to Consolidated Financial Statements | CONSOLIDATED FINANCIAL STATEMENTS
191
Annual Report 2018 | MVV

List of MVV’s shareholdings at 30 September 2018
Town/city Country Share of capital 1
%Footnote
juwi Yenilenebilir Enerji A.S. Istanbul Turkey 100.00
Kozilio Dio I.K.E. (Monoprosopi) Athens Greece 100.00 5
Kozilio Ena I.K.E. (Monoprosopi) Athens Greece 100.00 5
Las Torres Solar I S.L. Valencia Spain 100.00
mobiheat Schweiz GmbH Glattbrugg Switzerland 100.00
mobiheat Österreich GmbH Sankt Lorenz Austria 100.00 5
MVV Energie CZ a.s. Prague Czech Republic 100.00
MVV Environment Baldovie Ltd. (previously: Dundee Energy Recycling Ltd. (DERL)) Dundee UK 100.00 5
MVV Environment Devonport Limited Plymouth UK 100.00
MVV Environment Limited London UK 100.00
MVV Environment Ridham Limited Sittingbourne / Iwade UK 100.00
MVV Environment Services Limited London UK 100.00
OPATHERM a.s. Opava Czech Republic 100.00
POWGEN a.s. Prague Czech Republic 100.00
Promosolar Juwi 4 S.L.U. Valencia Spain 100.00
Rocky Mountain Solar LLC Delaware USA 100.00
SE Chronus Solar Energy 10 E.P.E. Athens Greece 100.00 5
SE Chronus Solar Energy 11 E.P.E. Athens Greece 100.00 5
SE Chronus Solar Energy 12 E.P.E. Athens Greece 100.00 5
SE Chronus Solar Energy 13 E.P.E. Athens Greece 100.00 5
SE Chronus Solar Energy 14 E.P.E. Athens Greece 100.00 5
SE Chronus Solar Energy 15 E.P.E. Athens Greece 100.00 5
SE Chronus Solar Energy 16 E.P.E. Athens Greece 100.00 5
SE Chronus Solar Energy 17 E.P.E. Athens Greece 100.00 5
SE Chronus Solar Energy 18 E.P.E. Athens Greece 100.00 5
SE Chronus Solar Energy 19 E.P.E. Athens Greece 100.00 5
SE Chronus Solar Energy 2 E.P.E. Athens Greece 100.00 5
SE Chronus Solar Energy 3 E.P.E. Athens Greece 100.00 5
SE Chronus Solar Energy 4 E.P.E. Athens Greece 100.00 5
SE Chronus Solar Energy 5 E.P.E. Athens Greece 100.00 5
SE Chronus Solar Energy 6 E.P.E. Athens Greece 100.00 5
SE Chronus Solar Energy 7 E.P.E. Athens Greece 100.00 5
SE Chronus Solar Energy 8 E.P.E. Athens Greece 100.00 5
SE Chronus Solar Energy 9 E.P.E. Athens Greece 100.00 5
Teplárna Liberec a.s. Liberec Czech Republic 76.04
TERMIZO a.s. Liberec Czech Republic 100.00
TERMO Děčín a.s. Děčín Czech Republic 96.91
Vents d'Oc Énergies Renouvelables SARL Montpellier France 100.00
Zásobování teplem Vsetín a.s. Vsetín Czech Republic 100.00
Notes to Balance Sheet | Notes to Consolidated Financial Statements | CONSOLIDATED FINANCIAL STATEMENTS
192
Annual Report 2018 | MVV

List of MVV’s shareholdings at 30 September 2018
Town/city Country Share of capital 1
%Footnote
Unconsolidated other shareholdings
Associates (Germany)
Blue Village FRANKLIN Mobil GmbH Mannheim Germany 70.00 5
Erschließungsträgergesellschaft Weeze mbH Weeze Germany 75.00
iwo Pellet Rhein-Main GmbH Offenbach am Main Germany 100.00
juwi Bio Germany Verwaltungs GmbH Wörrstadt Germany 100.00
juwi Solar Germany 13 GmbH & Co. KG Wörrstadt Germany 100.00
juwi Solar Germany 3 GmbH & Co. KG Wörrstadt Germany 100.00
juwi Solar Germany Verwaltungs GmbH Wörrstadt Germany 100.00
juwi Wind Germany 126 GmbH & Co. KG Wörrstadt Germany 100.00
juwi Wind Germany 127 GmbH & Co. KG Wörrstadt Germany 100.00
juwi Wind Germany 128 GmbH & Co. KG Wörrstadt Germany 100.00
juwi Wind Germany 134 GmbH & Co. KG Wörrstadt Germany 100.00
juwi Wind Germany 170 GmbH & Co. KG Wörrstadt Germany 100.00
juwi Wind Germany 171 GmbH & Co. KG Wörrstadt Germany 100.00
juwi Wind Germany 177 GmbH & Co. KG Wörrstadt Germany 100.00
juwi Wind Germany 178 GmbH & Co. KG Wörrstadt Germany 100.00
juwi Wind Germany 180 GmbH & Co. KG Wörrstadt Germany 100.00
juwi Wind Germany 183 GmbH & Co. KG Wörrstadt Germany 100.00 5
juwi Wind Germany 184 GmbH & Co. KG Wörrstadt Germany 100.00 5
juwi Wind Germany 186 GmbH & Co. KG Wörrstadt Germany 100.00 5
juwi Wind Germany 187 GmbH & Co. KG Wörrstadt Germany 100.00 5
juwi Wind Germany 188 GmbH & Co. KG Wörrstadt Germany 100.00 5
juwi Wind Germany 189 GmbH & Co. KG Wörrstadt Germany 100.00 5
juwi Wind Germany 190 GmbH & Co. KG Wörrstadt Germany 100.00 5
juwi Wind Germany 191 GmbH & Co. KG Wörrstadt Germany 100.00 5
juwi Wind Germany 192 GmbH & Co. KG Wörrstadt Germany 100.00 5
juwi Wind Germany 51 GmbH & Co. KG Wörrstadt Germany 100.00
MVV Alpha zwei GmbH Mannheim Germany 100.00 4
MVV Insurance Services GmbH Mannheim Germany 100.00
MVV Regioplan GmbH Mannheim Germany 100.00 4
MVV Windpark Verwaltungs GmbH Mannheim Germany 100.00
Neu-Anspach Wind GmbH & Co. KG Wörrstadt Germany 100.00
Windpark Hellenthal Wiesenhardt GmbH & Co. KG Wörrstadt Germany 100.00
Windpark Lauda-Heckfeld GmbH & Co. KG Wörrstadt Germany 100.00
Windpark Mußbach GmbH & Co. KG Wörrstadt Germany 100.00
Windpark Schwegenheim II GmbH & Co. KG (previously: juwi Wind Germany 181 GmbH & Co. KG) Wörrstadt Germany 100.00 5
Windpark Wiebelsheim GmbH & Co. KG Wörrstadt Germany 100.00
Windpark Windhübel GmbH & Co. KG (previously: juwi Wind Germany 172 GmbH & Co. KG) Wörrstadt Germany 100.00
Windwärts erste Verwaltungsgesellschaft mbH Hanover Germany 100.00
Windwärts Projektmanagement GmbH Hanover Germany 100.00
WKA Schauerberg GmbH & Co. KG Wörrstadt Germany 100.00
Notes to Balance Sheet | Notes to Consolidated Financial Statements | CONSOLIDATED FINANCIAL STATEMENTS
193
Annual Report 2018 | MVV

List of MVV’s shareholdings at 30 September 2018
Town/city Country Share of capital 1
%Footnote
Unconsolidated other shareholdings
Associates (International)
Abert Rim Solar LLC Delaware USA 100.00
Achab Wind Farm (Pty) Ltd. Cape Town South Africa 100.00
AL Solar I LLC Delaware USA 100.00
Alachua Solar LLC Delaware USA 100.00 5
Apple Valley Solar LLC Delaware USA 100.00
Archer Solar LLC Delaware USA 100.00
Arizona Solar I LLC Delaware USA 100.00
Ashdown Solar LLC Delaware USA 100.00
Birch Creek Solar LLC Delaware USA 100.00
Black Hollow Solar LLC Delaware USA 100.00 5
Blue Creek Solar LLC Delaware USA 100.00 5
Blue Earth Solar LLC Delaware USA 100.00
Blue Grama Solar LLC Delaware USA 100.00 5
Blue Spruce Solar LLC Delaware USA 100.00
Briscoe Solar LLC Delaware USA 100.00
Buckeye South Solar LLC Delaware USA 100.00
Buckskin Solar LLC Delaware USA 100.00
Cache Valley Solar LLC Delaware USA 100.00 5
Cascade Solar LLC Delaware USA 100.00
Castle Wind Farm (Pty) Ltd. Cape Town South Africa 100.00
Cedar Canyon Solar LLC Delaware USA 100.00 5
Cedarwood Solar LLC Delaware USA 100.00
Centrale Solair De Lafayette LLC Delaware USA 100.00
Chewaucan Solar LLC Delaware USA 100.00
Coolidge Solar LLC Delaware USA 100.00
Curry Hill Solar LLC Delaware USA 100.00
Daisy Canyon Solar LLC Delaware USA 100.00 5
Deer Creek Solar LLC Delaware USA 100.00
Delareyville Solar Farm (Pty) Ltd. Cape Town South Africa 100.00
Eureka Solar LLC Delaware USA 100.00
Firelands Wind Farm LLC Delaware USA 100.00
Fountain Solar LLC Delaware USA 100.00
Front Range Solar LLC Delaware USA 100.00
GA Solar I LLC Delaware USA 100.00
Galloway Solar LLC Delaware USA 100.00 5
Grassland Solar LLC Delaware USA 100.00
Hartebeest Wind Farm (Pty) Ltd. Cape Town South Africa 100.00
High Plains Solar LLC Delaware USA 100.00 5
Holden Solar LLC Delaware USA 100.00
Hotazel Solar Farm 1 (Pty) Ltd. (previously: Banzopax (Pty) Ltd.) Cape Town South Africa 100.00
Hotazel Solar Farm 2 (Pty) Ltd. (previously: Banzocorp (Pty) Ltd.) Cape Town South Africa 100.00
Hudsonville Solar LLC Delaware USA 100.00
JSI Construction Canada LLC Delaware USA 100.00
JSI PR Green Holding Company Inc. Delaware USA 100.00
Notes to Balance Sheet | Notes to Consolidated Financial Statements | CONSOLIDATED FINANCIAL STATEMENTS
194
Annual Report 2018 | MVV

List of MVV’s shareholdings at 30 September 2018
Town/city Country Share of capital 1
%Footnote
JSI Procurement Group LLC Delaware USA 100.00
JSI Rockfish Realty LLC Delaware USA 100.00
juwi Energy Services 2 (Pty) Ltd. Cape Town South Africa 80.00
juwi Nippon Energy K.K. Tokyo Japan 100.00 5
juwi Solar ZA Construction 9 (Pty) Ltd. Cape Town South Africa 60.00
juwi Viet Nam Company Limited Hanoi Vietnam 100.00
JWT Asset Co., Ltd. Bangkok Thailand 49.80 6
K20171516079 (Pty) Ltd. Cape Town South Africa 100.00 5
Kaip Wind Farm (Pty) Ltd. Cape Town South Africa 100.00
Kap Vley Wind Farm (Pty) Ltd. Cape Town South Africa 100.00
Kenhardt PV1 (Pty) Ltd. Cape Town South Africa 100.00
Kiowa Creek Solar LLC Delaware USA 100.00
Kiowa Solar LLC Delaware USA 100.00
Klondike Solar LLC Delaware USA 100.00
Koppie Enkel Solar Farm (Pty) Ltd. Cape Town South Africa 100.00
Kronos Solar Farm 1 (Pty) Ltd. Cape Town South Africa 100.00
Kronos Solar Farm 2 (Pty) Ltd. Cape Town South Africa 100.00
Kronos Solar Farm 3 (Pty) Ltd. Cape Town South Africa 100.00
L&D Solar LLC Delaware USA 100.00
Lone Rock Solar LLC Delaware USA 100.00
Long Prairie Solar LLC Delaware USA 100.00
Lost Creek Solar LLC Delaware USA 100.00
Madras Solar LLC Delaware USA 100.00
Marovax (Pty) Ltd. Cape Town South Africa 100.00
Meadowlark Solar LLC Delaware USA 100.00
Mesilla Solar LLC Delaware USA 100.00 5
Mesquite Solar LLC Delaware USA 100.00 5
Monarch Solar LLC Delaware USA 100.00 5
Muleshoe Solar LLC Delaware USA 100.00
MVV Environnement Ressources SASU Colmar France 100.00
Namies Wind Farm (Pty) Ltd. Cape Town South Africa 100.00
Nine Mile Solar LLC Delaware USA 100.00
NM Solar I LLC Delaware USA 100.00
Oasis Wind Farm (Pty) Ltd. Cape Town South Africa 100.00
OH Solar I LLC Delaware USA 100.00
Ophir Canyon Solar I LLC Delaware USA 100.00 5
Ophir Canyon Solar II LLC Delaware USA 100.00 5
Ophir Canyon Solar LLC Delaware USA 100.00 5
Osage Solar LLC Delaware USA 100.00
Othello Solar LLC Delaware USA 100.00
Outeniqua Wind Farm (Pty) Ltd. Cape Town South Africa 100.00
Palisade Solar LLC Delaware USA 100.00
Palmer Solar LLC Delaware USA 100.00
Parachute Solar LLC Delaware USA 100.00
Pike Solar LLC Delaware USA 100.00 5
Pilot Rock Solar LLC Delaware USA 100.00
Pleasant Hill Solar LLC Delaware USA 100.00
Notes to Balance Sheet | Notes to Consolidated Financial Statements | CONSOLIDATED FINANCIAL STATEMENTS
195
Annual Report 2018 | MVV

List of MVV’s shareholdings at 30 September 2018
Town/city Country Share of capital 1
%Footnote
Poplar Springs Solar LLC Delaware USA 100.00
Pronghorn Solar LLC Delaware USA 100.00 5
Rawhide Flats II Solar LLC Delaware USA 100.00 5
Razorback Solar LLC Delaware USA 100.00
Royal Slope Solar LLC Delaware USA 100.00 5
Saddle Butte Solar LLC Delaware USA 100.00
San Arroyo Solar LLC Delaware USA 100.00
San Carlos Solar LLC Delaware USA 100.00
Sand Hollow Solar LLC Delaware USA 100.00 5
Santa Cruz Solar LLC Delaware USA 100.00
Santa Rosa Solar LLC Delaware USA 100.00
Saranac Solar LLC Delaware USA 100.00
Shaefers Peak Solar LLC Delaware USA 100.00 5
Sierra Mojada Solar LLC Delaware USA 100.00 5
Silver Moon Solar LLC Delaware USA 100.00 5
Skipjack Solar LLC Delaware USA 100.00
Squirrel Creek Solar LLC Delaware USA 100.00
Stansburry Solar II LLC Delaware USA 100.00
Stansburry Solar LLC Delaware USA 100.00
Sugarcane Solar LLC Delaware USA 100.00
Suwannee Solar LLC Delaware USA 100.00
Tailwind Solar LLC Delaware USA 100.00
Thatcher Solar LLC Delaware USA 100.00 5
Trout Creek Solar LLC Delaware USA 100.00 5
Valent Canyon Solar LLC Delaware USA 100.00 5
Vredendal Solar Farm (Pty) Ltd. Cape Town South Africa 100.00
Wildebeest Wind Farm (Pty) Ltd. Cape Town South Africa 100.00
Wolf Wind Farm (Pty) Limited Cape Town South Africa 100.00
Zingesele Wind Farm (Pty) Ltd. Cape Town South Africa 100.00
At equity
Joint ventures (Germany)
Allegro engineering GmbH Markranstädt-Thronitz Germany 30.00 5
BEEGY Operations GmbH Mannheim Germany 51.00
Biomasse Rhein-Main GmbH Flörsheim am Main Germany 33.33
DataCenter Offenbach RheinMain GmbH (previously: EVO Alpha 2 GmbH) Offenbach am Main Germany 50.00 5
DC-Datacenter-Group GmbH Wallmenroth Germany 25.10 5
enerix Franchise GmbH & Co KG Regensburg Germany 25.10
enerix Management GmbH Regensburg Germany 25.10
Fernwärme Rhein-Neckar GmbH Mannheim Germany 50.00
Gemeinschaftskraftwerk Kiel GmbH Kiel Germany 50.00
Infrastruktur Donnersberg GmbH & Co. KG Wörrstadt Germany 36.31
Infrastrukturgesellschaft Rheinhessen II GmbH & Co. KG Wörrstadt Germany 48.00
KommunalWind GmbH & Co. KG Tübingen Germany 50.00
Naunhofer Transportgesellschaft mbH Parthenstein-Großsteinberg Germany 50.00
Qivalo GmbH Mannheim Germany 42.50
Notes to Balance Sheet | Notes to Consolidated Financial Statements | CONSOLIDATED FINANCIAL STATEMENTS
196
Annual Report 2018 | MVV

List of MVV’s shareholdings at 30 September 2018
Town/city Country Share of capital 1
%Footnote
RIO Holzenergie GmbH & Co. Dotternhausen KG Wörrstadt Germany 50.00
Rockenhausen Windenergie-Projektentwicklungs GmbH Rockenhausen Germany 49.00
Stadtwerke Ingolstadt Beteiligungen GmbH Ingolstadt Germany 48.40
Stadtwerke Sinsheim Versorgungs GmbH & Co. KG Sinsheim Germany 30.00
Umspannwerk Donnersberg GmbH & Co. KG Wörrstadt Germany 36.31
At equity
Joint ventures (International)
juwi Shizen Energy Inc. Tokyo Japan 50.00
luminatis S.à.r.l. Luxembourg Luxembourg 70.00
At equity
Associates (Germany)
AVR BioGas GmbH Sinsheim Germany 41.50
ESN EnergieSystemeNord GmbH Schwentinental Germany 25.00
Grosskraftwerk Mannheim Aktiengesellschaft Mannheim Germany 28.00
Infrastrukturgesellschaft Erbes-Büdesheim GmbH & Co. KG Wörrstadt Germany 22.36
juwi Beteiligungs GmbH & Co. Holzpelletieranlage Morbach KG Wörrstadt Germany 50.00
juwi Wind Germany 100 GmbH & Co. KG Wörrstadt Germany 39.00
Mainnetz GmbH Obertshausen Germany 25.10
Naturenergie Main-Kinzig GmbH Gelnhausen Germany 50.00
Netzgesellschaft Edingen-Neckarhausen GmbH & Co. KG Edingen-Neckarhausen Germany 24.00
Phoenix Energie GmbH Hanover Germany 0.05 6
Recogizer Group GmbH Bonn Germany 25.11 5
ReNabi GmbH Mannheim Germany 51.00
RIO Holzenergie GmbH & Co. Bad Arolsen KG Wörrstadt Germany 50.00
Stadtwerke Buchen GmbH & Co. KG Buchen-Odenwald Germany 25.10
Zweckverband Wasserversorgung Kurpfalz (ZWK) Mannheim (domicile: Heidelberg) Germany 51.00 3
At equity
Associates (International)
juwi Shizen Energy Operation Inc. Tokyo Japan 30.00
Other minority shareholdings
Germany
8KU GmbH Berlin Germany 12.50
Infrastruktur Oberheimbach I GmbH & Co. KG Wörrstadt Germany 15.00
Infrastrukturgesellschaft Bischheim GmbH & Co. KG Wörrstadt Germany 15.31
juwi Wind Germany 129 GmbH & Co. KG Wörrstadt Germany 16.00
Klimaschutzagentur Mannheim gemeinnützige GmbH Mannheim Germany 40.00
Main-Kinzig-Entsorgungs- und Verwertungs GmbH Gelnhausen Germany 49.00
Management Stadtwerke Buchen GmbH Buchen-Odenwald Germany 25.20
RIO Holzenergie GmbH & Co. Langelsheim KG Wörrstadt Germany 37.55
Stadtmarketing Mannheim GmbH Mannheim Germany 3.09
Stadtwerke Langen Gesellschaft mit beschränkter Haftung Langen Germany 10.00 4
Notes to Balance Sheet | Notes to Consolidated Financial Statements | CONSOLIDATED FINANCIAL STATEMENTS
197
Annual Report 2018 | MVV

List of MVV’s shareholdings at 30 September 2018
Town/city Country Share of capital 1
%Footnote
Stadtwerke Schwetzingen GmbH & Co. KG Schwetzingen Germany 10.00
Stadtwerke Schwetzingen Verwaltungsgesellschaft mbH Schwetzingen Germany 10.00
Stadtwerke Sinsheim Verwaltungs GmbH Sinsheim Germany 30.00
Stadtwerke Walldorf GmbH & Co. KG Walldorf Germany 25.10
Stadtwerke Walldorf Verwaltungs GmbH Walldorf Germany 25.10
SWT Regionale Erneuerbare Energien GmbH Trier Germany 51.00
Wasserversorgungsverband Neckargruppe Edingen-Neckarhausen Germany 25.00
Windfarm Wonnegau UW GmbH & Co. KG Gundersheim Germany 24.70
WiWi Windkraft GmbH & Co. Westpfalz KG Wörrstadt Germany 5.32
WVE Wasserversorgungs- und -entsorgungsgesellschaft Schriesheim mbH Schriesheim Germany 24.50
1 Share of capital at 30 September 2018 pursuant to § 16 (4) AktG; equity and annual net income pursuant to HGB or local requirements2 Majority of voting rights3 No voting right majority4 Profit transfer/operating profit transfer agreement5 Added in financial year6 Control agreement or controlling influence
40. Auditor’s feeThe following fees were incurred in Germany for the services performed by the auditor of the consolidated financial state-ments, PricewaterhouseCoopers GmbH Wirtschaftsprüfungs-gesellschaft, in the 2018 financial year:
Auditor’s fee
Euro 000s FY 2018 FY 2017
Audit 2,188 1,822
Other advisory services 486 317
Tax advisory services 101 101
Other services 357 578
3,132 2,818
The audit services line item relates above all to the fees paid for the audit of the consolidated financial statements and the audit of the separate financial statements of MVV Energie AG and its subsidiaries. The fees paid for other audit services mainly relate to audits performed in accordance with energy industry requirements/attestations (EEG, KWKG) and voluntary certification services, including those relating to the internal tax control system. The tax advisory services line item particu-larly involves fees for the support provided in the context of tax audits and for tax advisory services in the field of transfer prices. The fees paid for other services chiefly include fees for project advisory services relating to the conversion in account-ing to new IFRS standards.
Notes to Balance Sheet | Notes to Consolidated Financial Statements | CONSOLIDATED FINANCIAL STATEMENTS
198
Annual Report 2018 | MVV
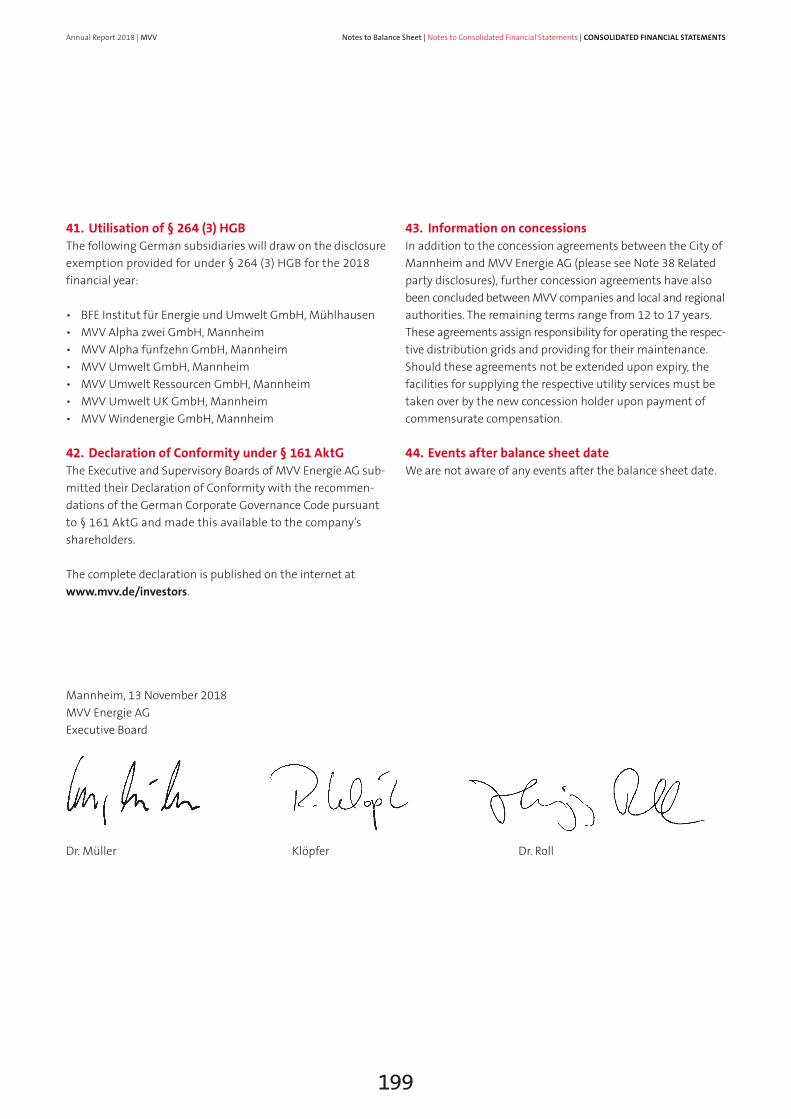
41. Utilisation of § 264 (3) HGBThe following German subsidiaries will draw on the disclosure exemption provided for under § 264 (3) HGB for the 2018 financial year:
• BFE Institut für Energie und Umwelt GmbH, Mühlhausen• MVV Alpha zwei GmbH, Mannheim• MVV Alpha fünfzehn GmbH, Mannheim• MVV Umwelt GmbH, Mannheim• MVV Umwelt Ressourcen GmbH, Mannheim • MVV Umwelt UK GmbH, Mannheim• MVV Windenergie GmbH, Mannheim
42. Declaration of Conformity under § 161 AktGThe Executive and Supervisory Boards of MVV Energie AG sub-mitted their Declaration of Conformity with the recommen-dations of the German Corporate Governance Code pursuant to § 161 AktG and made this available to the company’s shareholders.
The complete declaration is published on the internet at www.mvv.de/investors.
43. Information on concessionsIn addition to the concession agreements between the City of Mannheim and MVV Energie AG (please see Note 38 Related party disclosures), further concession agreements have also been concluded between MVV companies and local and regional authorities. The remaining terms range from 12 to 17 years. These agreements assign responsibility for operating the respec-tive distribution grids and providing for their maintenance. Should these agreements not be extended upon expiry, the facilities for supplying the respective utility services must be taken over by the new concession holder upon payment of commensurate compensation.
44. Events after balance sheet dateWe are not aware of any events after the balance sheet date.
Mannheim, 13 November 2018MVV Energie AGExecutive Board
Dr. Müller Klöpfer Dr. Roll
Notes to Balance Sheet | Notes to Consolidated Financial Statements | CONSOLIDATED FINANCIAL STATEMENTS
199
Annual Report 2018 | MVV

Responsibility Statement“We affirm that, to the best of our knowledge, the consoli-dated financial statements give a true and fair view of the net asset, financial and earnings position of the Group in accordance with applicable accounting principles and that the group management report provides a fair view of the development and performance of the business and the posi-tion of the Group, together with a description of the principal opportunities and risks associated with the expected devel-opment of the Group.”
Mannheim, 13 November 2018MVV Energie AGExecutive Board
Dr. Müller Klöpfer Dr. Roll
Responsibility Statement | CONSOLIDATED FINANCIAL STATEMENTS
200
Annual Report 2018 | MVV

Directors and OfficersEXECUTIVE BOARD OF MVV ENERGIE AGDr. Georg Müller CEO, Commercial Affairs and Labour Director
Ralf Klöpfer Sales
Dr. Hansjörg Roll Technology
SUPERVISORY BOARD OF MVV ENERGIE AGDr. Peter Kurz (Chairman) Lord High Mayor of City of Mannheim
Heike Kamradt 1 (Deputy Chairman) Chairman of Group Works Council
Johannes Böttcher 1 Chairman of Works Council of Energieversorgung Offenbach AG
Timo Carstensen 1 Deputy Chairman of Works Council of Stadtwerke Kiel AG
Ralf Eisenhauer Construction and Project Manager at MWS Projektentwicklungs gesellschaft mbH, Mannheim
Peter Erni 1 Trade Union Secretary at ver.di Rhine-Neckar
Detlef Falk 1 Chairman of Works Council of Stadtwerke Kiel AG
Dieter Hassel Member of Executive Board of RheinEnergie AG, Cologne
Barbara Hoffmann Auditor, Tax Advisor
Prof. Dr. Heidrun Kämper Academic Employee at Institut für Deutsche Sprache, Mannheim
Brigitte Kemmer Tax Advisor
Dr. Antje Mohr 1 Trade Union Secretary at ver.di Kiel
Dr. Lorenz Näger Member of Executive Board of HeidelbergCement AG
Steffen Ratzel Managing Director of BKV-Bäder- und Kurverwaltung Baden-Württemberg, Anstalt des öffentlichen Rechts, Baden-Baden (since 1 January 2018)
Peter Sattler 1 Member of Works Council
Bernhard Schumacher 1 Director of Regional Sales Division at MVV Energie AG
Christian Specht First Mayor of City of Mannheim
Carsten Südmersen Management Consultant (until 31 December 2017)
Katja Udluft 1 Trade Union Secretary at ver.di Rhine-Neckar
Prof. Heinz-Werner Ufer Graduate in Economics
Jürgen Wiesner 1 Chairman of Works Council of MVV Energie AG
Additional positions held by members of Executive and Supervisory Boards on supervisory boards or comparable supervisory bodies are listed in detail on the following pages.
1 Employee representative
Directors and Officers | CONSOLIDATED FINANCIAL STATEMENTS
201
Annual Report 2018 | MVV

MEMBERS OF SUPERVISORY BOARD COMMITTEES AT MVV ENERGIE AG
Committee NameAudit Committee • Prof. Heinz-Werner Ufer
(Chairman) • Heike Kamradt
(Deputy Chairman) • Peter Erni • Detlef Falk • Dr. Lorenz Näger • Steffen Ratzel (since 1 January 2018)• Carsten Südmersen (until 31 December 2017)
Personnel Committee • Dr. Peter Kurz (Chairman)
• Heike Kamradt (Deputy Chairman)
• Ralf Eisenhauer • Peter Erni• Steffen Ratzel (since 1 January 2018)• Carsten Südmersen (until 31 December 2017)• Jürgen Wiesner
Nomination Committee • Dr. Peter Kurz (Chairman)
• Ralf Eisenhauer • Barbara Hoffmann • Steffen Ratzel (since 1 January 2018)• Carsten Südmersen (until 31 December 2017)• Prof. Heinz-Werner Ufer
Mediation Committee • Dr. Peter Kurz (Chairman)
• Heike Kamradt • Steffen Ratzel (since 1 January 2018)• Carsten Südmersen (until 31 December 2017)• Jürgen Wiesner
New Authorised Capital Creation Committee
• Dr. Peter Kurz (Chairman)
• Ralf Eisenhauer• Peter Erni • Dieter Hassel• Heike Kamradt• Steffen Ratzel (since 1 January 2018)• Christian Specht• Carsten Südmersen (until 31 December 2017)• Prof. Heinz-Werner Ufer
Directors and Officers | CONSOLIDATED FINANCIAL STATEMENTS
202
Annual Report 2018 | MVV

MEMBERS OF EXECUTIVE BOARD OF MVV ENERGIE AG
Name Positions held on other statutory supervisory boards of German companies
Membership of comparable German and foreign company supervisory boards
Dr. Georg Müller • Energieversorgung Offenbach AG, Offenbach (Chairman)
• Grosskraftwerk Mannheim AG, Mannheim• Juwi AG, Wörrstadt
(Chairman) • MVV Enamic GmbH, Mannheim
(Deputy Chairman) • MVV Insurance Services GmbH, Mannheim
(Chairman) • MVV Trading GmbH, Mannheim • MVV Umwelt GmbH, Mannheim• Saarschmiede GmbH, Völklingen• Stadtwerke Kiel AG, Kiel
(Chairman)Ralf Klöpfer • Energieversorgung Offenbach AG, Offenbach
• IDOS Software AG, Karlsruhe • Juwi AG, Wörrstadt • MVV Enamic GmbH, Mannheim
(Chairman) • MVV Trading GmbH, Mannheim
(Chairman) • Stadtwerke Ingolstadt Beteiligungen GmbH,
Ingolstadt (Deputy Chairman)
• Stadtwerke Kiel AG, Kiel
• BEEGY GmbH, Mannheim (Chairman)
• MVV Energie CZ a.s., Prague, Czech Republic (Chairman)
• Qivalo GmbH, Mannheim (Deputy Chairman)
• Soluvia GmbH, Mannheim • Stadtmarketing Mannheim GmbH,
Mannheim
Dr. Hansjörg Roll • Energieversorgung Offenbach AG, Offenbach• Grosskraftwerk Mannheim AG, Mannheim
(Chairman since 16 May 2018)• Juwi AG, Wörrstadt • MVV Netze GmbH, Mannheim
(Chairman)• MVV Umwelt GmbH, Mannheim
(Chairman) • Stadtwerke Kiel AG, Kiel
• MVV Energie CZ a.s., Prague, Czech Republic • Soluvia GmbH, Mannheim
(Chairman)
Directors and Officers | CONSOLIDATED FINANCIAL STATEMENTS
203
Annual Report 2018 | MVV

MEMBERS OF SUPERVISORY BOARD OF MVV ENERGIE AG
Name Occupation
Positions held on other statutory supervisory boards of German companies
Membership of comparable German and foreign company supervisory boards
Dr. Peter Kurz (Chairman) Lord High Mayor of City of Mannheim
• Universitätsklinikum Mannheim GmbH, Mannheim (Chairman)
• MKB Mannheimer Kommunal-Beteiligungen GmbH, Mannheim (Chairman)
• GBG Mannheimer Wohnungsbau - gesellschaft mbH, Mannheim (Chairman)
• mg: mannheimer gründungszentren gmbh, Mannheim (Chairman)
• MWS Projektentwicklungsgesellschaft mbH, Mannheim (Chairman)
• Popakademie Baden-Württemberg GmbH, Mannheim
• Sparkasse Rhein Neckar Nord, Mannheim (Chairman since 12 August 2018)
• Stadtmarketing Mannheim GmbH, Mannheim
Heike Kamradt (Deputy Chairman) Chairman of Group Works Council
• MVV Enamic GmbH, Mannheim • MVV Insurance Services GmbH, Mannheim• MVV Netze GmbH, Mannheim• MVV Trading GmbH, Mannheim• MVV Umwelt GmbH, Mannheim
Johannes Böttcher Chairman of Works Council of Energie-versorgung Offenbach AG
• Energieversorgung Offenbach AG, Offenbach (Deputy Chairman)
Timo Carstensen Deputy Chairman of Works Council of Stadtwerke Kiel AG
• Stadtwerke Kiel AG, Kiel
Ralf Eisenhauer Construction and Project Manager at MWS Projekt-entwicklungsgesellschaft mbH, Mannheim
• Sparkasse Rhein Neckar Nord, Mannheim • Stadtmarketing Mannheim GmbH,
Mannheim
Peter Erni Trade Union Secretary at ver.di Rhine-NeckarDetlef Falk Chairman of Works Council of Stadtwerke Kiel AG
• Stadtwerke Kiel AG, Kiel • Soluvia GmbH, Mannheim
Directors and Officers | CONSOLIDATED FINANCIAL STATEMENTS
204
Annual Report 2018 | MVV
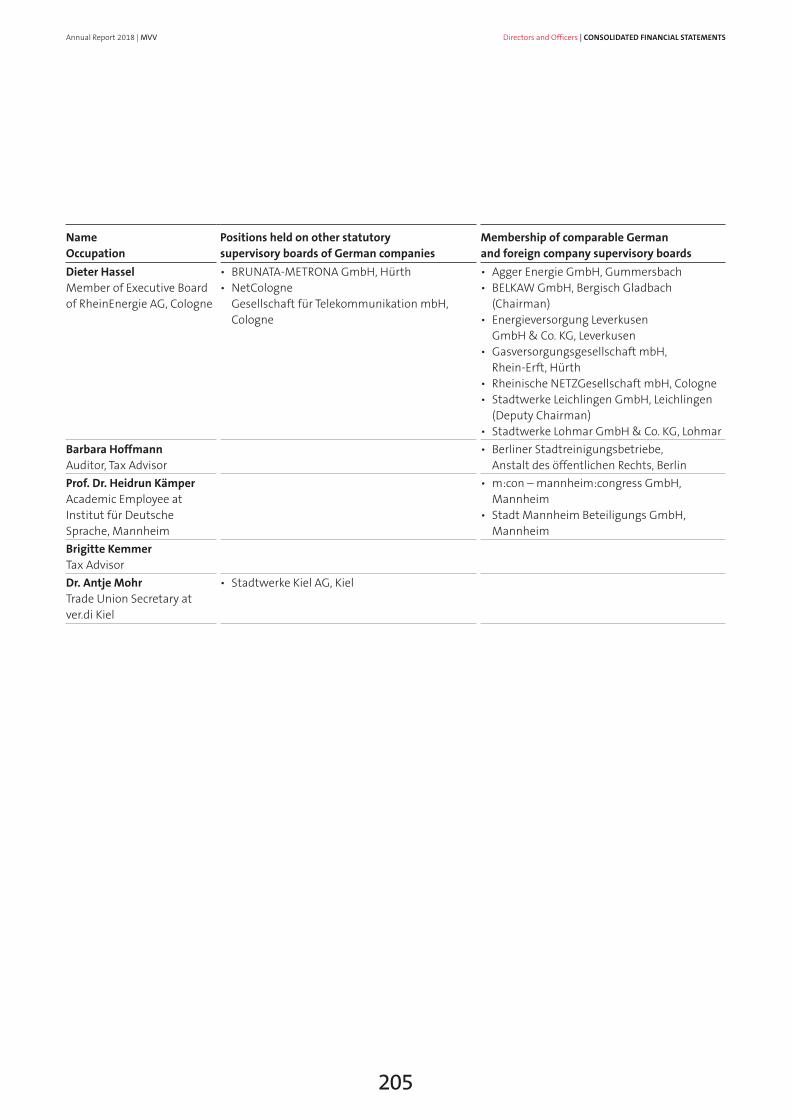
Name Occupation
Positions held on other statutory supervisory boards of German companies
Membership of comparable German and foreign company supervisory boards
Dieter Hassel Member of Executive Board of RheinEnergie AG, Cologne
• BRUNATA-METRONA GmbH, Hürth• NetCologne
Gesellschaft für Telekommunikation mbH, Cologne
• Agger Energie GmbH, Gummersbach• BELKAW GmbH, Bergisch Gladbach
(Chairman)• Energieversorgung Leverkusen
GmbH & Co. KG, Leverkusen• Gasversorgungsgesellschaft mbH,
Rhein-Erft, Hürth• Rheinische NETZGesellschaft mbH, Cologne• Stadtwerke Leichlingen GmbH, Leichlingen
(Deputy Chairman)• Stadtwerke Lohmar GmbH & Co. KG, Lohmar
Barbara Hoffmann Auditor, Tax Advisor
• Berliner Stadtreinigungsbetriebe, Anstalt des öffentlichen Rechts, Berlin
Prof. Dr. Heidrun Kämper Academic Employee at Institut für Deutsche Sprache, Mannheim
• m:con – mannheim:congress GmbH, Mannheim
• Stadt Mannheim Beteiligungs GmbH, Mannheim
Brigitte Kemmer Tax Advisor Dr. Antje Mohr Trade Union Secretary at ver.di Kiel
• Stadtwerke Kiel AG, Kiel
Directors and Officers | CONSOLIDATED FINANCIAL STATEMENTS
205
Annual Report 2018 | MVV
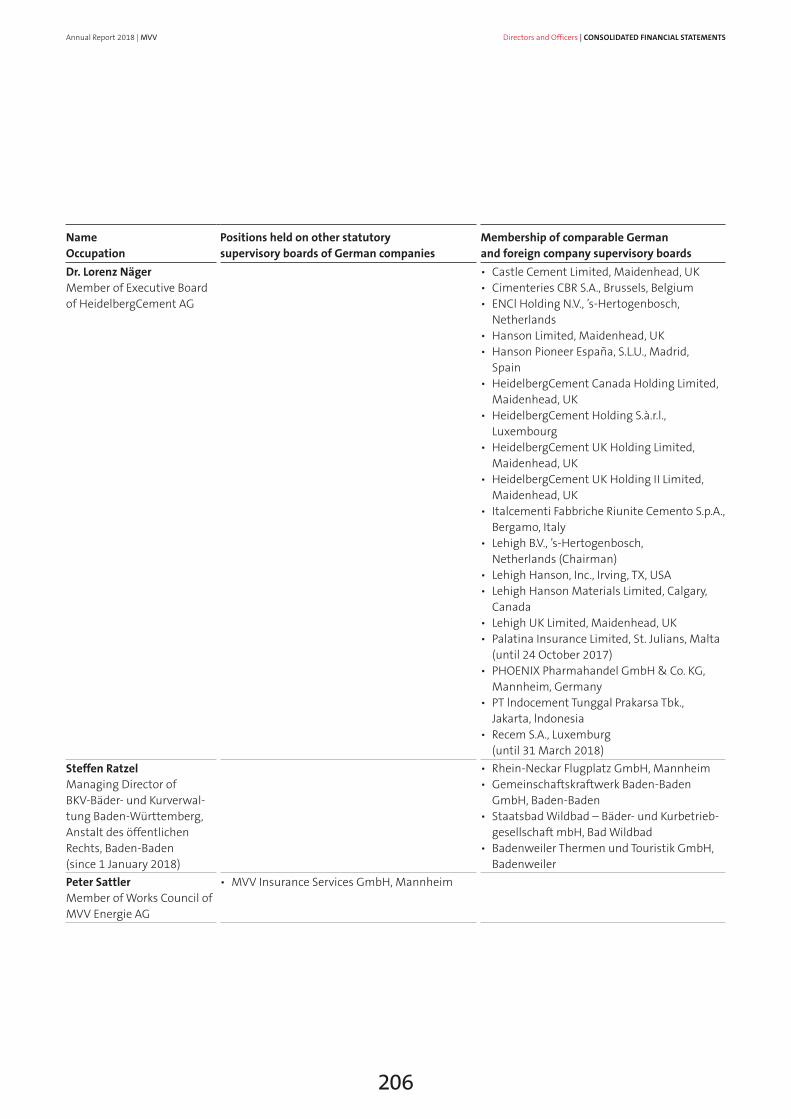
Name Occupation
Positions held on other statutory supervisory boards of German companies
Membership of comparable German and foreign company supervisory boards
Dr. Lorenz Näger Member of Executive Board of HeidelbergCement AG
• Castle Cement Limited, Maidenhead, UK • Cimenteries CBR S.A., Brussels, Belgium • ENCl Holding N.V., ’s-Hertogenbosch,
Netherlands • Hanson Limited, Maidenhead, UK • Hanson Pioneer España, S.L.U., Madrid,
Spain • HeidelbergCement Canada Holding Limited,
Maidenhead, UK • HeidelbergCement Holding S.à.r.l.,
Luxembourg • HeidelbergCement UK Holding Limited,
Maidenhead, UK • HeidelbergCement UK Holding II Limited,
Maidenhead, UK • Italcementi Fabbriche Riunite Cemento S.p.A.,
Bergamo, Italy • Lehigh B.V., ’s-Hertogenbosch,
Netherlands (Chairman) • Lehigh Hanson, Inc., Irving, TX, USA • Lehigh Hanson Materials Limited, Calgary,
Canada • Lehigh UK Limited, Maidenhead, UK • Palatina Insurance Limited, St. Julians, Malta
(until 24 October 2017) • PHOENIX Pharmahandel GmbH & Co. KG,
Mannheim, Germany• PT lndocement Tunggal Prakarsa Tbk.,
Jakarta, lndonesia • Recem S.A., Luxemburg
(until 31 March 2018)Steffen Ratzel Managing Director of BKV-Bäder- und Kurverwal-tung Baden-Württemberg, Anstalt des öffentlichen Rechts, Baden-Baden (since 1 January 2018)
• Rhein-Neckar Flugplatz GmbH, Mannheim • Gemeinschaftskraftwerk Baden-Baden
GmbH, Baden-Baden• Staatsbad Wildbad – Bäder- und Kurbetrieb-
gesellschaft mbH, Bad Wildbad• Badenweiler Thermen und Touristik GmbH,
BadenweilerPeter Sattler Member of Works Council of MVV Energie AG
• MVV Insurance Services GmbH, Mannheim
Directors and Officers | CONSOLIDATED FINANCIAL STATEMENTS
206
Annual Report 2018 | MVV
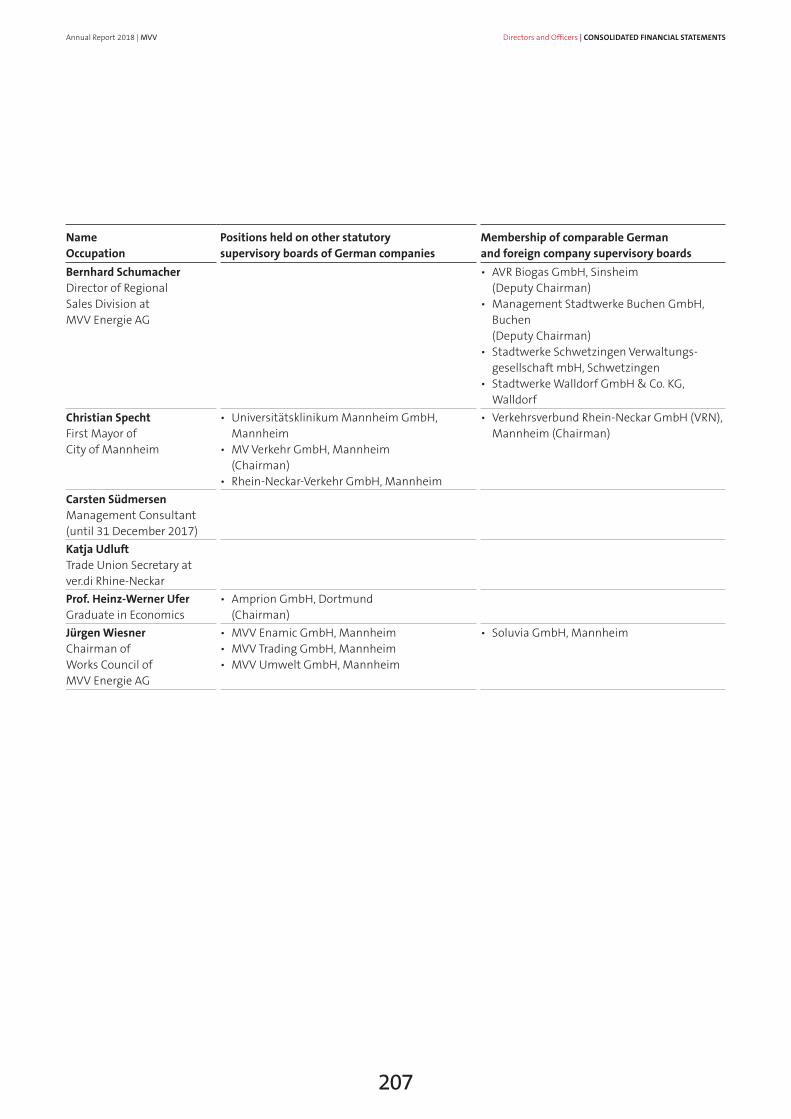
Name Occupation
Positions held on other statutory supervisory boards of German companies
Membership of comparable German and foreign company supervisory boards
Bernhard Schumacher Director of Regional Sales Division at MVV Energie AG
• AVR Biogas GmbH, Sinsheim (Deputy Chairman)
• Management Stadtwerke Buchen GmbH, Buchen (Deputy Chairman)
• Stadtwerke Schwetzingen Verwaltungs - gesellschaft mbH, Schwetzingen
• Stadtwerke Walldorf GmbH & Co. KG, Walldorf
Christian Specht First Mayor of City of Mannheim
• Universitätsklinikum Mannheim GmbH, Mannheim
• MV Verkehr GmbH, Mannheim (Chairman)
• Rhein-Neckar-Verkehr GmbH, Mannheim
• Verkehrsverbund Rhein-Neckar GmbH (VRN), Mannheim (Chairman)
Carsten Südmersen Management Consultant(until 31 December 2017)Katja Udluft Trade Union Secretary at ver.di Rhine-NeckarProf. Heinz-Werner Ufer Graduate in Economics
• Amprion GmbH, Dortmund (Chairman)
Jürgen Wiesner Chairman of Works Council of MVV Energie AG
• MVV Enamic GmbH, Mannheim• MVV Trading GmbH, Mannheim• MVV Umwelt GmbH, Mannheim
• Soluvia GmbH, Mannheim
Directors and Officers | CONSOLIDATED FINANCIAL STATEMENTS
207
Annual Report 2018 | MVV
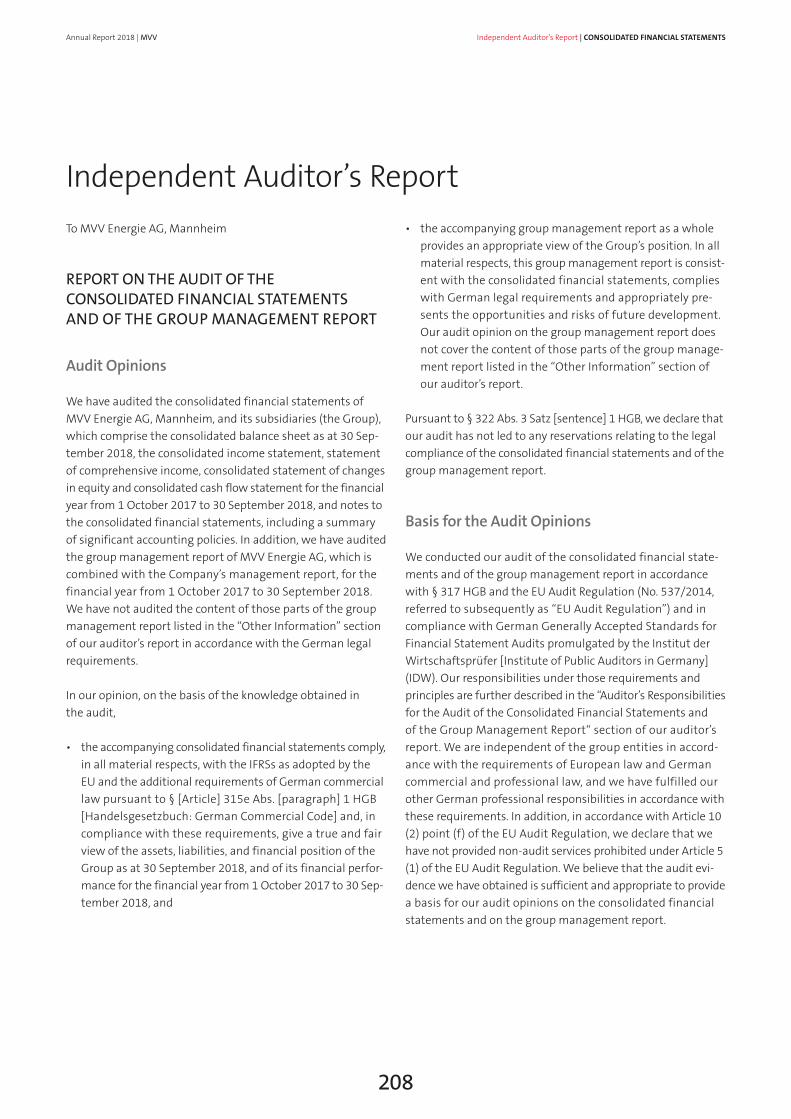
To MVV Energie AG, Mannheim
REPORT ON THE AUDIT OF THE CONSOLIDATED FINANCIAL STATEMENTS AND OF THE GROUP MANAGEMENT REPORT
Audit Opinions
We have audited the consolidated financial statements of MVV Energie AG, Mannheim, and its subsidiaries (the Group), which comprise the consolidated balance sheet as at 30 Sep-tember 2018, the consolidated income statement, statement of comprehensive income, consolidated statement of changes in equity and consolidated cash flow statement for the financial year from 1 October 2017 to 30 September 2018, and notes to the consolidated financial statements, including a summary of significant accounting policies. In addition, we have audited the group management report of MVV Energie AG, which is combined with the Company’s management report, for the financial year from 1 October 2017 to 30 September 2018. We have not audited the content of those parts of the group management report listed in the “Other Information” section of our auditor’s report in accordance with the German legal requirements.
In our opinion, on the basis of the knowledge obtained in the audit,
• the accompanying consolidated financial statements comply, in all material respects, with the IFRSs as adopted by the EU and the additional requirements of German commercial law pursuant to § [Article] 315e Abs. [paragraph] 1 HGB [Handelsgesetzbuch: German Commercial Code] and, in compliance with these requirements, give a true and fair view of the assets, liabilities, and financial position of the Group as at 30 September 2018, and of its financial perfor-mance for the financial year from 1 October 2017 to 30 Sep-tember 2018, and
• the accompanying group management report as a whole provides an appropriate view of the Group’s position. In all material respects, this group management report is consist-ent with the consolidated financial statements, complies with German legal requirements and appropriately pre-sents the opportunities and risks of future development. Our audit opinion on the group management report does not cover the content of those parts of the group manage-ment report listed in the “Other Information” section of our auditor’s report.
Pursuant to § 322 Abs. 3 Satz [sentence] 1 HGB, we declare that our audit has not led to any reservations relating to the legal compliance of the consolidated financial statements and of the group management report.
Basis for the Audit Opinions
We conducted our audit of the consolidated financial state-ments and of the group management report in accordance with § 317 HGB and the EU Audit Regulation (No. 537/2014, referred to subsequently as “EU Audit Regulation”) and in compliance with German Generally Accepted Standards for Financial Statement Audits promulgated by the Institut der Wirtschaftsprüfer [Institute of Public Auditors in Germany] (IDW). Our responsibilities under those requirements and principles are further described in the “Auditor’s Responsibilities for the Audit of the Consolidated Financial Statements and of the Group Management Report“ section of our auditor’s report. We are independent of the group entities in accord-ance with the requirements of European law and German commercial and professional law, and we have fulfilled our other German professional responsibilities in accordance with these requirements. In addition, in accordance with Article 10 (2) point (f) of the EU Audit Regulation, we declare that we have not provided non-audit services prohibited under Article 5 (1) of the EU Audit Regulation. We believe that the audit evi-dence we have obtained is sufficient and appropriate to provide a basis for our audit opinions on the consolidated financial statements and on the group management report.
Independent Auditor’s Report
Independent Auditor’s Report | CONSOLIDATED FINANCIAL STATEMENTS
208
Annual Report 2018 | MVV

Key Audit Matters in the Audit of the Consolidated Financial Statements
Key audit matters are those matters that, in our professional judgment, were of most significance in our audit of the con-solidated financial statements for the financial year from 1 October 2017 to 30 September 2018. These matters were addressed in the context of our audit of the consolidated financial statements as a whole, and in forming our audit opinion thereon; we do not provide a separate audit opinion on these matters.
In our view, the matters of most significance in our audit were as follows:
1. Recoverability of goodwill 2. Accounting treatment of energy trading transactions
Our presentation of these key audit matters has been structured in each case as follows:
a. Matter and issueb. Audit approach and findingsc. Reference to further information
Hereinafter we present the key audit matters:
1. Recoverability of goodwill
a. Goodwill amounting in total to € 197 million is reported under the “Intangible assets” balance sheet item in the consolidated financial statements of MVV Energie AG. Good-will is tested for impairment by the Company once a year or when there are indications of impairment to determine any possible need for write-downs. The impairment test is carried out at the level of the groups of cash-generating units to which the relevant goodwill is allocated. The carry-ing amount of the relevant cash-generating units, including goodwill, is compared with the corresponding recoverable amount in the context of the impairment test. The recov-erable amount is generally determined using the value in use. The present value of the future cash flows from the respective group of cash-generating units normally serves as the basis of valuation. Present values are calculated using discounted cash flow models. For this purpose, the adopted medium-term business plan of the Group forms the starting point which is extrapolated based on assumptions about long-term rates of growth. Expectations relating to future market developments and assumptions about the develop-ment of macroeconomic factors are also taken into account. The discount rate used is the weighted average cost of capital for the respective group of cash-generating units. In the context of the quarterly financial statements as of 31 March 2018, MVV Energie AG conducted an impairment test on the goodwill allocated to the juwi subgroup due to indications of impairment. The result of this impairment test was an impairment in the amount of € 24.0 million – after taking into account the fair value less costs of disposal. In addition, as a result of periodic impairment tests impair-ments of € 9.7 million were recognized, particularly for MVV Enamic’s goodwill.
Independent Auditor’s Report | CONSOLIDATED FINANCIAL STATEMENTS
209
Annual Report 2018 | MVV

The outcome of this valuation exercise is dependent to a large extent on the estimates made by management with respect to the future cash inflows from the respective group of cash-generating units, the discount rate used, the rate of growth and other assumptions, and is therefore subject to considerable uncertainty. Against this background and due to the complex nature of the valuation, this matter was of particular significance during our audit.
b. As part of our audit, we assessed the methodology used for the purposes of performing the impairment test, among other things. After matching the future cash inflows used for the calculation against the adopted medium-term busi-ness plan of the Group, we assessed the appropriateness of the calculation, in particular by reconciling it with general and sector-specific market expectations. In addition, we assessed the appropriate consideration of the costs of Group functions. In the knowledge that even relatively small changes in the discount rate applied can have a material impact on the value of the entity calculated in this way, we also focused our testing on the parameters used to deter-mine the discount rate applied, and assessed the calculation model. In order to reflect the uncertainty inherent in the projections, we evaluated the sensitivity analyses performed by the Company. Overall, the valuation parameters and assumptions used by the executive directors are in line with our expectations and are also within the ranges considered by us to be reasonable.
c. The Company’s goodwill disclosures are contained in note “14 Intangible assets” of the notes to the consolidated financial statements.
2. Accounting treatment of energy trading transactions
a. Within the MVV Energie AG Group, the consolidated sub-sidiary MVV Trading GmbH has primary responsibility for the procurement of energy and emission rights and for hedging energy price risks for the Group companies MVV Energie AG, Stadtwerke Kiel AG, Energieversorgung Offenbach AG and Stadtwerke Ingolstadt GmbH. MVV Trading GmbH trades to a large extent on the spot and futures market for electricity, gas and emission rights on stock exchanges and on the over- the-counter market for these purposes. These contracts are classified as derivative financial instruments in accordance with IAS 39, which are either accounted for at fair value through profit or loss (classified as held-for-trading financial instruments) or as pending transactions if the underlying for the derivative financial instrument will be received or delivered in future as part of the Company’s own expected purchase, sale or usage requirements (“own use exemption”). The accounting treatment for physically settled derivative financial instruments is determined with the aid of the risk management system of MVV Trading GmbH, which allocates these derivative financial instruments to their corresponding purpose and therefore to the appropriate accounting treatment from a Group perspective. Accordingly, physically settled derivative financial instruments that do not form part of the Group’s own expected purchase, sale or usage requirements and all financially settled derivative financial instruments are measured at fair value through profit or loss. To some extent these derivative financial instruments for energy are included as hedging instruments in the hedge accounting in accordance with IAS 39 as so called hedged cash flows. The underlying transactions are the purchase respectively the sale of energy at variable prices within maximum five years.
The energy trading operations are supported by energy trading systems. These systems handle the process chain from the recording of trading transactions to the calculation and measurement of positions and the confirmation of trading transactions, as well as risk management. In view of the high volume of trading and the complexity of account-ing for derivatives in accordance with IAS 39 and IFRS 13, respectively, as well as its significant effects on the assets, liabilities, financial position and financial performance, this business area is of particular significance for the consoli-dated financial statements and the conduct of our audit.
Independent Auditor’s Report | CONSOLIDATED FINANCIAL STATEMENTS
210
Annual Report 2018 | MVV

b. As part of our audit, among other things, we assessed the appropriateness of the internal control system established for the purpose of entering into and settling energy trading transactions, including the trading system used for this purpose. As part of our audit of the internal control system, we also evaluated the effectiveness of the controls estab-lished by the Company on a sample basis. We analyzed the methodology for determining the fair values of the deriva-tive instruments with respect to compliance with IFRS 13 and carried out an appraisal using our own valuations on a sample basis. With respect to the accounting treatment of the derivatives in accordance with IAS 39, we evaluated the application of the own use exemption for physically settled derivative financial instruments using the process imple-mented within the Group – from the submission of orders by the consolidated subsidiaries to MVV Trading GmbH to the processing of the data by MVV Trading GmbH – and satisfied ourselves that the own use exemption is applied correctly on the basis of a random sample. We assessed the recognition of cash flow hedges and their accounting. With respect to the hedged cash flows, we assessed the essential past hedge effectiveness and the expected future hedge effectiveness and the correctness of the correspond-ing amounts recorded in equity as well as the reclassified amounts within the consolidated income statement. In our view, the accounting policies applied by management and the methodology for accounting for energy trading transactions are appropriate overall.
c. The Company’s disclosures relating to energy trading and its effects on the consolidated financial statements are contained in section “35 Financial instruments” in the notes to the consolidated financial statements.
Other Information
The executive directors are responsible for the other infor-mation. The other information comprises the following non-audited parts of the group management report:
• the statement on corporate governance pursuant to § 289f HGB and § 315d HGB included in section “Corpo-rate Governance” of the group management report
• the corporate governance report pursuant to No. 3.10 of the German Corporate Governance Code
• the separate non-financial report pursuant to § 289b Abs. 3 HGB and § 315b Abs. 3 HGB
The other information comprises further the remaining parts of the annual report – excluding cross-references to external information – with the exception of the audited consolidated financial statements, the audited group management report and our auditor’s report.
Our audit opinions on the consolidated financial statements and on the group management report do not cover the other information, and consequently we do not express an audit opinion or any other form of assurance conclusion thereon.
In connection with our audit, our responsibility is to read the other information and, in so doing, to consider whether the other information
• is materially inconsistent with the consolidated financial statements, with the group management report or our knowledge obtained in the audit, or
• otherwise appears to be materially misstated.
Independent Auditor’s Report | CONSOLIDATED FINANCIAL STATEMENTS
211
Annual Report 2018 | MVV

Responsibilities of the Executive Directors and the Supervisory Board for the Consolidated Financial Statements and the Group Management Report
The executive directors are responsible for the preparation of the consolidated financial statements that comply, in all material respects, with IFRSs as adopted by the EU and the additional requirements of German commercial law pursuant to § 315e Abs. 1 HGB and that the consolidated financial state-ments, in compliance with these requirements, give a true and fair view of the assets, liabilities, financial position, and financial performance of the Group. In addition the executive directors are responsible for such internal control as they have determined necessary to enable the preparation of consolidated financial statements that are free from material misstatement, whether due to fraud or error.
In preparing the consolidated financial statements, the execu-tive directors are responsible for assessing the Group’s ability to continue as a going concern. They also have the responsi-bility for disclosing, as applicable, matters related to going concern. In addition, they are responsible for financial report-ing based on the going concern basis of accounting unless there is an intention to liquidate the Group or to cease opera-tions, or there is no realistic alternative but to do so.
Furthermore, the executive directors are responsible for the preparation of the group management report that, as a whole, provides an appropriate view of the Group’s position and is, in all material respects, consistent with the consolidated financial statements, complies with German legal requirements, and appropriately presents the opportunities and risks of future development. In addition, the executive directors are respon-sible for such arrangements and measures (systems) as they have considered necessary to enable the preparation of a group management report that is in accordance with the applicable German legal requirements, and to be able to provide suffi-cient appropriate evidence for the assertions in the group management report.
The supervisory board is responsible for overseeing the Group’s financial reporting process for the preparation of the consolidated financial statements and of the group management report.
Auditor’s Responsibilities for the Audit of the Consolidated Financial Statements and of the Group Management Report
Our objectives are to obtain reasonable assurance about whether the consolidated financial statements as a whole are free from material misstatement, whether due to fraud or error, and whether the group management report as a whole provides an appropriate view of the Group’s position and, in all material respects, is consistent with the consoli-dated financial statements and the knowledge obtained in the audit, complies with the German legal requirements and appropriately presents the opportunities and risks of future development, as well as to issue an auditor’s report that includes our audit opinions on the consolidated financial statements and on the group management report.
Reasonable assurance is a high level of assurance, but is not a guarantee that an audit conducted in accordance with § 317 HGB and the EU Audit Regulation and in compliance with German Generally Accepted Standards for Financial Statement Audits promulgated by the Institut der Wirtschafts-prüfer (IDW) will always detect a material misstatement. Misstatements can arise from fraud or error and are considered material if, individually or in the aggregate, they could reason-ably be expected to influence the economic decisions of users taken on the basis of these consolidated financial statements and this group management report.
We exercise professional judgment and maintain professional skepticism throughout the audit. We also:
• Identify and assess the risks of material misstatement of the consolidated financial statements and of the group management report, whether due to fraud or error, design and perform audit procedures responsive to those risks, and obtain audit evidence that is sufficient and appropri-ate to provide a basis for our audit opinions. The risk of not detecting a material misstatement resulting from fraud is higher than for one resulting from error, as fraud may involve collusion, forgery, intentional omissions, misrepresentations, or the override of internal control.
Independent Auditor’s Report | CONSOLIDATED FINANCIAL STATEMENTS
212
Annual Report 2018 | MVV
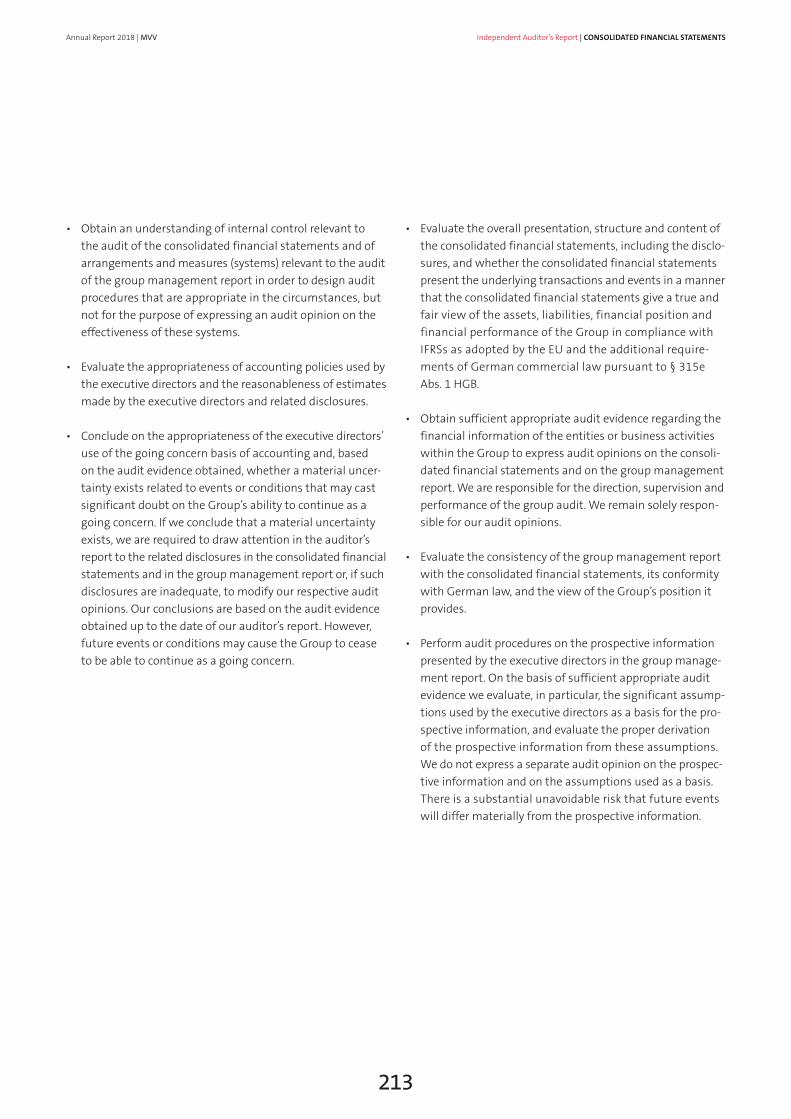
• Obtain an understanding of internal control relevant to the audit of the consolidated financial statements and of arrangements and measures (systems) relevant to the audit of the group management report in order to design audit procedures that are appropriate in the circumstances, but not for the purpose of expressing an audit opinion on the effectiveness of these systems.
• Evaluate the appropriateness of accounting policies used by the executive directors and the reasonableness of estimates made by the executive directors and related disclosures.
• Conclude on the appropriateness of the executive directors’ use of the going concern basis of accounting and, based on the audit evidence obtained, whether a material uncer-tainty exists related to events or conditions that may cast significant doubt on the Group’s ability to continue as a going concern. If we conclude that a material uncertainty exists, we are required to draw attention in the auditor’s report to the related disclosures in the consolidated financial statements and in the group management report or, if such disclosures are inadequate, to modify our respective audit opinions. Our conclusions are based on the audit evidence obtained up to the date of our auditor’s report. However, future events or conditions may cause the Group to cease to be able to continue as a going concern.
• Evaluate the overall presentation, structure and content of the consolidated financial statements, including the disclo-sures, and whether the consolidated financial statements present the underlying transactions and events in a manner that the consolidated financial statements give a true and fair view of the assets, liabilities, financial position and financial performance of the Group in compliance with IFRSs as adopted by the EU and the additional require-ments of German commercial law pursuant to § 315e Abs. 1 HGB.
• Obtain sufficient appropriate audit evidence regarding the financial information of the entities or business activities within the Group to express audit opinions on the consoli-dated financial statements and on the group management report. We are responsible for the direction, supervision and performance of the group audit. We remain solely respon-sible for our audit opinions.
• Evaluate the consistency of the group management report with the consolidated financial statements, its conformity with German law, and the view of the Group’s position it provides.
• Perform audit procedures on the prospective information presented by the executive directors in the group manage-ment report. On the basis of sufficient appropriate audit evidence we evaluate, in particular, the significant assump-tions used by the executive directors as a basis for the pro-spective information, and evaluate the proper derivation of the prospective information from these assumptions. We do not express a separate audit opinion on the prospec-tive information and on the assumptions used as a basis. There is a substantial unavoidable risk that future events will differ materially from the prospective information.
Independent Auditor’s Report | CONSOLIDATED FINANCIAL STATEMENTS
213
Annual Report 2018 | MVV

We communicate with those charged with governance regarding, among other matters, the planned scope and tim-ing of the audit and significant audit findings, including any significant deficiencies in internal control that we identify during our audit.
We also provide those charged with governance with a state-ment that we have complied with the relevant independence requirements, and communicate with them all relationships and other matters that may reasonably be thought to bear on our independence, and where applicable, the related safeguards.
From the matters communicated with those charged with governance, we determine those matters that were of most significance in the audit of the consolidated financial state-ments of the current period and are therefore the key audit matters. We describe these matters in our auditor’s report unless law or regulation precludes public disclosure about the matter.
OTHER LEGAL AND REGULATORY REQUIREMENTS
Further Information pursuant to Article 10 of the EU Audit Regulation
We were elected as group auditor by the annual general meeting on 9 March 2018. We were engaged by the super-visory board on 26 June 2018. We have been the group auditor of the MVV Energie AG, Mannheim, without interruption since the financial year 2008/09.
We declare that the audit opinions expressed in this auditor’s report are consistent with the additional report to the audit committee pursuant to Article 11 of the EU Audit Regulation (long-form audit report).
GERMAN PUBLIC AUDITOR RESPONSIBLE FOR THE ENGAGEMENT
The German Public Auditor responsible for the engagement is Kerstin Krauß.
Mannheim, 13 November 2018
PricewaterhouseCoopers GmbHWirtschaftsprüfungsgesellschaft
Folker Trepte Kerstin KraußWirtschaftsprüfer Wirtschaftsprüferin(German Public Auditor) (German Public Auditor)
Independent Auditor’s Report | CONSOLIDATED FINANCIAL STATEMENTS
214
Annual Report 2018 | MVV