Embed Size (px)
Citation preview
Consolidated Financial
Statements, Management
Report and Auditors´ Report for the year 2017
KPMG Auditores, S.L. Paseo de la Castellana, 259 C 28046 Madrid
Inscrita en el Registro Oficial de Auditores de Cuentas con el nº.S0702, y en el Registro de Sociedades del Instituto de Censores Jurados de Cuentas con el nº.10. Reg. Mer Madrid, T. 11.961, F. 90, Sec. 8, H. M -188.007, Inscrip. 9
N.I.F. B-78510153
KPMG Auditores S.L., sociedad española de responsabilidad limitada y
firma miembro de la red KPMG de firmas independientes afiliadas a
KPMG International Cooperative (“KPMG International”), sociedad suiza.
Paseo de la Castellana 259C – Torre de Cristal – 28046 Madrid
Translation of a report originally issued in Spanish based on our work performed in accordance with prevailing legislation regulating the audit of annual accounts in Spain on the consolidated financial statements originally issued in Spanish and
prepared in accordance with International Financial Reporting Standards as adopted by the European Union (IFRS-EU) and other provisions of the financial reporting framework applicable in Spain (see notes 1.2 and 57). In the event of a
discrepancy, the Spanish-language version prevails.
Independent Auditors’ Report on the Consolidated Annual Accounts
To the Shareholders of Banco Bilbao Vizcaya Argentaria, S.A. commissioned by the Board of Directors
REPORT ON THE CONSOLIDATED ANNUAL ACCOUNTS
Opinion __________________________________________________________________
We have audited the consolidated annual accounts of Banco Bilbao Vizcaya Argentaria, S.A.
(hereinafter the “Bank”) and its subsidiaries which, together with the Bank, form the Banco Bilbao
Vizcaya Argentaria Group (hereinafter the “Group”), which comprise the consolidated balance sheet
as of 31 December 2017, and the consolidated income statement, consolidated statement of
recognized income and expenses, consolidated statement of changes in equity, consolidated
statement of cash flows and the notes thereto for the year then ended
In our opinion, the accompanying consolidated annual accounts present fairly, in all material
respects, the consolidated equity and consolidated financial position of the Banco Bilbao Vizcaya
Argentaria Group as of 31 December 2017, and the results of its consolidated operations and
consolidated cash flows for the year then ended in accordance with International Financial Reporting
Standards as adopted by the European Union (IFRS-EU) and other provisions of the financial
reporting framework applicable in Spain.
Basis for Opinion _________________________________________________________
We conducted our audit in accordance with prevailing legislation regulating the audit of annual
accounts in Spain. Our responsibilities under those standards are further described in the Auditor's
Responsibilities for the Audit of the Consolidated Annual Accounts section of our report.
We are independent of the Group in accordance with the ethical requirements, including those
regarding independence, that are applicable to our audit of the consolidated annual accounts in Spain
pursuant to legislation regulating the audit of annual accounts. We have not provided any services
other than the audit of annual accounts, nor have any situations or circumstances arisen, under the
aforementioned regulations, which would have affected the required independence such that it
would have been compromised.
We believe that the audit evidence we have obtained is sufficient and appropriate to provide a basis
for our opinion.
2
Translation of a report originally issued in Spanish based on our work performed in accordance with prevailing legislation regulating the audit of annual accounts
in Spain on the consolidated financial statements originally issued in Spanish and prepared in accordance with International Financial Reporting Standards as adopted by the European Union (IFRS-EU) and other provisions of the financial reporting framework applicable in Spain (see notes 1.2 and 57). In the event of a
discrepancy, the Spanish-language version prevails.
Key Audit Matters ________________________________________________________
Key audit matters are those matters that, in our professional judgment, were of the most significance
in our audit of the consolidated annual accounts as of and for the year ended 31 December 2017.
These matters were addressed in the context of our audit of the consolidated annual accounts as a
whole, and in forming our opinion thereon, and we do not express a separate opinion on these matters.
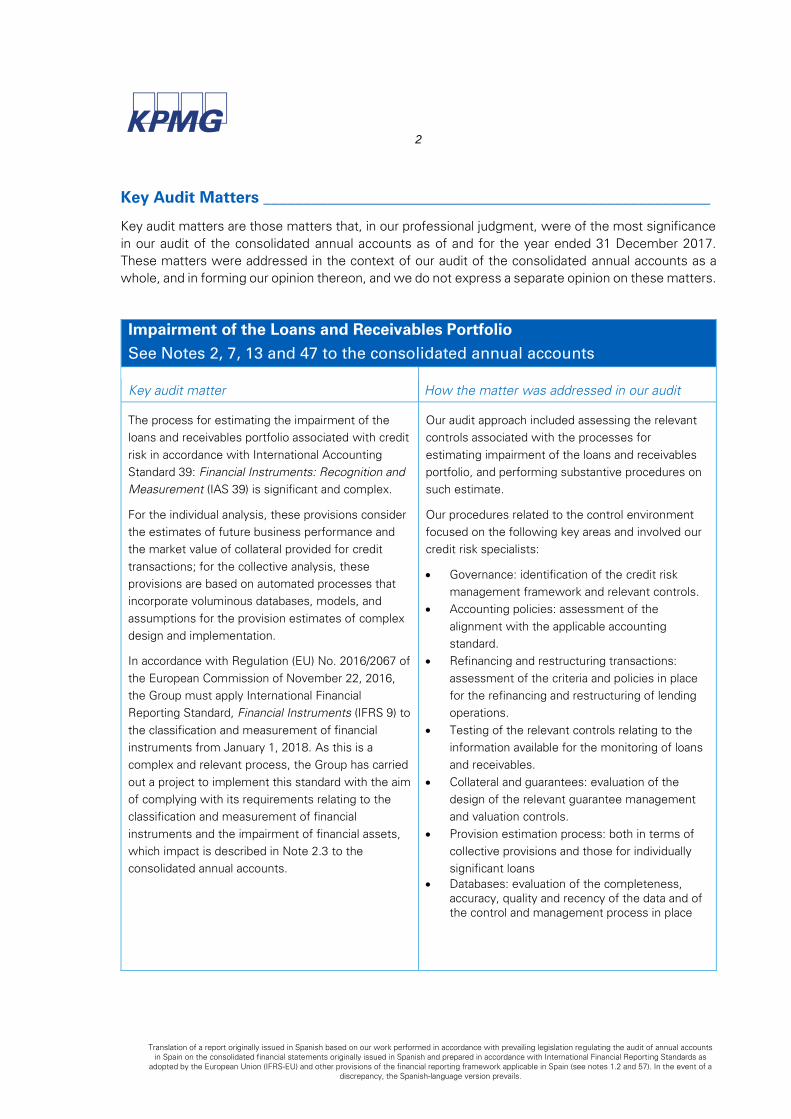
Impairment of the Loans and Receivables Portfolio
See Notes 2, 7, 13 and 47 to the consolidated annual accounts
Key audit matter How the matter was addressed in our audit
The process for estimating the impairment of the
loans and receivables portfolio associated with credit
risk in accordance with International Accounting
Standard 39: Financial Instruments: Recognition and
Measurement (IAS 39) is significant and complex.
For the individual analysis, these provisions consider
the estimates of future business performance and
the market value of collateral provided for credit
transactions; for the collective analysis, these
provisions are based on automated processes that
incorporate voluminous databases, models, and
assumptions for the provision estimates of complex
design and implementation.
In accordance with Regulation (EU) No. 2016/2067 of
the European Commission of November 22, 2016,
the Group must apply International Financial
Reporting Standard, Financial Instruments (IFRS 9) to
the classification and measurement of financial
instruments from January 1, 2018. As this is a
complex and relevant process, the Group has carried
out a project to implement this standard with the aim
of complying with its requirements relating to the
classification and measurement of financial
instruments and the impairment of financial assets,
which impact is described in Note 2.3 to the
consolidated annual accounts.
Our audit approach included assessing the relevant
controls associated with the processes for
estimating impairment of the loans and receivables
portfolio, and performing substantive procedures on
such estimate.
Our procedures related to the control environment
focused on the following key areas and involved our
credit risk specialists:
Governance: identification of the credit risk
management framework and relevant controls.
Accounting policies: assessment of the
alignment with the applicable accounting
standard.
Refinancing and restructuring transactions:
assessment of the criteria and policies in place
for the refinancing and restructuring of lending
operations.
Testing of the relevant controls relating to the
information available for the monitoring of loans
and receivables.
Collateral and guarantees: evaluation of the
design of the relevant guarantee management
and valuation controls.
Provision estimation process: both in terms of
collective provisions and those for individually
significant loans
Databases: evaluation of the completeness, accuracy, quality and recency of the data and of the control and management process in place
3
Translation of a report originally issued in Spanish based on our work performed in accordance with prevailing legislation regulating the audit of annual accounts
in Spain on the consolidated financial statements originally issued in Spanish and prepared in accordance with International Financial Reporting Standards as adopted by the European Union (IFRS-EU) and other provisions of the financial reporting framework applicable in Spain (see notes 1.2 and 57). In the event of a
discrepancy, the Spanish-language version prevails.
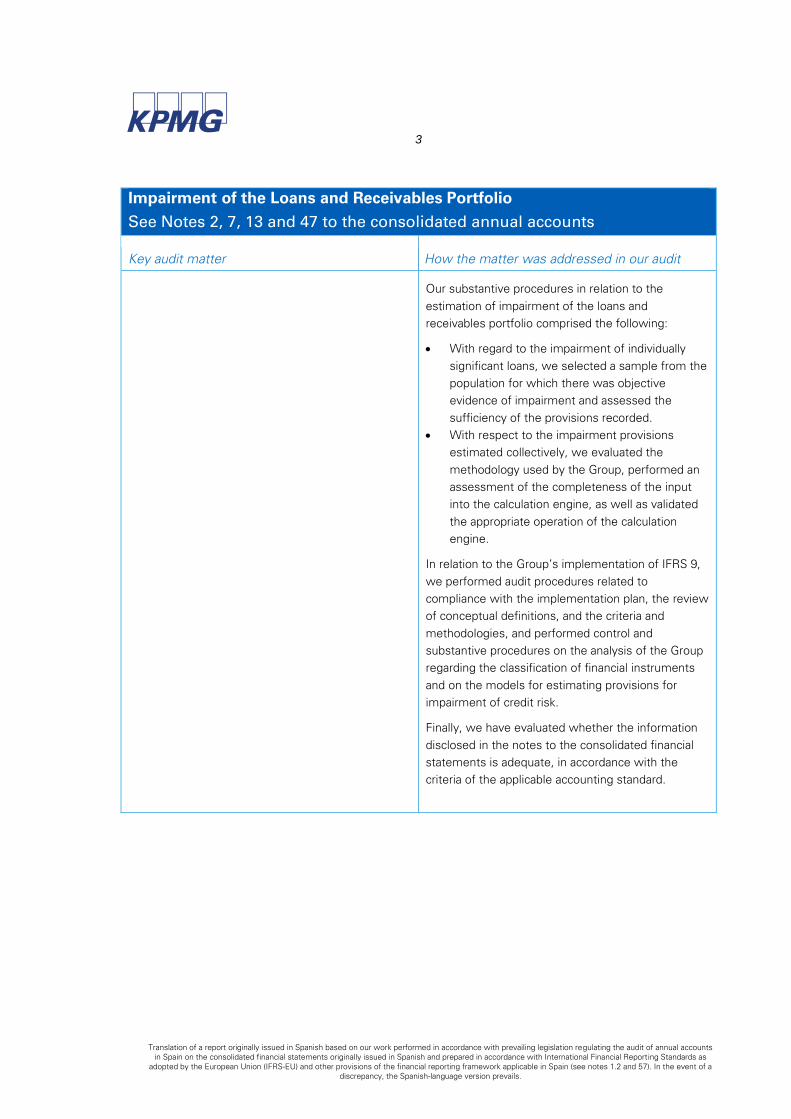
Impairment of the Loans and Receivables Portfolio
See Notes 2, 7, 13 and 47 to the consolidated annual accounts
Key audit matter How the matter was addressed in our audit
Our substantive procedures in relation to the
estimation of impairment of the loans and
receivables portfolio comprised the following:
With regard to the impairment of individually
significant loans, we selected a sample from the
population for which there was objective
evidence of impairment and assessed the
sufficiency of the provisions recorded.
With respect to the impairment provisions
estimated collectively, we evaluated the
methodology used by the Group, performed an
assessment of the completeness of the input
into the calculation engine, as well as validated
the appropriate operation of the calculation
engine.
In relation to the Group’s implementation of IFRS 9,
we performed audit procedures related to
compliance with the implementation plan, the review
of conceptual definitions, and the criteria and
methodologies, and performed control and
substantive procedures on the analysis of the Group
regarding the classification of financial instruments
and on the models for estimating provisions for
impairment of credit risk.
Finally, we have evaluated whether the information
disclosed in the notes to the consolidated financial
statements is adequate, in accordance with the
criteria of the applicable accounting standard.
4
Translation of a report originally issued in Spanish based on our work performed in accordance with prevailing legislation regulating the audit of annual accounts
in Spain on the consolidated financial statements originally issued in Spanish and prepared in accordance with International Financial Reporting Standards as adopted by the European Union (IFRS-EU) and other provisions of the financial reporting framework applicable in Spain (see notes 1.2 and 57). In the event of a
discrepancy, the Spanish-language version prevails.
Classification and Measurement of Financial Instruments
See Notes 2.2.1, 8, 10, 11 and 12 to the consolidated annual accounts
Key audit matter How the matter was addressed in our audit
The classification and measurement of financial
instruments, for the purpose of their valuation may
require an elevated level of judgment and complex
estimates, and in determining the criteria to be
applied in their subsequent measurement.
In the absence of a quoted price in an active market
(level 2 and 3 financial instruments), the fair value of
financial instruments is determined using complex
valuation techniques which may take into
consideration direct or indirect unobservable market
data and complex pricing models which require an
elevated level of judgment
Also, due to the relevance of certain equity
instruments classified as available for sale, we
considered that there is an inherent risk associated
with the determination of the existence and
valuation of impairment in these instruments.
Our audit approach included assessing the relevant
controls associated with the classification and
measurement processes for financial instrument
portfolios, as well as performing substantive
procedures thereon.
Our procedures related to the control environment
focused on the following key areas and involved our
market risk specialists:
Understanding of the strategy and operations of
the financial markets in which the Group
operates
Governance: identification of the market risk
framework and relevant controls.
Transaction origination process: evaluation of
the transaction settlement processes and
custody of deposits.
Classification of transactions: assessment of the
application of the Group's policies and of the
procedures implemented to identify and classify
financial instruments.
Measurement estimation process: assessment
of the relevant valuation controls.
Databases: evaluation of the completeness,
accuracy, quality and recency of the data and of
the control and management process in place
With regards to the substantive procedures related
to the classification and measurement of financial
instruments, we selected a sample of the Group’s
financial assets and derivatives, and evaluated the
appropriateness of their measurement and
classification. We also assessed the most significant
valuation models.
In relation to the determination of objective evidence
of impairment for available for sale investments, we
have evaluated the methodology applied and the
conclusion reached by the Group regarding the
existence of objective evidence of impairment as of
31 December 2017.
5
Translation of a report originally issued in Spanish based on our work performed in accordance with prevailing legislation regulating the audit of annual accounts
in Spain on the consolidated financial statements originally issued in Spanish and prepared in accordance with International Financial Reporting Standards as adopted by the European Union (IFRS-EU) and other provisions of the financial reporting framework applicable in Spain (see notes 1.2 and 57). In the event of a
discrepancy, the Spanish-language version prevails.
Measurement of Intangible Assets – Goodwill
See Notes 2.2.8 and 18 to the consolidated annual accounts
Key audit matter How the matter was addressed in our audit
The Group has recorded goodwill primarily relating to
the acquisition of entities in the United States and
Turkey.
Valuation of this asset requires the identification of
cash-generating units (CGUs), the calculation of the
book value for each CGU, the estimation of the
recoverable amount of the CGUs, and the
identification of triggering events that may be
indicators of impairment. This estimation entails,
among other things, financial projections that
consider macroeconomic assumptions, internal
circumstances of the entity and its competitors,
discount rates or future business performance.
Therefore, there is a high degree of judgment and
complexity in the accounting and valuation of
goodwill.
As part of our audit procedures, we tested the key
processes and controls established by management
in relation to the Group's process for identifying
CGUs and the annual evaluation of potential
impairment of goodwill.
Additionally, we have performed substantive
procedures in relation to the evaluation carried out by
Management on the potential impairment of
goodwill, particularly on the accuracy of the
information used by Management for each CGU, the
reasonableness of the valuation methodology used
and the assumptions and valuation hypothesis
considered, in particular those factors to which the
determination of recoverable value is more sensitive.
6
Translation of a report originally issued in Spanish based on our work performed in accordance with prevailing legislation regulating the audit of annual accounts
in Spain on the consolidated financial statements originally issued in Spanish and prepared in accordance with International Financial Reporting Standards as adopted by the European Union (IFRS-EU) and other provisions of the financial reporting framework applicable in Spain (see notes 1.2 and 57). In the event of a
discrepancy, the Spanish-language version prevails.
Risks Associated with Information Technology
Key audit matter How the matter was addressed in our audit
The Group has a complex technological operating
environment with major data processing centers in
Spain and Mexico, which provide support to different
subsidiaries in different countries, an independent
data processing environment in Spain for the
insurance activity, separate data processing centers
in Turkey, Argentina and Venezuela, and other data
processing services in the United States and Latin
American countries.
Given the significant dependence by the businesses
of the Group on information technology (IT) systems,
it is critical to evaluate the controls over the principal
technology risks.
In accordance with our audit methodology, our
assessment of the IT systems encompassed two
areas: IT general controls and IT automated controls
in key processes.
Our assessment of IT general controls encompassed
the evaluation of existing general controls of
technological platforms on which the applications are
housed. During the audit we performed control tests
on the relevant applications applicable to the critical
areas of our work.
In this phase of our evaluation of the general controls
we assessed, among others, controls related to the
following activities: access to programs and data;
program changes; program development; and
computer operations.
With respect to the IT automated controls in key
processes, during our audit we determined the key
business processes, and for those processes we
identified the principal applications and automated
controls in place for information flows. For the
principal information systems, IT platforms and
applications considered key for our audit of the
Group, we analyzed the threats and vulnerabilities
associated with the completeness, accuracy and
availability of information, and identified and tested
the design and the operating effectiveness of the
controls implemented to respond to these risks.
7
Translation of a report originally issued in Spanish based on our work performed in accordance with prevailing legislation regulating the audit of annual accounts
in Spain on the consolidated financial statements originally issued in Spanish and prepared in accordance with International Financial Reporting Standards as adopted by the European Union (IFRS-EU) and other provisions of the financial reporting framework applicable in Spain (see notes 1.2 and 57). In the event of a
discrepancy, the Spanish-language version prevails.
Other Information: Consolidated Directors’ Report __________________________
Other information comprises, solely, the consolidated directors' report for the year ended 31
December 2017, the preparation of which is the responsibility of the Bank's Directors and which
does not form an integral part of the consolidated annual accounts.
Our audit opinion on the consolidated annual accounts does not encompass the consolidated
directors' report. Our responsibility regarding the information contained in the consolidated directors'
report is defined in the legislation regulating the audit of annual accounts, which establishes two
different levels for this information:
a) A specific level applicable to non-financial information, as well as certain information included
in the Annual Corporate Governance Report (ACGR), as defined in article 35.2. b) of the Audit
Law 22/2015, which consists of merely checking that this information has been provided in
the consolidated directors' report and if not, to report on this matter.
b) A general level applicable to the rest of the information included in the consolidated directors'
report, which consists of assessing and reporting on the consistency of this information with
the consolidated annual accounts, based on knowledge of the Bank obtained during the audit
of the aforementioned consolidated annual accounts and without including any information
other than that obtained as evidence during the audit. It is also our responsibility to assess and
report on whether the content and presentation of this part of the consolidated directors'
report are in accordance with applicable legislation. If, based on the work we have performed,
we conclude that there are material misstatements, we are required to report them.
Based on the work performed, as described in the preceding paragraph, we have checked that the
specific information mentioned in a) above has been provided in the consolidated directors’ report
and that the rest of the information contained in the consolidated directors' report is consistent with
that disclosed in the consolidated annual accounts for the year ended 31 December 2017 and the
content and presentation of the report are in accordance with applicable legislation.
Responsibility of the Bank’s Directors and the Audit and Compliance
Committee for the Consolidated Annual Accounts _________________________
The Bank's Directors are responsible for the preparation of the accompanying consolidated annual
accounts in order to present fairly the consolidated equity, consolidated financial position and
consolidated results of operations of the Group in accordance with IFRS-EU and other provisions of
the financial reporting framework applicable to the Group in Spain, and for such internal control as
they determine necessary to enable the preparation of consolidated annual accounts free from
material misstatement, whether due to fraud or error.

8
Translation of a report originally issued in Spanish based on our work performed in accordance with prevailing legislation regulating the audit of annual accounts
in Spain on the consolidated financial statements originally issued in Spanish and prepared in accordance with International Financial Reporting Standards as adopted by the European Union (IFRS-EU) and other provisions of the financial reporting framework applicable in Spain (see notes 1.2 and 57). In the event of a
discrepancy, the Spanish-language version prevails.
In preparing the consolidated annual accounts, the Bank's Directors are responsible for evaluating
the Group's ability to continue as a going concern, disclosing, as applicable, matters related to going
concern and using the going concern basis of accounting unless the Bank's Directors intend to either
liquidate the Group or to cease operations, or have no other realistic alternative but to do so.
The Bank's Audit and Compliance Committee is responsible for providing oversight in the
preparation and presentation of the consolidated annual accounts.
Auditor’s Responsibilities for the Audit of the Consolidated Annual Accounts___
Our objectives are to obtain reasonable assurance about whether the consolidated annual accounts
as a whole are free from material misstatement, whether due to fraud or error, and to issue an
auditors’ report that includes our opinion.
Reasonable assurance is a high level of assurance, but it does not guarantee that an audit conducted
in accordance with the prevailing legislation regulating the audit of annual accounts in Spain will
always detect an existing material misstatement. Misstatements can arise from fraud or error and
are considered material if, individually or in the aggregate, they could reasonably be expected to
influence the economic decisions of users taken on the basis of these consolidated annual accounts.
As part of an audit in accordance with the prevailing legislation regulating the audit of annual
accounts in Spain, we exercise professional judgment and maintain professional skepticism
throughout the audit. We also:
• Identify and assess the risks of material misstatement in the consolidated annual accounts,
whether due to fraud or error, design and perform audit procedures to respond to those risks,
and obtain sufficient and appropriate audit evidence to provide a basis for our opinion. The risk of
not detecting a material misstatement resulting from fraud is higher than for one resulting from
error, as fraud may involve collusion, forgery, deliberate omissions, intentional
misrepresentations, or the override of internal control.
• Obtain an understanding of internal control relevant to the audit in order to design audit
procedures that are appropriate in the circumstances, and not for the purpose of expressing an
opinion on the effectiveness of the Group's internal control.
• Evaluate the appropriateness of accounting policies used and the reasonableness of accounting
estimates and related disclosures made by the Bank's Directors.
9
Translation of a report originally issued in Spanish based on our work performed in accordance with prevailing legislation regulating the audit of annual accounts
in Spain on the consolidated financial statements originally issued in Spanish and prepared in accordance with International Financial Reporting Standards as adopted by the European Union (IFRS-EU) and other provisions of the financial reporting framework applicable in Spain (see notes 1.2 and 57). In the event of a
discrepancy, the Spanish-language version prevails.
• Conclude on the appropriateness of the Bank's Directors' use of the going concern basis of
accounting and, based on the audit evidence obtained, conclude on whether a material
uncertainty exists related to events or conditions that may cast significant doubt on the Group's
ability to continue as a going concern. If we conclude that a material uncertainty exists, we are
required to draw attention in our auditor's report to the related disclosures in the consolidated
annual accounts or, if such disclosures are inadequate, to modify our opinion. Our conclusions are
based on the audit evidence obtained up to the date of our auditor's report. However, future
events or conditions may cause the Group to cease to continue as a going concern.
• Evaluate the overall presentation, structure and content of the consolidated annual accounts,
including the disclosures, and whether the consolidated annual accounts represent the underlying
transactions and events in a manner that achieves fair presentation.
• Obtain sufficient appropriate audit evidence regarding the financial information of the entities or
business activities within the Group to express an opinion on the consolidated annual accounts.
We are responsible for the direction, supervision and performance of the Group audit. We remain
solely responsible for our audit opinion.
We communicate with the Bank's Audit and Compliance Committee, among other matters, the
planned scope and timing of the audit and significant audit findings, including any significant
deficiencies in internal control that we identify during our audit.
We also provide the Bank's Audit and Compliance Committee with the declaration that we have
complied with relevant ethical requirements, including those regarding independence, and have
communicated with the Committee all matters that may reasonably be thought to bear on our
independence, and where applicable, the related safeguards.
From the matters communicated to the Bank's Audit and Compliance Committee, we determine
those matters that were of most significance in the audit of the consolidated annual accounts as of
and for the year ended 31 December 2017 and are therefore the key audit matters.
We describe these matters in our auditor’s report unless laws or regulations preclude public
disclosure about the matter.
P. 1Translation of the Consolidated Financial Statements originally issued in Spanish and prepared in accordance with EU-IFRSs, as adopted by the European Union (See Note 1 and 56). In the event of a discrepancy, the Spanish language version prevails.
Contents
CONSOLIDATED FINANCIAL STATEMENTS
Consolidated balance sheets ..................................................................................................................................... 4
Consolidated income statements .............................................................................................................................. 7
Consolidated statements of recognized income and expenses ............................................................................. 8
Consolidated statements of changes in equity......................................................................................................... 9
Consolidated statements of cash flows .................................................................................................................. 12
NOTES TO THE ACCOMPANYING CONSOLIDATED FINANCIAL STATEMENTS
1. Introduction, basis for the presentation of the Consolidated Financial Statements, internal control ..........
of financial information and other information .............................................................................................. 13
2. Principles of consolidation, accounting policies and measurement bases applied and recent ....................
IFRS pronouncements .....................................................................................................................................16
3. BBVA Group ...................................................................................................................................................... 51
4. Shareholder remuneration system ................................................................................................................ 55
5. Earnings per share ........................................................................................................................................... 57
6. Operating segment reporting.......................................................................................................................... 58
7. Risk management .............................................................................................................................................61
8. Fair value .......................................................................................................................................................... 116
9. Cash and cash balances at central banks and other demands deposits and Financial liabilities .................
measured at amortized cost ......................................................................................................................... 129
10. Financial assets and liabilities held for trading ............................................................................................ 129
11. Financial assets and liabilities designated at fair value through profit or loss........................................... 134
12. Available-for-sale financial assets ................................................................................................................ 134
13. Loans and receivables .................................................................................................................................... 141
14. Held-to-maturity investments ...................................................................................................................... 144
15. Hedging derivatives and fair value changes of the hedged items in portfolio hedges of interest rate .........
risk ................................................................................................................................................................... 146
16. Investments in joint ventures and associates .............................................................................................. 148
17. Tangible assets .............................................................................................................................................. 150
18. Intangible assets ............................................................................................................................................ 153
19. Tax assets and liabilities ................................................................................................................................ 158
20. Other assets and liabilities............................................................................................................................. 163
21. Non-current assets and disposal groups held for sale................................................................................ 164
22. Financial liabilities at amortized cost ............................................................................................................ 166
P. 2 Translation of the Consolidated Financial Statements originally issued in Spanish and prepared in accordance with EU-IFRSs, as adopted by the European Union (See Note 1 and 56). In the event of a discrepancy, the Spanish language version prevails.
23. Liabilities under insurance and reinsurance contracts ................................................................................ 171
24. Provisions ........................................................................................................................................................173
25. Post-employment and other employee benefit commitments ................................................................... 175
26. Common stock ............................................................................................................................................... 185
27. Share premium .............................................................................................................................................. 188
28. Retained earnings, revaluation reserves and other reserves ..................................................................... 188
29. Treasury shares .............................................................................................................................................. 191
30. Accumulated other comprehensive income (loss) ..................................................................................... 192
31. Non-controlling interest ................................................................................................................................ 192
32. Capital base and capital management ......................................................................................................... 193
33. Commitments and guarantees given ........................................................................................................... 196
34. Other contingent assets and liabilities ......................................................................................................... 197
35. Purchase and sale commitments and future payment obligations ........................................................... 197
36. Transactions on behalf of third parties ........................................................................................................ 198
37. Interest income and expense ........................................................................................................................ 199
38. Dividend income ............................................................................................................................................. 202
39. Share of profit or loss of entities accounted for using the equity method................................................. 202
40. Fee and commission income and expense .................................................................................................. 202
41. Gains (losses) on financial assets and liabilities, net and Exchange Differences ..................................... 203
42. Other operating income and expense .......................................................................................................... 204
43. Income and expense from insurance and reinsurance contracts.............................................................. 205
44. Administration costs ...................................................................................................................................... 205
45. Depreciation and Amortization ..................................................................................................................... 210
46. Provisions or reversal of provisions .............................................................................................................. 210
47. Impairment or reversal of impairment on financial assets not measured at fair value through ...................
profit or loss .................................................................................................................................................... 211
48. Impairment or reversal of impairment on non-financial assets .................................................................. 211
49. Gains (losses) on derecognition of non financial assets and subsidiaries, net .......................................... 211
50. Profit (loss) from non-current assets and disposal groups classified as held for sale not ...........................
qualifying as discontinued operations ......................................................................................................... 212
51. Consolidated statements of cash flows ....................................................................................................... 212
52. Accountant fees and services ....................................................................................................................... 213
53. Related-party transactions ........................................................................................................................... 214
54. Remuneration and other benefits received by the Board of Directors and members of the Bank’s ...........
Senior Management ...................................................................................................................................... 216
55. Other information ........................................................................................................................................... 222
56. Subsequent events ........................................................................................................................................ 224
57. Explanation added for translation into English ............................................................................................ 224
P. 3Translation of the Consolidated Financial Statements originally issued in Spanish and prepared in accordance with EU-IFRSs, as adopted by the European Union (See Note 1 and 56). In the event of a discrepancy, the Spanish language version prevails.
APPENDICES
APPENDIX I Additional information on consolidated subsidiaries and consolidated structured .........................
entities composing the BBVA Group ......................................................................................... 226
APPENDIX II Additional information on investments joint ventures and associates in the BBVA Group ....... 235
APPENDIX III Changes and notification of participations in the BBVA Group in 2017...................................... 236
APPENDIX IV Fully consolidated subsidiaries with more than 10% owned by non-Group shareholders ............
as of December 31, 2017 ............................................................................................................. 241
APPENDIX V BBVA Group’s structured entities. Securitization funds .............................................................. 242
APPENDIX VI Details of the outstanding subordinated debt and preferred securities issued by the ..................
Bank or entities in the Group consolidated as of December 31, 2017, 2016 and 2015 .......... 243
APPENDIX VII Consolidated balance sheets held in foreign currency as of December 31, 2017, 2016 ...............
and 2015. ...................................................................................................................................... 247
APPENDIX VIII Consolidated income statements for the first and second half of 2017 and 2016 .................. 248
APPENDIX IX Financial Statements of Banco Bilbao Vizcaya Argentaria, S.A. ................................................ 249
APPENDIX X Information on data derived from the special accounting registry ............................................. 258
APPENDIX XI Quantitative information on refinancing and restructuring operations and other .........................
requirement under Bank of Spain Circular 6/2012 .................................................................. 264
APPENDIX XII Additional information on Risk Concentration ............................................................................ 275
APPENDIX XIII Information in accordance with Article 89 of Directive 2013/36/EU of the ................................
European Parliament and its application to Spanish Law through Law 10/2014 ..................290
Glossary .................................................................................................................................................................. 291
CONSOLIDATED MANAGEMENT REPORT
P. 4Translation of the Consolidated Financial Statements originally issued in Spanish and prepared in accordance with EU-IFRSs, as adopted by the European Union (See Note 1 and 56). In the event of a discrepancy, the Spanish language version prevails.
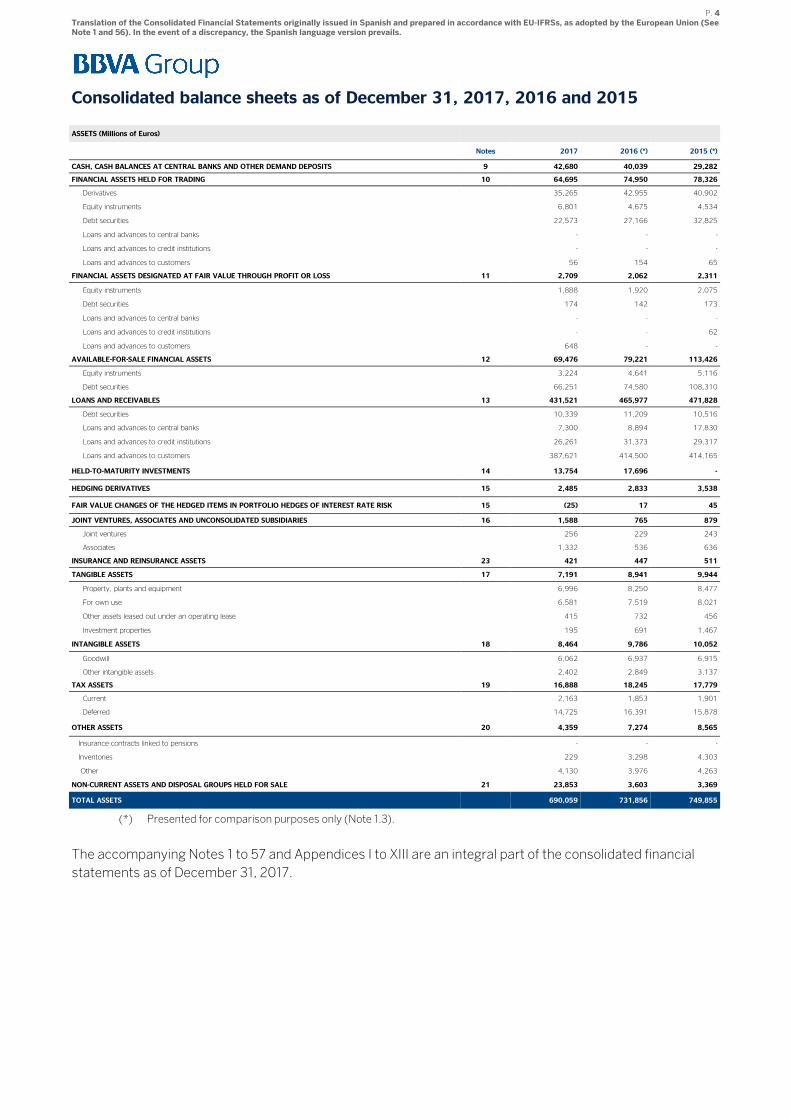
Consolidated balance sheets as of December 31, 2017, 2016 and 2015
ASSETS (Millions of Euros)
Notes 2017 2016 (*) 2015 (*)
CASH, CASH BALANCES AT CENTRAL BANKS AND OTHER DEMAND DEPOSITS 9 42,680 40,039 29,282
FINANCIAL ASSETS HELD FOR TRADING 10 64,695 74,950 78,326
Derivatives 35,265 42,955 40,902
Equity instruments 6,801 4,675 4,534
Debt securities 22,573 27,166 32,825
Loans and advances to central banks - - -
Loans and advances to credit institutions - - -
Loans and advances to customers 56 154 65
FINANCIAL ASSETS DESIGNATED AT FAIR VALUE THROUGH PROFIT OR LOSS 11 2,709 2,062 2,311
Equity instruments 1,888 1,920 2,075
Debt securities 174 142 173
Loans and advances to central banks - - -
Loans and advances to credit institutions - - 62
Loans and advances to customers 648 - -
AVAILABLE-FOR-SALE FINANCIAL ASSETS 12 69,476 79,221 113,426
Equity instruments 3,224 4,641 5,116
Debt securities 66,251 74,580 108,310
LOANS AND RECEIVABLES 13 431,521 465,977 471,828
Debt securities 10,339 11,209 10,516
Loans and advances to central banks 7,300 8,894 17,830
Loans and advances to credit institutions 26,261 31,373 29,317
Loans and advances to customers 387,621 414,500 414,165
HELD-TO-MATURITY INVESTMENTS 14 13,754 17,696 -
HEDGING DERIVATIVES 15 2,485 2,833 3,538
FAIR VALUE CHANGES OF THE HEDGED ITEMS IN PORTFOLIO HEDGES OF INTEREST RATE RISK 15 (25) 17 45
JOINT VENTURES, ASSOCIATES AND UNCONSOLIDATED SUBSIDIARIES 16 1,588 765 879
Joint ventures 256 229 243
Associates 1,332 536 636
INSURANCE AND REINSURANCE ASSETS 23 421 447 511
TANGIBLE ASSETS 17 7,191 8,941 9,944
Property, plants and equipment 6,996 8,250 8,477
For own use 6,581 7,519 8,021
Other assets leased out under an operating lease 415 732 456
Investment properties 195 691 1,467
INTANGIBLE ASSETS 18 8,464 9,786 10,052
Goodwill 6,062 6,937 6,915
Other intangible assets 2,402 2,849 3,137
TAX ASSETS 19 16,888 18,245 17,779
Current 2,163 1,853 1,901
Deferred 14,725 16,391 15,878
OTHER ASSETS 20 4,359 7,274 8,565
Insurance contracts linked to pensions - - -
Inventories 229 3,298 4,303
Other 4,130 3,976 4,263
NON-CURRENT ASSETS AND DISPOSAL GROUPS HELD FOR SALE 21 23,853 3,603 3,369
TOTAL ASSETS 690,059 731,856 749,855
(*) Presented for comparison purposes only (Note 1.3).
The accompanying Notes 1 to 57 and Appendices I to XIII are an integral part of the consolidated financial
statements as of December 31, 2017.
P. 5Translation of the Consolidated Financial Statements originally issued in Spanish and prepared in accordance with EU-IFRSs, as adopted by the European Union (See Note 1 and 56). In the event of a discrepancy, the Spanish language version prevails.
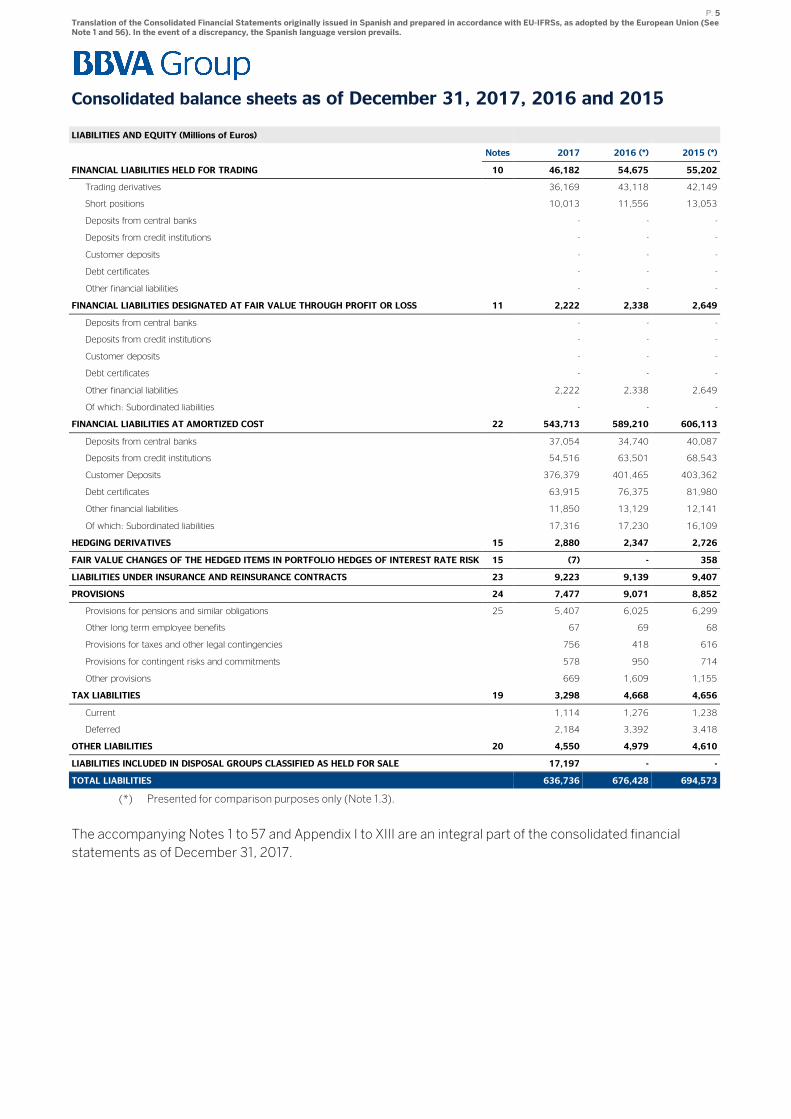
Consolidated balance sheets as of December 31, 2017, 2016 and 2015
LIABILITIES AND EQUITY (Millions of Euros)
Notes 2017 2016 (*) 2015 (*)
FINANCIAL LIABILITIES HELD FOR TRADING 10 46,182 54,675 55,202
Trading derivatives 36,169 43,118 42,149
Short positions 10,013 11,556 13,053
Deposits from central banks - - -
Deposits from credit institutions - - -
Customer deposits - - -
Debt certificates - - -
Other financial liabilities - - -
FINANCIAL LIABILITIES DESIGNATED AT FAIR VALUE THROUGH PROFIT OR LOSS 11 2,222 2,338 2,649
Deposits from central banks - - -
Deposits from credit institutions - - -
Customer deposits - - -
Debt certificates - - -
Other financial liabilities 2,222 2,338 2,649
Of which: Subordinated liabilities - - -
FINANCIAL LIABILITIES AT AMORTIZED COST 22 543,713 589,210 606,113
Deposits from central banks 37,054 34,740 40,087
Deposits from credit institutions 54,516 63,501 68,543
Customer Deposits 376,379 401,465 403,362
Debt certificates 63,915 76,375 81,980
Other financial liabilities 11,850 13,129 12,141
Of which: Subordinated liabilities 17,316 17,230 16,109
HEDGING DERIVATIVES 15 2,880 2,347 2,726
FAIR VALUE CHANGES OF THE HEDGED ITEMS IN PORTFOLIO HEDGES OF INTEREST RATE RISK 15 (7) - 358
LIABILITIES UNDER INSURANCE AND REINSURANCE CONTRACTS 23 9,223 9,139 9,407
PROVISIONS 24 7,477 9,071 8,852
Provisions for pensions and similar obligations 25 5,407 6,025 6,299
Other long term employee benefits 67 69 68
Provisions for taxes and other legal contingencies 756 418 616
Provisions for contingent risks and commitments 578 950 714
Other provisions 669 1,609 1,155
TAX LIABILITIES 19 3,298 4,668 4,656
Current 1,114 1,276 1,238
Deferred 2,184 3,392 3,418
OTHER LIABILITIES 20 4,550 4,979 4,610
LIABILITIES INCLUDED IN DISPOSAL GROUPS CLASSIFIED AS HELD FOR SALE 17,197 - -
TOTAL LIABILITIES 636,736 676,428 694,573
(*) Presented for comparison purposes only (Note 1.3).
The accompanying Notes 1 to 57 and Appendix I to XIII are an integral part of the consolidated financial
statements as of December 31, 2017.
P. 6Translation of the Consolidated Financial Statements originally issued in Spanish and prepared in accordance with EU-IFRSs, as adopted by the European Union (See Note 1 and 56). In the event of a discrepancy, the Spanish language version prevails.
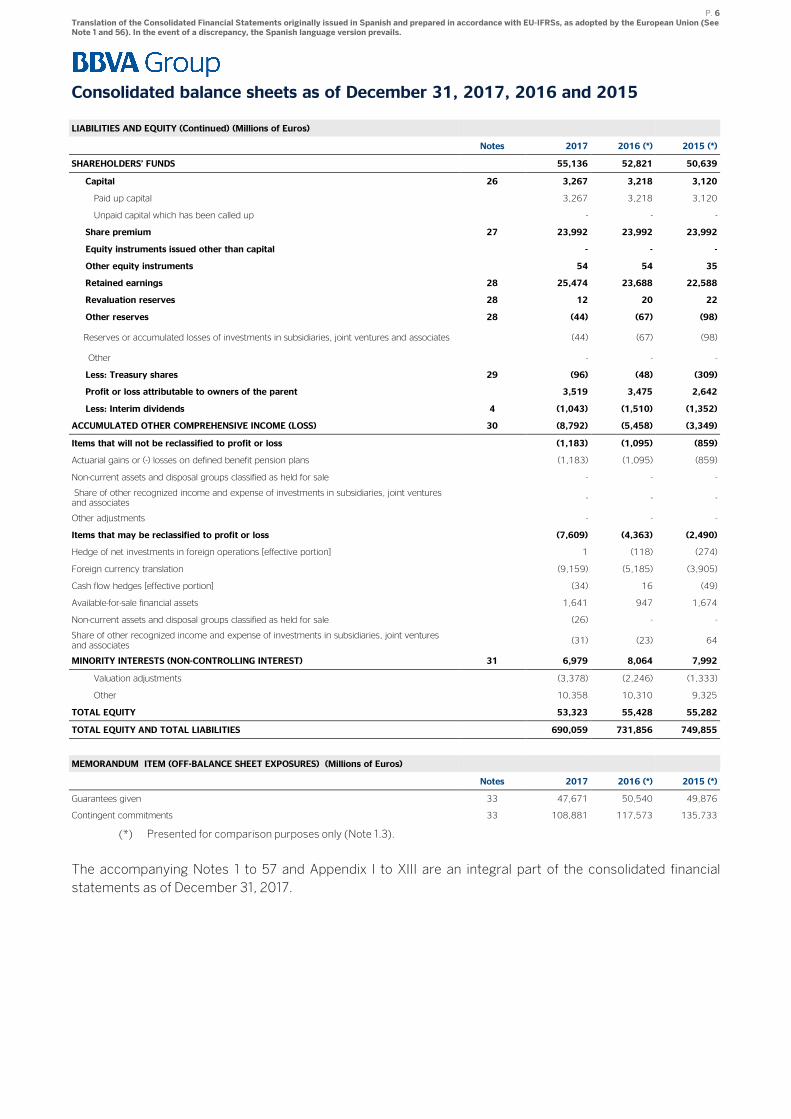
Consolidated balance sheets as of December 31, 2017, 2016 and 2015
LIABILITIES AND EQUITY (Continued) (Millions of Euros)
Notes 2017 2016 (*) 2015 (*)
SHAREHOLDERS’ FUNDS 55,136 52,821 50,639
Capital 26 3,267 3,218 3,120
Paid up capital 3,267 3,218 3,120
Unpaid capital which has been called up - - -
Share premium 27 23,992 23,992 23,992
Equity instruments issued other than capital - - -
Other equity instruments 54 54 35
Retained earnings 28 25,474 23,688 22,588
Revaluation reserves 28 12 20 22
Other reserves 28 (44) (67) (98)
Reserves or accumulated losses of investments in subsidiaries, joint ventures and associates (44) (67) (98)
Other - - -
Less: Treasury shares 29 (96) (48) (309)
Profit or loss attributable to owners of the parent 3,519 3,475 2,642
Less: Interim dividends 4 (1,043) (1,510) (1,352)
ACCUMULATED OTHER COMPREHENSIVE INCOME (LOSS) 30 (8,792) (5,458) (3,349)
Items that will not be reclassified to profit or loss (1,183) (1,095) (859)
Actuarial gains or (-) losses on defined benefit pension plans (1,183) (1,095) (859)
Non-current assets and disposal groups classified as held for sale - - -
Share of other recognized income and expense of investments in subsidiaries, joint ventures and associates
- - -
Other adjustments - - -
Items that may be reclassified to profit or loss (7,609) (4,363) (2,490)
Hedge of net investments in foreign operations [effective portion] 1 (118) (274)
Foreign currency translation (9,159) (5,185) (3,905)
Cash flow hedges [effective portion] (34) 16 (49)
Available-for-sale financial assets 1,641 947 1,674
Non-current assets and disposal groups classified as held for sale (26) - -
Share of other recognized income and expense of investments in subsidiaries, joint ventures and associates
(31) (23) 64
MINORITY INTERESTS (NON-CONTROLLING INTEREST) 31 6,979 8,064 7,992
Valuation adjustments (3,378) (2,246) (1,333)
Other 10,358 10,310 9,325
TOTAL EQUITY 53,323 55,428 55,282
TOTAL EQUITY AND TOTAL LIABILITIES 690,059 731,856 749,855
MEMORANDUM ITEM (OFF-BALANCE SHEET EXPOSURES) (Millions of Euros)
Notes 2017 2016 (*) 2015 (*)
Guarantees given 33 47,671 50,540 49,876
Contingent commitments 33 108,881 117,573 135,733
(*) Presented for comparison purposes only (Note 1.3).
The accompanying Notes 1 to 57 and Appendix I to XIII are an integral part of the consolidated financial
statements as of December 31, 2017.
P. 7Translation of the Consolidated Financial Statements originally issued in Spanish and prepared in accordance with EU-IFRSs, as adopted by the European Union (See Note 1 and 56). In the event of a discrepancy, the Spanish language version prevails.
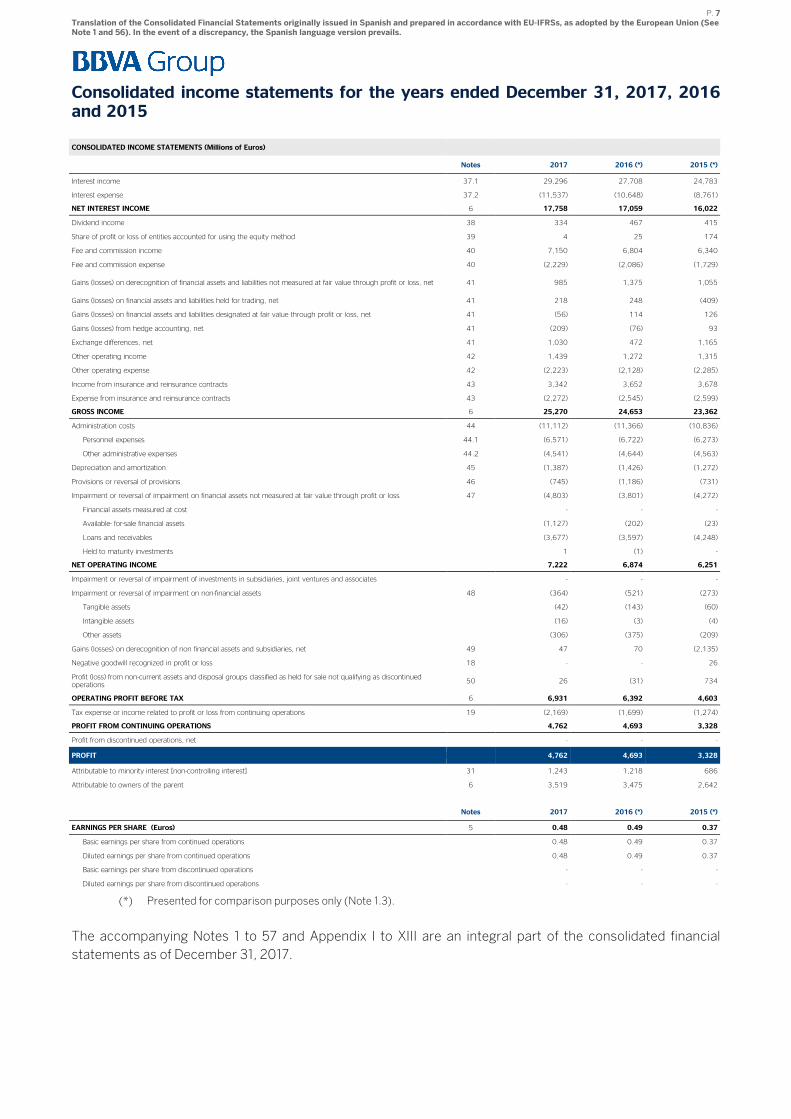
Consolidated income statements for the years ended December 31, 2017, 2016 and 2015
CONSOLIDATED INCOME STATEMENTS (Millions of Euros)
Notes 2017 2016 (*) 2015 (*)
Interest income 37.1 29,296 27,708 24,783
Interest expense 37.2 (11,537) (10,648) (8,761)
NET INTEREST INCOME 6 17,758 17,059 16,022
Dividend income 38 334 467 415
Share of profit or loss of entities accounted for using the equity method 39 4 25 174
Fee and commission income 40 7,150 6,804 6,340
Fee and commission expense 40 (2,229) (2,086) (1,729)
Gains (losses) on derecognition of financial assets and liabilities not measured at fair value through profit or loss, net 41 985 1,375 1,055
Gains (losses) on financial assets and liabilities held for trading, net 41 218 248 (409)
Gains (losses) on financial assets and liabilities designated at fair value through profit or loss, net 41 (56) 114 126
Gains (losses) from hedge accounting, net 41 (209) (76) 93
Exchange differences, net 41 1,030 472 1,165
Other operating income 42 1,439 1,272 1,315
Other operating expense 42 (2,223) (2,128) (2,285)
Income from insurance and reinsurance contracts 43 3,342 3,652 3,678
Expense from insurance and reinsurance contracts 43 (2,272) (2,545) (2,599)
GROSS INCOME 6 25,270 24,653 23,362
Administration costs 44 (11,112) (11,366) (10,836)
Personnel expenses 44.1 (6,571) (6,722) (6,273)
Other administrative expenses 44.2 (4,541) (4,644) (4,563)
Depreciation and amortization 45 (1,387) (1,426) (1,272)
Provisions or reversal of provisions 46 (745) (1,186) (731)
Impairment or reversal of impairment on financial assets not measured at fair value through profit or loss 47 (4,803) (3,801) (4,272)
Financial assets measured at cost - - -
Available- for-sale financial assets (1,127) (202) (23)
Loans and receivables (3,677) (3,597) (4,248)
Held to maturity investments 1 (1) -
NET OPERATING INCOME 7,222 6,874 6,251
Impairment or reversal of impairment of investments in subsidiaries, joint ventures and associates - - -
Impairment or reversal of impairment on non-financial assets 48 (364) (521) (273)
Tangible assets (42) (143) (60)
Intangible assets (16) (3) (4)
Other assets (306) (375) (209)
Gains (losses) on derecognition of non financial assets and subsidiaries, net 49 47 70 (2,135)
Negative goodwill recognized in profit or loss 18 - - 26
Profit (loss) from non-current assets and disposal groups classified as held for sale not qualifying as discontinued operations
50 26 (31) 734
OPERATING PROFIT BEFORE TAX 6 6,931 6,392 4,603
Tax expense or income related to profit or loss from continuing operations 19 (2,169) (1,699) (1,274)
PROFIT FROM CONTINUING OPERATIONS 4,762 4,693 3,328
Profit from discontinued operations, net - - -
PROFIT 4,762 4,693 3,328
Attributable to minority interest [non-controlling interest] 31 1,243 1,218 686
Attributable to owners of the parent 6 3,519 3,475 2,642
Notes 2017 2016 (*) 2015 (*)
EARNINGS PER SHARE (Euros) 5 0.48 0.49 0.37
Basic earnings per share from continued operations 0.48 0.49 0.37
Diluted earnings per share from continued operations 0.48 0.49 0.37
Basic earnings per share from discontinued operations - - -
Diluted earnings per share from discontinued operations - - -
(*) Presented for comparison purposes only (Note 1.3).
The accompanying Notes 1 to 57 and Appendix I to XIII are an integral part of the consolidated financial
statements as of December 31, 2017.
P. 8Translation of the Consolidated Financial Statements originally issued in Spanish and prepared in accordance with EU-IFRSs, as adopted by the European Union (See Note 1 and 56). In the event of a discrepancy, the Spanish language version prevails.
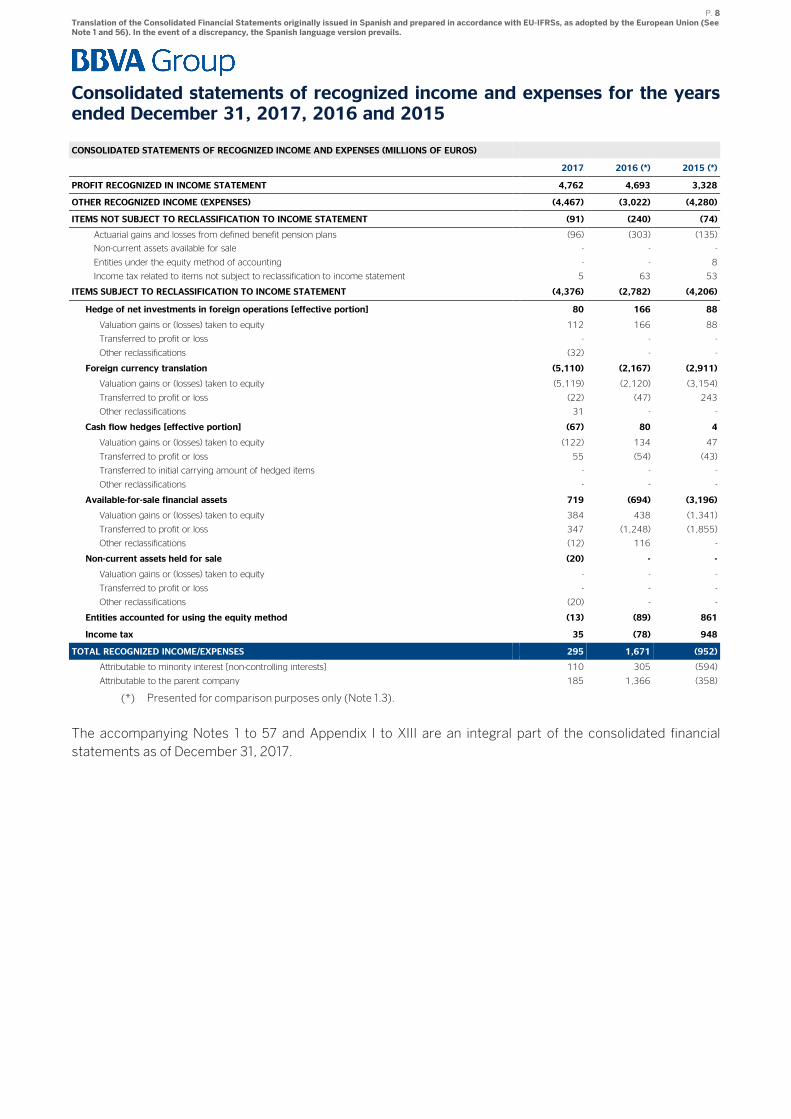
Consolidated statements of recognized income and expenses for the years ended December 31, 2017, 2016 and 2015
CONSOLIDATED STATEMENTS OF RECOGNIZED INCOME AND EXPENSES (MILLIONS OF EUROS)
2017 2016 (*) 2015 (*)
PROFIT RECOGNIZED IN INCOME STATEMENT 4,762 4,693 3,328
OTHER RECOGNIZED INCOME (EXPENSES) (4,467) (3,022) (4,280)
ITEMS NOT SUBJECT TO RECLASSIFICATION TO INCOME STATEMENT (91) (240) (74)
Actuarial gains and losses from defined benefit pension plans (96) (303) (135)
Non-current assets available for sale - - -
Entities under the equity method of accounting - - 8
Income tax related to items not subject to reclassification to income statement 5 63 53
ITEMS SUBJECT TO RECLASSIFICATION TO INCOME STATEMENT (4,376) (2,782) (4,206)
Hedge of net investments in foreign operations [effective portion] 80 166 88
Valuation gains or (losses) taken to equity 112 166 88
Transferred to profit or loss - - -
Other reclassifications (32) - -
Foreign currency translation (5,110) (2,167) (2,911)
Valuation gains or (losses) taken to equity (5,119) (2,120) (3,154)
Transferred to profit or loss (22) (47) 243
Other reclassifications 31 - -
Cash flow hedges [effective portion] (67) 80 4
Valuation gains or (losses) taken to equity (122) 134 47
Transferred to profit or loss 55 (54) (43)
Transferred to initial carrying amount of hedged items - - -
Other reclassifications - - -
Available-for-sale financial assets 719 (694) (3,196)
Valuation gains or (losses) taken to equity 384 438 (1,341)
Transferred to profit or loss 347 (1,248) (1,855)
Other reclassifications (12) 116 -
Non-current assets held for sale (20) - -
Valuation gains or (losses) taken to equity - - -
Transferred to profit or loss - - -
Other reclassifications (20) - -
Entities accounted for using the equity method (13) (89) 861
Income tax 35 (78) 948
TOTAL RECOGNIZED INCOME/EXPENSES 295 1,671 (952)
Attributable to minority interest [non-controlling interests] 110 305 (594)
Attributable to the parent company 185 1,366 (358)
(*) Presented for comparison purposes only (Note 1.3).
The accompanying Notes 1 to 57 and Appendix I to XIII are an integral part of the consolidated financial
statements as of December 31, 2017.
P. 9Translation of the Consolidated Financial Statements originally issued in Spanish and prepared in accordance with EU-IFRSs, as adopted by the European Union (See Note 1 and 56). In the event of a discrepancy, the Spanish language version prevails.
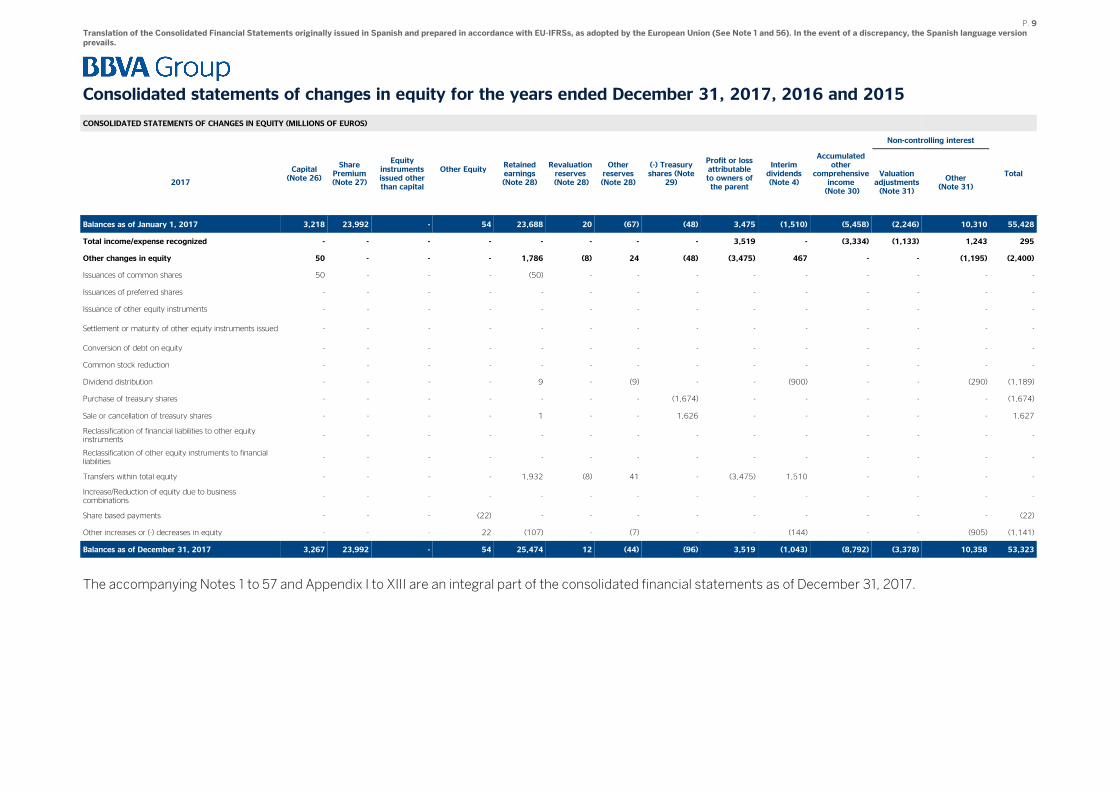
Consolidated statements of changes in equity for the years ended December 31, 2017, 2016 and 2015
CONSOLIDATED STATEMENTS OF CHANGES IN EQUITY (MILLIONS OF EUROS)
Capital (Note 26)
Share Premium (Note 27)
Equity instruments issued other than capital
Other Equity Retained earnings (Note 28)
Revaluation reserves (Note 28)
Other reserves (Note 28)
(-) Treasury shares (Note
29)
Profit or loss attributable to owners of the parent
Interim dividends (Note 4)
Accumulated other
comprehensive income (Note 30)
Non-controlling interest
Total 2017
Valuation adjustments (Note 31)
Other (Note 31)
Balances as of January 1, 2017 3,218 23,992 - 54 23,688 20 (67) (48) 3,475 (1,510) (5,458) (2,246) 10,310 55,428
Total income/expense recognized - - - - - - - - 3,519 - (3,334) (1,133) 1,243 295
Other changes in equity 50 - - - 1,786 (8) 24 (48) (3,475) 467 - - (1,195) (2,400)
Issuances of common shares 50 - - - (50) - - - - - - - - -
Issuances of preferred shares - - - - - - - - - - - - - -
Issuance of other equity instruments - - - - - - - - - - - - - -
Settlement or maturity of other equity instruments issued - - - - - - - - - - - - - -
Conversion of debt on equity - - - - - - - - - - - - - -
Common stock reduction - - - - - - - - - - - - - -
Dividend distribution - - - - 9 - (9) - - (900) - - (290) (1,189)
Purchase of treasury shares - - - - - - - (1,674) - - - - - (1,674)
Sale or cancellation of treasury shares - - - - 1 - - 1,626 - - - - - 1,627
Reclassification of financial liabilities to other equity instruments
- - - - - - - - - - - - - -
Reclassification of other equity instruments to financial liabilities
- - - - - - - - - - - - - -
Transfers within total equity - - - - 1,932 (8) 41 - (3,475) 1,510 - - - -
Increase/Reduction of equity due to business combinations
- - - - - - - - - - - - - -
Share based payments - - - (22) - - - - - - - - - (22)
Other increases or (-) decreases in equity - - - 22 (107) - (7) - - (144) - - (905) (1,141)
Balances as of December 31, 2017 3,267 23,992 - 54 25,474 12 (44) (96) 3,519 (1,043) (8,792) (3,378) 10,358 53,323
The accompanying Notes 1 to 57 and Appendix I to XIII are an integral part of the consolidated financial statements as of December 31, 2017.
P. 10Translation of the Consolidated Financial Statements originally issued in Spanish and prepared in accordance with EU-IFRSs, as adopted by the European Union (See Note 1 and 56). In the event of a discrepancy, the Spanish language version prevails.
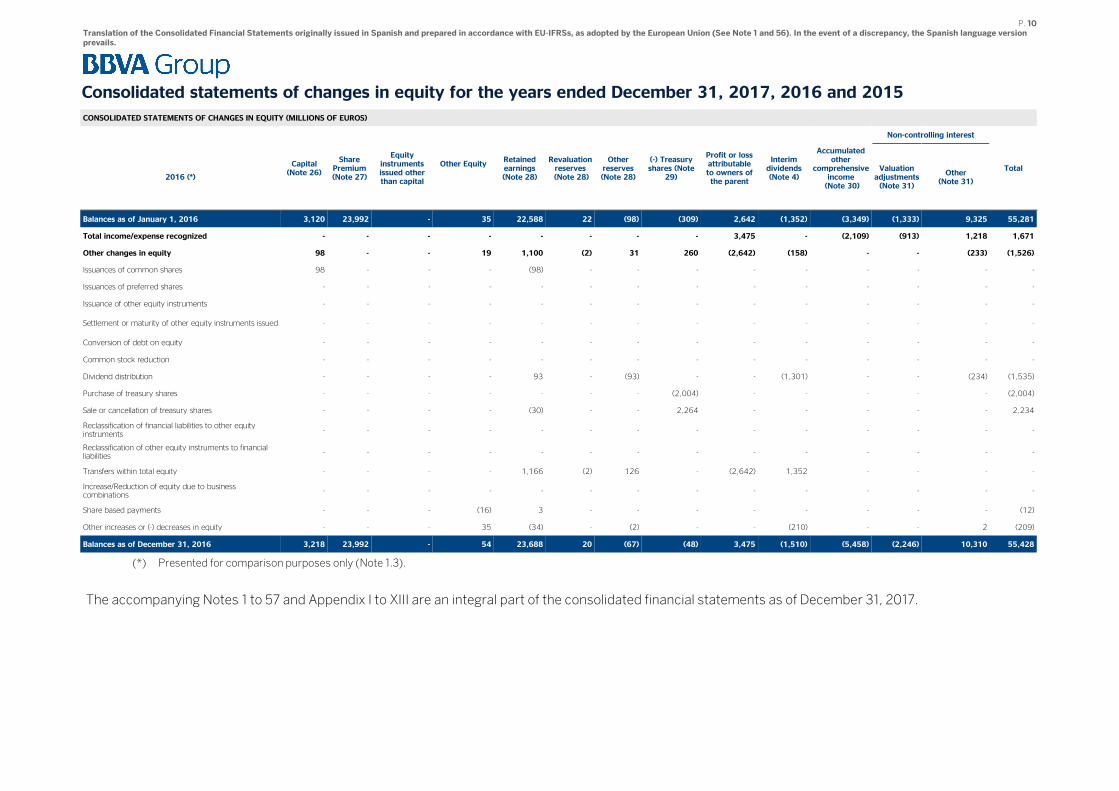
Consolidated statements of changes in equity for the years ended December 31, 2017, 2016 and 2015
CONSOLIDATED STATEMENTS OF CHANGES IN EQUITY (MILLIONS OF EUROS)
Capital (Note 26)
Share Premium (Note 27)
Equity instruments issued other than capital
Other Equity Retained earnings (Note 28)
Revaluation reserves (Note 28)
Other reserves (Note 28)
(-) Treasury shares (Note
29)
Profit or loss attributable to owners of the parent
Interim dividends (Note 4)
Accumulated other
comprehensive income (Note 30)
Non-controlling interest
Total 2016 (*)
Valuation adjustments (Note 31)
Other (Note 31)
Balances as of January 1, 2016 3,120 23,992 - 35 22,588 22 (98) (309) 2,642 (1,352) (3,349) (1,333) 9,325 55,281
Total income/expense recognized - - - - - - - - 3,475 - (2,109) (913) 1,218 1,671
Other changes in equity 98 - - 19 1,100 (2) 31 260 (2,642) (158) - - (233) (1,526)
Issuances of common shares 98 - - - (98) - - - - - - - - -
Issuances of preferred shares - - - - - - - - - - - - - -
Issuance of other equity instruments - - - - - - - - - - - - - -
Settlement or maturity of other equity instruments issued - - - - - - - - - - - - - -
Conversion of debt on equity - - - - - - - - - - - - - -
Common stock reduction - - - - - - - - - - - - - -
Dividend distribution - - - - 93 - (93) - - (1,301) - - (234) (1,535)
Purchase of treasury shares - - - - - - - (2,004) - - - - - (2,004)
Sale or cancellation of treasury shares - - - - (30) - - 2,264 - - - - - 2,234
Reclassification of financial liabilities to other equity instruments
- - - - - - - - - - - - - -
Reclassification of other equity instruments to financial liabilities
- - - - - - - - - - - - - -
Transfers within total equity - - - - 1,166 (2) 126 - (2,642) 1,352 - - - -
Increase/Reduction of equity due to business combinations
- - - - - - - - - - - - - -
Share based payments - - - (16) 3 - - - - - - - - (12)
Other increases or (-) decreases in equity - - - 35 (34) - (2) - - (210) - - 2 (209)
Balances as of December 31, 2016 3,218 23,992 - 54 23,688 20 (67) (48) 3,475 (1,510) (5,458) (2,246) 10,310 55,428
(*) Presented for comparison purposes only (Note 1.3).
The accompanying Notes 1 to 57 and Appendix I to XIII are an integral part of the consolidated financial statements as of December 31, 2017.
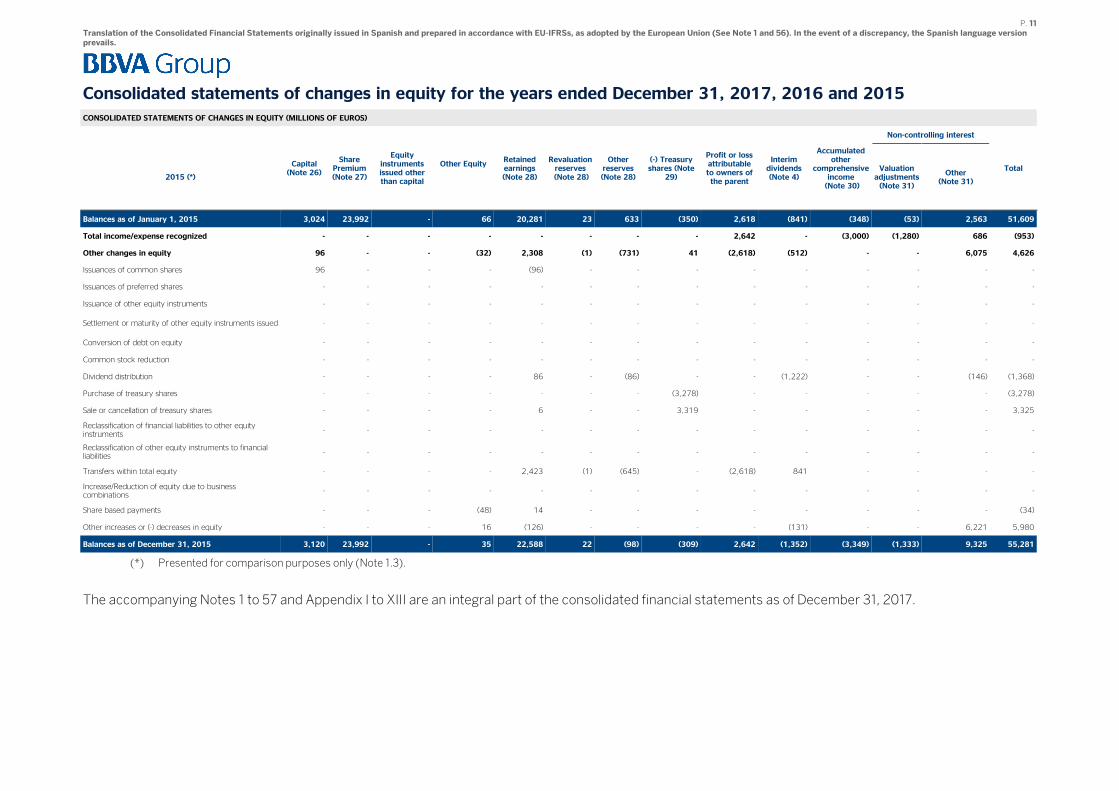
P. 11Translation of the Consolidated Financial Statements originally issued in Spanish and prepared in accordance with EU-IFRSs, as adopted by the European Union (See Note 1 and 56). In the event of a discrepancy, the Spanish language version prevails.
Consolidated statements of changes in equity for the years ended December 31, 2017, 2016 and 2015
CONSOLIDATED STATEMENTS OF CHANGES IN EQUITY (MILLIONS OF EUROS)
Capital (Note 26)
Share Premium (Note 27)
Equity instruments issued other than capital
Other Equity Retained earnings (Note 28)
Revaluation reserves (Note 28)
Other reserves (Note 28)
(-) Treasury shares (Note
29)
Profit or loss attributable to owners of the parent
Interim dividends (Note 4)
Accumulated other
comprehensive income (Note 30)
Non-controlling interest
Total 2015 (*)
Valuation adjustments (Note 31)
Other (Note 31)
Balances as of January 1, 2015 3,024 23,992 - 66 20,281 23 633 (350) 2,618 (841) (348) (53) 2,563 51,609
Total income/expense recognized - - - - - - - - 2,642 - (3,000) (1,280) 686 (953)
Other changes in equity 96 - - (32) 2,308 (1) (731) 41 (2,618) (512) - - 6,075 4,626
Issuances of common shares 96 - - - (96) - - - - - - - - -
Issuances of preferred shares - - - - - - - - - - - - - -
Issuance of other equity instruments - - - - - - - - - - - - - -
Settlement or maturity of other equity instruments issued - - - - - - - - - - - - - -
Conversion of debt on equity - - - - - - - - - - - - - -
Common stock reduction - - - - - - - - - - - - - -
Dividend distribution - - - - 86 - (86) - - (1,222) - - (146) (1,368)
Purchase of treasury shares - - - - - - - (3,278) - - - - - (3,278)
Sale or cancellation of treasury shares - - - - 6 - - 3,319 - - - - - 3,325
Reclassification of financial liabilities to other equity instruments
- - - - - - - - - - - - - -
Reclassification of other equity instruments to financial liabilities
- - - - - - - - - - - - - -
Transfers within total equity - - - - 2,423 (1) (645) - (2,618) 841 - - - -
Increase/Reduction of equity due to business combinations
- - - - - - - - - - - - - -
Share based payments - - - (48) 14 - - - - - - - - (34)
Other increases or (-) decreases in equity - - - 16 (126) - - - - (131) - - 6,221 5,980
Balances as of December 31, 2015 3,120 23,992 - 35 22,588 22 (98) (309) 2,642 (1,352) (3,349) (1,333) 9,325 55,281
(*) Presented for comparison purposes only (Note 1.3).
The accompanying Notes 1 to 57 and Appendix I to XIII are an integral part of the consolidated financial statements as of December 31, 2017.
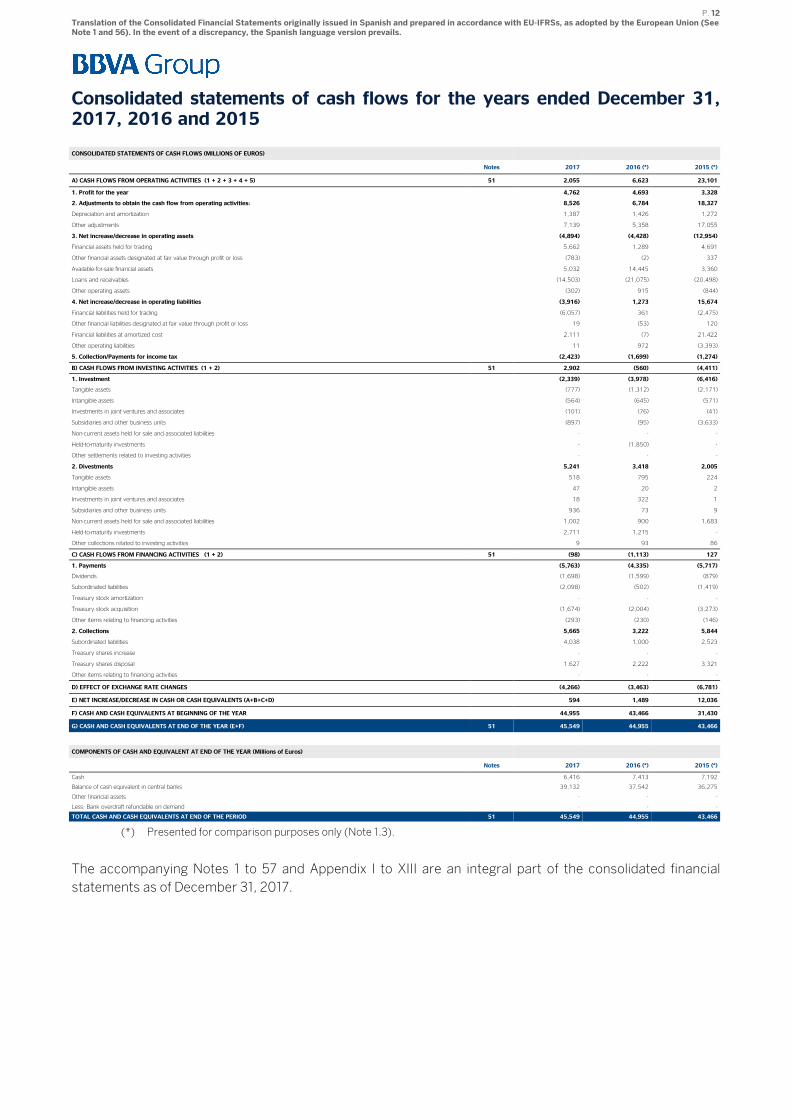
P. 12Translation of the Consolidated Financial Statements originally issued in Spanish and prepared in accordance with EU-IFRSs, as adopted by the European Union (See Note 1 and 56). In the event of a discrepancy, the Spanish language version prevails.
Consolidated statements of cash flows for the years ended December 31, 2017, 2016 and 2015
CONSOLIDATED STATEMENTS OF CASH FLOWS (MILLIONS OF EUROS)
Notes 2017 2016 (*) 2015 (*)
A) CASH FLOWS FROM OPERATING ACTIVITIES (1 + 2 + 3 + 4 + 5) 51 2,055 6,623 23,101
1. Profit for the year 4,762 4,693 3,328
2. Adjustments to obtain the cash flow from operating activities: 8,526 6,784 18,327
Depreciation and amortization 1,387 1,426 1,272
Other adjustments 7,139 5,358 17,055
3. Net increase/decrease in operating assets (4,894) (4,428) (12,954)
Financial assets held for trading 5,662 1,289 4,691
Other financial assets designated at fair value through profit or loss (783) (2) 337
Available-for-sale financial assets 5,032 14,445 3,360
Loans and receivables (14,503) (21,075) (20,498)
Other operating assets (302) 915 (844)
4. Net increase/decrease in operating liabilities (3,916) 1,273 15,674
Financial liabilities held for trading (6,057) 361 (2,475)
Other financial liabilities designated at fair value through profit or loss 19 (53) 120
Financial liabilities at amortized cost 2,111 (7) 21,422
Other operating liabilities 11 972 (3,393)
5. Collection/Payments for income tax (2,423) (1,699) (1,274)
B) CASH FLOWS FROM INVESTING ACTIVITIES (1 + 2) 51 2,902 (560) (4,411)
1. Investment (2,339) (3,978) (6,416)
Tangible assets (777) (1,312) (2,171)
Intangible assets (564) (645) (571)
Investments in joint ventures and associates (101) (76) (41)
Subsidiaries and other business units (897) (95) (3,633)
Non-current assets held for sale and associated liabilities - - -
Held-to-maturity investments - (1,850) -
Other settlements related to investing activities - - -
2. Divestments 5,241 3,418 2,005
Tangible assets 518 795 224
Intangible assets 47 20 2
Investments in joint ventures and associates 18 322 1
Subsidiaries and other business units 936 73 9
Non-current assets held for sale and associated liabilities 1,002 900 1,683
Held-to-maturity investments 2,711 1,215 -
Other collections related to investing activities 9 93 86
C) CASH FLOWS FROM FINANCING ACTIVITIES (1 + 2) 51 (98) (1,113) 127
1. Payments (5,763) (4,335) (5,717)
Dividends (1,698) (1,599) (879)
Subordinated liabilities (2,098) (502) (1,419)
Treasury stock amortization - - -
Treasury stock acquisition (1,674) (2,004) (3,273)
Other items relating to financing activities (293) (230) (146)
2. Collections 5,665 3,222 5,844
Subordinated liabilities 4,038 1,000 2,523
Treasury shares increase - - -
Treasury shares disposal 1,627 2,222 3,321
Other items relating to financing activities - - -
D) EFFECT OF EXCHANGE RATE CHANGES (4,266) (3,463) (6,781)
E) NET INCREASE/DECREASE IN CASH OR CASH EQUIVALENTS (A+B+C+D) 594 1,489 12,036
F) CASH AND CASH EQUIVALENTS AT BEGINNING OF THE YEAR 44,955 43,466 31,430
G) CASH AND CASH EQUIVALENTS AT END OF THE YEAR (E+F) 51 45,549 44,955 43,466
COMPONENTS OF CASH AND EQUIVALENT AT END OF THE YEAR (Millions of Euros)
Notes 2017 2016 (*) 2015 (*)
Cash 6,416 7,413 7,192
Balance of cash equivalent in central banks 39,132 37,542 36,275
Other financial assets - - -
Less: Bank overdraft refundable on demand - - -
TOTAL CASH AND CASH EQUIVALENTS AT END OF THE PERIOD 51 45,549 44,955 43,466
(*) Presented for comparison purposes only (Note 1.3).
The accompanying Notes 1 to 57 and Appendix I to XIII are an integral part of the consolidated financial
statements as of December 31, 2017.
P. 13 Translation of the Consolidated Financial Statements originally issued in Spanish and prepared in accordance with EU-IFRSs, as adopted by the European Union (See Note 1 and 56). In the event of a discrepancy, the Spanish language version prevails.
Notes to the Consolidated Financial Statements
1. Introduction, basis for the presentation of the Consolidated Financial Statements, internal control of financial information and other information
1.1 Introduction
Banco Bilbao Vizcaya Argentaria, S.A. (hereinafter “the Bank” or “BBVA") is a private-law entity subject to
the laws and regulations governing banking entities operating in Spain. It carries out its activity through
branches and agencies across the country and abroad.
The Bylaws and other public information are available for inspection at the Bank’s registered address (Plaza
San Nicolás, 4 Bilbao) as noted on its web site (www.bbva.com).
In addition to the activities it carries out directly, the Bank heads a group of subsidiaries, joint ventures and
associates which perform a wide range of activities and which together with the Bank constitute the Banco
Bilbao Vizcaya Argentaria Group (hereinafter, “the Group” or “the BBVA Group”). In addition to its own
separate financial statements, the Bank is required to prepare Consolidated Financial Statements
comprising all consolidated subsidiaries of the Group.
As of December 31, 2017, the BBVA Group had 331 consolidated entities and 76 entities accounted for using
the equity method (see Notes 3 and 16 and Appendix I to V).
The Consolidated Financial Statements of the BBVA Group for the year ended December 31, 2016 were
approved by the shareholders at the Annual General Meetings (“AGM”) on March 17, 2017.
BBVA Group’s consolidated financial statements and the financial statements for the Bank and the majority
of the remaining entities within the Group have been prepared as of December 31, 2017, and are pending
approval by their respective AGMs. Notwithstanding, the Board of Directors of the Bank understands that
said financial statements will be approved without changes.
1.2 Basis for the presentation of the Consolidated Financial Statements
The BBVA Group’s Consolidated Financial Statements are presented in accordance with the International
Financial Reporting Standards endorsed by the European Union (hereinafter, “EU-IFRS”) applicable as of
December 31, 2017, considering the Bank of Spain Circular 4/2004, of December, 22 (and as amended
thereafter), and with any other legislation governing financial reporting applicable to the Group in Spain.
The BBVA Group’s accompanying Consolidated Financial Statements for the year ended December 31, 2017
were prepared by the Group’s Directors (through the Board of Directors held on February 12, 2018) by
applying the principles of consolidation, accounting policies and valuation criteria described in Note 2, so that
they present fairly the Group’s total consolidated equity and financial position as of December 31, 2017,
together with the consolidated results of its operations and cash flows generated during the year ended
December 31, 2017.
These Consolidated Financial Statements were prepared on the basis of the accounting records kept by the
Bank and each of the other entities in the Group. Moreover, they include the adjustments and
P. 14 Translation of the Consolidated Financial Statements originally issued in Spanish and prepared in accordance with EU-IFRSs, as adopted by the European Union (See Note 1 and 56). In the event of a discrepancy, the Spanish language version prevails.
reclassifications required to harmonize the accounting policies and valuation criteria used by the Group (see
Note 2.2).
All effective accounting standards and valuation criteria with a significant effect in the Consolidated Financial
Statements were applied in their preparation.
The amounts reflected in the accompanying Consolidated Financial Statements are presented in millions of
euros, unless it is more appropriate to use smaller units. Some items that appear without a balance in these
Consolidated Financial Statements are due to how the units are expressed. Also, in presenting amounts in
millions of euros, the accounting balances have been rounded up or down. It is therefore possible that the
totals appearing in some tables are not the exact arithmetical sum of their component figures.
The percentage changes in amounts have been calculated using figures expressed in thousands of euros.
1.3 Comparative information
The information included in the accompanying Consolidated Financial Statements and the explanatory notes
referring to December 31, 2016 and December 31, 2015 are presented exclusively for the purpose of
comparison with the information for December 31, 2017.
During 2017, there were no significant changes to the existing structure of the BBVA Group’s operating
segments in comparison to 2016 (Note 6). Certain prior year balances have been reclassified to conform to
current period presentation.
1.4 Seasonal nature of income and expenses
The nature of the most significant activities carried out by the BBVA Group’s entities is mainly related to
typical activities carried out by financial institutions, which are not significantly affected by seasonal factors
within the same year.
1.5 Responsibility for the information and for the estimates made
The information contained in the BBVA Group’s Consolidated Financial Statements is the responsibility of
the Group’s Directors.
Estimates have to be made at times when preparing these Consolidated Financial Statements in order to
calculate the recorded or disclosed amount of some assets, liabilities, income, expenses and commitments.
These estimates relate mainly to the following:
Impairment on certain financial assets (see Notes 7, 12, 13, 14 and 16).
The assumptions used to quantify certain provisions (see Note 24) and for the actuarial calculation
of post-employment benefit liabilities and commitments (see Note 25).
The useful life and impairment losses of tangible and intangible assets (see Notes 17, 18, 20 and 21).
The valuation of goodwill and price allocation of business combinations (see Note 18).
The fair value of certain unlisted financial assets and liabilities (see Notes 7, 8, 10, 11 and 12).
The recoverability of deferred tax assets (See Note 19).
The exchange rate and the inflation rate of Venezuela (see Notes 2.2.16 and 2.2.20).
Although these estimates were made on the basis of the best information available as of December 31, 2017,
future events may make it necessary to modify them (either up or down) over the coming years. This would
be done prospectively in accordance with applicable standards, recognizing the effects of changes in the
estimates in the corresponding consolidated income statement.
P. 15 Translation of the Consolidated Financial Statements originally issued in Spanish and prepared in accordance with EU-IFRSs, as adopted by the European Union (See Note 1 and 56). In the event of a discrepancy, the Spanish language version prevails.
1.6 BBVA Group’s Internal Control over Financial Reporting
BBVA Group’s Financial Statements is prepared under an Internal Control over Financial Reporting Model
(hereinafter “ICFR"). It provides reasonable assurance with respect to the reliability and the integrity of the
consolidated financial statements. It is also aimed to ensure that the transactions are processed in
accordance with the applicable laws and regulations.
The ICFR is in accordance with the control framework established by the “Committee of Sponsoring
Organizations of the Treadway Commission” (hereinafter, "COSO"). The COSO framework sets five
components that constitute the basis of the effectiveness and efficiency of the internal control systems:
The establishment of an appropriate control framework.
The assessment of the risks that could arise during the preparation of the financial information.
The design of the necessary controls to mitigate the identified risks.
The establishment of an appropriate system of information to detect and report system weaknesses.
The monitoring of the controls to ensure they perform correctly and are effective over time.
The ICFR is a dynamic model that evolves continuously over time to reflect the reality of the BBVA Group’s
businesses and processes, as well as the risks and controls designed to mitigate them. It is subject to a
continuous evaluation by the internal control units located in the different entities of BBVA Group.
These internal control units are integrated within the BBVA internal control model which is based in two
pillars:
A control system organized into three lines of defense:
• The first line is located within the business and support units, which are responsible for
identifying risks associated with their processes and to execute the controls established to
mitigate them.
• The second line comprises the specialized control units (Compliance, Internal Financial Control,
Internal Risk Control, Engineering Risk, Fraud & Security, and Operations Control among
others). This second line defines the models and controls under their areas of responsibility and
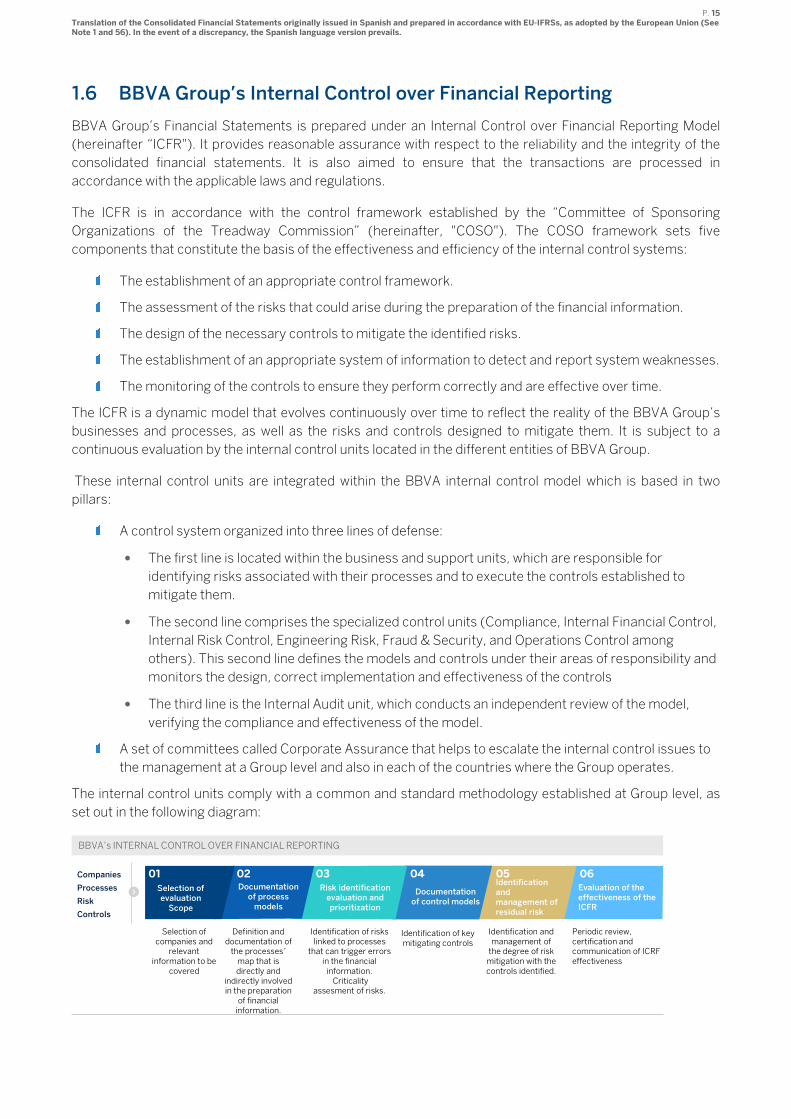
monitors the design, correct implementation and effectiveness of the controls
• The third line is the Internal Audit unit, which conducts an independent review of the model,
verifying the compliance and effectiveness of the model.
A set of committees called Corporate Assurance that helps to escalate the internal control issues to
the management at a Group level and also in each of the countries where the Group operates.
The internal control units comply with a common and standard methodology established at Group level, as
set out in the following diagram:
BBVA’s INTERNAL CONTROL OVER FINANCIAL REPORTING
Selection of evaluationScope
01
Risk identificationevaluation and prioritization
0302 04 05 06Evaluation of theeffectiveness of theICFR
Documentationof processmodels
Documentationof control models
Identificationand management of residual risk
Selection of
companies and relevant
information to be
covered
Definition and
documentation of the processes´
map that is
directly and
indirectly involvedin the preparation
of financial
information.
Identification of risks
linked to processesthat can trigger errors
in the financial
information.
Criticalityassesment of risks.
Identification of key
mitigating controls
Identification and
management of the degree of risk
mitigation with the
controls identified.
Periodic review,
certification and communication of ICRF
effectiveness
Companies
Processes
Risk
Controls
P. 16 Translation of the Consolidated Financial Statements originally issued in Spanish and prepared in accordance with EU-IFRSs, as adopted by the European Union (See Note 1 and 56). In the event of a discrepancy, the Spanish language version prevails.
The ICFR Model is subject to annual evaluations by the Group’s Internal Audit Unit. It is also supervised by
the Audit and Compliance Committee of the Bank’s Board of Directors.
The BBVA Group also complies with the requirements of the Sarbanes-Oxley Act (hereafter “SOX”) for
consolidated financial statements as a listed company with the U.S. Securities and Exchange Commission
(“SEC”). The main senior executives of the Group are involved in the design, compliance and implementation
of the internal control model to make it effective and to ensure the quality and accuracy of the financial
information.
The description of the ICFR for financial information in the Corporate Governance Annual Report, which is
included within the Management Report attached to the consolidated financial statements for the year ended
December 31, 2017.
2. Principles of consolidation, accounting policies and measurement bases applied and recent IFRS pronouncements
The Glossary includes the definition of some of the financial and economic terms used in Note 2 and
subsequent Notes.
2.1 Principles of consolidation
In terms of its consolidation, in accordance with the criteria established by IFRS, the BBVA Group is made up
of four types of entities: subsidiaries, joint ventures, associates and structured entities, defined as follows:
Subsidiaries
Subsidiaries are entities controlled by the Group (for definition of the criterion for control, see Glossary).The financial statements of the subsidiaries are fully consolidated with those of the Bank. The share of non-controlling interests from subsidiaries in the Group’s consolidated total equity is presented under the heading “Non-controlling interests” in the consolidated balance sheet. Their share in the profit or loss for the period or year is presented under the heading “Attributable to minority interest” in the accompanying consolidated income statement (see Note 31).
Note 3 includes information related to the main subsidiaries in the Group as of December 31, 2017. Appendix I includes other significant information on these entities.
Joint ventures
Joint ventures are those entities over which there is a joint arrangement to joint control with third parties other than the Group (for definitions of joint arrangement, joint control and joint venture, refer to Glossary).
The investments in joint ventures are accounted for using the equity method (see Note 16). Appendix II shows the main figures for joint ventures accounted for using the equity method.
Associates
Associates are entities in which the Group is able to exercise significant influence (for definition of significant influence, see Glossary). Significant influence is deemed to exist when the Group owns 20% or more of the voting rights of an investee directly or indirectly, unless it can be clearly demonstrated that this is not the case.
However, certain entities in which the Group owns 20% or more of the voting rights are not included as Group associates, since the Group does not have the ability to exercise significant influence over these entities. Investments in these entities, which do not represent material amounts for the Group, are classified as “Available-for-sale financial assets”.
P. 17 Translation of the Consolidated Financial Statements originally issued in Spanish and prepared in accordance with EU-IFRSs, as adopted by the European Union (See Note 1 and 56). In the event of a discrepancy, the Spanish language version prevails.
In contrast, some investments in entities in which the Group holds less than 20% of the voting rights are accounted for as Group associates, as the Group is considered to have the ability to exercise significant influence over these entities. As of December 31, 2017, these entities are not significant in the Group.
Appendix II shows the most significant information related to the associates (see Note 16), which are accounted for using the equity method.
Structured Entities
A structured entity is an entity that has been designed so that voting or similar rights are not the dominant factor in deciding who controls the entity, such as when the voting rights relate to administrative matters only and the relevant activities are directed by means of contractual arrangements (see Glossary).
In those cases where the Group sets up entities or has a holding in such entities, in order to allow its customers access to certain investments, to transfer risks or for other purposes, in accordance with internal criteria and procedures and with applicable regulations, the Group determines whether control over the entity in question actually exists and therefore whether it should be subject to consolidation.
Such methods and procedures determine whether there is control by the Group, considering how the decisions are made about the relevant activities, assesses whether the Group has all power over the relevant elements, exposure, or rights, to variable returns from involvement with the investee and the ability to use power over the investee to affect the amount of the investor’s returns.
Structured entities subject to consolidation
To determine if a structured entity is controlled by the Group, and therefore should be consolidated into the Group, the existing contractual rights (different from the voting rights) are analyzed. For this reason, an analysis of the structure and purpose of each investee is performed and, among others, the following factors will be considered:
- Evidence of the current ability to manage the relevant activities of the investee according to the specific business needs (including any decisions that may arise only in particular circumstances).
- Potential existence of a special relationship with the investee.
- Implicit or explicit Group commitments to support the investee.
- The ability to use the Group´s power over the investee to affect the amount of the Group’s returns.
There are cases where the Group has a high exposure to variable returns and retains decision-making power over the investee, either directly or through an agent.
The main structured entities of the Group are the asset securitization funds, to which the BBVA Group transfers loans and receivables portfolios, and other vehicles, which allow the Group’s customers to gain access to certain investments or to allow for the transfer of risks or for other purposes (see Appendices I and V). The BBVA Group maintains the decision-making power over the relevant activities of these vehicles and financial support through securitized market standard contracts. The most common ones are: investment positions in equity note tranches, funding through subordinated debt, credit enhancements through derivative instruments or liquidity lines, management rights of defaulted securitized assets, “clean-up” call derivatives, and asset repurchase clauses by the grantor.
For these reasons, the loans and receivable portfolios related to the vast majority of the securitizations carried out by the Bank or Group subsidiaries are not derecognized in the books of said entity and the issuances of the related debt securities are registered as liabilities within the Group’s consolidated balance sheet.
Non-consolidated structured entities
The Group owns other vehicles also for the purpose of allowing customers access to certain investments, to transfer risks, and for other purposes, but without the Group having control of the vehicles, which are not consolidated in accordance with “IFRS 10 - Consolidated Financial Statements”. The balance of assets and liabilities of these vehicles is not material in relation to the Group’s Consolidated Financial Statements.
P. 18 Translation of the Consolidated Financial Statements originally issued in Spanish and prepared in accordance with EU-IFRSs, as adopted by the European Union (See Note 1 and 56). In the event of a discrepancy, the Spanish language version prevails.
As of December 31, 2017, there was no material financial support from the Bank or its subsidiaries to unconsolidated structured entities.
The Group does not consolidate any of the mutual funds it manages since the necessary control conditions are not met (see definition of control in the Glossary). Particularly, the BBVA Group does not act as arranger but as agent since it operates the mutual funds on behalf and for the benefit of investors or parties (arranger or arrangers) and, for this reason it does not control the mutual funds when exercising its authority for decision making.
The mutual funds managed by the Group are not considered structured entities (generally, retail funds without corporate identity over which investors have participations which gives them ownership of said managed equity). These funds are not dependent on a capital structure that could prevent them from carry out activities without additional financial support, being in any case insufficient as far as the activities themselves are concerned. Additionally, the risk of the investment is absorbed by the fund participants, and the Group is only exposed when it becomes a participant, and as such, there is no other risk for the Group.
In all cases, the operating results of equity method investees acquired by the BBVA Group in a particular
period only include the period from the date of acquisition to the financial statements date. Similarly, the
results of entities disposed of during any only include year the period from the start of the year to the date of
disposal.
The consolidated financial statements of subsidiaries, associates and joint ventures used in the preparation
of the Consolidated Financial Statements of the Group have the same date of presentation as the
Consolidated Financial Statements. If financial statements at those same dates are not available, the most
recent will be used, as long as these are not older than three months, and adjusted to take into account the
most significant transactions. As of December 31, 2017, except for the case of the consolidated financial
statements of a subsidiary and five associates and joint-ventures deemed non-significant for which financial
statements as of November 30, 2017 were used, the December 31, 2017 financial statements for of all Group
entities were utilized.
BBVA banking subsidiaries, associates and joint venture worldwide, are subject to supervision and regulation
from a variety of regulatory bodies in relation to, among other aspects, the satisfaction of minimum capital
requirements. The obligation to satisfy such capital requirements may affect the ability of such entities to
transfer funds in the form of cash dividends, loans or advances. In addition, under the laws of the various
jurisdictions where such entities are incorporated, dividends may only be paid out through funds legally
available for such purpose. Even when the minimum capital requirements are met and funds are legally
available, the relevant regulators or other public administrations could discourage or delay the transfer of
funds to the Group in the form of cash, dividends, loans or advances for prudential reasons.
Separate financial statements
The separate financial statements of the parent company of the Group (Banco Bilbao Vizcaya Argentaria,
S.A.) are prepared under Spanish regulations (Circular 4/2004 of the Bank of Spain, and subsequent
amendments) and following other regulatory requirements of financial information applicable to the Bank.
The Bank uses the cost method to account in its separate financial statements for its investments in
subsidiaries, associates and joint venture entities, which are consistent with the requirements of Bank of
Spain Circular 4/2004 and IAS 27.
Appendix IX shows BBVA’s financial statements as of and for the years ended December 31, 2017 and 2016.
2.2 Accounting policies and valuation criteria applied
The accounting standards and policies and the valuation criteria applied in preparing these Consolidated
Financial Statements may differ from those used by some of the entities within the BBVA Group. For this
reason, necessary adjustments and reclassifications have been made in the consolidation process to
standardize these principles and criteria and comply with the EU-IFRS.
P. 19 Translation of the Consolidated Financial Statements originally issued in Spanish and prepared in accordance with EU-IFRSs, as adopted by the European Union (See Note 1 and 56). In the event of a discrepancy, the Spanish language version prevails.
The accounting standards and policies and valuation criteria used in preparing the accompanying
Consolidated Financial Statements are as follows:
2.2.1 Financial instruments
Measurement of financial instruments and recognition of changes in subsequent fair value
All financial instruments are initially accounted for at fair value plus, in the case of a financial asset or financial liability not at fair value through profit or loss, transaction costs that are directly attributable to the acquisition or issue of the financial asset or financial liability, unless there is evidence to the contrary, the best evidence of the fair value of a financial instrument at initial recognition shall be the transaction price. Excluding all trading derivatives not considered as economic hedges, all the changes in the fair value of the
financial instruments arising from the accrual of interest and similar items are recognized under the headings
“Interest income” or “Interest expenses”, as appropriate, in the accompanying consolidated income
statement in which period the change occurred (see Note 37). The dividends received from other entities,
other than associated entities and joint venture entities, are recognized under the heading “Dividend income”
in the accompanying consolidated income statement in the period in which the right to receive them arises
(see Note 38).
The changes in fair value after the initial recognition, for reasons other than those mentioned in the preceding
paragraph, are treated as described below, according to the categories of financial assets and liabilities.
“Financial assets and liabilities held for trading” and “Financial assets and liabilities designated at fair value through profit or loss”
The assets and liabilities recognized under these headings of the consolidated balance sheets are measured
upon acquisition at fair value and changes in the fair value (gains or losses) are recognized as their net value
under the heading “Gains (losses) on financial assets and liabilities, net” in the accompanying consolidated
income statements (see Note 41). Interests from derivatives designated as economic hedges on interest rate
are recognized in interest income or expense (Note 37), depending on the result of the hedging instrument.
However, changes in fair value resulting from variations in foreign exchange rates are recognized under the
heading “Exchange differences, net" in the accompanying consolidated income statements (Note 41).
“Available-for-sale financial assets”
Assets recognized under this heading in the consolidated balance sheets are measured at their fair value.
Subsequent changes in fair value (gains or losses) are recognized temporarily net of tax effect, under the
heading “Accumulated other comprehensive income- Items that may be reclassified to profit or loss -
Available-for-sale financial assets” in the consolidated balance sheets (see Note 30).
The amounts recognized under the headings “Accumulated other comprehensive income- Items that may
be reclassified to profit or loss - Available-for-sale financial assets” and “Accumulated other comprehensive
income- Items that may be reclassified to profit or loss - Exchange differences” continue to form part of the
Group's consolidated equity until the corresponding asset is derecognized from the consolidated balance
sheet or until an impairment loss is recognized on the corresponding financial instrument. If these assets are
sold, these amounts are derecognized and included under the headings “Gains (losses) on financial assets
and liabilities, net” or “Exchange differences, net", as appropriate, in the consolidated income statement for
the year in which they are derecognized (see Note 41).
The net impairment losses in “Available-for-sale financial assets” over the year are recognized under the
heading “Impairment losses on financial assets, net – Other financial instruments not at fair value through
profit or loss” (see Note 47) in the consolidated income statements for that period.
P. 20 Translation of the Consolidated Financial Statements originally issued in Spanish and prepared in accordance with EU-IFRSs, as adopted by the European Union (See Note 1 and 56). In the event of a discrepancy, the Spanish language version prevails.
Changes in the value of non-monetary items resulting from changes in foreign exchange rates are recognized
temporarily under the heading “Accumulated other comprehensive income- Items that may be reclassified to
profit or loss - Exchange differences” in the accompanying consolidated balance sheets. Changes in foreign
exchange rates resulting from monetary items are recognized under the heading “Exchange differences, net"
in the accompanying consolidated income statements (see Note 41).
“Loans and receivables”, “Held-to-maturity investments” and “Financial liabilities at amortized cost”
Assets and liabilities recognized under these headings in the accompanying consolidated balance sheets are
subsequently measured at “amortized cost” using the “effective interest rate” method. This is because the
consolidated entities generally intend to hold such financial instruments to maturity.
Net impairment losses of assets recognized under these headings arising in each period are recognized
under the heading “Impairment or reversal of impairment on financial assets not measured at fair value
through profit or loss – loans and receivables”, “Impairment or reversal of impairment on financial assets not
measured at fair value through profit or loss - held to maturity investments” or “Impairment or reversal of
impairment on financial assets not measured at fair value through profit or loss – financial assets measured
at cost” (see Note 47) in the consolidated income statement for that period.
“Derivatives-Hedge Accounting” and “Fair value changes of the hedged items in portfolio hedges of interest-rate risk”
Assets and liabilities recognized under these headings in the accompanying consolidated balance sheets are
measured at fair value.
Changes occurring subsequent to the designation of the hedging relationship in the measurement of
financial instruments designated as hedged items as well as financial instruments designated as hedge
accounting instruments are recognized as follows:
In fair value hedges, the changes in the fair value of the derivative and the hedged item attributable to
the hedged risk are recognized under the heading “Gains or losses from hedge accounting, net” in
the consolidated income statement, with a corresponding offset under the headings where hedging
items ("Hedging derivatives") and the hedged items are recognized, as applicable. Almost all of the
hedges used by the Group are for interest-rate risks. Therefore, the valuation changes are
recognized under the headings “Interest income” or “Interest expenses”, as appropriate, in the
accompanying consolidated income statement (see Note 37).
In fair value hedges of interest rate risk of a portfolio of financial instruments (portfolio-hedges), the
gains or losses that arise in the measurement of the hedging instrument are recognized in the
consolidated income statement, and the gains or losses that arise from the change in the fair value of
the hedged item (attributable to the hedged risk) are also recognized in the consolidated income
statement (in both cases under the heading “Gains or losses from hedge accounting, net”, using, as
a balancing item, the headings "Fair value changes of the hedged items in portfolio hedges of interest
rate risk" in the consolidated balance sheets, as applicable.
In cash flow hedges, the gain or loss on the hedging instruments relating to the effective portion are
recognized temporarily under the heading ”Accumulated other comprehensive income - Items that
may be reclassified to profit or loss - Hedging derivatives. Cash flow hedges” in the consolidated
balance sheets, with a balancing entry under the heading “Hedging derivatives” of the Assets or
Liabilities of the consolidated balance sheets as applicable. These differences are recognized in the
accompanying consolidated income statement at the time when the gain or loss in the hedged
instrument affects profit or loss, when the forecast transaction is executed or at the maturity date of
the hedged item (see Note 37).
P. 21 Translation of the Consolidated Financial Statements originally issued in Spanish and prepared in accordance with EU-IFRSs, as adopted by the European Union (See Note 1 and 56). In the event of a discrepancy, the Spanish language version prevails.
Differences in the measurement of the hedging items corresponding to the ineffective portions of
cash flow hedges are recognized directly in the heading “Gains or losses from hedge accounting, net”
in the consolidated income statement (see Note 41).
In the hedges of net investments in foreign operations, the differences attributable to the effective
portions of hedging items are recognized temporarily under the heading "Accumulated other
comprehensive income - Items that may be reclassified to profit or loss – Hedging of net investments
in foreign transactions" in the consolidated balance sheets with a balancing entry under the heading
“Hedging derivatives” of the Assets or Liabilities of the consolidated balance sheets as applicable.
These differences in valuation are recognized under the heading “Exchange differences, net" in the
consolidated income statement when the investment in a foreign operation is disposed of or
derecognized (see Note 41).
Other financial instruments
The following exceptions are applicable with respect to the above general criteria:
Equity instruments whose fair value cannot be determined in a sufficiently objective manner and
financial derivatives that have those instruments as their underlying asset and are settled by delivery
of those instruments are recorded in the consolidated balance sheet at acquisition cost; this may be
adjusted, where appropriate, for any impairment loss (see Note 8).
Accumulated other comprehensive income arising from financial instruments classified at the
consolidated balance sheet date as “Non-current assets and disposal groups classified as held for
sale” are recognized with the corresponding entry under the heading “Accumulated other
comprehensive income- Items that may be reclassified to profit or loss – Non-current assets and
disposal groups classified as held for sale” in the accompanying consolidated balance sheets (see
note 30).
Impairment losses on financial assets
Definition of impaired financial assets carried at amortized cost
A financial asset is considered impaired – and therefore its carrying amount is adjusted to reflect the effect of
impairment – when there is objective evidence that events have occurred, which:
In the case of debt instruments (loans and advances and debt securities), reduce the future cash
flows that were estimated at the time the instruments were acquired. So they are considered
impaired when there are reasonable doubts that the carrying amounts will be recovered in full and/or
the related interest will be collected for the amounts and on the dates initially agreed.
In the case of equity instruments, it means that their carrying amount may not be fully recovered.
As a general rule, the carrying amount of impaired financial assets is adjusted with a charge to the
consolidated income statement for the period in which the impairment becomes known. The recoveries of
previously recognized impairment losses are reflected, if appropriate, in the consolidated income statement
for the year in which the impairment is reversed or reduced, with an exception: any recovery of previously
recognized impairment losses for an investment in an equity instrument classified as financial assets
available for sale is not recognized in the consolidated income statement, but under the heading "
Accumulated other comprehensive income - Items that may be reclassified to profit or loss - Available-for-
sale financial assets" in the consolidated balance sheet (see Note 30).
In general, amounts collected on impaired loans and receivables are used to recognize the related accrued
interest and any excess amount is used to reduce the unpaid principal.
P. 22 Translation of the Consolidated Financial Statements originally issued in Spanish and prepared in accordance with EU-IFRSs, as adopted by the European Union (See Note 1 and 56). In the event of a discrepancy, the Spanish language version prevails.
When the recovery of any recognized amount is considered remote, such amount is written-off on the
consolidated balance sheet, without prejudice to any actions that may be taken in order to collect the amount
until the rights extinguish in full either because it is time-barred debt, the debt is forgiven, or other reasons.
Impairment on financial assets
The impairment on financial assets is determined by type of instrument and other circumstances that could
affect it, taking into account the guarantees received to assure (in part or in full) the performance of the
financial assets. The BBVA Group recognizes impairment charges directly against the impaired financial
asset when the likelihood of recovery is deemed remote, and uses an offsetting or allowance account when it
recognizes non-performing loan provisions for the estimated losses.
Impairment of debt instruments measured at amortized cost
With regard to impairment losses arising from insolvency risk of the obligors (credit risk), a debt instrument,
mainly Loans and receivables, is impaired due to insolvency when a deterioration in the ability to pay by the
obligor is evidenced, either due to past due status or for other reasons.
The BBVA Group has developed policies, methods and procedures to estimate incurred losses on
outstanding credit risk. These policies, methods and procedures are applied in the due diligence, approval
and execution of debt instruments and Commitments and guarantees given; as well as in identifying the
impairment and, where appropriate, in calculating the amounts necessary to cover estimated losses.
The amount of impairment losses on debt instruments measured at amortized cost is calculated based on
whether the impairment losses are determined individually or collectively. First it is determined whether
there is objective evidence of impairment individually for individually significant debt instrument, and
collectively for debt instrument that are not individually significant. If the Group determines that there is no
objective evidence of impairment, the assets are classified in groups of debt instrument based on similar risk
characteristics and impairment is assessed collectively.
In determining whether there is objective evidence of impairment the Group uses observable data in the
following aspects:
Significant financial difficulties of the obligors.
Ongoing delays in the payment of interest or principal.
Refinancing of credit due to financial difficulties by the counterparty.
Bankruptcy or reorganization / liquidation are considered likely.
Disappearance of the active market for a financial asset because of financial difficulties.
Observable data indicating a reduction in future cash flows from the initial recognition such as
adverse changes in the payment status of the counterparty (delays in payments, reaching credit
cards limits, etc.).
National or local economic conditions that are linked to "defaults" in the financial assets
(unemployment rate, falling property prices, etc.).
Impairment losses on financial assets individually evaluated for impairment
The amount of the impairment losses incurred on financial assets represents the excess of their respective
carrying amounts over the present values of their expected future cash flows. These cash flows are
discounted using the original effective interest rate. If a financial asset has a variable interest rate, the
discount rate for measuring any impairment loss is the current effective rate determined under the contract.
As an exception to the rule described above, the market value of listed debt instruments is deemed to be a
fair estimate of the present value of their expected future cash flows.
P. 23 Translation of the Consolidated Financial Statements originally issued in Spanish and prepared in accordance with EU-IFRSs, as adopted by the European Union (See Note 1 and 56). In the event of a discrepancy, the Spanish language version prevails.
The following is to be taken into consideration when estimating the future cash flows of debt instruments:
All amounts that are expected to be recovered over the remaining life of the debt instrument;
including, where appropriate, those which may result from the collateral and other credit
enhancements provided for the debt instrument (after deducting the costs required for foreclosure
and subsequent sale). Impairment losses include an estimate for the possibility of collecting accrued,
past-due and uncollected interest.
The various types of risk to which each debt instrument is subject.
The circumstances in which collections will foreseeably be made.
Impairment losses on financial assets collectively evaluated for impairment
With regard to the collective impairment analysis, financial assets are grouped by risk type considering the
debtor's capacity to pay based on the contractual terms. As part of this analysis, the BBVA Group estimates
the impairment loan losses that are not individually significant, distinguishing between those that show
objective evidence of impairment, and those that do not show objective evidence of impairment, as well as
the impairment of significant loans that the BBVA Group has deemed as not showing an objective evidence of
impairment.
With respect to financial assets that have no objective evidence of impairment, the Group applies statistical
methods using historical experience and other specific information to estimate the losses that the Group has
incurred as a result of events that have occurred as of the date of preparation of the Consolidated Financial
Statements but have not been known and will be apparent, individually after the date of submission of the
information. This calculation is an intermediate step until these losses are identified on an individual level, at
which time these financial instruments will be segregated from the portfolio of financial assets without
objective evidence of impairment.
The incurred loss is calculated taking into account three key factors: exposure at default, probability of
default and loss given default.
Exposure at default (EAD) is the amount of risk exposure at the date of default by the counterparty.
Probability of default (PD) is the probability of the counterparty failing to meet its principal and/or
interest payment obligations. The PD is associated with the rating/scoring of each
counterparty/transaction.
Loss given default (LGD) is the estimate of the loss arising in the event of default. It depends mainly
on the characteristics of the counterparty, and the valuation of the guarantees or collateral
associated with the asset.
In order to calculate the LGD at each balance sheet date, the Group evaluates the whole amount expected to
be obtained over the remaining life of the financial asset. The recoverable amount from executable secured
collateral is estimated based on the property valuation, discounting the necessary adjustments to
adequately account for the potential fall in value until its execution and sale, as well as execution costs,
maintenance costs and sale costs.
In addition, to identify the possible incurred but not reported losses (IBNR) in the unimpaired portfolio, an additional parameter called "LIP" (loss identification period) has to be introduced. The LIP parameter is the period between the time at which the event that generates a given loss occurs and the time when the loss is identified at an individual level.
When the property right is contractually acquired at the end of the foreclosure process or when the assets of distressed borrowers are purchased, the asset is recognized in the consolidated balance sheets (see Note 2.2.4).
P. 24 Translation of the Consolidated Financial Statements originally issued in Spanish and prepared in accordance with EU-IFRSs, as adopted by the European Union (See Note 1 and 56). In the event of a discrepancy, the Spanish language version prevails.
Impairment of other debt instruments classified as financial assets available for sale
The impairment losses on other debt instruments included in the “Available-for-sale financial asset” portfolio
are equal to the excess of their acquisition cost (net of any principal repayment), after deducting any
impairment loss previously recognized in the consolidated income statement over their fair value.
When there is objective evidence that the negative differences arising on measurement of these debt
instruments are due to impairment, they are no longer considered as “Accumulated other comprehensive
income - Items that may be reclassified to profit or loss - Available-for-sale financial assets” and are
recognized in the consolidated income statement.
If all, or part of the impairment losses are subsequently recovered, the amount is recognized in the
consolidated income statement for the year in which the recovery occurred, up to the amount previously
recognized in the income statement.
Impairment of equity instruments
The amount of the impairment in the equity instruments is determined by the category where they are
recognized:
Equity instruments classified as available for sale: When there is objective evidence that the negative
differences arising on measurement of these equity instruments are due to impairment, they are no
longer registered as “Accumulated other comprehensive income - Items that may be reclassified to
profit or loss - Available-for-sale financial assets” and are recognized in the consolidated income
statement. In general, the Group considers that there is objective evidence of impairment on equity
instruments classified as available-for-sale when significant unrealized losses have existed over a
sustained period of time due to a price reduction of at least 40% or over a period of more than 18
months.
When applying this evidence of impairment, the Group takes into account the volatility in the price of
each individual equity instrument to determine whether it is a percentage that can be recovered
through its sale in the market; other different thresholds may exist for certain equity instruments or
specific sectors.
In addition, for individually significant investments, the Group compares the valuation of the most
significant equity instruments against valuations performed by independent experts.
Any recovery of previously recognized impairment losses for an investment in an equity instrument
classified as available for sale is not recognized in the consolidated income statement, but under the
heading " Accumulated other comprehensive income - Items that may be reclassified to profit or loss
- Available-for-sale financial assets" in the consolidated balance sheet (see Note 30).
Equity instruments measured at cost: The impairment losses on equity instruments measured at
acquisition cost are equal to the excess of their carrying amount over the present value of expected
future cash flows discounted at the market rate of return for similar equity instruments. In order to
determine these impairment losses, unless there is better evidence, an assessment of the equity of
the investee is carried out (excluding Accumulated other comprehensive income due to cash flow
hedges) based on the last approved (consolidated) balance sheet, adjusted by the unrealized gains
at measurement date.
Impairment losses are recognized in the consolidated income statement in the year in which they arise as a
direct reduction of the cost of the instrument. These impairment losses may only be recovered subsequently
in the event of the sale of these assets.
P. 25 Translation of the Consolidated Financial Statements originally issued in Spanish and prepared in accordance with EU-IFRSs, as adopted by the European Union (See Note 1 and 56). In the event of a discrepancy, the Spanish language version prevails.
2.2.2 Transfers and derecognition of financial assets and liabilities
The accounting treatment of transfers of financial assets is determined by the form in which risks and
benefits associated with the financial assets involved are transferred to third parties. Thus the financial
assets are only derecognized from the consolidated balance sheet when the cash flows that they generate
are extinguished, when their implicit risks and benefits have been substantially transferred to third parties or
when the control of financial asset is transferred even in case of no physical transfer or substantial retention
of such assets. In the latter case, the financial asset transferred is derecognized from the consolidated
balance sheet, and any right or obligation retained or created as a result of the transfer is simultaneously
recognized.
Similarly, financial liabilities are derecognized from the consolidated balance sheet only if their obligations are extinguished or acquired (with a view to subsequent cancellation or renewed placement).
The Group is considered to have transferred substantially all the risks and benefits if such risks and benefits
account for the majority of the risks and benefits involved in ownership of the transferred financial assets. If
substantially all the risks and benefits associated with the transferred financial asset are retained:
The transferred financial asset is not derecognized from the consolidated balance sheet and
continues to be measured using the same criteria as those used before the transfer.
A financial liability is recognized at the amount equal to the amount received, which is subsequently
measured at amortized cost or fair value with changes in the income statement, whichever the case.
Both the income generated on the transferred (but not derecognized) financial asset and the
expenses of the new financial liability continue to be recognized.
2.2.3 Financial guarantees
Financial guarantees are considered to be those contracts that require their issuer to make specific
payments to reimburse the holder of the financial guarantee for a loss incurred when a specific borrower
breaches its payment obligations on the terms – whether original or subsequently modified – of a debt
instrument, irrespective of the legal form it may take. Financial guarantees may take the form of a deposit,
bank guarantee, insurance contract or credit derivative, among others.
In their initial recognition, financial guarantees are recognized as liabilities in the consolidated balance sheet
at fair value, which is generally the present value of the fees, commissions and interest receivable from these
contracts over the term thereof, and the Group simultaneously recognize a corresponding asset in the
consolidated balance sheet for the amount of the fees and commissions received at the inception of the
transactions and the amounts receivable at the present value of the fees, commissions and interest
outstanding.
Financial guarantees, irrespective of the guarantor, instrumentation or other circumstances, are reviewed
periodically so as to determine the credit risk to which they are exposed and, if appropriate, to consider
whether a provision is required for them. The credit risk is determined by application of criteria similar to
those established for quantifying impairment losses on debt instruments measured at amortized cost (see
Note 2.2.1).
The provisions recognized for financial guarantees considered impaired are recognized under the heading
“Provisions - Provisions for contingent risks and commitments” on the liability side in the consolidated
balance sheets (see Note 24). These provisions are recognized and reversed with a charge or credit,
respectively; to “Provisions or reversal of provision” in the consolidated income statements (see Note 46).
Income from financial guarantees is recorded under the heading “Fee and commission income” in the
consolidated income statement and is calculated by applying the rate established in the related contract to
the nominal amount of the guarantee (see Note 40).
P. 26 Translation of the Consolidated Financial Statements originally issued in Spanish and prepared in accordance with EU-IFRSs, as adopted by the European Union (See Note 1 and 56). In the event of a discrepancy, the Spanish language version prevails.
2.2.4 Non-current assets and disposal groups held for sale and liabilities included in disposal groups classified as held for sale
The headings “Non-current assets and disposal groups held for sale” and “liabilities included in disposal
groups classified as held for sale” in the consolidated balance sheets includes the carrying amount of assets
that are not part of the BBVA Group’s operating activities. The recovery of this carrying amount is expected
to take place through the price obtained on its disposal (see Note 21).
These headings include individual items and groups of items (“disposal groups”) and disposal groups that
form part of a major operating segment and are being held for sale as part of a disposal plan (“discontinued
operations”). The individual items include the assets received by the subsidiaries from their debtors, in full or
partial settlement of the debtors’ payment obligations (assets foreclosed or received in payment of debt and
recovery of lease finance transactions), unless the Group has decided to make continued use of these
assets. The BBVA Group has units that specialize in real estate management and the sale of this type of
asset.
Symmetrically, the heading “Liabilities included in disposal groups classified as held for sale” in the
consolidated balance sheets reflects the balances payable arising from disposal groups and discontinued
operations.
Non-current assets and disposal groups classified as held for sale are generally measured, at the acquisition
date and at any later date deemed necessary, at either their carrying amount or the fair value of the property
(less costs to sell), whichever is lower.
In the case of real estate assets foreclosed or received in payment of debts, they are initially recognized at
the lower of: the restated carrying amount of the financial asset and the fair value at the time of the
foreclosure or receipt of the asset less estimated sales costs. The carrying amount of the financial asset is
updated at the time of the foreclosure, treating the real property received as a secured collateral and taking
into account the credit risk coverage that would correspond to it according to its classification prior to the
delivery. For these purposes, the collateral will be valued at its current fair value (less sale costs) at the time
of foreclosure. This carrying amount will be compared with the previous carrying amount and the difference
will be recognized as a provision increase, if applicable. On the other hand, the fair value of the foreclosed
asset is obtained by appraisal, evaluating the need to apply a discount on the asset derived from the specific
conditions of the asset or the market situation for these assets, and in any case, deducting the company’s
estimated sale costs.
At the time of the initial recognition, these real estate assets foreclosed or received in payment of debts,
classified as “Non-current assets and disposal groups held for sale” and “liabilities included in disposal
groups classified as held for sale” are valued at the lower of: their restated fair value less estimated sale costs
and their carrying amount; a deterioration or impairment reversal can be recognized for the difference if
applicable.
Non-current assets and disposal groups held for sale groups classified as held for sale are not depreciated
while included under the heading “Non-current assets and disposal groups held for sale”.
Fair value of non-current assets held for sale from foreclosures or recoveries is based, mainly, in appraisals
or valuations made by independent experts on an annual basis or more frequently, should there be indicators
of impairment.
Gains and losses generated on the disposal of assets and liabilities classified as non-current held for sale, and
liabilities included in disposal groups classified as held for sale as well as impairment losses and, where
pertinent, the related recoveries, are recognized in “Profit or loss from non-current assets and disposal
groups classified as held for sale not qualifying as discontinued operations” in the consolidated income
P. 27 Translation of the Consolidated Financial Statements originally issued in Spanish and prepared in accordance with EU-IFRSs, as adopted by the European Union (See Note 1 and 56). In the event of a discrepancy, the Spanish language version prevails.
statement (see Note 50). The remaining income and expense items associated with these assets and
liabilities are classified within the relevant consolidated income statement headings.
Income and expenses for discontinued operations, whatever their nature, generated during the year, even if
they have occurred before their classification as discontinued operations, are presented net of the tax effect
as a single amount under the heading “Profit from discontinued operations” in the consolidated income
statement, whether the business remains on the consolidated balance sheet or is derecognized from the
consolidated balance sheet. As long as an asset remains in this category, it will not be amortized. This
heading includes the earnings from their sale or other disposal.
2.2.5 Tangible assets
Property, plant and equipment for own use
This heading includes the assets under ownership or acquired under lease finance, intended for future or
current use by the BBVA Group and that it expects to hold for more than one year. It also includes tangible
assets received by the consolidated entities in full or partial settlement of financial assets representing
receivables from third parties and those assets expected to be held for continuing use.
Property, plant and equipment for own use are presented in the consolidated balance sheets at acquisition
cost, less any accumulated depreciation and, where appropriate, any estimated impairment losses resulting
from comparing this net carrying amount of each item with its corresponding recoverable amount.
Depreciation is calculated using the straight-line method, on the basis of the acquisition cost of the assets
less their residual value; the land is considered to have an indefinite life and is therefore not depreciated.
The tangible asset depreciation charges are recognized in the accompanying consolidated income
statements under the heading "Depreciation and Amortization" (see Note 45) and are based on the
application of the following depreciation rates (determined on the basis of the average years of estimated
useful life of the various assets):
Depreciation Rates for Tangible Assets
Type of Assets Annual Percentage
Buildings for own use 1% - 4%
Furniture 8% - 10%
Fixtures 6% - 12%
Office supplies and hardware 8% - 25%
The BBVA Group’s criteria for determining the recoverable amount of these assets, in particular buildings for
own use, is based on independent appraisals that are no more than 3-5 years old at most, unless there are
indications of impairment.
At each reporting date, the Group entities analyze whether there are internal or external indicators that a
tangible asset may be impaired. When there is evidence of impairment, the Group analyzes whether this
impairment actually exists by comparing the asset’s net carrying amount with its recoverable amount (as the
higher between its recoverable amount less disposal costs and its value in use). When the carrying amount
exceeds the recoverable amount, the carrying amount is written down to the recoverable amount and
depreciation charges going forward are adjusted to reflect the asset’s remaining useful life.
Similarly, if there is any indication that the value of a tangible asset is now recoverable, the consolidated
entities will estimate the recoverable amounts of the asset and recognize it in the consolidated income
statement, recording the reversal of the impairment loss registered in previous years and thus adjusting
future depreciation charges. Under no circumstances may the reversal of an impairment loss on an asset
P. 28 Translation of the Consolidated Financial Statements originally issued in Spanish and prepared in accordance with EU-IFRSs, as adopted by the European Union (See Note 1 and 56). In the event of a discrepancy, the Spanish language version prevails.
raise its carrying amount above that which it would have if no impairment losses had been recognized in prior
years.
Running and maintenance expenses relating to tangible assets held for own use are recognized as an
expense in the year they are incurred and recognized in the consolidated income statements under the
heading "Administration costs - Other administrative expenses - Property, fixtures and equipment" (see Note
44.2).
Other assets leased out under an operating lease
The criteria used to recognize the acquisition cost of assets leased out under operating leases, to calculate
their depreciation and their respective estimated useful lives and to recognize the impairment losses on
them, are the same as those described in relation to tangible assets for own use.
Investment properties
The heading “Tangible assets - Investment properties” in the consolidated balance sheets reflects the net
values (purchase cost minus the corresponding accumulated depreciation and, if appropriate, estimated
impairment losses) of the land, buildings and other structures that are held either to earn rentals or for
capital appreciation through sale and that are neither expected to be sold off in the ordinary course of
business nor are destined for own use (see Note 17).
The criteria used to recognize the acquisition cost of investment properties, calculate their depreciation and
their respective estimated useful lives and recognize the impairment losses on them, are the same as those
described in relation to tangible assets held for own use.
The BBVA Group’s criteria for determining the recoverable amount of these assets is based on independent
appraisals that are no more than one year old at most, unless there are indications of impairment.
2.2.6 Inventories
The balance under the heading “Other assets - Inventories” in the consolidated balance sheets mainly
includes the land and other properties that the BBVA Group’s real estate entities hold for development and
sale as part of their real estate development activities (see Note 20).
The cost of inventories includes those costs incurred in their acquisition and development, as well as other
direct and indirect costs incurred in getting them to their current condition and location.
In the case of the cost of real-estate assets accounted for as inventories, the cost is comprised of: the
acquisition cost of the land, the cost of urban planning and construction, non-recoverable taxes and costs
corresponding to construction supervision, coordination and management. Financing cost incurred during
the year form part of cost, provided that the inventories require more than a year to be in a condition to be
sold.
Properties purchased from customers in distress, which the Group manages for sale, are measured at the
acquisition date and any subsequent time, at either their related carrying amount or the fair value of the
property (less costs to sell), whichever is lower. The carrying amount at acquisition date of these properties
is defined as the balance pending collection on those assets that originated said purchases (net of
provisions).
Impairment
The amount of any subsequent adjustment due to inventory valuation for reasons such as damage,
obsolescence, reduction in sale price to its net realizable value, as well as losses for other reasons and, if
appropriate, subsequent recoveries of value up to the limit of the initial cost value, are registered under the
P. 29 Translation of the Consolidated Financial Statements originally issued in Spanish and prepared in accordance with EU-IFRSs, as adopted by the European Union (See Note 1 and 56). In the event of a discrepancy, the Spanish language version prevails.
heading "Impairment or reversal of impairment on non-financial assets” in the accompanying consolidated
income statements (see Note 48) for the year in which they are incurred.
In the case of the above mentioned real-estate assets, if the fair value less costs to sell is lower than the
carrying amount of the loan recognized in the consolidated balance sheet, a loss is recognized under the
heading "Impairment or reversal of impairment on non-financial assets" in the consolidated income
statement for the period. In the case of real-estate assets accounted for as inventories, the BBVA Group’s
criterion for determining their net realizable value is mainly based on independent appraisals no more than
one year old, or less if there are indications of impairment.
Inventory sales
In sale transactions, the carrying amount of inventories is derecognized from the consolidated balance sheet
and recognized as an expense under the income statement heading "Other operating expenses – Changes in
inventories” in the year in which the income from its sale is recognized. This income is recognized under the
heading “Other operating income – Financial income from non-financial services” in the consolidated income
statements (see Note 42).
2.2.7 Business combinations
A business combination is a transaction, or any other deal, by which the Group obtains control of one or
more businesses. It is accounted for by applying the acquisition method.
According to this method, the acquirer has to recognize the assets acquired and the liabilities and contingent
liabilities assumed, including those that the acquired entity had not recognized in the accounts. The method
involves the measurement of the consideration received for the business combination and its allocation to
the assets, liabilities and contingent liabilities measured according to their fair value, at the purchase date, as
well as the recognition of any non-controlling participation (minority interests) that may arise from the
transaction.
In a business combination achieved in stages, the acquirer shall remeasure its previously held equity interest
in the acquiree at its acquisition-date fair value and recognize the resulting gain or loss, if any, in profit or loss
under the heading “Gains (losses) on derecognized of non-financial assets and subsidiaries, net” of the
consolidated income statements. In prior reporting periods, the acquirer may have recognized changes in
the value of its equity interest in the acquiree in other comprehensive income. If so, the amount that was
recognized in other comprehensive income shall be recognized on the same basis as would be required if the
acquirer had disposed directly of the previously held equity interest.
In addition, the acquirer shall recognize an asset in the consolidated balance sheet under the heading
“Intangible asset - Goodwill” if on the acquisition date there is a positive difference between:
the sum of the consideration transferred, the amount of all the non-controlling interests and the fair
value of stock previously held in the acquired business; and
the net fair value of the assets acquired and liabilities assumed.
If this difference is negative, it shall be recognized directly in the income statement under the heading “Gain
on Bargain Purchase in business combinations”.
Non-controlling interests in the acquired entity may be measured in two ways: either at their fair value; or at
the proportional percentage of net assets identified in the acquired entity. The method of valuing non-
controlling interest may be elected in each business combination. BBVA Group has always elected for the
second method.
P. 30 Translation of the Consolidated Financial Statements originally issued in Spanish and prepared in accordance with EU-IFRSs, as adopted by the European Union (See Note 1 and 56). In the event of a discrepancy, the Spanish language version prevails.
2.2.8 Intangible assets
Goodwill
Goodwill represents a portion of consideration transferred in advance by the acquiring entity for the future
economic benefits from assets that cannot be individually identified and separately recognized. Goodwill is
never amortized. It is subject periodically to an impairment analysis, and is written off if there has been
impairment.
Goodwill is assigned to one or more cash-generating units that expect to be the beneficiaries of the synergies
derived from the business combinations. The cash-generating units represent the Group’s smallest
identifiable asset groups that generate cash flows for the Group and that are largely independent of the flows
generated from the Group’s other assets or groups of assets. Each unit or units to which goodwill is allocated:
Is the lowest level at which the entity manages goodwill internally.
Is not larger than an operating segment.
The cash-generating units to which goodwill has been allocated are tested for impairment (including the
allocated goodwill in their carrying amount). This analysis is performed at least annually or more frequently if
there is any indication of impairment.
For the purpose of determining the impairment of a cash-generating unit to which a part of goodwill has been
allocated, the carrying amount of that cash-generating unit, adjusted by the theoretical amount of the
goodwill attributable to the non-controlling interests, in the event they are not valued at fair value, is
compared with its recoverable amount.
The recoverable amount of a cash-generating unit is equal to the fair value less sale costs or its value in use,
whichever is greater. Value in use is calculated as the discounted value of the cash flow projections that the
unit’s management estimates and is based on the latest budgets approved for the coming years. The main
assumptions used in its calculation are: a sustainable growth rate to extrapolate the cash flows indefinitely,
and the discount rate used to discount the cash flows, which is equal to the cost of the capital assigned to
each cash-generating unit, and equivalent to the sum of the risk-free rate plus a risk premium inherent to the
cash-generating unit being evaluated for impairment.
If the carrying amount of the cash-generating unit exceeds the related recoverable amount, the Group
recognizes an impairment loss; the resulting loss is apportioned by reducing, first, the carrying amount of the
goodwill allocated to that unit and, second, if there are still impairment losses remaining to be recognized,
the carrying amount of the remainder of the assets. This is done by allocating the remaining loss in
proportion to the carrying amount of each of the assets in the unit. In the event the non-controlling interests
are measured at fair value, the deterioration of goodwill attributable to non-controlling interests will be
recognized. In any case, an impairment loss recognized for goodwill shall not be reversed in a subsequent
period.
Goodwill impairment losses are recognized under the heading "Impairment or reversal of impairment on
non-financial assets – Intangible assets” in the consolidated income statements (see Note 48).
Other intangible assets
These assets may have an indefinite useful life if, based on an analysis of all relevant factors, it is concluded
that there is no foreseeable limit to the period over which the asset is expected to generate net cash flows for
the consolidated entities. In all other cases they have a finite useful life.
Intangible assets with a finite useful life are amortized according to the duration of this useful life, using
methods similar to those used to depreciate tangible assets. The defined useful life intangible asset is made
up mainly of IT applications acquisition costs which have a useful life of 3 to 5 years. The depreciation charge
P. 31 Translation of the Consolidated Financial Statements originally issued in Spanish and prepared in accordance with EU-IFRSs, as adopted by the European Union (See Note 1 and 56). In the event of a discrepancy, the Spanish language version prevails.
of these assets is recognized in the accompanying consolidated income statements under the heading
"Depreciation" (see Note 45).
The consolidated entities recognize any impairment loss on the carrying amount of these assets with charge
to the heading “Impairment or reversal of impairment on non - financial assets- Intangible assets” in the
accompanying consolidated income statements (see Note 48). The criteria used to recognize the
impairment losses on these assets and, where applicable, the recovery of impairment losses recognized in
prior years, are similar to those used for tangible assets.
2.2.9 Insurance and reinsurance contracts
The assets of the BBVA Group’s insurance subsidiaries are recognized according to their nature under the
corresponding headings of the consolidated balance sheets and the initial recognition and valuation is carried
out according to the criteria set out in IFRS 4.
The heading “Insurance and reinsurance assets” in the accompanying consolidated balance sheets includes
the amounts that the consolidated insurance subsidiaries are entitled to receive under the reinsurance
contracts entered into by them with third parties and, more specifically, the share of the reinsurer in the
technical provisions recognized by the consolidated insurance subsidiaries.
The heading “Liabilities under insurance and reinsurance contracts” in the accompanying consolidated
balance sheets includes the technical provisions for direct insurance and inward reinsurance recognized by
the consolidated insurance subsidiaries to cover claims arising from insurance contracts in force at period-
end (see Note 23).
The income or expenses reported by the BBVA Group’s consolidated insurance subsidiaries on their
insurance activities is recognized, in accordance with their nature, in the corresponding items of the
consolidated income statements.
The consolidated insurance entities of the BBVA Group recognize the amounts of the premiums written to
the income statement and a charge for the estimated cost of the claims that will be incurred at their final
settlement to their consolidated income statements. At the close of each year the amounts collected and
unpaid, as well as the costs incurred and unpaid, are accrued.
The most significant provisions registered by consolidated insurance entities with respect to insurance
policies issued by them are set out by their nature in Note 23.
According to the type of product, the provisions may be as follows:
Life insurance provisions:
Represents the value of the net obligations undertaken with the life insurance policyholder. These provisions include:
• Provisions for unearned premiums. These are intended for the accrual, at the date of
calculation, of the premiums written. Their balance reflects the portion of the premiums
received until the closing date that has to be allocated to the period from the closing date to the
end of the insurance policy period.
• Mathematical reserves: Represents the value of the life insurance obligations of the insurance
entities at year-end, net of the policyholder’s obligations, arising from life insurance contracted.
Non-life insurance provisions:
• Provisions for unearned premiums. These provisions are intended for the accrual, at the date of
calculation, of the premiums written. Their balance reflects the portion of the premiums
P. 32 Translation of the Consolidated Financial Statements originally issued in Spanish and prepared in accordance with EU-IFRSs, as adopted by the European Union (See Note 1 and 56). In the event of a discrepancy, the Spanish language version prevails.
received until year-end that has to be allocated to the period between the year-end and the end
of the policy period.
• Provisions for unexpired risks: The provision for unexpired risks supplements the provision for
unearned premiums by the amount by which that provision is not sufficient to reflect the
assessed risks and expenses to be covered by the consolidated insurance subsidiaries in the
policy period not elapsed at year-end.
Provision for claims:
This reflects the total amount of the outstanding obligations arising from claims incurred prior to year-end. Insurance subsidiaries calculate this provision as the difference between the total estimated or certain cost of the claims not yet reported, settled or paid, and the total amounts already paid in relation to these claims.
Provision for bonuses and rebates:
This provision includes the amount of the bonuses accruing to policyholders, insurees or beneficiaries and the premiums to be returned to policyholders or insurees, as the case may be, based on the behavior of the risk insured, to the extent that such amounts have not been individually assigned to each of them.
Technical provisions for reinsurance ceded:
Calculated by applying the criteria indicated above for direct insurance, taking account of the assignment conditions established in the reinsurance contracts in force.
Other technical provisions:
Insurance entities have recognized provisions to cover the probable mismatches in the market reinvestment interest rates with respect to those used in the valuation of the technical provisions.
The BBVA Group controls and monitors the exposure of the insurance subsidiaries to financial risk and, to
this end, uses internal methods and tools that enable it to measure credit risk and market risk and to
establish the limits for these risks.
2.2.10 Tax assets and liabilities
Expenses on corporate income tax applicable to the BBVA Group’s Spanish entities and on similar income
taxes applicable to consolidated foreign entities are recognized in the consolidated income statement,
except when they result from transactions on which the profits or losses are recognized directly in equity, in
which case the related tax effect is also recognized in equity.
The total corporate income tax expense is calculated by aggregating the current tax arising from the
application of the corresponding tax rate to the tax for the year (after deducting the tax credits or discounts
allowable for tax purposes) and the change in deferred tax assets and liabilities recognized in the
consolidated income statement.
Deferred tax assets and liabilities include temporary differences, defined as the amounts to be payable or
recoverable in future years arising from the differences between the carrying amount of assets and liabilities
and their tax bases (the “tax value”), and tax loss and tax credit or discount carry forwards (see Note 19).
The "Tax Assets" line item in the accompanying consolidated balance sheets includes the amount of all the
assets of a tax nature, and distinguishes between: "Current” (amounts recoverable by tax in the next twelve
months) and "Deferred" (which includes the amount of tax to be recovered in future years, including those
arising from tax losses or credits for deductions or rebates that can be compensated). The "Tax Liabilities"
line item in the accompanying consolidated balance sheets includes the amount of all the liabilities of a tax
P. 33 Translation of the Consolidated Financial Statements originally issued in Spanish and prepared in accordance with EU-IFRSs, as adopted by the European Union (See Note 1 and 56). In the event of a discrepancy, the Spanish language version prevails.
nature, except for provisions for taxes, broken down into: "Current” (income tax payable on taxable profit for
the year and other taxes payable in the next twelve months) and "Deferred" (the amount of corporate tax
payable in subsequent years).
Deferred tax liabilities attributable to taxable temporary differences associated with investments in
subsidiaries, associates or joint venture entities are recognized as such, except where the Group can control
the timing of the reversal of the temporary difference and it is unlikely that it will reverse in the future.
Deferred tax assets are recognized to the extent that it is considered probable that the consolidated entities
will have sufficient taxable profits in the future against which the deferred tax assets can be utilized and are
not from the initial recognition (except in the case of a business combination) of other assets or liabilities in a
transaction that does not affect the fiscal outcome or the accounting result.
The deferred tax assets and liabilities recognized are reassessed by the consolidated entities at each balance
sheet date in order to ascertain whether they still qualify as deferred tax assets and liabilities, and the
appropriate adjustments are made on the basis of the findings of the analyses performed. In those
circumstances in which it is unclear how a specific requirement of the tax law applies to a particular
transaction or circumstance, and the acceptability of the definitive tax treatment depends on the decisions
taken by the relevant taxation authority in future, the entity recognizes current and deferred tax liabilities and
assets considering whether it is probable or not that a taxation authority will accept an uncertain tax
treatment. Thus, if the entity concludes that it is not probable that the taxation authority will accept an
uncertain tax treatment, the entity uses the amount expected to be paid to (recovered from) the taxation
authorities.
The income and expenses directly recognized in consolidated equity that do not increase or decrease taxable
income are accounted for as temporary differences.
2.2.11 Provisions, contingent assets and contingent liabilities
The heading “Provisions” in the consolidated balance sheets includes amounts recognized to cover the BBVA
Group’s current obligations arising as a result of past events. These are certain in terms of nature but
uncertain in terms of amount and/or settlement date. The settlement of these obligations is deemed likely to
entail an outflow of resources embodying economic benefits (see Note 24). The obligations may arise in
connection with legal or contractual provisions, valid expectations formed by Group entities relative to third
parties in relation to the assumption of certain responsibilities or through virtually certain developments of
particular aspects of the regulations applicable to the operation of the entities; and, specifically, future
legislation to which the Group will certainly be subject. The provisions are recognized in the consolidated
balance sheets when each and every one of the following requirements is met:
They represent a current obligation that has arisen from a past event. At the date of the Consolidated
Financial Statements, there is more probability that the obligation will have to be met than that it will
not.
It is probable that an outflow of resources embodying economic benefits will be required to settle the
obligation.
The amount of the obligation can be reasonably estimated.
Among other items, these provisions include the commitments made to employees by some of the Group
entities (mentioned in Note 2.2.12), as well as provisions for tax and legal litigation.
Contingent assets are possible assets that arise from past events and whose existence is conditional on, and
will be confirmed only by, the occurrence or non-occurrence of events beyond the control of the Group.
Contingent assets are not recognized in the consolidated balance sheet or in the consolidated income
statement; however, they will be disclosed, should they exist, in the Notes to the Consolidated Financial
P. 34 Translation of the Consolidated Financial Statements originally issued in Spanish and prepared in accordance with EU-IFRSs, as adopted by the European Union (See Note 1 and 56). In the event of a discrepancy, the Spanish language version prevails.
Statements, provided that it is probable will give rise to an increase in resources embodying economic
benefits.
Contingent liabilities are possible obligations of the Group that arise from past events and whose existence is
conditional on the occurrence or non-occurrence of one or more future events beyond the control of the
Group. They also include the existing obligations of the Group when it is not probable that an outflow of
resources embodying economic benefits will be required to settle them; or when, in extremely rare cases,
their amount cannot be measured with sufficient reliability.
Contingent liabilities are not recognized in the consolidated balance sheet or the income statement
(excluding contingent liabilities from business combination) but are disclosed in the Consolidated Financial
Statements, unless the possibility of an outflow of resources embodying economic benefits is remote.
2.2.12 Pensions and other post-employment commitments
Below we provide a description of the most significant accounting policies relating to post-employment and
other employee benefit commitments assumed by BBVA Group entities (see Note 25).
Short-term employee benefits
Benefits for current active employees which are accrued and settled during the year and for which a
provision is not required in the entity´s accounts. These include wages and salaries, social security charges
and other personnel expenses.
Costs are charged and recognized under the heading “Administration costs – Personnel expenses – Other
personnel expenses” of the consolidated income statement (see Note 44.1).
Post-employment benefits – Defined-contribution plans
The Group sponsors defined-contribution plans for the majority of its active employees. The amount of these
benefits is established as a percentage of remuneration and/or as a fixed amount.
The contributions made to these plans in each period by BBVA Group entities are charged and recognized
under the heading “Administration costs – Personnel expenses – Defined-contribution plan expense” of the
consolidated income statement (see Note 44.1).
Post-employment benefits – Defined-benefit plans
Some Group entities maintain pension commitments with employees who have already retired or taken early
retirement, certain closed groups of active employees still accruing defined benefit pensions, and in-service
death and disability benefits provided to most active employees. These commitments are covered by
insurance contracts, pension funds and internal provisions.
In addition, some of the Spanish entities have offered certain employees the option to retire before their
normal retirement age, recognizing the necessary provisions to cover the costs of the associated benefit
commitments, which include both the liability for the benefit payments due as well as the contributions
payable to external pension funds during the early retirement period.
Furthermore, certain Group entities provide welfare and medical benefits which extend beyond the date of
retirement of the employees entitled to the benefits.
All of these commitments are quantified based on actuarial valuations, with the amounts recorded under the
heading “Provisions – Provisions for pensions and similar obligations” in the consolidated balance sheet and
determined as the difference between the value of the defined-benefit commitments and the fair value of
plan assets at the date of the Consolidated Financial Statements (see Note 25).
P. 35 Translation of the Consolidated Financial Statements originally issued in Spanish and prepared in accordance with EU-IFRSs, as adopted by the European Union (See Note 1 and 56). In the event of a discrepancy, the Spanish language version prevails.
Current service cost are charged and recognized under the heading “Administration costs – Personnel
expenses – Defined-benefit plan expense” of the consolidated income statement (see Note 44.1).
Interest credits/charges relating to these commitments are charged and recognized under the headings
“Interest income” and “Interest expense” of the consolidated income statement (see Note 37).
Past service costs arising from benefit plan changes as well as early retirements granted during the period
are recognized under the heading “Provisions or reversals of provisions” of the consolidated income
statement (see Note 46).
Other long-term employee benefits
In addition to the above commitments, certain Group entities provide long-term service awards to their
employees, consisting of monetary amounts or periods of vacation granted upon completion of a number of
years of qualifying service.
These commitments are quantified based on actuarial valuations and the amounts recorded under the
heading “Provisions – Other long-term employee benefits” of the consolidated balance sheet (see Note 24).
Valuation of commitments: actuarial assumptions and recognition of gains/losses
The present value of these commitments is determined based on individual member data. Active employee
costs are determined using the “projected unit credit” method, which treats each period of service as giving
rise to an additional unit of benefit and values each unit separately.
In establishing the actuarial assumptions we take into account that:
They should be unbiased, i.e. neither unduly optimistic nor excessively conservative.
Each assumption does not contradict the others and adequately reflect the existing relationship
between economic variables such as price inflation, expected wage increases, discount rates and the
expected return on plan assets, etc. Future wage and benefit levels should be based on market
expectations, at the balance sheet date, for the period over which the obligations are to be settled.
The interest rate used to discount benefit commitments is determined by reference to market yields,
at the balance sheet date, on high quality bonds.
The BBVA Group recognizes actuarial gains/losses relating to early retirement benefits, long service awards
and other similar items under the heading “Provisions or reversal of provisions” of the consolidated income
statement for the period in which they arise (see Note 46). Actuarial gains/losses relating to pension and
medical benefits are directly charged and recognized under the heading "Accumulated other comprehensive
income – Items that will not be reclassified to profit or loss – Actuarial gains or losses on defined benefit
pension plans" of equity in the consolidated balance sheet (see Note 30).
2.2.13 Equity-settled share-based payment transactions
Provided they constitute the delivery of such equity instruments following the completion of a specific period
of services, equity-settled share-based payment transactions are recognized as an expense for services
being provided by employees, by way of a balancing entry under the heading “Shareholders’ funds – Other
equity instruments” in the consolidated balance sheet (Note 44.1.1). These services are measured at fair
value for the employees services received, unless such fair value cannot be calculated reliably. In such case,
they are measured by reference to the fair value of the equity instruments granted, taking into account the
date on which the commitments were granted and the terms and other conditions included in the
commitments.
When the initial compensation agreement includes what may be considered market conditions among its
terms, any changes in these conditions will not be reflected in the consolidated income statement, as these
P. 36 Translation of the Consolidated Financial Statements originally issued in Spanish and prepared in accordance with EU-IFRSs, as adopted by the European Union (See Note 1 and 56). In the event of a discrepancy, the Spanish language version prevails.
have already been accounted for in calculating the initial fair value of the equity instruments. Non-market
vesting conditions are not taken into account when estimating the initial fair value of equity instruments, but
they are taken into account when determining the number of equity instruments to be issued. This will be
recognized on the consolidated income statement with the corresponding increase in total consolidated
equity.
2.2.14 Termination benefits
Termination benefits are recognized in the financial statements when the BBVA Group agrees to terminate
employment contracts with its employees and has established a detailed plan.
2.2.15 Treasury shares
The value of common stock issued by the BBVA Group’s entities and held by them - basically, shares and
derivatives on the Bank’s shares held by some consolidated entities that comply with the requirements to be
recognized as equity instruments - are recognized as a decrease to net equity, under the heading
"Shareholders’ funds - Treasury stock" in the consolidated balance sheets (see Note 29).
These financial assets are recognized at acquisition cost, and the gains or losses arising on their disposal are
credited or debited, as appropriate, to the heading “Shareholders’ funds - Retained earnings” in the
consolidated balance sheets (see Note 28).
2.2.16 Foreign-currency transactions and exchange differences
The BBVA Group’s functional currency, and thus the currency in which the Consolidated Financial
Statements are presented, is the euro. As such, all balances and transactions denominated in currencies
other than the euro are deemed to be denominated in “foreign currency”.
Conversion to euros of the balances held in foreign currency is performed in two consecutive stages:
Conversion of the foreign currency to the entity’s functional currency (currency of the main
economic environment in which the entity operates); and
Conversion to euros of the balances held in the functional currencies of the entities whose functional
currency is not the euro.
Conversion of the foreign currency to the entity’s functional currency
Transactions denominated in foreign currencies carried out by the consolidated entities (or accounted for
using the equity method) are initially accounted for in their respective currencies. Subsequently, the
monetary balances in foreign currencies are converted to their respective functional currencies using the
exchange rate at the close of the financial year. In addition,
Non-monetary items valued at their historical cost are converted to the functional currency at the
exchange rate applicable on the purchase date.
Non-monetary items valued at their fair value are converted at the exchange rate in force on the date
on which such fair value was determined.
Income and expenses are converted at the period’s average exchange rates for all the operations
carried out during the period. When applying this criterion the BBVA Group considers whether
significant variations have taken place in exchange rates during the year which, owing to their impact
on the statements as a whole, may require the application of exchange rates as of the date of the
transaction instead of such average exchange rates.
P. 37 Translation of the Consolidated Financial Statements originally issued in Spanish and prepared in accordance with EU-IFRSs, as adopted by the European Union (See Note 1 and 56). In the event of a discrepancy, the Spanish language version prevails.
The exchange differences produced when converting the balances in foreign currency to the functional
currency of the consolidated entities are generally recognized under the heading "Exchange differences, net"
in the consolidated income statements (see Note 41). However, the exchange differences in non-monetary
items, measured at fair value, are recognized temporarily in consolidated equity under the heading
“Accumulated other comprehensive income - Items that may be reclassified to profit or loss - Exchange
differences” in the consolidated balance sheets (see Note 30).
Conversion of functional currencies to euros
The balances in the financial statements of consolidated entities whose functional currency is not the euro
are converted to euros as follows:
Assets and liabilities: at the closing spot exchange rates as of the date of each of the consolidated
balance sheets.
Income and expenses and cash flows are converted by applying the exchange rate applicable on the
date of the transaction, and the average exchange rate for the financial year may be used, unless it
has undergone significant variations.
Equity items: at the historical exchange rates.
The exchange differences arising from the conversion to euros of balances in the functional currencies of the
consolidated entities whose functional currency is not the euro are recognized under the heading
“Accumulated other comprehensive income – Items that may be reclassified to profit or loss - Exchange
differences” in the consolidated balance sheets (Notes 30 and 31 respectively). Meanwhile, the differences
arising from the conversion to euros of the financial statements of entities accounted for by the equity
method are recognized under the heading " Accumulated other comprehensive income - Items that may be
reclassified to profit or loss - Entities accounted for using the equity method" (Note 30) until the item to
which they relate is derecognized, at which time they are recognized in the income statement.
The breakdown of the main consolidated balances in foreign currencies, with reference to the most
significant foreign currencies, is set forth in Appendix VII.
Venezuela
Local financial statements of the Group subsidiaries in Venezuela are expressed in Venezuelan Bolivar, and
converted into euros for the consolidated financial statements, as indicated below, since Venezuela is a
country with strong exchange restrictions and has different rates officially published:
Since December 31, 2015, the Board of Directors considers that the use of the Venezuelan official
exchanges rates for converting bolivars into euros in preparing the Consolidated Financial
Statements does not reflect the true picture of the financial statements of the Group and the financial
position of the Group subsidiaries in Venezuela.
Consequently, as of December 31, 2017, 2016 and 2015, the Group has used foreign exchange rates
of 18,181, 1,893 and 469 Venezuelan bolivars per euro, respectively in the conversion of the financial
statements. These exchanges rates have been calculated taking into account the estimated
evolution of inflation in Venezuela, in the absence of published official data (800%, 300%, and
170%, as of December 31, 2017, 2016 and 2015, respectively) (see Note 2.2.20). These inflation rates
have been calculated based on the best estimate of the Group, taking into consideration the available
information that includes sectorial aspects that affect the Group's subsidiaries in Venezuela.
The summarized balance sheet and income statements of the Group subsidiaries in Venezuela as of December 31, 2017, whose local financial statements are expressed in Venezuelan bolivars comparing their conversion to euros with the estimated exchange rate with the balances that would have result by applying the last published exchange rate, are as follows:
P. 38 Translation of the Consolidated Financial Statements originally issued in Spanish and prepared in accordance with EU-IFRSs, as adopted by the European Union (See Note 1 and 56). In the event of a discrepancy, the Spanish language version prevails.
Balance sheet. December 31, 2017 (Millions of euros)
Estimated
exchange rate Official Exchange
rate Variation
Cash and balances with central banks 597 2,287 1,690
Securities portfolio 42 148 107
Loans and receivables 364 1,650 1,285
Tangible assets 60 272 212
Other 28 131 103
TOTAL ASSETS 1,091 4,487 3,397
Deposits from central bank and credit institutions - 1 1
Customer deposits 839 3,772 2,933
Provisions 5 24 18
Other 127 465 338
TOTAL LIABILITIES 971 4,262 3,291
Income statements December 31, 2017 (Millions of euros)
Estimated exchange
rate Official Exchange
rate Variation
NET INTEREST ICOME 90 410 319
GROSS INCOME 70 319 249
Administration costs 55 249 194
NET OPERATING INCOME 15 70 54
OPERATING PROFIT BEFORE TAX 12 53 41
Tax expense or (-) income related to profit or loss from continuing operation 20 90 70
PROFIT (8) (38) (29)
Attributable to minority interest [non-controlling interests] (4) (16) (13)
Attributable to owners of the parent (5) (21) (17)
2.2.17 Recognition of income and expenses
The most significant policies a used by the BBVA Group to recognize its income and expenses are as follows.
Interest income and expenses and similar items:
As a general rule, interest income and expenses and similar items are recognized on the basis of their
period of accrual using the effective interest rate method. The financial fees and commissions that
arise on the arrangement of loans and advances (basically origination and analysis fees) are deferred
and recognized in the income statement over the expected life of the loan. From that amount, the
transaction costs identified as directly attributable to the arrangement of the loans and advances will
be deducted. These fees are part of the effective interest rate for the loans and advances. Also
dividends received from other entities are recognized as income when the consolidated entities’ right
to receive them arises.
Once a debt instrument has been impaired, interest income is recognized applying the effective
interest rate used to discount the estimated recoverable cash flows on the carrying amount of the
asset.
Commissions, fees and similar items:
Income and expenses relating to commissions and similar fees are recognized in the consolidated
income statement using criteria that vary according to the nature of such items. The most significant
items in this connection are:
P. 39 Translation of the Consolidated Financial Statements originally issued in Spanish and prepared in accordance with EU-IFRSs, as adopted by the European Union (See Note 1 and 56). In the event of a discrepancy, the Spanish language version prevails.
• Those relating to financial assets and liabilities measured at fair value through profit or loss,
which are recognized when collected/paid.
• Those arising from transactions or services that are provided over a period of time, which are
recognized over the life of these transactions or services.
• Those relating to a singular transaction, which are recognized when this singular transaction is
carried out.
Non-financial income and expenses:
These are recognized for accounting purposes on an accrual basis.
Deferred collections and payments:
These are recognized for accounting purposes at the amount resulting from discounting the
expected cash flows at market rates.
2.2.18 Sales of assets and income from the provision of non-financial services
The heading “Other operating income” in the consolidated income statements includes the proceeds of the
sales of assets and income from the services provided by the Group entities that are not financial institutions.
In the case of the Group, these entities are mainly real estate and service entities (see Note 42).
2.2.19 Leases
Lease contracts are classified as finance leases from the inception of the transaction if they substantially
transfer all the risks and rewards incidental to ownership of the asset forming the subject-matter of the
contract. Leases other than finance leases are classified as operating leases.
When the consolidated entities act as the lessor of an asset under finance leases, the aggregate present
values of the lease payments receivable from the lessee plus the guaranteed residual value (normally the
exercise price of the lessee’s purchase option on expiration of the lease agreement) are recognized as
financing provided to third parties and, therefore, are included under the heading “Loans and receivables” in
the accompanying consolidated balance sheets (see Note 13).
When the consolidated entities act as lessors of an asset in operating leases, the acquisition cost of the
leased assets is recognized under "Tangible assets – Property, plant and equipment – Other assets leased
out under an operating lease" in the consolidated balance sheets (see Note 17). These assets are depreciated
in line with the criteria adopted for items of tangible assets for own use, while the income arising from the
lease arrangements is recognized in the consolidated income statements on a straight-line basis within
"Other operating expenses" (see Note 42).
If a fair value sale and leaseback results in an operating lease, the profit or loss generated from the sale is
recognized in the consolidated income statement at the time of sale. If such a transaction gives rise to a
finance lease, the corresponding gains or losses are accrued over the lease period.
The assets leased out under operating lease contracts to other entities in the Group are treated in the
Consolidated Financial Statements as for own use, and thus rental expense and income is eliminated in
consolidation and the corresponding depreciation is recognized.
2.2.20 Entities and branches located in countries with hyperinflationary economies
In order to assess whether an economy is under hyperinflation, the country’s economic environment is
evaluated, analyzing whether certain circumstances exist, such as:
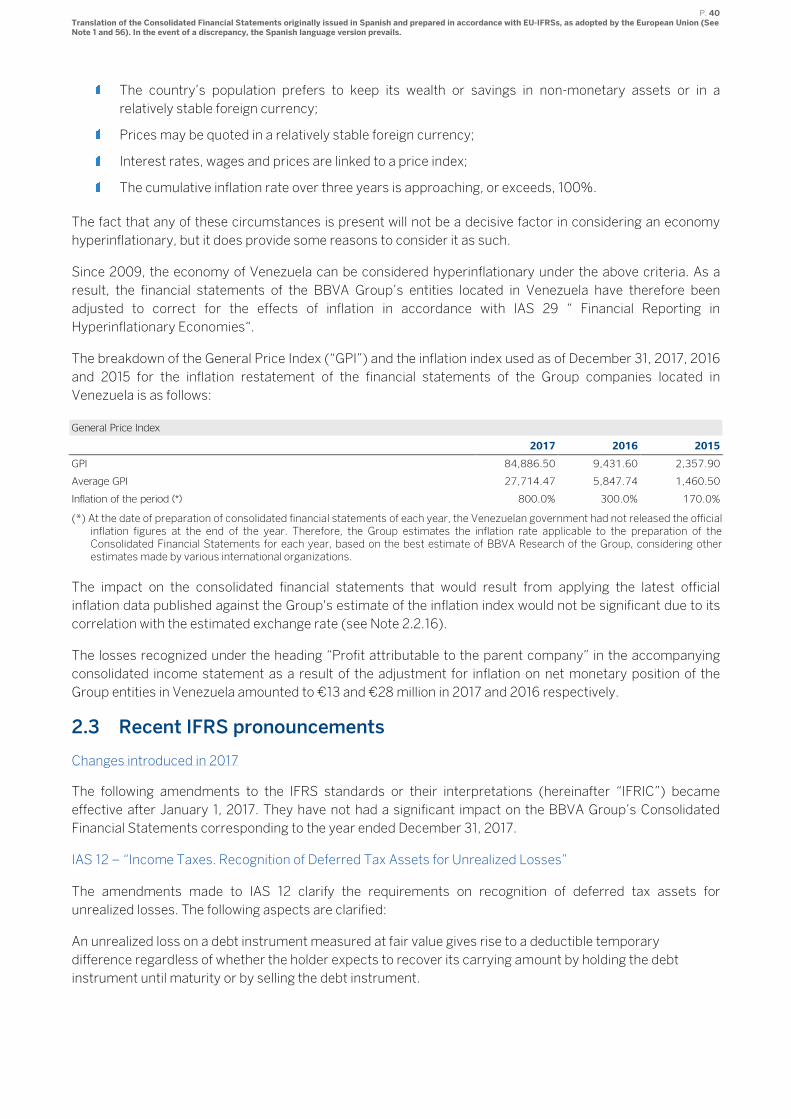
P. 40 Translation of the Consolidated Financial Statements originally issued in Spanish and prepared in accordance with EU-IFRSs, as adopted by the European Union (See Note 1 and 56). In the event of a discrepancy, the Spanish language version prevails.
The country’s population prefers to keep its wealth or savings in non-monetary assets or in a
relatively stable foreign currency;
Prices may be quoted in a relatively stable foreign currency;
Interest rates, wages and prices are linked to a price index;
The cumulative inflation rate over three years is approaching, or exceeds, 100%.
The fact that any of these circumstances is present will not be a decisive factor in considering an economy
hyperinflationary, but it does provide some reasons to consider it as such.
Since 2009, the economy of Venezuela can be considered hyperinflationary under the above criteria. As a
result, the financial statements of the BBVA Group’s entities located in Venezuela have therefore been
adjusted to correct for the effects of inflation in accordance with IAS 29 “ Financial Reporting in
Hyperinflationary Economies“.
The breakdown of the General Price Index (“GPI”) and the inflation index used as of December 31, 2017, 2016
and 2015 for the inflation restatement of the financial statements of the Group companies located in
Venezuela is as follows:
General Price Index
2017 2016 2015
GPI 84,886.50 9,431.60 2,357.90
Average GPI 27,714.47 5,847.74 1,460.50
Inflation of the period (*) 800.0% 300.0% 170.0%
(*) At the date of preparation of consolidated financial statements of each year, the Venezuelan government had not released the official inflation figures at the end of the year. Therefore, the Group estimates the inflation rate applicable to the preparation of the Consolidated Financial Statements for each year, based on the best estimate of BBVA Research of the Group, considering other estimates made by various international organizations.
The impact on the consolidated financial statements that would result from applying the latest official
inflation data published against the Group's estimate of the inflation index would not be significant due to its
correlation with the estimated exchange rate (see Note 2.2.16).
The losses recognized under the heading “Profit attributable to the parent company” in the accompanying
consolidated income statement as a result of the adjustment for inflation on net monetary position of the
Group entities in Venezuela amounted to €13 and €28 million in 2017 and 2016 respectively.
2.3 Recent IFRS pronouncements
Changes introduced in 2017
The following amendments to the IFRS standards or their interpretations (hereinafter “IFRIC”) became
effective after January 1, 2017. They have not had a significant impact on the BBVA Group’s Consolidated
Financial Statements corresponding to the year ended December 31, 2017.
IAS 12 – “Income Taxes. Recognition of Deferred Tax Assets for Unrealized Losses”
The amendments made to IAS 12 clarify the requirements on recognition of deferred tax assets for
unrealized losses. The following aspects are clarified:
An unrealized loss on a debt instrument measured at fair value gives rise to a deductible temporary
difference regardless of whether the holder expects to recover its carrying amount by holding the debt
instrument until maturity or by selling the debt instrument.
P. 41 Translation of the Consolidated Financial Statements originally issued in Spanish and prepared in accordance with EU-IFRSs, as adopted by the European Union (See Note 1 and 56). In the event of a discrepancy, the Spanish language version prevails.
An entity assesses the utilization of deductible temporary differences in combination with other deductible
temporary differences. In circumstances in which tax laws restricts the utilization of tax losses, an entity
would assess a deferred tax asset in combination with other deferred tax assets of the appropriate type.
An entity’s estimate of future taxable profit can include the recovery of its assets for amounts more than
their carrying amounts if there is sufficient evidence to conclude that it is probable that the entity will achieve
this.
An entity’s estimate of future taxable profit excludes tax deductions resulting from the reversal of deductible
temporary difference.
IAS 7 – “Statement of Cash Flows. Disclosure Initiative”
The amendments to IAS 7 introduce the following new disclosure requirements related to changes in
liabilities arising from financing activities, to enable users of financial statements to evaluate changes in those
liabilities: changes from financing cash flows; changes arising from obtaining or losing control of subsidiaries
or other businesses; the effect of changes in foreign exchange rates; changes in fair values; and other
changes.
Liabilities arising from financing activities are liabilities for which cash flows were, or future cash flows will be,
classified in the statement of cash flows as cash flows arising from financing activities. Additionally, the
disclosure requirements also apply to changes in financial assets if cash flows from those financial assets
were, or future cash flows will be, included in cash flows from financing activities.
Annual improvements cycle to IFRSs 2014-2016 – Minor amendments to IFRS 12
The annual improvements cycle to IFRSs 2014-2016 includes minor changes and clarifications to IFRS 12 –
Disclosure of Interests in Other Entities. The European Union has not yet approved the adoption of the
amendments.
Standards and interpretations issued but not yet effective as of December 31, 2017
New International Financial Reporting Standards together with their interpretations had been published at
the date of preparation of the accompanying Consolidated Financial Statements, but are not obligatory as of
June 30, 2017. Although in some cases the IASB permits early adoption before they come into force, the
BBVA Group has not done such application in advance. The most relevant are the following:
IFRS 9 - “Financial instruments”
As of July, 24, 2014, IASB issued IFRS 9 which replaces IAS 39 on financial statements from January 2018
onwards and includes new classification and measurement requirements of financial assets and liabilities,
impairment requirements of financial assets and hedge accounting policy (See Note 56).
Since the initial drafts of the standards were published, the Group has been analyzing their implications once
in effect in 2018, both in terms of classification of the portfolios and the valuation models for financial
instruments and, in particular, the models for calculating impairment of financial assets using expected loss
models.
In the fiscal years 2016 and 2017, the Group implemented a project for applying IFRS 9 with the participation
of all the areas affected: finance, risks, technology, business areas, etc., with the involvement of the Group's
senior management.
The Project sets the definition of accounting policies and processes on the implementation of the Standard,
which has implications both on the financial statements and on the Group´s daily operations (initial and
subsequent risk assessment, changes in systems, management metrics, etc.), and also on the models used
for the presentation of financial statements.
P. 42 Translation of the Consolidated Financial Statements originally issued in Spanish and prepared in accordance with EU-IFRSs, as adopted by the European Union (See Note 1 and 56). In the event of a discrepancy, the Spanish language version prevails.
The main requirements of IFRS 9 are:
Classification and measurement of financial instruments
Financial assets
IFRS 9 has a new approach to classification and measurement of financial assets which is a mirror of the
business model used for asset management purposes and its cash flow characteristics.
IFRS 9 contains three main categories for financial assets classification: valued at amortized cost, valued at
fair value with changes in other accumulated comprehensive income, and valued at fair value through profit
or loss. The standard eliminates the existing IAS 39 categories of held-to-maturity investments, loans and
receivables, and available-for-sale financial assets.
The classification of financial instruments as measured at amortized cost or fair value must be carried out on
the basis of: the entity's business model and the assessment of the contractual cash flow, commonly known
as the "solely payments of principle and interest" criterion (hereinafter, the SPPI). The purpose of the SPPI
test is to determine whether in accordance with the contractual characteristics of the instrument its cash
flows only represent the return of the principal and interest, basically understood as consideration for the
time value of money and the debtor's credit risk.
A financial instrument will be classified in the amortized cost portfolio when it is managed with a business
model whose purpose is to maintain the financial assets to receive contractual cash flows, and passes the
SPPI test. They will be classified in the portfolio of financial assets at fair value with changes in other
comprehensive income if they are managed with a business model whose purpose combines collection of
the contractual cash flows and sale of the assets, and meets the SPPI test. They will be classified at fair value
with changes in profit and loss provided that the entity's business model for their management or the
contractual characteristics of its cash flows do not require classification into one of the portfolios described
above.
During 2017, the Group reviewed the existing business models in the geographic areas where it operates to
establish their classification in accordance with IFRS 9, taking into account the special characteristics of the
local structures and organizations, as well as the type of products.
The Group has defined criteria to determine the acceptable frequency and reasons for sales so that the
instrument can remain in the category of held to collect contractual cash flows.
Regardless of the frequency and importance of the sales, some types of sales are not incompatible with the
category of held to collect contractual flows: sales due to reduction in credit quality; sales close to the
maturity of transactions so that variations in market prices will not have a significant effect on the cash flows
of the financial asset; sales in response to a change in regulations or in taxation; sales in response to an
internal restructuring or significant business combination; sales derived from the execution of a liquidity
crisis plan when the crisis event is not reasonably foreseeable.
The Group has segmented the portfolio of instruments for carrying out the SPPI test by differentiating
products with standard contracts (all the instruments have identical contractual characteristics and are
broadly used), for which the Group has carried out the SPPI test by reviewing the standard framework
contract. Those products with similar characteristics, but not identical, compliance has been assessed
through a sampling exercise of contracts. Finally, all the financial instruments with specific contractual
characteristics have been analyzed individually.
As a result of the analyses carried out on both the business model and the contractual characteristics,
certain accounting reclassifications are expected affecting both financial assets and, as the case may be,
financial liabilities related to those assets. In general, there will be a greater volume of assets valued at fair
value with changes in the income statement and the valuation method of some instruments will also be
P. 43 Translation of the Consolidated Financial Statements originally issued in Spanish and prepared in accordance with EU-IFRSs, as adopted by the European Union (See Note 1 and 56). In the event of a discrepancy, the Spanish language version prevails.
changed according to the one that best reflects the business model to which they belong. Changes in the
valuation model in order not to exceed the criterion of payment of principal and interest are not significant
As of December 31, 2017, the Group had certain investments in asset instruments classified as available-for-
sale which, in accordance with IFRS 9, starting in 2018 the Group will designate these investments as
financial assets at fair value through changes in accumulated other comprehensive income. As a result, all
the gains and losses at fair value of these instruments will be reported in other cumulative comprehensive
income. Impairment losses will not be recognized to profit and loss, and gains or losses will not be
reclassified to the income statement in the case of divestment. The remaining investments held by the Group
as of December 31, 2017 in equity instruments classified as available-for-sale will be accounted at fair value
through changes in profit or loss.
Financial liabilities
IFRS 9 largely maintains the requirements under IAS 39 for classifying financial liabilities. Thus, save for the
above mentioned changes derived from the business model allocation of assets associated to them, the
classification of financial liabilities in accordance with IAS 39 will not be changed. However, a new aspect
introduced by IFRS 9 is the recognition of changes in the fair value of the financial liabilities to which the fair
value option is applied. In this case, the changes in the fair value attributable the credit risk itself should be
recognized as other comprehensive income, while the rest of the variation will be recognized in the income
statement. In any case, the variation of credit risk itself may be recognized in the income statement if the
treatment described above generates some accounting asymmetry.
Financial assets impairments
IFRS 9 replaces the "incurred loss" model in IAS 39 with one of "expected credit loss". The new impairment
model will be applied to financial assets valued at amortized cost; to financial assets valued at fair value with
changes in accumulated other comprehensive income, except for investments in equity instruments; and
contracts for financial guarantees and loan commitments.
The new standard classifies financial instruments into three categories, which depend on the evolution of
their credit risk from the moment of initial recognition. The first category includes the operations when they
are initially recognized; the second comprises the operations for which a significant increase in credit risk has
been identified since its initial recognition and the third one, the impaired operations.
The calculation of the hedges for credit risk in each of these three categories must be done differently. In this
way, the expected loss to 12 months for the operations classified in the first of the aforementioned categories
must be recorded, while the losses estimated for the remaining expected life of the operations classified in
the other two categories must be recorded. Thus, IFRS 9 differentiates between the following concepts of
expected loss:
• Expected loss at 12 months: expected credit loss that arises from possible default events within the
12 months following the presentation date of the financial statements; and
• Expected loss during the life of the transaction: this is the expected credit loss that arises from all the
possible default events over the expected life of the financial instrument.
All this will require considerable judgment, both in the modeling for the estimation of the expected losses and
in the forecasts, on how the economic factors affect such losses, which must be carried out on a weighted
probability basis.
For the purposes of the implementation of IFRS 9 project, the BBVA Group has applied the following
definitions:
P. 44 Translation of the Consolidated Financial Statements originally issued in Spanish and prepared in accordance with EU-IFRSs, as adopted by the European Union (See Note 1 and 56). In the event of a discrepancy, the Spanish language version prevails.
Default
BBVA has applied a definition of default for financial instruments that is consistent with that used in
internal credit risk management, as well as the indicators under applicable regulation at the date of
entry into force of IFRS 9. Both qualitative and quantitative indicators have been considered.
The Group has considered there is a default when one of the following situations occurs:
• payment past-due for more than 90 days; or
• there are reasonable doubts regarding the full reimbursement of the instrument.
The 90-day past-due stipulation may be waived in cases where the entity considers it appropriate,
based on reasonable and documented information that it is appropriate to use a longer term.
Credit impaired asset
An asset is credit-impaired according to IFRS 9 if one or more events have occurred and they have a
detrimental impact on the estimated future cash flows of the asset. Evidence that a financial asset is
credit-impaired includes observable data about the following events:
• Significant financial difficulty of the issuer or the borrower.
• A breach of contract (e.g. a default or past due event).
• A lender having granted a concession to the borrower – for economic or contractual reasons relating to the borrower’s financial difficulty – that the lender would not otherwise consider.
• It becoming probable that the borrower will enter bankruptcy or other financial reorganization.
• The disappearance of an active market for that financial asset because of financial difficulties.
• The purchase or origination of a financial asset at a deep discount that reflects the incurred credit losses.
It may not be possible to identify a single discrete event. Instead, the combined effect of several events
may cause financial assets to become credit-impaired.
The definition of impaired financial assets in the Group is aligned with the definition of default explained
in the above paragraphs.
Significant increase in credit risk
The objective of the impairment requirements is to recognize lifetime expected credit losses for
financial instruments for which there has been significant increases in credit risk since initial
recognition considering all reasonable and supportable information, including that which is forward-
looking.
The model developed by the Group for assessing the significant increase in credit risk has a twin
approach that is applied globally, although the specific characteristics of each geographic area are
respected:
• Quantitative criterion: the Group uses a quantitative analysis based on comparing the current
expected probability of default over the life of the transaction with the original adjusted expected
probability of default, so that both values are comparable in terms of expected default probability
for their residual life. The thresholds used for considering a significant increase in risk take into
account special cases according to geographic areas and portfolios. Depending on how old
current operations are, at the time of entry into force of the standard, some simplification will be
P. 45 Translation of the Consolidated Financial Statements originally issued in Spanish and prepared in accordance with EU-IFRSs, as adopted by the European Union (See Note 1 and 56). In the event of a discrepancy, the Spanish language version prevails.
made to compare the probabilities of default between the current and the original moment, based
on the best information available at that moment.
• Qualitative criterion: most indicators for detecting significant risk increase are included in the
Group's systems through rating/scoring systems or macroeconomic scenarios, so quantitative
analysis covers the majority of circumstances. The Group plans to use additional qualitative
criteria when it considers it necessary to include circumstances that are not reflected in the
rating/score systems or macroeconomic scenarios used.
Additionally, the instruments in which one of the following circumstances occurs are considered
Stage 2:
o More than 30 days past due. Default of more than 30 days is a presumption that can be
refuted in those cases in which the entity considers, based on reasonable and documented
information, that such non-payment does not represent a significant increase in risk
o They are subject to special watch by the Risks units because they show negative signs in
their credit quality, even though there may be no objective evidence of impairment
o Refinance or restructuring that does not show evidence of impairment
Although the standard introduces a series of operational simplifications or practical solutions for analyzing
the increase in significant risk, the Group does not expect to use them as a general rule. However, for high-
quality assets, mainly related to certain government institutions and bodies, the standard allows for
considering directly that their credit risk has not increased significantly because they have a low credit risk at
the presentation date.
Thus the classification of financial instruments subject to impairment under the new IFRS 9 will be as follows:
• Stage 1– without significant increase in credit risk
Financial assets which are not considered to have significantly increased in credit risk have loss
allowances measured at an amount equal to 12 months expected credit losses.
• Stage 2– significantly increased in credit risk
When the credit risk of a financial asset has increased significantly since the initial recognition, the
value correction for losses of that financial instrument will be calculated as the expected credit loss
during the entire life of the asset.
• Stage 3 - Impaired
When there is objective evidence that the loan is credit impaired, the financial asset is transferred to
this category in which value correction for losses of that financial instrument will be calculated as the
expected credit loss during the entire life of the asset.
Based on the impairment methodology described below, the Group has estimated that the application of the
impairment requirements under IFRS 9 as of January 1, 2018 will give rise to additional impairment losses.
Method for calculating expected loss
In accordance with IFRS 9, the measurement of expected losses must reflect:
A considered and unbiased amount, determined by evaluating a range of possible results.
The time value of money.
Reasonable and supportable information that is available without undue cost or effort and that
reflects current conditions and forecasts of future economic conditions.
P. 46 Translation of the Consolidated Financial Statements originally issued in Spanish and prepared in accordance with EU-IFRSs, as adopted by the European Union (See Note 1 and 56). In the event of a discrepancy, the Spanish language version prevails.
The Group plans to measure the expected loss both individually and collectively. The purpose of the Group's
individual measurement is to estimate expected losses for significant impaired risks, or risks classified in
Stage 2. In these cases, the amount of credit losses is calculated as the difference between expected
discounted cash flows at the effective interest rate of the transaction and the carrying amount of the
instrument.
For the collective measurement of expected losses the instruments are grouped into groups of assets based
on their risk characteristics. Exposure within each group is segmented according to the common credit risk
characteristics, similar characteristics of the credit risk, indicative of the payment capacity of the borrower in
accordance with their contractual conditions. These risk characteristics will have to be relevant in estimating
the future flows of each group. The characteristics of credit risk may consider, among others, the following
factors:
Type of operation.
Rating or scoring tools.
Credit risk score or rating.
Type of collateral.
Amount of time at default for stage 3.
Segment.
Qualitative criteria which can have a significant increase in risk.
Collateral value if it has an impact on the probability of a default event.
The estimated losses are derived from the following parameters:
PD: estimate of the probability of default in each period
EAD: estimate of the exposure in case of default at each future period, taking into account the
changes in exposure after the presentation date of the financial statements.
LGD: estimate of the loss in case of default, calculated as the difference between the contractual
cash flows and receivables, including guarantees.
In the case of debt securities, the Group supervises the changes in credit risk through monitoring the
external published credit ratings.
To determine whether there is a significant increase in credit risk as of January 1, 2018 that is not reflected in
the published ratings, the Group has also revised the changes in bond yields, and when they are available, the
prices of CDS, together with the news and regulatory information available on the issuers.
Use of present, past and future information
IFRS 9 requires incorporation of present, past and future information to detect any significant increase in risk
and measure expected loss.
The standard does not require identification of all possible scenarios for measuring expected loss. However,
the probability of a loss event occurring and the probability it will not occur will also have to be considered,
even though the possibility of a loss may be very small. Also, when there is no linear relation between the
different future economic scenarios and their associated expected losses, more than one future economic
scenario must be used for the measurement.
The approach used by the Group consists of using first the most probable scenario (baseline scenario)
consistent with that used in the Group's internal management processes, and then applying an additional
P. 47 Translation of the Consolidated Financial Statements originally issued in Spanish and prepared in accordance with EU-IFRSs, as adopted by the European Union (See Note 1 and 56). In the event of a discrepancy, the Spanish language version prevails.
adjustment, calculated by considering the weighted average of expected losses in other economic scenarios
(one more positive and the other more negative).
Hedge accounting
IFRS 9 will also affect hedge accounting, because the focus of the Standard is different from that of the
current IAS 39, as it tries to align the accounting requirements with economic risk management. IFRS 9 will
also permit to apply hedge accounting to a wider range of risks and hedging instruments. The Standard does
not address the accounting for macro hedging strategies. To avoid any conflict between the current macro
hedge accounting and the new general hedge accounting requirements, IFRS 9 includes an accounting policy
choice to continue applying hedge accounting according to IAS 39.
Macro-hedges accounting is being developed as a separate project. The companies have the option to
continue applying the hedge accounting as established by IAS39 until the project is completed. According to
the analysis carried out, the Group will continue applying IAS 39 to its hedge accounting to the
implementation date of IFRS 9.
Estimated impact of adopting IFRS 9
The Group has assessed the estimated impact on its consolidated financial statements of the initial
application of IFRS 9. The estimated impact of adopting this standard on the Group's capital as of January 1,
2018 is based on the assessments made to date. It is summed up below. The final impacts of adopting the
standards as of January 1, 2018 may change because:
• the Group has not concluded the tests or the evaluation of the controls of its new IT systems; and
• the new accounting policies,methodologies and parameters may be subject to changes until the
Group presents its financial statements that include the final impact as of the date of initial
application.
As of the date of preparing these Annual Accounts, the estimated impact on the CET1 fully-loaded ratio
would be a reduction of approximately 31 basis points and the average estimated impact on the volume of
provisions would be an increase of approximately 10% on the current level of provisions. This increase in
provisions is mainly due to non-impaired risks that would be classified within Stage 2, which are the risks
most affected by the change in the calculation methodology of provisions. By geographies, the increase in
provisions is centered in Spain and Mexico. Finally, based on the analysis carried out to date, the impact on
consolidated equity as a result of changes in classification and valuation of financial instruments is not
expected to be significant.
However, the European Parliament and Commission have established a mechanism for applying IFRS 9 on
capital ratios, transitional and of voluntary application by the entities. It is the intention of the Group to
adhere to that provision.
Amended IFRS 7 - “Financial instruments: Disclosures”
The IASB modified IFRS 7 in December 2011 to include new disclosures on financial instruments that entities
will have to provide as soon as they apply IFRS 9 for the first time.
IFRS 15 - “Revenue from contracts with customers”
IFRS 15 contains the principles that an entity shall apply to account for revenue and cash flows arising from a
contract with a customer.
The core principle of IFRS 15 is that a company should recognize revenue to depict the transfer of promised
goods or services to the customer in an amount that reflects the consideration to which the company
expects to be entitled in exchange for those goods or services, in accordance with contractual agreements. It
is considered that the good or service is transferred when the customer obtains control over it.
P. 48 Translation of the Consolidated Financial Statements originally issued in Spanish and prepared in accordance with EU-IFRSs, as adopted by the European Union (See Note 1 and 56). In the event of a discrepancy, the Spanish language version prevails.
The new Standard replaces IAS 18 - Revenue IAS 11 - Construction Contracts, IFRIC 13 - Customer Loyalty
Programmes, IFRIC 15 - Agreements for the Construction of Real Estate, IFRIC 18 - Transfers of Assets from
Customers and SIC 31 – Revenue-Transactions Involving Advertising Services.
This Standard will be applied to the accounting years starting on or after January 1, 2018, although early
adoption is permitted. It does not have a significant impact on the Consolidated Financial Statements.
IFRS 15 – “Clarifications to IFRS 15 Revenue from Contracts with Customers”
The amendments to the Revenue Standard clarify how some of the underlying principles of the new Standard should be applied. Specifically, they clarify how to:
Identify a performance obligation (the promise to transfer a good or a service to a customer) in a
contract.
Determine whether a company is a principal (the provider of a good or service) or an agent
(responsible for arranging for the good or service to be provided) and
Determine whether the revenue from granting a license should be recognized at a point in time or
over time.
In addition to the clarifications, the amendments include two additional reliefs to reduce cost and complexity for a company when it first applies the new Standard.
The amendments will be applied at the same time as the IFRS 15, i.e. to the accounting periods beginning on or after January 1, 2018, although early application is permitted. It does not have a significant impact on the Consolidated Financial Statements.
Amended IFRS 10 – “Consolidated Financial Statements” and Amended IAS 28 - “Investments in Associates and Joint Ventures”
The amendments to IFRS 10 and IAS 28 establish that when an entity sells or transfers assets are considered
a business (including its consolidated subsidiaries) to an associate or joint venture of the entity, the latter will
have to recognize any gains or losses derived from such transaction in its entirety. Notwithstanding, if the
assets sold or transferred are not considered a business, the entity will have to recognize the gains or losses
derived only to the extent of the interests in the associate or joint venture with unrelated investors.
These changes will be applicable to accounting periods beginning on the effective date, still to be determined,
although early adoption is allowed.
IFRS 16 – “Leases”
On January 13, 2016 the IASB issued the IFRS 16 which will replace IAS 17. The new standard introduces a
single lessee accounting model and will require a lessee to recognize assets and liabilities for all leases with a
term of more than 12 months, unless the underlying asset is of low value. A lessee will be required to
recognize a right-of–use asset representing its right to use the underlying leased asset and a lease liability
representing its obligation to make lease payments.
With regard to lessor accounting, IFRS 16 substantially carries forward the lessor accounting requirements in
IAS 17. Accordingly, a lessor will continue to classify its leases as operating leases or finance leases, and
account for those two types of leases differently.
The standard will be applied to the accounting years starting on or after January 1, 2019, although early
application is permitted if IFRS 15 is also applied.
P. 49 Translation of the Consolidated Financial Statements originally issued in Spanish and prepared in accordance with EU-IFRSs, as adopted by the European Union (See Note 1 and 56). In the event of a discrepancy, the Spanish language version prevails.
IFRS 2 – “Classification and Measurement of Share-based Payment Transactions”
The amendments made to IFRS 2 provide requirements on three different aspects:
When measuring the fair value of a cash-settled share-based payment vesting conditions, other than
market conditions, the conditions for the irrevocability shall be taken into account by adjusting the
number of awards included in the measurement of the liability arising from the transaction.
A transaction in which an entity settles a share-base payment arrangement net by withholding a
specified portion of the equity instruments to meet a statutory tax withholding obligation will be
classified as equity settled in its entirety if, without the net settlement feature, the entire share-based
payment would otherwise be classified as equity-settled.
In case of modification of a share-based payment from cash-settled to equity-settled, the
modification will be accounted for derecognizing the original liability and recognizing in equity the fair
value of the equity instruments granted to the extent that services have been rendered up to the
modification date; any difference will be recognized immediately in profit or loss.
These amendments will be applied to the accounting periods beginning on or after January 1, 2018, although
early application is permitted. It does not have a significant impact on the Consolidated Financial Statements.
Amended IFRS 4 “Insurance Contracts”
The amendments made to IFRS 4 address the temporary accounting consequences of the different effective
dates of IFRS 9 and the forthcoming insurance contracts Standard, by introducing two optional solutions:
The deferral approach or temporary exemption, that gives entities whose predominant activities are
connected with insurance the option to defer the application of IFRS 9 and continue applying IAS 39 until
2021.
The overlay approach, that gives all issuers of insurance contracts the option to recognize in other
comprehensive income, rather than profit or loss, the additional accounting volatility that may arise from
applying IFRS 9 compared to applying IAS 39 before applying the forthcoming insurance contracts Standard.
These modifications will be applied to the accounting periods beginning on or after January 1, 2018, although
early application is permitted. It does not have a significant impact on the Consolidated Financial Statements.
Annual improvements cycle to IFRSs 2014-2016 – Minor amendments to IFRS 1 and IAS 28
The annual improvements cycle to IFRSs 2014-2016 includes minor changes and clarifications to IFRS 1-
Frist-time Adoption of International Financial Reporting Standards and IAS 28 – Investments in Associates
and Joint Ventures, which will be applied to the accounting periods beginning on or after January 1, 2018,
although early application is permitted to amendments to IAS 28. It does not have a significant impact on the
Consolidated Financial Statements.
IFRIC 22- Foreign Currency Transactions and Advance Consideration
The Interpretation addresses how to determine the date of the transaction, and thus, the exchange rate to
use to translate the related asset, expense or income on initial recognition, in circumstances in which a non-
monetary prepayment asset or a non-monetary deferred income liability arising from the payment or receipt
of advance consideration is recognized in advance of the related asset, income or expense. It requires that
the date of the transaction will be the date on which an entity initially recognizes the non-monetary asset or
non-monetary liability.
If there are multiple payments or receipts in advance, the entity shall determine a date of the transaction for
each payment or receipt of advance consideration.
P. 50 Translation of the Consolidated Financial Statements originally issued in Spanish and prepared in accordance with EU-IFRSs, as adopted by the European Union (See Note 1 and 56). In the event of a discrepancy, the Spanish language version prevails.
The interpretation will be applied to the accounting periods beginning on or after January 1, 2018, although
early application is permitted. It does not have a significant impact on the Consolidated Financial Statements.
Amended IAS 40 – Investment Property
The amendment states that an entity shall transfer a property to, or from, investment property when, and
only when, there is evidence of a change in use. A change in use occurs when the property meets, or ceases
to meet, the definition of investment property.
The amendments will be applied to the accounting periods beginning on or after January 1, 2018, although
early adoption is allowed. It does not have a significant impact on the Consolidated Financial Statements.
IFRS 17 – Insurance Contracts
IFRS 17 establishes the principles for the accounting for insurance contracts and supersedes IFRS 4. The
new standard introduces a single accounting model for all insurance contracts and requires the entities to
use updated assumptions.
An entity shall divide the contracts into groups and recognize and measure groups of insurance contracts at
the total of:
the fulfilment cash flows, that comprises the estimate of future cash flows, an adjustment to reflect the time
value of money and the financial risk associated with the future cash flows and a risk adjustment for non-
financial risk; and
the contractual service margin that represents the unearned profit.
The amounts recognized in the consolidate income statement shall be disaggregated into insurance revenue,
insurance service expenses and insurance finance income or expenses. Insurance revenue and insurance
service expenses shall exclude any investment components. Insurance revenue shall be recognized over the
period the entity provides insurance coverage and in proportion to the value of the provision of coverage that
the insurer provides in the period.
The new Standard will be applied to the accounting periods beginning on or after January 1, 2021, although
early adoption is allowed.
IFRIC 23– Uncertainty over Income Tax Treatments
IFRIC 23 provides guidance on how to apply the recognition and measurement requirements in IAS 12 when
there is uncertainty over income tax treatments.
If the entity considers that it is probable that the taxation authority will accept an uncertain tax treatment, the
Interpretation requires the entity to determine taxable profit (tax loss), tax bases, unused tax losses, unused
tax credits or tax rates consistently with the tax treatment used or planned to be used in its income tax
filings.
If the entity considers that it is not probable that the taxation authority will accept an uncertain tax treatment,
the Interpretation requires the entity to use the most likely amount or the expected value (sum of the
probability. weighted amounts in a range of possible outcomes) in determining taxable profit (tax loss), tax
bases, unused tax losses, unused tax credits and tax rates. The method used should be the method that the
entity expects to provide the better prediction of the resolution of the uncertainty.
The interpretation will be applied to the accounting periods beginning on or after January 1, 2019, although
early application is permitted.

P. 51 Translation of the Consolidated Financial Statements originally issued in Spanish and prepared in accordance with EU-IFRSs, as adopted by the European Union (See Note 1 and 56). In the event of a discrepancy, the Spanish language version prevails.
Amended IFRS 9 – Prepayment Features with Negative Compensation
The amendments to IFRS 9 allow companies to measure particular prepayable financial assets with negative
compensation at amortized cost or at fair value through other comprehensive income if a specified condition
is met, instead of at fair value through profit or loss. The condition is that the financial asset would otherwise
meet the criteria of having contractual cash flows that are solely payments of principal and interest but do
not meet that condition only as a result of that prepayment feature.
The amendments will be applied to the accounting periods beginning on or after January 1, 2019, although
early application is permitted.
Amended IAS 28 – Long-term Interests in Associates and Joint Ventures
The amendments to IAS 28 clarify that an entity is required to apply IFRS 9 to long term interests in an
associate or joint venture that, in substance, form part of the net investment in the associate or joint venture
but to which the equity method is not applied.
The amendments will be applied to the accounting periods beginning on or after January 1, 2019, although
early application is permitted.
Annual improvements cycle to IFRSs 2015-2017
The annual improvements cycle to IFRSs 2015-2017 includes minor changes and clarifications to IFRS 3-
Business Combinations, IFRS 11 – Joint Arrangements, IAS 12 – Income Taxes and IAS 23 – Borrowing
Costs, which will be applied to the accounting periods beginning on or after January 1, 2019, although early
application is permitted.
3. BBVA Group
The BBVA Group is an international diversified financial group with a significant presence in retail banking,
wholesale banking, asset management and private banking. The Group also operates in other sectors such
as insurance, real estate, operational leasing, etc.
Appendices I and II provide relevant information as of December 31, 2017 on the Group’s subsidiaries,
consolidated structured entities, and investments in associate entities and joint venture entities. Appendix III
shows the main changes in investments for the year ended December 31, 2017, and Appendix IV gives details
of the consolidated subsidiaries which, are more than 10% owned by non-Group shareholders as of
December 31, 2017.
The following table sets forth information related to the Group’s total assets as of December 31, 2017, 2016
and 2015, broken down by the Group’s entities according to their activity:
Contribution to Consolidated Group Total Assets. Entities by Main Activities (Millions of euros)
2017 2016 2015
Banks and other financial services 659,414 699,592 717,981
Insurance and pension fund managing companies 26,134 26,831 25,741
Other non-financial services 4,511 5,433 6,133
Total 690,059 731,856 749,855
The total assets and results of operations broken down by the geographical areas, in which the BBVA Group
operates, are included in Note 6.
The BBVA Group’s activities are mainly located in Spain, Mexico, South America, the United States and
Turkey, with active presence in other countries, as shown below:
P. 52 Translation of the Consolidated Financial Statements originally issued in Spanish and prepared in accordance with EU-IFRSs, as adopted by the European Union (See Note 1 and 56). In the event of a discrepancy, the Spanish language version prevails.
Spain
The Group’s activity in Spain is mainly through Banco Bilbao Vizcaya Argentaria, S.A., which is the
parent company of the BBVA Group. The Group also has other entities that operate in Spain’s
banking sector, insurance sector, real estate sector, services and as operational leasing entities.
Mexico
The BBVA Group operates in Mexico, not only in the banking sector, but also in the insurance sector
through Grupo Financiero Bancomer.
South America
The BBVA Group’s activities in South America are mainly focused on the banking and insurance
sectors, in the following countries: Argentina, Chile, Colombia, Peru, Paraguay, Uruguay and
Venezuela. It has a representative office in Sao Paulo (Brazil).
The Group owns more than 50% of most of the entities based in these countries. Appendix I shows a
list of the entities which, although less than 50% owned by the BBVA Group as of December 31, 2017,
are consolidated (see Note 2.1).
The United States
The Group’s activity in the United States is mainly carried out through a group of entities with BBVA
Compass Bancshares, Inc. at their head, as well as, the New York BBVA branch and a representative
office in Silicon Valley (California).
Turkey
The Group’s activity in Turkey is mainly carried out through the Garanti Group.
Rest of Europe
The Group’s activity in Europe is carried out through banks and financial institutions in Ireland,
Switzerland, Italy, Netherlands, Romania and Portugal, branches in Germany, Belgium, France, Italy
and the United Kingdom, and a representative office in Moscow.
Asia-Pacific
The Group’s activity in this region is carried out through branches (in Taipei, Tokyo, Hong Kong
Singapore and Shanghai) and representative offices (in Beijing, Seoul, Mumbai, Abu Dhabi and
Jakarta).
Main transactions in the Group in 2017
Investments
On February 21, 2017, BBVA Group entered into an agreement for the acquisition from Dogus Holding A.S. and Dogus Arastirma Gelistirme ve Musavirlik Hizmetleri A.S of 41,790,000,000 shares of Turkiye Garanti Bankasi, A.S. (“Garanti Bank”), amounting to 9.95% of the total issued share capital of Garanti Bank. On March 22, 2017, the sale and purchase agreement was completed, and therefore BBVA´s total stake in Garanti Bank as of December 31, 2017 amounts to 49.85% (See Note 31).
Ongoing divestitures
Offer for the acquisition of BBVA’s stake in BBVA Chile
On November 28, 2017, BBVA received a binding offer from The Bank of Nova Scotia group (“Scotiabank”) for the acquisition, at a price of approximately USD 2,200 million of BBVA’s stake in Banco Bilbao Vizcaya Argentaria, Chile (“BBVA Chile”) as well as in other companies of the Group in Chile which operations are
P. 53 Translation of the Consolidated Financial Statements originally issued in Spanish and prepared in accordance with EU-IFRSs, as adopted by the European Union (See Note 1 and 56). In the event of a discrepancy, the Spanish language version prevails.
complementary to the banking business (amongst them, BBVA Seguros Vida, S.A.). BBVA owns, directly and indirectly, approximately 68.19% of BBVA Chile share capital. On December 5, 2017, BBVA accepted the Offer and entered into a sale and purchase agreement. The Offer received does not include BBVA’s stake in the automobile financing companies of Forum group and in other Chilean entities from BBVA’s Group which are engaged in corporate activities of BBVA Group. Completion of the transaction is subject to obtaining the relevant regulatory approvals.
Agreement for the creation of a “joint-venture” and transfer of the real estate business in Spain
On November 29, 2017, BBVA reached an agreement with a subsidiary of Cerberus Capital Management, L.P. (“Cerberus”) for the creation of a “joint venture” to which an important part of the real estate business of BBVA in Spain will be transferred (the “Business”). BBVA will contribute the Business to a single company (the “Company”) and will sell 80% of the shares of such Company to Cerberus at the closing date of the transaction.
The Business comprises: (i) foreclosed real estate assets (the “REOs”), with a gross book value of approximately €13,000 million, taking as starting point the situation of the REOs on June 26, 2017; and (ii) the necessary assets and employees to manage the Business in an autonomous manner. For the purpose of the agreement with Cerberus, the whole Business was valued at approximately €5,000 million.
Considering the valuation of the whole Business previously mentioned and assuming that all the Business’ REOs on June 26, 2017 will be contributed to the Company, the sale price for 80% of the shares would amount to approximately €4,000 million. The price finally paid will be determined by the volume of REOs effectively contributed that may vary depending on, among other matters, the sales carried out from the date of reference 26 June 2017 until the date of closing of the transaction and the fulfilment of the usual conditions in this kind of transactions.
The transaction as a whole is subject to obtaining the relevant authorizations from the competent authorities and it is not expected to have significant impact on the Consolidated Financial Statements when completed.
Main transaction in the Group in 2016
Mergers
The BBVA Group, at its Board of Directors meeting held on March 31, 2016, adopted a resolution to begin a
merger process of BBVA S.A. (absorbing company), Catalunya Banc, S.A., Banco Depositario BBVA, S.A. y
Unoe Bank, S.A.
This transaction was part of the corporate reorganization of its banking subsidiaries in Spain, was
successfully completed throughout 2016 and has no impact in the Consolidated Financial Statements both
from the accounting and the solvency stand points.
Main transactions in the Group in 2015
During 2015, the Group consolidated Garanti from the date of effective control (third quarter) and recorded
the acquisition of Catalunya Banc (second quarter). These effects impact on the period-on-period
comparison of all the income statements was affected with the previous first semester results.
Investments
Acquisition of an additional 14.89% of Garanti
On November 19, 2014, the Group signed a new agreement with Dogus Holding AS, Ferit Faik Sahenk, Dianne
Sahenk and Defne Sahenk (hereinafter "Dogus") to, among other terms, the acquisition of 62,538,000,000
P. 54 Translation of the Consolidated Financial Statements originally issued in Spanish and prepared in accordance with EU-IFRSs, as adopted by the European Union (See Note 1 and 56). In the event of a discrepancy, the Spanish language version prevails.
additional shares of Garanti (equivalent to 14.89% of the capital of this entity) for a maximum total
consideration of 8.90 Turkish lira per batch (Garanti traded in batches of 100 shares each).
In the same agreement it stated that if the payment of dividends for the year 2014 was executed by Dogus
before the closing of the acquisition, that amount would be deducted from the amount payable by BBVA. On
April 27, 2015, Dogus received the amount of the dividend paid to shareholders of Garanti, which amounted
to Turkish Liras 0.135 per batch.
On July 27, 2015, after obtaining all the required regulatory approvals, the Group materialized said
participation increase after the acquisition of the new shares. As of December 31, 2015, the Group's interest
in Garanti was 39.9%.
The total price effectively paid by BBVA amounts to 8,765 TL per batch (amounting to approximately TL
5,481 million and €1,857 million applying a 2.9571 TL/EUR exchange rate).
In accordance with the EU-IFRS accounting rules, and as a consequence of the agreements reached, the
BBVA Group shall, at the date of effective control, measure at fair value its previously acquired stake of
25.01% in Garanti (classified as a joint venture accounted for using the equity method) and shall consolidate
Garanti in the consolidated financial statements of the BBVA Group, beginning on the above-mentioned
effective control date.
Measuring the above-mentioned stake in Garanti Bank at fair value resulted in a negative impact in “Gains or
(-) losses on derecognition of non-financial assets and subsidiaries, net” in the consolidated income
statement of the BBVA Group for the second semester of 2015, which resulted in a net negative impact in the
Profit attributable to owners of the parent of the BBVA Group in 2015 amounting to €1,840 million. Such
accounting impact does not translate into any additional cash outflow from BBVA. Most of this impact was
generated by the exchange rate differences due to the depreciation of the TL against Euro since the initial
acquisition by BBVA of the 25.01% stake in Garanti Bank up to the date of effective control. As of December
31, 2015, these exchange rate differences were already recorded as Other Comprehensive Income reducing
the stock shareholder’s equity of the BBVA Group.
The agreements with the Dogus group included an agreement for the management of the bank and the
appointment by the BBVA Group of the majority of the members of its Board of Directors (7 of 10). Garanti
was consolidated in the BBVA Group, because of these management agreements.
The Group estimated according to the acquisition method, the fair values assigned to the assets acquired
and the liabilities assumed from Garanti, along with the identified intangible assets, and cash payment made
by the BBVA Group in consideration of the transaction was recorded under the heading "Intangible assets -
Goodwill" in the accompanying consolidated balance sheets as of December 31, 2017 (see Note 18.1).
Acquisition of Catalunya Banc
On July 21, 2014, the Management Commission of the Banking Restructuring Fund (known as “FROB”)
accepted BBVA´s bid in the competitive auction for the acquisition of Catalunya Banc, S.A. (“Catalunya
Banc”).
On April 24, 2015, once the necessary authorizations had been obtained and all the agreed conditions
precedent have been fulfilled, BBVA announced that it acquired 1,947,166,809 shares of Catalunya Banc,
S.A. (approximately 98.4% of its share capital) for a price of approximately €1,165 million.
According to the purchase method, the comparison between the fair values assigned to the assets acquired
and the liabilities assumed from Catalunya Banc, and the cash payment made to the FROB in consideration
of the transaction generated a difference of €26 million, which was recorded under the heading “Negative
goodwill recognized in profit or loss” in the accompanying consolidated income statement for the year ended
December 31, 2015. According to the IFRS 3, there is a period, up to a year, to complete the necessary
P. 55 Translation of the Consolidated Financial Statements originally issued in Spanish and prepared in accordance with EU-IFRSs, as adopted by the European Union (See Note 1 and 56). In the event of a discrepancy, the Spanish language version prevails.
adjustments to the calculation of initial acquisition (see Note 18.1). After the deadline, there has not been any
significant adjustment that involves amending the calculation recorded in the year 2015.
Divestitures
Partial sale of China CITIC Bank Corporation Limited (CNCB)
On January 23, 2015 the BBVA Group signed an agreement to sell 4.9% in China CITIC Bank Corporation Limited (CNCB) to UBS AG, London Branch (UBS), who entered into transactions pursuant to which such CNCB shares will be transferred to a third party and the ultimate economic benefit of ownership of such CNCB shares will be transferred to Xinhu Zhongbao Co., Ltd (Xinhu) (the Relevant Transactions). On March 12, 2015, after having obtained the necessary approvals, BBVA completed the sale.
The selling price to UBS is HK$ 5.73 per share, amounting to a total of HK$ 13,136 million, equivalent to approximately €1,555 million (with an exchange rate of EUR/HK$=8.45 as of the date of the closing).
In addition to the above mentioned 4.9%, during the first semester of 2015 various sales were made in the market to total a 6.34% participation sale. The impact of these sales on the consolidated financial statements of the BBVA Group was a gain net of taxes of approximately €705 million. This gain gross of taxes was recognized under "Profit or loss from non-current assets and disposal groups classified as held for sale not qualifying as discontinued operations” in 2015 consolidated financial statements.
Sale of the participation in Citic International Financial Holding (CIFH)
On December 23, 2014, the BBVA Group signed an agreement to sell its participation of 29.68% in Citic
International Financial Holdings Limited (hereinafter “CIFH”), to China CITIC Bank Corporation Limited
(hereinafter “CNCB”). CIFH is a non-listed subsidiary of CNCB domiciled in Hong Kong. The selling price is
HK$8,162 million.
On August 27, 2015, BBVA completed the sale of this participation. The impact on the consolidated financial
statements of the BBVA Group was not significant.
4. Shareholder remuneration system
In accordance with BBVA’s shareholder remuneration policy communicated in October 2013, which established the distribution of an annual pay-out of between 35% and 40% of the profits earned in each year and the progressive reduction of the remuneration via “Dividend Options”, so that the shareholders’ remuneration would ultimately be fully in cash, on February 1, 2017 BBVA announced that it was expected to be proposed for the consideration of the competent governing bodies the approval of a capital increase to be charged to voluntary reserves for the instrumentation of one “Dividend Option” in 2017, being the subsequent shareholders’ remunerations that could be approved fully in cash.
This fully in cash shareholders’ remuneration policy would be composed, for each year, of a distribution on account of the dividend of such year (which is expected to be paid in October) and a final dividend (which would be paid once the year has ended and the profit allocation has been approved, which is expected for April), subject to the applicable authorizations by the competent governing bodies.
Shareholder remuneration scheme “Dividend Option”
During 2012, 2013, 2014, 2015, 2016 and 2017, the Group implemented a shareholder remuneration system referred to as “Dividend Option”.
Under such remuneration scheme, BBVA offered its shareholders the possibility to receive all or part of their remuneration in the form of newly-issued BBVA ordinary shares, whilst maintaining the possibility for BBVA shareholders to receive their entire remuneration in cash by selling the rights of free allocation assigned either to BBVA (in execution of the commitment assumed by BBVA to acquire the rights of free allocation at a guaranteed fixed price) or by selling the rights of free allocation on the market at the prevailing market price at that time. However, the execution of the commitment assumed by BBVA was only available to whoever
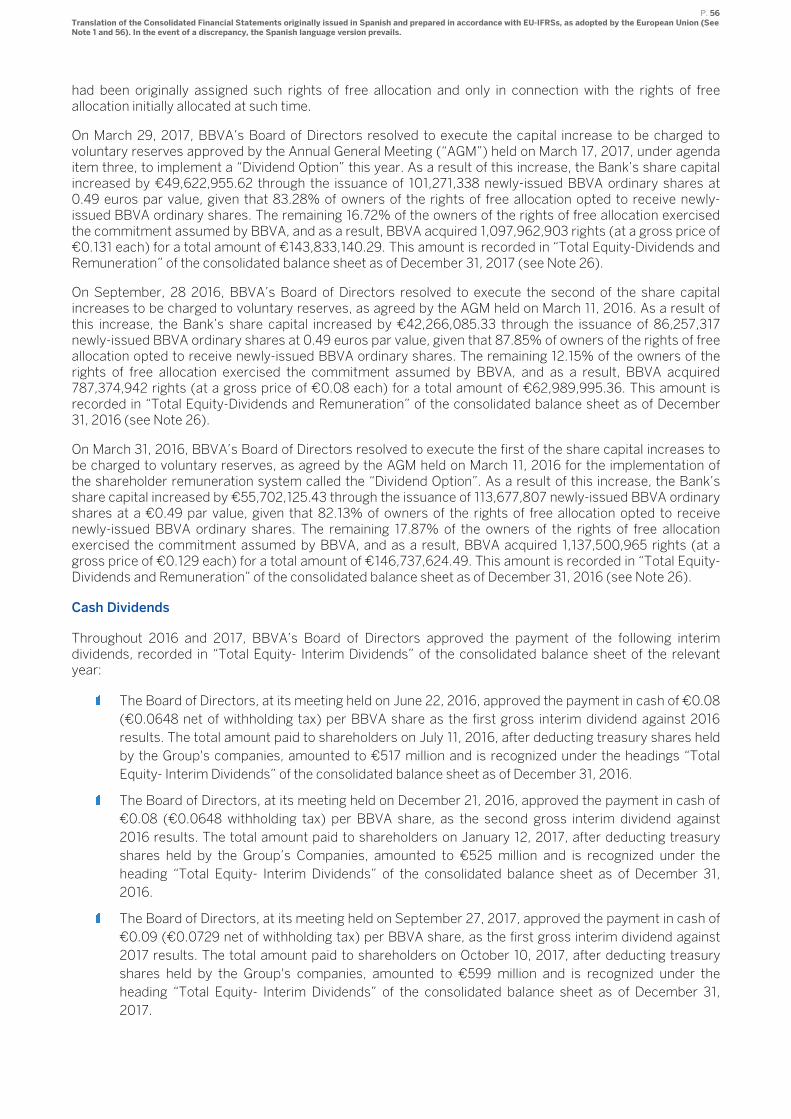
P. 56 Translation of the Consolidated Financial Statements originally issued in Spanish and prepared in accordance with EU-IFRSs, as adopted by the European Union (See Note 1 and 56). In the event of a discrepancy, the Spanish language version prevails.
had been originally assigned such rights of free allocation and only in connection with the rights of free allocation initially allocated at such time.
On March 29, 2017, BBVA’s Board of Directors resolved to execute the capital increase to be charged to voluntary reserves approved by the Annual General Meeting (“AGM”) held on March 17, 2017, under agenda item three, to implement a “Dividend Option” this year. As a result of this increase, the Bank’s share capital increased by €49,622,955.62 through the issuance of 101,271,338 newly-issued BBVA ordinary shares at 0.49 euros par value, given that 83.28% of owners of the rights of free allocation opted to receive newly-issued BBVA ordinary shares. The remaining 16.72% of the owners of the rights of free allocation exercised the commitment assumed by BBVA, and as a result, BBVA acquired 1,097,962,903 rights (at a gross price of €0.131 each) for a total amount of €143,833,140.29. This amount is recorded in “Total Equity-Dividends and Remuneration” of the consolidated balance sheet as of December 31, 2017 (see Note 26).
On September, 28 2016, BBVA’s Board of Directors resolved to execute the second of the share capital increases to be charged to voluntary reserves, as agreed by the AGM held on March 11, 2016. As a result of this increase, the Bank’s share capital increased by €42,266,085.33 through the issuance of 86,257,317 newly-issued BBVA ordinary shares at 0.49 euros par value, given that 87.85% of owners of the rights of free allocation opted to receive newly-issued BBVA ordinary shares. The remaining 12.15% of the owners of the rights of free allocation exercised the commitment assumed by BBVA, and as a result, BBVA acquired 787,374,942 rights (at a gross price of €0.08 each) for a total amount of €62,989,995.36. This amount is recorded in “Total Equity-Dividends and Remuneration” of the consolidated balance sheet as of December 31, 2016 (see Note 26).
On March 31, 2016, BBVA’s Board of Directors resolved to execute the first of the share capital increases to be charged to voluntary reserves, as agreed by the AGM held on March 11, 2016 for the implementation of the shareholder remuneration system called the “Dividend Option”. As a result of this increase, the Bank’s share capital increased by €55,702,125.43 through the issuance of 113,677,807 newly-issued BBVA ordinary shares at a €0.49 par value, given that 82.13% of owners of the rights of free allocation opted to receive newly-issued BBVA ordinary shares. The remaining 17.87% of the owners of the rights of free allocation exercised the commitment assumed by BBVA, and as a result, BBVA acquired 1,137,500,965 rights (at a gross price of €0.129 each) for a total amount of €146,737,624.49. This amount is recorded in “Total Equity-Dividends and Remuneration” of the consolidated balance sheet as of December 31, 2016 (see Note 26).
Cash Dividends
Throughout 2016 and 2017, BBVA’s Board of Directors approved the payment of the following interim dividends, recorded in “Total Equity- Interim Dividends” of the consolidated balance sheet of the relevant year:
The Board of Directors, at its meeting held on June 22, 2016, approved the payment in cash of €0.08
(€0.0648 net of withholding tax) per BBVA share as the first gross interim dividend against 2016
results. The total amount paid to shareholders on July 11, 2016, after deducting treasury shares held
by the Group's companies, amounted to €517 million and is recognized under the headings “Total
Equity- Interim Dividends” of the consolidated balance sheet as of December 31, 2016.
The Board of Directors, at its meeting held on December 21, 2016, approved the payment in cash of
€0.08 (€0.0648 withholding tax) per BBVA share, as the second gross interim dividend against
2016 results. The total amount paid to shareholders on January 12, 2017, after deducting treasury
shares held by the Group’s Companies, amounted to €525 million and is recognized under the
heading “Total Equity- Interim Dividends” of the consolidated balance sheet as of December 31,
2016.
The Board of Directors, at its meeting held on September 27, 2017, approved the payment in cash of
€0.09 (€0.0729 net of withholding tax) per BBVA share, as the first gross interim dividend against
2017 results. The total amount paid to shareholders on October 10, 2017, after deducting treasury
shares held by the Group's companies, amounted to €599 million and is recognized under the
heading “Total Equity- Interim Dividends” of the consolidated balance sheet as of December 31,
2017.
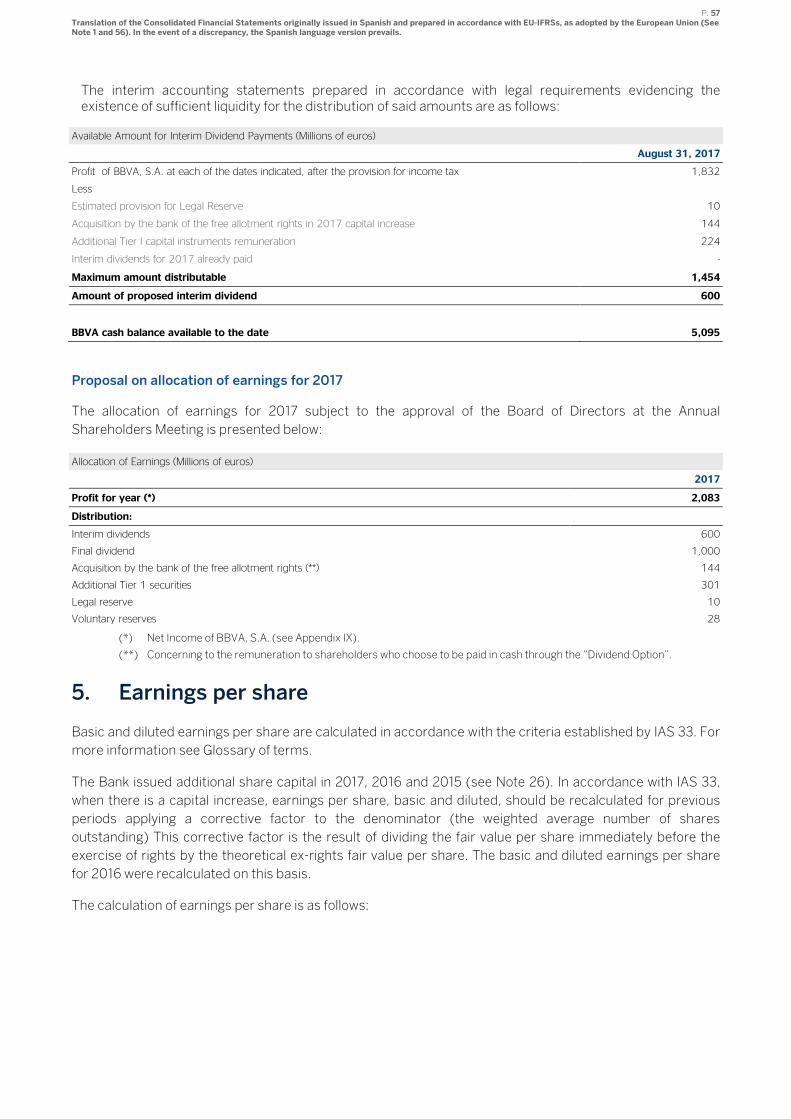
P. 57 Translation of the Consolidated Financial Statements originally issued in Spanish and prepared in accordance with EU-IFRSs, as adopted by the European Union (See Note 1 and 56). In the event of a discrepancy, the Spanish language version prevails.
The interim accounting statements prepared in accordance with legal requirements evidencing the existence of sufficient liquidity for the distribution of said amounts are as follows:
Available Amount for Interim Dividend Payments (Millions of euros)
August 31, 2017
Profit of BBVA, S.A. at each of the dates indicated, after the provision for income tax 1,832
Less
Estimated provision for Legal Reserve 10
Acquisition by the bank of the free allotment rights in 2017 capital increase 144
Additional Tier I capital instruments remuneration 224
Interim dividends for 2017 already paid -
Maximum amount distributable 1,454
Amount of proposed interim dividend 600
BBVA cash balance available to the date 5,095
Proposal on allocation of earnings for 2017
The allocation of earnings for 2017 subject to the approval of the Board of Directors at the Annual
Shareholders Meeting is presented below:
Allocation of Earnings (Millions of euros)
2017
Profit for year (*) 2,083
Distribution:
Interim dividends 600
Final dividend 1,000
Acquisition by the bank of the free allotment rights (**) 144
Additional Tier 1 securities 301
Legal reserve 10
Voluntary reserves 28
(*) Net Income of BBVA, S.A. (see Appendix IX).
(**) Concerning to the remuneration to shareholders who choose to be paid in cash through the “Dividend Option”.
5. Earnings per share
Basic and diluted earnings per share are calculated in accordance with the criteria established by IAS 33. For
more information see Glossary of terms.
The Bank issued additional share capital in 2017, 2016 and 2015 (see Note 26). In accordance with IAS 33,
when there is a capital increase, earnings per share, basic and diluted, should be recalculated for previous
periods applying a corrective factor to the denominator (the weighted average number of shares
outstanding) This corrective factor is the result of dividing the fair value per share immediately before the
exercise of rights by the theoretical ex-rights fair value per share. The basic and diluted earnings per share
for 2016 were recalculated on this basis.
The calculation of earnings per share is as follows:
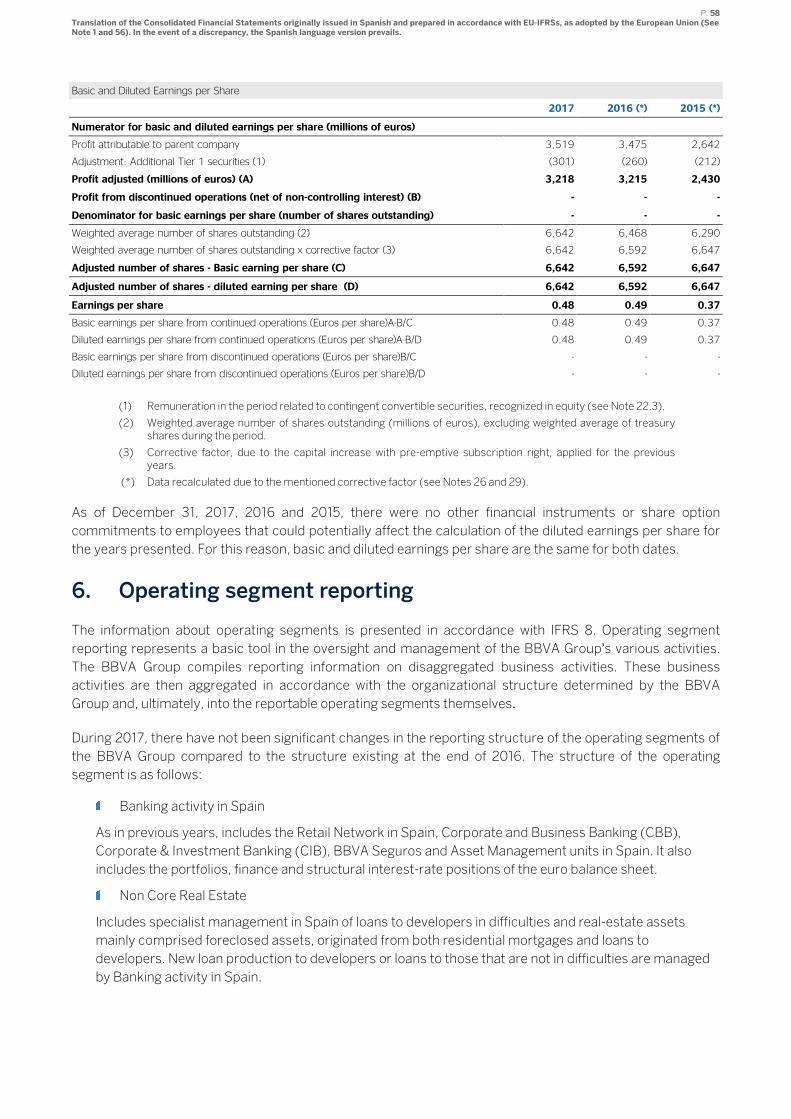
P. 58 Translation of the Consolidated Financial Statements originally issued in Spanish and prepared in accordance with EU-IFRSs, as adopted by the European Union (See Note 1 and 56). In the event of a discrepancy, the Spanish language version prevails.
Basic and Diluted Earnings per Share
2017 2016 (*) 2015 (*)
Numerator for basic and diluted earnings per share (millions of euros)
Profit attributable to parent company 3,519 3,475 2,642
Adjustment: Additional Tier 1 securities (1) (301) (260) (212)
Profit adjusted (millions of euros) (A) 3,218 3,215 2,430
Profit from discontinued operations (net of non-controlling interest) (B) - - -
Denominator for basic earnings per share (number of shares outstanding) - - -
Weighted average number of shares outstanding (2) 6,642 6,468 6,290
Weighted average number of shares outstanding x corrective factor (3) 6,642 6,592 6,647
Adjusted number of shares - Basic earning per share (C) 6,642 6,592 6,647
Adjusted number of shares - diluted earning per share (D) 6,642 6,592 6,647
Earnings per share 0.48 0.49 0.37
Basic earnings per share from continued operations (Euros per share)A-B/C 0.48 0.49 0.37
Diluted earnings per share from continued operations (Euros per share)A-B/D 0.48 0.49 0.37
Basic earnings per share from discontinued operations (Euros per share)B/C - - -
Diluted earnings per share from discontinued operations (Euros per share)B/D - - -
(1) Remuneration in the period related to contingent convertible securities, recognized in equity (see Note 22.3).
(2) Weighted average number of shares outstanding (millions of euros), excluding weighted average of treasury shares during the period.
(3) Corrective factor, due to the capital increase with pre-emptive subscription right, applied for the previous years.
(*) Data recalculated due to the mentioned corrective factor (see Notes 26 and 29).
As of December 31, 2017, 2016 and 2015, there were no other financial instruments or share option
commitments to employees that could potentially affect the calculation of the diluted earnings per share for
the years presented. For this reason, basic and diluted earnings per share are the same for both dates.
6. Operating segment reporting
The information about operating segments is presented in accordance with IFRS 8. Operating segment
reporting represents a basic tool in the oversight and management of the BBVA Group’s various activities.
The BBVA Group compiles reporting information on disaggregated business activities. These business
activities are then aggregated in accordance with the organizational structure determined by the BBVA
Group and, ultimately, into the reportable operating segments themselves.
During 2017, there have not been significant changes in the reporting structure of the operating segments of
the BBVA Group compared to the structure existing at the end of 2016. The structure of the operating
segment is as follows:
Banking activity in Spain
As in previous years, includes the Retail Network in Spain, Corporate and Business Banking (CBB),
Corporate & Investment Banking (CIB), BBVA Seguros and Asset Management units in Spain. It also
includes the portfolios, finance and structural interest-rate positions of the euro balance sheet.
Non Core Real Estate
Includes specialist management in Spain of loans to developers in difficulties and real-estate assets
mainly comprised foreclosed assets, originated from both residential mortgages and loans to
developers. New loan production to developers or loans to those that are not in difficulties are managed
by Banking activity in Spain.
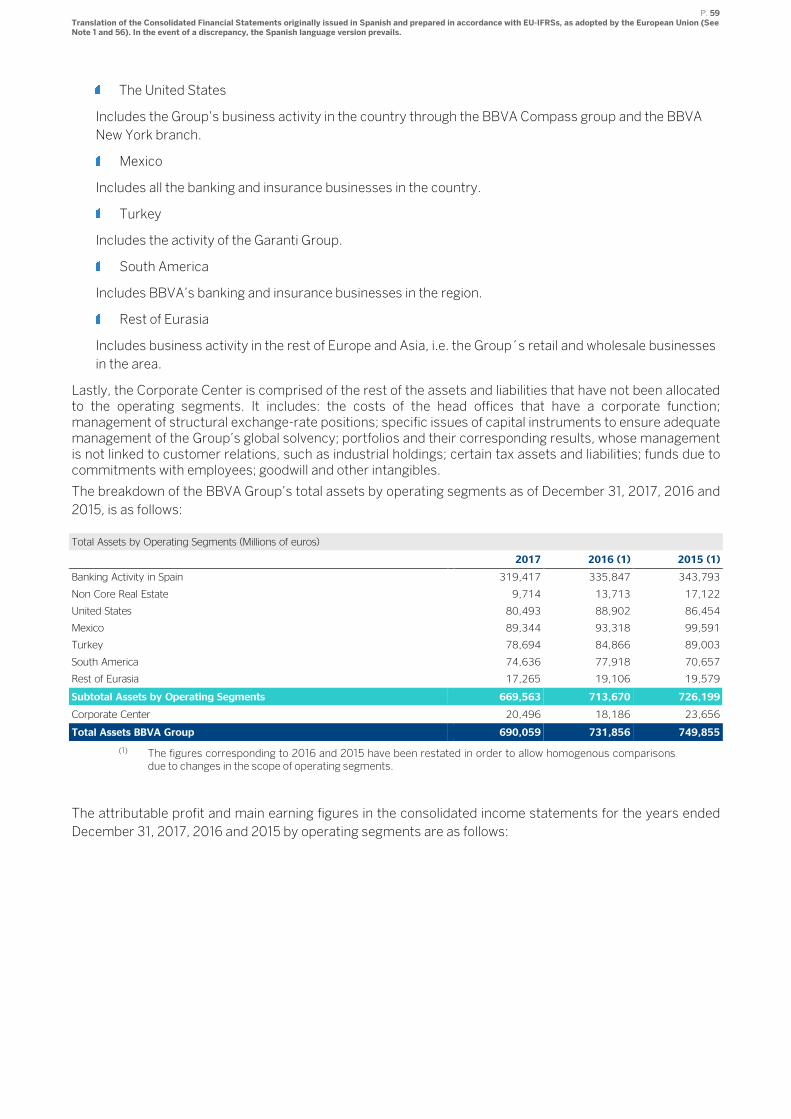
P. 59 Translation of the Consolidated Financial Statements originally issued in Spanish and prepared in accordance with EU-IFRSs, as adopted by the European Union (See Note 1 and 56). In the event of a discrepancy, the Spanish language version prevails.
The United States
Includes the Group’s business activity in the country through the BBVA Compass group and the BBVA
New York branch.
Mexico
Includes all the banking and insurance businesses in the country.
Turkey
Includes the activity of the Garanti Group.
South America
Includes BBVA’s banking and insurance businesses in the region.
Rest of Eurasia
Includes business activity in the rest of Europe and Asia, i.e. the Group´s retail and wholesale businesses
in the area.
Lastly, the Corporate Center is comprised of the rest of the assets and liabilities that have not been allocated to the operating segments. It includes: the costs of the head offices that have a corporate function; management of structural exchange-rate positions; specific issues of capital instruments to ensure adequate management of the Group’s global solvency; portfolios and their corresponding results, whose management is not linked to customer relations, such as industrial holdings; certain tax assets and liabilities; funds due to commitments with employees; goodwill and other intangibles.
The breakdown of the BBVA Group’s total assets by operating segments as of December 31, 2017, 2016 and
2015, is as follows:
Total Assets by Operating Segments (Millions of euros)
2017 2016 (1) 2015 (1)
Banking Activity in Spain 319,417 335,847 343,793
Non Core Real Estate 9,714 13,713 17,122
United States 80,493 88,902 86,454
Mexico 89,344 93,318 99,591
Turkey 78,694 84,866 89,003
South America 74,636 77,918 70,657
Rest of Eurasia 17,265 19,106 19,579
Subtotal Assets by Operating Segments 669,563 713,670 726,199
Corporate Center 20,496 18,186 23,656
Total Assets BBVA Group 690,059 731,856 749,855
(1) The figures corresponding to 2016 and 2015 have been restated in order to allow homogenous comparisons due to changes in the scope of operating segments.
The attributable profit and main earning figures in the consolidated income statements for the years ended
December 31, 2017, 2016 and 2015 by operating segments are as follows:
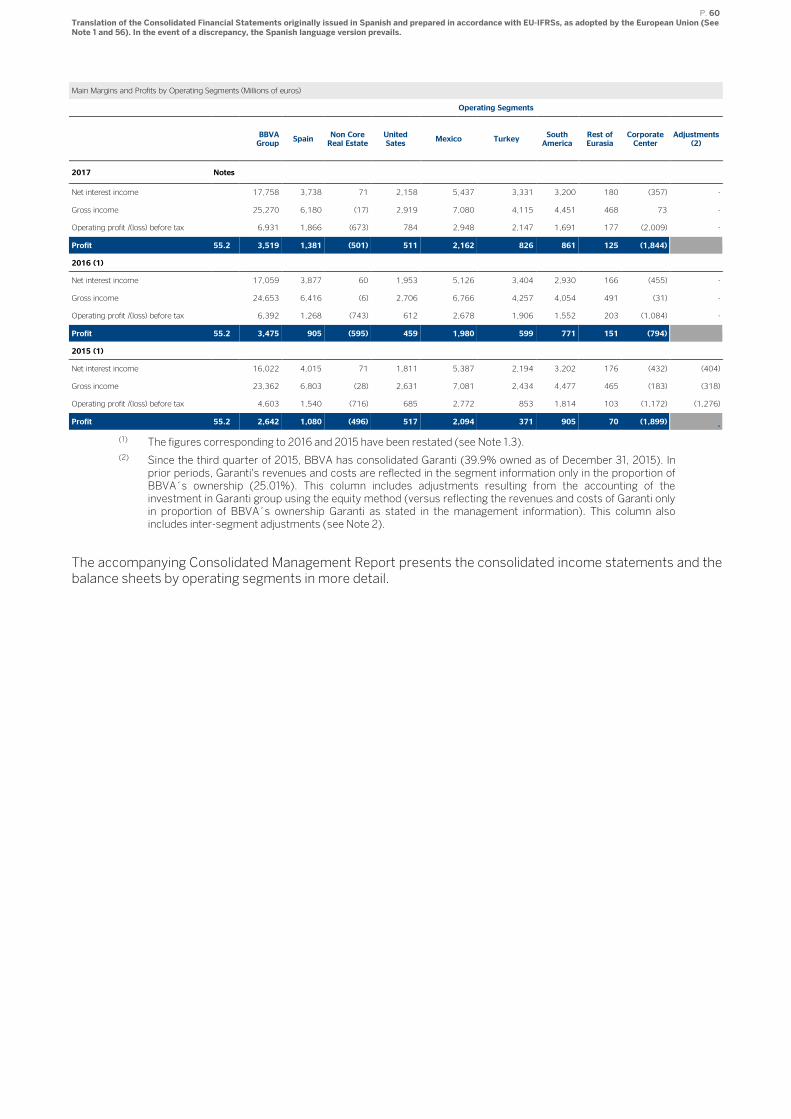
P. 60 Translation of the Consolidated Financial Statements originally issued in Spanish and prepared in accordance with EU-IFRSs, as adopted by the European Union (See Note 1 and 56). In the event of a discrepancy, the Spanish language version prevails.
Main Margins and Profits by Operating Segments (Millions of euros)
Operating Segments
BBVA Group
Spain Non Core Real Estate
United Sates
Mexico Turkey South America
Rest of Eurasia
Corporate Center
Adjustments (2)
2017 Notes
Net interest income 17,758 3,738 71 2,158 5,437 3,331 3,200 180 (357) -
Gross income 25,270 6,180 (17) 2,919 7,080 4,115 4,451 468 73 -
Operating profit /(loss) before tax 6,931 1,866 (673) 784 2,948 2,147 1,691 177 (2,009) -
Profit 55.2 3,519 1,381 (501) 511 2,162 826 861 125 (1,844)
2016 (1)
Net interest income 17,059 3,877 60 1,953 5,126 3,404 2,930 166 (455) -
Gross income 24,653 6,416 (6) 2,706 6,766 4,257 4,054 491 (31) -
Operating profit /(loss) before tax 6,392 1,268 (743) 612 2,678 1,906 1,552 203 (1,084) -
Profit 55.2 3,475 905 (595) 459 1,980 599 771 151 (794)
2015 (1)
Net interest income 16,022 4,015 71 1,811 5,387 2,194 3,202 176 (432) (404)
Gross income 23,362 6,803 (28) 2,631 7,081 2,434 4,477 465 (183) (318)
Operating profit /(loss) before tax 4,603 1,540 (716) 685 2,772 853 1,814 103 (1,172) (1,276)
Profit 55.2 2,642 1,080 (496) 517 2,094 371 905 70 (1,899) -
(1) The figures corresponding to 2016 and 2015 have been restated (see Note 1.3).
(2) Since the third quarter of 2015, BBVA has consolidated Garanti (39.9% owned as of December 31, 2015). In prior periods, Garanti's revenues and costs are reflected in the segment information only in the proportion of BBVA´s ownership (25.01%). This column includes adjustments resulting from the accounting of the investment in Garanti group using the equity method (versus reflecting the revenues and costs of Garanti only in proportion of BBVA´s ownership Garanti as stated in the management information). This column also includes inter-segment adjustments (see Note 2).
The accompanying Consolidated Management Report presents the consolidated income statements and the balance sheets by operating segments in more detail.
P. 61 Translation of the Consolidated Financial Statements originally issued in Spanish and prepared in accordance with EU-IFRSs, as adopted by the European Union (See Note 1 and 56). In the event of a discrepancy, the Spanish language version prevails.
7. Risk management
7.1 General risk management and control model ........................................................................................ 62
7.1.1 Governance and organization ................................................................................................................. 62
7.1.2 Risk Appetite Framework ........................................................................................................................ 66
7.1.3 Decisions and processes ......................................................................................................................... 68
7.1.4 Assessment, monitoring and reporting ........................................................................................... 69
7.1.5 Infrastructure ........................................................................................................................................... 70
7.1.6 Risk culture ............................................................................................................................................... 70
7.2 Risk factors ................................................................................................................................................. 71
7.3 Credit risk .................................................................................................................................................. 73
7.3.1 Credit risk exposure .......................................................................................................................... 74
7.3.2 Mitigation of credit risk, collateralized credit risk and other credit enhancements ..................... 78
7.3.3 Credit quality of financial assets that are neither past due nor impaired ..................................... 79
7.3.4 Past due but not impaired and impaired secured loans risks .........................................................81
7.3.5 Impairment losses ............................................................................................................................. 88
7.3.6 Refinancing and restructuring operations ....................................................................................... 92
7.4 Market risk ................................................................................................................................................. 93
7.4.1 Market risk trading portfolios.................................................................................................................. 93
7.4.2 Structural risk .......................................................................................................................................... 99
7.4.3 Financial Instruments offset ................................................................................................................. 102
7.5 Liquidity risk ............................................................................................................................................ 104
7.5.1 Liquidity risk management ............................................................................................................. 104
7.5.2 Asset encumbrance ........................................................................................................................ 109
7.6 Operational Risk ........................................................................................................................................ 111
7.7 Risk concentration ................................................................................................................................... 112
P. 62 Translation of the Consolidated Financial Statements originally issued in Spanish and prepared in accordance with EU-IFRSs, as adopted by the European Union (See Note 1 and 56). In the event of a discrepancy, the Spanish language version prevails.
7.1 General risk management and control model
The BBVA Group has an overall risk management and control model (hereinafter 'the model') tailored to its
business model, its organization and the geographies in which it operates, This model allows BBVA Group to
develop its activity in accordance with the risk strategy and risk controls and management policies defined
by the governing bodies of the Bank and to adapt to a changing economic and regulatory environment,
tackling risk management globally and adapted to the circumstances at all times. The model establishes a
system of appropriate risk management regarding risk profile and strategy of the Group.
This model is applied comprehensively in the Group and consists of the basic elements listed below:
Governance and organization.
Risk Appetite Framework.
Decisions and processes.
Assessment, monitoring and reporting.
Infrastructure.
The Group promotes the development of a risk culture that ensures consistent application of the risk
management and control model in the Group, and that guarantees that the risk function is understood and
assimilated at all levels of the organization.
7.1.1 Governance and organization
BBVA Group´s risk governance model is characterized by a special involvement of its corporate bodies, both
in setting the risk strategy and in the ongoing monitoring and supervision of its implementation.
Thus, as developed below, the corporate bodies are the ones that approve this risk strategy and corporate
policies for the different types of risk. The risk function is responsible at management level for their
implementation and development, and reporting to the governing bodies.
The responsibility for the daily management of the risks lies on the businesses which abide in the
development of their activity to meet the policies, rules, procedures, infrastructures and controls, which are
defined by the function risk on the basis of the framework set by the governing bodies.
To perform this task properly, the risk function in the BBVA Group is configured as a single, global function
with an independent role from commercial areas.
Corporate bodies
BBVA Board of Directors (hereinafter also referred to as "the Board") approves the risk strategy and
oversees the internal management and control systems. Specifically, in relation to the risk strategy, the
Board approves the Group's risk appetite statement, the core metrics and the main metrics by type of risk,
as well as the general risk management and control model.
The Board of Directors is also responsible for approving and monitoring the strategic and business plan, the
annual budget and management goals, as well as the investment and funding policy, in a consistent way and
in line with the approved Risk Appetite Framework. For this reason, the processes for defining the Risk
Appetite Framework proposals and the strategic and budgetary planning at Group level are coordinated by
the executive areas for submission to the Board.
With the aim of ensuring the integration of the Risk Appetite Framework into management, on the basis
established by the Board of Directors, the Executive Committee approves the remaining metrics by type of
risk (in 2017 those in relation to concentration, profitability and reputational risk) and the Group's basic
P. 63 Translation of the Consolidated Financial Statements originally issued in Spanish and prepared in accordance with EU-IFRSs, as adopted by the European Union (See Note 1 and 56). In the event of a discrepancy, the Spanish language version prevails.
structure of limits by geographical area, risk type, asset type and portfolio level. This committee also
approves specific corporate policies for each type of risk.
Lastly, the Board has set up a Board committee specialized in risks, the Risk Committee, that assists the
Board and the Executive Committee in determining the Group's risk strategy and the risk limits and policies,
respectively, analyzing and assessing beforehand the proposals submitted to those bodies. The Board of
Directors has the exclusive authority to amend the Group’s risk strategy and its elements, including the Risk
Appetite Framework metrics within its scope of decision, while the Executive Committee is responsible for
amending the metrics by type of risk within its scope of decision and the Group's basic structure of limits
(core limits), when applicable. In both cases, the amendments follow the same decision-making process
described above, so the proposals for amendment are submitted by the executive area (Chief Risk Officer,
“CRO”) and analyzed by the Risk Committee, for later submission to the Board of Directors or to the
Executive Committee, as appropriate.
Moreover, the Risk Committee, the Executive Committee and the Board itself conduct proper monitoring of
the risk strategy implementation and of the Group's risk profile. The risk function regularly reports on the
development of the Group's Risk Appetite Framework metrics to the Board and to the Executive Committee,
after the analysis by the Risk Committee, whose role in this monitoring and control work is particularly
relevant.
Risk Function: CRO. Organizational structure and committees
The head of the risk function at executive level is the Group’s CRO, who carries out his functions
independently and with the necessary authority, rank, experience, knowledge and resources. He is appointed
by the Board as a member of its senior management and has direct access to its corporate bodies (Board,
Executive Standing Committee and Risk Committee), to whom he reports regularly on the status of risks in
the Group.
The CRO, for a better performance of its functions, is supported in the performance of its functions by a
structure consisting of cross-sectional risk units in the corporate area and the specific risk units in the
geographical and/or business areas of the Group. Each of the latter units is headed by a Chief Risk Officer for
the geographical and/or business area who, within his/her area of responsibility, carries out risk
management and control functions and is responsible for applying the corporate policies and rules approved
at Group level in a consistent manner, adapting them if necessary to local requirements and reporting to the
local corporate bodies.
The Chief Risk Officers of the geographical and/or business areas report both to the Group's CRO and to the
head of their geographical and/or business area. This dual reporting system aims to ensure that the local risk
management function is independent from the operating functions and enable its alignment with the Group's
corporate risk policies and goals.
As explained above, the risk management function consists of risk units from the corporate area, which
carry out cross-sectional functions, and risk units from the geographical and/or business areas.
The corporate area's risk units develop and submit to the Group CRO the proposal for the Group's
Risk Appetite Framework, the corporate policies, rules and global procedures and infrastructures
within the framework approved by the corporate bodies; they ensure their application and report
either directly or through the CRO to the Bank's corporate bodies. Their functions include:
• Management of the different types of risks at Group level in accordance with the strategy
defined by the corporate bodies.
• Risk planning aligned with the risk appetite framework principles defined by the Group.
P. 64 Translation of the Consolidated Financial Statements originally issued in Spanish and prepared in accordance with EU-IFRSs, as adopted by the European Union (See Note 1 and 56). In the event of a discrepancy, the Spanish language version prevails.
• Monitoring and control of the Group's risk profile in relation to the risk appetite framework
approved by the Bank's corporate bodies, providing accurate and reliable information with the
required frequency and in the necessary format.
• Prospective analyses to enable an evaluation of compliance with the risk appetite framework in
stress scenarios and the analysis of risk mitigation mechanisms.
• Management of the technological and methodological developments required for implementing
the Model in the Group.
• Design of the Group's Internal Control model and definition of the methodology, corporate
criteria and procedures for identifying and prioritizing the risk inherent in each unit's activities
and processes.
• Validation of the models used and the results obtained by them in order to verify their
adaptation to the different uses to which they are applied.
The risk units in the business units develop and present to the Chief Risk Officer of the geographical
and/or business area the risk appetite framework proposal applicable in each geographical and/or
business area, independently and always within the Group's strategy/Risk Appetite Framework.
They also ensure that the corporate policies and rules approved and applied consistently at a Group
level, adapting them if necessary to local requirements; that they are provided with appropriate
infrastructures for management and control of their risks, within the global risk infrastructure
framework defined by the corporate areas; and that they report to their corporate bodies and/or to
senior management, as appropriate.
The local risk units thus work with the corporate area risk units in order to adapt to the risk strategy at Group
level and share all the information necessary for monitoring the development of their risks.
The risk function has a decision-making process to perform its functions, underpinned by a structure of
committees, where the Global Risk Management Committee (GRMC) acts as the top-level committee within
the risk function. It proposes, examines and, where applicable, approves, among others, the internal risk
regulatory framework and the procedures and infrastructures needed to identify, assess, measure and
manage the material risks faced by the Group in carrying out its business, and the determination of risk limits
by portfolio. The members of this Committee are the Group's CRO and the heads of the risk units of the
corporate area and of the most representative geographical and/or business areas.
The GRMC carries out its functions assisted by various support committees which include:
Global Credit Risk Management Committee: It is responsible for analyzing and decision-making
related to wholesale credit risk admission.
Wholesale Credit Risk Management Committee: its purpose is the analysis and decision-making
regarding the admission of wholesale credit risk of certain customer segments of the BBVA Group.
Work Out Committee: its purpose is to be informed about decisions taken under the delegation
framework regarding risk proposals concerning clients on Watch List levels 1 and 2 and clients
classified as NPL of certain customer segments of the BBVA Group, as well the sanction of proposals
regarding entries, exits and changes of the Special Monitoring list.
Monitoring, Assessment & Reporting Committee: It guarantees and ensures the appropriate
development of aspects related to risk identification, assessment, monitoring and reporting, with an
integrated and cross-cutting vision.
Asset Allocation Committee: The executive authority responsible for analyzing and deciding on credit
risk issues related to processes aimed at achieving a portfolios combination and composition that,
under the restrictions imposed by the Risk Appetite framework, allows to maximize the risk adjusted
profit subject to an appropriate risk-adjusted return on equity.
P. 65 Translation of the Consolidated Financial Statements originally issued in Spanish and prepared in accordance with EU-IFRSs, as adopted by the European Union (See Note 1 and 56). In the event of a discrepancy, the Spanish language version prevails.
Technology & Analytics Committee: It ensures an appropriate decision-making process regarding
the development, implementation and use of the tools and models required to achieve an
appropriate management of those risks to which the BBVA Group is exposed.
Global Markets Risk Unit Global Committee: It is responsible for formalizing, supervising and
communicating the monitoring of trading desk risk in all the Global Markets business units, as well as
coordinating and approving GMRU key decisions activity, and developing and proposing to GRMC
the corporate regulation of the unit.
Corporate Operational and Outsourcing Risk Admission Committee: It identifies and assesses the
operational risks of new businesses, new products and services, and outsourcing initiatives.
Retail Risk Committee: It ensures the alignment of the practices and processes of the retail credit
risk cycle with the approved risk tolerance and with the business growth and development objectives
established in the corporate strategy of the Group.
Asset Management Global Risk Steering Committee: its purpose is to develop and coordinate the
strategies, policies, procedures, and infrastructure necessary to identify, assess, measure and
manage the material risks facing the bank in the operation of businesses linked to BBVA Asset
Management.
Global Insurance Risk Committee: its purpose is to guarantee the alignment and the communication
between all the Insurance Risk Units in the BBVA Group. It will do this by promoting the application of
standardized principles, policies, tools and risk metrics in the different regions with the aim of
maintaining proper integration of insurance risk management in the Group.
COPOR: its purpose is to analyze and make decision in relation to the operations of the various
geographies in which Global Markets is present.
Each geographical and/or business area has its own risk management committee (or committees), with
objectives and contents similar to those of the corporate area, which perform their duties consistently and in
line with corporate risk policies and rules, whose decisions are reflected in the corresponding minutes.
Under this organizational scheme, the risk management function ensures the risk strategy, the regulatory
framework, and standardized risk infrastructures and controls are integrated and applied across the entire
Group. It also benefits from the knowledge and proximity to customers in each geographical and/or business
area, and transmits the corporate risk culture to the Group's different levels. Moreover, this organization
enables the risks function to conduct and report to the corporate bodies integrated monitoring and control of
the entire Group's risks.
Internal Risk Control and Internal Validation
The Group has a specific Internal Risk Control unit. Its main function is to ensure there is an adequate internal
regulatory framework, a process and measures defined for each type of risk identified in the Group (and for
those other types of risk that may potentially affect the Group). It controls their application and operation, as
well as ensuring the integration of the risk strategy into the Group's management. In this regard, the Internal
Risk Control unit verifies the performance of their duties by the units that develop the risk models, manage
the processes and execute the controls. Its scope of action is global, from the geographical point of view and
the type of risks.
The Group's Head of Internal Risk Control is responsible for the function and reports on its activities and
informs of its work plans to the CRO and to the Board's Risk Committee, assisting it in any matters where
requested. For these purposes the Internal Risk Control department has a Technical Secretary's Office,
which offers the Committee the technical support it needs to better perform its duties.
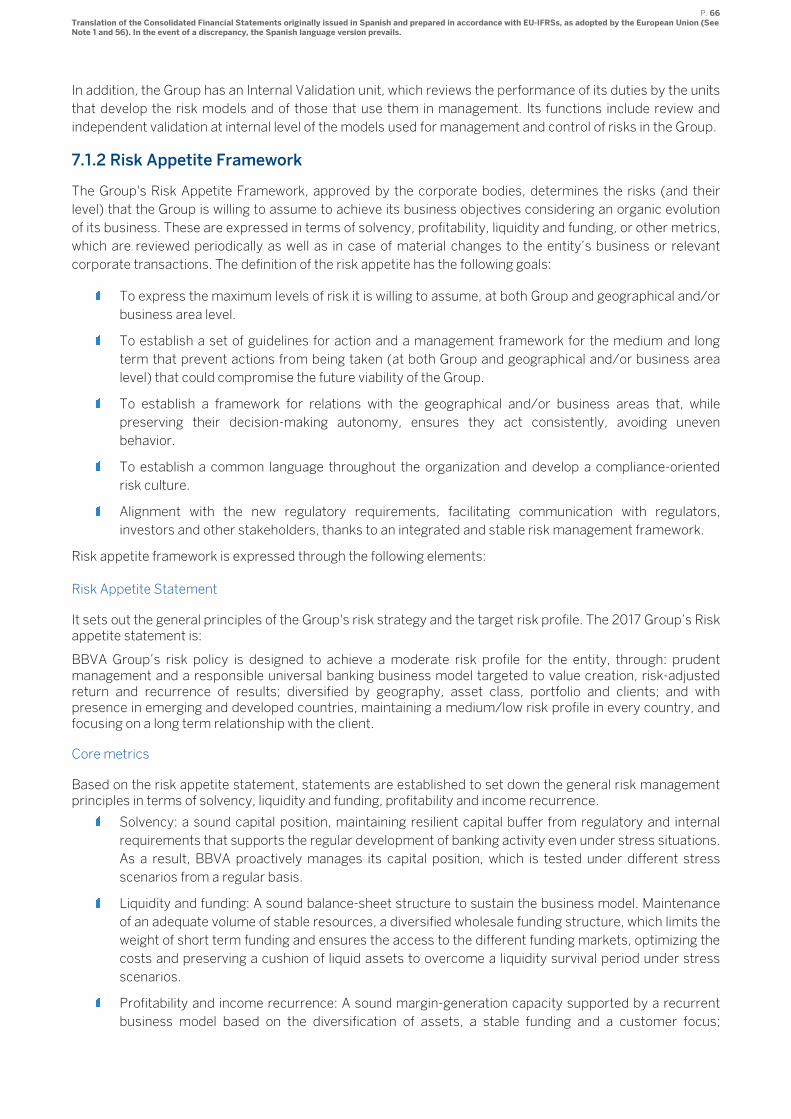
P. 66 Translation of the Consolidated Financial Statements originally issued in Spanish and prepared in accordance with EU-IFRSs, as adopted by the European Union (See Note 1 and 56). In the event of a discrepancy, the Spanish language version prevails.
In addition, the Group has an Internal Validation unit, which reviews the performance of its duties by the units
that develop the risk models and of those that use them in management. Its functions include review and
independent validation at internal level of the models used for management and control of risks in the Group.
7.1.2 Risk Appetite Framework
The Group's Risk Appetite Framework, approved by the corporate bodies, determines the risks (and their
level) that the Group is willing to assume to achieve its business objectives considering an organic evolution
of its business. These are expressed in terms of solvency, profitability, liquidity and funding, or other metrics,
which are reviewed periodically as well as in case of material changes to the entity’s business or relevant
corporate transactions. The definition of the risk appetite has the following goals:
To express the maximum levels of risk it is willing to assume, at both Group and geographical and/or
business area level.
To establish a set of guidelines for action and a management framework for the medium and long
term that prevent actions from being taken (at both Group and geographical and/or business area
level) that could compromise the future viability of the Group.
To establish a framework for relations with the geographical and/or business areas that, while
preserving their decision-making autonomy, ensures they act consistently, avoiding uneven
behavior.
To establish a common language throughout the organization and develop a compliance-oriented
risk culture.
Alignment with the new regulatory requirements, facilitating communication with regulators,
investors and other stakeholders, thanks to an integrated and stable risk management framework.
Risk appetite framework is expressed through the following elements:
Risk Appetite Statement
It sets out the general principles of the Group's risk strategy and the target risk profile. The 2017 Group’s Risk appetite statement is:
BBVA Group’s risk policy is designed to achieve a moderate risk profile for the entity, through: prudent management and a responsible universal banking business model targeted to value creation, risk-adjusted return and recurrence of results; diversified by geography, asset class, portfolio and clients; and with presence in emerging and developed countries, maintaining a medium/low risk profile in every country, and focusing on a long term relationship with the client.
Core metrics
Based on the risk appetite statement, statements are established to set down the general risk management principles in terms of solvency, liquidity and funding, profitability and income recurrence.
Solvency: a sound capital position, maintaining resilient capital buffer from regulatory and internal
requirements that supports the regular development of banking activity even under stress situations.
As a result, BBVA proactively manages its capital position, which is tested under different stress
scenarios from a regular basis.
Liquidity and funding: A sound balance-sheet structure to sustain the business model. Maintenance
of an adequate volume of stable resources, a diversified wholesale funding structure, which limits the
weight of short term funding and ensures the access to the different funding markets, optimizing the
costs and preserving a cushion of liquid assets to overcome a liquidity survival period under stress
scenarios.
Profitability and income recurrence: A sound margin-generation capacity supported by a recurrent
business model based on the diversification of assets, a stable funding and a customer focus;
P. 67 Translation of the Consolidated Financial Statements originally issued in Spanish and prepared in accordance with EU-IFRSs, as adopted by the European Union (See Note 1 and 56). In the event of a discrepancy, the Spanish language version prevails.
combined with a moderate risk profile that limits the credit losses even under stress situations; all
focused on allowing income stability and maximizing the risk-adjusted profitability.
The core metrics define, in quantitative terms, the principles and the target risk profile set out in the risk appetite statement and are in line with the strategy of the Group. Each metric has three thresholds (traffic-light approach) ranging from a standard business management to higher deterioration levels: Management reference, Maximum appetite and Maximum capacity. The 2017 Group’s Core metrics are:
By type of risk metrics
Based on the core metrics, statements are established for each type of risk reflecting the main principles governing the management of that risk and several metrics are calibrated, compliance with which enables compliance with the core metrics and the risk appetite statement of the Group. By type of risk metrics have a maximum appetite threshold.
Basic limits structure (core limits)
The purpose of the basic limits structure or core limits is to shape the Risk Appetite Framework at geographical area risk type, asset type and portfolio level, ensuring that the management of risks on an ongoing basis is within the thresholds set forth for "by type of risk".
In addition to this framework, there’s a level of management limits level that is defined and managed by the risk function developing the core limits, in order to ensure that the anticipatory management of risks by subcategories or by subportfolios complies with that core limits and, in general, with the Risk Appetite Framework.
The following graphic summarizes the structure of BBVA’s Risk Appetite Framework:
Metric
Income recurrence
and profitability
Net margin / Average Total Assets
Cost of Risk
Return on Equity (ROE)
Solvency
Economic Solvency
Regulatory Solvency: CET1 Fully Loaded
Liquidity and Funding
Loan to Stable Costumer Deposits (LTSCD)
Liquidity Coverage Ratio (LCR)
P. 68 Translation of the Consolidated Financial Statements originally issued in Spanish and prepared in accordance with EU-IFRSs, as adopted by the European Union (See Note 1 and 56). In the event of a discrepancy, the Spanish language version prevails.
The corporate risk area works with the various geographical and/or business areas to define their risk
appetite framework, which will be coordinated with and integrated into the Group's risk appetite to ensure
that its profile fits as defined.
The Group Risk Appetite Framework expresses the levels and types of risk that the Bank is willing to assume
to be able to implement its strategic plan with no relevant deviations, even in situations of stress. The Risk
Appetite Framework is integrated into the management and the processes for defining the Risk Appetite
Framework proposals and strategic and budgetary planning at Group level are coordinates.
As explained above, the core metrics of BBVA Risk Appetite Framework measure Groups performance in
terms of solvency, liquidity and funding, profitability and income recurrence; most of the core metrics are
accounting related or regulatory metrics which are published regularly to the market in the BBVA Group
annual report and in the quarterly financial reports. During 2017, the Group risk profile evolved in line with the
Risk Appetite metrics.
.
7.1.3 Decisions and processes
The transfer of risk appetite framework to ordinary management is supported by three basic aspects:
A standardized set of regulations.
Risk planning.
Comprehensive management of risks over their life cycle.
Standardized regulatory framework
The corporate risk area is responsible for the definition and proposal of the corporate policies, specific rules,
procedures and schemes of delegation based on which risk decisions should be taken within the Group.
This process aims for the following objectives:
Hierarchy and structure: well-structured information through a clear and simple hierarchy creating
relations between documents that depend on each other.
Simplicity: an appropriate and sufficient number of documents.
Standardization: a standardized name and content of document.
Accessibility: ability to search for, and easy access to, documentation through the corporate risk
management library.
The approval of corporate policies for all types of risks corresponds to the corporate bodies of the Bank,
while the corporate risk area endorses the remaining regulations.
Risk units of geographical and / or business areas comply with this set of regulations and, where necessary,
adapt it to local requirements for the purpose of having a decision process that is appropriate at local level
and aligned with the Group policies. If such adaptation is necessary, the local risk area must inform the
corporate area of GRM, who must ensure the consistency of the regulatory body at the Group level and,
therefore, if necessary, give prior approval to the modifications proposed by the local risk areas.
Risk planning
Risk planning ensures that the risk appetite framework is integrated into management through a cascade
process for establishing limits and profitability adjusted to the risk profile, in which the function of the
corporate area risk units and the geographical and/or business areas is to guarantee the alignment of this
P. 69 Translation of the Consolidated Financial Statements originally issued in Spanish and prepared in accordance with EU-IFRSs, as adopted by the European Union (See Note 1 and 56). In the event of a discrepancy, the Spanish language version prevails.
process with the Group's Risk Appetite Framework in terms of solvency, liquidity and funding, profitability
and income recurrence.
There are tools in place that allow the Risk Appetite Framework defined at aggregate level to be assigned and
monitored by business areas, legal entities, types of risk, concentrations and any other level considered
necessary.
The risk planning process is aligned and taken into consideration within the rest of the Group's planning
framework so as to ensure consistency.
Comprehensive management
All risks must be managed comprehensively during their life cycle, and be treated differently depending on
the type.
The risk management cycle is composed of five elements:
Planning: with the aim of ensuring that the Group's activities are consistent with the target risk profile
and guaranteeing solvency in the development of the strategy.
Assessment: a process focused on identifying all the risks inherent to the activities carried out by the
Group.
Formalization: includes the risk origination, approval and formalization stages.
Monitoring and reporting: continuous and structured monitoring of risks and preparation of reports
for internal and/or external (market, investors, etc.) consumption.
Active portfolio management: focused on identifying business opportunities in existing portfolios and
new markets, businesses and products.
7.1.4 Assessment, monitoring and reporting
Assessment, monitoring and reporting is a cross-cutting element that ensure the Model has a dynamic and
proactive vision to enable compliance with the risk appetite framework approved by the corporate bodies,
even in adverse scenarios. The materialization of this process has the following objectives:
Assess compliance with the risk appetite framework at the present time, through monitoring of the
core metrics, metrics by type of risk and the basic structure of limits.
Assess compliance with the risk appetite framework in the future, through the projection of the risk
appetite framework variables, in both a baseline scenario determined by the budget and a risk
scenario determined by the stress tests.
Identify and assess the risk factors and scenarios that could compromise compliance with the risk
appetite framework, through the development of a risk repository and an analysis of the impact of
those risks.
Act to mitigate the impact in the Group of the identified risk factors and scenarios, ensuring this
impact remains within the target risk profile.
Supervise the key variables that are not a direct part of the risk appetite framework, but that
condition its compliance. These can be either external or internal.
This process is integrated in the activity of the risk units, both of the corporate area and in the business units,
and it is carried out during the following phases:
Identification of the risk factors that can compromise the performance of the Group or of the
geographical and/or business areas in relation to the defined risk thresholds.
P. 70 Translation of the Consolidated Financial Statements originally issued in Spanish and prepared in accordance with EU-IFRSs, as adopted by the European Union (See Note 1 and 56). In the event of a discrepancy, the Spanish language version prevails.
Assessment of the impact of the materialization of the risk factors on the metrics that define the Risk
Appetite Framework based on different scenarios, including stress scenarios.
Response to unwanted situations and proposals for readjustment to enable a dynamic management
of the situation, even before it takes place.
Monitoring of the Group's risk profile and of the identified risk factors, through internal, competitor
and market indicators, among others, to anticipate their future development.
Reporting: Complete and reliable information on the development of risks for the corporate bodies
and senior management, with the frequency and completeness appropriate to the nature,
significance and complexity of the reported risks. The principle of transparency governs al reporting
of risk information.
7.1.5 Infrastructure
The infrastructure is an element that must ensure that the Group has the human and technological resources
needed for effective management and supervision of risks in order to carry out the functions set out in the
Group's risk Model and the achievement of their objectives.
With respect to human resources, the Group risk function has an adequate workforce, in terms of number,
skills, knowledge and experience.
With regards to technology, the Group risk function ensures the integrity of management information
systems and the provision of the infrastructure needed for supporting risk management, including tools
appropriate to the needs arising from the different types of risks for their admission, management,
assessment and monitoring.
The principles that govern the Group risk technology are:
Standardization: the criteria are consistent across the Group, thus ensuring that risk handling is
standardized at geographical and/or business area level.
Integration in management: the tools incorporate the corporate risk policies and are applied in the
Group's day-to-day management.
Automation of the main processes making up the risk management cycle.
Appropriateness: provision of adequate information at the right time.
Through the “Risk Analytics” function, the Group has a corporate framework in place for developing the
measurement techniques and models. It covers all the types of risks and the different purposes and uses a
standard language for all the activities and geographical/business areas and decentralized execution to
make the most of the Group's global reach. The aim is to continually evolve the existing risk models and
generate others that cover the new areas of the businesses that develop them, so as to reinforce the
anticipation and proactiveness that characterize the Group's risk function.
Also the risk units of geographical and / or business areas have sufficient means from the point of view of
resources, structures and tools to develop a risk management in line with the corporate model.
7.1.6 Risk culture
The Group promotes the development of a risk culture that ensure consistent application of the risk
management and control model in the Group, and that guarantees that the risk function is understood and
internalized at all levels of the organization.
P. 71 Translation of the Consolidated Financial Statements originally issued in Spanish and prepared in accordance with EU-IFRSs, as adopted by the European Union (See Note 1 and 56). In the event of a discrepancy, the Spanish language version prevails.
The culture transfers the implications that are involved in the Group's activities and businesses to all the
levels of the organization. The risk culture is organized through a number of levers, including the following:
Communication: promotes the dissemination of the Model, and in particular the principles that must
govern risk management in the Group, in a consistent and integrated manner across the
organization, through the most appropriate channels. GRM has a number of communication
channels to facilitate the transmission of information and knowledge among the various teams in the
function and the Group, adapting the frequency, formats and recipients based on the proposed goal,
in order to strengthen the basic principles of the risk function. The risk culture and the management
model thus emanate from the Group's corporate bodies and senior management and are
transmitted throughout the organization.
Training: its main aim is to disseminate and establish the model of risk management across the
organization, ensuring standards in the skills and knowledge of the different persons involved in the
risk management processes.
Well defined and implemented training ensures continuous improvement of the skills and knowledge
of the Group's professionals, and in particular of the GRM area, and is based on four aspects that aim
to develop each of the needs of the GRM group by increasing its knowledge and skills in different
fields such as: finance and risks, tools and technology, management and skills, and languages.
Motivation: the aim in this area is for the incentives of the risk function teams to support the strategy
for managing those teams and the function's values and culture at all levels. Includes compensation
and all those elements related to motivation – working environment, etc. which contribute to the
achievement Model objectives.
7.2 Risk factors
As mentioned earlier, BBVA has processes in place for identifying risks and analyzing scenarios that enable
the Group to manage risks in a dynamic and proactive way.
The risk identification processes are forward looking to ensure the identification of emerging risks and take
into account the concerns of both the business areas, which are close to the reality of the different
geographical areas, and the corporate areas and senior management.
Risks are captured and measured consistently using the methodologies deemed appropriate in each case.
Their measurement includes the design and application of scenario analyses and stress testing and
considers the controls to which the risks are subjected.
As part of this process, a forward projection of the risk appetite framework variables in stress scenarios is
conducted in order to identify possible deviations from the established thresholds. If any such deviations are
detected, appropriate measures are taken to keep the variables within the target risk profile.
To this extent, there are a number of emerging risks that could affect the Group’s business trends. These
risks are described in the following main blocks:
Macroeconomic and geopolitical risks
Global growth has improved during 2017, and is more synchronized across developed and
emerging markets, which makes the recovery more sustainable. Healthy global trade growth
and calm financial markets, which rely on the support from central banks and the lack of inflation
pressure, also contribute to the more upbeat outlook. The performance of the most advanced
economies is solid, especially the Eurozone, where global demand adds to domestic factors and
reduced political uncertainty. Growth momentum in The United States will be supported in the
short term by the recently approved tax reform, although its long-term impact is unlikely to be
large. As regards emerging economies, China's growth moderation continues, with a mix of
P. 72 Translation of the Consolidated Financial Statements originally issued in Spanish and prepared in accordance with EU-IFRSs, as adopted by the European Union (See Note 1 and 56). In the event of a discrepancy, the Spanish language version prevails.
policies oriented to diminish financial imbalances, while economic activity in Latin America
recovers against a background of higher commodity prices and favorable global funding
conditions.
The uncertainty around these positive economic perspectives has a downward bias but
continues to be elevated. First, following a long period of exceptionally loose monetary policies,
the main central banks are tapering their support, with uncertainty on their impact on markets
and economies given the background of high leverage and signs of overvaluation in some
financial assets. A second source of uncertainty is related with the political support to the
multilateral global governance of trade. Third, both global geopolitics and domestic politics in
some countries are relevant for the economic perspectives within the BBVA's footprint.
In this regard, the Group's geographical diversification remains a key element in achieving a high
level of revenue recurrence, despite the background conditions and economic cycles of the
economies in which it operates.
Regulatory and reputational risks
• Financial institutions are exposed to a complex and ever-changing regulatory environment
defined by governments and regulators. This can affect their ability to grow and the capacity of
certain businesses to develop, and result in stricter liquidity and capital requirements with lower
profitability ratios. The Group constantly monitors changes in the regulatory framework (such
as IFRS9, Basel IV, etc.) that allow for anticipation and adaptation to them in a timely manner,
adopt industry practices and more efficient and rigorous criteria in its implementation.
• The financial sector is under ever closer scrutiny by regulators, governments and society itself.
Negative news or inappropriate behavior can significantly damage the Group's reputation and
affect its ability to develop a sustainable business. The attitudes and behaviors of the group and
its members are governed by the principles of integrity, honesty, long-term vision and industry
practices through, inter alia, internal control Model, the Code of Conduct, tax strategy and
Responsible Business Strategy of the Group.
Business, operational and legal risks
• New technologies and forms of customer relationships: Developments in the digital world and in
information technologies pose significant challenges for financial institutions, entailing threats
(new competitors, disintermediation…) but also opportunities (new framework of relations with
customers, greater ability to adapt to their needs, new products and distribution channels...).
Digital transformation is a priority for the Group as it aims to lead digital banking of the future as
one of its objectives.
• Technological risks and security breaches: The Group is exposed to new threats such as cyber-
attacks, theft of internal and customer databases, fraud in payment systems, etc. that require
major investments in security from both the technological and human point of view. The Group
gives great importance to the active operational and technological risk management and
control. One example was the early adoption of advanced models for management of these
risks (AMA - Advanced Measurement Approach).
• The financial sector is exposed to increasing litigation, so the financial institutions face a large
number of proceedings which economic consequences are difficult to determine. The Group
manages and monitors these proceedings to defend its interests, where necessary allocating
the corresponding provisions to cover them, following the expert criteria of internal lawyers and
external attorneys responsible for the legal handling of the procedures, in accordance with
applicable legislation.
P. 73 Translation of the Consolidated Financial Statements originally issued in Spanish and prepared in accordance with EU-IFRSs, as adopted by the European Union (See Note 1 and 56). In the event of a discrepancy, the Spanish language version prevails.
7.3 Credit risk
Credit risk arises from the probability that one party to a financial instrument will fail to meet its contractual
obligations for reasons of insolvency or inability to pay and cause a financial loss for the other party.
It is the most important risk for the Group and includes counterparty risk, issuer risk, settlement risk and
country risk management.
The principles underpinning credit risk management in BBVA are as follows:
Availability of basic information for the study and proposal of risk, and supporting documentation for
approval, which sets out the conditions required by the internal relevant body.
Sufficient generation of funds and asset solvency of the customer to assume principal and interest
repayments of loans owed.
Establishment of adequate and sufficient guarantees that allow effective recovery of the operation,
this being considered a secondary and exceptional method of recovery when the first has failed.
Credit risk management in the Group has an integrated structure for all its functions, allowing decisions to be
taken objectively and independently throughout the life cycle of the risk.
At Group level: frameworks for action and standard rules of conduct are defined for handling risk,
specifically, the circuits, procedures, structure and supervision.
At the business area level: they are responsible for adapting the Group's criteria to the local realities
of each geographical area and for direct management of risk according to the decision-making
circuit:
Retail risks: in general, the decisions are formalized according to the scoring tools, within the general
framework for action of each business area with regard to risks. The changes in weighting and variables of
these tools must be validated by the corporate GRM area.
Wholesale risks: in general, the decisions are formalized by each business area within its general framework
for action with regard to risks, which incorporates the delegation rule and the Group's corporate policies.
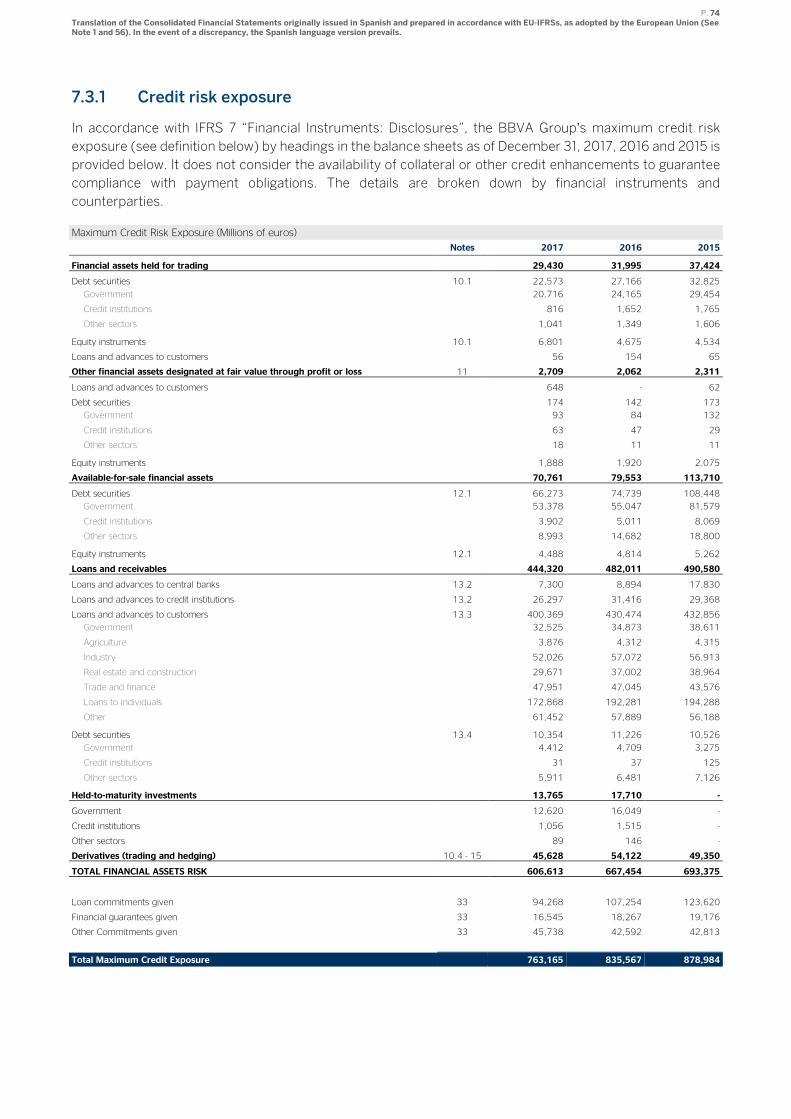
P. 74 Translation of the Consolidated Financial Statements originally issued in Spanish and prepared in accordance with EU-IFRSs, as adopted by the European Union (See Note 1 and 56). In the event of a discrepancy, the Spanish language version prevails.
7.3.1 Credit risk exposure
In accordance with IFRS 7 “Financial Instruments: Disclosures”, the BBVA Group’s maximum credit risk
exposure (see definition below) by headings in the balance sheets as of December 31, 2017, 2016 and 2015 is
provided below. It does not consider the availability of collateral or other credit enhancements to guarantee
compliance with payment obligations. The details are broken down by financial instruments and
counterparties.
Maximum Credit Risk Exposure (Millions of euros)
Notes 2017 2016 2015
Financial assets held for trading 29,430 31,995 37,424
Debt securities 10.1 22,573 27,166 32,825
Government 20,716 24,165 29,454
Credit institutions 816 1,652 1,765
Other sectors 1,041 1,349 1,606
Equity instruments 10.1 6,801 4,675 4,534
Loans and advances to customers 56 154 65
Other financial assets designated at fair value through profit or loss 11 2,709 2,062 2,311
Loans and advances to customers 648 - 62
Debt securities 174 142 173
Government 93 84 132
Credit institutions 63 47 29
Other sectors 18 11 11
Equity instruments 1,888 1,920 2,075
Available-for-sale financial assets 70,761 79,553 113,710
Debt securities 12.1 66,273 74,739 108,448
Government 53,378 55,047 81,579
Credit institutions 3,902 5,011 8,069
Other sectors 8,993 14,682 18,800
Equity instruments 12.1 4,488 4,814 5,262
Loans and receivables 444,320 482,011 490,580
Loans and advances to central banks 13.2 7,300 8,894 17,830
Loans and advances to credit institutions 13.2 26,297 31,416 29,368
Loans and advances to customers 13.3 400,369 430,474 432,856
Government 32,525 34,873 38,611
Agriculture 3,876 4,312 4,315
Industry 52,026 57,072 56,913
Real estate and construction 29,671 37,002 38,964
Trade and finance 47,951 47,045 43,576
Loans to individuals 172,868 192,281 194,288
Other 61,452 57,889 56,188
Debt securities 13.4 10,354 11,226 10,526
Government 4,412 4,709 3,275
Credit institutions 31 37 125
Other sectors 5,911 6,481 7,126
Held-to-maturity investments 13,765 17,710 -
Government 12,620 16,049 -
Credit institutions 1,056 1,515 -
Other sectors 89 146 -
Derivatives (trading and hedging) 10.4 - 15 45,628 54,122 49,350
TOTAL FINANCIAL ASSETS RISK 606,613 667,454 693,375
Loan commitments given 33 94,268 107,254 123,620
Financial guarantees given 33 16,545 18,267 19,176
Other Commitments given 33 45,738 42,592 42,813
Total Maximum Credit Exposure 763,165 835,567 878,984
P. 75 Translation of the Consolidated Financial Statements originally issued in Spanish and prepared in accordance with EU-IFRSs, as adopted by the European Union (See Note 1 and 56). In the event of a discrepancy, the Spanish language version prevails.
The maximum credit exposure presented in the table above is determined by type of financial asset as
explained below:
In the case of financial assets recognized in the consolidated balance sheets, exposure to credit risk
is considered equal to its carrying amount (not including impairment losses), with the sole exception
of derivatives and hedging derivatives.
The maximum credit risk exposure on financial guarantees granted is the maximum that the Group
would be liable for if these guarantees were called in, and that is their carrying amount.
The calculation of risk exposure for derivatives is based on the sum of two factors: the derivatives fair
value and their potential risk (or "add-on").
The first factor, fair value, reflects the difference between original commitments and fair values on the
reporting date (mark-to-market). As indicated in Note 2.2.1, derivatives are accounted for as of each
reporting date at fair value in accordance with IAS 39.
The second factor, potential risk (‘add-on’), is an estimate of the maximum increase to be expected on risk
exposure over a derivative fair value (at a given statistical confidence level) as a result of future changes in
the fair value over the remaining term of the derivatives.
The consideration of the potential risk ("add-on") relates the risk exposure to the exposure level at the time
of a customer’s default. The exposure level will depend on the customer’s credit quality and the type of
transaction with such customer. Given the fact that default is an uncertain event which might occur any time
during the life of a contract, the BBVA Group has to consider not only the credit exposure of the derivatives
on the reporting date, but also the potential changes in exposure during the life of the contract. This is
especially important for derivatives, whose valuation changes substantially throughout their terms,
depending on the fluctuation of market prices.
The breakdown by counterparty and product of loans and advances, net of impairment losses, classified in
the different headings of the assets, as of December 31, 2017, 2016 and 2015 is shown below:
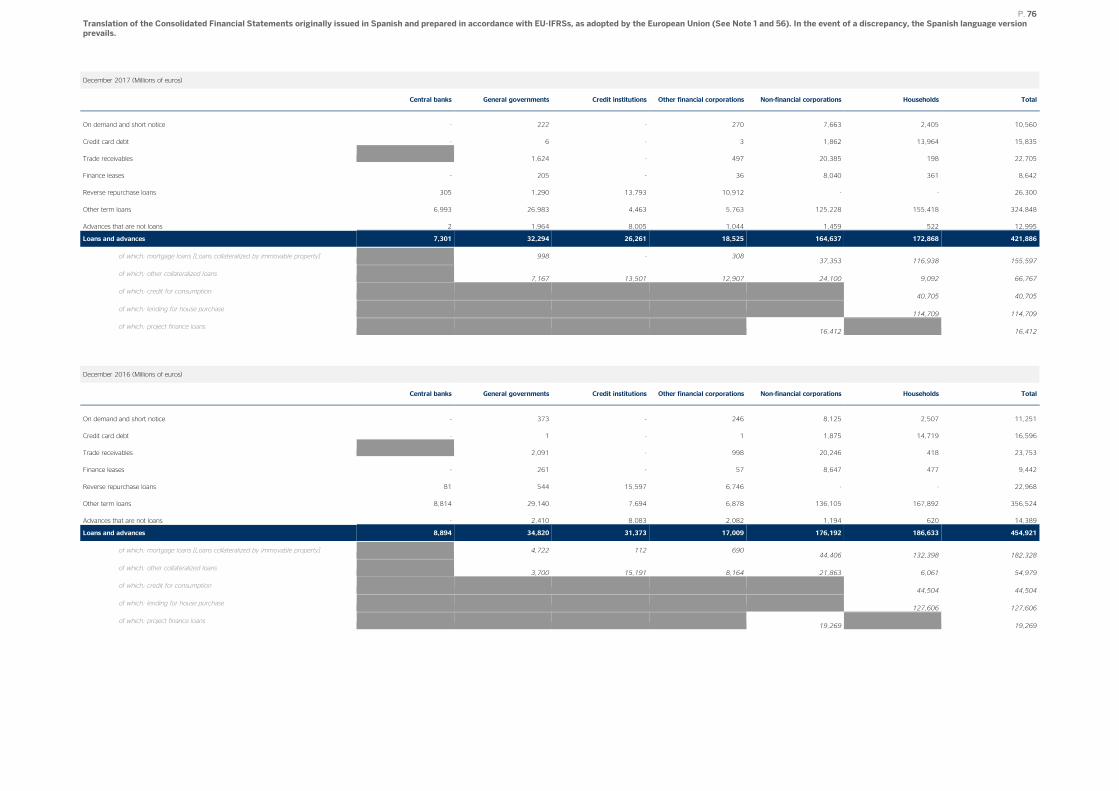
P. 76 Translation of the Consolidated Financial Statements originally issued in Spanish and prepared in accordance with EU-IFRSs, as adopted by the European Union (See Note 1 and 56). In the event of a discrepancy, the Spanish language version prevails.
December 2017 (Millions of euros)
Central banks General governments Credit institutions Other financial corporations Non-financial corporations Households Total
On demand and short notice - 222 - 270 7,663 2,405 10,560
Credit card debt - 6 - 3 1,862 13,964 15,835
Trade receivables 1,624 - 497 20,385 198 22,705
Finance leases - 205 - 36 8,040 361 8,642
Reverse repurchase loans 305 1,290 13,793 10,912 - - 26,300
Other term loans 6,993 26,983 4,463 5,763 125,228 155,418 324,848
Advances that are not loans 2 1,964 8,005 1,044 1,459 522 12,995
Loans and advances 7,301 32,294 26,261 18,525 164,637 172,868 421,886
of which: mortgage loans [Loans collateralized by immovable property] 998 - 308 37,353 116,938 155,597
of which: other collateralized loans 7,167 13,501 12,907 24,100 9,092 66,767
of which: credit for consumption 40,705 40,705
of which: lending for house purchase 114,709 114,709
of which: project finance loans 16,412 16,412
December 2016 (Millions of euros)
Central banks General governments Credit institutions Other financial corporations Non-financial corporations Households Total
On demand and short notice - 373 - 246 8,125 2,507 11,251
Credit card debt - 1 - 1 1,875 14,719 16,596
Trade receivables 2,091 - 998 20,246 418 23,753
Finance leases - 261 - 57 8,647 477 9,442
Reverse repurchase loans 81 544 15,597 6,746 - - 22,968
Other term loans 8,814 29,140 7,694 6,878 136,105 167,892 356,524
Advances that are not loans - 2,410 8,083 2,082 1,194 620 14,389
Loans and advances 8,894 34,820 31,373 17,009 176,192 186,633 454,921
of which: mortgage loans [Loans collateralized by immovable property] 4,722 112 690 44,406 132,398 182,328
of which: other collateralized loans 3,700 15,191 8,164 21,863 6,061 54,979
of which: credit for consumption 44,504 44,504
of which: lending for house purchase 127,606 127,606
of which: project finance loans 19,269 19,269
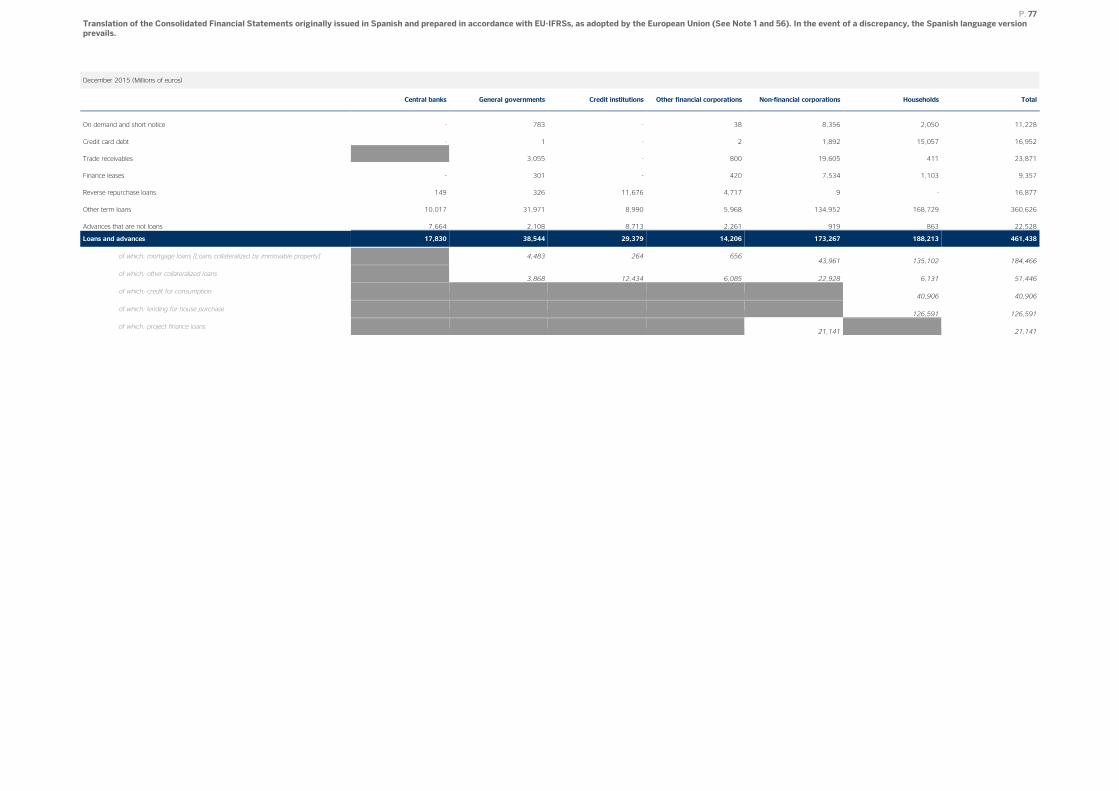
P. 77 Translation of the Consolidated Financial Statements originally issued in Spanish and prepared in accordance with EU-IFRSs, as adopted by the European Union (See Note 1 and 56). In the event of a discrepancy, the Spanish language version prevails.
December 2015 (Millions of euros)
Central banks General governments Credit institutions Other financial corporations Non-financial corporations Households Total
On demand and short notice - 783 - 38 8,356 2,050 11,228
Credit card debt - 1 - 2 1,892 15,057 16,952
Trade receivables 3,055 - 800 19,605 411 23,871
Finance leases - 301 - 420 7,534 1,103 9,357
Reverse repurchase loans 149 326 11,676 4,717 9 - 16,877
Other term loans 10,017 31,971 8,990 5,968 134,952 168,729 360,626
Advances that are not loans 7,664 2,108 8,713 2,261 919 863 22,528
Loans and advances 17,830 38,544 29,379 14,206 173,267 188,213 461,438
of which: mortgage loans [Loans collateralized by immovable property] 4,483 264 656 43,961 135,102 184,466
of which: other collateralized loans 3,868 12,434 6,085 22,928 6,131 51,446
of which: credit for consumption 40,906 40,906
of which: lending for house purchase 126,591 126,591
of which: project finance loans 21,141 21,141
P. 78 Translation of the Consolidated Financial Statements originally issued in Spanish and prepared in accordance with EU-IFRSs, as adopted by the European Union (See Note 1 and 56). In the event of a discrepancy, the Spanish language version prevails.
7.3.2 Mitigation of credit risk, collateralized credit risk and other credit enhancements
In most cases, maximum credit risk exposure is reduced by collateral, credit enhancements and other
actions which mitigate the Group’s exposure. The BBVA Group applies a credit risk hedging and mitigation
policy deriving from a banking approach focused on relationship banking. The existence of guarantees could
be a necessary but not sufficient instrument for accepting risks, as the assumption of risks by the Group
requires prior evaluation of the debtor’s capacity for repayment, or that the debtor can generate sufficient
resources to allow the amortization of the risk incurred under the agreed terms.
The policy of accepting risks is therefore organized into three different levels in the BBVA Group:
Analysis of the financial risk of the operation, based on the debtor’s capacity for repayment or
generation of funds.
The constitution of guarantees that are adequate, or at any rate generally accepted, for the risk
assumed, in any of the generally accepted forms: monetary, secured, personal or hedge guarantees;
and finally.
Assessment of the repayment risk (asset liquidity) of the guarantees received.
The procedures for the management and valuation of collateral are set out in the Corporate Policies (retail
and wholesale), which establish the basic principles for credit risk management, including the management
of collaterals assigned in transactions with customers.
The methods used to value the collateral are in line with the best market practices and imply the use of
appraisal of real-estate collateral, the market price in market securities, the trading price of shares in mutual
funds, etc. All the collaterals assigned must be properly drawn up and entered in the corresponding register.
They must also have the approval of the Group’s legal units.
The following is a description of the main types of collateral for each financial instrument class:
Financial instruments held for trading: The guarantees or credit enhancements obtained directly
from the issuer or counterparty are implicit in the clauses of the instrument.
Derivatives and hedging derivatives: In derivatives, credit risk is minimized through contractual
netting agreements, where positive- and negative-value derivatives with the same counterparty are
offset for their net balance. There may likewise be other kinds of guarantees, depending on
counterparty solvency and the nature of the transaction.
Other financial assets designated at fair value through profit or loss and Available-for-sale financial
assets: The guarantees or credit enhancements obtained directly from the issuer or counterparty
are inherent to the structure of the instrument.
Loans and receivables:
• Loans and advances to credit institutions: These usually only have the counterparty’s personal
guarantee.
• Loans and advances to customers: Most of these loans and advances are backed by personal
guarantees extended by the own customer. There may also be collateral to secure loans and
advances to customers (such as mortgages, cash collaterals, pledged securities and other
collateral), or to obtain other credit enhancements (bonds, hedging, etc.).
• Debt securities: The guarantees or credit enhancements obtained directly from the issuer or
counterparty are inherent to the structure of the instrument.
Collateralized loans granted by the Group as of December 31, 2017, 2016 and 2015 excluding balances
deemed impaired, is broken down in Note 13.2.
P. 79 Translation of the Consolidated Financial Statements originally issued in Spanish and prepared in accordance with EU-IFRSs, as adopted by the European Union (See Note 1 and 56). In the event of a discrepancy, the Spanish language version prevails.
Financial guarantees, other contingent risks and drawable by third parties: These have the
counterparty’s personal guarantee.
7.3.3 Credit quality of financial assets that are neither past due nor impaired
The BBVA Group has tools (“scoring” and “rating”) that enable it to rank the credit quality of its operations
and customers based on an assessment and its correspondence with the probability of default (“PD”) scales.
To analyze the performance of PD, the Group has a series of tracking tools and historical databases that
collect the pertinent internally generated information, which can basically be grouped together into scoring
and rating models.
Scoring
Scoring is a decision-making model that contributes to both the arrangement and management of retail
loans: consumer loans, mortgages, credit cards for individuals, etc. Scoring is the tool used to decide to
originate a loan, what amount should be originated and what strategies can help establish the price, because
it is an algorithm that sorts transactions by their credit quality. This algorithm enables the BBVA Group to
assign a score to each transaction requested by a customer, on the basis of a series of objective
characteristics that have statistically been shown to discriminate between the quality and risk of this type of
transactions. The advantage of scoring lies in its simplicity and homogeneity: all that is needed is a series of
objective data for each customer, and this data is analyzed automatically using an algorithm.
There are three types of scoring, based on the information used and on its purpose:
Reactive scoring: measures the risk of a transaction requested by an individual using variables
relating to the requested transaction and to the customer’s socio-economic data available at the
time of the request. The new transaction is approved or rejected depending on the score.
Behavioral scoring: scores transactions for a given product in an outstanding risk portfolio of the
entity, enabling the credit rating to be tracked and the customer’s needs to be anticipated. It uses
transaction and customer variables available internally. Specifically, variables that refer to the
behavior of both the product and the customer.
Proactive scoring: gives a score at customer level using variables related to the individual’s general
behavior with the entity, and to his/her payment behavior in all the contracted products. The
purpose is to track the customer’s credit quality and it is used to pre-approved new transactions.
Rating
Rating tools, as opposed to scoring tools, do not assess transactions but focus on the rating of customers
instead: companies, corporations, SMEs, general governments, etc. A rating tool is an instrument that, based
on a detailed financial study, helps determine a customer’s ability to meet his/her financial obligations. The
final rating is usually a combination of various factors: on one hand, quantitative factors, and on the other
hand, qualitative factors. It is a middle road between an individual analysis and a statistical analysis.
The main difference between ratings and scorings is that the latter are used to assess retail products, while
ratings use a wholesale banking customer approach. Moreover, scorings only include objective variables,
while ratings add qualitative information. And although both are based on statistical studies, adding a
business view, rating tools give more weight to the business criterion compared to scoring tools.
For portfolios where the number of defaults is low (sovereign risk, corporates, financial entities, etc.) the
internal information is supplemented by “benchmarking” of the external rating agencies (Moody’s, Standard
& Poor’s and Fitch). To this end, each year the PDs compiled by the rating agencies at each level of risk rating
are compared, and the measurements compiled by the various agencies are mapped against those of the
BBVA master rating scale.
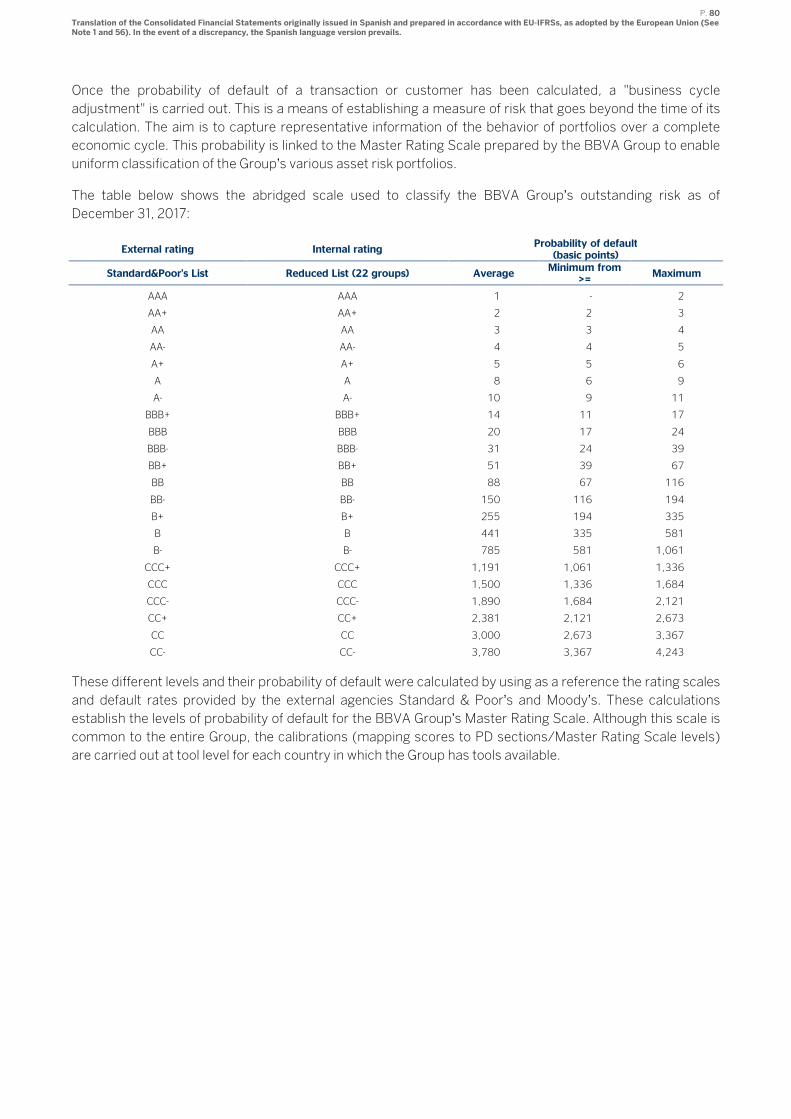
P. 80 Translation of the Consolidated Financial Statements originally issued in Spanish and prepared in accordance with EU-IFRSs, as adopted by the European Union (See Note 1 and 56). In the event of a discrepancy, the Spanish language version prevails.
Once the probability of default of a transaction or customer has been calculated, a "business cycle
adjustment" is carried out. This is a means of establishing a measure of risk that goes beyond the time of its
calculation. The aim is to capture representative information of the behavior of portfolios over a complete
economic cycle. This probability is linked to the Master Rating Scale prepared by the BBVA Group to enable
uniform classification of the Group’s various asset risk portfolios.
The table below shows the abridged scale used to classify the BBVA Group’s outstanding risk as of
December 31, 2017:
External rating Internal rating Probability of default
(basic points)
Standard&Poor's List Reduced List (22 groups) Average Minimum from
>= Maximum
AAA AAA 1 - 2
AA+ AA+ 2 2 3
AA AA 3 3 4
AA- AA- 4 4 5
A+ A+ 5 5 6
A A 8 6 9
A- A- 10 9 11
BBB+ BBB+ 14 11 17
BBB BBB 20 17 24
BBB- BBB- 31 24 39
BB+ BB+ 51 39 67
BB BB 88 67 116
BB- BB- 150 116 194
B+ B+ 255 194 335
B B 441 335 581
B- B- 785 581 1,061
CCC+ CCC+ 1,191 1,061 1,336
CCC CCC 1,500 1,336 1,684
CCC- CCC- 1,890 1,684 2,121
CC+ CC+ 2,381 2,121 2,673
CC CC 3,000 2,673 3,367
CC- CC- 3,780 3,367 4,243
These different levels and their probability of default were calculated by using as a reference the rating scales
and default rates provided by the external agencies Standard & Poor’s and Moody’s. These calculations
establish the levels of probability of default for the BBVA Group’s Master Rating Scale. Although this scale is
common to the entire Group, the calibrations (mapping scores to PD sections/Master Rating Scale levels)
are carried out at tool level for each country in which the Group has tools available.
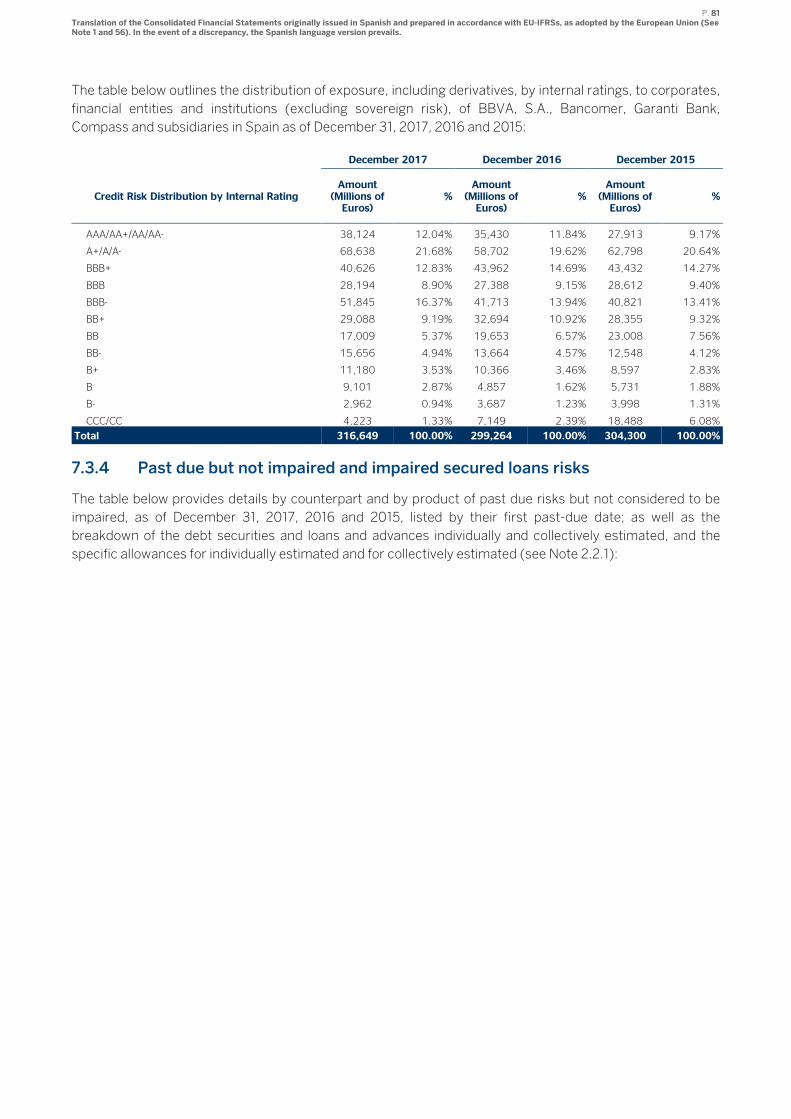
P. 81 Translation of the Consolidated Financial Statements originally issued in Spanish and prepared in accordance with EU-IFRSs, as adopted by the European Union (See Note 1 and 56). In the event of a discrepancy, the Spanish language version prevails.
The table below outlines the distribution of exposure, including derivatives, by internal ratings, to corporates,
financial entities and institutions (excluding sovereign risk), of BBVA, S.A., Bancomer, Garanti Bank,
Compass and subsidiaries in Spain as of December 31, 2017, 2016 and 2015:
December 2017 December 2016 December 2015
Credit Risk Distribution by Internal Rating Amount (Millions of Euros)
% Amount (Millions of Euros)
% Amount (Millions of Euros)
%
AAA/AA+/AA/AA- 38,124 12.04% 35,430 11.84% 27,913 9.17%
A+/A/A- 68,638 21.68% 58,702 19.62% 62,798 20.64%
BBB+ 40,626 12.83% 43,962 14.69% 43,432 14.27%
BBB 28,194 8.90% 27,388 9.15% 28,612 9.40%
BBB- 51,845 16.37% 41,713 13.94% 40,821 13.41%
BB+ 29,088 9.19% 32,694 10.92% 28,355 9.32%
BB 17,009 5.37% 19,653 6.57% 23,008 7.56%
BB- 15,656 4.94% 13,664 4.57% 12,548 4.12%
B+ 11,180 3.53% 10,366 3.46% 8,597 2.83%
B 9,101 2.87% 4,857 1.62% 5,731 1.88%
B- 2,962 0.94% 3,687 1.23% 3,998 1.31%
CCC/CC 4,223 1.33% 7,149 2.39% 18,488 6.08%
Total 316,649 100.00% 299,264 100.00% 304,300 100.00%
7.3.4 Past due but not impaired and impaired secured loans risks
The table below provides details by counterpart and by product of past due risks but not considered to be
impaired, as of December 31, 2017, 2016 and 2015, listed by their first past-due date; as well as the
breakdown of the debt securities and loans and advances individually and collectively estimated, and the
specific allowances for individually estimated and for collectively estimated (see Note 2.2.1):
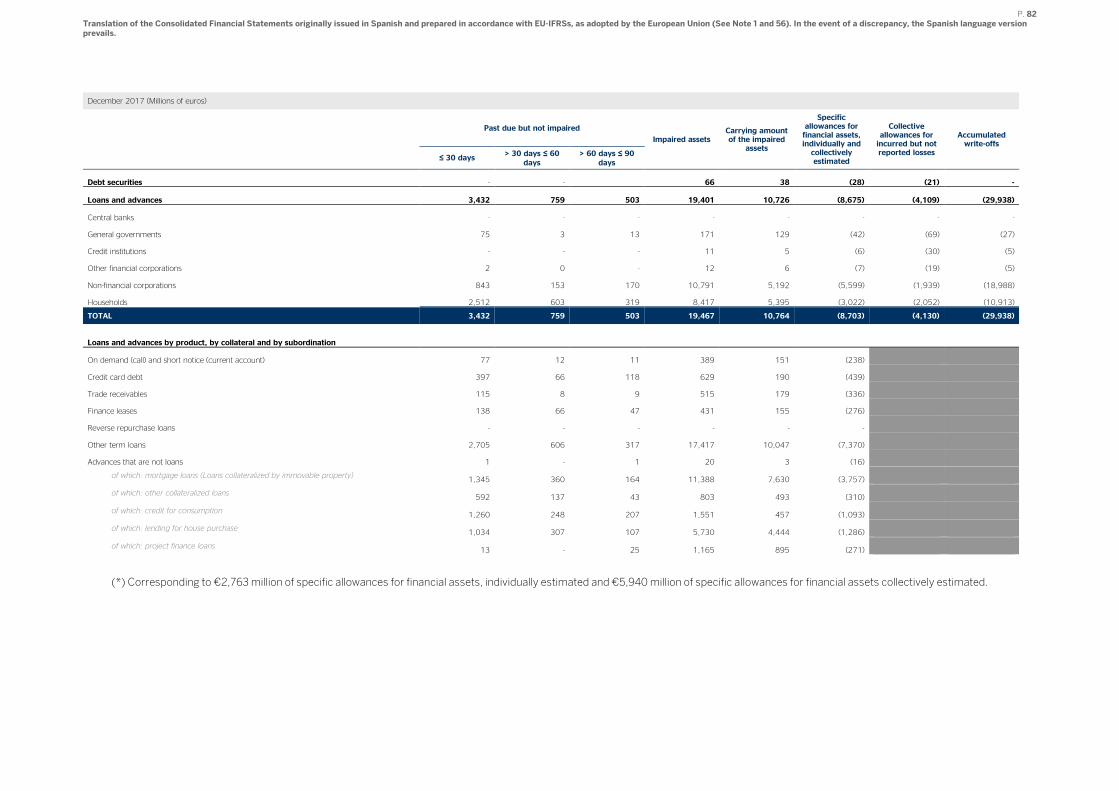
P. 82 Translation of the Consolidated Financial Statements originally issued in Spanish and prepared in accordance with EU-IFRSs, as adopted by the European Union (See Note 1 and 56). In the event of a discrepancy, the Spanish language version prevails.
December 2017 (Millions of euros)
Past due but not impaired
Impaired assets Carrying amount of the impaired
assets
Specific allowances for financial assets, individually and collectively estimated
Collective allowances for incurred but not reported losses
Accumulated write-offs
≤ 30 days > 30 days ≤ 60
days
> 60 days ≤ 90
days
Debt securities - - 66 38 (28) (21) -
Loans and advances 3,432 759 503 19,401 10,726 (8,675) (4,109) (29,938)
Central banks - - - - - - - -
General governments 75 3 13 171 129 (42) (69) (27)
Credit institutions - - - 11 5 (6) (30) (5)
Other financial corporations 2 0 - 12 6 (7) (19) (5)
Non-financial corporations 843 153 170 10,791 5,192 (5,599) (1,939) (18,988)
Households 2,512 603 319 8,417 5,395 (3,022) (2,052) (10,913)
TOTAL 3,432 759 503 19,467 10,764 (8,703) (4,130) (29,938)
Loans and advances by product, by collateral and by subordination
On demand (call) and short notice (current account) 77 12 11 389 151 (238)
Credit card debt 397 66 118 629 190 (439)
Trade receivables 115 8 9 515 179 (336)
Finance leases 138 66 47 431 155 (276)
Reverse repurchase loans - - - - - -
Other term loans 2,705 606 317 17,417 10,047 (7,370)
Advances that are not loans 1 - 1 20 3 (16)
of which: mortgage loans (Loans collateralized by immovable property) 1,345 360 164 11,388 7,630 (3,757)
of which: other collateralized loans 592 137 43 803 493 (310)
of which: credit for consumption 1,260 248 207 1,551 457 (1,093)
of which: lending for house purchase 1,034 307 107 5,730 4,444 (1,286)
of which: project finance loans 13 - 25 1,165 895 (271)
(*) Corresponding to €2,763 million of specific allowances for financial assets, individually estimated and €5,940 million of specific allowances for financial assets collectively estimated.
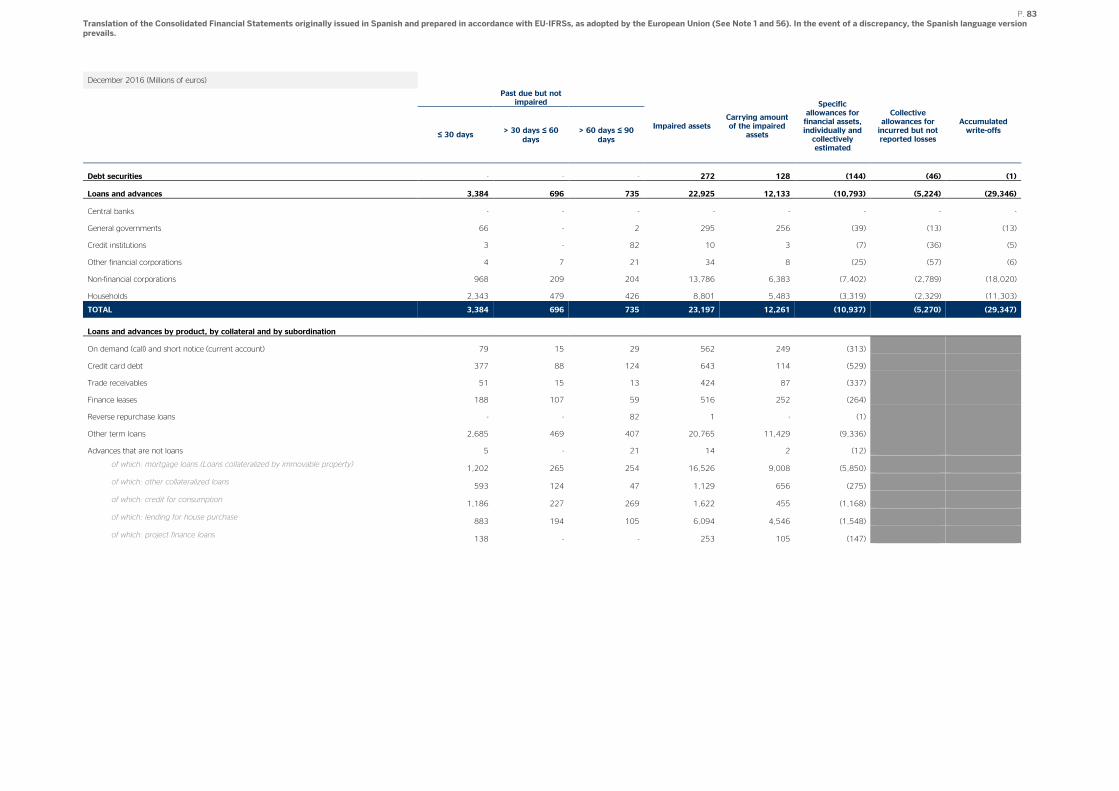
P. 83 Translation of the Consolidated Financial Statements originally issued in Spanish and prepared in accordance with EU-IFRSs, as adopted by the European Union (See Note 1 and 56). In the event of a discrepancy, the Spanish language version prevails.
December 2016 (Millions of euros)
Past due but not
impaired
Impaired assets Carrying amount of the impaired
assets
Specific allowances for financial assets, individually and collectively estimated
Collective allowances for incurred but not reported losses
Accumulated write-offs
≤ 30 days > 30 days ≤ 60
days
> 60 days ≤ 90
days
Debt securities - - - 272 128 (144) (46) (1)
Loans and advances 3,384 696 735 22,925 12,133 (10,793) (5,224) (29,346)
Central banks - - - - - - - -
General governments 66 - 2 295 256 (39) (13) (13)
Credit institutions 3 - 82 10 3 (7) (36) (5)
Other financial corporations 4 7 21 34 8 (25) (57) (6)
Non-financial corporations 968 209 204 13,786 6,383 (7,402) (2,789) (18,020)
Households 2,343 479 426 8,801 5,483 (3,319) (2,329) (11,303)
TOTAL 3,384 696 735 23,197 12,261 (10,937) (5,270) (29,347)
Loans and advances by product, by collateral and by subordination
On demand (call) and short notice (current account) 79 15 29 562 249 (313)
Credit card debt 377 88 124 643 114 (529)
Trade receivables 51 15 13 424 87 (337)
Finance leases 188 107 59 516 252 (264)
Reverse repurchase loans - - 82 1 - (1)
Other term loans 2,685 469 407 20,765 11,429 (9,336)
Advances that are not loans 5 - 21 14 2 (12)
of which: mortgage loans (Loans collateralized by immovable property) 1,202 265 254 16,526 9,008 (5,850)
of which: other collateralized loans 593 124 47 1,129 656 (275)
of which: credit for consumption 1,186 227 269 1,622 455 (1,168)
of which: lending for house purchase 883 194 105 6,094 4,546 (1,548)
of which: project finance loans 138 - - 253 105 (147)
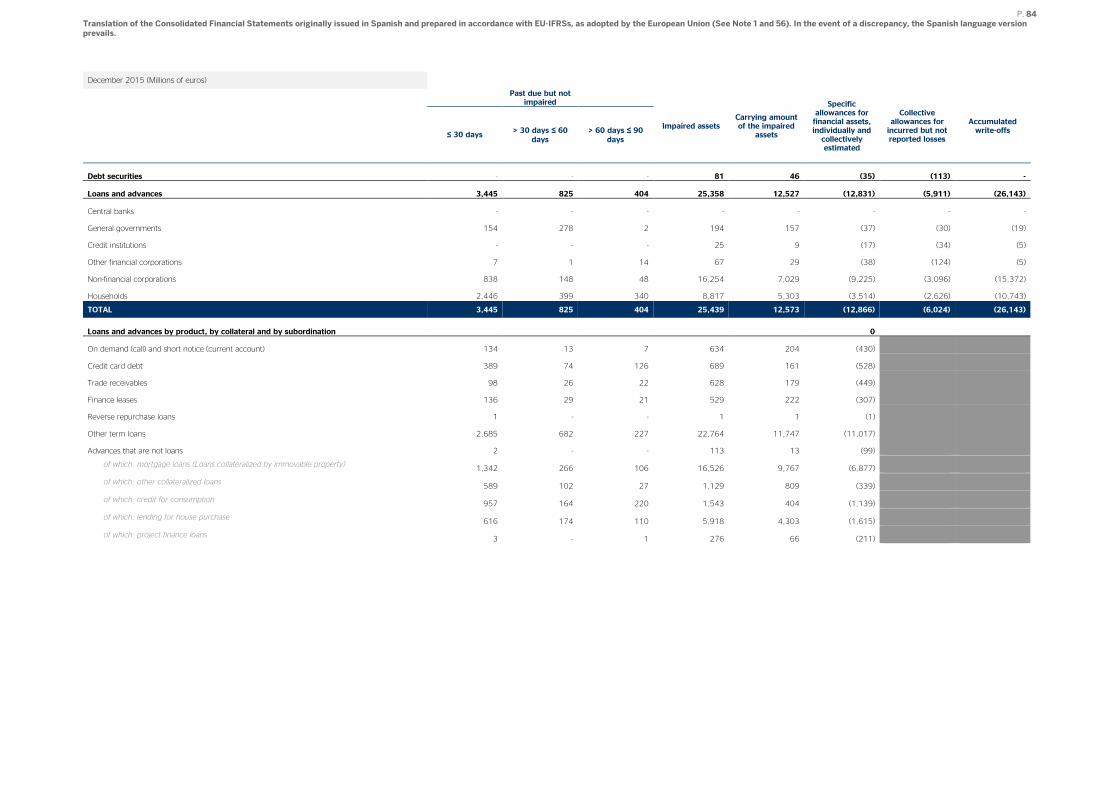
P. 84 Translation of the Consolidated Financial Statements originally issued in Spanish and prepared in accordance with EU-IFRSs, as adopted by the European Union (See Note 1 and 56). In the event of a discrepancy, the Spanish language version prevails.
December 2015 (Millions of euros)
Past due but not
impaired
Impaired assets Carrying amount of the impaired
assets
Specific allowances for financial assets, individually and collectively estimated
Collective allowances for incurred but not reported losses
Accumulated write-offs
≤ 30 days > 30 days ≤ 60
days
> 60 days ≤ 90
days
Debt securities - - - 81 46 (35) (113) -
Loans and advances 3,445 825 404 25,358 12,527 (12,831) (5,911) (26,143)
Central banks - - - - - - - -
General governments 154 278 2 194 157 (37) (30) (19)
Credit institutions - - - 25 9 (17) (34) (5)
Other financial corporations 7 1 14 67 29 (38) (124) (5)
Non-financial corporations 838 148 48 16,254 7,029 (9,225) (3,096) (15,372)
Households 2,446 399 340 8,817 5,303 (3,514) (2,626) (10,743)
TOTAL 3,445 825 404 25,439 12,573 (12,866) (6,024) (26,143)
Loans and advances by product, by collateral and by subordination 0
On demand (call) and short notice (current account) 134 13 7 634 204 (430)
Credit card debt 389 74 126 689 161 (528)
Trade receivables 98 26 22 628 179 (449)
Finance leases 136 29 21 529 222 (307)
Reverse repurchase loans 1 - - 1 1 (1)
Other term loans 2,685 682 227 22,764 11,747 (11,017)
Advances that are not loans 2 - - 113 13 (99)
of which: mortgage loans (Loans collateralized by immovable property) 1,342 266 106 16,526 9,767 (6,877)
of which: other collateralized loans 589 102 27 1,129 809 (339)
of which: credit for consumption 957 164 220 1,543 404 (1,139)
of which: lending for house purchase 616 174 110 5,918 4,303 (1,615)
of which: project finance loans 3 - 1 276 66 (211)
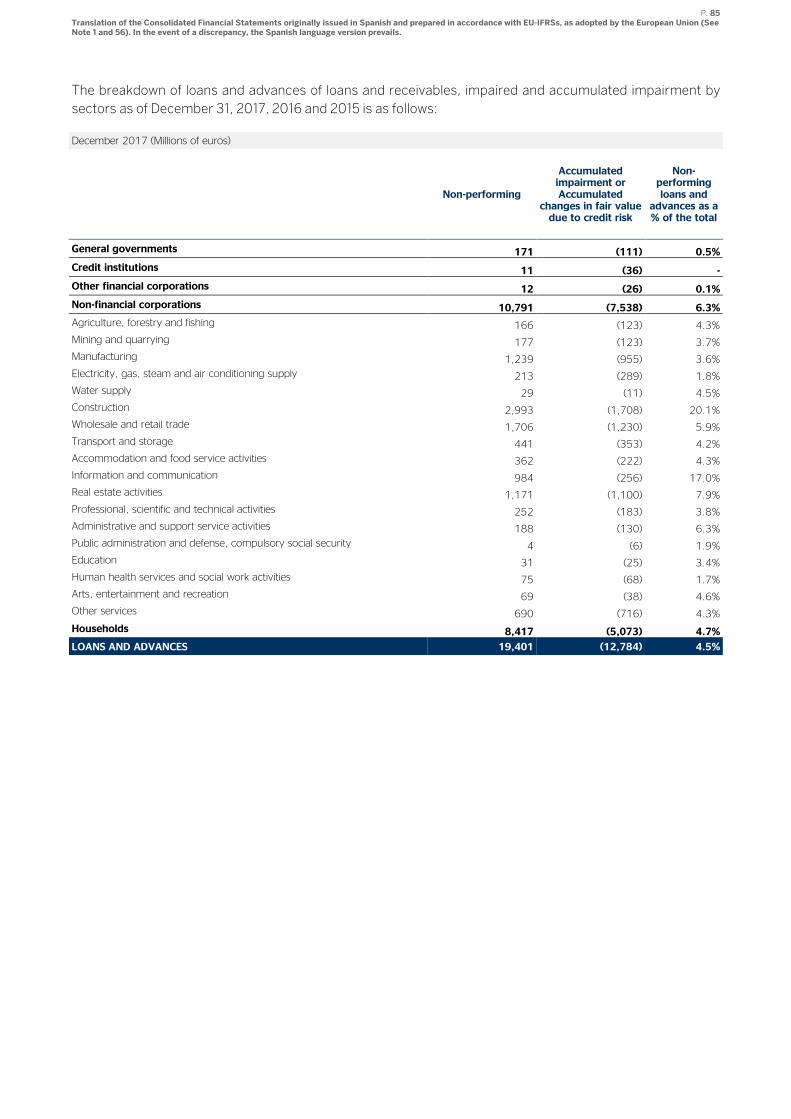
P. 85 Translation of the Consolidated Financial Statements originally issued in Spanish and prepared in accordance with EU-IFRSs, as adopted by the European Union (See Note 1 and 56). In the event of a discrepancy, the Spanish language version prevails.
The breakdown of loans and advances of loans and receivables, impaired and accumulated impairment by
sectors as of December 31, 2017, 2016 and 2015 is as follows:
December 2017 (Millions of euros)
Non-performing
Accumulated impairment or Accumulated
changes in fair value due to credit risk
Non-performing loans and
advances as a % of the total
General governments 171 (111) 0.5%
Credit institutions 11 (36) -
Other financial corporations 12 (26) 0.1%
Non-financial corporations 10,791 (7,538) 6.3%
Agriculture, forestry and fishing 166 (123) 4.3%
Mining and quarrying 177 (123) 3.7%
Manufacturing 1,239 (955) 3.6%
Electricity, gas, steam and air conditioning supply 213 (289) 1.8%
Water supply 29 (11) 4.5%
Construction 2,993 (1,708) 20.1%
Wholesale and retail trade 1,706 (1,230) 5.9%
Transport and storage 441 (353) 4.2%
Accommodation and food service activities 362 (222) 4.3%
Information and communication 984 (256) 17.0%
Real estate activities 1,171 (1,100) 7.9%
Professional, scientific and technical activities 252 (183) 3.8%
Administrative and support service activities 188 (130) 6.3%
Public administration and defense, compulsory social security 4 (6) 1.9%
Education 31 (25) 3.4%
Human health services and social work activities 75 (68) 1.7%
Arts, entertainment and recreation 69 (38) 4.6%
Other services 690 (716) 4.3%
Households 8,417 (5,073) 4.7%
LOANS AND ADVANCES 19,401 (12,784) 4.5%
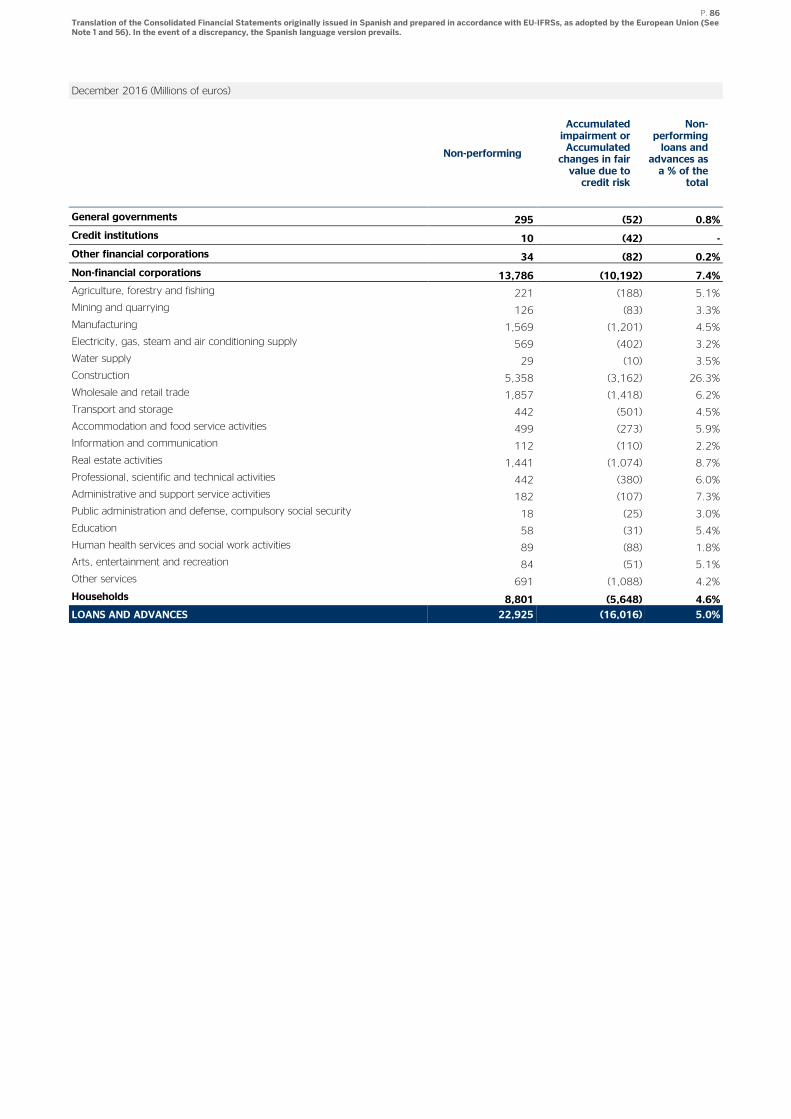
P. 86 Translation of the Consolidated Financial Statements originally issued in Spanish and prepared in accordance with EU-IFRSs, as adopted by the European Union (See Note 1 and 56). In the event of a discrepancy, the Spanish language version prevails.
December 2016 (Millions of euros)
Non-performing
Accumulated impairment or Accumulated changes in fair value due to credit risk
Non-performing loans and
advances as a % of the
total
General governments 295 (52) 0.8%
Credit institutions 10 (42) -
Other financial corporations 34 (82) 0.2%
Non-financial corporations 13,786 (10,192) 7.4%
Agriculture, forestry and fishing 221 (188) 5.1%
Mining and quarrying 126 (83) 3.3%
Manufacturing 1,569 (1,201) 4.5%
Electricity, gas, steam and air conditioning supply 569 (402) 3.2%
Water supply 29 (10) 3.5%
Construction 5,358 (3,162) 26.3%
Wholesale and retail trade 1,857 (1,418) 6.2%
Transport and storage 442 (501) 4.5%
Accommodation and food service activities 499 (273) 5.9%
Information and communication 112 (110) 2.2%
Real estate activities 1,441 (1,074) 8.7%
Professional, scientific and technical activities 442 (380) 6.0%
Administrative and support service activities 182 (107) 7.3%
Public administration and defense, compulsory social security 18 (25) 3.0%
Education 58 (31) 5.4%
Human health services and social work activities 89 (88) 1.8%
Arts, entertainment and recreation 84 (51) 5.1%
Other services 691 (1,088) 4.2%
Households 8,801 (5,648) 4.6%
LOANS AND ADVANCES 22,925 (16,016) 5.0%
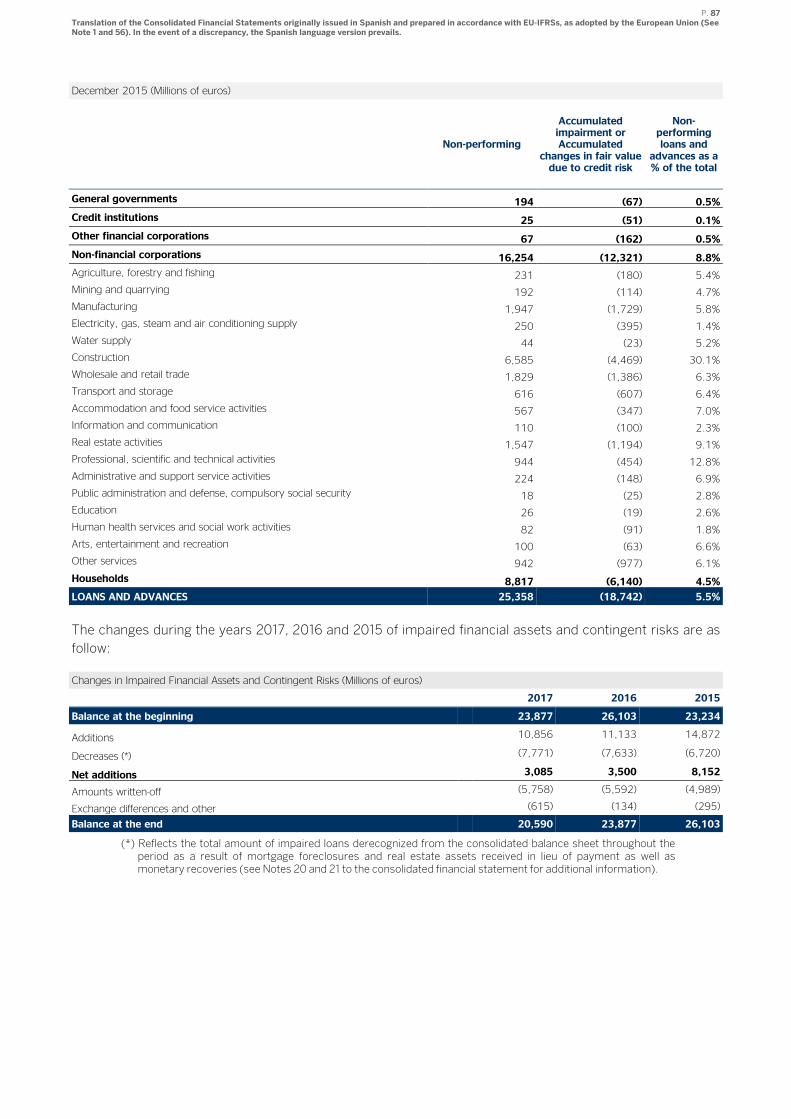
P. 87 Translation of the Consolidated Financial Statements originally issued in Spanish and prepared in accordance with EU-IFRSs, as adopted by the European Union (See Note 1 and 56). In the event of a discrepancy, the Spanish language version prevails.
December 2015 (Millions of euros)
Non-performing
Accumulated impairment or Accumulated
changes in fair value due to credit risk
Non-performing loans and
advances as a % of the total
General governments 194 (67) 0.5%
Credit institutions 25 (51) 0.1%
Other financial corporations 67 (162) 0.5%
Non-financial corporations 16,254 (12,321) 8.8%
Agriculture, forestry and fishing 231 (180) 5.4%
Mining and quarrying 192 (114) 4.7%
Manufacturing 1,947 (1,729) 5.8%
Electricity, gas, steam and air conditioning supply 250 (395) 1.4%
Water supply 44 (23) 5.2%
Construction 6,585 (4,469) 30.1%
Wholesale and retail trade 1,829 (1,386) 6.3%
Transport and storage 616 (607) 6.4%
Accommodation and food service activities 567 (347) 7.0%
Information and communication 110 (100) 2.3%
Real estate activities 1,547 (1,194) 9.1%
Professional, scientific and technical activities 944 (454) 12.8%
Administrative and support service activities 224 (148) 6.9%
Public administration and defense, compulsory social security 18 (25) 2.8%
Education 26 (19) 2.6%
Human health services and social work activities 82 (91) 1.8%
Arts, entertainment and recreation 100 (63) 6.6%
Other services 942 (977) 6.1%
Households 8,817 (6,140) 4.5%
LOANS AND ADVANCES 25,358 (18,742) 5.5%
The changes during the years 2017, 2016 and 2015 of impaired financial assets and contingent risks are as
follow:
Changes in Impaired Financial Assets and Contingent Risks (Millions of euros)
2017 2016 2015
Balance at the beginning 23,877 26,103 23,234
Additions 10,856 11,133 14,872
Decreases (*) (7,771) (7,633) (6,720)
Net additions 3,085 3,500 8,152
Amounts written-off (5,758) (5,592) (4,989)
Exchange differences and other (615) (134) (295)
Balance at the end 20,590 23,877 26,103
(*) Reflects the total amount of impaired loans derecognized from the consolidated balance sheet throughout the period as a result of mortgage foreclosures and real estate assets received in lieu of payment as well as monetary recoveries (see Notes 20 and 21 to the consolidated financial statement for additional information).
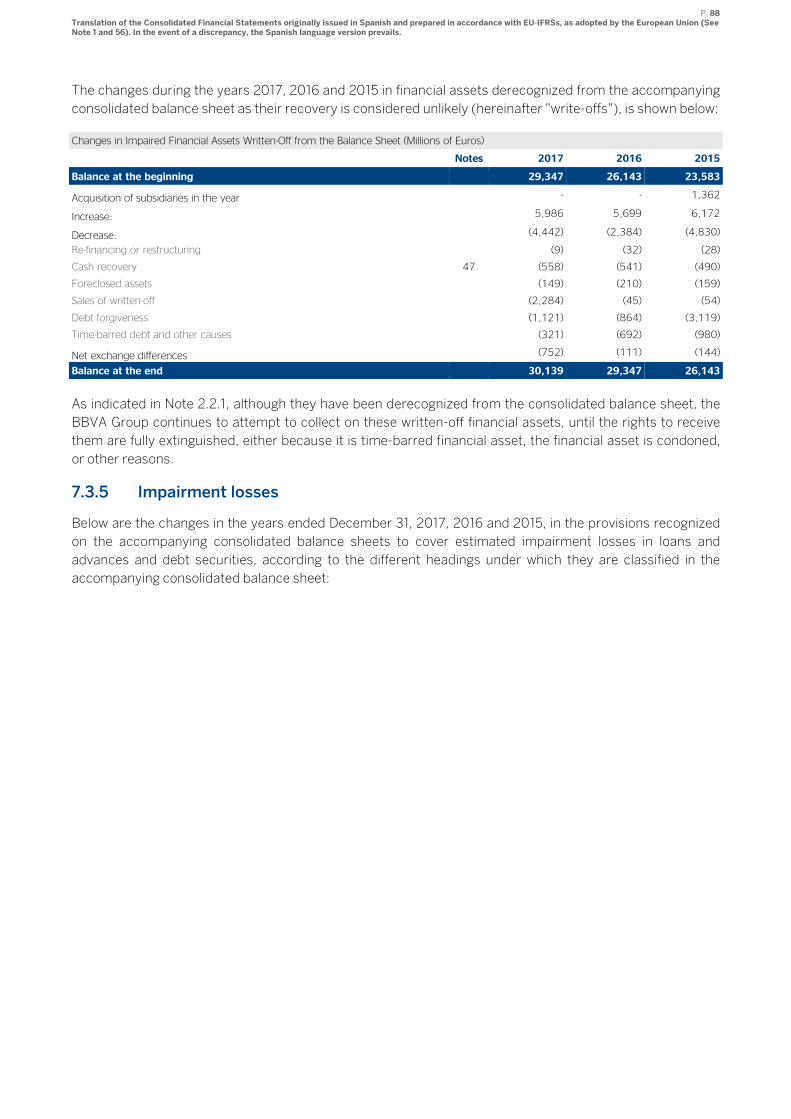
P. 88 Translation of the Consolidated Financial Statements originally issued in Spanish and prepared in accordance with EU-IFRSs, as adopted by the European Union (See Note 1 and 56). In the event of a discrepancy, the Spanish language version prevails.
The changes during the years 2017, 2016 and 2015 in financial assets derecognized from the accompanying
consolidated balance sheet as their recovery is considered unlikely (hereinafter "write-offs"), is shown below:
Changes in Impaired Financial Assets Written-Off from the Balance Sheet (Millions of Euros)
Notes 2017 2016 2015
Balance at the beginning 29,347 26,143 23,583
Acquisition of subsidiaries in the year - - 1,362
Increase: 5,986 5,699 6,172
Decrease: (4,442) (2,384) (4,830)
Re-financing or restructuring (9) (32) (28)
Cash recovery 47 (558) (541) (490)
Foreclosed assets (149) (210) (159)
Sales of written-off (2,284) (45) (54)
Debt forgiveness (1,121) (864) (3,119)
Time-barred debt and other causes (321) (692) (980)
Net exchange differences (752) (111) (144)
Balance at the end 30,139 29,347 26,143
As indicated in Note 2.2.1, although they have been derecognized from the consolidated balance sheet, the
BBVA Group continues to attempt to collect on these written-off financial assets, until the rights to receive
them are fully extinguished, either because it is time-barred financial asset, the financial asset is condoned,
or other reasons.
7.3.5 Impairment losses
Below are the changes in the years ended December 31, 2017, 2016 and 2015, in the provisions recognized
on the accompanying consolidated balance sheets to cover estimated impairment losses in loans and
advances and debt securities, according to the different headings under which they are classified in the
accompanying consolidated balance sheet:
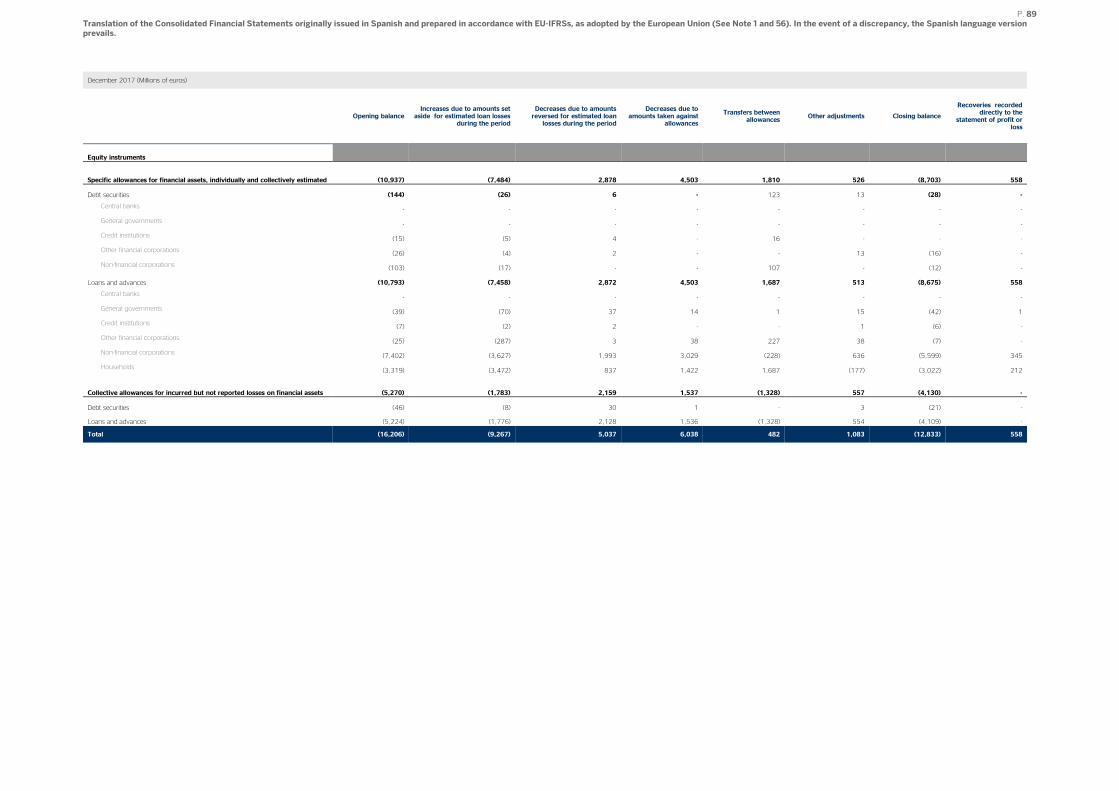
P. 89 Translation of the Consolidated Financial Statements originally issued in Spanish and prepared in accordance with EU-IFRSs, as adopted by the European Union (See Note 1 and 56). In the event of a discrepancy, the Spanish language version prevails.
December 2017 (Millions of euros)
Opening balance Increases due to amounts set
aside for estimated loan losses during the period
Decreases due to amounts reversed for estimated loan losses during the period
Decreases due to amounts taken against
allowances
Transfers between allowances
Other adjustments Closing balance
Recoveries recorded directly to the
statement of profit or loss
Equity instruments
Specific allowances for financial assets, individually and collectively estimated (10,937) (7,484) 2,878 4,503 1,810 526 (8,703) 558
Debt securities (144) (26) 6 - 123 13 (28) -
Central banks - - - - - - - -
General governments - - - - - - - -
Credit institutions (15) (5) 4 - 16 - - -
Other financial corporations (26) (4) 2 - - 13 (16) -
Non-financial corporations (103) (17) - - 107 - (12) -
Loans and advances (10,793) (7,458) 2,872 4,503 1,687 513 (8,675) 558
Central banks - - - - - - - -
General governments (39) (70) 37 14 1 15 (42) 1
Credit institutions (7) (2) 2 - - 1 (6) -
Other financial corporations (25) (287) 3 38 227 38 (7) -
Non-financial corporations (7,402) (3,627) 1,993 3,029 (228) 636 (5,599) 345
Households (3,319) (3,472) 837 1,422 1,687 (177) (3,022) 212
Collective allowances for incurred but not reported losses on financial assets (5,270) (1,783) 2,159 1,537 (1,328) 557 (4,130) -
Debt securities (46) (8) 30 1 - 3 (21) -
Loans and advances (5,224) (1,776) 2,128 1,536 (1,328) 554 (4,109) -
Total (16,206) (9,267) 5,037 6,038 482 1,083 (12,833) 558
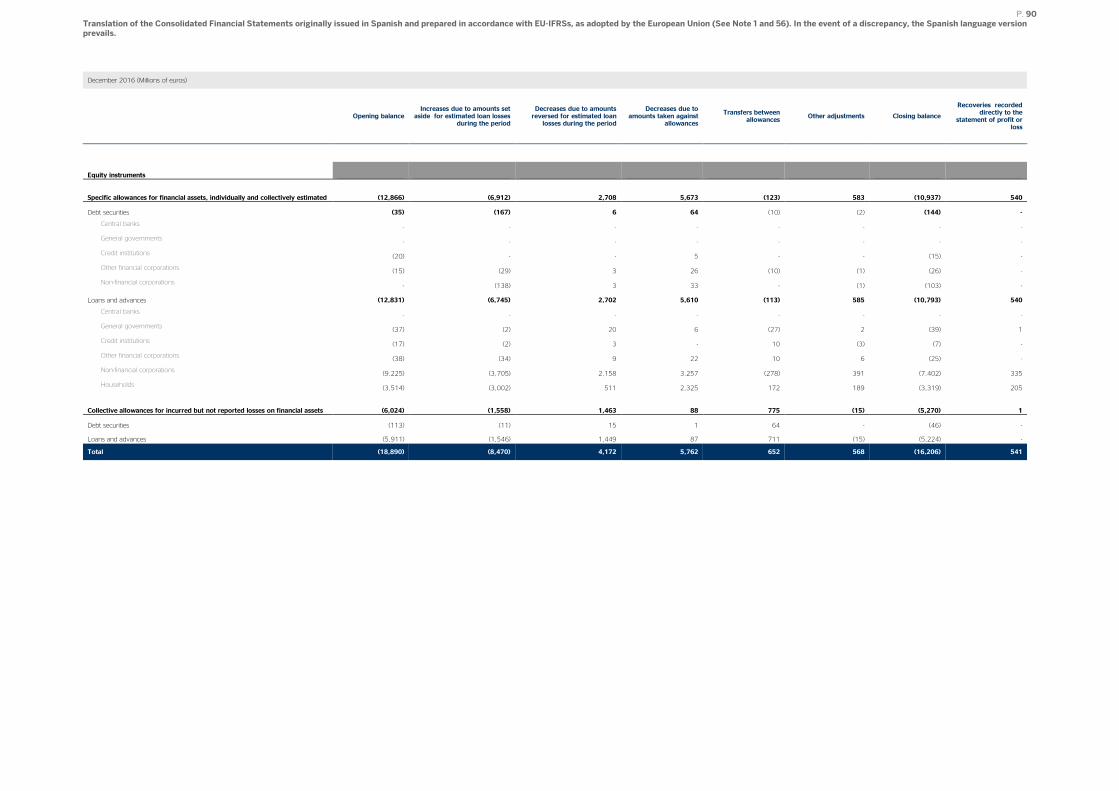
P. 90 Translation of the Consolidated Financial Statements originally issued in Spanish and prepared in accordance with EU-IFRSs, as adopted by the European Union (See Note 1 and 56). In the event of a discrepancy, the Spanish language version prevails.
December 2016 (Millions of euros)
Opening balance Increases due to amounts set
aside for estimated loan losses during the period
Decreases due to amounts reversed for estimated loan losses during the period
Decreases due to amounts taken against
allowances
Transfers between allowances
Other adjustments Closing balance
Recoveries recorded directly to the
statement of profit or loss
Equity instruments
Specific allowances for financial assets, individually and collectively estimated (12,866) (6,912) 2,708 5,673 (123) 583 (10,937) 540
Debt securities (35) (167) 6 64 (10) (2) (144) -
Central banks - - - - - - - -
General governments - - - - - - - -
Credit institutions (20) - - 5 - - (15) -
Other financial corporations (15) (29) 3 26 (10) (1) (26) -
Non-financial corporations - (138) 3 33 - (1) (103) -
Loans and advances (12,831) (6,745) 2,702 5,610 (113) 585 (10,793) 540
Central banks - - - - - - - -
General governments (37) (2) 20 6 (27) 2 (39) 1
Credit institutions (17) (2) 3 - 10 (3) (7) -
Other financial corporations (38) (34) 9 22 10 6 (25) -
Non-financial corporations (9,225) (3,705) 2,158 3,257 (278) 391 (7,402) 335
Households (3,514) (3,002) 511 2,325 172 189 (3,319) 205
Collective allowances for incurred but not reported losses on financial assets (6,024) (1,558) 1,463 88 775 (15) (5,270) 1
Debt securities (113) (11) 15 1 64 - (46) -
Loans and advances (5,911) (1,546) 1,449 87 711 (15) (5,224) -
Total (18,890) (8,470) 4,172 5,762 652 568 (16,206) 541

P. 91 Translation of the Consolidated Financial Statements originally issued in Spanish and prepared in accordance with EU-IFRSs, as adopted by the European Union (See Note 1 and 56). In the event of a discrepancy, the Spanish language version prevails.
December 2015 (Millions of euros)
Opening balance Increases due to amounts set
aside for estimated loan losses during the period
Decreases due to amounts reversed for estimated loan losses during the period
Decreases due to amounts taken against
allowances
Transfers between allowances
Other adjustments Closing balance
Recoveries recorded directly to the
statement of profit or loss
Equity instruments
Specific allowances for financial assets, individually and collectively estimated (10,519) (6,172) 1,435 5,162 388 (3,160) (12,866) 490
Debt securities (33) (6) 8 - - (3) (35) -
Central banks - - - - - - - -
General governments - - - - - - - -
Credit institutions (17) (2) 1 - (1) - (20) -
Other financial corporations (16) (4) 7 - 1 (3) (15) -
Non-financial corporations - - - - - - - -
Loans and advances (10,487) (6,166) 1,427 5,162 388 (3,156) (12,831) 490
Central banks - - - - - - - -
General governments (24) (16) 17 3 (12) (6) (37) -
Credit institutions (18) (11) 5 - 9 (2) (17) 1
Other financial corporations (21) (276) 2 23 231 3 (38) -
Non-financial corporations (7,610) (3,229) 1,169 2,580 (298) (1,837) (9,225) 301
Households (2,814) (2,635) 234 2,555 459 (1,313) (3,514) 187
Collective allowances for incurred but not reported losses on financial assets (3,829) (578) 576 110 (486) (1,817) (6,024) -
Debt securities (42) (9) 6 - (67) (1) (113) -
Loans and advances (3,787) (569) 570 110 (420) (1,816) (5,911) -
Total (14,348) (6,750) 2,011 5,272 (98) (4,977) (18,890) 490
P. 92 Translation of the Consolidated Financial Statements originally issued in Spanish and prepared in accordance with EU-IFRSs, as adopted by the European Union (See Note 1 and 56). In the event of a discrepancy, the Spanish language version prevails.
7.3.6 Refinancing and restructuring operations
Group policies and principles with respect to refinancing and restructuring operations
Refinancing and restructuring operations (see definition in the Glossary) are carried out with customers who
have requested such an operation in order to meet their current loan payments if they are expected, or may
be expected, to experience financial difficulty in making the payments in the future.
The basic aim of a refinancing and restructuring operation is to provide the customer with a situation of
financial viability over time by adapting repayment of the loan incurred with the Group to the customer’s new
situation of fund generation. The use of refinancing and restructuring for other purposes, such as to delay
loss recognition, is contrary to BBVA Group policies.
The BBVA Group’s refinancing and restructuring policies are based on the following general principles:
Refinancing and restructuring is authorized according to the capacity of customers to pay the new
installments. This is done by first identifying the origin of the payment difficulties and then carrying
out an analysis of the customers’ viability, including an updated analysis of their economic and
financial situation and capacity to pay and generate funds. If the customer is a company, the analysis
also covers the situation of the industry in which it operates.
With the aim of increasing the solvency of the operation, new guarantees and/or guarantors of
demonstrable solvency are obtained where possible. An essential part of this process is an analysis
of the effectiveness of both the new and original guarantees.
This analysis is carried out from the overall customer or group perspective.
Refinancing and restructuring operations do not in general increase the amount of the customer’s
loan, except for the expenses inherent to the operation itself.
The capacity to refinance and restructure loan is not delegated to the branches, but decided on by
the risk units.
The decisions made are reviewed from time to time with the aim of evaluating full compliance with
refinancing and restructuring policies.
These general principles are adapted in each case according to the conditions and circumstances of each
geographical area in which the Group operates, and to the different types of customers involved.
In the case of retail customers (private individuals), the main aim of the BBVA Group’s policy on refinancing
and restructuring loan is to avoid default arising from a customer’s temporary liquidity problems by
implementing structural solutions that do not increase the balance of customer’s loan. The solution required
is adapted to each case and the loan repayment is made easier, in accordance with the following principles:
Analysis of the viability of operations based on the customer’s willingness and ability to pay, which
may be reduced, but should nevertheless be present. The customer must therefore repay at least
the interest on the operation in all cases. No arrangements may be concluded that involve a grace
period for both principal and interest.
Refinancing and restructuring of operations is only allowed on those loans in which the BBVA Group
originally entered into.
Customers subject to refinancing and restructuring operations are excluded from marketing
campaigns of any kind.
In the case of non-retail customers (mainly companies, enterprises and corporates),
refinancing/restructuring is authorized according to an economic and financial viability plan based on:
P. 93 Translation of the Consolidated Financial Statements originally issued in Spanish and prepared in accordance with EU-IFRSs, as adopted by the European Union (See Note 1 and 56). In the event of a discrepancy, the Spanish language version prevails.
Forecasted future income, margins and cash flows to allow entities to implement cost adjustment
measures (industrial restructuring) and a business development plan that can help reduce the level
of leverage to sustainable levels (capacity to access the financial markets).
Where appropriate, the existence of a divestment plan for assets and/or operating segments that
can generate cash to assist the deleveraging process.
The capacity of shareholders to contribute capital and/or guarantees that can support the viability of
the plan.
In accordance with the Group’s policy, the conclusion of a loan refinancing and restructuring operation does
not meet the loan is reclassified from "impaired" or "standard under special monitoring" to outstanding risk.
The reclassification to the "standard under special monitoring" or normal risk categories must be based on
the analysis mentioned earlier of the viability, upon completion of the probationary periods described below.
The Group maintains the policy of including risks related to refinanced and restructured loans as either:
"Impaired assets", as although the customer is up to date with payments, they are classified as
impaired for reasons other than their default when there are significant doubts that the terms of their
refinancing may not be met; or
"Normal-risk assets under special monitoring" until the conditions established for their consideration
as normal risk are met).
The conditions established for assets classified as “standard under special monitoring” to be reclassified out
of this category are as follows:
The customer must have paid past-due amounts (principal and interest) since the date of the
renegotiation or restructuring of the loan or other objective criteria, demonstrating the borrower´s
ability to pay, have been verified; and
At least two years must have elapsed since completion of the renegotiation or restructuring of the
loan;
It is unlikely that the customer will have financial difficulties and, therefore, it is expected that the
customer will be able to meet its loan payment obligations (principal and interest) in a timely
manner.
The BBVA Group’s refinancing and restructuring policy provides for the possibility of two modifications in a
24 month period for loans that are not in compliance with the payment schedule.
The internal models used to determine allowances for loan losses consider the restructuring and
renegotiation of a loan, as well as re-defaults on such a loan, by assigning a lower internal rating to
restructured and renegotiated loans than the average internal rating assigned to non-
restructured/renegotiated loans. This downgrade results in an increase in the probability of default (PD)
assigned to restructured/renegotiated loans (with the resulting PD being higher than the average PD of the
non- renegotiated loans in the same portfolios).
For quantitative information on refinancing and restructuring operations see Appendix XII.
7.4 Market risk
7.4.1 Market risk trading portfolios
Market risk originates as a result of movements in the market variables that impact the valuation of traded
financial products and assets. The main risks generated can be classified as follows:
P. 94 Translation of the Consolidated Financial Statements originally issued in Spanish and prepared in accordance with EU-IFRSs, as adopted by the European Union (See Note 1 and 56). In the event of a discrepancy, the Spanish language version prevails.
Interest-rate risk: This arises as a result of exposure to movements in the different interest-rate
curves involved in trading. Although the typical products that generate sensitivity to the movements
in interest rates are money-market products (deposits, interest-rate futures, call money swaps, etc.)
and traditional interest-rate derivatives (swaps and interest-rate options such as caps, floors,
swaptions, etc.), practically all the financial products are exposed to interest-rate movements due to
the effect that such movements have on the valuation of the financial discount.
Equity risk: This arises as a result of movements in share prices. This risk is generated in spot
positions in shares or any derivative products whose underlying asset is a share or an equity index.
Dividend risk is a sub-risk of equity risk, arising as an input for any equity option. Its variation may
affect the valuation of positions and it is therefore a factor that generates risk on the books.
Exchange-rate risk: This is caused by movements in the exchange rates of the different currencies in
which a position is held. As in the case of equity risk, this risk is generated in spot currency positions,
and in any derivative product whose underlying asset is an exchange rate. In addition, the quanto
effect (operations where the underlying asset and the instrument itself are denominated in different
currencies) means that in certain transactions in which the underlying asset is not a currency, an
exchange-rate risk is generated that has to be measured and monitored.
Credit-spread risk: Credit spread is an indicator of an issuer's credit quality. Spread risk occurs due
to variations in the levels of spread of both corporate and government issues, and affects positions in
bonds and credit derivatives.
Volatility risk: This occurs as a result of changes in the levels of implied price volatility of the different
market instruments on which derivatives are traded. This risk, unlike the others, is exclusively a
component of trading in derivatives and is defined as a first-order convexity risk that is generated in
all possible underlying assets in which there are products with options that require a volatility input
for their valuation.
The metrics developed to control and monitor market risk in BBVA Group are aligned with market practices
and are implemented consistently across all the local market risk units.
Measurement procedures are established in terms of the possible impact of negative market conditions on
the trading portfolio of the Group's Global Markets units, both under ordinary circumstances and in
situations of heightened risk factors.
The standard metric used to measure market risk is Value at Risk (“VaR”), which indicates the maximum loss
that may occur in the portfolios at a given confidence level (99%) and time horizon (one day). This statistic
value is widely used in the market and has the advantage of summing up in a single metric the risks inherent
to trading activity, taking into account how they are related and providing a prediction of the loss that the
trading book could sustain as a result of fluctuations in equity prices, interest rates, foreign exchange rates
and credit spreads. The market risk analysis considers risks, such as credit spread, basis risk, volatility and
correlation risk.
P. 95 Translation of the Consolidated Financial Statements originally issued in Spanish and prepared in accordance with EU-IFRSs, as adopted by the European Union (See Note 1 and 56). In the event of a discrepancy, the Spanish language version prevails.
Most of the headings on the Group's balance sheet subject to market risk are positions whose main metric
for measuring their market risk is VaR. This table shows the accounting lines of the consolidated balance
sheet as of December 31, 2017, 2016 and 2015 in which there is a market risk in trading activity subject to this
measurement:
Headings of the balance sheet under market risk (Millions of euros)
December 2017 December 2016 December 2015
Main market risk metrics -
VaR Main market risk metrics -
Others (*) Main market risk metrics -
VaR Main market risk metrics -
Others (*) Main market risk metrics -
VaR Main market risk metrics -
Others (*)
Assets subject to market risk
Financial assets held for trading 59,008 441 64,623 1,480 64,370 4,712
Available for sale financial assets 5,661 24,083 7,119 28,771 8,234 50,088
Of which: Equity instruments - 2,404 - 3,559 - 4,067
Derivatives - Hedging accounting 829 1,397 1,041 1,415 528 1,888
Liabilities subject to market risk
Financial liabilities held for trading 42,468 2,526 47,491 2,223 42,550 6,277
Derivatives - Hedging accounting 1,157 638 1,305 689 1,128 806
(*) Includes mainly assets and liabilities managed by ALCO.
Although the prior table shows details the financial positions subject to market risk, it should be noted that
the data are for information purposes only and do not reflect how the risk is managed in trading activity,
where it is not classified into assets and liabilities.
With respect to the risk measurement models used in BBVA Group, the Bank of Spain has authorized the use
of the internal model to determine bank capital requirements deriving from risk positions on the BBVA S.A.
and BBVA Bancomer trading book, which jointly account for around 70% and 66% of the Group’s trading-
book market risk as of December 31, 2017 and 2016. For the rest of the geographical areas (mainly South
America, Garanti and BBVA Compass), bank capital for the risk positions in the trading book is calculated
using the standard model.
The current management structure includes the monitoring of market-risk limits, consisting of a scheme of
limits based on VaR, economic capital (based on VaR measurements) and VaR sub-limits, as well as stop-
loss limits for each of the Group’s business units.
The model used estimates VaR in accordance with the "historical simulation" methodology, which involves
estimating losses and gains that would have taken place in the current portfolio if the changes in market
conditions that took place over a specific period of time in the past were repeated. Based on this information,
it infers the maximum expected loss of the current portfolio within a given confidence level. This model has
the advantage of reflecting precisely the historical distribution of the market variables and not assuming any
specific distribution of probability. The historical period used in this model is two years. The historical
simulation method is used in BBVA S.A., BBVA Bancomer, BBVA Chile, BBVA Colombia, Compass Bank and
Garanti.
VaR figures are estimated following two methodologies:
VaR without smoothing, which awards equal weight to the daily information for the previous two
years. This is currently the official methodology for measuring market risks for the purpose of
monitoring compliance with risk limits.
VaR with smoothing, which gives a greater weight to more recent market information. This metric
supplements the previous one.
In the case of South America (except BBVA Chile and BBVA Colombia), a parametric methodology is used to
measure risk in terms of VaR.
At the same time, and following the guidelines established by the Spanish and European authorities, BBVA
incorporates metrics in addition to VaR with the aim of meeting the Bank of Spain's regulatory requirements
P. 96 Translation of the Consolidated Financial Statements originally issued in Spanish and prepared in accordance with EU-IFRSs, as adopted by the European Union (See Note 1 and 56). In the event of a discrepancy, the Spanish language version prevails.
with respect to the calculation of bank capital for the trading book. Specifically, the new measures
incorporated in the Group since December 2011 (stipulated by Basel 2.5) are:
VaR: In regulatory terms, the VaR charge incorporates the stressed VaR charge, and the sum of the
two (VaR and stressed VaR) is calculated. This quantifies the losses associated with the movements
of the two risk factors inherent to market operations (interest rates, FX, RV, credit, etc.). Both VaR
and stressed VaR are rescaled by a regulatory multiplier set at three and by the square root of ten to
calculate the capital charge.
Specific Risk: Incremental Risk Capital (“IRC”) Quantification of the risks of default and downgrading
of the credit ratings of the bond and credit derivative positions in the portfolio. The specific capital
risk by IRC is a charge exclusively used in the geographical areas with the internal model approved
(BBVA S.A. and Bancomer). The capital charge is determined according to the associated losses (at
99.9% in a 1-year horizon under the hypothesis of constant risk) due to the rating migration and/or
default state the issuer of an asset. In addition, the price risk is included in sovereign positions for the
items specified.
Specific Risk: Securitization and correlation portfolios. Capital charge for securitizations and the
correlation portfolio to include the potential losses associated at the level of rating a specific credit
structure (rating). Both are calculated by the standard method. The scope of the correlation
portfolios refers to the FTD-type market operation and/or tranches of market CDOs and only for
positions with an active market and hedging capacity.
Validity tests are performed regularly on the risk measurement models used by the Group. They estimate the
maximum loss that could have been incurred in the positions with a certain level of probability (backtesting),
as well as measurements of the impact of extreme market events on risk positions (stress testing). As an
additional control measure, backtesting is conducted at trading desk level in order to enable more specific
monitoring of the validity of the measurement models.
Market risk in 2017
The Group’s market risk remains at low levels compared with the risk aggregates managed by BBVA,
particularly in terms of credit risk. This is due to the nature of the business. During year ended December 31,
2017 the average VaR was €27 million, below the figure of 2016, with a high on January 11, 2017 of €34
million. The evolution in the BBVA Group’s market risk during 2017, measured as VaR without smoothing
(see Glossary) with a 99% confidence level and a 1-day horizon (shown in millions of Euros) is as follows:
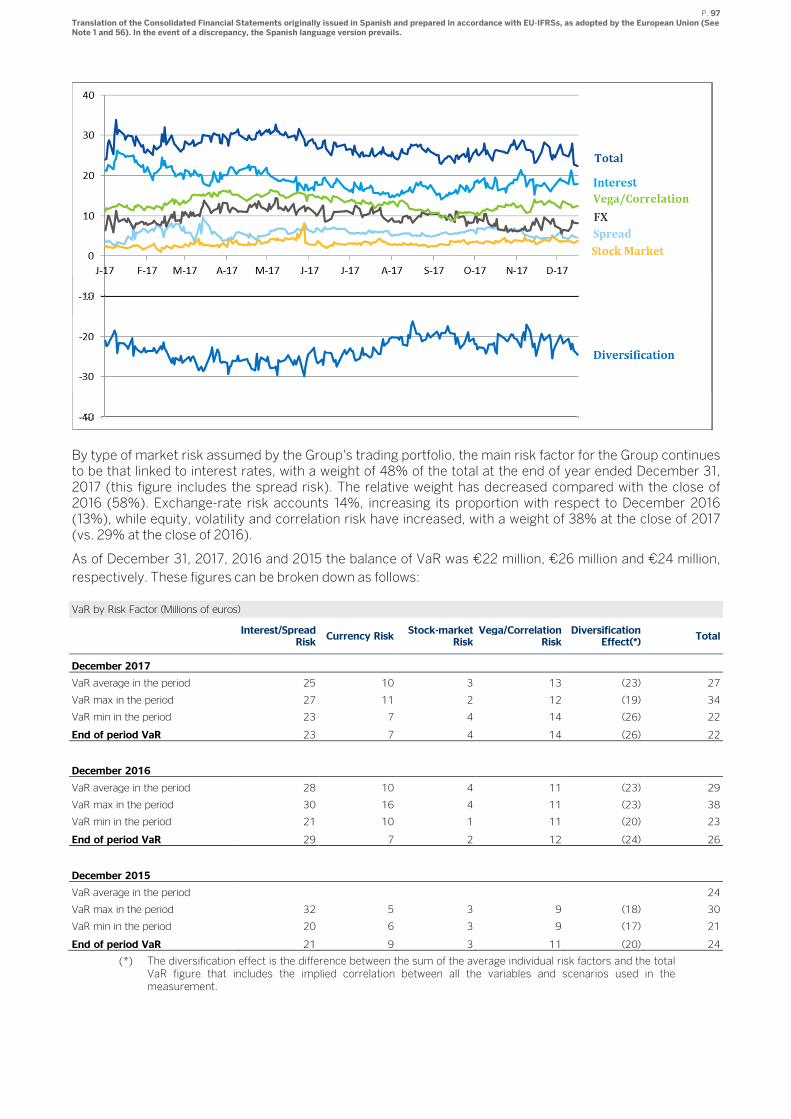
P. 97 Translation of the Consolidated Financial Statements originally issued in Spanish and prepared in accordance with EU-IFRSs, as adopted by the European Union (See Note 1 and 56). In the event of a discrepancy, the Spanish language version prevails.
By type of market risk assumed by the Group's trading portfolio, the main risk factor for the Group continues to be that linked to interest rates, with a weight of 48% of the total at the end of year ended December 31, 2017 (this figure includes the spread risk). The relative weight has decreased compared with the close of 2016 (58%). Exchange-rate risk accounts 14%, increasing its proportion with respect to December 2016 (13%), while equity, volatility and correlation risk have increased, with a weight of 38% at the close of 2017 (vs. 29% at the close of 2016).
As of December 31, 2017, 2016 and 2015 the balance of VaR was €22 million, €26 million and €24 million,
respectively. These figures can be broken down as follows:
VaR by Risk Factor (Millions of euros)
Interest/Spread
Risk Currency Risk
Stock-market Risk
Vega/Correlation Risk
Diversification Effect(*)
Total
December 2017
VaR average in the period 25 10 3 13 (23) 27
VaR max in the period 27 11 2 12 (19) 34
VaR min in the period 23 7 4 14 (26) 22
End of period VaR 23 7 4 14 (26) 22
December 2016
VaR average in the period 28 10 4 11 (23) 29
VaR max in the period 30 16 4 11 (23) 38
VaR min in the period 21 10 1 11 (20) 23
End of period VaR 29 7 2 12 (24) 26
December 2015
VaR average in the period 24
VaR max in the period 32 5 3 9 (18) 30
VaR min in the period 20 6 3 9 (17) 21
End of period VaR 21 9 3 11 (20) 24
(*) The diversification effect is the difference between the sum of the average individual risk factors and the total VaR figure that includes the implied correlation between all the variables and scenarios used in the measurement.
P. 98 Translation of the Consolidated Financial Statements originally issued in Spanish and prepared in accordance with EU-IFRSs, as adopted by the European Union (See Note 1 and 56). In the event of a discrepancy, the Spanish language version prevails.
Validation of the model
The internal market risk model is validated on a regular basis by backtesting in both BBVA S.A. and
Bancomer. The aim of backtesting is to validate the quality and precision of the internal market risk model
used by BBVA Group to estimate the maximum daily loss of a portfolio, at a 99% level of confidence and a
250-day time horizon, by comparing the Group's results and the risk measurements generated by the
internal market risk model. These tests showed that the internal market risk model of both BBVA, S.A. and
Bancomer is adequate and precise.
Two types of backtesting have been carried out during 2017, 2016 and 2015:
"Hypothetical" backtesting: the daily VaR is compared with the results obtained, not taking into
account the intraday results or the changes in the portfolio positions. This validates the
appropriateness of the market risk metrics for the end-of-day position.
"Real" backtesting: the daily VaR is compared with the total results, including intraday transactions,
but discounting the possible minimum charges or fees involved. This type of backtesting includes the
intraday risk in portfolios.
In addition, each of these two types of backtesting was carried out at the level of risk factor or business type,
thus making a deeper comparison of the results with respect to risk measurements.
For the period between the end of the year ended December 31, 2016 and the end of the year ended
December 31, 2016, it was carried out the backtesting of the internal VaR calculation model, comparing the
daily results obtained with the estimated risk level estimated by the internal VaR calculation model. At the
end of the semester the comparison showed the internal VaR calculation model was working correctly, within
the "green" zone (0-4 exceptions), thus validating the internal VaR calculation model, as has occurred each
year since the internal market risk model was approved for the Group.
Stress test analysis
A number of stress tests are carried out on BBVA Group's trading portfolios. First, global and local historical
scenarios are used that replicate the behavior of an extreme past event, such as for example the collapse of
Lehman Brothers or the "Tequilazo" crisis. These stress tests are complemented with simulated scenarios,
where the aim is to generate scenarios that have a significant impact on the different portfolios, but without
being anchored to any specific historical scenario. Finally, for some portfolios or positions, fixed stress tests
are also carried out that have a significant impact on the market variables affecting these positions.
Historical scenarios
The historical benchmark stress scenario for the BBVA Group is Lehman Brothers, whose sudden collapse in
September 2008 led to a significant impact on the behavior of financial markets at a global level. The
following are the most relevant effects of this historical scenario:
Credit shock: reflected mainly in the increase of credit spreads and downgrades in credit ratings.
Increased volatility in most of the financial markets (giving rise to a great deal of variation in the prices of different assets (currency, equity, debt).
Liquidity shock in the financial systems, reflected by a major movement in interbank curves, particularly in the shortest sections of the euro and dollar curves.
Simulated scenarios
Unlike the historical scenarios, which are fixed and therefore not suited to the composition of the risk
portfolio at all times, the scenario used for the exercises of economic stress is based on Resampling
methodology. This methodology is based on the use of dynamic scenarios are recalculated periodically
depending on the main risks held in the trading portfolios. On a data window wide enough to collect different
P. 99 Translation of the Consolidated Financial Statements originally issued in Spanish and prepared in accordance with EU-IFRSs, as adopted by the European Union (See Note 1 and 56). In the event of a discrepancy, the Spanish language version prevails.
periods of stress (data are taken from 1-1-2008 until today), a simulation is performed by resampling of
historic observations, generating a loss distribution and profits to analyze most extreme of births in the
selected historical window. The advantage of this resampling methodology is that the period of stress is not
predetermined, but depends on the portfolio maintained at each time, and making a large number of
simulations (10,000 simulations) allows a richer information for the analysis of expected shortfall than what
is available in the scenarios included in the calculation of VaR.
The main features of this approach are: a) the generated simulations respect the correlation structure of the
data, b) flexibility in the inclusion of new risk factors and c) to allow the introduction of a lot of variability in the
simulations (desirable to consider extreme events).
The impact of the stress test under multivariable simulation of the risk factors of the portfolio (Expected
shortfall 95% to 20 days) as of December 31, 2017 is as follows:
Millions of Euros
Europe Mexico Peru Venezuela Argentina Colombia Chile Turkey
Expected Shortfall (75) (29) (8) - (8) (8) (9) (1)
7.4.2 Structural risk
The Assets and Liabilities Committee (ALCO) is the main responsible body for the management of structural
risks relating to liquidity/funding, interest rates, currency rates, equity and solvency. Every month, with the
assistance of the CEO and representatives from the areas of Finance, Risks and Business Areas, this
committee monitors the above risks and is presented with proposals for managing them for its approval.
These management proposals are made proactively by the Finance area, taking into account the risk
appetite framework and with the aim of guaranteeing recurrent earnings and financial stability and
preserving the entity's solvency. All the balance-sheet management units have a local ALCO, assisted
constantly by the members of the Corporate Center. There is also a corporate ALCO where the management
strategies in the Group's subsidiaries are monitored and presented.
Structural interest-rate risk
The structural interest-rate risk (“SIRR”) is related to the potential impact that variations in market interest
rates have on an entity's net interest income and equity. In order to properly measure SIRR, BBVA takes into
account the main sources that generate this risk: repricing risk, yield curve risk, option risk and basis risk,
which are analyzed from two complementary points of view: net interest income (short term) and economic
value (long term).
ALCO monitors the interest-rate risk metrics and the Assets and Liabilities Management unit carries out the
management proposals for the structural balance sheet. The management objective is to ensure the stability
of net interest income and book value in the face of changes in market interest rates, while respecting the
internal solvency and limits in the different balance-sheets and for BBVA Group as a whole; and complying
with current and future regulatory requirements.
BBVA's structural interest-rate risk management control and monitoring is based on a set of metrics and
tools that enable the entity's risk profile to be monitored correctly. A wide range of scenarios are measured
on a regular basis, including sensitivities to parallel movements in the event of different shocks, changes in
slope and curve, as well as delayed movements. Other probabilistic metrics based on statistical scenario-
simulating methods are also assessed, such as earnings at risk (“EaR”) and economic capital (“EC”), which
are defined as the maximum adverse deviations in net interest income and economic value, respectively, for
a given confidence level and time horizon. Impact thresholds are established on these management metrics
both in terms of deviations in net interest income and in terms of the impact on economic value. The process
P. 100 Translation of the Consolidated Financial Statements originally issued in Spanish and prepared in accordance with EU-IFRSs, as adopted by the European Union (See Note 1 and 56). In the event of a discrepancy, the Spanish language version prevails.
is carried out separately for each currency to which the Group is exposed, and the diversification effect
between currencies and business units is considered after this.
In order to evaluate its effectiveness, the model is subjected to regular internal validation, which includes
backtesting. In addition, the banking book’s interest-rate risk exposures are subjected to different stress
tests in order to reveal balance sheet vulnerabilities under extreme scenarios. This testing includes an
analysis of adverse macroeconomic scenarios designed specifically by BBVA Research, together with a wide
range of potential scenarios that aim to identify interest-rate environments that are particularly damaging for
the entity. This is done by generating extreme scenarios of a breakthrough in interest rate levels and
historical correlations, giving rise to sudden changes in the slopes and even to inverted curves.
The model is necessarily underpinned by an elaborate set of hypotheses that aim to reproduce the behavior
of the balance sheet as closely as possible to reality. Especially relevant among these assumptions are those
related to the behavior of “accounts with no explicit maturity”, for which stability and remuneration
assumptions are established, consistent with an adequate segmentation by type of product and customer,
and prepayment estimates (implicit optionality). The hypotheses are reviewed and adapted, at least on an
annual basis, to signs of changes in behavior, kept properly documented and reviewed on a regular basis in
the internal validation processes.
The impacts on the metrics are assessed both from a point of view of economic value (gone concern) and
from the perspective of net interest income, for which a dynamic model (going concern) consistent with the
corporate assumptions of earnings forecasts is used.
The table below shows the profile of average sensitivities to net interest income and value of the main entities
in BBVA Group in 2017 (certain information within this table is provisional. Its distribution should not be
significantly affected):
Sensitivity to Interest-Rate Analysis - December 2017
Impact on Net Interest Income (*) Impact on Economic Value (**)
100 Basis-Point
Increase 100 Basis-Point Decrease
100 Basis-Point Increase
100 Basis-Point Decrease
Europe (***) + (10% - 15%) - (5% - 10%) + (0% - 5%) - (0% - 5%)
Mexico + (0% - 5%) - (0% - 5%) - (0% - 5%) + (0% - 5%)
USA + (5% - 10%) - (5% - 10%) - (0% - 5%) - (0% - 5%)
Turkey - (0% - 5%) + (0% - 5%) - (0% - 5%) + (0% - 5%)
South America + (0% - 5%) - (0% - 5%) - (0% - 5%) + (0% - 5%)
BBVA Group + (0% - 5%) - (0% - 5%) + (0% - 5%) - (0% - 5%)
(*) Percentage of "1 year" net interest income forecast for each unit.
(**) Percentage of Core Capital for each unit.
(***) In Europe downward movement allowed until more negative level than current rates.
In 2017 in Europe monetary policy has remained expansionary, maintaining rates at 0%. In USA the rising
rate cycle initiated by the Federal Reserve in 2015 has been intensified. In Mexico and Turkey, the upward
cycle has continued because of weak currencies and inflation prospects. In South America, monetary policy
has been expansive, with rate declines in most of the economies where the Group operates, with the
exception of Argentina, where rates increased during 2017.
The BBVA Group maintains, overall in its Balance Sheet Management Units ("BSMUs"), a positive sensitivity
in its net interest income to an increase in interest rates. The higher relative net interest income sensitivities
are observed in mature markets, particularly Europe, where however, the negative sensitivity in its net
interest income to a decrease in interest rates is limited by the downward path scope in interest rates. The
Group maintains a moderate risk profile, according to its target risk, through effective management of its
balance sheet structural risk.
P. 101 Translation of the Consolidated Financial Statements originally issued in Spanish and prepared in accordance with EU-IFRSs, as adopted by the European Union (See Note 1 and 56). In the event of a discrepancy, the Spanish language version prevails.
Structural exchange-rate risk
In BBVA Group, structural exchange-rate risk arises from the consolidation of holdings in subsidiaries with
functional currencies other than the euro. Its management is centralized in order to optimize the joint
handling of permanent foreign currency exposures, taking into account the diversification.
The corporate Assets and Liabilities Management unit, through ALCO, designs and executes hedging
strategies with the main purpose of controlling the potential negative effect of exchange-rate fluctuations on
capital ratios and on the equivalent value in euros of the foreign-currency earnings of the Group's
subsidiaries, considering transactions according to market expectations and their cost.
The risk monitoring metrics included in the framework of limits are integrated into management and
supplemented with additional assessment indicators. At corporate level they are based on probabilistic
metrics that measure the maximum deviation in the Group’s Capital, CET1 (“Common Equity Tier 1”) ratio,
and net attributable profit. The probabilistic metrics make it possible to estimate the joint impact of exposure
to different currencies taking into account the different variability in exchange rates and their correlations.
The suitability of these risk assessment metrics is reviewed on a regular basis through backtesting exercises.
The final element of structural exchange-rate risk control is the analysis of scenarios and stress with the aim
of identifying in advance possible threats to future compliance with the risk appetite levels set, so that any
necessary preventive management actions can be taken. The scenarios are based both on historical
situations simulated by the risk model and on the risk scenarios provided by BBVA Research.
2017 has been characterized by the depreciation against the euro of the main currencies of the geographies
where the Group operates: US Dollar (-12%), Mexican peso (-8%) and Turkish lira (-18%).
The Group's structural exchange-rate risk exposure level has remained fairly stable since the end of 2016.
The hedging policy intends to keep low levels of sensitivity to movements in the exchange rates of emerging
currencies against the euro and focuses on Mexican peso and Turkish lira. The risk mitigation level in capital
ratio due to the book value of BBVA Group's holdings in foreign emerging currencies stood at around 70%
and, as of the end of 2017, CET1 ratio sensitivity to the appreciation of 1% in the euro exchange rate for each
currency is: US Dollar +1,2 bps; Mexican peso -0,1 bps; Turkish Lira -0,1 bps; other currencies -0,3 bps. On
the other hand, hedging of emerging-currency denominated earnings of 2017 has reached a 61%,
concentrated in Mexican peso and Turkish lira.
Structural equity risk
BBVA Group's exposure to structural equity risk stems basically from investments in industrial and financial
companies with medium- and long-term investment horizons. This exposure is mitigated through net short
positions held in derivatives of their underlying assets, used to limit portfolio sensitivity to potential falls in
prices.
Structural management of equity portfolios is the responsibility of the Group's units specializing in this area.
Their activity is subject to the corporate risk management policies for equity positions in the equity portfolio.
The aim is to ensure that they are handled consistently with BBVA's business model and appropriately to its
risk tolerance level, thus enabling long-term business sustainability.
The Group's risk management systems also make it possible to anticipate possible negative impacts and
take appropriate measures to prevent damage being caused to the entity. The risk control and limitation
mechanisms are focused on the exposure, annual operating performance and economic capital estimated
for each portfolio. Economic capital is estimated in accordance with a corporate model based on Monte
Carlo simulations, taking into account the statistical performance of asset prices and the diversification
existing among the different exposures.
P. 102 Translation of the Consolidated Financial Statements originally issued in Spanish and prepared in accordance with EU-IFRSs, as adopted by the European Union (See Note 1 and 56). In the event of a discrepancy, the Spanish language version prevails.
Stress tests and analyses of sensitivity to different simulated scenarios are carried out periodically to analyze
the risk profile in more depth. They are based on both past crisis situations and forecasts made by BBVA
Research. This checks that the risks are limited and that the tolerance levels set by the Group are not at risk.
Backtesting is carried out on a regular basis on the risk measurement model used.
With regard to the equity markets, the world indexes have closed the year 2017 with significant increases
helped by a positive macro environment. However, the European indexes, and especially the Spanish one,
have lagged despite their positive performance. In the case of the IBEX (+7% in the year), the index have
been partly penalized in the second half of the year by the political tensions in Catalonia.
Structural equity risk, measured in terms of economic capital, has decreased in the period mainly due to the
sale of stakes. The aggregate sensitivity of the BBVA Group’s consolidated equity to a 1% fall in the price of
shares of the companies making up the equity portfolio remained at around -€32 million as of December 31,
2017 and -€38 million as of December 31, 2016. This estimate takes into account the exposure in shares
valued at market prices, or if not applicable, at fair value (excluding the positions in the Treasury Area
portfolios) and the net delta-equivalent positions in derivatives on the same underlyings.
7.4.3 Financial Instruments offset
Financial assets and liabilities may be netted, i.e. they are presented for a net amount on the consolidated
balance sheet only when the Group's entities satisfy with the provisions of IAS 32-Paragraph 42, so they have
both the legal right to net recognized amounts, and the intention of settling the net amount or of realizing the
asset and simultaneously paying the liability.
In addition, the Group has presented as gross amounts assets and liabilities on the consolidated balance
sheet for which there are master netting arrangements in place, but for which there is no intention of settling
net. The most common types of events that trigger the netting of reciprocal obligations are bankruptcy of the
entity, surpassing certain level of indebtedness threshold, failure to pay, restructuring and dissolution of the
entity.
In the current market context, derivatives are contracted under different framework contracts being the
most widespread developed by the International Swaps and Derivatives Association (“ISDA”) and, for the
Spanish market, the Framework Agreement on Financial Transactions (“CMOF”). Almost all portfolio
derivative transactions have been concluded under these framework contracts, including in them the netting
clauses mentioned in the preceding paragraph as "Master Netting Agreement", greatly reducing the credit
exposure on these instruments. Additionally, in contracts signed with professional counterparties, the
collateral agreement annexes called Credit Support Annex (“CSA”) are included, thereby minimizing
exposure to a potential default of the counterparty.
Moreover, in transactions involving assets purchased or sold under a purchase agreement there is a high
volume transacted through clearing houses that articulate mechanisms to reduce counterparty risk, as well
as through the signature of various master agreements for bilateral transactions, the most widely used being
the Global Master Repurchase Agreement (GMRA), published by International Capital Market Association
(“ICMA”), to which the clauses related to the collateral exchange are usually added within the text of the
master agreement itself.
A summary of the effect of the compensation (via netting and collateral) for derivatives and securities
operations is presented below as of December 31, 2017, 2016 and 2015:
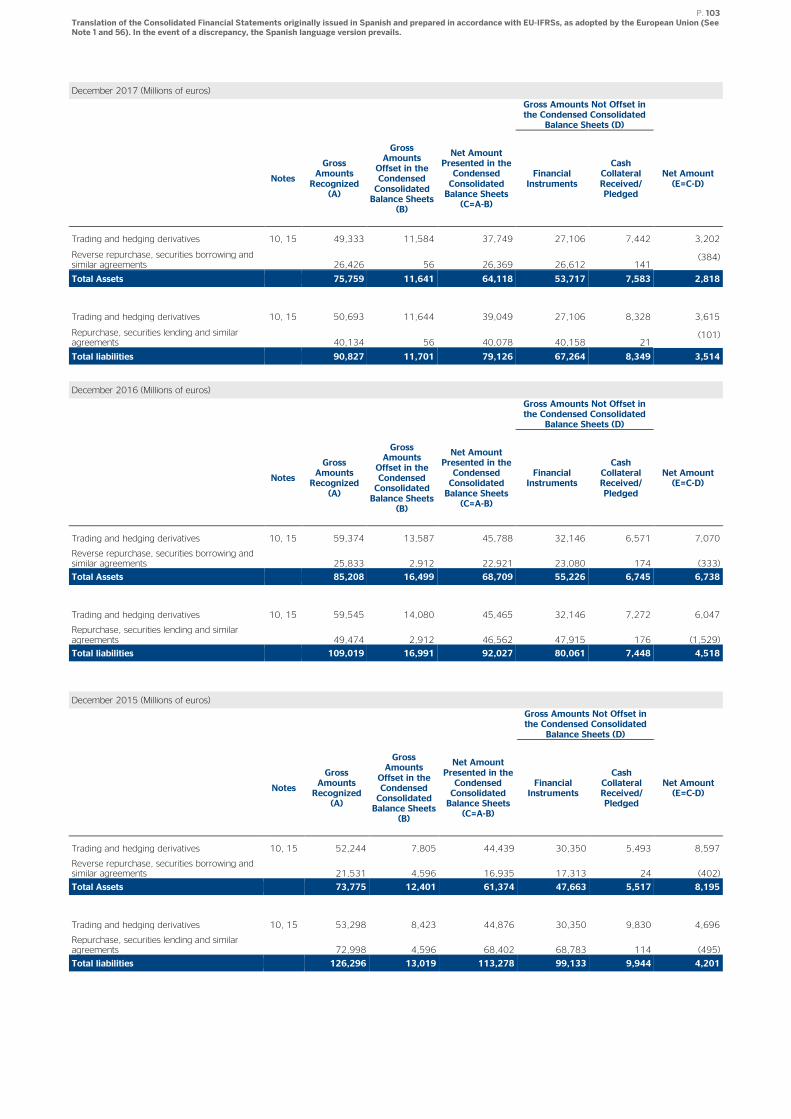
P. 103 Translation of the Consolidated Financial Statements originally issued in Spanish and prepared in accordance with EU-IFRSs, as adopted by the European Union (See Note 1 and 56). In the event of a discrepancy, the Spanish language version prevails.
December 2017 (Millions of euros)
Gross Amounts Not Offset in the Condensed Consolidated
Balance Sheets (D)
Notes
Gross Amounts Recognized
(A)
Gross Amounts Offset in the Condensed Consolidated Balance Sheets
(B)
Net Amount Presented in the Condensed Consolidated Balance Sheets (C=A-B)
Financial Instruments
Cash Collateral Received/ Pledged
Net Amount (E=C-D)
Trading and hedging derivatives 10, 15 49,333 11,584 37,749 27,106 7,442 3,202
Reverse repurchase, securities borrowing and similar agreements 26,426 56 26,369 26,612 141
(384)
Total Assets 75,759 11,641 64,118 53,717 7,583 2,818
Trading and hedging derivatives 10, 15 50,693 11,644 39,049 27,106 8,328 3,615
Repurchase, securities lending and similar agreements 40,134 56 40,078 40,158 21
(101)
Total liabilities 90,827 11,701 79,126 67,264 8,349 3,514
December 2016 (Millions of euros)
Gross Amounts Not Offset in the Condensed Consolidated
Balance Sheets (D)
Notes
Gross Amounts Recognized
(A)
Gross Amounts Offset in the Condensed Consolidated Balance Sheets
(B)
Net Amount Presented in the Condensed Consolidated Balance Sheets (C=A-B)
Financial Instruments
Cash Collateral Received/ Pledged
Net Amount (E=C-D)
Trading and hedging derivatives 10, 15 59,374 13,587 45,788 32,146 6,571 7,070
Reverse repurchase, securities borrowing and similar agreements 25,833 2,912 22,921 23,080 174 (333)
Total Assets 85,208 16,499 68,709 55,226 6,745 6,738
Trading and hedging derivatives 10, 15 59,545 14,080 45,465 32,146 7,272 6,047
Repurchase, securities lending and similar agreements 49,474 2,912 46,562 47,915 176 (1,529)
Total liabilities 109,019 16,991 92,027 80,061 7,448 4,518
December 2015 (Millions of euros)
Gross Amounts Not Offset in the Condensed Consolidated
Balance Sheets (D)
Notes
Gross Amounts Recognized
(A)
Gross Amounts Offset in the Condensed Consolidated Balance Sheets
(B)
Net Amount Presented in the Condensed Consolidated Balance Sheets (C=A-B)
Financial Instruments
Cash Collateral Received/ Pledged
Net Amount (E=C-D)
Trading and hedging derivatives 10, 15 52,244 7,805 44,439 30,350 5,493 8,597
Reverse repurchase, securities borrowing and similar agreements 21,531 4,596 16,935 17,313 24 (402)
Total Assets 73,775 12,401 61,374 47,663 5,517 8,195
Trading and hedging derivatives 10, 15 53,298 8,423 44,876 30,350 9,830 4,696
Repurchase, securities lending and similar agreements 72,998 4,596 68,402 68,783 114 (495)
Total liabilities 126,296 13,019 113,278 99,133 9,944 4,201
P. 104 Translation of the Consolidated Financial Statements originally issued in Spanish and prepared in accordance with EU-IFRSs, as adopted by the European Union (See Note 1 and 56). In the event of a discrepancy, the Spanish language version prevails.
7.5 Liquidity risk
7.5.1 Liquidity risk management
Management of liquidity and structural finance within the BBVA Group is based on the principle of the
financial autonomy of the entities that make it up. This approach helps prevent and limit liquidity risk by
reducing the Group’s vulnerability in periods of high risk. This decentralized management avoids possible
contagion due to a crisis that could affect only one or several BBVA Group entities, which must cover their
liquidity needs independently in the markets where they operate. Liquidity Management Units (LMUs) have
been set up for this reason in the geographical areas where the main foreign subsidiaries operate, and also
for the parent BBVA S.A., within the Euro currency scope, which includes BBVA Portugal.
Assets and Liabilities Management unit manages BBVA Group's liquidity and funding. It plans and executes
the funding of the long-term structural gap of each LMUs and proposes to ALCO the actions to adopt in this
regard in accordance with the policies and limits established by the Standing Committee.
As first core element, the Bank's target in terms of liquidity and funding risk is characterized through the
Liquidity Coverage Ratio (LCR) and the Loan-to-Stable-Customer-Deposits (LtSCD) ratio. LCR is a
regulatory measurement aimed at ensuring entities’ resistance in a scenario of liquidity stress within a time
horizon of 30 days. BBVA, within its risk appetite framework and its limits and alerts schemes, has
established a level of requirement for compliance with the LCR ratio both for the Group as a whole and for
each of the LMUs individually. The internal levels required are geared to comply sufficiently and efficiently in
advance with the implementation of the regulatory requirement of 2018, at a level above 100%.
LCR ratio in Europe came into force on 1st October 2015. With an initial 60% minimum requirement,
progressively increased (phased-in) up to 100% in 2018. Throughout the year 2017, LCR level at BBVA
Group has been comfortably above 100%. As of December 2017, the ratio level is 128%.
Although this regulatory requirement is mandatory at a Group level and Eurozone banks, all subsidiaries are
well above this minimum. In any case, it should be noted that liquidity excesses in subsidiaries are not
deemed transferable when calculating the consolidated ratio. Taking into account the impact of these High
Quality Liquid Assets excluded, LCR ratio would be 149%, which is +21% above.
LCR main LMU
December 2017
Group 128%
Eurozone(*) 151%
Bancomer 148%
Compass(**) 144%
Garanti 134%
(*)Perimeter: Spain, Portugal and Rest of Eurasia
(**)Compass LCR calculated according to local regulation (Fed Modified LCR)
The LtSCD measures the relation between the net credit investment and stable funds. The aim is to preserve
a stable funding structure in the medium term for each of the LMUs making up BBVA Group, taking into
account that maintaining an adequate volume of stable customer funds is key to achieving a sound liquidity
profile.
Customer funds captured and managed by business units are defined as stable customer funds. These funds
usually show little sensitivity to market changes and are largely non-volatile in terms of aggregate amounts
per operation, thanks to customer linkage to the unit. Stable funds in each LMU are calculated by analyzing
the behavior of the balance sheets of the different customer segments identified as likely to provide stability
to the funding structure, and by prioritizing an established relationship and applying bigger haircuts to the
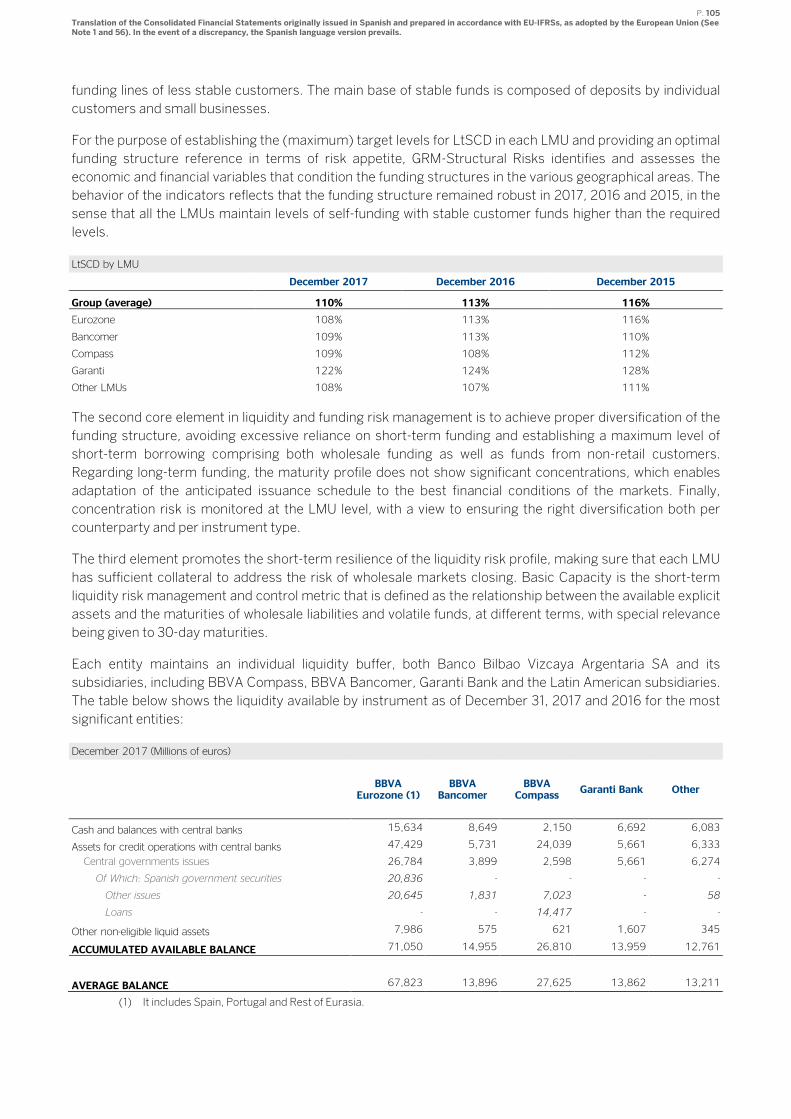
P. 105 Translation of the Consolidated Financial Statements originally issued in Spanish and prepared in accordance with EU-IFRSs, as adopted by the European Union (See Note 1 and 56). In the event of a discrepancy, the Spanish language version prevails.
funding lines of less stable customers. The main base of stable funds is composed of deposits by individual
customers and small businesses.
For the purpose of establishing the (maximum) target levels for LtSCD in each LMU and providing an optimal
funding structure reference in terms of risk appetite, GRM-Structural Risks identifies and assesses the
economic and financial variables that condition the funding structures in the various geographical areas. The
behavior of the indicators reflects that the funding structure remained robust in 2017, 2016 and 2015, in the
sense that all the LMUs maintain levels of self-funding with stable customer funds higher than the required
levels.
LtSCD by LMU
December 2017 December 2016 December 2015
Group (average) 110% 113% 116%
Eurozone 108% 113% 116%
Bancomer 109% 113% 110%
Compass 109% 108% 112%
Garanti 122% 124% 128%
Other LMUs 108% 107% 111%
The second core element in liquidity and funding risk management is to achieve proper diversification of the
funding structure, avoiding excessive reliance on short-term funding and establishing a maximum level of
short-term borrowing comprising both wholesale funding as well as funds from non-retail customers.
Regarding long-term funding, the maturity profile does not show significant concentrations, which enables
adaptation of the anticipated issuance schedule to the best financial conditions of the markets. Finally,
concentration risk is monitored at the LMU level, with a view to ensuring the right diversification both per
counterparty and per instrument type.
The third element promotes the short-term resilience of the liquidity risk profile, making sure that each LMU
has sufficient collateral to address the risk of wholesale markets closing. Basic Capacity is the short-term
liquidity risk management and control metric that is defined as the relationship between the available explicit
assets and the maturities of wholesale liabilities and volatile funds, at different terms, with special relevance
being given to 30-day maturities.
Each entity maintains an individual liquidity buffer, both Banco Bilbao Vizcaya Argentaria SA and its
subsidiaries, including BBVA Compass, BBVA Bancomer, Garanti Bank and the Latin American subsidiaries.
The table below shows the liquidity available by instrument as of December 31, 2017 and 2016 for the most
significant entities:
December 2017 (Millions of euros)
BBVA
Eurozone (1) BBVA
Bancomer BBVA Compass
Garanti Bank Other
Cash and balances with central banks 15,634 8,649 2,150 6,692 6,083
Assets for credit operations with central banks 47,429 5,731 24,039 5,661 6,333
Central governments issues 26,784 3,899 2,598 5,661 6,274
Of Which: Spanish government securities 20,836 - - - -
Other issues 20,645 1,831 7,023 - 58
Loans - - 14,417 - -
Other non-eligible liquid assets 7,986 575 621 1,607 345
ACCUMULATED AVAILABLE BALANCE 71,050 14,955 26,810 13,959 12,761
AVERAGE BALANCE 67,823 13,896 27,625 13,862 13,211
(1) It includes Spain, Portugal and Rest of Eurasia.
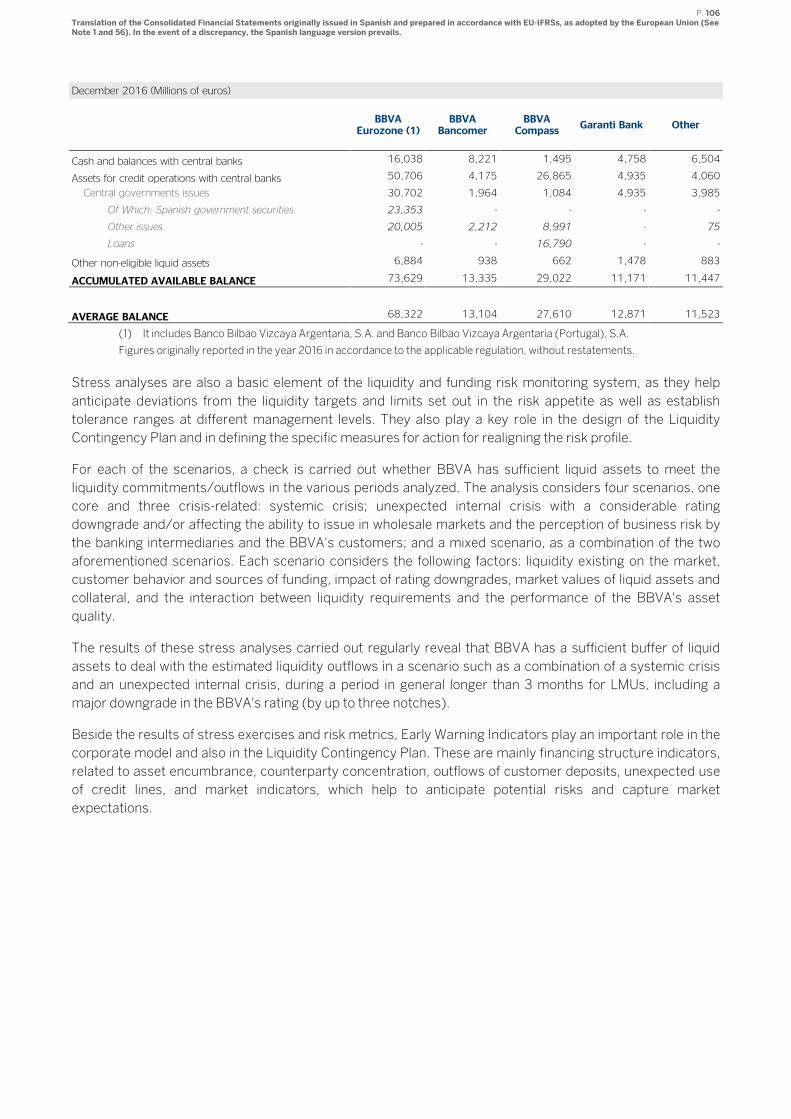
P. 106 Translation of the Consolidated Financial Statements originally issued in Spanish and prepared in accordance with EU-IFRSs, as adopted by the European Union (See Note 1 and 56). In the event of a discrepancy, the Spanish language version prevails.
December 2016 (Millions of euros)
BBVA
Eurozone (1) BBVA
Bancomer BBVA Compass
Garanti Bank Other
Cash and balances with central banks 16,038 8,221 1,495 4,758 6,504
Assets for credit operations with central banks 50,706 4,175 26,865 4,935 4,060
Central governments issues 30,702 1,964 1,084 4,935 3,985
Of Which: Spanish government securities 23,353 - - - -
Other issues 20,005 2,212 8,991 - 75
Loans - - 16,790 - -
Other non-eligible liquid assets 6,884 938 662 1,478 883
ACCUMULATED AVAILABLE BALANCE 73,629 13,335 29,022 11,171 11,447
AVERAGE BALANCE 68,322 13,104 27,610 12,871 11,523
(1) It includes Banco Bilbao Vizcaya Argentaria, S.A. and Banco Bilbao Vizcaya Argentaria (Portugal), S.A.
Figures originally reported in the year 2016 in accordance to the applicable regulation, without restatements.
Stress analyses are also a basic element of the liquidity and funding risk monitoring system, as they help
anticipate deviations from the liquidity targets and limits set out in the risk appetite as well as establish
tolerance ranges at different management levels. They also play a key role in the design of the Liquidity
Contingency Plan and in defining the specific measures for action for realigning the risk profile.
For each of the scenarios, a check is carried out whether BBVA has sufficient liquid assets to meet the
liquidity commitments/outflows in the various periods analyzed. The analysis considers four scenarios, one
core and three crisis-related: systemic crisis; unexpected internal crisis with a considerable rating
downgrade and/or affecting the ability to issue in wholesale markets and the perception of business risk by
the banking intermediaries and the BBVA's customers; and a mixed scenario, as a combination of the two
aforementioned scenarios. Each scenario considers the following factors: liquidity existing on the market,
customer behavior and sources of funding, impact of rating downgrades, market values of liquid assets and
collateral, and the interaction between liquidity requirements and the performance of the BBVA's asset
quality.
The results of these stress analyses carried out regularly reveal that BBVA has a sufficient buffer of liquid
assets to deal with the estimated liquidity outflows in a scenario such as a combination of a systemic crisis
and an unexpected internal crisis, during a period in general longer than 3 months for LMUs, including a
major downgrade in the BBVA's rating (by up to three notches).
Beside the results of stress exercises and risk metrics, Early Warning Indicators play an important role in the
corporate model and also in the Liquidity Contingency Plan. These are mainly financing structure indicators,
related to asset encumbrance, counterparty concentration, outflows of customer deposits, unexpected use
of credit lines, and market indicators, which help to anticipate potential risks and capture market
expectations.
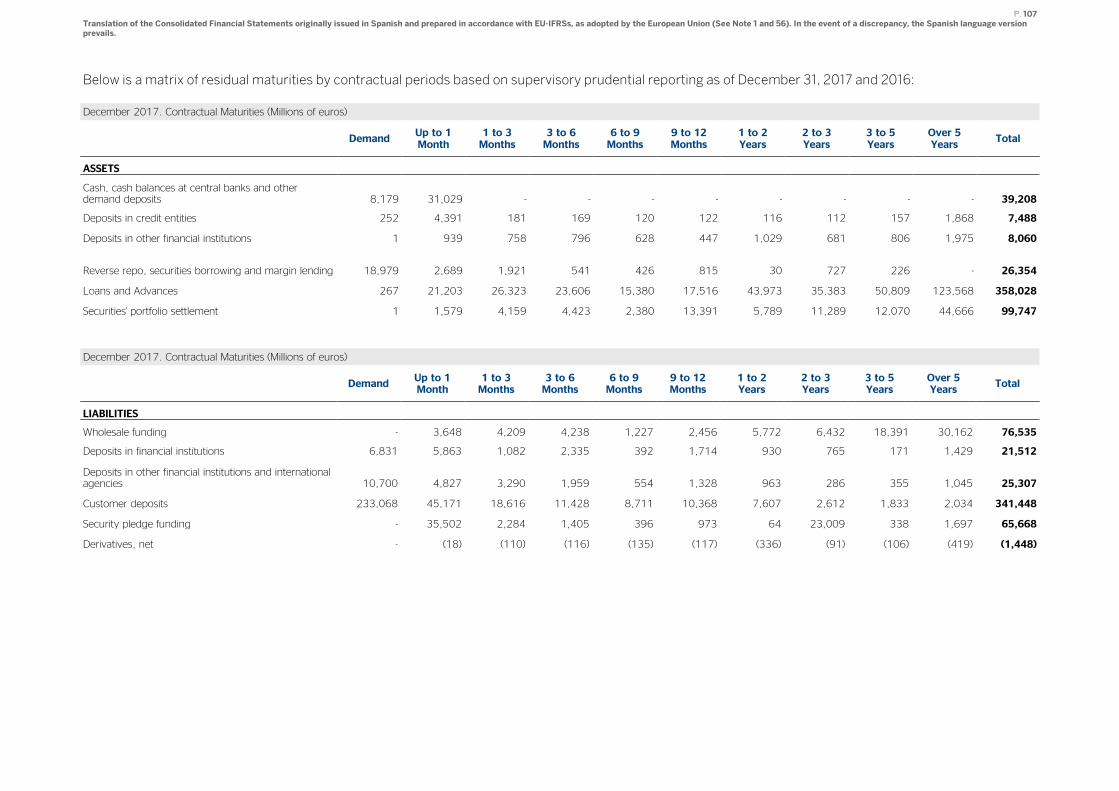
P. 107 Translation of the Consolidated Financial Statements originally issued in Spanish and prepared in accordance with EU-IFRSs, as adopted by the European Union (See Note 1 and 56). In the event of a discrepancy, the Spanish language version prevails.
Below is a matrix of residual maturities by contractual periods based on supervisory prudential reporting as of December 31, 2017 and 2016:
December 2017. Contractual Maturities (Millions of euros)
Demand Up to 1 Month
1 to 3 Months
3 to 6 Months
6 to 9 Months
9 to 12 Months
1 to 2 Years
2 to 3 Years
3 to 5 Years
Over 5 Years
Total
ASSETS
Cash, cash balances at central banks and other demand deposits 8,179 31,029 - - - - - - - - 39,208
Deposits in credit entities 252 4,391 181 169 120 122 116 112 157 1,868 7,488
Deposits in other financial institutions 1 939 758 796 628 447 1,029 681 806 1,975 8,060
Reverse repo, securities borrowing and margin lending 18,979 2,689 1,921 541 426 815 30 727 226 - 26,354
Loans and Advances 267 21,203 26,323 23,606 15,380 17,516 43,973 35,383 50,809 123,568 358,028
Securities' portfolio settlement 1 1,579 4,159 4,423 2,380 13,391 5,789 11,289 12,070 44,666 99,747
December 2017. Contractual Maturities (Millions of euros)
Demand Up to 1 Month
1 to 3 Months
3 to 6 Months
6 to 9 Months
9 to 12 Months
1 to 2 Years
2 to 3 Years
3 to 5 Years
Over 5 Years
Total
LIABILITIES
Wholesale funding - 3,648 4,209 4,238 1,227 2,456 5,772 6,432 18,391 30,162 76,535
Deposits in financial institutions 6,831 5,863 1,082 2,335 392 1,714 930 765 171 1,429 21,512
Deposits in other financial institutions and international agencies 10,700 4,827 3,290 1,959 554 1,328 963 286 355 1,045 25,307
Customer deposits 233,068 45,171 18,616 11,428 8,711 10,368 7,607 2,612 1,833 2,034 341,448
Security pledge funding - 35,502 2,284 1,405 396 973 64 23,009 338 1,697 65,668
Derivatives, net - (18) (110) (116) (135) (117) (336) (91) (106) (419) (1,448)
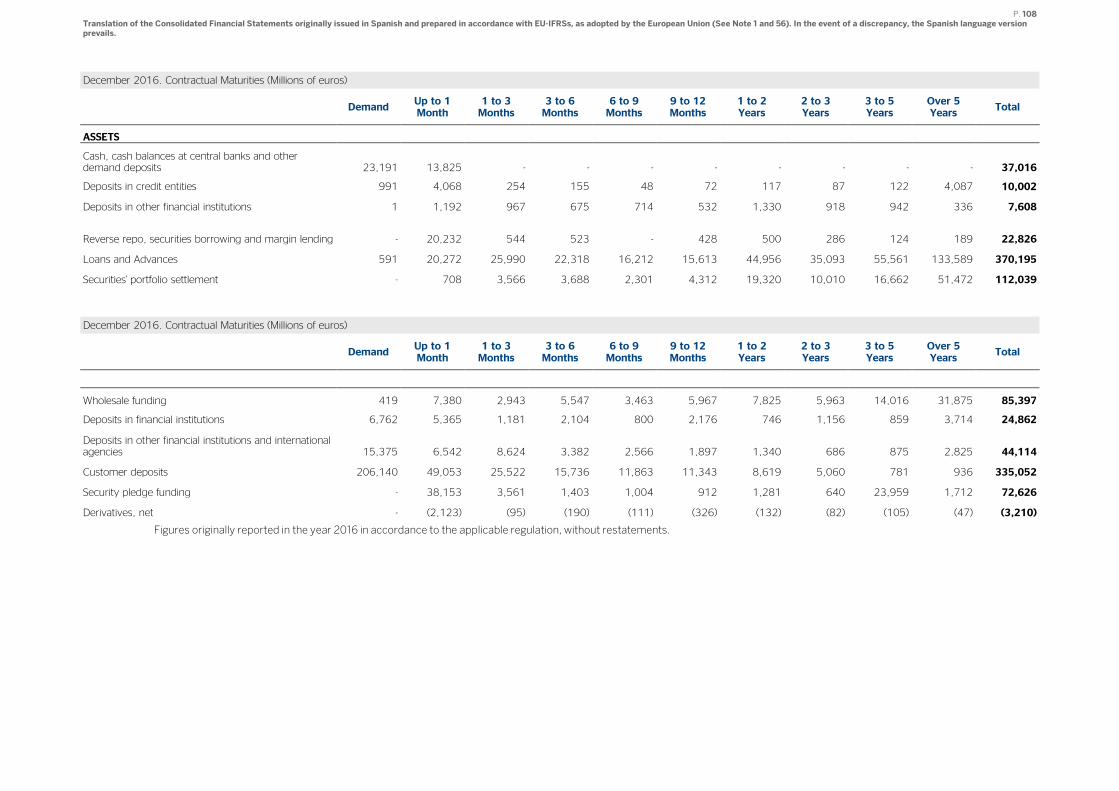
P. 108 Translation of the Consolidated Financial Statements originally issued in Spanish and prepared in accordance with EU-IFRSs, as adopted by the European Union (See Note 1 and 56). In the event of a discrepancy, the Spanish language version prevails.
December 2016. Contractual Maturities (Millions of euros)
Demand Up to 1 Month
1 to 3 Months
3 to 6 Months
6 to 9 Months
9 to 12 Months
1 to 2 Years
2 to 3 Years
3 to 5 Years
Over 5 Years
Total
ASSETS
Cash, cash balances at central banks and other demand deposits 23,191 13,825 - - - - - - - - 37,016
Deposits in credit entities 991 4,068 254 155 48 72 117 87 122 4,087 10,002
Deposits in other financial institutions 1 1,192 967 675 714 532 1,330 918 942 336 7,608
Reverse repo, securities borrowing and margin lending - 20,232 544 523 - 428 500 286 124 189 22,826
Loans and Advances 591 20,272 25,990 22,318 16,212 15,613 44,956 35,093 55,561 133,589 370,195
Securities' portfolio settlement - 708 3,566 3,688 2,301 4,312 19,320 10,010 16,662 51,472 112,039
December 2016. Contractual Maturities (Millions of euros)
Demand Up to 1 Month
1 to 3 Months
3 to 6 Months
6 to 9 Months
9 to 12 Months
1 to 2 Years
2 to 3 Years
3 to 5 Years
Over 5 Years
Total
Wholesale funding 419 7,380 2,943 5,547 3,463 5,967 7,825 5,963 14,016 31,875 85,397
Deposits in financial institutions 6,762 5,365 1,181 2,104 800 2,176 746 1,156 859 3,714 24,862
Deposits in other financial institutions and international agencies 15,375 6,542 8,624 3,382 2,566 1,897 1,340 686 875 2,825 44,114
Customer deposits 206,140 49,053 25,522 15,736 11,863 11,343 8,619 5,060 781 936 335,052
Security pledge funding - 38,153 3,561 1,403 1,004 912 1,281 640 23,959 1,712 72,626
Derivatives, net - (2,123) (95) (190) (111) (326) (132) (82) (105) (47) (3,210)
Figures originally reported in the year 2016 in accordance to the applicable regulation, without restatements.
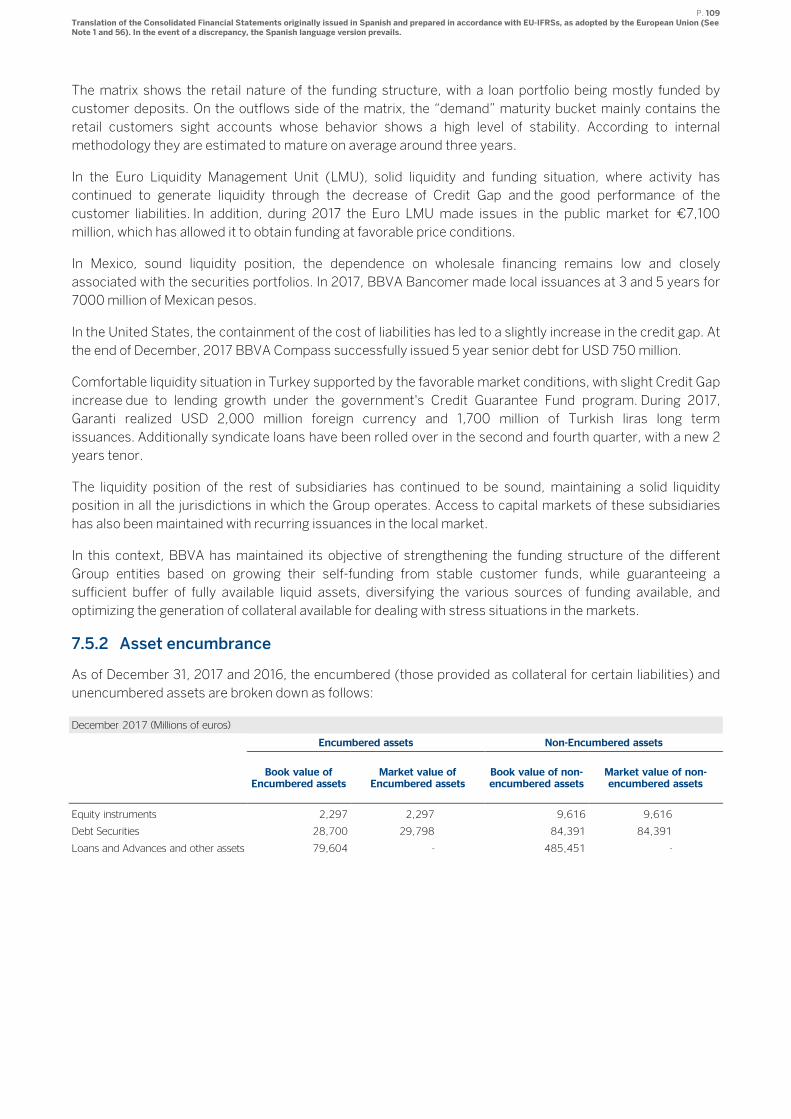
P. 109 Translation of the Consolidated Financial Statements originally issued in Spanish and prepared in accordance with EU-IFRSs, as adopted by the European Union (See Note 1 and 56). In the event of a discrepancy, the Spanish language version prevails.
The matrix shows the retail nature of the funding structure, with a loan portfolio being mostly funded by
customer deposits. On the outflows side of the matrix, the “demand” maturity bucket mainly contains the
retail customers sight accounts whose behavior shows a high level of stability. According to internal
methodology they are estimated to mature on average around three years.
In the Euro Liquidity Management Unit (LMU), solid liquidity and funding situation, where activity has
continued to generate liquidity through the decrease of Credit Gap and the good performance of the
customer liabilities. In addition, during 2017 the Euro LMU made issues in the public market for €7,100
million, which has allowed it to obtain funding at favorable price conditions.
In Mexico, sound liquidity position, the dependence on wholesale financing remains low and closely
associated with the securities portfolios. In 2017, BBVA Bancomer made local issuances at 3 and 5 years for
7000 million of Mexican pesos.
In the United States, the containment of the cost of liabilities has led to a slightly increase in the credit gap. At
the end of December, 2017 BBVA Compass successfully issued 5 year senior debt for USD 750 million.
Comfortable liquidity situation in Turkey supported by the favorable market conditions, with slight Credit Gap
increase due to lending growth under the government's Credit Guarantee Fund program. During 2017,
Garanti realized USD 2,000 million foreign currency and 1,700 million of Turkish liras long term
issuances. Additionally syndicate loans have been rolled over in the second and fourth quarter, with a new 2
years tenor.
The liquidity position of the rest of subsidiaries has continued to be sound, maintaining a solid liquidity
position in all the jurisdictions in which the Group operates. Access to capital markets of these subsidiaries
has also been maintained with recurring issuances in the local market.
In this context, BBVA has maintained its objective of strengthening the funding structure of the different
Group entities based on growing their self-funding from stable customer funds, while guaranteeing a
sufficient buffer of fully available liquid assets, diversifying the various sources of funding available, and
optimizing the generation of collateral available for dealing with stress situations in the markets.
7.5.2 Asset encumbrance
As of December 31, 2017 and 2016, the encumbered (those provided as collateral for certain liabilities) and
unencumbered assets are broken down as follows:
December 2017 (Millions of euros)
Encumbered assets Non-Encumbered assets
Book value of
Encumbered assets Market value of Encumbered assets
Book value of non-encumbered assets
Market value of non-encumbered assets
Equity instruments 2,297 2,297 9,616 9,616
Debt Securities 28,700 29,798 84,391 84,391
Loans and Advances and other assets 79,604 - 485,451 -
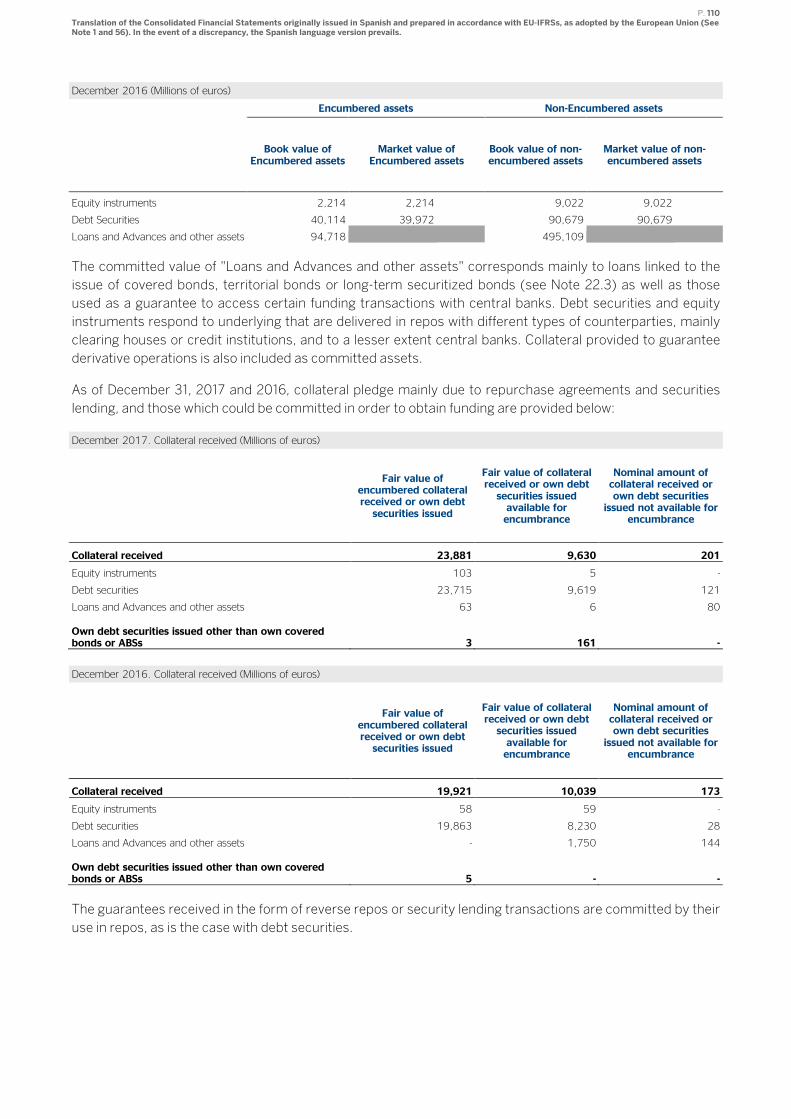
P. 110 Translation of the Consolidated Financial Statements originally issued in Spanish and prepared in accordance with EU-IFRSs, as adopted by the European Union (See Note 1 and 56). In the event of a discrepancy, the Spanish language version prevails.
December 2016 (Millions of euros)
Encumbered assets Non-Encumbered assets
Book value of
Encumbered assets Market value of Encumbered assets
Book value of non-encumbered assets
Market value of non-encumbered assets
Equity instruments 2,214 2,214 9,022 9,022
Debt Securities 40,114 39,972 90,679 90,679
Loans and Advances and other assets 94,718 495,109
The committed value of "Loans and Advances and other assets" corresponds mainly to loans linked to the
issue of covered bonds, territorial bonds or long-term securitized bonds (see Note 22.3) as well as those
used as a guarantee to access certain funding transactions with central banks. Debt securities and equity
instruments respond to underlying that are delivered in repos with different types of counterparties, mainly
clearing houses or credit institutions, and to a lesser extent central banks. Collateral provided to guarantee
derivative operations is also included as committed assets.
As of December 31, 2017 and 2016, collateral pledge mainly due to repurchase agreements and securities
lending, and those which could be committed in order to obtain funding are provided below:
December 2017. Collateral received (Millions of euros)
Fair value of encumbered collateral received or own debt securities issued
Fair value of collateral received or own debt securities issued available for encumbrance
Nominal amount of collateral received or own debt securities
issued not available for encumbrance
Collateral received 23,881 9,630 201
Equity instruments 103 5 -
Debt securities 23,715 9,619 121
Loans and Advances and other assets 63 6 80
Own debt securities issued other than own covered bonds or ABSs 3 161 -
December 2016. Collateral received (Millions of euros)
Fair value of encumbered collateral received or own debt securities issued
Fair value of collateral received or own debt securities issued available for encumbrance
Nominal amount of collateral received or own debt securities
issued not available for encumbrance
Collateral received 19,921 10,039 173
Equity instruments 58 59 -
Debt securities 19,863 8,230 28
Loans and Advances and other assets - 1,750 144
Own debt securities issued other than own covered bonds or ABSs 5 - -
The guarantees received in the form of reverse repos or security lending transactions are committed by their
use in repos, as is the case with debt securities.
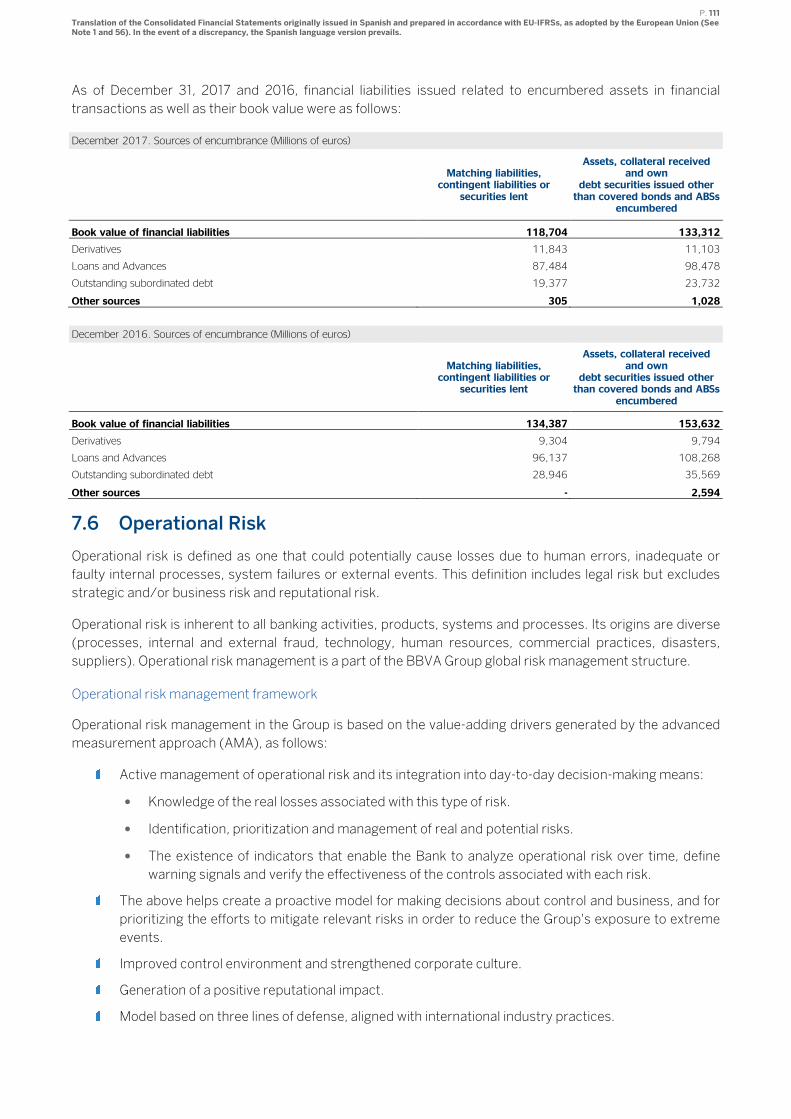
P. 111 Translation of the Consolidated Financial Statements originally issued in Spanish and prepared in accordance with EU-IFRSs, as adopted by the European Union (See Note 1 and 56). In the event of a discrepancy, the Spanish language version prevails.
As of December 31, 2017 and 2016, financial liabilities issued related to encumbered assets in financial
transactions as well as their book value were as follows:
December 2017. Sources of encumbrance (Millions of euros)
Matching liabilities, contingent liabilities or
securities lent
Assets, collateral received and own
debt securities issued other than covered bonds and ABSs
encumbered
Book value of financial liabilities 118,704 133,312
Derivatives 11,843 11,103
Loans and Advances 87,484 98,478
Outstanding subordinated debt 19,377 23,732
Other sources 305 1,028
December 2016. Sources of encumbrance (Millions of euros)
Matching liabilities, contingent liabilities or
securities lent
Assets, collateral received and own
debt securities issued other than covered bonds and ABSs
encumbered
Book value of financial liabilities 134,387 153,632
Derivatives 9,304 9,794
Loans and Advances 96,137 108,268
Outstanding subordinated debt 28,946 35,569
Other sources - 2,594
7.6 Operational Risk
Operational risk is defined as one that could potentially cause losses due to human errors, inadequate or
faulty internal processes, system failures or external events. This definition includes legal risk but excludes
strategic and/or business risk and reputational risk.
Operational risk is inherent to all banking activities, products, systems and processes. Its origins are diverse
(processes, internal and external fraud, technology, human resources, commercial practices, disasters,
suppliers). Operational risk management is a part of the BBVA Group global risk management structure.
Operational risk management framework
Operational risk management in the Group is based on the value-adding drivers generated by the advanced
measurement approach (AMA), as follows:
Active management of operational risk and its integration into day-to-day decision-making means:
• Knowledge of the real losses associated with this type of risk.
• Identification, prioritization and management of real and potential risks.
• The existence of indicators that enable the Bank to analyze operational risk over time, define
warning signals and verify the effectiveness of the controls associated with each risk.
The above helps create a proactive model for making decisions about control and business, and for
prioritizing the efforts to mitigate relevant risks in order to reduce the Group's exposure to extreme
events.
Improved control environment and strengthened corporate culture.
Generation of a positive reputational impact.
Model based on three lines of defense, aligned with international industry practices.
P. 112 Translation of the Consolidated Financial Statements originally issued in Spanish and prepared in accordance with EU-IFRSs, as adopted by the European Union (See Note 1 and 56). In the event of a discrepancy, the Spanish language version prevails.
Operational Risk Management Principles
Operational risk management in BBVA Group should:
Be aligned with the risk appetite framework statement set out by the Board of BBVA.
Anticipate the potential operational risks to which the Group would be exposed as a result of new or
modified products, activities, processes, systems or outsourcing decisions, and establish
procedures to enable their evaluation and reasonable mitigation prior to their implementation.
Establish methodologies and procedures to enable a regular reassessment of the relevant
operational risks to which the Group is exposed in order to adopt appropriate mitigation measures in
each case, once the identified risk and the cost of mitigation (cost/benefit analysis) have been
considered, while preserving the Group's solvency at all times.
Identify the causes of the operational losses sustained by the Group and establish measures to
reduce them. Procedures must therefore be in place to enable the capture and analysis of the
operational events that cause those losses.
Analyze the events that have caused operational risk losses in other institutions in the financial
sector and promote, where appropriate, the implementation of the measures needed to prevent
them from occurring in the Group.
Identify, analyze and quantify events with a low probability of occurrence and high impact in order to
evaluate their mitigation. Due to their exceptional nature, it is possible that such events may not be
included in the loss database or, if they are, they have impacts that are not representative.
Have an effective system of governance in place, where the functions and responsibilities of the
areas and bodies involved in operational risk management are clearly defined.
These principles reflect BBVA Group's vision of operational risk, on the basis that the resulting events have
an ultimate cause that should always be identified, and that the impact of the events is reduced significantly
by controlling that cause.
Irrespective of the adoption of all the possible measures and controls for preventing or reducing both the
frequency and severity of operational risk events, BBVA ensures at all times that sufficient capital is available
to cover any expected or unexpected losses that may occur.
7.7 Risk concentration
Policies for preventing excessive risk concentration
In order to prevent the build-up of excessive concentrations of credit risk at the individual, country and sector
levels, BBVA Group maintains maximum permitted risk concentration indices updated at individual and
portfolio sector levels tied to the various observable variables within the field of credit risk management.
Together with the limits for individual concentration, the Group uses the Herfindahl index to measure the
concentration of the Group's portfolio and the banking group's subsidiaries. At the BBVA Group level, the
index reached implies a "very low" degree of concentration.
The limit on the Group’s exposure or financial commitment to a specific customer therefore depends on the
customer’s credit rating, the nature of the risks involved, and the Group’s presence in a given market, based
on the following guidelines:
The aim is, as much as possible, to reconcile the customer's credit needs (commercial/financial,
short-term/long-term, etc.) with the interests of the Group.
P. 113 Translation of the Consolidated Financial Statements originally issued in Spanish and prepared in accordance with EU-IFRSs, as adopted by the European Union (See Note 1 and 56). In the event of a discrepancy, the Spanish language version prevails.
Any legal limits that may exist concerning risk concentration are taken into account (relationship
between risks with a customer and the capital of the shareholder´s entity that assumes them), the
markets, the macroeconomic situation, etc.
Risk concentrations by geography
The breakdown of the main figures in the most significant foreign currencies in the accompanying
consolidated balance sheets is set forth in Appendix XII.
Sovereign risk concentration
Sovereign risk management
The risk associated with the transactions involving sovereign risk is identified, measured, controlled and
tracked by a centralized unit integrated in the BBVA Group’s Risk Area. Its basic functions involve the
preparation of reports in the countries where sovereign risk exists (called “financial programs”), tracking
such risks, assigning ratings to these countries and, in general, supporting the Group in terms of reporting
requirements for any transactions involving sovereign risk. The risk policies established in the financial
programs are approved by the relevant risk committees.
The country risk unit tracks the evolution of the risks associated with the various countries to which the
Group are exposed (including sovereign risk) on an ongoing basis in order to adapt its risk and mitigation
policies to any macroeconomic and political changes that may occur. Moreover, it regularly updates its
internal ratings and forecasts for these countries. The methodology is based on the assessment of
quantitative and qualitative parameters which are in line with those used by certain multilateral organizations
such as the International Monetary Fund (IMF) and the World Bank, rating agencies and export credit
organizations.
For additional information on sovereign risk in Europe see Appendix XII.
Valuation and impairment methods
The valuation methods used to assess the instruments that are subject to sovereign risks are the same ones
used for other instruments included in the relevant portfolios and are detailed in Note 8.
Specifically, the fair value of sovereign debt securities of European countries has been considered equivalent
to their listed price in active markets (Level 1 as defined in Note 8).
Risk related to the developer and Real-Estate sector in Spain
One of the main Group activities of the Group in Spain is focused on developer and mortgage loans. The
policies and strategies established by the Group to deal with risks related to the developer and real-estate
sector are explained below:
Policies and strategies established by the Group to deal with risks related to the developer and real-estate sector
BBVA has teams specializing in the management of the Real-Estate Sector risk, given its economic
importance and specific technical component. This specialization is not only in the Risk-Acceptance teams,
but throughout the handling, commercial, problem risks and legal, etc. It also includes the research
department of the BBVA Group (BBVA Research), which helps determine the medium/long-term vision
needed to manage this portfolio. Specialization has been increased and the management teams in the areas
of recovery and the Real Estate Unit itself have been reinforced.
P. 114 Translation of the Consolidated Financial Statements originally issued in Spanish and prepared in accordance with EU-IFRSs, as adopted by the European Union (See Note 1 and 56). In the event of a discrepancy, the Spanish language version prevails.
The policies established to address the risks related to the developer and real-estate sector, aim to
accomplish, among others, the following objectives: to avoid concentration in terms of customers, products
and regions; to estimate the risk profile for the portfolio; and to anticipate possible worsening of the portfolio.
Specific policies for analysis and admission of new developer risk transactions
In the analysis of new operations, the assessment of the commercial operation in terms of the economic and
financial viability of the project has been one of the constant points that have helped ensure the success and
transformation of construction land operations for customers’ developments.
With regard the participation of the Risk Acceptance teams, they have a direct link and participate in the
committees of areas such as Recoveries and the Real Estate Unit. This guarantees coordination and
exchange of information in all the processes.
The following strategies have been implemented with customers in the developer sector: avoidance of large
corporate transactions, which had already reduced their share in the years of greatest market growth; non
active participation in the second-home market; commitment to public housing financing; and participation
in land operations with a high level of urban development security, giving priority to land open to urban
development.
Risk monitoring policies
The base information for analyzing the real estate portfolios is updated monthly. The tools used include the
so-called “watch-list”, which is updated monthly with the progress of each client under watch, and the
different strategic plans for management of special groups. There are plans that involve an intensification of
the review of the portfolio for financing land, while, in the case of ongoing promotions, they are classified
based on the rate of progress of the projects.
These actions have enabled BBVA to identify possible impairment situations, by always keeping an eye on
BBVA’s position with each customer (whether or not as first creditor). In this regard, key aspects include
management of the risk policy to be followed with each customer, contract review, deadline extension,
improved collateral, rate review (repricing) and asset purchase.
Proper management of the relationship with each customer requires knowledge of various aspects such as
the identification of the source of payment difficulties, an analysis of the company’s future viability, the
updating of the information on the debtor and the guarantors (their current situation and business course,
economic-financial information, debt analysis and generation of funds), and the updating of the appraisal of
the assets offered as collateral.
BBVA has a classification of debtors in accordance with legislation in force in each country, usually
categorizing each one’s level of difficulty for each risk.
Based on the information above, a decision is made whether to use the refinancing tool, whose objective is to
adjust the structure of the maturity of the debt to the generation of funds and the customer’s payment
capacity.
As for the policies relating to risk refinancing with the developer and real-estate sector, they are the same as
the general policies used for all of the Group’s risks (see Note 7.3.6). In the developer and real estate sector,
they are based on clear solvency and viability criteria for projects, with demanding terms for additional
guarantees and legal compliance, given a refinancing tool that standardizes criteria and variables when
considering any refinancing operation.
In the case of refinancing, the tools used for enhancing the Bank’s position are: the search for new
intervening parties with proven solvency and initial payment to reduce the principal debt or outstanding
interest; the improvement of the debt bond in order to facilitate the procedure in the event of default; the
P. 115 Translation of the Consolidated Financial Statements originally issued in Spanish and prepared in accordance with EU-IFRSs, as adopted by the European Union (See Note 1 and 56). In the event of a discrepancy, the Spanish language version prevails.
provision of new or additional collateral; and making refinancing viable with new conditions (period, rate and
repayments), adapted to a credible and sufficiently verified business plan.
Policies applied in the management of real estate assets in Spain
The policy applied for managing these assets depends on the type of real-estate asset, as detailed below.
In the case of completed homes, the final aim is the sale of these homes to private individuals, thus
reducing the risk and beginning a new business cycle. Here, the strategy has been to help
subrogation (the default rate in this channel of business is notably lower than in any other channel of
residential mortgages) and to support customers’ sales directly, using BBVA’s own channel (BBVA
Services and its branches), creating incentives for sale and including sale orders for BBVA. In
exceptional case we have even accepted partial haircuts, with the aim of making the sale easier.
In the case of ongoing home construction, the strategy has been to help and promote the completion
of the construction in order to transfer the investment to completed homes. The whole developer
Works in Progress portfolio has been reviewed and classified into different stages with the aim of
using different tools to support the strategy. This includes the use of developer accounts-payable
financing as a form of payment control, the use of project monitoring supported by the Real Estate
Unit itself, and the management of direct suppliers for the works as a complement to the developer’s
own management.
With respect to land, the fact that the risk of rustic land is not significant simplifies the management.
Urban management and liquidity control to tackle urban planning costs are also subject to special
monitoring.
For quantitative information about the risk related to the developer and Real-Estate sector in Spain see
Appendix XII.
P. 116 Translation of the Consolidated Financial Statements originally issued in Spanish and prepared in accordance with EU-IFRSs, as adopted by the European Union (See Note 1 and 56). In the event of a discrepancy, the Spanish language version prevails.
8. Fair value
8.1 Fair value of financial instrument
The fair value of financial instrument is defined as the price that would be received to sell an asset or paid to
transfer a liability in an orderly transaction between market participants at the measurement date. It is
therefore a market-based measurement and not specific to each entity.
All financial instruments, both assets and liabilities are initially recognized at fair value, which at that point is
equivalent to the transaction price, unless there is evidence to the contrary in the market. Subsequently,
depending on the type of financial instrument, it may continue to be recognized at amortized cost or fair
value through adjustments in the consolidated income statement or equity.
When possible, the fair value is determined as the market price of a financial instrument. However, for many
of the financial assets and liabilities of the Group, especially in the case of derivatives, there is no market
price available, so its fair value is estimated on the basis of the price established in recent transactions
involving similar instruments or, in the absence thereof, by using mathematical measurement models that
are sufficiently tried and trusted by the international financial community. The estimates of the fair value
derived from the use of such models take into consideration the specific features of the asset or liability to be
measured and, in particular, the various types of risk associated with the asset or liability. However, the
limitations inherent in the measurement models and possible inaccuracies in the assumptions and
parameters required by these models may mean that the estimated fair value of an asset or liability does not
exactly match the price for which the asset or liability could be exchanged or settled on the date of its
measurement.
As part of the process established in the Group for determining the fair value in order to ensure that financial
assets and liabilities are properly valued, BBVA has established, at a geographic level, a structure of New
Product Committees responsible for validating and approving new products or types of financial assets and
liabilities before being contracted. Local management responsible for valuation, which are independent from
the business (see Note 7) are members of these committees.
These areas are required to ensure, prior to the approval stage, the existence of not only technical and
human resources, but also adequate informational sources to measure the fair value of these financial assets
and liabilities, in accordance with the rules established by the Global Valuation Area and using models that
have been validated and approved by the Risk Analytics & Innovation Department that reports to Global Risk
Management.
Additionally, for financial assets and liabilities that show significant uncertainty in inputs or model
parameters used for valuation, criteria is established to measure said uncertainty and activity limits are set
based on these. Finally, these measurements are compared, as much as possible, against other sources
such as the measurements obtained by the business teams or those obtained by other market participants.
The process for determining the fair value requires the classification of the financial assets and liabilities
according to the measurement processes used as set forth below:
Level 1: Measurement using market observable quoted prices for the financial instrument in
question, secured from independent sources and trading in active markets - according to the Group
policies. This level includes, listed equity instruments, some debt securities, some derivatives and
mutual funds.
Level 2: Measurement that applies techniques using inputs drawn from observable market data.
Level 3: Measurement using techniques where some of the material inputs are not derived from
market observable data. As of December 31, 2017, the affected instruments accounted for
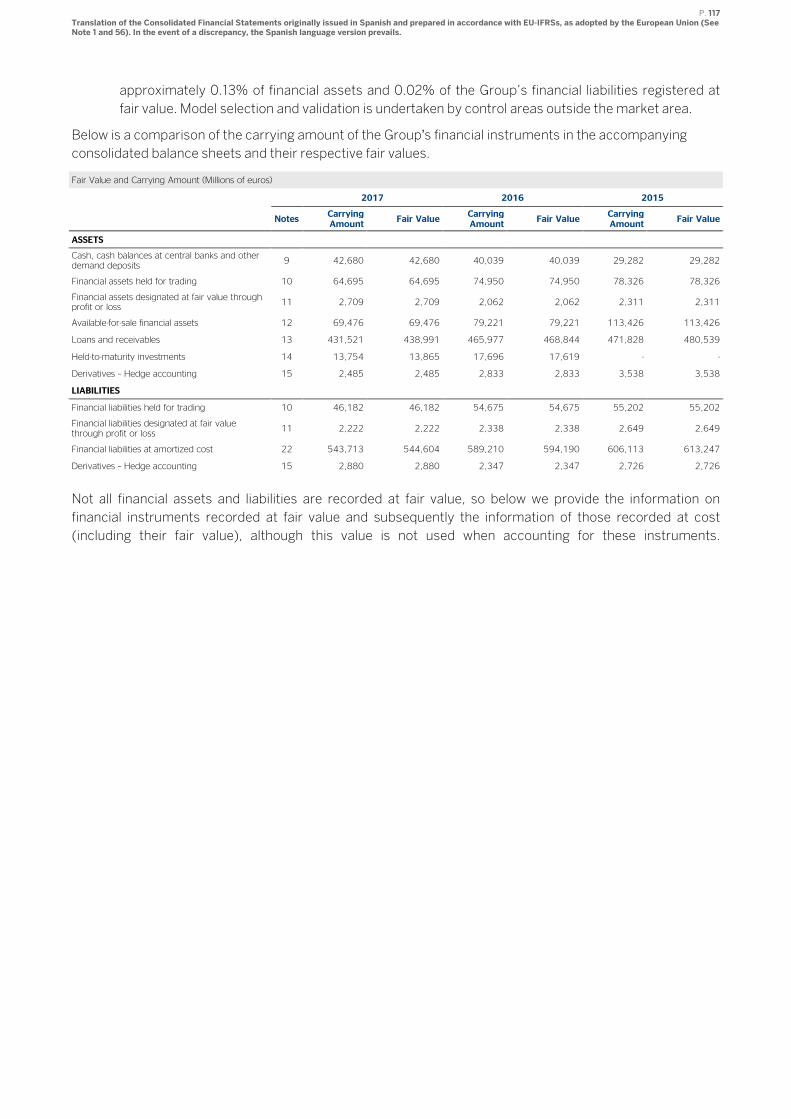
P. 117 Translation of the Consolidated Financial Statements originally issued in Spanish and prepared in accordance with EU-IFRSs, as adopted by the European Union (See Note 1 and 56). In the event of a discrepancy, the Spanish language version prevails.
approximately 0.13% of financial assets and 0.02% of the Group’s financial liabilities registered at
fair value. Model selection and validation is undertaken by control areas outside the market area.
Below is a comparison of the carrying amount of the Group’s financial instruments in the accompanying
consolidated balance sheets and their respective fair values.
Fair Value and Carrying Amount (Millions of euros)
2017 2016 2015
Notes Carrying Amount
Fair Value Carrying Amount
Fair Value Carrying Amount
Fair Value
ASSETS
Cash, cash balances at central banks and other demand deposits
9 42,680 42,680 40,039 40,039 29,282 29,282
Financial assets held for trading 10 64,695 64,695 74,950 74,950 78,326 78,326
Financial assets designated at fair value through profit or loss
11 2,709 2,709 2,062 2,062 2,311 2,311
Available-for-sale financial assets 12 69,476 69,476 79,221 79,221 113,426 113,426
Loans and receivables 13 431,521 438,991 465,977 468,844 471,828 480,539
Held-to-maturity investments 14 13,754 13,865 17,696 17,619 - -
Derivatives – Hedge accounting 15 2,485 2,485 2,833 2,833 3,538 3,538
LIABILITIES
Financial liabilities held for trading 10 46,182 46,182 54,675 54,675 55,202 55,202
Financial liabilities designated at fair value through profit or loss
11 2,222 2,222 2,338 2,338 2,649 2,649
Financial liabilities at amortized cost 22 543,713 544,604 589,210 594,190 606,113 613,247
Derivatives – Hedge accounting 15 2,880 2,880 2,347 2,347 2,726 2,726
Not all financial assets and liabilities are recorded at fair value, so below we provide the information on
financial instruments recorded at fair value and subsequently the information of those recorded at cost
(including their fair value), although this value is not used when accounting for these instruments.
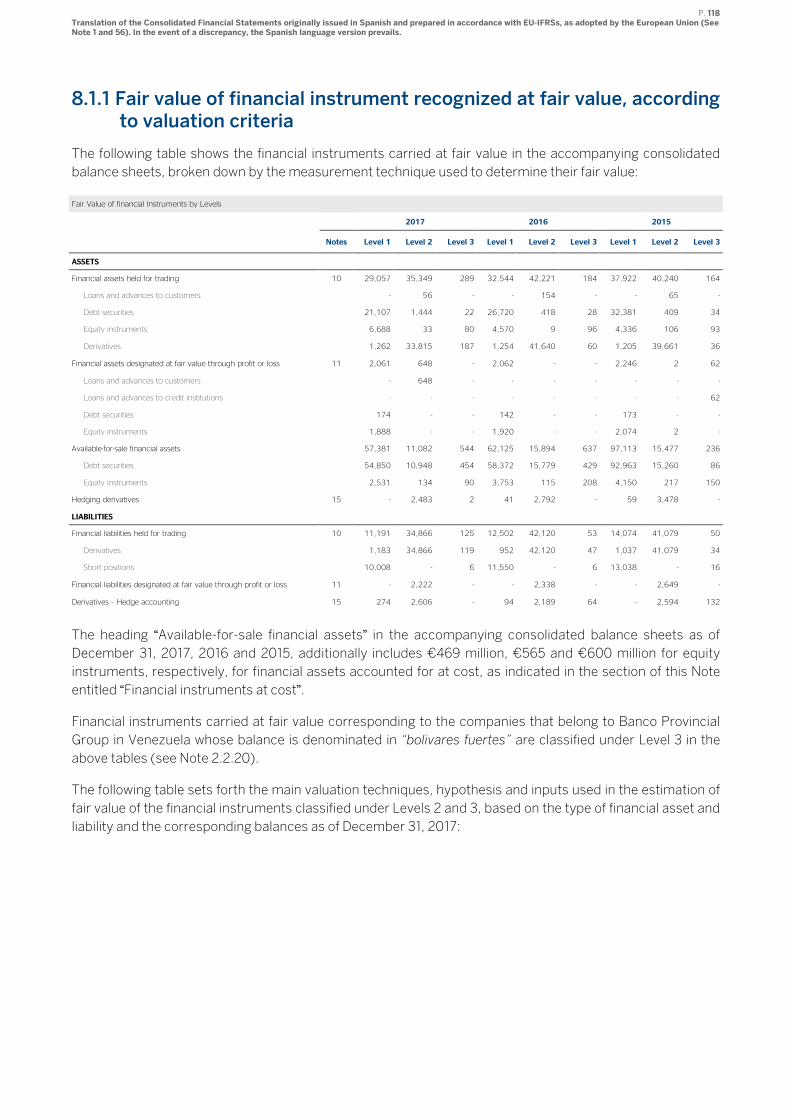
P. 118 Translation of the Consolidated Financial Statements originally issued in Spanish and prepared in accordance with EU-IFRSs, as adopted by the European Union (See Note 1 and 56). In the event of a discrepancy, the Spanish language version prevails.
8.1.1 Fair value of financial instrument recognized at fair value, according to valuation criteria
The following table shows the financial instruments carried at fair value in the accompanying consolidated
balance sheets, broken down by the measurement technique used to determine their fair value:
Fair Value of financial Instruments by Levels
2017 2016 2015
Notes Level 1 Level 2 Level 3 Level 1 Level 2 Level 3 Level 1 Level 2 Level 3
ASSETS
Financial assets held for trading 10 29,057 35,349 289 32,544 42,221 184 37,922 40,240 164
Loans and advances to customers - 56 - - 154 - - 65 -
Debt securities 21,107 1,444 22 26,720 418 28 32,381 409 34
Equity instruments 6,688 33 80 4,570 9 96 4,336 106 93
Derivatives 1,262 33,815 187 1,254 41,640 60 1,205 39,661 36
Financial assets designated at fair value through profit or loss 11 2,061 648 - 2,062 - - 2,246 2 62
Loans and advances to customers - 648 - - - - - - -
Loans and advances to credit institutions - - - - - - - - 62
Debt securities 174 - - 142 - - 173 - -
Equity instruments 1,888 - - 1,920 - - 2,074 2 -
Available-for-sale financial assets 57,381 11,082 544 62,125 15,894 637 97,113 15,477 236
Debt securities 54,850 10,948 454 58,372 15,779 429 92,963 15,260 86
Equity instruments 2,531 134 90 3,753 115 208 4,150 217 150
Hedging derivatives 15 - 2,483 2 41 2,792 - 59 3,478 -
LIABILITIES
Financial liabilities held for trading 10 11,191 34,866 125 12,502 42,120 53 14,074 41,079 50
Derivatives 1,183 34,866 119 952 42,120 47 1,037 41,079 34
Short positions 10,008 - 6 11,550 - 6 13,038 - 16
Financial liabilities designated at fair value through profit or loss 11 - 2,222 - - 2,338 - - 2,649 -
Derivatives – Hedge accounting 15 274 2,606 - 94 2,189 64 - 2,594 132
The heading “Available-for-sale financial assets” in the accompanying consolidated balance sheets as of
December 31, 2017, 2016 and 2015, additionally includes €469 million, €565 and €600 million for equity
instruments, respectively, for financial assets accounted for at cost, as indicated in the section of this Note
entitled “Financial instruments at cost”.
Financial instruments carried at fair value corresponding to the companies that belong to Banco Provincial
Group in Venezuela whose balance is denominated in “bolivares fuertes” are classified under Level 3 in the
above tables (see Note 2.2.20).
The following table sets forth the main valuation techniques, hypothesis and inputs used in the estimation of
fair value of the financial instruments classified under Levels 2 and 3, based on the type of financial asset and
liability and the corresponding balances as of December 31, 2017:
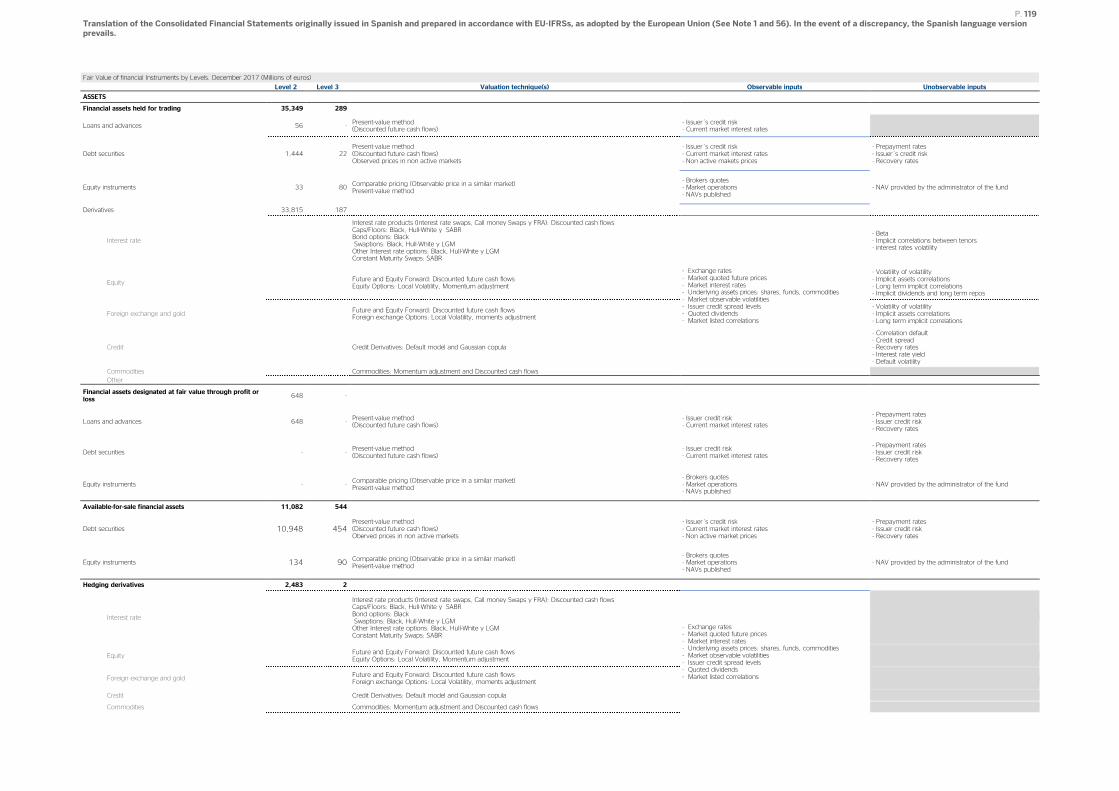
P. 119 Translation of the Consolidated Financial Statements originally issued in Spanish and prepared in accordance with EU-IFRSs, as adopted by the European Union (See Note 1 and 56). In the event of a discrepancy, the Spanish language version prevails.
Fair Value of financial Instruments by Levels. December 2017 (Millions of euros)
Level 2 Level 3 Valuation technique(s) Observable inputs Unobservable inputs
ASSETS
Financial assets held for trading 35,349 289
Loans and advances 56 - Present-value method (Discounted future cash flows)
- Issuer´s credit risk - Current market interest rates
Debt securities 1,444 22 Present-value method (Discounted future cash flows) Observed prices in non active markets
- Issuer´s credit risk - Current market interest rates - Non active makets prices
- Prepayment rates - Issuer´s credit risk - Recovery rates
Equity instruments 33 80 Comparable pricing (Observable price in a similar market) Present-value method
- Brokers quotes - Market operations - NAVs published
- NAV provided by the administrator of the fund
Derivatives 33,815 187
Interest rate
Interest rate products (Interest rate swaps, Call money Swaps y FRA): Discounted cash flows Caps/Floors: Black, Hull-White y SABR Bond options: Black Swaptions: Black, Hull-White y LGM Other Interest rate options: Black, Hull-White y LGM Constant Maturity Swaps: SABR
- Exchange rates - Market quoted future prices - Market interest rates - Underlying assets prices: shares, funds, commodities - Market observable volatilities - Issuer credit spread levels - Quoted dividends - Market listed correlations
- Beta - Implicit correlations between tenors - interest rates volatility
Equity Future and Equity Forward: Discounted future cash flows Equity Options: Local Volatility, Momentum adjustment
- Volatility of volatility - Implicit assets correlations - Long term implicit correlations - Implicit dividends and long term repos
Foreign exchange and gold Future and Equity Forward: Discounted future cash flows Foreign exchange Options: Local Volatility, moments adjustment
- Volatility of volatility - Implicit assets correlations - Long term implicit correlations
Credit Credit Derivatives: Default model and Gaussian copula
- Correlation default - Credit spread - Recovery rates - Interest rate yield - Default volatility
Commodities Commodities: Momentum adjustment and Discounted cash flows
Other
Financial assets designated at fair value through profit or loss
648 -
Loans and advances 648 - Present-value method (Discounted future cash flows)
- Issuer credit risk - Current market interest rates
- Prepayment rates - Issuer credit risk - Recovery rates
Debt securities - - Present-value method (Discounted future cash flows)
- Issuer credit risk - Current market interest rates
- Prepayment rates - Issuer credit risk - Recovery rates
Equity instruments - - Comparable pricing (Observable price in a similar market) Present-value method
- Brokers quotes - Market operations - NAVs published
- NAV provided by the administrator of the fund
Available-for-sale financial assets 11,082 544
Debt securities 10,948 454 Present-value method (Discounted future cash flows) Oberved prices in non active markets
- Issuer´s credit risk - Current market interest rates - Non active market prices
- Prepayment rates - Issuer credit risk - Recovery rates
Equity instruments 134 90 Comparable pricing (Observable price in a similar market) Present-value method
- Brokers quotes - Market operations - NAVs published
- NAV provided by the administrator of the fund
Hedging derivatives 2,483 2
Interest rate
Interest rate products (Interest rate swaps, Call money Swaps y FRA): Discounted cash flows Caps/Floors: Black, Hull-White y SABR Bond options: Black Swaptions: Black, Hull-White y LGM Other Interest rate options: Black, Hull-White y LGM Constant Maturity Swaps: SABR
- Exchange rates - Market quoted future prices - Market interest rates - Underlying assets prices: shares, funds, commodities - Market observable volatilities - Issuer credit spread levels - Quoted dividends - Market listed correlations
Equity Future and Equity Forward: Discounted future cash flows Equity Options: Local Volatility, Momentum adjustment
Foreign exchange and gold Future and Equity Forward: Discounted future cash flows Foreign exchange Options: Local Volatility, moments adjustment
Credit Credit Derivatives: Default model and Gaussian copula
Commodities Commodities: Momentum adjustment and Discounted cash flows
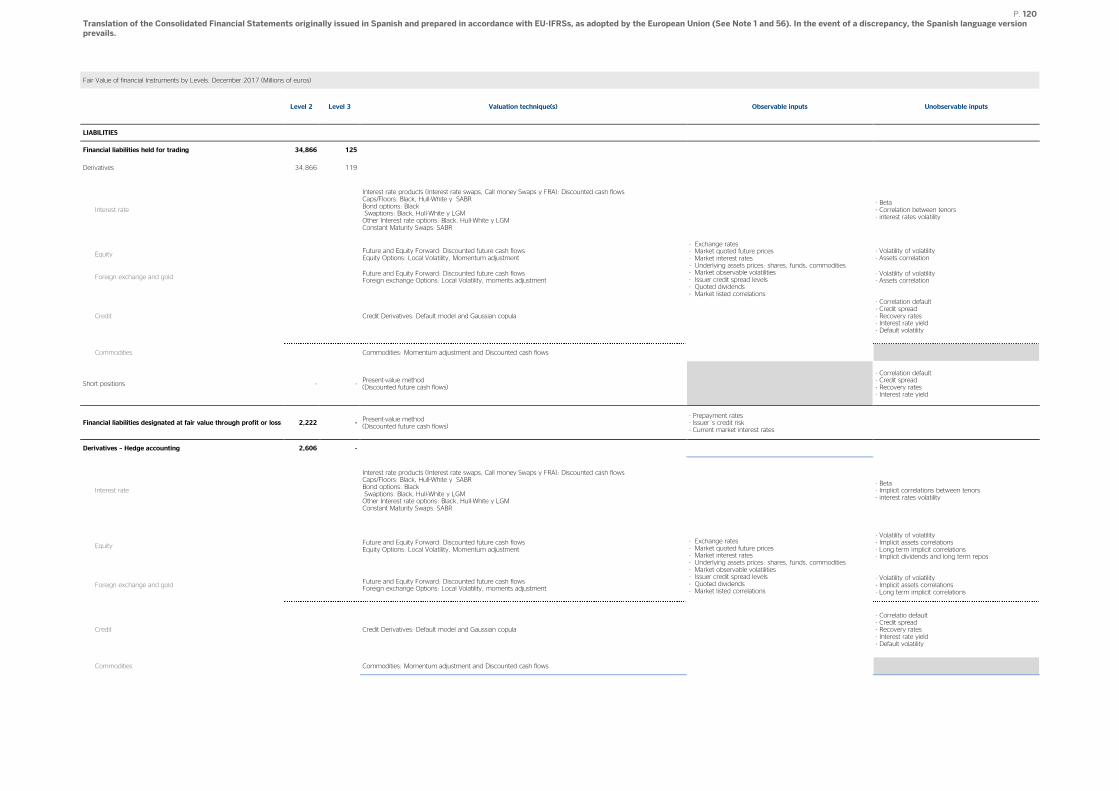
P. 120 Translation of the Consolidated Financial Statements originally issued in Spanish and prepared in accordance with EU-IFRSs, as adopted by the European Union (See Note 1 and 56). In the event of a discrepancy, the Spanish language version prevails.
Fair Value of financial Instruments by Levels. December 2017 (Millions of euros)
Level 2 Level 3 Valuation technique(s) Observable inputs Unobservable inputs
LIABILITIES
Financial liabilities held for trading 34,866 125
Derivatives 34,866 119
Interest rate
Interest rate products (Interest rate swaps, Call money Swaps y FRA): Discounted cash flows Caps/Floors: Black, Hull-White y SABR Bond options: Black Swaptions: Black, Hull-White y LGM Other Interest rate options: Black, Hull-White y LGM Constant Maturity Swaps: SABR
- Exchange rates - Market quoted future prices - Market interest rates - Underlying assets prices: shares, funds, commodities - Market observable volatilities - Issuer credit spread levels - Quoted dividends - Market listed correlations
- Beta - Correlation between tenors - interest rates volatility
Equity Future and Equity Forward: Discounted future cash flows Equity Options: Local Volatility, Momentum adjustment
- Volatility of volatility - Assets correlation
Foreign exchange and gold Future and Equity Forward: Discounted future cash flows Foreign exchange Options: Local Volatility, moments adjustment
- Volatility of volatility - Assets correlation
Credit Credit Derivatives: Default model and Gaussian copula
- Correlation default - Credit spread - Recovery rates - Interest rate yield - Default volatility
Commodities Commodities: Momentum adjustment and Discounted cash flows
Short positions - - Present-value method (Discounted future cash flows)
- Correlation default - Credit spread - Recovery rates - Interest rate yield
Financial liabilities designated at fair value through profit or loss 2,222 - Present-value method (Discounted future cash flows)
- Prepayment rates - Issuer´s credit risk - Current market interest rates
Derivatives – Hedge accounting 2,606 -
Interest rate
Interest rate products (Interest rate swaps, Call money Swaps y FRA): Discounted cash flows Caps/Floors: Black, Hull-White y SABR Bond options: Black Swaptions: Black, Hull-White y LGM Other Interest rate options: Black, Hull-White y LGM Constant Maturity Swaps: SABR
- Exchange rates - Market quoted future prices - Market interest rates - Underlying assets prices: shares, funds, commodities - Market observable volatilities - Issuer credit spread levels - Quoted dividends - Market listed correlations
- Beta - Implicit correlations between tenors - interest rates volatility
Equity Future and Equity Forward: Discounted future cash flows Equity Options: Local Volatility, Momentum adjustment
- Volatility of volatility - Implicit assets correlations - Long term implicit correlations - Implicit dividends and long term repos
Foreign exchange and gold Future and Equity Forward: Discounted future cash flows Foreign exchange Options: Local Volatility, moments adjustment
- Volatility of volatility - Implicit assets correlations - Long term implicit correlations
Credit Credit Derivatives: Default model and Gaussian copula
- Correlatio default - Credit spread - Recovery rates - Interest rate yield - Default volatility
Commodities Commodities: Momentum adjustment and Discounted cash flows
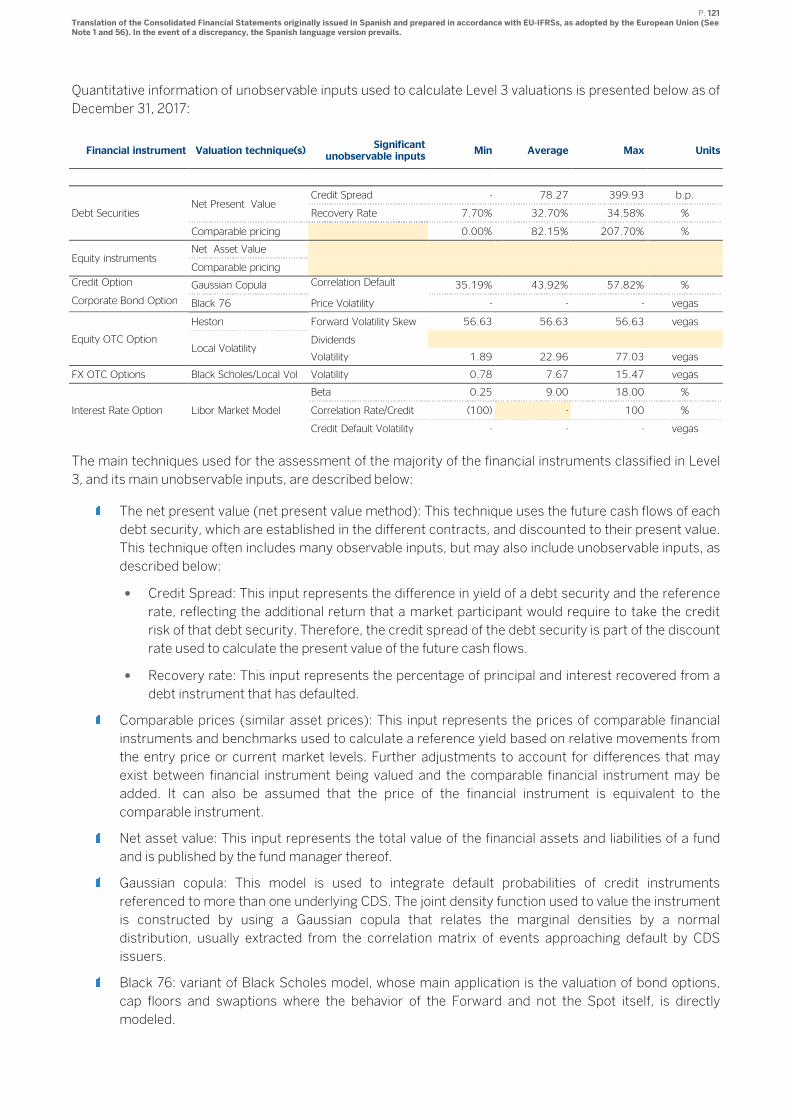
P. 121 Translation of the Consolidated Financial Statements originally issued in Spanish and prepared in accordance with EU-IFRSs, as adopted by the European Union (See Note 1 and 56). In the event of a discrepancy, the Spanish language version prevails.
Quantitative information of unobservable inputs used to calculate Level 3 valuations is presented below as of
December 31, 2017:
Financial instrument Valuation technique(s) Significant
unobservable inputs Min Average Max Units
Debt Securities Net Present Value
Credit Spread - 78.27 399.93 b.p.
Recovery Rate 7.70% 32.70% 34.58% %
Comparable pricing 0.00% 82.15% 207.70% %
Equity instruments Net Asset Value
Comparable pricing
Credit Option Gaussian Copula Correlation Default 35.19% 43.92% 57.82% %
Corporate Bond Option Black 76 Price Volatility - - - vegas
Equity OTC Option
Heston Forward Volatility Skew 56.63 56.63 56.63 vegas
Local Volatility Dividends
Volatility 1.89 22.96 77.03 vegas
FX OTC Options Black Scholes/Local Vol Volatility 0.78 7.67 15.47 vegas
Interest Rate Option Libor Market Model
Beta 0.25 9.00 18.00 %
Correlation Rate/Credit (100) - 100 %
Credit Default Volatility - - - vegas
The main techniques used for the assessment of the majority of the financial instruments classified in Level
3, and its main unobservable inputs, are described below:
The net present value (net present value method): This technique uses the future cash flows of each
debt security, which are established in the different contracts, and discounted to their present value.
This technique often includes many observable inputs, but may also include unobservable inputs, as
described below:
• Credit Spread: This input represents the difference in yield of a debt security and the reference
rate, reflecting the additional return that a market participant would require to take the credit
risk of that debt security. Therefore, the credit spread of the debt security is part of the discount
rate used to calculate the present value of the future cash flows.
• Recovery rate: This input represents the percentage of principal and interest recovered from a
debt instrument that has defaulted.
Comparable prices (similar asset prices): This input represents the prices of comparable financial
instruments and benchmarks used to calculate a reference yield based on relative movements from
the entry price or current market levels. Further adjustments to account for differences that may
exist between financial instrument being valued and the comparable financial instrument may be
added. It can also be assumed that the price of the financial instrument is equivalent to the
comparable instrument.
Net asset value: This input represents the total value of the financial assets and liabilities of a fund
and is published by the fund manager thereof.
Gaussian copula: This model is used to integrate default probabilities of credit instruments
referenced to more than one underlying CDS. The joint density function used to value the instrument
is constructed by using a Gaussian copula that relates the marginal densities by a normal
distribution, usually extracted from the correlation matrix of events approaching default by CDS
issuers.
Black 76: variant of Black Scholes model, whose main application is the valuation of bond options,
cap floors and swaptions where the behavior of the Forward and not the Spot itself, is directly
modeled.
P. 122 Translation of the Consolidated Financial Statements originally issued in Spanish and prepared in accordance with EU-IFRSs, as adopted by the European Union (See Note 1 and 56). In the event of a discrepancy, the Spanish language version prevails.
Black Scholes: The Black Scholes model postulates log-normal distribution for the prices of
securities, so that the expected return under the risk neutral measure is the risk free interest rate.
Under this assumption, the price of vanilla options can be obtained analytically, so that inverting the
Black- Scholes formula, the implied volatility for process of the price can be calculated.
Heston: This model, typically applied to equity OTC options, assumes stochastic behavior of
volatility. According to which, the volatility follows a process that reverts to a long-term level and is
correlated with the underlying equity instrument. As opposed to local volatility models, in which the
volatility evolves deterministically, the Heston model is more flexible, allowing it to be similar to that
observed in the short term today.
Libor market model: This model assumes that the dynamics of the interest rate curve can be
modeled based on the set of forward contracts that compose the underlying interest rate. The
correlation matrix is parameterized on the assumption that the correlation between any two forward
contracts decreases at a constant rate, beta, to the extent of the difference in their respective due
dates. The input “Credit default volatility” is a volatility input of the credit factor dynamic. The
multifactorial frame of this model makes it ideal for the valuation of instruments sensitive to the slope
or curve, including interest rate option.
Local Volatility: In the local volatility models of the volatility, instead of being static, evolves over time
according to the level of moneyness of the underlying, capturing the existence of smiles. These
models are appropriate for pricing path dependent options when use Monte Carlo simulation
technique is used.
Adjustments to the valuation for risk of default
The credit valuation adjustments (“CVA”) and debit valuation adjustments (“DVA”) are a part of derivative
instrument valuations, both financial assets and liabilities, to reflect the impact in the fair value of the credit
risk of the counterparty and BBVA, respectively.
These adjustments are calculated by estimating Exposure At Default, Probability of Default and Loss Given
Default, for all derivative products on any instrument at the legal entity level (all counterparties under a same
ISDA / CMOF) in which BBVA has exposure.
As a general rule, the calculation of CVA is done through simulations of market and credit variables to
calculate the expected positive exposure, given the Exposure at Default and multiplying the result by the
Loss Given Default of the counterparty. Consequently, the DVA is calculated as the result of the expected
negative exposure given the Exposure at Default and multiplying the result by the Loss Given Default of the
counterparty. Both calculations are performed throughout the entire period of potential exposure.
The information needed to calculate the exposure at default and the loss given default come from the credit
markets (Credit Default Swaps or iTraxx Indexes), where rating is available. For those cases where the rating
is not available, BBVA implements a mapping process based on the sector, rating and geography to assign
probabilities of both probability of default and loss given default, calibrated directly to market or with an
adjustment market factor for the probability of default and the historical expected loss.
The amounts recognized in the consolidated balance sheet as of December 31, 2017 related to the valuation
adjustments to the credit assessment of the derivative asset as “Credit Valuation Adjustments” (“CVA”) and
the derivative liabilities as “Debit Valuation Adjustment” (DVA) were €-153 million and €138 million
respectively. The impact recorded under “Gains or (-) losses on financial assets and liabilities held for
trading, net” in the consolidated income statement as for the years ended 2017 and 2016 corresponding to
the mentioned adjustments was a net impact of -€23 million and €46 million respectively. Additionally, as of
December 31, 2017, €-10 million related to the “Funding Valuation Adjustments” (“FVA”) were recognized in
the consolidated balance sheet.
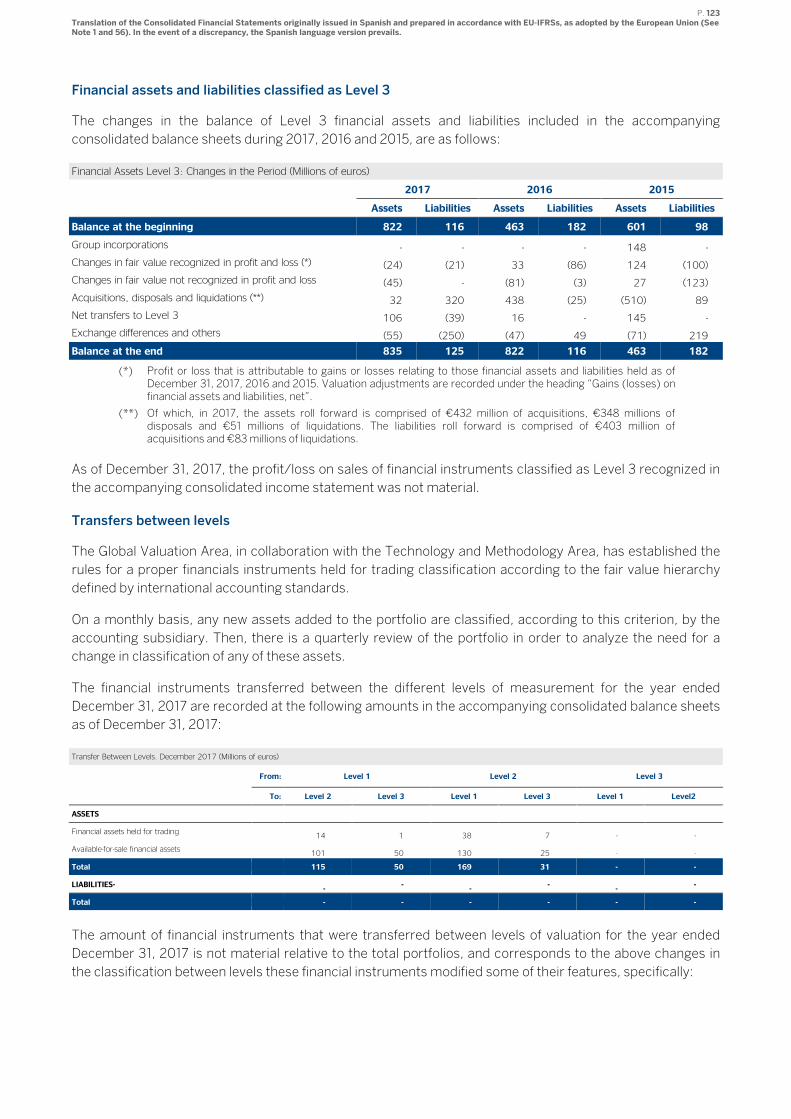
P. 123 Translation of the Consolidated Financial Statements originally issued in Spanish and prepared in accordance with EU-IFRSs, as adopted by the European Union (See Note 1 and 56). In the event of a discrepancy, the Spanish language version prevails.
Financial assets and liabilities classified as Level 3
The changes in the balance of Level 3 financial assets and liabilities included in the accompanying
consolidated balance sheets during 2017, 2016 and 2015, are as follows:
Financial Assets Level 3: Changes in the Period (Millions of euros)
2017 2016 2015
Assets Liabilities Assets Liabilities Assets Liabilities
Balance at the beginning 822 116 463 182 601 98
Group incorporations - - - - 148 -
Changes in fair value recognized in profit and loss (*) (24) (21) 33 (86) 124 (100)
Changes in fair value not recognized in profit and loss (45) - (81) (3) 27 (123)
Acquisitions, disposals and liquidations (**) 32 320 438 (25) (510) 89
Net transfers to Level 3 106 (39) 16 - 145 -
Exchange differences and others (55) (250) (47) 49 (71) 219
Balance at the end 835 125 822 116 463 182
(*) Profit or loss that is attributable to gains or losses relating to those financial assets and liabilities held as of December 31, 2017, 2016 and 2015. Valuation adjustments are recorded under the heading “Gains (losses) on financial assets and liabilities, net”.
(**) Of which, in 2017, the assets roll forward is comprised of €432 million of acquisitions, €348 millions of disposals and €51 millions of liquidations. The liabilities roll forward is comprised of €403 million of acquisitions and €83 millions of liquidations.
As of December 31, 2017, the profit/loss on sales of financial instruments classified as Level 3 recognized in
the accompanying consolidated income statement was not material.
Transfers between levels
The Global Valuation Area, in collaboration with the Technology and Methodology Area, has established the
rules for a proper financials instruments held for trading classification according to the fair value hierarchy
defined by international accounting standards.
On a monthly basis, any new assets added to the portfolio are classified, according to this criterion, by the
accounting subsidiary. Then, there is a quarterly review of the portfolio in order to analyze the need for a
change in classification of any of these assets.
The financial instruments transferred between the different levels of measurement for the year ended
December 31, 2017 are recorded at the following amounts in the accompanying consolidated balance sheets
as of December 31, 2017:
Transfer Between Levels. December 2017 (Millions of euros)
From: Level 1 Level 2 Level 3
To: Level 2 Level 3 Level 1 Level 3 Level 1 Level2
ASSETS
Financial assets held for trading 14 1 38 7 - -
Available-for-sale financial assets 101 50 130 25 - -
Total 115 50 169 31 - -
LIABILITIES- -
- -
- -
-
Total - - - - - -
The amount of financial instruments that were transferred between levels of valuation for the year ended
December 31, 2017 is not material relative to the total portfolios, and corresponds to the above changes in
the classification between levels these financial instruments modified some of their features, specifically:
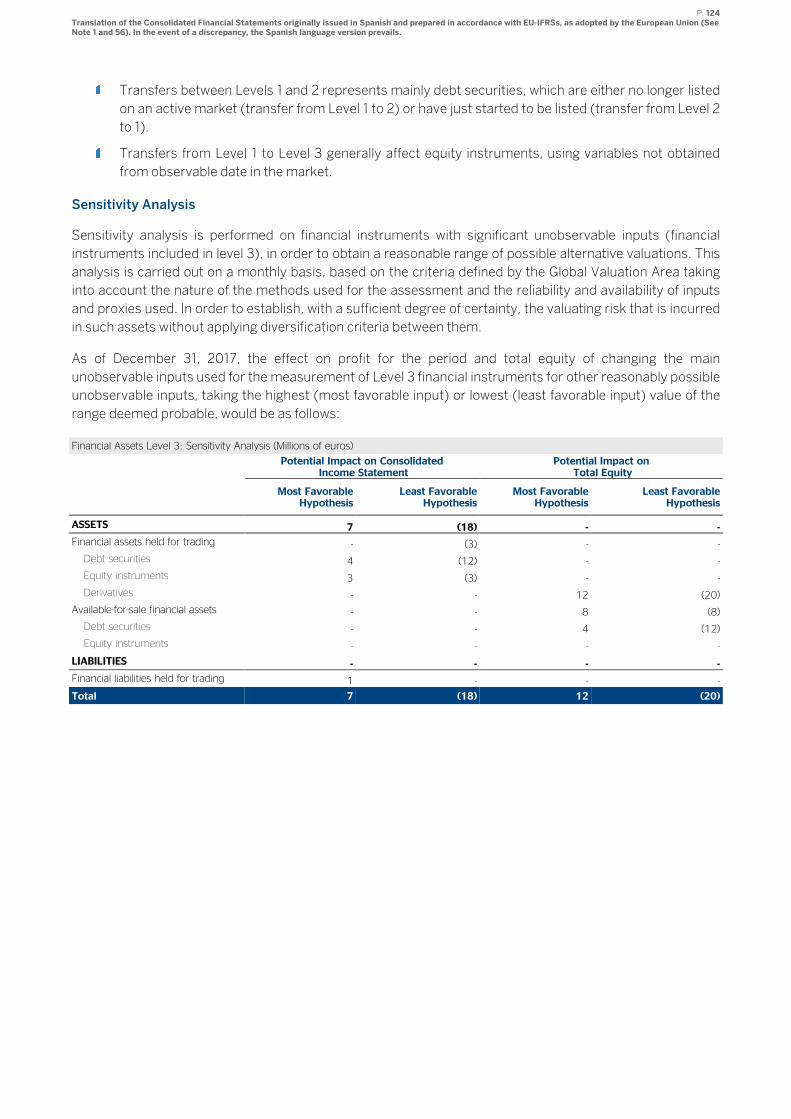
P. 124 Translation of the Consolidated Financial Statements originally issued in Spanish and prepared in accordance with EU-IFRSs, as adopted by the European Union (See Note 1 and 56). In the event of a discrepancy, the Spanish language version prevails.
Transfers between Levels 1 and 2 represents mainly debt securities, which are either no longer listed
on an active market (transfer from Level 1 to 2) or have just started to be listed (transfer from Level 2
to 1).
Transfers from Level 1 to Level 3 generally affect equity instruments, using variables not obtained
from observable date in the market.
Sensitivity Analysis
Sensitivity analysis is performed on financial instruments with significant unobservable inputs (financial
instruments included in level 3), in order to obtain a reasonable range of possible alternative valuations. This
analysis is carried out on a monthly basis, based on the criteria defined by the Global Valuation Area taking
into account the nature of the methods used for the assessment and the reliability and availability of inputs
and proxies used. In order to establish, with a sufficient degree of certainty, the valuating risk that is incurred
in such assets without applying diversification criteria between them.
As of December 31, 2017, the effect on profit for the period and total equity of changing the main
unobservable inputs used for the measurement of Level 3 financial instruments for other reasonably possible
unobservable inputs, taking the highest (most favorable input) or lowest (least favorable input) value of the
range deemed probable, would be as follows:
Financial Assets Level 3: Sensitivity Analysis (Millions of euros)
Potential Impact on Consolidated
Income Statement Potential Impact on Total Equity
Most Favorable Hypothesis
Least Favorable Hypothesis
Most Favorable Hypothesis
Least Favorable Hypothesis
ASSETS 7 (18) - -
Financial assets held for trading - (3) - -
Debt securities 4 (12) - -
Equity instruments 3 (3) - -
Derivatives - - 12 (20)
Available-for-sale financial assets - - 8 (8)
Debt securities - - 4 (12)
Equity instruments - - - -
LIABILITIES - - - -
Financial liabilities held for trading 1 - - -
Total 7 (18) 12 (20)
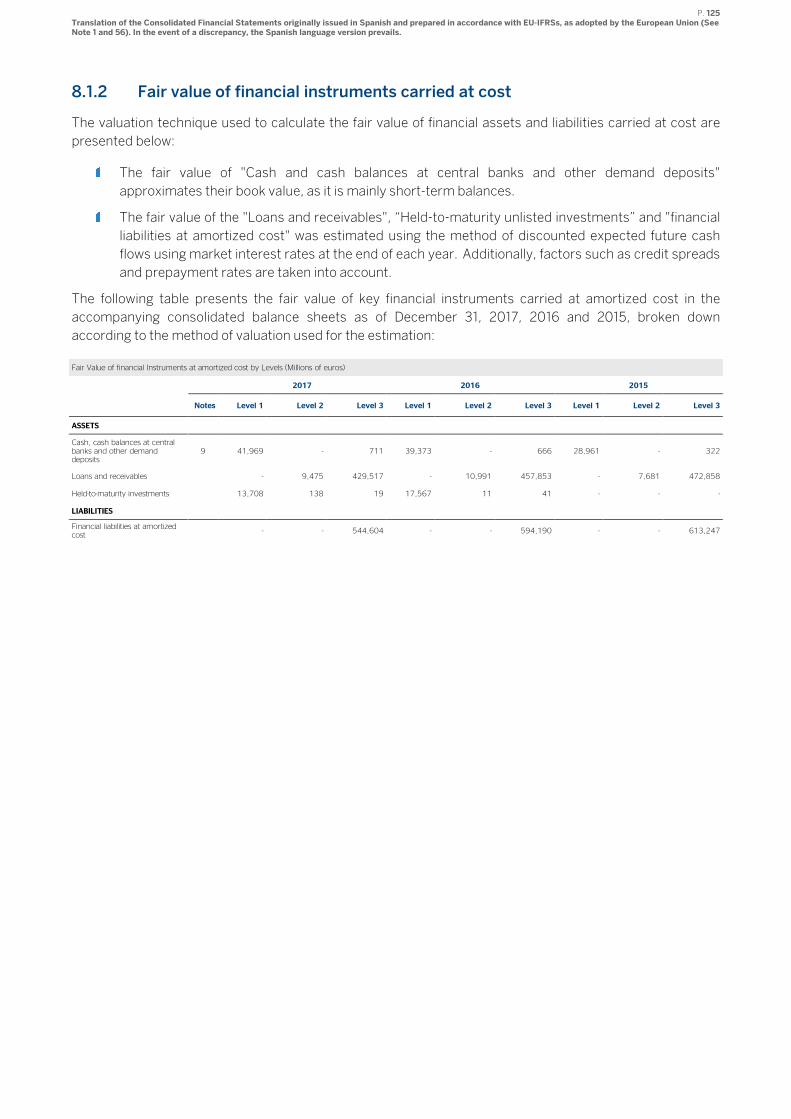
P. 125 Translation of the Consolidated Financial Statements originally issued in Spanish and prepared in accordance with EU-IFRSs, as adopted by the European Union (See Note 1 and 56). In the event of a discrepancy, the Spanish language version prevails.
8.1.2 Fair value of financial instruments carried at cost
The valuation technique used to calculate the fair value of financial assets and liabilities carried at cost are
presented below:
The fair value of "Cash and cash balances at central banks and other demand deposits"
approximates their book value, as it is mainly short-term balances.
The fair value of the "Loans and receivables", “Held-to-maturity unlisted investments” and "financial
liabilities at amortized cost" was estimated using the method of discounted expected future cash
flows using market interest rates at the end of each year. Additionally, factors such as credit spreads
and prepayment rates are taken into account.
The following table presents the fair value of key financial instruments carried at amortized cost in the
accompanying consolidated balance sheets as of December 31, 2017, 2016 and 2015, broken down
according to the method of valuation used for the estimation:
Fair Value of financial Instruments at amortized cost by Levels (Millions of euros)
2017 2016 2015
Notes Level 1 Level 2 Level 3 Level 1 Level 2 Level 3 Level 1 Level 2 Level 3
ASSETS
Cash, cash balances at central banks and other demand deposits
9 41,969 - 711 39,373 - 666 28,961 - 322
Loans and receivables - 9,475 429,517 - 10,991 457,853 - 7,681 472,858
Held-to-maturity investments 13,708 138 19 17,567 11 41 - - -
LIABILITIES
Financial liabilities at amortized cost
- - 544,604 - - 594,190 - - 613,247
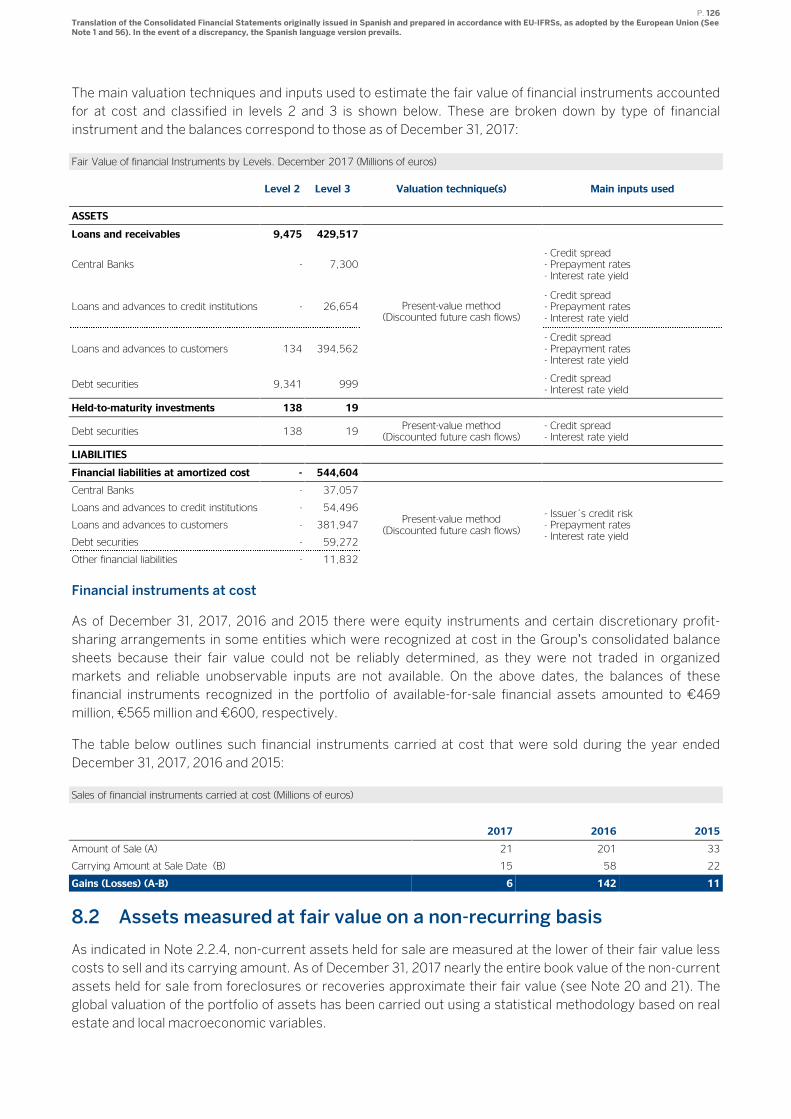
P. 126 Translation of the Consolidated Financial Statements originally issued in Spanish and prepared in accordance with EU-IFRSs, as adopted by the European Union (See Note 1 and 56). In the event of a discrepancy, the Spanish language version prevails.
The main valuation techniques and inputs used to estimate the fair value of financial instruments accounted
for at cost and classified in levels 2 and 3 is shown below. These are broken down by type of financial
instrument and the balances correspond to those as of December 31, 2017:
Fair Value of financial Instruments by Levels. December 2017 (Millions of euros)
Level 2 Level 3 Valuation technique(s) Main inputs used
ASSETS
Loans and receivables 9,475 429,517
Present-value method (Discounted future cash flows)
Central Banks - 7,300 - Credit spread - Prepayment rates - Interest rate yield
Loans and advances to credit institutions - 26,654 - Credit spread - Prepayment rates - Interest rate yield
Loans and advances to customers 134 394,562 - Credit spread - Prepayment rates - Interest rate yield
Debt securities 9,341 999 - Credit spread - Interest rate yield
Held-to-maturity investments 138 19
Debt securities 138 19 Present-value method
(Discounted future cash flows) - Credit spread - Interest rate yield
LIABILITIES
Financial liabilities at amortized cost - 544,604
Central Banks - 37,057
Present-value method (Discounted future cash flows)
- Issuer´s credit risk - Prepayment rates - Interest rate yield
Loans and advances to credit institutions - 54,496
Loans and advances to customers - 381,947
Debt securities - 59,272
Other financial liabilities - 11,832
Financial instruments at cost
As of December 31, 2017, 2016 and 2015 there were equity instruments and certain discretionary profit-
sharing arrangements in some entities which were recognized at cost in the Group’s consolidated balance
sheets because their fair value could not be reliably determined, as they were not traded in organized
markets and reliable unobservable inputs are not available. On the above dates, the balances of these
financial instruments recognized in the portfolio of available-for-sale financial assets amounted to €469
million, €565 million and €600, respectively.
The table below outlines such financial instruments carried at cost that were sold during the year ended
December 31, 2017, 2016 and 2015:
Sales of financial instruments carried at cost (Millions of euros)
2017 2016 2015
Amount of Sale (A) 21 201 33
Carrying Amount at Sale Date (B) 15 58 22
Gains (Losses) (A-B) 6 142 11
8.2 Assets measured at fair value on a non-recurring basis
As indicated in Note 2.2.4, non-current assets held for sale are measured at the lower of their fair value less
costs to sell and its carrying amount. As of December 31, 2017 nearly the entire book value of the non-current
assets held for sale from foreclosures or recoveries approximate their fair value (see Note 20 and 21). The
global valuation of the portfolio of assets has been carried out using a statistical methodology based on real
estate and local macroeconomic variables.
P. 127 Translation of the Consolidated Financial Statements originally issued in Spanish and prepared in accordance with EU-IFRSs, as adopted by the European Union (See Note 1 and 56). In the event of a discrepancy, the Spanish language version prevails.
Valuation standards
The overall rating of the portfolio of assets has been carried out using a statistical methodology based on real
estate and local macroeconomic variables.
The details of each property which has been based each of the assessments are specified in the data sheet
valuation of each asset.
Valuation Methodology
Overall valuation of real estate assets portfolio
The overall valuation of the portfolio of real estate assets was performed from the latest appraisal values
available. This value was adjusted based on the following:
Analysis of the property sales performed during the year and comparison of the cost to sell these
properties to the appraisal values obtained most recently. From this analysis derived a conclusion by
type of property and location.
Individual valuation of a material sample of the entire portfolio considering type of properties. The
results obtained from these valuations have been compared with the adjusted values of the above
analysis, obtaining a second conclusion by type and location.
Individual valuation of real estate assets sample
The basic methods used in the valuation were as follows:
Comparative Market Method: the property under study is compared with others with similar
characteristics which have been recently sold or are for sale on the market, making a comparative
analysis, making adjustments due to factors that can cause differences, such as location, size,
dimensions, shape, topography, access, urban classification, type of construction, age, storage,
distribution, function, or design.
Dynamic Residual Method (DRM): this is considered the most accurate method to conduct an
appraisal of poorly developed or undeveloped land, where there is minimal planning (use and a gross
floor area) or a more defined development planning, since in these cases the market is often not very
transparent. It starts from the consideration that the development and sale of finished real estate
product is conceived from the beginning as a business project, as such it involves a risk, taking place
in a time frame in which an initial capital investment occurs generating income and expenses. As
such business project, the goal is to maximize profits and therefore the principle of highest and best
use.
Yield Method (DCF): the value of assets is determined by the profits that they could generate in the
future (projections) discounted at an appropriate rate of discount. This is an overall assessment,
reflecting the economic potential and profitability.
To calculate the value, once the market conditions have been analyzed, the following factors are taken into
consideration:
Size, location, and type of property.
Current condition of the property market, sales price trends and rental competition in the real estate
market or industry risk, adjusted based on the statistical information of local real estate and
macroeconomic variables.
The fullest and best use of the asset, which must be legally allowed, physically possible, economically
viable, and provide the maximum possible value, supported in economic terms. Analysis of the fullest
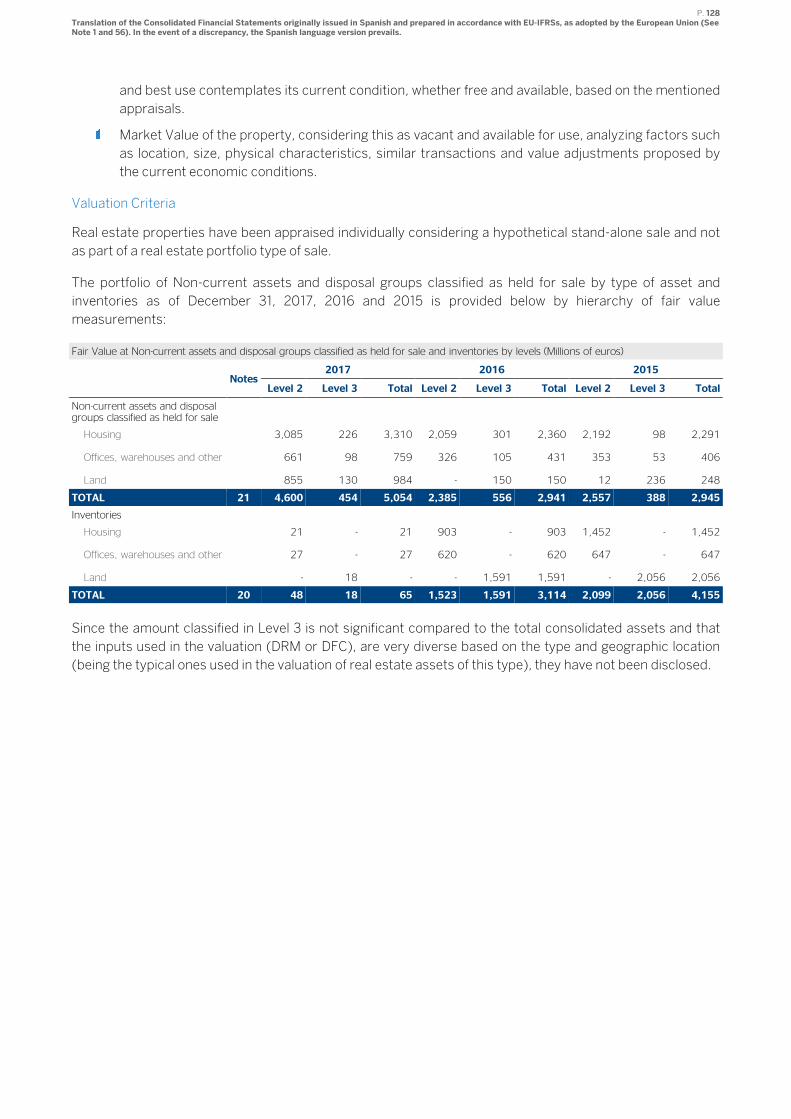
P. 128 Translation of the Consolidated Financial Statements originally issued in Spanish and prepared in accordance with EU-IFRSs, as adopted by the European Union (See Note 1 and 56). In the event of a discrepancy, the Spanish language version prevails.
and best use contemplates its current condition, whether free and available, based on the mentioned
appraisals.
Market Value of the property, considering this as vacant and available for use, analyzing factors such
as location, size, physical characteristics, similar transactions and value adjustments proposed by
the current economic conditions.
Valuation Criteria
Real estate properties have been appraised individually considering a hypothetical stand-alone sale and not
as part of a real estate portfolio type of sale.
The portfolio of Non-current assets and disposal groups classified as held for sale by type of asset and
inventories as of December 31, 2017, 2016 and 2015 is provided below by hierarchy of fair value
measurements:
Fair Value at Non-current assets and disposal groups classified as held for sale and inventories by levels (Millions of euros)
Notes
2017 2016 2015
Level 2 Level 3 Total Level 2 Level 3 Total Level 2 Level 3 Total
Non-current assets and disposal groups classified as held for sale
Housing 3,085 226 3,310 2,059 301 2,360 2,192 98 2,291
Offices, warehouses and other 661 98 759 326 105 431 353 53 406
Land 855 130 984 - 150 150 12 236 248
TOTAL 21 4,600 454 5,054 2,385 556 2,941 2,557 388 2,945
Inventories
Housing 21 - 21 903 - 903 1,452 - 1,452
Offices, warehouses and other 27 - 27 620 - 620 647 - 647
Land - 18 - - 1,591 1,591 - 2,056 2,056
TOTAL 20 48 18 65 1,523 1,591 3,114 2,099 2,056 4,155
Since the amount classified in Level 3 is not significant compared to the total consolidated assets and that
the inputs used in the valuation (DRM or DFC), are very diverse based on the type and geographic location
(being the typical ones used in the valuation of real estate assets of this type), they have not been disclosed.
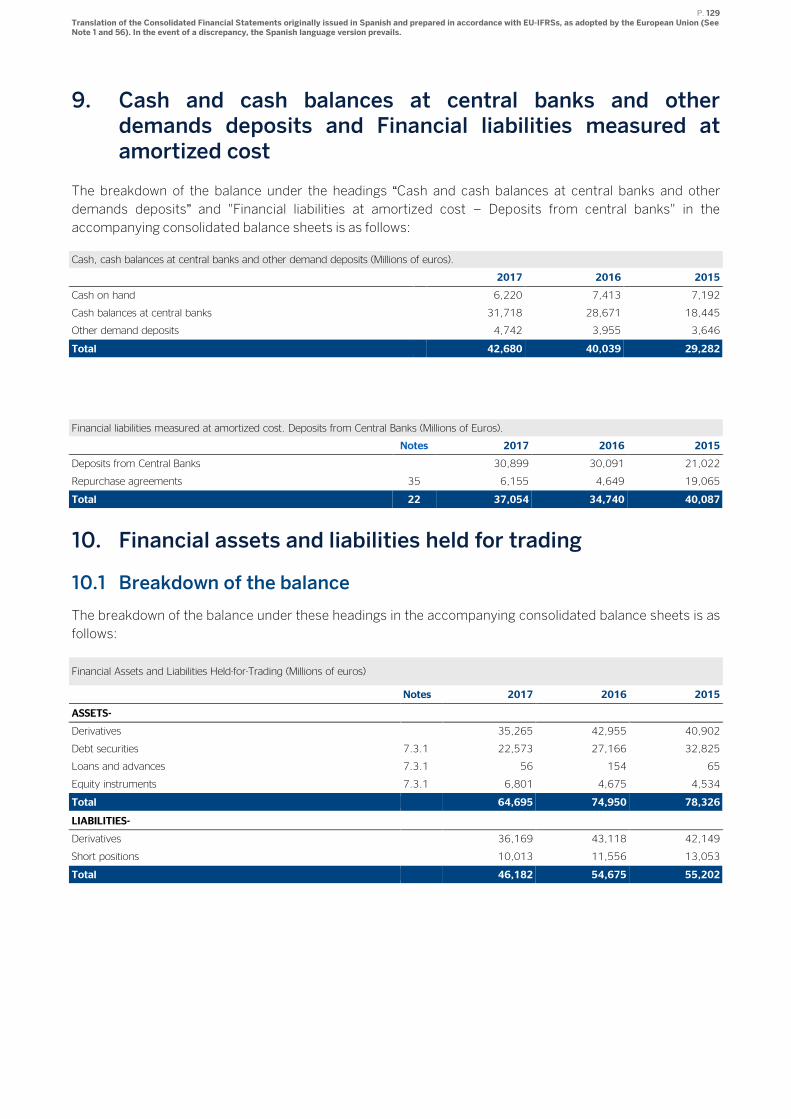
P. 129 Translation of the Consolidated Financial Statements originally issued in Spanish and prepared in accordance with EU-IFRSs, as adopted by the European Union (See Note 1 and 56). In the event of a discrepancy, the Spanish language version prevails.
9. Cash and cash balances at central banks and other demands deposits and Financial liabilities measured at amortized cost
The breakdown of the balance under the headings “Cash and cash balances at central banks and other
demands deposits” and "Financial liabilities at amortized cost – Deposits from central banks" in the
accompanying consolidated balance sheets is as follows:
Cash, cash balances at central banks and other demand deposits (Millions of euros).
2017 2016 2015
Cash on hand 6,220 7,413 7,192
Cash balances at central banks 31,718 28,671 18,445
Other demand deposits 4,742 3,955 3,646
Total 42,680 40,039 29,282
Financial liabilities measured at amortized cost. Deposits from Central Banks (Millions of Euros).
Notes 2017 2016 2015
Deposits from Central Banks 30,899 30,091 21,022
Repurchase agreements 35 6,155 4,649 19,065
Total 22 37,054 34,740 40,087
10. Financial assets and liabilities held for trading
10.1 Breakdown of the balance
The breakdown of the balance under these headings in the accompanying consolidated balance sheets is as
follows:
Financial Assets and Liabilities Held-for-Trading (Millions of euros)
Notes 2017 2016 2015
ASSETS-
Derivatives 35,265 42,955 40,902
Debt securities 7.3.1 22,573 27,166 32,825
Loans and advances 7.3.1 56 154 65
Equity instruments 7.3.1 6,801 4,675 4,534
Total 64,695 74,950 78,326
LIABILITIES-
Derivatives 36,169 43,118 42,149
Short positions 10,013 11,556 13,053
Total 46,182 54,675 55,202
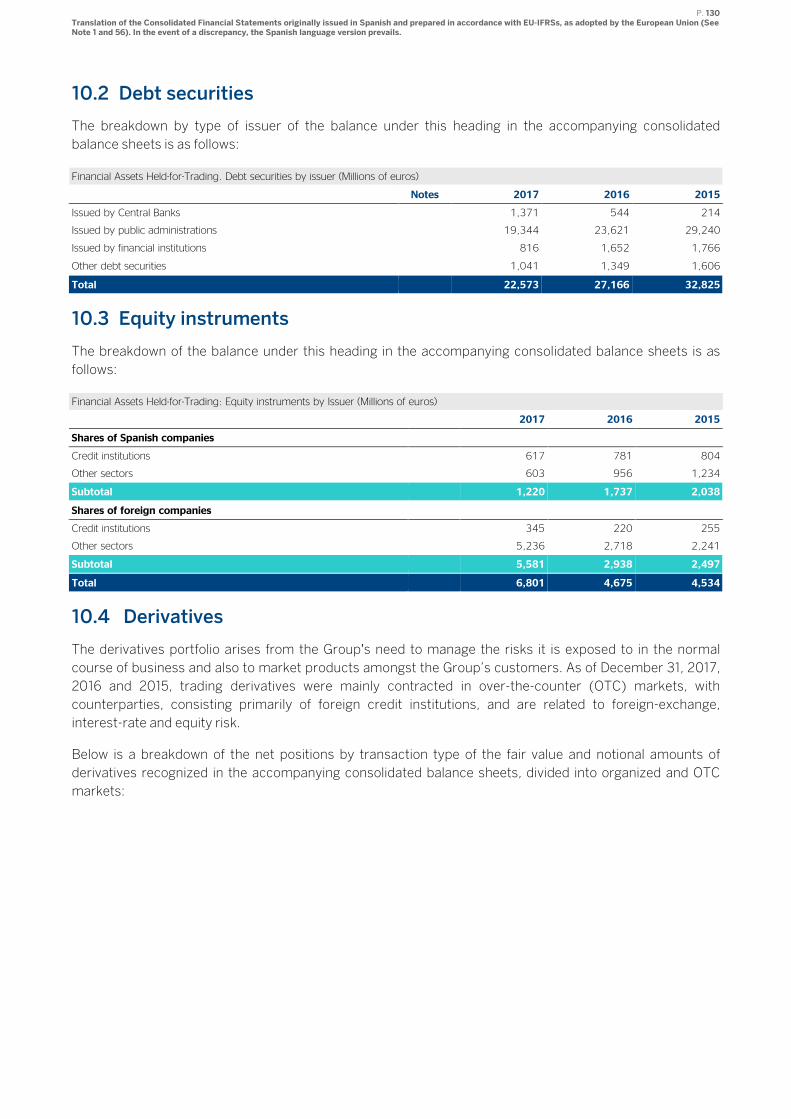
P. 130 Translation of the Consolidated Financial Statements originally issued in Spanish and prepared in accordance with EU-IFRSs, as adopted by the European Union (See Note 1 and 56). In the event of a discrepancy, the Spanish language version prevails.
10.2 Debt securities
The breakdown by type of issuer of the balance under this heading in the accompanying consolidated
balance sheets is as follows:
Financial Assets Held-for-Trading. Debt securities by issuer (Millions of euros)
Notes 2017 2016 2015
Issued by Central Banks 1,371 544 214
Issued by public administrations 19,344 23,621 29,240
Issued by financial institutions 816 1,652 1,766
Other debt securities 1,041 1,349 1,606
Total 22,573 27,166 32,825
10.3 Equity instruments
The breakdown of the balance under this heading in the accompanying consolidated balance sheets is as
follows:
Financial Assets Held-for-Trading: Equity instruments by Issuer (Millions of euros)
2017 2016 2015
Shares of Spanish companies
Credit institutions 617 781 804
Other sectors 603 956 1,234
Subtotal 1,220 1,737 2,038
Shares of foreign companies
Credit institutions 345 220 255
Other sectors 5,236 2,718 2,241
Subtotal 5,581 2,938 2,497
Total 6,801 4,675 4,534
10.4 Derivatives
The derivatives portfolio arises from the Group’s need to manage the risks it is exposed to in the normal
course of business and also to market products amongst the Group’s customers. As of December 31, 2017,
2016 and 2015, trading derivatives were mainly contracted in over-the-counter (OTC) markets, with
counterparties, consisting primarily of foreign credit institutions, and are related to foreign-exchange,
interest-rate and equity risk.
Below is a breakdown of the net positions by transaction type of the fair value and notional amounts of
derivatives recognized in the accompanying consolidated balance sheets, divided into organized and OTC
markets:

P. 131 Translation of the Consolidated Financial Statements originally issued in Spanish and prepared in accordance with EU-IFRSs, as adopted by the European Union (See Note 1 and 56). In the event of a discrepancy, the Spanish language version prevails.
Derivatives by type of risk / by product or by type of market - December 2017 (Millions of Euros)
Assets Liabilities Notional amount -
Total
Interest rate 22,606 22,546 2,152,490
OTC options 2,429 2,581 212,554
OTC other 20,177 19,965 1,916,920
Organized market options - - 600
Organized market other - - 22,416
Equity 1,778 2,336 95,573
OTC options 495 1,118 34,140
OTC other 83 90 8,158
Organized market options 1,200 1,129 48,644
Organized market other - - 4,631
Foreign exchange and gold 10,371 10,729 380,404
OTC options 245 258 24,447
OTC other 10,092 10,430 348,857
Organized market options - 3 104
Organized market other 34 37 6,997
Credit 489 517 30,181
Credit default swap 480 507 27,942
Credit spread option - - 200
Total return swap 9 9 2,039
Other - - -
Commodities 3 3 36
Other 18 38 561
DERIVATIVES 35,265 36,169 2,659,246
of which: OTC - credit institutions 21,016 22,804 898,209
of which: OTC - other financial corporations 8,695 9,207 1,548,919
of which: OTC - other 4,316 2,986 128,722

P. 132 Translation of the Consolidated Financial Statements originally issued in Spanish and prepared in accordance with EU-IFRSs, as adopted by the European Union (See Note 1 and 56). In the event of a discrepancy, the Spanish language version prevails.
Derivatives by type of risk / by product or by type of market - December 2016 (Millions of Euros)
Assets Liabilities Notional amount -
Total
Interest rate 25,770 25,322 1,556,150
OTC options 3,331 3,428 217,958
OTC other 22,339 21,792 1,296,183
Organized market options 1 - 1,311
Organized market other 100 102 40,698
Equity 2,032 2,252 90,655
OTC options 718 1,224 44,837
OTC other 109 91 5,312
Organized market options 1,205 937 36,795
Organized market other - - 3,712
Foreign exchange and gold 14,872 15,179 425,506
OTC options 417 539 27,583
OTC other 14,436 14,624 392,240
Organized market options 3 - 175
Organized market other 16 16 5,508
Credit 261 338 19,399
Credit default swap 246 230 15,788
Credit spread option - - 150
Total return swap 2 108 1,895
Other 14 - 1,565
Commodities 6 6 169
Other 13 22 1,065
DERIVATIVES 42,955 43,118 2,092,945
of which: OTC - credit institutions 26,438 28,005 806,096
of which: OTC - other financial corporations 8,786 9,362 1,023,174
of which: OTC - other 6,404 4,694 175,473
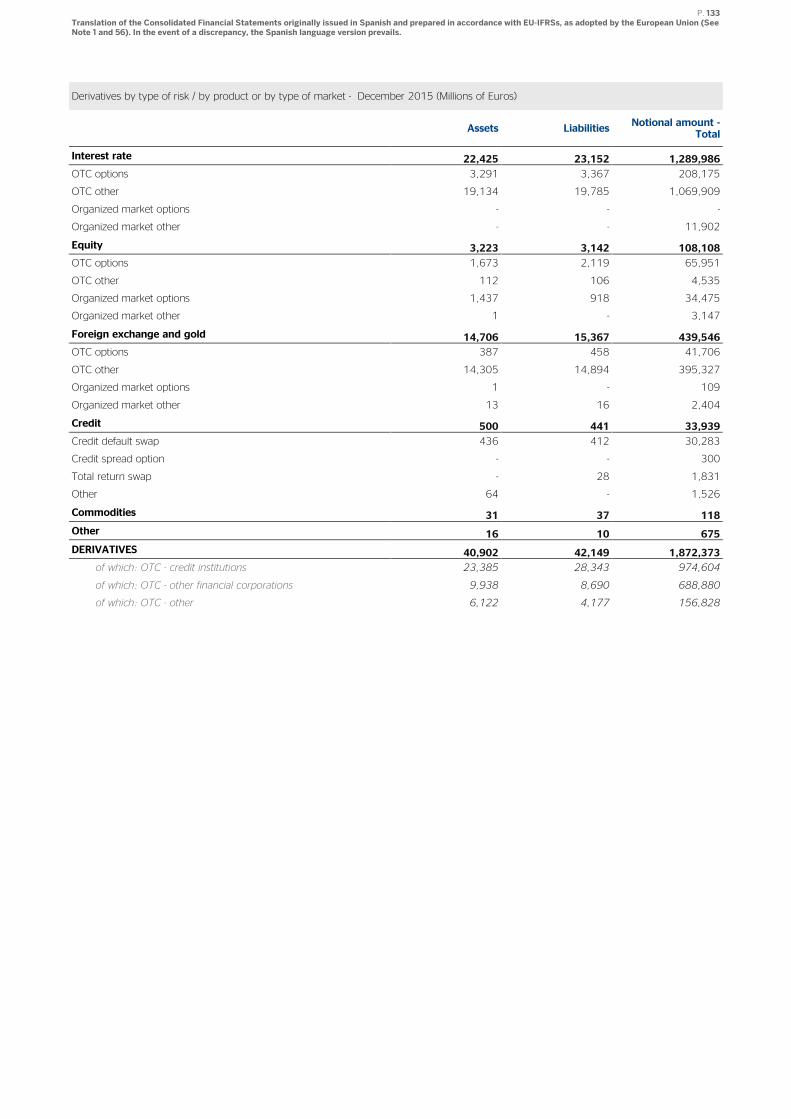
P. 133 Translation of the Consolidated Financial Statements originally issued in Spanish and prepared in accordance with EU-IFRSs, as adopted by the European Union (See Note 1 and 56). In the event of a discrepancy, the Spanish language version prevails.
Derivatives by type of risk / by product or by type of market - December 2015 (Millions of Euros)
Assets Liabilities Notional amount -
Total
Interest rate 22,425 23,152 1,289,986
OTC options 3,291 3,367 208,175
OTC other 19,134 19,785 1,069,909
Organized market options - - -
Organized market other - - 11,902
Equity 3,223 3,142 108,108
OTC options 1,673 2,119 65,951
OTC other 112 106 4,535
Organized market options 1,437 918 34,475
Organized market other 1 - 3,147
Foreign exchange and gold 14,706 15,367 439,546
OTC options 387 458 41,706
OTC other 14,305 14,894 395,327
Organized market options 1 - 109
Organized market other 13 16 2,404
Credit 500 441 33,939
Credit default swap 436 412 30,283
Credit spread option - - 300
Total return swap - 28 1,831
Other 64 - 1,526
Commodities 31 37 118
Other 16 10 675
DERIVATIVES 40,902 42,149 1,872,373
of which: OTC - credit institutions 23,385 28,343 974,604
of which: OTC - other financial corporations 9,938 8,690 688,880
of which: OTC - other 6,122 4,177 156,828
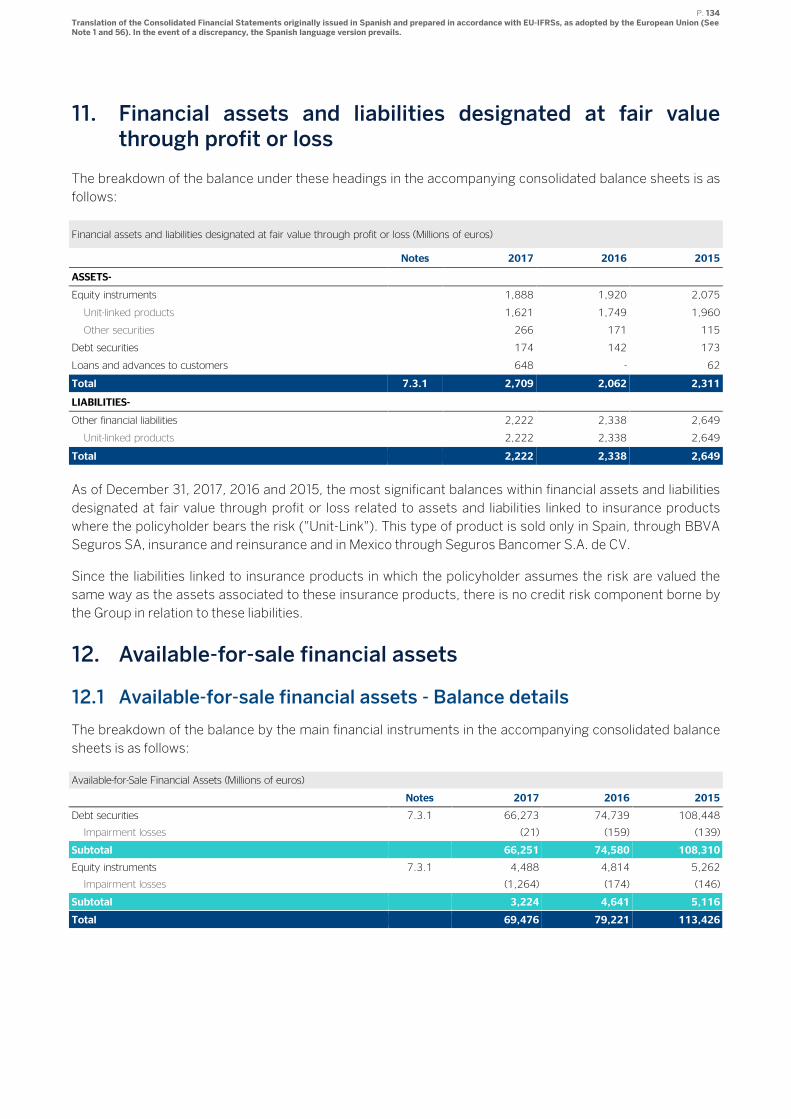
P. 134 Translation of the Consolidated Financial Statements originally issued in Spanish and prepared in accordance with EU-IFRSs, as adopted by the European Union (See Note 1 and 56). In the event of a discrepancy, the Spanish language version prevails.
11. Financial assets and liabilities designated at fair value through profit or loss
The breakdown of the balance under these headings in the accompanying consolidated balance sheets is as
follows:
Financial assets and liabilities designated at fair value through profit or loss (Millions of euros)
Notes 2017 2016 2015
ASSETS-
Equity instruments 1,888 1,920 2,075
Unit-linked products 1,621 1,749 1,960
Other securities 266 171 115
Debt securities 174 142 173
Loans and advances to customers 648 - 62
Total 7.3.1 2,709 2,062 2,311
LIABILITIES-
Other financial liabilities 2,222 2,338 2,649
Unit-linked products 2,222 2,338 2,649
Total 2,222 2,338 2,649
As of December 31, 2017, 2016 and 2015, the most significant balances within financial assets and liabilities
designated at fair value through profit or loss related to assets and liabilities linked to insurance products
where the policyholder bears the risk ("Unit-Link"). This type of product is sold only in Spain, through BBVA
Seguros SA, insurance and reinsurance and in Mexico through Seguros Bancomer S.A. de CV.
Since the liabilities linked to insurance products in which the policyholder assumes the risk are valued the
same way as the assets associated to these insurance products, there is no credit risk component borne by
the Group in relation to these liabilities.
12. Available-for-sale financial assets
12.1 Available-for-sale financial assets - Balance details
The breakdown of the balance by the main financial instruments in the accompanying consolidated balance
sheets is as follows:
Available-for-Sale Financial Assets (Millions of euros)
Notes 2017 2016 2015
Debt securities 7.3.1 66,273 74,739 108,448
Impairment losses (21) (159) (139)
Subtotal 66,251 74,580 108,310
Equity instruments 7.3.1 4,488 4,814 5,262
Impairment losses (1,264) (174) (146)
Subtotal 3,224 4,641 5,116
Total 69,476 79,221 113,426
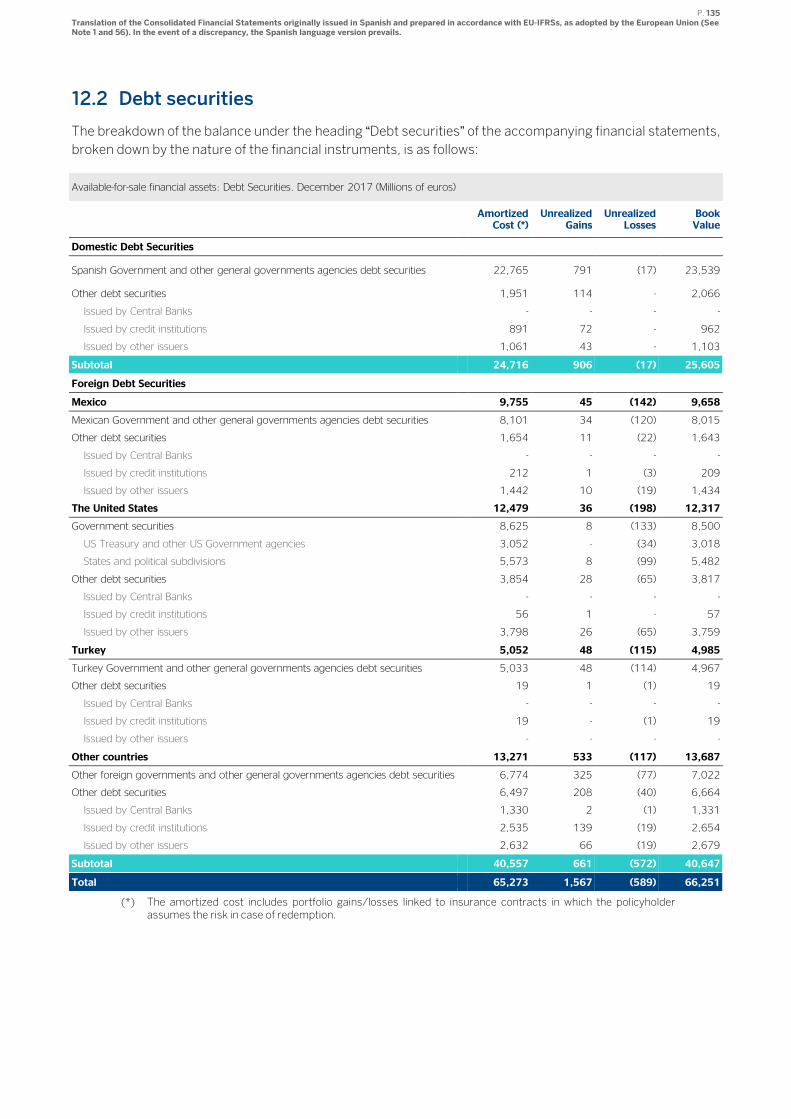
P. 135 Translation of the Consolidated Financial Statements originally issued in Spanish and prepared in accordance with EU-IFRSs, as adopted by the European Union (See Note 1 and 56). In the event of a discrepancy, the Spanish language version prevails.
12.2 Debt securities
The breakdown of the balance under the heading “Debt securities” of the accompanying financial statements,
broken down by the nature of the financial instruments, is as follows:
Available-for-sale financial assets: Debt Securities. December 2017 (Millions of euros)
Amortized Cost (*)
Unrealized Gains
Unrealized Losses
Book Value
Domestic Debt Securities
Spanish Government and other general governments agencies debt securities 22,765 791 (17) 23,539
Other debt securities 1,951 114 - 2,066
Issued by Central Banks - - - -
Issued by credit institutions 891 72 - 962
Issued by other issuers 1,061 43 - 1,103
Subtotal 24,716 906 (17) 25,605
Foreign Debt Securities
Mexico 9,755 45 (142) 9,658
Mexican Government and other general governments agencies debt securities 8,101 34 (120) 8,015
Other debt securities 1,654 11 (22) 1,643
Issued by Central Banks - - - -
Issued by credit institutions 212 1 (3) 209
Issued by other issuers 1,442 10 (19) 1,434
The United States 12,479 36 (198) 12,317
Government securities 8,625 8 (133) 8,500
US Treasury and other US Government agencies 3,052 - (34) 3,018
States and political subdivisions 5,573 8 (99) 5,482
Other debt securities 3,854 28 (65) 3,817
Issued by Central Banks - - - -
Issued by credit institutions 56 1 - 57
Issued by other issuers 3,798 26 (65) 3,759
Turkey 5,052 48 (115) 4,985
Turkey Government and other general governments agencies debt securities 5,033 48 (114) 4,967
Other debt securities 19 1 (1) 19
Issued by Central Banks - - - -
Issued by credit institutions 19 - (1) 19
Issued by other issuers - - - -
Other countries 13,271 533 (117) 13,687
Other foreign governments and other general governments agencies debt securities 6,774 325 (77) 7,022
Other debt securities 6,497 208 (40) 6,664
Issued by Central Banks 1,330 2 (1) 1,331
Issued by credit institutions 2,535 139 (19) 2,654
Issued by other issuers 2,632 66 (19) 2,679
Subtotal 40,557 661 (572) 40,647
Total 65,273 1,567 (589) 66,251
(*) The amortized cost includes portfolio gains/losses linked to insurance contracts in which the policyholder assumes the risk in case of redemption.
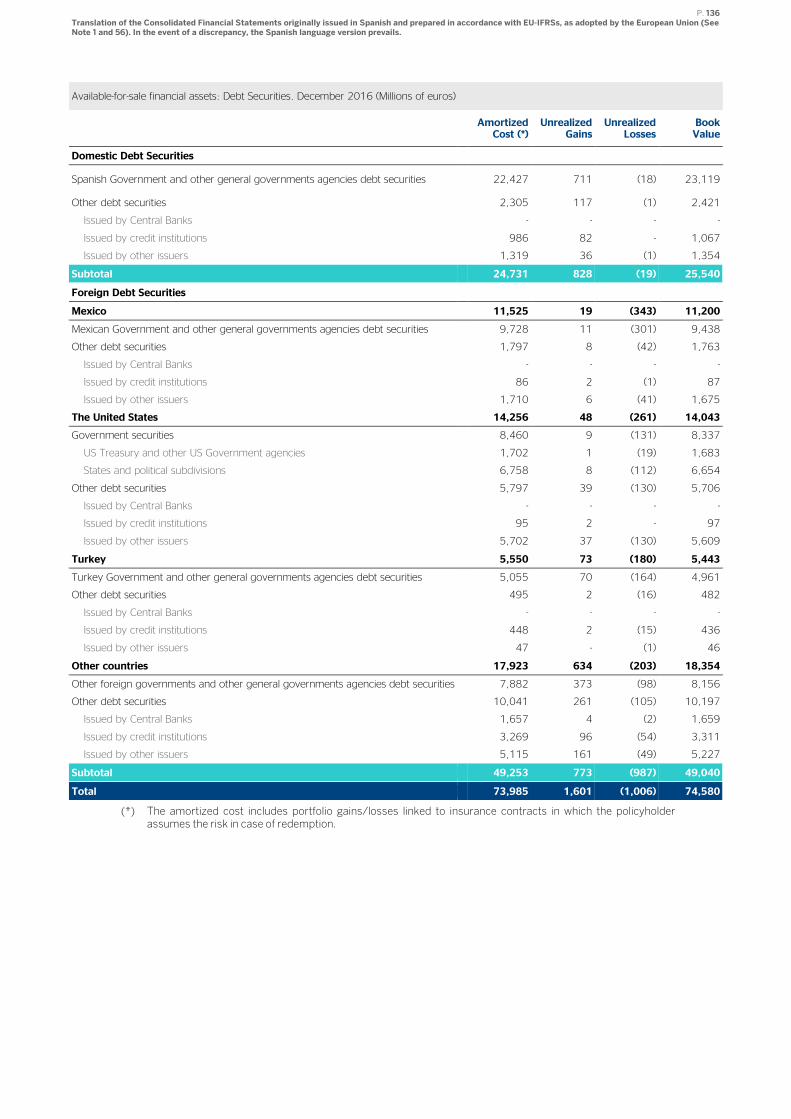
P. 136 Translation of the Consolidated Financial Statements originally issued in Spanish and prepared in accordance with EU-IFRSs, as adopted by the European Union (See Note 1 and 56). In the event of a discrepancy, the Spanish language version prevails.
Available-for-sale financial assets: Debt Securities. December 2016 (Millions of euros)
Amortized Cost (*)
Unrealized Gains
Unrealized Losses
Book Value
Domestic Debt Securities
Spanish Government and other general governments agencies debt securities 22,427 711 (18) 23,119
Other debt securities 2,305 117 (1) 2,421
Issued by Central Banks - - - -
Issued by credit institutions 986 82 - 1,067
Issued by other issuers 1,319 36 (1) 1,354
Subtotal 24,731 828 (19) 25,540
Foreign Debt Securities
Mexico 11,525 19 (343) 11,200
Mexican Government and other general governments agencies debt securities 9,728 11 (301) 9,438
Other debt securities 1,797 8 (42) 1,763
Issued by Central Banks - - - -
Issued by credit institutions 86 2 (1) 87
Issued by other issuers 1,710 6 (41) 1,675
The United States 14,256 48 (261) 14,043
Government securities 8,460 9 (131) 8,337
US Treasury and other US Government agencies 1,702 1 (19) 1,683
States and political subdivisions 6,758 8 (112) 6,654
Other debt securities 5,797 39 (130) 5,706
Issued by Central Banks - - - -
Issued by credit institutions 95 2 - 97
Issued by other issuers 5,702 37 (130) 5,609
Turkey 5,550 73 (180) 5,443
Turkey Government and other general governments agencies debt securities 5,055 70 (164) 4,961
Other debt securities 495 2 (16) 482
Issued by Central Banks - - - -
Issued by credit institutions 448 2 (15) 436
Issued by other issuers 47 - (1) 46
Other countries 17,923 634 (203) 18,354
Other foreign governments and other general governments agencies debt securities 7,882 373 (98) 8,156
Other debt securities 10,041 261 (105) 10,197
Issued by Central Banks 1,657 4 (2) 1,659
Issued by credit institutions 3,269 96 (54) 3,311
Issued by other issuers 5,115 161 (49) 5,227
Subtotal 49,253 773 (987) 49,040
Total 73,985 1,601 (1,006) 74,580
(*) The amortized cost includes portfolio gains/losses linked to insurance contracts in which the policyholder assumes the risk in case of redemption.
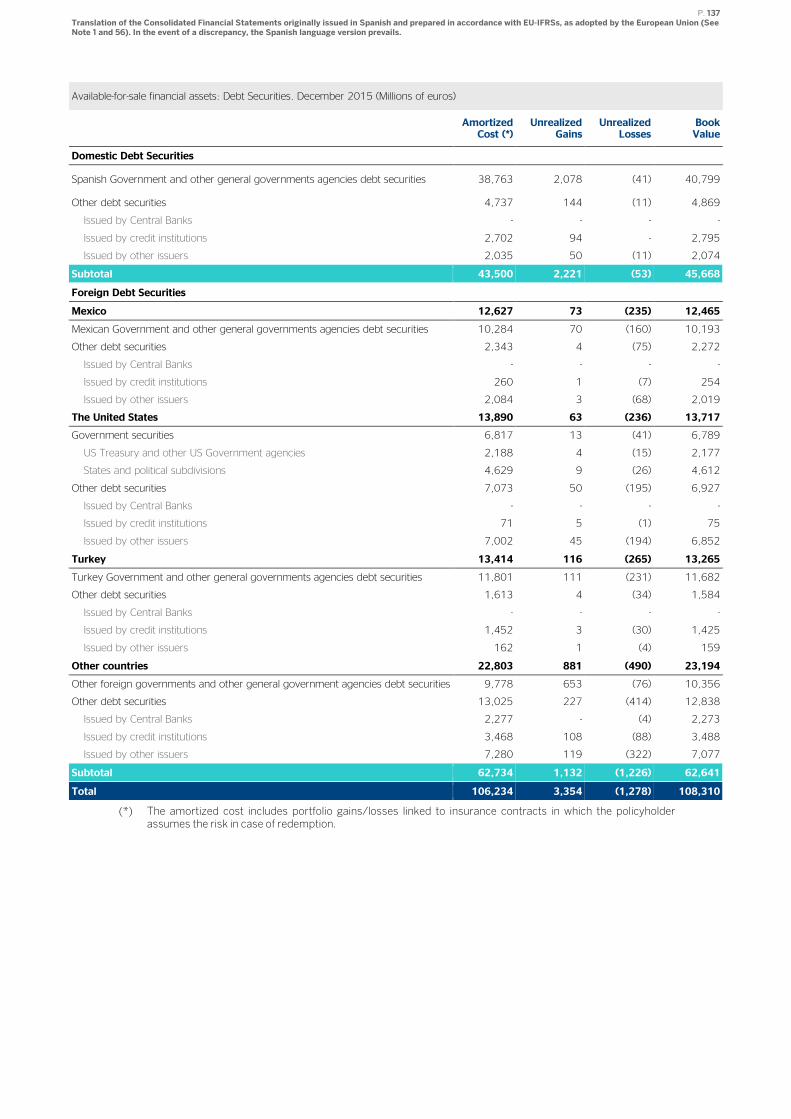
P. 137 Translation of the Consolidated Financial Statements originally issued in Spanish and prepared in accordance with EU-IFRSs, as adopted by the European Union (See Note 1 and 56). In the event of a discrepancy, the Spanish language version prevails.
Available-for-sale financial assets: Debt Securities. December 2015 (Millions of euros)
Amortized Cost (*)
Unrealized Gains
Unrealized Losses
Book Value
Domestic Debt Securities
Spanish Government and other general governments agencies debt securities 38,763 2,078 (41) 40,799
Other debt securities 4,737 144 (11) 4,869
Issued by Central Banks - - - -
Issued by credit institutions 2,702 94 - 2,795
Issued by other issuers 2,035 50 (11) 2,074
Subtotal 43,500 2,221 (53) 45,668
Foreign Debt Securities
Mexico 12,627 73 (235) 12,465
Mexican Government and other general governments agencies debt securities 10,284 70 (160) 10,193
Other debt securities 2,343 4 (75) 2,272
Issued by Central Banks - - - -
Issued by credit institutions 260 1 (7) 254
Issued by other issuers 2,084 3 (68) 2,019
The United States 13,890 63 (236) 13,717
Government securities 6,817 13 (41) 6,789
US Treasury and other US Government agencies 2,188 4 (15) 2,177
States and political subdivisions 4,629 9 (26) 4,612
Other debt securities 7,073 50 (195) 6,927
Issued by Central Banks - - - -
Issued by credit institutions 71 5 (1) 75
Issued by other issuers 7,002 45 (194) 6,852
Turkey 13,414 116 (265) 13,265
Turkey Government and other general governments agencies debt securities 11,801 111 (231) 11,682
Other debt securities 1,613 4 (34) 1,584
Issued by Central Banks - - - -
Issued by credit institutions 1,452 3 (30) 1,425
Issued by other issuers 162 1 (4) 159
Other countries 22,803 881 (490) 23,194
Other foreign governments and other general government agencies debt securities 9,778 653 (76) 10,356
Other debt securities 13,025 227 (414) 12,838
Issued by Central Banks 2,277 - (4) 2,273
Issued by credit institutions 3,468 108 (88) 3,488
Issued by other issuers 7,280 119 (322) 7,077
Subtotal 62,734 1,132 (1,226) 62,641
Total 106,234 3,354 (1,278) 108,310
(*) The amortized cost includes portfolio gains/losses linked to insurance contracts in which the policyholder assumes the risk in case of redemption.
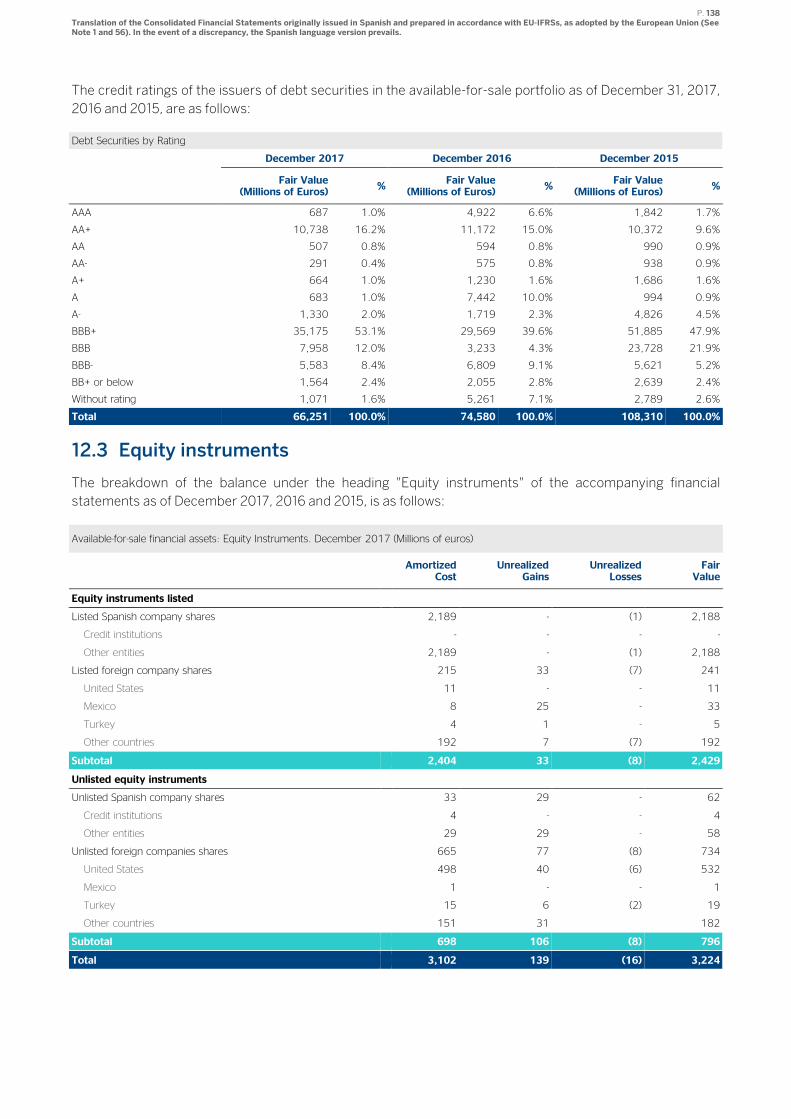
P. 138 Translation of the Consolidated Financial Statements originally issued in Spanish and prepared in accordance with EU-IFRSs, as adopted by the European Union (See Note 1 and 56). In the event of a discrepancy, the Spanish language version prevails.
The credit ratings of the issuers of debt securities in the available-for-sale portfolio as of December 31, 2017,
2016 and 2015, are as follows:
Debt Securities by Rating
December 2017 December 2016 December 2015
Fair Value
(Millions of Euros) %
Fair Value (Millions of Euros)
% Fair Value
(Millions of Euros) %
AAA 687 1.0% 4,922 6.6% 1,842 1.7%
AA+ 10,738 16.2% 11,172 15.0% 10,372 9.6%
AA 507 0.8% 594 0.8% 990 0.9%
AA- 291 0.4% 575 0.8% 938 0.9%
A+ 664 1.0% 1,230 1.6% 1,686 1.6%
A 683 1.0% 7,442 10.0% 994 0.9%
A- 1,330 2.0% 1,719 2.3% 4,826 4.5%
BBB+ 35,175 53.1% 29,569 39.6% 51,885 47.9%
BBB 7,958 12.0% 3,233 4.3% 23,728 21.9%
BBB- 5,583 8.4% 6,809 9.1% 5,621 5.2%
BB+ or below 1,564 2.4% 2,055 2.8% 2,639 2.4%
Without rating 1,071 1.6% 5,261 7.1% 2,789 2.6%
Total 66,251 100.0% 74,580 100.0% 108,310 100.0%
12.3 Equity instruments
The breakdown of the balance under the heading "Equity instruments" of the accompanying financial
statements as of December 2017, 2016 and 2015, is as follows:
Available-for-sale financial assets: Equity Instruments. December 2017 (Millions of euros)
Amortized
Cost Unrealized
Gains Unrealized
Losses Fair Value
Equity instruments listed
Listed Spanish company shares 2,189 - (1) 2,188
Credit institutions - - - -
Other entities 2,189 - (1) 2,188
Listed foreign company shares 215 33 (7) 241
United States 11 - - 11
Mexico 8 25 - 33
Turkey 4 1 - 5
Other countries 192 7 (7) 192
Subtotal 2,404 33 (8) 2,429
Unlisted equity instruments
Unlisted Spanish company shares 33 29 - 62
Credit institutions 4 - - 4
Other entities 29 29 - 58
Unlisted foreign companies shares 665 77 (8) 734
United States 498 40 (6) 532
Mexico 1 - - 1
Turkey 15 6 (2) 19
Other countries 151 31 182
Subtotal 698 106 (8) 796
Total 3,102 139 (16) 3,224
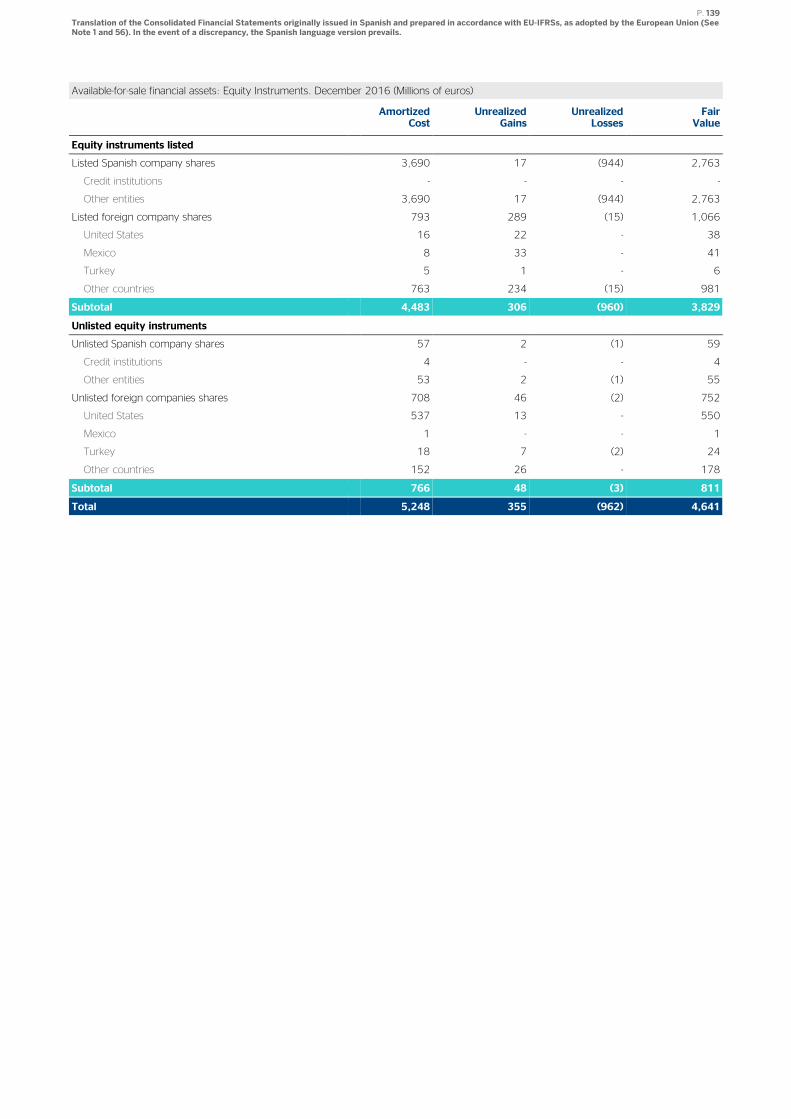
P. 139 Translation of the Consolidated Financial Statements originally issued in Spanish and prepared in accordance with EU-IFRSs, as adopted by the European Union (See Note 1 and 56). In the event of a discrepancy, the Spanish language version prevails.
Available-for-sale financial assets: Equity Instruments. December 2016 (Millions of euros)
Amortized
Cost Unrealized
Gains Unrealized
Losses Fair Value
Equity instruments listed
Listed Spanish company shares 3,690 17 (944) 2,763
Credit institutions - - - -
Other entities 3,690 17 (944) 2,763
Listed foreign company shares 793 289 (15) 1,066
United States 16 22 - 38
Mexico 8 33 - 41
Turkey 5 1 - 6
Other countries 763 234 (15) 981
Subtotal 4,483 306 (960) 3,829
Unlisted equity instruments
Unlisted Spanish company shares 57 2 (1) 59
Credit institutions 4 - - 4
Other entities 53 2 (1) 55
Unlisted foreign companies shares 708 46 (2) 752
United States 537 13 - 550
Mexico 1 - - 1
Turkey 18 7 (2) 24
Other countries 152 26 - 178
Subtotal 766 48 (3) 811
Total 5,248 355 (962) 4,641
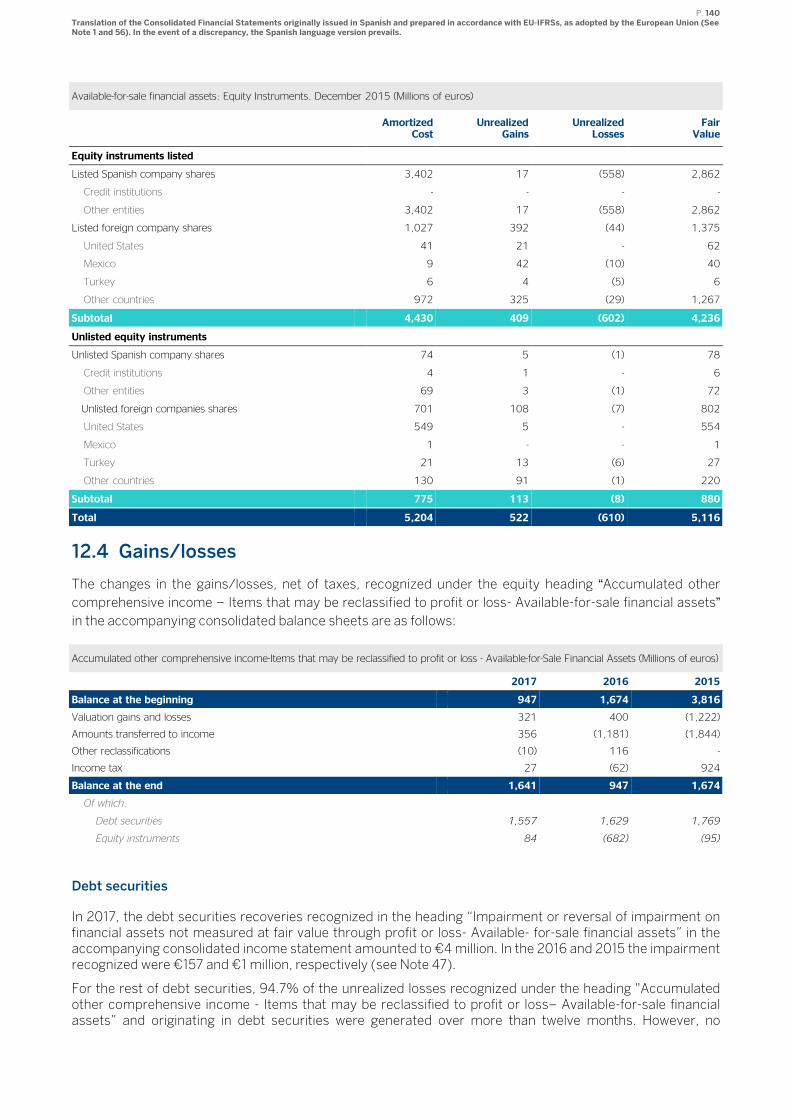
P. 140 Translation of the Consolidated Financial Statements originally issued in Spanish and prepared in accordance with EU-IFRSs, as adopted by the European Union (See Note 1 and 56). In the event of a discrepancy, the Spanish language version prevails.
Available-for-sale financial assets: Equity Instruments. December 2015 (Millions of euros)
Amortized
Cost Unrealized
Gains Unrealized
Losses Fair Value
Equity instruments listed
Listed Spanish company shares 3,402 17 (558) 2,862
Credit institutions - - - -
Other entities 3,402 17 (558) 2,862
Listed foreign company shares 1,027 392 (44) 1,375
United States 41 21 - 62
Mexico 9 42 (10) 40
Turkey 6 4 (5) 6
Other countries 972 325 (29) 1,267
Subtotal 4,430 409 (602) 4,236
Unlisted equity instruments
Unlisted Spanish company shares 74 5 (1) 78
Credit institutions 4 1 - 6
Other entities 69 3 (1) 72
Unlisted foreign companies shares 701 108 (7) 802
United States 549 5 - 554
Mexico 1 - - 1
Turkey 21 13 (6) 27
Other countries 130 91 (1) 220
Subtotal 775 113 (8) 880
Total 5,204 522 (610) 5,116
12.4 Gains/losses
The changes in the gains/losses, net of taxes, recognized under the equity heading “Accumulated other
comprehensive income – Items that may be reclassified to profit or loss- Available-for-sale financial assets”
in the accompanying consolidated balance sheets are as follows:
Accumulated other comprehensive income-Items that may be reclassified to profit or loss - Available-for-Sale Financial Assets (Millions of euros)
2017 2016 2015
Balance at the beginning 947 1,674 3,816
Valuation gains and losses 321 400 (1,222)
Amounts transferred to income 356 (1,181) (1,844)
Other reclassifications (10) 116 -
Income tax 27 (62) 924
Balance at the end 1,641 947 1,674
Of which:
Debt securities 1,557 1,629 1,769
Equity instruments 84 (682) (95)
Debt securities
In 2017, the debt securities recoveries recognized in the heading “Impairment or reversal of impairment on financial assets not measured at fair value through profit or loss- Available- for-sale financial assets” in the accompanying consolidated income statement amounted to €4 million. In the 2016 and 2015 the impairment recognized were €157 and €1 million, respectively (see Note 47).
For the rest of debt securities, 94.7% of the unrealized losses recognized under the heading "Accumulated other comprehensive income - Items that may be reclassified to profit or loss– Available-for-sale financial assets” and originating in debt securities were generated over more than twelve months. However, no
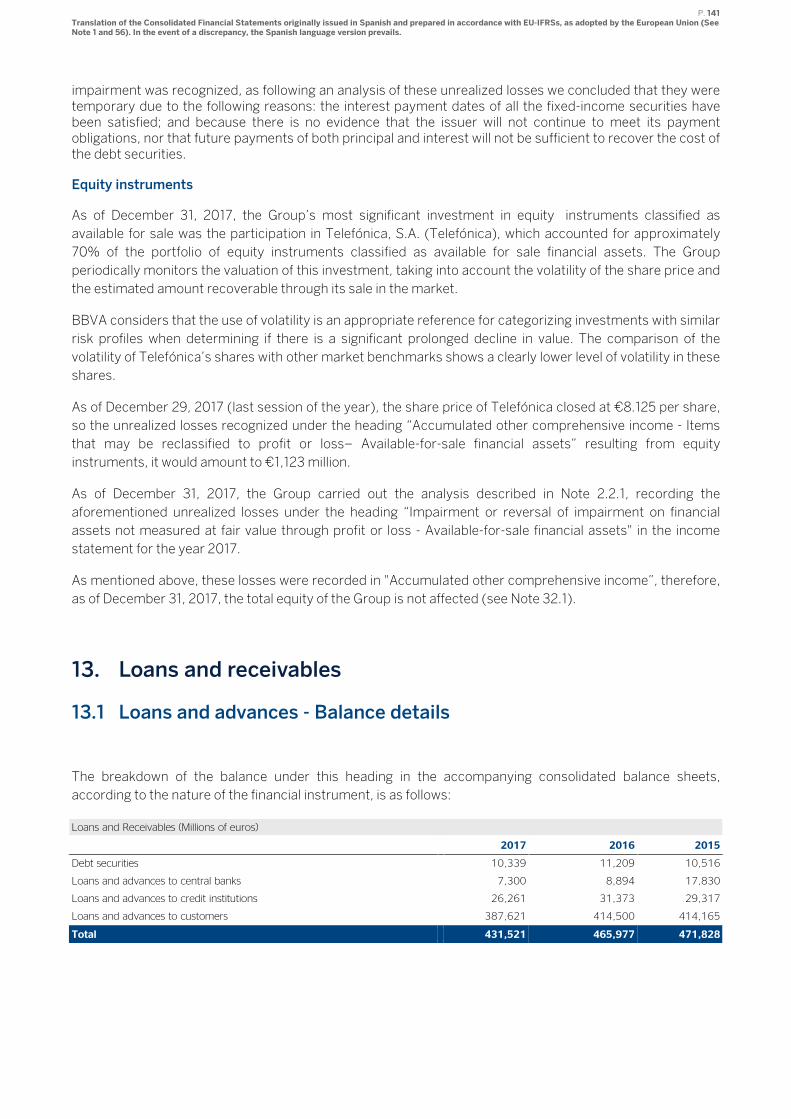
P. 141 Translation of the Consolidated Financial Statements originally issued in Spanish and prepared in accordance with EU-IFRSs, as adopted by the European Union (See Note 1 and 56). In the event of a discrepancy, the Spanish language version prevails.
impairment was recognized, as following an analysis of these unrealized losses we concluded that they were temporary due to the following reasons: the interest payment dates of all the fixed-income securities have been satisfied; and because there is no evidence that the issuer will not continue to meet its payment obligations, nor that future payments of both principal and interest will not be sufficient to recover the cost of the debt securities.
Equity instruments
As of December 31, 2017, the Group’s most significant investment in equity instruments classified as
available for sale was the participation in Telefónica, S.A. (Telefónica), which accounted for approximately
70% of the portfolio of equity instruments classified as available for sale financial assets. The Group
periodically monitors the valuation of this investment, taking into account the volatility of the share price and
the estimated amount recoverable through its sale in the market.
BBVA considers that the use of volatility is an appropriate reference for categorizing investments with similar
risk profiles when determining if there is a significant prolonged decline in value. The comparison of the
volatility of Telefónica’s shares with other market benchmarks shows a clearly lower level of volatility in these
shares.
As of December 29, 2017 (last session of the year), the share price of Telefónica closed at €8.125 per share,
so the unrealized losses recognized under the heading “Accumulated other comprehensive income - Items
that may be reclassified to profit or loss– Available-for-sale financial assets” resulting from equity
instruments, it would amount to €1,123 million.
As of December 31, 2017, the Group carried out the analysis described in Note 2.2.1, recording the
aforementioned unrealized losses under the heading “Impairment or reversal of impairment on financial
assets not measured at fair value through profit or loss - Available-for-sale financial assets" in the income
statement for the year 2017.
As mentioned above, these losses were recorded in "Accumulated other comprehensive income”, therefore,
as of December 31, 2017, the total equity of the Group is not affected (see Note 32.1).
13. Loans and receivables
13.1 Loans and advances - Balance details
The breakdown of the balance under this heading in the accompanying consolidated balance sheets,
according to the nature of the financial instrument, is as follows:
Loans and Receivables (Millions of euros)
2017 2016 2015
Debt securities 10,339 11,209 10,516
Loans and advances to central banks 7,300 8,894 17,830
Loans and advances to credit institutions 26,261 31,373 29,317
Loans and advances to customers 387,621 414,500 414,165
Total 431,521 465,977 471,828
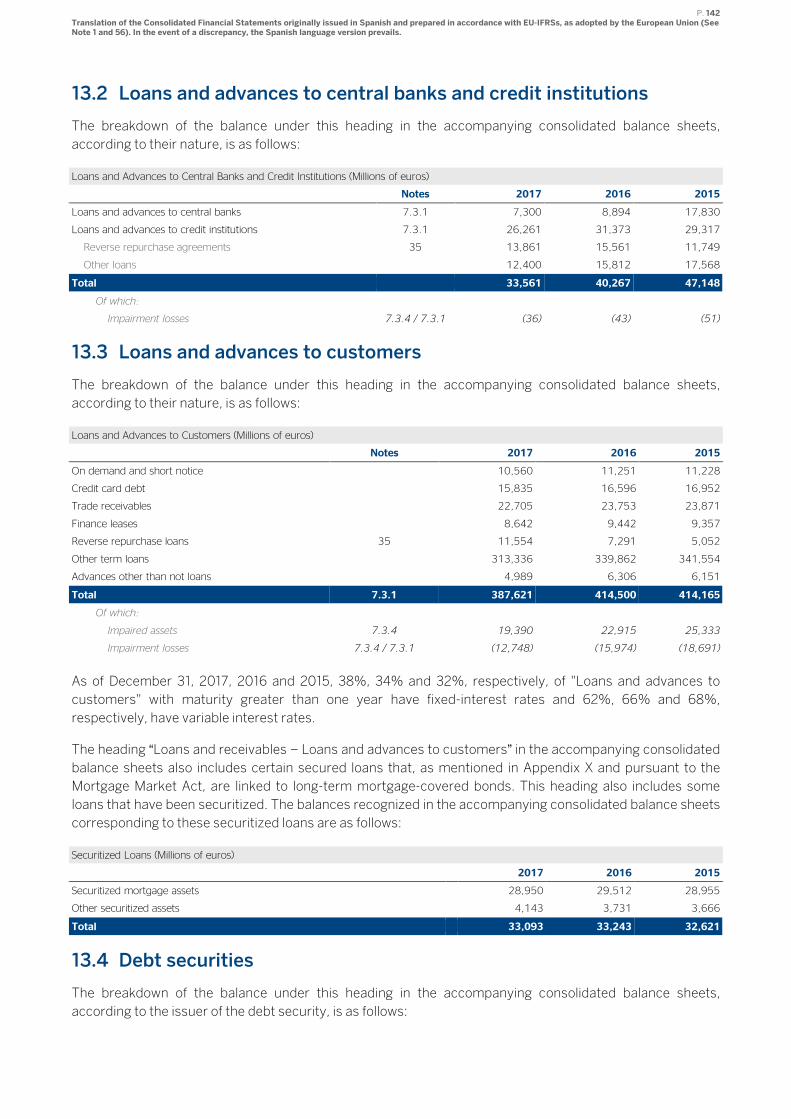
P. 142 Translation of the Consolidated Financial Statements originally issued in Spanish and prepared in accordance with EU-IFRSs, as adopted by the European Union (See Note 1 and 56). In the event of a discrepancy, the Spanish language version prevails.
13.2 Loans and advances to central banks and credit institutions
The breakdown of the balance under this heading in the accompanying consolidated balance sheets,
according to their nature, is as follows:
Loans and Advances to Central Banks and Credit Institutions (Millions of euros)
Notes 2017 2016 2015
Loans and advances to central banks 7.3.1 7,300 8,894 17,830
Loans and advances to credit institutions 7.3.1 26,261 31,373 29,317
Reverse repurchase agreements 35 13,861 15,561 11,749
Other loans 12,400 15,812 17,568
Total 33,561 40,267 47,148
Of which:
Impairment losses 7.3.4 / 7.3.1 (36) (43) (51)
13.3 Loans and advances to customers
The breakdown of the balance under this heading in the accompanying consolidated balance sheets,
according to their nature, is as follows:
Loans and Advances to Customers (Millions of euros)
Notes 2017 2016 2015
On demand and short notice 10,560 11,251 11,228
Credit card debt 15,835 16,596 16,952
Trade receivables 22,705 23,753 23,871
Finance leases 8,642 9,442 9,357
Reverse repurchase loans 35 11,554 7,291 5,052
Other term loans 313,336 339,862 341,554
Advances other than not loans 4,989 6,306 6,151
Total 7.3.1 387,621 414,500 414,165
Of which:
Impaired assets 7.3.4 19,390 22,915 25,333
Impairment losses 7.3.4 / 7.3.1 (12,748) (15,974) (18,691)
As of December 31, 2017, 2016 and 2015, 38%, 34% and 32%, respectively, of "Loans and advances to
customers" with maturity greater than one year have fixed-interest rates and 62%, 66% and 68%,
respectively, have variable interest rates.
The heading “Loans and receivables – Loans and advances to customers” in the accompanying consolidated
balance sheets also includes certain secured loans that, as mentioned in Appendix X and pursuant to the
Mortgage Market Act, are linked to long-term mortgage-covered bonds. This heading also includes some
loans that have been securitized. The balances recognized in the accompanying consolidated balance sheets
corresponding to these securitized loans are as follows:
Securitized Loans (Millions of euros)
2017 2016 2015
Securitized mortgage assets 28,950 29,512 28,955
Other securitized assets 4,143 3,731 3,666
Total 33,093 33,243 32,621
13.4 Debt securities
The breakdown of the balance under this heading in the accompanying consolidated balance sheets,
according to the issuer of the debt security, is as follows:
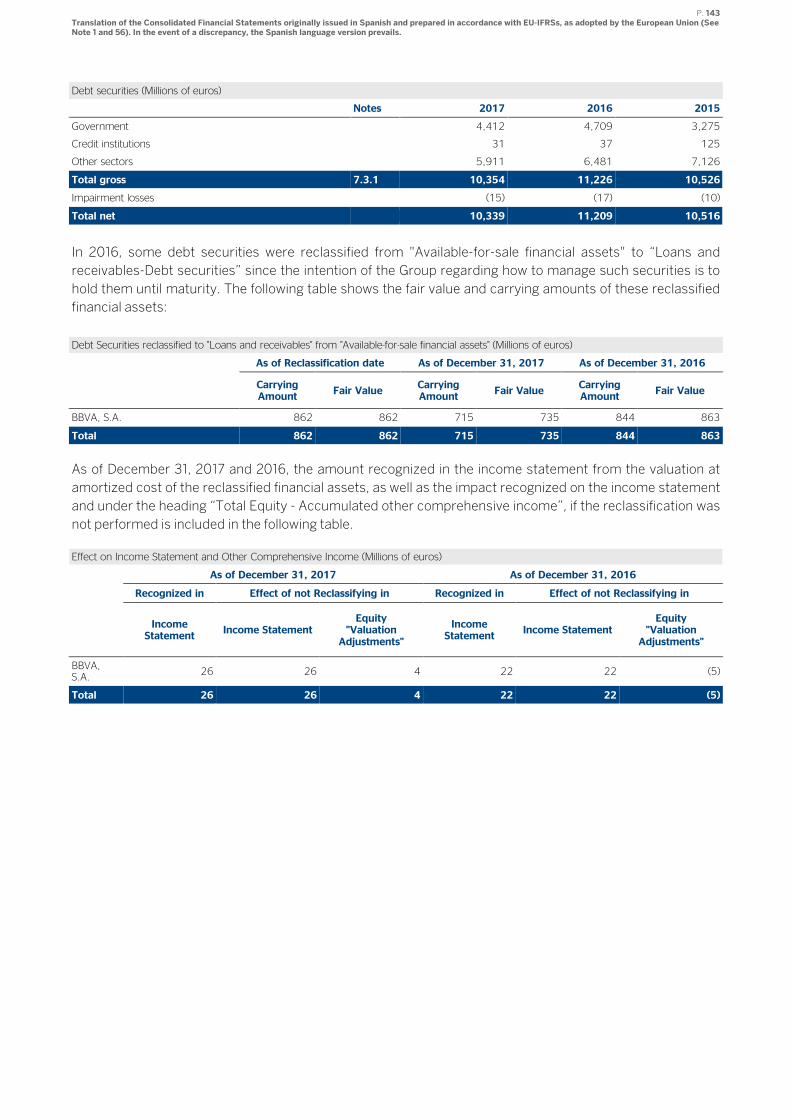
P. 143 Translation of the Consolidated Financial Statements originally issued in Spanish and prepared in accordance with EU-IFRSs, as adopted by the European Union (See Note 1 and 56). In the event of a discrepancy, the Spanish language version prevails.
Debt securities (Millions of euros)
Notes 2017 2016 2015
Government 4,412 4,709 3,275
Credit institutions 31 37 125
Other sectors 5,911 6,481 7,126
Total gross 7.3.1 10,354 11,226 10,526
Impairment losses (15) (17) (10)
Total net 10,339 11,209 10,516
In 2016, some debt securities were reclassified from "Available-for-sale financial assets" to “Loans and
receivables-Debt securities” since the intention of the Group regarding how to manage such securities is to
hold them until maturity. The following table shows the fair value and carrying amounts of these reclassified
financial assets:
Debt Securities reclassified to "Loans and receivables" from "Available-for-sale financial assets" (Millions of euros)
As of Reclassification date As of December 31, 2017 As of December 31, 2016
Carrying Amount
Fair Value Carrying Amount
Fair Value Carrying Amount
Fair Value
BBVA, S.A. 862 862 715 735 844 863
Total 862 862 715 735 844 863
As of December 31, 2017 and 2016, the amount recognized in the income statement from the valuation at
amortized cost of the reclassified financial assets, as well as the impact recognized on the income statement
and under the heading “Total Equity - Accumulated other comprehensive income”, if the reclassification was
not performed is included in the following table.
Effect on Income Statement and Other Comprehensive Income (Millions of euros)
As of December 31, 2017 As of December 31, 2016
Recognized in Effect of not Reclassifying in Recognized in Effect of not Reclassifying in
Income Statement
Income Statement Equity
"Valuation Adjustments"
Income Statement
Income Statement Equity
"Valuation Adjustments"
BBVA, S.A.
26 26 4 22 22 (5)
Total 26 26 4 22 22 (5)
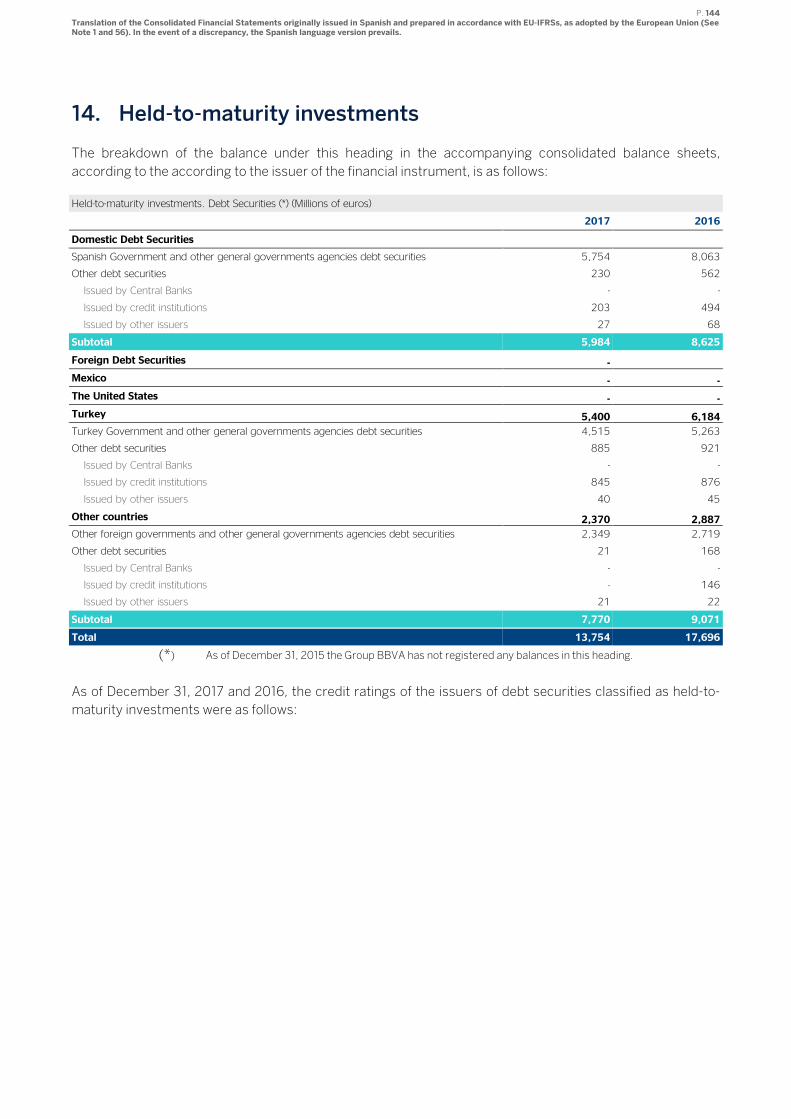
P. 144 Translation of the Consolidated Financial Statements originally issued in Spanish and prepared in accordance with EU-IFRSs, as adopted by the European Union (See Note 1 and 56). In the event of a discrepancy, the Spanish language version prevails.
14. Held-to-maturity investments
The breakdown of the balance under this heading in the accompanying consolidated balance sheets,
according to the according to the issuer of the financial instrument, is as follows:
Held-to-maturity investments. Debt Securities (*) (Millions of euros)
2017 2016
Domestic Debt Securities
Spanish Government and other general governments agencies debt securities 5,754 8,063
Other debt securities 230 562
Issued by Central Banks - -
Issued by credit institutions 203 494
Issued by other issuers 27 68
Subtotal 5,984 8,625
Foreign Debt Securities -
Mexico - -
The United States - -
Turkey 5,400 6,184
Turkey Government and other general governments agencies debt securities 4,515 5,263
Other debt securities 885 921
Issued by Central Banks - -
Issued by credit institutions 845 876
Issued by other issuers 40 45
Other countries 2,370 2,887
Other foreign governments and other general governments agencies debt securities 2,349 2,719
Other debt securities 21 168
Issued by Central Banks - -
Issued by credit institutions - 146
Issued by other issuers 21 22
Subtotal 7,770 9,071
Total 13,754 17,696
(*) As of December 31, 2015 the Group BBVA has not registered any balances in this heading.
As of December 31, 2017 and 2016, the credit ratings of the issuers of debt securities classified as held-to-
maturity investments were as follows:
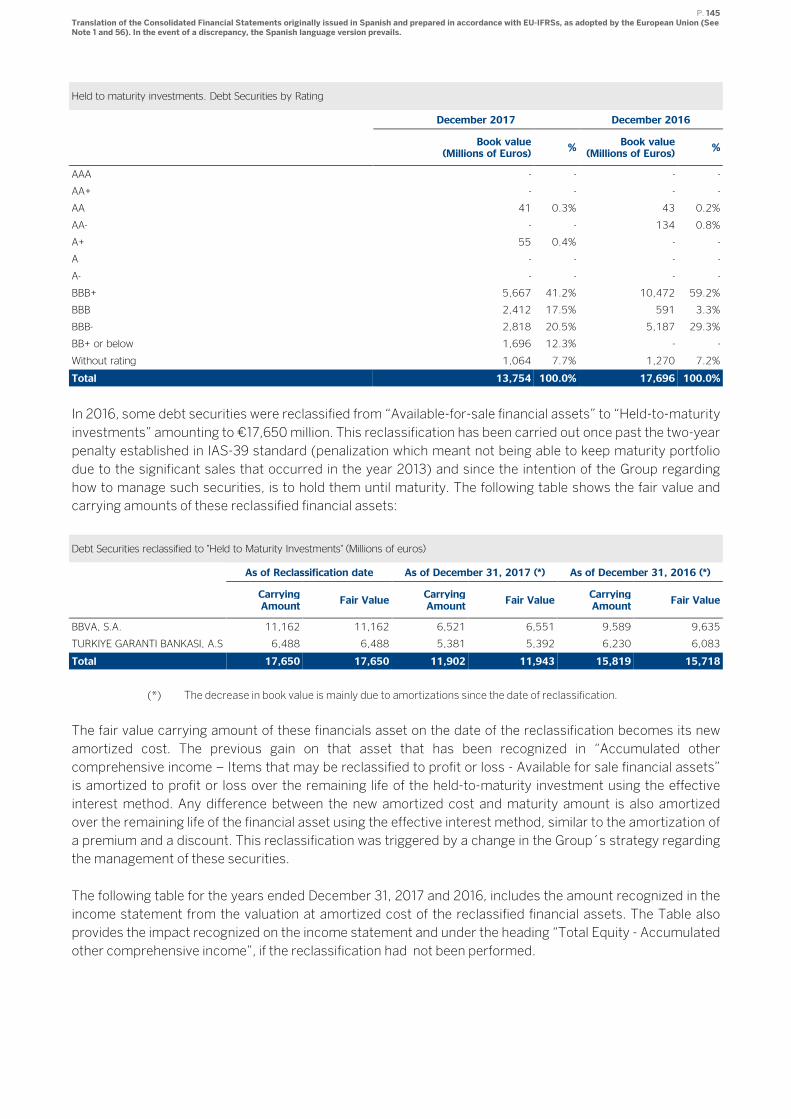
P. 145 Translation of the Consolidated Financial Statements originally issued in Spanish and prepared in accordance with EU-IFRSs, as adopted by the European Union (See Note 1 and 56). In the event of a discrepancy, the Spanish language version prevails.
Held to maturity investments. Debt Securities by Rating
December 2017 December 2016
Book value
(Millions of Euros) %
Book value (Millions of Euros)
%
AAA - - - -
AA+ - - - -
AA 41 0.3% 43 0.2%
AA- - - 134 0.8%
A+ 55 0.4% - -
A - - - -
A- - - - -
BBB+ 5,667 41.2% 10,472 59.2%
BBB 2,412 17.5% 591 3.3%
BBB- 2,818 20.5% 5,187 29.3%
BB+ or below 1,696 12.3% - -
Without rating 1,064 7.7% 1,270 7.2%
Total 13,754 100.0% 17,696 100.0%
In 2016, some debt securities were reclassified from “Available-for-sale financial assets” to “Held-to-maturity
investments” amounting to €17,650 million. This reclassification has been carried out once past the two-year
penalty established in IAS-39 standard (penalization which meant not being able to keep maturity portfolio
due to the significant sales that occurred in the year 2013) and since the intention of the Group regarding
how to manage such securities, is to hold them until maturity. The following table shows the fair value and
carrying amounts of these reclassified financial assets:
Debt Securities reclassified to "Held to Maturity Investments" (Millions of euros)
As of Reclassification date As of December 31, 2017 (*) As of December 31, 2016 (*)
Carrying Amount
Fair Value Carrying Amount
Fair Value Carrying Amount
Fair Value
BBVA, S.A. 11,162 11,162 6,521 6,551 9,589 9,635
TURKIYE GARANTI BANKASI, A.S 6,488 6,488 5,381 5,392 6,230 6,083
Total 17,650 17,650 11,902 11,943 15,819 15,718
(*) The decrease in book value is mainly due to amortizations since the date of reclassification.
The fair value carrying amount of these financials asset on the date of the reclassification becomes its new
amortized cost. The previous gain on that asset that has been recognized in “Accumulated other
comprehensive income – Items that may be reclassified to profit or loss - Available for sale financial assets”
is amortized to profit or loss over the remaining life of the held-to-maturity investment using the effective
interest method. Any difference between the new amortized cost and maturity amount is also amortized
over the remaining life of the financial asset using the effective interest method, similar to the amortization of
a premium and a discount. This reclassification was triggered by a change in the Group´s strategy regarding
the management of these securities.
The following table for the years ended December 31, 2017 and 2016, includes the amount recognized in the
income statement from the valuation at amortized cost of the reclassified financial assets. The Table also
provides the impact recognized on the income statement and under the heading “Total Equity - Accumulated
other comprehensive income”, if the reclassification had not been performed.
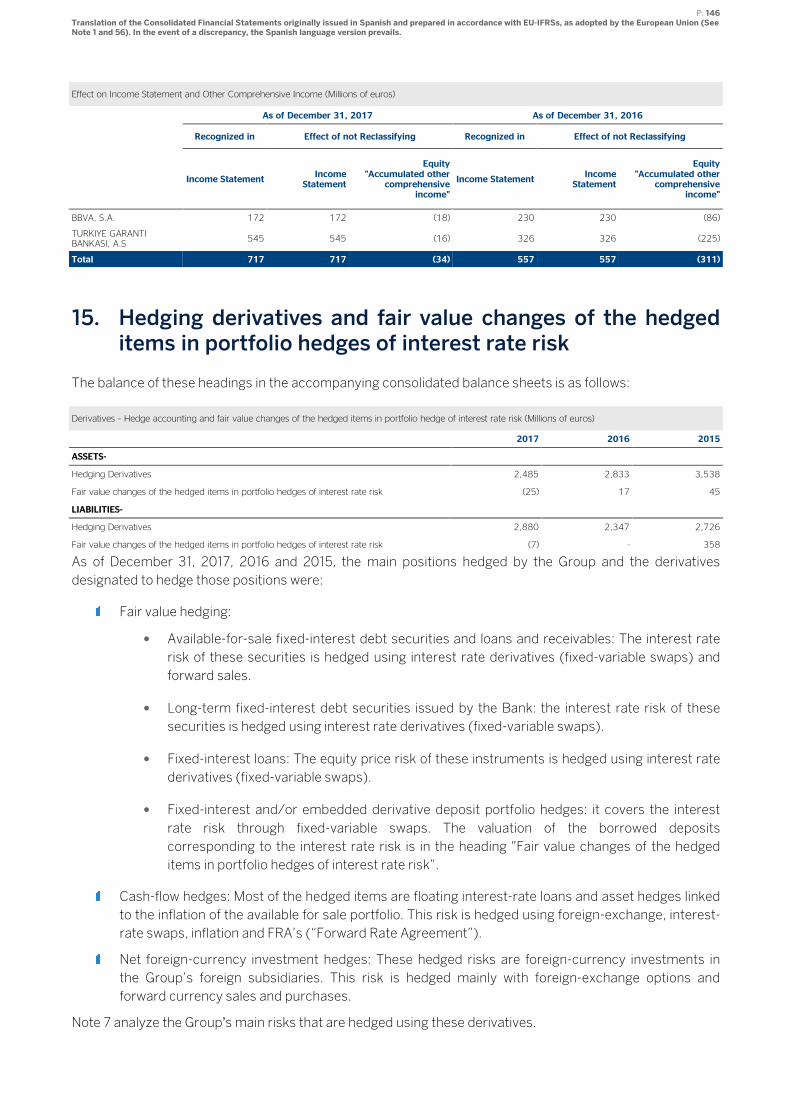
P. 146 Translation of the Consolidated Financial Statements originally issued in Spanish and prepared in accordance with EU-IFRSs, as adopted by the European Union (See Note 1 and 56). In the event of a discrepancy, the Spanish language version prevails.
Effect on Income Statement and Other Comprehensive Income (Millions of euros)
As of December 31, 2017 As of December 31, 2016
Recognized in Effect of not Reclassifying Recognized in Effect of not Reclassifying
Income Statement Income
Statement
Equity "Accumulated other
comprehensive income"
Income Statement Income
Statement
Equity "Accumulated other
comprehensive income"
BBVA, S.A. 172 172 (18) 230 230 (86)
TURKIYE GARANTI BANKASI, A.S
545 545 (16) 326 326 (225)
Total 717 717 (34) 557 557 (311)
15. Hedging derivatives and fair value changes of the hedged items in portfolio hedges of interest rate risk
The balance of these headings in the accompanying consolidated balance sheets is as follows:
Derivatives – Hedge accounting and fair value changes of the hedged items in portfolio hedge of interest rate risk (Millions of euros)
2017 2016 2015
ASSETS-
Hedging Derivatives 2,485 2,833 3,538
Fair value changes of the hedged items in portfolio hedges of interest rate risk (25) 17 45
LIABILITIES-
Hedging Derivatives 2,880 2,347 2,726
Fair value changes of the hedged items in portfolio hedges of interest rate risk (7) - 358
As of December 31, 2017, 2016 and 2015, the main positions hedged by the Group and the derivatives
designated to hedge those positions were:
Fair value hedging:
• Available-for-sale fixed-interest debt securities and loans and receivables: The interest rate
risk of these securities is hedged using interest rate derivatives (fixed-variable swaps) and
forward sales.
• Long-term fixed-interest debt securities issued by the Bank: the interest rate risk of these
securities is hedged using interest rate derivatives (fixed-variable swaps).
• Fixed-interest loans: The equity price risk of these instruments is hedged using interest rate
derivatives (fixed-variable swaps).
• Fixed-interest and/or embedded derivative deposit portfolio hedges: it covers the interest
rate risk through fixed-variable swaps. The valuation of the borrowed deposits
corresponding to the interest rate risk is in the heading "Fair value changes of the hedged
items in portfolio hedges of interest rate risk”.
Cash-flow hedges: Most of the hedged items are floating interest-rate loans and asset hedges linked
to the inflation of the available for sale portfolio. This risk is hedged using foreign-exchange, interest-
rate swaps, inflation and FRA’s (“Forward Rate Agreement”).
Net foreign-currency investment hedges: These hedged risks are foreign-currency investments in
the Group’s foreign subsidiaries. This risk is hedged mainly with foreign-exchange options and
forward currency sales and purchases.
Note 7 analyze the Group’s main risks that are hedged using these derivatives.
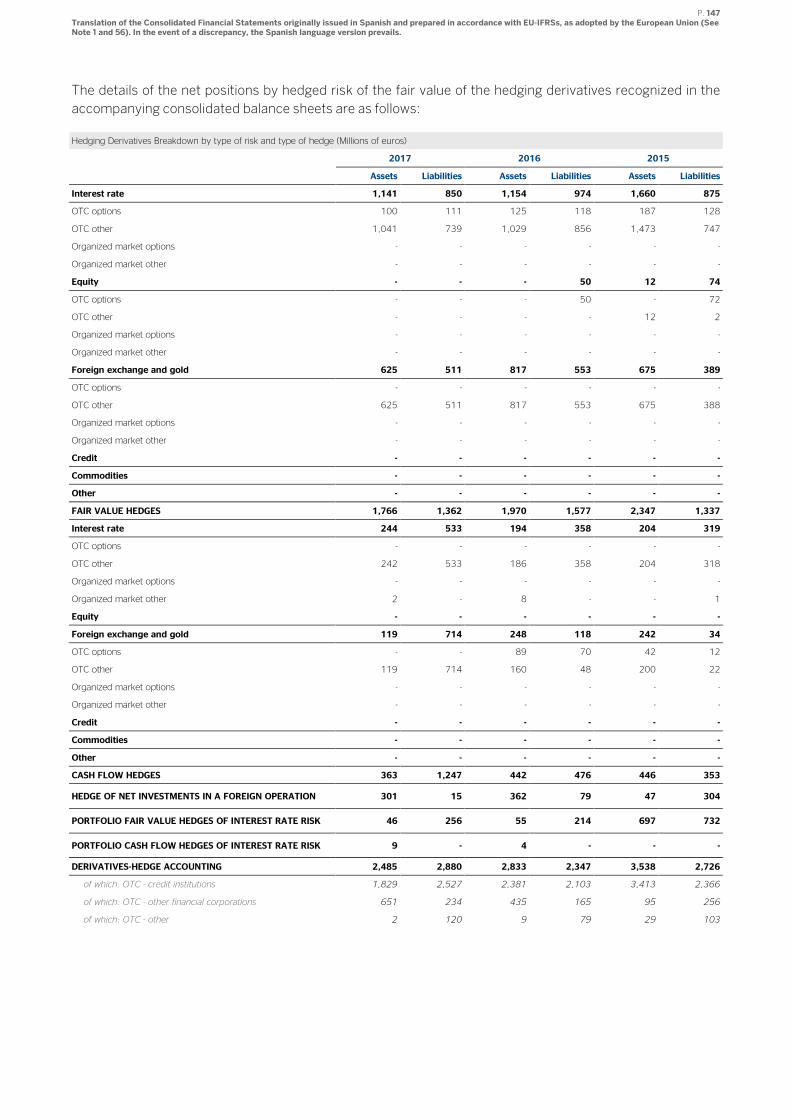
P. 147 Translation of the Consolidated Financial Statements originally issued in Spanish and prepared in accordance with EU-IFRSs, as adopted by the European Union (See Note 1 and 56). In the event of a discrepancy, the Spanish language version prevails.
The details of the net positions by hedged risk of the fair value of the hedging derivatives recognized in the
accompanying consolidated balance sheets are as follows:
Hedging Derivatives Breakdown by type of risk and type of hedge (Millions of euros)
2017 2016 2015
Assets Liabilities Assets Liabilities Assets Liabilities
Interest rate 1,141 850 1,154 974 1,660 875
OTC options 100 111 125 118 187 128
OTC other 1,041 739 1,029 856 1,473 747
Organized market options - - - - - -
Organized market other - - - - - -
Equity - - - 50 12 74
OTC options - - - 50 - 72
OTC other - - - - 12 2
Organized market options - - - - - -
Organized market other - - - - - -
Foreign exchange and gold 625 511 817 553 675 389
OTC options - - - - - -
OTC other 625 511 817 553 675 388
Organized market options - - - - - -
Organized market other - - - - - -
Credit - - - - - -
Commodities - - - - - -
Other - - - - - -
FAIR VALUE HEDGES 1,766 1,362 1,970 1,577 2,347 1,337
Interest rate 244 533 194 358 204 319
OTC options - - - - - -
OTC other 242 533 186 358 204 318
Organized market options - - - - - -
Organized market other 2 - 8 - - 1
Equity - - - - - -
Foreign exchange and gold 119 714 248 118 242 34
OTC options - - 89 70 42 12
OTC other 119 714 160 48 200 22
Organized market options - - - - - -
Organized market other - - - - - -
Credit - - - - - -
Commodities - - - - - -
Other - - - - - -
CASH FLOW HEDGES 363 1,247 442 476 446 353
HEDGE OF NET INVESTMENTS IN A FOREIGN OPERATION 301 15 362 79 47 304
PORTFOLIO FAIR VALUE HEDGES OF INTEREST RATE RISK 46 256 55 214 697 732
PORTFOLIO CASH FLOW HEDGES OF INTEREST RATE RISK 9 - 4 - - -
DERIVATIVES-HEDGE ACCOUNTING 2,485 2,880 2,833 2,347 3,538 2,726
of which: OTC - credit institutions 1,829 2,527 2,381 2,103 3,413 2,366
of which: OTC - other financial corporations 651 234 435 165 95 256
of which: OTC - other 2 120 9 79 29 103
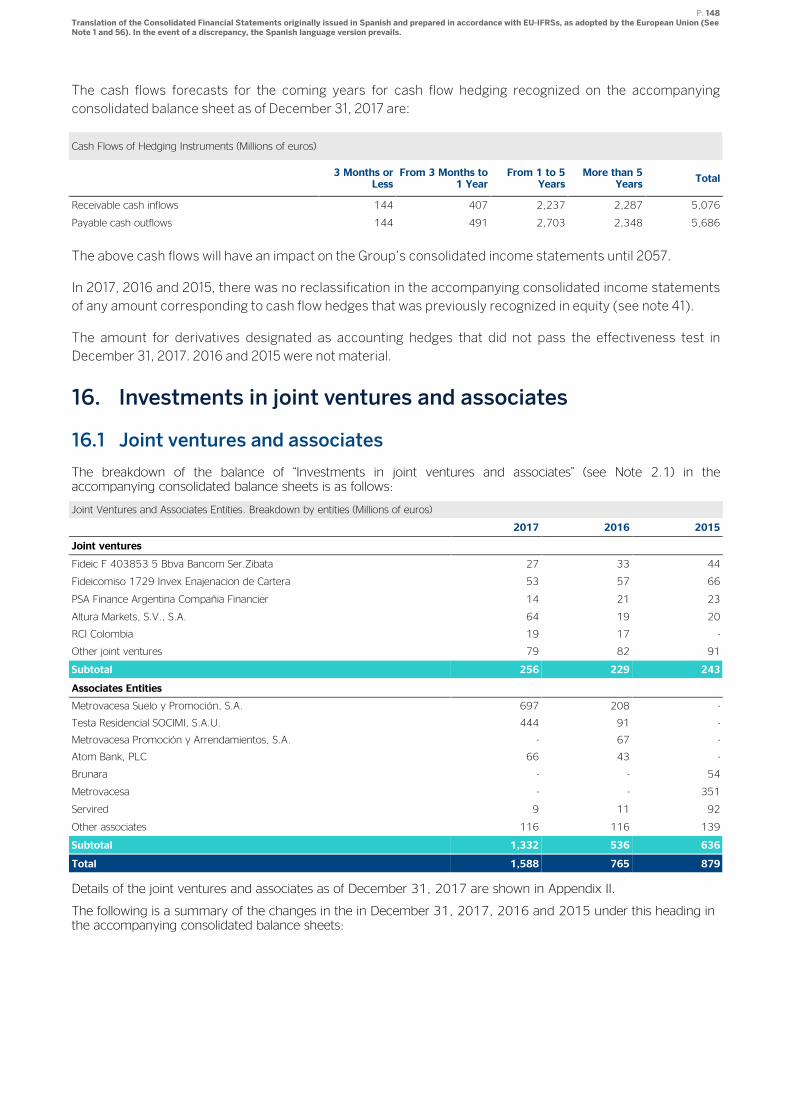
P. 148 Translation of the Consolidated Financial Statements originally issued in Spanish and prepared in accordance with EU-IFRSs, as adopted by the European Union (See Note 1 and 56). In the event of a discrepancy, the Spanish language version prevails.
The cash flows forecasts for the coming years for cash flow hedging recognized on the accompanying
consolidated balance sheet as of December 31, 2017 are:
Cash Flows of Hedging Instruments (Millions of euros)
3 Months or
Less From 3 Months to
1 Year From 1 to 5
Years More than 5
Years Total
Receivable cash inflows 144 407 2,237 2,287 5,076
Payable cash outflows 144 491 2,703 2,348 5,686
The above cash flows will have an impact on the Group’s consolidated income statements until 2057.
In 2017, 2016 and 2015, there was no reclassification in the accompanying consolidated income statements
of any amount corresponding to cash flow hedges that was previously recognized in equity (see note 41).
The amount for derivatives designated as accounting hedges that did not pass the effectiveness test in
December 31, 2017. 2016 and 2015 were not material.
16. Investments in joint ventures and associates
16.1 Joint ventures and associates
The breakdown of the balance of “Investments in joint ventures and associates” (see Note 2.1) in the accompanying consolidated balance sheets is as follows:
Joint Ventures and Associates Entities. Breakdown by entities (Millions of euros)
2017 2016 2015
Joint ventures
Fideic F 403853 5 Bbva Bancom Ser.Zibata 27 33 44
Fideicomiso 1729 Invex Enajenacion de Cartera 53 57 66
PSA Finance Argentina Compañia Financier 14 21 23
Altura Markets, S.V., S.A. 64 19 20
RCI Colombia 19 17 -
Other joint ventures 79 82 91
Subtotal 256 229 243
Associates Entities
Metrovacesa Suelo y Promoción, S.A. 697 208 -
Testa Residencial SOCIMI, S.A.U. 444 91 -
Metrovacesa Promoción y Arrendamientos, S.A. - 67 -
Atom Bank, PLC 66 43 -
Brunara - - 54
Metrovacesa - - 351
Servired 9 11 92
Other associates 116 116 139
Subtotal 1,332 536 636
Total 1,588 765 879
Details of the joint ventures and associates as of December 31, 2017 are shown in Appendix II.
The following is a summary of the changes in the in December 31, 2017, 2016 and 2015 under this heading in the accompanying consolidated balance sheets:
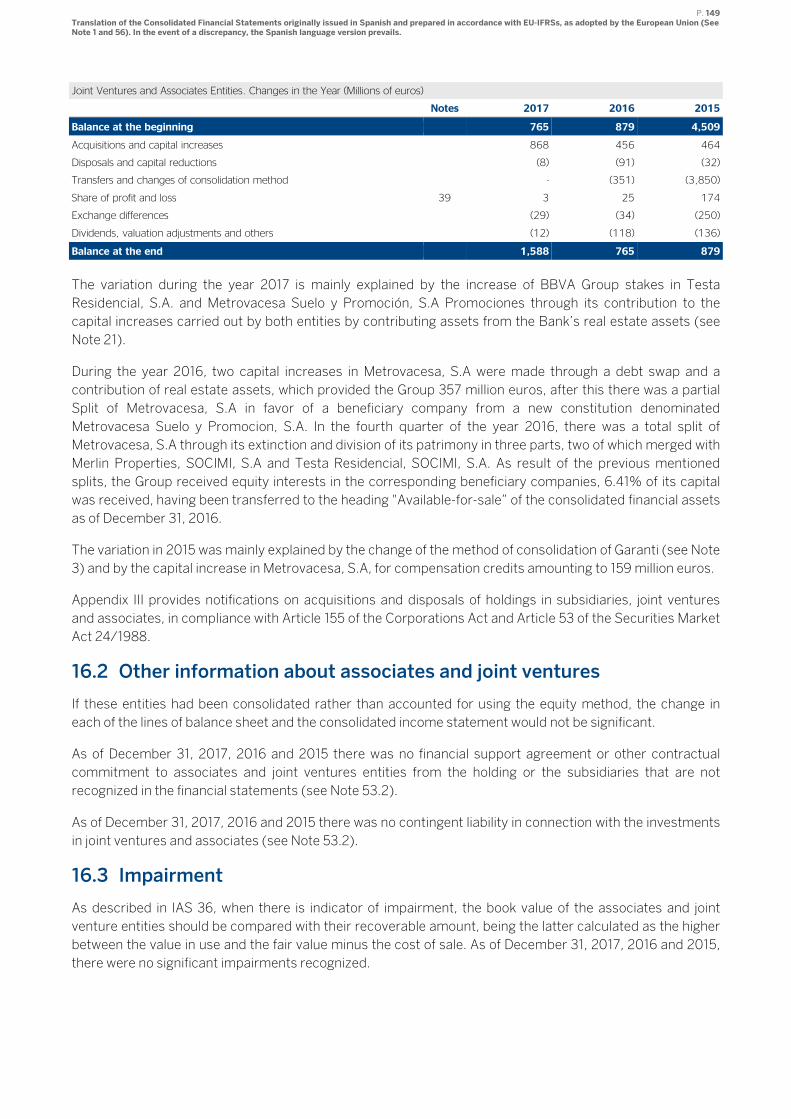
P. 149 Translation of the Consolidated Financial Statements originally issued in Spanish and prepared in accordance with EU-IFRSs, as adopted by the European Union (See Note 1 and 56). In the event of a discrepancy, the Spanish language version prevails.
Joint Ventures and Associates Entities. Changes in the Year (Millions of euros)
Notes 2017 2016 2015
Balance at the beginning 765 879 4,509
Acquisitions and capital increases 868 456 464
Disposals and capital reductions (8) (91) (32)
Transfers and changes of consolidation method - (351) (3,850)
Share of profit and loss 39 3 25 174
Exchange differences (29) (34) (250)
Dividends, valuation adjustments and others (12) (118) (136)
Balance at the end 1,588 765 879
The variation during the year 2017 is mainly explained by the increase of BBVA Group stakes in Testa
Residencial, S.A. and Metrovacesa Suelo y Promoción, S.A Promociones through its contribution to the
capital increases carried out by both entities by contributing assets from the Bank’s real estate assets (see
Note 21).
During the year 2016, two capital increases in Metrovacesa, S.A were made through a debt swap and a
contribution of real estate assets, which provided the Group 357 million euros, after this there was a partial
Split of Metrovacesa, S.A in favor of a beneficiary company from a new constitution denominated
Metrovacesa Suelo y Promocion, S.A. In the fourth quarter of the year 2016, there was a total split of
Metrovacesa, S.A through its extinction and division of its patrimony in three parts, two of which merged with
Merlin Properties, SOCIMI, S.A and Testa Residencial, SOCIMI, S.A. As result of the previous mentioned
splits, the Group received equity interests in the corresponding beneficiary companies, 6.41% of its capital
was received, having been transferred to the heading "Available-for-sale” of the consolidated financial assets
as of December 31, 2016.
The variation in 2015 was mainly explained by the change of the method of consolidation of Garanti (see Note
3) and by the capital increase in Metrovacesa, S.A, for compensation credits amounting to 159 million euros.
Appendix III provides notifications on acquisitions and disposals of holdings in subsidiaries, joint ventures
and associates, in compliance with Article 155 of the Corporations Act and Article 53 of the Securities Market
Act 24/1988.
16.2 Other information about associates and joint ventures
If these entities had been consolidated rather than accounted for using the equity method, the change in
each of the lines of balance sheet and the consolidated income statement would not be significant.
As of December 31, 2017, 2016 and 2015 there was no financial support agreement or other contractual
commitment to associates and joint ventures entities from the holding or the subsidiaries that are not
recognized in the financial statements (see Note 53.2).
As of December 31, 2017, 2016 and 2015 there was no contingent liability in connection with the investments
in joint ventures and associates (see Note 53.2).
16.3 Impairment
As described in IAS 36, when there is indicator of impairment, the book value of the associates and joint
venture entities should be compared with their recoverable amount, being the latter calculated as the higher
between the value in use and the fair value minus the cost of sale. As of December 31, 2017, 2016 and 2015,
there were no significant impairments recognized.
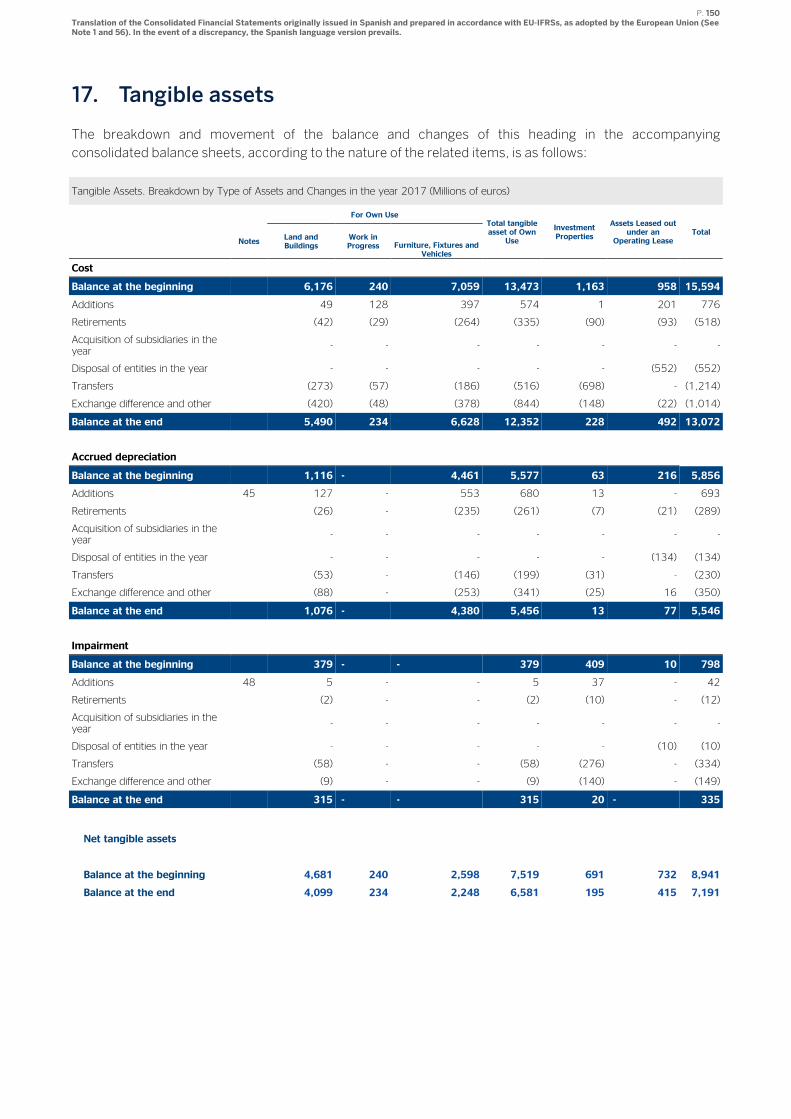
P. 150 Translation of the Consolidated Financial Statements originally issued in Spanish and prepared in accordance with EU-IFRSs, as adopted by the European Union (See Note 1 and 56). In the event of a discrepancy, the Spanish language version prevails.
17. Tangible assets
The breakdown and movement of the balance and changes of this heading in the accompanying
consolidated balance sheets, according to the nature of the related items, is as follows:
Tangible Assets. Breakdown by Type of Assets and Changes in the year 2017 (Millions of euros)
For Own Use
Total tangible asset of Own
Use
Investment Properties
Assets Leased out under an
Operating Lease Total
Notes Land and Buildings
Work in Progress Furniture, Fixtures and
Vehicles
Cost
Balance at the beginning 6,176 240 7,059 13,473 1,163 958 15,594
Additions 49 128 397 574 1 201 776
Retirements (42) (29) (264) (335) (90) (93) (518)
Acquisition of subsidiaries in the year
- - - - - - -
Disposal of entities in the year - - - - - (552) (552)
Transfers (273) (57) (186) (516) (698) - (1,214)
Exchange difference and other (420) (48) (378) (844) (148) (22) (1,014)
Balance at the end 5,490 234 6,628 12,352 228 492 13,072
Accrued depreciation
Balance at the beginning 1,116 - 4,461 5,577 63 216 5,856
Additions 45 127 - 553 680 13 - 693
Retirements (26) - (235) (261) (7) (21) (289)
Acquisition of subsidiaries in the year
- - - - - - -
Disposal of entities in the year - - - - - (134) (134)
Transfers (53) - (146) (199) (31) - (230)
Exchange difference and other (88) - (253) (341) (25) 16 (350)
Balance at the end 1,076 - 4,380 5,456 13 77 5,546
Impairment
Balance at the beginning 379 - - 379 409 10 798
Additions 48 5 - - 5 37 - 42
Retirements (2) - - (2) (10) - (12)
Acquisition of subsidiaries in the year
- - - - - - -
Disposal of entities in the year - - - - - (10) (10)
Transfers (58) - - (58) (276) - (334)
Exchange difference and other (9) - - (9) (140) - (149)
Balance at the end 315 - - 315 20 - 335
Net tangible assets
Balance at the beginning 4,681 240 2,598 7,519 691 732 8,941
Balance at the end 4,099 234 2,248 6,581 195 415 7,191
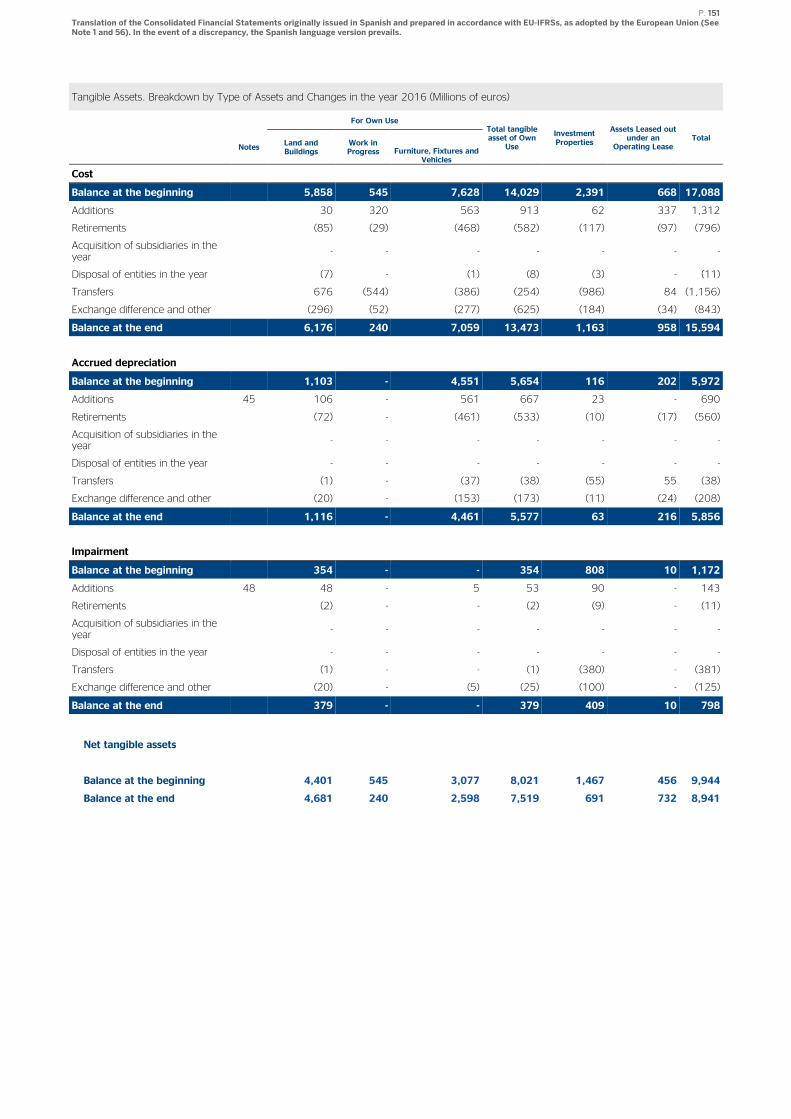
P. 151 Translation of the Consolidated Financial Statements originally issued in Spanish and prepared in accordance with EU-IFRSs, as adopted by the European Union (See Note 1 and 56). In the event of a discrepancy, the Spanish language version prevails.
Tangible Assets. Breakdown by Type of Assets and Changes in the year 2016 (Millions of euros)
For Own Use
Total tangible asset of Own
Use
Investment Properties
Assets Leased out under an
Operating Lease Total
Notes Land and Buildings
Work in Progress Furniture, Fixtures and
Vehicles
Cost
Balance at the beginning 5,858 545 7,628 14,029 2,391 668 17,088
Additions 30 320 563 913 62 337 1,312
Retirements (85) (29) (468) (582) (117) (97) (796)
Acquisition of subsidiaries in the year
- - - - - - -
Disposal of entities in the year (7) - (1) (8) (3) - (11)
Transfers 676 (544) (386) (254) (986) 84 (1,156)
Exchange difference and other (296) (52) (277) (625) (184) (34) (843)
Balance at the end 6,176 240 7,059 13,473 1,163 958 15,594
Accrued depreciation
Balance at the beginning 1,103 - 4,551 5,654 116 202 5,972
Additions 45 106 - 561 667 23 - 690
Retirements (72) - (461) (533) (10) (17) (560)
Acquisition of subsidiaries in the year
- - - - - - -
Disposal of entities in the year - - - - - - -
Transfers (1) - (37) (38) (55) 55 (38)
Exchange difference and other (20) - (153) (173) (11) (24) (208)
Balance at the end 1,116 - 4,461 5,577 63 216 5,856
Impairment
Balance at the beginning 354 - - 354 808 10 1,172
Additions 48 48 - 5 53 90 - 143
Retirements (2) - - (2) (9) - (11)
Acquisition of subsidiaries in the year
- - - - - - -
Disposal of entities in the year - - - - - - -
Transfers (1) - - (1) (380) - (381)
Exchange difference and other (20) - (5) (25) (100) - (125)
Balance at the end 379 - - 379 409 10 798
Net tangible assets
Balance at the beginning 4,401 545 3,077 8,021 1,467 456 9,944
Balance at the end 4,681 240 2,598 7,519 691 732 8,941
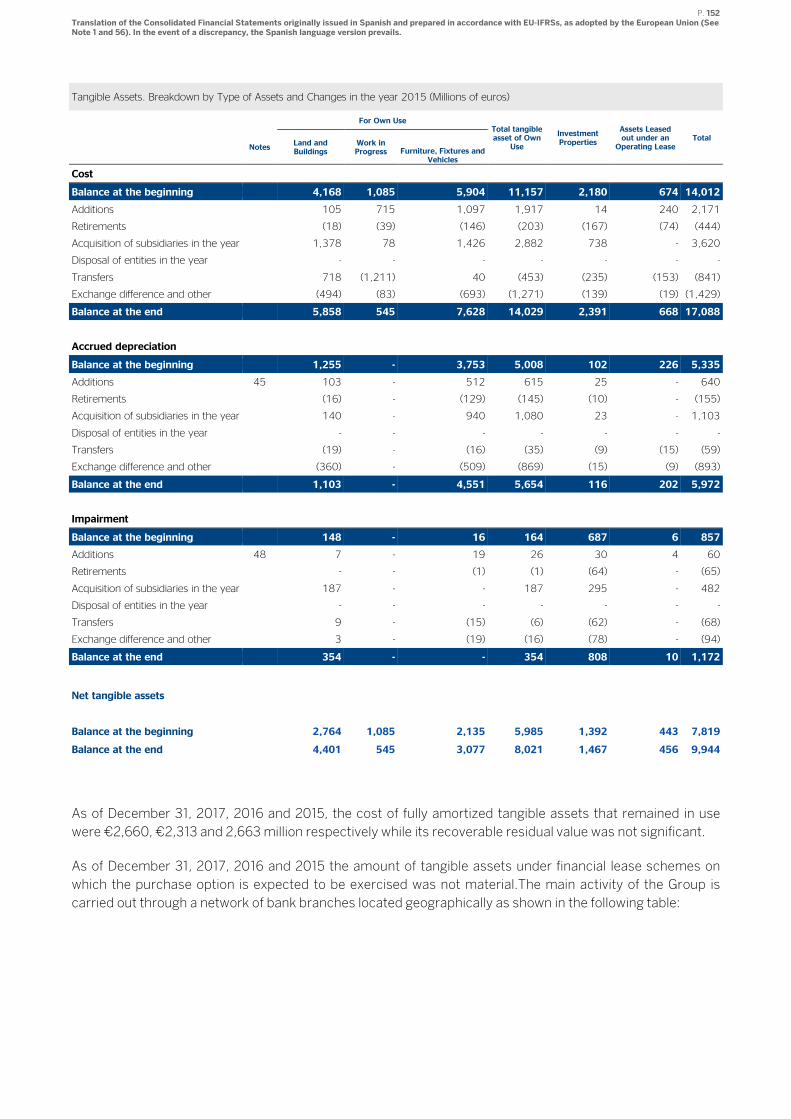
P. 152 Translation of the Consolidated Financial Statements originally issued in Spanish and prepared in accordance with EU-IFRSs, as adopted by the European Union (See Note 1 and 56). In the event of a discrepancy, the Spanish language version prevails.
Tangible Assets. Breakdown by Type of Assets and Changes in the year 2015 (Millions of euros)
For Own Use
Total tangible asset of Own
Use
Investment Properties
Assets Leased out under an Operating Lease
Total
Notes Land and Buildings
Work in Progress Furniture, Fixtures and
Vehicles
Cost
Balance at the beginning 4,168 1,085 5,904 11,157 2,180 674 14,012
Additions 105 715 1,097 1,917 14 240 2,171
Retirements (18) (39) (146) (203) (167) (74) (444)
Acquisition of subsidiaries in the year 1,378 78 1,426 2,882 738 - 3,620
Disposal of entities in the year - - - - - - -
Transfers 718 (1,211) 40 (453) (235) (153) (841)
Exchange difference and other (494) (83) (693) (1,271) (139) (19) (1,429)
Balance at the end 5,858 545 7,628 14,029 2,391 668 17,088
Accrued depreciation
Balance at the beginning 1,255 - 3,753 5,008 102 226 5,335
Additions 45 103 - 512 615 25 - 640
Retirements (16) - (129) (145) (10) - (155)
Acquisition of subsidiaries in the year 140 - 940 1,080 23 - 1,103
Disposal of entities in the year - - - - - - -
Transfers (19) - (16) (35) (9) (15) (59)
Exchange difference and other (360) - (509) (869) (15) (9) (893)
Balance at the end 1,103 - 4,551 5,654 116 202 5,972
Impairment
Balance at the beginning 148 - 16 164 687 6 857
Additions 48 7 - 19 26 30 4 60
Retirements - - (1) (1) (64) - (65)
Acquisition of subsidiaries in the year 187 - - 187 295 - 482
Disposal of entities in the year - - - - - - -
Transfers 9 - (15) (6) (62) - (68)
Exchange difference and other 3 - (19) (16) (78) - (94)
Balance at the end 354 - - 354 808 10 1,172
Net tangible assets
Balance at the beginning 2,764 1,085 2,135 5,985 1,392 443 7,819
Balance at the end 4,401 545 3,077 8,021 1,467 456 9,944
As of December 31, 2017, 2016 and 2015, the cost of fully amortized tangible assets that remained in use
were €2,660, €2,313 and 2,663 million respectively while its recoverable residual value was not significant.
As of December 31, 2017, 2016 and 2015 the amount of tangible assets under financial lease schemes on
which the purchase option is expected to be exercised was not material.The main activity of the Group is
carried out through a network of bank branches located geographically as shown in the following table:
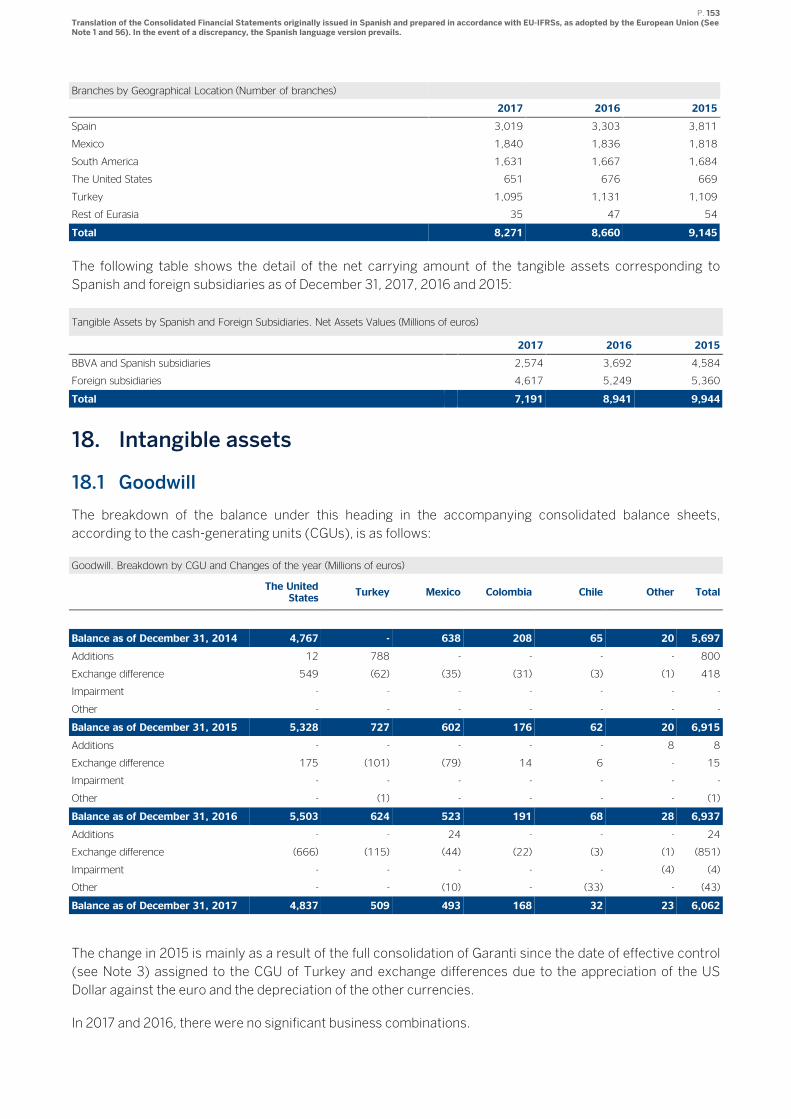
P. 153 Translation of the Consolidated Financial Statements originally issued in Spanish and prepared in accordance with EU-IFRSs, as adopted by the European Union (See Note 1 and 56). In the event of a discrepancy, the Spanish language version prevails.
Branches by Geographical Location (Number of branches)
2017 2016 2015
Spain 3,019 3,303 3,811
Mexico 1,840 1,836 1,818
South America 1,631 1,667 1,684
The United States 651 676 669
Turkey 1,095 1,131 1,109
Rest of Eurasia 35 47 54
Total 8,271 8,660 9,145
The following table shows the detail of the net carrying amount of the tangible assets corresponding to
Spanish and foreign subsidiaries as of December 31, 2017, 2016 and 2015:
Tangible Assets by Spanish and Foreign Subsidiaries. Net Assets Values (Millions of euros)
2017 2016 2015
BBVA and Spanish subsidiaries 2,574 3,692 4,584
Foreign subsidiaries 4,617 5,249 5,360
Total 7,191 8,941 9,944
18. Intangible assets
18.1 Goodwill
The breakdown of the balance under this heading in the accompanying consolidated balance sheets,
according to the cash-generating units (CGUs), is as follows:
Goodwill. Breakdown by CGU and Changes of the year (Millions of euros)
The United
States Turkey Mexico Colombia Chile Other Total
Balance as of December 31, 2014 4,767 - 638 208 65 20 5,697
Additions 12 788 - - - - 800
Exchange difference 549 (62) (35) (31) (3) (1) 418
Impairment - - - - - - -
Other - - - - - - -
Balance as of December 31, 2015 5,328 727 602 176 62 20 6,915
Additions - - - - - 8 8
Exchange difference 175 (101) (79) 14 6 - 15
Impairment - - - - - - -
Other - (1) - - - - (1)
Balance as of December 31, 2016 5,503 624 523 191 68 28 6,937
Additions - - 24 - - - 24
Exchange difference (666) (115) (44) (22) (3) (1) (851)
Impairment - - - - - (4) (4)
Other - - (10) - (33) - (43)
Balance as of December 31, 2017 4,837 509 493 168 32 23 6,062
The change in 2015 is mainly as a result of the full consolidation of Garanti since the date of effective control
(see Note 3) assigned to the CGU of Turkey and exchange differences due to the appreciation of the US
Dollar against the euro and the depreciation of the other currencies.
In 2017 and 2016, there were no significant business combinations.
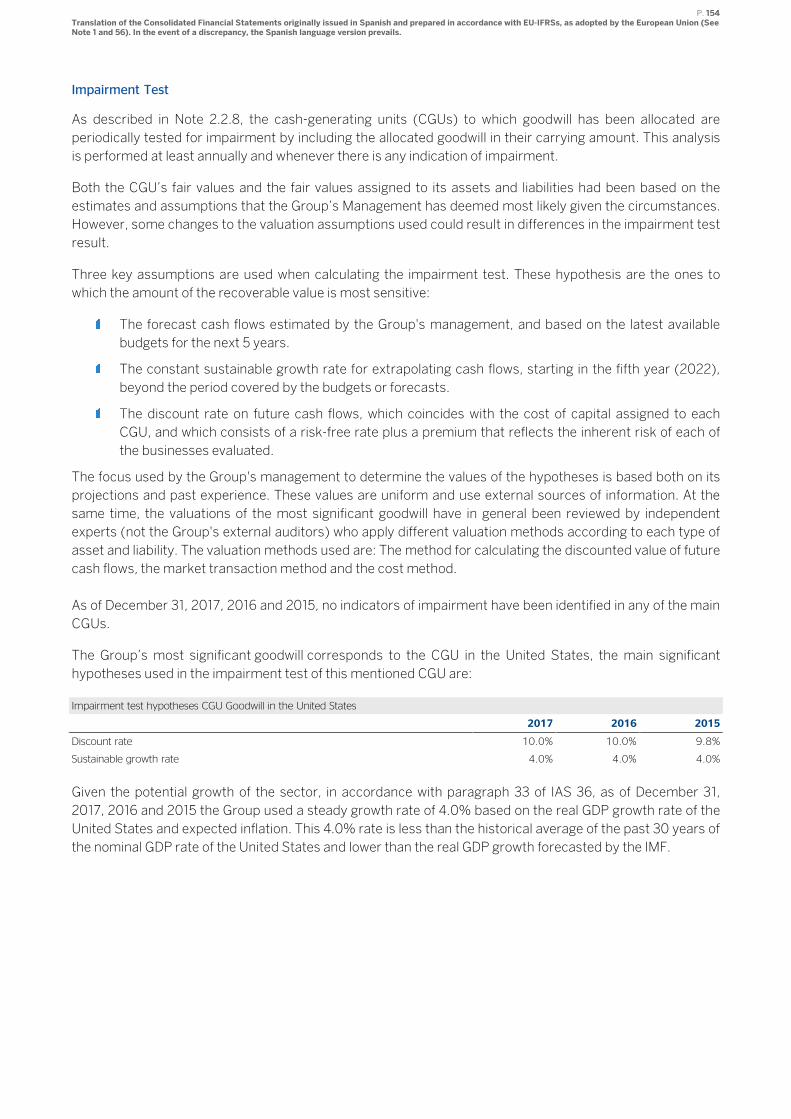
P. 154 Translation of the Consolidated Financial Statements originally issued in Spanish and prepared in accordance with EU-IFRSs, as adopted by the European Union (See Note 1 and 56). In the event of a discrepancy, the Spanish language version prevails.
Impairment Test
As described in Note 2.2.8, the cash-generating units (CGUs) to which goodwill has been allocated are
periodically tested for impairment by including the allocated goodwill in their carrying amount. This analysis
is performed at least annually and whenever there is any indication of impairment.
Both the CGU’s fair values and the fair values assigned to its assets and liabilities had been based on the
estimates and assumptions that the Group’s Management has deemed most likely given the circumstances.
However, some changes to the valuation assumptions used could result in differences in the impairment test
result.
Three key assumptions are used when calculating the impairment test. These hypothesis are the ones to
which the amount of the recoverable value is most sensitive:
The forecast cash flows estimated by the Group's management, and based on the latest available
budgets for the next 5 years.
The constant sustainable growth rate for extrapolating cash flows, starting in the fifth year (2022),
beyond the period covered by the budgets or forecasts.
The discount rate on future cash flows, which coincides with the cost of capital assigned to each
CGU, and which consists of a risk-free rate plus a premium that reflects the inherent risk of each of
the businesses evaluated.
The focus used by the Group's management to determine the values of the hypotheses is based both on its
projections and past experience. These values are uniform and use external sources of information. At the
same time, the valuations of the most significant goodwill have in general been reviewed by independent
experts (not the Group's external auditors) who apply different valuation methods according to each type of
asset and liability. The valuation methods used are: The method for calculating the discounted value of future
cash flows, the market transaction method and the cost method.
As of December 31, 2017, 2016 and 2015, no indicators of impairment have been identified in any of the main
CGUs.
The Group’s most significant goodwill corresponds to the CGU in the United States, the main significant
hypotheses used in the impairment test of this mentioned CGU are:
Impairment test hypotheses CGU Goodwill in the United States
2017 2016 2015
Discount rate 10.0% 10.0% 9.8%
Sustainable growth rate 4.0% 4.0% 4.0%
Given the potential growth of the sector, in accordance with paragraph 33 of IAS 36, as of December 31,
2017, 2016 and 2015 the Group used a steady growth rate of 4.0% based on the real GDP growth rate of the
United States and expected inflation. This 4.0% rate is less than the historical average of the past 30 years of
the nominal GDP rate of the United States and lower than the real GDP growth forecasted by the IMF.
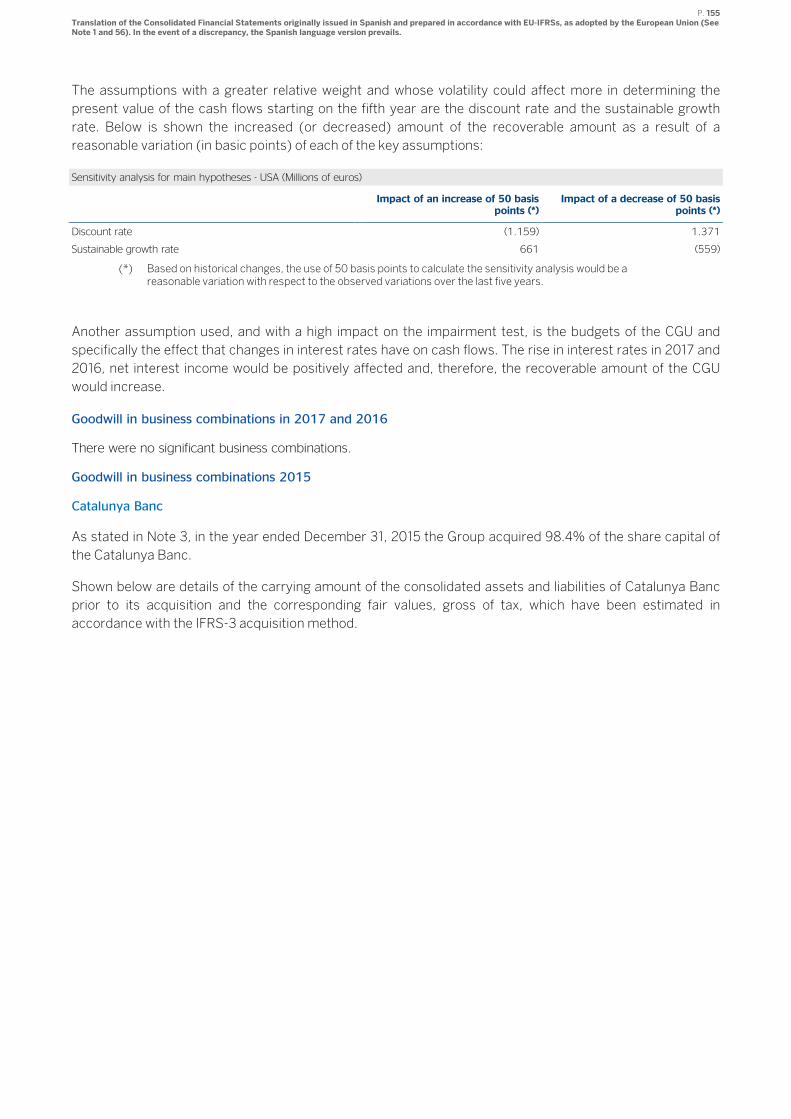
P. 155 Translation of the Consolidated Financial Statements originally issued in Spanish and prepared in accordance with EU-IFRSs, as adopted by the European Union (See Note 1 and 56). In the event of a discrepancy, the Spanish language version prevails.
The assumptions with a greater relative weight and whose volatility could affect more in determining the
present value of the cash flows starting on the fifth year are the discount rate and the sustainable growth
rate. Below is shown the increased (or decreased) amount of the recoverable amount as a result of a
reasonable variation (in basic points) of each of the key assumptions:
Sensitivity analysis for main hypotheses - USA (Millions of euros)
Impact of an increase of 50 basis
points (*) Impact of a decrease of 50 basis
points (*)
Discount rate (1.159) 1.371
Sustainable growth rate 661 (559)
(*) Based on historical changes, the use of 50 basis points to calculate the sensitivity analysis would be a reasonable variation with respect to the observed variations over the last five years.
Another assumption used, and with a high impact on the impairment test, is the budgets of the CGU and
specifically the effect that changes in interest rates have on cash flows. The rise in interest rates in 2017 and
2016, net interest income would be positively affected and, therefore, the recoverable amount of the CGU
would increase.
Goodwill in business combinations in 2017 and 2016
There were no significant business combinations.
Goodwill in business combinations 2015
Catalunya Banc
As stated in Note 3, in the year ended December 31, 2015 the Group acquired 98.4% of the share capital of
the Catalunya Banc.
Shown below are details of the carrying amount of the consolidated assets and liabilities of Catalunya Banc
prior to its acquisition and the corresponding fair values, gross of tax, which have been estimated in
accordance with the IFRS-3 acquisition method.
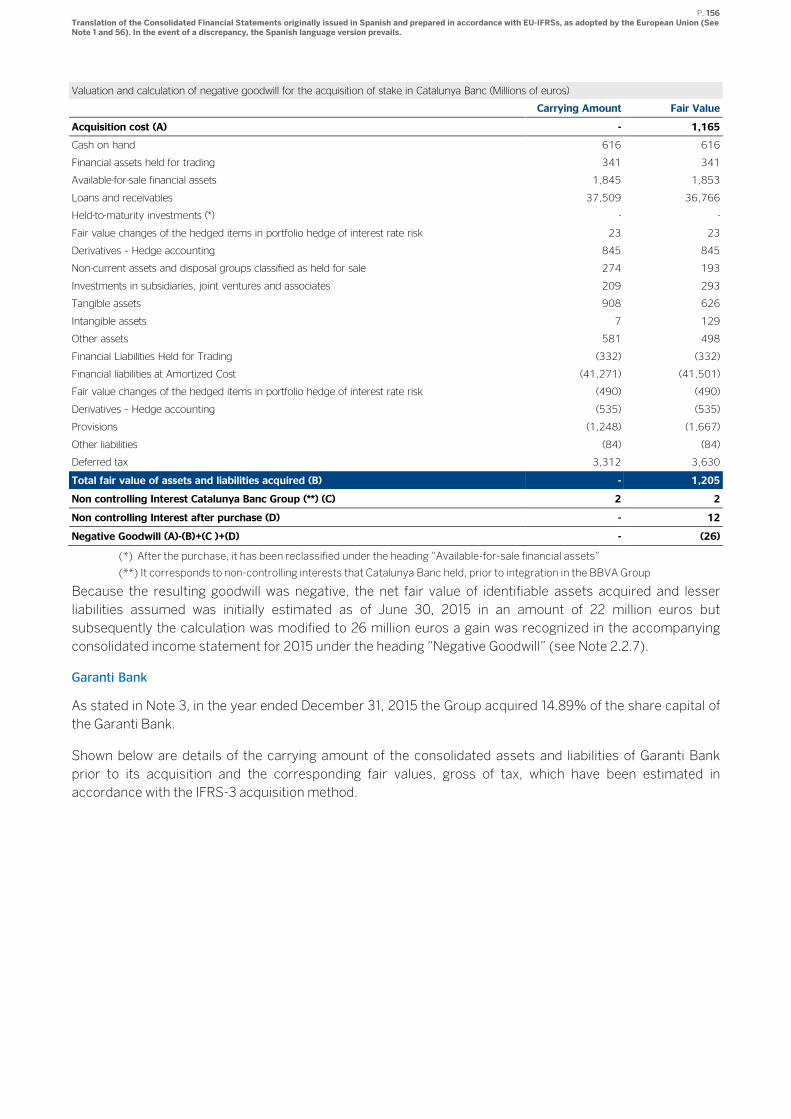
P. 156 Translation of the Consolidated Financial Statements originally issued in Spanish and prepared in accordance with EU-IFRSs, as adopted by the European Union (See Note 1 and 56). In the event of a discrepancy, the Spanish language version prevails.
Valuation and calculation of negative goodwill for the acquisition of stake in Catalunya Banc (Millions of euros)
Carrying Amount Fair Value
Acquisition cost (A) - 1,165
Cash on hand 616 616
Financial assets held for trading 341 341
Available-for-sale financial assets 1,845 1,853
Loans and receivables 37,509 36,766
Held-to-maturity investments (*) - -
Fair value changes of the hedged items in portfolio hedge of interest rate risk 23 23
Derivatives – Hedge accounting 845 845
Non-current assets and disposal groups classified as held for sale 274 193
Investments in subsidiaries, joint ventures and associates 209 293
Tangible assets 908 626
Intangible assets 7 129
Other assets 581 498
Financial Liabilities Held for Trading (332) (332)
Financial liabilities at Amortized Cost (41,271) (41,501)
Fair value changes of the hedged items in portfolio hedge of interest rate risk (490) (490)
Derivatives – Hedge accounting (535) (535)
Provisions (1,248) (1,667)
Other liabilities (84) (84)
Deferred tax 3,312 3,630
Total fair value of assets and liabilities acquired (B) - 1,205
Non controlling Interest Catalunya Banc Group (**) (C) 2 2
Non controlling Interest after purchase (D) - 12
Negative Goodwill (A)-(B)+(C )+(D) - (26)
(*) After the purchase, it has been reclassified under the heading “Available-for-sale financial assets”
(**) It corresponds to non-controlling interests that Catalunya Banc held, prior to integration in the BBVA Group
Because the resulting goodwill was negative, the net fair value of identifiable assets acquired and lesser
liabilities assumed was initially estimated as of June 30, 2015 in an amount of 22 million euros but
subsequently the calculation was modified to 26 million euros a gain was recognized in the accompanying
consolidated income statement for 2015 under the heading “Negative Goodwill” (see Note 2.2.7).
Garanti Bank
As stated in Note 3, in the year ended December 31, 2015 the Group acquired 14.89% of the share capital of
the Garanti Bank.
Shown below are details of the carrying amount of the consolidated assets and liabilities of Garanti Bank
prior to its acquisition and the corresponding fair values, gross of tax, which have been estimated in
accordance with the IFRS-3 acquisition method.
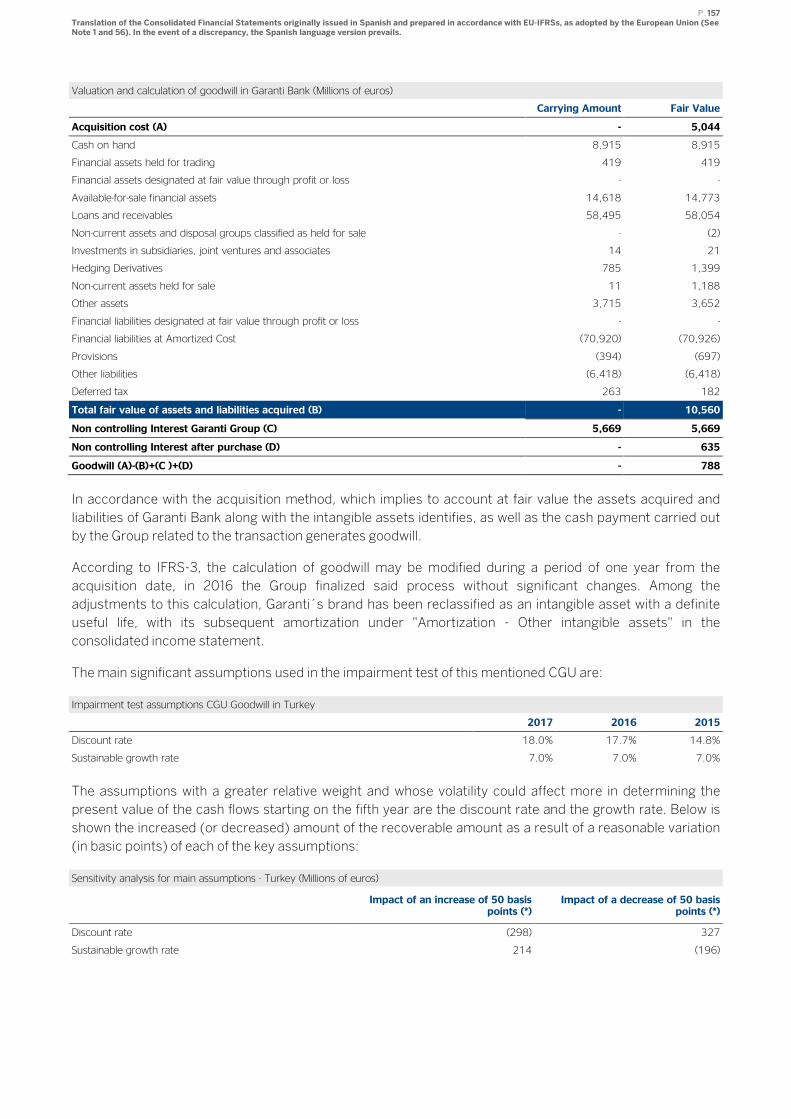
P. 157 Translation of the Consolidated Financial Statements originally issued in Spanish and prepared in accordance with EU-IFRSs, as adopted by the European Union (See Note 1 and 56). In the event of a discrepancy, the Spanish language version prevails.
Valuation and calculation of goodwill in Garanti Bank (Millions of euros)
Carrying Amount Fair Value
Acquisition cost (A) - 5,044
Cash on hand 8,915 8,915
Financial assets held for trading 419 419
Financial assets designated at fair value through profit or loss - -
Available-for-sale financial assets 14,618 14,773
Loans and receivables 58,495 58,054
Non-current assets and disposal groups classified as held for sale - (2)
Investments in subsidiaries, joint ventures and associates 14 21
Hedging Derivatives 785 1,399
Non-current assets held for sale 11 1,188
Other assets 3,715 3,652
Financial liabilities designated at fair value through profit or loss - -
Financial liabilities at Amortized Cost (70,920) (70,926)
Provisions (394) (697)
Other liabilities (6,418) (6,418)
Deferred tax 263 182
Total fair value of assets and liabilities acquired (B) - 10,560
Non controlling Interest Garanti Group (C) 5,669 5,669
Non controlling Interest after purchase (D) - 635
Goodwill (A)-(B)+(C )+(D) - 788
In accordance with the acquisition method, which implies to account at fair value the assets acquired and
liabilities of Garanti Bank along with the intangible assets identifies, as well as the cash payment carried out
by the Group related to the transaction generates goodwill.
According to IFRS-3, the calculation of goodwill may be modified during a period of one year from the
acquisition date, in 2016 the Group finalized said process without significant changes. Among the
adjustments to this calculation, Garanti´s brand has been reclassified as an intangible asset with a definite
useful life, with its subsequent amortization under "Amortization - Other intangible assets" in the
consolidated income statement.
The main significant assumptions used in the impairment test of this mentioned CGU are:
Impairment test assumptions CGU Goodwill in Turkey
2017 2016 2015
Discount rate 18.0% 17.7% 14.8%
Sustainable growth rate 7.0% 7.0% 7.0%
The assumptions with a greater relative weight and whose volatility could affect more in determining the
present value of the cash flows starting on the fifth year are the discount rate and the growth rate. Below is
shown the increased (or decreased) amount of the recoverable amount as a result of a reasonable variation
(in basic points) of each of the key assumptions:
Sensitivity analysis for main assumptions - Turkey (Millions of euros)
Impact of an increase of 50 basis
points (*) Impact of a decrease of 50 basis
points (*)
Discount rate (298) 327
Sustainable growth rate 214 (196)
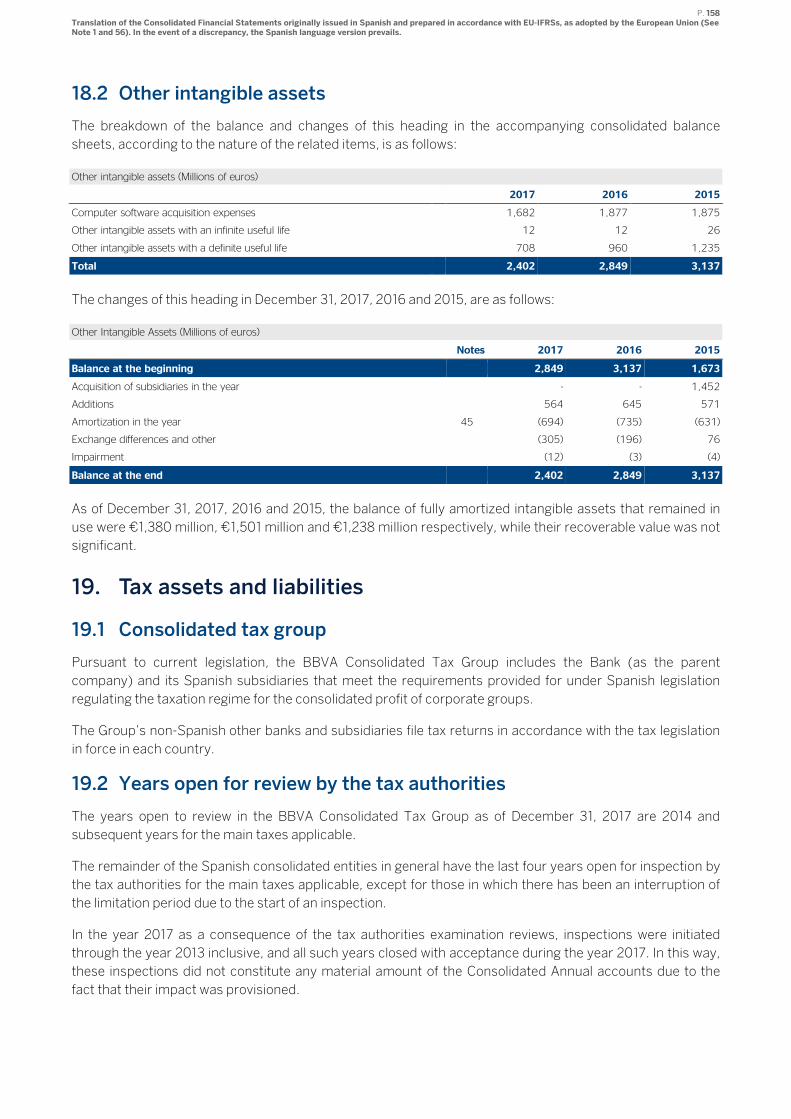
P. 158 Translation of the Consolidated Financial Statements originally issued in Spanish and prepared in accordance with EU-IFRSs, as adopted by the European Union (See Note 1 and 56). In the event of a discrepancy, the Spanish language version prevails.
18.2 Other intangible assets
The breakdown of the balance and changes of this heading in the accompanying consolidated balance
sheets, according to the nature of the related items, is as follows:
Other intangible assets (Millions of euros)
2017 2016 2015
Computer software acquisition expenses 1,682 1,877 1,875
Other intangible assets with an infinite useful life 12 12 26
Other intangible assets with a definite useful life 708 960 1,235
Total 2,402 2,849 3,137
The changes of this heading in December 31, 2017, 2016 and 2015, are as follows:
Other Intangible Assets (Millions of euros)
Notes 2017 2016 2015
Balance at the beginning 2,849 3,137 1,673
Acquisition of subsidiaries in the year - - 1,452
Additions 564 645 571
Amortization in the year 45 (694) (735) (631)
Exchange differences and other (305) (196) 76
Impairment (12) (3) (4)
Balance at the end 2,402 2,849 3,137
As of December 31, 2017, 2016 and 2015, the balance of fully amortized intangible assets that remained in
use were €1,380 million, €1,501 million and €1,238 million respectively, while their recoverable value was not
significant.
19. Tax assets and liabilities
19.1 Consolidated tax group
Pursuant to current legislation, the BBVA Consolidated Tax Group includes the Bank (as the parent
company) and its Spanish subsidiaries that meet the requirements provided for under Spanish legislation
regulating the taxation regime for the consolidated profit of corporate groups.
The Group’s non-Spanish other banks and subsidiaries file tax returns in accordance with the tax legislation
in force in each country.
19.2 Years open for review by the tax authorities
The years open to review in the BBVA Consolidated Tax Group as of December 31, 2017 are 2014 and
subsequent years for the main taxes applicable.
The remainder of the Spanish consolidated entities in general have the last four years open for inspection by
the tax authorities for the main taxes applicable, except for those in which there has been an interruption of
the limitation period due to the start of an inspection.
In the year 2017 as a consequence of the tax authorities examination reviews, inspections were initiated
through the year 2013 inclusive, and all such years closed with acceptance during the year 2017. In this way,
these inspections did not constitute any material amount of the Consolidated Annual accounts due to the
fact that their impact was provisioned.
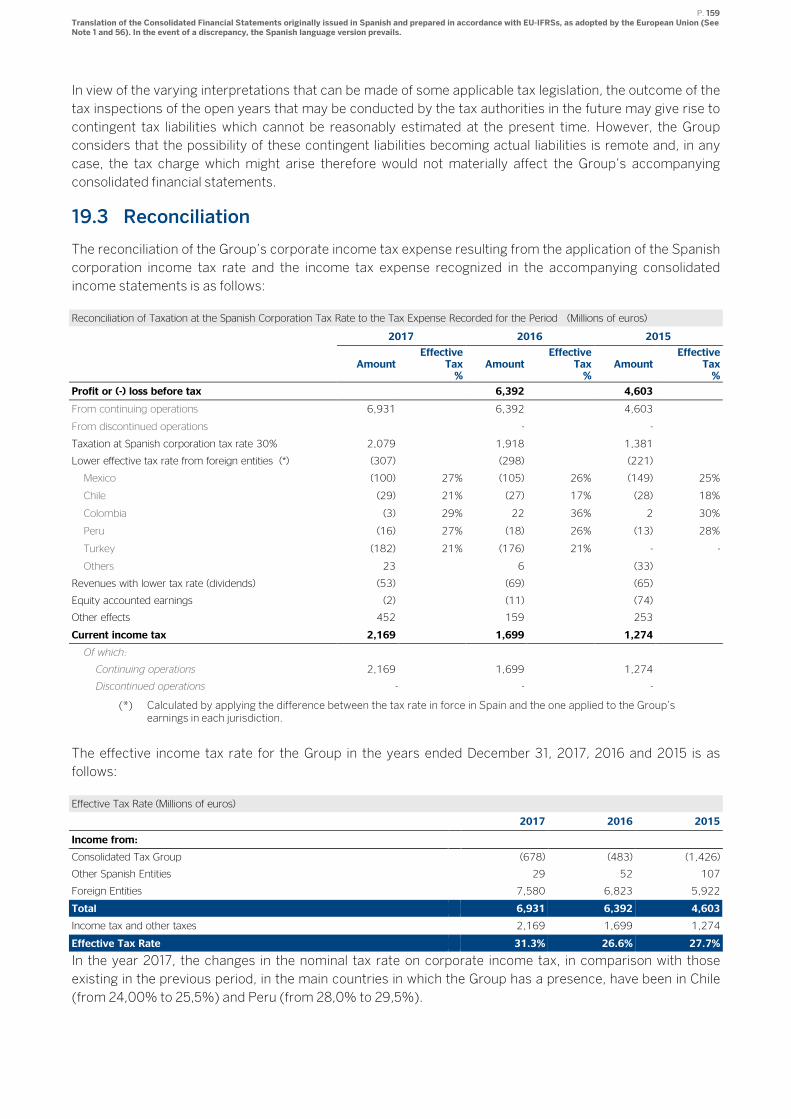
P. 159 Translation of the Consolidated Financial Statements originally issued in Spanish and prepared in accordance with EU-IFRSs, as adopted by the European Union (See Note 1 and 56). In the event of a discrepancy, the Spanish language version prevails.
In view of the varying interpretations that can be made of some applicable tax legislation, the outcome of the
tax inspections of the open years that may be conducted by the tax authorities in the future may give rise to
contingent tax liabilities which cannot be reasonably estimated at the present time. However, the Group
considers that the possibility of these contingent liabilities becoming actual liabilities is remote and, in any
case, the tax charge which might arise therefore would not materially affect the Group’s accompanying
consolidated financial statements.
19.3 Reconciliation
The reconciliation of the Group’s corporate income tax expense resulting from the application of the Spanish
corporation income tax rate and the income tax expense recognized in the accompanying consolidated
income statements is as follows:
Reconciliation of Taxation at the Spanish Corporation Tax Rate to the Tax Expense Recorded for the Period (Millions of euros)
2017 2016 2015
Amount Effective
Tax %
Amount Effective
Tax %
Amount Effective
Tax %
Profit or (-) loss before tax 6,931 6,392 4,603
From continuing operations 6,931 6,392 4,603
From discontinued operations - -
Taxation at Spanish corporation tax rate 30% 2,079 1,918 1,381
Lower effective tax rate from foreign entities (*) (307) (298) (221)
Mexico (100) 27% (105) 26% (149) 25%
Chile (29) 21% (27) 17% (28) 18%
Colombia (3) 29% 22 36% 2 30%
Peru (16) 27% (18) 26% (13) 28%
Turkey (182) 21% (176) 21% - -
Others 23 6 (33)
Revenues with lower tax rate (dividends) (53) (69) (65)
Equity accounted earnings (2) (11) (74)
Other effects 452 159 253
Current income tax 2,169 1,699 1,274
Of which:
Continuing operations 2,169 1,699 1,274
Discontinued operations - - -
(*) Calculated by applying the difference between the tax rate in force in Spain and the one applied to the Group’s earnings in each jurisdiction.
The effective income tax rate for the Group in the years ended December 31, 2017, 2016 and 2015 is as
follows:
Effective Tax Rate (Millions of euros)
2017 2016 2015
Income from:
Consolidated Tax Group (678) (483) (1,426)
Other Spanish Entities 29 52 107
Foreign Entities 7,580 6,823 5,922
Total 6,931 6,392 4,603
Income tax and other taxes 2,169 1,699 1,274
Effective Tax Rate 31.3% 26.6% 27.7%
In the year 2017, the changes in the nominal tax rate on corporate income tax, in comparison with those
existing in the previous period, in the main countries in which the Group has a presence, have been in Chile
(from 24,00% to 25,5%) and Peru (from 28,0% to 29,5%).
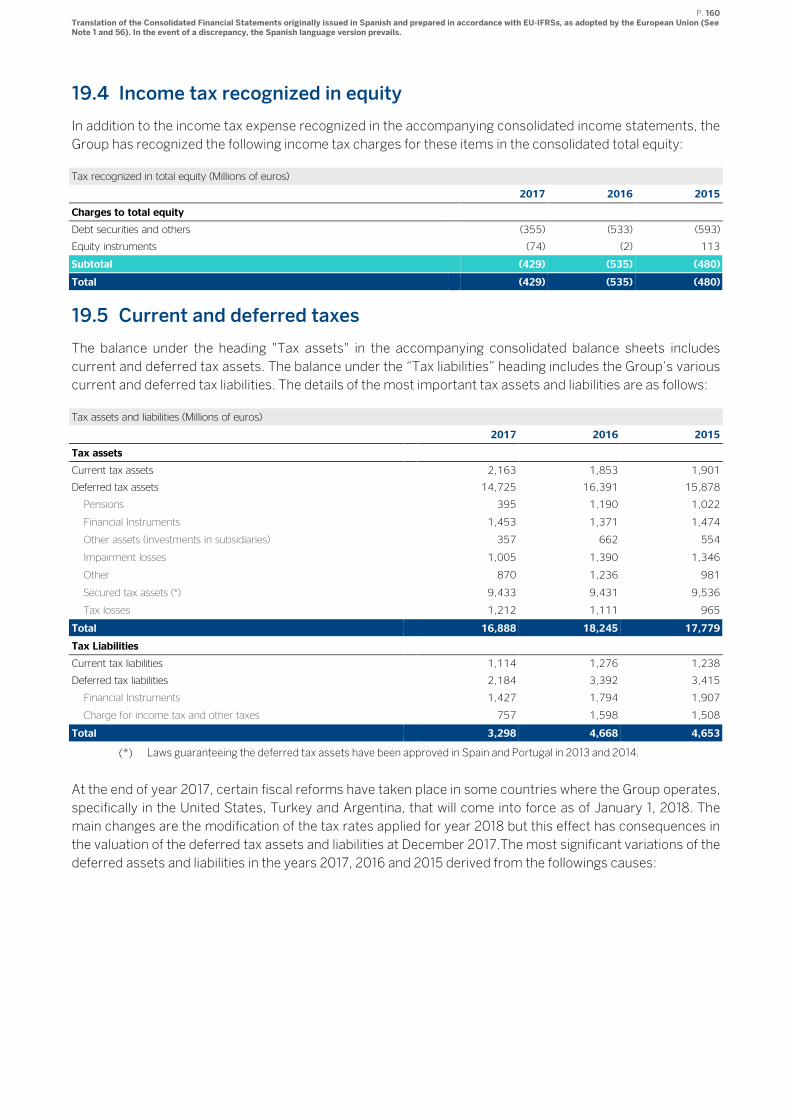
P. 160 Translation of the Consolidated Financial Statements originally issued in Spanish and prepared in accordance with EU-IFRSs, as adopted by the European Union (See Note 1 and 56). In the event of a discrepancy, the Spanish language version prevails.
19.4 Income tax recognized in equity
In addition to the income tax expense recognized in the accompanying consolidated income statements, the
Group has recognized the following income tax charges for these items in the consolidated total equity:
Tax recognized in total equity (Millions of euros)
2017 2016 2015
Charges to total equity
Debt securities and others (355) (533) (593)
Equity instruments (74) (2) 113
Subtotal (429) (535) (480)
Total (429) (535) (480)
19.5 Current and deferred taxes
The balance under the heading "Tax assets" in the accompanying consolidated balance sheets includes
current and deferred tax assets. The balance under the “Tax liabilities” heading includes the Group’s various
current and deferred tax liabilities. The details of the most important tax assets and liabilities are as follows:
Tax assets and liabilities (Millions of euros)
2017 2016 2015
Tax assets
Current tax assets 2,163 1,853 1,901
Deferred tax assets 14,725 16,391 15,878
Pensions 395 1,190 1,022
Financial Instruments 1,453 1,371 1,474
Other assets (investments in subsidiaries) 357 662 554
Impairment losses 1,005 1,390 1,346
Other 870 1,236 981
Secured tax assets (*) 9,433 9,431 9,536
Tax losses 1,212 1,111 965
Total 16,888 18,245 17,779
Tax Liabilities
Current tax liabilities 1,114 1,276 1,238
Deferred tax liabilities 2,184 3,392 3,415
Financial Instruments 1,427 1,794 1,907
Charge for income tax and other taxes 757 1,598 1,508
Total 3,298 4,668 4,653
(*) Laws guaranteeing the deferred tax assets have been approved in Spain and Portugal in 2013 and 2014.
At the end of year 2017, certain fiscal reforms have taken place in some countries where the Group operates,
specifically in the United States, Turkey and Argentina, that will come into force as of January 1, 2018. The
main changes are the modification of the tax rates applied for year 2018 but this effect has consequences in
the valuation of the deferred tax assets and liabilities at December 2017.The most significant variations of the
deferred assets and liabilities in the years 2017, 2016 and 2015 derived from the followings causes:
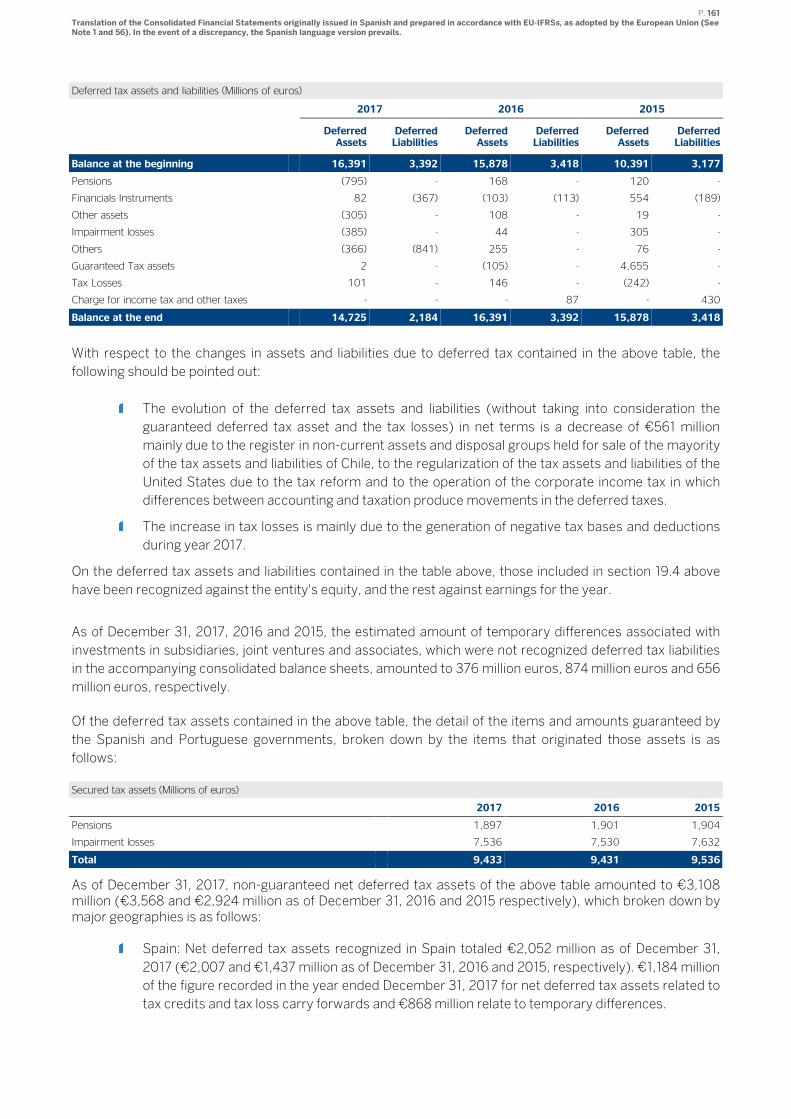
P. 161 Translation of the Consolidated Financial Statements originally issued in Spanish and prepared in accordance with EU-IFRSs, as adopted by the European Union (See Note 1 and 56). In the event of a discrepancy, the Spanish language version prevails.
Deferred tax assets and liabilities (Millions of euros)
2017 2016 2015
Deferred Assets
Deferred Liabilities
Deferred Assets
Deferred Liabilities
Deferred Assets
Deferred Liabilities
Balance at the beginning 16,391 3,392 15,878 3,418 10,391 3,177
Pensions (795) - 168 - 120 -
Financials Instruments 82 (367) (103) (113) 554 (189)
Other assets (305) - 108 - 19 -
Impairment losses (385) - 44 - 305 -
Others (366) (841) 255 - 76 -
Guaranteed Tax assets 2 - (105) - 4,655 -
Tax Losses 101 - 146 - (242) -
Charge for income tax and other taxes - - - 87 - 430
Balance at the end 14,725 2,184 16,391 3,392 15,878 3,418
With respect to the changes in assets and liabilities due to deferred tax contained in the above table, the
following should be pointed out:
The evolution of the deferred tax assets and liabilities (without taking into consideration the
guaranteed deferred tax asset and the tax losses) in net terms is a decrease of €561 million
mainly due to the register in non-current assets and disposal groups held for sale of the mayority
of the tax assets and liabilities of Chile, to the regularization of the tax assets and liabilities of the
United States due to the tax reform and to the operation of the corporate income tax in which
differences between accounting and taxation produce movements in the deferred taxes.
The increase in tax losses is mainly due to the generation of negative tax bases and deductions
during year 2017.
On the deferred tax assets and liabilities contained in the table above, those included in section 19.4 above
have been recognized against the entity's equity, and the rest against earnings for the year.
As of December 31, 2017, 2016 and 2015, the estimated amount of temporary differences associated with
investments in subsidiaries, joint ventures and associates, which were not recognized deferred tax liabilities
in the accompanying consolidated balance sheets, amounted to 376 million euros, 874 million euros and 656
million euros, respectively.
Of the deferred tax assets contained in the above table, the detail of the items and amounts guaranteed by
the Spanish and Portuguese governments, broken down by the items that originated those assets is as
follows:
Secured tax assets (Millions of euros)
2017 2016 2015
Pensions 1,897 1,901 1,904
Impairment losses 7,536 7,530 7,632
Total 9,433 9,431 9,536
As of December 31, 2017, non-guaranteed net deferred tax assets of the above table amounted to €3,108 million (€3,568 and €2,924 million as of December 31, 2016 and 2015 respectively), which broken down by major geographies is as follows:
Spain: Net deferred tax assets recognized in Spain totaled €2,052 million as of December 31,
2017 (€2,007 and €1,437 million as of December 31, 2016 and 2015, respectively). €1,184 million
of the figure recorded in the year ended December 31, 2017 for net deferred tax assets related to
tax credits and tax loss carry forwards and €868 million relate to temporary differences.
P. 162 Translation of the Consolidated Financial Statements originally issued in Spanish and prepared in accordance with EU-IFRSs, as adopted by the European Union (See Note 1 and 56). In the event of a discrepancy, the Spanish language version prevails.
Mexico: Net deferred tax assets recognized in Mexico amounted to €615 million as of December
31, 2017 (€698 and €608 million as of December 31, 2016 and 2015, respectively). 98,24% of
deferred tax assets as of December 31, 2017 relate to temporary differences. The remainders are
tax credits carry forwards.
South America: Net deferred tax assets recognized in South America amounted to €26 million as
of December 31, 2017 (€362 and €330 million as of December 31, 2016 and 2015, respectively).
All the deferred tax assets relate to temporary differences.
The United States: Net deferred tax assets recognized in The United States amounted to €180
million as of December 31, 2017 (€345 and €300 million as of December 31, 2016 and 2015,
respectively). All the deferred tax assets relate to temporary differences.
Turkey: Net deferred tax assets recognized in Turkey amounted to €224 million as of December
31, 2017 (€135 and €217 million as of December 31, 2016 and 2015 respectively). As of
December 31, 2017, all the deferred tax assets correspond to €13 million of tax credits related to
tax losses carry forwards and deductions and €211 million relate to temporary differences.
Based on the information available as of December 31, 2017, including historical levels of benefits and
projected results available to the Group for the coming years, it is considered that sufficient taxable income
will be generated for the recovery of above mentioned unsecured deferred tax assets when they become
deductible according to the tax laws.
On the other hand, the Group has not recognized certain deductible temporary differences, negative tax
bases and deductions for which, in general, there is no legal period for offsetting, amounting to
approximately 2,284 million euros, which are mainly originated by Catalunya Banc.
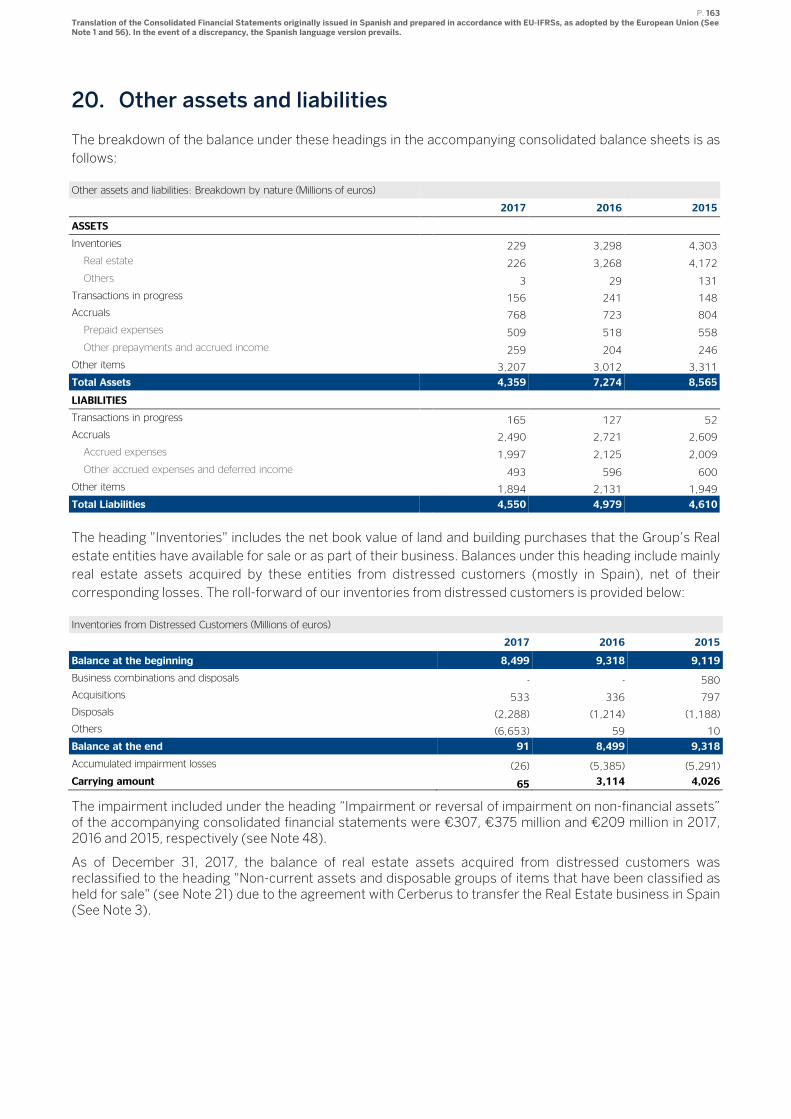
P. 163 Translation of the Consolidated Financial Statements originally issued in Spanish and prepared in accordance with EU-IFRSs, as adopted by the European Union (See Note 1 and 56). In the event of a discrepancy, the Spanish language version prevails.
20. Other assets and liabilities
The breakdown of the balance under these headings in the accompanying consolidated balance sheets is as
follows:
Other assets and liabilities: Breakdown by nature (Millions of euros)
2017 2016 2015
ASSETS
Inventories 229 3,298 4,303
Real estate 226 3,268 4,172
Others 3 29 131
Transactions in progress 156 241 148
Accruals 768 723 804
Prepaid expenses 509 518 558
Other prepayments and accrued income 259 204 246
Other items 3,207 3,012 3,311
Total Assets 4,359 7,274 8,565
LIABILITIES
Transactions in progress 165 127 52
Accruals 2,490 2,721 2,609
Accrued expenses 1,997 2,125 2,009
Other accrued expenses and deferred income 493 596 600
Other items 1,894 2,131 1,949
Total Liabilities 4,550 4,979 4,610
The heading "Inventories" includes the net book value of land and building purchases that the Group’s Real
estate entities have available for sale or as part of their business. Balances under this heading include mainly
real estate assets acquired by these entities from distressed customers (mostly in Spain), net of their
corresponding losses. The roll-forward of our inventories from distressed customers is provided below:
Inventories from Distressed Customers (Millions of euros)
2017 2016 2015
Balance at the beginning 8,499 9,318 9,119
Business combinations and disposals - - 580
Acquisitions 533 336 797
Disposals (2,288) (1,214) (1,188)
Others (6,653) 59 10
Balance at the end 91 8,499 9,318
Accumulated impairment losses (26) (5,385) (5,291)
Carrying amount 65 3,114 4,026
The impairment included under the heading “Impairment or reversal of impairment on non-financial assets” of the accompanying consolidated financial statements were €307, €375 million and €209 million in 2017, 2016 and 2015, respectively (see Note 48).
As of December 31, 2017, the balance of real estate assets acquired from distressed customers was reclassified to the heading "Non-current assets and disposable groups of items that have been classified as held for sale" (see Note 21) due to the agreement with Cerberus to transfer the Real Estate business in Spain (See Note 3).
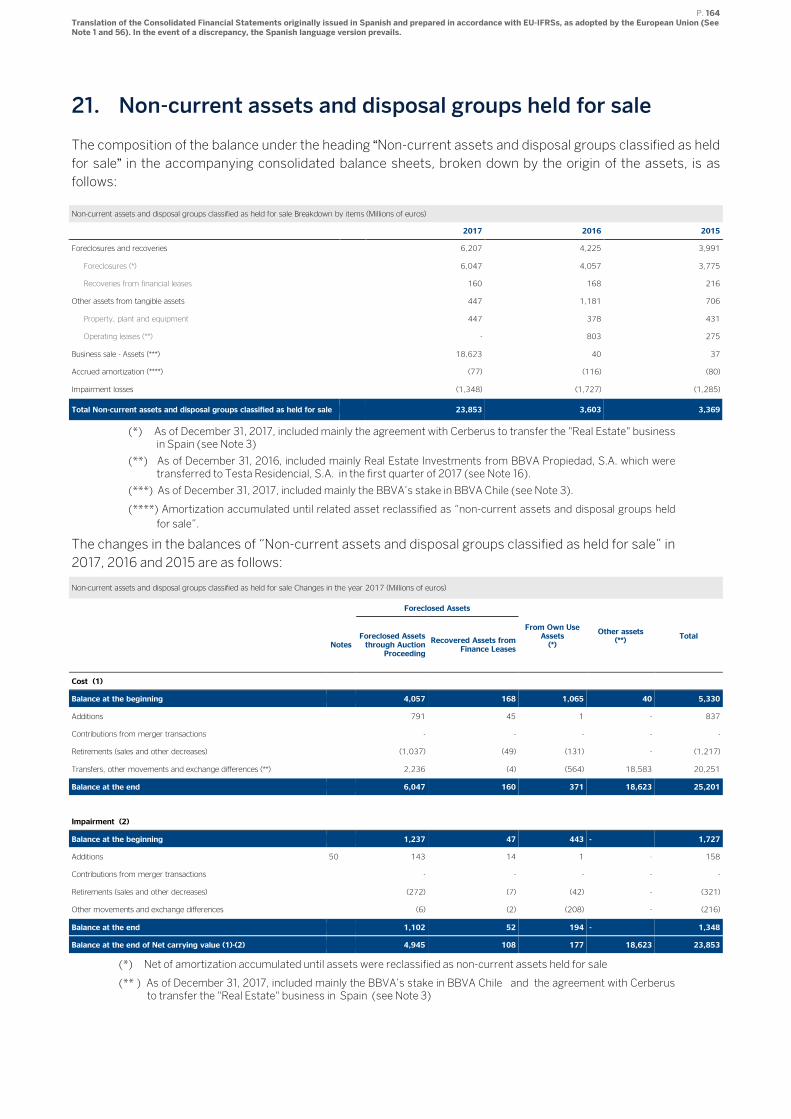
P. 164 Translation of the Consolidated Financial Statements originally issued in Spanish and prepared in accordance with EU-IFRSs, as adopted by the European Union (See Note 1 and 56). In the event of a discrepancy, the Spanish language version prevails.
21. Non-current assets and disposal groups held for sale
The composition of the balance under the heading “Non-current assets and disposal groups classified as held
for sale” in the accompanying consolidated balance sheets, broken down by the origin of the assets, is as
follows:
Non-current assets and disposal groups classified as held for sale Breakdown by items (Millions of euros)
2017 2016 2015
Foreclosures and recoveries 6,207 4,225 3,991
Foreclosures (*) 6,047 4,057 3,775
Recoveries from financial leases 160 168 216
Other assets from tangible assets 447 1,181 706
Property, plant and equipment 447 378 431
Operating leases (**) - 803 275
Business sale - Assets (***) 18,623 40 37
Accrued amortization (****) (77) (116) (80)
Impairment losses (1,348) (1,727) (1,285)
Total Non-current assets and disposal groups classified as held for sale 23,853 3,603 3,369
(*) As of December 31, 2017, included mainly the agreement with Cerberus to transfer the "Real Estate" business in Spain (see Note 3)
(**) As of December 31, 2016, included mainly Real Estate Investments from BBVA Propiedad, S.A. which were transferred to Testa Residencial, S.A. in the first quarter of 2017 (see Note 16).
(***) As of December 31, 2017, included mainly the BBVA’s stake in BBVA Chile (see Note 3).
(****) Amortization accumulated until related asset reclassified as “non-current assets and disposal groups held
for sale”.
The changes in the balances of “Non-current assets and disposal groups classified as held for sale” in
2017, 2016 and 2015 are as follows:
Non-current assets and disposal groups classified as held for sale Changes in the year 2017 (Millions of euros)
Foreclosed Assets
From Own Use Assets (*)
Other assets (**)
Total Notes
Foreclosed Assets through Auction
Proceeding
Recovered Assets from Finance Leases
Cost (1)
Balance at the beginning 4,057 168 1,065 40 5,330
Additions 791 45 1 - 837
Contributions from merger transactions - - - - -
Retirements (sales and other decreases) (1,037) (49) (131) - (1,217)
Transfers, other movements and exchange differences (**) 2,236 (4) (564) 18,583 20,251
Balance at the end 6,047 160 371 18,623 25,201
Impairment (2)
Balance at the beginning 1,237 47 443 - 1,727
Additions 50 143 14 1 - 158
Contributions from merger transactions - - - - -
Retirements (sales and other decreases) (272) (7) (42) - (321)
Other movements and exchange differences (6) (2) (208) - (216)
Balance at the end 1,102 52 194 - 1,348
Balance at the end of Net carrying value (1)-(2) 4,945 108 177 18,623 23,853
(*) Net of amortization accumulated until assets were reclassified as non-current assets held for sale
(** ) As of December 31, 2017, included mainly the BBVA’s stake in BBVA Chile and the agreement with Cerberus to transfer the "Real Estate" business in Spain (see Note 3)
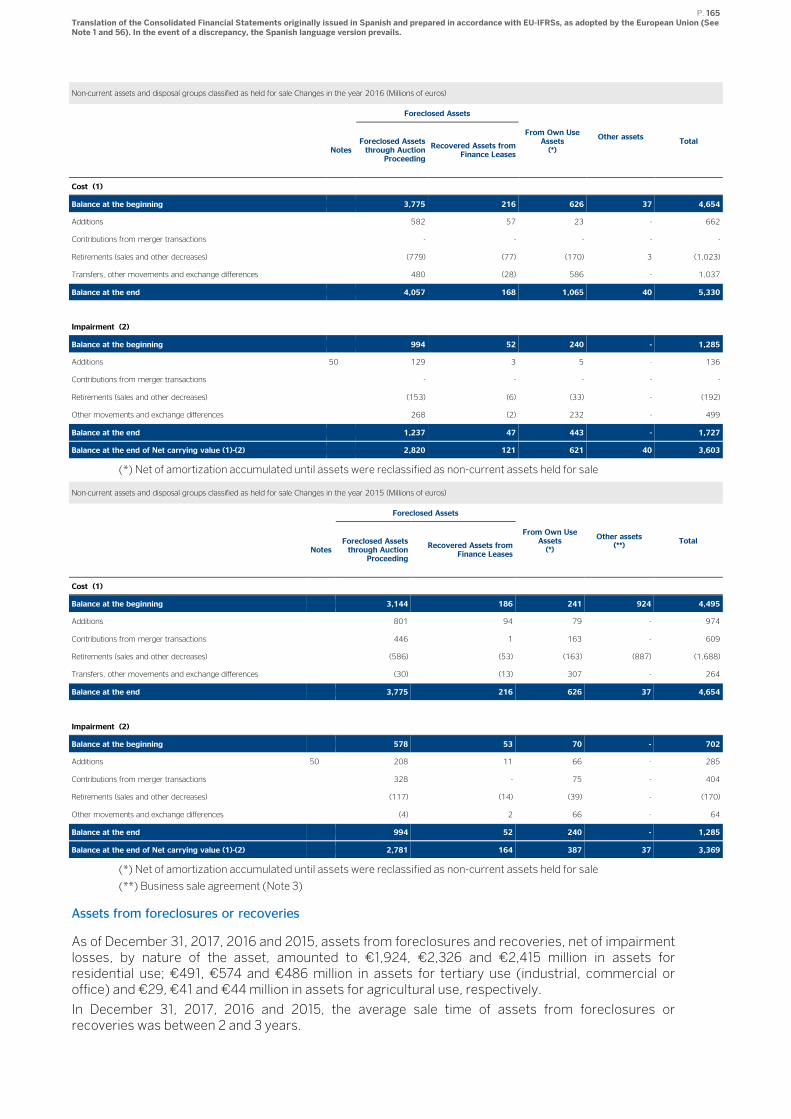
P. 165 Translation of the Consolidated Financial Statements originally issued in Spanish and prepared in accordance with EU-IFRSs, as adopted by the European Union (See Note 1 and 56). In the event of a discrepancy, the Spanish language version prevails.
Non-current assets and disposal groups classified as held for sale Changes in the year 2016 (Millions of euros)
Foreclosed Assets
From Own Use Assets (*)
Other assets
Total Notes
Foreclosed Assets through Auction
Proceeding
Recovered Assets from Finance Leases
Cost (1)
Balance at the beginning 3,775 216 626 37 4,654
Additions 582 57 23 - 662
Contributions from merger transactions - - - - -
Retirements (sales and other decreases) (779) (77) (170) 3 (1,023)
Transfers, other movements and exchange differences 480 (28) 586 - 1,037
Balance at the end 4,057 168 1,065 40 5,330
Impairment (2)
Balance at the beginning 994 52 240 - 1,285
Additions 50 129 3 5 - 136
Contributions from merger transactions - - - - -
Retirements (sales and other decreases) (153) (6) (33) - (192)
Other movements and exchange differences 268 (2) 232 - 499
Balance at the end 1,237 47 443 - 1,727
Balance at the end of Net carrying value (1)-(2) 2,820 121 621 40 3,603
(*) Net of amortization accumulated until assets were reclassified as non-current assets held for sale
Non-current assets and disposal groups classified as held for sale Changes in the year 2015 (Millions of euros)
Foreclosed Assets
From Own Use Assets (*)
Other assets (**)
Total Notes
Foreclosed Assets through Auction
Proceeding
Recovered Assets from Finance Leases
Cost (1)
Balance at the beginning 3,144 186 241 924 4,495
Additions 801 94 79 - 974
Contributions from merger transactions 446 1 163 - 609
Retirements (sales and other decreases) (586) (53) (163) (887) (1,688)
Transfers, other movements and exchange differences (30) (13) 307 - 264
Balance at the end 3,775 216 626 37 4,654
Impairment (2)
Balance at the beginning 578 53 70 - 702
Additions 50 208 11 66 - 285
Contributions from merger transactions 328 - 75 - 404
Retirements (sales and other decreases) (117) (14) (39) - (170)
Other movements and exchange differences (4) 2 66 - 64
Balance at the end 994 52 240 - 1,285
Balance at the end of Net carrying value (1)-(2) 2,781 164 387 37 3,369
(*) Net of amortization accumulated until assets were reclassified as non-current assets held for sale
(**) Business sale agreement (Note 3)
Assets from foreclosures or recoveries
As of December 31, 2017, 2016 and 2015, assets from foreclosures and recoveries, net of impairment losses, by nature of the asset, amounted to €1,924, €2,326 and €2,415 million in assets for residential use; €491, €574 and €486 million in assets for tertiary use (industrial, commercial or office) and €29, €41 and €44 million in assets for agricultural use, respectively.
In December 31, 2017, 2016 and 2015, the average sale time of assets from foreclosures or recoveries was between 2 and 3 years.
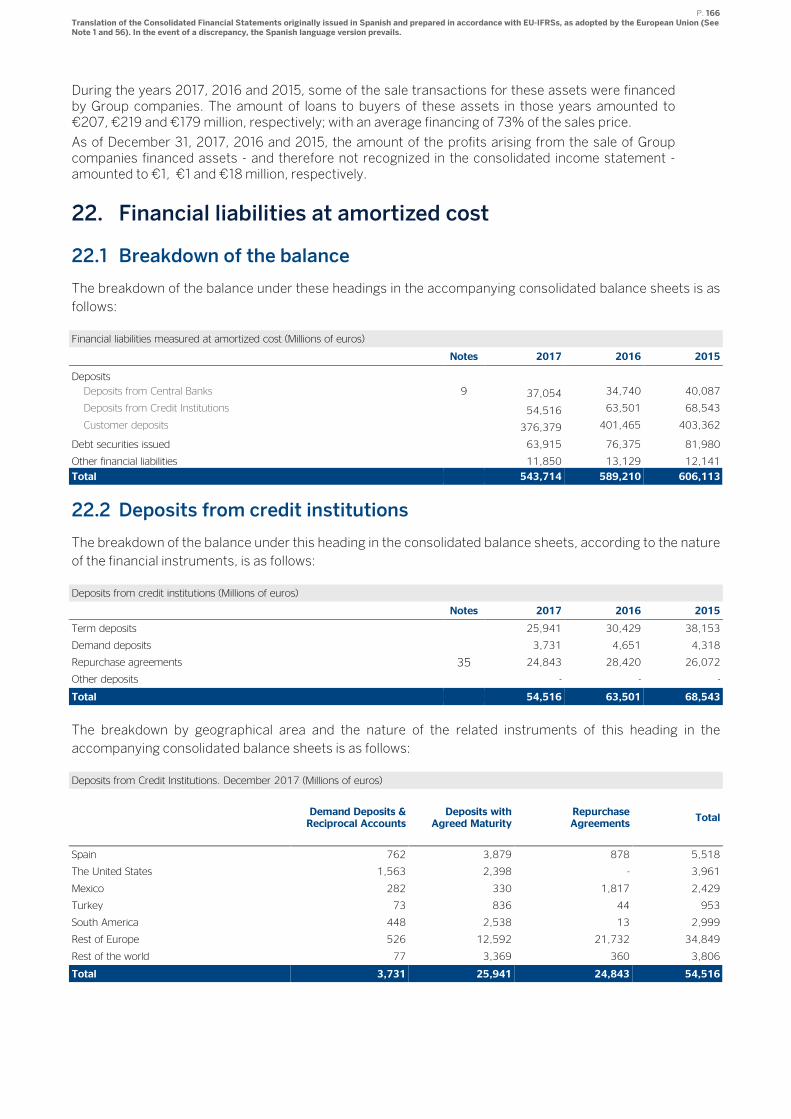
P. 166 Translation of the Consolidated Financial Statements originally issued in Spanish and prepared in accordance with EU-IFRSs, as adopted by the European Union (See Note 1 and 56). In the event of a discrepancy, the Spanish language version prevails.
During the years 2017, 2016 and 2015, some of the sale transactions for these assets were financed by Group companies. The amount of loans to buyers of these assets in those years amounted to €207, €219 and €179 million, respectively; with an average financing of 73% of the sales price.
As of December 31, 2017, 2016 and 2015, the amount of the profits arising from the sale of Group companies financed assets - and therefore not recognized in the consolidated income statement - amounted to €1, €1 and €18 million, respectively.
22. Financial liabilities at amortized cost
22.1 Breakdown of the balance
The breakdown of the balance under these headings in the accompanying consolidated balance sheets is as
follows:
Financial liabilities measured at amortized cost (Millions of euros)
Notes 2017 2016 2015
Deposits
Deposits from Central Banks 9 37,054 34,740 40,087
Deposits from Credit Institutions 54,516 63,501 68,543
Customer deposits 376,379 401,465 403,362
Debt securities issued 63,915 76,375 81,980
Other financial liabilities 11,850 13,129 12,141
Total 543,714 589,210 606,113
22.2 Deposits from credit institutions
The breakdown of the balance under this heading in the consolidated balance sheets, according to the nature
of the financial instruments, is as follows:
Deposits from credit institutions (Millions of euros)
Notes 2017 2016 2015
Term deposits 25,941 30,429 38,153
Demand deposits 3,731 4,651 4,318
Repurchase agreements 35 24,843 28,420 26,072
Other deposits - - -
Total 54,516 63,501 68,543
The breakdown by geographical area and the nature of the related instruments of this heading in the
accompanying consolidated balance sheets is as follows:
Deposits from Credit Institutions. December 2017 (Millions of euros)
Demand Deposits & Reciprocal Accounts
Deposits with Agreed Maturity
Repurchase Agreements
Total
Spain 762 3,879 878 5,518
The United States 1,563 2,398 - 3,961
Mexico 282 330 1,817 2,429
Turkey 73 836 44 953
South America 448 2,538 13 2,999
Rest of Europe 526 12,592 21,732 34,849
Rest of the world 77 3,369 360 3,806
Total 3,731 25,941 24,843 54,516
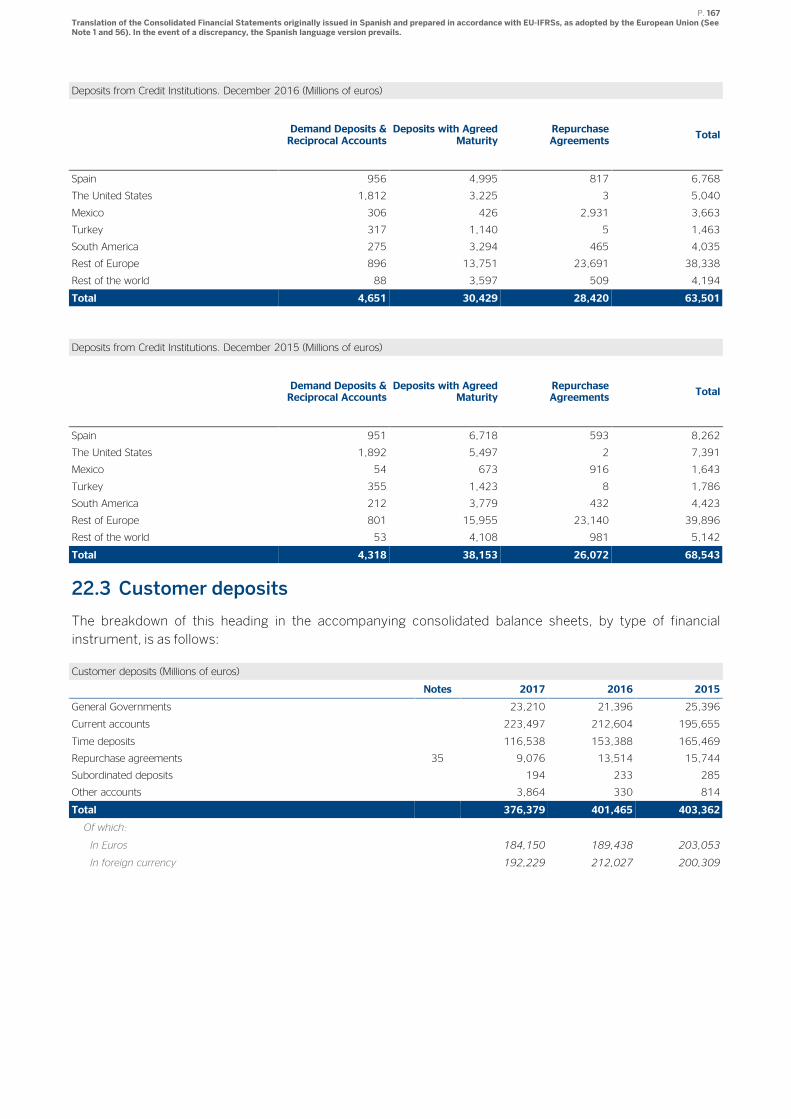
P. 167 Translation of the Consolidated Financial Statements originally issued in Spanish and prepared in accordance with EU-IFRSs, as adopted by the European Union (See Note 1 and 56). In the event of a discrepancy, the Spanish language version prevails.
Deposits from Credit Institutions. December 2016 (Millions of euros)
Demand Deposits & Reciprocal Accounts
Deposits with Agreed Maturity
Repurchase Agreements
Total
Spain 956 4,995 817 6,768
The United States 1,812 3,225 3 5,040
Mexico 306 426 2,931 3,663
Turkey 317 1,140 5 1,463
South America 275 3,294 465 4,035
Rest of Europe 896 13,751 23,691 38,338
Rest of the world 88 3,597 509 4,194
Total 4,651 30,429 28,420 63,501
Deposits from Credit Institutions. December 2015 (Millions of euros)
Demand Deposits & Reciprocal Accounts
Deposits with Agreed Maturity
Repurchase Agreements
Total
Spain 951 6,718 593 8,262
The United States 1,892 5,497 2 7,391
Mexico 54 673 916 1,643
Turkey 355 1,423 8 1,786
South America 212 3,779 432 4,423
Rest of Europe 801 15,955 23,140 39,896
Rest of the world 53 4,108 981 5,142
Total 4,318 38,153 26,072 68,543
22.3 Customer deposits
The breakdown of this heading in the accompanying consolidated balance sheets, by type of financial
instrument, is as follows:
Customer deposits (Millions of euros)
Notes 2017 2016 2015
General Governments 23,210 21,396 25,396
Current accounts 223,497 212,604 195,655
Time deposits 116,538 153,388 165,469
Repurchase agreements 35 9,076 13,514 15,744
Subordinated deposits 194 233 285
Other accounts 3,864 330 814
Total 376,379 401,465 403,362
Of which:
In Euros 184,150 189,438 203,053
In foreign currency 192,229 212,027 200,309
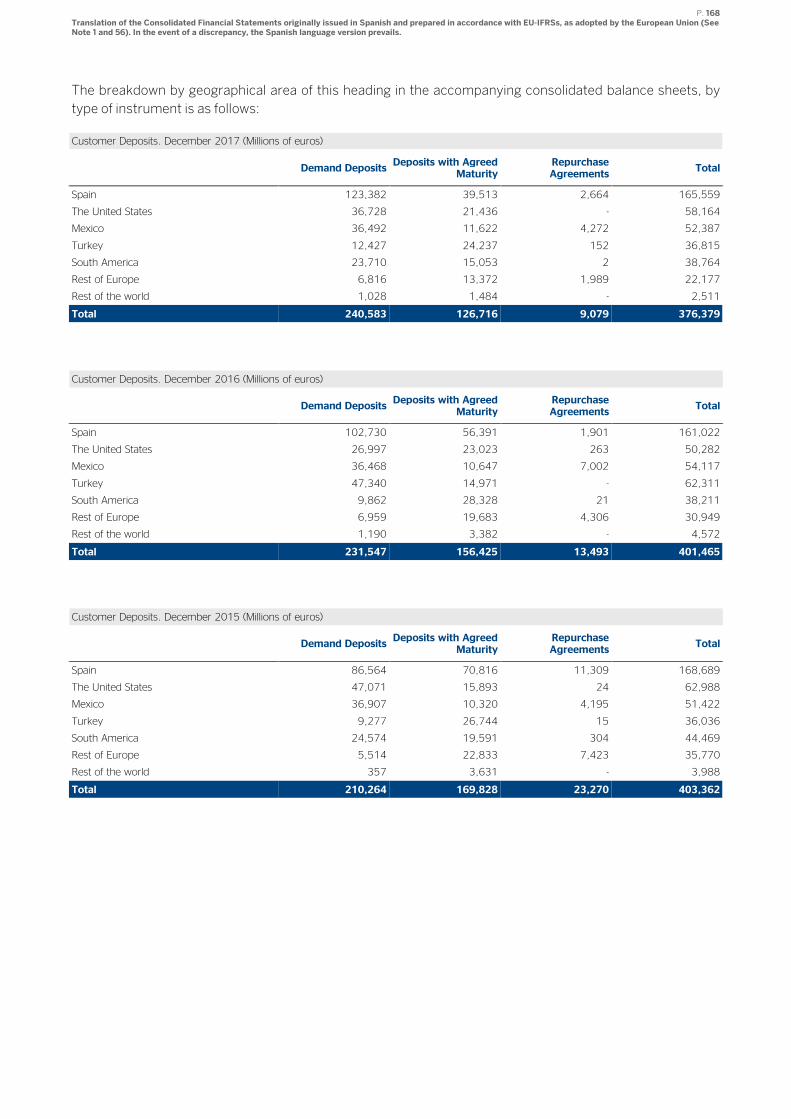
P. 168 Translation of the Consolidated Financial Statements originally issued in Spanish and prepared in accordance with EU-IFRSs, as adopted by the European Union (See Note 1 and 56). In the event of a discrepancy, the Spanish language version prevails.
The breakdown by geographical area of this heading in the accompanying consolidated balance sheets, by
type of instrument is as follows:
Customer Deposits. December 2017 (Millions of euros)
Demand Deposits Deposits with Agreed
Maturity Repurchase Agreements
Total
Spain 123,382 39,513 2,664 165,559
The United States 36,728 21,436 - 58,164
Mexico 36,492 11,622 4,272 52,387
Turkey 12,427 24,237 152 36,815
South America 23,710 15,053 2 38,764
Rest of Europe 6,816 13,372 1,989 22,177
Rest of the world 1,028 1,484 - 2,511
Total 240,583 126,716 9,079 376,379
Customer Deposits. December 2016 (Millions of euros)
Demand Deposits Deposits with Agreed
Maturity Repurchase Agreements
Total
Spain 102,730 56,391 1,901 161,022
The United States 26,997 23,023 263 50,282
Mexico 36,468 10,647 7,002 54,117
Turkey 47,340 14,971 - 62,311
South America 9,862 28,328 21 38,211
Rest of Europe 6,959 19,683 4,306 30,949
Rest of the world 1,190 3,382 - 4,572
Total 231,547 156,425 13,493 401,465
Customer Deposits. December 2015 (Millions of euros)
Demand Deposits Deposits with Agreed
Maturity Repurchase Agreements
Total
Spain 86,564 70,816 11,309 168,689
The United States 47,071 15,893 24 62,988
Mexico 36,907 10,320 4,195 51,422
Turkey 9,277 26,744 15 36,036
South America 24,574 19,591 304 44,469
Rest of Europe 5,514 22,833 7,423 35,770
Rest of the world 357 3,631 - 3,988
Total 210,264 169,828 23,270 403,362
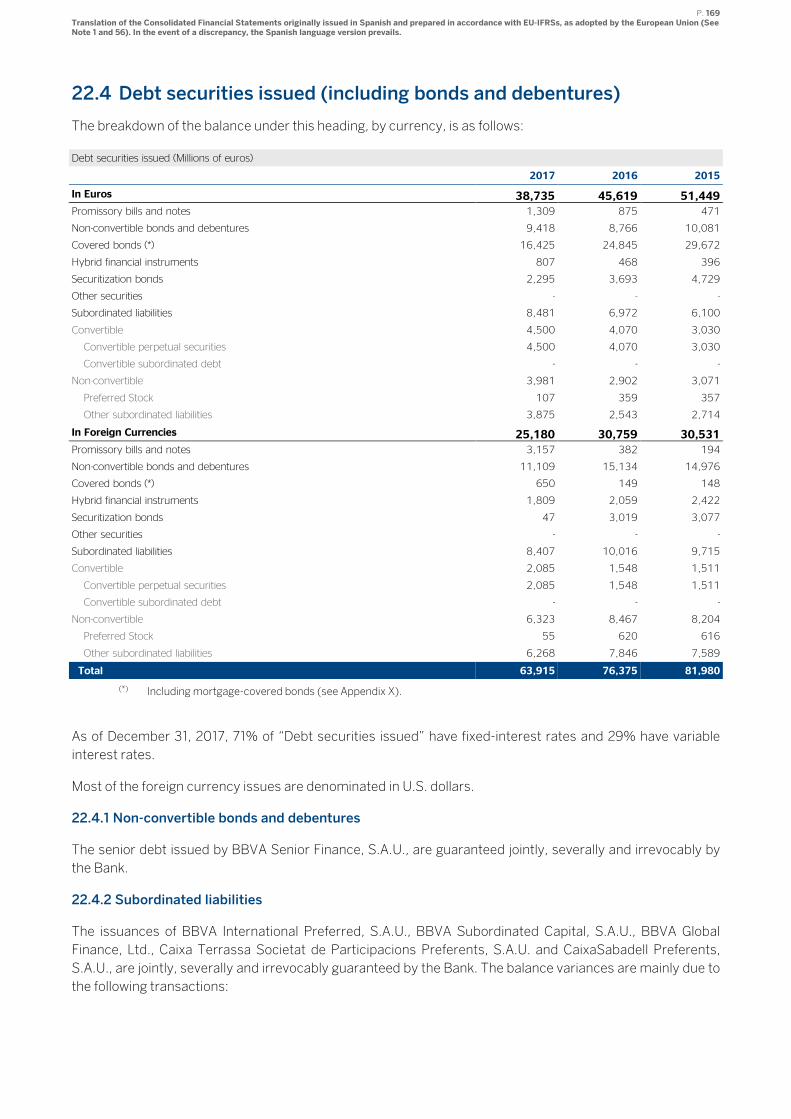
P. 169 Translation of the Consolidated Financial Statements originally issued in Spanish and prepared in accordance with EU-IFRSs, as adopted by the European Union (See Note 1 and 56). In the event of a discrepancy, the Spanish language version prevails.
22.4 Debt securities issued (including bonds and debentures)
The breakdown of the balance under this heading, by currency, is as follows:
Debt securities issued (Millions of euros)
2017 2016 2015
In Euros 38,735 45,619 51,449
Promissory bills and notes 1,309 875 471
Non-convertible bonds and debentures 9,418 8,766 10,081
Covered bonds (*) 16,425 24,845 29,672
Hybrid financial instruments 807 468 396
Securitization bonds 2,295 3,693 4,729
Other securities - - -
Subordinated liabilities 8,481 6,972 6,100
Convertible 4,500 4,070 3,030
Convertible perpetual securities 4,500 4,070 3,030
Convertible subordinated debt - - -
Non-convertible 3,981 2,902 3,071
Preferred Stock 107 359 357
Other subordinated liabilities 3,875 2,543 2,714
In Foreign Currencies 25,180 30,759 30,531
Promissory bills and notes 3,157 382 194
Non-convertible bonds and debentures 11,109 15,134 14,976
Covered bonds (*) 650 149 148
Hybrid financial instruments 1,809 2,059 2,422
Securitization bonds 47 3,019 3,077
Other securities - - -
Subordinated liabilities 8,407 10,016 9,715
Convertible 2,085 1,548 1,511
Convertible perpetual securities 2,085 1,548 1,511
Convertible subordinated debt - - -
Non-convertible 6,323 8,467 8,204
Preferred Stock 55 620 616
Other subordinated liabilities 6,268 7,846 7,589
Total 63,915 76,375 81,980
(*) Including mortgage-covered bonds (see Appendix X).
As of December 31, 2017, 71% of “Debt securities issued” have fixed-interest rates and 29% have variable
interest rates.
Most of the foreign currency issues are denominated in U.S. dollars.
22.4.1 Non-convertible bonds and debentures
The senior debt issued by BBVA Senior Finance, S.A.U., are guaranteed jointly, severally and irrevocably by
the Bank.
22.4.2 Subordinated liabilities
The issuances of BBVA International Preferred, S.A.U., BBVA Subordinated Capital, S.A.U., BBVA Global
Finance, Ltd., Caixa Terrassa Societat de Participacions Preferents, S.A.U. and CaixaSabadell Preferents,
S.A.U., are jointly, severally and irrevocably guaranteed by the Bank. The balance variances are mainly due to
the following transactions:
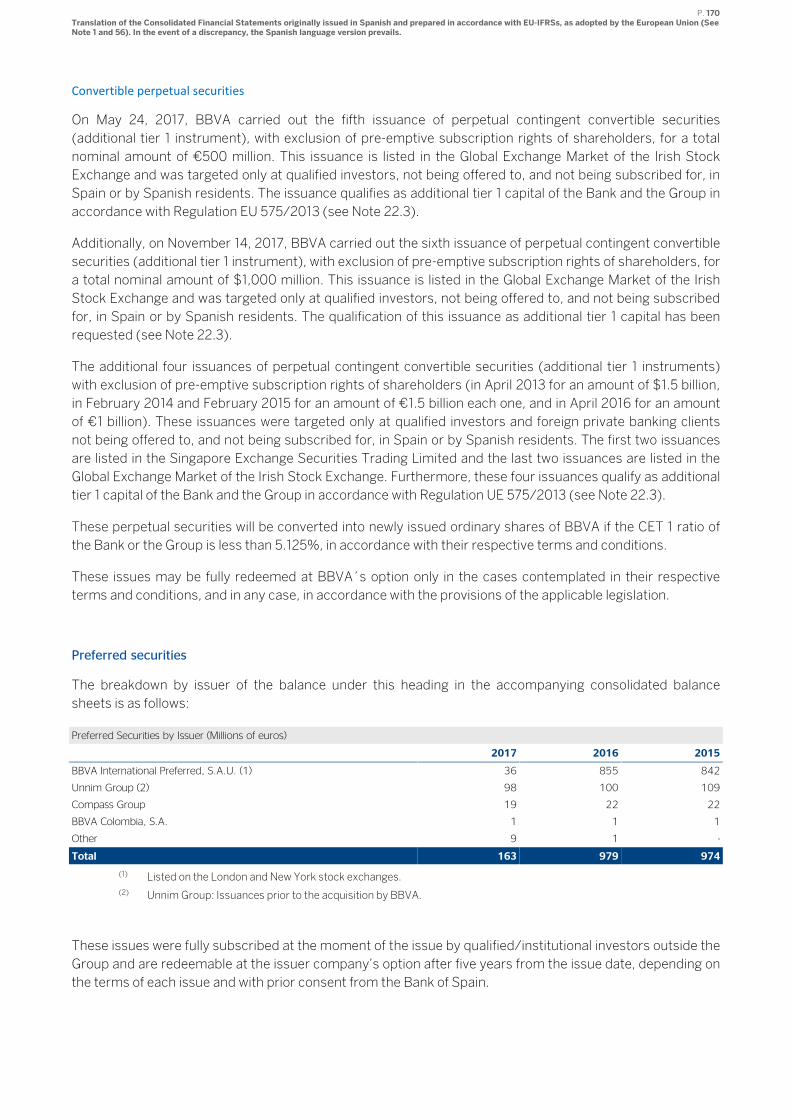
P. 170 Translation of the Consolidated Financial Statements originally issued in Spanish and prepared in accordance with EU-IFRSs, as adopted by the European Union (See Note 1 and 56). In the event of a discrepancy, the Spanish language version prevails.
Convertible perpetual securities
On May 24, 2017, BBVA carried out the fifth issuance of perpetual contingent convertible securities
(additional tier 1 instrument), with exclusion of pre-emptive subscription rights of shareholders, for a total
nominal amount of €500 million. This issuance is listed in the Global Exchange Market of the Irish Stock
Exchange and was targeted only at qualified investors, not being offered to, and not being subscribed for, in
Spain or by Spanish residents. The issuance qualifies as additional tier 1 capital of the Bank and the Group in
accordance with Regulation EU 575/2013 (see Note 22.3).
Additionally, on November 14, 2017, BBVA carried out the sixth issuance of perpetual contingent convertible
securities (additional tier 1 instrument), with exclusion of pre-emptive subscription rights of shareholders, for
a total nominal amount of $1,000 million. This issuance is listed in the Global Exchange Market of the Irish
Stock Exchange and was targeted only at qualified investors, not being offered to, and not being subscribed
for, in Spain or by Spanish residents. The qualification of this issuance as additional tier 1 capital has been
requested (see Note 22.3).
The additional four issuances of perpetual contingent convertible securities (additional tier 1 instruments)
with exclusion of pre-emptive subscription rights of shareholders (in April 2013 for an amount of $1.5 billion,
in February 2014 and February 2015 for an amount of €1.5 billion each one, and in April 2016 for an amount
of €1 billion). These issuances were targeted only at qualified investors and foreign private banking clients
not being offered to, and not being subscribed for, in Spain or by Spanish residents. The first two issuances
are listed in the Singapore Exchange Securities Trading Limited and the last two issuances are listed in the
Global Exchange Market of the Irish Stock Exchange. Furthermore, these four issuances qualify as additional
tier 1 capital of the Bank and the Group in accordance with Regulation UE 575/2013 (see Note 22.3).
These perpetual securities will be converted into newly issued ordinary shares of BBVA if the CET 1 ratio of
the Bank or the Group is less than 5.125%, in accordance with their respective terms and conditions.
These issues may be fully redeemed at BBVA´s option only in the cases contemplated in their respective
terms and conditions, and in any case, in accordance with the provisions of the applicable legislation.
Preferred securities
The breakdown by issuer of the balance under this heading in the accompanying consolidated balance
sheets is as follows:
Preferred Securities by Issuer (Millions of euros)
2017 2016 2015
BBVA International Preferred, S.A.U. (1) 36 855 842
Unnim Group (2) 98 100 109
Compass Group 19 22 22
BBVA Colombia, S.A. 1 1 1
Other 9 1 -
Total 163 979 974
(1) Listed on the London and New York stock exchanges.
(2) Unnim Group: Issuances prior to the acquisition by BBVA.
These issues were fully subscribed at the moment of the issue by qualified/institutional investors outside the
Group and are redeemable at the issuer company’s option after five years from the issue date, depending on
the terms of each issue and with prior consent from the Bank of Spain.
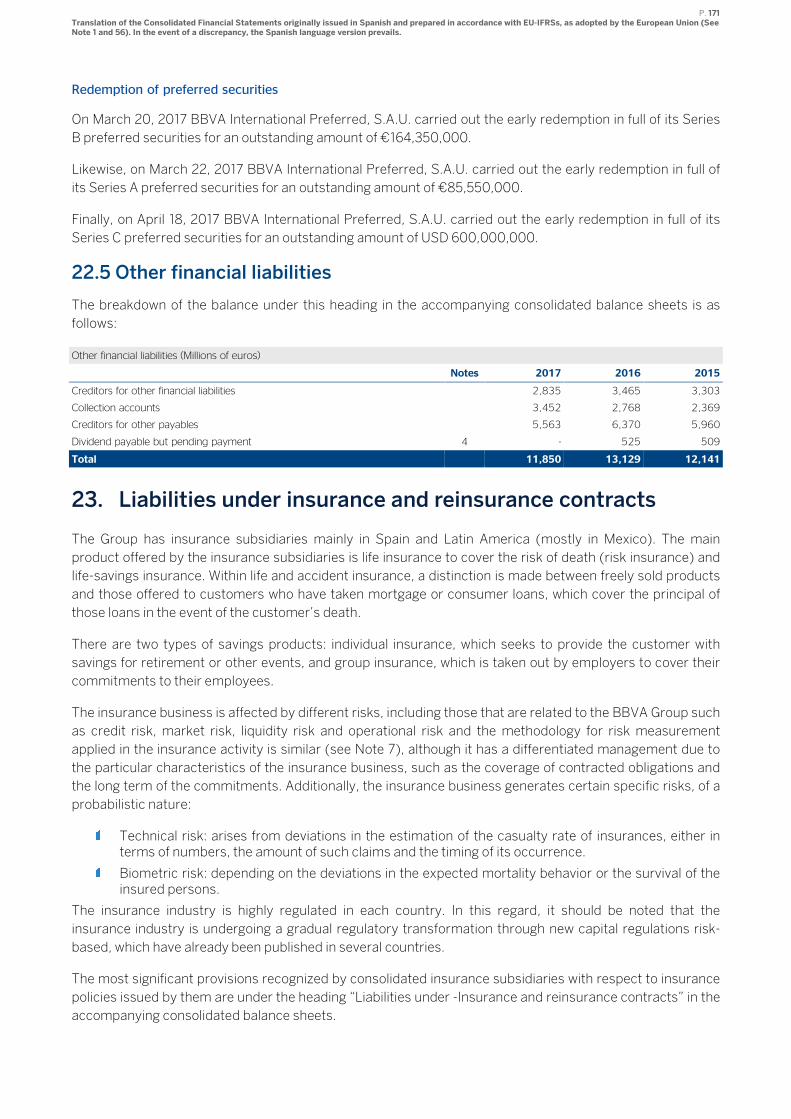
P. 171 Translation of the Consolidated Financial Statements originally issued in Spanish and prepared in accordance with EU-IFRSs, as adopted by the European Union (See Note 1 and 56). In the event of a discrepancy, the Spanish language version prevails.
Redemption of preferred securities
On March 20, 2017 BBVA International Preferred, S.A.U. carried out the early redemption in full of its Series
B preferred securities for an outstanding amount of €164,350,000.
Likewise, on March 22, 2017 BBVA International Preferred, S.A.U. carried out the early redemption in full of
its Series A preferred securities for an outstanding amount of €85,550,000.
Finally, on April 18, 2017 BBVA International Preferred, S.A.U. carried out the early redemption in full of its
Series C preferred securities for an outstanding amount of USD 600,000,000.
22.5 Other financial liabilities
The breakdown of the balance under this heading in the accompanying consolidated balance sheets is as
follows:
Other financial liabilities (Millions of euros)
Notes 2017 2016 2015
Creditors for other financial liabilities 2,835 3,465 3,303
Collection accounts 3,452 2,768 2,369
Creditors for other payables 5,563 6,370 5,960
Dividend payable but pending payment 4 - 525 509
Total 11,850 13,129 12,141
23. Liabilities under insurance and reinsurance contracts
The Group has insurance subsidiaries mainly in Spain and Latin America (mostly in Mexico). The main
product offered by the insurance subsidiaries is life insurance to cover the risk of death (risk insurance) and
life-savings insurance. Within life and accident insurance, a distinction is made between freely sold products
and those offered to customers who have taken mortgage or consumer loans, which cover the principal of
those loans in the event of the customer’s death.
There are two types of savings products: individual insurance, which seeks to provide the customer with
savings for retirement or other events, and group insurance, which is taken out by employers to cover their
commitments to their employees.
The insurance business is affected by different risks, including those that are related to the BBVA Group such
as credit risk, market risk, liquidity risk and operational risk and the methodology for risk measurement
applied in the insurance activity is similar (see Note 7), although it has a differentiated management due to
the particular characteristics of the insurance business, such as the coverage of contracted obligations and
the long term of the commitments. Additionally, the insurance business generates certain specific risks, of a
probabilistic nature:
Technical risk: arises from deviations in the estimation of the casualty rate of insurances, either in terms of numbers, the amount of such claims and the timing of its occurrence.
Biometric risk: depending on the deviations in the expected mortality behavior or the survival of the insured persons.
The insurance industry is highly regulated in each country. In this regard, it should be noted that the
insurance industry is undergoing a gradual regulatory transformation through new capital regulations risk-
based, which have already been published in several countries.
The most significant provisions recognized by consolidated insurance subsidiaries with respect to insurance
policies issued by them are under the heading “Liabilities under -Insurance and reinsurance contracts” in the
accompanying consolidated balance sheets.
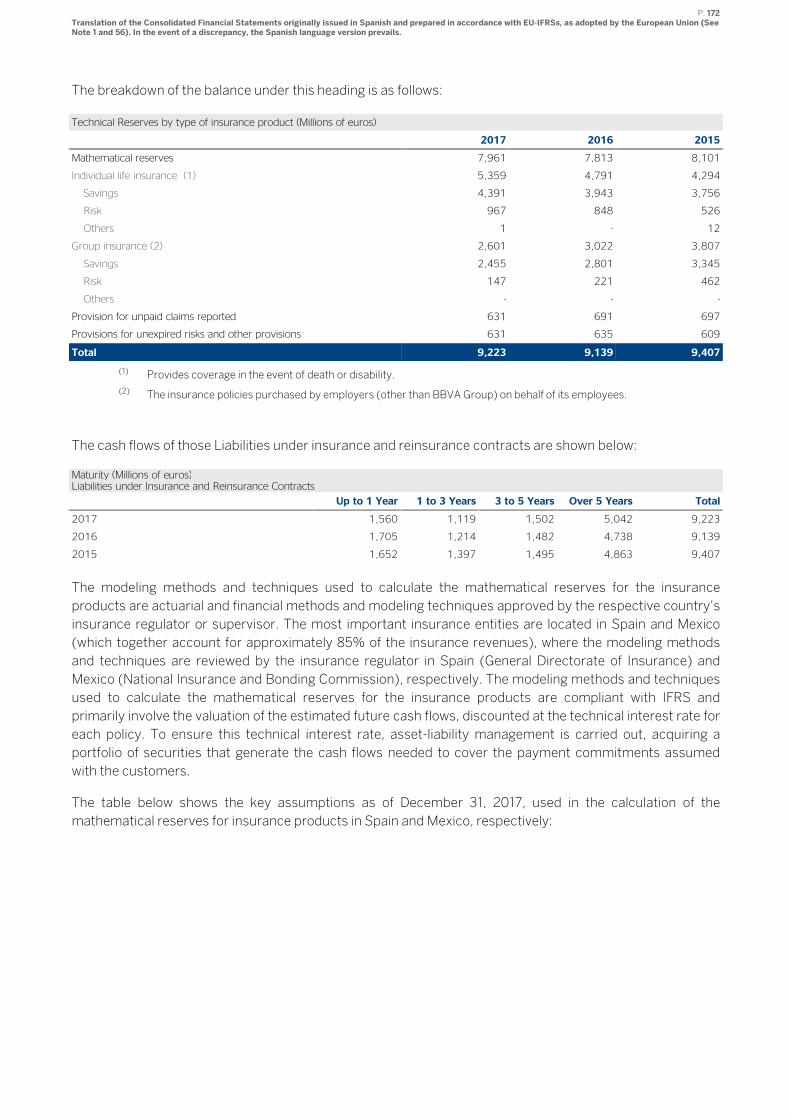
P. 172 Translation of the Consolidated Financial Statements originally issued in Spanish and prepared in accordance with EU-IFRSs, as adopted by the European Union (See Note 1 and 56). In the event of a discrepancy, the Spanish language version prevails.
The breakdown of the balance under this heading is as follows:
Technical Reserves by type of insurance product (Millions of euros)
2017 2016 2015
Mathematical reserves 7,961 7,813 8,101
Individual life insurance (1) 5,359 4,791 4,294
Savings 4,391 3,943 3,756
Risk 967 848 526
Others 1 - 12
Group insurance (2) 2,601 3,022 3,807
Savings 2,455 2,801 3,345
Risk 147 221 462
Others - - -
Provision for unpaid claims reported 631 691 697
Provisions for unexpired risks and other provisions 631 635 609
Total 9,223 9,139 9,407
(1) Provides coverage in the event of death or disability.
(2) The insurance policies purchased by employers (other than BBVA Group) on behalf of its employees.
The cash flows of those Liabilities under insurance and reinsurance contracts are shown below:
Maturity (Millions of euros) Liabilities under Insurance and Reinsurance Contracts
Up to 1 Year 1 to 3 Years 3 to 5 Years Over 5 Years Total
2017 1,560 1,119 1,502 5,042 9,223
2016 1,705 1,214 1,482 4,738 9,139
2015 1,652 1,397 1,495 4,863 9,407
The modeling methods and techniques used to calculate the mathematical reserves for the insurance
products are actuarial and financial methods and modeling techniques approved by the respective country’s
insurance regulator or supervisor. The most important insurance entities are located in Spain and Mexico
(which together account for approximately 85% of the insurance revenues), where the modeling methods
and techniques are reviewed by the insurance regulator in Spain (General Directorate of Insurance) and
Mexico (National Insurance and Bonding Commission), respectively. The modeling methods and techniques
used to calculate the mathematical reserves for the insurance products are compliant with IFRS and
primarily involve the valuation of the estimated future cash flows, discounted at the technical interest rate for
each policy. To ensure this technical interest rate, asset-liability management is carried out, acquiring a
portfolio of securities that generate the cash flows needed to cover the payment commitments assumed
with the customers.
The table below shows the key assumptions as of December 31, 2017, used in the calculation of the
mathematical reserves for insurance products in Spain and Mexico, respectively:
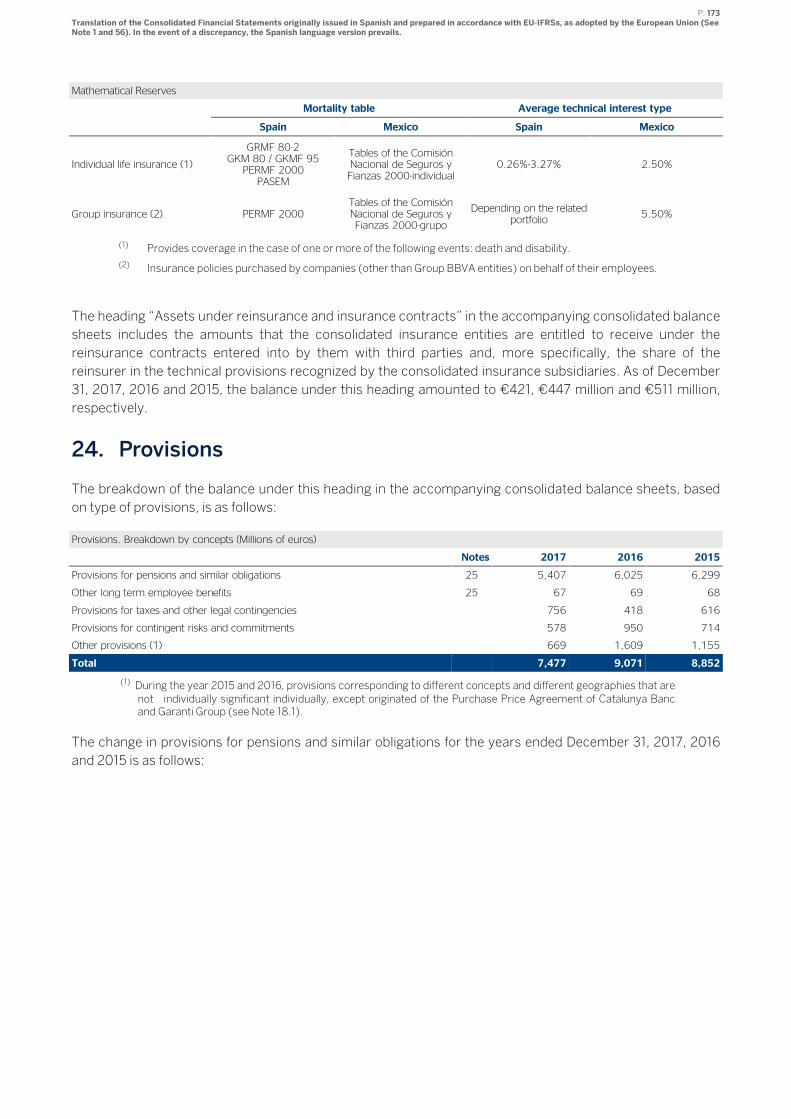
P. 173 Translation of the Consolidated Financial Statements originally issued in Spanish and prepared in accordance with EU-IFRSs, as adopted by the European Union (See Note 1 and 56). In the event of a discrepancy, the Spanish language version prevails.
Mathematical Reserves
Mortality table Average technical interest type
Spain Mexico Spain Mexico
Individual life insurance (1)
GRMF 80-2 GKM 80 / GKMF 95
PERMF 2000 PASEM
Tables of the Comisión Nacional de Seguros y
Fianzas 2000-individual 0.26%-3.27% 2.50%
Group insurance (2) PERMF 2000 Tables of the Comisión Nacional de Seguros y
Fianzas 2000-grupo
Depending on the related portfolio
5.50%
(1) Provides coverage in the case of one or more of the following events: death and disability.
(2) Insurance policies purchased by companies (other than Group BBVA entities) on behalf of their employees.
The heading “Assets under reinsurance and insurance contracts” in the accompanying consolidated balance
sheets includes the amounts that the consolidated insurance entities are entitled to receive under the
reinsurance contracts entered into by them with third parties and, more specifically, the share of the
reinsurer in the technical provisions recognized by the consolidated insurance subsidiaries. As of December
31, 2017, 2016 and 2015, the balance under this heading amounted to €421, €447 million and €511 million,
respectively.
24. Provisions
The breakdown of the balance under this heading in the accompanying consolidated balance sheets, based
on type of provisions, is as follows:
Provisions. Breakdown by concepts (Millions of euros)
Notes 2017 2016 2015
Provisions for pensions and similar obligations 25 5,407 6,025 6,299
Other long term employee benefits 25 67 69 68
Provisions for taxes and other legal contingencies 756 418 616
Provisions for contingent risks and commitments 578 950 714
Other provisions (1) 669 1,609 1,155
Total 7,477 9,071 8,852
(1) During the year 2015 and 2016, provisions corresponding to different concepts and different geographies that are not individually significant individually, except originated of the Purchase Price Agreement of Catalunya Banc and Garanti Group (see Note 18.1).
The change in provisions for pensions and similar obligations for the years ended December 31, 2017, 2016
and 2015 is as follows:
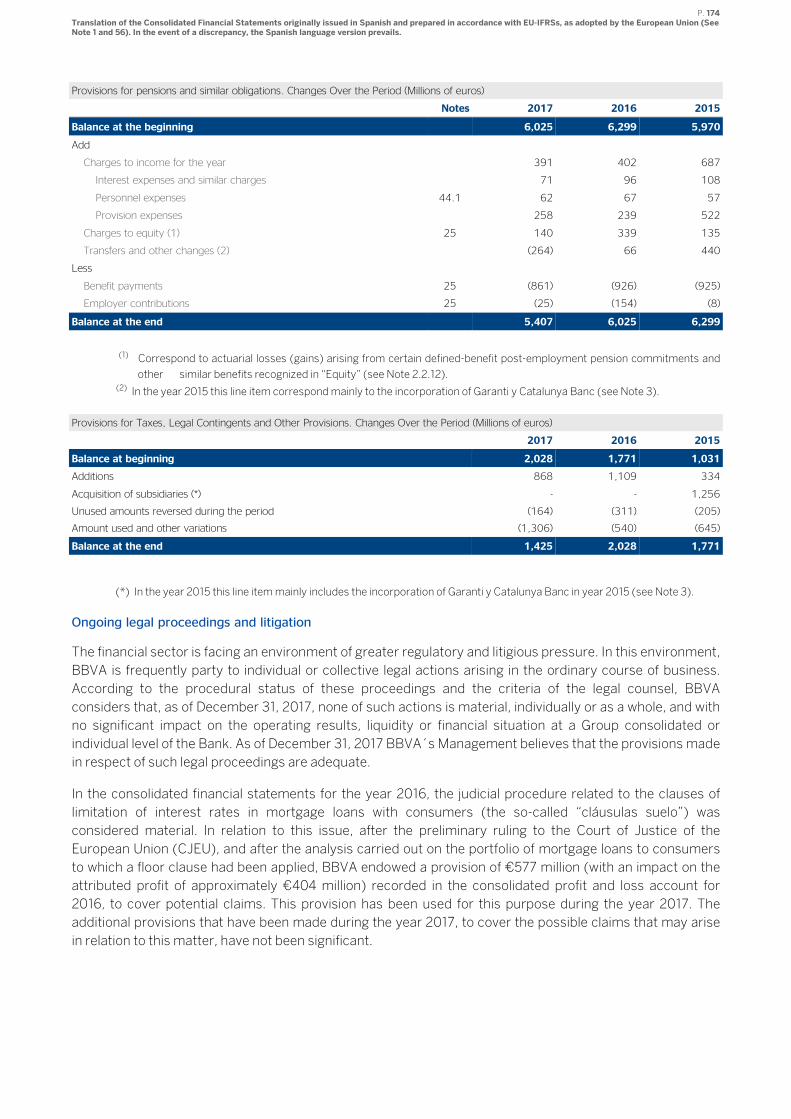
P. 174 Translation of the Consolidated Financial Statements originally issued in Spanish and prepared in accordance with EU-IFRSs, as adopted by the European Union (See Note 1 and 56). In the event of a discrepancy, the Spanish language version prevails.
Provisions for pensions and similar obligations. Changes Over the Period (Millions of euros)
Notes 2017 2016 2015
Balance at the beginning 6,025 6,299 5,970
Add
Charges to income for the year 391 402 687
Interest expenses and similar charges 71 96 108
Personnel expenses 44.1 62 67 57
Provision expenses 258 239 522
Charges to equity (1) 25 140 339 135
Transfers and other changes (2) (264) 66 440
Less
Benefit payments 25 (861) (926) (925)
Employer contributions 25 (25) (154) (8)
Balance at the end 5,407 6,025 6,299
(1) Correspond to actuarial losses (gains) arising from certain defined-benefit post-employment pension commitments and
other similar benefits recognized in “Equity” (see Note 2.2.12).
(2) In the year 2015 this line item correspond mainly to the incorporation of Garanti y Catalunya Banc (see Note 3).
Provisions for Taxes, Legal Contingents and Other Provisions. Changes Over the Period (Millions of euros)
2017 2016 2015
Balance at beginning 2,028 1,771 1,031
Additions 868 1,109 334
Acquisition of subsidiaries (*) - - 1,256
Unused amounts reversed during the period (164) (311) (205)
Amount used and other variations (1,306) (540) (645)
Balance at the end 1,425 2,028 1,771
(*) In the year 2015 this line item mainly includes the incorporation of Garanti y Catalunya Banc in year 2015 (see Note 3).
Ongoing legal proceedings and litigation
The financial sector is facing an environment of greater regulatory and litigious pressure. In this environment,
BBVA is frequently party to individual or collective legal actions arising in the ordinary course of business.
According to the procedural status of these proceedings and the criteria of the legal counsel, BBVA
considers that, as of December 31, 2017, none of such actions is material, individually or as a whole, and with
no significant impact on the operating results, liquidity or financial situation at a Group consolidated or
individual level of the Bank. As of December 31, 2017 BBVA´s Management believes that the provisions made
in respect of such legal proceedings are adequate.
In the consolidated financial statements for the year 2016, the judicial procedure related to the clauses of
limitation of interest rates in mortgage loans with consumers (the so-called “cláusulas suelo”) was
considered material. In relation to this issue, after the preliminary ruling to the Court of Justice of the
European Union (CJEU), and after the analysis carried out on the portfolio of mortgage loans to consumers
to which a floor clause had been applied, BBVA endowed a provision of €577 million (with an impact on the
attributed profit of approximately €404 million) recorded in the consolidated profit and loss account for
2016, to cover potential claims. This provision has been used for this purpose during the year 2017. The
additional provisions that have been made during the year 2017, to cover the possible claims that may arise
in relation to this matter, have not been significant.
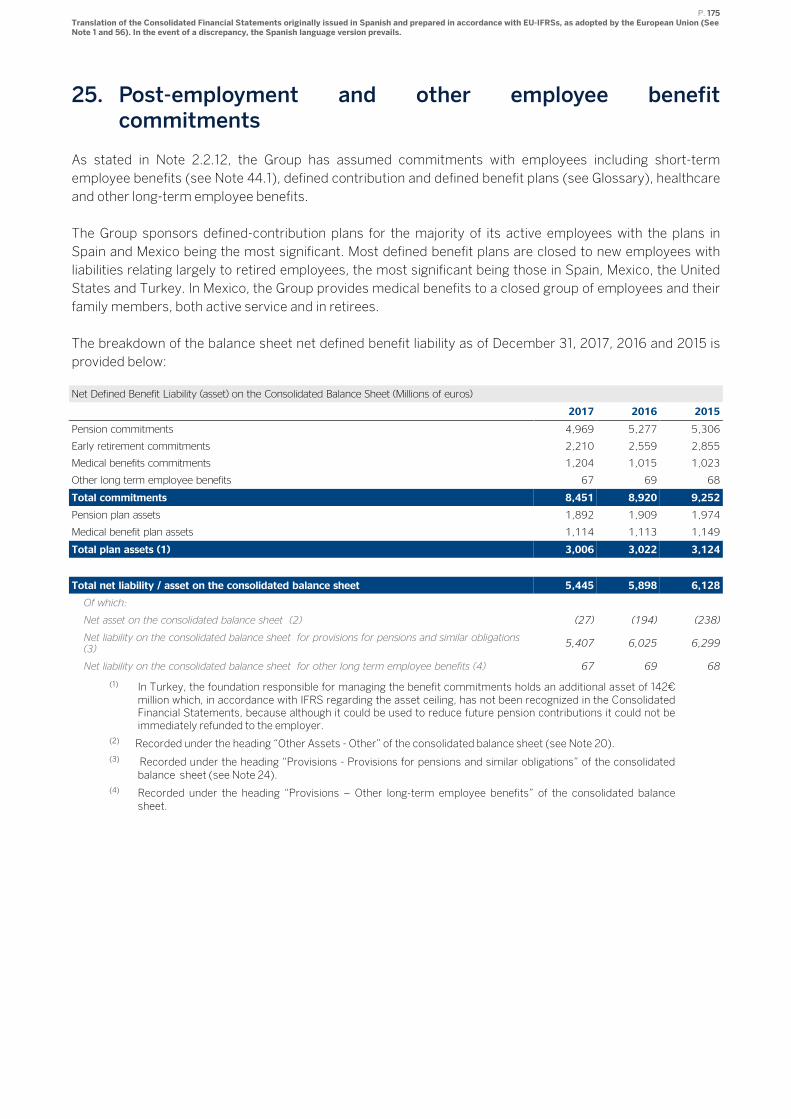
P. 175 Translation of the Consolidated Financial Statements originally issued in Spanish and prepared in accordance with EU-IFRSs, as adopted by the European Union (See Note 1 and 56). In the event of a discrepancy, the Spanish language version prevails.
25. Post-employment and other employee benefit commitments
As stated in Note 2.2.12, the Group has assumed commitments with employees including short-term
employee benefits (see Note 44.1), defined contribution and defined benefit plans (see Glossary), healthcare
and other long-term employee benefits.
The Group sponsors defined-contribution plans for the majority of its active employees with the plans in
Spain and Mexico being the most significant. Most defined benefit plans are closed to new employees with
liabilities relating largely to retired employees, the most significant being those in Spain, Mexico, the United
States and Turkey. In Mexico, the Group provides medical benefits to a closed group of employees and their
family members, both active service and in retirees.
The breakdown of the balance sheet net defined benefit liability as of December 31, 2017, 2016 and 2015 is
provided below:
Net Defined Benefit Liability (asset) on the Consolidated Balance Sheet (Millions of euros)
2017 2016 2015
Pension commitments 4,969 5,277 5,306
Early retirement commitments 2,210 2,559 2,855
Medical benefits commitments 1,204 1,015 1,023
Other long term employee benefits 67 69 68
Total commitments 8,451 8,920 9,252
Pension plan assets 1,892 1,909 1,974
Medical benefit plan assets 1,114 1,113 1,149
Total plan assets (1) 3,006 3,022 3,124
Total net liability / asset on the consolidated balance sheet 5,445 5,898 6,128
Of which:
Net asset on the consolidated balance sheet (2) (27) (194) (238)
Net liability on the consolidated balance sheet for provisions for pensions and similar obligations (3)
5,407 6,025 6,299
Net liability on the consolidated balance sheet for other long term employee benefits (4) 67 69 68
(1) In Turkey, the foundation responsible for managing the benefit commitments holds an additional asset of 142€ million which, in accordance with IFRS regarding the asset ceiling, has not been recognized in the Consolidated Financial Statements, because although it could be used to reduce future pension contributions it could not be immediately refunded to the employer.
(2) Recorded under the heading “Other Assets - Other” of the consolidated balance sheet (see Note 20).
(3) Recorded under the heading “Provisions - Provisions for pensions and similar obligations” of the consolidated balance sheet (see Note 24).
(4) Recorded under the heading “Provisions – Other long-term employee benefits” of the consolidated balance sheet.
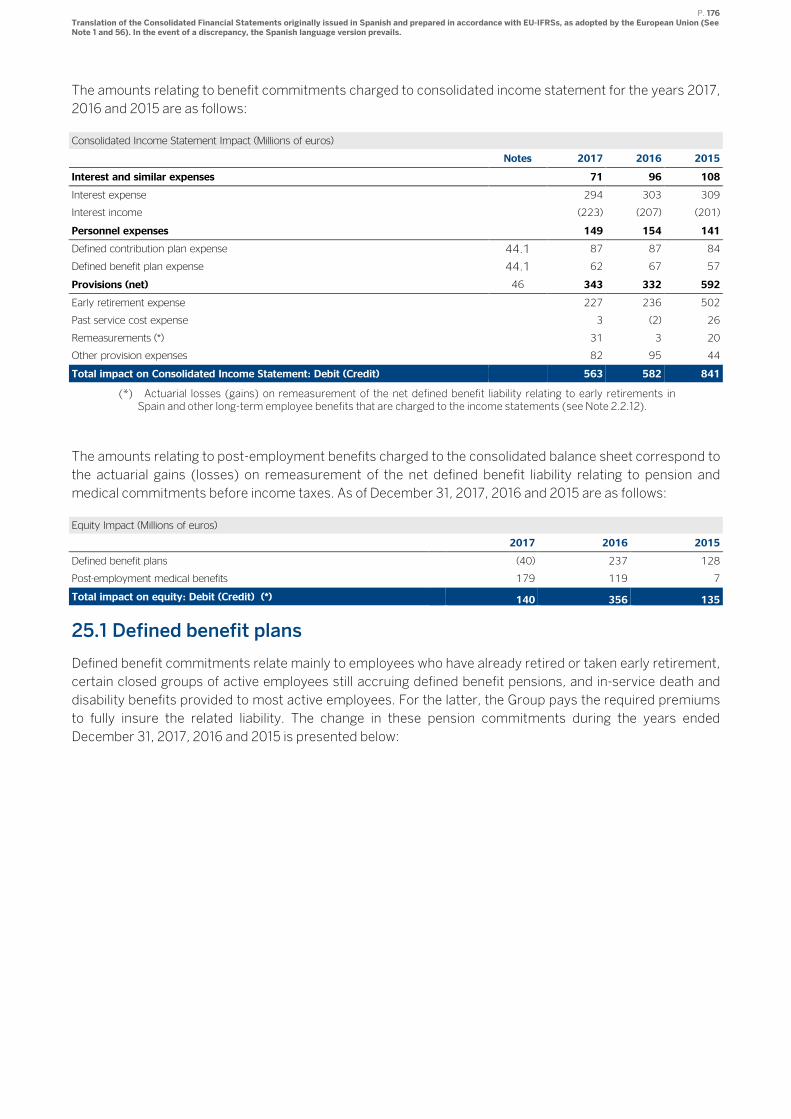
P. 176 Translation of the Consolidated Financial Statements originally issued in Spanish and prepared in accordance with EU-IFRSs, as adopted by the European Union (See Note 1 and 56). In the event of a discrepancy, the Spanish language version prevails.
The amounts relating to benefit commitments charged to consolidated income statement for the years 2017,
2016 and 2015 are as follows:
Consolidated Income Statement Impact (Millions of euros)
Notes 2017 2016 2015
Interest and similar expenses 71 96 108
Interest expense 294 303 309
Interest income (223) (207) (201)
Personnel expenses 149 154 141
Defined contribution plan expense 44.1 87 87 84
Defined benefit plan expense 44.1 62 67 57
Provisions (net) 46 343 332 592
Early retirement expense 227 236 502
Past service cost expense 3 (2) 26
Remeasurements (*) 31 3 20
Other provision expenses 82 95 44
Total impact on Consolidated Income Statement: Debit (Credit) 563 582 841
(*) Actuarial losses (gains) on remeasurement of the net defined benefit liability relating to early retirements in Spain and other long-term employee benefits that are charged to the income statements (see Note 2.2.12).
The amounts relating to post-employment benefits charged to the consolidated balance sheet correspond to
the actuarial gains (losses) on remeasurement of the net defined benefit liability relating to pension and
medical commitments before income taxes. As of December 31, 2017, 2016 and 2015 are as follows:
Equity Impact (Millions of euros)
2017 2016 2015
Defined benefit plans (40) 237 128
Post-employment medical benefits 179 119 7
Total impact on equity: Debit (Credit) (*) 140 356 135
25.1 Defined benefit plans
Defined benefit commitments relate mainly to employees who have already retired or taken early retirement,
certain closed groups of active employees still accruing defined benefit pensions, and in-service death and
disability benefits provided to most active employees. For the latter, the Group pays the required premiums
to fully insure the related liability. The change in these pension commitments during the years ended
December 31, 2017, 2016 and 2015 is presented below:
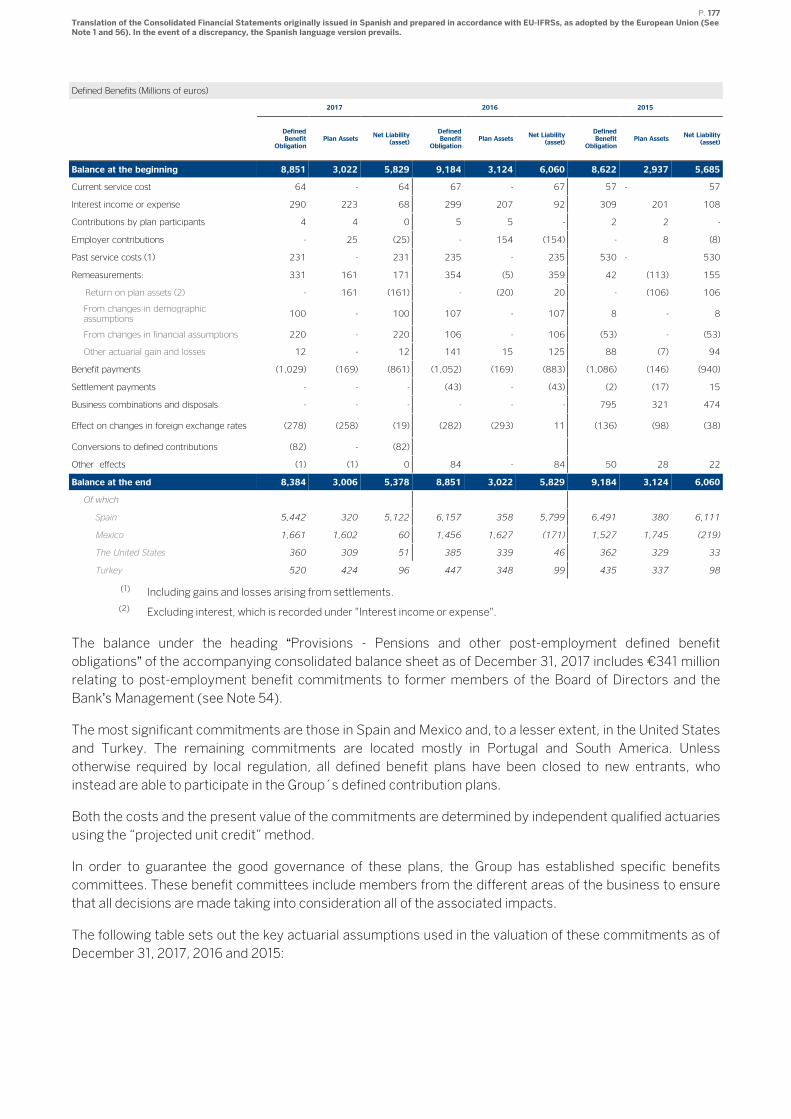
P. 177 Translation of the Consolidated Financial Statements originally issued in Spanish and prepared in accordance with EU-IFRSs, as adopted by the European Union (See Note 1 and 56). In the event of a discrepancy, the Spanish language version prevails.
Defined Benefits (Millions of euros)
2017 2016 2015
Defined Benefit
Obligation Plan Assets
Net Liability (asset)
Defined Benefit
Obligation Plan Assets
Net Liability (asset)
Defined Benefit
Obligation Plan Assets
Net Liability (asset)
Balance at the beginning 8,851 3,022 5,829 9,184 3,124 6,060 8,622 2,937 5,685
Current service cost 64 - 64 67 - 67 57 - 57
Interest income or expense 290 223 68 299 207 92 309 201 108
Contributions by plan participants 4 4 0 5 5 - 2 2 -
Employer contributions - 25 (25) - 154 (154) - 8 (8)
Past service costs (1) 231 - 231 235 - 235 530 - 530
Remeasurements: 331 161 171 354 (5) 359 42 (113) 155
Return on plan assets (2) - 161 (161) - (20) 20 - (106) 106
From changes in demographic assumptions
100 - 100 107 - 107 8 - 8
From changes in financial assumptions 220 - 220 106 - 106 (53) - (53)
Other actuarial gain and losses 12 - 12 141 15 125 88 (7) 94
Benefit payments (1,029) (169) (861) (1,052) (169) (883) (1,086) (146) (940)
Settlement payments - - - (43) - (43) (2) (17) 15
Business combinations and disposals - - - - - - 795 321 474
Effect on changes in foreign exchange rates (278) (258) (19) (282) (293) 11 (136) (98) (38)
Conversions to defined contributions (82) - (82)
Other effects (1) (1) 0 84 - 84 50 28 22
Balance at the end 8,384 3,006 5,378 8,851 3,022 5,829 9,184 3,124 6,060
Of which
Spain 5,442 320 5,122 6,157 358 5,799 6,491 380 6,111
Mexico 1,661 1,602 60 1,456 1,627 (171) 1,527 1,745 (219)
The United States 360 309 51 385 339 46 362 329 33
Turkey 520 424 96 447 348 99 435 337 98
(1) Including gains and losses arising from settlements.
(2) Excluding interest, which is recorded under "Interest income or expense".
The balance under the heading “Provisions - Pensions and other post-employment defined benefit
obligations” of the accompanying consolidated balance sheet as of December 31, 2017 includes €341 million
relating to post-employment benefit commitments to former members of the Board of Directors and the
Bank’s Management (see Note 54).
The most significant commitments are those in Spain and Mexico and, to a lesser extent, in the United States
and Turkey. The remaining commitments are located mostly in Portugal and South America. Unless
otherwise required by local regulation, all defined benefit plans have been closed to new entrants, who
instead are able to participate in the Group´s defined contribution plans.
Both the costs and the present value of the commitments are determined by independent qualified actuaries
using the “projected unit credit” method.
In order to guarantee the good governance of these plans, the Group has established specific benefits
committees. These benefit committees include members from the different areas of the business to ensure
that all decisions are made taking into consideration all of the associated impacts.
The following table sets out the key actuarial assumptions used in the valuation of these commitments as of
December 31, 2017, 2016 and 2015:
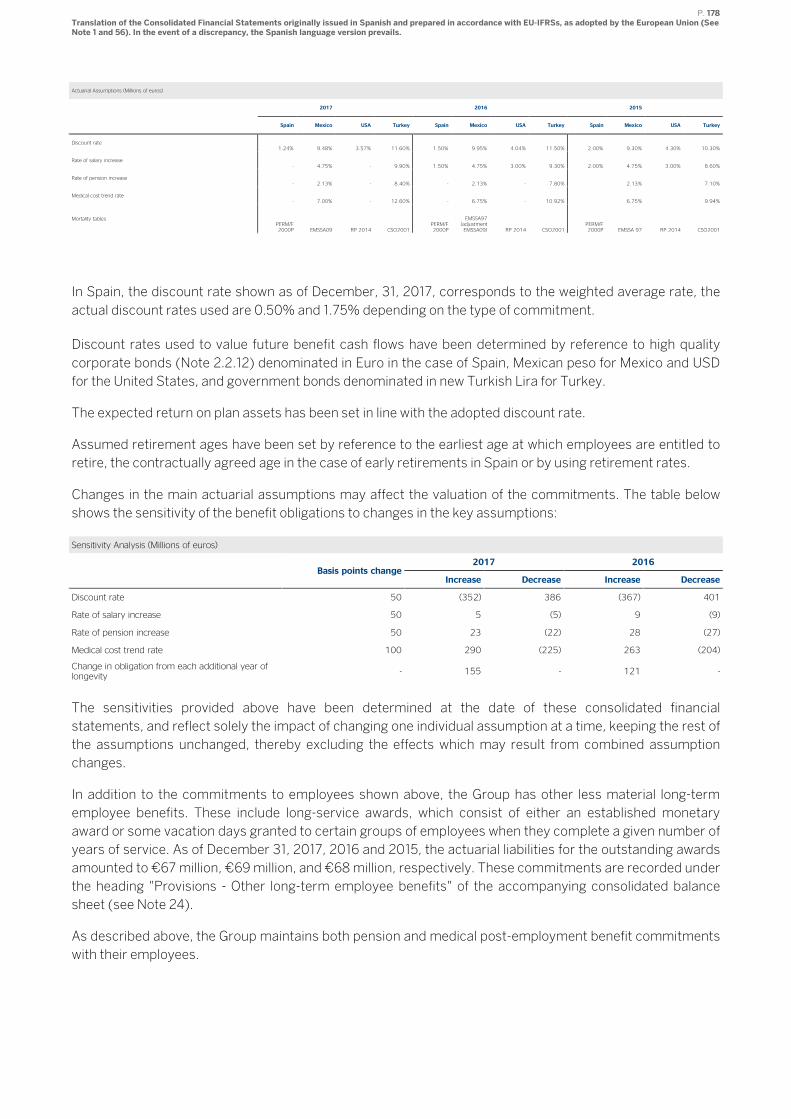
P. 178 Translation of the Consolidated Financial Statements originally issued in Spanish and prepared in accordance with EU-IFRSs, as adopted by the European Union (See Note 1 and 56). In the event of a discrepancy, the Spanish language version prevails.
Actuarial Assumptions (Millions of euros)
2017 2016 2015
Spain Mexico USA Turkey Spain Mexico USA Turkey Spain Mexico USA Turkey
Discount rate 1.24% 9.48% 3.57% 11.60% 1.50% 9.95% 4.04% 11.50% 2.00% 9.30% 4.30% 10.30%
Rate of salary increase - 4.75% - 9.90% 1.50% 4.75% 3.00% 9.30% 2.00% 4.75% 3.00% 8.60%
Rate of pension increase - 2.13% - 8.40% - 2.13% - 7.80% 2.13% 7.10%
Medical cost trend rate - 7.00% - 12.60% - 6.75% - 10.92% 6.75% 9.94%
Mortality tables PERM/F
2000P EMSSA09 RP 2014 CSO2001 PERM/F
2000P
EMSSA97 (adjustment
EMSSA09) RP 2014 CSO2001 PERM/F
2000P EMSSA 97 RP 2014 CSO2001
In Spain, the discount rate shown as of December, 31, 2017, corresponds to the weighted average rate, the
actual discount rates used are 0.50% and 1.75% depending on the type of commitment.
Discount rates used to value future benefit cash flows have been determined by reference to high quality
corporate bonds (Note 2.2.12) denominated in Euro in the case of Spain, Mexican peso for Mexico and USD
for the United States, and government bonds denominated in new Turkish Lira for Turkey.
The expected return on plan assets has been set in line with the adopted discount rate.
Assumed retirement ages have been set by reference to the earliest age at which employees are entitled to
retire, the contractually agreed age in the case of early retirements in Spain or by using retirement rates.
Changes in the main actuarial assumptions may affect the valuation of the commitments. The table below
shows the sensitivity of the benefit obligations to changes in the key assumptions:
Sensitivity Analysis (Millions of euros)
Basis points change
2017 2016
Increase Decrease Increase Decrease
Discount rate 50 (352) 386 (367) 401
Rate of salary increase 50 5 (5) 9 (9)
Rate of pension increase 50 23 (22) 28 (27)
Medical cost trend rate 100 290 (225) 263 (204)
Change in obligation from each additional year of longevity
- 155 - 121 -
The sensitivities provided above have been determined at the date of these consolidated financial
statements, and reflect solely the impact of changing one individual assumption at a time, keeping the rest of
the assumptions unchanged, thereby excluding the effects which may result from combined assumption
changes.
In addition to the commitments to employees shown above, the Group has other less material long-term
employee benefits. These include long-service awards, which consist of either an established monetary
award or some vacation days granted to certain groups of employees when they complete a given number of
years of service. As of December 31, 2017, 2016 and 2015, the actuarial liabilities for the outstanding awards
amounted to €67 million, €69 million, and €68 million, respectively. These commitments are recorded under
the heading "Provisions - Other long-term employee benefits" of the accompanying consolidated balance
sheet (see Note 24).
As described above, the Group maintains both pension and medical post-employment benefit commitments
with their employees.
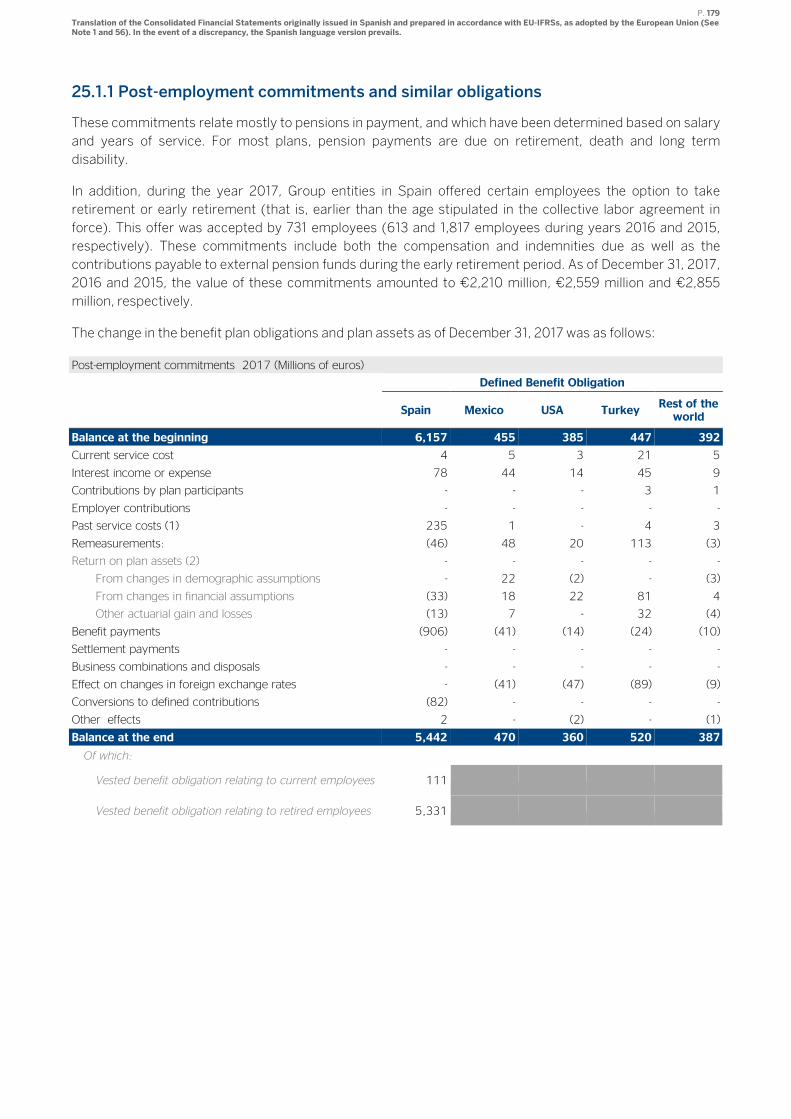
P. 179 Translation of the Consolidated Financial Statements originally issued in Spanish and prepared in accordance with EU-IFRSs, as adopted by the European Union (See Note 1 and 56). In the event of a discrepancy, the Spanish language version prevails.
25.1.1 Post-employment commitments and similar obligations
These commitments relate mostly to pensions in payment, and which have been determined based on salary
and years of service. For most plans, pension payments are due on retirement, death and long term
disability.
In addition, during the year 2017, Group entities in Spain offered certain employees the option to take
retirement or early retirement (that is, earlier than the age stipulated in the collective labor agreement in
force). This offer was accepted by 731 employees (613 and 1,817 employees during years 2016 and 2015,
respectively). These commitments include both the compensation and indemnities due as well as the
contributions payable to external pension funds during the early retirement period. As of December 31, 2017,
2016 and 2015, the value of these commitments amounted to €2,210 million, €2,559 million and €2,855
million, respectively.
The change in the benefit plan obligations and plan assets as of December 31, 2017 was as follows:
Post-employment commitments 2017 (Millions of euros)
Defined Benefit Obligation
Spain Mexico USA Turkey Rest of the world
Balance at the beginning 6,157 455 385 447 392
Current service cost 4 5 3 21 5
Interest income or expense 78 44 14 45 9
Contributions by plan participants - - - 3 1
Employer contributions - - - - -
Past service costs (1) 235 1 - 4 3
Remeasurements: (46) 48 20 113 (3)
Return on plan assets (2) - - - - -
From changes in demographic assumptions - 22 (2) - (3)
From changes in financial assumptions (33) 18 22 81 4
Other actuarial gain and losses (13) 7 - 32 (4)
Benefit payments (906) (41) (14) (24) (10)
Settlement payments - - - - -
Business combinations and disposals - - - - -
Effect on changes in foreign exchange rates - (41) (47) (89) (9)
Conversions to defined contributions (82) - - - -
Other effects 2 - (2) - (1)
Balance at the end 5,442 470 360 520 387
Of which:
Vested benefit obligation relating to current employees 111
Vested benefit obligation relating to retired employees 5,331
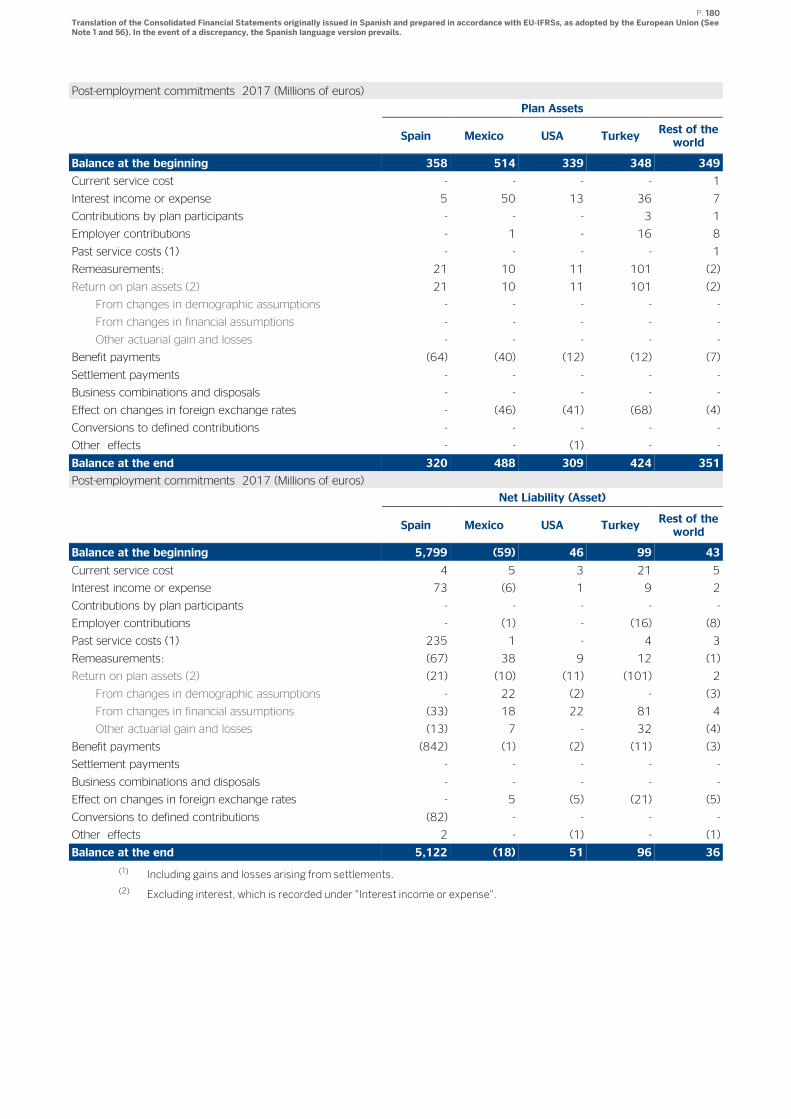
P. 180 Translation of the Consolidated Financial Statements originally issued in Spanish and prepared in accordance with EU-IFRSs, as adopted by the European Union (See Note 1 and 56). In the event of a discrepancy, the Spanish language version prevails.
Post-employment commitments 2017 (Millions of euros)
Plan Assets
Spain Mexico USA Turkey Rest of the world
Balance at the beginning 358 514 339 348 349
Current service cost - - - - 1
Interest income or expense 5 50 13 36 7
Contributions by plan participants - - - 3 1
Employer contributions - 1 - 16 8
Past service costs (1) - - - - 1
Remeasurements: 21 10 11 101 (2)
Return on plan assets (2) 21 10 11 101 (2)
From changes in demographic assumptions - - - - -
From changes in financial assumptions - - - - -
Other actuarial gain and losses - - - - -
Benefit payments (64) (40) (12) (12) (7)
Settlement payments - - - - -
Business combinations and disposals - - - - -
Effect on changes in foreign exchange rates - (46) (41) (68) (4)
Conversions to defined contributions - - - - -
Other effects - - (1) - -
Balance at the end 320 488 309 424 351
Post-employment commitments 2017 (Millions of euros)
Net Liability (Asset)
Spain Mexico USA Turkey Rest of the world
Balance at the beginning 5,799 (59) 46 99 43
Current service cost 4 5 3 21 5
Interest income or expense 73 (6) 1 9 2
Contributions by plan participants - - - - -
Employer contributions - (1) - (16) (8)
Past service costs (1) 235 1 - 4 3
Remeasurements: (67) 38 9 12 (1)
Return on plan assets (2) (21) (10) (11) (101) 2
From changes in demographic assumptions - 22 (2) - (3)
From changes in financial assumptions (33) 18 22 81 4
Other actuarial gain and losses (13) 7 - 32 (4)
Benefit payments (842) (1) (2) (11) (3)
Settlement payments - - - - -
Business combinations and disposals - - - - -
Effect on changes in foreign exchange rates - 5 (5) (21) (5)
Conversions to defined contributions (82) - - - -
Other effects 2 - (1) - (1)
Balance at the end 5,122 (18) 51 96 36
(1) Including gains and losses arising from settlements.
(2) Excluding interest, which is recorded under "Interest income or expense".
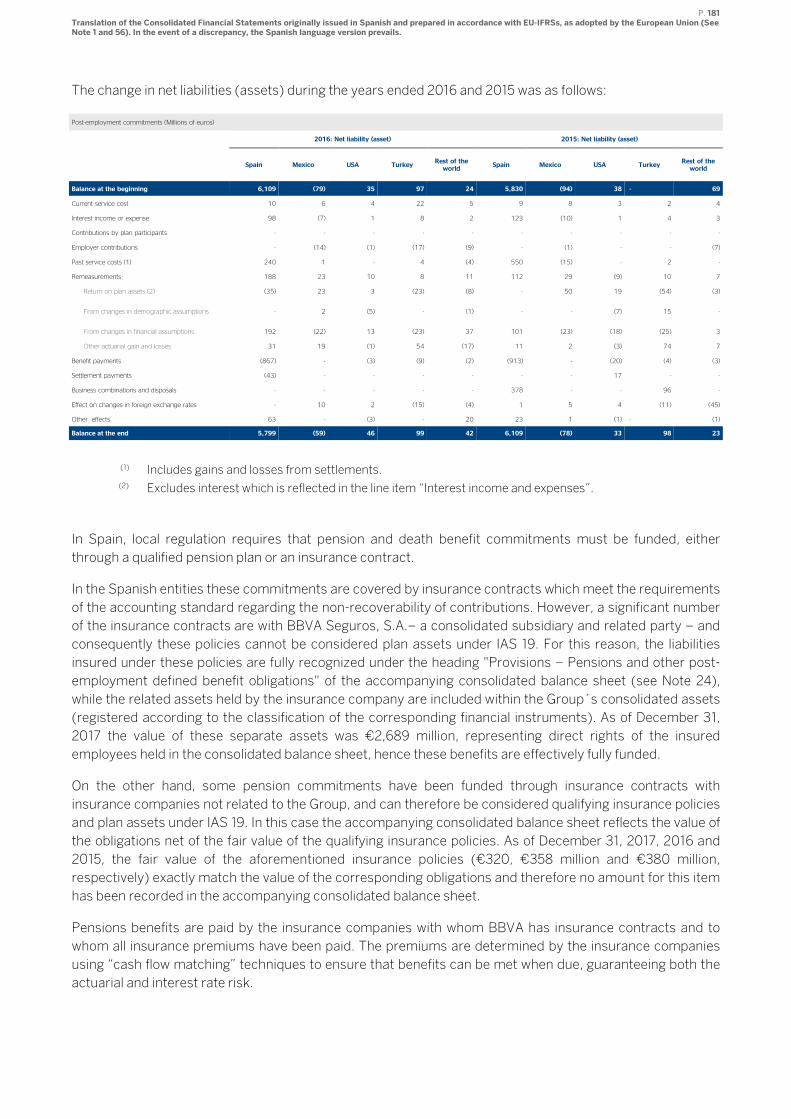
P. 181 Translation of the Consolidated Financial Statements originally issued in Spanish and prepared in accordance with EU-IFRSs, as adopted by the European Union (See Note 1 and 56). In the event of a discrepancy, the Spanish language version prevails.
The change in net liabilities (assets) during the years ended 2016 and 2015 was as follows:
Post-employment commitments (Millions of euros)
2016: Net liability (asset) 2015: Net liability (asset)
Spain Mexico USA Turkey Rest of the world
Spain Mexico USA Turkey Rest of the world
Balance at the beginning 6,109 (79) 35 97 24 5,830 (94) 38 - 69
Current service cost 10 6 4 22 5 9 8 3 2 4
Interest income or expense 98 (7) 1 8 2 123 (10) 1 4 3
Contributions by plan participants - - - - - - - - - -
Employer contributions - (14) (1) (17) (9) - (1) - - (7)
Past service costs (1) 240 1 - 4 (4) 550 (15) - 2 -
Remeasurements: 188 23 10 8 11 112 29 (9) 10 7
Return on plan assets (2) (35) 23 3 (23) (8) - 50 19 (54) (3)
From changes in demographic assumptions - 2 (5) - (1) - - (7) 15 -
From changes in financial assumptions 192 (22) 13 (23) 37 101 (23) (18) (25) 3
Other actuarial gain and losses 31 19 (1) 54 (17) 11 2 (3) 74 7
Benefit payments (867) - (3) (9) (2) (913) - (20) (4) (3)
Settlement payments (43) - - - - - - 17 - -
Business combinations and disposals - - - - - 378 - - 96 -
Effect on changes in foreign exchange rates - 10 2 (15) (4) 1 5 4 (11) (45)
Other effects 63 - (3) - 20 23 1 (1) - (1)
Balance at the end 5,799 (59) 46 99 42 6,109 (78) 33 98 23
(1) Includes gains and losses from settlements. (2) Excludes interest which is reflected in the line item “Interest income and expenses”.
In Spain, local regulation requires that pension and death benefit commitments must be funded, either
through a qualified pension plan or an insurance contract.
In the Spanish entities these commitments are covered by insurance contracts which meet the requirements
of the accounting standard regarding the non-recoverability of contributions. However, a significant number
of the insurance contracts are with BBVA Seguros, S.A.– a consolidated subsidiary and related party – and
consequently these policies cannot be considered plan assets under IAS 19. For this reason, the liabilities
insured under these policies are fully recognized under the heading "Provisions – Pensions and other post-
employment defined benefit obligations" of the accompanying consolidated balance sheet (see Note 24),
while the related assets held by the insurance company are included within the Group´s consolidated assets
(registered according to the classification of the corresponding financial instruments). As of December 31,
2017 the value of these separate assets was €2,689 million, representing direct rights of the insured
employees held in the consolidated balance sheet, hence these benefits are effectively fully funded.
On the other hand, some pension commitments have been funded through insurance contracts with
insurance companies not related to the Group, and can therefore be considered qualifying insurance policies
and plan assets under IAS 19. In this case the accompanying consolidated balance sheet reflects the value of
the obligations net of the fair value of the qualifying insurance policies. As of December 31, 2017, 2016 and
2015, the fair value of the aforementioned insurance policies (€320, €358 million and €380 million,
respectively) exactly match the value of the corresponding obligations and therefore no amount for this item
has been recorded in the accompanying consolidated balance sheet.
Pensions benefits are paid by the insurance companies with whom BBVA has insurance contracts and to
whom all insurance premiums have been paid. The premiums are determined by the insurance companies
using “cash flow matching” techniques to ensure that benefits can be met when due, guaranteeing both the
actuarial and interest rate risk.

P. 182 Translation of the Consolidated Financial Statements originally issued in Spanish and prepared in accordance with EU-IFRSs, as adopted by the European Union (See Note 1 and 56). In the event of a discrepancy, the Spanish language version prevails.
In Mexico, there is a defined benefit plan for employees hired prior to 2001. Other employees participate in a
defined contribution plan. External funds/trusts have been constituted locally to meet benefit payments as
required by local regulation.
In the United States there are mainly two defined benefit plans, both closed to new employees, who instead
are able to join a defined contribution plan. External funds/trusts have been constituted locally to fund the
plans, as required by local regulation.
In 2008, the Turkish government passed a law to unify the different existing pension systems under a single
umbrella Social Security system. Such system provides for the transfer of the various previously established
funds.
The financial sector is in this stage at present, maintaining these pension commitments managed by external
pension funds (foundations) established for that purpose.
The Foundation that maintains the assets and liabilities relating to employees of Garanti in Turkey, as per the
local regulatory requirements, has registered an obligation amounting to €228 million as of December 31,
2017 pending future transfer to the Social Security system.
Furthermore, Garanti has set up a defined benefit pension plan for employees, additional to the social
security benefits, reflected in the consolidated balance sheet.
Until the year 2016, he Bank also had commitments to pay indemnities to certain employees and members
of the Group’s Senior Management in the event that they cease to hold their positions for reasons other than
their own will, retirement, disability or serious dereliction of duties. The amount will be calculated according
to the salary and professional conditions of each employee, taking into consideration fixed elements of the
remuneration and the length of office at the Bank. Under no circumstances indemnities will be paid in cases
of disciplinary dismissal for misconduct upon decision of the employer on grounds of the employee's serious
dereliction of duties.
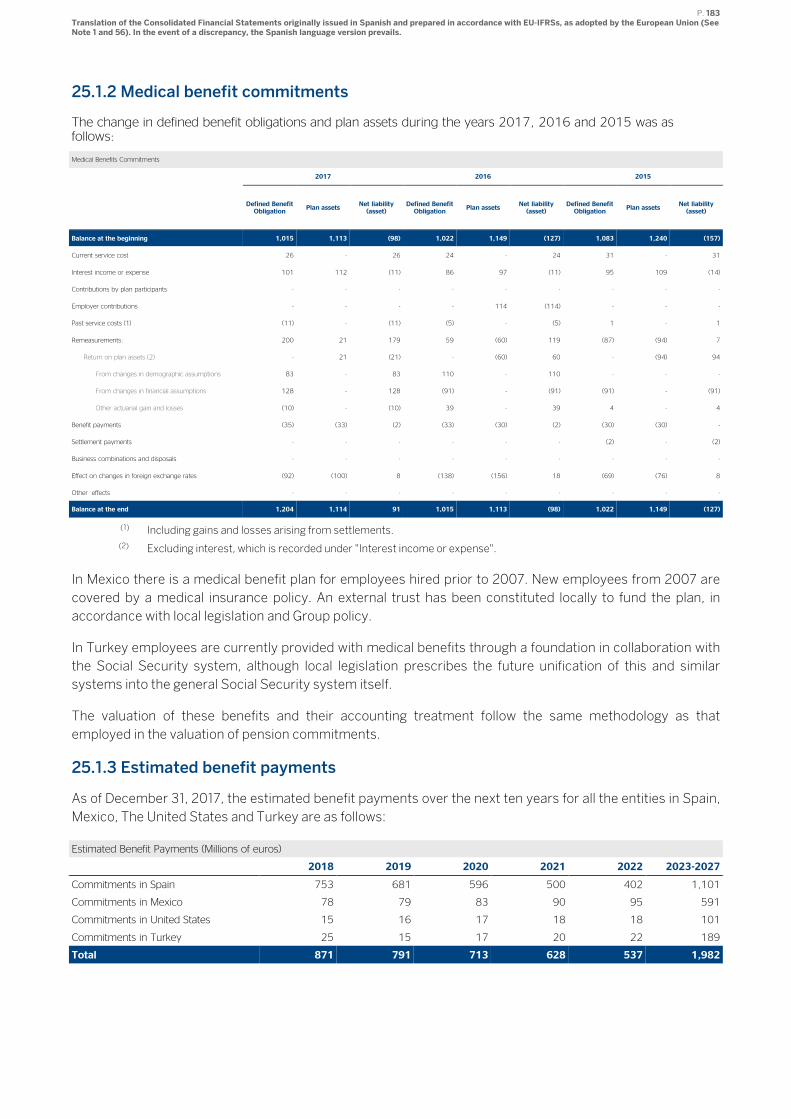
P. 183 Translation of the Consolidated Financial Statements originally issued in Spanish and prepared in accordance with EU-IFRSs, as adopted by the European Union (See Note 1 and 56). In the event of a discrepancy, the Spanish language version prevails.
25.1.2 Medical benefit commitments
The change in defined benefit obligations and plan assets during the years 2017, 2016 and 2015 was as follows:
Medical Benefits Commitments
2017 2016 2015
Defined Benefit Obligation
Plan assets Net liability (asset)
Defined Benefit Obligation
Plan assets Net liability (asset)
Defined Benefit Obligation
Plan assets Net liability (asset)
Balance at the beginning 1,015 1,113 (98) 1,022 1,149 (127) 1,083 1,240 (157)
Current service cost 26 - 26 24 - 24 31 - 31
Interest income or expense 101 112 (11) 86 97 (11) 95 109 (14)
Contributions by plan participants - - - - - - - - -
Employer contributions - - - - 114 (114) - - -
Past service costs (1) (11) - (11) (5) - (5) 1 - 1
Remeasurements: 200 21 179 59 (60) 119 (87) (94) 7
Return on plan assets (2) - 21 (21) - (60) 60 - (94) 94
From changes in demographic assumptions 83 - 83 110 - 110 - - -
From changes in financial assumptions 128 - 128 (91) - (91) (91) - (91)
Other actuarial gain and losses (10) - (10) 39 - 39 4 - 4
Benefit payments (35) (33) (2) (33) (30) (2) (30) (30) -
Settlement payments - - - - - - (2) - (2)
Business combinations and disposals - - - - - - - - -
Effect on changes in foreign exchange rates (92) (100) 8 (138) (156) 18 (69) (76) 8
Other effects - - - - - - - - -
Balance at the end 1,204 1,114 91 1,015 1,113 (98) 1,022 1,149 (127)
(1) Including gains and losses arising from settlements.
(2) Excluding interest, which is recorded under "Interest income or expense".
In Mexico there is a medical benefit plan for employees hired prior to 2007. New employees from 2007 are
covered by a medical insurance policy. An external trust has been constituted locally to fund the plan, in
accordance with local legislation and Group policy.
In Turkey employees are currently provided with medical benefits through a foundation in collaboration with
the Social Security system, although local legislation prescribes the future unification of this and similar
systems into the general Social Security system itself.
The valuation of these benefits and their accounting treatment follow the same methodology as that
employed in the valuation of pension commitments.
25.1.3 Estimated benefit payments
As of December 31, 2017, the estimated benefit payments over the next ten years for all the entities in Spain,
Mexico, The United States and Turkey are as follows:
Estimated Benefit Payments (Millions of euros)
2018 2019 2020 2021 2022 2023-2027
Commitments in Spain 753 681 596 500 402 1,101
Commitments in Mexico 78 79 83 90 95 591
Commitments in United States 15 16 17 18 18 101
Commitments in Turkey 25 15 17 20 22 189
Total 871 791 713 628 537 1,982
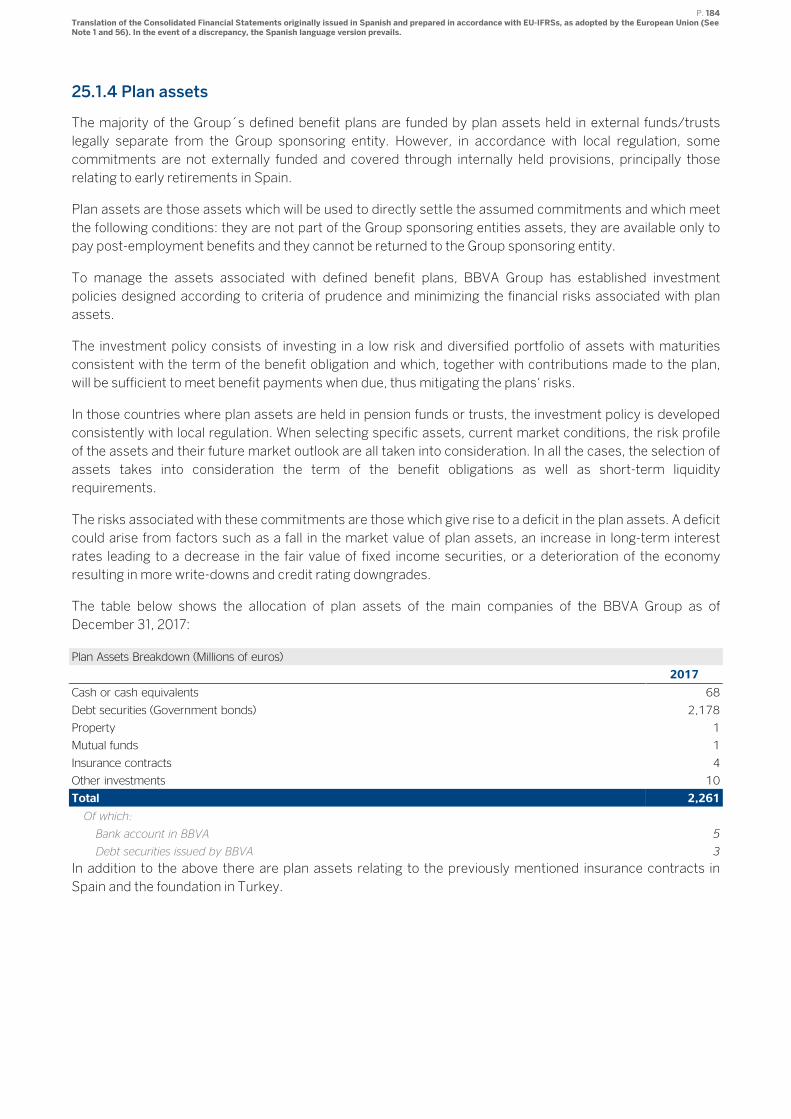
P. 184 Translation of the Consolidated Financial Statements originally issued in Spanish and prepared in accordance with EU-IFRSs, as adopted by the European Union (See Note 1 and 56). In the event of a discrepancy, the Spanish language version prevails.
25.1.4 Plan assets
The majority of the Group´s defined benefit plans are funded by plan assets held in external funds/trusts
legally separate from the Group sponsoring entity. However, in accordance with local regulation, some
commitments are not externally funded and covered through internally held provisions, principally those
relating to early retirements in Spain.
Plan assets are those assets which will be used to directly settle the assumed commitments and which meet
the following conditions: they are not part of the Group sponsoring entities assets, they are available only to
pay post-employment benefits and they cannot be returned to the Group sponsoring entity.
To manage the assets associated with defined benefit plans, BBVA Group has established investment
policies designed according to criteria of prudence and minimizing the financial risks associated with plan
assets.
The investment policy consists of investing in a low risk and diversified portfolio of assets with maturities
consistent with the term of the benefit obligation and which, together with contributions made to the plan,
will be sufficient to meet benefit payments when due, thus mitigating the plans‘ risks.
In those countries where plan assets are held in pension funds or trusts, the investment policy is developed
consistently with local regulation. When selecting specific assets, current market conditions, the risk profile
of the assets and their future market outlook are all taken into consideration. In all the cases, the selection of
assets takes into consideration the term of the benefit obligations as well as short-term liquidity
requirements.
The risks associated with these commitments are those which give rise to a deficit in the plan assets. A deficit
could arise from factors such as a fall in the market value of plan assets, an increase in long-term interest
rates leading to a decrease in the fair value of fixed income securities, or a deterioration of the economy
resulting in more write-downs and credit rating downgrades.
The table below shows the allocation of plan assets of the main companies of the BBVA Group as of
December 31, 2017:
Plan Assets Breakdown (Millions of euros)
2017
Cash or cash equivalents 68
Debt securities (Government bonds) 2,178
Property 1
Mutual funds 1
Insurance contracts 4
Other investments 10
Total 2,261
Of which:
Bank account in BBVA 5
Debt securities issued by BBVA 3
In addition to the above there are plan assets relating to the previously mentioned insurance contracts in
Spain and the foundation in Turkey.
P. 185 Translation of the Consolidated Financial Statements originally issued in Spanish and prepared in accordance with EU-IFRSs, as adopted by the European Union (See Note 1 and 56). In the event of a discrepancy, the Spanish language version prevails.
The following table provides details of investments in listed securities (Level 1) as of December 31, 2017:
Investments in listed markets
2017
Cash or cash equivalents 68
Debt securities (Government bonds) 2,178
Mutual funds 1
Total 2,247
Of which:
Bank account in BBVA 5
Debt securities issued by BBVA 3
The remainders of the assets are mainly invested in Level 2 assets in in accordance with the classification
established under IFRS 13 (mainly insurance contracts). As of December 31, 2017, almost all of the assets
related to employee’s commitments corresponded to fixed income securities.
25.2 Defined contribution plans
Certain Group entities sponsor defined contribution plans. Some of these plans allow employees to make
contributions which are then matched by the employer.
Contributions are recognized as and when they are accrued, with a charge to the consolidated income
statement in the corresponding year. No liability is therefore recognized in the accompanying consolidated
balance sheet (see Note 44.1).
26. Common stock
As of December 31, 2017, BBVA’s common stock amounted to €3,267,264,424.20 divided into
6,667,886,580 fully subscribed and paid-up registered shares, all of the same class and series, at €0.49 par
value each, represented through book-entry accounts. All of the Bank shares carry the same voting and
dividend rights, and no single stockholder enjoys special voting rights. Each and every share is part of the
Bank’s common stock.
The Bank’s shares are traded on the Spanish stock market, as well as on the London and Mexico stock
markets. BBVA American Depositary Shares (ADSs) traded on the New York Stock Exchange. Also, as of
December 31, 2017, the shares of BBVA Banco Continental, S.A., Banco Provincial S.A., BBVA Colombia,
S.A., BBVA Chile, S.A., and BBVA Banco Frances, S.A. were listed on their respective local stock markets.
BBVA Banco Frances, S.A. is also listed on the Latin American market (Latibex) of the Madrid Stock
Exchange and on the New York Stock Exchange.
Additionally, as of December 31, 2017, the shares of BBVA Banco Continental, S.A .; Banco Provincial, S.A .;
BBVA Colombia, S.A .; BBVA Chile, S.A .; BBVA Banco Francés, S.A. and Turkiye Garanti Bankasi A.S., were
listed on their respective local stock markets. BBVA Banco Francés, S.A. was also quoted in the Latin
American market (Latibex) of the Madrid Stock Exchange and the New York Stock Exchange.
As of December 31, 2017, State Street Bank and Trust Co., Chase Nominees Ltd and The Bank of New York
Mellon SA NV in their capacity as international custodian/depositary banks, held 12.53%, 6.48%, and 3.80%
of BBVA common stock, respectively. Of said positions held by the custodian banks, BBVA is not aware of
any individual shareholders with direct or indirect holdings greater than or equal to 3% of BBVA common
stock outstanding.
On October 18, 2017, the Blackrock, Inc. reported to the Spanish Securities and Exchange Commission
(CNMV) that, it now has an indirect holding of BBVA common stock totaling 5.939%, of which 5.708% are
voting rights attributed to shares and 0,231% are voting rights through financial instruments.
P. 186 Translation of the Consolidated Financial Statements originally issued in Spanish and prepared in accordance with EU-IFRSs, as adopted by the European Union (See Note 1 and 56). In the event of a discrepancy, the Spanish language version prevails.
BBVA is not aware of any direct or indirect interests through which control of the Bank may be exercised.
BBVA has not received any information on stockholder agreements including the regulation of the exercise of
voting rights at its annual general meetings or restricting or placing conditions on the free transferability of
BBVA shares. No agreement is known that could give rise to changes in the control of the Bank.
The changes in the heading “Paid up Capital” of the accompanying consolidated balance sheets are due to
the following common stock increases:
Capital Increase
Number of Shares Paid up capital
(Millions of Euros)
As of December 31, 2015 6,366,680,118 3,120
Dividend option - April 2016 113,677,807 56
Dividend option - October 2016 86,257,317 42
As of December 31, 2016 6,566,615,242 3,218
Dividend Option . April 2017 101,271,338 50
As of December 31, 2017 6,667,886,580 3,267
“Dividend Option” Program in 2017:
The AGM of BBVA held on March 17, 2017 adopted, under agenda item three, a capital increase to be
charged to voluntary reserves to implement the shareholder remuneration system called the “Dividend
Option” this year in similar conditions to those agreed in 2014, 2015 and 2016, conferring on the Board of
Directors, in accordance with article 297.1.a) of the Spanish Companies Act, the authority to set the date on
which the capital increase should be carried out, within one year of the date of approval of the AGM
resolution.
By virtue of such resolution, the Board of Directors of BBVA resolved, on March 29, 2017, to execute the
capital increase to be charged to voluntary reserves, in accordance with the terms and conditions approved
by the AGM mentioned above. As a result, BBVA’s share capital was increased by an amount of
49,622,955.62 euros through the issuance of 101,271,338 newly-issued BBVA ordinary shares at 0.49 euros
par value each (see Note 4).
“Dividend Option” Program in 2016:
The AGM held on March 11, 2016, under agenda item three, adopted four capital increase resolutions to be
charged to voluntary reserves to once again implement the shareholder remuneration program called the
“Dividend Option” (see Note 4), conferring on the Board of Directors, in accordance with article 297.1 a) of
the Spanish Companies Act, the authority to set the date on which said capital increases should be carried
out, within one year of the date of approval of the AGM resolution, including the power not to implement any
of the resolutions, when deemed advisable.
On March 31, 2016, the Board of Directors of BBVA approved the execution of the first of the capital
increases charged to voluntary reserves, in accordance with the terms and conditions agreed by the
aforementioned AGM. As a result of this increase, the Bank’s capital increased by €55,702,125.43 through
the issuance of 113,677,807 ordinary shares at €0.49 par value each.
On September 28, 2016, BBVA’s Board of Directors approved the execution of the second of the capital
increases charged to voluntary reserves in accordance with the terms and conditions agreed by the
aforementioned AGM. As a result of this increase, the Bank’s capital increased by €42,266,085.33 through
the issuance of 86,257,317 ordinary shares at €0.49 par value each.
P. 187Translation of the Consolidated Financial Statements originally issued in Spanish and prepared in accordance with EU-IFRSs, as adopted by the European Union (See Note 1 and 56). In the event of a discrepancy, the Spanish language version prevails.
“Dividend Option” Program in 2015:
The AGM held on March 13, 2015 under Point Four of the Agenda, adopted four resolutions on capital
increase to be charged to voluntary reserves, to once again implement the shareholder remuneration
program called the “Dividend Option” (see Note 4), pursuant to article 297.1 a) of the Spanish Corporate
Enterprises Act, conferring on the Board of Directors the authority to indicate the date on which said capital
increases should be carried out, within one year of the date of the AGM, including the power not to implement
any of the resolutions, when deemed advisable.
On March 25, 2015, the Board of Directors of BBVA approved the execution of the first of the capital
increases charged to voluntary reserves agreed by the aforementioned AGM. As a result of this increase, the
Bank’s capital increased by €39,353,896.26 through the issue and circulation of 80,314,074 shares with a
€0.49 par value each.
Likewise, on September 30, 2015, the Board of Directors of BBVA approved the execution of the second of
the capital increases charged to voluntary reserves agreed by the aforementioned AGM. As a result of this
increase, the Bank’s capital increased by €30,106,631.94 through the issue and circulation of 61,442,106
shares with a €0.49 par value each.
Convertible and/or exchangeable securities:
The AGM held on March 17, 2017, resolved, under agenda item five, to confer authority to the Board of
Directors to issue securities convertible into newly issued BBVA shares, on one or several occasions, within
the maximum term of five years to be counted from the approval date of the authorization, up to a maximum
overall amount of €8 billion or its equivalent in any other currency. Likewise, the AGM resolved to confer to
the Board of Directors the authority to totally or partially exclude shareholders’ pre-emptive subscription
rights within the framework of a specific issue of convertible securities, although this power was limited to
ensure the nominal amount of the capital increases resolved or effectively carried out to cover the
conversion of mandatory convertible issuances of this authority (without prejudice to anti-dilution
adjustments), with exclusion of pre-emptive subscription rights and of those likewise resolved or carried out
with exclusion of pre-emptive subscription rights in use of the authority to increase the share capital
conferred by the AGM held on March 17, 2017, under agenda item four, do not exceed the maximum nominal
amount, overall, of 20% of the share capital of BBVA at the time of the authorization, this limit not being
applicable to contingent convertible issues.
In use of the authority mentioned above, BBVA carried out, on May 24, 2017 the fifth issuance of perpetual
contingent convertible securities (additional tier 1 instrument), with exclusion of pre-emptive subscription
rights of shareholders, for a total nominal amount of €500 million. This issuance is listed in the Global
Exchange Market of the Irish Stock Exchange and was targeted only at qualified investors, not being offered
to, and not being subscribed for, in Spain or by Spanish residents. The issuance qualifies as additional tier 1
capital of the Bank and the Group in accordance with Regulation EU 575/2013 (see Note 22.3).
Likewise, in use of such authority, BBVA carried out, on November 14, 2017 the sixth issuance of perpetual
contingent convertible securities (additional tier 1 instrument), with exclusion of pre-emptive subscription
rights of shareholders, for a total nominal amount of $1,000 million. This issuance is listed in the Global
Exchange Market of the Irish Stock Exchange and was targeted only at qualified investors, not being offered
to, and not being subscribed for, in Spain or by Spanish residents. The qualification of this issuance as
additional tier 1 capital has been requested (see Note 22.3).
In past years, BBVA has carried out, in use of the authority to issue convertible securities conferred by the
AGM held on March 16, 2012 (in effect until March 16, 2017), four additional issuances of perpetual
contingent convertible securities (additional tier 1 instrument), with exclusion of pre-emptive subscription
rights of shareholders (in April 2013 for an amount of $1.5 billion, in February 2014 and February 2015 for an
amount of €1.5 billion each one, and in April 2016 for an amount of €1 billion). These issuances were targeted
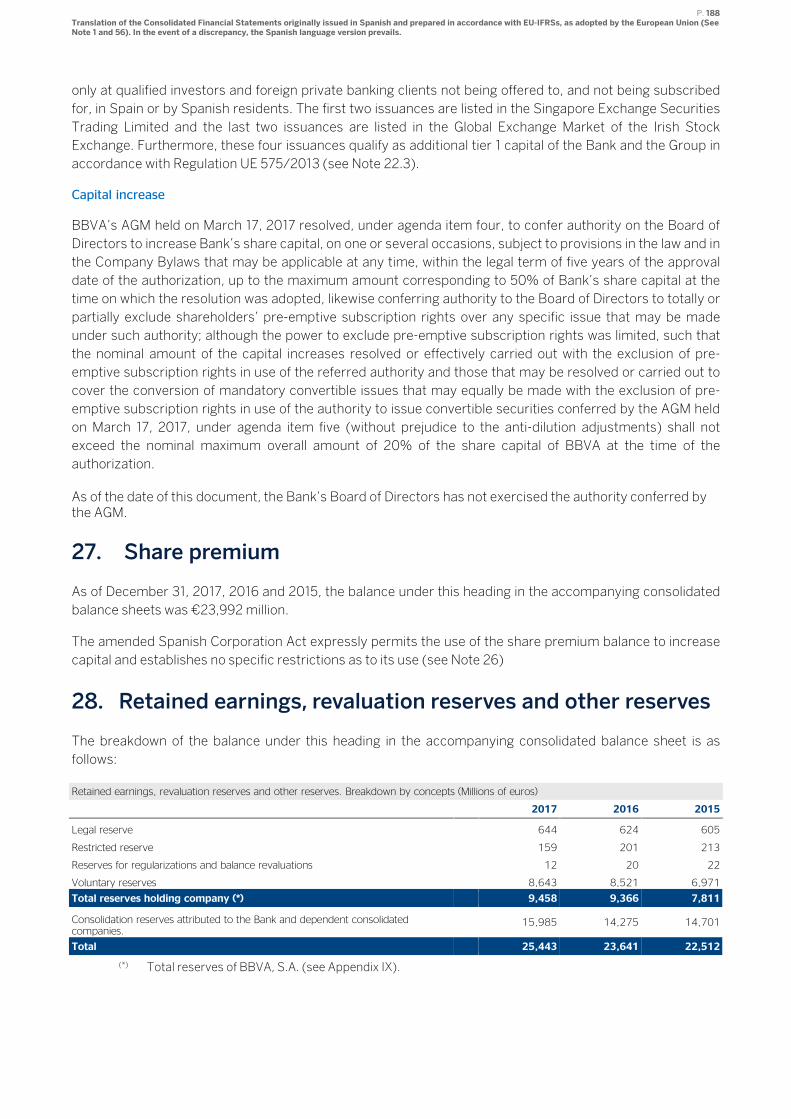
P. 188 Translation of the Consolidated Financial Statements originally issued in Spanish and prepared in accordance with EU-IFRSs, as adopted by the European Union (See Note 1 and 56). In the event of a discrepancy, the Spanish language version prevails.
only at qualified investors and foreign private banking clients not being offered to, and not being subscribed
for, in Spain or by Spanish residents. The first two issuances are listed in the Singapore Exchange Securities
Trading Limited and the last two issuances are listed in the Global Exchange Market of the Irish Stock
Exchange. Furthermore, these four issuances qualify as additional tier 1 capital of the Bank and the Group in
accordance with Regulation UE 575/2013 (see Note 22.3).
Capital increase
BBVA’s AGM held on March 17, 2017 resolved, under agenda item four, to confer authority on the Board of
Directors to increase Bank’s share capital, on one or several occasions, subject to provisions in the law and in
the Company Bylaws that may be applicable at any time, within the legal term of five years of the approval
date of the authorization, up to the maximum amount corresponding to 50% of Bank’s share capital at the
time on which the resolution was adopted, likewise conferring authority to the Board of Directors to totally or
partially exclude shareholders’ pre-emptive subscription rights over any specific issue that may be made
under such authority; although the power to exclude pre-emptive subscription rights was limited, such that
the nominal amount of the capital increases resolved or effectively carried out with the exclusion of pre-
emptive subscription rights in use of the referred authority and those that may be resolved or carried out to
cover the conversion of mandatory convertible issues that may equally be made with the exclusion of pre-
emptive subscription rights in use of the authority to issue convertible securities conferred by the AGM held
on March 17, 2017, under agenda item five (without prejudice to the anti-dilution adjustments) shall not
exceed the nominal maximum overall amount of 20% of the share capital of BBVA at the time of the
authorization.
As of the date of this document, the Bank’s Board of Directors has not exercised the authority conferred by the AGM.
27. Share premium
As of December 31, 2017, 2016 and 2015, the balance under this heading in the accompanying consolidated
balance sheets was €23,992 million.
The amended Spanish Corporation Act expressly permits the use of the share premium balance to increase
capital and establishes no specific restrictions as to its use (see Note 26)
28. Retained earnings, revaluation reserves and other reserves
The breakdown of the balance under this heading in the accompanying consolidated balance sheet is as
follows:
Retained earnings, revaluation reserves and other reserves. Breakdown by concepts (Millions of euros)
2017 2016 2015
Legal reserve 644 624 605
Restricted reserve 159 201 213
Reserves for regularizations and balance revaluations 12 20 22
Voluntary reserves 8,643 8,521 6,971
Total reserves holding company (*) 9,458 9,366 7,811
Consolidation reserves attributed to the Bank and dependent consolidated companies.
15,985 14,275 14,701
Total 25,443 23,641 22,512
(*) Total reserves of BBVA, S.A. (see Appendix IX).
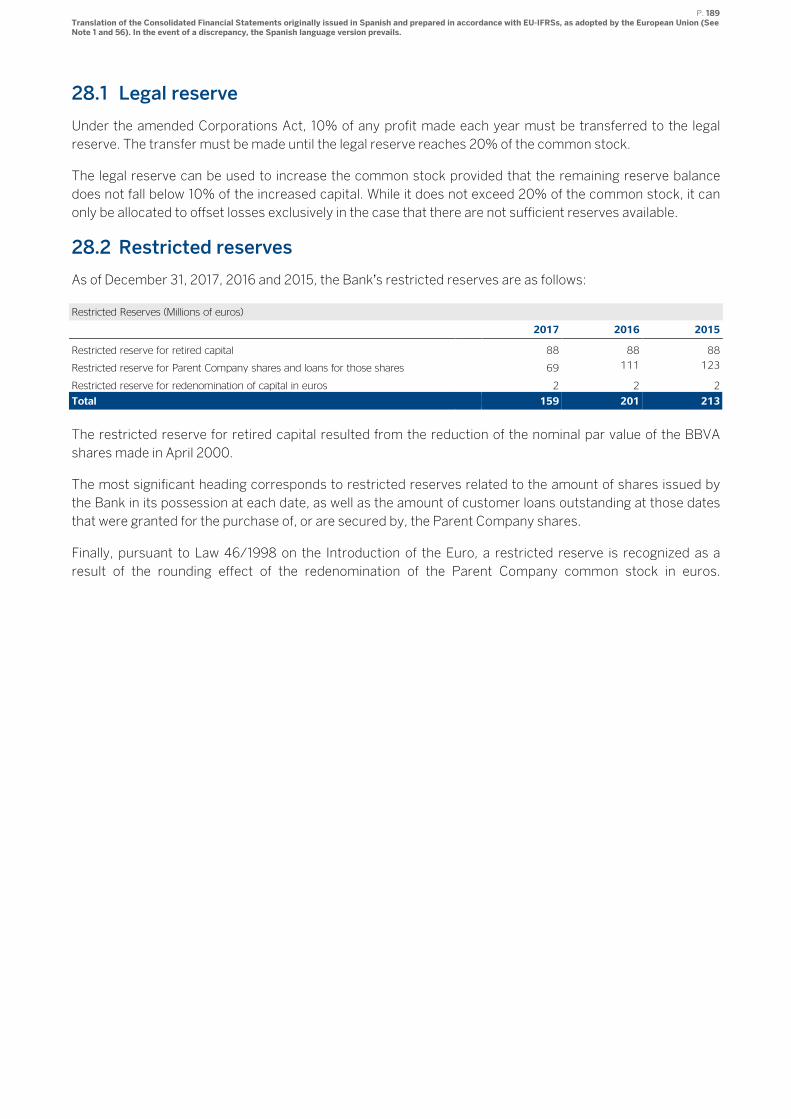
P. 189Translation of the Consolidated Financial Statements originally issued in Spanish and prepared in accordance with EU-IFRSs, as adopted by the European Union (See Note 1 and 56). In the event of a discrepancy, the Spanish language version prevails.
28.1 Legal reserve
Under the amended Corporations Act, 10% of any profit made each year must be transferred to the legal
reserve. The transfer must be made until the legal reserve reaches 20% of the common stock.
The legal reserve can be used to increase the common stock provided that the remaining reserve balance
does not fall below 10% of the increased capital. While it does not exceed 20% of the common stock, it can
only be allocated to offset losses exclusively in the case that there are not sufficient reserves available.
28.2 Restricted reserves
As of December 31, 2017, 2016 and 2015, the Bank’s restricted reserves are as follows:
Restricted Reserves (Millions of euros)
2017 2016 2015
Restricted reserve for retired capital 88 88 88
Restricted reserve for Parent Company shares and loans for those shares 69 111 123
Restricted reserve for redenomination of capital in euros 2 2 2
Total 159 201 213
The restricted reserve for retired capital resulted from the reduction of the nominal par value of the BBVA
shares made in April 2000.
The most significant heading corresponds to restricted reserves related to the amount of shares issued by
the Bank in its possession at each date, as well as the amount of customer loans outstanding at those dates
that were granted for the purchase of, or are secured by, the Parent Company shares.
Finally, pursuant to Law 46/1998 on the Introduction of the Euro, a restricted reserve is recognized as a
result of the rounding effect of the redenomination of the Parent Company common stock in euros.
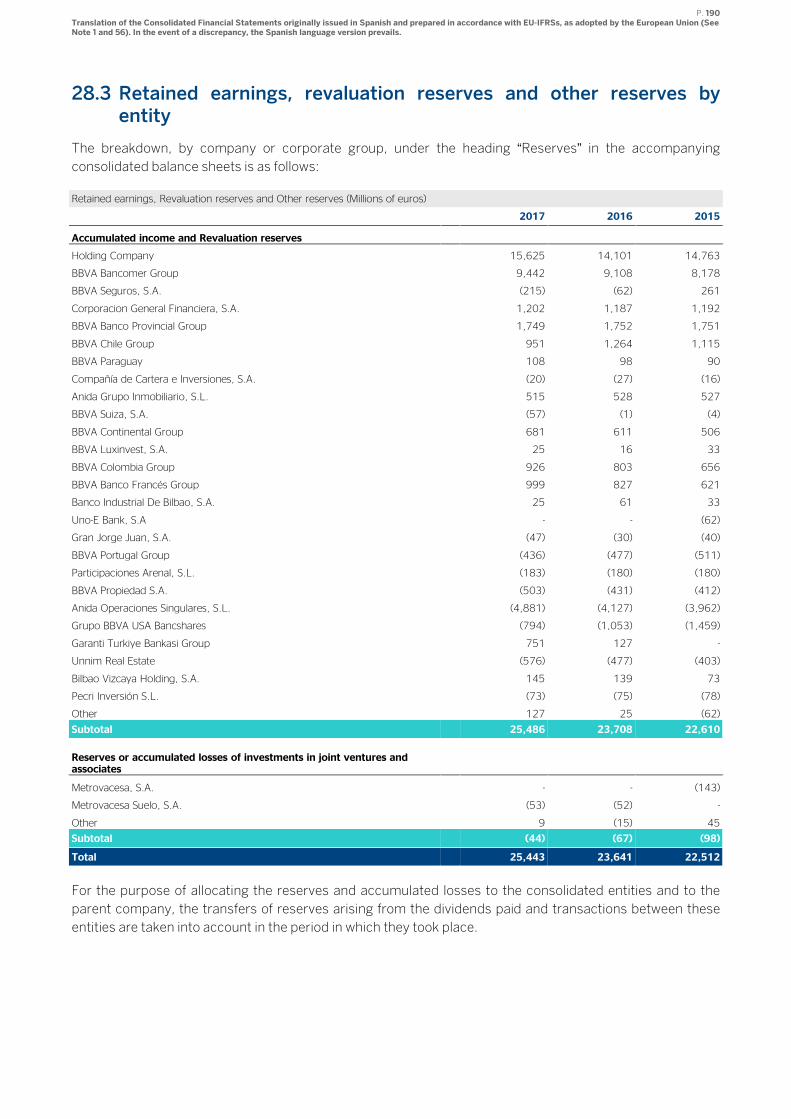
P. 190 Translation of the Consolidated Financial Statements originally issued in Spanish and prepared in accordance with EU-IFRSs, as adopted by the European Union (See Note 1 and 56). In the event of a discrepancy, the Spanish language version prevails.
28.3 Retained earnings, revaluation reserves and other reserves by entity
The breakdown, by company or corporate group, under the heading “Reserves” in the accompanying
consolidated balance sheets is as follows:
Retained earnings, Revaluation reserves and Other reserves (Millions of euros)
2017 2016 2015
Accumulated income and Revaluation reserves
Holding Company 15,625 14,101 14,763
BBVA Bancomer Group 9,442 9,108 8,178
BBVA Seguros, S.A. (215) (62) 261
Corporacion General Financiera, S.A. 1,202 1,187 1,192
BBVA Banco Provincial Group 1,749 1,752 1,751
BBVA Chile Group 951 1,264 1,115
BBVA Paraguay 108 98 90
Compañía de Cartera e Inversiones, S.A. (20) (27) (16)
Anida Grupo Inmobiliario, S.L. 515 528 527
BBVA Suiza, S.A. (57) (1) (4)
BBVA Continental Group 681 611 506
BBVA Luxinvest, S.A. 25 16 33
BBVA Colombia Group 926 803 656
BBVA Banco Francés Group 999 827 621
Banco Industrial De Bilbao, S.A. 25 61 33
Uno-E Bank, S.A - - (62)
Gran Jorge Juan, S.A. (47) (30) (40)
BBVA Portugal Group (436) (477) (511)
Participaciones Arenal, S.L. (183) (180) (180)
BBVA Propiedad S.A. (503) (431) (412)
Anida Operaciones Singulares, S.L. (4,881) (4,127) (3,962)
Grupo BBVA USA Bancshares (794) (1,053) (1,459)
Garanti Turkiye Bankasi Group 751 127 -
Unnim Real Estate (576) (477) (403)
Bilbao Vizcaya Holding, S.A. 145 139 73
Pecri Inversión S.L. (73) (75) (78)
Other 127 25 (62)
Subtotal 25,486 23,708 22,610
Reserves or accumulated losses of investments in joint ventures and associates
Metrovacesa, S.A. - - (143)
Metrovacesa Suelo, S.A. (53) (52) -
Other 9 (15) 45
Subtotal (44) (67) (98)
Total 25,443 23,641 22,512
For the purpose of allocating the reserves and accumulated losses to the consolidated entities and to the
parent company, the transfers of reserves arising from the dividends paid and transactions between these
entities are taken into account in the period in which they took place.
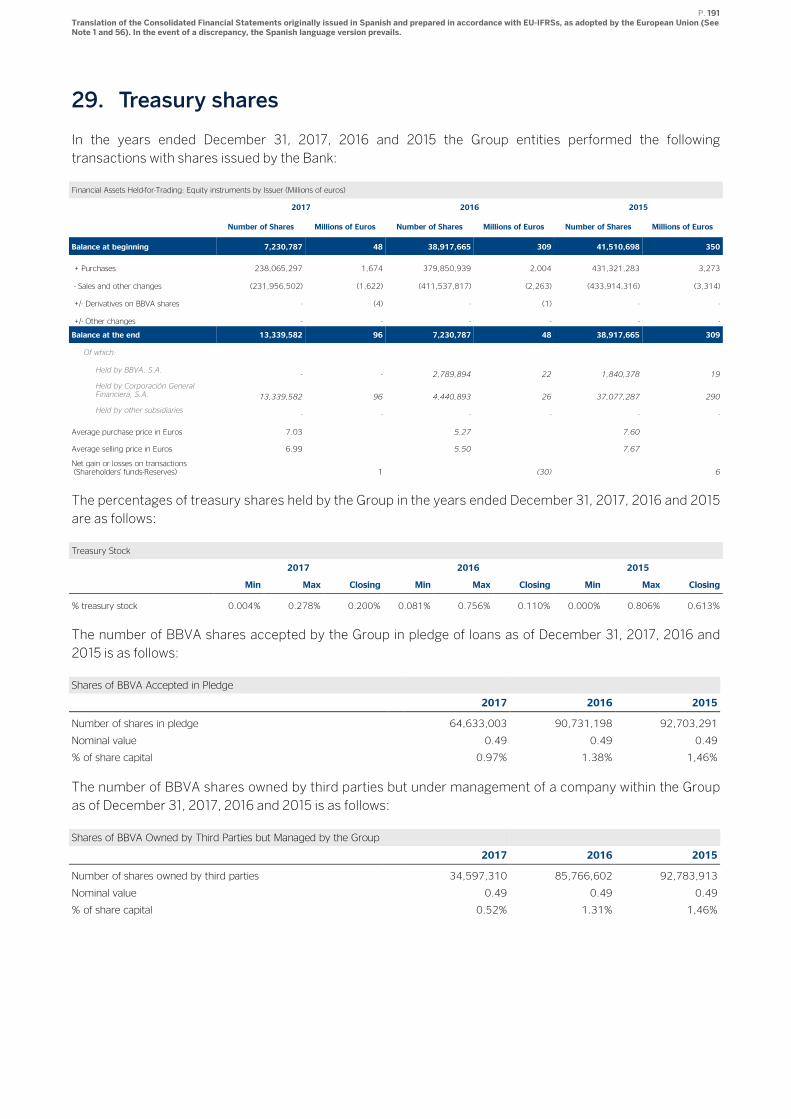
P. 191 Translation of the Consolidated Financial Statements originally issued in Spanish and prepared in accordance with EU-IFRSs, as adopted by the European Union (See Note 1 and 56). In the event of a discrepancy, the Spanish language version prevails.
29. Treasury shares
In the years ended December 31, 2017, 2016 and 2015 the Group entities performed the following
transactions with shares issued by the Bank:
Financial Assets Held-for-Trading: Equity instruments by Issuer (Millions of euros)
2017 2016 2015
Number of Shares Millions of Euros Number of Shares Millions of Euros Number of Shares Millions of Euros
Balance at beginning 7,230,787 48 38,917,665 309 41,510,698 350
+ Purchases 238,065,297 1,674 379,850,939 2,004 431,321,283 3,273
- Sales and other changes (231,956,502) (1,622) (411,537,817) (2,263) (433,914,316) (3,314)
+/- Derivatives on BBVA shares - (4) - (1) - -
+/- Other changes - - - - - -
Balance at the end 13,339,582 96 7,230,787 48 38,917,665 309
Of which:
Held by BBVA, S.A. - - 2,789,894 22 1,840,378 19
Held by Corporación General Financiera, S.A. 13,339,582 96 4,440,893 26 37,077,287 290
Held by other subsidiaries - - - - - -
Average purchase price in Euros 7.03 5.27 7.60
Average selling price in Euros 6.99 5.50 7.67
Net gain or losses on transactions (Shareholders' funds-Reserves) 1 (30) 6
The percentages of treasury shares held by the Group in the years ended December 31, 2017, 2016 and 2015
are as follows:
Treasury Stock
2017 2016 2015
Min Max Closing Min Max Closing Min Max Closing
% treasury stock 0.004% 0.278% 0.200% 0.081% 0.756% 0.110% 0.000% 0.806% 0.613%
The number of BBVA shares accepted by the Group in pledge of loans as of December 31, 2017, 2016 and
2015 is as follows:
Shares of BBVA Accepted in Pledge
2017 2016 2015
Number of shares in pledge 64,633,003 90,731,198 92,703,291
Nominal value 0.49 0.49 0.49
% of share capital 0.97% 1.38% 1,46%
The number of BBVA shares owned by third parties but under management of a company within the Group
as of December 31, 2017, 2016 and 2015 is as follows:
Shares of BBVA Owned by Third Parties but Managed by the Group
2017 2016 2015
Number of shares owned by third parties 34,597,310 85,766,602 92,783,913
Nominal value 0.49 0.49 0.49
% of share capital 0.52% 1.31% 1,46%
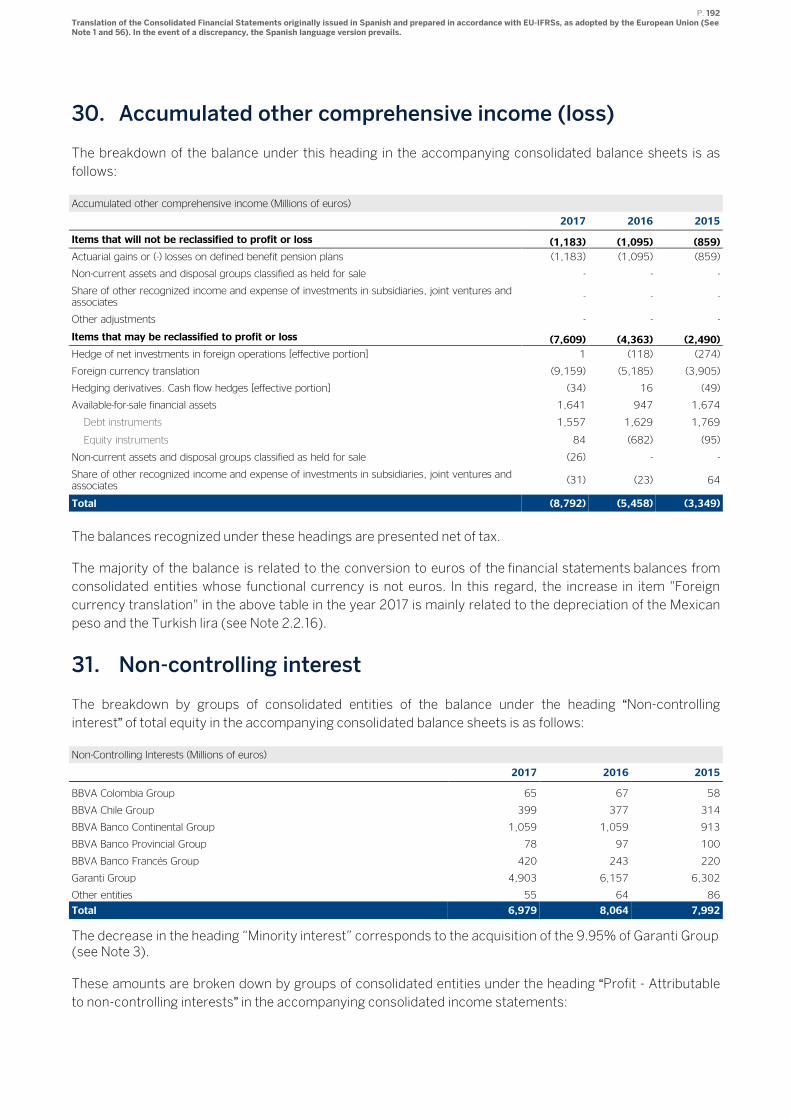
P. 192 Translation of the Consolidated Financial Statements originally issued in Spanish and prepared in accordance with EU-IFRSs, as adopted by the European Union (See Note 1 and 56). In the event of a discrepancy, the Spanish language version prevails.
30. Accumulated other comprehensive income (loss)
The breakdown of the balance under this heading in the accompanying consolidated balance sheets is as
follows:
Accumulated other comprehensive income (Millions of euros)
2017 2016 2015
Items that will not be reclassified to profit or loss (1,183) (1,095) (859)
Actuarial gains or (-) losses on defined benefit pension plans (1,183) (1,095) (859)
Non-current assets and disposal groups classified as held for sale - - -
Share of other recognized income and expense of investments in subsidiaries, joint ventures and associates
- - -
Other adjustments - - -
Items that may be reclassified to profit or loss (7,609) (4,363) (2,490)
Hedge of net investments in foreign operations [effective portion] 1 (118) (274)
Foreign currency translation (9,159) (5,185) (3,905)
Hedging derivatives. Cash flow hedges [effective portion] (34) 16 (49)
Available-for-sale financial assets 1,641 947 1,674
Debt instruments 1,557 1,629 1,769
Equity instruments 84 (682) (95)
Non-current assets and disposal groups classified as held for sale (26) - -
Share of other recognized income and expense of investments in subsidiaries, joint ventures and associates
(31) (23) 64
Total (8,792) (5,458) (3,349)
The balances recognized under these headings are presented net of tax.
The majority of the balance is related to the conversion to euros of the financial statements balances from
consolidated entities whose functional currency is not euros. In this regard, the increase in item "Foreign
currency translation" in the above table in the year 2017 is mainly related to the depreciation of the Mexican
peso and the Turkish lira (see Note 2.2.16).
31. Non-controlling interest
The breakdown by groups of consolidated entities of the balance under the heading “Non-controlling
interest” of total equity in the accompanying consolidated balance sheets is as follows:
Non-Controlling Interests (Millions of euros)
2017 2016 2015
BBVA Colombia Group 65 67 58
BBVA Chile Group 399 377 314
BBVA Banco Continental Group 1,059 1,059 913
BBVA Banco Provincial Group 78 97 100
BBVA Banco Francés Group 420 243 220
Garanti Group 4,903 6,157 6,302
Other entities 55 64 86
Total 6,979 8,064 7,992
The decrease in the heading “Minority interest” corresponds to the acquisition of the 9.95% of Garanti Group (see Note 3).
These amounts are broken down by groups of consolidated entities under the heading “Profit - Attributable
to non-controlling interests” in the accompanying consolidated income statements:
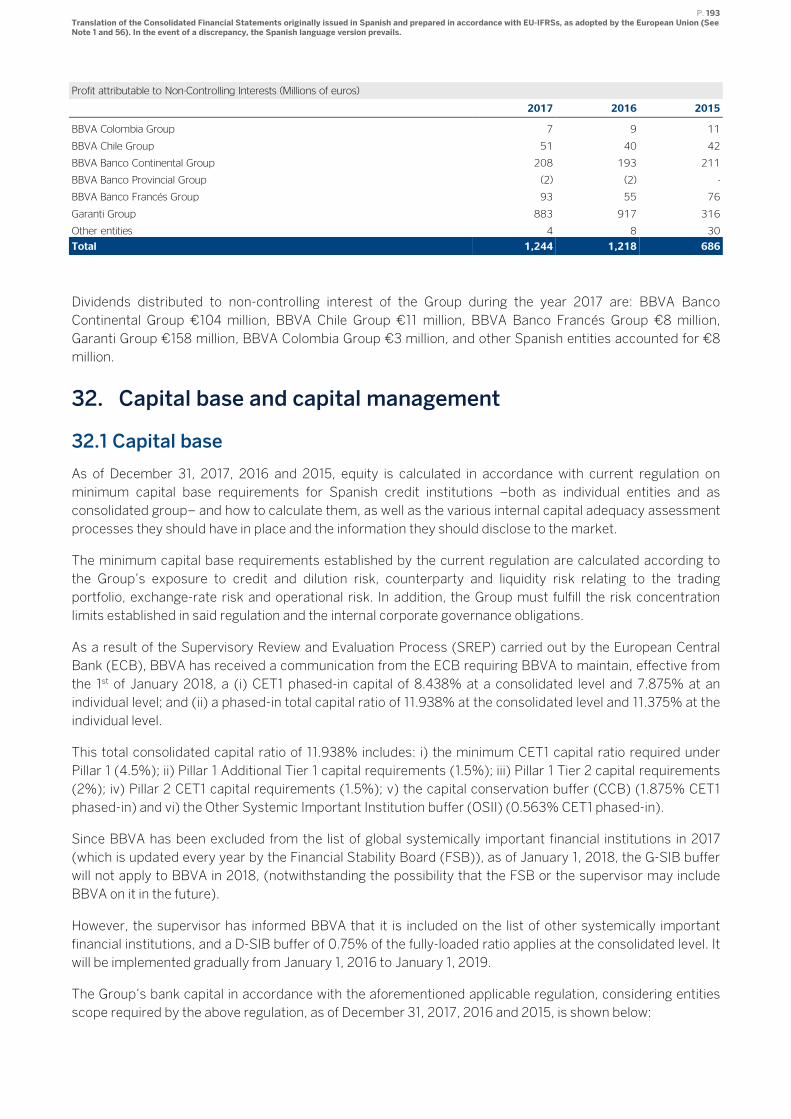
P. 193 Translation of the Consolidated Financial Statements originally issued in Spanish and prepared in accordance with EU-IFRSs, as adopted by the European Union (See Note 1 and 56). In the event of a discrepancy, the Spanish language version prevails.
Profit attributable to Non-Controlling Interests (Millions of euros)
2017 2016 2015
BBVA Colombia Group 7 9 11
BBVA Chile Group 51 40 42
BBVA Banco Continental Group 208 193 211
BBVA Banco Provincial Group (2) (2) -
BBVA Banco Francés Group 93 55 76
Garanti Group 883 917 316
Other entities 4 8 30
Total 1,244 1,218 686
Dividends distributed to non-controlling interest of the Group during the year 2017 are: BBVA Banco
Continental Group €104 million, BBVA Chile Group €11 million, BBVA Banco Francés Group €8 million,
Garanti Group €158 million, BBVA Colombia Group €3 million, and other Spanish entities accounted for €8
million.
32. Capital base and capital management
32.1 Capital base
As of December 31, 2017, 2016 and 2015, equity is calculated in accordance with current regulation on
minimum capital base requirements for Spanish credit institutions –both as individual entities and as
consolidated group– and how to calculate them, as well as the various internal capital adequacy assessment
processes they should have in place and the information they should disclose to the market.
The minimum capital base requirements established by the current regulation are calculated according to
the Group’s exposure to credit and dilution risk, counterparty and liquidity risk relating to the trading
portfolio, exchange-rate risk and operational risk. In addition, the Group must fulfill the risk concentration
limits established in said regulation and the internal corporate governance obligations.
As a result of the Supervisory Review and Evaluation Process (SREP) carried out by the European Central
Bank (ECB), BBVA has received a communication from the ECB requiring BBVA to maintain, effective from
the 1st of January 2018, a (i) CET1 phased-in capital of 8.438% at a consolidated level and 7.875% at an
individual level; and (ii) a phased-in total capital ratio of 11.938% at the consolidated level and 11.375% at the
individual level.
This total consolidated capital ratio of 11.938% includes: i) the minimum CET1 capital ratio required under
Pillar 1 (4.5%); ii) Pillar 1 Additional Tier 1 capital requirements (1.5%); iii) Pillar 1 Tier 2 capital requirements
(2%); iv) Pillar 2 CET1 capital requirements (1.5%); v) the capital conservation buffer (CCB) (1.875% CET1
phased-in) and vi) the Other Systemic Important Institution buffer (OSII) (0.563% CET1 phased-in).
Since BBVA has been excluded from the list of global systemically important financial institutions in 2017
(which is updated every year by the Financial Stability Board (FSB)), as of January 1, 2018, the G-SIB buffer
will not apply to BBVA in 2018, (notwithstanding the possibility that the FSB or the supervisor may include
BBVA on it in the future).
However, the supervisor has informed BBVA that it is included on the list of other systemically important
financial institutions, and a D-SIB buffer of 0.75% of the fully-loaded ratio applies at the consolidated level. It
will be implemented gradually from January 1, 2016 to January 1, 2019.
The Group’s bank capital in accordance with the aforementioned applicable regulation, considering entities
scope required by the above regulation, as of December 31, 2017, 2016 and 2015, is shown below:
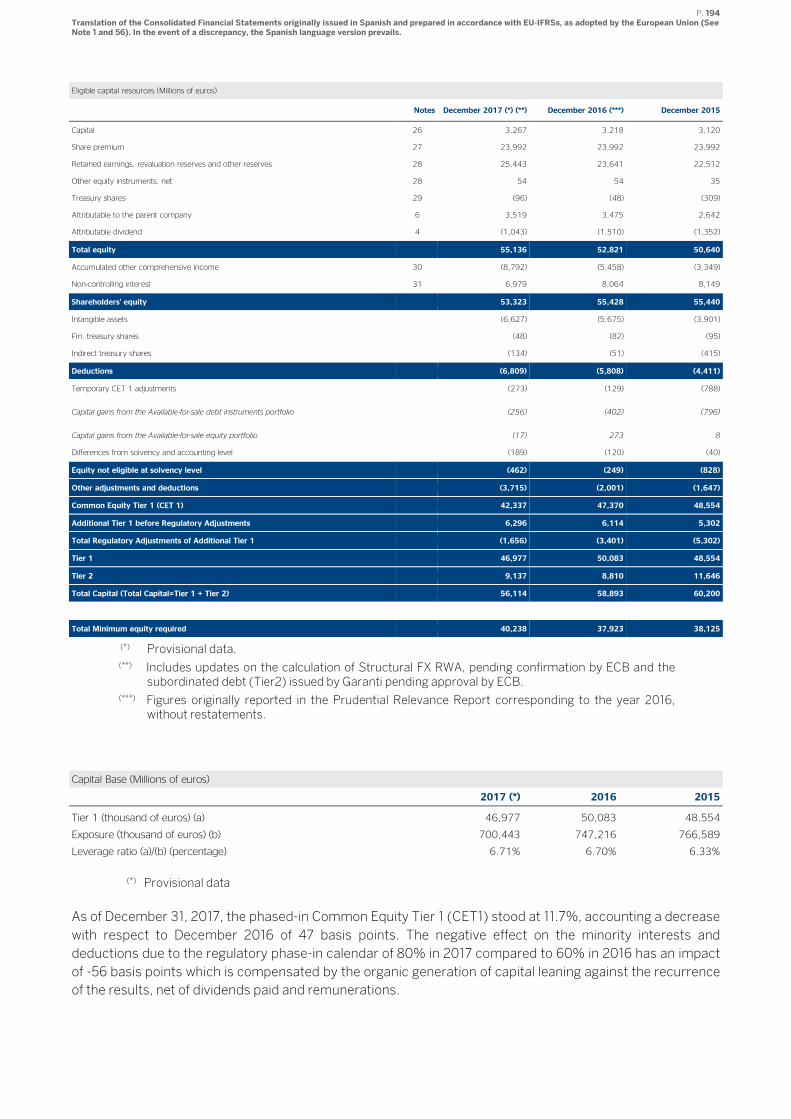
P. 194 Translation of the Consolidated Financial Statements originally issued in Spanish and prepared in accordance with EU-IFRSs, as adopted by the European Union (See Note 1 and 56). In the event of a discrepancy, the Spanish language version prevails.
Eligible capital resources (Millions of euros)
Notes December 2017 (*) (**) December 2016 (***) December 2015
Capital 26 3,267 3,218 3,120
Share premium 27 23,992 23,992 23,992
Retained earnings, revaluation reserves and other reserves 28 25,443 23,641 22,512
Other equity instruments, net 28 54 54 35
Treasury shares 29 (96) (48) (309)
Attributable to the parent company 6 3,519 3,475 2,642
Attributable dividend 4 (1,043) (1,510) (1,352)
Total equity 55,136 52,821 50,640
Accumulated other comprehensive income 30 (8,792) (5,458) (3,349)
Non-controlling interest 31 6,979 8,064 8,149
Shareholders' equity 53,323 55,428 55,440
Intangible assets (6,627) (5,675) (3,901)
Fin. treasury shares (48) (82) (95)
Indirect treasury shares (134) (51) (415)
Deductions (6,809) (5,808) (4,411)
Temporary CET 1 adjustments (273) (129) (788)
Capital gains from the Available-for-sale debt instruments portfolio (256) (402) (796)
Capital gains from the Available-for-sale equity portfolio (17) 273 8
Differences from solvency and accounting level (189) (120) (40)
Equity not eligible at solvency level (462) (249) (828)
Other adjustments and deductions (3,715) (2,001) (1,647)
Common Equity Tier 1 (CET 1) 42,337 47,370 48,554
Additional Tier 1 before Regulatory Adjustments 6,296 6,114 5,302
Total Regulatory Adjustments of Additional Tier 1 (1,656) (3,401) (5,302)
Tier 1 46,977 50,083 48,554
Tier 2 9,137 8,810 11,646
Total Capital (Total Capital=Tier 1 + Tier 2) 56,114 58,893 60,200
Total Minimum equity required 40,238 37,923 38,125
(*) Provisional data. (**) Includes updates on the calculation of Structural FX RWA, pending confirmation by ECB and the
subordinated debt (Tier2) issued by Garanti pending approval by ECB. (***) Figures originally reported in the Prudential Relevance Report corresponding to the year 2016,
without restatements.
Capital Base (Millions of euros)
2017 (*) 2016 2015
Tier 1 (thousand of euros) (a) 46,977 50,083 48,554
Exposure (thousand of euros) (b) 700,443 747,216 766,589
Leverage ratio (a)/(b) (percentage) 6.71% 6.70% 6.33%
(*) Provisional data
As of December 31, 2017, the phased-in Common Equity Tier 1 (CET1) stood at 11.7%, accounting a decrease
with respect to December 2016 of 47 basis points. The negative effect on the minority interests and
deductions due to the regulatory phase-in calendar of 80% in 2017 compared to 60% in 2016 has an impact
of -56 basis points which is compensated by the organic generation of capital leaning against the recurrence
of the results, net of dividends paid and remunerations.
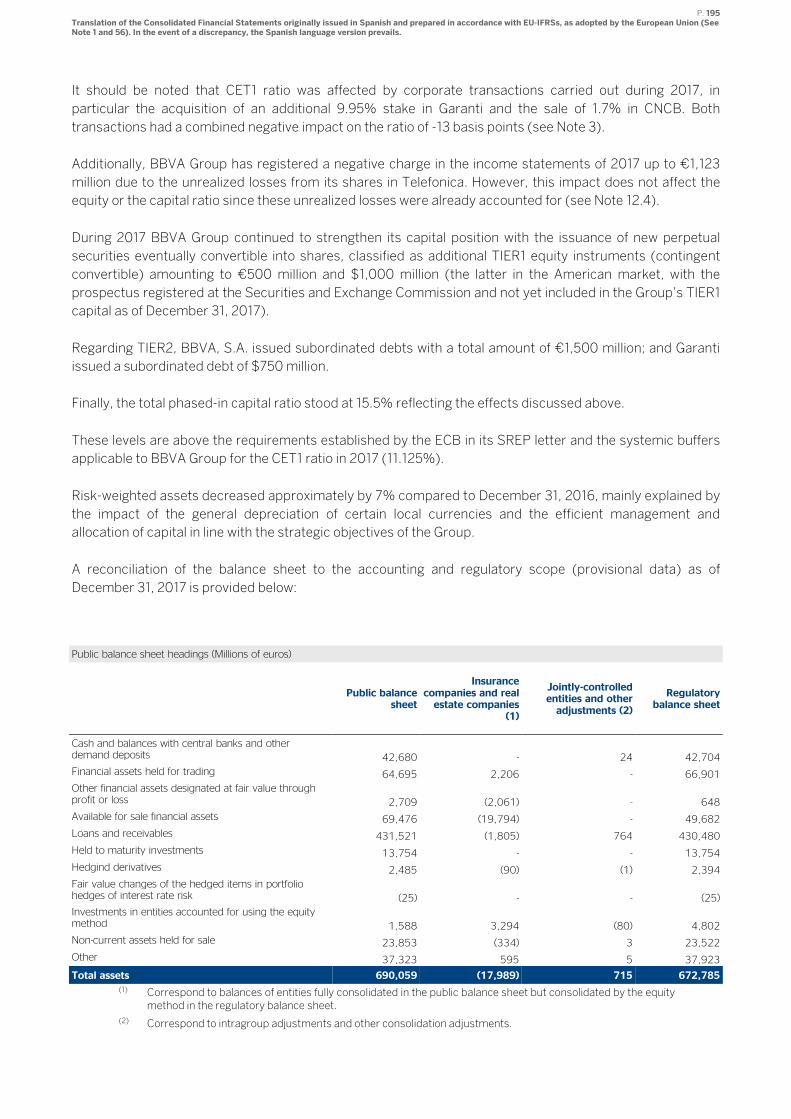
P. 195 Translation of the Consolidated Financial Statements originally issued in Spanish and prepared in accordance with EU-IFRSs, as adopted by the European Union (See Note 1 and 56). In the event of a discrepancy, the Spanish language version prevails.
It should be noted that CET1 ratio was affected by corporate transactions carried out during 2017, in
particular the acquisition of an additional 9.95% stake in Garanti and the sale of 1.7% in CNCB. Both
transactions had a combined negative impact on the ratio of -13 basis points (see Note 3).
Additionally, BBVA Group has registered a negative charge in the income statements of 2017 up to €1,123
million due to the unrealized losses from its shares in Telefonica. However, this impact does not affect the
equity or the capital ratio since these unrealized losses were already accounted for (see Note 12.4).
During 2017 BBVA Group continued to strengthen its capital position with the issuance of new perpetual
securities eventually convertible into shares, classified as additional TIER1 equity instruments (contingent
convertible) amounting to €500 million and $1,000 million (the latter in the American market, with the
prospectus registered at the Securities and Exchange Commission and not yet included in the Group’s TIER1
capital as of December 31, 2017).
Regarding TIER2, BBVA, S.A. issued subordinated debts with a total amount of €1,500 million; and Garanti
issued a subordinated debt of $750 million.
Finally, the total phased-in capital ratio stood at 15.5% reflecting the effects discussed above.
These levels are above the requirements established by the ECB in its SREP letter and the systemic buffers
applicable to BBVA Group for the CET1 ratio in 2017 (11.125%).
Risk-weighted assets decreased approximately by 7% compared to December 31, 2016, mainly explained by
the impact of the general depreciation of certain local currencies and the efficient management and
allocation of capital in line with the strategic objectives of the Group.
A reconciliation of the balance sheet to the accounting and regulatory scope (provisional data) as of
December 31, 2017 is provided below:
Public balance sheet headings (Millions of euros)
Public balance
sheet
Insurance companies and real estate companies
(1)
Jointly-controlled entities and other adjustments (2)
Regulatory balance sheet
Cash and balances with central banks and other demand deposits 42,680 - 24 42,704
Financial assets held for trading 64,695 2,206 - 66,901
Other financial assets designated at fair value through profit or loss 2,709 (2,061) - 648
Available for sale financial assets 69,476 (19,794) - 49,682
Loans and receivables 431,521 (1,805) 764 430,480
Held to maturity investments 13,754 - - 13,754
Hedgind derivatives 2,485 (90) (1) 2,394
Fair value changes of the hedged items in portfolio hedges of interest rate risk (25) - - (25)
Investments in entities accounted for using the equity method 1,588 3,294 (80) 4,802
Non-current assets held for sale 23,853 (334) 3 23,522
Other 37,323 595 5 37,923
Total assets 690,059 (17,989) 715 672,785
(1) Correspond to balances of entities fully consolidated in the public balance sheet but consolidated by the equity method in the regulatory balance sheet.
(2) Correspond to intragroup adjustments and other consolidation adjustments.
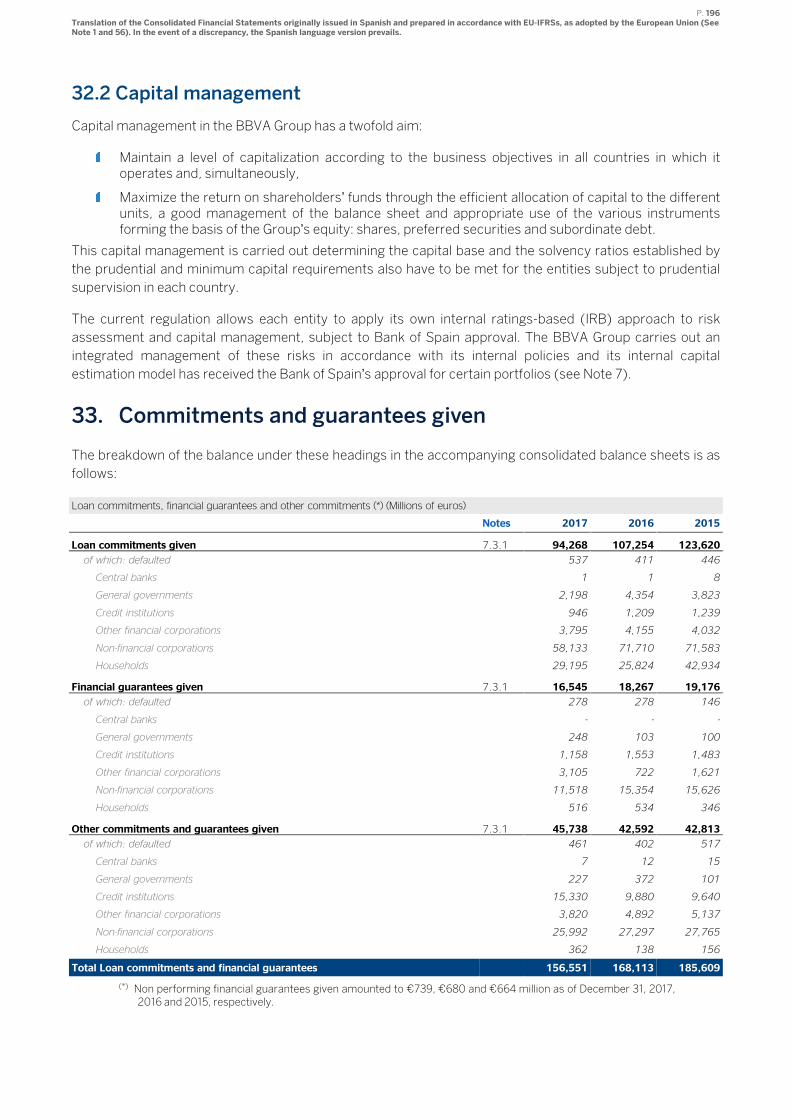
P. 196 Translation of the Consolidated Financial Statements originally issued in Spanish and prepared in accordance with EU-IFRSs, as adopted by the European Union (See Note 1 and 56). In the event of a discrepancy, the Spanish language version prevails.
32.2 Capital management
Capital management in the BBVA Group has a twofold aim:
Maintain a level of capitalization according to the business objectives in all countries in which it operates and, simultaneously,
Maximize the return on shareholders’ funds through the efficient allocation of capital to the different units, a good management of the balance sheet and appropriate use of the various instruments forming the basis of the Group’s equity: shares, preferred securities and subordinate debt.
This capital management is carried out determining the capital base and the solvency ratios established by
the prudential and minimum capital requirements also have to be met for the entities subject to prudential
supervision in each country.
The current regulation allows each entity to apply its own internal ratings-based (IRB) approach to risk
assessment and capital management, subject to Bank of Spain approval. The BBVA Group carries out an
integrated management of these risks in accordance with its internal policies and its internal capital
estimation model has received the Bank of Spain’s approval for certain portfolios (see Note 7).
33. Commitments and guarantees given
The breakdown of the balance under these headings in the accompanying consolidated balance sheets is as
follows:
Loan commitments, financial guarantees and other commitments (*) (Millions of euros)
Notes 2017 2016 2015
Loan commitments given 7.3.1 94,268 107,254 123,620
of which: defaulted 537 411 446
Central banks 1 1 8
General governments 2,198 4,354 3,823
Credit institutions 946 1,209 1,239
Other financial corporations 3,795 4,155 4,032
Non-financial corporations 58,133 71,710 71,583
Households 29,195 25,824 42,934
Financial guarantees given 7.3.1 16,545 18,267 19,176
of which: defaulted 278 278 146
Central banks - - -
General governments 248 103 100
Credit institutions 1,158 1,553 1,483
Other financial corporations 3,105 722 1,621
Non-financial corporations 11,518 15,354 15,626
Households 516 534 346
Other commitments and guarantees given 7.3.1 45,738 42,592 42,813
of which: defaulted 461 402 517
Central banks 7 12 15
General governments 227 372 101
Credit institutions 15,330 9,880 9,640
Other financial corporations 3,820 4,892 5,137
Non-financial corporations 25,992 27,297 27,765
Households 362 138 156
Total Loan commitments and financial guarantees 156,551 168,113 185,609
(*) Non performing financial guarantees given amounted to €739, €680 and €664 million as of December 31, 2017, 2016 and 2015, respectively.
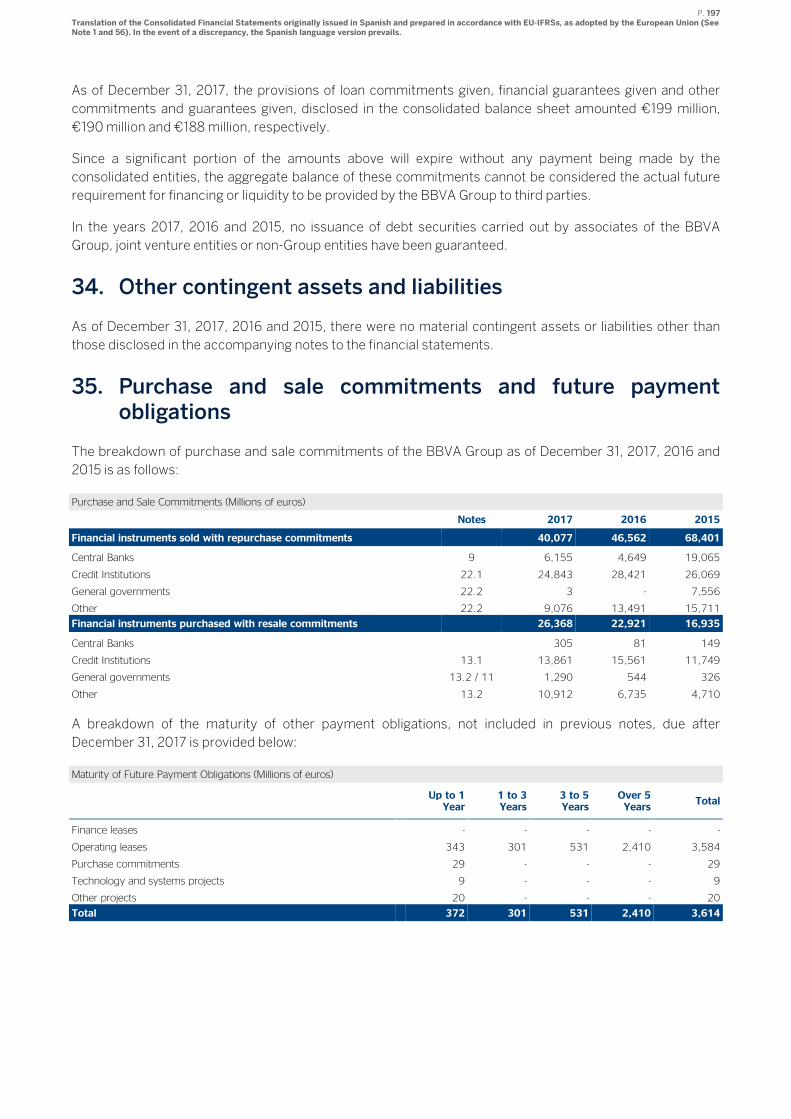
P. 197 Translation of the Consolidated Financial Statements originally issued in Spanish and prepared in accordance with EU-IFRSs, as adopted by the European Union (See Note 1 and 56). In the event of a discrepancy, the Spanish language version prevails.
As of December 31, 2017, the provisions of loan commitments given, financial guarantees given and other
commitments and guarantees given, disclosed in the consolidated balance sheet amounted €199 million,
€190 million and €188 million, respectively.
Since a significant portion of the amounts above will expire without any payment being made by the
consolidated entities, the aggregate balance of these commitments cannot be considered the actual future
requirement for financing or liquidity to be provided by the BBVA Group to third parties.
In the years 2017, 2016 and 2015, no issuance of debt securities carried out by associates of the BBVA
Group, joint venture entities or non-Group entities have been guaranteed.
34. Other contingent assets and liabilities
As of December 31, 2017, 2016 and 2015, there were no material contingent assets or liabilities other than
those disclosed in the accompanying notes to the financial statements.
35. Purchase and sale commitments and future payment obligations
The breakdown of purchase and sale commitments of the BBVA Group as of December 31, 2017, 2016 and
2015 is as follows:
Purchase and Sale Commitments (Millions of euros)
Notes 2017 2016 2015
Financial instruments sold with repurchase commitments 40,077 46,562 68,401
Central Banks 9 6,155 4,649 19,065
Credit Institutions 22.1 24,843 28,421 26,069
General governments 22.2 3 - 7,556
Other 22.2 9,076 13,491 15,711
Financial instruments purchased with resale commitments 26,368 22,921 16,935
Central Banks 305 81 149
Credit Institutions 13.1 13,861 15,561 11,749
General governments 13.2 / 11 1,290 544 326
Other 13.2 10,912 6,735 4,710
A breakdown of the maturity of other payment obligations, not included in previous notes, due after
December 31, 2017 is provided below:
Maturity of Future Payment Obligations (Millions of euros)
Up to 1 Year
1 to 3 Years
3 to 5 Years
Over 5 Years
Total
Finance leases - - - - -
Operating leases 343 301 531 2,410 3,584
Purchase commitments 29 - - - 29
Technology and systems projects 9 - - - 9
Other projects 20 - - - 20
Total 372 301 531 2,410 3,614
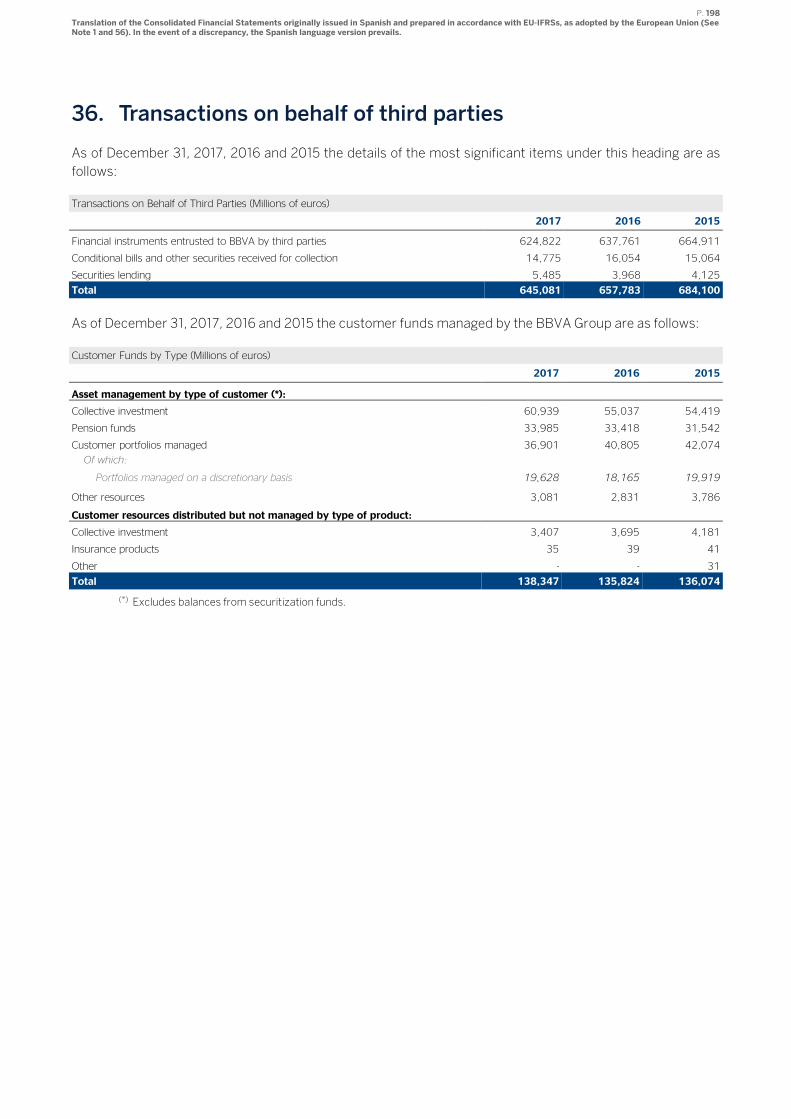
P. 198 Translation of the Consolidated Financial Statements originally issued in Spanish and prepared in accordance with EU-IFRSs, as adopted by the European Union (See Note 1 and 56). In the event of a discrepancy, the Spanish language version prevails.
36. Transactions on behalf of third parties
As of December 31, 2017, 2016 and 2015 the details of the most significant items under this heading are as
follows:
Transactions on Behalf of Third Parties (Millions of euros)
2017 2016 2015
Financial instruments entrusted to BBVA by third parties 624,822 637,761 664,911
Conditional bills and other securities received for collection 14,775 16,054 15,064
Securities lending 5,485 3,968 4,125
Total 645,081 657,783 684,100
As of December 31, 2017, 2016 and 2015 the customer funds managed by the BBVA Group are as follows:
Customer Funds by Type (Millions of euros)
2017 2016 2015
Asset management by type of customer (*):
Collective investment 60,939 55,037 54,419
Pension funds 33,985 33,418 31,542
Customer portfolios managed 36,901 40,805 42,074
Of which:
Portfolios managed on a discretionary basis 19,628 18,165 19,919
Other resources 3,081 2,831 3,786
Customer resources distributed but not managed by type of product:
Collective investment 3,407 3,695 4,181
Insurance products 35 39 41
Other - - 31
Total 138,347 135,824 136,074
(*) Excludes balances from securitization funds.
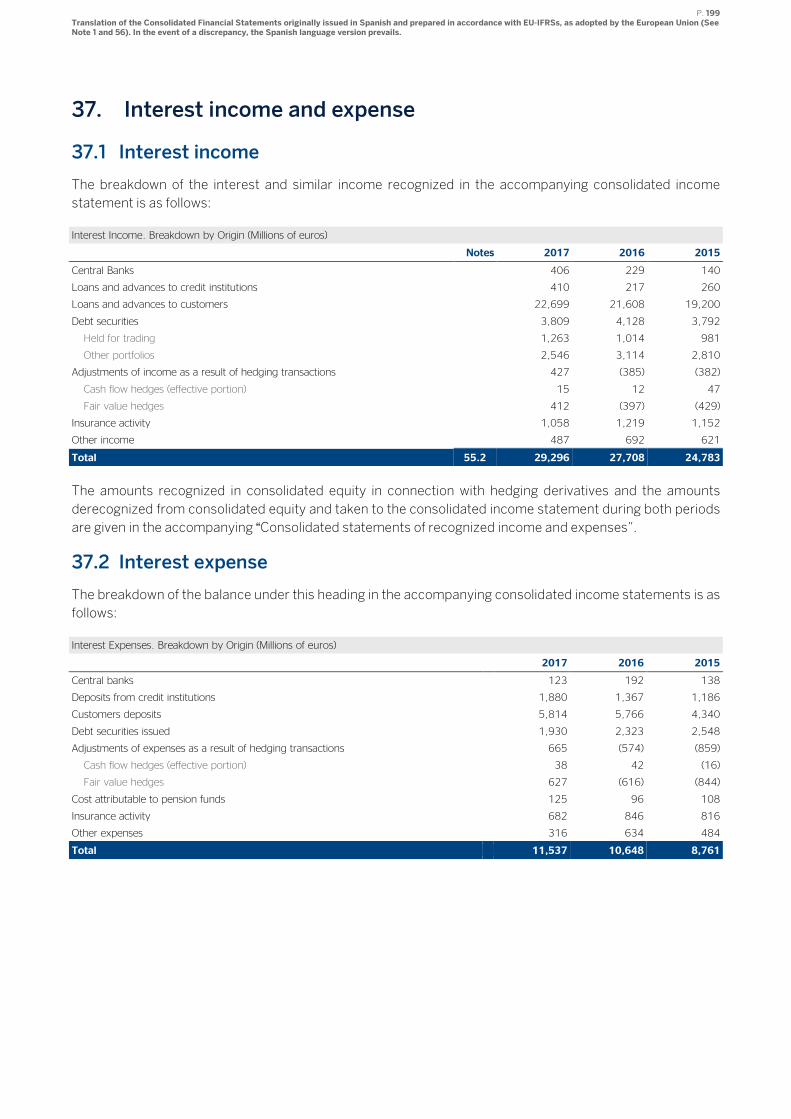
P. 199 Translation of the Consolidated Financial Statements originally issued in Spanish and prepared in accordance with EU-IFRSs, as adopted by the European Union (See Note 1 and 56). In the event of a discrepancy, the Spanish language version prevails.
37. Interest income and expense
37.1 Interest income
The breakdown of the interest and similar income recognized in the accompanying consolidated income
statement is as follows:
Interest Income. Breakdown by Origin (Millions of euros)
Notes 2017 2016 2015
Central Banks 406 229 140
Loans and advances to credit institutions 410 217 260
Loans and advances to customers 22,699 21,608 19,200
Debt securities 3,809 4,128 3,792
Held for trading 1,263 1,014 981
Other portfolios 2,546 3,114 2,810
Adjustments of income as a result of hedging transactions 427 (385) (382)
Cash flow hedges (effective portion) 15 12 47
Fair value hedges 412 (397) (429)
Insurance activity 1,058 1,219 1,152
Other income 487 692 621
Total 55.2 29,296 27,708 24,783
The amounts recognized in consolidated equity in connection with hedging derivatives and the amounts
derecognized from consolidated equity and taken to the consolidated income statement during both periods
are given in the accompanying “Consolidated statements of recognized income and expenses”.
37.2 Interest expense
The breakdown of the balance under this heading in the accompanying consolidated income statements is as
follows:
Interest Expenses. Breakdown by Origin (Millions of euros)
2017 2016 2015
Central banks 123 192 138
Deposits from credit institutions 1,880 1,367 1,186
Customers deposits 5,814 5,766 4,340
Debt securities issued 1,930 2,323 2,548
Adjustments of expenses as a result of hedging transactions 665 (574) (859)
Cash flow hedges (effective portion) 38 42 (16)
Fair value hedges 627 (616) (844)
Cost attributable to pension funds 125 96 108
Insurance activity 682 846 816
Other expenses 316 634 484
Total 11,537 10,648 8,761
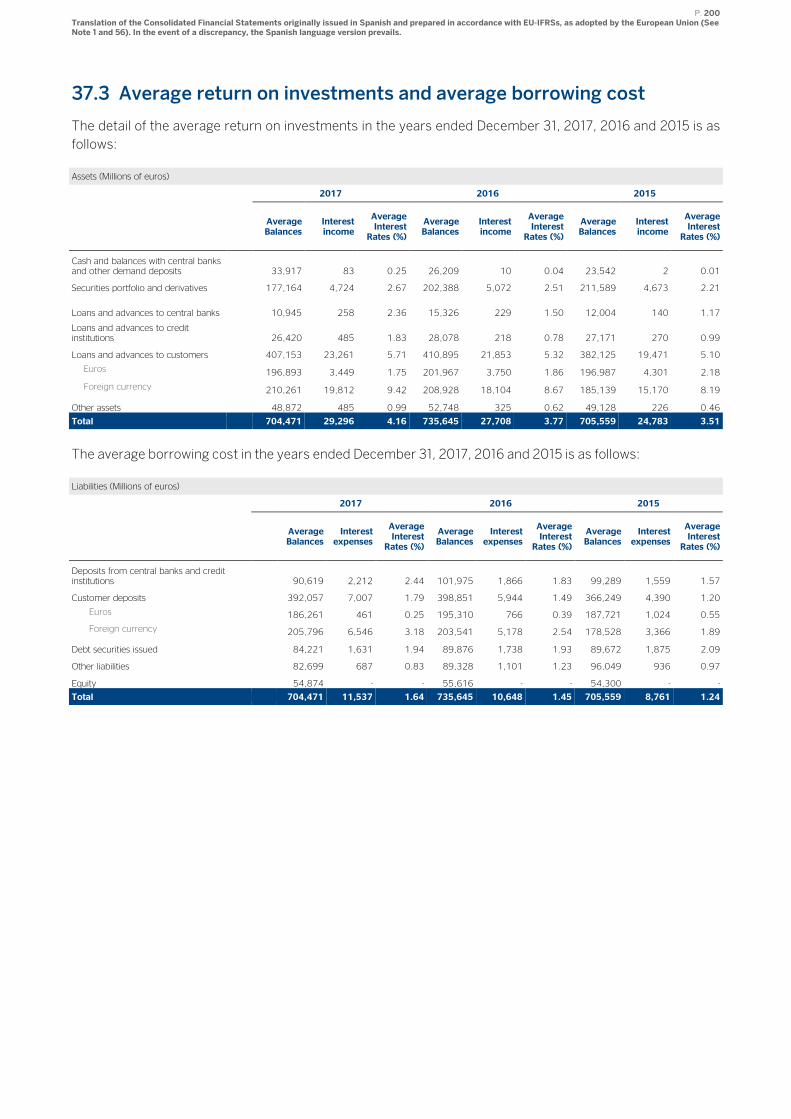
P. 200 Translation of the Consolidated Financial Statements originally issued in Spanish and prepared in accordance with EU-IFRSs, as adopted by the European Union (See Note 1 and 56). In the event of a discrepancy, the Spanish language version prevails.
37.3 Average return on investments and average borrowing cost
The detail of the average return on investments in the years ended December 31, 2017, 2016 and 2015 is as
follows:
Assets (Millions of euros)
2017 2016 2015
Average Balances
Interest income
Average Interest Rates (%)
Average Balances
Interest income
Average Interest Rates (%)
Average Balances
Interest income
Average Interest Rates (%)
Cash and balances with central banks and other demand deposits 33,917 83 0.25 26,209 10 0.04 23,542 2 0.01
Securities portfolio and derivatives 177,164 4,724 2.67 202,388 5,072 2.51 211,589 4,673 2.21
Loans and advances to central banks 10,945 258 2.36 15,326 229 1.50 12,004 140 1.17
Loans and advances to credit institutions 26,420 485 1.83 28,078 218 0.78 27,171 270 0.99
Loans and advances to customers 407,153 23,261 5.71 410,895 21,853 5.32 382,125 19,471 5.10
Euros 196,893 3,449 1.75 201,967 3,750 1.86 196,987 4,301 2.18
Foreign currency 210,261 19,812 9.42 208,928 18,104 8.67 185,139 15,170 8.19
Other assets 48,872 485 0.99 52,748 325 0.62 49,128 226 0.46
Total 704,471 29,296 4.16 735,645 27,708 3.77 705,559 24,783 3.51
The average borrowing cost in the years ended December 31, 2017, 2016 and 2015 is as follows:
Liabilities (Millions of euros)
2017 2016 2015
Average Balances
Interest expenses
Average Interest Rates (%)
Average Balances
Interest expenses
Average Interest Rates (%)
Average Balances
Interest expenses
Average Interest Rates (%)
Deposits from central banks and credit institutions 90,619 2,212 2.44 101,975 1,866 1.83 99,289 1,559 1.57
Customer deposits 392,057 7,007 1.79 398,851 5,944 1.49 366,249 4,390 1.20
Euros 186,261 461 0.25 195,310 766 0.39 187,721 1,024 0.55
Foreign currency 205,796 6,546 3.18 203,541 5,178 2.54 178,528 3,366 1.89
Debt securities issued 84,221 1,631 1.94 89,876 1,738 1.93 89,672 1,875 2.09
Other liabilities 82,699 687 0.83 89,328 1,101 1.23 96,049 936 0.97
Equity 54,874 - - 55,616 - - 54,300 - -
Total 704,471 11,537 1.64 735,645 10,648 1.45 705,559 8,761 1.24
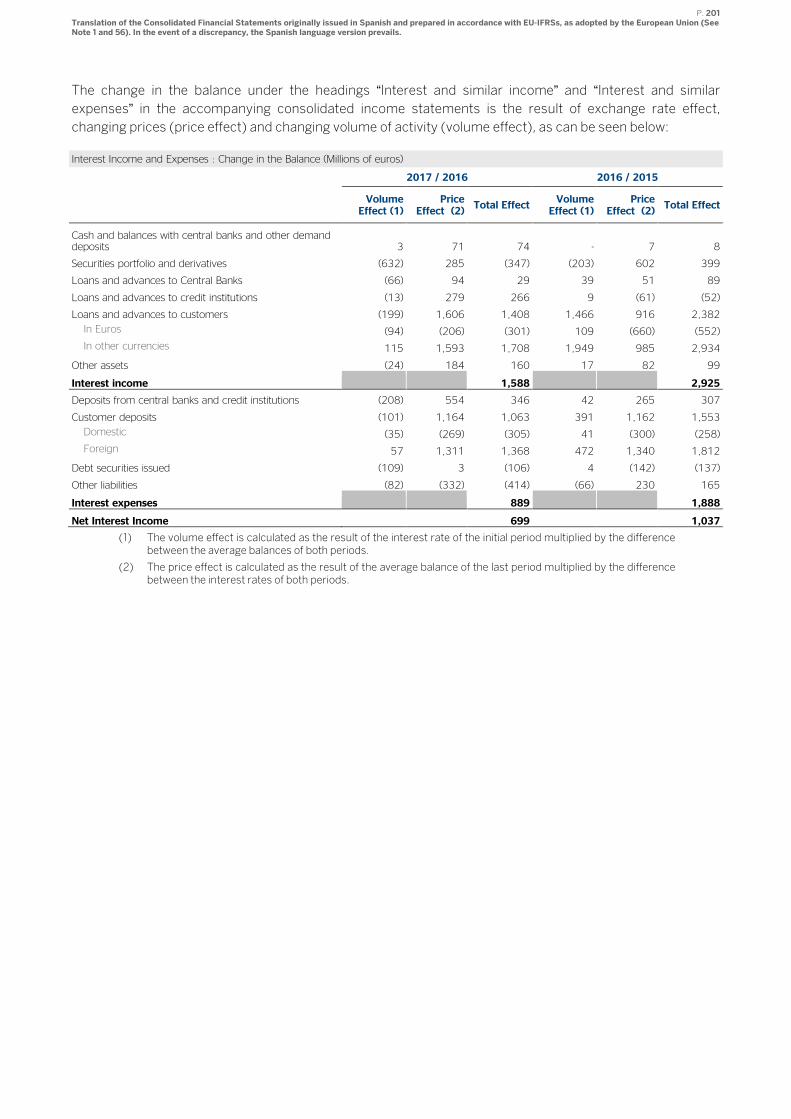
P. 201 Translation of the Consolidated Financial Statements originally issued in Spanish and prepared in accordance with EU-IFRSs, as adopted by the European Union (See Note 1 and 56). In the event of a discrepancy, the Spanish language version prevails.
The change in the balance under the headings “Interest and similar income” and “Interest and similar
expenses” in the accompanying consolidated income statements is the result of exchange rate effect,
changing prices (price effect) and changing volume of activity (volume effect), as can be seen below:
Interest Income and Expenses : Change in the Balance (Millions of euros)
2017 / 2016 2016 / 2015
Volume Effect (1)
Price Effect (2)
Total Effect Volume Effect (1)
Price Effect (2)
Total Effect
Cash and balances with central banks and other demand deposits 3 71 74 - 7 8
Securities portfolio and derivatives (632) 285 (347) (203) 602 399
Loans and advances to Central Banks (66) 94 29 39 51 89
Loans and advances to credit institutions (13) 279 266 9 (61) (52)
Loans and advances to customers (199) 1,606 1,408 1,466 916 2,382
In Euros (94) (206) (301) 109 (660) (552)
In other currencies 115 1,593 1,708 1,949 985 2,934
Other assets (24) 184 160 17 82 99
Interest income 1,588 2,925
Deposits from central banks and credit institutions (208) 554 346 42 265 307
Customer deposits (101) 1,164 1,063 391 1,162 1,553
Domestic (35) (269) (305) 41 (300) (258)
Foreign 57 1,311 1,368 472 1,340 1,812
Debt securities issued (109) 3 (106) 4 (142) (137)
Other liabilities (82) (332) (414) (66) 230 165
Interest expenses 889 1,888
Net Interest Income 699 1,037
(1) The volume effect is calculated as the result of the interest rate of the initial period multiplied by the difference between the average balances of both periods.
(2) The price effect is calculated as the result of the average balance of the last period multiplied by the difference between the interest rates of both periods.
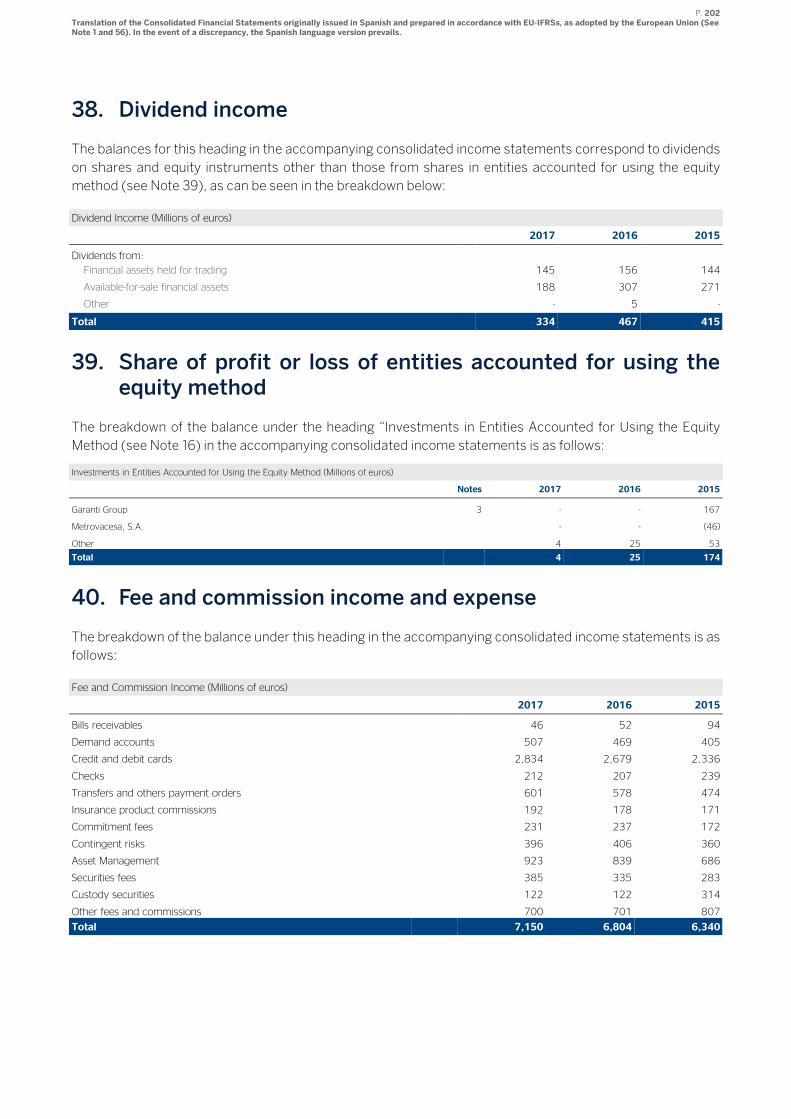
P. 202 Translation of the Consolidated Financial Statements originally issued in Spanish and prepared in accordance with EU-IFRSs, as adopted by the European Union (See Note 1 and 56). In the event of a discrepancy, the Spanish language version prevails.
38. Dividend income
The balances for this heading in the accompanying consolidated income statements correspond to dividends
on shares and equity instruments other than those from shares in entities accounted for using the equity
method (see Note 39), as can be seen in the breakdown below:
Dividend Income (Millions of euros)
2017 2016 2015
Dividends from:
Financial assets held for trading 145 156 144
Available-for-sale financial assets 188 307 271
Other - 5 -
Total 334 467 415
39. Share of profit or loss of entities accounted for using the equity method
The breakdown of the balance under the heading “Investments in Entities Accounted for Using the Equity
Method (see Note 16) in the accompanying consolidated income statements is as follows:
Investments in Entities Accounted for Using the Equity Method (Millions of euros)
Notes 2017 2016 2015
Garanti Group 3 - - 167
Metrovacesa, S.A. - - (46)
Other 4 25 53
Total 4 25 174
40. Fee and commission income and expense
The breakdown of the balance under this heading in the accompanying consolidated income statements is as
follows:
Fee and Commission Income (Millions of euros)
2017 2016 2015
Bills receivables 46 52 94
Demand accounts 507 469 405
Credit and debit cards 2,834 2,679 2,336
Checks 212 207 239
Transfers and others payment orders 601 578 474
Insurance product commissions 192 178 171
Commitment fees 231 237 172
Contingent risks 396 406 360
Asset Management 923 839 686
Securities fees 385 335 283
Custody securities 122 122 314
Other fees and commissions 700 701 807
Total 7,150 6,804 6,340
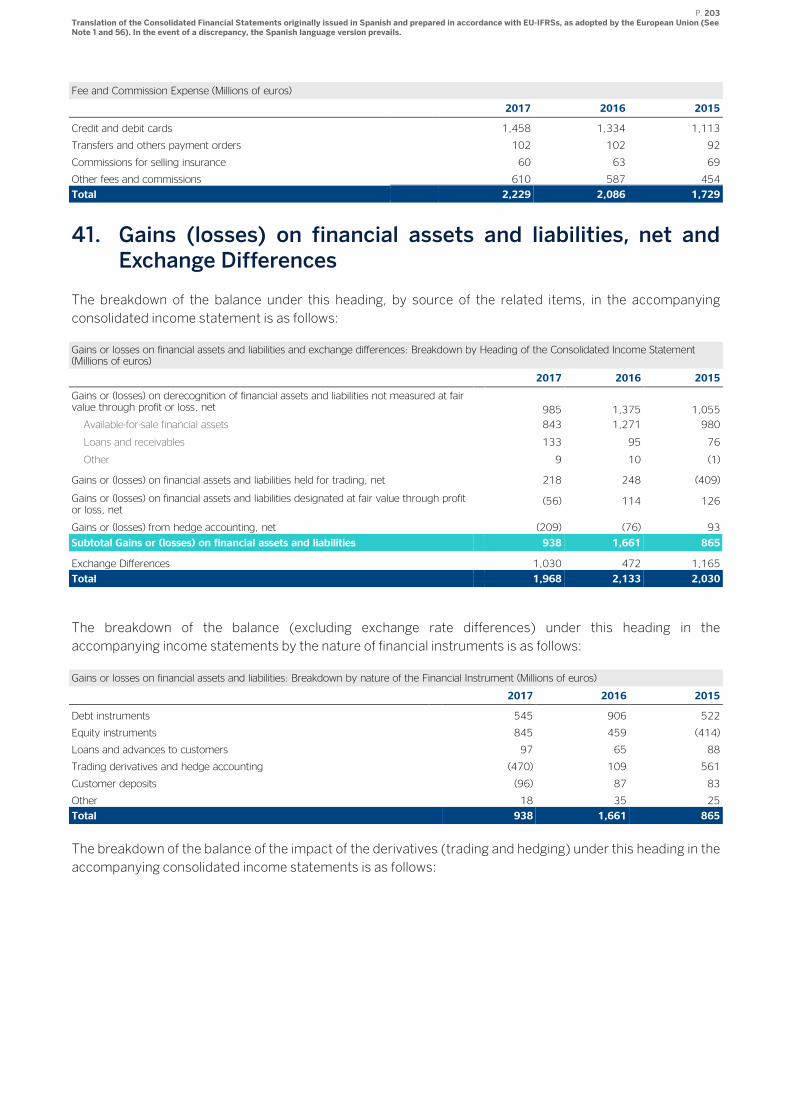
P. 203 Translation of the Consolidated Financial Statements originally issued in Spanish and prepared in accordance with EU-IFRSs, as adopted by the European Union (See Note 1 and 56). In the event of a discrepancy, the Spanish language version prevails.
Fee and Commission Expense (Millions of euros)
2017 2016 2015
Credit and debit cards 1,458 1,334 1,113
Transfers and others payment orders 102 102 92
Commissions for selling insurance 60 63 69
Other fees and commissions 610 587 454
Total 2,229 2,086 1,729
41. Gains (losses) on financial assets and liabilities, net and Exchange Differences
The breakdown of the balance under this heading, by source of the related items, in the accompanying
consolidated income statement is as follows:
Gains or losses on financial assets and liabilities and exchange differences: Breakdown by Heading of the Consolidated Income Statement (Millions of euros)
2017 2016 2015
Gains or (losses) on derecognition of financial assets and liabilities not measured at fair value through profit or loss, net 985 1,375 1,055
Available-for-sale financial assets 843 1,271 980
Loans and receivables 133 95 76
Other 9 10 (1)
Gains or (losses) on financial assets and liabilities held for trading, net 218 248 (409)
Gains or (losses) on financial assets and liabilities designated at fair value through profit or loss, net
(56) 114 126
Gains or (losses) from hedge accounting, net (209) (76) 93
Subtotal Gains or (losses) on financial assets and liabilities 938 1,661 865
Exchange Differences 1,030 472 1,165
Total 1,968 2,133 2,030
The breakdown of the balance (excluding exchange rate differences) under this heading in the
accompanying income statements by the nature of financial instruments is as follows:
Gains or losses on financial assets and liabilities: Breakdown by nature of the Financial Instrument (Millions of euros)
2017 2016 2015
Debt instruments 545 906 522
Equity instruments 845 459 (414)
Loans and advances to customers 97 65 88
Trading derivatives and hedge accounting (470) 109 561
Customer deposits (96) 87 83
Other 18 35 25
Total 938 1,661 865
The breakdown of the balance of the impact of the derivatives (trading and hedging) under this heading in the
accompanying consolidated income statements is as follows:
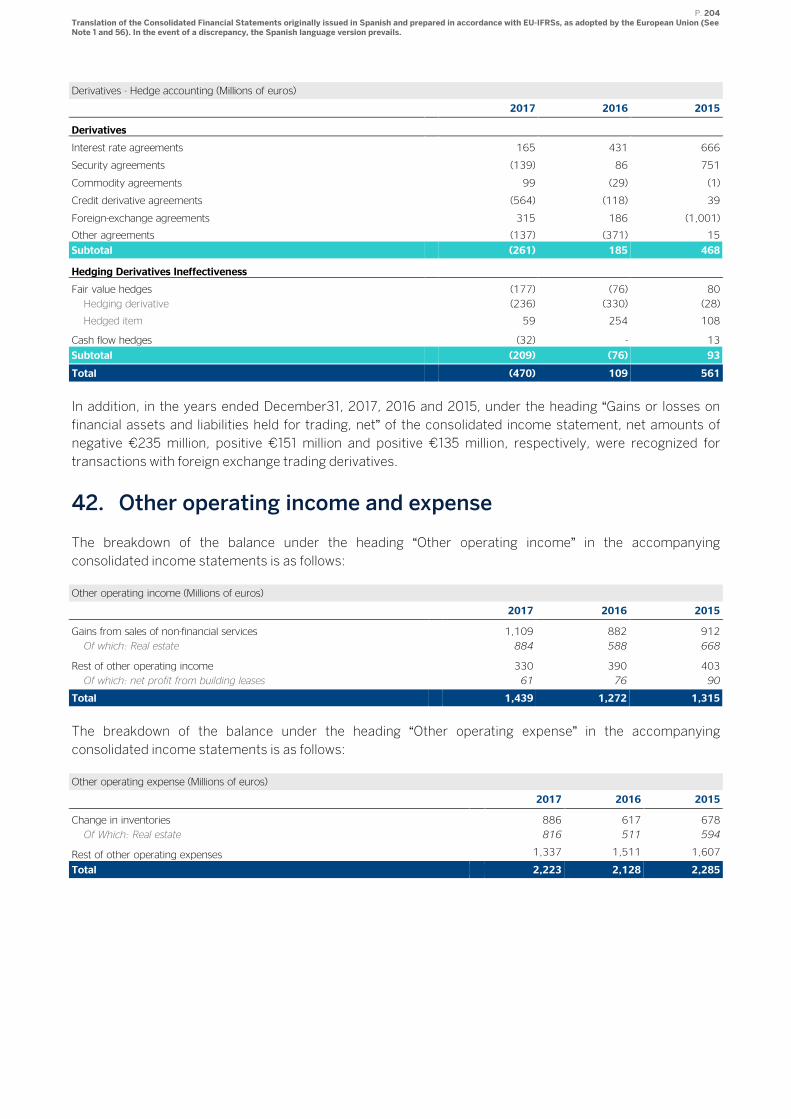
P. 204 Translation of the Consolidated Financial Statements originally issued in Spanish and prepared in accordance with EU-IFRSs, as adopted by the European Union (See Note 1 and 56). In the event of a discrepancy, the Spanish language version prevails.
Derivatives - Hedge accounting (Millions of euros)
2017 2016 2015
Derivatives
Interest rate agreements 165 431 666
Security agreements (139) 86 751
Commodity agreements 99 (29) (1)
Credit derivative agreements (564) (118) 39
Foreign-exchange agreements 315 186 (1,001)
Other agreements (137) (371) 15
Subtotal (261) 185 468
Hedging Derivatives Ineffectiveness
Fair value hedges (177) (76) 80
Hedging derivative (236) (330) (28)
Hedged item 59 254 108
Cash flow hedges (32) - 13
Subtotal (209) (76) 93
Total (470) 109 561
In addition, in the years ended December31, 2017, 2016 and 2015, under the heading “Gains or losses on
financial assets and liabilities held for trading, net” of the consolidated income statement, net amounts of
negative €235 million, positive €151 million and positive €135 million, respectively, were recognized for
transactions with foreign exchange trading derivatives.
42. Other operating income and expense
The breakdown of the balance under the heading “Other operating income” in the accompanying
consolidated income statements is as follows:
Other operating income (Millions of euros)
2017 2016 2015
Gains from sales of non-financial services 1,109 882 912
Of which: Real estate 884 588 668
Rest of other operating income 330 390 403
Of which: net profit from building leases 61 76 90
Total 1,439 1,272 1,315
The breakdown of the balance under the heading “Other operating expense” in the accompanying
consolidated income statements is as follows:
Other operating expense (Millions of euros)
2017 2016 2015
Change in inventories 886 617 678
Of Which: Real estate 816 511 594
Rest of other operating expenses 1,337 1,511 1,607
Total 2,223 2,128 2,285
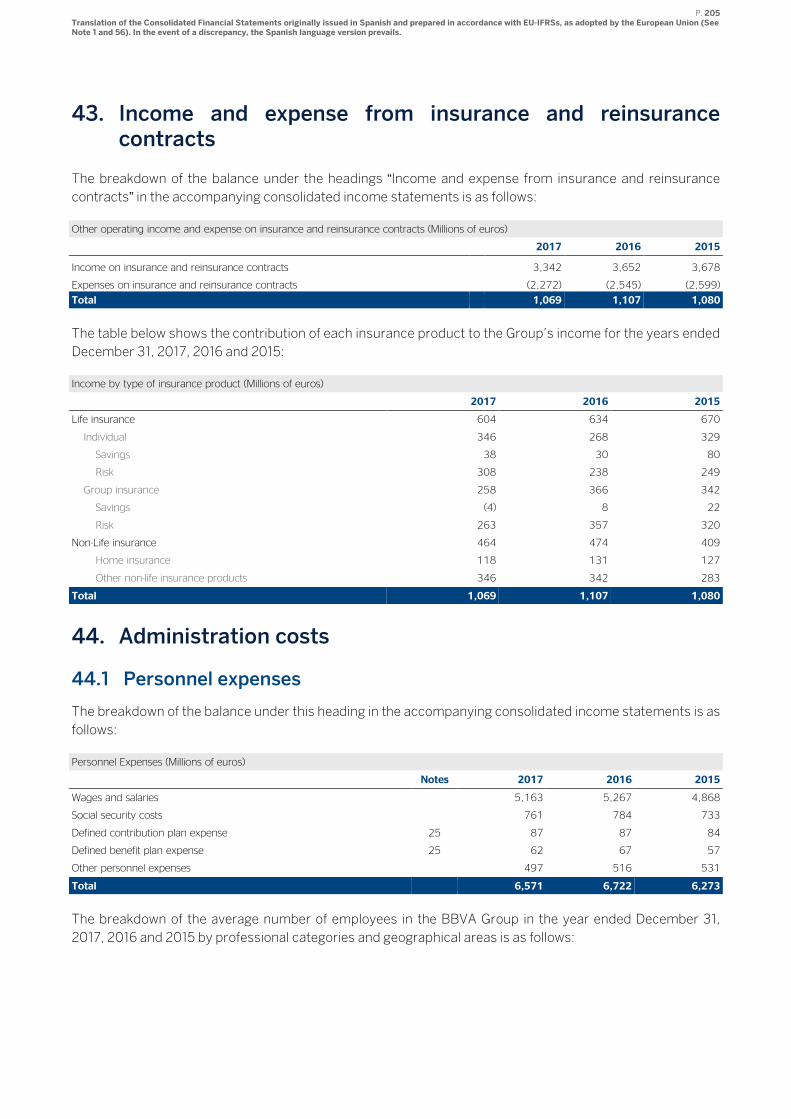
P. 205 Translation of the Consolidated Financial Statements originally issued in Spanish and prepared in accordance with EU-IFRSs, as adopted by the European Union (See Note 1 and 56). In the event of a discrepancy, the Spanish language version prevails.
43. Income and expense from insurance and reinsurance contracts
The breakdown of the balance under the headings “Income and expense from insurance and reinsurance
contracts” in the accompanying consolidated income statements is as follows:
Other operating income and expense on insurance and reinsurance contracts (Millions of euros)
2017 2016 2015
Income on insurance and reinsurance contracts 3,342 3,652 3,678
Expenses on insurance and reinsurance contracts (2,272) (2,545) (2,599)
Total 1,069 1,107 1,080
The table below shows the contribution of each insurance product to the Group’s income for the years ended
December 31, 2017, 2016 and 2015:
Income by type of insurance product (Millions of euros)
2017 2016 2015
Life insurance 604 634 670
Individual 346 268 329
Savings 38 30 80
Risk 308 238 249
Group insurance 258 366 342
Savings (4) 8 22
Risk 263 357 320
Non-Life insurance 464 474 409
Home insurance 118 131 127
Other non-life insurance products 346 342 283
Total 1,069 1,107 1,080
44. Administration costs
44.1 Personnel expenses
The breakdown of the balance under this heading in the accompanying consolidated income statements is as
follows:
Personnel Expenses (Millions of euros)
Notes 2017 2016 2015
Wages and salaries 5,163 5,267 4,868
Social security costs 761 784 733
Defined contribution plan expense 25 87 87 84
Defined benefit plan expense 25 62 67 57
Other personnel expenses 497 516 531
Total 6,571 6,722 6,273
The breakdown of the average number of employees in the BBVA Group in the year ended December 31,
2017, 2016 and 2015 by professional categories and geographical areas is as follows:
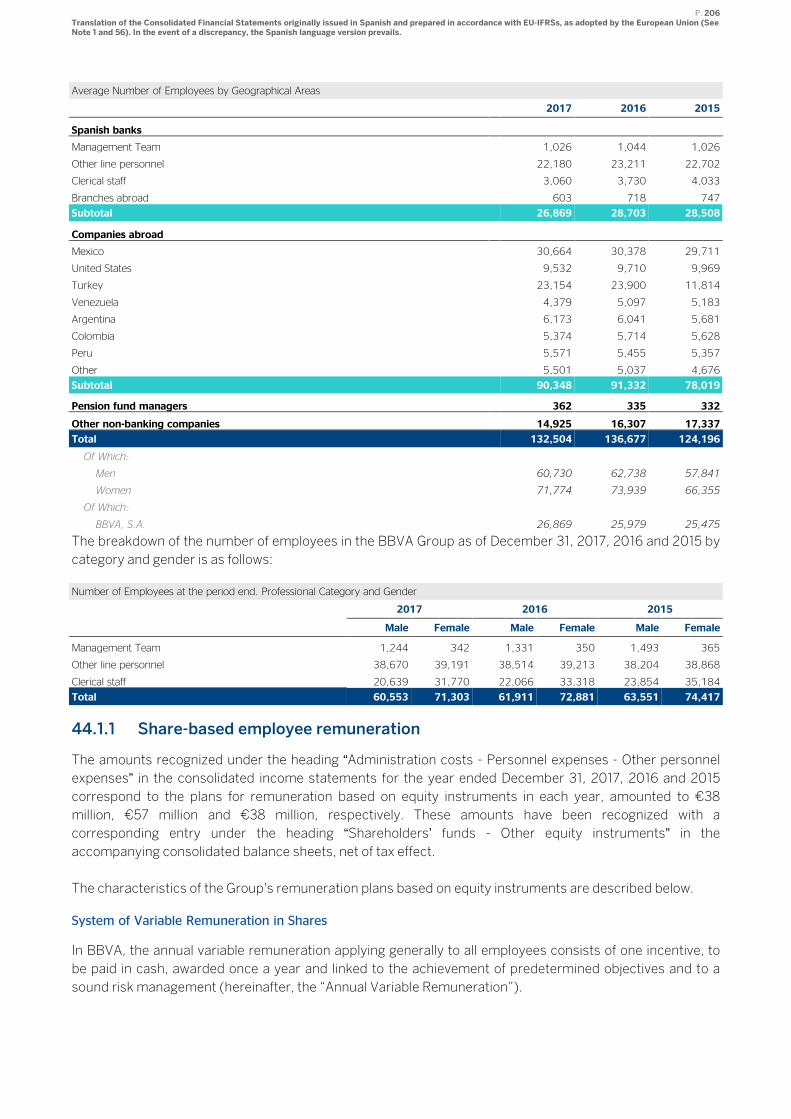
P. 206 Translation of the Consolidated Financial Statements originally issued in Spanish and prepared in accordance with EU-IFRSs, as adopted by the European Union (See Note 1 and 56). In the event of a discrepancy, the Spanish language version prevails.
Average Number of Employees by Geographical Areas
2017 2016 2015
Spanish banks
Management Team 1,026 1,044 1,026
Other line personnel 22,180 23,211 22,702
Clerical staff 3,060 3,730 4,033
Branches abroad 603 718 747
Subtotal 26,869 28,703 28,508
Companies abroad
Mexico 30,664 30,378 29,711
United States 9,532 9,710 9,969
Turkey 23,154 23,900 11,814
Venezuela 4,379 5,097 5,183
Argentina 6,173 6,041 5,681
Colombia 5,374 5,714 5,628
Peru 5,571 5,455 5,357
Other 5,501 5,037 4,676
Subtotal 90,348 91,332 78,019
Pension fund managers 362 335 332
Other non-banking companies 14,925 16,307 17,337
Total 132,504 136,677 124,196
Of Which:
Men 60,730 62,738 57,841
Women 71,774 73,939 66,355
Of Which:
BBVA, S.A. 26,869 25,979 25,475
The breakdown of the number of employees in the BBVA Group as of December 31, 2017, 2016 and 2015 by
category and gender is as follows:
Number of Employees at the period end. Professional Category and Gender
2017 2016 2015
Male Female Male Female Male Female
Management Team 1,244 342 1,331 350 1,493 365
Other line personnel 38,670 39,191 38,514 39,213 38,204 38,868
Clerical staff 20,639 31,770 22,066 33,318 23,854 35,184
Total 60,553 71,303 61,911 72,881 63,551 74,417
44.1.1 Share-based employee remuneration
The amounts recognized under the heading “Administration costs - Personnel expenses - Other personnel
expenses” in the consolidated income statements for the year ended December 31, 2017, 2016 and 2015
correspond to the plans for remuneration based on equity instruments in each year, amounted to €38
million, €57 million and €38 million, respectively. These amounts have been recognized with a
corresponding entry under the heading “Shareholders’ funds - Other equity instruments” in the
accompanying consolidated balance sheets, net of tax effect.
The characteristics of the Group's remuneration plans based on equity instruments are described below.
System of Variable Remuneration in Shares
In BBVA, the annual variable remuneration applying generally to all employees consists of one incentive, to
be paid in cash, awarded once a year and linked to the achievement of predetermined objectives and to a
sound risk management (hereinafter, the “Annual Variable Remuneration”).

P. 207 Translation of the Consolidated Financial Statements originally issued in Spanish and prepared in accordance with EU-IFRSs, as adopted by the European Union (See Note 1 and 56). In the event of a discrepancy, the Spanish language version prevails.
According to the remuneration policy for BBVA Group, in force until 2016, the specific settlement and
payment system for the Annual Variable Remuneration applicable to those employees and senior managers
whose professional activities have a significant impact on the Group’s risk profile including the executive
directors and members of BBVA Senior Management (hereinafter, the "Identified Staff"), which includes,
among others, the payment in shares of part of their Annual Variable Remuneration.
This remuneration policy was approved, with respect to BBVA directors, by the Annual General
Shareholders’ Meeting held on March 13, 2015.
The specific rules of the settlement and payment system of 2016 Annual Variable Remuneration which have
given rise to the delivery of shares in 2017 to executive directors and members of the Senior Management
are described in Note 54, while the rules listed below were established to the rest of the Identified Staff:
The Annual Variable Remuneration of Identified Staff members would be paid in equal parts in cash
and in BBVA shares.
The payment of 40% of the Annual Variable Remuneration, both in cash and in shares, would be
deferred in its entirety for a three–year period. Its accrual and payment would be subject to
compliance with certain multi-year performance indicators related to the share performance and the
Group’s fundamental control and risk management metrics regarding solvency, liquidity and
profitability, which would be calculated over the deferral period (hereinafter “Multi-year Performance
Indicators”). These Multi-year Performance Indicators could lead to a reduction in the amounts
deferred, and might even bring it down to zero, but they would not be used under any circumstances
to increase the aforementioned deferred remuneration.
All the shares delivered pursuant to the rules indicated above would be withheld for a period of one
year from the date of delivery. This withholding would be applied over the net amount of the shares,
after discounting the necessary part to pay any tax accruing on the shares received.
A prohibition was also established against hedging, both regarding vested shares that were withheld
and shares whose delivery was pending.
Moreover, circumstances were established under which the payment of the deferred Annual Variable
Remuneration could be limited or impeded ("malus" clauses), as well as the adjustment to update
these deferred parts.
Finally, the variable component of the remuneration corresponding to a year for the Identified Staff
would be limited to a maximum amount of 100% of the fixed component of total remuneration,
unless the General Meeting resolved to increase such limit which, in any event, could not exceed
200% of the fixed component of total remuneration.
In this regard, the Annual General Meeting resolved, in line with applicable legislation, the application of the
maximum level of variable remuneration up to 200% of the fixed remuneration for a specific group of
employees whose professional activities have a material impact on the Group’s risk profile, and to enlarge
this group, whose variable remuneration will be subject to the maximum threshold of 200% of the fixed
component of their total remuneration. This is entirely consistent with the Recommendations Report issued
by the BBVA's Board of Directors.
According to the settlement and payment scheme indicated, during 2017, members of the Identified Staff
received a total amount of 6,481,409 shares corresponding to the initial payment corresponding to 2016
Annual Variable Remuneration to be delivered in shares.
Additionally, the remuneration policy prevailing until 2014 provided for a specific settlement and payment
scheme for the variable remuneration of the Identified Staff that established a three-year deferral period for
P. 208 Translation of the Consolidated Financial Statements originally issued in Spanish and prepared in accordance with EU-IFRSs, as adopted by the European Union (See Note 1 and 56). In the event of a discrepancy, the Spanish language version prevails.
the Annual Variable Remuneration, being the deferred amount paid in thirds over this period in equal parts, in
cash and in BBVA shares.
According to this prior scheme, during 2017, the members of the Identified Staff received the shares
corresponding to the deferred parts of the Annual Variable Remuneration from previous years, and their
corresponding adjustments in cash, delivery of which corresponded in 2017, were delivered to the
beneficiary members of the Identified Staff, resulting in (i) a total amount of 943,955 shares corresponding
to the second deferred third of the 2014 Annual Variable Remuneration and €697,583 as adjustments for
updates of the shares granted; and (ii) a total amount of 437,069 shares corresponding to the last deferred
third of the 2013 Annual Variable Remuneration and €501,318 in adjustments for updates.
The information on the delivery of shares to executive Directors and senior management corresponding to
the deferred parts of the Annual Variable Remuneration from previous years and their corresponding
adjustments in cash, are detailed in Note 54.
Additionally, in line with specific regulation applicable in Portugal and Brazil, BBVA identifies those
employees that, according to local regulators, should be subject to a specific settlement and payment
scheme of the Annual Variable Remuneration.
According to this regulation, during 2017 a number of 49,798 shares corresponding to the initial payment of
2016 Annual Variable Remuneration were delivered to these beneficiaries.
Additionally, during 2017 the shares corresponding to the deferred parts of the Annual Variable
Remuneration and their corresponding adjustments in cash, were delivered to these beneficiaries, giving rise
in 2017, of a total of 10,485 shares corresponding to the first deferred third of the 2015 Annual Variable
Remuneration, and €3,869 as adjustments for updates of the shares granted; a total of 7,201 shares
corresponding to the second third of the 2014 Annual Variable Remuneration, and €5,322 as adjustments for
updates of the shares granted; and a total of 5,757 shares corresponding to the final third of the 2013 Annual
Variable Remuneration, and €6,603 as adjustments for updates of the shares granted.
Additionally, BBVA Compass' remuneration structure included a long-term incentive programme in shares
for employees in certain key positions. This plan is applicable for a three-year term and consisted in the
delivery of a number of shares to its beneficiaries, subject to their permanence in the company for a period of
three years.
During 2017, a number of 331,111 shares corresponding to this programme were delivered.
Remuneration policy applicable from 2017 onwards
The Bank has modified its remuneration policy applicable to the Identified Staff and to BBVA Directors for the
years 2017, 2018 and 2019, aimed at improving alignment with new regulatory requirements, best market
practices and BBVA’s organization and internal strategy. This policy was approved, with respect to Identified
Staff, by the Board of Directors held in 9 February 2017, and, with respect to BBVA directors, by the General
Shareholders’ Meeting held on March 17, 2017.
The new remuneration policy includes a specific settlement and payment system of the Annual Variable
Remuneration applicable to the Identified Staff, including directors and senior management, under the
following rules, among others:
A significant percentage of variable remuneration – 60% in the case of executive directors, Senior Management and those Identified Staff members with particularly high variable remuneration, and 40% for the rest of the Identified Staff– shall be deferred over a five- year period, in the case of executive directors and Senior Management, and over a three-year period, for the remaining Identified Staff.
P. 209 Translation of the Consolidated Financial Statements originally issued in Spanish and prepared in accordance with EU-IFRSs, as adopted by the European Union (See Note 1 and 56). In the event of a discrepancy, the Spanish language version prevails.
50% of the variable remuneration of each year (including both upfront and deferred portions), shall be established in BBVA shares, albeit a larger proportion (60%) in shares shall be deferred in the case of executive directors and Senior Management.
The variable remuneration will be subject to ex ante adjustments, so that it will not be accrued, or will be accrued in a reduced amount, should a certain level of profit or capital ratio not be obtained. Likewise, the Annual Variable Remuneration will be reduced upon performance assessment in the event of negative evolution of the Bank’s results or other parameters such as the level of achievement of budgeted targets.
The deferred component of the variable remuneration (in shares and in cash) may be reduced in its entirety, yet not increased, based on the result of multi-year performance indicators aligned with the Bank’s fundamental risk management and control metrics, related to the solvency, capital, liquidity, funding or profitability, or to the share performance and recurring results of the Group.
During the entire deferral period (5 or 3 years, as applicable) and retention period, variable remuneration shall be subject to malus and clawback arrangements, both linked to a downturn in financial performance of the Bank, specific unit or area, or individual, under certain circumstances.
All shares shall be withheld for a period of one year after delivery, except for those shares required to honor the payment of taxes.
No personal hedging strategies or insurance may be used in connection with remuneration and responsibility that may undermine the effects of alignment with sound risk management.
The deferred amounts in cash subject to multi-year performance indicators that are finally paid shall be subject to updating, in the terms determined by the Bank’s Board of Directors, upon proposal of the Remunerations Committee, whereas deferred amounts in shares shall not be updated.
Finally, the variable component of the remuneration of the Identified Staff members shall be limited to a maximum amount of 100% of the fixed component of total remuneration, unless the General Meeting resolves to increase this percentage up to 200%.
In this regard, the General Meeting held on March, 17 2017 resolved to increase the maximum level of
variable remuneration to 200% of the fixed component for a number of the Identified Staff, in the terms
indicated in the Report of Recommendations issued for this purpose by the Board of Directors dated 9
February 2017.
In accordance with the new remuneration policy applicable to the Identified Staff, malus and clawback
arrangements will be applicable to the Annual Variable Remuneration awarded as of the year 2016, inclusive,
for each member of the Identified Staff.
According to this new policy, the first disbursement in shares will be the upfront payment of the 2017 Annual
Variable Remuneration, in equal parts in BBVA shares and in cash, which will take place in 2018.
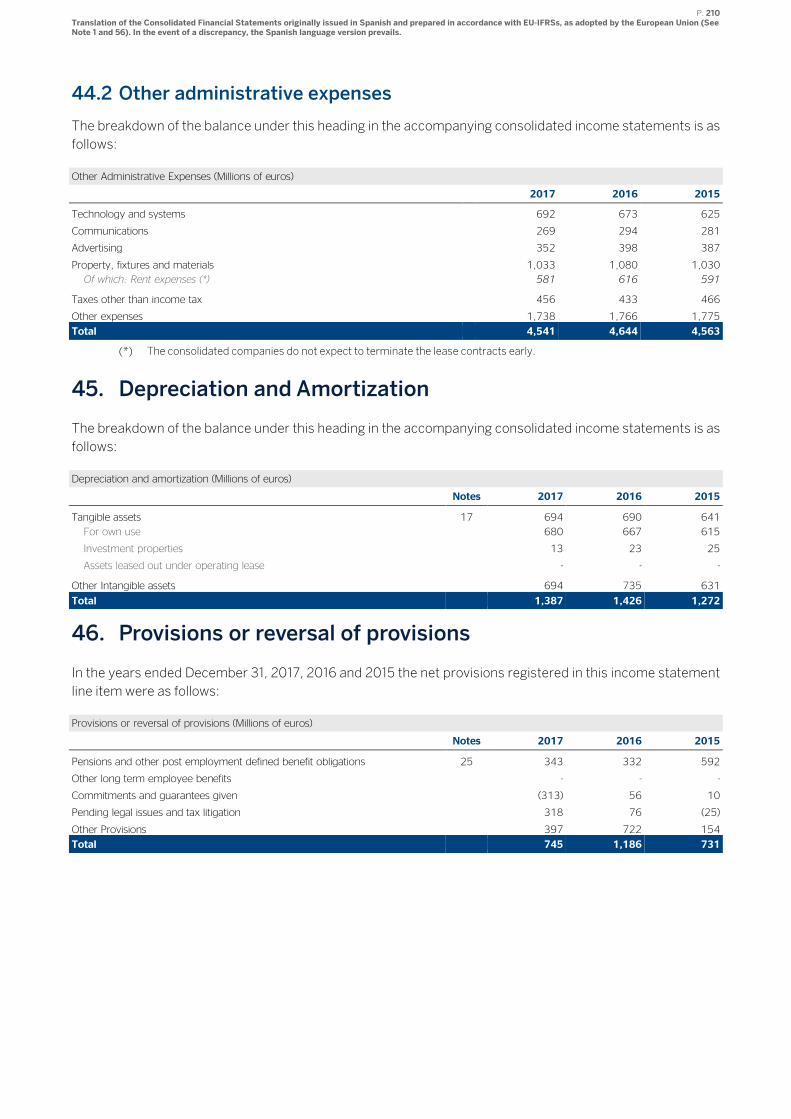
P. 210 Translation of the Consolidated Financial Statements originally issued in Spanish and prepared in accordance with EU-IFRSs, as adopted by the European Union (See Note 1 and 56). In the event of a discrepancy, the Spanish language version prevails.
44.2 Other administrative expenses
The breakdown of the balance under this heading in the accompanying consolidated income statements is as
follows:
Other Administrative Expenses (Millions of euros)
2017 2016 2015
Technology and systems 692 673 625
Communications 269 294 281
Advertising 352 398 387
Property, fixtures and materials 1,033 1,080 1,030
Of which: Rent expenses (*) 581 616 591
Taxes other than income tax 456 433 466
Other expenses 1,738 1,766 1,775
Total 4,541 4,644 4,563
(*) The consolidated companies do not expect to terminate the lease contracts early.
45. Depreciation and Amortization
The breakdown of the balance under this heading in the accompanying consolidated income statements is as
follows:
Depreciation and amortization (Millions of euros)
Notes 2017 2016 2015
Tangible assets 17 694 690 641
For own use 680 667 615
Investment properties 13 23 25
Assets leased out under operating lease - - -
Other Intangible assets 694 735 631
Total 1,387 1,426 1,272
46. Provisions or reversal of provisions
In the years ended December 31, 2017, 2016 and 2015 the net provisions registered in this income statement
line item were as follows:
Provisions or reversal of provisions (Millions of euros)
Notes 2017 2016 2015
Pensions and other post employment defined benefit obligations 25 343 332 592
Other long term employee benefits - - -
Commitments and guarantees given (313) 56 10
Pending legal issues and tax litigation 318 76 (25)
Other Provisions 397 722 154
Total 745 1,186 731
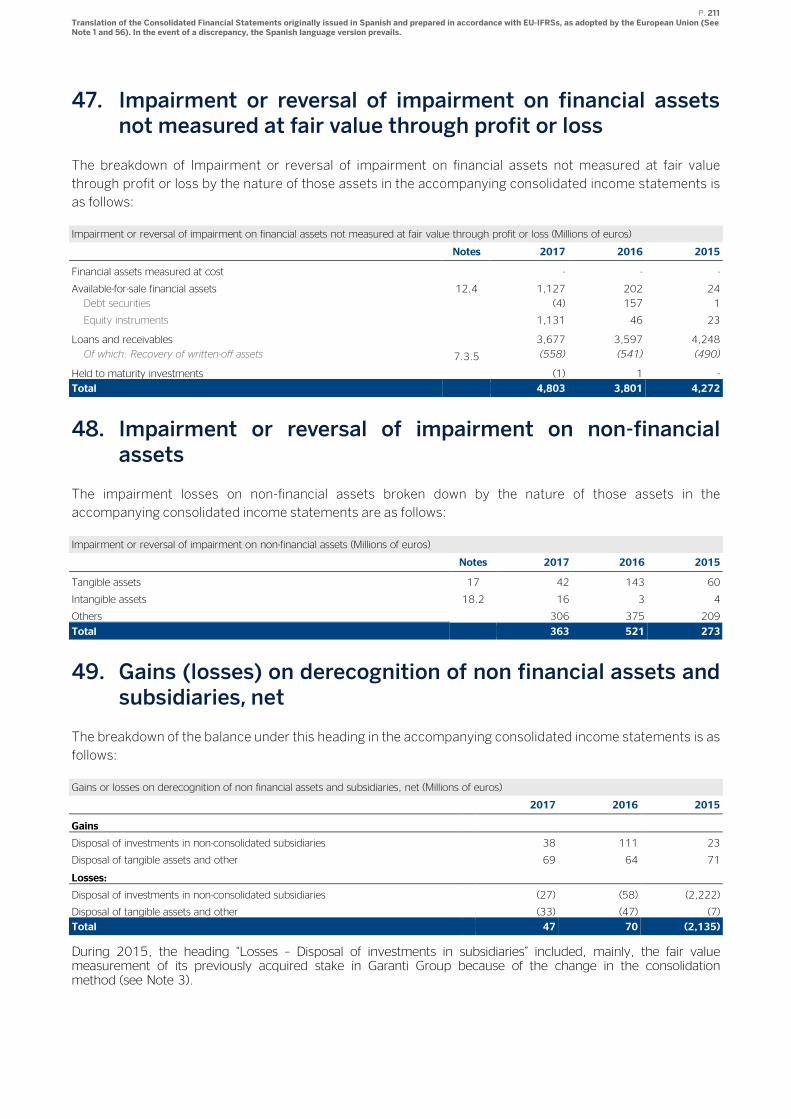
P. 211 Translation of the Consolidated Financial Statements originally issued in Spanish and prepared in accordance with EU-IFRSs, as adopted by the European Union (See Note 1 and 56). In the event of a discrepancy, the Spanish language version prevails.
47. Impairment or reversal of impairment on financial assets not measured at fair value through profit or loss
The breakdown of Impairment or reversal of impairment on financial assets not measured at fair value
through profit or loss by the nature of those assets in the accompanying consolidated income statements is
as follows:
Impairment or reversal of impairment on financial assets not measured at fair value through profit or loss (Millions of euros)
Notes 2017 2016 2015
Financial assets measured at cost - - -
Available-for-sale financial assets 12.4 1,127 202 24
Debt securities (4) 157 1
Equity instruments 1,131 46 23
Loans and receivables 3,677 3,597 4,248
Of which: Recovery of written-off assets 7.3.5 (558) (541) (490)
Held to maturity investments (1) 1 -
Total 4,803 3,801 4,272
48. Impairment or reversal of impairment on non-financial assets
The impairment losses on non-financial assets broken down by the nature of those assets in the
accompanying consolidated income statements are as follows:
Impairment or reversal of impairment on non-financial assets (Millions of euros)
Notes 2017 2016 2015
Tangible assets 17 42 143 60
Intangible assets 18.2 16 3 4
Others 306 375 209
Total 363 521 273
49. Gains (losses) on derecognition of non financial assets and subsidiaries, net
The breakdown of the balance under this heading in the accompanying consolidated income statements is as
follows:
Gains or losses on derecognition of non financial assets and subsidiaries, net (Millions of euros)
2017 2016 2015
Gains
Disposal of investments in non-consolidated subsidiaries 38 111 23
Disposal of tangible assets and other 69 64 71
Losses:
Disposal of investments in non-consolidated subsidiaries (27) (58) (2,222)
Disposal of tangible assets and other (33) (47) (7)
Total 47 70 (2,135)
During 2015, the heading “Losses – Disposal of investments in subsidiaries” included, mainly, the fair value measurement of its previously acquired stake in Garanti Group because of the change in the consolidation method (see Note 3).
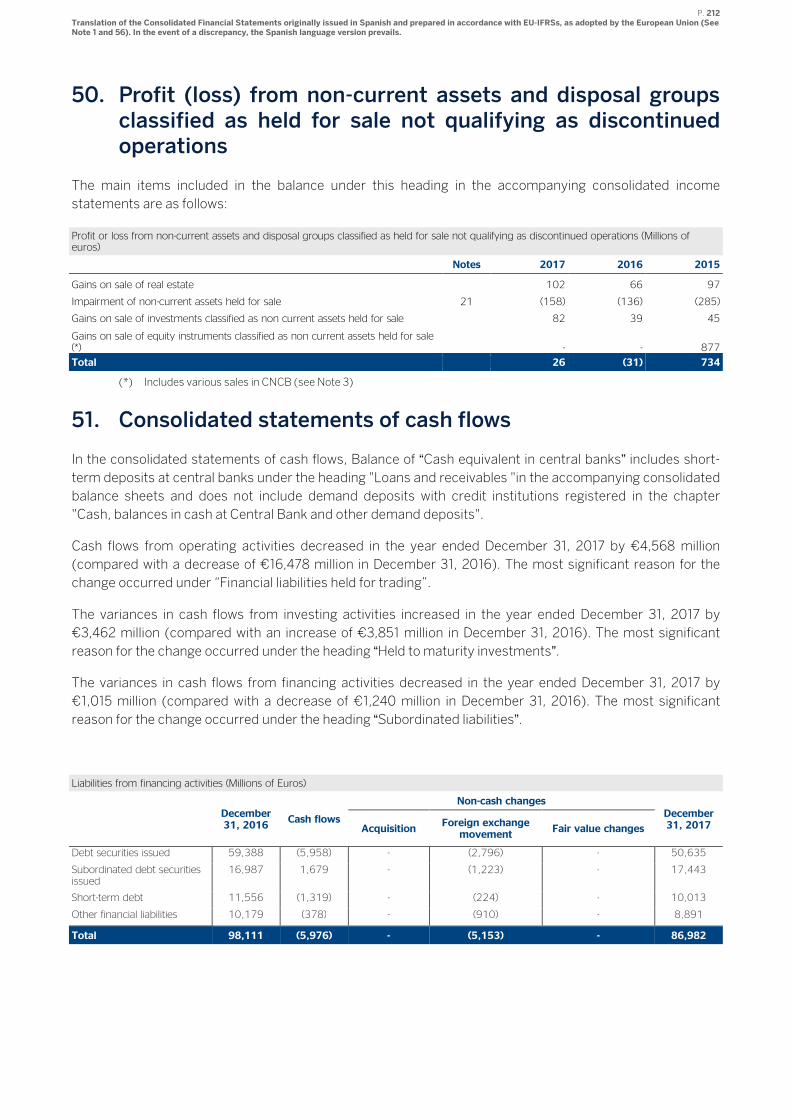
P. 212 Translation of the Consolidated Financial Statements originally issued in Spanish and prepared in accordance with EU-IFRSs, as adopted by the European Union (See Note 1 and 56). In the event of a discrepancy, the Spanish language version prevails.
50. Profit (loss) from non-current assets and disposal groups classified as held for sale not qualifying as discontinued operations
The main items included in the balance under this heading in the accompanying consolidated income
statements are as follows:
Profit or loss from non-current assets and disposal groups classified as held for sale not qualifying as discontinued operations (Millions of euros)
Notes 2017 2016 2015
Gains on sale of real estate 102 66 97
Impairment of non-current assets held for sale 21 (158) (136) (285)
Gains on sale of investments classified as non current assets held for sale 82 39 45
Gains on sale of equity instruments classified as non current assets held for sale (*) - - 877
Total 26 (31) 734
(*) Includes various sales in CNCB (see Note 3)
51. Consolidated statements of cash flows
In the consolidated statements of cash flows, Balance of “Cash equivalent in central banks” includes short-
term deposits at central banks under the heading "Loans and receivables "in the accompanying consolidated
balance sheets and does not include demand deposits with credit institutions registered in the chapter
"Cash, balances in cash at Central Bank and other demand deposits".
Cash flows from operating activities decreased in the year ended December 31, 2017 by €4,568 million
(compared with a decrease of €16,478 million in December 31, 2016). The most significant reason for the
change occurred under “Financial liabilities held for trading”.
The variances in cash flows from investing activities increased in the year ended December 31, 2017 by
€3,462 million (compared with an increase of €3,851 million in December 31, 2016). The most significant
reason for the change occurred under the heading “Held to maturity investments”.
The variances in cash flows from financing activities decreased in the year ended December 31, 2017 by
€1,015 million (compared with a decrease of €1,240 million in December 31, 2016). The most significant
reason for the change occurred under the heading “Subordinated liabilities”.
Liabilities from financing activities (Millions of Euros)
December 31, 2016
Cash flows
Non-cash changes
December 31, 2017
Acquisition
Foreign exchange movement
Fair value changes
Debt securities issued 59,388 (5,958) - (2,796) - 50,635
Subordinated debt securities issued
16,987 1,679 - (1,223) - 17,443
Short-term debt 11,556 (1,319) - (224) - 10,013
Other financial liabilities 10,179 (378) - (910) - 8,891
Total 98,111 (5,976) - (5,153) - 86,982
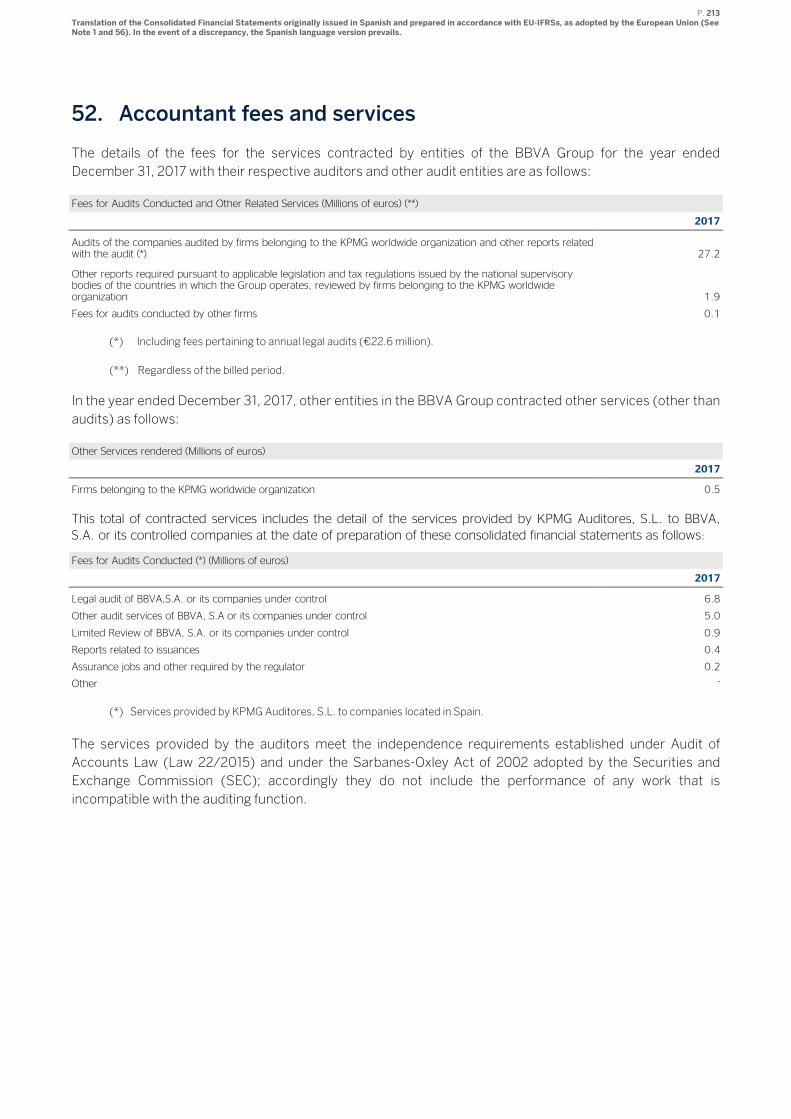
P. 213 Translation of the Consolidated Financial Statements originally issued in Spanish and prepared in accordance with EU-IFRSs, as adopted by the European Union (See Note 1 and 56). In the event of a discrepancy, the Spanish language version prevails.
52. Accountant fees and services
The details of the fees for the services contracted by entities of the BBVA Group for the year ended
December 31, 2017 with their respective auditors and other audit entities are as follows:
Fees for Audits Conducted and Other Related Services (Millions of euros) (**)
2017
Audits of the companies audited by firms belonging to the KPMG worldwide organization and other reports related with the audit (*) 27.2
Other reports required pursuant to applicable legislation and tax regulations issued by the national supervisory bodies of the countries in which the Group operates, reviewed by firms belonging to the KPMG worldwide organization 1.9
Fees for audits conducted by other firms 0.1
(*) Including fees pertaining to annual legal audits (€22.6 million).
(**) Regardless of the billed period.
In the year ended December 31, 2017, other entities in the BBVA Group contracted other services (other than
audits) as follows:
Other Services rendered (Millions of euros)
2017
Firms belonging to the KPMG worldwide organization 0.5
This total of contracted services includes the detail of the services provided by KPMG Auditores, S.L. to BBVA, S.A. or its controlled companies at the date of preparation of these consolidated financial statements as follows:
Fees for Audits Conducted (*) (Millions of euros)
2017
Legal audit of BBVA,S.A. or its companies under control 6.8
Other audit services of BBVA, S.A or its companies under control 5.0
Limited Review of BBVA, S.A. or its companies under control 0.9
Reports related to issuances 0.4
Assurance jobs and other required by the regulator 0.2
Other -
(*) Services provided by KPMG Auditores, S.L. to companies located in Spain.
The services provided by the auditors meet the independence requirements established under Audit of
Accounts Law (Law 22/2015) and under the Sarbanes-Oxley Act of 2002 adopted by the Securities and
Exchange Commission (SEC); accordingly they do not include the performance of any work that is
incompatible with the auditing function.
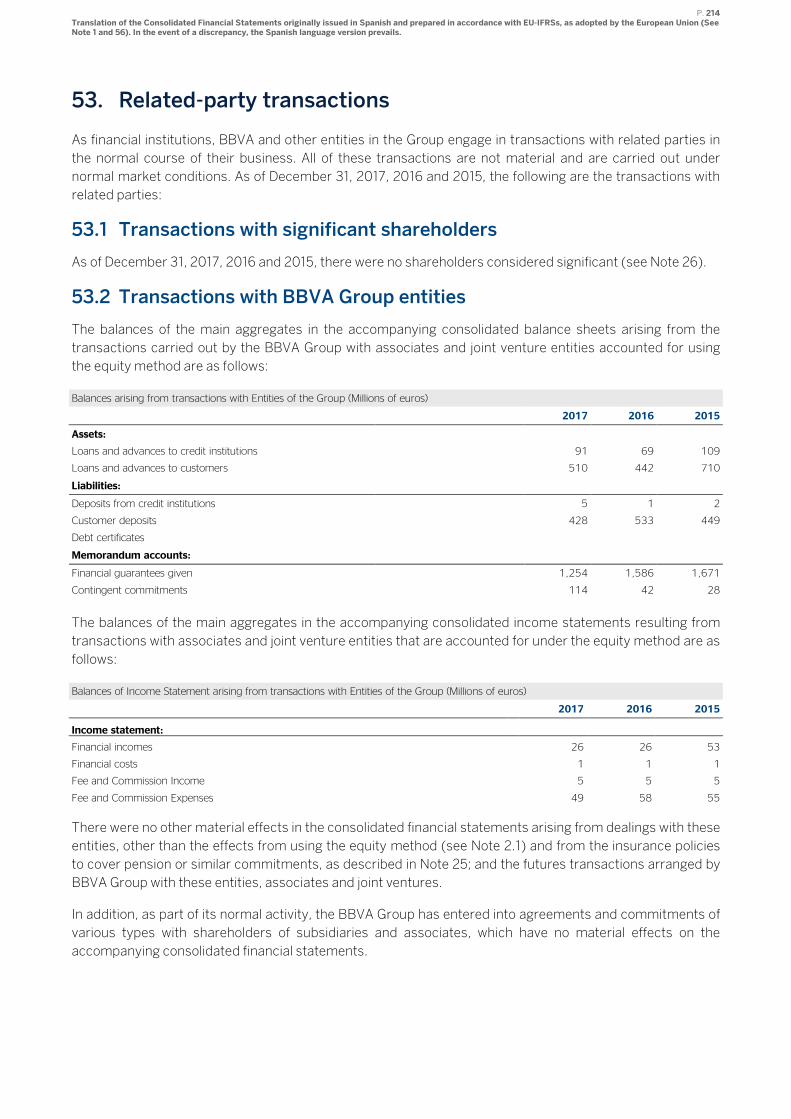
P. 214 Translation of the Consolidated Financial Statements originally issued in Spanish and prepared in accordance with EU-IFRSs, as adopted by the European Union (See Note 1 and 56). In the event of a discrepancy, the Spanish language version prevails.
53. Related-party transactions
As financial institutions, BBVA and other entities in the Group engage in transactions with related parties in
the normal course of their business. All of these transactions are not material and are carried out under
normal market conditions. As of December 31, 2017, 2016 and 2015, the following are the transactions with
related parties:
53.1 Transactions with significant shareholders
As of December 31, 2017, 2016 and 2015, there were no shareholders considered significant (see Note 26).
53.2 Transactions with BBVA Group entities
The balances of the main aggregates in the accompanying consolidated balance sheets arising from the
transactions carried out by the BBVA Group with associates and joint venture entities accounted for using
the equity method are as follows:
Balances arising from transactions with Entities of the Group (Millions of euros)
2017 2016 2015
Assets:
Loans and advances to credit institutions 91 69 109
Loans and advances to customers 510 442 710
Liabilities:
Deposits from credit institutions 5 1 2
Customer deposits 428 533 449
Debt certificates
Memorandum accounts:
Financial guarantees given 1,254 1,586 1,671
Contingent commitments 114 42 28
The balances of the main aggregates in the accompanying consolidated income statements resulting from
transactions with associates and joint venture entities that are accounted for under the equity method are as
follows:
Balances of Income Statement arising from transactions with Entities of the Group (Millions of euros)
2017 2016 2015
Income statement:
Financial incomes 26 26 53
Financial costs 1 1 1
Fee and Commission Income 5 5 5
Fee and Commission Expenses 49 58 55
There were no other material effects in the consolidated financial statements arising from dealings with these
entities, other than the effects from using the equity method (see Note 2.1) and from the insurance policies
to cover pension or similar commitments, as described in Note 25; and the futures transactions arranged by
BBVA Group with these entities, associates and joint ventures.
In addition, as part of its normal activity, the BBVA Group has entered into agreements and commitments of
various types with shareholders of subsidiaries and associates, which have no material effects on the
accompanying consolidated financial statements.
P. 215 Translation of the Consolidated Financial Statements originally issued in Spanish and prepared in accordance with EU-IFRSs, as adopted by the European Union (See Note 1 and 56). In the event of a discrepancy, the Spanish language version prevails.
53.3 Transactions with members of the Board of Directors and Senior Management
The information on the remuneration of the members of the BBVA Board of Directors and Senior
Management is included in Note 54.
As of December 31, 2017 and 2016, there were no loans granted by the Group’s entities to the members of
the Board of Directors. As of December 31, 2015 the amount availed against the loans by the Group’s entities
to the members of the Board of Directors was €200 thousand. The amount availed against the loans by the
Group’s entities to the members of Senior Management on those same dates (excluding the executive
directors) amounted to €4,049, €5,573 and €6,641 thousand, respectively.
As of December 31, 2017 and 2016, there were no loans granted to parties related to the members of the
Board of Directors. As of December 31, 2015, the amount availed against the loans to parties related to the
members of the Bank’s Board of Directors was €10,000 thousand. As of December 31, 2017, 2016 and 2015
the amount availed against the loans to parties related to members of the Senior Management amounted to
€85, €98 and €113 thousand, respectively.
As of December 31, 2017, 2016 and 2015 no guarantees had been granted to any member of the Board of
Directors.
As of December 31, 2017 and 2016, the amount availed against guarantees arranged with members of the
Senior Management totaled €28 thousand. As of December 31, 2015 no guarantees had been granted to any
member of the Senior Management.
As of December 31, 2017, 2016 and 2015 the amount availed against commercial loans and guarantees
arranged with parties related to the members of the Bank’s Board of Directors and the Senior Management
totaled €8, €8 and €1,679 thousand, respectively.
53.4 Transactions with other related parties
In the years ended December 31, 2017, 2016 and 2015, the Group did not conduct any transactions with
other related parties that are not in the ordinary course of its business, which were not carried out at arm's-
length market conditions and of marginal relevance; whose information is not necessary to give a true picture
of the BBVA Group’s consolidated net equity, net earnings and financial situation.
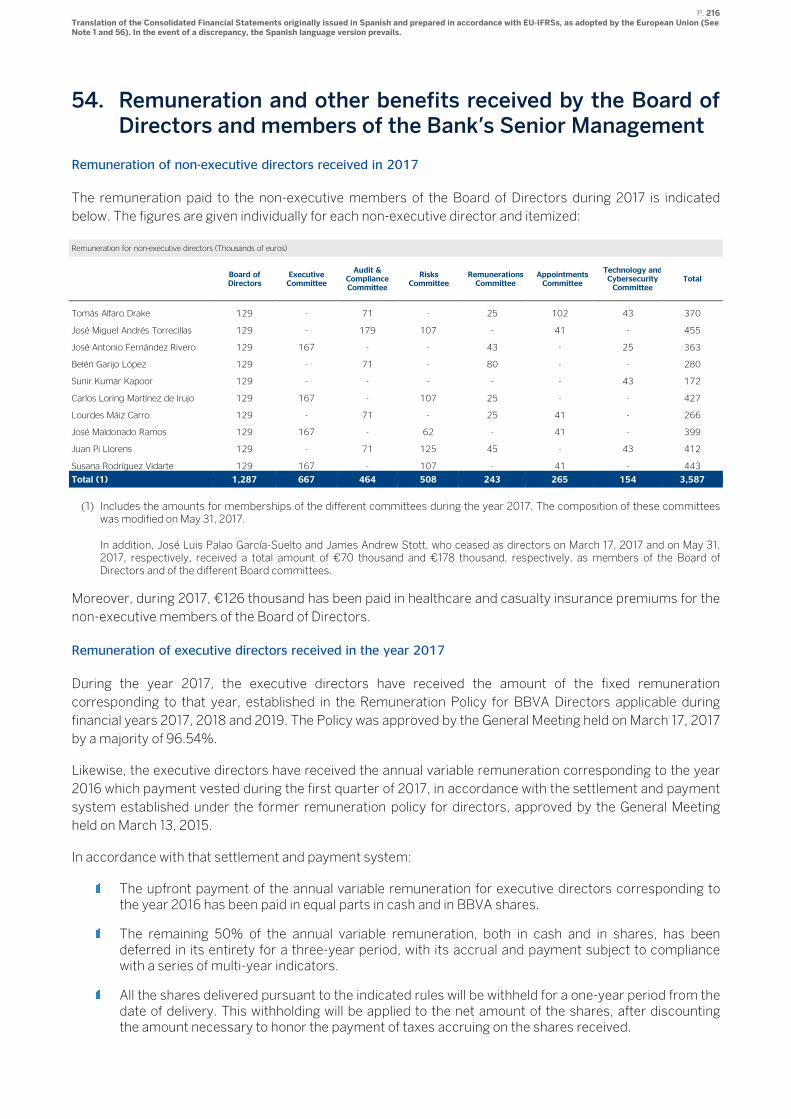
P. 216 Translation of the Consolidated Financial Statements originally issued in Spanish and prepared in accordance with EU-IFRSs, as adopted by the European Union (See Note 1 and 56). In the event of a discrepancy, the Spanish language version prevails.
54. Remuneration and other benefits received by the Board of Directors and members of the Bank’s Senior Management
Remuneration of non-executive directors received in 2017
The remuneration paid to the non-executive members of the Board of Directors during 2017 is indicated
below. The figures are given individually for each non-executive director and itemized:
Remuneration for non-executive directors (Thousands of euros)
Board of Directors
Executive Committee
Audit & Compliance Committee
Risks Committee
Remunerations Committee
Appointments Committee
Technology and Cybersecurity Committee
Total
Tomás Alfaro Drake 129 - 71 - 25 102 43 370
José Miguel Andrés Torrecillas 129 - 179 107 - 41 - 455
José Antonio Fernández Rivero 129 167 - - 43 - 25 363
Belén Garijo López 129 - 71 - 80 - - 280
Sunir Kumar Kapoor 129 - - - - - 43 172
Carlos Loring Martínez de Irujo 129 167 - 107 25 - - 427
Lourdes Máiz Carro 129 - 71 - 25 41 - 266
José Maldonado Ramos 129 167 - 62 - 41 - 399
Juan Pi Llorens 129 - 71 125 45 - 43 412
Susana Rodríguez Vidarte 129 167 - 107 - 41 - 443
Total (1) 1,287 667 464 508 243 265 154 3,587
(1) Includes the amounts for memberships of the different committees during the year 2017. The composition of these committees
was modified on May 31, 2017.
In addition, José Luis Palao García-Suelto and James Andrew Stott, who ceased as directors on March 17, 2017 and on May 31, 2017, respectively, received a total amount of €70 thousand and €178 thousand, respectively, as members of the Board of Directors and of the different Board committees.
Moreover, during 2017, €126 thousand has been paid in healthcare and casualty insurance premiums for the
non-executive members of the Board of Directors.
Remuneration of executive directors received in the year 2017
During the year 2017, the executive directors have received the amount of the fixed remuneration
corresponding to that year, established in the Remuneration Policy for BBVA Directors applicable during
financial years 2017, 2018 and 2019. The Policy was approved by the General Meeting held on March 17, 2017
by a majority of 96.54%.
Likewise, the executive directors have received the annual variable remuneration corresponding to the year
2016 which payment vested during the first quarter of 2017, in accordance with the settlement and payment
system established under the former remuneration policy for directors, approved by the General Meeting
held on March 13, 2015.
In accordance with that settlement and payment system:
The upfront payment of the annual variable remuneration for executive directors corresponding to the year 2016 has been paid in equal parts in cash and in BBVA shares.
The remaining 50% of the annual variable remuneration, both in cash and in shares, has been deferred in its entirety for a three-year period, with its accrual and payment subject to compliance with a series of multi-year indicators.
All the shares delivered pursuant to the indicated rules will be withheld for a one-year period from the date of delivery. This withholding will be applied to the net amount of the shares, after discounting the amount necessary to honor the payment of taxes accruing on the shares received.
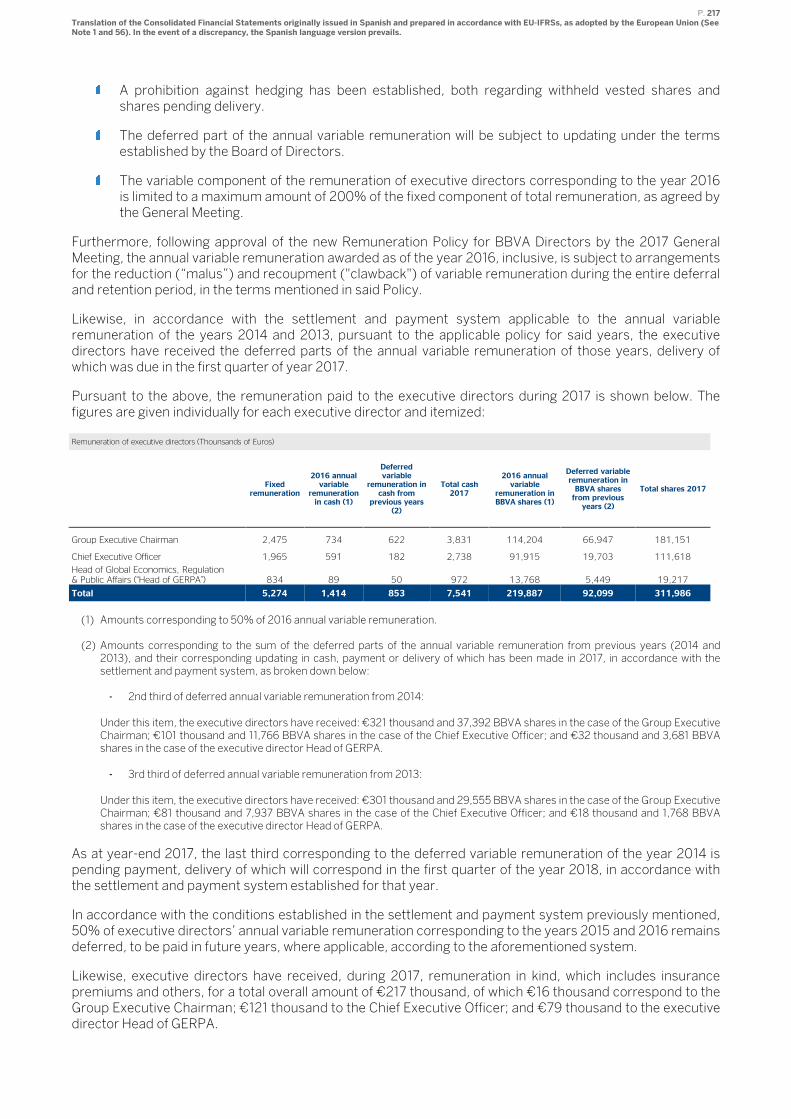
P. 217 Translation of the Consolidated Financial Statements originally issued in Spanish and prepared in accordance with EU-IFRSs, as adopted by the European Union (See Note 1 and 56). In the event of a discrepancy, the Spanish language version prevails.
A prohibition against hedging has been established, both regarding withheld vested shares and shares pending delivery.
The deferred part of the annual variable remuneration will be subject to updating under the terms established by the Board of Directors.
The variable component of the remuneration of executive directors corresponding to the year 2016 is limited to a maximum amount of 200% of the fixed component of total remuneration, as agreed by the General Meeting.
Furthermore, following approval of the new Remuneration Policy for BBVA Directors by the 2017 General Meeting, the annual variable remuneration awarded as of the year 2016, inclusive, is subject to arrangements for the reduction (“malus”) and recoupment ("clawback") of variable remuneration during the entire deferral and retention period, in the terms mentioned in said Policy.
Likewise, in accordance with the settlement and payment system applicable to the annual variable remuneration of the years 2014 and 2013, pursuant to the applicable policy for said years, the executive directors have received the deferred parts of the annual variable remuneration of those years, delivery of which was due in the first quarter of year 2017.
Pursuant to the above, the remuneration paid to the executive directors during 2017 is shown below. The figures are given individually for each executive director and itemized:
Remuneration of executive directors (Thounsands of Euros)
Fixed remuneration
2016 annual variable
remuneration in cash (1)
Deferred variable
remuneration in cash from
previous years (2)
Total cash 2017
2016 annual variable
remuneration in BBVA shares (1)
Deferred variable remuneration in BBVA shares from previous years (2)
Total shares 2017
Group Executive Chairman 2,475 734 622 3,831 114,204 66,947 181,151
Chief Executive Officer 1,965 591 182 2,738 91,915 19,703 111,618
Head of Global Economics, Regulation & Public Affairs (“Head of GERPA”) 834 89 50 972 13,768 5,449 19,217
Total 5,274 1,414 853 7,541 219,887 92,099 311,986
(1) Amounts corresponding to 50% of 2016 annual variable remuneration.
(2) Amounts corresponding to the sum of the deferred parts of the annual variable remuneration from previous years (2014 and
2013), and their corresponding updating in cash, payment or delivery of which has been made in 2017, in accordance with the settlement and payment system, as broken down below:
- 2nd third of deferred annual variable remuneration from 2014:
Under this item, the executive directors have received: €321 thousand and 37,392 BBVA shares in the case of the Group Executive Chairman; €101 thousand and 11,766 BBVA shares in the case of the Chief Executive Officer; and €32 thousand and 3,681 BBVA shares in the case of the executive director Head of GERPA.
- 3rd third of deferred annual variable remuneration from 2013:
Under this item, the executive directors have received: €301 thousand and 29,555 BBVA shares in the case of the Group Executive Chairman; €81 thousand and 7,937 BBVA shares in the case of the Chief Executive Officer; and €18 thousand and 1,768 BBVA shares in the case of the executive director Head of GERPA.
As at year-end 2017, the last third corresponding to the deferred variable remuneration of the year 2014 is pending payment, delivery of which will correspond in the first quarter of the year 2018, in accordance with the settlement and payment system established for that year.
In accordance with the conditions established in the settlement and payment system previously mentioned, 50% of executive directors’ annual variable remuneration corresponding to the years 2015 and 2016 remains deferred, to be paid in future years, where applicable, according to the aforementioned system.
Likewise, executive directors have received, during 2017, remuneration in kind, which includes insurance premiums and others, for a total overall amount of €217 thousand, of which €16 thousand correspond to the Group Executive Chairman; €121 thousand to the Chief Executive Officer; and €79 thousand to the executive director Head of GERPA.
P. 218 Translation of the Consolidated Financial Statements originally issued in Spanish and prepared in accordance with EU-IFRSs, as adopted by the European Union (See Note 1 and 56). In the event of a discrepancy, the Spanish language version prevails.
Annual variable remuneration of executive directors for the year
Following year-end 2017, the variable remuneration for executive directors corresponding to that year has been determined, applying the conditions established at the beginning of 2017, as set forth in the Remuneration Policy for BBVA Directors, approved by the General Meeting held on 17 March 2017, in the following terms:
40% of the annual variable remuneration corresponding to 2017 will be paid, during the first quarter of 2018, in equal parts in cash and in shares, which amounts to €660 thousand and 90,933 BBVA shares in the case of the Group Executive Chairman; €562 thousand and 77,493 BBVA shares in the case of the Chief Executive Officer; and €87 thousand and 12,029 BBVA shares in the case of the executive director Head of GERPA.
The remaining 60% will be deferred for a five-year period, subject to compliance with the multi-year performance indicators (the “Deferred Component”), which will vest, 40% in cash and 60% in shares, under the following schedule: 60% of the Deferred Component after the third year of deferral; 20% after the fourth year of deferral; and 20% after the fifth year of deferral.
The Deferred Component of the annual variable remuneration will be subject to compliance with the multi-year performance indicators determined by the Board of Directors at the beginning of the year, calculated over the first three years of deferral. The application of these indicators may lead to a reduction of the Deferred Component, even in its entirety, but in no event lead to an increase in its amount.
Moreover, in accordance with the settlement and payment system established in the Remuneration Policy for BBVA Directors: Shares delivered to executive directors as annual variable remuneration shall be withheld for a one-year period from the date of delivery. Upon reception of the shares, executive directors will not be allowed to transfer a number of shares equivalent to twice their annual fixed remuneration for at least three years after their delivery. The foregoing shall not apply to the transfer of those shares required to honor the payment of taxes.
The annual variable remuneration deferred in cash will be subject to updating in the terms established by the Board of Directors.
Executive directors shall not be allowed to use personal hedging strategies or insurance in connection with remuneration and responsibility that may undermine the effects of alignment with sound risk management.
The variable component of the remuneration of executive directors for the year 2017 will be limited to a maximum amount of 200% of the fixed component of total remuneration, as approved by the General Meeting.
Finally, the entire annual variable remuneration of executive directors will be subject to malus and clawback arrangements during the entire deferral and retention period.
The amounts corresponding to the deferred shares are recorded under the item “own share based compensation schemes - equity” and the amounts corresponding to cash are recorded under the item “Other Liabilities – Accrued interest” of the consolidated balance sheet at 31 December 2017.
Remuneration of the members of the Senior Management received in 2017
During 2017, members of Senior Management have received the amount of the fixed remuneration corresponding to that year and the annual variable remuneration corresponding to the year 2016, which payment vested during the first quarter of the year 2017, according to the settlement and payment system set forth in the remuneration policy applicable to the Senior Management in that year.
In accordance with this settlement and payment system:
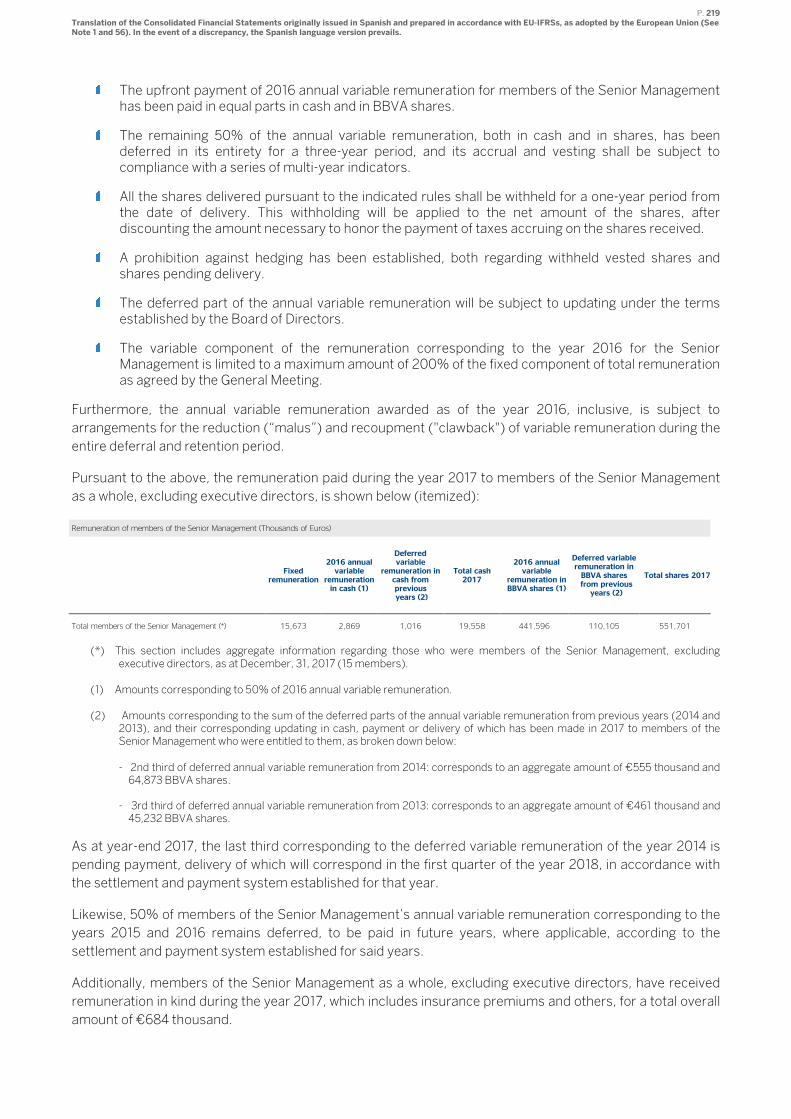
P. 219 Translation of the Consolidated Financial Statements originally issued in Spanish and prepared in accordance with EU-IFRSs, as adopted by the European Union (See Note 1 and 56). In the event of a discrepancy, the Spanish language version prevails.
The upfront payment of 2016 annual variable remuneration for members of the Senior Management has been paid in equal parts in cash and in BBVA shares.
The remaining 50% of the annual variable remuneration, both in cash and in shares, has been deferred in its entirety for a three-year period, and its accrual and vesting shall be subject to compliance with a series of multi-year indicators.
All the shares delivered pursuant to the indicated rules shall be withheld for a one-year period from the date of delivery. This withholding will be applied to the net amount of the shares, after discounting the amount necessary to honor the payment of taxes accruing on the shares received.
A prohibition against hedging has been established, both regarding withheld vested shares and shares pending delivery.
The deferred part of the annual variable remuneration will be subject to updating under the terms established by the Board of Directors.
The variable component of the remuneration corresponding to the year 2016 for the Senior Management is limited to a maximum amount of 200% of the fixed component of total remuneration as agreed by the General Meeting.
Furthermore, the annual variable remuneration awarded as of the year 2016, inclusive, is subject to
arrangements for the reduction (“malus”) and recoupment ("clawback") of variable remuneration during the
entire deferral and retention period.
Pursuant to the above, the remuneration paid during the year 2017 to members of the Senior Management
as a whole, excluding executive directors, is shown below (itemized):
Remuneration of members of the Senior Management (Thousands of Euros)
Fixed remuneration
2016 annual variable
remuneration in cash (1)
Deferred variable
remuneration in cash from previous years (2)
Total cash 2017
2016 annual variable
remuneration in BBVA shares (1)
Deferred variable remuneration in BBVA shares from previous years (2)
Total shares 2017
Total members of the Senior Management (*) 15,673 2,869 1,016 19,558 441,596 110,105 551,701
(*) This section includes aggregate information regarding those who were members of the Senior Management, excluding executive directors, as at December, 31, 2017 (15 members).
(1) Amounts corresponding to 50% of 2016 annual variable remuneration.
(2) Amounts corresponding to the sum of the deferred parts of the annual variable remuneration from previous years (2014 and 2013), and their corresponding updating in cash, payment or delivery of which has been made in 2017 to members of the Senior Management who were entitled to them, as broken down below:
- 2nd third of deferred annual variable remuneration from 2014: corresponds to an aggregate amount of €555 thousand and 64,873 BBVA shares.
- 3rd third of deferred annual variable remuneration from 2013: corresponds to an aggregate amount of €461 thousand and 45,232 BBVA shares.
As at year-end 2017, the last third corresponding to the deferred variable remuneration of the year 2014 is
pending payment, delivery of which will correspond in the first quarter of the year 2018, in accordance with
the settlement and payment system established for that year.
Likewise, 50% of members of the Senior Management’s annual variable remuneration corresponding to the
years 2015 and 2016 remains deferred, to be paid in future years, where applicable, according to the
settlement and payment system established for said years.
Additionally, members of the Senior Management as a whole, excluding executive directors, have received
remuneration in kind during the year 2017, which includes insurance premiums and others, for a total overall
amount of €684 thousand.
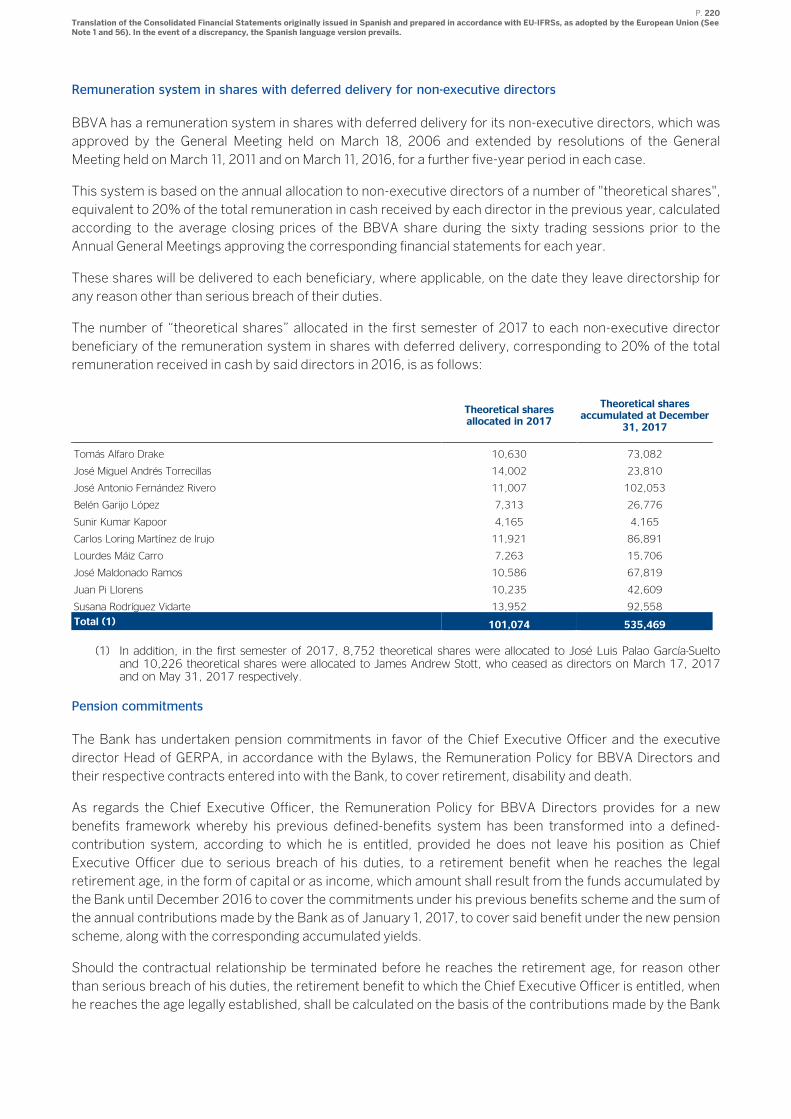
P. 220 Translation of the Consolidated Financial Statements originally issued in Spanish and prepared in accordance with EU-IFRSs, as adopted by the European Union (See Note 1 and 56). In the event of a discrepancy, the Spanish language version prevails.
Remuneration system in shares with deferred delivery for non-executive directors
BBVA has a remuneration system in shares with deferred delivery for its non-executive directors, which was
approved by the General Meeting held on March 18, 2006 and extended by resolutions of the General
Meeting held on March 11, 2011 and on March 11, 2016, for a further five-year period in each case.
This system is based on the annual allocation to non-executive directors of a number of "theoretical shares",
equivalent to 20% of the total remuneration in cash received by each director in the previous year, calculated
according to the average closing prices of the BBVA share during the sixty trading sessions prior to the
Annual General Meetings approving the corresponding financial statements for each year.
These shares will be delivered to each beneficiary, where applicable, on the date they leave directorship for
any reason other than serious breach of their duties.
The number of “theoretical shares” allocated in the first semester of 2017 to each non-executive director
beneficiary of the remuneration system in shares with deferred delivery, corresponding to 20% of the total
remuneration received in cash by said directors in 2016, is as follows:
Theoretical shares allocated in 2017
Theoretical shares accumulated at December
31, 2017
Tomás Alfaro Drake 10,630 73,082
José Miguel Andrés Torrecillas 14,002 23,810
José Antonio Fernández Rivero 11,007 102,053
Belén Garijo López 7,313 26,776
Sunir Kumar Kapoor 4,165 4,165
Carlos Loring Martínez de Irujo 11,921 86,891
Lourdes Máiz Carro 7,263 15,706
José Maldonado Ramos 10,586 67,819
Juan Pi Llorens 10,235 42,609
Susana Rodríguez Vidarte 13,952 92,558
Total (1) 101,074 535,469
(1) In addition, in the first semester of 2017, 8,752 theoretical shares were allocated to José Luis Palao García-Suelto and 10,226 theoretical shares were allocated to James Andrew Stott, who ceased as directors on March 17, 2017 and on May 31, 2017 respectively.
Pension commitments
The Bank has undertaken pension commitments in favor of the Chief Executive Officer and the executive
director Head of GERPA, in accordance with the Bylaws, the Remuneration Policy for BBVA Directors and
their respective contracts entered into with the Bank, to cover retirement, disability and death.
As regards the Chief Executive Officer, the Remuneration Policy for BBVA Directors provides for a new
benefits framework whereby his previous defined-benefits system has been transformed into a defined-
contribution system, according to which he is entitled, provided he does not leave his position as Chief
Executive Officer due to serious breach of his duties, to a retirement benefit when he reaches the legal
retirement age, in the form of capital or as income, which amount shall result from the funds accumulated by
the Bank until December 2016 to cover the commitments under his previous benefits scheme and the sum of
the annual contributions made by the Bank as of January 1, 2017, to cover said benefit under the new pension
scheme, along with the corresponding accumulated yields.
Should the contractual relationship be terminated before he reaches the retirement age, for reason other
than serious breach of his duties, the retirement benefit to which the Chief Executive Officer is entitled, when
he reaches the age legally established, shall be calculated on the basis of the contributions made by the Bank
P. 221 Translation of the Consolidated Financial Statements originally issued in Spanish and prepared in accordance with EU-IFRSs, as adopted by the European Union (See Note 1 and 56). In the event of a discrepancy, the Spanish language version prevails.
up to that date, along with the corresponding accumulated yields, with no additional contributions to be
made by the Bank upon leave of directorship.
The amount established in the Remuneration Policy for BBVA Directors for the Chief Executive Officer, as
annual contribution to cover the retirement benefit under the new defined-contribution scheme, amounts to
€1,642 thousand, amount which shall be updated in the same proportion as the annual fixed remuneration
for the Chief Executive Officer, in the terms established in said Policy.
Likewise, pursuant to the Policy, 15% of the agreed annual contribution, mentioned above, shall be based on
variable components and be considered "discretionary pension benefits", thus subject to the conditions of
delivery in shares, retention and clawback established in applicable regulations, as well as to those other
conditions of variable remuneration applicable to them pursuant to the aforementioned Policy.
On the other hand, the Bank will assume payment of the annual insurance premiums in order to top up the
coverage of death and disability of the Chief Executive Officer’s benefits scheme, in the terms established in
the Remuneration Policy for BBVA Directors.
Pursuant to the foregoing, in the year 2017 an amount of €1,853 thousand has been recorded to attend the
benefits commitments undertaken with the Chief Executive Officer, amount which includes the contribution
to retirement coverage (€1,642 thousand), as well as to death and disability (€211 thousand), with the total
accumulated fund to cover retirement commitments amounting €17,503 thousand, as at December 31,
2017.
15% of the agreed annual contribution to retirement (€246 thousand) has been registered in the year 2017
as “discretionary pension benefits” and, following year-end 2017, said amount has been adjusted according
to the criteria established for the determination of the Chief Executive Officer’s annual variable remuneration
for 2017. Accordingly, the “discretionary pension benefits” for the year 2017 have been determined in an
amount of €288 thousand, amount which will be included in the accumulated fund in the year 2018, subject
to the same conditions as the Deferred Component of annual variable remuneration for the year 2017, as well
as the remaining conditions established for these benefits in the Remuneration Policy for BBVA Directors.
As regards the executive director Head of GERPA, the pension scheme established in the Remuneration
Policy for BBVA Directors establishes an annual contribution of 30% of his fixed remuneration as of January
1, 2017, to cover retirement benefit, as well as payment of the corresponding annual insurance premiums in
order to top up the coverage of death and disability.
As in the case of the Chief Executive Officer, 15% of the agreed annual contribution, mentioned above, shall
be based on variable components and be considered "discretionary pension benefits", thus subject to the
conditions of delivery in shares, retention and clawback established in applicable regulations, as well as to
those other conditions of variable remuneration applicable to them pursuant to the aforementioned Policy.
The executive director Head of GERPA shall be entitled, when he reaches the retirement age, to the benefits
arising from the contributions made by the Bank to cover pension commitments, plus the corresponding
accumulated yields up to that date, provided he does not leave his position due to serious breach of his
duties. In the event of voluntary termination of contractual relationship by the director before retirement,
benefits shall be limited to 50% of the contributions made by the Bank to that date, along with the
corresponding accumulated yields, with the Bank's contributions ceasing upon leave of directorship.
Pursuant to the foregoing, in the year 2017 an amount of €393 thousand has been recorded to attend the
benefits commitments undertaken with the executive director Head of GERPA, amount which includes the
contribution to retirement coverage (€250 thousand), as well as to death and disability (€143 thousand),
with the total accumulated fund to cover retirement commitments amounting €842 thousand, as at
December 31, 2017.
P. 222 Translation of the Consolidated Financial Statements originally issued in Spanish and prepared in accordance with EU-IFRSs, as adopted by the European Union (See Note 1 and 56). In the event of a discrepancy, the Spanish language version prevails.
15% of the agreed annual contribution to retirement (€38 thousand) has been registered in the year 2017 as
“discretionary pension benefits” and, following year-end 2017, said amount has been adjusted according to
the criteria established for the determination of the executive director Head of GERPA’s annual variable
remuneration for 2017. Accordingly, the “discretionary pension benefits” for the year 2017 have been
determined in an amount of €46 thousand, amount which will be included in the accumulated fund in the
year 2018, subject to the same conditions as the Deferred Component of annual variable remuneration for
the year 2017, as well as the remaining conditions established for these benefits in the Remuneration Policy
for BBVA Directors.
There are no other pension obligations undertaken in favor of other executive directors.
Likewise, an amount of €5,630 thousand has been recorded to attend the benefits commitments undertaken
with members of the Senior Management, excluding executive directors, amount which includes the
contribution to retirement coverage (€4,910 thousand), as well as to death and disability (€720 thousand),
with the total accumulated fund to cover retirement commitments with the Senior Management amounting
€55,689 thousand, as at December 31, 2017.
As in the case of executive directors, 15% of the annual contributions agreed for members of the Senior
Management shall be based on variable components and be considered "discretionary pension benefits",
thus subject to the conditions of delivery in shares, retention and clawback established in applicable
regulations, as well as to those other conditions of variable remuneration applicable to them pursuant to the
remuneration policy applicable to Senior Management.
Pursuant to the foregoing, from the annual contribution to cover retirement recorded in 2017, an amount of
€585 thousand has been recorded in the year 2017 as “discretionary pension benefits” and, following year-
end 2017, said amount has been adjusted according to the criteria established for the determination of the
Senior Management’s annual variable remuneration for 2017. Accordingly, the “discretionary pension
benefits” for the year 2017 have been determined in an amount of €589 thousand, amount which will be
included in the accumulated fund in the year 2018, subject to the same conditions as the Deferred
Component of annual variable remuneration for the year 2017, as well as the remaining conditions
established for these benefits in the remuneration policy applicable to members of the Senior Management.
Extinction of contractual relationship
In accordance with the Remuneration Policy for BBVA Directors, approved by the 2017 General Meeting, the
Bank has no commitments to pay severance indemnity to executive directors.
The new contractual framework defined in the aforementioned Policy for the Chief Executive Officer and the
executive director Head of GERPA includes a post-contractual non-compete agreement for a period of two
years, after they cease as BBVA executive directors, in accordance to which they shall receive remuneration
in an amount equivalent to one annual fixed remuneration for every year of duration of the non-compete
arrangement, which shall be paid periodically over the course of the two years, provided that leave of
directorship is not due to retirement, disability or serious breach of duties.
55. Other information
55.1 Environmental impact
Given the activities BBVA Group entities engage in, the Group has no environmental liabilities, expenses,
assets, provisions or contingencies that could have a significant effect on its consolidated equity, financial
situation and profits. Consequently, as of December 31, 2017, there is no item in the Group’s accompanying
consolidated financial statements that requires disclosure in an environmental information report pursuant
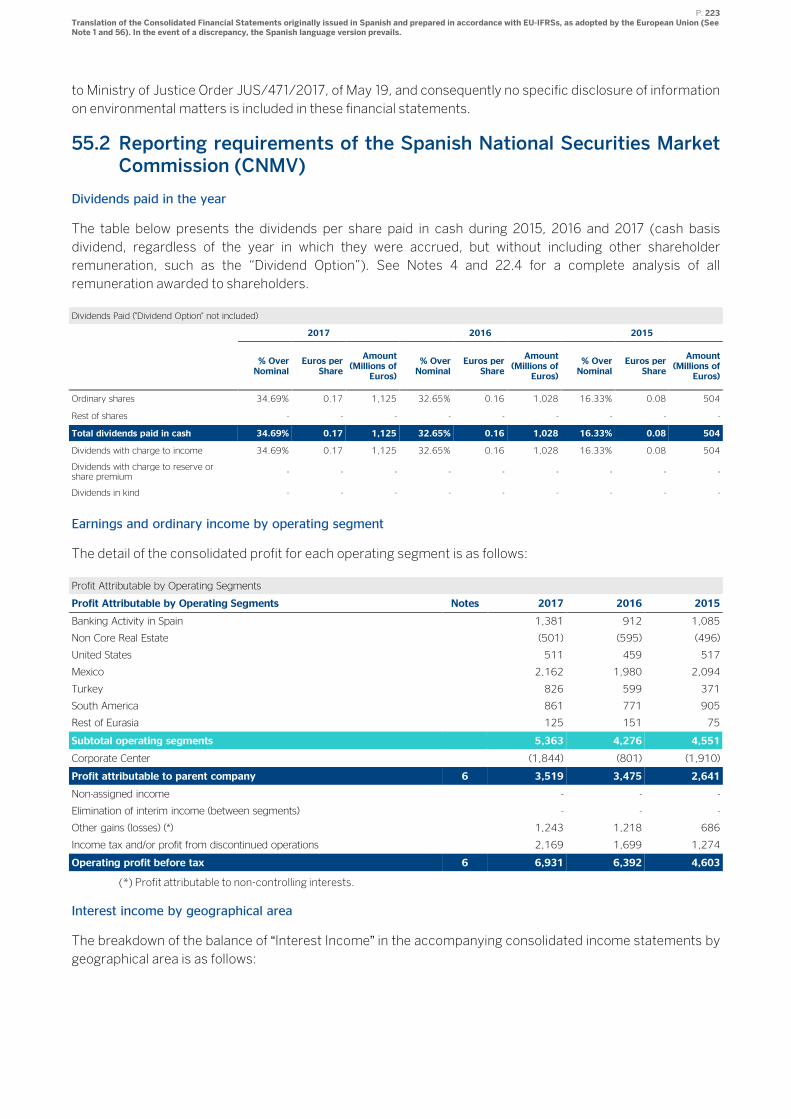
P. 223 Translation of the Consolidated Financial Statements originally issued in Spanish and prepared in accordance with EU-IFRSs, as adopted by the European Union (See Note 1 and 56). In the event of a discrepancy, the Spanish language version prevails.
to Ministry of Justice Order JUS/471/2017, of May 19, and consequently no specific disclosure of information
on environmental matters is included in these financial statements.
55.2 Reporting requirements of the Spanish National Securities Market Commission (CNMV)
Dividends paid in the year
The table below presents the dividends per share paid in cash during 2015, 2016 and 2017 (cash basis
dividend, regardless of the year in which they were accrued, but without including other shareholder
remuneration, such as the “Dividend Option”). See Notes 4 and 22.4 for a complete analysis of all
remuneration awarded to shareholders.
Dividends Paid ("Dividend Option" not included)
2017 2016 2015
% Over Nominal
Euros per Share
Amount (Millions of
Euros)
% Over Nominal
Euros per Share
Amount (Millions of
Euros)
% Over Nominal
Euros per Share
Amount (Millions of
Euros)
Ordinary shares 34.69% 0.17 1,125 32.65% 0.16 1,028 16.33% 0.08 504
Rest of shares - - - - - - - - -
Total dividends paid in cash 34.69% 0.17 1,125 32.65% 0.16 1,028 16.33% 0.08 504
Dividends with charge to income 34.69% 0.17 1,125 32.65% 0.16 1,028 16.33% 0.08 504
Dividends with charge to reserve or share premium
- - - - - - - - -
Dividends in kind - - - - - - - - -
Earnings and ordinary income by operating segment
The detail of the consolidated profit for each operating segment is as follows:
Profit Attributable by Operating Segments
Profit Attributable by Operating Segments Notes 2017 2016 2015
Banking Activity in Spain 1,381 912 1,085
Non Core Real Estate (501) (595) (496)
United States 511 459 517
Mexico 2,162 1,980 2,094
Turkey 826 599 371
South America 861 771 905
Rest of Eurasia 125 151 75
Subtotal operating segments 5,363 4,276 4,551
Corporate Center (1,844) (801) (1,910)
Profit attributable to parent company 6 3,519 3,475 2,641
Non-assigned income - - -
Elimination of interim income (between segments) - - -
Other gains (losses) (*) 1,243 1,218 686
Income tax and/or profit from discontinued operations 2,169 1,699 1,274
Operating profit before tax 6 6,931 6,392 4,603
(*) Profit attributable to non-controlling interests.
Interest income by geographical area
The breakdown of the balance of “Interest Income” in the accompanying consolidated income statements by
geographical area is as follows:
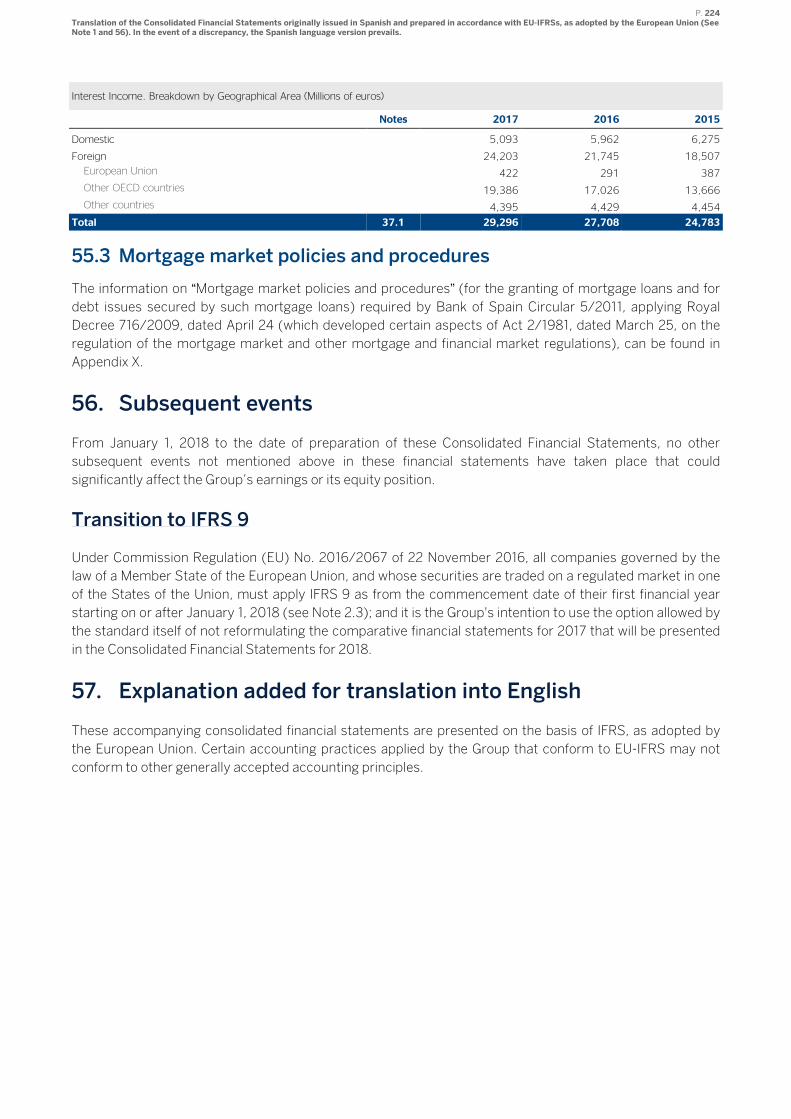
P. 224 Translation of the Consolidated Financial Statements originally issued in Spanish and prepared in accordance with EU-IFRSs, as adopted by the European Union (See Note 1 and 56). In the event of a discrepancy, the Spanish language version prevails.
Interest Income. Breakdown by Geographical Area (Millions of euros)
Notes 2017 2016 2015
Domestic 5,093 5,962 6,275
Foreign 24,203 21,745 18,507
European Union 422 291 387
Other OECD countries 19,386 17,026 13,666
Other countries 4,395 4,429 4,454
Total 37.1 29,296 27,708 24,783
55.3 Mortgage market policies and procedures
The information on “Mortgage market policies and procedures” (for the granting of mortgage loans and for
debt issues secured by such mortgage loans) required by Bank of Spain Circular 5/2011, applying Royal
Decree 716/2009, dated April 24 (which developed certain aspects of Act 2/1981, dated March 25, on the
regulation of the mortgage market and other mortgage and financial market regulations), can be found in
Appendix X.
56. Subsequent events
From January 1, 2018 to the date of preparation of these Consolidated Financial Statements, no other
subsequent events not mentioned above in these financial statements have taken place that could
significantly affect the Group’s earnings or its equity position.
Transition to IFRS 9
Under Commission Regulation (EU) No. 2016/2067 of 22 November 2016, all companies governed by the
law of a Member State of the European Union, and whose securities are traded on a regulated market in one
of the States of the Union, must apply IFRS 9 as from the commencement date of their first financial year
starting on or after January 1, 2018 (see Note 2.3); and it is the Group's intention to use the option allowed by
the standard itself of not reformulating the comparative financial statements for 2017 that will be presented
in the Consolidated Financial Statements for 2018.
57. Explanation added for translation into English
These accompanying consolidated financial statements are presented on the basis of IFRS, as adopted by
the European Union. Certain accounting practices applied by the Group that conform to EU-IFRS may not
conform to other generally accepted accounting principles.

P. 225 Translation of the Consolidated Financial Statements originally issued in Spanish and prepared in accordance with EU-IFRSs, as adopted by the European Union (See Note 1 and 56). In the event of a discrepancy, the Spanish language version prevails.
Appendices
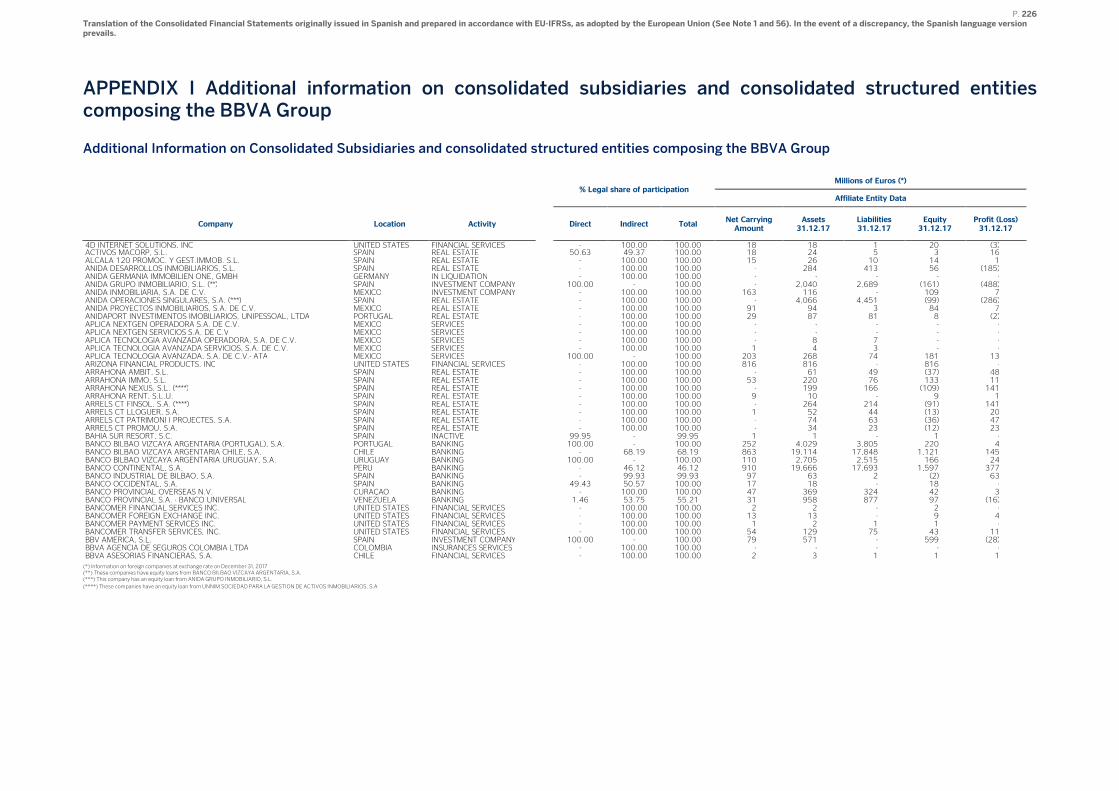
P. 226 Translation of the Consolidated Financial Statements originally issued in Spanish and prepared in accordance with EU-IFRSs, as adopted by the European Union (See Note 1 and 56). In the event of a discrepancy, the Spanish language version prevails.
APPENDIX I Additional information on consolidated subsidiaries and consolidated structured entities composing the BBVA Group
Additional Information on Consolidated Subsidiaries and consolidated structured entities composing the BBVA Group
% Legal share of participation
Millions of Euros (*)
Affiliate Entity Data
Company Location Activity
Direct Indirect Total
Net Carrying Amount
Assets 31.12.17
Liabilities 31.12.17
Equity 31.12.17
Profit (Loss) 31.12.17
4D INTERNET SOLUTIONS, INC UNITED STATES FINANCIAL SERVICES - 100.00 100.00 18 18 1 20 (3) ACTIVOS MACORP, S.L. SPAIN REAL ESTATE 50.63 49.37 100.00 18 24 5 3 16 ALCALA 120 PROMOC. Y GEST.IMMOB. S.L. SPAIN REAL ESTATE - 100.00 100.00 15 26 10 14 1 ANIDA DESARROLLOS INMOBILIARIOS, S.L. SPAIN REAL ESTATE - 100.00 100.00 - 284 413 56 (185) ANIDA GERMANIA IMMOBILIEN ONE, GMBH GERMANY IN LIQUIDATION - 100.00 100.00 - - - - - ANIDA GRUPO INMOBILIARIO, S.L. (**) SPAIN INVESTMENT COMPANY 100.00 - 100.00 - 2,040 2,689 (161) (488) ANIDA INMOBILIARIA, S.A. DE C.V. MEXICO INVESTMENT COMPANY - 100.00 100.00 163 116 - 109 7 ANIDA OPERACIONES SINGULARES, S.A. (***) SPAIN REAL ESTATE - 100.00 100.00 - 4,066 4,451 (99) (286) ANIDA PROYECTOS INMOBILIARIOS, S.A. DE C.V. MEXICO REAL ESTATE - 100.00 100.00 91 94 3 84 7 ANIDAPORT INVESTIMENTOS IMOBILIARIOS, UNIPESSOAL, LTDA PORTUGAL REAL ESTATE - 100.00 100.00 29 87 81 8 (2) APLICA NEXTGEN OPERADORA S.A. DE C.V. MEXICO SERVICES - 100.00 100.00 - - - - - APLICA NEXTGEN SERVICIOS S.A. DE C.V MEXICO SERVICES - 100.00 100.00 - - - - - APLICA TECNOLOGIA AVANZADA OPERADORA, S.A. DE C.V. MEXICO SERVICES - 100.00 100.00 - 8 7 - - APLICA TECNOLOGIA AVANZADA SERVICIOS, S.A. DE C.V. MEXICO SERVICES - 100.00 100.00 1 4 3 - - APLICA TECNOLOGIA AVANZADA, S.A. DE C.V.- ATA MEXICO SERVICES 100.00 - 100.00 203 268 74 181 13 ARIZONA FINANCIAL PRODUCTS, INC UNITED STATES FINANCIAL SERVICES - 100.00 100.00 816 816 - 816 - ARRAHONA AMBIT, S.L. SPAIN REAL ESTATE - 100.00 100.00 - 61 49 (37) 48 ARRAHONA IMMO, S.L. SPAIN REAL ESTATE - 100.00 100.00 53 220 76 133 11 ARRAHONA NEXUS, S.L. (****) SPAIN REAL ESTATE - 100.00 100.00 - 199 166 (109) 141 ARRAHONA RENT, S.L.U. SPAIN REAL ESTATE - 100.00 100.00 9 10 - 9 1 ARRELS CT FINSOL, S.A. (****) SPAIN REAL ESTATE - 100.00 100.00 - 264 214 (91) 141 ARRELS CT LLOGUER, S.A. SPAIN REAL ESTATE - 100.00 100.00 1 52 44 (13) 20 ARRELS CT PATRIMONI I PROJECTES, S.A. SPAIN REAL ESTATE - 100.00 100.00 - 74 63 (36) 47 ARRELS CT PROMOU, S.A. SPAIN REAL ESTATE - 100.00 100.00 - 34 23 (12) 23 BAHIA SUR RESORT, S.C. SPAIN INACTIVE 99.95 - 99.95 1 1 - 1 - BANCO BILBAO VIZCAYA ARGENTARIA (PORTUGAL), S.A. PORTUGAL BANKING 100.00 - 100.00 252 4,029 3,805 220 4 BANCO BILBAO VIZCAYA ARGENTARIA CHILE, S.A. CHILE BANKING - 68.19 68.19 863 19,114 17,848 1,121 145 BANCO BILBAO VIZCAYA ARGENTARIA URUGUAY, S.A. URUGUAY BANKING 100.00 - 100.00 110 2,705 2,515 166 24 BANCO CONTINENTAL, S.A. PERU BANKING - 46.12 46.12 910 19,666 17,693 1,597 377 BANCO INDUSTRIAL DE BILBAO, S.A. SPAIN BANKING - 99.93 99.93 97 63 2 (2) 63 BANCO OCCIDENTAL, S.A. SPAIN BANKING 49.43 50.57 100.00 17 18 - 18 - BANCO PROVINCIAL OVERSEAS N.V. CURAÇAO BANKING - 100.00 100.00 47 369 324 42 3 BANCO PROVINCIAL S.A. - BANCO UNIVERSAL VENEZUELA BANKING 1.46 53.75 55.21 31 958 877 97 (16) BANCOMER FINANCIAL SERVICES INC. UNITED STATES FINANCIAL SERVICES - 100.00 100.00 2 2 - 2 - BANCOMER FOREIGN EXCHANGE INC. UNITED STATES FINANCIAL SERVICES - 100.00 100.00 13 13 - 9 4 BANCOMER PAYMENT SERVICES INC. UNITED STATES FINANCIAL SERVICES - 100.00 100.00 1 2 1 1 - BANCOMER TRANSFER SERVICES, INC. UNITED STATES FINANCIAL SERVICES - 100.00 100.00 54 129 75 43 11 BBV AMERICA, S.L. SPAIN INVESTMENT COMPANY 100.00 - 100.00 79 571 - 599 (28) BBVA AGENCIA DE SEGUROS COLOMBIA LTDA COLOMBIA INSURANCES SERVICES - 100.00 100.00 - - - - - BBVA ASESORIAS FINANCIERAS, S.A. CHILE FINANCIAL SERVICES - 100.00 100.00 2 3 1 1 1 (*) Information on foreign companies at exchange rate on December 31, 2017 (**) These companies have equity loans from BANCO BILBAO VIZCAYA ARGENTARIA, S.A. (***) This company has an equity loan from ANIDA GRUPO INMOBILIARIO, S.L.
(****) These companies have an equity loan from UNNIM SOCIEDAD PARA LA GESTION DE ACTIVOS INMOBILIARIOS, S.A
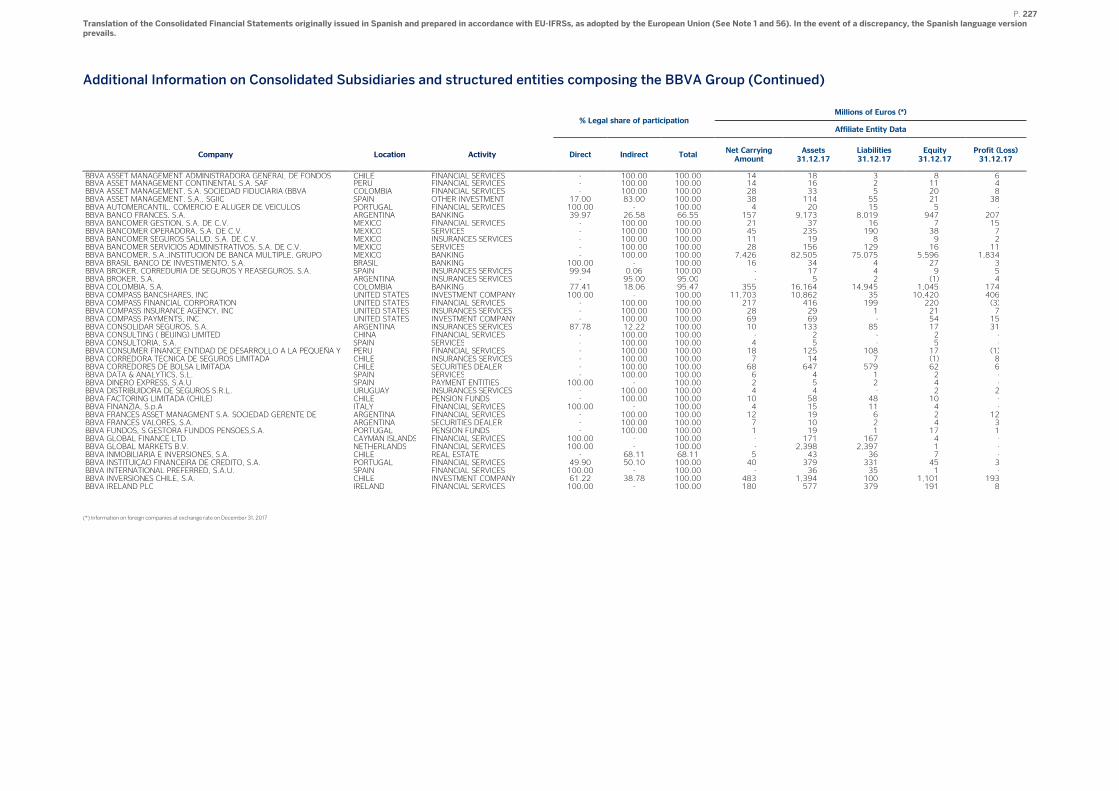
P. 227 Translation of the Consolidated Financial Statements originally issued in Spanish and prepared in accordance with EU-IFRSs, as adopted by the European Union (See Note 1 and 56). In the event of a discrepancy, the Spanish language version prevails.
Additional Information on Consolidated Subsidiaries and structured entities composing the BBVA Group (Continued)
% Legal share of participation
Millions of Euros (*)
Affiliate Entity Data
Company Location Activity Direct Indirect Total Net Carrying Amount
Assets 31.12.17
Liabilities 31.12.17
Equity 31.12.17
Profit (Loss) 31.12.17
BBVA ASSET MANAGEMENT ADMINISTRADORA GENERAL DE FONDOS CHILE FINANCIAL SERVICES - 100.00 100.00 14 18 3 8 6 BBVA ASSET MANAGEMENT CONTINENTAL S.A. SAF PERU FINANCIAL SERVICES - 100.00 100.00 14 16 2 11 4 BBVA ASSET MANAGEMENT, S.A. SOCIEDAD FIDUCIARIA (BBVA COLOMBIA FINANCIAL SERVICES - 100.00 100.00 28 33 5 20 8 BBVA ASSET MANAGEMENT, S.A., SGIIC SPAIN OTHER INVESTMENT 17.00 83.00 100.00 38 114 55 21 38 BBVA AUTOMERCANTIL, COMERCIO E ALUGER DE VEICULOS PORTUGAL FINANCIAL SERVICES 100.00 - 100.00 4 20 15 5 - BBVA BANCO FRANCES, S.A. ARGENTINA BANKING 39.97 26.58 66.55 157 9,173 8,019 947 207 BBVA BANCOMER GESTION, S.A. DE C.V. MEXICO FINANCIAL SERVICES - 100.00 100.00 21 37 16 7 15 BBVA BANCOMER OPERADORA, S.A. DE C.V. MEXICO SERVICES - 100.00 100.00 45 235 190 38 7 BBVA BANCOMER SEGUROS SALUD, S.A. DE C.V. MEXICO INSURANCES SERVICES - 100.00 100.00 11 19 8 9 2 BBVA BANCOMER SERVICIOS ADMINISTRATIVOS, S.A. DE C.V. MEXICO SERVICES - 100.00 100.00 28 156 129 16 11 BBVA BANCOMER, S.A.,INSTITUCION DE BANCA MULTIPLE, GRUPO MEXICO BANKING - 100.00 100.00 7,426 82,505 75,075 5,596 1,834 BBVA BRASIL BANCO DE INVESTIMENTO, S.A. BRASIL BANKING 100.00 - 100.00 16 34 4 27 3 BBVA BROKER, CORREDURIA DE SEGUROS Y REASEGUROS, S.A. SPAIN INSURANCES SERVICES 99.94 0.06 100.00 - 17 4 9 5 BBVA BROKER, S.A. ARGENTINA INSURANCES SERVICES - 95.00 95.00 - 5 2 (1) 4 BBVA COLOMBIA, S.A. COLOMBIA BANKING 77.41 18.06 95.47 355 16,164 14,945 1,045 174 BBVA COMPASS BANCSHARES, INC UNITED STATES INVESTMENT COMPANY 100.00 - 100.00 11,703 10,862 35 10,420 406 BBVA COMPASS FINANCIAL CORPORATION UNITED STATES FINANCIAL SERVICES - 100.00 100.00 217 416 199 220 (3) BBVA COMPASS INSURANCE AGENCY, INC UNITED STATES INSURANCES SERVICES - 100.00 100.00 28 29 1 21 7 BBVA COMPASS PAYMENTS, INC UNITED STATES INVESTMENT COMPANY - 100.00 100.00 69 69 - 54 15 BBVA CONSOLIDAR SEGUROS, S.A. ARGENTINA INSURANCES SERVICES 87.78 12.22 100.00 10 133 85 17 31 BBVA CONSULTING ( BEIJING) LIMITED CHINA FINANCIAL SERVICES - 100.00 100.00 - 2 - 2 - BBVA CONSULTORIA, S.A. SPAIN SERVICES - 100.00 100.00 4 5 - 5 - BBVA CONSUMER FINANCE ENTIDAD DE DESARROLLO A LA PEQUEÑA Y PERU FINANCIAL SERVICES - 100.00 100.00 18 125 108 17 (1) BBVA CORREDORA TECNICA DE SEGUROS LIMITADA CHILE INSURANCES SERVICES - 100.00 100.00 7 14 7 (1) 8 BBVA CORREDORES DE BOLSA LIMITADA CHILE SECURITIES DEALER - 100.00 100.00 68 647 579 62 6 BBVA DATA & ANALYTICS, S.L. SPAIN SERVICES - 100.00 100.00 6 4 1 2 - BBVA DINERO EXPRESS, S.A.U SPAIN PAYMENT ENTITIES 100.00 - 100.00 2 5 2 4 - BBVA DISTRIBUIDORA DE SEGUROS S.R.L. URUGUAY INSURANCES SERVICES - 100.00 100.00 4 4 - 2 2 BBVA FACTORING LIMITADA (CHILE) CHILE PENSION FUNDS - 100.00 100.00 10 58 48 10 - BBVA FINANZIA, S.p.A ITALY FINANCIAL SERVICES 100.00 - 100.00 4 15 11 4 - BBVA FRANCES ASSET MANAGMENT S.A. SOCIEDAD GERENTE DE ARGENTINA FINANCIAL SERVICES - 100.00 100.00 12 19 6 2 12 BBVA FRANCES VALORES, S.A. ARGENTINA SECURITIES DEALER - 100.00 100.00 7 10 2 4 3 BBVA FUNDOS, S.GESTORA FUNDOS PENSOES,S.A. PORTUGAL PENSION FUNDS - 100.00 100.00 1 19 1 17 1 BBVA GLOBAL FINANCE LTD. CAYMAN ISLANDS FINANCIAL SERVICES 100.00 - 100.00 - 171 167 4 - BBVA GLOBAL MARKETS B.V. NETHERLANDS FINANCIAL SERVICES 100.00 - 100.00 - 2,398 2,397 1 - BBVA INMOBILIARIA E INVERSIONES, S.A. CHILE REAL ESTATE - 68.11 68.11 5 43 36 7 - BBVA INSTITUIÇAO FINANCEIRA DE CREDITO, S.A. PORTUGAL FINANCIAL SERVICES 49.90 50.10 100.00 40 379 331 45 3 BBVA INTERNATIONAL PREFERRED, S.A.U. SPAIN FINANCIAL SERVICES 100.00 - 100.00 - 36 35 1 - BBVA INVERSIONES CHILE, S.A. CHILE INVESTMENT COMPANY 61.22 38.78 100.00 483 1,394 100 1,101 193 BBVA IRELAND PLC IRELAND FINANCIAL SERVICES 100.00 - 100.00 180 577 379 191 8
(*) Information on foreign companies at exchange rate on December 31, 2017
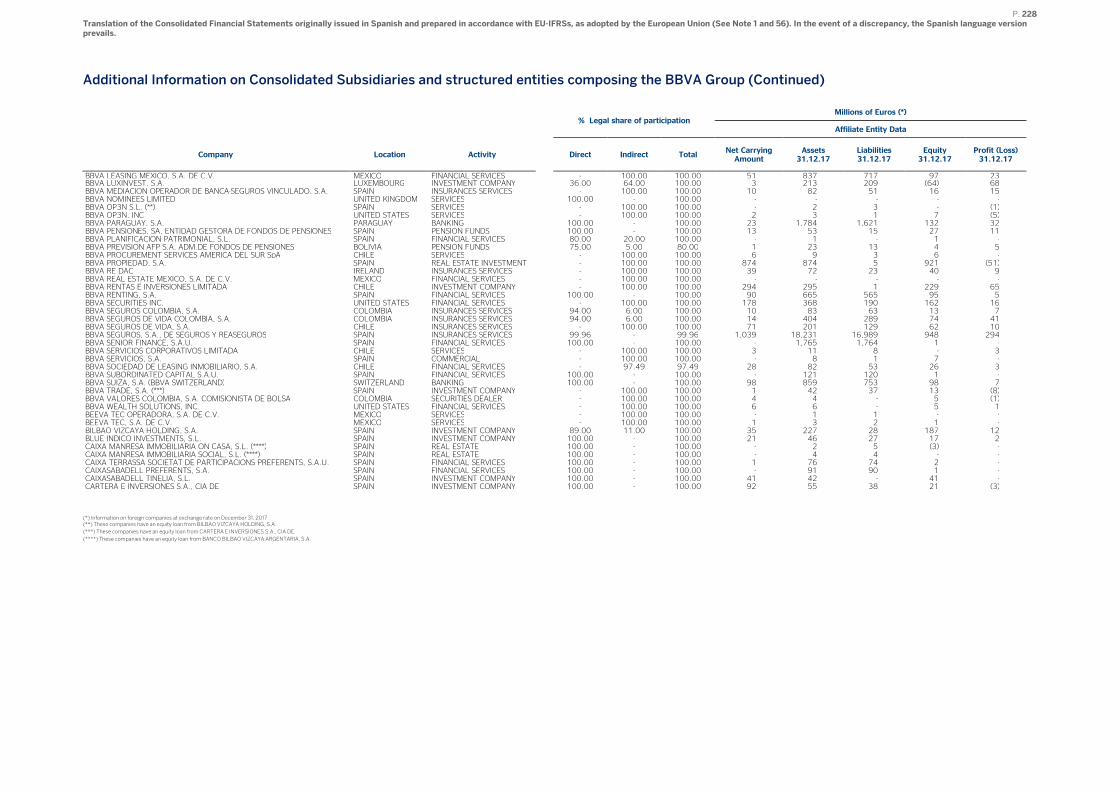
P. 228 Translation of the Consolidated Financial Statements originally issued in Spanish and prepared in accordance with EU-IFRSs, as adopted by the European Union (See Note 1 and 56). In the event of a discrepancy, the Spanish language version prevails.
Additional Information on Consolidated Subsidiaries and structured entities composing the BBVA Group (Continued)
% Legal share of participation
Millions of Euros (*)
Affiliate Entity Data
Company Location Activity
Direct Indirect Total
Net Carrying Amount
Assets 31.12.17
Liabilities 31.12.17
Equity 31.12.17
Profit (Loss) 31.12.17
BBVA LEASING MEXICO, S.A. DE C.V. MEXICO FINANCIAL SERVICES - 100.00 100.00 51 837 717 97 23 BBVA LUXINVEST, S.A. LUXEMBOURG INVESTMENT COMPANY 36.00 64.00 100.00 3 213 209 (64) 68 BBVA MEDIACION OPERADOR DE BANCA-SEGUROS VINCULADO, S.A. SPAIN INSURANCES SERVICES - 100.00 100.00 10 82 51 16 15 BBVA NOMINEES LIMITED UNITED KINGDOM SERVICES 100.00 - 100.00 - - - - - BBVA OP3N S.L. (**) SPAIN SERVICES - 100.00 100.00 - 2 3 - (1) BBVA OP3N, INC UNITED STATES SERVICES - 100.00 100.00 2 3 1 7 (5) BBVA PARAGUAY, S.A. PARAGUAY BANKING 100.00 - 100.00 23 1,784 1,621 132 32 BBVA PENSIONES, SA, ENTIDAD GESTORA DE FONDOS DE PENSIONES SPAIN PENSION FUNDS 100.00 - 100.00 13 53 15 27 11 BBVA PLANIFICACION PATRIMONIAL, S.L. SPAIN FINANCIAL SERVICES 80.00 20.00 100.00 - 1 - 1 - BBVA PREVISION AFP S.A. ADM.DE FONDOS DE PENSIONES BOLIVIA PENSION FUNDS 75.00 5.00 80.00 1 23 13 4 5 BBVA PROCUREMENT SERVICES AMERICA DEL SUR SpA CHILE SERVICES - 100.00 100.00 6 9 3 6 - BBVA PROPIEDAD, S.A. SPAIN REAL ESTATE INVESTMENT - 100.00 100.00 874 874 5 921 (51) BBVA RE DAC IRELAND INSURANCES SERVICES - 100.00 100.00 39 72 23 40 9 BBVA REAL ESTATE MEXICO, S.A. DE C.V. MEXICO FINANCIAL SERVICES - 100.00 100.00 - - - - - BBVA RENTAS E INVERSIONES LIMITADA CHILE INVESTMENT COMPANY - 100.00 100.00 294 295 1 229 65 BBVA RENTING, S.A. SPAIN FINANCIAL SERVICES 100.00 - 100.00 90 665 565 95 5 BBVA SECURITIES INC. UNITED STATES FINANCIAL SERVICES - 100.00 100.00 178 368 190 162 16 BBVA SEGUROS COLOMBIA, S.A. COLOMBIA INSURANCES SERVICES 94.00 6.00 100.00 10 83 63 13 7 BBVA SEGUROS DE VIDA COLOMBIA, S.A. COLOMBIA INSURANCES SERVICES 94.00 6.00 100.00 14 404 289 74 41 BBVA SEGUROS DE VIDA, S.A. CHILE INSURANCES SERVICES - 100.00 100.00 71 201 129 62 10 BBVA SEGUROS, S.A., DE SEGUROS Y REASEGUROS SPAIN INSURANCES SERVICES 99.96 - 99.96 1,039 18,231 16,989 948 294 BBVA SENIOR FINANCE, S.A.U. SPAIN FINANCIAL SERVICES 100.00 - 100.00 - 1,765 1,764 1 - BBVA SERVICIOS CORPORATIVOS LIMITADA CHILE SERVICES - 100.00 100.00 3 11 8 - 3 BBVA SERVICIOS, S.A. SPAIN COMMERCIAL - 100.00 100.00 - 8 1 7 - BBVA SOCIEDAD DE LEASING INMOBILIARIO, S.A. CHILE FINANCIAL SERVICES - 97.49 97.49 28 82 53 26 3 BBVA SUBORDINATED CAPITAL S.A.U. SPAIN FINANCIAL SERVICES 100.00 - 100.00 - 121 120 1 - BBVA SUIZA, S.A. (BBVA SWITZERLAND) SWITZERLAND BANKING 100.00 - 100.00 98 859 753 98 7 BBVA TRADE, S.A. (***) SPAIN INVESTMENT COMPANY - 100.00 100.00 1 42 37 13 (8) BBVA VALORES COLOMBIA, S.A. COMISIONISTA DE BOLSA COLOMBIA SECURITIES DEALER - 100.00 100.00 4 4 - 5 (1) BBVA WEALTH SOLUTIONS, INC. UNITED STATES FINANCIAL SERVICES - 100.00 100.00 6 6 - 5 1 BEEVA TEC OPERADORA, S.A. DE C.V. MEXICO SERVICES - 100.00 100.00 - 1 1 - - BEEVA TEC, S.A. DE C.V. MEXICO SERVICES - 100.00 100.00 1 3 2 1 - BILBAO VIZCAYA HOLDING, S.A. SPAIN INVESTMENT COMPANY 89.00 11.00 100.00 35 227 28 187 12 BLUE INDICO INVESTMENTS, S.L. SPAIN INVESTMENT COMPANY 100.00 - 100.00 21 46 27 17 2 CAIXA MANRESA IMMOBILIARIA ON CASA, S.L. (****) SPAIN REAL ESTATE 100.00 - 100.00 - 2 5 (3) - CAIXA MANRESA IMMOBILIARIA SOCIAL, S.L. (****) SPAIN REAL ESTATE 100.00 - 100.00 - 4 4 - - CAIXA TERRASSA SOCIETAT DE PARTICIPACIONS PREFERENTS, S.A.U. SPAIN FINANCIAL SERVICES 100.00 - 100.00 1 76 74 2 - CAIXASABADELL PREFERENTS, S.A. SPAIN FINANCIAL SERVICES 100.00 - 100.00 - 91 90 1 - CAIXASABADELL TINELIA, S.L. SPAIN INVESTMENT COMPANY 100.00 - 100.00 41 42 - 41 - CARTERA E INVERSIONES S.A., CIA DE SPAIN INVESTMENT COMPANY 100.00 - 100.00 92 55 38 21 (3)
(*) Information on foreign companies at exchange rate on December 31, 2017 (**) These companies have an equity loan from BILBAO VIZCAYA HOLDING, S.A.
(***) These companies have an equity loan from CARTERA E INVERSIONES S.A., CIA DE.
(****) These companies have an equity loan from BANCO BILBAO VIZCAYA ARGENTARIA, S.A.
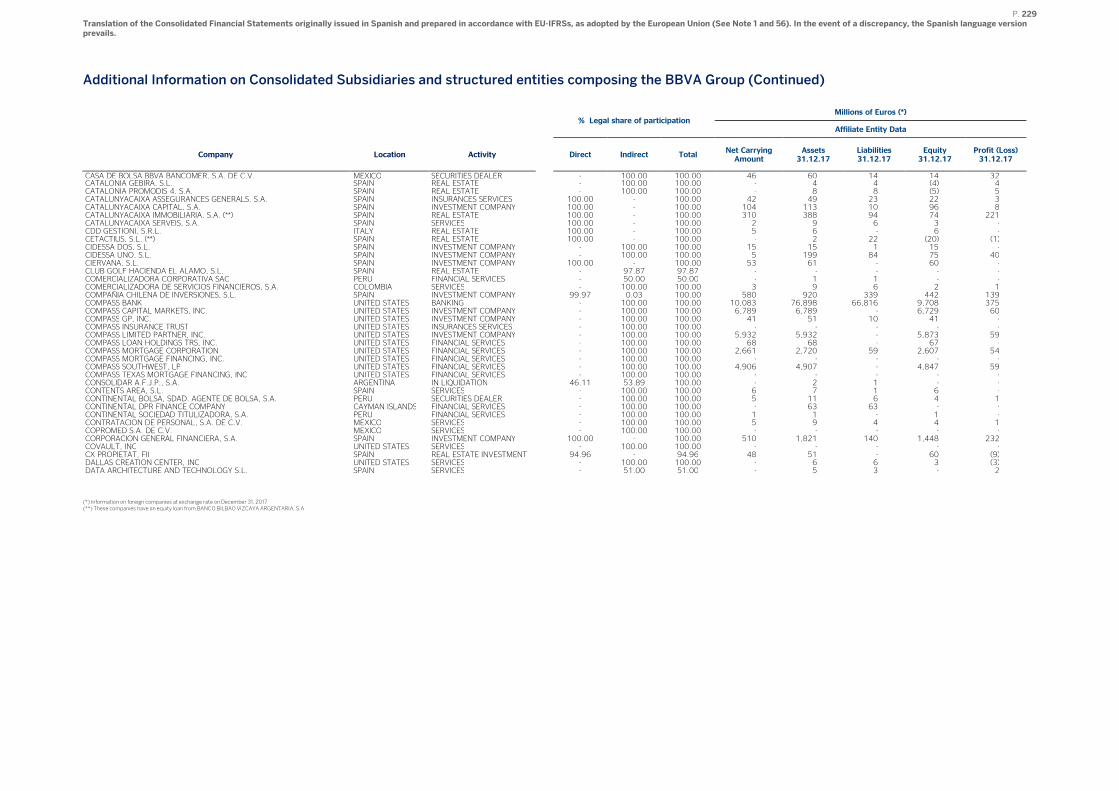
P. 229 Translation of the Consolidated Financial Statements originally issued in Spanish and prepared in accordance with EU-IFRSs, as adopted by the European Union (See Note 1 and 56). In the event of a discrepancy, the Spanish language version prevails.
Additional Information on Consolidated Subsidiaries and structured entities composing the BBVA Group (Continued)
% Legal share of participation
Millions of Euros (*)
Affiliate Entity Data
Company Location Activity
Direct Indirect Total
Net Carrying Amount
Assets 31.12.17
Liabilities 31.12.17
Equity 31.12.17
Profit (Loss) 31.12.17
CASA DE BOLSA BBVA BANCOMER, S.A. DE C.V. MEXICO SECURITIES DEALER - 100.00 100.00 46 60 14 14 32 CATALONIA GEBIRA, S.L. SPAIN REAL ESTATE - 100.00 100.00 - 4 4 (4) 4 CATALONIA PROMODIS 4, S.A. SPAIN REAL ESTATE - 100.00 100.00 - 8 8 (5) 5 CATALUNYACAIXA ASSEGURANCES GENERALS, S.A. SPAIN INSURANCES SERVICES 100.00 - 100.00 42 49 23 22 3 CATALUNYACAIXA CAPITAL, S.A. SPAIN INVESTMENT COMPANY 100.00 - 100.00 104 113 10 96 8 CATALUNYACAIXA IMMOBILIARIA, S.A. (**) SPAIN REAL ESTATE 100.00 - 100.00 310 388 94 74 221 CATALUNYACAIXA SERVEIS, S.A. SPAIN SERVICES 100.00 - 100.00 2 9 6 3 - CDD GESTIONI, S.R.L. ITALY REAL ESTATE 100.00 - 100.00 5 6 - 6 - CETACTIUS, S.L. (**) SPAIN REAL ESTATE 100.00 - 100.00 - 2 22 (20) (1) CIDESSA DOS, S.L. SPAIN INVESTMENT COMPANY - 100.00 100.00 15 15 1 15 - CIDESSA UNO, S.L. SPAIN INVESTMENT COMPANY - 100.00 100.00 5 199 84 75 40 CIERVANA, S.L. SPAIN INVESTMENT COMPANY 100.00 - 100.00 53 61 - 60 - CLUB GOLF HACIENDA EL ALAMO, S.L. SPAIN REAL ESTATE - 97.87 97.87 - - - - - COMERCIALIZADORA CORPORATIVA SAC PERU FINANCIAL SERVICES - 50.00 50.00 - 1 1 - - COMERCIALIZADORA DE SERVICIOS FINANCIEROS, S.A. COLOMBIA SERVICES - 100.00 100.00 3 9 6 2 1 COMPAÑIA CHILENA DE INVERSIONES, S.L. SPAIN INVESTMENT COMPANY 99.97 0.03 100.00 580 920 339 442 139 COMPASS BANK UNITED STATES BANKING - 100.00 100.00 10,083 76,898 66,816 9,708 375 COMPASS CAPITAL MARKETS, INC. UNITED STATES INVESTMENT COMPANY - 100.00 100.00 6,789 6,789 - 6,729 60 COMPASS GP, INC. UNITED STATES INVESTMENT COMPANY - 100.00 100.00 41 51 10 41 - COMPASS INSURANCE TRUST UNITED STATES INSURANCES SERVICES - 100.00 100.00 - - - - - COMPASS LIMITED PARTNER, INC. UNITED STATES INVESTMENT COMPANY - 100.00 100.00 5,932 5,932 - 5,873 59 COMPASS LOAN HOLDINGS TRS, INC. UNITED STATES FINANCIAL SERVICES - 100.00 100.00 68 68 - 67 - COMPASS MORTGAGE CORPORATION UNITED STATES FINANCIAL SERVICES - 100.00 100.00 2,661 2,720 59 2,607 54 COMPASS MORTGAGE FINANCING, INC. UNITED STATES FINANCIAL SERVICES - 100.00 100.00 - - - - - COMPASS SOUTHWEST, LP UNITED STATES FINANCIAL SERVICES - 100.00 100.00 4,906 4,907 - 4,847 59 COMPASS TEXAS MORTGAGE FINANCING, INC UNITED STATES FINANCIAL SERVICES - 100.00 100.00 - - - - - CONSOLIDAR A.F.J.P., S.A. ARGENTINA IN LIQUIDATION 46.11 53.89 100.00 - 2 1 - - CONTENTS AREA, S.L. SPAIN SERVICES - 100.00 100.00 6 7 1 6 - CONTINENTAL BOLSA, SDAD. AGENTE DE BOLSA, S.A. PERU SECURITIES DEALER - 100.00 100.00 5 11 6 4 1 CONTINENTAL DPR FINANCE COMPANY CAYMAN ISLANDS FINANCIAL SERVICES - 100.00 100.00 - 63 63 - - CONTINENTAL SOCIEDAD TITULIZADORA, S.A. PERU FINANCIAL SERVICES - 100.00 100.00 1 1 - 1 - CONTRATACION DE PERSONAL, S.A. DE C.V. MEXICO SERVICES - 100.00 100.00 5 9 4 4 1 COPROMED S.A. DE C.V. MEXICO SERVICES - 100.00 100.00 - - - - - CORPORACION GENERAL FINANCIERA, S.A. SPAIN INVESTMENT COMPANY 100.00 - 100.00 510 1,821 140 1,448 232 COVAULT, INC UNITED STATES SERVICES - 100.00 100.00 - - - - - CX PROPIETAT, FII SPAIN REAL ESTATE INVESTMENT 94.96 - 94.96 48 51 - 60 (9) DALLAS CREATION CENTER, INC UNITED STATES SERVICES - 100.00 100.00 - 6 6 3 (3) DATA ARCHITECTURE AND TECHNOLOGY S.L. SPAIN SERVICES - 51.00 51.00 - 5 3 - 2
(*) Information on foreign companies at exchange rate on December 31, 2017 (**) These companies have an equity loan from BANCO BILBAO VIZCAYA ARGENTARIA, S.A
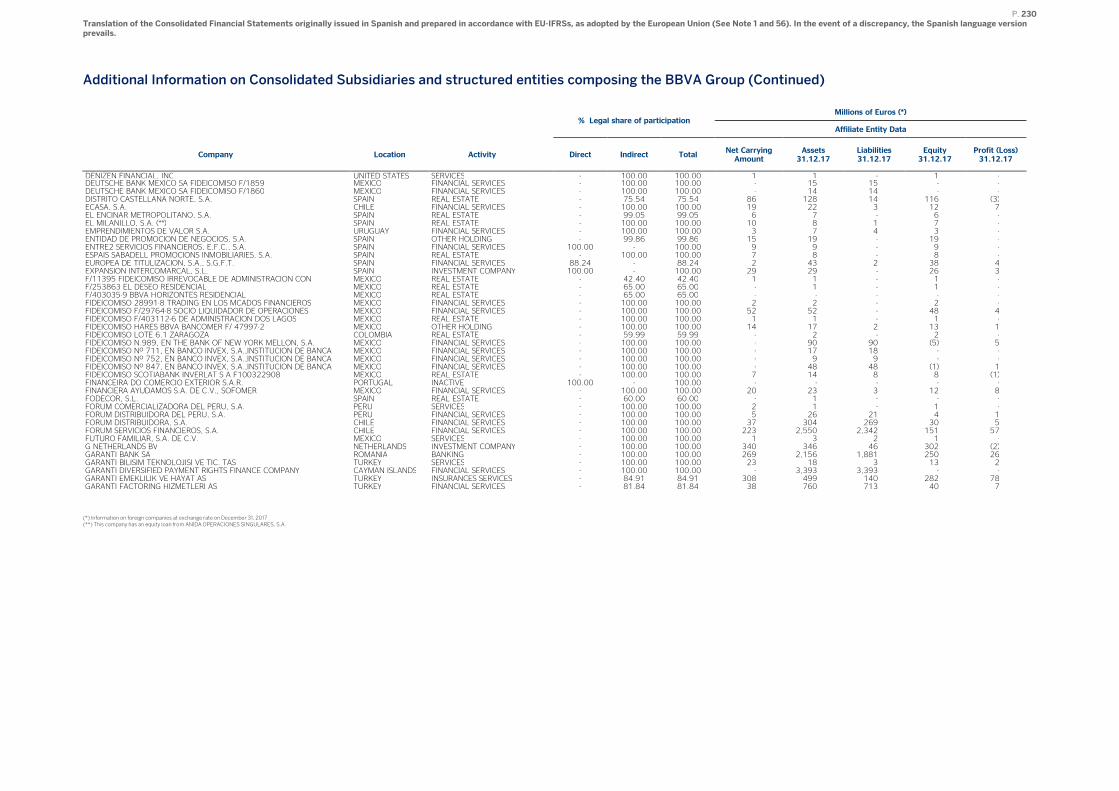
P. 230 Translation of the Consolidated Financial Statements originally issued in Spanish and prepared in accordance with EU-IFRSs, as adopted by the European Union (See Note 1 and 56). In the event of a discrepancy, the Spanish language version prevails.
Additional Information on Consolidated Subsidiaries and structured entities composing the BBVA Group (Continued)
% Legal share of participation
Millions of Euros (*)
Affiliate Entity Data
Company Location Activity
Direct Indirect Total
Net Carrying Amount
Assets 31.12.17
Liabilities 31.12.17
Equity 31.12.17
Profit (Loss) 31.12.17
DENIZEN FINANCIAL, INC UNITED STATES SERVICES - 100.00 100.00 1 1 - 1 - DEUTSCHE BANK MEXICO SA FIDEICOMISO F/1859 MEXICO FINANCIAL SERVICES - 100.00 100.00 - 15 15 - - DEUTSCHE BANK MEXICO SA FIDEICOMISO F/1860 MEXICO FINANCIAL SERVICES - 100.00 100.00 - 14 14 - - DISTRITO CASTELLANA NORTE, S.A. SPAIN REAL ESTATE - 75.54 75.54 86 128 14 116 (3) ECASA, S.A. CHILE FINANCIAL SERVICES - 100.00 100.00 19 22 3 12 7 EL ENCINAR METROPOLITANO, S.A. SPAIN REAL ESTATE - 99.05 99.05 6 7 - 6 - EL MILANILLO, S.A. (**) SPAIN REAL ESTATE - 100.00 100.00 10 8 1 7 - EMPRENDIMIENTOS DE VALOR S.A. URUGUAY FINANCIAL SERVICES - 100.00 100.00 3 7 4 3 - ENTIDAD DE PROMOCION DE NEGOCIOS, S.A. SPAIN OTHER HOLDING - 99.86 99.86 15 19 - 19 - ENTRE2 SERVICIOS FINANCIEROS, E.F.C., S.A. SPAIN FINANCIAL SERVICES 100.00 - 100.00 9 9 - 9 - ESPAIS SABADELL PROMOCIONS INMOBILIARIES, S.A. SPAIN REAL ESTATE - 100.00 100.00 7 8 - 8 - EUROPEA DE TITULIZACION, S.A., S.G.F.T. SPAIN FINANCIAL SERVICES 88.24 - 88.24 2 43 2 38 4 EXPANSION INTERCOMARCAL, S.L. SPAIN INVESTMENT COMPANY 100.00 - 100.00 29 29 - 26 3 F/11395 FIDEICOMISO IRREVOCABLE DE ADMINISTRACION CON MEXICO REAL ESTATE - 42.40 42.40 1 1 - 1 - F/253863 EL DESEO RESIDENCIAL MEXICO REAL ESTATE - 65.00 65.00 - 1 - 1 - F/403035-9 BBVA HORIZONTES RESIDENCIAL MEXICO REAL ESTATE - 65.00 65.00 - - - - - FIDEICOMISO 28991-8 TRADING EN LOS MCADOS FINANCIEROS MEXICO FINANCIAL SERVICES - 100.00 100.00 2 2 - 2 - FIDEICOMISO F/29764-8 SOCIO LIQUIDADOR DE OPERACIONES MEXICO FINANCIAL SERVICES - 100.00 100.00 52 52 - 48 4 FIDEICOMISO F/403112-6 DE ADMINISTRACION DOS LAGOS MEXICO REAL ESTATE - 100.00 100.00 1 1 - 1 - FIDEICOMISO HARES BBVA BANCOMER F/ 47997-2 MEXICO OTHER HOLDING - 100.00 100.00 14 17 2 13 1 FIDEICOMISO LOTE 6.1 ZARAGOZA COLOMBIA REAL ESTATE - 59.99 59.99 - 2 - 2 - FIDEICOMISO N.989, EN THE BANK OF NEW YORK MELLON, S.A. MEXICO FINANCIAL SERVICES - 100.00 100.00 - 90 90 (5) 5 FIDEICOMISO Nº 711, EN BANCO INVEX, S.A.,INSTITUCION DE BANCA MEXICO FINANCIAL SERVICES - 100.00 100.00 - 17 18 - - FIDEICOMISO Nº 752, EN BANCO INVEX, S.A.,INSTITUCION DE BANCA MEXICO FINANCIAL SERVICES - 100.00 100.00 - 9 9 - - FIDEICOMISO Nº 847, EN BANCO INVEX, S.A.,INSTITUCION DE BANCA MEXICO FINANCIAL SERVICES - 100.00 100.00 - 48 48 (1) 1 FIDEICOMISO SCOTIABANK INVERLAT S A F100322908 MEXICO REAL ESTATE - 100.00 100.00 7 14 8 8 (1) FINANCEIRA DO COMERCIO EXTERIOR S.A.R. PORTUGAL INACTIVE 100.00 - 100.00 - - - - - FINANCIERA AYUDAMOS S.A. DE C.V., SOFOMER MEXICO FINANCIAL SERVICES - 100.00 100.00 20 23 3 12 8 FODECOR, S.L. SPAIN REAL ESTATE - 60.00 60.00 - 1 - - - FORUM COMERCIALIZADORA DEL PERU, S.A. PERU SERVICES - 100.00 100.00 2 1 - 1 - FORUM DISTRIBUIDORA DEL PERU, S.A. PERU FINANCIAL SERVICES - 100.00 100.00 5 26 21 4 1 FORUM DISTRIBUIDORA, S.A. CHILE FINANCIAL SERVICES - 100.00 100.00 37 304 269 30 5 FORUM SERVICIOS FINANCIEROS, S.A. CHILE FINANCIAL SERVICES - 100.00 100.00 223 2,550 2,342 151 57 FUTURO FAMILIAR, S.A. DE C.V. MEXICO SERVICES - 100.00 100.00 1 3 2 1 - G NETHERLANDS BV NETHERLANDS INVESTMENT COMPANY - 100.00 100.00 340 346 46 302 (2) GARANTI BANK SA ROMANIA BANKING - 100.00 100.00 269 2,156 1,881 250 26 GARANTI BILISIM TEKNOLOJISI VE TIC. TAS TURKEY SERVICES - 100.00 100.00 23 18 3 13 2 GARANTI DIVERSIFIED PAYMENT RIGHTS FINANCE COMPANY CAYMAN ISLANDS FINANCIAL SERVICES - 100.00 100.00 - 3,393 3,393 - - GARANTI EMEKLILIK VE HAYAT AS TURKEY INSURANCES SERVICES - 84.91 84.91 308 499 140 282 78 GARANTI FACTORING HIZMETLERI AS TURKEY FINANCIAL SERVICES - 81.84 81.84 38 760 713 40 7
(*) Information on foreign companies at exchange rate on December 31, 2017 (**) This company has an equity loan from ANIDA OPERACIONES SINGULARES, S.A.
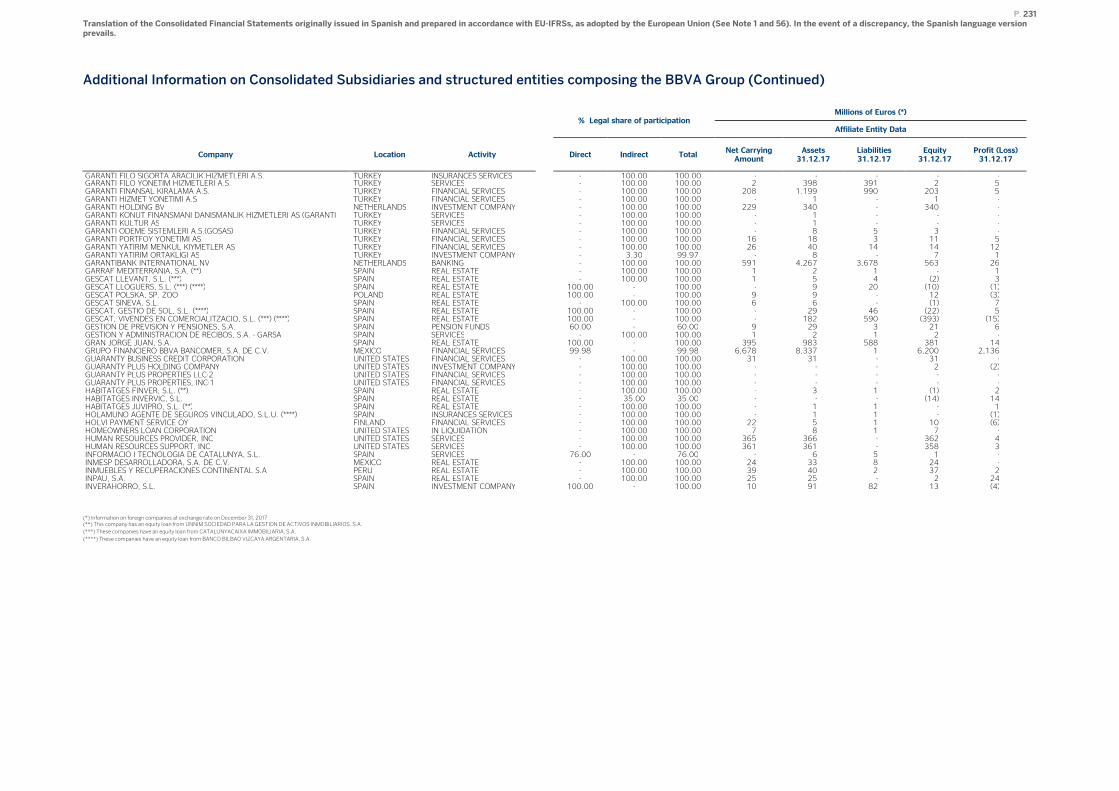
P. 231 Translation of the Consolidated Financial Statements originally issued in Spanish and prepared in accordance with EU-IFRSs, as adopted by the European Union (See Note 1 and 56). In the event of a discrepancy, the Spanish language version prevails.
Additional Information on Consolidated Subsidiaries and structured entities composing the BBVA Group (Continued)
% Legal share of participation
Millions of Euros (*)
Affiliate Entity Data
Company Location Activity
Direct Indirect Total
Net Carrying Amount
Assets 31.12.17
Liabilities 31.12.17
Equity 31.12.17
Profit (Loss) 31.12.17
GARANTI FILO SIGORTA ARACILIK HIZMETLERI A.S. TURKEY INSURANCES SERVICES - 100.00 100.00 - - - - - GARANTI FILO YONETIM HIZMETLERI A.S. TURKEY SERVICES - 100.00 100.00 2 398 391 2 5 GARANTI FINANSAL KIRALAMA A.S. TURKEY FINANCIAL SERVICES - 100.00 100.00 208 1,199 990 203 5 GARANTI HIZMET YONETIMI A.S TURKEY FINANCIAL SERVICES - 100.00 100.00 - 1 - 1 - GARANTI HOLDING BV NETHERLANDS INVESTMENT COMPANY - 100.00 100.00 229 340 - 340 - GARANTI KONUT FINANSMANI DANISMANLIK HIZMETLERI AS (GARANTI TURKEY SERVICES - 100.00 100.00 - 1 - - - GARANTI KULTUR AS TURKEY SERVICES - 100.00 100.00 - 1 - - - GARANTI ODEME SISTEMLERI A.S.(GOSAS) TURKEY FINANCIAL SERVICES - 100.00 100.00 - 8 5 3 - GARANTI PORTFOY YONETIMI AS TURKEY FINANCIAL SERVICES - 100.00 100.00 16 18 3 11 5 GARANTI YATIRIM MENKUL KIYMETLER AS TURKEY FINANCIAL SERVICES - 100.00 100.00 26 40 14 14 12 GARANTI YATIRIM ORTAKLIGI AS TURKEY INVESTMENT COMPANY - 3.30 99.97 - 8 - 7 1 GARANTIBANK INTERNATIONAL NV NETHERLANDS BANKING - 100.00 100.00 591 4,267 3,678 563 26 GARRAF MEDITERRANIA, S.A. (**) SPAIN REAL ESTATE - 100.00 100.00 1 2 1 - 1 GESCAT LLEVANT, S.L. (***) SPAIN REAL ESTATE - 100.00 100.00 1 5 4 (2) 3 GESCAT LLOGUERS, S.L. (***) (****) SPAIN REAL ESTATE 100.00 - 100.00 - 9 20 (10) (1) GESCAT POLSKA, SP. ZOO POLAND REAL ESTATE 100.00 - 100.00 9 9 - 12 (3) GESCAT SINEVA, S.L. SPAIN REAL ESTATE - 100.00 100.00 6 6 - (1) 7 GESCAT, GESTIO DE SOL, S.L. (****) SPAIN REAL ESTATE 100.00 - 100.00 - 29 46 (22) 5 GESCAT, VIVENDES EN COMERCIALITZACIO, S.L. (***) (****) SPAIN REAL ESTATE 100.00 - 100.00 - 182 590 (393) (15) GESTION DE PREVISION Y PENSIONES, S.A. SPAIN PENSION FUNDS 60.00 - 60.00 9 29 3 21 6 GESTION Y ADMINISTRACION DE RECIBOS, S.A. - GARSA SPAIN SERVICES - 100.00 100.00 1 2 1 2 - GRAN JORGE JUAN, S.A. SPAIN REAL ESTATE 100.00 - 100.00 395 983 588 381 14 GRUPO FINANCIERO BBVA BANCOMER, S.A. DE C.V. MEXICO FINANCIAL SERVICES 99.98 - 99.98 6,678 8,337 1 6,200 2,136 GUARANTY BUSINESS CREDIT CORPORATION UNITED STATES FINANCIAL SERVICES - 100.00 100.00 31 31 - 31 - GUARANTY PLUS HOLDING COMPANY UNITED STATES INVESTMENT COMPANY - 100.00 100.00 - - - 2 (2) GUARANTY PLUS PROPERTIES LLC-2 UNITED STATES FINANCIAL SERVICES - 100.00 100.00 - - - - - GUARANTY PLUS PROPERTIES, INC-1 UNITED STATES FINANCIAL SERVICES - 100.00 100.00 - - - - - HABITATGES FINVER, S.L. (**) SPAIN REAL ESTATE - 100.00 100.00 - 3 1 (1) 2 HABITATGES INVERVIC, S.L. SPAIN REAL ESTATE - 35.00 35.00 - - - (14) 14 HABITATGES JUVIPRO, S.L. (**) SPAIN REAL ESTATE - 100.00 100.00 - 1 1 - 1 HOLAMUNO AGENTE DE SEGUROS VINCULADO, S.L.U. (****) SPAIN INSURANCES SERVICES - 100.00 100.00 - 1 1 - (1) HOLVI PAYMENT SERVICE OY FINLAND FINANCIAL SERVICES - 100.00 100.00 22 5 1 10 (6) HOMEOWNERS LOAN CORPORATION UNITED STATES IN LIQUIDATION - 100.00 100.00 7 8 1 7 - HUMAN RESOURCES PROVIDER, INC UNITED STATES SERVICES - 100.00 100.00 365 366 - 362 4 HUMAN RESOURCES SUPPORT, INC UNITED STATES SERVICES - 100.00 100.00 361 361 - 358 3 INFORMACIO I TECNOLOGIA DE CATALUNYA, S.L. SPAIN SERVICES 76.00 - 76.00 - 6 5 1 - INMESP DESARROLLADORA, S.A. DE C.V. MEXICO REAL ESTATE - 100.00 100.00 24 33 8 24 - INMUEBLES Y RECUPERACIONES CONTINENTAL S.A PERU REAL ESTATE - 100.00 100.00 39 40 2 37 2 INPAU, S.A. SPAIN REAL ESTATE - 100.00 100.00 25 25 - 2 24 INVERAHORRO, S.L. SPAIN INVESTMENT COMPANY 100.00 - 100.00 10 91 82 13 (4)
(*) Information on foreign companies at exchange rate on December 31, 2017 (**) This company has an equity loan from UNNIM SOCIEDAD PARA LA GESTION DE ACTIVOS INMOBILIARIOS, S.A.
(***) These companies have an equity loan from CATALUNYACAIXA IMMOBILIARIA, S.A.
(****) These companies have an equity loan from BANCO BILBAO VIZCAYA ARGENTARIA, S.A.
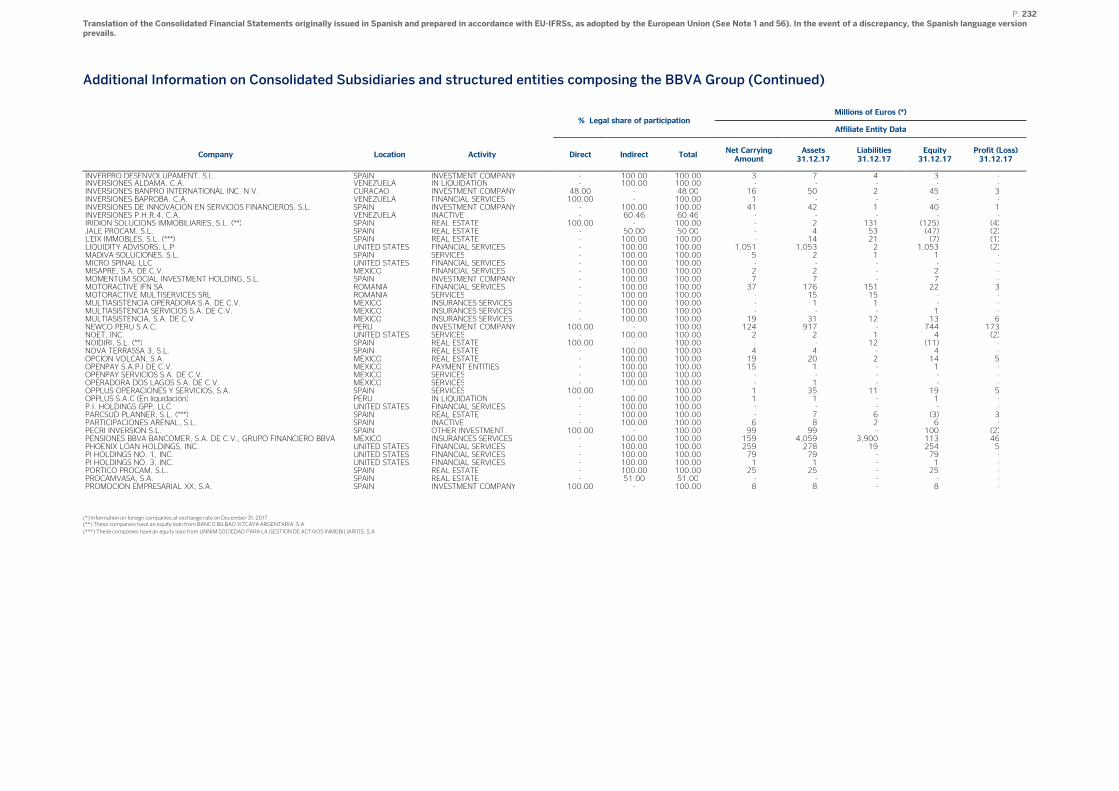
P. 232 Translation of the Consolidated Financial Statements originally issued in Spanish and prepared in accordance with EU-IFRSs, as adopted by the European Union (See Note 1 and 56). In the event of a discrepancy, the Spanish language version prevails.
Additional Information on Consolidated Subsidiaries and structured entities composing the BBVA Group (Continued)
% Legal share of participation
Millions of Euros (*)
Affiliate Entity Data
Company Location Activity
Direct Indirect Total
Net Carrying Amount
Assets 31.12.17
Liabilities 31.12.17
Equity 31.12.17
Profit (Loss) 31.12.17
INVERPRO DESENVOLUPAMENT, S.L. SPAIN INVESTMENT COMPANY - 100.00 100.00 3 7 4 3 - INVERSIONES ALDAMA, C.A. VENEZUELA IN LIQUIDATION - 100.00 100.00 - - - - - INVERSIONES BANPRO INTERNATIONAL INC. N.V. CURAÇAO INVESTMENT COMPANY 48.00 - 48.00 16 50 2 45 3 INVERSIONES BAPROBA, C.A. VENEZUELA FINANCIAL SERVICES 100.00 - 100.00 1 - - - - INVERSIONES DE INNOVACION EN SERVICIOS FINANCIEROS, S.L. SPAIN INVESTMENT COMPANY - 100.00 100.00 41 42 1 40 1 INVERSIONES P.H.R.4, C.A. VENEZUELA INACTIVE - 60.46 60.46 - - - - - IRIDION SOLUCIONS IMMOBILIARIES, S.L. (**) SPAIN REAL ESTATE 100.00 - 100.00 - 2 131 (125) (4) JALE PROCAM, S.L. SPAIN REAL ESTATE - 50.00 50.00 - 4 53 (47) (2) L'EIX IMMOBLES, S.L. (***) SPAIN REAL ESTATE - 100.00 100.00 - 14 21 (7) (1) LIQUIDITY ADVISORS, L.P UNITED STATES FINANCIAL SERVICES - 100.00 100.00 1,051 1,053 2 1,053 (2) MADIVA SOLUCIONES, S.L. SPAIN SERVICES - 100.00 100.00 5 2 1 1 - MICRO SPINAL LLC UNITED STATES FINANCIAL SERVICES - 100.00 100.00 - - - - - MISAPRE, S.A. DE C.V. MEXICO FINANCIAL SERVICES - 100.00 100.00 2 2 - 2 - MOMENTUM SOCIAL INVESTMENT HOLDING, S.L. SPAIN INVESTMENT COMPANY - 100.00 100.00 7 7 - 7 - MOTORACTIVE IFN SA ROMANIA FINANCIAL SERVICES - 100.00 100.00 37 176 151 22 3 MOTORACTIVE MULTISERVICES SRL ROMANIA SERVICES - 100.00 100.00 - 15 15 - - MULTIASISTENCIA OPERADORA S.A. DE C.V. MEXICO INSURANCES SERVICES - 100.00 100.00 - 1 1 - - MULTIASISTENCIA SERVICIOS S.A. DE C.V. MEXICO INSURANCES SERVICES - 100.00 100.00 - - - 1 - MULTIASISTENCIA, S.A. DE C.V. MEXICO INSURANCES SERVICES - 100.00 100.00 19 31 12 13 6 NEWCO PERU S.A.C. PERU INVESTMENT COMPANY 100.00 - 100.00 124 917 - 744 173 NOET, INC. UNITED STATES SERVICES - 100.00 100.00 2 2 1 4 (2) NOIDIRI, S.L. (**) SPAIN REAL ESTATE 100.00 - 100.00 - - 12 (11) - NOVA TERRASSA 3, S.L. SPAIN REAL ESTATE - 100.00 100.00 4 4 - 4 - OPCION VOLCAN, S.A. MEXICO REAL ESTATE - 100.00 100.00 19 20 2 14 5 OPENPAY S.A.P.I DE C.V. MEXICO PAYMENT ENTITIES - 100.00 100.00 15 1 - 1 - OPENPAY SERVICIOS S.A. DE C.V. MEXICO SERVICES - 100.00 100.00 - - - - - OPERADORA DOS LAGOS S.A. DE C.V. MEXICO SERVICES - 100.00 100.00 - 1 - - - OPPLUS OPERACIONES Y SERVICIOS, S.A. SPAIN SERVICES 100.00 - 100.00 1 35 11 19 5 OPPLUS S.A.C (En liquidación) PERU IN LIQUIDATION - 100.00 100.00 1 1 - 1 - P.I. HOLDINGS GPP, LLC UNITED STATES FINANCIAL SERVICES - 100.00 100.00 - - - - - PARCSUD PLANNER, S.L. (***) SPAIN REAL ESTATE - 100.00 100.00 - 7 6 (3) 3 PARTICIPACIONES ARENAL, S.L. SPAIN INACTIVE - 100.00 100.00 6 8 2 6 - PECRI INVERSION S.L. SPAIN OTHER INVESTMENT 100.00 - 100.00 99 99 - 100 (2) PENSIONES BBVA BANCOMER, S.A. DE C.V., GRUPO FINANCIERO BBVA MEXICO INSURANCES SERVICES - 100.00 100.00 159 4,059 3,900 113 46 PHOENIX LOAN HOLDINGS, INC. UNITED STATES FINANCIAL SERVICES - 100.00 100.00 259 278 19 254 5 PI HOLDINGS NO. 1, INC. UNITED STATES FINANCIAL SERVICES - 100.00 100.00 79 79 - 79 - PI HOLDINGS NO. 3, INC. UNITED STATES FINANCIAL SERVICES - 100.00 100.00 1 1 - 1 - PORTICO PROCAM, S.L. SPAIN REAL ESTATE - 100.00 100.00 25 25 - 25 - PROCAMVASA, S.A. SPAIN REAL ESTATE - 51.00 51.00 - - - - - PROMOCION EMPRESARIAL XX, S.A. SPAIN INVESTMENT COMPANY 100.00 - 100.00 8 8 - 8 -
(*) Information on foreign companies at exchange rate on December 31, 2017 (**) These companies have an equity loan from BANCO BILBAO VIZCAYA ARGENTARIA, S.A.
(***) These companies have an equity loan from UNNIM SOCIEDAD PARA LA GESTION DE ACTIVOS INMOBILIARIOS, S.A
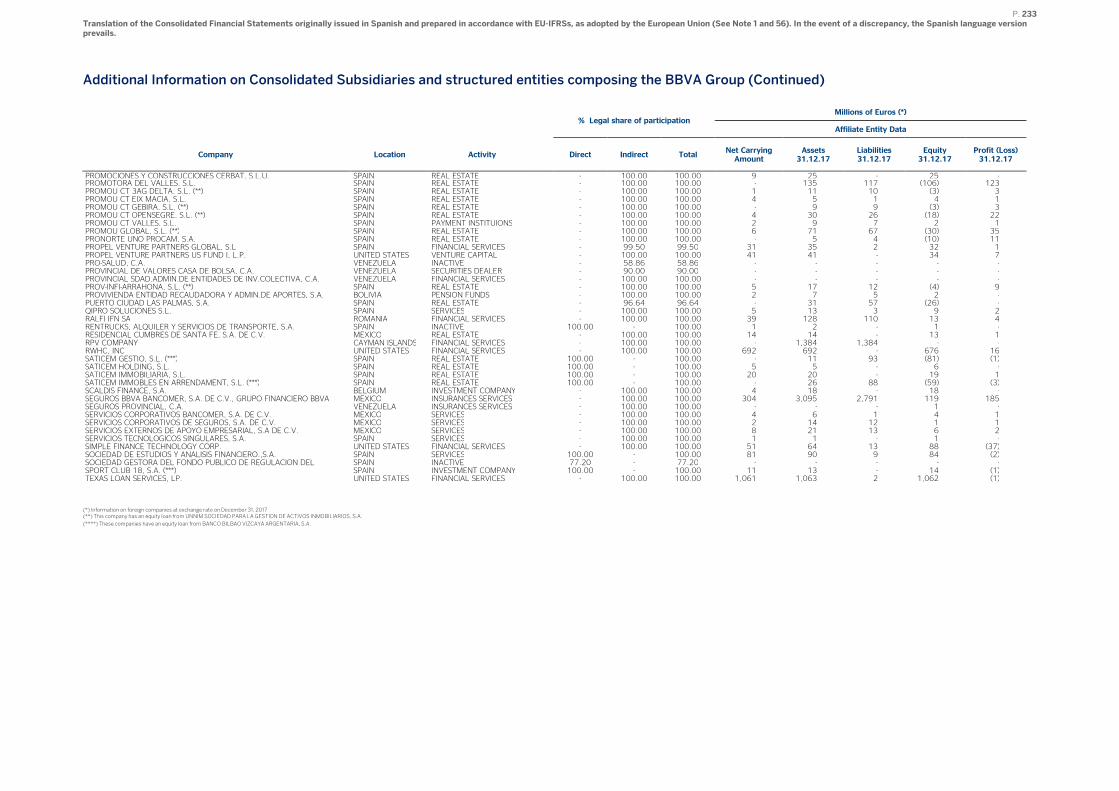
P. 233 Translation of the Consolidated Financial Statements originally issued in Spanish and prepared in accordance with EU-IFRSs, as adopted by the European Union (See Note 1 and 56). In the event of a discrepancy, the Spanish language version prevails.
Additional Information on Consolidated Subsidiaries and structured entities composing the BBVA Group (Continued)
% Legal share of participation
Millions of Euros (*)
Affiliate Entity Data
Company Location Activity
Direct Indirect Total
Net Carrying Amount
Assets 31.12.17
Liabilities 31.12.17
Equity 31.12.17
Profit (Loss) 31.12.17
PROMOCIONES Y CONSTRUCCIONES CERBAT, S.L.U. SPAIN REAL ESTATE - 100.00 100.00 9 25 - 25 - PROMOTORA DEL VALLES, S.L. SPAIN REAL ESTATE - 100.00 100.00 - 135 117 (106) 123 PROMOU CT 3AG DELTA, S.L. (**) SPAIN REAL ESTATE - 100.00 100.00 1 11 10 (3) 3 PROMOU CT EIX MACIA, S.L. SPAIN REAL ESTATE - 100.00 100.00 4 5 1 4 1 PROMOU CT GEBIRA, S.L. (**) SPAIN REAL ESTATE - 100.00 100.00 - 9 9 (3) 3 PROMOU CT OPENSEGRE, S.L. (**) SPAIN REAL ESTATE - 100.00 100.00 4 30 26 (18) 22 PROMOU CT VALLES, S.L. SPAIN PAYMENT INSTITUIONS - 100.00 100.00 2 9 7 2 1 PROMOU GLOBAL, S.L. (**) SPAIN REAL ESTATE - 100.00 100.00 6 71 67 (30) 35 PRONORTE UNO PROCAM, S.A. SPAIN REAL ESTATE - 100.00 100.00 - 5 4 (10) 11 PROPEL VENTURE PARTNERS GLOBAL, S.L SPAIN FINANCIAL SERVICES - 99.50 99.50 31 35 2 32 1 PROPEL VENTURE PARTNERS US FUND I, L.P. UNITED STATES VENTURE CAPITAL - 100.00 100.00 41 41 - 34 7 PRO-SALUD, C.A. VENEZUELA INACTIVE - 58.86 58.86 - - - - - PROVINCIAL DE VALORES CASA DE BOLSA, C.A. VENEZUELA SECURITIES DEALER - 90.00 90.00 - - - - - PROVINCIAL SDAD.ADMIN.DE ENTIDADES DE INV.COLECTIVA, C.A. VENEZUELA FINANCIAL SERVICES - 100.00 100.00 - - - - - PROV-INFI-ARRAHONA, S.L. (**) SPAIN REAL ESTATE - 100.00 100.00 5 17 12 (4) 9 PROVIVIENDA ENTIDAD RECAUDADORA Y ADMIN.DE APORTES, S.A. BOLIVIA PENSION FUNDS - 100.00 100.00 2 7 5 2 - PUERTO CIUDAD LAS PALMAS, S.A. SPAIN REAL ESTATE - 96.64 96.64 - 31 57 (26) - QIPRO SOLUCIONES S.L. SPAIN SERVICES - 100.00 100.00 5 13 3 9 2 RALFI IFN SA ROMANIA FINANCIAL SERVICES - 100.00 100.00 39 128 110 13 4 RENTRUCKS, ALQUILER Y SERVICIOS DE TRANSPORTE, S.A. SPAIN INACTIVE 100.00 - 100.00 1 2 - 1 - RESIDENCIAL CUMBRES DE SANTA FE, S.A. DE C.V. MEXICO REAL ESTATE - 100.00 100.00 14 14 - 13 1 RPV COMPANY CAYMAN ISLANDS FINANCIAL SERVICES - 100.00 100.00 - 1,384 1,384 - - RWHC, INC UNITED STATES FINANCIAL SERVICES - 100.00 100.00 692 692 - 676 16 SATICEM GESTIO, S.L. (***) SPAIN REAL ESTATE 100.00 - 100.00 - 11 93 (81) (1) SATICEM HOLDING, S.L. SPAIN REAL ESTATE 100.00 - 100.00 5 5 - 6 - SATICEM IMMOBILIARIA, S.L. SPAIN REAL ESTATE 100.00 - 100.00 20 20 - 19 1 SATICEM IMMOBLES EN ARRENDAMENT, S.L. (***) SPAIN REAL ESTATE 100.00 - 100.00 - 26 88 (59) (3) SCALDIS FINANCE, S.A. BELGIUM INVESTMENT COMPANY - 100.00 100.00 4 18 - 18 - SEGUROS BBVA BANCOMER, S.A. DE C.V., GRUPO FINANCIERO BBVA MEXICO INSURANCES SERVICES - 100.00 100.00 304 3,095 2,791 119 185 SEGUROS PROVINCIAL, C.A. VENEZUELA INSURANCES SERVICES - 100.00 100.00 - - - 1 - SERVICIOS CORPORATIVOS BANCOMER, S.A. DE C.V. MEXICO SERVICES - 100.00 100.00 4 6 1 4 1 SERVICIOS CORPORATIVOS DE SEGUROS, S.A. DE C.V. MEXICO SERVICES - 100.00 100.00 2 14 12 1 1 SERVICIOS EXTERNOS DE APOYO EMPRESARIAL, S.A DE C.V. MEXICO SERVICES - 100.00 100.00 8 21 13 6 2 SERVICIOS TECNOLOGICOS SINGULARES, S.A. SPAIN SERVICES - 100.00 100.00 1 1 - 1 - SIMPLE FINANCE TECHNOLOGY CORP. UNITED STATES FINANCIAL SERVICES - 100.00 100.00 51 64 13 88 (37) SOCIEDAD DE ESTUDIOS Y ANALISIS FINANCIERO.,S.A. SPAIN SERVICES 100.00 - 100.00 81 90 9 84 (2) SOCIEDAD GESTORA DEL FONDO PUBLICO DE REGULACION DEL SPAIN INACTIVE 77.20 - 77.20 - - - - - SPORT CLUB 18, S.A. (***) SPAIN INVESTMENT COMPANY 100.00 - 100.00 11 13 - 14 (1) TEXAS LOAN SERVICES, LP. UNITED STATES FINANCIAL SERVICES - 100.00 100.00 1,061 1,063 2 1,062 (1)
(*) Information on foreign companies at exchange rate on December 31, 2017 (**) This company has an equity loan from UNNIM SOCIEDAD PARA LA GESTION DE ACTIVOS INMOBILIARIOS, S.A.
(****) These companies have an equity loan from BANCO BILBAO VIZCAYA ARGENTARIA, S.A.
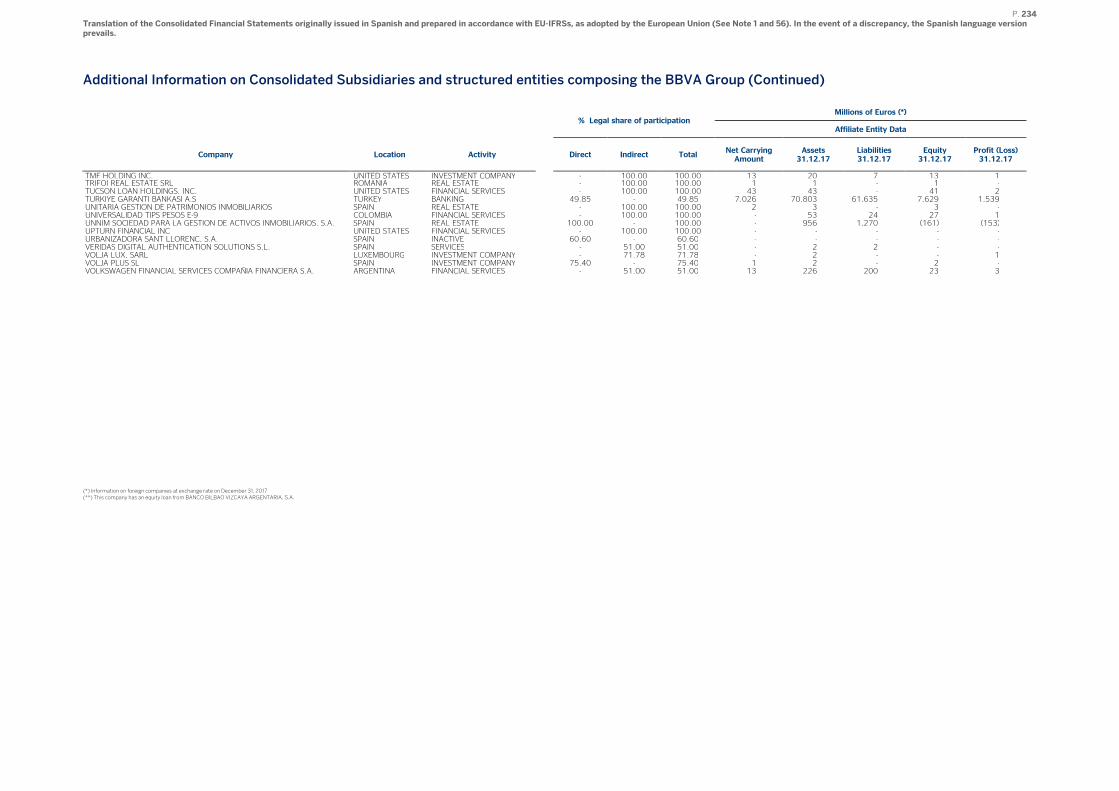
P. 234 Translation of the Consolidated Financial Statements originally issued in Spanish and prepared in accordance with EU-IFRSs, as adopted by the European Union (See Note 1 and 56). In the event of a discrepancy, the Spanish language version prevails.
Additional Information on Consolidated Subsidiaries and structured entities composing the BBVA Group (Continued)
% Legal share of participation
Millions of Euros (*)
Affiliate Entity Data
Company Location Activity
Direct Indirect Total
Net Carrying Amount
Assets 31.12.17
Liabilities 31.12.17
Equity 31.12.17
Profit (Loss) 31.12.17
TMF HOLDING INC. UNITED STATES INVESTMENT COMPANY - 100.00 100.00 13 20 7 13 1 TRIFOI REAL ESTATE SRL ROMANIA REAL ESTATE - 100.00 100.00 1 1 - 1 - TUCSON LOAN HOLDINGS, INC. UNITED STATES FINANCIAL SERVICES - 100.00 100.00 43 43 - 41 2 TURKIYE GARANTI BANKASI A.S TURKEY BANKING 49.85 - 49.85 7,026 70,803 61,635 7,629 1,539 UNITARIA GESTION DE PATRIMONIOS INMOBILIARIOS SPAIN REAL ESTATE - 100.00 100.00 2 3 - 3 - UNIVERSALIDAD TIPS PESOS E-9 COLOMBIA FINANCIAL SERVICES - 100.00 100.00 - 53 24 27 1 UNNIM SOCIEDAD PARA LA GESTION DE ACTIVOS INMOBILIARIOS, S.A. SPAIN REAL ESTATE 100.00 - 100.00 - 956 1,270 (161) (153) UPTURN FINANCIAL INC UNITED STATES FINANCIAL SERVICES - 100.00 100.00 - - - - - URBANIZADORA SANT LLORENC, S.A. SPAIN INACTIVE 60.60 - 60.60 - - - - - VERIDAS DIGITAL AUTHENTICATION SOLUTIONS S.L. SPAIN SERVICES - 51.00 51.00 - 2 2 - - VOLJA LUX, SARL LUXEMBOURG INVESTMENT COMPANY - 71.78 71.78 - 2 - - 1 VOLJA PLUS SL SPAIN INVESTMENT COMPANY 75.40 - 75.40 1 2 - 2 - VOLKSWAGEN FINANCIAL SERVICES COMPAÑIA FINANCIERA S.A. ARGENTINA FINANCIAL SERVICES - 51.00 51.00 13 226 200 23 3
(*) Information on foreign companies at exchange rate on December 31, 2017 (**) This company has an equity loan from BANCO BILBAO VIZCAYA ARGENTARIA, S.A.
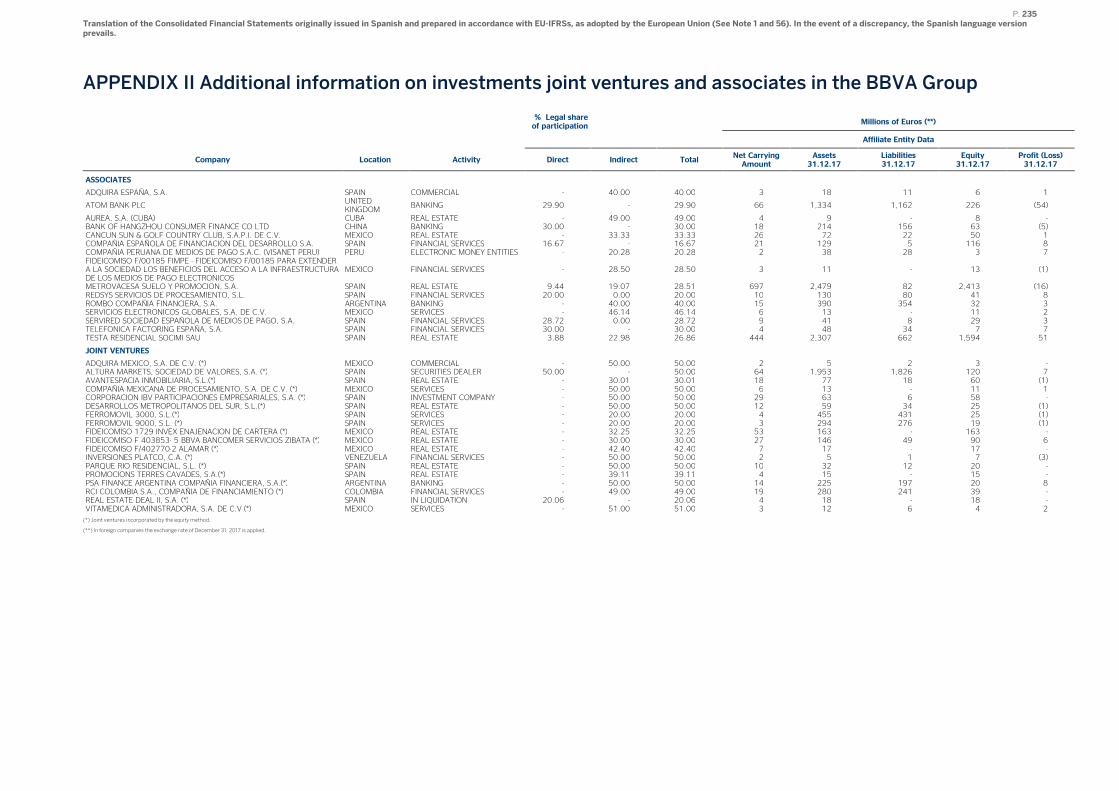
P. 235 Translation of the Consolidated Financial Statements originally issued in Spanish and prepared in accordance with EU-IFRSs, as adopted by the European Union (See Note 1 and 56). In the event of a discrepancy, the Spanish language version prevails.
APPENDIX II Additional information on investments joint ventures and associates in the BBVA Group
% Legal share of participation
Millions of Euros (**)
Affiliate Entity Data
Company Location Activity Direct Indirect Total Net Carrying Amount
Assets 31.12.17
Liabilities 31.12.17
Equity 31.12.17
Profit (Loss) 31.12.17
ASSOCIATES
ADQUIRA ESPAÑA, S.A. SPAIN COMMERCIAL - 40.00 40.00 3 18 11 6 1
ATOM BANK PLC UNITED KINGDOM
BANKING 29.90 - 29.90 66 1,334 1,162 226 (54)
AUREA, S.A. (CUBA) CUBA REAL ESTATE - 49.00 49.00 4 9 - 8 - BANK OF HANGZHOU CONSUMER FINANCE CO LTD CHINA BANKING 30.00 - 30.00 18 214 156 63 (5) CANCUN SUN & GOLF COUNTRY CLUB, S.A.P.I. DE C.V. MEXICO REAL ESTATE - 33.33 33.33 26 72 22 50 1 COMPAÑIA ESPAÑOLA DE FINANCIACION DEL DESARROLLO S.A. SPAIN FINANCIAL SERVICES 16.67 - 16.67 21 129 5 116 8 COMPAÑIA PERUANA DE MEDIOS DE PAGO S.A.C. (VISANET PERU) PERU ELECTRONIC MONEY ENTITIES - 20.28 20.28 2 38 28 3 7 FIDEICOMISO F/00185 FIMPE - FIDEICOMISO F/00185 PARA EXTENDER A LA SOCIEDAD LOS BENEFICIOS DEL ACCESO A LA INFRAESTRUCTURA DE LOS MEDIOS DE PAGO ELECTRONICOS
MEXICO FINANCIAL SERVICES - 28.50 28.50 3 11 - 13 (1)
METROVACESA SUELO Y PROMOCION, S.A. SPAIN REAL ESTATE 9.44 19.07 28.51 697 2,479 82 2,413 (16) REDSYS SERVICIOS DE PROCESAMIENTO, S.L. SPAIN FINANCIAL SERVICES 20.00 0.00 20.00 10 130 80 41 8 ROMBO COMPAÑIA FINANCIERA, S.A. ARGENTINA BANKING - 40.00 40.00 15 390 354 32 3 SERVICIOS ELECTRONICOS GLOBALES, S.A. DE C.V. MEXICO SERVICES - 46.14 46.14 6 13 - 11 2 SERVIRED SOCIEDAD ESPAÑOLA DE MEDIOS DE PAGO, S.A. SPAIN FINANCIAL SERVICES 28.72 0.00 28.72 9 41 8 29 3 TELEFONICA FACTORING ESPAÑA, S.A. SPAIN FINANCIAL SERVICES 30.00 - 30.00 4 48 34 7 7 TESTA RESIDENCIAL SOCIMI SAU SPAIN REAL ESTATE 3.88 22.98 26.86 444 2,307 662 1,594 51
JOINT VENTURES
ADQUIRA MEXICO, S.A. DE C.V. (*) MEXICO COMMERCIAL - 50.00 50.00 2 5 2 3 - ALTURA MARKETS, SOCIEDAD DE VALORES, S.A. (*) SPAIN SECURITIES DEALER 50.00 - 50.00 64 1,953 1,826 120 7 AVANTESPACIA INMOBILIARIA, S.L.(*) SPAIN REAL ESTATE - 30.01 30.01 18 77 18 60 (1) COMPAÑIA MEXICANA DE PROCESAMIENTO, S.A. DE C.V. (*) MEXICO SERVICES - 50.00 50.00 6 13 - 11 1 CORPORACION IBV PARTICIPACIONES EMPRESARIALES, S.A. (*) SPAIN INVESTMENT COMPANY - 50.00 50.00 29 63 6 58 - DESARROLLOS METROPOLITANOS DEL SUR, S.L.(*) SPAIN REAL ESTATE - 50.00 50.00 12 59 34 25 (1) FERROMOVIL 3000, S.L.(*) SPAIN SERVICES - 20.00 20.00 4 455 431 25 (1) FERROMOVIL 9000, S.L. (*) SPAIN SERVICES - 20.00 20.00 3 294 276 19 (1) FIDEICOMISO 1729 INVEX ENAJENACION DE CARTERA (*) MEXICO REAL ESTATE - 32.25 32.25 53 163 - 163 - FIDEICOMISO F 403853- 5 BBVA BANCOMER SERVICIOS ZIBATA (*) MEXICO REAL ESTATE - 30.00 30.00 27 146 49 90 6 FIDEICOMISO F/402770-2 ALAMAR (*) MEXICO REAL ESTATE - 42.40 42.40 7 17 - 17 - INVERSIONES PLATCO, C.A. (*) VENEZUELA FINANCIAL SERVICES - 50.00 50.00 2 5 1 7 (3) PARQUE RIO RESIDENCIAL, S.L. (*) SPAIN REAL ESTATE - 50.00 50.00 10 32 12 20 - PROMOCIONS TERRES CAVADES, S.A.(*) SPAIN REAL ESTATE - 39.11 39.11 4 15 - 15 - PSA FINANCE ARGENTINA COMPAÑIA FINANCIERA, S.A.(*) ARGENTINA BANKING - 50.00 50.00 14 225 197 20 8 RCI COLOMBIA S.A., COMPAÑIA DE FINANCIAMIENTO (*) COLOMBIA FINANCIAL SERVICES - 49.00 49.00 19 280 241 39 - REAL ESTATE DEAL II, S.A. (*) SPAIN IN LIQUIDATION 20.06 - 20.06 4 18 - 18 - VITAMEDICA ADMINISTRADORA, S.A. DE C.V (*) MEXICO SERVICES - 51.00 51.00 3 12 6 4 2
(*) Joint ventures incorporated by the equity method.
(**) In foreign companies the exchange rate of December 31, 2017 is applied.
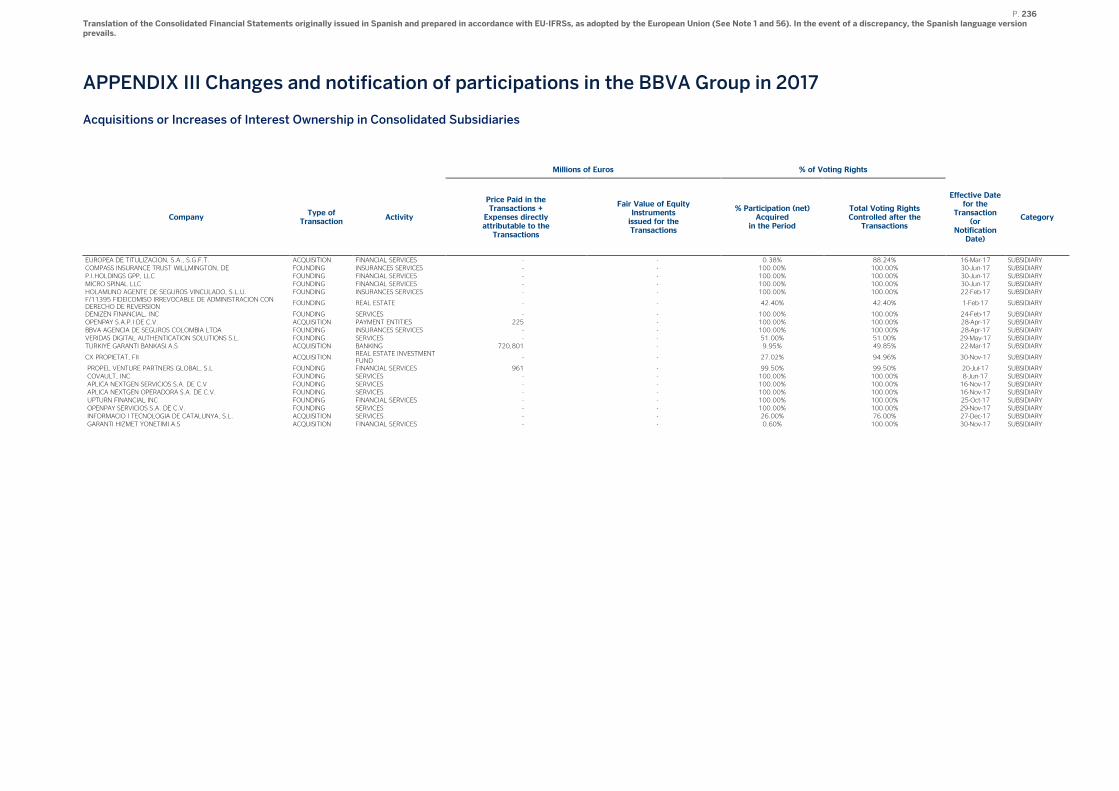
P. 236 Translation of the Consolidated Financial Statements originally issued in Spanish and prepared in accordance with EU-IFRSs, as adopted by the European Union (See Note 1 and 56). In the event of a discrepancy, the Spanish language version prevails.
APPENDIX III Changes and notification of participations in the BBVA Group in 2017
Acquisitions or Increases of Interest Ownership in Consolidated Subsidiaries
Millions of Euros % of Voting Rights
Company Type of
Transaction Activity
Price Paid in the Transactions + Expenses directly attributable to the Transactions
Fair Value of Equity Instruments issued for the Transactions
% Participation (net) Acquired
in the Period
Total Voting Rights Controlled after the Transactions
Effective Date for the
Transaction (or
Notification Date)
Category
EUROPEA DE TITULIZACION, S.A., S.G.F.T. ACQUISITION FINANCIAL SERVICES - - 0.38% 88.24% 16-Mar-17 SUBSIDIARY COMPASS INSURANCE TRUST WILLMINGTON, DE FOUNDING INSURANCES SERVICES - - 100.00% 100.00% 30-Jun-17 SUBSIDIARY P.I.HOLDINGS GPP, LLC FOUNDING FINANCIAL SERVICES - - 100.00% 100.00% 30-Jun-17 SUBSIDIARY MICRO SPINAL LLC FOUNDING FINANCIAL SERVICES - - 100.00% 100.00% 30-Jun-17 SUBSIDIARY HOLAMUNO AGENTE DE SEGUROS VINCULADO, S.L.U. FOUNDING INSURANCES SERVICES - - 100.00% 100.00% 22-Feb-17 SUBSIDIARY F/11395 FIDEICOMISO IRREVOCABLE DE ADMINISTRACION CON DERECHO DE REVERSION
FOUNDING REAL ESTATE - - 42.40% 42.40% 1-Feb-17 SUBSIDIARY
DENIZEN FINANCIAL, INC FOUNDING SERVICES - - 100.00% 100.00% 24-Feb-17 SUBSIDIARY OPENPAY S.A.P.I DE C.V. ACQUISITION PAYMENT ENTITIES 225 - 100.00% 100.00% 28-Apr-17 SUBSIDIARY BBVA AGENCIA DE SEGUROS COLOMBIA LTDA FOUNDING INSURANCES SERVICES - - 100.00% 100.00% 28-Apr-17 SUBSIDIARY VERIDAS DIGITAL AUTHENTICATION SOLUTIONS S.L. FOUNDING SERVICES - - 51.00% 51.00% 29-May-17 SUBSIDIARY TURKIYE GARANTI BANKASI A.S ACQUISITION BANKING 720,801 - 9.95% 49.85% 22-Mar-17 SUBSIDIARY
CX PROPIETAT, FII ACQUISITION REAL ESTATE INVESTMENT FUND
- - 27.02% 94.96% 30-Nov-17 SUBSIDIARY
PROPEL VENTURE PARTNERS GLOBAL, S.L FOUNDING FINANCIAL SERVICES 961 - 99.50% 99.50% 20-Jul-17 SUBSIDIARY COVAULT, INC FOUNDING SERVICES - - 100.00% 100.00% 8-Jun-17 SUBSIDIARY APLICA NEXTGEN SERVICIOS S.A. DE C.V FOUNDING SERVICES - - 100.00% 100.00% 16-Nov-17 SUBSIDIARY APLICA NEXTGEN OPERADORA S.A. DE C.V. FOUNDING SERVICES - - 100.00% 100.00% 16-Nov-17 SUBSIDIARY UPTURN FINANCIAL INC FOUNDING FINANCIAL SERVICES - - 100.00% 100.00% 25-Oct-17 SUBSIDIARY OPENPAY SERVICIOS S.A. DE C.V. FOUNDING SERVICES - - 100.00% 100.00% 29-Nov-17 SUBSIDIARY INFORMACIO I TECNOLOGIA DE CATALUNYA, S.L. ACQUISITION SERVICES - - 26.00% 76.00% 27-Dec-17 SUBSIDIARY GARANTI HIZMET YONETIMI A.S ACQUISITION FINANCIAL SERVICES - - 0.60% 100.00% 30-Nov-17 SUBSIDIARY
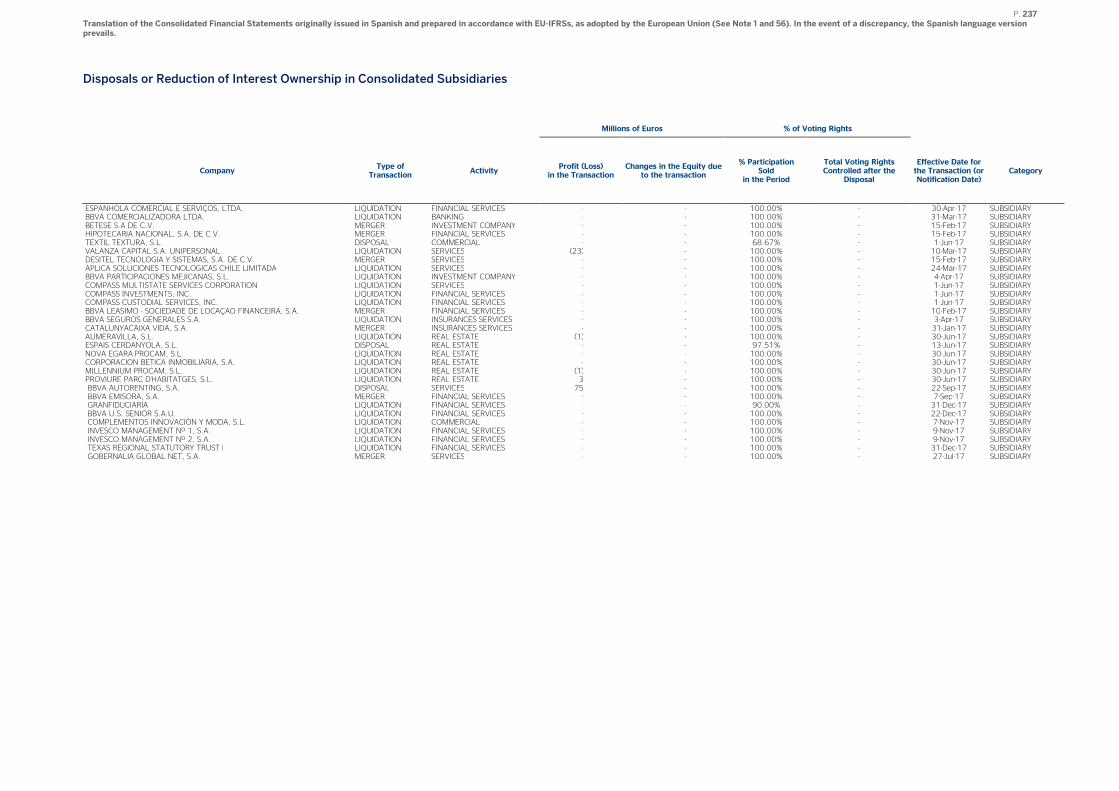
P. 237 Translation of the Consolidated Financial Statements originally issued in Spanish and prepared in accordance with EU-IFRSs, as adopted by the European Union (See Note 1 and 56). In the event of a discrepancy, the Spanish language version prevails.
Disposals or Reduction of Interest Ownership in Consolidated Subsidiaries
Millions of Euros % of Voting Rights
Company Type of
Transaction Activity
Profit (Loss) in the Transaction
Changes in the Equity due to the transaction
% Participation Sold
in the Period
Total Voting Rights Controlled after the
Disposal
Effective Date for the Transaction (or Notification Date)
Category
ESPANHOLA COMERCIAL E SERVIÇOS, LTDA. LIQUIDATION FINANCIAL SERVICES - - 100.00% - 30-Apr-17 SUBSIDIARY BBVA COMERCIALIZADORA LTDA. LIQUIDATION BANKING - - 100.00% - 31-Mar-17 SUBSIDIARY BETESE S.A DE C.V. MERGER INVESTMENT COMPANY - - 100.00% - 15-Feb-17 SUBSIDIARY HIPOTECARIA NACIONAL, S.A. DE C.V. MERGER FINANCIAL SERVICES - - 100.00% - 15-Feb-17 SUBSIDIARY TEXTIL TEXTURA, S.L. DISPOSAL COMMERCIAL - - 68.67% - 1-Jun-17 SUBSIDIARY VALANZA CAPITAL S.A. UNIPERSONAL LIQUIDATION SERVICES (23) - 100.00% - 10-Mar-17 SUBSIDIARY DESITEL TECNOLOGIA Y SISTEMAS, S.A. DE C.V. MERGER SERVICES - - 100.00% - 15-Feb-17 SUBSIDIARY APLICA SOLUCIONES TECNOLOGICAS CHILE LIMITADA LIQUIDATION SERVICES - - 100.00% - 24-Mar-17 SUBSIDIARY BBVA PARTICIPACIONES MEJICANAS, S.L. LIQUIDATION INVESTMENT COMPANY - - 100.00% - 4-Apr-17 SUBSIDIARY COMPASS MULTISTATE SERVICES CORPORATION LIQUIDATION SERVICES - - 100.00% - 1-Jun-17 SUBSIDIARY COMPASS INVESTMENTS, INC. LIQUIDATION FINANCIAL SERVICES - - 100.00% - 1-Jun-17 SUBSIDIARY COMPASS CUSTODIAL SERVICES, INC. LIQUIDATION FINANCIAL SERVICES - - 100.00% - 1-Jun-17 SUBSIDIARY BBVA LEASIMO - SOCIEDADE DE LOCAÇAO FINANCEIRA, S.A. MERGER FINANCIAL SERVICES - - 100.00% - 10-Feb-17 SUBSIDIARY BBVA SEGUROS GENERALES S.A. LIQUIDATION INSURANCES SERVICES - - 100.00% - 3-Apr-17 SUBSIDIARY CATALUNYACAIXA VIDA, S.A. MERGER INSURANCES SERVICES - - 100.00% - 31-Jan-17 SUBSIDIARY AUMERAVILLA, S.L. LIQUIDATION REAL ESTATE (1) - 100.00% - 30-Jun-17 SUBSIDIARY ESPAIS CERDANYOLA, S.L. DISPOSAL REAL ESTATE - - 97.51% - 13-Jun-17 SUBSIDIARY NOVA EGARA-PROCAM, S.L. LIQUIDATION REAL ESTATE - - 100.00% - 30-Jun-17 SUBSIDIARY CORPORACION BETICA INMOBILIARIA, S.A. LIQUIDATION REAL ESTATE - - 100.00% - 30-Jun-17 SUBSIDIARY MILLENNIUM PROCAM, S.L. LIQUIDATION REAL ESTATE (1) - 100.00% - 30-Jun-17 SUBSIDIARY PROVIURE PARC D'HABITATGES, S.L. LIQUIDATION REAL ESTATE 3 - 100.00% - 30-Jun-17 SUBSIDIARY BBVA AUTORENTING, S.A. DISPOSAL SERVICES 75 - 100.00% - 22-Sep-17 SUBSIDIARY BBVA EMISORA, S.A. MERGER FINANCIAL SERVICES - - 100.00% - 7-Sep-17 SUBSIDIARY GRANFIDUCIARIA LIQUIDATION FINANCIAL SERVICES - - 90.00% - 31-Dec-17 SUBSIDIARY BBVA U.S. SENIOR S.A.U. LIQUIDATION FINANCIAL SERVICES - - 100.00% - 22-Dec-17 SUBSIDIARY COMPLEMENTOS INNOVACIÓN Y MODA, S.L. LIQUIDATION COMMERCIAL - - 100.00% - 7-Nov-17 SUBSIDIARY INVESCO MANAGEMENT Nº 1, S.A. LIQUIDATION FINANCIAL SERVICES - - 100.00% - 9-Nov-17 SUBSIDIARY INVESCO MANAGEMENT Nº 2, S.A. LIQUIDATION FINANCIAL SERVICES - - 100.00% - 9-Nov-17 SUBSIDIARY TEXAS REGIONAL STATUTORY TRUST I LIQUIDATION FINANCIAL SERVICES - - 100.00% - 31-Dec-17 SUBSIDIARY GOBERNALIA GLOBAL NET, S.A. MERGER SERVICES - - 100.00% - 27-Jul-17 SUBSIDIARY
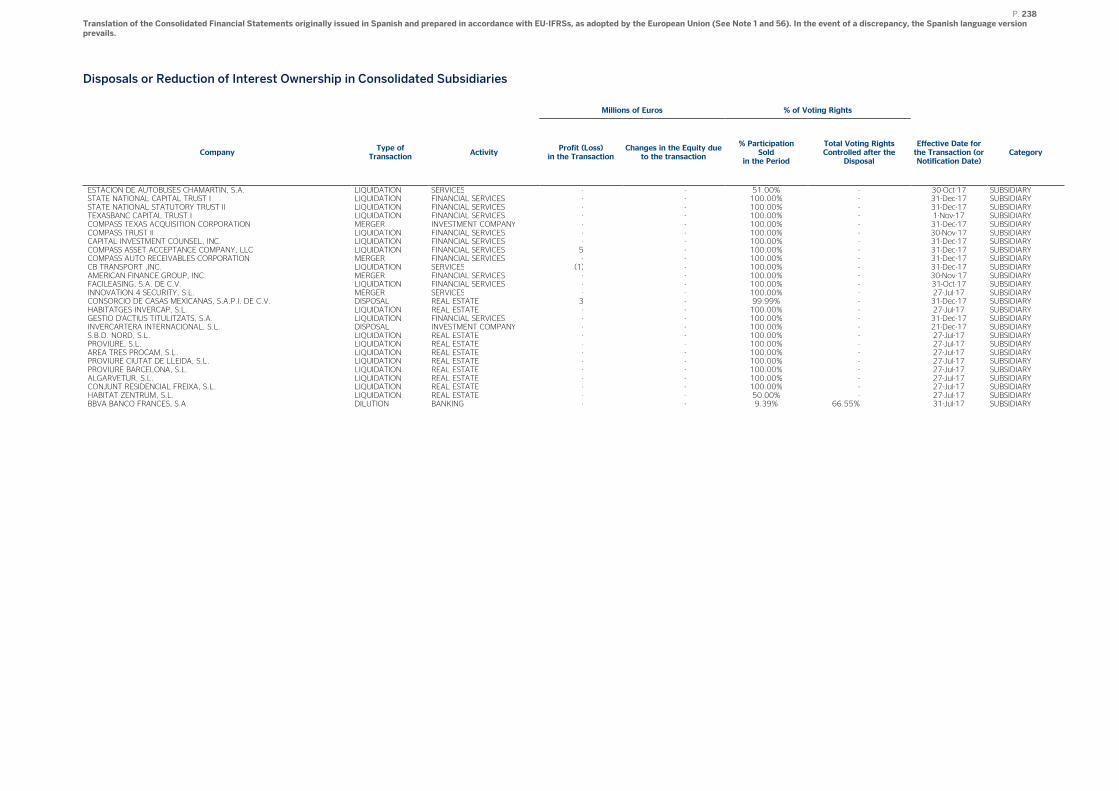
P. 238 Translation of the Consolidated Financial Statements originally issued in Spanish and prepared in accordance with EU-IFRSs, as adopted by the European Union (See Note 1 and 56). In the event of a discrepancy, the Spanish language version prevails.
Disposals or Reduction of Interest Ownership in Consolidated Subsidiaries
Millions of Euros % of Voting Rights
Company Type of
Transaction Activity
Profit (Loss) in the Transaction
Changes in the Equity due to the transaction
% Participation Sold
in the Period
Total Voting Rights Controlled after the
Disposal
Effective Date for the Transaction (or Notification Date)
Category
ESTACION DE AUTOBUSES CHAMARTIN, S.A. LIQUIDATION SERVICES - - 51.00% - 30-Oct-17 SUBSIDIARY STATE NATIONAL CAPITAL TRUST I LIQUIDATION FINANCIAL SERVICES - - 100.00% - 31-Dec-17 SUBSIDIARY STATE NATIONAL STATUTORY TRUST II LIQUIDATION FINANCIAL SERVICES - - 100.00% - 31-Dec-17 SUBSIDIARY TEXASBANC CAPITAL TRUST I LIQUIDATION FINANCIAL SERVICES - - 100.00% - 1-Nov-17 SUBSIDIARY COMPASS TEXAS ACQUISITION CORPORATION MERGER INVESTMENT COMPANY - - 100.00% - 31-Dec-17 SUBSIDIARY COMPASS TRUST II LIQUIDATION FINANCIAL SERVICES - - 100.00% - 30-Nov-17 SUBSIDIARY CAPITAL INVESTMENT COUNSEL, INC. LIQUIDATION FINANCIAL SERVICES - - 100.00% - 31-Dec-17 SUBSIDIARY COMPASS ASSET ACCEPTANCE COMPANY, LLC LIQUIDATION FINANCIAL SERVICES 5 - 100.00% - 31-Dec-17 SUBSIDIARY COMPASS AUTO RECEIVABLES CORPORATION MERGER FINANCIAL SERVICES - - 100.00% - 31-Dec-17 SUBSIDIARY CB TRANSPORT ,INC. LIQUIDATION SERVICES (1) - 100.00% - 31-Dec-17 SUBSIDIARY AMERICAN FINANCE GROUP, INC. MERGER FINANCIAL SERVICES - - 100.00% - 30-Nov-17 SUBSIDIARY FACILEASING, S.A. DE C.V. LIQUIDATION FINANCIAL SERVICES - - 100.00% - 31-Oct-17 SUBSIDIARY INNOVATION 4 SECURITY, S.L. MERGER SERVICES - - 100.00% - 27-Jul-17 SUBSIDIARY CONSORCIO DE CASAS MEXICANAS, S.A.P.I. DE C.V. DISPOSAL REAL ESTATE 3 - 99.99% - 31-Dec-17 SUBSIDIARY HABITATGES INVERCAP, S.L. LIQUIDATION REAL ESTATE - - 100.00% - 27-Jul-17 SUBSIDIARY GESTIO D'ACTIUS TITULITZATS, S.A. LIQUIDATION FINANCIAL SERVICES - - 100.00% - 31-Dec-17 SUBSIDIARY INVERCARTERA INTERNACIONAL, S.L. DISPOSAL INVESTMENT COMPANY - - 100.00% - 21-Dec-17 SUBSIDIARY S.B.D. NORD, S.L. LIQUIDATION REAL ESTATE - - 100.00% - 27-Jul-17 SUBSIDIARY PROVIURE, S.L. LIQUIDATION REAL ESTATE - - 100.00% - 27-Jul-17 SUBSIDIARY AREA TRES PROCAM, S.L. LIQUIDATION REAL ESTATE - - 100.00% - 27-Jul-17 SUBSIDIARY PROVIURE CIUTAT DE LLEIDA, S.L. LIQUIDATION REAL ESTATE - - 100.00% - 27-Jul-17 SUBSIDIARY PROVIURE BARCELONA, S.L. LIQUIDATION REAL ESTATE - - 100.00% - 27-Jul-17 SUBSIDIARY ALGARVETUR, S.L. LIQUIDATION REAL ESTATE - - 100.00% - 27-Jul-17 SUBSIDIARY CONJUNT RESIDENCIAL FREIXA, S.L. LIQUIDATION REAL ESTATE - - 100.00% - 27-Jul-17 SUBSIDIARY HABITAT ZENTRUM, S.L. LIQUIDATION REAL ESTATE - - 50.00% - 27-Jul-17 SUBSIDIARY BBVA BANCO FRANCES, S.A. DILUTION BANKING - - 9.39% 66.55% 31-Jul-17 SUBSIDIARY
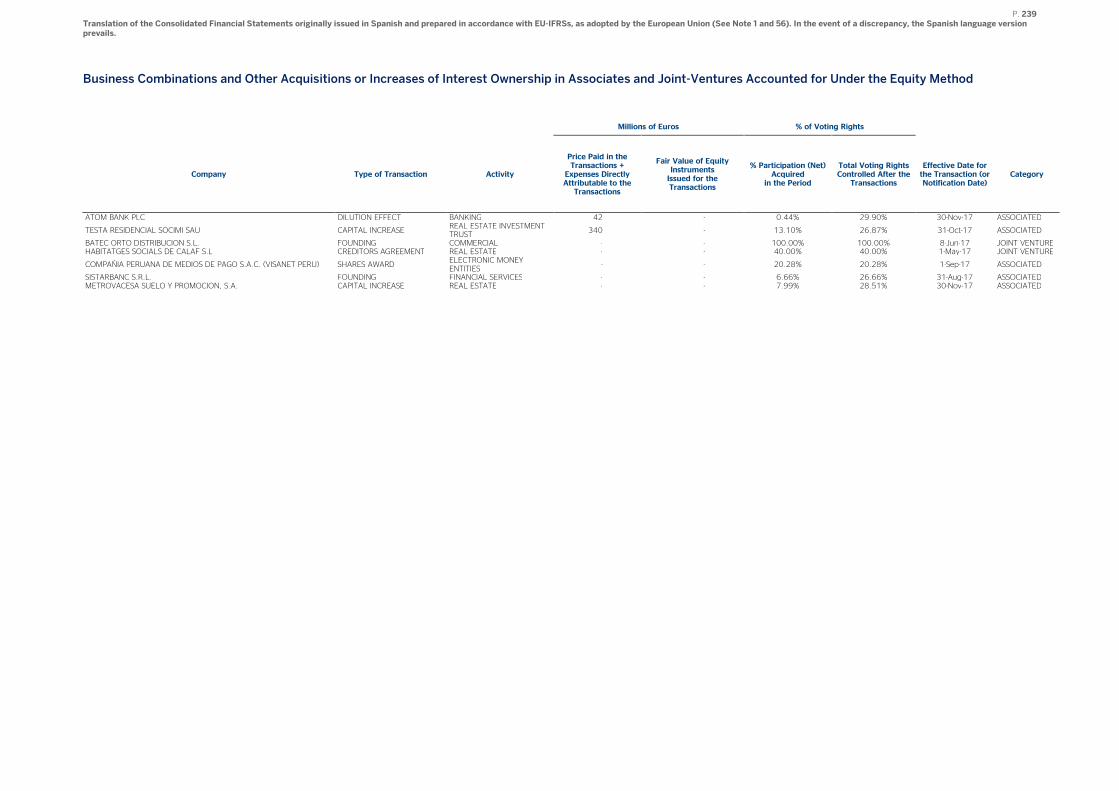
P. 239 Translation of the Consolidated Financial Statements originally issued in Spanish and prepared in accordance with EU-IFRSs, as adopted by the European Union (See Note 1 and 56). In the event of a discrepancy, the Spanish language version prevails.
Business Combinations and Other Acquisitions or Increases of Interest Ownership in Associates and Joint-Ventures Accounted for Under the Equity Method
Millions of Euros % of Voting Rights
Company Type of Transaction Activity
Price Paid in the Transactions + Expenses Directly Attributable to the Transactions
Fair Value of Equity Instruments Issued for the Transactions
% Participation (Net) Acquired
in the Period
Total Voting Rights Controlled After the Transactions
Effective Date for the Transaction (or Notification Date)
Category
ATOM BANK PLC DILUTION EFFECT BANKING 42 - 0.44% 29.90% 30-Nov-17 ASSOCIATED
TESTA RESIDENCIAL SOCIMI SAU CAPITAL INCREASE REAL ESTATE INVESTMENT TRUST
340 - 13.10% 26.87% 31-Oct-17 ASSOCIATED
BATEC ORTO DISTRIBUCION S.L. FOUNDING COMMERCIAL - - 100.00% 100.00% 8-Jun-17 JOINT VENTURE HABITATGES SOCIALS DE CALAF S.L CREDITORS AGREEMENT REAL ESTATE - - 40.00% 40.00% 1-May-17 JOINT VENTURE
COMPAÑIA PERUANA DE MEDIOS DE PAGO S.A.C. (VISANET PERU) SHARES AWARD ELECTRONIC MONEY ENTITIES
- - 20.28% 20.28% 1-Sep-17 ASSOCIATED
SISTARBANC S.R.L. FOUNDING FINANCIAL SERVICES - - 6.66% 26.66% 31-Aug-17 ASSOCIATED METROVACESA SUELO Y PROMOCION, S.A. CAPITAL INCREASE REAL ESTATE - - 7.99% 28.51% 30-Nov-17 ASSOCIATED
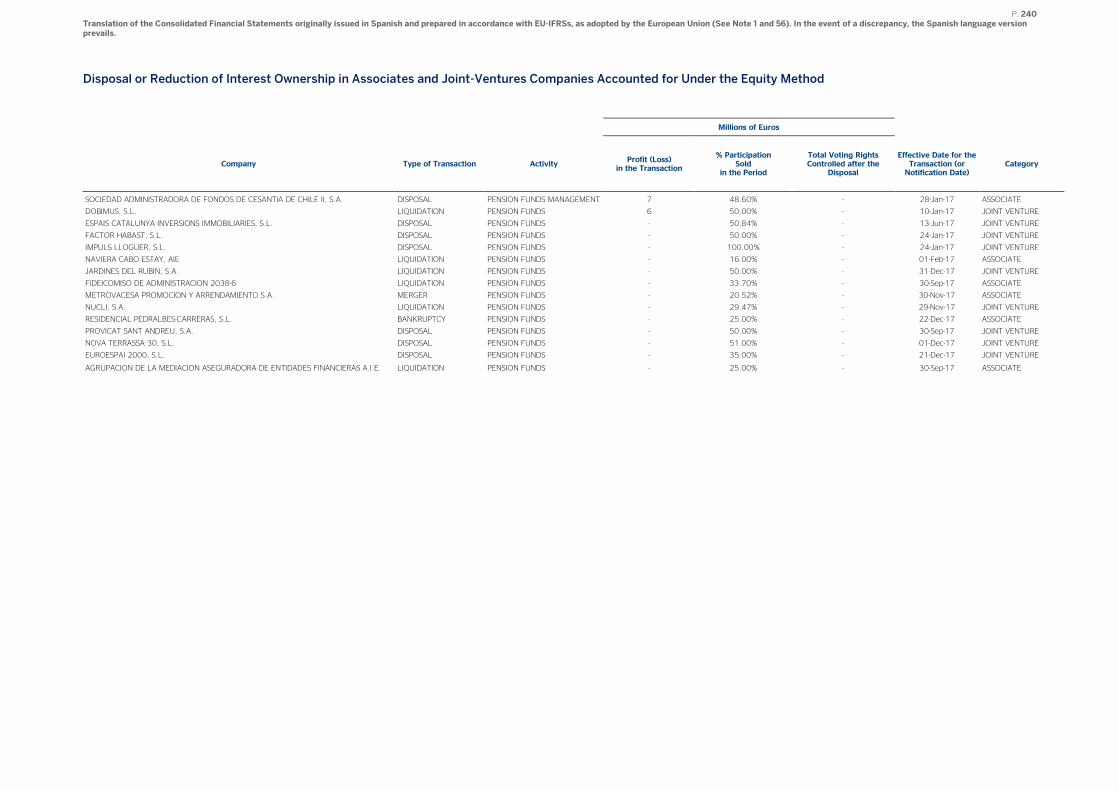
P. 240 Translation of the Consolidated Financial Statements originally issued in Spanish and prepared in accordance with EU-IFRSs, as adopted by the European Union (See Note 1 and 56). In the event of a discrepancy, the Spanish language version prevails.
Disposal or Reduction of Interest Ownership in Associates and Joint-Ventures Companies Accounted for Under the Equity Method
Millions of Euros
Company Type of Transaction Activity Profit (Loss)
in the Transaction
% Participation Sold
in the Period
Total Voting Rights Controlled after the
Disposal
Effective Date for the Transaction (or Notification Date)
Category
SOCIEDAD ADMINISTRADORA DE FONDOS DE CESANTIA DE CHILE II, S.A. DISPOSAL PENSION FUNDS MANAGEMENT 7 48.60% - 28-Jan-17 ASSOCIATE
DOBIMUS, S.L. LIQUIDATION PENSION FUNDS 6 50.00% - 10-Jan-17 JOINT VENTURE
ESPAIS CATALUNYA INVERSIONS IMMOBILIARIES, S.L. DISPOSAL PENSION FUNDS - 50.84% - 13-Jun-17 JOINT VENTURE
FACTOR HABAST, S.L. DISPOSAL PENSION FUNDS - 50.00% - 24-Jan-17 JOINT VENTURE
IMPULS LLOGUER, S.L. DISPOSAL PENSION FUNDS - 100.00% - 24-Jan-17 JOINT VENTURE
NAVIERA CABO ESTAY, AIE LIQUIDATION PENSION FUNDS - 16.00% - 01-Feb-17 ASSOCIATE
JARDINES DEL RUBIN, S.A. LIQUIDATION PENSION FUNDS - 50.00% - 31-Dec-17 JOINT VENTURE
FIDEICOMISO DE ADMINISTRACION 2038-6 LIQUIDATION PENSION FUNDS - 33.70% - 30-Sep-17 ASSOCIATE
METROVACESA PROMOCION Y ARRENDAMIENTO S.A. MERGER PENSION FUNDS - 20.52% - 30-Nov-17 ASSOCIATE
NUCLI, S.A. LIQUIDATION PENSION FUNDS - 29.47% - 29-Nov-17 JOINT VENTURE
RESIDENCIAL PEDRALBES-CARRERAS, S.L. BANKRUPTCY PENSION FUNDS - 25.00% - 22-Dec-17 ASSOCIATE
PROVICAT SANT ANDREU, S.A. DISPOSAL PENSION FUNDS - 50.00% - 30-Sep-17 JOINT VENTURE
NOVA TERRASSA 30, S.L. DISPOSAL PENSION FUNDS - 51.00% - 01-Dec-17 JOINT VENTURE
EUROESPAI 2000, S.L. DISPOSAL PENSION FUNDS - 35.00% - 21-Dec-17 JOINT VENTURE
AGRUPACION DE LA MEDIACION ASEGURADORA DE ENTIDADES FINANCIERAS A.I.E. LIQUIDATION PENSION FUNDS - 25.00% - 30-Sep-17 ASSOCIATE
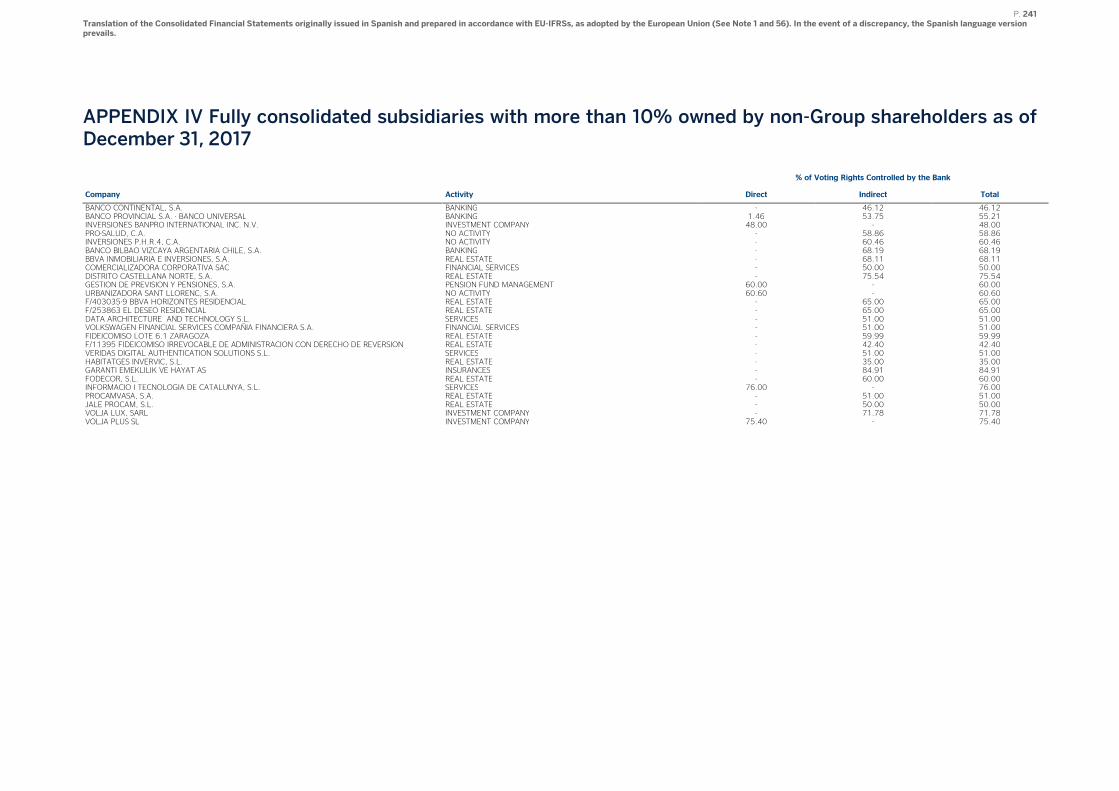
P. 241 Translation of the Consolidated Financial Statements originally issued in Spanish and prepared in accordance with EU-IFRSs, as adopted by the European Union (See Note 1 and 56). In the event of a discrepancy, the Spanish language version prevails.
APPENDIX IV Fully consolidated subsidiaries with more than 10% owned by non-Group shareholders as of December 31, 2017
% of Voting Rights Controlled by the Bank
Company Activity Direct Indirect Total
BANCO CONTINENTAL, S.A. BANKING - 46.12 46.12 BANCO PROVINCIAL S.A. - BANCO UNIVERSAL BANKING 1.46 53.75 55.21 INVERSIONES BANPRO INTERNATIONAL INC. N.V. INVESTMENT COMPANY 48.00 - 48.00 PRO-SALUD, C.A. NO ACTIVITY - 58.86 58.86 INVERSIONES P.H.R.4, C.A. NO ACTIVITY - 60.46 60.46 BANCO BILBAO VIZCAYA ARGENTARIA CHILE, S.A. BANKING - 68.19 68.19 BBVA INMOBILIARIA E INVERSIONES, S.A. REAL ESTATE - 68.11 68.11 COMERCIALIZADORA CORPORATIVA SAC FINANCIAL SERVICES - 50.00 50.00 DISTRITO CASTELLANA NORTE, S.A. REAL ESTATE - 75.54 75.54 GESTION DE PREVISION Y PENSIONES, S.A. PENSION FUND MANAGEMENT 60.00 - 60.00 URBANIZADORA SANT LLORENC, S.A. NO ACTIVITY 60.60 - 60.60 F/403035-9 BBVA HORIZONTES RESIDENCIAL REAL ESTATE - 65.00 65.00 F/253863 EL DESEO RESIDENCIAL REAL ESTATE - 65.00 65.00 DATA ARCHITECTURE AND TECHNOLOGY S.L. SERVICES - 51.00 51.00 VOLKSWAGEN FINANCIAL SERVICES COMPAÑIA FINANCIERA S.A. FINANCIAL SERVICES - 51.00 51.00 FIDEICOMISO LOTE 6.1 ZARAGOZA REAL ESTATE - 59.99 59.99 F/11395 FIDEICOMISO IRREVOCABLE DE ADMINISTRACION CON DERECHO DE REVERSION REAL ESTATE - 42.40 42.40 VERIDAS DIGITAL AUTHENTICATION SOLUTIONS S.L. SERVICES - 51.00 51.00 HABITATGES INVERVIC, S.L. REAL ESTATE - 35.00 35.00 GARANTI EMEKLILIK VE HAYAT AS INSURANCES - 84.91 84.91 FODECOR, S.L. REAL ESTATE - 60.00 60.00 INFORMACIO I TECNOLOGIA DE CATALUNYA, S.L. SERVICES 76.00 - 76.00 PROCAMVASA, S.A. REAL ESTATE - 51.00 51.00 JALE PROCAM, S.L. REAL ESTATE - 50.00 50.00 VOLJA LUX, SARL INVESTMENT COMPANY - 71.78 71.78 VOLJA PLUS SL INVESTMENT COMPANY 75.40 - 75.40
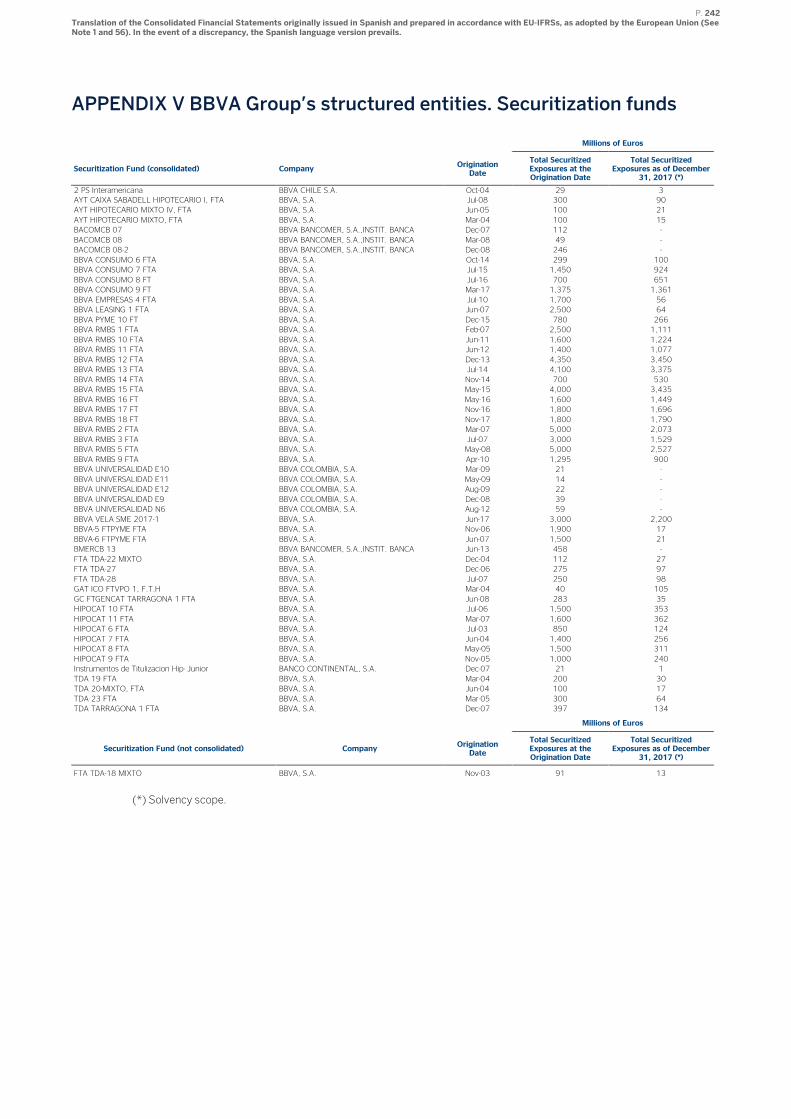
P. 242 Translation of the Consolidated Financial Statements originally issued in Spanish and prepared in accordance with EU-IFRSs, as adopted by the European Union (See Note 1 and 56). In the event of a discrepancy, the Spanish language version prevails.
APPENDIX V BBVA Group’s structured entities. Securitization funds
Millions of Euros
Securitization Fund (consolidated) Company Origination Date
Total Securitized Exposures at the Origination Date
Total Securitized Exposures as of December
31, 2017 (*)
2 PS Interamericana BBVA CHILE S.A. Oct-04 29 3 AYT CAIXA SABADELL HIPOTECARIO I, FTA BBVA, S.A. Jul-08 300 90 AYT HIPOTECARIO MIXTO IV, FTA BBVA, S.A. Jun-05 100 21
AYT HIPOTECARIO MIXTO, FTA BBVA, S.A. Mar-04 100 15 BACOMCB 07 BBVA BANCOMER, S.A.,INSTIT. BANCA Dec-07 112 -
BACOMCB 08 BBVA BANCOMER, S.A.,INSTIT. BANCA Mar-08 49 - BACOMCB 08-2 BBVA BANCOMER, S.A.,INSTIT. BANCA Dec-08 246 -
BBVA CONSUMO 6 FTA BBVA, S.A. Oct-14 299 100 BBVA CONSUMO 7 FTA BBVA, S.A. Jul-15 1,450 924
BBVA CONSUMO 8 FT BBVA, S.A. Jul-16 700 651 BBVA CONSUMO 9 FT BBVA, S.A. Mar-17 1,375 1,361
BBVA EMPRESAS 4 FTA BBVA, S.A. Jul-10 1,700 56 BBVA LEASING 1 FTA BBVA, S.A. Jun-07 2,500 64
BBVA PYME 10 FT BBVA, S.A. Dec-15 780 266 BBVA RMBS 1 FTA BBVA, S.A. Feb-07 2,500 1,111
BBVA RMBS 10 FTA BBVA, S.A. Jun-11 1,600 1,224 BBVA RMBS 11 FTA BBVA, S.A. Jun-12 1,400 1,077
BBVA RMBS 12 FTA BBVA, S.A. Dec-13 4,350 3,450 BBVA RMBS 13 FTA BBVA, S.A. Jul-14 4,100 3,375
BBVA RMBS 14 FTA BBVA, S.A. Nov-14 700 530 BBVA RMBS 15 FTA BBVA, S.A. May-15 4,000 3,435
BBVA RMBS 16 FT BBVA, S.A. May-16 1,600 1,449 BBVA RMBS 17 FT BBVA, S.A. Nov-16 1,800 1,696
BBVA RMBS 18 FT BBVA, S.A. Nov-17 1,800 1,790 BBVA RMBS 2 FTA BBVA, S.A. Mar-07 5,000 2,073
BBVA RMBS 3 FTA BBVA, S.A. Jul-07 3,000 1,529 BBVA RMBS 5 FTA BBVA, S.A. May-08 5,000 2,527
BBVA RMBS 9 FTA BBVA, S.A. Apr-10 1,295 900 BBVA UNIVERSALIDAD E10 BBVA COLOMBIA, S.A. Mar-09 21 -
BBVA UNIVERSALIDAD E11 BBVA COLOMBIA, S.A. May-09 14 - BBVA UNIVERSALIDAD E12 BBVA COLOMBIA, S.A. Aug-09 22 -
BBVA UNIVERSALIDAD E9 BBVA COLOMBIA, S.A. Dec-08 39 - BBVA UNIVERSALIDAD N6 BBVA COLOMBIA, S.A. Aug-12 59 -
BBVA VELA SME 2017-1 BBVA, S.A. Jun-17 3,000 2,200 BBVA-5 FTPYME FTA BBVA, S.A. Nov-06 1,900 17
BBVA-6 FTPYME FTA BBVA, S.A. Jun-07 1,500 21 BMERCB 13 BBVA BANCOMER, S.A.,INSTIT. BANCA Jun-13 458 -
FTA TDA-22 MIXTO BBVA, S.A. Dec-04 112 27 FTA TDA-27 BBVA, S.A. Dec-06 275 97
FTA TDA-28 BBVA, S.A. Jul-07 250 98 GAT ICO FTVPO 1, F.T.H BBVA, S.A. Mar-04 40 105
GC FTGENCAT TARRAGONA 1 FTA BBVA, S.A. Jun-08 283 35 HIPOCAT 10 FTA BBVA, S.A. Jul-06 1,500 353
HIPOCAT 11 FTA BBVA, S.A. Mar-07 1,600 362 HIPOCAT 6 FTA BBVA, S.A. Jul-03 850 124
HIPOCAT 7 FTA BBVA, S.A. Jun-04 1,400 256 HIPOCAT 8 FTA BBVA, S.A. May-05 1,500 311
HIPOCAT 9 FTA BBVA, S.A. Nov-05 1,000 240 Instrumentos de Titulizacion Hip- Junior BANCO CONTINENTAL, S.A. Dec-07 21 1
TDA 19 FTA BBVA, S.A. Mar-04 200 30 TDA 20-MIXTO, FTA BBVA, S.A. Jun-04 100 17
TDA 23 FTA BBVA, S.A. Mar-05 300 64 TDA TARRAGONA 1 FTA BBVA, S.A. Dec-07 397 134
Millions of Euros
Securitization Fund (not consolidated) Company Origination Date
Total Securitized Exposures at the Origination Date
Total Securitized Exposures as of December
31, 2017 (*)
FTA TDA-18 MIXTO BBVA, S.A. Nov-03 91 13
(*) Solvency scope.
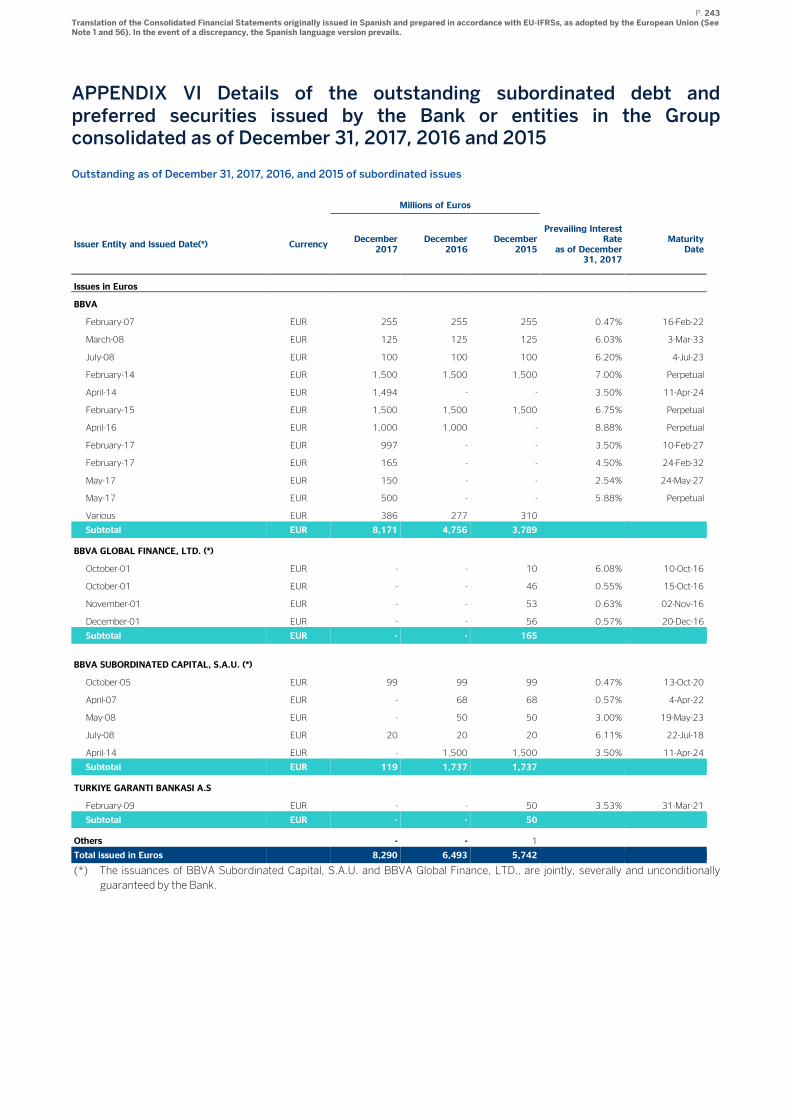
P. 243 Translation of the Consolidated Financial Statements originally issued in Spanish and prepared in accordance with EU-IFRSs, as adopted by the European Union (See Note 1 and 56). In the event of a discrepancy, the Spanish language version prevails.
APPENDIX VI Details of the outstanding subordinated debt and preferred securities issued by the Bank or entities in the Group consolidated as of December 31, 2017, 2016 and 2015
Outstanding as of December 31, 2017, 2016, and 2015 of subordinated issues
Millions of Euros
Issuer Entity and Issued Date(*) Currency December
2017 December
2016 December
2015
Prevailing Interest Rate
as of December 31, 2017
Maturity Date
Issues in Euros
BBVA
February-07 EUR 255 255 255 0.47% 16-Feb-22
March-08 EUR 125 125 125 6.03% 3-Mar-33
July-08 EUR 100 100 100 6.20% 4-Jul-23
February-14 EUR 1,500 1,500 1,500 7.00% Perpetual
April-14 EUR 1,494 - - 3.50% 11-Apr-24
February-15 EUR 1,500 1,500 1,500 6.75% Perpetual
April-16 EUR 1,000 1,000 - 8.88% Perpetual
February-17 EUR 997 - - 3.50% 10-Feb-27
February-17 EUR 165 - - 4.50% 24-Feb-32
May-17 EUR 150 - - 2.54% 24-May-27
May-17 EUR 500 - - 5.88% Perpetual
Various EUR 386 277 310
Subtotal EUR 8,171 4,756 3,789
BBVA GLOBAL FINANCE, LTD. (*)
October-01 EUR - - 10 6.08% 10-Oct-16
October-01 EUR - - 46 0.55% 15-Oct-16
November-01 EUR - - 53 0.63% 02-Nov-16
December-01 EUR - - 56 0.57% 20-Dec-16
Subtotal EUR - - 165
BBVA SUBORDINATED CAPITAL, S.A.U. (*)
October-05 EUR 99 99 99 0.47% 13-Oct-20
April-07 EUR - 68 68 0.57% 4-Apr-22
May-08 EUR - 50 50 3.00% 19-May-23
July-08 EUR 20 20 20 6.11% 22-Jul-18
April-14 EUR - 1,500 1,500 3.50% 11-Apr-24
Subtotal EUR 119 1,737 1,737
TURKIYE GARANTI BANKASI A.S
February-09 EUR - - 50 3.53% 31-Mar-21
Subtotal EUR - - 50
Others - - 1
Total issued in Euros 8,290 6,493 5,742
(*) The issuances of BBVA Subordinated Capital, S.A.U. and BBVA Global Finance, LTD., are jointly, severally and unconditionally
guaranteed by the Bank.
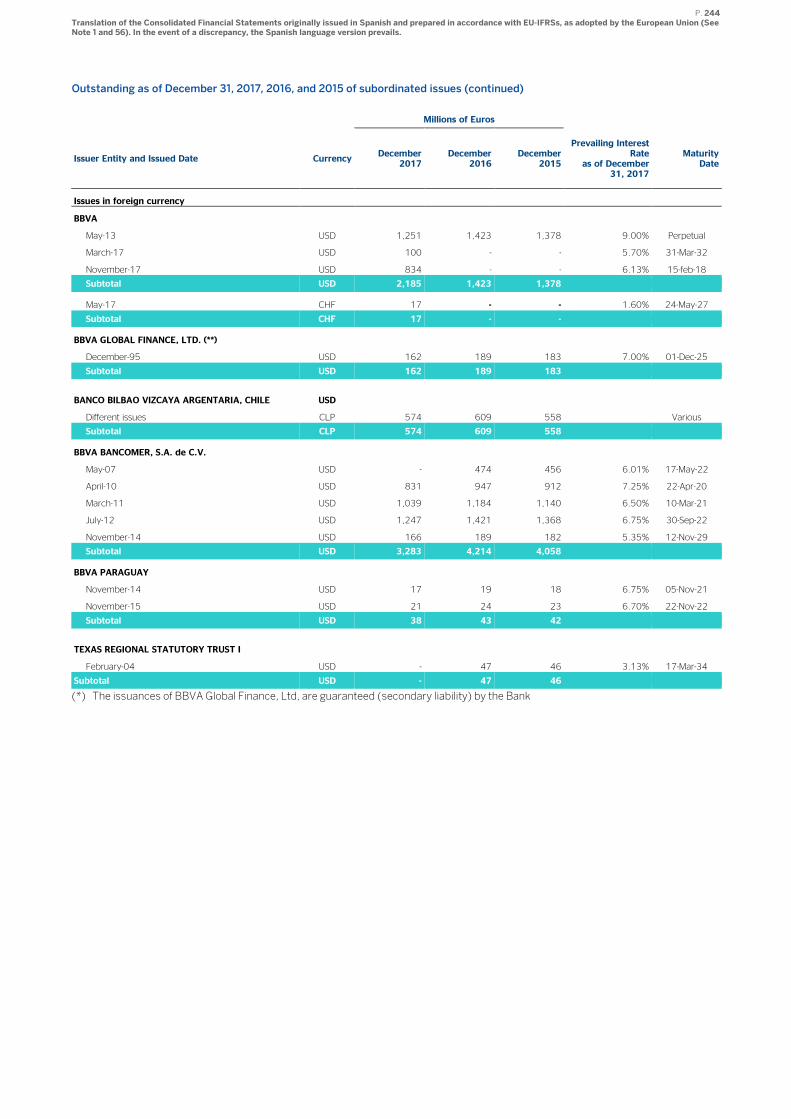
P. 244 Translation of the Consolidated Financial Statements originally issued in Spanish and prepared in accordance with EU-IFRSs, as adopted by the European Union (See Note 1 and 56). In the event of a discrepancy, the Spanish language version prevails.
Outstanding as of December 31, 2017, 2016, and 2015 of subordinated issues (continued)
Millions of Euros
Issuer Entity and Issued Date Currency December
2017 December
2016 December
2015
Prevailing Interest Rate
as of December 31, 2017
Maturity Date
Issues in foreign currency
BBVA
May-13 USD 1,251 1,423 1,378 9.00% Perpetual
March-17 USD 100 - - 5.70% 31-Mar-32
November-17 USD 834 - - 6.13% 15-feb-18
Subtotal USD 2,185 1,423 1,378
May-17 CHF 17 - - 1.60% 24-May-27
Subtotal CHF 17 - -
BBVA GLOBAL FINANCE, LTD. (**)
December-95 USD 162 189 183 7.00% 01-Dec-25
Subtotal USD 162 189 183
BANCO BILBAO VIZCAYA ARGENTARIA, CHILE USD
Different issues CLP 574 609 558 Various
Subtotal CLP 574 609 558
BBVA BANCOMER, S.A. de C.V.
May-07 USD - 474 456 6.01% 17-May-22
April-10 USD 831 947 912 7.25% 22-Apr-20
March-11 USD 1,039 1,184 1,140 6.50% 10-Mar-21
July-12 USD 1,247 1,421 1,368 6.75% 30-Sep-22
November-14 USD 166 189 182 5.35% 12-Nov-29
Subtotal USD 3,283 4,214 4,058
BBVA PARAGUAY
November-14 USD 17 19 18 6.75% 05-Nov-21
November-15 USD 21 24 23 6.70% 22-Nov-22
Subtotal USD 38 43 42
TEXAS REGIONAL STATUTORY TRUST I
February-04 USD - 47 46 3.13% 17-Mar-34
Subtotal USD - 47 46
(*) The issuances of BBVA Global Finance, Ltd, are guaranteed (secondary liability) by the Bank
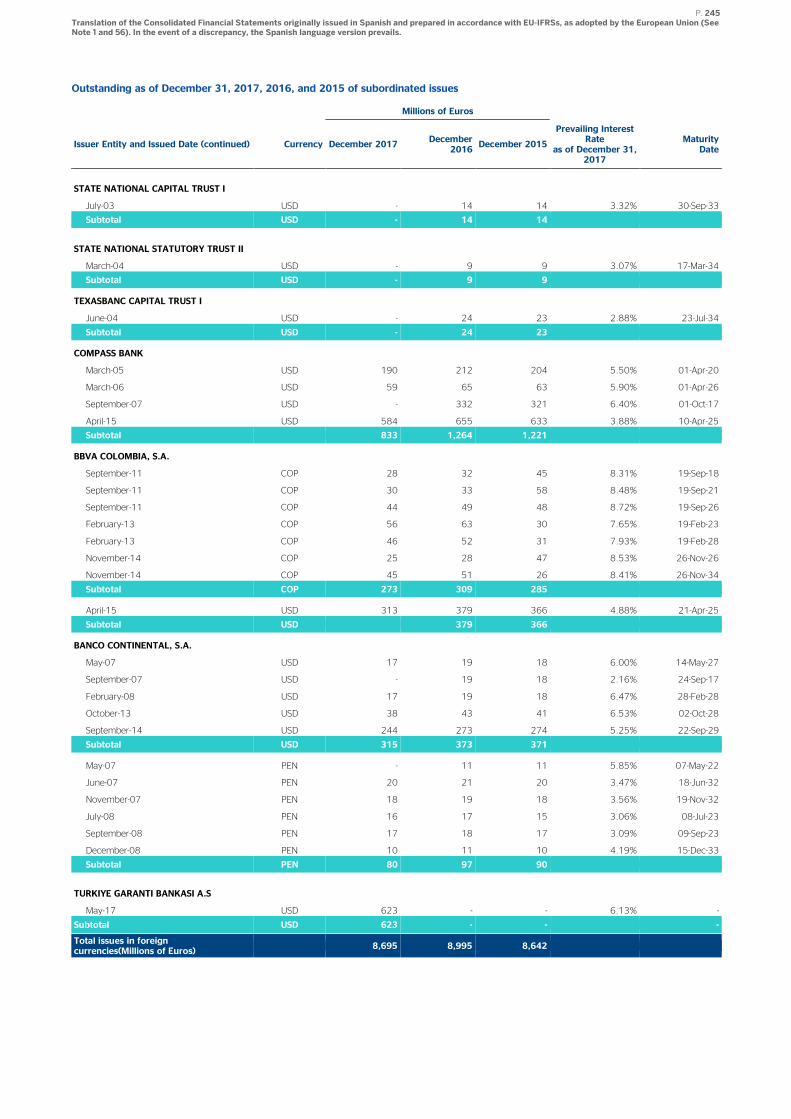
P. 245 Translation of the Consolidated Financial Statements originally issued in Spanish and prepared in accordance with EU-IFRSs, as adopted by the European Union (See Note 1 and 56). In the event of a discrepancy, the Spanish language version prevails.
Outstanding as of December 31, 2017, 2016, and 2015 of subordinated issues
Millions of Euros
Issuer Entity and Issued Date (continued) Currency December 2017 December
2016 December 2015
Prevailing Interest Rate
as of December 31, 2017
Maturity Date
STATE NATIONAL CAPITAL TRUST I
July-03 USD - 14 14 3.32% 30-Sep-33
Subtotal USD - 14 14
STATE NATIONAL STATUTORY TRUST II
March-04 USD - 9 9 3.07% 17-Mar-34
Subtotal USD - 9 9
TEXASBANC CAPITAL TRUST I
June-04 USD - 24 23 2.88% 23-Jul-34
Subtotal USD - 24 23
COMPASS BANK
March-05 USD 190 212 204 5.50% 01-Apr-20
March-06 USD 59 65 63 5.90% 01-Apr-26
September-07 USD - 332 321 6.40% 01-Oct-17
April-15 USD 584 655 633 3.88% 10-Apr-25
Subtotal 833 1,264 1,221
BBVA COLOMBIA, S.A.
September-11 COP 28 32 45 8.31% 19-Sep-18
September-11 COP 30 33 58 8.48% 19-Sep-21
September-11 COP 44 49 48 8.72% 19-Sep-26
February-13 COP 56 63 30 7.65% 19-Feb-23
February-13 COP 46 52 31 7.93% 19-Feb-28
November-14 COP 25 28 47 8.53% 26-Nov-26
November-14 COP 45 51 26 8.41% 26-Nov-34
Subtotal COP 273 309 285
April-15 USD 313 379 366 4.88% 21-Apr-25
Subtotal USD 379 366
BANCO CONTINENTAL, S.A.
May-07 USD 17 19 18 6.00% 14-May-27
September-07 USD - 19 18 2.16% 24-Sep-17
February-08 USD 17 19 18 6.47% 28-Feb-28
October-13 USD 38 43 41 6.53% 02-Oct-28
September-14 USD 244 273 274 5.25% 22-Sep-29
Subtotal USD 315 373 371
May-07 PEN - 11 11 5.85% 07-May-22
June-07 PEN 20 21 20 3.47% 18-Jun-32
November-07 PEN 18 19 18 3.56% 19-Nov-32
July-08 PEN 16 17 15 3.06% 08-Jul-23
September-08 PEN 17 18 17 3.09% 09-Sep-23
December-08 PEN 10 11 10 4.19% 15-Dec-33
Subtotal PEN 80 97 90
TURKIYE GARANTI BANKASI A.S
May-17 USD 623 - - 6.13% -
Subtotal USD 623 - - -
Total issues in foreign currencies(Millions of Euros)
8,695 8,995 8,642
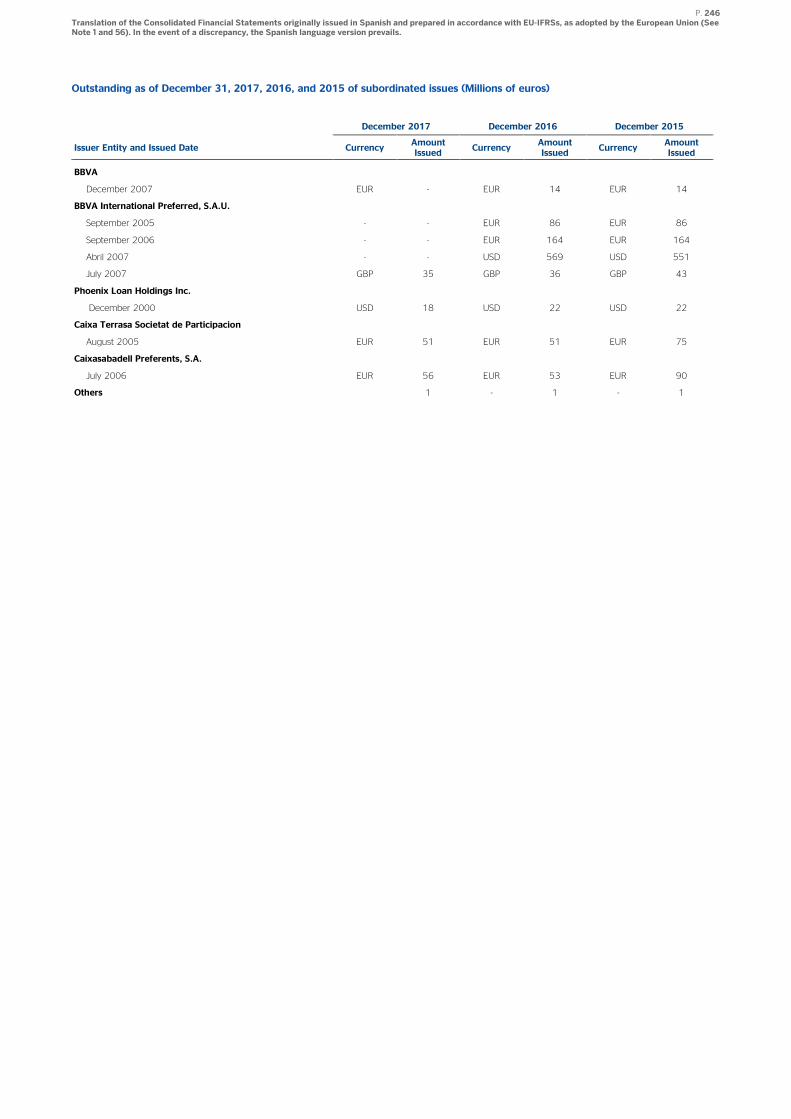
P. 246 Translation of the Consolidated Financial Statements originally issued in Spanish and prepared in accordance with EU-IFRSs, as adopted by the European Union (See Note 1 and 56). In the event of a discrepancy, the Spanish language version prevails.
Outstanding as of December 31, 2017, 2016, and 2015 of subordinated issues (Millions of euros)
December 2017 December 2016 December 2015
Issuer Entity and Issued Date Currency Amount Issued
Currency Amount Issued
Currency Amount Issued
BBVA
December 2007 EUR - EUR 14 EUR 14
BBVA International Preferred, S.A.U.
September 2005 - - EUR 86 EUR 86
September 2006 - - EUR 164 EUR 164
Abril 2007 - - USD 569 USD 551
July 2007 GBP 35 GBP 36 GBP 43
Phoenix Loan Holdings Inc.
December 2000 USD 18 USD 22 USD 22
Caixa Terrasa Societat de Participacion
August 2005 EUR 51 EUR 51 EUR 75
Caixasabadell Preferents, S.A.
July 2006 EUR 56 EUR 53 EUR 90
Others 1 - 1 - 1
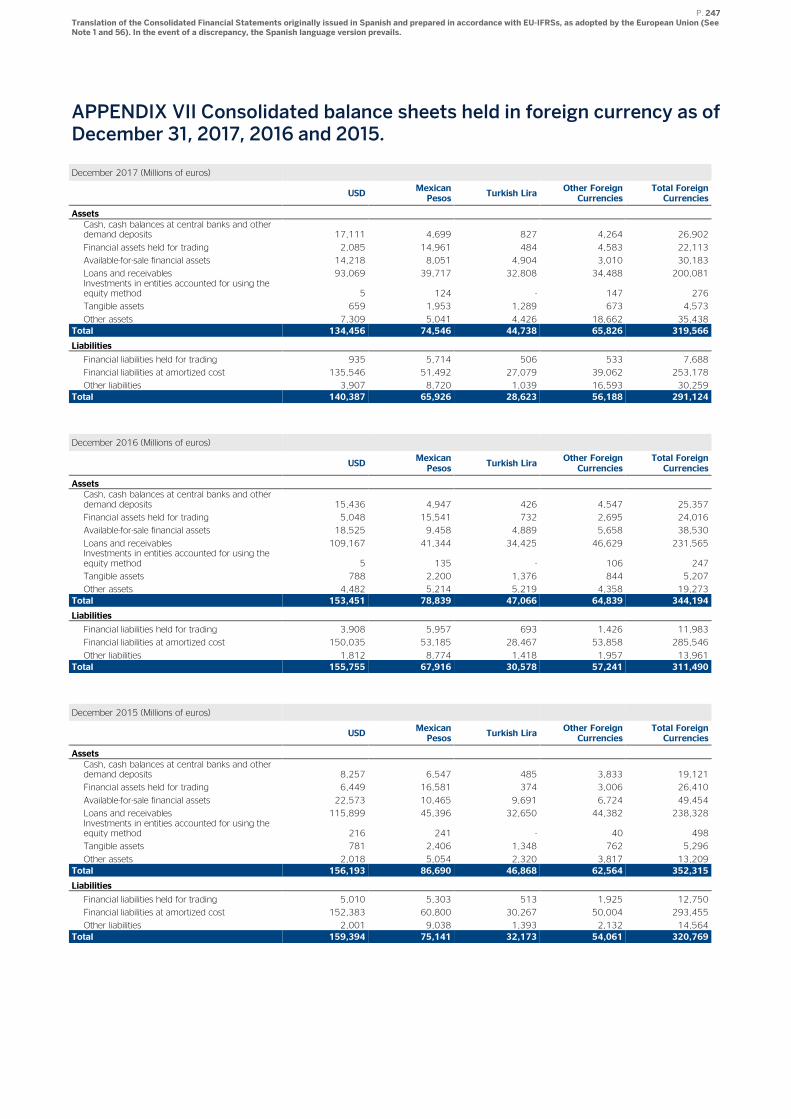
P. 247 Translation of the Consolidated Financial Statements originally issued in Spanish and prepared in accordance with EU-IFRSs, as adopted by the European Union (See Note 1 and 56). In the event of a discrepancy, the Spanish language version prevails.
APPENDIX VII Consolidated balance sheets held in foreign currency as of December 31, 2017, 2016 and 2015.
December 2017 (Millions of euros)
USD Mexican Pesos
Turkish Lira Other Foreign Currencies
Total Foreign Currencies
Assets
Cash, cash balances at central banks and other demand deposits 17,111 4,699 827 4,264 26,902
Financial assets held for trading 2,085 14,961 484 4,583 22,113
Available-for-sale financial assets 14,218 8,051 4,904 3,010 30,183
Loans and receivables 93,069 39,717 32,808 34,488 200,081 Investments in entities accounted for using the equity method 5 124 - 147 276
Tangible assets 659 1,953 1,289 673 4,573
Other assets 7,309 5,041 4,426 18,662 35,438 Total 134,456 74,546 44,738 65,826 319,566
Liabilities
Financial liabilities held for trading 935 5,714 506 533 7,688
Financial liabilities at amortized cost 135,546 51,492 27,079 39,062 253,178
Other liabilities 3,907 8,720 1,039 16,593 30,259 Total 140,387 65,926 28,623 56,188 291,124
December 2016 (Millions of euros)
USD Mexican Pesos
Turkish Lira Other Foreign Currencies
Total Foreign Currencies
Assets
Cash, cash balances at central banks and other demand deposits 15,436 4,947 426 4,547 25,357
Financial assets held for trading 5,048 15,541 732 2,695 24,016
Available-for-sale financial assets 18,525 9,458 4,889 5,658 38,530
Loans and receivables 109,167 41,344 34,425 46,629 231,565 Investments in entities accounted for using the equity method 5 135 - 106 247
Tangible assets 788 2,200 1,376 844 5,207
Other assets 4,482 5,214 5,219 4,358 19,273 Total 153,451 78,839 47,066 64,839 344,194
Liabilities
Financial liabilities held for trading 3,908 5,957 693 1,426 11,983
Financial liabilities at amortized cost 150,035 53,185 28,467 53,858 285,546
Other liabilities 1,812 8,774 1,418 1,957 13,961 Total 155,755 67,916 30,578 57,241 311,490
December 2015 (Millions of euros)
USD Mexican Pesos
Turkish Lira Other Foreign Currencies
Total Foreign Currencies
Assets
Cash, cash balances at central banks and other demand deposits 8,257 6,547 485 3,833 19,121
Financial assets held for trading 6,449 16,581 374 3,006 26,410
Available-for-sale financial assets 22,573 10,465 9,691 6,724 49,454
Loans and receivables 115,899 45,396 32,650 44,382 238,328 Investments in entities accounted for using the equity method 216 241 - 40 498
Tangible assets 781 2,406 1,348 762 5,296
Other assets 2,018 5,054 2,320 3,817 13,209 Total 156,193 86,690 46,868 62,564 352,315
Liabilities
Financial liabilities held for trading 5,010 5,303 513 1,925 12,750
Financial liabilities at amortized cost 152,383 60,800 30,267 50,004 293,455
Other liabilities 2,001 9,038 1,393 2,132 14,564 Total 159,394 75,141 32,173 54,061 320,769
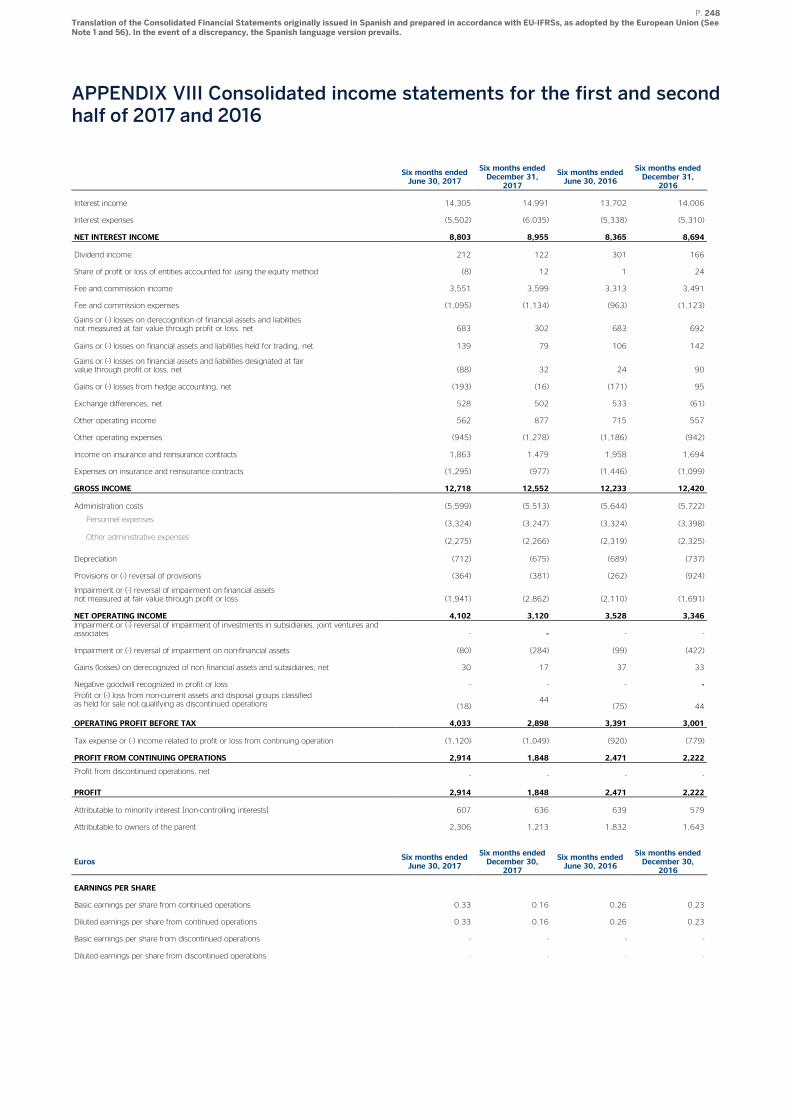
P. 248 Translation of the Consolidated Financial Statements originally issued in Spanish and prepared in accordance with EU-IFRSs, as adopted by the European Union (See Note 1 and 56). In the event of a discrepancy, the Spanish language version prevails.
APPENDIX VIII Consolidated income statements for the first and second half of 2017 and 2016
Six months ended June 30, 2017
Six months ended December 31,
2017
Six months ended June 30, 2016
Six months ended December 31,
2016
Interest income 14,305 14,991 13,702 14,006
Interest expenses (5,502) (6,035) (5,338) (5,310)
NET INTEREST INCOME 8,803 8,955 8,365 8,694
Dividend income 212 122 301 166
Share of profit or loss of entities accounted for using the equity method (8) 12 1 24
Fee and commission income 3,551 3,599 3,313 3,491
Fee and commission expenses (1,095) (1,134) (963) (1,123)
Gains or (-) losses on derecognition of financial assets and liabilities not measured at fair value through profit or loss. net 683 302 683 692
Gains or (-) losses on financial assets and liabilities held for trading, net 139 79 106 142
Gains or (-) losses on financial assets and liabilities designated at fair value through profit or loss, net (88) 32 24 90
Gains or (-) losses from hedge accounting, net (193) (16) (171) 95
Exchange differences, net 528 502 533 (61)
Other operating income 562 877 715 557
Other operating expenses (945) (1,278) (1,186) (942)
Income on insurance and reinsurance contracts 1,863 1,479 1,958 1,694
Expenses on insurance and reinsurance contracts (1,295) (977) (1,446) (1,099)
GROSS INCOME 12,718 12,552 12,233 12,420
Administration costs (5,599) (5,513) (5,644) (5,722)
Personnel expenses (3,324) (3,247) (3,324) (3,398)
Other administrative expenses (2,275) (2,266) (2,319) (2,325)
Depreciation (712) (675) (689) (737)
Provisions or (-) reversal of provisions (364) (381) (262) (924)
Impairment or (-) reversal of impairment on financial assets not measured at fair value through profit or loss (1,941) (2,862) (2,110) (1,691)
NET OPERATING INCOME 4,102 3,120 3,528 3,346
Impairment or (-) reversal of impairment of investments in subsidiaries, joint ventures and associates - - - -
Impairment or (-) reversal of impairment on non-financial assets (80) (284) (99) (422)
Gains (losses) on derecognized of non financial assets and subsidiaries, net 30 17 37 33
Negative goodwill recognized in profit or loss - - - -
Profit or (-) loss from non-current assets and disposal groups classified as held for sale not qualifying as discontinued operations (18)
44 (75) 44
OPERATING PROFIT BEFORE TAX 4,033 2,898 3,391 3,001
Tax expense or (-) income related to profit or loss from continuing operation (1,120) (1,049) (920) (779)
PROFIT FROM CONTINUING OPERATIONS 2,914 1,848 2,471 2,222
Profit from discontinued operations, net - - - -
PROFIT 2,914 1,848 2,471 2,222
Attributable to minority interest [non-controlling interests] 607 636 639 579
Attributable to owners of the parent 2,306 1,213 1,832 1,643
Euros Six months ended June 30, 2017
Six months ended December 30,
2017
Six months ended June 30, 2016
Six months ended December 30,
2016
EARNINGS PER SHARE
Basic earnings per share from continued operations 0.33 0.16 0.26 0.23
Diluted earnings per share from continued operations 0.33 0.16 0.26 0.23
Basic earnings per share from discontinued operations - - - -
Diluted earnings per share from discontinued operations - - - -
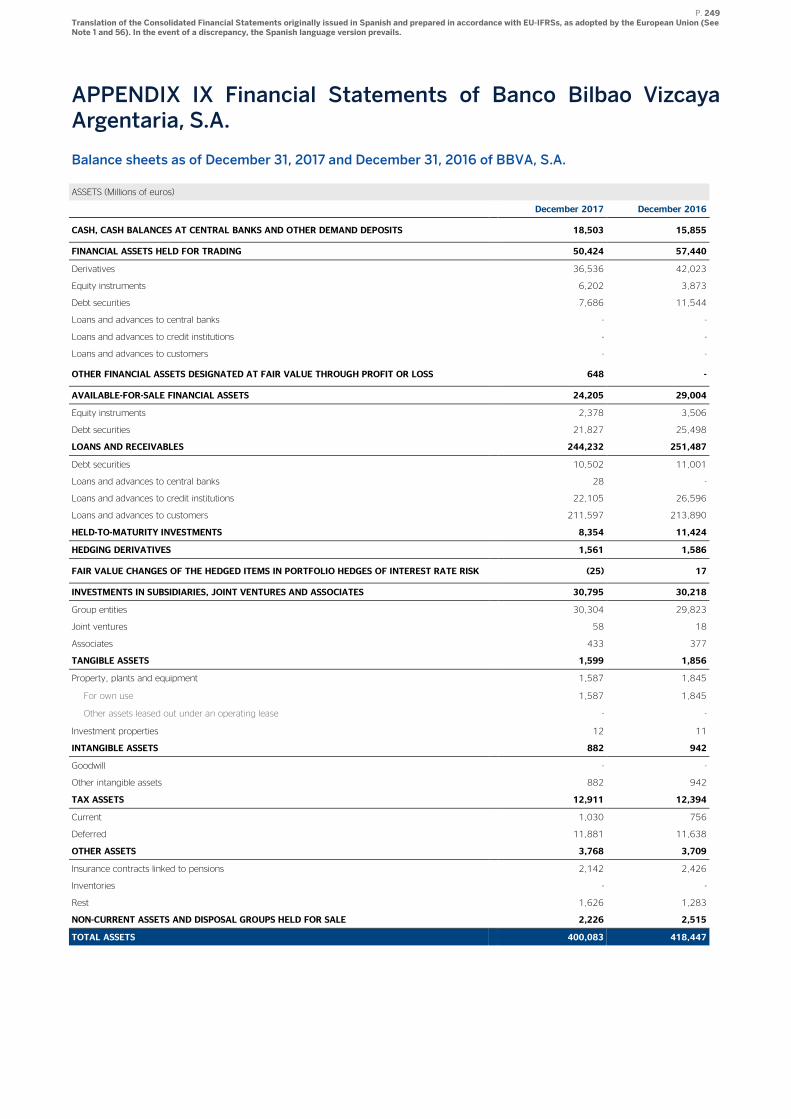
P. 249 Translation of the Consolidated Financial Statements originally issued in Spanish and prepared in accordance with EU-IFRSs, as adopted by the European Union (See Note 1 and 56). In the event of a discrepancy, the Spanish language version prevails.
APPENDIX IX Financial Statements of Banco Bilbao Vizcaya Argentaria, S.A.
Balance sheets as of December 31, 2017 and December 31, 2016 of BBVA, S.A.
ASSETS (Millions of euros)
December 2017 December 2016
CASH, CASH BALANCES AT CENTRAL BANKS AND OTHER DEMAND DEPOSITS 18,503 15,855
FINANCIAL ASSETS HELD FOR TRADING 50,424 57,440
Derivatives 36,536 42,023
Equity instruments 6,202 3,873
Debt securities 7,686 11,544
Loans and advances to central banks - -
Loans and advances to credit institutions - -
Loans and advances to customers - -
OTHER FINANCIAL ASSETS DESIGNATED AT FAIR VALUE THROUGH PROFIT OR LOSS 648 -
AVAILABLE-FOR-SALE FINANCIAL ASSETS 24,205 29,004
Equity instruments 2,378 3,506
Debt securities 21,827 25,498
LOANS AND RECEIVABLES 244,232 251,487
Debt securities 10,502 11,001
Loans and advances to central banks 28 -
Loans and advances to credit institutions 22,105 26,596
Loans and advances to customers 211,597 213,890
HELD-TO-MATURITY INVESTMENTS 8,354 11,424
HEDGING DERIVATIVES 1,561 1,586
FAIR VALUE CHANGES OF THE HEDGED ITEMS IN PORTFOLIO HEDGES OF INTEREST RATE RISK (25) 17
INVESTMENTS IN SUBSIDIARIES, JOINT VENTURES AND ASSOCIATES 30,795 30,218
Group entities 30,304 29,823
Joint ventures 58 18
Associates 433 377
TANGIBLE ASSETS 1,599 1,856
Property, plants and equipment 1,587 1,845
For own use 1,587 1,845
Other assets leased out under an operating lease - -
Investment properties 12 11
INTANGIBLE ASSETS 882 942
Goodwill - -
Other intangible assets 882 942
TAX ASSETS 12,911 12,394
Current 1,030 756
Deferred 11,881 11,638
OTHER ASSETS 3,768 3,709
Insurance contracts linked to pensions 2,142 2,426
Inventories - -
Rest 1,626 1,283
NON-CURRENT ASSETS AND DISPOSAL GROUPS HELD FOR SALE 2,226 2,515
TOTAL ASSETS 400,083 418,447
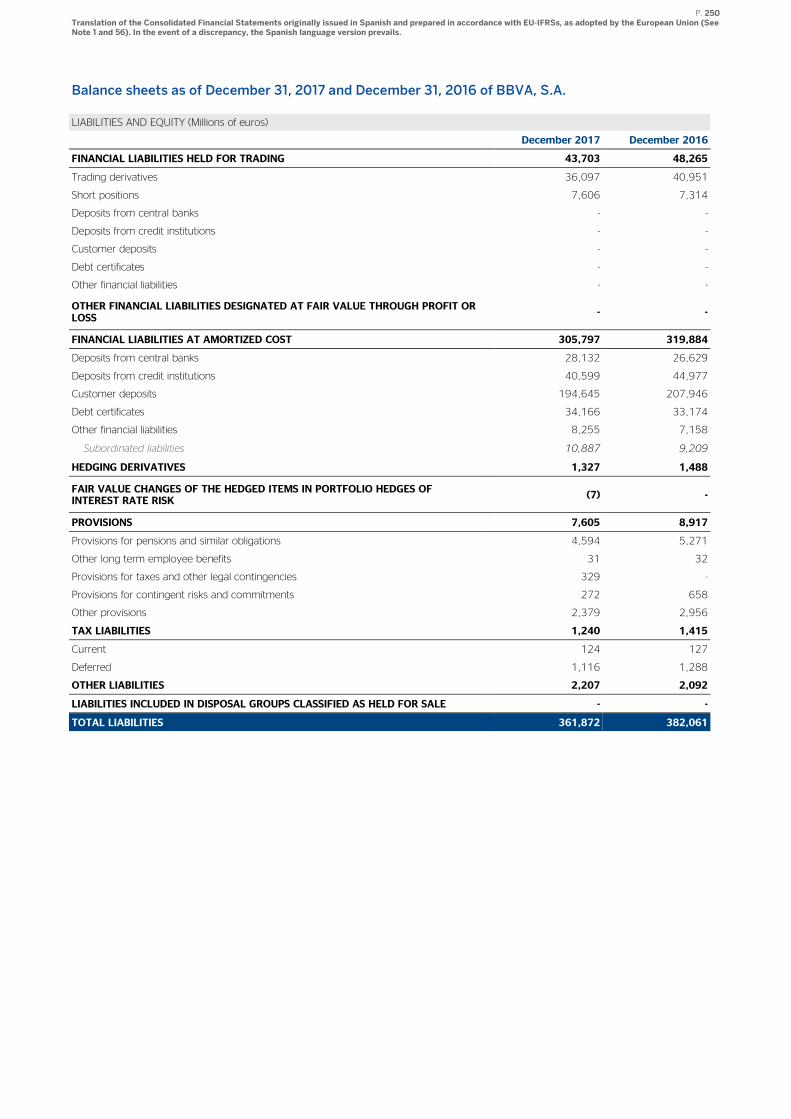
P. 250 Translation of the Consolidated Financial Statements originally issued in Spanish and prepared in accordance with EU-IFRSs, as adopted by the European Union (See Note 1 and 56). In the event of a discrepancy, the Spanish language version prevails.
Balance sheets as of December 31, 2017 and December 31, 2016 of BBVA, S.A.
LIABILITIES AND EQUITY (Millions of euros)
December 2017 December 2016
FINANCIAL LIABILITIES HELD FOR TRADING 43,703 48,265
Trading derivatives 36,097 40,951
Short positions 7,606 7,314
Deposits from central banks - -
Deposits from credit institutions - -
Customer deposits - -
Debt certificates - -
Other financial liabilities - -
OTHER FINANCIAL LIABILITIES DESIGNATED AT FAIR VALUE THROUGH PROFIT OR LOSS
- -
FINANCIAL LIABILITIES AT AMORTIZED COST 305,797 319,884
Deposits from central banks 28,132 26,629
Deposits from credit institutions 40,599 44,977
Customer deposits 194,645 207,946
Debt certificates 34,166 33,174
Other financial liabilities 8,255 7,158
Subordinated liabilities 10,887 9,209
HEDGING DERIVATIVES 1,327 1,488
FAIR VALUE CHANGES OF THE HEDGED ITEMS IN PORTFOLIO HEDGES OF INTEREST RATE RISK
(7) -
PROVISIONS 7,605 8,917
Provisions for pensions and similar obligations 4,594 5,271
Other long term employee benefits 31 32
Provisions for taxes and other legal contingencies 329 -
Provisions for contingent risks and commitments 272 658
Other provisions 2,379 2,956
TAX LIABILITIES 1,240 1,415
Current 124 127
Deferred 1,116 1,288
OTHER LIABILITIES 2,207 2,092
LIABILITIES INCLUDED IN DISPOSAL GROUPS CLASSIFIED AS HELD FOR SALE - -
TOTAL LIABILITIES 361,872 382,061
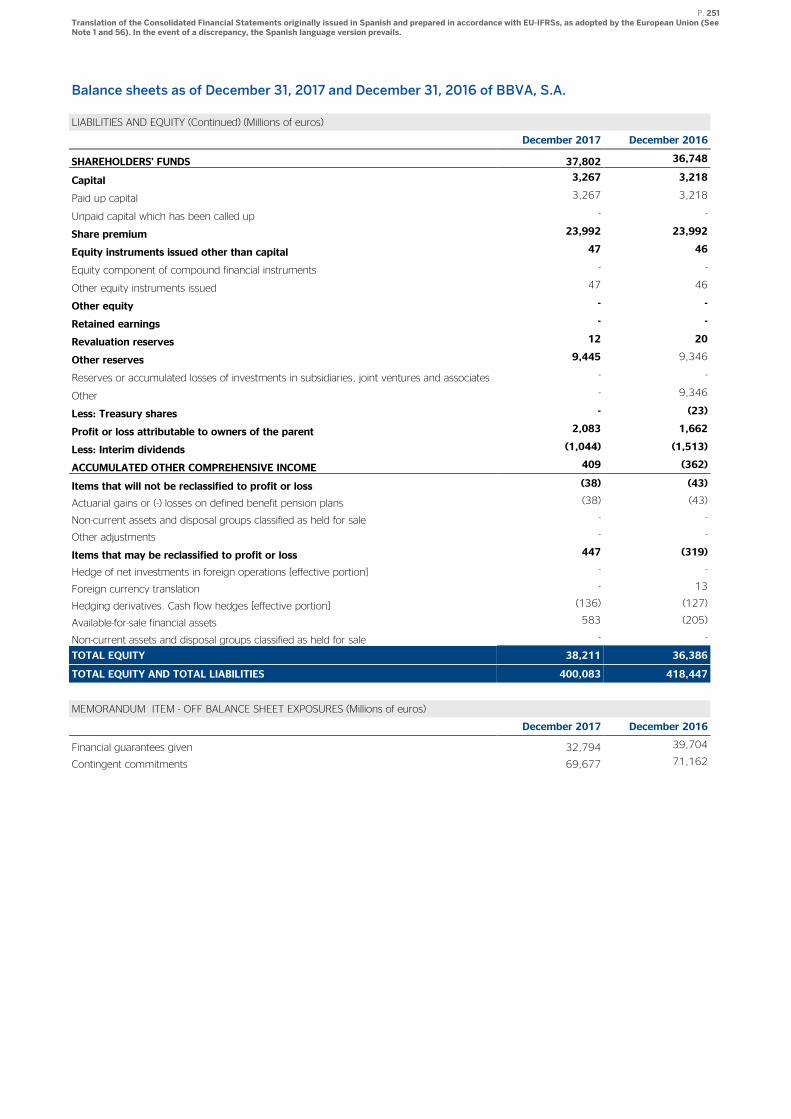
P. 251 Translation of the Consolidated Financial Statements originally issued in Spanish and prepared in accordance with EU-IFRSs, as adopted by the European Union (See Note 1 and 56). In the event of a discrepancy, the Spanish language version prevails.
Balance sheets as of December 31, 2017 and December 31, 2016 of BBVA, S.A.
LIABILITIES AND EQUITY (Continued) (Millions of euros)
December 2017 December 2016
SHAREHOLDERS’ FUNDS 37,802 36,748
Capital 3,267 3,218
Paid up capital 3,267 3,218
Unpaid capital which has been called up - -
Share premium 23,992 23,992
Equity instruments issued other than capital 47 46
Equity component of compound financial instruments - -
Other equity instruments issued 47 46
Other equity - -
Retained earnings - -
Revaluation reserves 12 20
Other reserves 9,445 9,346
Reserves or accumulated losses of investments in subsidiaries, joint ventures and associates - -
Other - 9,346
Less: Treasury shares - (23)
Profit or loss attributable to owners of the parent 2,083 1,662
Less: Interim dividends (1,044) (1,513)
ACCUMULATED OTHER COMPREHENSIVE INCOME 409 (362)
Items that will not be reclassified to profit or loss (38) (43)
Actuarial gains or (-) losses on defined benefit pension plans (38) (43)
Non-current assets and disposal groups classified as held for sale - -
Other adjustments - -
Items that may be reclassified to profit or loss 447 (319)
Hedge of net investments in foreign operations [effective portion] - -
Foreign currency translation - 13
Hedging derivatives. Cash flow hedges [effective portion] (136) (127)
Available-for-sale financial assets 583 (205)
Non-current assets and disposal groups classified as held for sale - -
TOTAL EQUITY 38,211 36,386
TOTAL EQUITY AND TOTAL LIABILITIES 400,083 418,447
MEMORANDUM ITEM - OFF BALANCE SHEET EXPOSURES (Millions of euros)
December 2017 December 2016
Financial guarantees given 32,794 39,704
Contingent commitments 69,677 71,162
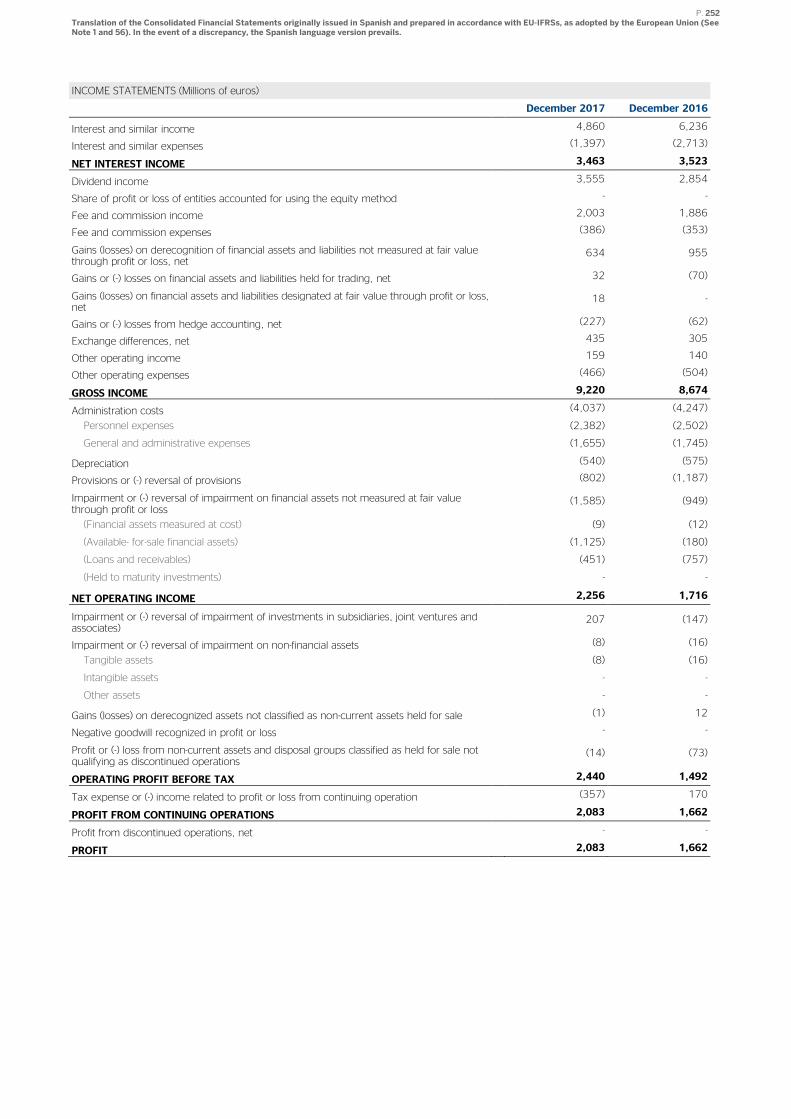
P. 252 Translation of the Consolidated Financial Statements originally issued in Spanish and prepared in accordance with EU-IFRSs, as adopted by the European Union (See Note 1 and 56). In the event of a discrepancy, the Spanish language version prevails.
INCOME STATEMENTS (Millions of euros)
December 2017 December 2016
Interest and similar income 4,860 6,236
Interest and similar expenses (1,397) (2,713)
NET INTEREST INCOME 3,463 3,523
Dividend income 3,555 2,854
Share of profit or loss of entities accounted for using the equity method - -
Fee and commission income 2,003 1,886
Fee and commission expenses (386) (353)
Gains (losses) on derecognition of financial assets and liabilities not measured at fair value through profit or loss, net
634 955
Gains or (-) losses on financial assets and liabilities held for trading, net 32 (70)
Gains (losses) on financial assets and liabilities designated at fair value through profit or loss, net
18 -
Gains or (-) losses from hedge accounting, net (227) (62)
Exchange differences, net 435 305
Other operating income 159 140
Other operating expenses (466) (504)
GROSS INCOME 9,220 8,674
Administration costs (4,037) (4,247)
Personnel expenses (2,382) (2,502)
General and administrative expenses (1,655) (1,745)
Depreciation (540) (575)
Provisions or (-) reversal of provisions (802) (1,187)
Impairment or (-) reversal of impairment on financial assets not measured at fair value through profit or loss
(1,585) (949)
(Financial assets measured at cost) (9) (12)
(Available- for-sale financial assets) (1,125) (180)
(Loans and receivables) (451) (757)
(Held to maturity investments) - -
NET OPERATING INCOME 2,256 1,716
Impairment or (-) reversal of impairment of investments in subsidiaries, joint ventures and associates)
207 (147)
Impairment or (-) reversal of impairment on non-financial assets (8) (16)
Tangible assets (8) (16)
Intangible assets - -
Other assets - -
Gains (losses) on derecognized assets not classified as non-current assets held for sale (1) 12
Negative goodwill recognized in profit or loss - -
Profit or (-) loss from non-current assets and disposal groups classified as held for sale not qualifying as discontinued operations
(14) (73)
OPERATING PROFIT BEFORE TAX 2,440 1,492
Tax expense or (-) income related to profit or loss from continuing operation (357) 170
PROFIT FROM CONTINUING OPERATIONS 2,083 1,662
Profit from discontinued operations, net - -
PROFIT 2,083 1,662
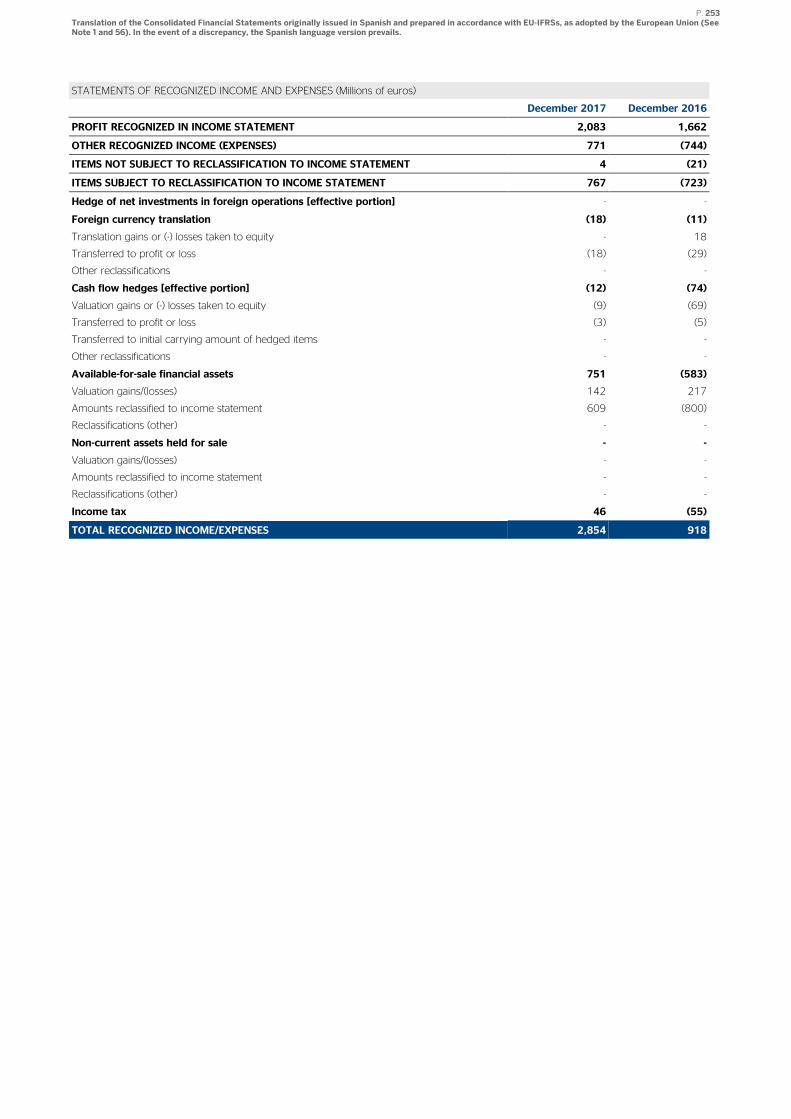
P. 253 Translation of the Consolidated Financial Statements originally issued in Spanish and prepared in accordance with EU-IFRSs, as adopted by the European Union (See Note 1 and 56). In the event of a discrepancy, the Spanish language version prevails.
STATEMENTS OF RECOGNIZED INCOME AND EXPENSES (Millions of euros)
December 2017 December 2016
PROFIT RECOGNIZED IN INCOME STATEMENT 2,083 1,662
OTHER RECOGNIZED INCOME (EXPENSES) 771 (744)
ITEMS NOT SUBJECT TO RECLASSIFICATION TO INCOME STATEMENT 4 (21)
ITEMS SUBJECT TO RECLASSIFICATION TO INCOME STATEMENT 767 (723)
Hedge of net investments in foreign operations [effective portion] - -
Foreign currency translation (18) (11)
Translation gains or (-) losses taken to equity - 18
Transferred to profit or loss (18) (29)
Other reclassifications - -
Cash flow hedges [effective portion] (12) (74)
Valuation gains or (-) losses taken to equity (9) (69)
Transferred to profit or loss (3) (5)
Transferred to initial carrying amount of hedged items - -
Other reclassifications - -
Available-for-sale financial assets 751 (583)
Valuation gains/(losses) 142 217
Amounts reclassified to income statement 609 (800)
Reclassifications (other) - -
Non-current assets held for sale - -
Valuation gains/(losses) - -
Amounts reclassified to income statement - -
Reclassifications (other) - -
Income tax 46 (55)
TOTAL RECOGNIZED INCOME/EXPENSES 2,854 918
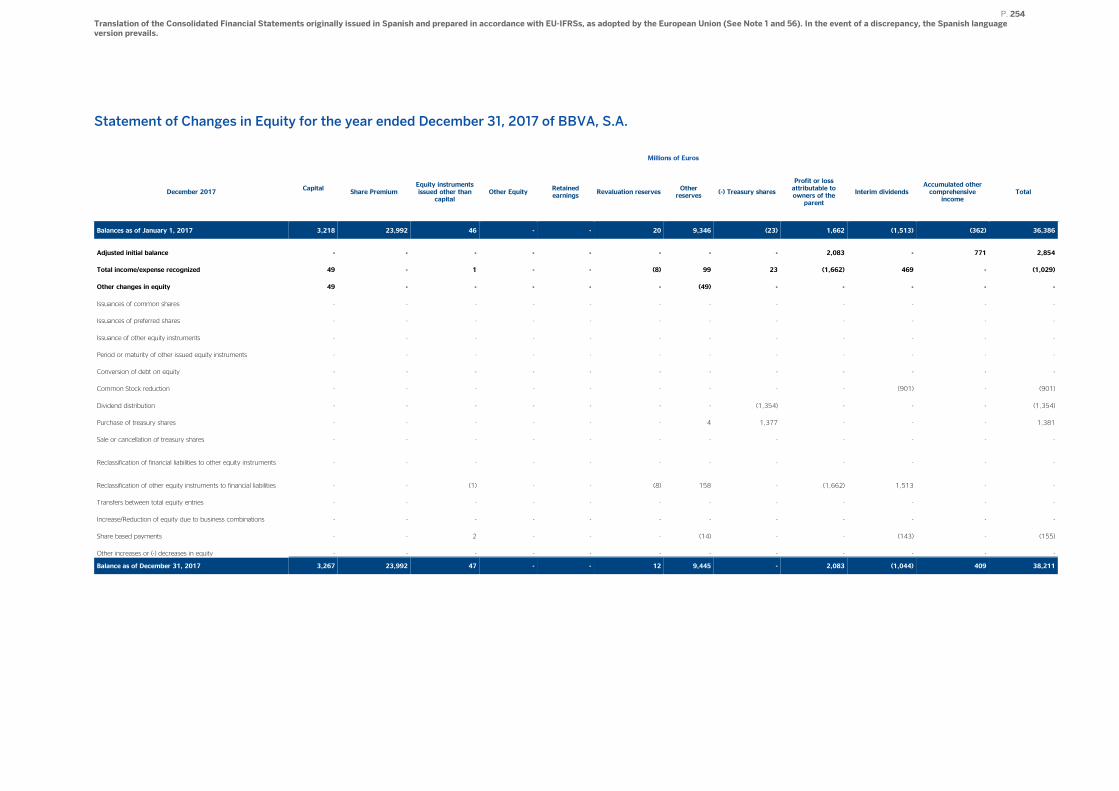
P. 254 Translation of the Consolidated Financial Statements originally issued in Spanish and prepared in accordance with EU-IFRSs, as adopted by the European Union (See Note 1 and 56). In the event of a discrepancy, the Spanish language version prevails.
Statement of Changes in Equity for the year ended December 31, 2017 of BBVA, S.A.
Millions of Euros
December 2017 Capital
Share Premium Equity instruments issued other than
capital Other Equity
Retained earnings
Revaluation reserves Other reserves
(-) Treasury shares
Profit or loss attributable to owners of the parent
Interim dividends Accumulated other comprehensive
income Total
Balances as of January 1, 2017 3,218 23,992 46 - - 20 9,346 (23) 1,662 (1,513) (362) 36,386
Adjusted initial balance - - - - - - - - 2,083 - 771 2,854
Total income/expense recognized 49 - 1 - - (8) 99 23 (1,662) 469 - (1,029)
Other changes in equity 49 - - - - - (49) - - - - -
Issuances of common shares - - - - - - - - - - - -
Issuances of preferred shares - - - - - - - - - - - -
Issuance of other equity instruments - - - - - - - - - - - -
Period or maturity of other issued equity instruments - - - - - - - - - - - -
Conversion of debt on equity - - - - - - - - - - - -
Common Stock reduction - - - - - - - - - (901) - (901)
Dividend distribution - - - - - - - (1,354) - - - (1,354)
Purchase of treasury shares - - - - - - 4 1,377 - - - 1,381
Sale or cancellation of treasury shares - - - - - - - - - - - -
Reclassification of financial liabilities to other equity instruments - - - - - - - - - - - -
Reclassification of other equity instruments to financial liabilities - - (1) - - (8) 158 - (1,662) 1,513 - -
Transfers between total equity entries - - - - - - - - - - - -
Increase/Reduction of equity due to business combinations - - - - - - - - - - - -
Share based payments - - 2 - - - (14) - - (143) - (155)
Other increases or (-) decreases in equity - - - - - - - - - - - -
Balance as of December 31, 2017 3,267 23,992 47 - - 12 9,445 - 2,083 (1,044) 409 38,211
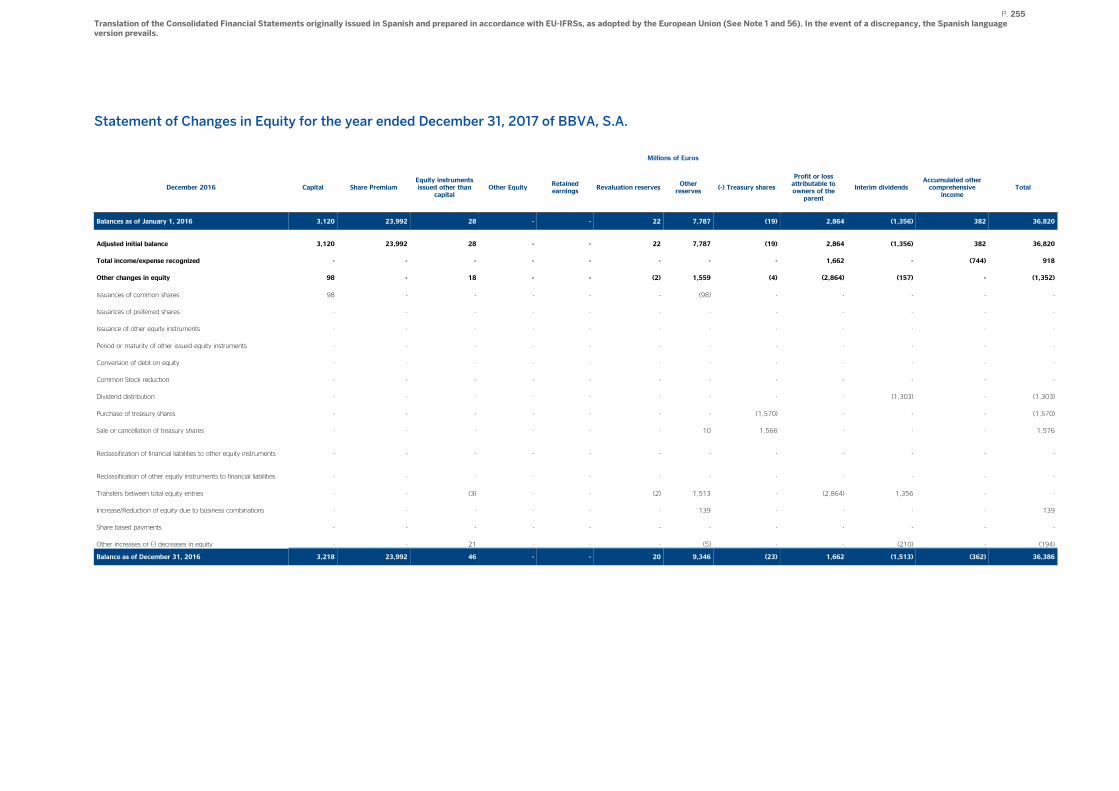
P. 255 Translation of the Consolidated Financial Statements originally issued in Spanish and prepared in accordance with EU-IFRSs, as adopted by the European Union (See Note 1 and 56). In the event of a discrepancy, the Spanish language version prevails.
Statement of Changes in Equity for the year ended December 31, 2017 of BBVA, S.A.
Millions of Euros
December 2016 Capital Share Premium Equity instruments issued other than
capital Other Equity
Retained earnings
Revaluation reserves Other reserves
(-) Treasury shares
Profit or loss attributable to owners of the parent
Interim dividends Accumulated other comprehensive
income Total
Balances as of January 1, 2016 3,120 23,992 28 - - 22 7,787 (19) 2,864 (1,356) 382 36,820
Adjusted initial balance 3,120 23,992 28 - - 22 7,787 (19) 2,864 (1,356) 382 36,820
Total income/expense recognized - - - - - - - - 1,662 - (744) 918
Other changes in equity 98 - 18 - - (2) 1,559 (4) (2,864) (157) - (1,352)
Issuances of common shares 98 - - - - - (98) - - - - -
Issuances of preferred shares - - - - - - - - - - - -
Issuance of other equity instruments - - - - - - - - - - - -
Period or maturity of other issued equity instruments - - - - - - - - - - - -
Conversion of debt on equity - - - - - - - - - - - -
Common Stock reduction - - - - - - - - - - - -
Dividend distribution - - - - - - - - - (1,303) - (1,303)
Purchase of treasury shares - - - - - - - (1,570) - - - (1,570)
Sale or cancellation of treasury shares - - - - - - 10 1,566 - - - 1,576
Reclassification of financial liabilities to other equity instruments - - - - - - - - - - - -
Reclassification of other equity instruments to financial liabilities - - - - - - - - - - - -
Transfers between total equity entries - - (3) - - (2) 1,513 - (2,864) 1,356 - -
Increase/Reduction of equity due to business combinations - - - - - - 139 - - - - 139
Share based payments - - - - - - - - - - - -
Other increases or (-) decreases in equity - - 21 - - - (5) - - (210) - (194)
Balance as of December 31, 2016 3,218 23,992 46 - - 20 9,346 (23) 1,662 (1,513) (362) 36,386
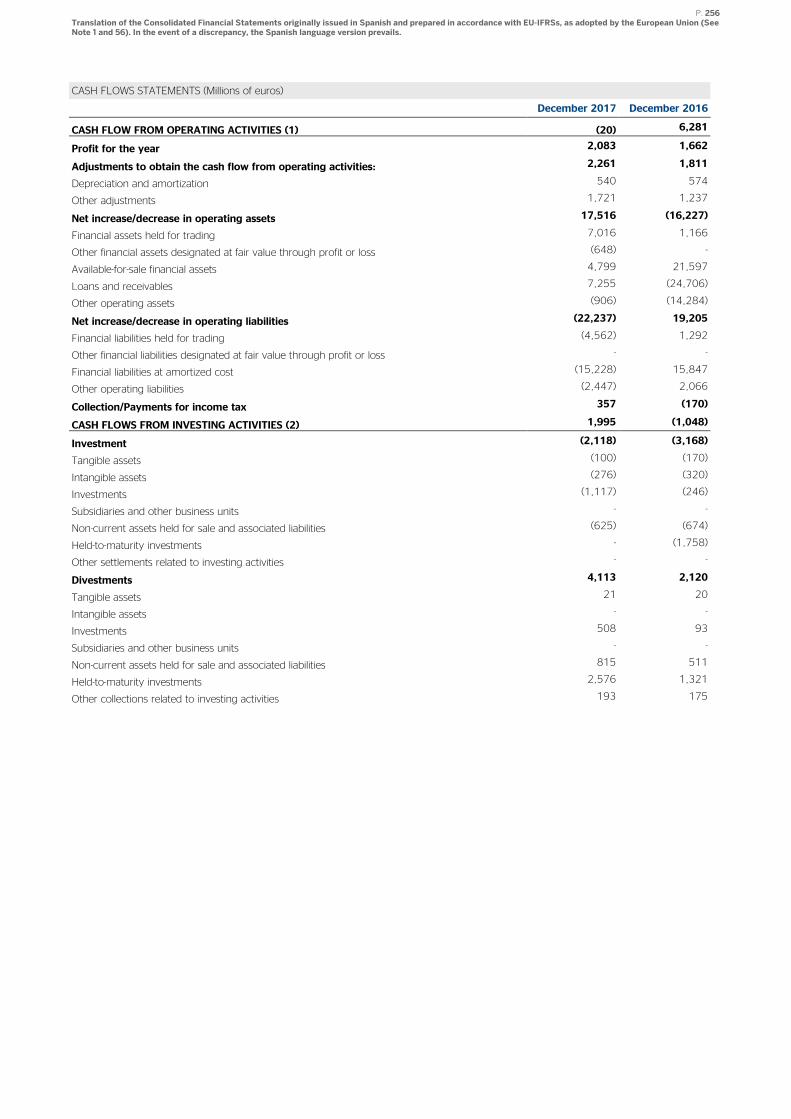
P. 256 Translation of the Consolidated Financial Statements originally issued in Spanish and prepared in accordance with EU-IFRSs, as adopted by the European Union (See Note 1 and 56). In the event of a discrepancy, the Spanish language version prevails.
CASH FLOWS STATEMENTS (Millions of euros)
December 2017 December 2016
CASH FLOW FROM OPERATING ACTIVITIES (1) (20) 6,281
Profit for the year 2,083 1,662
Adjustments to obtain the cash flow from operating activities: 2,261 1,811
Depreciation and amortization 540 574
Other adjustments 1,721 1,237
Net increase/decrease in operating assets 17,516 (16,227)
Financial assets held for trading 7,016 1,166
Other financial assets designated at fair value through profit or loss (648) -
Available-for-sale financial assets 4,799 21,597
Loans and receivables 7,255 (24,706)
Other operating assets (906) (14,284)
Net increase/decrease in operating liabilities (22,237) 19,205
Financial liabilities held for trading (4,562) 1,292
Other financial liabilities designated at fair value through profit or loss - -
Financial liabilities at amortized cost (15,228) 15,847
Other operating liabilities (2,447) 2,066
Collection/Payments for income tax 357 (170)
CASH FLOWS FROM INVESTING ACTIVITIES (2) 1,995 (1,048)
Investment (2,118) (3,168)
Tangible assets (100) (170)
Intangible assets (276) (320)
Investments (1,117) (246)
Subsidiaries and other business units - -
Non-current assets held for sale and associated liabilities (625) (674)
Held-to-maturity investments - (1,758)
Other settlements related to investing activities - -
Divestments 4,113 2,120
Tangible assets 21 20
Intangible assets - -
Investments 508 93
Subsidiaries and other business units - -
Non-current assets held for sale and associated liabilities 815 511
Held-to-maturity investments 2,576 1,321
Other collections related to investing activities 193 175
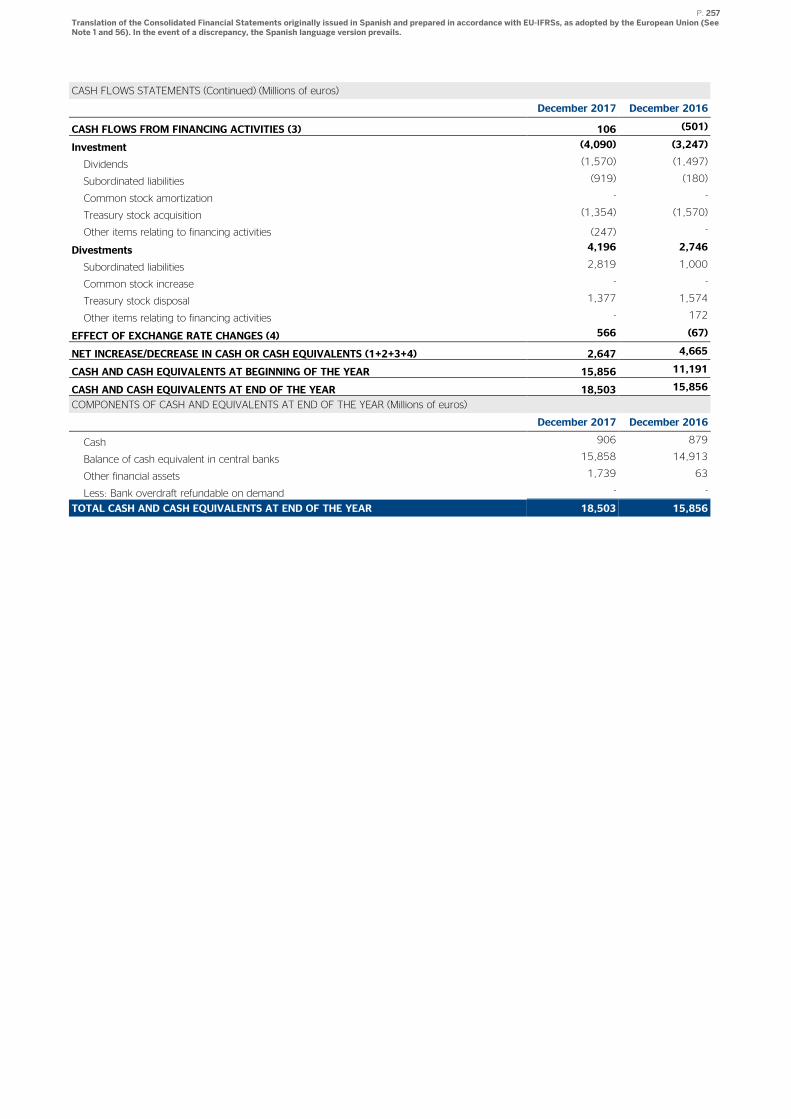
P. 257 Translation of the Consolidated Financial Statements originally issued in Spanish and prepared in accordance with EU-IFRSs, as adopted by the European Union (See Note 1 and 56). In the event of a discrepancy, the Spanish language version prevails.
CASH FLOWS STATEMENTS (Continued) (Millions of euros)
December 2017 December 2016
CASH FLOWS FROM FINANCING ACTIVITIES (3) 106 (501)
Investment (4,090) (3,247)
Dividends (1,570) (1,497)
Subordinated liabilities (919) (180)
Common stock amortization - -
Treasury stock acquisition (1,354) (1,570)
Other items relating to financing activities (247) -
Divestments 4,196 2,746
Subordinated liabilities 2,819 1,000
Common stock increase - -
Treasury stock disposal 1,377 1,574
Other items relating to financing activities - 172
EFFECT OF EXCHANGE RATE CHANGES (4) 566 (67)
NET INCREASE/DECREASE IN CASH OR CASH EQUIVALENTS (1+2+3+4) 2,647 4,665
CASH AND CASH EQUIVALENTS AT BEGINNING OF THE YEAR 15,856 11,191
CASH AND CASH EQUIVALENTS AT END OF THE YEAR 18,503 15,856
COMPONENTS OF CASH AND EQUIVALENTS AT END OF THE YEAR (Millions of euros)
December 2017 December 2016
Cash 906 879
Balance of cash equivalent in central banks 15,858 14,913
Other financial assets 1,739 63
Less: Bank overdraft refundable on demand - -
TOTAL CASH AND CASH EQUIVALENTS AT END OF THE YEAR 18,503 15,856
P. 258 Translation of the Consolidated Financial Statements originally issued in Spanish and prepared in accordance with EU-IFRSs, as adopted by the European Union (See Note 1 and 56). In the event of a discrepancy, the Spanish language version prevails.
APPENDIX X Information on data derived from the special accounting registry
a) Mortgage market policies and procedures
Information required pursuant to Circular 5/2011 of the Bank of Spain is indicated as follows.
The Bank has express policies and procedures in place regarding its activities in the mortgage market, which
provide for full compliance with applicable regulations.
The mortgage origination policy is based in principles focused on assessing the adequate ratio between the
amount of the loan, and the payments, and the income of the applicant. Applicants must in all cases prove
sufficient repayment ability (present and future) to meet their repayment obligations, for both the mortgage
debt and for other debts detected in the financial system. Therefore, the applicant’s repayment ability is a
key aspect within the credit decision-making tools and retail risk acceptance manuals, and has a high
weighting in the final decision.
During the mortgage risk transaction analysis process, documentation supporting the applicant’s income
(payroll, etc.) is required, and the applicant’s position in the financial system is checked through automated
database queries (internal and external). This information is used for calculation purposes in order to
determine the level of indebtedness/compliance with the remainder of the system. This documentation is
kept in the transaction’s file.
In addition, the mortgage origination policy assesses the adequate ratio between the amount of the loan and
the appraisal value of the mortgaged asset. The policy also establishes that the property to be mortgaged be
appraised by an independent appraisal company as established by Circular 3/2010 and Circular 4/2016.
BBVA selects those companies whose reputation, standing in the market and independence ensure that
their appraisals adapt to the market reality in each region. Each appraisal is reviewed and checked before the
loan is granted and, in those cases where the loan is finally granted, it is kept in the transaction’s file.
As for issues related to the mortgage market, the Finance area annually defines the strategy for wholesale
finance issues, and more specifically mortgage bond issues, such as mortgage covered bonds or mortgage
securitization. The Assets and Liabilities Committee tracks the budget monthly. The volume and type of
assets in these transactions is determined in accordance with the wholesale finance plan, the trend of the
Bank’s “Loans and receivables” outstanding balances and the conditions in the market.
The Board of Directors of the Bank authorizes each of the issues of Mortgage Transfer Certificates and/or
Mortgage Participations issued by BBVA to securitize the credit rights derived from loans and mortgage
loans, Likewise, the Board of Directors authorizes the establishment of a Base Prospectus for the issuance of
fixed-income securities through which the mortgage-covered bonds are implemented.
As established in article 24 of Royal Decree 716/2009, of April, 24, by virtue of which certain aspects of Law
2/1981, of 25 March, of regulation of the mortgage market and other rules of the mortgage and financial
system are developed, “the volume of outstanding mortgage-covered bonds issued by a bank may not exceed
80% of a calculation base determined by adding the outstanding principal of all the loans and mortgage loans
in the bank’s portfolio that are eligible” and which are not covered by the issue of Mortgage Bonds, Mortgage
Participations or Mortgage Transfer Certificates. For these purposes, in accordance with the aforementioned
Royal Decree 716/2009, in order to be eligible, loans and mortgage loans, on a general basis: (i) must be
secured by a first mortgage on the freehold; (ii) the loan’s amount may not exceed 80% of the appraisal
value for residential mortgages, and 60% for other mortgage lending; (iii) must be established on assets
exclusively and wholly owned by the mortgagor; (iv) must have been appraised by an independent appraisal

P. 259 Translation of the Consolidated Financial Statements originally issued in Spanish and prepared in accordance with EU-IFRSs, as adopted by the European Union (See Note 1 and 56). In the event of a discrepancy, the Spanish language version prevails.
company unrelated to the Group and authorized by the Bank of Spain; and (v) the mortgaged property must
be covered at least by a current damage insurance policy.
The Bank has set up a series of controls for mortgage covered bonds, which regularly control the total
volume of issued mortgage covered bonds issued and the remaining eligible collateral, to avoid exceeding
the maximum limit set by Royal Decree 716/2009, and outlined in the preceding paragraph. In the case of
securitizations, the preliminary portfolio of loans and mortgage loans to be securitized is checked according
to an agreed procedures engagement, by the Bank’s external auditor as required by the Spanish Securities
and Exchange Commission. There is also a series of filters through which some mortgage loans and credits
are excluded in accordance with legal, commercial and risk concentration criteria.
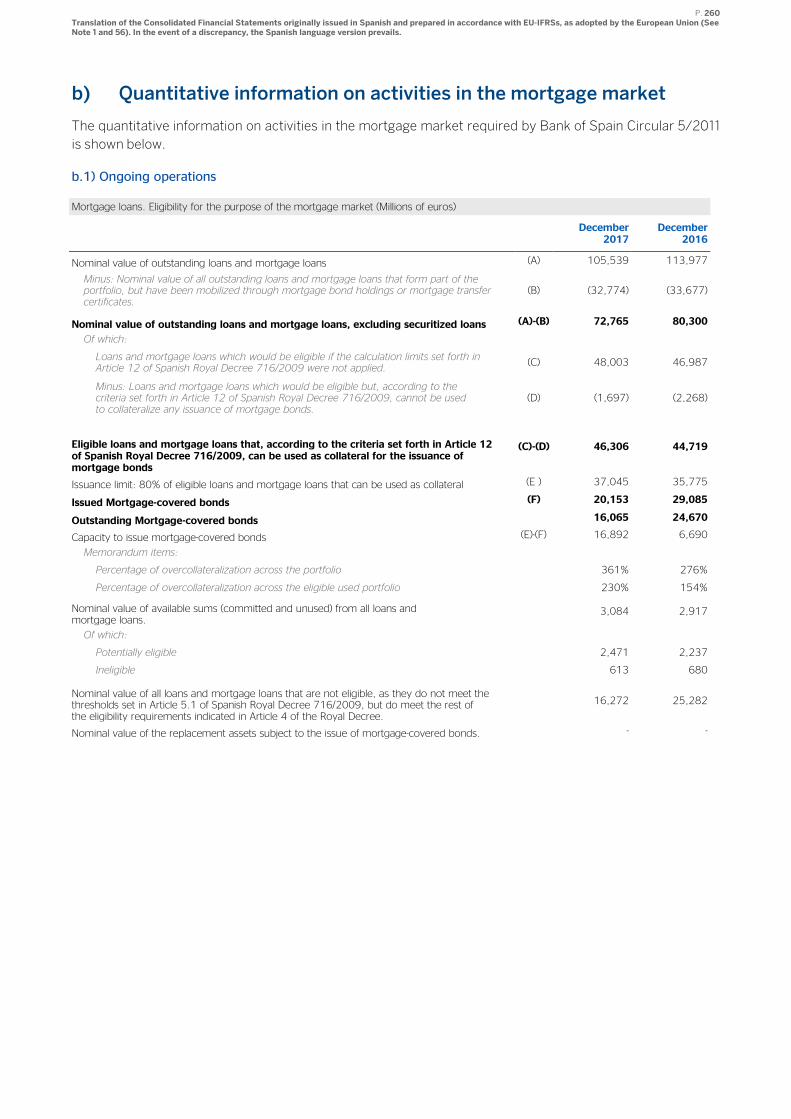
P. 260 Translation of the Consolidated Financial Statements originally issued in Spanish and prepared in accordance with EU-IFRSs, as adopted by the European Union (See Note 1 and 56). In the event of a discrepancy, the Spanish language version prevails.
b) Quantitative information on activities in the mortgage market
The quantitative information on activities in the mortgage market required by Bank of Spain Circular 5/2011
is shown below.
b.1) Ongoing operations
Mortgage loans. Eligibility for the purpose of the mortgage market (Millions of euros)
December
2017 December
2016
Nominal value of outstanding loans and mortgage loans (A) 105,539 113,977
Minus: Nominal value of all outstanding loans and mortgage loans that form part of the portfolio, but have been mobilized through mortgage bond holdings or mortgage transfer certificates.
(B) (32,774) (33,677)
Nominal value of outstanding loans and mortgage loans, excluding securitized loans (A)-(B) 72,765 80,300
Of which:
Loans and mortgage loans which would be eligible if the calculation limits set forth in Article 12 of Spanish Royal Decree 716/2009 were not applied.
(C) 48,003 46,987
Minus: Loans and mortgage loans which would be eligible but, according to the criteria set forth in Article 12 of Spanish Royal Decree 716/2009, cannot be used to collateralize any issuance of mortgage bonds.
(D) (1,697) (2,268)
Eligible loans and mortgage loans that, according to the criteria set forth in Article 12 of Spanish Royal Decree 716/2009, can be used as collateral for the issuance of mortgage bonds
(C)-(D) 46,306 44,719
Issuance limit: 80% of eligible loans and mortgage loans that can be used as collateral (E ) 37,045 35,775
Issued Mortgage-covered bonds (F) 20,153 29,085
Outstanding Mortgage-covered bonds 16,065 24,670
Capacity to issue mortgage-covered bonds (E)-(F) 16,892 6,690
Memorandum items:
Percentage of overcollateralization across the portfolio 361% 276%
Percentage of overcollateralization across the eligible used portfolio 230% 154%
Nominal value of available sums (committed and unused) from all loans and mortgage loans.
3,084 2,917
Of which:
Potentially eligible 2,471 2,237
Ineligible 613 680
Nominal value of all loans and mortgage loans that are not eligible, as they do not meet the thresholds set in Article 5.1 of Spanish Royal Decree 716/2009, but do meet the rest of the eligibility requirements indicated in Article 4 of the Royal Decree.
16,272 25,282
Nominal value of the replacement assets subject to the issue of mortgage-covered bonds. - -
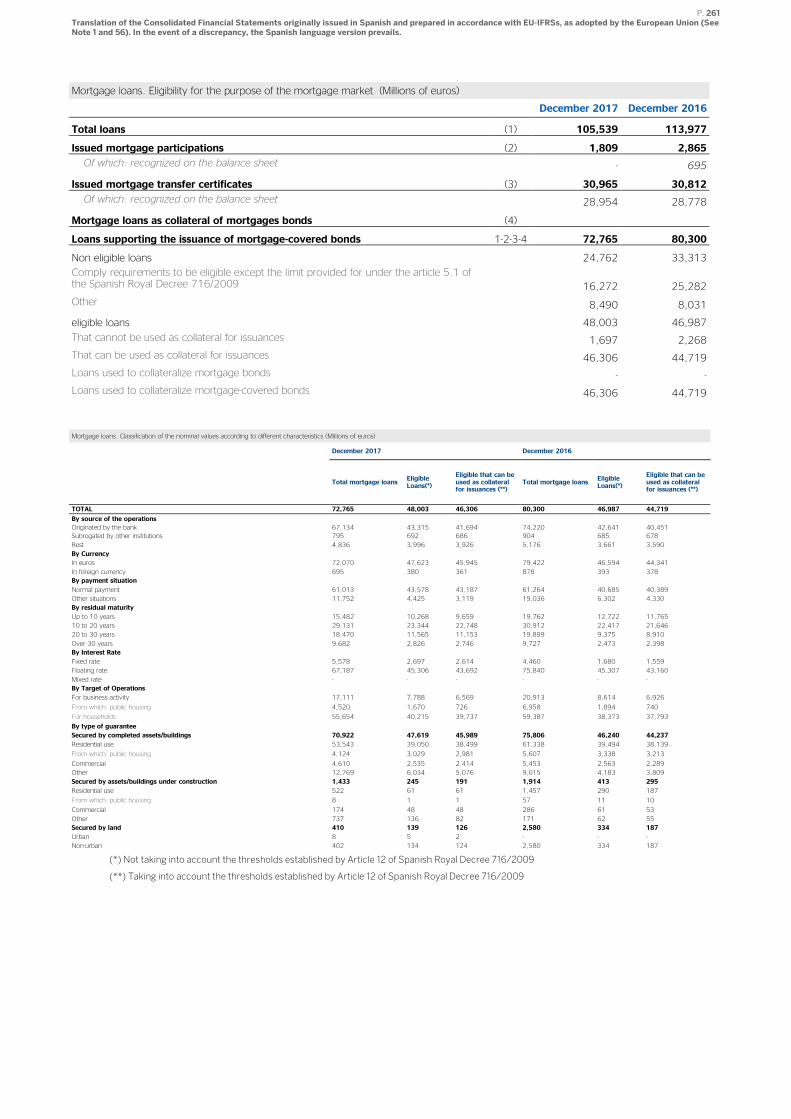
P. 261 Translation of the Consolidated Financial Statements originally issued in Spanish and prepared in accordance with EU-IFRSs, as adopted by the European Union (See Note 1 and 56). In the event of a discrepancy, the Spanish language version prevails.
Mortgage loans. Eligibility for the purpose of the mortgage market (Millions of euros)
December 2017 December 2016
Total loans (1) 105,539 113,977
Issued mortgage participations (2) 1,809 2,865
Of which: recognized on the balance sheet - 695
Issued mortgage transfer certificates (3) 30,965 30,812
Of which: recognized on the balance sheet 28,954 28,778
Mortgage loans as collateral of mortgages bonds (4)
Loans supporting the issuance of mortgage-covered bonds 1-2-3-4 72,765 80,300
Non eligible loans 24,762 33,313
Comply requirements to be eligible except the limit provided for under the article 5.1 of the Spanish Royal Decree 716/2009 16,272 25,282
Other 8,490 8,031
eligible loans 48,003 46,987
That cannot be used as collateral for issuances 1,697 2,268
That can be used as collateral for issuances 46,306 44,719
Loans used to collateralize mortgage bonds - -
Loans used to collateralize mortgage-covered bonds 46,306 44,719
Mortgage loans. Classification of the nominal values according to different characteristics (Millions of euros)
December 2017 December 2016
Total mortgage loans Eligible Loans(*)
Eligible that can be used as collateral for issuances (**)
Total mortgage loans Eligible Loans(*)
Eligible that can be used as collateral for issuances (**)
TOTAL 72,765 48,003 46,306 80,300 46,987 44,719
By source of the operations
Originated by the bank 67,134 43,315 41,694 74,220 42,641 40,451
Subrogated by other institutions 795 692 686 904 685 678
Rest 4,836 3,996 3,926 5,176 3,661 3,590
By Currency
In euros 72,070 47,623 45,945 79,422 46,594 44,341
In foreign currency 695 380 361 878 393 378
By payment situation
Normal payment 61,013 43,578 43,187 61,264 40,685 40,389
Other situations 11,752 4,425 3,119 19,036 6,302 4,330
By residual maturity
Up to 10 years 15,482 10,268 9,659 19,762 12,722 11,765
10 to 20 years 29,131 23,344 22,748 30,912 22,417 21,646
20 to 30 years 18,470 11,565 11,153 19,899 9,375 8,910
Over 30 years 9,682 2,826 2,746 9,727 2,473 2,398
By Interest Rate
Fixed rate 5,578 2,697 2,614 4,460 1,680 1,559
Floating rate 67,187 45,306 43,692 75,840 45,307 43,160
Mixed rate - - - - - -
By Target of Operations
For business activity 17,111 7,788 6,569 20,913 8,614 6,926
From which: public housing 4,520 1,670 726 6,958 1,894 740
For households 55,654 40,215 39,737 59,387 38,373 37,793
By type of guarantee
Secured by completed assets/buildings 70,922 47,619 45,989 75,806 46,240 44,237
Residential use 53,543 39,050 38,499 61,338 39,494 38,139
From which: public housing 4,124 3,029 2,981 5,607 3,338 3,213
Commercial 4,610 2,535 2,414 5,453 2,563 2,289
Other 12,769 6,034 5,076 9,015 4,183 3,809
Secured by assets/buildings under construction 1,433 245 191 1,914 413 295
Residential use 522 61 61 1,457 290 187
From which: public housing 8 1 1 57 11 10
Commercial 174 48 48 286 61 53
Other 737 136 82 171 62 55
Secured by land 410 139 126 2,580 334 187
Urban 8 5 2 - - -
Non-urban 402 134 124 2,580 334 187
(*) Not taking into account the thresholds established by Article 12 of Spanish Royal Decree 716/2009
(**) Taking into account the thresholds established by Article 12 of Spanish Royal Decree 716/2009
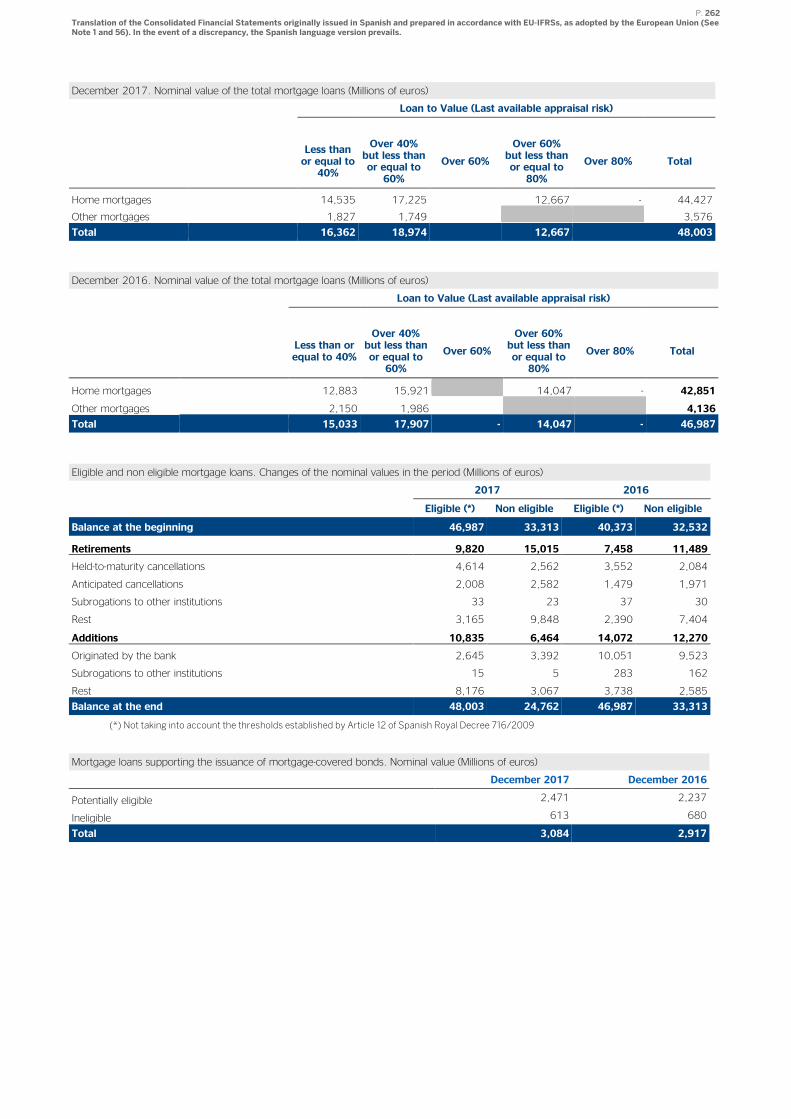
P. 262 Translation of the Consolidated Financial Statements originally issued in Spanish and prepared in accordance with EU-IFRSs, as adopted by the European Union (See Note 1 and 56). In the event of a discrepancy, the Spanish language version prevails.
December 2017. Nominal value of the total mortgage loans (Millions of euros)
Loan to Value (Last available appraisal risk)
Less than or equal to 40%
Over 40% but less than or equal to 60%
Over 60%
Over 60% but less than or equal to 80%
Over 80% Total
Home mortgages 14,535 17,225 12,667 - 44,427
Other mortgages 1,827 1,749 3,576
Total 16,362 18,974 12,667 48,003
December 2016. Nominal value of the total mortgage loans (Millions of euros)
Loan to Value (Last available appraisal risk)
Less than or equal to 40%
Over 40% but less than or equal to 60%
Over 60%
Over 60% but less than or equal to 80%
Over 80% Total
Home mortgages 12,883 15,921 14,047 - 42,851
Other mortgages 2,150 1,986 4,136
Total 15,033 17,907 - 14,047 - 46,987
Eligible and non eligible mortgage loans. Changes of the nominal values in the period (Millions of euros)
2017 2016
Eligible (*) Non eligible Eligible (*) Non eligible
Balance at the beginning 46,987 33,313 40,373 32,532
Retirements 9,820 15,015 7,458 11,489
Held-to-maturity cancellations 4,614 2,562 3,552 2,084
Anticipated cancellations 2,008 2,582 1,479 1,971
Subrogations to other institutions 33 23 37 30
Rest 3,165 9,848 2,390 7,404
Additions 10,835 6,464 14,072 12,270
Originated by the bank 2,645 3,392 10,051 9,523
Subrogations to other institutions 15 5 283 162
Rest 8,176 3,067 3,738 2,585
Balance at the end 48,003 24,762 46,987 33,313
(*) Not taking into account the thresholds established by Article 12 of Spanish Royal Decree 716/2009
Mortgage loans supporting the issuance of mortgage-covered bonds. Nominal value (Millions of euros)
December 2017 December 2016
Potentially eligible 2,471 2,237
Ineligible 613 680
Total 3,084 2,917
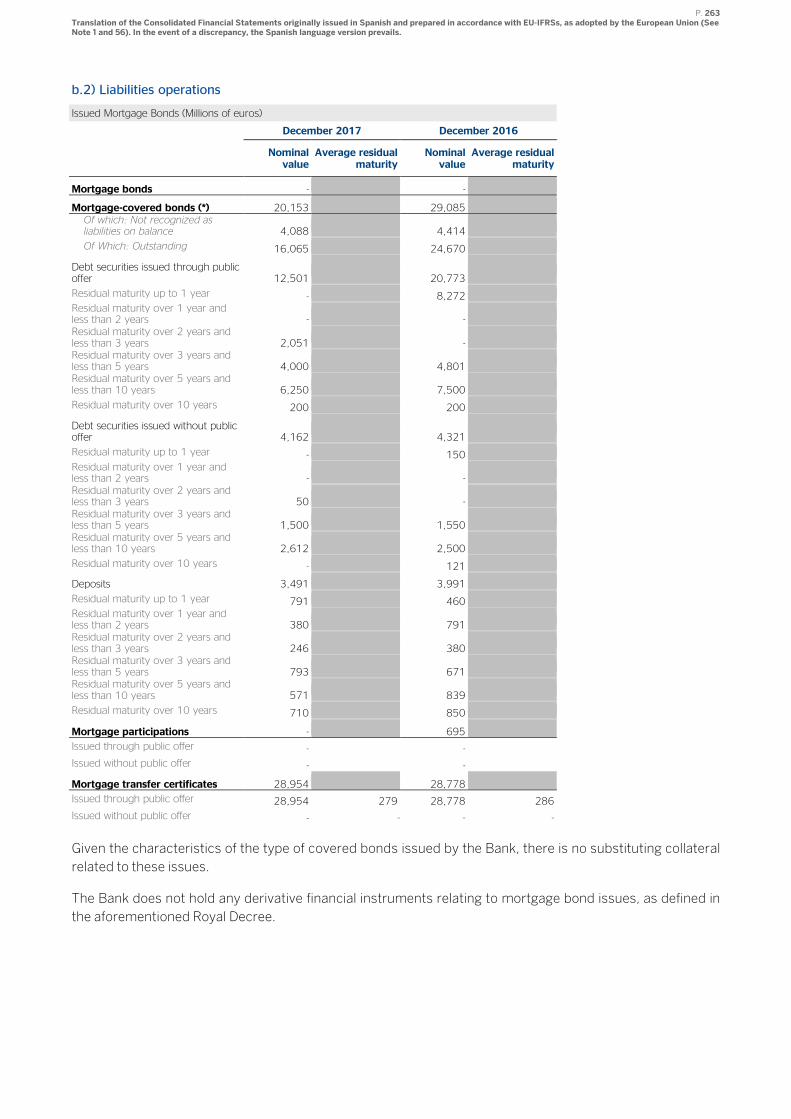
P. 263 Translation of the Consolidated Financial Statements originally issued in Spanish and prepared in accordance with EU-IFRSs, as adopted by the European Union (See Note 1 and 56). In the event of a discrepancy, the Spanish language version prevails.
b.2) Liabilities operations
Issued Mortgage Bonds (Millions of euros)
December 2017 December 2016
Nominal value
Average residual maturity
Nominal value
Average residual maturity
Mortgage bonds - -
Mortgage-covered bonds (*) 20,153 29,085 Of which: Not recognized as liabilities on balance 4,088 4,414
Of Which: Outstanding 16,065 24,670
Debt securities issued through public offer 12,501
20,773
Residual maturity up to 1 year - 8,272
Residual maturity over 1 year and less than 2 years -
-
Residual maturity over 2 years and less than 3 years 2,051
-
Residual maturity over 3 years and less than 5 years 4,000
4,801
Residual maturity over 5 years and less than 10 years 6,250
7,500
Residual maturity over 10 years 200 200
Debt securities issued without public offer 4,162
4,321
Residual maturity up to 1 year - 150
Residual maturity over 1 year and less than 2 years -
-
Residual maturity over 2 years and less than 3 years 50
-
Residual maturity over 3 years and less than 5 years 1,500
1,550
Residual maturity over 5 years and less than 10 years 2,612
2,500
Residual maturity over 10 years - 121
Deposits 3,491 3,991
Residual maturity up to 1 year 791 460
Residual maturity over 1 year and less than 2 years 380
791
Residual maturity over 2 years and less than 3 years 246
380
Residual maturity over 3 years and less than 5 years 793
671
Residual maturity over 5 years and less than 10 years 571
839
Residual maturity over 10 years 710 850
Mortgage participations - 695 196
Issued through public offer - -
Issued without public offer - -
Mortgage transfer certificates 28,954 28,778 286
Issued through public offer 28,954 279 28,778 286
Issued without public offer - - - -
Given the characteristics of the type of covered bonds issued by the Bank, there is no substituting collateral
related to these issues.
The Bank does not hold any derivative financial instruments relating to mortgage bond issues, as defined in
the aforementioned Royal Decree.
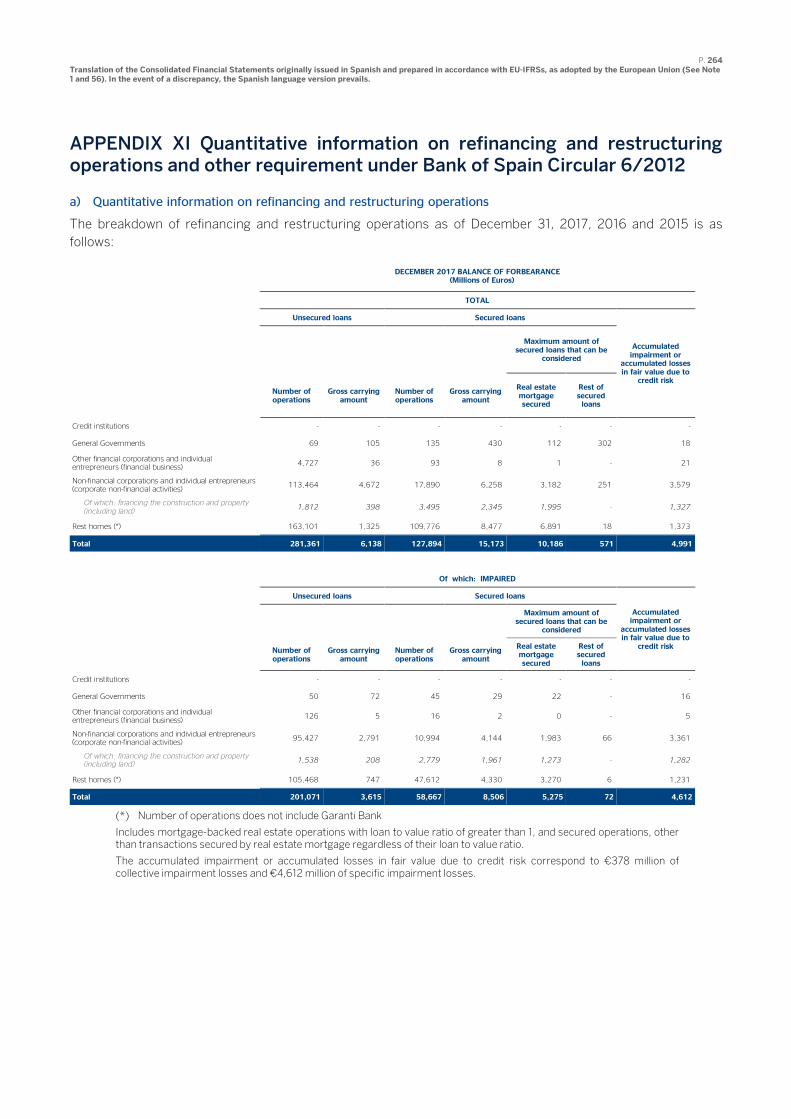
P. 264 Translation of the Consolidated Financial Statements originally issued in Spanish and prepared in accordance with EU-IFRSs, as adopted by the European Union (See Note 1 and 56). In the event of a discrepancy, the Spanish language version prevails.
APPENDIX XI Quantitative information on refinancing and restructuring operations and other requirement under Bank of Spain Circular 6/2012
a) Quantitative information on refinancing and restructuring operations
The breakdown of refinancing and restructuring operations as of December 31, 2017, 2016 and 2015 is as
follows:
DECEMBER 2017 BALANCE OF FORBEARANCE
(Millions of Euros)
TOTAL
Unsecured loans Secured loans
Accumulated impairment or
accumulated losses in fair value due to
credit risk
Maximum amount of secured loans that can be
considered
Number of operations
Gross carrying amount
Number of operations
Gross carrying amount
Real estate mortgage secured
Rest of secured loans
Credit institutions - - - - - - -
General Governments 69 105 135 430 112 302 18
Other financial corporations and individual entrepreneurs (financial business)
4,727 36 93 8 1 - 21
Non-financial corporations and individual entrepreneurs (corporate non-financial activities)
113,464 4,672 17,890 6,258 3,182 251 3,579
Of which: financing the construction and property (including land)
1,812 398 3,495 2,345 1,995 - 1,327
Rest homes (*) 163,101 1,325 109,776 8,477 6,891 18 1,373
Total 281,361 6,138 127,894 15,173 10,186 571 4,991
Of which: IMPAIRED
Unsecured loans Secured loans
Accumulated impairment or
accumulated losses in fair value due to
credit risk
Maximum amount of secured loans that can be
considered
Number of operations
Gross carrying amount
Number of operations
Gross carrying amount
Real estate mortgage secured
Rest of secured loans
Credit institutions - - - - - - -
General Governments 50 72 45 29 22 - 16
Other financial corporations and individual entrepreneurs (financial business)
126 5 16 2 0 - 5
Non-financial corporations and individual entrepreneurs (corporate non-financial activities)
95,427 2,791 10,994 4,144 1,983 66 3,361
Of which: financing the construction and property (including land)
1,538 208 2,779 1,961 1,273 - 1,282
Rest homes (*) 105,468 747 47,612 4,330 3,270 6 1,231
Total 201,071 3,615 58,667 8,506 5,275 72 4,612
(*) Number of operations does not include Garanti Bank
Includes mortgage-backed real estate operations with loan to value ratio of greater than 1, and secured operations, other than transactions secured by real estate mortgage regardless of their loan to value ratio.
The accumulated impairment or accumulated losses in fair value due to credit risk correspond to €378 million of collective impairment losses and €4,612 million of specific impairment losses.
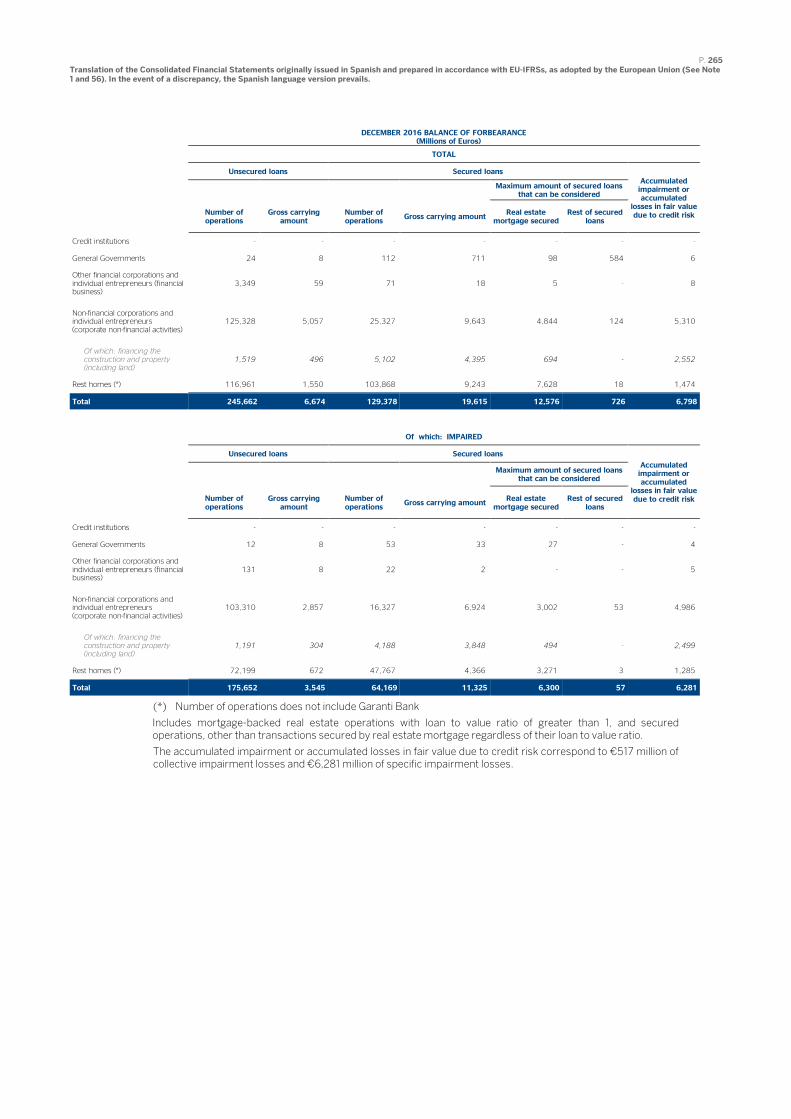
P. 265 Translation of the Consolidated Financial Statements originally issued in Spanish and prepared in accordance with EU-IFRSs, as adopted by the European Union (See Note 1 and 56). In the event of a discrepancy, the Spanish language version prevails.
DECEMBER 2016 BALANCE OF FORBEARANCE
(Millions of Euros)
TOTAL
Unsecured loans Secured loans
Accumulated impairment or accumulated
losses in fair value due to credit risk
Maximum amount of secured loans
that can be considered
Number of operations
Gross carrying amount
Number of operations
Gross carrying amount Real estate
mortgage secured Rest of secured
loans
Credit institutions - - - - - - -
General Governments 24 8 112 711 98 584 6
Other financial corporations and individual entrepreneurs (financial business)
3,349 59 71 18 5 - 8
Non-financial corporations and individual entrepreneurs (corporate non-financial activities)
125,328 5,057 25,327 9,643 4,844 124 5,310
Of which: financing the construction and property (including land)
1,519 496 5,102 4,395 694 - 2,552
Rest homes (*) 116,961 1,550 103,868 9,243 7,628 18 1,474
Total 245,662 6,674 129,378 19,615 12,576 726 6,798
Of which: IMPAIRED
Unsecured loans Secured loans
Accumulated impairment or accumulated
losses in fair value due to credit risk
Maximum amount of secured loans that can be considered
Number of operations
Gross carrying amount
Number of operations
Gross carrying amount Real estate
mortgage secured Rest of secured
loans
Credit institutions - - - - - - -
General Governments 12 8 53 33 27 - 4
Other financial corporations and individual entrepreneurs (financial business)
131 8 22 2 - - 5
Non-financial corporations and individual entrepreneurs (corporate non-financial activities)
103,310 2,857 16,327 6,924 3,002 53 4,986
Of which: financing the construction and property (including land)
1,191 304 4,188 3,848 494 - 2,499
Rest homes (*) 72,199 672 47,767 4,366 3,271 3 1,285
Total 175,652 3,545 64,169 11,325 6,300 57 6,281
(*) Number of operations does not include Garanti Bank
Includes mortgage-backed real estate operations with loan to value ratio of greater than 1, and secured operations, other than transactions secured by real estate mortgage regardless of their loan to value ratio.
The accumulated impairment or accumulated losses in fair value due to credit risk correspond to €517 million of collective impairment losses and €6,281 million of specific impairment losses.
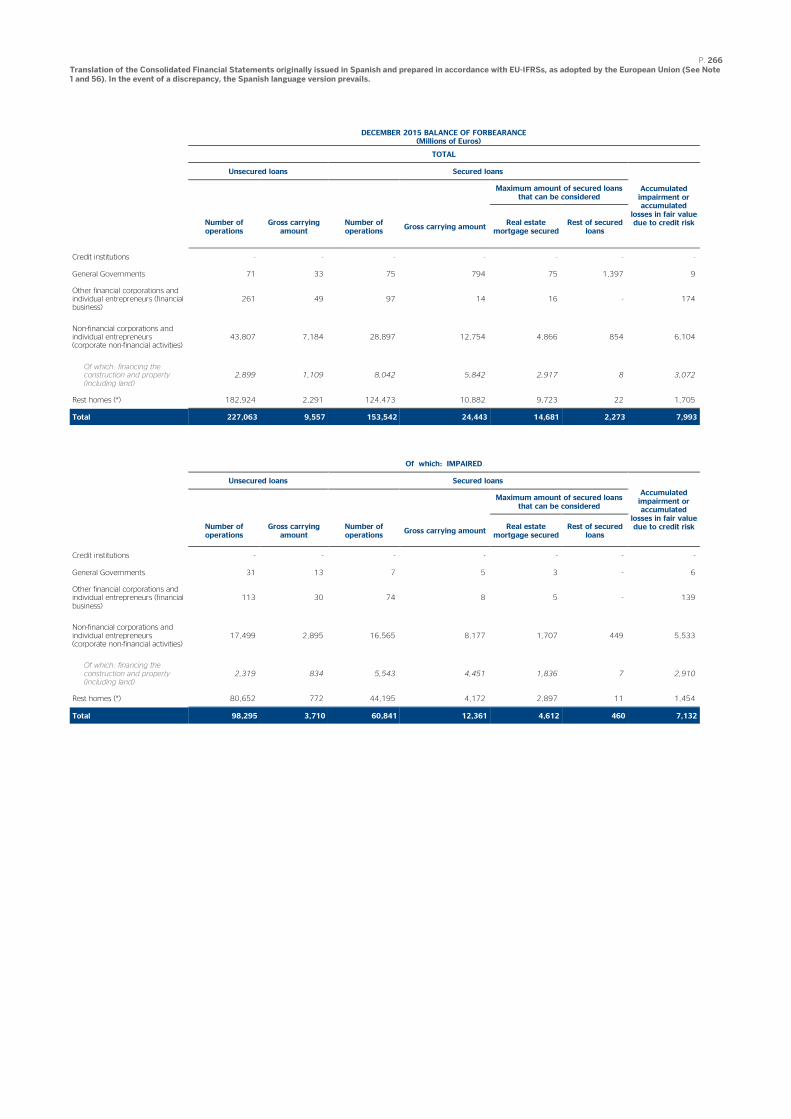
P. 266 Translation of the Consolidated Financial Statements originally issued in Spanish and prepared in accordance with EU-IFRSs, as adopted by the European Union (See Note 1 and 56). In the event of a discrepancy, the Spanish language version prevails.
DECEMBER 2015 BALANCE OF FORBEARANCE
(Millions of Euros)
TOTAL
Unsecured loans Secured loans
Accumulated impairment or accumulated
losses in fair value due to credit risk
Maximum amount of secured loans that can be considered
Number of operations
Gross carrying amount
Number of operations
Gross carrying amount Real estate
mortgage secured Rest of secured
loans
Credit institutions - - - - - - -
General Governments 71 33 75 794 75 1,397 9
Other financial corporations and individual entrepreneurs (financial business)
261 49 97 14 16 - 174
Non-financial corporations and individual entrepreneurs (corporate non-financial activities)
43,807 7,184 28,897 12,754 4,866 854 6,104
Of which: financing the construction and property (including land)
2,899 1,109 8,042 5,842 2,917 8 3,072
Rest homes (*) 182,924 2,291 124,473 10,882 9,723 22 1,705
Total 227,063 9,557 153,542 24,443 14,681 2,273 7,993
Of which: IMPAIRED
Unsecured loans Secured loans
Accumulated impairment or accumulated
losses in fair value due to credit risk
Maximum amount of secured loans that can be considered
Number of operations
Gross carrying amount
Number of operations
Gross carrying amount Real estate
mortgage secured Rest of secured
loans
Credit institutions - - - - - - -
General Governments 31 13 7 5 3 - 6
Other financial corporations and individual entrepreneurs (financial business)
113 30 74 8 5 - 139
Non-financial corporations and individual entrepreneurs (corporate non-financial activities)
17,499 2,895 16,565 8,177 1,707 449 5,533
Of which: financing the construction and property (including land)
2,319 834 5,543 4,451 1,836 7 2,910
Rest homes (*) 80,652 772 44,195 4,172 2,897 11 1,454
Total 98,295 3,710 60,841 12,361 4,612 460 7,132
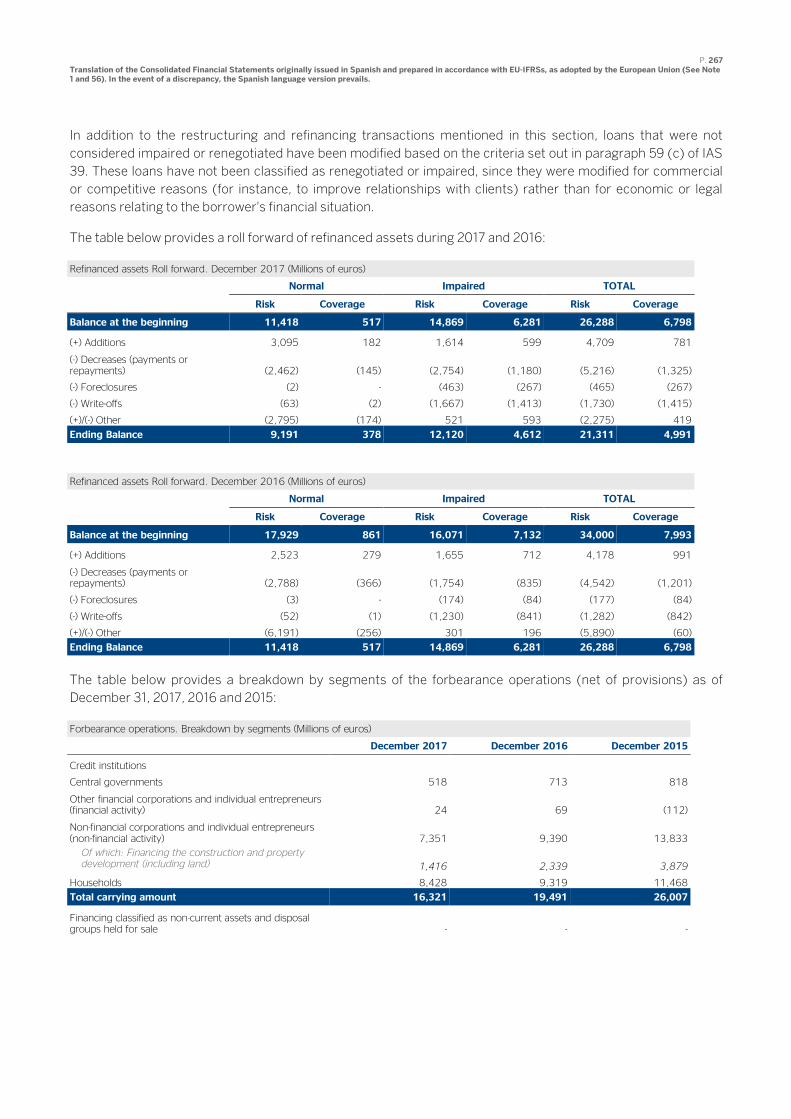
P. 267 Translation of the Consolidated Financial Statements originally issued in Spanish and prepared in accordance with EU-IFRSs, as adopted by the European Union (See Note 1 and 56). In the event of a discrepancy, the Spanish language version prevails.
In addition to the restructuring and refinancing transactions mentioned in this section, loans that were not
considered impaired or renegotiated have been modified based on the criteria set out in paragraph 59 (c) of IAS
39. These loans have not been classified as renegotiated or impaired, since they were modified for commercial
or competitive reasons (for instance, to improve relationships with clients) rather than for economic or legal
reasons relating to the borrower's financial situation.
The table below provides a roll forward of refinanced assets during 2017 and 2016:
Refinanced assets Roll forward. December 2017 (Millions of euros)
Normal Impaired TOTAL
Risk Coverage Risk Coverage Risk Coverage
Balance at the beginning 11,418 517 14,869 6,281 26,288 6,798
(+) Additions 3,095 182 1,614 599 4,709 781
(-) Decreases (payments or repayments) (2,462) (145) (2,754) (1,180) (5,216) (1,325)
(-) Foreclosures (2) - (463) (267) (465) (267)
(-) Write-offs (63) (2) (1,667) (1,413) (1,730) (1,415)
(+)/(-) Other (2,795) (174) 521 593 (2,275) 419
Ending Balance 9,191 378 12,120 4,612 21,311 4,991
Refinanced assets Roll forward. December 2016 (Millions of euros)
Normal Impaired TOTAL
Risk Coverage Risk Coverage Risk Coverage
Balance at the beginning 17,929 861 16,071 7,132 34,000 7,993
(+) Additions 2,523 279 1,655 712 4,178 991
(-) Decreases (payments or repayments) (2,788) (366) (1,754) (835) (4,542) (1,201)
(-) Foreclosures (3) - (174) (84) (177) (84)
(-) Write-offs (52) (1) (1,230) (841) (1,282) (842)
(+)/(-) Other (6,191) (256) 301 196 (5,890) (60)
Ending Balance 11,418 517 14,869 6,281 26,288 6,798
The table below provides a breakdown by segments of the forbearance operations (net of provisions) as of
December 31, 2017, 2016 and 2015:
Forbearance operations. Breakdown by segments (Millions of euros)
December 2017 December 2016 December 2015
Credit institutions
Central governments 518 713 818
Other financial corporations and individual entrepreneurs (financial activity) 24 69 (112)
Non-financial corporations and individual entrepreneurs (non-financial activity) 7,351 9,390 13,833
Of which: Financing the construction and property development (including land) 1,416 2,339 3,879
Households 8,428 9,319 11,468
Total carrying amount 16,321 19,491 26,007
Financing classified as non-current assets and disposal groups held for sale - - -
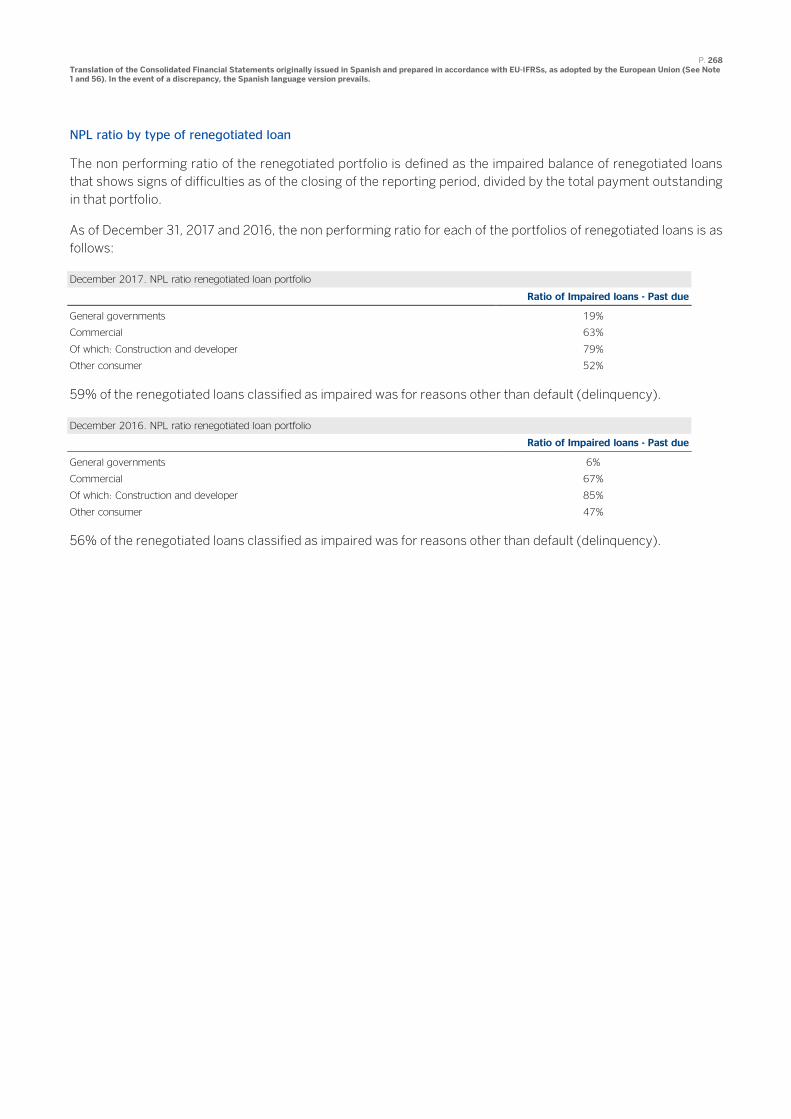
P. 268 Translation of the Consolidated Financial Statements originally issued in Spanish and prepared in accordance with EU-IFRSs, as adopted by the European Union (See Note 1 and 56). In the event of a discrepancy, the Spanish language version prevails.
NPL ratio by type of renegotiated loan
The non performing ratio of the renegotiated portfolio is defined as the impaired balance of renegotiated loans
that shows signs of difficulties as of the closing of the reporting period, divided by the total payment outstanding
in that portfolio.
As of December 31, 2017 and 2016, the non performing ratio for each of the portfolios of renegotiated loans is as
follows:
December 2017. NPL ratio renegotiated loan portfolio
Ratio of Impaired loans - Past due
General governments 19%
Commercial 63%
Of which: Construction and developer 79%
Other consumer 52%
59% of the renegotiated loans classified as impaired was for reasons other than default (delinquency).
December 2016. NPL ratio renegotiated loan portfolio
Ratio of Impaired loans - Past due
General governments 6%
Commercial 67%
Of which: Construction and developer 85%
Other consumer 47%
56% of the renegotiated loans classified as impaired was for reasons other than default (delinquency).
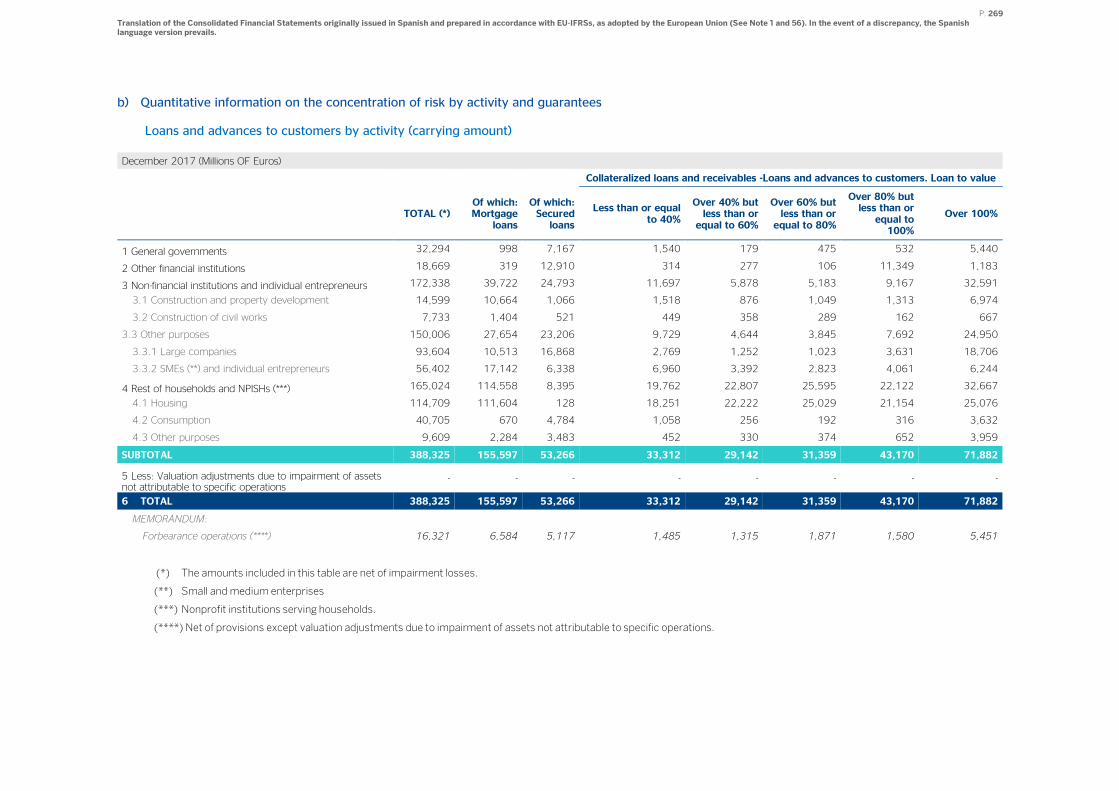
P. 269 Translation of the Consolidated Financial Statements originally issued in Spanish and prepared in accordance with EU-IFRSs, as adopted by the European Union (See Note 1 and 56). In the event of a discrepancy, the Spanish language version prevails.
b) Quantitative information on the concentration of risk by activity and guarantees
Loans and advances to customers by activity (carrying amount)
December 2017 (Millions OF Euros)
Collateralized loans and receivables -Loans and advances to customers. Loan to value
TOTAL (*) Of which: Mortgage
loans
Of which: Secured loans
Less than or equal to 40%
Over 40% but less than or equal to 60%
Over 60% but less than or equal to 80%
Over 80% but less than or equal to 100%
Over 100%
1 General governments 32,294 998 7,167 1,540 179 475 532 5,440
2 Other financial institutions 18,669 319 12,910 314 277 106 11,349 1,183
3 Non-financial institutions and individual entrepreneurs 172,338 39,722 24,793 11,697 5,878 5,183 9,167 32,591
3.1 Construction and property development 14,599 10,664 1,066 1,518 876 1,049 1,313 6,974
3.2 Construction of civil works 7,733 1,404 521 449 358 289 162 667
3.3 Other purposes 150,006 27,654 23,206 9,729 4,644 3,845 7,692 24,950
3.3.1 Large companies 93,604 10,513 16,868 2,769 1,252 1,023 3,631 18,706
3.3.2 SMEs (**) and individual entrepreneurs 56,402 17,142 6,338 6,960 3,392 2,823 4,061 6,244
4 Rest of households and NPISHs (***) 165,024 114,558 8,395 19,762 22,807 25,595 22,122 32,667
4.1 Housing 114,709 111,604 128 18,251 22,222 25,029 21,154 25,076
4.2 Consumption 40,705 670 4,784 1,058 256 192 316 3,632
4.3 Other purposes 9,609 2,284 3,483 452 330 374 652 3,959
SUBTOTAL 388,325 155,597 53,266 33,312 29,142 31,359 43,170 71,882
5 Less: Valuation adjustments due to impairment of assets not attributable to specific operations
- - - - - - - -
6 TOTAL 388,325 155,597 53,266 33,312 29,142 31,359 43,170 71,882
MEMORANDUM:
Forbearance operations (****) 16,321 6,584 5,117 1,485 1,315 1,871 1,580 5,451
(*) The amounts included in this table are net of impairment losses.
(**) Small and medium enterprises
(***) Nonprofit institutions serving households.
(****) Net of provisions except valuation adjustments due to impairment of assets not attributable to specific operations.
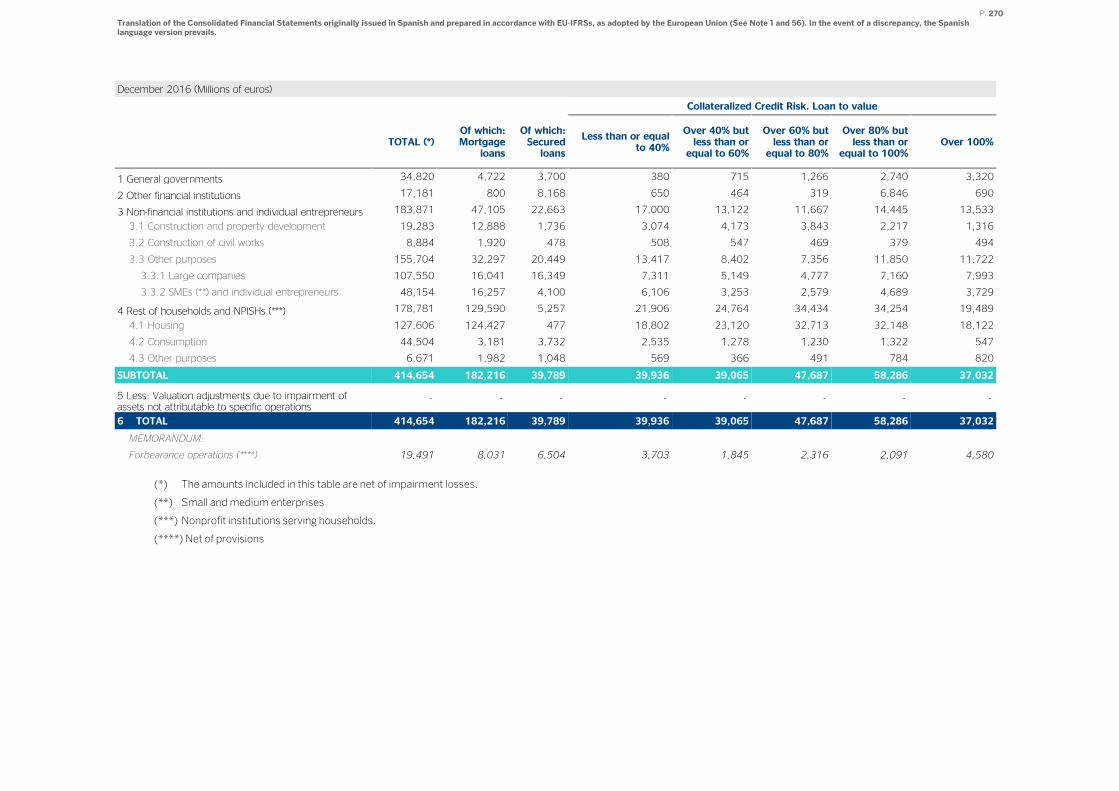
P. 270 Translation of the Consolidated Financial Statements originally issued in Spanish and prepared in accordance with EU-IFRSs, as adopted by the European Union (See Note 1 and 56). In the event of a discrepancy, the Spanish language version prevails.
December 2016 (Millions of euros)
Collateralized Credit Risk. Loan to value
TOTAL (*) Of which: Mortgage
loans
Of which: Secured loans
Less than or equal to 40%
Over 40% but less than or equal to 60%
Over 60% but less than or equal to 80%
Over 80% but less than or
equal to 100% Over 100%
1 General governments 34,820 4,722 3,700 380 715 1,266 2,740 3,320
2 Other financial institutions 17,181 800 8,168 650 464 319 6,846 690
3 Non-financial institutions and individual entrepreneurs 183,871 47,105 22,663 17,000 13,122 11,667 14,445 13,533
3.1 Construction and property development 19,283 12,888 1,736 3,074 4,173 3,843 2,217 1,316
3.2 Construction of civil works 8,884 1,920 478 508 547 469 379 494
3.3 Other purposes 155,704 32,297 20,449 13,417 8,402 7,356 11,850 11,722
3.3.1 Large companies 107,550 16,041 16,349 7,311 5,149 4,777 7,160 7,993
3.3.2 SMEs (**) and individual entrepreneurs 48,154 16,257 4,100 6,106 3,253 2,579 4,689 3,729
4 Rest of households and NPISHs (***) 178,781 129,590 5,257 21,906 24,764 34,434 34,254 19,489
4.1 Housing 127,606 124,427 477 18,802 23,120 32,713 32,148 18,122
4.2 Consumption 44,504 3,181 3,732 2,535 1,278 1,230 1,322 547
4.3 Other purposes 6,671 1,982 1,048 569 366 491 784 820
SUBTOTAL 414,654 182,216 39,789 39,936 39,065 47,687 58,286 37,032
5 Less: Valuation adjustments due to impairment of assets not attributable to specific operations
- - - - - - - -
6 TOTAL 414,654 182,216 39,789 39,936 39,065 47,687 58,286 37,032
MEMORANDUM:
Forbearance operations (****) 19,491 8,031 6,504 3,703 1,845 2,316 2,091 4,580
(*) The amounts included in this table are net of impairment losses.
(**) Small and medium enterprises
(***) Nonprofit institutions serving households.
(****) Net of provisions

P. 271 Translation of the Consolidated Financial Statements originally issued in Spanish and prepared in accordance with EU-IFRSs, as adopted by the European Union (See Note 1 and 56). In the event of a discrepancy, the Spanish language version prevails.
December 2015 (Millions of euros)
Collateralized Credit Risk. Loan to value
TOTAL (*) Of which: Mortgage
loans
Of which: Secured loans
Less than or equal to 40%
Over 40% but less than or equal to 60%
Over 60% but less than or equal to 80%
Over 80% but less than or
equal to 100% Over 100%
1 General governments 38,555 4,483 3,868 643 690 1,088 2,506 3,424
2 Other financial institutions 14,319 663 6,098 710 474 302 4,610 666
3 Non-financial institutions and individual entrepreneurs 184,203 47,773 24,034 20,400 14,931 11,480 12,491 12,506
3.1 Construction and property development 19,914 13,295 1,682 3,148 5,465 3,663 1,911 789
3.2 Construction of civil works 9,687 2,322 1,023 827 615 576 373 954
3.3 Other purposes 154,602 32,157 21,329 16,425 8,850 7,242 10,207 10,763
3.3.1 Large companies 96,239 11,959 15,663 6,207 4,569 4,248 5,627 6,971
3.3.2 SMEs (**) and individual entrepreneurs 58,363 20,198 5,665 10,218 4,281 2,993 4,579 3,792
4 Rest of households and NPISHs (***) 181,385 132,358 5,397 24,737 34,007 46,885 23,891 8,235
4.1 Housing 127,260 124,133 513 20,214 31,816 44,506 21,300 6,810
4.2 Consumption 42,211 3,627 3,738 2,311 1,156 1,398 2,118 381
4.3 Other purposes 11,914 4,599 1,146 2,212 1,035 982 472 1,043
SUBTOTAL 418,462 185,278 39,396 46,490 50,102 59,756 43,498 24,830
5 Less: Valuation adjustments due to impairment of assets not attributable to specific operations
4,233 - - - - - - -
6 TOTAL 414,230 185,278 39,396 46,490 50,102 59,756 43,498 24,830
MEMORANDUM:
Forbearance operations (****) 26,080 10,931 7,457 2,728 1,797 2,575 4,665 6,623
(*) The amounts included in this table are net of impairment losses.
(**) Small and medium enterprises
(***) Nonprofit institutions serving households.
(****) Net of provisions
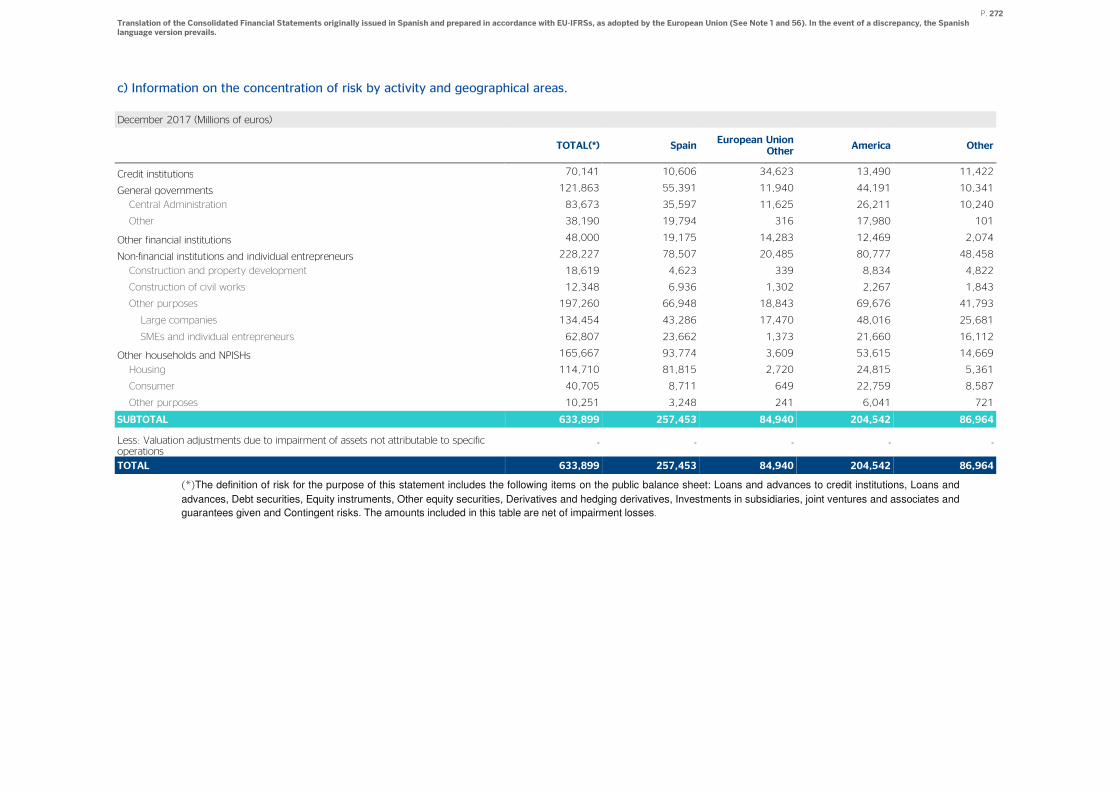
P. 272 Translation of the Consolidated Financial Statements originally issued in Spanish and prepared in accordance with EU-IFRSs, as adopted by the European Union (See Note 1 and 56). In the event of a discrepancy, the Spanish language version prevails.
c) Information on the concentration of risk by activity and geographical areas.
December 2017 (Millions of euros)
TOTAL(*) Spain European Union
Other America Other
Credit institutions 70,141 10,606 34,623 13,490 11,422
General governments 121,863 55,391 11,940 44,191 10,341
Central Administration 83,673 35,597 11,625 26,211 10,240
Other 38,190 19,794 316 17,980 101
Other financial institutions 48,000 19,175 14,283 12,469 2,074
Non-financial institutions and individual entrepreneurs 228,227 78,507 20,485 80,777 48,458
Construction and property development 18,619 4,623 339 8,834 4,822
Construction of civil works 12,348 6,936 1,302 2,267 1,843
Other purposes 197,260 66,948 18,843 69,676 41,793
Large companies 134,454 43,286 17,470 48,016 25,681
SMEs and individual entrepreneurs 62,807 23,662 1,373 21,660 16,112
Other households and NPISHs 165,667 93,774 3,609 53,615 14,669
Housing 114,710 81,815 2,720 24,815 5,361
Consumer 40,705 8,711 649 22,759 8,587
Other purposes 10,251 3,248 241 6,041 721
SUBTOTAL 633,899 257,453 84,940 204,542 86,964
Less: Valuation adjustments due to impairment of assets not attributable to specific operations
- - - - -
TOTAL 633,899 257,453 84,940 204,542 86,964
(*)The definition of risk for the purpose of this statement includes the following items on the public balance sheet: Loans and advances to credit institutions, Loans and
advances, Debt securities, Equity instruments, Other equity securities, Derivatives and hedging derivatives, Investments in subsidiaries, joint ventures and associates and
guarantees given and Contingent risks. The amounts included in this table are net of impairment losses.
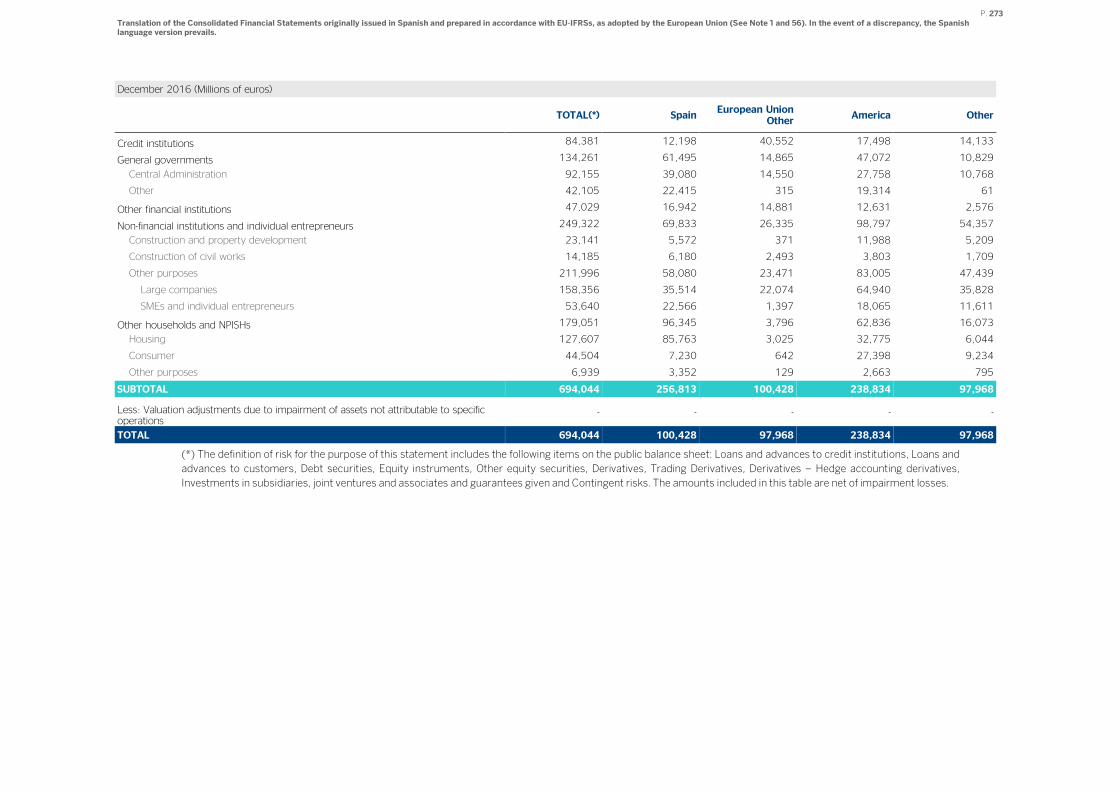
P. 273 Translation of the Consolidated Financial Statements originally issued in Spanish and prepared in accordance with EU-IFRSs, as adopted by the European Union (See Note 1 and 56). In the event of a discrepancy, the Spanish language version prevails.
December 2016 (Millions of euros)
TOTAL(*) Spain European Union
Other America Other
Credit institutions 84,381 12,198 40,552 17,498 14,133
General governments 134,261 61,495 14,865 47,072 10,829
Central Administration 92,155 39,080 14,550 27,758 10,768
Other 42,105 22,415 315 19,314 61
Other financial institutions 47,029 16,942 14,881 12,631 2,576
Non-financial institutions and individual entrepreneurs 249,322 69,833 26,335 98,797 54,357
Construction and property development 23,141 5,572 371 11,988 5,209
Construction of civil works 14,185 6,180 2,493 3,803 1,709
Other purposes 211,996 58,080 23,471 83,005 47,439
Large companies 158,356 35,514 22,074 64,940 35,828
SMEs and individual entrepreneurs 53,640 22,566 1,397 18,065 11,611
Other households and NPISHs 179,051 96,345 3,796 62,836 16,073
Housing 127,607 85,763 3,025 32,775 6,044
Consumer 44,504 7,230 642 27,398 9,234
Other purposes 6,939 3,352 129 2,663 795
SUBTOTAL 694,044 256,813 100,428 238,834 97,968
Less: Valuation adjustments due to impairment of assets not attributable to specific operations
- - - - -
TOTAL 694,044 100,428 97,968 238,834 97,968
(*) The definition of risk for the purpose of this statement includes the following items on the public balance sheet: Loans and advances to credit institutions, Loans and
advances to customers, Debt securities, Equity instruments, Other equity securities, Derivatives, Trading Derivatives, Derivatives – Hedge accounting derivatives,
Investments in subsidiaries, joint ventures and associates and guarantees given and Contingent risks. The amounts included in this table are net of impairment losses.
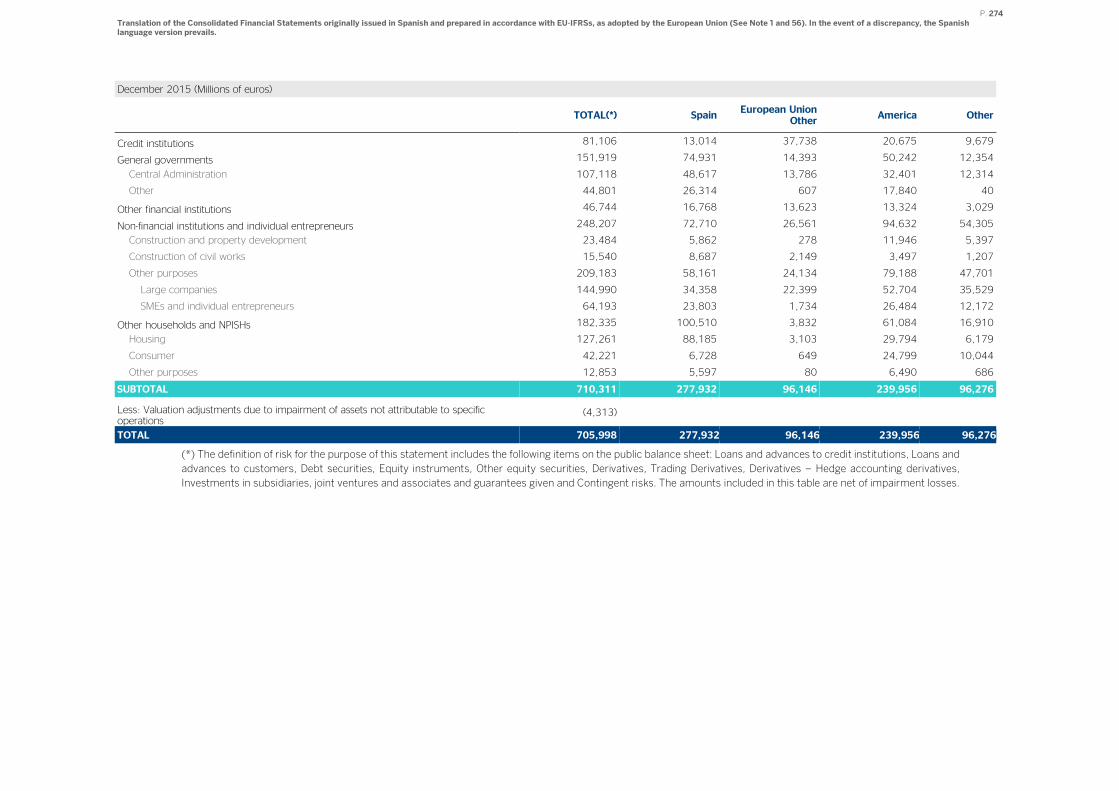
P. 274 Translation of the Consolidated Financial Statements originally issued in Spanish and prepared in accordance with EU-IFRSs, as adopted by the European Union (See Note 1 and 56). In the event of a discrepancy, the Spanish language version prevails.
December 2015 (Millions of euros)
TOTAL(*) Spain European Union
Other America Other
Credit institutions 81,106 13,014 37,738 20,675 9,679
General governments 151,919 74,931 14,393 50,242 12,354
Central Administration 107,118 48,617 13,786 32,401 12,314
Other 44,801 26,314 607 17,840 40
Other financial institutions 46,744 16,768 13,623 13,324 3,029
Non-financial institutions and individual entrepreneurs 248,207 72,710 26,561 94,632 54,305
Construction and property development 23,484 5,862 278 11,946 5,397
Construction of civil works 15,540 8,687 2,149 3,497 1,207
Other purposes 209,183 58,161 24,134 79,188 47,701
Large companies 144,990 34,358 22,399 52,704 35,529
SMEs and individual entrepreneurs 64,193 23,803 1,734 26,484 12,172
Other households and NPISHs 182,335 100,510 3,832 61,084 16,910
Housing 127,261 88,185 3,103 29,794 6,179
Consumer 42,221 6,728 649 24,799 10,044
Other purposes 12,853 5,597 80 6,490 686
SUBTOTAL 710,311 277,932 96,146 239,956 96,276
Less: Valuation adjustments due to impairment of assets not attributable to specific operations
(4,313)
TOTAL 705,998 277,932 96,146 239,956 96,276
(*) The definition of risk for the purpose of this statement includes the following items on the public balance sheet: Loans and advances to credit institutions, Loans and
advances to customers, Debt securities, Equity instruments, Other equity securities, Derivatives, Trading Derivatives, Derivatives – Hedge accounting derivatives,
Investments in subsidiaries, joint ventures and associates and guarantees given and Contingent risks. The amounts included in this table are net of impairment losses.
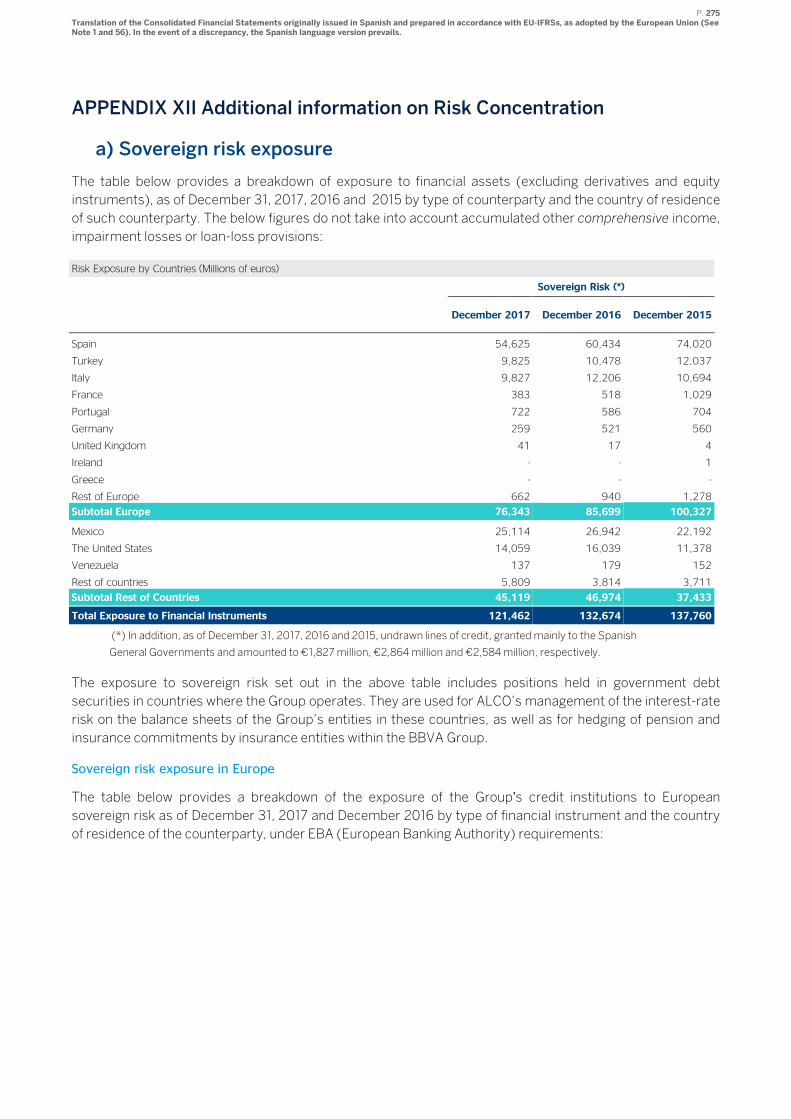
P. 275 Translation of the Consolidated Financial Statements originally issued in Spanish and prepared in accordance with EU-IFRSs, as adopted by the European Union (See Note 1 and 56). In the event of a discrepancy, the Spanish language version prevails.
APPENDIX XII Additional information on Risk Concentration
a) Sovereign risk exposure
The table below provides a breakdown of exposure to financial assets (excluding derivatives and equity
instruments), as of December 31, 2017, 2016 and 2015 by type of counterparty and the country of residence
of such counterparty. The below figures do not take into account accumulated other comprehensive income,
impairment losses or loan-loss provisions:
Risk Exposure by Countries (Millions of euros)
Sovereign Risk (*)
December 2017 December 2016 December 2015
Spain 54,625 60,434 74,020
Turkey 9,825 10,478 12,037
Italy 9,827 12,206 10,694
France 383 518 1,029
Portugal 722 586 704
Germany 259 521 560
United Kingdom 41 17 4
Ireland - - 1
Greece - - -
Rest of Europe 662 940 1,278
Subtotal Europe 76,343 85,699 100,327
Mexico 25,114 26,942 22,192
The United States 14,059 16,039 11,378
Venezuela 137 179 152
Rest of countries 5,809 3,814 3,711
Subtotal Rest of Countries 45,119 46,974 37,433
Total Exposure to Financial Instruments 121,462 132,674 137,760
(*) In addition, as of December 31, 2017, 2016 and 2015, undrawn lines of credit, granted mainly to the Spanish
General Governments and amounted to €1,827 million, €2,864 million and €2,584 million, respectively.
The exposure to sovereign risk set out in the above table includes positions held in government debt
securities in countries where the Group operates. They are used for ALCO’s management of the interest-rate
risk on the balance sheets of the Group’s entities in these countries, as well as for hedging of pension and
insurance commitments by insurance entities within the BBVA Group.
Sovereign risk exposure in Europe
The table below provides a breakdown of the exposure of the Group’s credit institutions to European
sovereign risk as of December 31, 2017 and December 2016 by type of financial instrument and the country
of residence of the counterparty, under EBA (European Banking Authority) requirements:
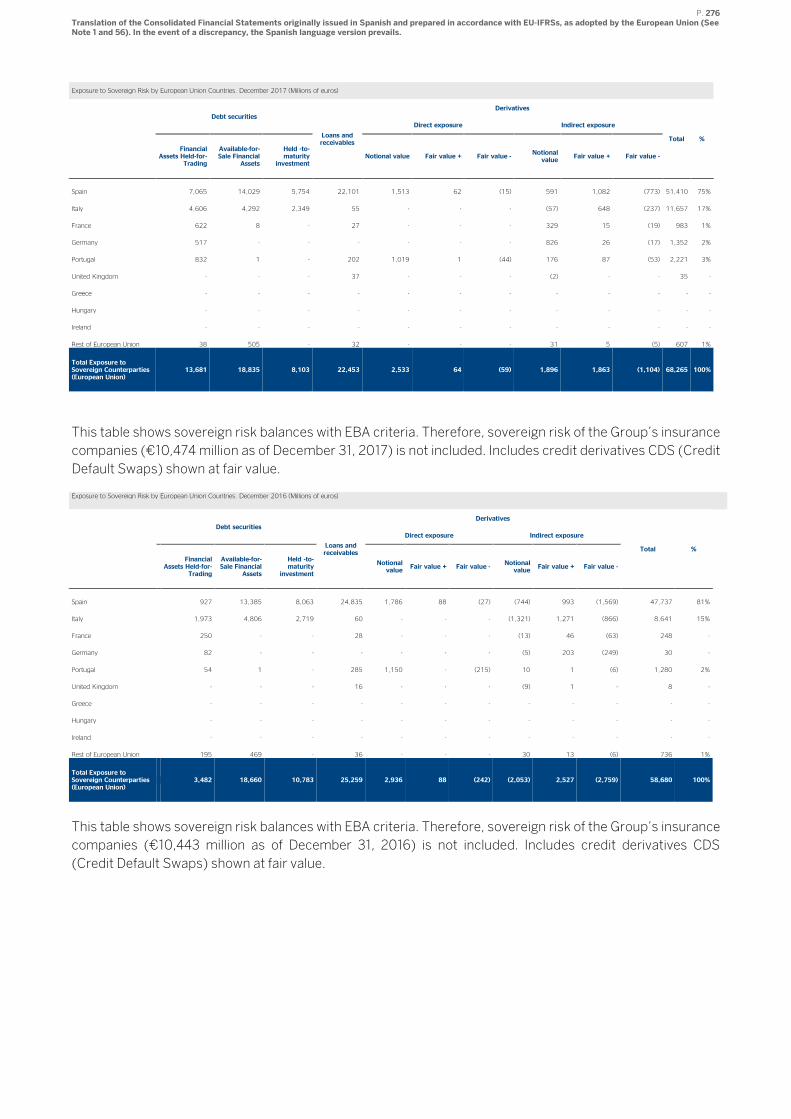
P. 276 Translation of the Consolidated Financial Statements originally issued in Spanish and prepared in accordance with EU-IFRSs, as adopted by the European Union (See Note 1 and 56). In the event of a discrepancy, the Spanish language version prevails.
Exposure to Sovereign Risk by European Union Countries. December 2017 (Millions of euros)
Debt securities
Loans and receivables
Derivatives
Total %
Direct exposure Indirect exposure
Financial Assets Held-for-
Trading
Available-for-Sale Financial
Assets
Held -to-maturity
investment Notional value Fair value + Fair value -
Notional value
Fair value + Fair value -
Spain 7,065 14,029 5,754 22,101 1,513 62 (15) 591 1,082 (773) 51,410 75%
Italy 4,606 4,292 2,349 55 - - - (57) 648 (237) 11,657 17%
France 622 8 - 27 - - - 329 15 (19) 983 1%
Germany 517 - - - - - - 826 26 (17) 1,352 2%
Portugal 832 1 - 202 1,019 1 (44) 176 87 (53) 2,221 3%
United Kingdom - - - 37 - - - (2) - - 35 -
Greece - - - - - - - - - - - -
Hungary - - - - - - - - - - - -
Ireland - - - - - - - - - - - -
Rest of European Union 38 505 - 32 - - - 31 5 (5) 607 1%
Total Exposure to Sovereign Counterparties (European Union)
13,681 18,835 8,103 22,453 2,533 64 (59) 1,896 1,863 (1,104) 68,265 100%
This table shows sovereign risk balances with EBA criteria. Therefore, sovereign risk of the Group’s insurance
companies (€10,474 million as of December 31, 2017) is not included. Includes credit derivatives CDS (Credit
Default Swaps) shown at fair value.
Exposure to Sovereign Risk by European Union Countries. December 2016 (Millions of euros)
Debt securities
Loans and receivables
Derivatives
Total %
Direct exposure Indirect exposure
Financial Assets Held-for-
Trading
Available-for-Sale Financial
Assets
Held -to-maturity
investment
Notional value
Fair value + Fair value - Notional value
Fair value + Fair value -
Spain 927 13,385 8,063 24,835 1,786 88 (27) (744) 993 (1,569) 47,737 81%
Italy 1,973 4,806 2,719 60 - - - (1,321) 1,271 (866) 8,641 15%
France 250 - - 28 - - - (13) 46 (63) 248 -
Germany 82 - - - - - - (5) 203 (249) 30 -
Portugal 54 1 - 285 1,150 - (215) 10 1 (6) 1,280 2%
United Kingdom - - - 16 - - - (9) 1 - 8 -
Greece - - - - - - - - - - - -
Hungary - - - - - - - - - - - -
Ireland - - - - - - - - - - - -
Rest of European Union 195 469 - 36 - - - 30 13 (6) 736 1%
Total Exposure to Sovereign Counterparties (European Union)
3,482 18,660 10,783 25,259 2,936 88 (242) (2,053) 2,527 (2,759) 58,680 100%
This table shows sovereign risk balances with EBA criteria. Therefore, sovereign risk of the Group’s insurance
companies (€10,443 million as of December 31, 2016) is not included. Includes credit derivatives CDS
(Credit Default Swaps) shown at fair value.
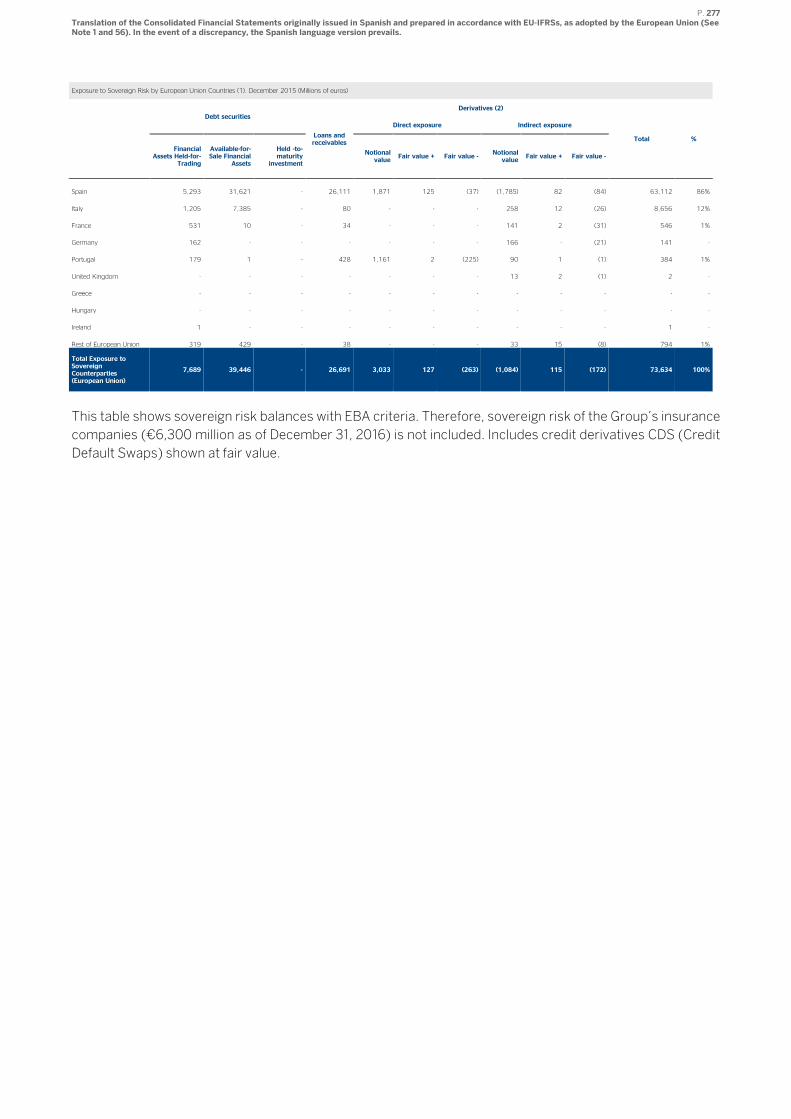
P. 277 Translation of the Consolidated Financial Statements originally issued in Spanish and prepared in accordance with EU-IFRSs, as adopted by the European Union (See Note 1 and 56). In the event of a discrepancy, the Spanish language version prevails.
Exposure to Sovereign Risk by European Union Countries (1). December 2015 (Millions of euros)
Debt securities
Loans and receivables
Derivatives (2)
Total %
Direct exposure Indirect exposure
Financial Assets Held-for-
Trading
Available-for-Sale Financial
Assets
Held -to-maturity
investment
Notional value
Fair value + Fair value - Notional value
Fair value + Fair value -
Spain 5,293 31,621 - 26,111 1,871 125 (37) (1,785) 82 (84) 63,112 86%
Italy 1,205 7,385 - 80 - - - 258 12 (26) 8,656 12%
France 531 10 - 34 - - - 141 2 (31) 546 1%
Germany 162 - - - - - - 166 - (21) 141 -
Portugal 179 1 - 428 1,161 2 (225) 90 1 (1) 384 1%
United Kingdom - - - - - - - 13 2 (1) 2 -
Greece - - - - - - - - - - - -
Hungary - - - - - - - - - - - -
Ireland 1 - - - - - - - - - 1 -
Rest of European Union 319 429 - 38 - - - 33 15 (8) 794 1%
Total Exposure to Sovereign Counterparties (European Union)
7,689 39,446 - 26,691 3,033 127 (263) (1,084) 115 (172) 73,634 100%
This table shows sovereign risk balances with EBA criteria. Therefore, sovereign risk of the Group’s insurance
companies (€6,300 million as of December 31, 2016) is not included. Includes credit derivatives CDS (Credit
Default Swaps) shown at fair value.
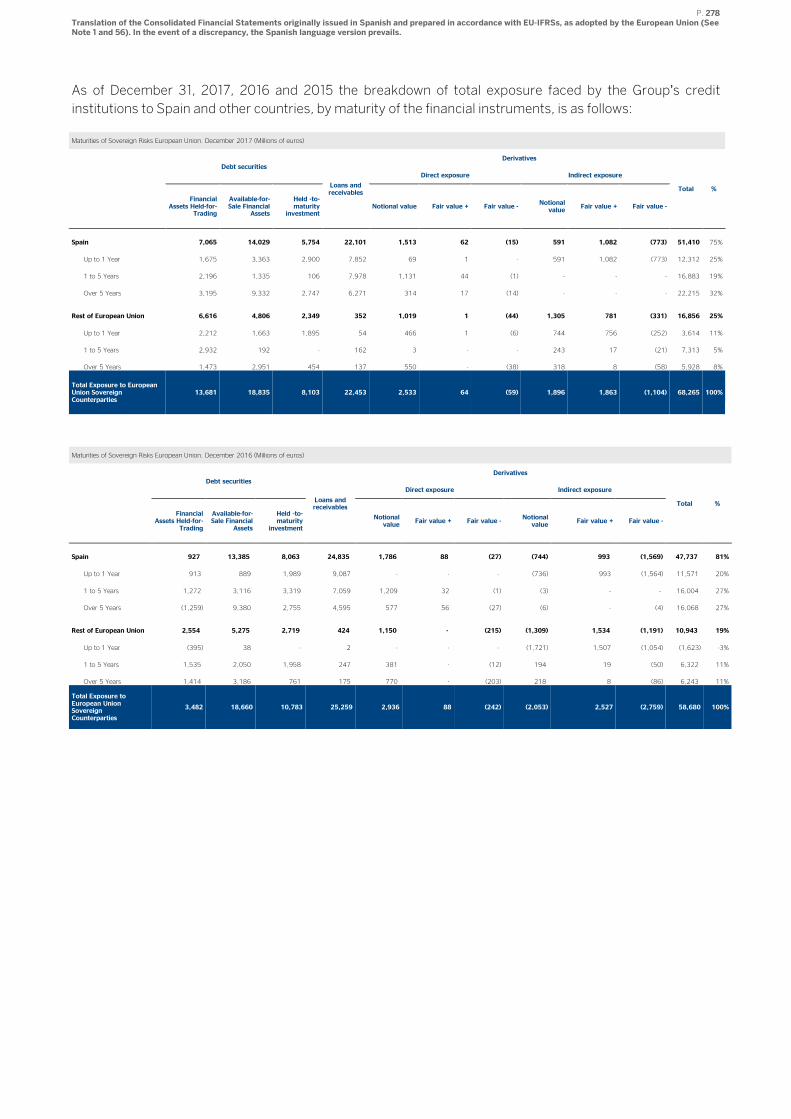
P. 278 Translation of the Consolidated Financial Statements originally issued in Spanish and prepared in accordance with EU-IFRSs, as adopted by the European Union (See Note 1 and 56). In the event of a discrepancy, the Spanish language version prevails.
As of December 31, 2017, 2016 and 2015 the breakdown of total exposure faced by the Group’s credit
institutions to Spain and other countries, by maturity of the financial instruments, is as follows:
Maturities of Sovereign Risks European Union. December 2017 (Millions of euros)
Debt securities
Loans and receivables
Derivatives
Total %
Direct exposure Indirect exposure
Financial Assets Held-for-
Trading
Available-for-Sale Financial
Assets
Held -to-maturity
investment Notional value Fair value + Fair value -
Notional value
Fair value + Fair value -
Spain 7,065 14,029 5,754 22,101 1,513 62 (15) 591 1,082 (773) 51,410 75%
Up to 1 Year 1,675 3,363 2,900 7,852 69 1 - 591 1,082 (773) 12,312 25%
1 to 5 Years 2,196 1,335 106 7,978 1,131 44 (1) - - - 16,883 19%
Over 5 Years 3,195 9,332 2,747 6,271 314 17 (14) - - - 22,215 32%
Rest of European Union 6,616 4,806 2,349 352 1,019 1 (44) 1,305 781 (331) 16,856 25%
Up to 1 Year 2,212 1,663 1,895 54 466 1 (6) 744 756 (252) 3,614 11%
1 to 5 Years 2,932 192 - 162 3 - - 243 17 (21) 7,313 5%
Over 5 Years 1,473 2,951 454 137 550 - (38) 318 8 (58) 5,928 8%
Total Exposure to European Union Sovereign Counterparties
13,681 18,835 8,103 22,453 2,533 64 (59) 1,896 1,863 (1,104) 68,265 100%
Maturities of Sovereign Risks European Union. December 2016 (Millions of euros)
Debt securities
Loans and receivables
Derivatives
Total %
Direct exposure Indirect exposure
Financial Assets Held-for-
Trading
Available-for-Sale Financial
Assets
Held -to-maturity
investment
Notional value
Fair value + Fair value - Notional value
Fair value + Fair value -
Spain 927 13,385 8,063 24,835 1,786 88 (27) (744) 993 (1,569) 47,737 81%
Up to 1 Year 913 889 1,989 9,087 - - - (736) 993 (1,564) 11,571 20%
1 to 5 Years 1,272 3,116 3,319 7,059 1,209 32 (1) (3) - - 16,004 27%
Over 5 Years (1,259) 9,380 2,755 4,595 577 56 (27) (6) - (4) 16,068 27%
Rest of European Union 2,554 5,275 2,719 424 1,150 - (215) (1,309) 1,534 (1,191) 10,943 19%
Up to 1 Year (395) 38 - 2 - - - (1,721) 1,507 (1,054) (1,623) -3%
1 to 5 Years 1,535 2,050 1,958 247 381 - (12) 194 19 (50) 6,322 11%
Over 5 Years 1,414 3,186 761 175 770 - (203) 218 8 (86) 6,243 11%
Total Exposure to European Union Sovereign Counterparties
3,482 18,660 10,783 25,259 2,936 88 (242) (2,053) 2,527 (2,759) 58,680 100%
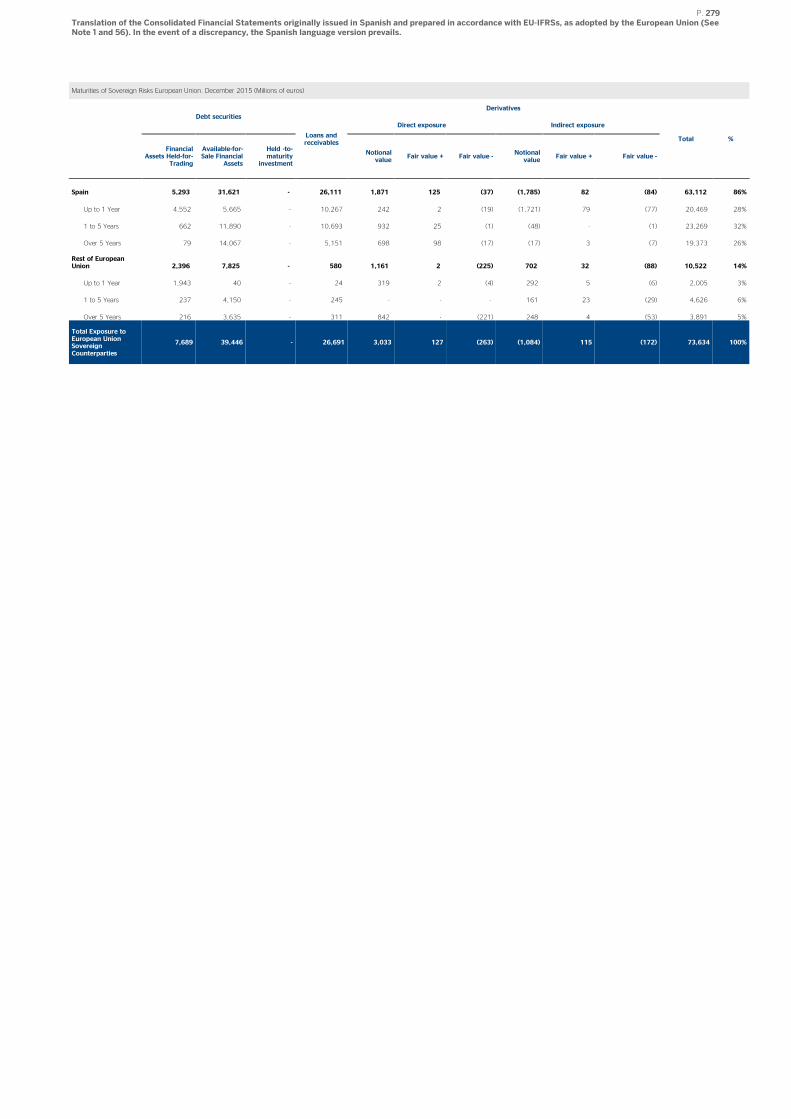
P. 279 Translation of the Consolidated Financial Statements originally issued in Spanish and prepared in accordance with EU-IFRSs, as adopted by the European Union (See Note 1 and 56). In the event of a discrepancy, the Spanish language version prevails.
Maturities of Sovereign Risks European Union. December 2015 (Millions of euros)
Debt securities
Loans and receivables
Derivatives
Total %
Direct exposure Indirect exposure
Financial Assets Held-for-
Trading
Available-for-Sale Financial
Assets
Held -to-maturity
investment
Notional value
Fair value + Fair value - Notional value
Fair value + Fair value -
Spain 5,293 31,621 - 26,111 1,871 125 (37) (1,785) 82 (84) 63,112 86%
Up to 1 Year 4,552 5,665 - 10,267 242 2 (19) (1,721) 79 (77) 20,469 28%
1 to 5 Years 662 11,890 - 10,693 932 25 (1) (48) - (1) 23,269 32%
Over 5 Years 79 14,067 - 5,151 698 98 (17) (17) 3 (7) 19,373 26%
Rest of European Union 2,396 7,825 - 580 1,161 2 (225) 702 32 (88) 10,522 14%
Up to 1 Year 1,943 40 - 24 319 2 (4) 292 5 (6) 2,005 3%
1 to 5 Years 237 4,150 - 245 - - - 161 23 (29) 4,626 6%
Over 5 Years 216 3,635 - 311 842 - (221) 248 4 (53) 3,891 5%
Total Exposure to European Union Sovereign Counterparties
7,689 39,446 - 26,691 3,033 127 (263) (1,084) 115 (172) 73,634 100%

P. 280 Translation of the Consolidated Financial Statements originally issued in Spanish and prepared in accordance with EU-IFRSs, as adopted by the European Union (See Note 1 and 56). In the event of a discrepancy, the Spanish language version prevails.
b) Concentration of risk on activities in the real-estate market in Spain
Quantitative information on activities in the real-estate market in Spain
The following quantitative information on real-estate activities in Spain has been prepared using the
reporting models required by Bank of Spain Circular 5/2011, of November 30.
As of December 31, 2017, 2016 and 2015, exposure to the construction sector and real-estate activities in
Spain stood at €11,981, €15,285 and €18,744 million, respectively. Of that amount, risk from loans to
construction and real-estate development activities accounted for €5,224, €7,930 and €9,681 million,
respectively, representing 2.9%, 5.0% and 6.0% of loans and advances to customers of the balance of
business in Spain (excluding the general governments) and 0.8%, 1.1% and 1.3% of the total assets of the
Consolidated Group.
Lending for real estate development of the loans as of December 31, 2017, 2016 and 2015 is shown below:
December 2017. Financing Allocated by credit institutions to Construction and Real Estate Development and lending for house purchase (Millions of euros)
Gross Amount Drawn Over the Guarantee Value
Accumulated impairment
Financing to construction and real estate development (including land) (Business in Spain) 5,224 2,132 (1,500)
Of which: Impaired assets 2,660 1,529 (1,461)
Memorandum item:
Write-offs 2,289
Memorandum item:
Total loans and advances to customers, excluding the General Governments (Business in Spain) 174,014
Total consolidated assets (total business) 690,059
Impairment and provisions for normal exposures (5,843)
December 2016. Financing Allocated by credit institutions to Construction and Real Estate Development and lending for house purchase (Millions of euros)
Gross Amount Drawn Over the Guarantee Value
Accumulated impairment
Financing to construction and real estate development (including land) (Business in Spain) 7,930 3,449 (2,944)
Of which: Impaired assets 5,095 2,680 (2,888)
Memorandum item:
Write-offs 2,061
Memorandum item:
Total loans and advances to customers, excluding the General Governments (Business in Spain) 159,492
Total consolidated assets (total business) 731,856
Impairment and provisions for normal exposures (5,830)
December 2015. Financing Allocated by credit institutions to Construction and Real Estate Development and lending for house purchase (Millions of euros)
Gross Amount Drawn Over the Guarantee Value
Accumulated impairment
Financing to construction and real estate development (including land) (Business in Spain) 9,681 4,132 (3,801)
Of which: Impaired assets 6,231 3,087 (3,600)
Memorandum item:
Write-offs 1,741
Memorandum item:
Total loans and advances to customers, excluding the General Governments (Business in Spain) 161,416
Total consolidated assets (total business) 749,855
Impairment and provisions for normal exposures (4,549)
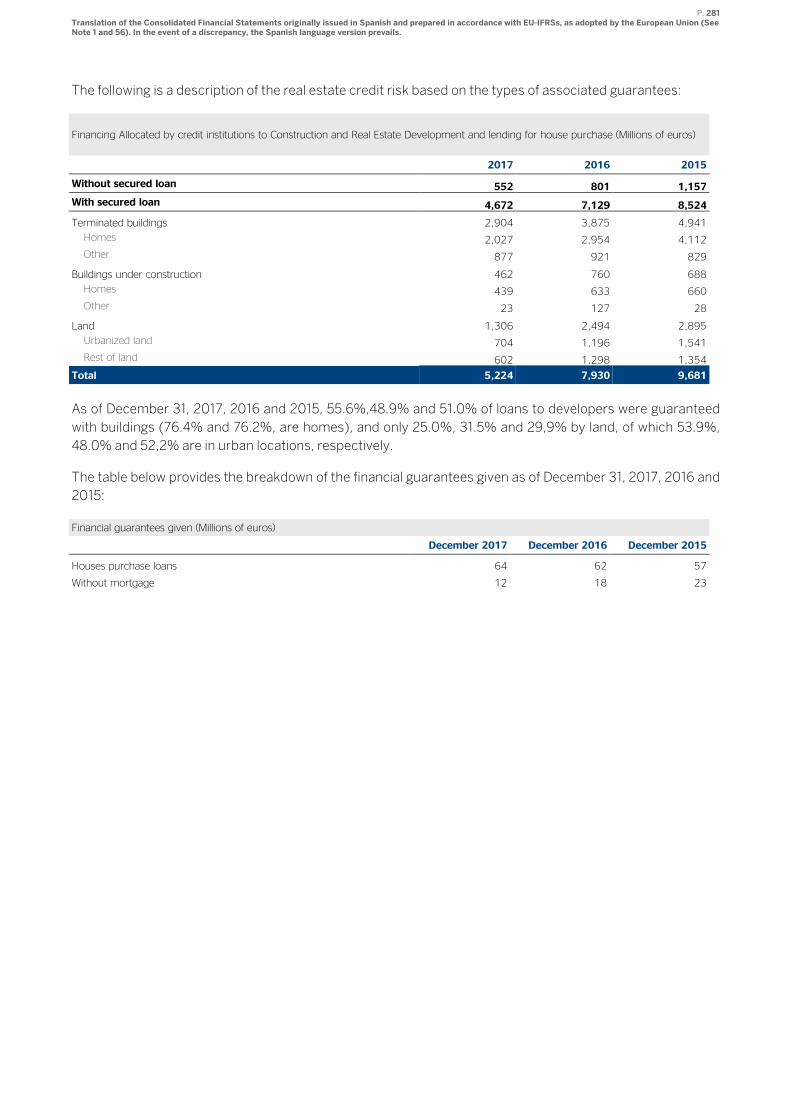
P. 281 Translation of the Consolidated Financial Statements originally issued in Spanish and prepared in accordance with EU-IFRSs, as adopted by the European Union (See Note 1 and 56). In the event of a discrepancy, the Spanish language version prevails.
The following is a description of the real estate credit risk based on the types of associated guarantees:
Financing Allocated by credit institutions to Construction and Real Estate Development and lending for house purchase (Millions of euros)
2017 2016 2015
Without secured loan 552 801 1,157
With secured loan 4,672 7,129 8,524
Terminated buildings 2,904 3,875 4,941
Homes 2,027 2,954 4,112
Other 877 921 829
Buildings under construction 462 760 688
Homes 439 633 660
Other 23 127 28
Land 1,306 2,494 2,895
Urbanized land 704 1,196 1,541
Rest of land 602 1,298 1,354
Total 5,224 7,930 9,681
As of December 31, 2017, 2016 and 2015, 55.6%,48.9% and 51.0% of loans to developers were guaranteed
with buildings (76.4% and 76.2%, are homes), and only 25.0%, 31.5% and 29,9% by land, of which 53.9%,
48.0% and 52,2% are in urban locations, respectively.
The table below provides the breakdown of the financial guarantees given as of December 31, 2017, 2016 and
2015:
Financial guarantees given (Millions of euros)
December 2017 December 2016 December 2015
Houses purchase loans 64 62 57
Without mortgage 12 18 23
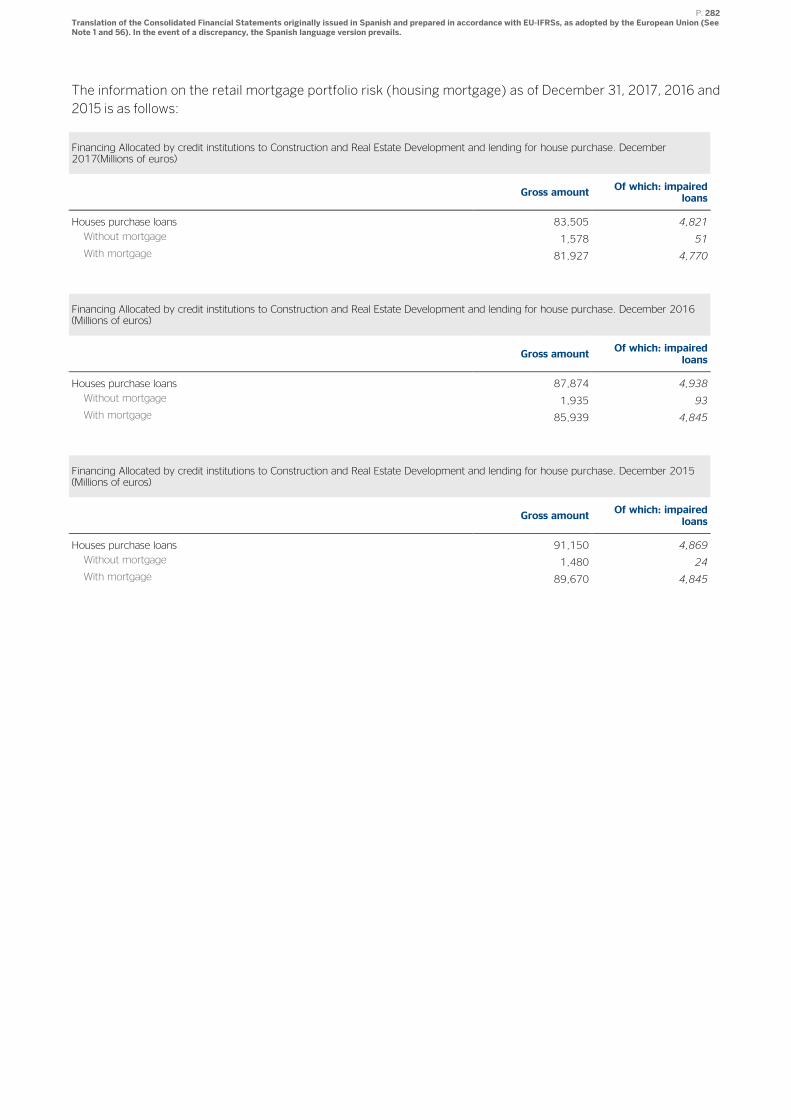
P. 282 Translation of the Consolidated Financial Statements originally issued in Spanish and prepared in accordance with EU-IFRSs, as adopted by the European Union (See Note 1 and 56). In the event of a discrepancy, the Spanish language version prevails.
The information on the retail mortgage portfolio risk (housing mortgage) as of December 31, 2017, 2016 and
2015 is as follows:
Financing Allocated by credit institutions to Construction and Real Estate Development and lending for house purchase. December 2017(Millions of euros)
Gross amount Of which: impaired
loans
Houses purchase loans 83,505 4,821
Without mortgage 1,578 51
With mortgage 81,927 4,770
Financing Allocated by credit institutions to Construction and Real Estate Development and lending for house purchase. December 2016 (Millions of euros)
Gross amount Of which: impaired
loans
Houses purchase loans 87,874 4,938
Without mortgage 1,935 93
With mortgage 85,939 4,845
Financing Allocated by credit institutions to Construction and Real Estate Development and lending for house purchase. December 2015 (Millions of euros)
Gross amount Of which: impaired
loans
Houses purchase loans 91,150 4,869
Without mortgage 1,480 24
With mortgage 89,670 4,845
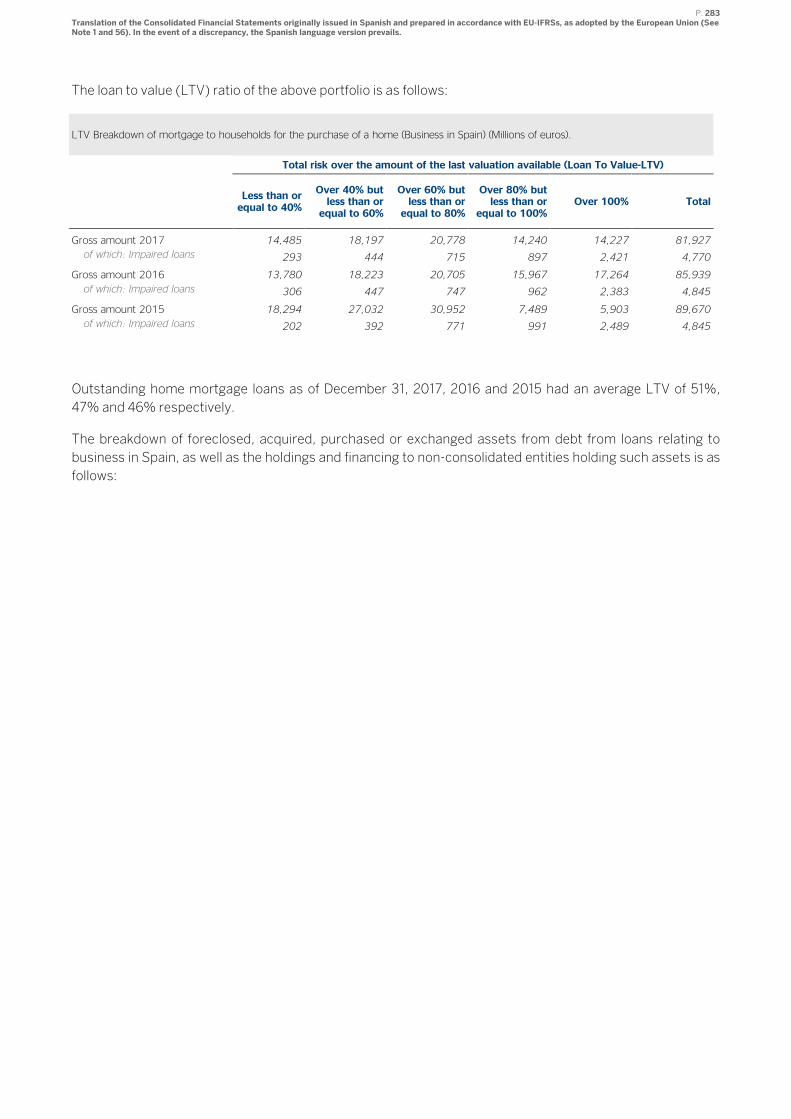
P. 283 Translation of the Consolidated Financial Statements originally issued in Spanish and prepared in accordance with EU-IFRSs, as adopted by the European Union (See Note 1 and 56). In the event of a discrepancy, the Spanish language version prevails.
The loan to value (LTV) ratio of the above portfolio is as follows:
LTV Breakdown of mortgage to households for the purchase of a home (Business in Spain) (Millions of euros).
Total risk over the amount of the last valuation available (Loan To Value-LTV)
Less than or equal to 40%
Over 40% but less than or equal to 60%
Over 60% but less than or equal to 80%
Over 80% but less than or
equal to 100% Over 100% Total
Gross amount 2017 14,485 18,197 20,778 14,240 14,227 81,927
of which: Impaired loans 293 444 715 897 2,421 4,770
Gross amount 2016 13,780 18,223 20,705 15,967 17,264 85,939
of which: Impaired loans 306 447 747 962 2,383 4,845
Gross amount 2015 18,294 27,032 30,952 7,489 5,903 89,670
of which: Impaired loans 202 392 771 991 2,489 4,845
Outstanding home mortgage loans as of December 31, 2017, 2016 and 2015 had an average LTV of 51%,
47% and 46% respectively.
The breakdown of foreclosed, acquired, purchased or exchanged assets from debt from loans relating to
business in Spain, as well as the holdings and financing to non-consolidated entities holding such assets is as
follows:
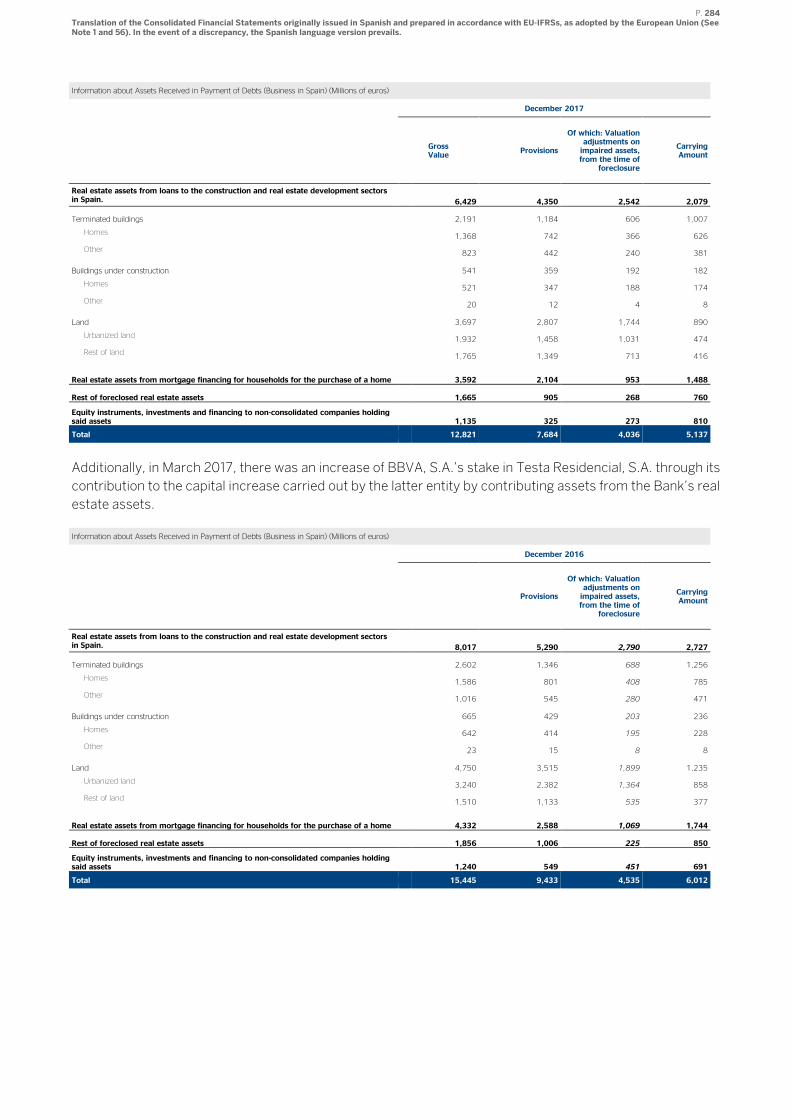
P. 284 Translation of the Consolidated Financial Statements originally issued in Spanish and prepared in accordance with EU-IFRSs, as adopted by the European Union (See Note 1 and 56). In the event of a discrepancy, the Spanish language version prevails.
Information about Assets Received in Payment of Debts (Business in Spain) (Millions of euros)
December 2017
Gross Value
Provisions
Of which: Valuation adjustments on impaired assets, from the time of
foreclosure
Carrying Amount
Real estate assets from loans to the construction and real estate development sectors in Spain. 6,429 4,350 2,542 2,079
Terminated buildings 2,191 1,184 606 1,007
Homes 1,368 742 366 626
Other 823 442 240 381
Buildings under construction 541 359 192 182
Homes 521 347 188 174
Other 20 12 4 8
Land 3,697 2,807 1,744 890
Urbanized land 1,932 1,458 1,031 474
Rest of land 1,765 1,349 713 416
Real estate assets from mortgage financing for households for the purchase of a home 3,592 2,104 953 1,488
Rest of foreclosed real estate assets 1,665 905 268 760
Equity instruments, investments and financing to non-consolidated companies holding said assets 1,135 325 273 810
Total 12,821 7,684 4,036 5,137
Additionally, in March 2017, there was an increase of BBVA, S.A.’s stake in Testa Residencial, S.A. through its
contribution to the capital increase carried out by the latter entity by contributing assets from the Bank’s real
estate assets.
Information about Assets Received in Payment of Debts (Business in Spain) (Millions of euros)
December 2016
Provisions
Of which: Valuation adjustments on impaired assets, from the time of
foreclosure
Carrying Amount
Real estate assets from loans to the construction and real estate development sectors in Spain. 8,017 5,290 2,790 2,727
Terminated buildings 2,602 1,346 688 1,256
Homes 1,586 801 408 785
Other 1,016 545 280 471
Buildings under construction 665 429 203 236
Homes 642 414 195 228
Other 23 15 8 8
Land 4,750 3,515 1,899 1,235
Urbanized land 3,240 2,382 1,364 858
Rest of land 1,510 1,133 535 377
Real estate assets from mortgage financing for households for the purchase of a home 4,332 2,588 1,069 1,744
Rest of foreclosed real estate assets 1,856 1,006 225 850
Equity instruments, investments and financing to non-consolidated companies holding said assets 1,240 549 451 691
Total 15,445 9,433 4,535 6,012
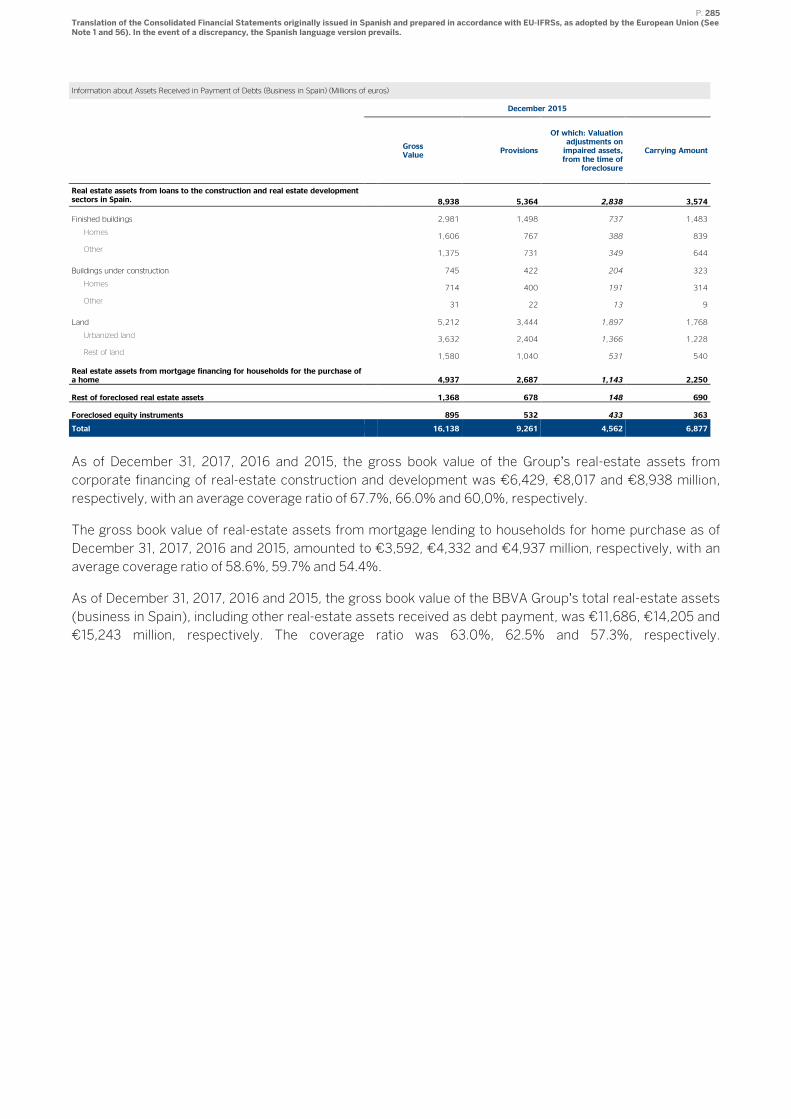
P. 285 Translation of the Consolidated Financial Statements originally issued in Spanish and prepared in accordance with EU-IFRSs, as adopted by the European Union (See Note 1 and 56). In the event of a discrepancy, the Spanish language version prevails.
Information about Assets Received in Payment of Debts (Business in Spain) (Millions of euros)
December 2015
Gross Value
Provisions
Of which: Valuation adjustments on impaired assets, from the time of
foreclosure
Carrying Amount
Real estate assets from loans to the construction and real estate development sectors in Spain. 8,938 5,364 2,838 3,574
Finished buildings 2,981 1,498 737 1,483
Homes 1,606 767 388 839
Other 1,375 731 349 644
Buildings under construction 745 422 204 323
Homes 714 400 191 314
Other 31 22 13 9
Land 5,212 3,444 1,897 1,768
Urbanized land 3,632 2,404 1,366 1,228
Rest of land 1,580 1,040 531 540
Real estate assets from mortgage financing for households for the purchase of a home 4,937 2,687 1,143 2,250
Rest of foreclosed real estate assets 1,368 678 148 690
Foreclosed equity instruments 895 532 433 363
Total 16,138 9,261 4,562 6,877
As of December 31, 2017, 2016 and 2015, the gross book value of the Group’s real-estate assets from
corporate financing of real-estate construction and development was €6,429, €8,017 and €8,938 million,
respectively, with an average coverage ratio of 67.7%, 66.0% and 60,0%, respectively.
The gross book value of real-estate assets from mortgage lending to households for home purchase as of
December 31, 2017, 2016 and 2015, amounted to €3,592, €4,332 and €4,937 million, respectively, with an
average coverage ratio of 58.6%, 59.7% and 54.4%.
As of December 31, 2017, 2016 and 2015, the gross book value of the BBVA Group’s total real-estate assets
(business in Spain), including other real-estate assets received as debt payment, was €11,686, €14,205 and
€15,243 million, respectively. The coverage ratio was 63.0%, 62.5% and 57.3%, respectively.
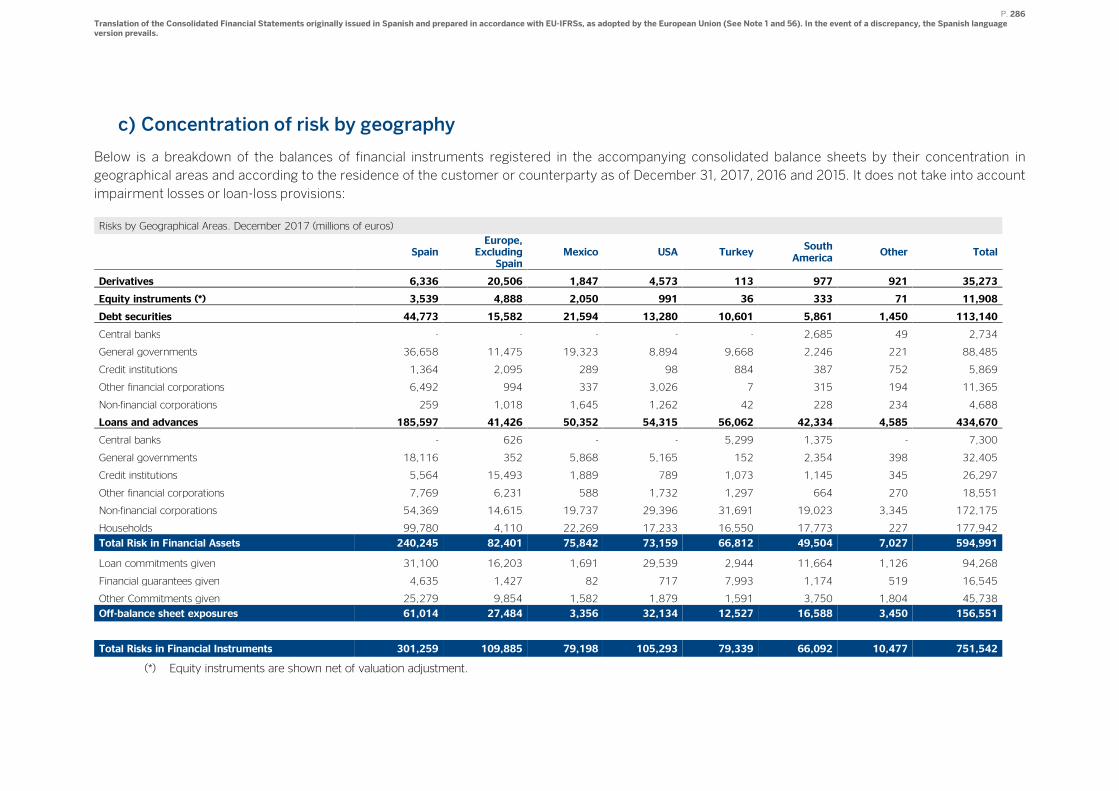
P. 286 Translation of the Consolidated Financial Statements originally issued in Spanish and prepared in accordance with EU-IFRSs, as adopted by the European Union (See Note 1 and 56). In the event of a discrepancy, the Spanish language version prevails.
c) Concentration of risk by geography
Below is a breakdown of the balances of financial instruments registered in the accompanying consolidated balance sheets by their concentration in
geographical areas and according to the residence of the customer or counterparty as of December 31, 2017, 2016 and 2015. It does not take into account
impairment losses or loan-loss provisions:
Risks by Geographical Areas. December 2017 (millions of euros)
Spain Europe,
Excluding Spain
Mexico USA Turkey South
America Other Total
Derivatives 6,336 20,506 1,847 4,573 113 977 921 35,273
Equity instruments (*) 3,539 4,888 2,050 991 36 333 71 11,908
Debt securities 44,773 15,582 21,594 13,280 10,601 5,861 1,450 113,140
Central banks - - - - - 2,685 49 2,734
General governments 36,658 11,475 19,323 8,894 9,668 2,246 221 88,485
Credit institutions 1,364 2,095 289 98 884 387 752 5,869
Other financial corporations 6,492 994 337 3,026 7 315 194 11,365
Non-financial corporations 259 1,018 1,645 1,262 42 228 234 4,688
Loans and advances 185,597 41,426 50,352 54,315 56,062 42,334 4,585 434,670
Central banks - 626 - - 5,299 1,375 - 7,300
General governments 18,116 352 5,868 5,165 152 2,354 398 32,405
Credit institutions 5,564 15,493 1,889 789 1,073 1,145 345 26,297
Other financial corporations 7,769 6,231 588 1,732 1,297 664 270 18,551
Non-financial corporations 54,369 14,615 19,737 29,396 31,691 19,023 3,345 172,175
Households 99,780 4,110 22,269 17,233 16,550 17,773 227 177,942
Total Risk in Financial Assets 240,245 82,401 75,842 73,159 66,812 49,504 7,027 594,991
Loan commitments given 31,100 16,203 1,691 29,539 2,944 11,664 1,126 94,268
Financial guarantees given 4,635 1,427 82 717 7,993 1,174 519 16,545
Other Commitments given 25,279 9,854 1,582 1,879 1,591 3,750 1,804 45,738
Off-balance sheet exposures 61,014 27,484 3,356 32,134 12,527 16,588 3,450 156,551
Total Risks in Financial Instruments 301,259 109,885 79,198 105,293 79,339 66,092 10,477 751,542
(*) Equity instruments are shown net of valuation adjustment.
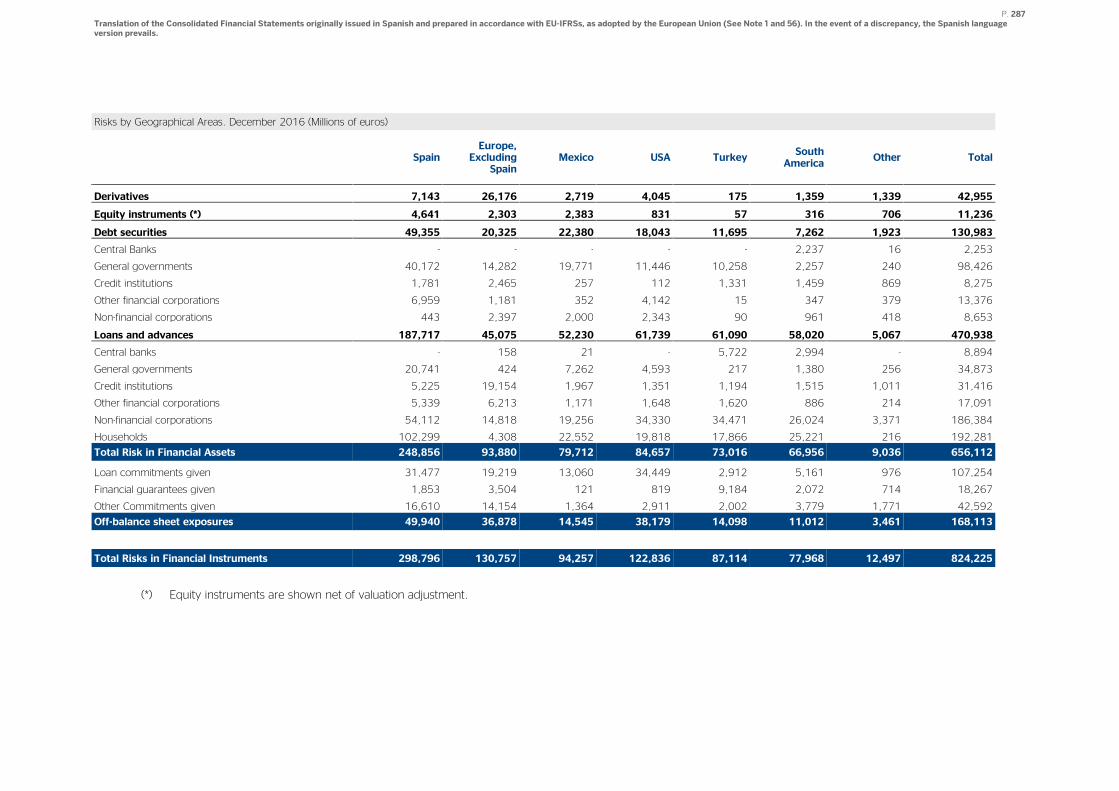
P. 287 Translation of the Consolidated Financial Statements originally issued in Spanish and prepared in accordance with EU-IFRSs, as adopted by the European Union (See Note 1 and 56). In the event of a discrepancy, the Spanish language version prevails.
Risks by Geographical Areas. December 2016 (Millions of euros)
Spain Europe,
Excluding Spain
Mexico USA Turkey South
America Other Total
Derivatives 7,143 26,176 2,719 4,045 175 1,359 1,339 42,955
Equity instruments (*) 4,641 2,303 2,383 831 57 316 706 11,236
Debt securities 49,355 20,325 22,380 18,043 11,695 7,262 1,923 130,983
Central Banks - - - - - 2,237 16 2,253
General governments 40,172 14,282 19,771 11,446 10,258 2,257 240 98,426
Credit institutions 1,781 2,465 257 112 1,331 1,459 869 8,275
Other financial corporations 6,959 1,181 352 4,142 15 347 379 13,376
Non-financial corporations 443 2,397 2,000 2,343 90 961 418 8,653
Loans and advances 187,717 45,075 52,230 61,739 61,090 58,020 5,067 470,938
Central banks - 158 21 - 5,722 2,994 - 8,894
General governments 20,741 424 7,262 4,593 217 1,380 256 34,873
Credit institutions 5,225 19,154 1,967 1,351 1,194 1,515 1,011 31,416
Other financial corporations 5,339 6,213 1,171 1,648 1,620 886 214 17,091
Non-financial corporations 54,112 14,818 19,256 34,330 34,471 26,024 3,371 186,384
Households 102,299 4,308 22,552 19,818 17,866 25,221 216 192,281
Total Risk in Financial Assets 248,856 93,880 79,712 84,657 73,016 66,956 9,036 656,112
Loan commitments given 31,477 19,219 13,060 34,449 2,912 5,161 976 107,254
Financial guarantees given 1,853 3,504 121 819 9,184 2,072 714 18,267
Other Commitments given 16,610 14,154 1,364 2,911 2,002 3,779 1,771 42,592
Off-balance sheet exposures 49,940 36,878 14,545 38,179 14,098 11,012 3,461 168,113
Total Risks in Financial Instruments 298,796 130,757 94,257 122,836 87,114 77,968 12,497 824,225
(*) Equity instruments are shown net of valuation adjustment.
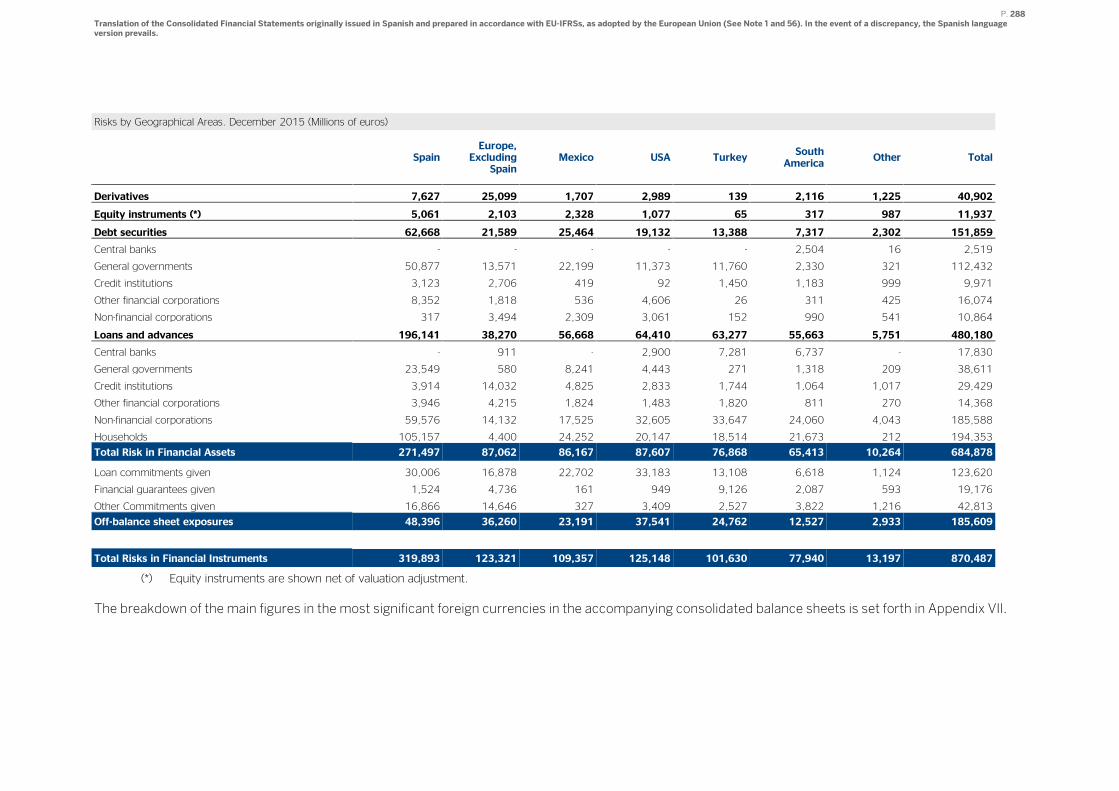
P. 288 Translation of the Consolidated Financial Statements originally issued in Spanish and prepared in accordance with EU-IFRSs, as adopted by the European Union (See Note 1 and 56). In the event of a discrepancy, the Spanish language version prevails.
Risks by Geographical Areas. December 2015 (Millions of euros)
Spain Europe,
Excluding Spain
Mexico USA Turkey South
America Other Total
Derivatives 7,627 25,099 1,707 2,989 139 2,116 1,225 40,902
Equity instruments (*) 5,061 2,103 2,328 1,077 65 317 987 11,937
Debt securities 62,668 21,589 25,464 19,132 13,388 7,317 2,302 151,859
Central banks - - - - - 2,504 16 2,519
General governments 50,877 13,571 22,199 11,373 11,760 2,330 321 112,432
Credit institutions 3,123 2,706 419 92 1,450 1,183 999 9,971
Other financial corporations 8,352 1,818 536 4,606 26 311 425 16,074
Non-financial corporations 317 3,494 2,309 3,061 152 990 541 10,864
Loans and advances 196,141 38,270 56,668 64,410 63,277 55,663 5,751 480,180
Central banks - 911 - 2,900 7,281 6,737 - 17,830
General governments 23,549 580 8,241 4,443 271 1,318 209 38,611
Credit institutions 3,914 14,032 4,825 2,833 1,744 1,064 1,017 29,429
Other financial corporations 3,946 4,215 1,824 1,483 1,820 811 270 14,368
Non-financial corporations 59,576 14,132 17,525 32,605 33,647 24,060 4,043 185,588
Households 105,157 4,400 24,252 20,147 18,514 21,673 212 194,353
Total Risk in Financial Assets 271,497 87,062 86,167 87,607 76,868 65,413 10,264 684,878
Loan commitments given 30,006 16,878 22,702 33,183 13,108 6,618 1,124 123,620
Financial guarantees given 1,524 4,736 161 949 9,126 2,087 593 19,176
Other Commitments given 16,866 14,646 327 3,409 2,527 3,822 1,216 42,813
Off-balance sheet exposures 48,396 36,260 23,191 37,541 24,762 12,527 2,933 185,609
Total Risks in Financial Instruments 319,893 123,321 109,357 125,148 101,630 77,940 13,197 870,487
(*) Equity instruments are shown net of valuation adjustment.
The breakdown of the main figures in the most significant foreign currencies in the accompanying consolidated balance sheets is set forth in Appendix VII.
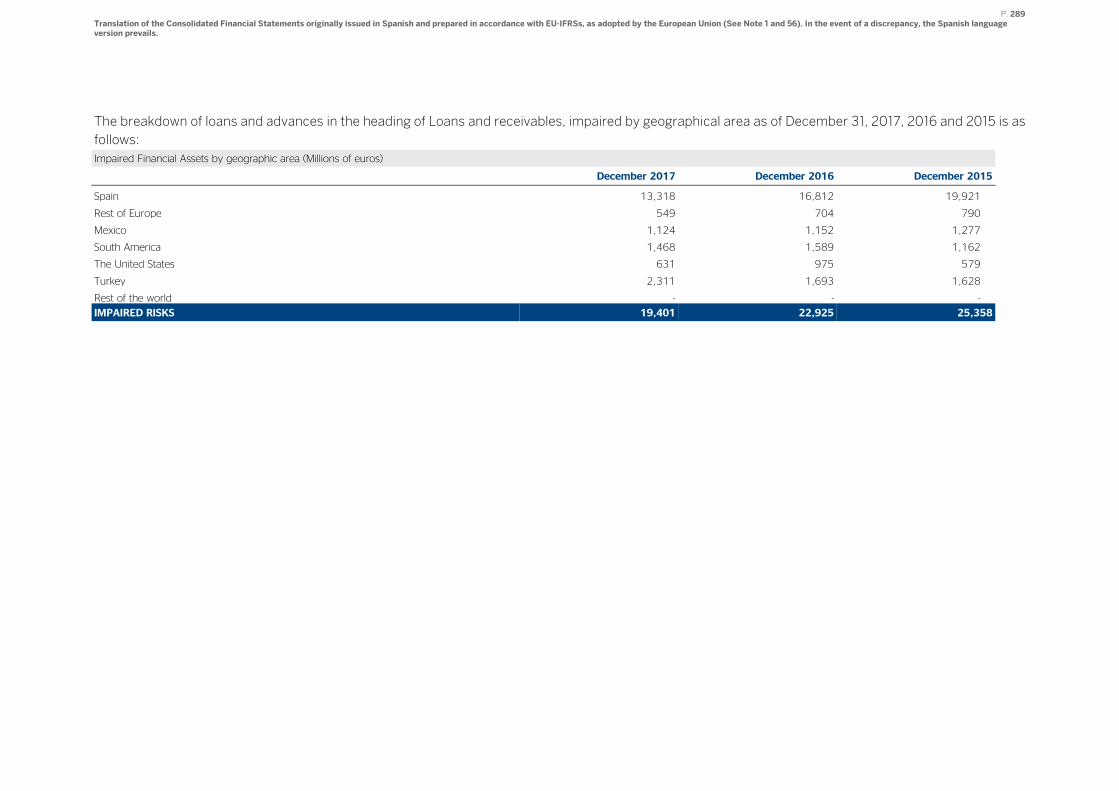
P. 289 Translation of the Consolidated Financial Statements originally issued in Spanish and prepared in accordance with EU-IFRSs, as adopted by the European Union (See Note 1 and 56). In the event of a discrepancy, the Spanish language version prevails.
The breakdown of loans and advances in the heading of Loans and receivables, impaired by geographical area as of December 31, 2017, 2016 and 2015 is as
follows:
Impaired Financial Assets by geographic area (Millions of euros)
December 2017 December 2016 December 2015
Spain 13,318 16,812 19,921
Rest of Europe 549 704 790
Mexico 1,124 1,152 1,277
South America 1,468 1,589 1,162
The United States 631 975 579
Turkey 2,311 1,693 1,628
Rest of the world - - -
IMPAIRED RISKS 19,401 22,925 25,358
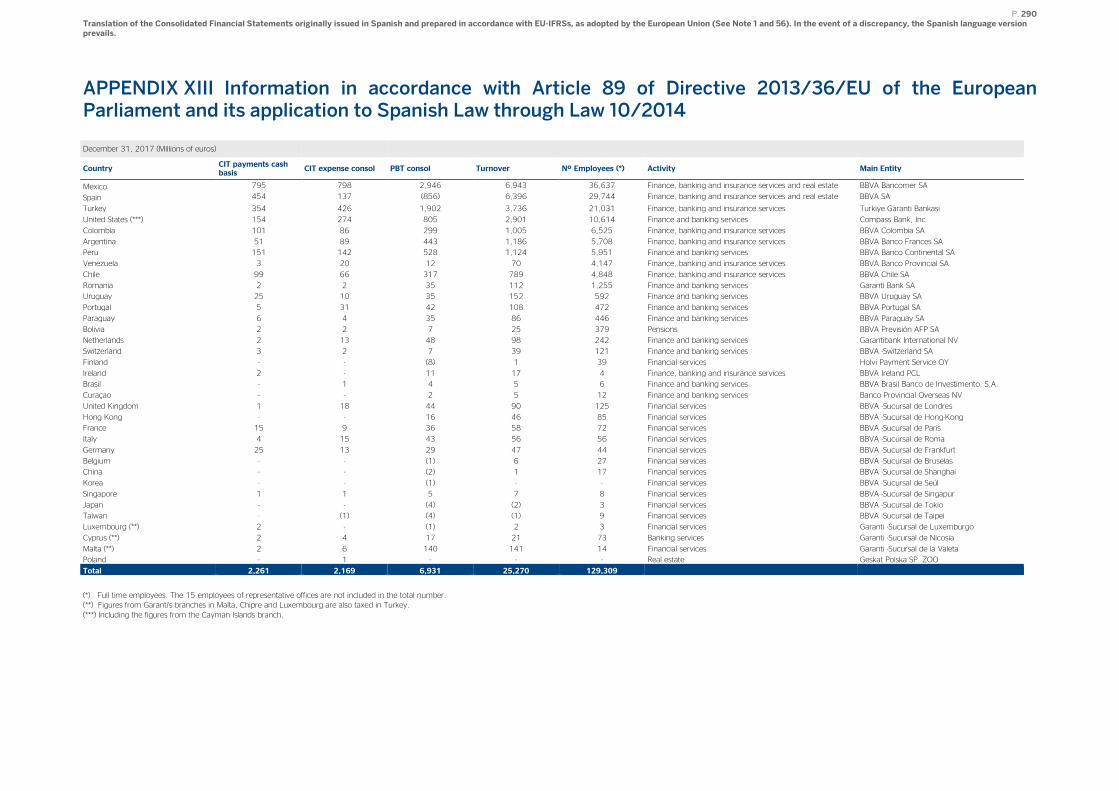
P. 290 Translation of the Consolidated Financial Statements originally issued in Spanish and prepared in accordance with EU-IFRSs, as adopted by the European Union (See Note 1 and 56). In the event of a discrepancy, the Spanish language version prevails.
APPENDIX XIII Information in accordance with Article 89 of Directive 2013/36/EU of the European Parliament and its application to Spanish Law through Law 10/2014
December 31, 2017 (Millions of euros)
Country CIT payments cash basis
CIT expense consol PBT consol Turnover Nº Employees (*) Activity Main Entity
Mexico 795 798 2,946 6,943 36,637 Finance, banking and insurance services and real estate BBVA Bancomer SA
Spain 454 137 (856) 6,396 29,744 Finance, banking and insurance services and real estate BBVA SA
Turkey 354 426 1,902 3,736 21,031 Finance, banking and insurance services Turkiye Garanti Bankasi
United States (***) 154 274 805 2,901 10,614 Finance and banking services Compass Bank, Inc.
Colombia 101 86 299 1,005 6,525 Finance, banking and insurance services BBVA Colombia SA
Argentina 51 89 443 1,186 5,708 Finance, banking and insurance services BBVA Banco Frances SA
Peru 151 142 528 1,124 5,951 Finance and banking services BBVA Banco Continental SA
Venezuela 3 20 12 70 4,147 Finance, banking and insurance services BBVA Banco Provincial SA
Chile 99 66 317 789 4,848 Finance, banking and insurance services BBVA Chile SA
Romania 2 2 35 112 1,255 Finance and banking services Garanti Bank SA
Uruguay 25 10 35 152 592 Finance and banking services BBVA Uruguay SA
Portugal 5 31 42 108 472 Finance and banking services BBVA Portugal SA
Paraguay 6 4 35 86 446 Finance and banking services BBVA Paraguay SA
Bolivia 2 2 7 25 379 Pensions BBVA Previsión AFP SA
Netherlands 2 13 48 98 242 Finance and banking services Garantibank International NV
Switzerland 3 2 7 39 121 Finance and banking services BBVA -Switzerland SA
Finland - - (8) 1 39 Financial services Holvi Payment Service OY
Ireland 2 - 11 17 4 Finance, banking and insurance services BBVA Ireland PCL
Brasil - 1 4 5 6 Finance and banking services BBVA Brasil Banco de Investimento, S.A.
Curaçao - - 2 5 12 Finance and banking services Banco Provincial Overseas NV
United Kingdom 1 18 44 90 125 Financial services BBVA -Sucursal de Londres
Hong Kong - - 16 46 85 Financial services BBVA -Sucursal de Hong-Kong
France 15 9 36 58 72 Financial services BBVA -Sucursal de Paris
Italy 4 15 43 56 56 Financial services BBVA -Sucursal de Roma
Germany 25 13 29 47 44 Financial services BBVA -Sucursal de Frankfurt
Belgium - - (1) 6 27 Financial services BBVA -Sucursal de Bruselas
China - - (2) 1 17 Financial services BBVA -Sucursal de Shanghai
Korea - - (1) - - Financial services BBVA -Sucursal de Seúl
Singapore 1 1 5 7 8 Financial services BBVA -Sucursal de Singapur
Japan - - (4) (2) 3 Financial services BBVA -Sucursal de Tokio
Taiwan - (1) (4) (1) 9 Financial services BBVA -Sucursal de Taipei
Luxembourg (**) 2 - (1) 2 3 Financial services Garanti -Sucursal de Luxemburgo
Cyprus (**) 2 4 17 21 73 Banking services Garanti -Sucursal de Nicosia
Malta (**) 2 6 140 141 14 Financial services Garanti -Sucursal de la Valeta
Poland - 1 - - - Real estate Geskat Polska SP. ZOO
Total 2,261 2,169 6,931 25,270 129,309
(*) Full time employees. The 15 employees of representative offices are not included in the total number. (**) Figures from Garanti's branches in Malta, Chipre and Luxembourg are also taxed in Turkey. (***) Including the figures from the Cayman Islands branch.
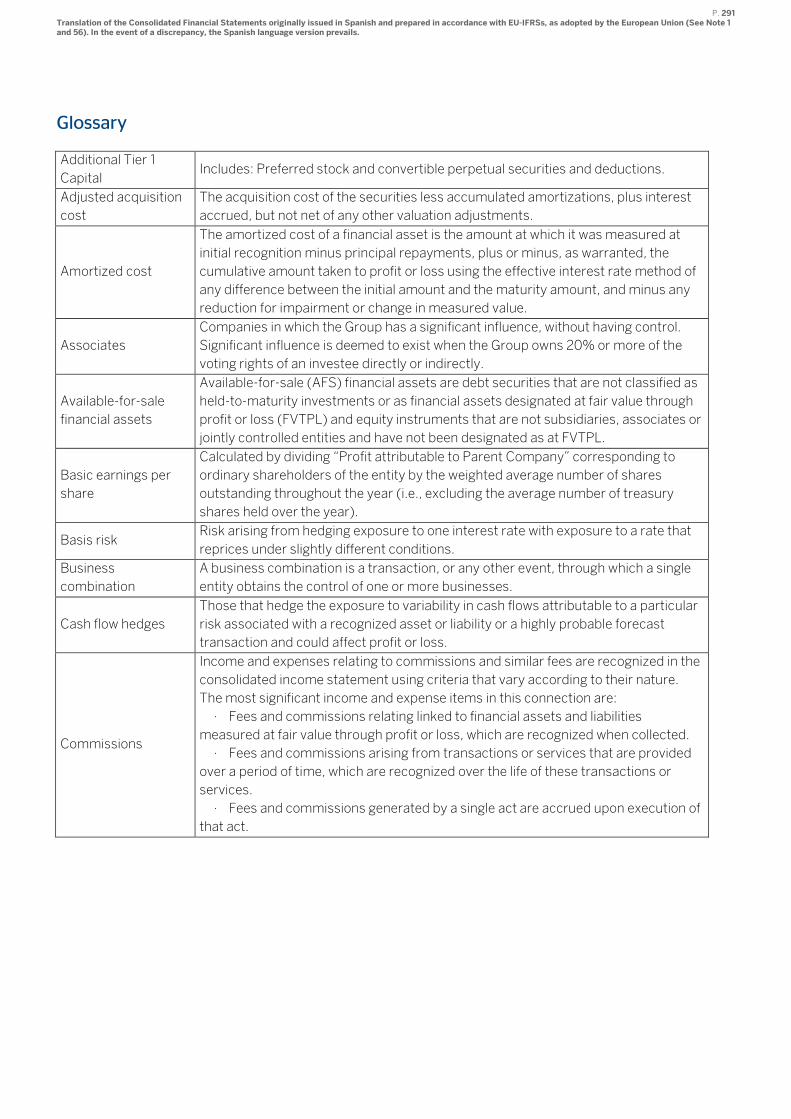
P. 291 Translation of the Consolidated Financial Statements originally issued in Spanish and prepared in accordance with EU-IFRSs, as adopted by the European Union (See Note 1 and 56). In the event of a discrepancy, the Spanish language version prevails.
Glossary
Additional Tier 1
Capital Includes: Preferred stock and convertible perpetual securities and deductions.
Adjusted acquisition
cost
The acquisition cost of the securities less accumulated amortizations, plus interest
accrued, but not net of any other valuation adjustments.
Amortized cost
The amortized cost of a financial asset is the amount at which it was measured at
initial recognition minus principal repayments, plus or minus, as warranted, the
cumulative amount taken to profit or loss using the effective interest rate method of
any difference between the initial amount and the maturity amount, and minus any
reduction for impairment or change in measured value.
Associates
Companies in which the Group has a significant influence, without having control.
Significant influence is deemed to exist when the Group owns 20% or more of the
voting rights of an investee directly or indirectly.
Available-for-sale
financial assets
Available-for-sale (AFS) financial assets are debt securities that are not classified as
held-to-maturity investments or as financial assets designated at fair value through
profit or loss (FVTPL) and equity instruments that are not subsidiaries, associates or
jointly controlled entities and have not been designated as at FVTPL.
Basic earnings per
share
Calculated by dividing “Profit attributable to Parent Company” corresponding to
ordinary shareholders of the entity by the weighted average number of shares
outstanding throughout the year (i.e., excluding the average number of treasury
shares held over the year).
Basis risk Risk arising from hedging exposure to one interest rate with exposure to a rate that
reprices under slightly different conditions.
Business
combination
A business combination is a transaction, or any other event, through which a single
entity obtains the control of one or more businesses.
Cash flow hedges
Those that hedge the exposure to variability in cash flows attributable to a particular
risk associated with a recognized asset or liability or a highly probable forecast
transaction and could affect profit or loss.
Commissions
Income and expenses relating to commissions and similar fees are recognized in the
consolidated income statement using criteria that vary according to their nature.
The most significant income and expense items in this connection are:
· Fees and commissions relating linked to financial assets and liabilities
measured at fair value through profit or loss, which are recognized when collected.
· Fees and commissions arising from transactions or services that are provided
over a period of time, which are recognized over the life of these transactions or
services.
· Fees and commissions generated by a single act are accrued upon execution of
that act.
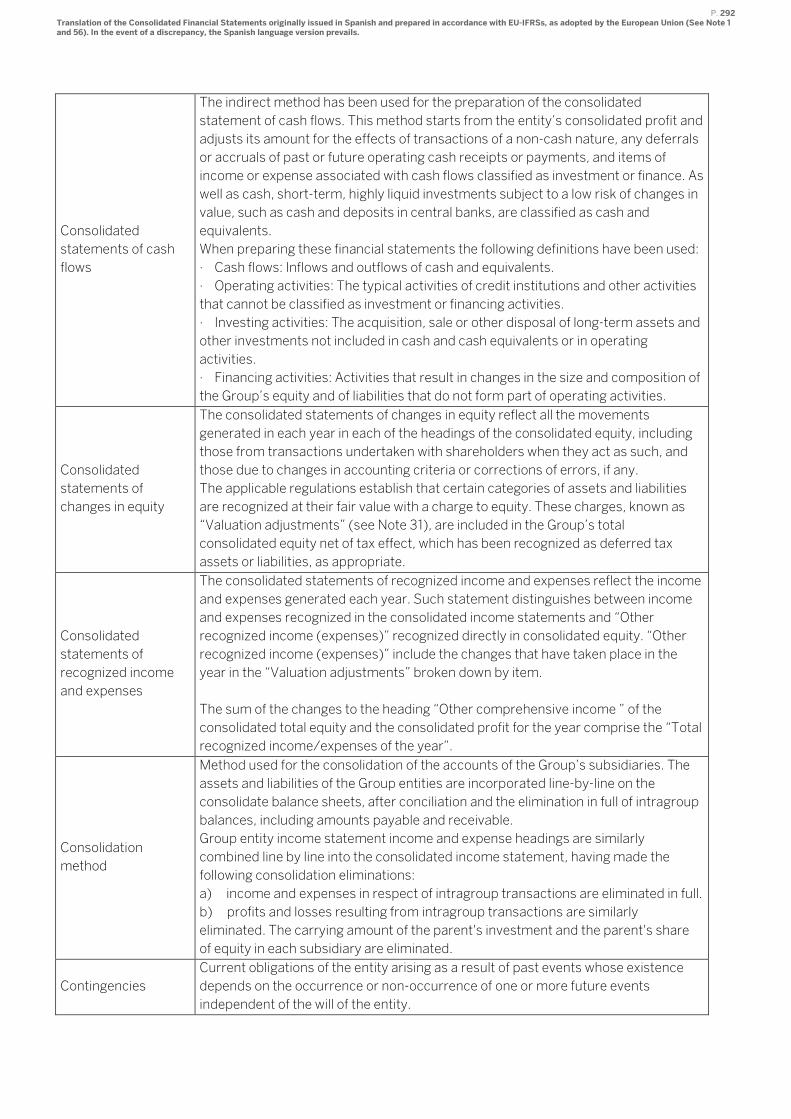
P. 292 Translation of the Consolidated Financial Statements originally issued in Spanish and prepared in accordance with EU-IFRSs, as adopted by the European Union (See Note 1 and 56). In the event of a discrepancy, the Spanish language version prevails.
Consolidated
statements of cash
flows
The indirect method has been used for the preparation of the consolidated
statement of cash flows. This method starts from the entity’s consolidated profit and
adjusts its amount for the effects of transactions of a non-cash nature, any deferrals
or accruals of past or future operating cash receipts or payments, and items of
income or expense associated with cash flows classified as investment or finance. As
well as cash, short-term, highly liquid investments subject to a low risk of changes in
value, such as cash and deposits in central banks, are classified as cash and
equivalents.
When preparing these financial statements the following definitions have been used:
· Cash flows: Inflows and outflows of cash and equivalents.
· Operating activities: The typical activities of credit institutions and other activities
that cannot be classified as investment or financing activities.
· Investing activities: The acquisition, sale or other disposal of long-term assets and
other investments not included in cash and cash equivalents or in operating
activities.
· Financing activities: Activities that result in changes in the size and composition of
the Group’s equity and of liabilities that do not form part of operating activities.
Consolidated
statements of
changes in equity
The consolidated statements of changes in equity reflect all the movements
generated in each year in each of the headings of the consolidated equity, including
those from transactions undertaken with shareholders when they act as such, and
those due to changes in accounting criteria or corrections of errors, if any.
The applicable regulations establish that certain categories of assets and liabilities
are recognized at their fair value with a charge to equity. These charges, known as
“Valuation adjustments” (see Note 31), are included in the Group’s total
consolidated equity net of tax effect, which has been recognized as deferred tax
assets or liabilities, as appropriate.
Consolidated
statements of
recognized income
and expenses
The consolidated statements of recognized income and expenses reflect the income
and expenses generated each year. Such statement distinguishes between income
and expenses recognized in the consolidated income statements and “Other
recognized income (expenses)” recognized directly in consolidated equity. “Other
recognized income (expenses)” include the changes that have taken place in the
year in the “Valuation adjustments” broken down by item.
The sum of the changes to the heading “Other comprehensive income ” of the
consolidated total equity and the consolidated profit for the year comprise the “Total
recognized income/expenses of the year”.
Consolidation
method
Method used for the consolidation of the accounts of the Group’s subsidiaries. The
assets and liabilities of the Group entities are incorporated line-by-line on the
consolidate balance sheets, after conciliation and the elimination in full of intragroup
balances, including amounts payable and receivable.
Group entity income statement income and expense headings are similarly
combined line by line into the consolidated income statement, having made the
following consolidation eliminations:
a) income and expenses in respect of intragroup transactions are eliminated in full.
b) profits and losses resulting from intragroup transactions are similarly
eliminated. The carrying amount of the parent's investment and the parent's share
of equity in each subsidiary are eliminated.
Contingencies
Current obligations of the entity arising as a result of past events whose existence
depends on the occurrence or non-occurrence of one or more future events
independent of the will of the entity.
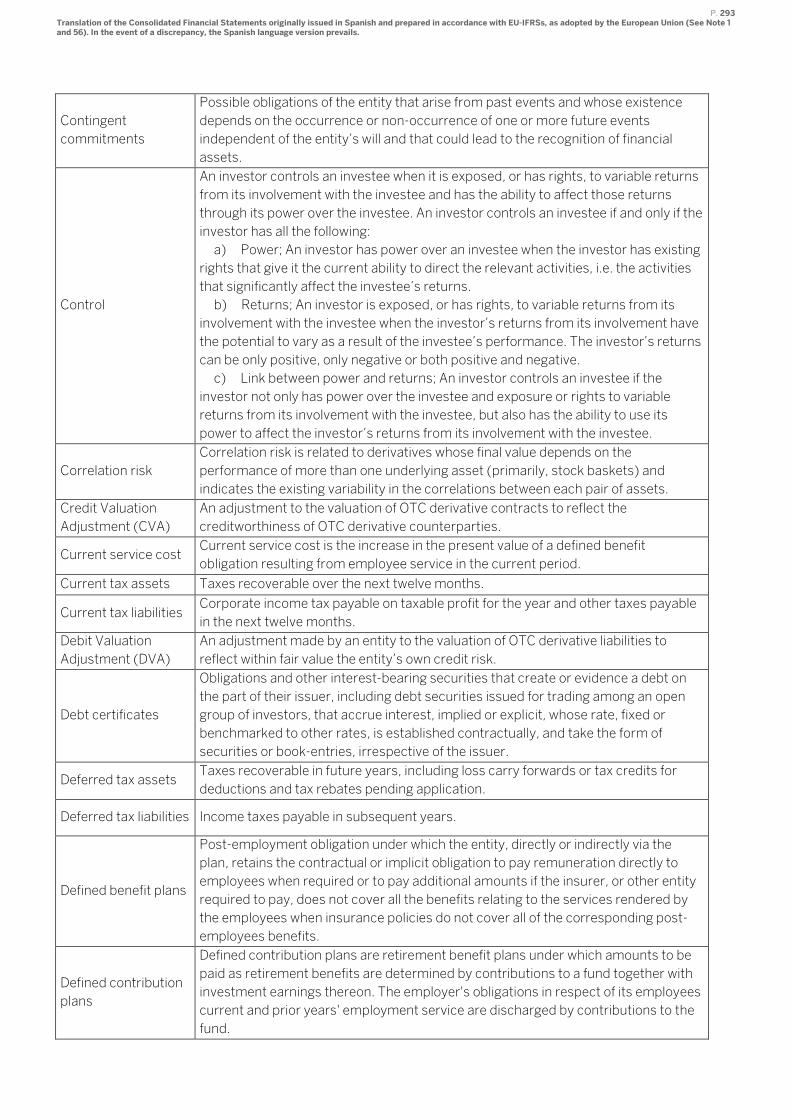
P. 293 Translation of the Consolidated Financial Statements originally issued in Spanish and prepared in accordance with EU-IFRSs, as adopted by the European Union (See Note 1 and 56). In the event of a discrepancy, the Spanish language version prevails.
Contingent
commitments
Possible obligations of the entity that arise from past events and whose existence
depends on the occurrence or non-occurrence of one or more future events
independent of the entity’s will and that could lead to the recognition of financial
assets.
Control
An investor controls an investee when it is exposed, or has rights, to variable returns
from its involvement with the investee and has the ability to affect those returns
through its power over the investee. An investor controls an investee if and only if the
investor has all the following:
a) Power; An investor has power over an investee when the investor has existing
rights that give it the current ability to direct the relevant activities, i.e. the activities
that significantly affect the investee’s returns.
b) Returns; An investor is exposed, or has rights, to variable returns from its
involvement with the investee when the investor’s returns from its involvement have
the potential to vary as a result of the investee’s performance. The investor’s returns
can be only positive, only negative or both positive and negative.
c) Link between power and returns; An investor controls an investee if the
investor not only has power over the investee and exposure or rights to variable
returns from its involvement with the investee, but also has the ability to use its
power to affect the investor’s returns from its involvement with the investee.
Correlation risk
Correlation risk is related to derivatives whose final value depends on the
performance of more than one underlying asset (primarily, stock baskets) and
indicates the existing variability in the correlations between each pair of assets.
Credit Valuation
Adjustment (CVA)
An adjustment to the valuation of OTC derivative contracts to reflect the
creditworthiness of OTC derivative counterparties.
Current service cost Current service cost is the increase in the present value of a defined benefit
obligation resulting from employee service in the current period.
Current tax assets Taxes recoverable over the next twelve months.
Current tax liabilities Corporate income tax payable on taxable profit for the year and other taxes payable
in the next twelve months.
Debit Valuation
Adjustment (DVA)
An adjustment made by an entity to the valuation of OTC derivative liabilities to
reflect within fair value the entity’s own credit risk.
Debt certificates
Obligations and other interest-bearing securities that create or evidence a debt on
the part of their issuer, including debt securities issued for trading among an open
group of investors, that accrue interest, implied or explicit, whose rate, fixed or
benchmarked to other rates, is established contractually, and take the form of
securities or book-entries, irrespective of the issuer.
Deferred tax assets Taxes recoverable in future years, including loss carry forwards or tax credits for
deductions and tax rebates pending application.
Deferred tax liabilities Income taxes payable in subsequent years.
Defined benefit plans
Post-employment obligation under which the entity, directly or indirectly via the
plan, retains the contractual or implicit obligation to pay remuneration directly to
employees when required or to pay additional amounts if the insurer, or other entity
required to pay, does not cover all the benefits relating to the services rendered by
the employees when insurance policies do not cover all of the corresponding post-
employees benefits.
Defined contribution
plans
Defined contribution plans are retirement benefit plans under which amounts to be
paid as retirement benefits are determined by contributions to a fund together with
investment earnings thereon. The employer's obligations in respect of its employees
current and prior years' employment service are discharged by contributions to the
fund.
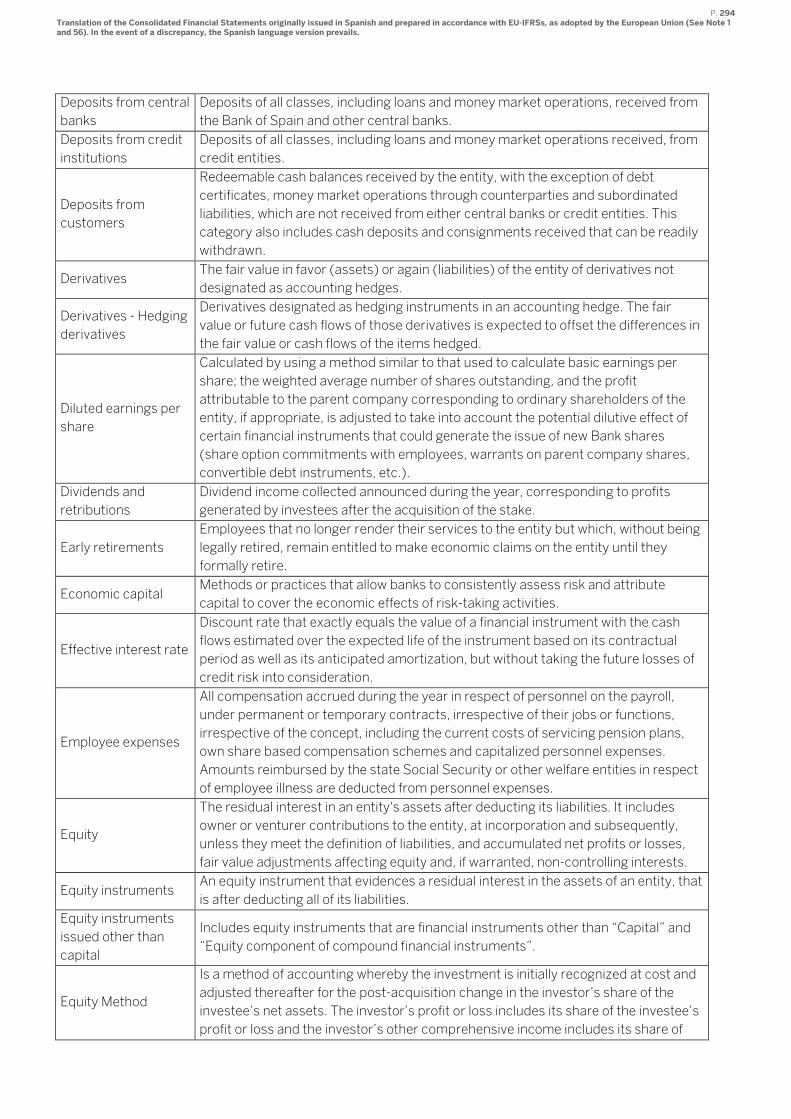
P. 294 Translation of the Consolidated Financial Statements originally issued in Spanish and prepared in accordance with EU-IFRSs, as adopted by the European Union (See Note 1 and 56). In the event of a discrepancy, the Spanish language version prevails.
Deposits from central
banks
Deposits of all classes, including loans and money market operations, received from
the Bank of Spain and other central banks.
Deposits from credit
institutions
Deposits of all classes, including loans and money market operations received, from
credit entities.
Deposits from
customers
Redeemable cash balances received by the entity, with the exception of debt
certificates, money market operations through counterparties and subordinated
liabilities, which are not received from either central banks or credit entities. This
category also includes cash deposits and consignments received that can be readily
withdrawn.
Derivatives The fair value in favor (assets) or again (liabilities) of the entity of derivatives not
designated as accounting hedges.
Derivatives - Hedging
derivatives
Derivatives designated as hedging instruments in an accounting hedge. The fair
value or future cash flows of those derivatives is expected to offset the differences in
the fair value or cash flows of the items hedged.
Diluted earnings per
share
Calculated by using a method similar to that used to calculate basic earnings per
share; the weighted average number of shares outstanding, and the profit
attributable to the parent company corresponding to ordinary shareholders of the
entity, if appropriate, is adjusted to take into account the potential dilutive effect of
certain financial instruments that could generate the issue of new Bank shares
(share option commitments with employees, warrants on parent company shares,
convertible debt instruments, etc.).
Dividends and
retributions
Dividend income collected announced during the year, corresponding to profits
generated by investees after the acquisition of the stake.
Early retirements
Employees that no longer render their services to the entity but which, without being
legally retired, remain entitled to make economic claims on the entity until they
formally retire.
Economic capital Methods or practices that allow banks to consistently assess risk and attribute
capital to cover the economic effects of risk-taking activities.
Effective interest rate
Discount rate that exactly equals the value of a financial instrument with the cash
flows estimated over the expected life of the instrument based on its contractual
period as well as its anticipated amortization, but without taking the future losses of
credit risk into consideration.
Employee expenses
All compensation accrued during the year in respect of personnel on the payroll,
under permanent or temporary contracts, irrespective of their jobs or functions,
irrespective of the concept, including the current costs of servicing pension plans,
own share based compensation schemes and capitalized personnel expenses.
Amounts reimbursed by the state Social Security or other welfare entities in respect
of employee illness are deducted from personnel expenses.
Equity
The residual interest in an entity's assets after deducting its liabilities. It includes
owner or venturer contributions to the entity, at incorporation and subsequently,
unless they meet the definition of liabilities, and accumulated net profits or losses,
fair value adjustments affecting equity and, if warranted, non-controlling interests.
Equity instruments An equity instrument that evidences a residual interest in the assets of an entity, that
is after deducting all of its liabilities.
Equity instruments
issued other than
capital
Includes equity instruments that are financial instruments other than “Capital” and
“Equity component of compound financial instruments”.
Equity Method
Is a method of accounting whereby the investment is initially recognized at cost and
adjusted thereafter for the post-acquisition change in the investor’s share of the
investee’s net assets. The investor’s profit or loss includes its share of the investee’s
profit or loss and the investor’s other comprehensive income includes its share of
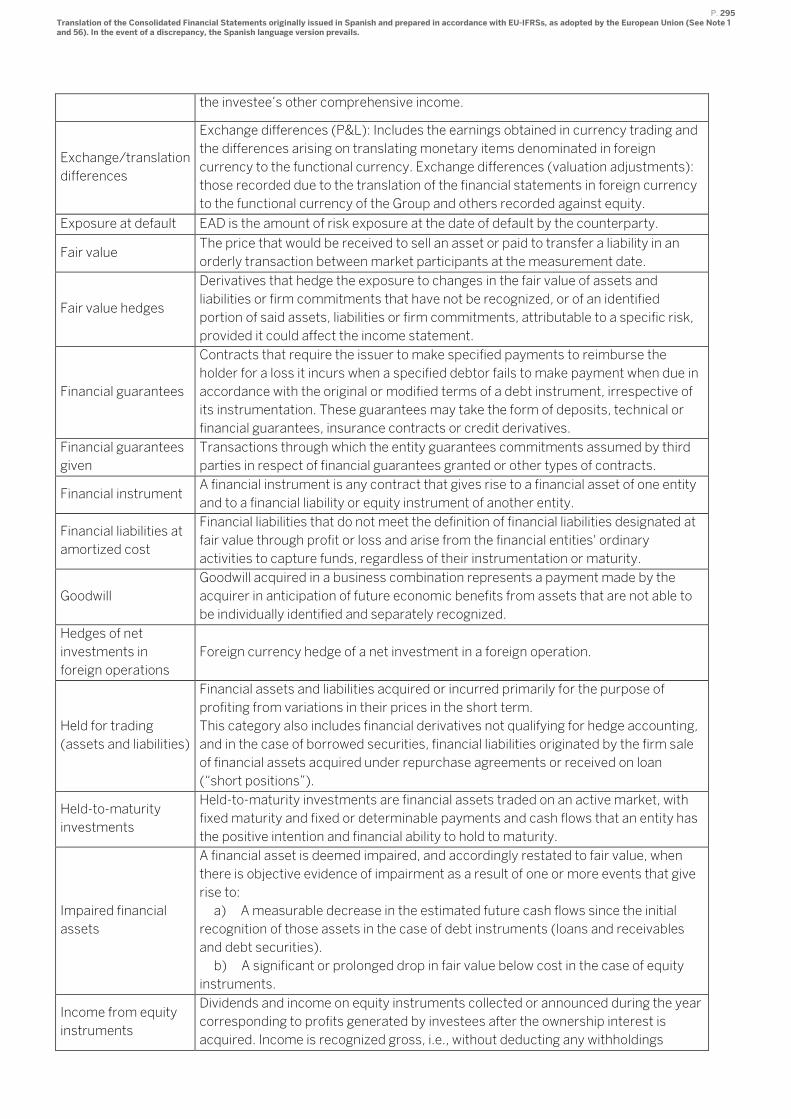
P. 295 Translation of the Consolidated Financial Statements originally issued in Spanish and prepared in accordance with EU-IFRSs, as adopted by the European Union (See Note 1 and 56). In the event of a discrepancy, the Spanish language version prevails.
the investee’s other comprehensive income.
Exchange/translation
differences
Exchange differences (P&L): Includes the earnings obtained in currency trading and
the differences arising on translating monetary items denominated in foreign
currency to the functional currency. Exchange differences (valuation adjustments):
those recorded due to the translation of the financial statements in foreign currency
to the functional currency of the Group and others recorded against equity.
Exposure at default EAD is the amount of risk exposure at the date of default by the counterparty.
Fair value The price that would be received to sell an asset or paid to transfer a liability in an
orderly transaction between market participants at the measurement date.
Fair value hedges
Derivatives that hedge the exposure to changes in the fair value of assets and
liabilities or firm commitments that have not be recognized, or of an identified
portion of said assets, liabilities or firm commitments, attributable to a specific risk,
provided it could affect the income statement.
Financial guarantees
Contracts that require the issuer to make specified payments to reimburse the
holder for a loss it incurs when a specified debtor fails to make payment when due in
accordance with the original or modified terms of a debt instrument, irrespective of
its instrumentation. These guarantees may take the form of deposits, technical or
financial guarantees, insurance contracts or credit derivatives.
Financial guarantees
given
Transactions through which the entity guarantees commitments assumed by third
parties in respect of financial guarantees granted or other types of contracts.
Financial instrument A financial instrument is any contract that gives rise to a financial asset of one entity
and to a financial liability or equity instrument of another entity.
Financial liabilities at
amortized cost
Financial liabilities that do not meet the definition of financial liabilities designated at
fair value through profit or loss and arise from the financial entities' ordinary
activities to capture funds, regardless of their instrumentation or maturity.
Goodwill
Goodwill acquired in a business combination represents a payment made by the
acquirer in anticipation of future economic benefits from assets that are not able to
be individually identified and separately recognized.
Hedges of net
investments in
foreign operations
Foreign currency hedge of a net investment in a foreign operation.
Held for trading
(assets and liabilities)
Financial assets and liabilities acquired or incurred primarily for the purpose of
profiting from variations in their prices in the short term.
This category also includes financial derivatives not qualifying for hedge accounting,
and in the case of borrowed securities, financial liabilities originated by the firm sale
of financial assets acquired under repurchase agreements or received on loan
(“short positions”).
Held-to-maturity
investments
Held-to-maturity investments are financial assets traded on an active market, with
fixed maturity and fixed or determinable payments and cash flows that an entity has
the positive intention and financial ability to hold to maturity.
Impaired financial
assets
A financial asset is deemed impaired, and accordingly restated to fair value, when
there is objective evidence of impairment as a result of one or more events that give
rise to:
a) A measurable decrease in the estimated future cash flows since the initial
recognition of those assets in the case of debt instruments (loans and receivables
and debt securities).
b) A significant or prolonged drop in fair value below cost in the case of equity
instruments.
Income from equity
instruments
Dividends and income on equity instruments collected or announced during the year
corresponding to profits generated by investees after the ownership interest is
acquired. Income is recognized gross, i.e., without deducting any withholdings
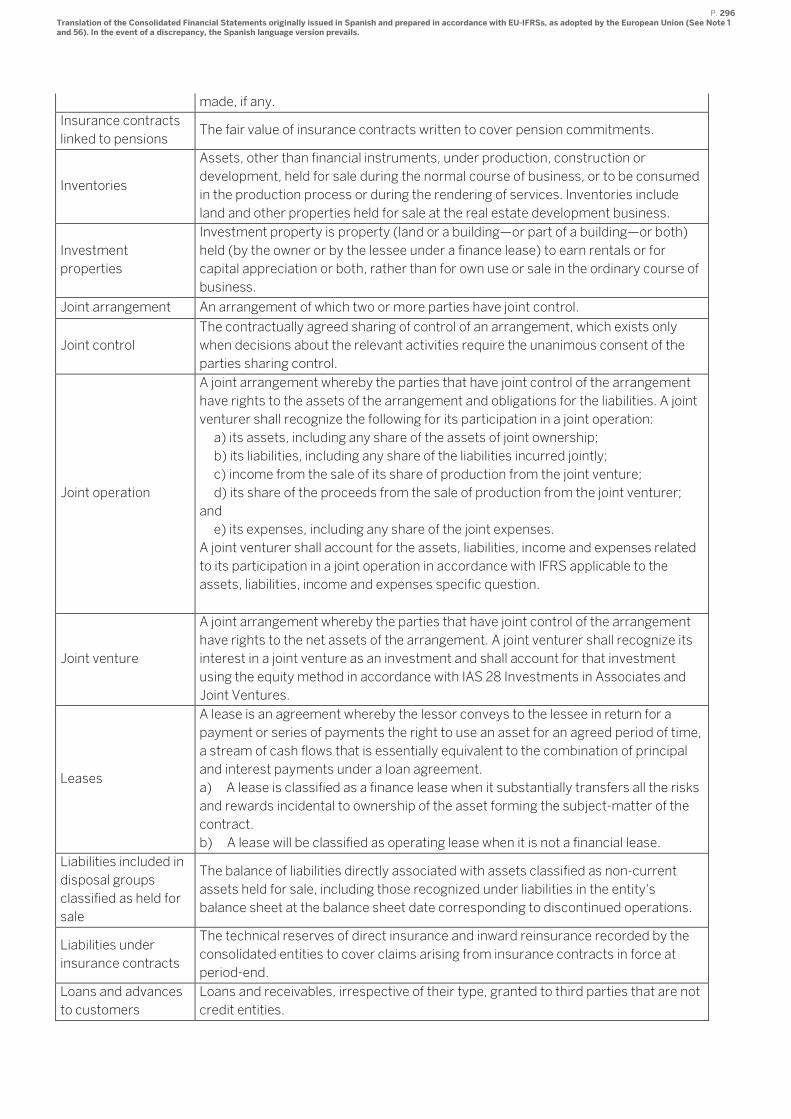
P. 296 Translation of the Consolidated Financial Statements originally issued in Spanish and prepared in accordance with EU-IFRSs, as adopted by the European Union (See Note 1 and 56). In the event of a discrepancy, the Spanish language version prevails.
made, if any.
Insurance contracts
linked to pensions The fair value of insurance contracts written to cover pension commitments.
Inventories
Assets, other than financial instruments, under production, construction or
development, held for sale during the normal course of business, or to be consumed
in the production process or during the rendering of services. Inventories include
land and other properties held for sale at the real estate development business.
Investment
properties
Investment property is property (land or a building—or part of a building—or both)
held (by the owner or by the lessee under a finance lease) to earn rentals or for
capital appreciation or both, rather than for own use or sale in the ordinary course of
business.
Joint arrangement An arrangement of which two or more parties have joint control.
Joint control
The contractually agreed sharing of control of an arrangement, which exists only
when decisions about the relevant activities require the unanimous consent of the
parties sharing control.
Joint operation
A joint arrangement whereby the parties that have joint control of the arrangement
have rights to the assets of the arrangement and obligations for the liabilities. A joint
venturer shall recognize the following for its participation in a joint operation:
a) its assets, including any share of the assets of joint ownership;
b) its liabilities, including any share of the liabilities incurred jointly;
c) income from the sale of its share of production from the joint venture;
d) its share of the proceeds from the sale of production from the joint venturer;
and
e) its expenses, including any share of the joint expenses.
A joint venturer shall account for the assets, liabilities, income and expenses related
to its participation in a joint operation in accordance with IFRS applicable to the
assets, liabilities, income and expenses specific question.
Joint venture
A joint arrangement whereby the parties that have joint control of the arrangement
have rights to the net assets of the arrangement. A joint venturer shall recognize its
interest in a joint venture as an investment and shall account for that investment
using the equity method in accordance with IAS 28 Investments in Associates and
Joint Ventures.
Leases
A lease is an agreement whereby the lessor conveys to the lessee in return for a
payment or series of payments the right to use an asset for an agreed period of time,
a stream of cash flows that is essentially equivalent to the combination of principal
and interest payments under a loan agreement.
a) A lease is classified as a finance lease when it substantially transfers all the risks
and rewards incidental to ownership of the asset forming the subject-matter of the
contract.
b) A lease will be classified as operating lease when it is not a financial lease.
Liabilities included in
disposal groups
classified as held for
sale
The balance of liabilities directly associated with assets classified as non-current
assets held for sale, including those recognized under liabilities in the entity's
balance sheet at the balance sheet date corresponding to discontinued operations.
Liabilities under
insurance contracts
The technical reserves of direct insurance and inward reinsurance recorded by the
consolidated entities to cover claims arising from insurance contracts in force at
period-end.
Loans and advances
to customers
Loans and receivables, irrespective of their type, granted to third parties that are not
credit entities.
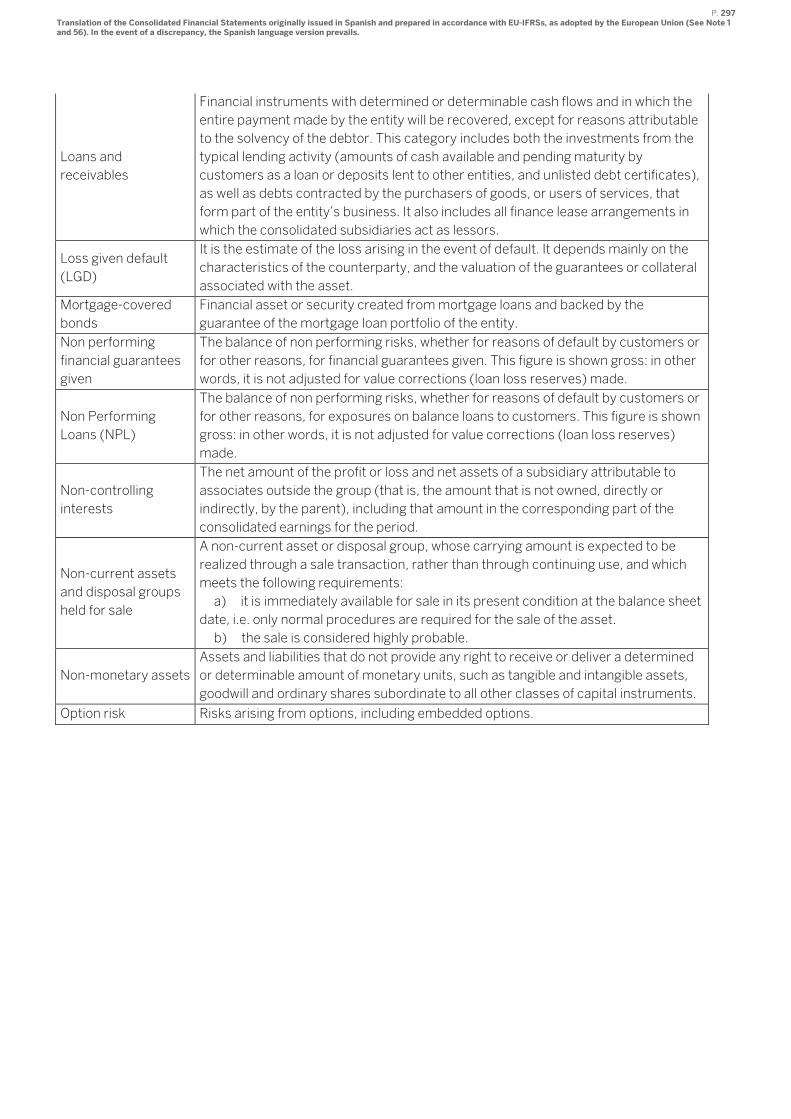
P. 297 Translation of the Consolidated Financial Statements originally issued in Spanish and prepared in accordance with EU-IFRSs, as adopted by the European Union (See Note 1 and 56). In the event of a discrepancy, the Spanish language version prevails.
Loans and
receivables
Financial instruments with determined or determinable cash flows and in which the
entire payment made by the entity will be recovered, except for reasons attributable
to the solvency of the debtor. This category includes both the investments from the
typical lending activity (amounts of cash available and pending maturity by
customers as a loan or deposits lent to other entities, and unlisted debt certificates),
as well as debts contracted by the purchasers of goods, or users of services, that
form part of the entity’s business. It also includes all finance lease arrangements in
which the consolidated subsidiaries act as lessors.
Loss given default
(LGD)
It is the estimate of the loss arising in the event of default. It depends mainly on the
characteristics of the counterparty, and the valuation of the guarantees or collateral
associated with the asset.
Mortgage-covered
bonds
Financial asset or security created from mortgage loans and backed by the
guarantee of the mortgage loan portfolio of the entity.
Non performing
financial guarantees
given
The balance of non performing risks, whether for reasons of default by customers or
for other reasons, for financial guarantees given. This figure is shown gross: in other
words, it is not adjusted for value corrections (loan loss reserves) made.
Non Performing
Loans (NPL)
The balance of non performing risks, whether for reasons of default by customers or
for other reasons, for exposures on balance loans to customers. This figure is shown
gross: in other words, it is not adjusted for value corrections (loan loss reserves)
made.
Non-controlling
interests
The net amount of the profit or loss and net assets of a subsidiary attributable to
associates outside the group (that is, the amount that is not owned, directly or
indirectly, by the parent), including that amount in the corresponding part of the
consolidated earnings for the period.
Non-current assets
and disposal groups
held for sale
A non-current asset or disposal group, whose carrying amount is expected to be
realized through a sale transaction, rather than through continuing use, and which
meets the following requirements:
a) it is immediately available for sale in its present condition at the balance sheet
date, i.e. only normal procedures are required for the sale of the asset.
b) the sale is considered highly probable.
Non-monetary assets
Assets and liabilities that do not provide any right to receive or deliver a determined
or determinable amount of monetary units, such as tangible and intangible assets,
goodwill and ordinary shares subordinate to all other classes of capital instruments.
Option risk Risks arising from options, including embedded options.

P. 298 Translation of the Consolidated Financial Statements originally issued in Spanish and prepared in accordance with EU-IFRSs, as adopted by the European Union (See Note 1 and 56). In the event of a discrepancy, the Spanish language version prevails.
Other financial
assets/liabilities at
fair value through
profit or loss
Instruments designated by the entity from the inception at fair value with changes in
profit or loss.
An entity may only designate a financial instrument at fair value through profit or
loss, if doing so more relevant information is obtained, because:
a) It eliminates or significantly reduces a measurement or recognition
inconsistency (sometimes called "accounting mismatch") that would otherwise arise
from measuring assets or liabilities or recognizing the gains and losses on them on
different bases. It might be acceptable to designate only some of a number of similar
financial assets or financial liabilities if doing so a significant reduction (and possibly
a greater reduction than other allowable designations) in the inconsistency is
achieved.
b) The performance of a group of financial assets or financial liabilities is managed
and evaluated on a fair value basis, in accordance with a documented risk
management or investment strategy, and information about the group is provided
internally on that basis to the entity´s key management personnel.
These are financial assets managed jointly with “Liabilities under insurance and
reinsurance contracts” measured at fair value, in combination with derivatives
written with a view to significantly mitigating exposure to changes in these contracts'
fair value, or in combination with financial liabilities and derivatives designed to
significantly reduce global exposure to interest rate risk.
These headings include customer loans and deposits effected via so-called unit-
linked life insurance contracts, in which the policyholder assumes the investment
risk.
Other Reserves
This heading is broken down as follows:
i) Reserves or accumulated losses of investments in subsidiaries, joint ventures and
associate: include the accumulated amount of income and expenses generated by
the aforementioned investments through profit or loss in past years.
ii) Other: includes reserves different from those separately disclosed in other items
and may include legal reserve and statutory reserve.
Other retributions to
employees long term Includes the amount of compensation plans to employees long term.
Own/treasury shares The amount of own equity instruments held by the entity.
Past service cost
It is the change in the present value of the defined benefit obligation for employee
service in prior periods, resulting in the current period from the introduction of, or
changes to, post-employment benefits or other long-term employee benefits.
Post-employment
benefits
Retirement benefit plans are arrangements whereby an enterprise provides benefits
for its employees on or after termination of service.
Probability of default
(PD)
It is the probability of the counterparty failing to meet its principal and/or interest
payment obligations. The PD is associated with the rating/scoring of each
counterparty/transaction.
Property, plant and
equipment/tangible
assets
Buildings, land, fixtures, vehicles, computer equipment and other facilities owned by
the entity or acquired under finance leases.
Provisions
Provisions include amounts recognized to cover the Group’s current obligations
arising as a result of past events, certain in terms of nature but uncertain in terms of
amount and/or cancellation date.
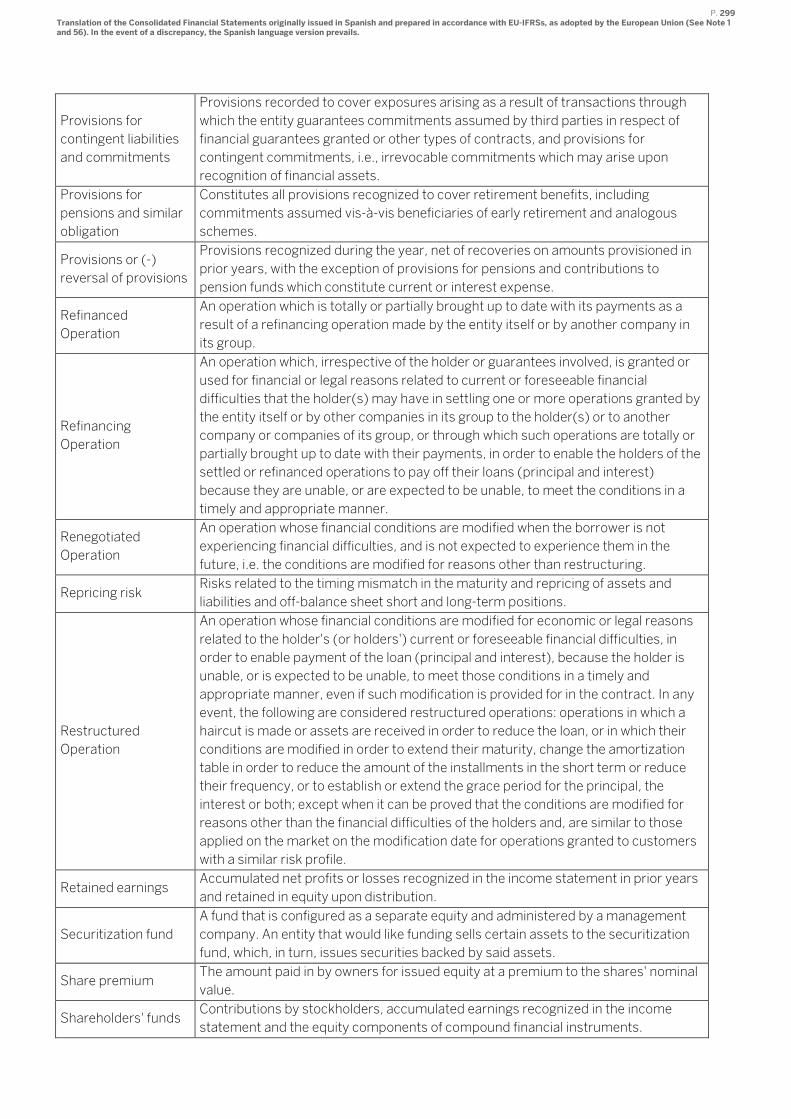
P. 299 Translation of the Consolidated Financial Statements originally issued in Spanish and prepared in accordance with EU-IFRSs, as adopted by the European Union (See Note 1 and 56). In the event of a discrepancy, the Spanish language version prevails.
Provisions for
contingent liabilities
and commitments
Provisions recorded to cover exposures arising as a result of transactions through
which the entity guarantees commitments assumed by third parties in respect of
financial guarantees granted or other types of contracts, and provisions for
contingent commitments, i.e., irrevocable commitments which may arise upon
recognition of financial assets.
Provisions for
pensions and similar
obligation
Constitutes all provisions recognized to cover retirement benefits, including
commitments assumed vis-à-vis beneficiaries of early retirement and analogous
schemes.
Provisions or (-)
reversal of provisions
Provisions recognized during the year, net of recoveries on amounts provisioned in
prior years, with the exception of provisions for pensions and contributions to
pension funds which constitute current or interest expense.
Refinanced
Operation
An operation which is totally or partially brought up to date with its payments as a
result of a refinancing operation made by the entity itself or by another company in
its group.
Refinancing
Operation
An operation which, irrespective of the holder or guarantees involved, is granted or
used for financial or legal reasons related to current or foreseeable financial
difficulties that the holder(s) may have in settling one or more operations granted by
the entity itself or by other companies in its group to the holder(s) or to another
company or companies of its group, or through which such operations are totally or
partially brought up to date with their payments, in order to enable the holders of the
settled or refinanced operations to pay off their loans (principal and interest)
because they are unable, or are expected to be unable, to meet the conditions in a
timely and appropriate manner.
Renegotiated
Operation
An operation whose financial conditions are modified when the borrower is not
experiencing financial difficulties, and is not expected to experience them in the
future, i.e. the conditions are modified for reasons other than restructuring.
Repricing risk Risks related to the timing mismatch in the maturity and repricing of assets and
liabilities and off-balance sheet short and long-term positions.
Restructured
Operation
An operation whose financial conditions are modified for economic or legal reasons
related to the holder's (or holders') current or foreseeable financial difficulties, in
order to enable payment of the loan (principal and interest), because the holder is
unable, or is expected to be unable, to meet those conditions in a timely and
appropriate manner, even if such modification is provided for in the contract. In any
event, the following are considered restructured operations: operations in which a
haircut is made or assets are received in order to reduce the loan, or in which their
conditions are modified in order to extend their maturity, change the amortization
table in order to reduce the amount of the installments in the short term or reduce
their frequency, or to establish or extend the grace period for the principal, the
interest or both; except when it can be proved that the conditions are modified for
reasons other than the financial difficulties of the holders and, are similar to those
applied on the market on the modification date for operations granted to customers
with a similar risk profile.
Retained earnings Accumulated net profits or losses recognized in the income statement in prior years
and retained in equity upon distribution.
Securitization fund
A fund that is configured as a separate equity and administered by a management
company. An entity that would like funding sells certain assets to the securitization
fund, which, in turn, issues securities backed by said assets.
Share premium The amount paid in by owners for issued equity at a premium to the shares' nominal
value.
Shareholders' funds Contributions by stockholders, accumulated earnings recognized in the income
statement and the equity components of compound financial instruments.
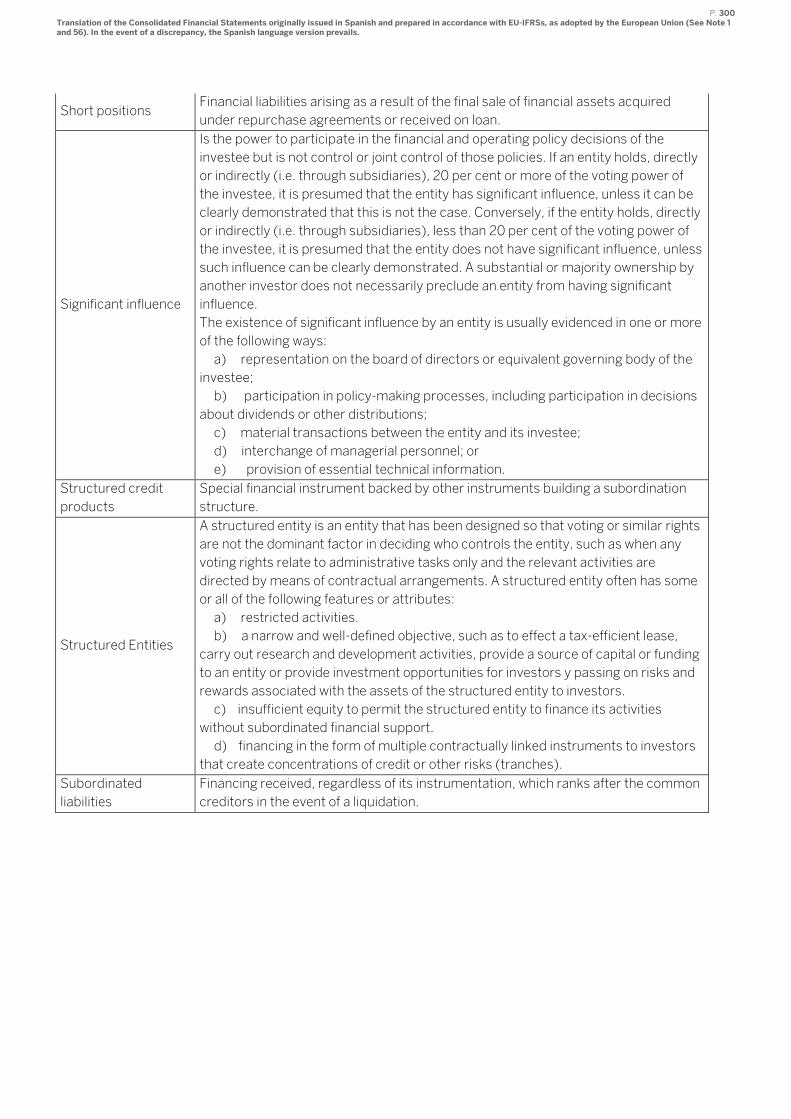
P. 300 Translation of the Consolidated Financial Statements originally issued in Spanish and prepared in accordance with EU-IFRSs, as adopted by the European Union (See Note 1 and 56). In the event of a discrepancy, the Spanish language version prevails.
Short positions Financial liabilities arising as a result of the final sale of financial assets acquired
under repurchase agreements or received on loan.
Significant influence
Is the power to participate in the financial and operating policy decisions of the
investee but is not control or joint control of those policies. If an entity holds, directly
or indirectly (i.e. through subsidiaries), 20 per cent or more of the voting power of
the investee, it is presumed that the entity has significant influence, unless it can be
clearly demonstrated that this is not the case. Conversely, if the entity holds, directly
or indirectly (i.e. through subsidiaries), less than 20 per cent of the voting power of
the investee, it is presumed that the entity does not have significant influence, unless
such influence can be clearly demonstrated. A substantial or majority ownership by
another investor does not necessarily preclude an entity from having significant
influence.
The existence of significant influence by an entity is usually evidenced in one or more
of the following ways:
a) representation on the board of directors or equivalent governing body of the
investee;
b) participation in policy-making processes, including participation in decisions
about dividends or other distributions;
c) material transactions between the entity and its investee;
d) interchange of managerial personnel; or
e) provision of essential technical information.
Structured credit
products
Special financial instrument backed by other instruments building a subordination
structure.
Structured Entities
A structured entity is an entity that has been designed so that voting or similar rights
are not the dominant factor in deciding who controls the entity, such as when any
voting rights relate to administrative tasks only and the relevant activities are
directed by means of contractual arrangements. A structured entity often has some
or all of the following features or attributes:
a) restricted activities.
b) a narrow and well-defined objective, such as to effect a tax-efficient lease,
carry out research and development activities, provide a source of capital or funding
to an entity or provide investment opportunities for investors y passing on risks and
rewards associated with the assets of the structured entity to investors.
c) insufficient equity to permit the structured entity to finance its activities
without subordinated financial support.
d) financing in the form of multiple contractually linked instruments to investors
that create concentrations of credit or other risks (tranches).
Subordinated
liabilities
Financing received, regardless of its instrumentation, which ranks after the common
creditors in the event of a liquidation.
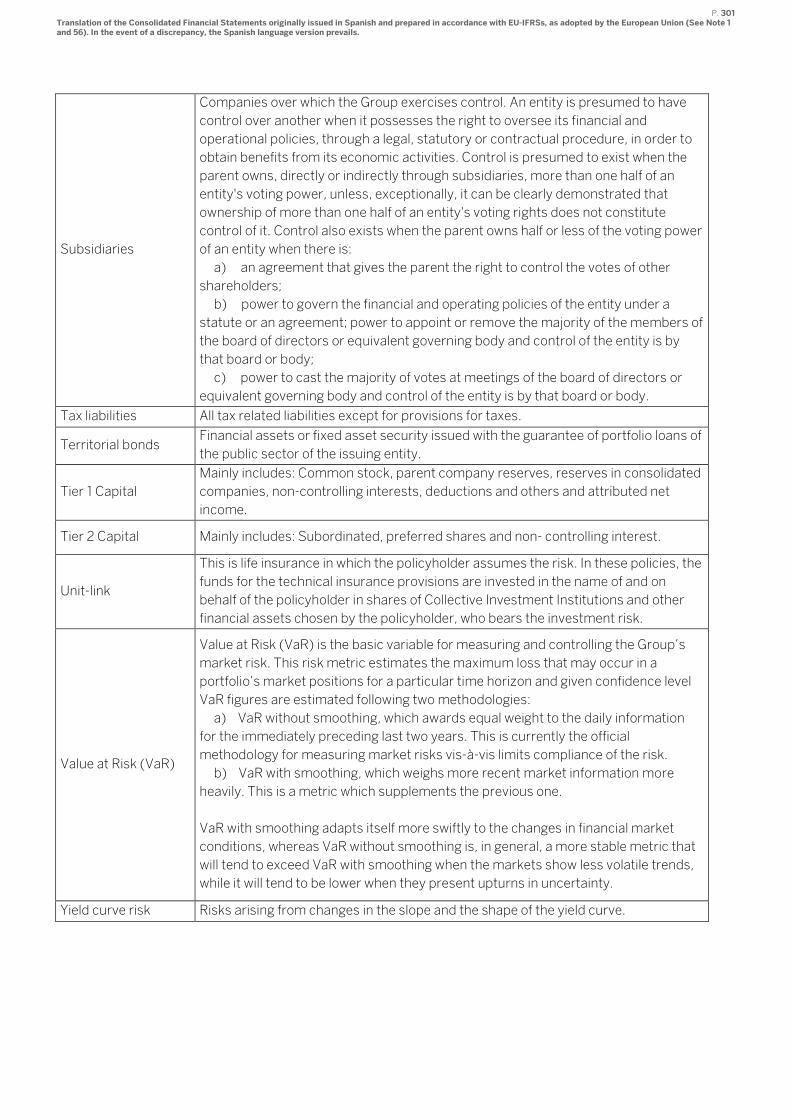
P. 301 Translation of the Consolidated Financial Statements originally issued in Spanish and prepared in accordance with EU-IFRSs, as adopted by the European Union (See Note 1 and 56). In the event of a discrepancy, the Spanish language version prevails.
Subsidiaries
Companies over which the Group exercises control. An entity is presumed to have
control over another when it possesses the right to oversee its financial and
operational policies, through a legal, statutory or contractual procedure, in order to
obtain benefits from its economic activities. Control is presumed to exist when the
parent owns, directly or indirectly through subsidiaries, more than one half of an
entity's voting power, unless, exceptionally, it can be clearly demonstrated that
ownership of more than one half of an entity's voting rights does not constitute
control of it. Control also exists when the parent owns half or less of the voting power
of an entity when there is:
a) an agreement that gives the parent the right to control the votes of other
shareholders;
b) power to govern the financial and operating policies of the entity under a
statute or an agreement; power to appoint or remove the majority of the members of
the board of directors or equivalent governing body and control of the entity is by
that board or body;
c) power to cast the majority of votes at meetings of the board of directors or
equivalent governing body and control of the entity is by that board or body.
Tax liabilities All tax related liabilities except for provisions for taxes.
Territorial bonds Financial assets or fixed asset security issued with the guarantee of portfolio loans of
the public sector of the issuing entity.
Tier 1 Capital
Mainly includes: Common stock, parent company reserves, reserves in consolidated
companies, non-controlling interests, deductions and others and attributed net
income.
Tier 2 Capital Mainly includes: Subordinated, preferred shares and non- controlling interest.
Unit-link
This is life insurance in which the policyholder assumes the risk. In these policies, the
funds for the technical insurance provisions are invested in the name of and on
behalf of the policyholder in shares of Collective Investment Institutions and other
financial assets chosen by the policyholder, who bears the investment risk.
Value at Risk (VaR)
Value at Risk (VaR) is the basic variable for measuring and controlling the Group’s
market risk. This risk metric estimates the maximum loss that may occur in a
portfolio’s market positions for a particular time horizon and given confidence level
VaR figures are estimated following two methodologies:
a) VaR without smoothing, which awards equal weight to the daily information
for the immediately preceding last two years. This is currently the official
methodology for measuring market risks vis-à-vis limits compliance of the risk.
b) VaR with smoothing, which weighs more recent market information more
heavily. This is a metric which supplements the previous one.
VaR with smoothing adapts itself more swiftly to the changes in financial market
conditions, whereas VaR without smoothing is, in general, a more stable metric that
will tend to exceed VaR with smoothing when the markets show less volatile trends,
while it will tend to be lower when they present upturns in uncertainty.
Yield curve risk Risks arising from changes in the slope and the shape of the yield curve.
Management Report2017

2017
Contents
Introduction 4
About BBVA 4
Business organizational chart and structure 5
Environment 6
Strategy and business model 10
Vision and aspiration 10
Progress in BBVA’s transformation journey 12
Our Values 15
Innovation and technology 16
Responsible banking model 17
Group information 18
BBVA Group highlights 18
Relevant events 19
Results 20
Balance sheet and business activity 26
Solvency 28
Risk management 30
The BBVA share 33
Business areas 35
Banking activity in Spain 38
Non Core Real Estate 41
The United States 43
Mexico 46
Turkey 49
South America 52
Rest of Eurasia 55
Corporate Center 57
2017
Customer relationship 58
Customer experience 58
Customer care 60
Staff information 64
Team management 64
Professional development 65
Workplace 67
Ethical behaviour 69
Compliance system 69
Commitment to human rights 73
Sustainable finance 75
Sustainable financing 76
Management of environmental and social impacts 77
Engagement 80
Contribution to society 81
Investment in social programs 81
Fiscal transparency 83
Other information 85
Main risks and uncertainties 85
Contractual obligations and off-balance-sheet operations 85
Patents, licenses or similar 85
Subsequent events 85
Alternative Performance Measures (APMs) 86
Annual Corporate Governance Report 92
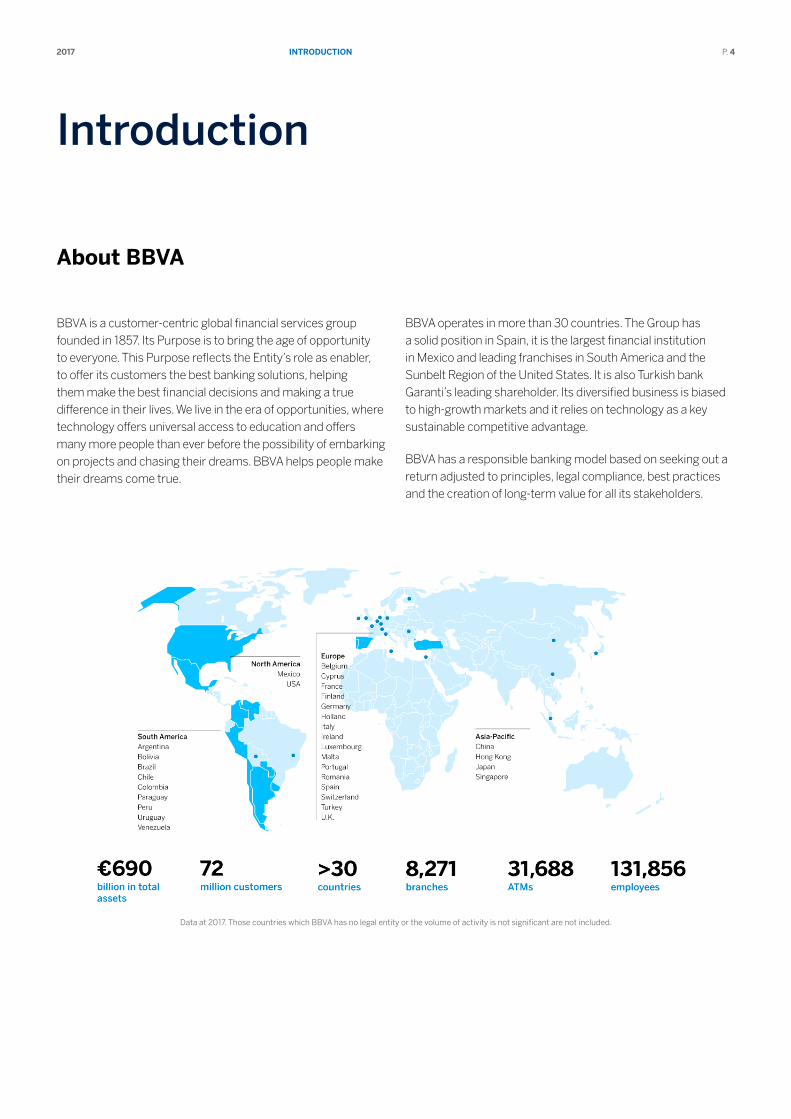
IntroductIon2017 P. 4
Introduction
About BBVA
BBVA is a customer-centric global financial services group founded in 1857. Its Purpose is to bring the age of opportunity to everyone. This Purpose reflects the Entity’s role as enabler, to offer its customers the best banking solutions, helping them make the best financial decisions and making a true difference in their lives. We live in the era of opportunities, where technology offers universal access to education and offers many more people than ever before the possibility of embarking on projects and chasing their dreams. BBVA helps people make their dreams come true.
BBVA operates in more than 30 countries. The Group has a solid position in Spain, it is the largest financial institution in Mexico and leading franchises in South America and the Sunbelt Region of the United States. It is also Turkish bank Garanti’s leading shareholder. Its diversified business is biased to high-growth markets and it relies on technology as a key sustainable competitive advantage.
BBVA has a responsible banking model based on seeking out a return adjusted to principles, legal compliance, best practices and the creation of long-term value for all its stakeholders.
Data at 2017. Those countries which BBVA has no legal entity or the volume of activity is not significant are not included.

IntroductIon2017 P. 5
Business organizational chart and structure
BBVA Group’s organizational structure has remained the same in 2017, with only one change: the creation of the global Data area. This area, which answers directly to the CEO, has been created to boost the strategic use of data in all areas of the Bank. It thus defines and implements the global data strategy, as well as creating and extending a data culture in the Bank, with the aim of speeding up BBVA’s transformation to a data-driven organization.
BBVA’s organizational structure remains divided into four types of areas: Execution & Performance, New Core Competences, Risk & Finance and Strategy & Control. The CEO is responsible for the first three functions and the Group Executive Chairman for Strategy & Control.
Corporate & Investment Banking
Juan Asúa
Country Monitoring1
Jorge Sáenz-Azcúnaga Talent & Culture
Ricardo Forcano
Engineering
Ricardo Moreno
Finance
Jaime Sáenz de Tejada
Global Risk Management Rafael Salinas
Global Economics Regulation & Public Affairs José Manuel González-Páramo
Legal & Compliance
Eduardo Arbizu
Strategy & M&A
Javier Rodríguez Soler
Accounting & Supervisors
Ricardo Gómez Barredo
Communications
Paul G. Tobin
General Secretary
Domingo Armengol
Internal Audit
José Luis de los Santos
Customer Solutions2
Derek White
Mexico
Eduardo Osuna
The United States
Onur Genç
Spain Cristina de Parias
Turkey
Fuat Erbil
CEO Carlos Torres Vila
GROUP EXECUTIVE CHAIRMAN Francisco González
EXECUTION & PERFORMANCE NEW CORE COMPETENCIES RISK & FINANCE STRATEGY & CONTROL
Data
David Puente
(1) Reporting channel to CEO for Argentina, Colombia, Chile, Peru, Venezuela, Uruguay and Paraguay, as well as monitoring of all countries, including Spain, Mexico, Turkey and The United States. (2) Integrates Global Products & Digital Sales; Design & Marketing; Data & Open Innovation; Business Development in Spain, Mexico, Turkey, The United States and South America; Distribution model; Asset Management & Global Wealth and New Digital Businesses.
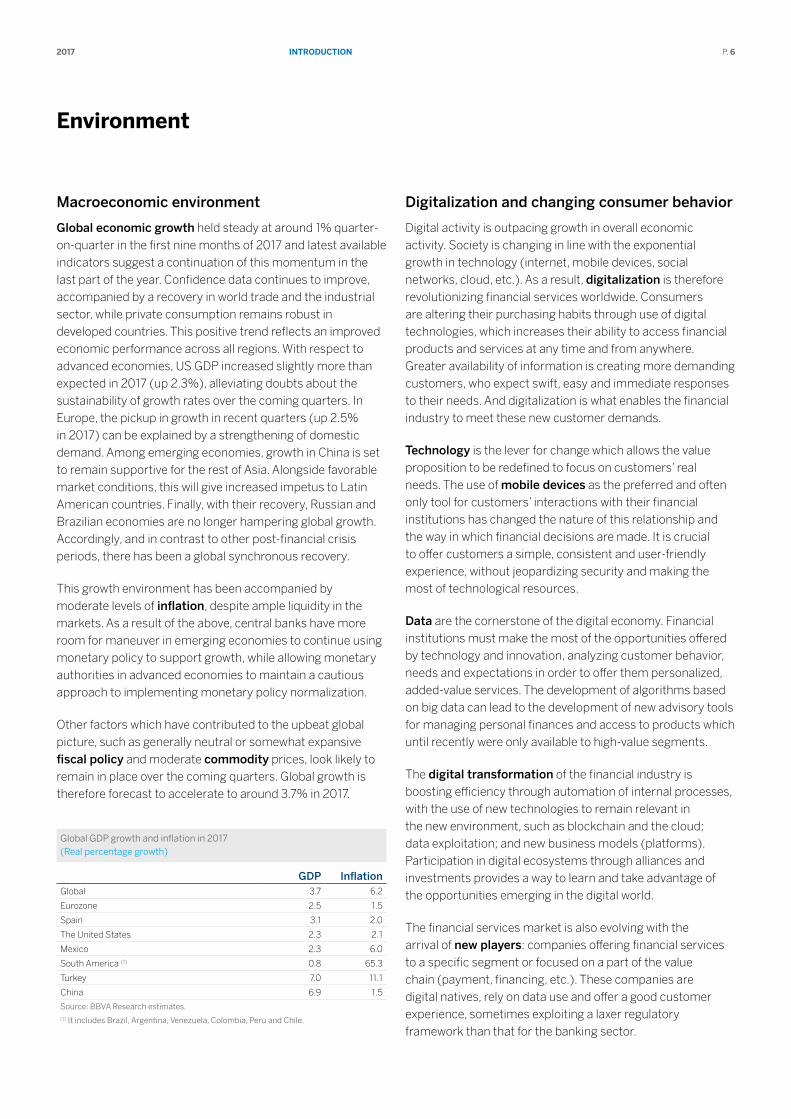
IntroductIon2017 P. 6
Environment
Macroeconomic environment
Global economic growth held steady at around 1% quarter-on-quarter in the first nine months of 2017 and latest available indicators suggest a continuation of this momentum in the last part of the year. Confidence data continues to improve, accompanied by a recovery in world trade and the industrial sector, while private consumption remains robust in developed countries. This positive trend reflects an improved economic performance across all regions. With respect to advanced economies, US GDP increased slightly more than expected in 2017 (up 2.3%), alleviating doubts about the sustainability of growth rates over the coming quarters. In Europe, the pickup in growth in recent quarters (up 2.5% in 2017) can be explained by a strengthening of domestic demand. Among emerging economies, growth in China is set to remain supportive for the rest of Asia. Alongside favorable market conditions, this will give increased impetus to Latin American countries. Finally, with their recovery, Russian and Brazilian economies are no longer hampering global growth. Accordingly, and in contrast to other post-financial crisis periods, there has been a global synchronous recovery.
This growth environment has been accompanied by moderate levels of inflation, despite ample liquidity in the markets. As a result of the above, central banks have more room for maneuver in emerging economies to continue using monetary policy to support growth, while allowing monetary authorities in advanced economies to maintain a cautious approach to implementing monetary policy normalization.
Other factors which have contributed to the upbeat global picture, such as generally neutral or somewhat expansive fiscal policy and moderate commodity prices, look likely to remain in place over the coming quarters. Global growth is therefore forecast to accelerate to around 3.7% in 2017.
Global GDP growth and inflation in 2017 (Real percentage growth)
GDP InflationGlobal 3.7 6.2
Eurozone 2.5 1.5
Spain 3.1 2.0
The United States 2.3 2.1
Mexico 2.3 6.0
South America (1) 0.8 65.3
Turkey 7.0 11.1
China 6.9 1.5
Source: BBVA Research estimates.(1) It includes Brazil, Argentina, Venezuela, Colombia, Peru and Chile.
Digitalization and changing consumer behavior
Digital activity is outpacing growth in overall economic activity. Society is changing in line with the exponential growth in technology (internet, mobile devices, social networks, cloud, etc.). As a result, digitalization is therefore revolutionizing financial services worldwide. Consumers are altering their purchasing habits through use of digital technologies, which increases their ability to access financial products and services at any time and from anywhere. Greater availability of information is creating more demanding customers, who expect swift, easy and immediate responses to their needs. And digitalization is what enables the financial industry to meet these new customer demands.
Technology is the lever for change which allows the value proposition to be redefined to focus on customers’ real needs. The use of mobile devices as the preferred and often only tool for customers’ interactions with their financial institutions has changed the nature of this relationship and the way in which financial decisions are made. It is crucial to offer customers a simple, consistent and user-friendly experience, without jeopardizing security and making the most of technological resources.
Data are the cornerstone of the digital economy. Financial institutions must make the most of the opportunities offered by technology and innovation, analyzing customer behavior, needs and expectations in order to offer them personalized, added-value services. The development of algorithms based on big data can lead to the development of new advisory tools for managing personal finances and access to products which until recently were only available to high-value segments.
The digital transformation of the financial industry is boosting efficiency through automation of internal processes, with the use of new technologies to remain relevant in the new environment, such as blockchain and the cloud; data exploitation; and new business models (platforms). Participation in digital ecosystems through alliances and investments provides a way to learn and take advantage of the opportunities emerging in the digital world.
The financial services market is also evolving with the arrival of new players: companies offering financial services to a specific segment or focused on a part of the value chain (payment, financing, etc.). These companies are digital natives, rely on data use and offer a good customer experience, sometimes exploiting a laxer regulatory framework than that for the banking sector.
IntroductIon2017 P. 7
The regulatory environment
1. Completion of Basel III
The main issue in developing the global regulatory agenda in 2017 has continued to be the completion of the pending elements in the global capital framework (Basel III), in particular the comparability of the internal models used by global banks and the variability of risk-weighted assets.
At European level, the regulatory effort was focused on the European Council’s discussion of the Commission’s proposal to review the European banking framework with the aim of incorporating the final elements of Basel III to reduce the risks to the financial system.
2. Bank resolution in Europe
In terms of legislative development, in 2017 a new class of bank liabilities were created called senior non-preferred debt, by the transposition of an EU Directive through Royal Decree Law (RDL) 11/2017. A number of banks, including BBVA, have begun to issue this new class of debt, which has had an excellent uptake by institutional investors.
In addition, discussions are continuing between the EU Council and Parliament about the Commission’s 2016 proposal on a series of banking reforms to mitigate the risk of the banking sector. The most important of these is the implementation of international law on the total loss-absorbing capacity (TLAC) of systemic banks in Europe. The Commission has proposed modifying the minimum requirement for own funds and eligible liabilities now in force (MREL) and align it with the TLAC.
At the same time, the resolution authority of the main banks in the Eurozone, the Single Resolution Board (SRB) issued at the end of 2017 the first mandatory MREL requirements and defined a calendar for compliance based on current law.
3. Current situation on the banking union in Europe
Following the consolidation of the economic recovery in Europe, the debate on the future of the euro has resulted in the issue of two important documents by the European Commission. The first is a White Book on possible scenarios for the future integration of Europe, with a list of options. The core or most likely framework according to the document is a future two-speed Europe. The second document is a Reflection Paper on the future of the Eurozone, which proposes moving forward in two phases (2017-19 and 2019-25) toward a more consolidated union.
It is important to highlight that the banking union has meant: i) application of a single regulation; ii) the creation of the Single Supervisory Mechanism (SSM); and iii) the creation of the Single Resolution Mechanism (SRM) and the Single Resolution Fund (SRF). Two fundamental elements have yet to be established for full banking union: a common public
backstop for the SRF and a common European deposit insurance scheme (EDIS).
4. Focus on reducing non-performing loans
The European authorities have expressed their concern regarding non-performing loans (NPLs) in the EU. In 2017 a number of initiatives were implemented, focused on three areas:
Improved supervision The European Commission is considering the introduction of prudential requirements for new loans in its review of the CRR/CRD capital Directives.
Reform of the insolvency frameworks The Commission published the results of a comparative study carried out among countries and a consultation on the introduction of a faster loan recovery guarantee, within the framework of the directive proposed in 2016 on insolvency frameworks.
Development of secondary markets for non-performing loans In January 2017, the European Banking Authority (EBA) presented its proposal for the creation of an asset management company at European level (the “bad bank”). More recently, the Council’s action plan invited the European Commission to issue a guide for countries to create their own bad banks.
The Council’s action plan invited authorities to propose initiatives related to transparency, including the creation of centralized NPL data platforms, to facilitate access to this information. The securitization of NPLs could be another tool to withdraw the most granular loans from the balance sheets.
5. Regulation in the field of digital transformation of the financial sector
Several topics marked the regulatory agenda in the field of digital transformation of the financial sector in 2017:
The payments industry. In January 2018 the new Payment Services Directive (PSD2) came into force. This new regulatory framework aims to promote competition and strengthen the security of payments in Europe. To do so, it regulates third-party access to customers’ payment accounts.
Digitalization makes possible the storage, processing and exchange of large volumes of data. This trend makes it easier to adopt technologies such as big data and artificial intelligence, with an enormous potential for expanding access to financial services; but it also generates concerns on how to ensure privacy and the integrity of customer data. In Europe this has resulted in two regulations: the General Data Protection Regulation (GDPR), which entered into force in 2018, and the proposed e-Privacy Regulation, still at the discussion phase.
IntroductIon2017 P. 8
In view of the growing importance of data, it is important to guarantee the integrity of information. The increased frequency and sophistication of cyberattacks make cybersecurity a priority for the financial sector. A new cybersecurity framework was created in Europe through the Security Directive for Networks and Information Systems (NIS), GDPR and PSD2.
Finally, in 2017 there were more intense regulatory discussions on the implications of the technological innovation in financial services or fintech. Operational, IT and cyber risks are among the greatest concerns for the authorities, together with possible risks for financial stability derived from financial technology (fintech) in the sector. There is a need to assess whether the existing regulatory frameworks are capable of guaranteeing a level playing field and adequate consumer protection.
Economic outlook
The underlying factors which have supported the rebound and stabilization of global growth since the end of 2016 will continue into 2018, although some may begin to gradually fade. The most immediate factor will be the gradual normalization of Federal Reserve (Fed) and ECB monetary policy, which will involve a gradual tightening of global liquidity and a reduction in incentives for capital flows toward emerging economies. BBVA Research forecasts global growth to remain relatively stable at around 3.8%, also in 2018. However, various political risks could affect economic confidence and market performance.
In Spain, the recovery is likely to slow in 2018 to around 2.5% following three consecutive years of growth in excess of 3%. The main support factors will be positive momentum in activity and employment data, a favorable global backdrop which should remain propitious for goods exports, and an expansive monetary policy. However, the recent rise in uncertainty which may be sustained for some time represents a risk to certain components of demand, primarily investment and services exports.
In the rest of Europe, improving labor markets and increased confidence, alongside favorable financing conditions, will continue to underpin momentum in consumption and investment. However, some external support factors could gradually attenuate over the course of the year 2018. Euro appreciation, rising commodity prices and stabilization of global growth mean GDP could slip slightly above 2% in 2018 (up 2.5% in 2017). In this context, the ECB intends to rein in its asset purchases, while interest-rate hikes likely to be postponed until mid-2019. Furthermore, domestic risks within the Eurozone, which are primarily political, remain tilted to the downside, though they have moderated to some degree.
In the United States, uncertainty regarding economic policy has been reduced in recent quarters. Economic fundamentals and the effect of the recently adopted measures are consistent with a growth of a shade over 2.5% in 2018. Robust global growth, dollar depreciation, oil price expectations and the moderate improvement in construction should spur an upturn in investment. By contrast, a more gradual improvement in the labor market and stronger inflation could weigh against private consumption. However, contained price growth in recent months and the absence of clear signs of inflationary pressure mean that it is likely that the Fed will proceed slowly in its process of normalizing monetary policy.
Despite the improvement in the global economy, some of the remnants of the recession still need to be absorbed and concerns linger regarding the capacity to increase the rate of long-term potential growth. Therefore, how the authorities go about withdrawing the stimuli, particularly on the monetary policy side, continues to be crucial for entrenching the recovery in developed economies and ensuring financial markets remain favorable for emerging countries. By contrast, maintaining low interest rates for a prolonged period of time could contribute to increasing medium-term financial vulnerabilities.
In emerging economies, the key challenge is to manage the potential vulnerability to possible abrupt fluctuations in capital flows in a context of greater idiosyncratic uncertainty, whether as a result of geopolitical tensions or due to the elections taking place in 2018, particularly in Latin America. In Turkey, the credit stimulus driven by the authorities is pushing GDP growth above potential. This, alongside the exchange-rate impact, has led to a significant increase in inflation to around 12% in the last quarter of 2017, which has provoked a tightening of monetary policy. To the extent that the effect of the credit stimulus proves temporary, growth is forecast to slow to 4.5% in 2018. The Mexican economy could post growth of around 2% in 2018 (from 2.3% in 2017), with the main risk stemming from a possible deterioration in trade relations with the United States. The recovery is set to gain traction in South America as whole. GDP could grow at around 1.6% in 2018, following on from 0.8% in 2017, on the back of support from the external sector, Brazil’s recovery from recession, private and public investment in Argentina and infrastructure investment plans in countries such as Colombia and Peru.
Although short-term risks have receded, especially in China, the latter’s economic imbalances remain the biggest threat to the global economy over the medium and long-term. Support from the Chinese authorities has helped stabilize growth in 2017 (6.9%). Although concerns of a hard landing in the short term have diminished, growth is nonetheless expected to continue around 6.3% in 2018.
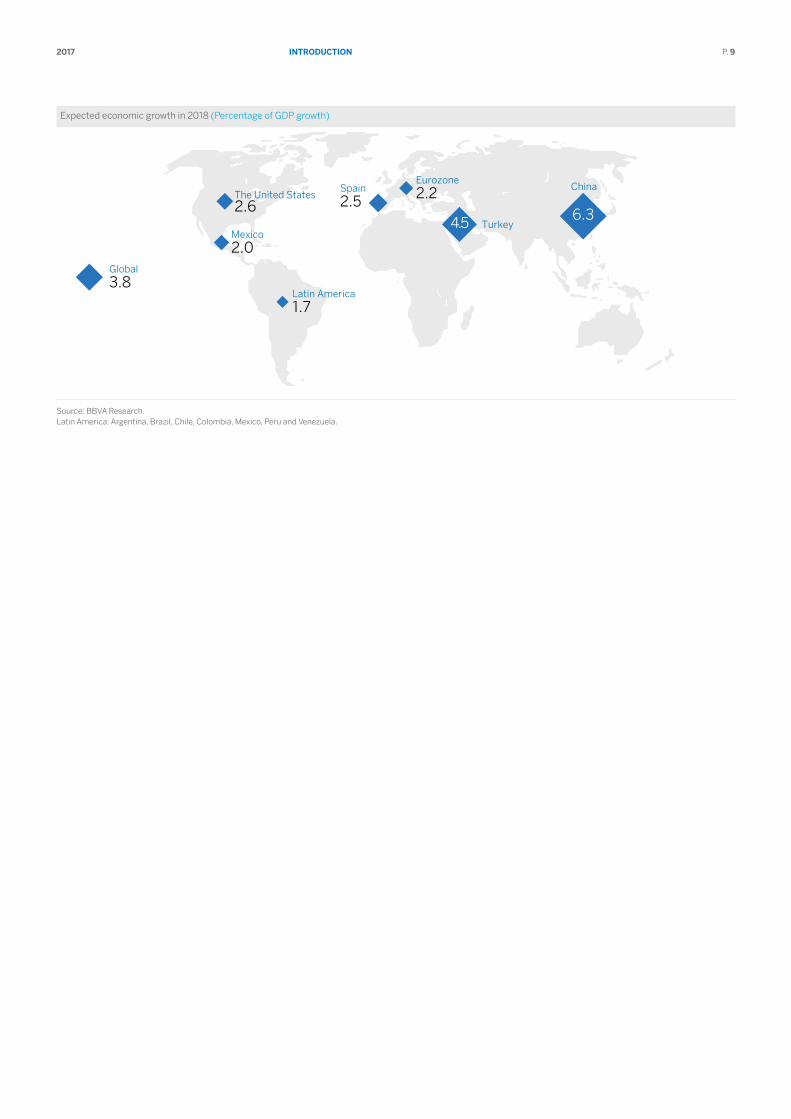
IntroductIon2017 P. 9
Expected economic growth in 2018 (Percentage of GDP growth)
6.3
China
4.5 Turkey
2.5Spain 2.2
Eurozone
2.6The United States
2.0Mexico
1.7Latin America
3.8Global
Source: BBVA Research. Latin America: Argentina, Brazil, Chile, Colombia, Mexico, Peru and Venezuela.

StrAtEgy And BuSInESS modEl2017 P. 10
Strategy and business model
Vision and aspiration
During 2017, the BBVA Group made significant progress on its transformation process, firmly underpinned by the Group’s Purpose and six Strategic Priorities. The Bank’s strategy has been strengthened with a particular focus on digitalization and customer experience under a new tagline: “Creating Opportunities”, as well as the Values established to steer the behavior of the Organization as a whole. A necessary transformation process in order to adapt to the new environment in the financial industry described previously and preserve its leadership.
The financial industry is facing an environment characterized by an onslaught of regulatory reform which has been introduced in recent years at a global level, which has resulted in regulatory changes in diverse areas ranging from solvency, liquidity, separation of activities, bank resolution, as well as affecting investment banking activities.
New technological developments (big data, artificial intelligence, blockchain, the cloud, data processing, biometry, etc.) represent a major step forward in improving the customer experience, enable data and algorithms to be analyzed automatically, as well as providing easy access to the best solutions available on the market and, by default, the most beneficial conditions. Technological innovations reduce unit costs thanks to process automation and scalability.
Shifting consumer needs. Customers are seeking a new type of banking relationship and are demanding greater added-value services based on new needs. Technology is enabling these new demands to be met. The use of mobile devices has led to changes in the distribution model. Consumers are permanently connected, well accustomed to digital experiences, and making use of multiple devices and applications. The fact is that the number of mobile banking users worldwide has grown exponentially in recent years and customers are increasingly interacting through these devices.
At the same time, new players are entering the financial industry and specializing in specific parts of the value chain (payments, financing, asset management, insurance,
etc.). These new players include fintech companies as well as digital giants, who are already competing with banks in the new environment, offering very attractive value propositions and with major potential.
Data forms the crucial element for helping people take financial decisions, provided customers consent to their data being used. In this regard, at BBVA we believe it is essential to create a trust circle with customers, given that data is a crucial element for better understanding them. Applying intelligence to these data can provide customers with personalized services that offer higher value-added, which will increase the trust, thus completing this circle.
Trust circle
Trust
Consent
Customer’s dataActionable
insights
Addedvalue
Within this context, the main objective of the BBVA Group’s transformation strategy, its aspiration, is to strengthen the relationship with its customers. Customers should be the main beneficiaries of this new environment in which the democratization of financial services is taking place. To do so, BBVA is redefining its value proposition, based on the real needs of its customers, helping them to make better financial decisions through a clear, simple and transparent product and service offer, in order to gain their trust.

StrAtEgy And BuSInESS modEl2017 P. 11
Our Aspiration
Providing the best solutions that generate trust to our customers: clear, transparent and honest conditions
Through an easy and convenient experience:
DIY through digital channels or
human interaction
Strengthening the relationship
with the customer
Helping our customersto make the best financial decisions offering relevant advice
In addition, the value proposition of BBVA must also be easy and accessible; in other words, a proposition that offers access to its services at any time, from any place and by the means chosen by each individual customer, whether on a do-it-yourself basis via digital channels, or through human interaction.

StrAtEgy And BuSInESS modEl2017 P. 12
Progress in BBVA’s transformation journey
During 2017, BBVA has continued to make progress in achieving its Purpose to bring the age of opportunity to everyone, through products and services which help people to make better financial decisions and fulfill their goals in life.
In this regard, and in line with its Purpose, significant steps have been taken in pursuit of the Group’s six Strategic Priorities so as to make headway in this transformation process.
Strategic Priorities
New standardin customer experience
Optimize capitalallocation
Digitalsales
Unrivaledefficiency
New businessmodels
A firstclass workforce
1. A new standard in customer experience
BBVA Group’s main focus is on providing a new standard in customer experience that stands out for its simplicity, transparency and swiftness, further empowering its customers while offering them personalized advice.
BBVA increased its customers ‘ empowerment in 2017 by expanding the number of products available on a do-it-yourself basis, allowing them to interact with BBVA at any time and from any place.
Significant progress has been made in improving the customer experience in terms of the relationship model and products and functionalities.
Various projects have been launched as part of the relationship model: MIA, a virtual mobile information assistant, and Facebook Messenger BOT (Turkey), live chat (Mexico), the front-office tool (Peru) and fast track in branches (Spain).
Some of the more prominent new products and functional features developed this year include: Beconomy and BBVA Cashup (Spain), Tuyyo and digital loans to non-customers (the United States), BBVA Plan - financial objectives and BBVA financial situation check up
(Mexico), iris recognition login and Garanti Pay (Turkey), one-click credit cards (Argentina) and microinsurance against theft from cash withdrawals (Colombia).
In essence, BBVA has a customer-oriented business model that offers a differential service with one very ambitious goal: to be leaders in customer satisfaction across its global footprint.
In order to know the level of recommendation of BBVA’s customers, and therefore , their level of satisfaction, the Group applies the Net Promoter Score (NPS) methodology, as explained in the section on Customer relationship. The internalization and application of this methodology has led to a steady increase in the customers’ level of trust, as they recognize BBVA to be one of the most secure and recommendable banking institutions in every country where it operates.
2. Digital sales
At BBVA, it is essential to foster digitalization as part of its transformation journey while boosting business on digital channels. In this regard, the Bank is developing a significant digital offering of products and services.
The relationship model of BBVA is evolving to adapt to the multi-channel profile of its customers. The number of digital and mobile customers in BBVA Group grew considerably in 2017. The 50% tipping point in digital clients has been reached in most of the countries where BBVA is present (Spain, the United States, Turkey, Argentina, Chile and Venezuela).
Digital and mobile customers (BBVA Group. Million)
15.4 18.1
22.6
Dec. 15 Dec.16 Dec.17
Digital customers
+25%
9.0 12.3
17.7
Dec. 15 Dec.16 Dec.17
Mobile customers
+44%
Furthermore, a significant boost to sales through digital channels is being made, which is having a very positive evolution across the global footprint. In 2017, five million units were sold through the mobile devices.
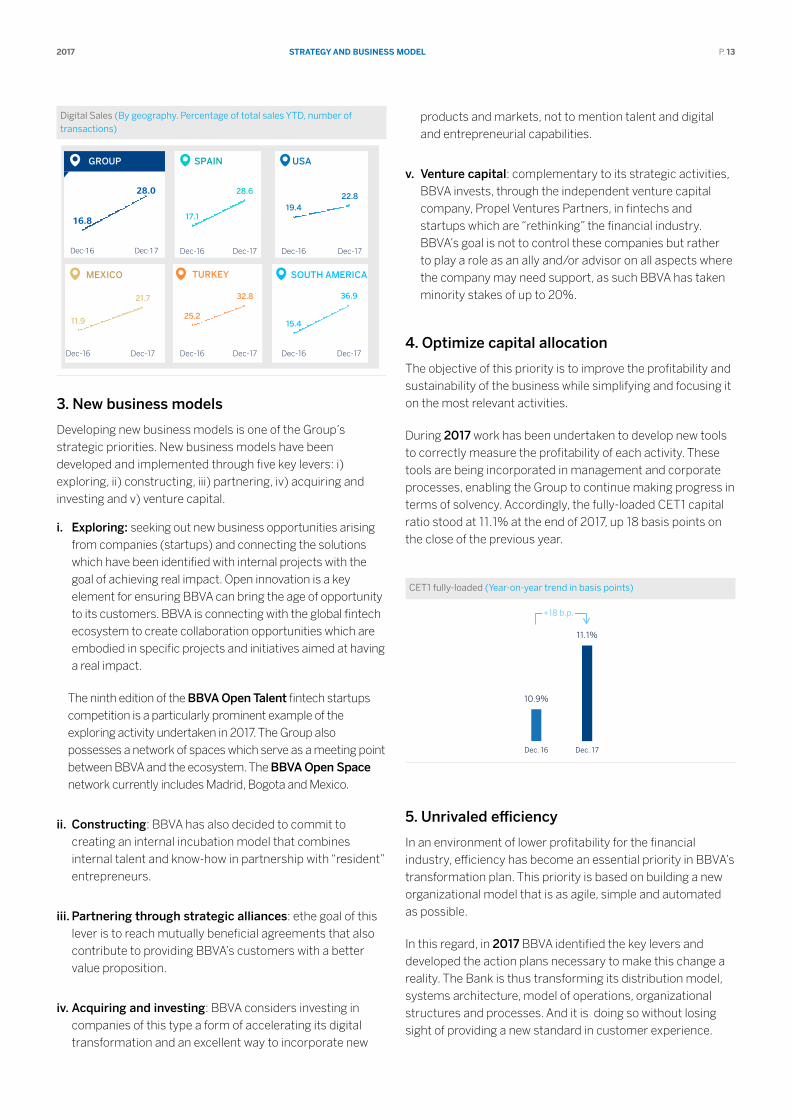
StrAtEgy And BuSInESS modEl2017 P. 13
Digital Sales (By geography. Percentage of total sales YTD, number of transactions)
SPAIN USA
17.1
28.6
Dec-16 Dec-17
MEXICO
11.9
21.7
Dec-16 Dec-17
15.4
36.9
Dec-16 Dec-17
19.4 22.8
Dec-16 Dec-17
TURKEY
25.2
32.8
Dec-16 Dec-17
SOUTH AMERICA
16.8
28.0
Dec-16 Dec-17
GROUP
3. New business models
Developing new business models is one of the Group’s strategic priorities. New business models have been developed and implemented through five key levers: i) exploring, ii) constructing, iii) partnering, iv) acquiring and investing and v) venture capital.
i. Exploring: seeking out new business opportunities arising from companies (startups) and connecting the solutions which have been identified with internal projects with the goal of achieving real impact. Open innovation is a key element for ensuring BBVA can bring the age of opportunity to its customers. BBVA is connecting with the global fintech ecosystem to create collaboration opportunities which are embodied in specific projects and initiatives aimed at having a real impact.
The ninth edition of the BBVA Open Talent fintech startups competition is a particularly prominent example of the exploring activity undertaken in 2017. The Group also possesses a network of spaces which serve as a meeting point between BBVA and the ecosystem. The BBVA Open Space network currently includes Madrid, Bogota and Mexico.
ii. Constructing: BBVA has also decided to commit to creating an internal incubation model that combines internal talent and know-how in partnership with “resident” entrepreneurs.
iii. Partnering through strategic alliances: ethe goal of this lever is to reach mutually beneficial agreements that also contribute to providing BBVA’s customers with a better value proposition.
iv. Acquiring and investing: BBVA considers investing in companies of this type a form of accelerating its digital transformation and an excellent way to incorporate new
products and markets, not to mention talent and digital and entrepreneurial capabilities.
v. Venture capital: complementary to its strategic activities, BBVA invests, through the independent venture capital company, Propel Ventures Partners, in fintechs and startups which are “rethinking” the financial industry. BBVA’s goal is not to control these companies but rather to play a role as an ally and/or advisor on all aspects where the company may need support, as such BBVA has taken minority stakes of up to 20%.
4. Optimize capital allocation
The objective of this priority is to improve the profitability and sustainability of the business while simplifying and focusing it on the most relevant activities.
During 2017 work has been undertaken to develop new tools to correctly measure the profitability of each activity. These tools are being incorporated in management and corporate processes, enabling the Group to continue making progress in terms of solvency. Accordingly, the fully-loaded CET1 capital ratio stood at 11.1% at the end of 2017, up 18 basis points on the close of the previous year.
CET1 fully-loaded (Year-on-year trend in basis points)
10.9%
11.1%
Dec. 16 Dec. 17
+18 b.p.
5. Unrivaled efficiency
In an environment of lower profitability for the financial industry, efficiency has become an essential priority in BBVA’s transformation plan. This priority is based on building a new organizational model that is as agile, simple and automated as possible.
In this regard, in 2017 BBVA identified the key levers and developed the action plans necessary to make this change a reality. The Bank is thus transforming its distribution model, systems architecture, model of operations, organizational structures and processes. And it is doing so without losing sight of providing a new standard in customer experience.

StrAtEgy And BuSInESS modEl2017 P. 14
In 2017, the efficiency ratio closed at 49.5%, below the figure of 51.9% in the previous year.
Efficiency ratio (BBVA Group. Percentage)
51.9
49.5
2016 2017
6. A first-class workforce
BBVA Group’s most important asset is its people, which is why having “a first-class workforce” is one of the six Strategic Priorities. This entails attracting, selecting, training and retaining top-class talent wherever it may be.
BBVA Group has developed new people management models and ways of working which have enabled the Bank to keep transforming its operational model, but have also enhanced its ability to become a purpose-driven company: a company where staff are genuinely inspired and motivated to work for the same Purpose of: bringing the age of opportunity to everyone.

StrAtEgy And BuSInESS modEl2017 P. 15
our Values
BBVA engaged in an open process to identify the Group’s values, which took on board the opinion of employees from across the global footprint and units of the Group. These Values define our identity and are the pillars for making our Purpose a reality:
1. Customer comes first We are empathetic: we take the customer’s viewpoint into
account from the outset, putting ourselves in their shoes to better understand their needs.
We have integrity: everything we do is legal, publishable and morally acceptable to society. We always put customer interests’ first.
We meet their needs: we are swift, agile and responsive in resolving the problems and needs of our customers, overcoming any
difficulties we encounter.
2. We think big
We are ambitious: we set ourselves ambitious and aspirational challenges to have a real impact on peoples’ lives.
We break the mold: we question everything we do to discover new ways of doing things, innovating and testing new ideas which enables us to learn.
We amaze our customers: we seek excellence in everything we do in order to amaze our customers, creating unique experiences and solutions which exceed their expectations.
3. We are one team
I am committed: I am committed to my role and my objectives and I feel empowered and fully responsible for delivering them, working with passion and enthusiasm.
I trust others: I trust others from the outset and work generously, collaborating and breaking down silos between areas and hierarchical barriers.
I am BBVA: I feel ownership of BBVA. The Bank’s objectives are my own and I do everything in my power to achieve them and make our Purpose a reality.
The implementation and adoption of these Values is supported by the entire Organization, including the Global Leadership, launching local and global initiatives which ensure these Values are adopted uniformly throughout the Group.
In conclusion, at BBVA we are accelerating our transformation in order to be the best bank for our customers.
Our Values
We are empathetic We are ambitious I am committed
We have integrity We break the mold I trust others
We meet their needs We amaze our customers I am BBVA
Customer comes first We think big We are one team
StrAtEgy And BuSInESS modEl2017 P. 16
Innovation and technology
BBVA is engaged in a process of digital transformation, the main aim of which is to achieve its aspiration of strengthening relationships with its customers and being the best possible bank for them. Engineering is an essential component of this transformation. Its mission has always been to enable a technology strategy that provides the foundation for this transformation, thus becoming more customer-centric and establishing a more global strategy, fast to implement, digital, flexible and leveraged on the Group’s data. This must be done while continuing to provide support to the Bank’s core business: catering to the demand for traditional business (multi-segment, multi-product, multi-channel, etc.); and b) contributing reliability, with the necessary tools to ensure adequate internal controls, based on consistent information and data. Another Engineering objective is provide the group with all the tools it needs to drive profitability, new productivity paradigms and new business processes.
The area’s responsibilities continue to be focused on the lines of work that were indicated in 2016:
A new technology stack to offer customers services that are more suited to their needs, in terms of speed and content.
Alliances with strategic partners to harness cutting-edge technology, and the necessary collaboration to speed up the transformation process.
Productivity and reliability, i.e. securing improved performance from technology, and doing so in a manner that is fully reliable and guarantees the highest quality standards.
New technology stack: cloud paradigms
With customers increasingly making use of digital channels, and therefore driving an exponential increase in transaction numbers, the Group is continuing to develop its IT model into a more uniform and scalable system, boosting cloud technology.
During 2017, Engineering continued to construct and deploy the building blocks of the new global technological stack for the whole of BBVA. This stack shares the cloud attributes of flexibility and stability that are demanded by the digital world, while strictly complying with regulatory requirements. The first pilot projects have been executed on the blocks with good results. This new stack will enable real-time access, a new approach to data management and the optimization of processing costs, providing customers with a service that caters directly to their needs.
Strategic alliances
Engineering continues to encourage the creation of a network of strategic alliances, giving traction to BBVA’s digital transformation and complement its technology stack. Establishing an ecosystem of strategic alliances with some of the leading businesses in the market ensures the adoption of innovative technologies, digitalization of the business, speed in activation, as well as global deployment of solutions. Furthermore, by building a network of technological alliances with strategic partners, BBVA will work in close cooperation with some of the foremost companies in their respective fields.
In 2017 alliances were established with relevant companies that will be responsible, on the one hand, for operating and optimizing BBVA’s current technology and, on the other hand, for managing the communications infrastructure in a global manner.
Productivity and reliability
Engineering continues to focus on productivity as part of the transformation process. Greater productivity is needed to provide our customers with the best possible service while being profitable. The area is therefore working on the following:
Technology transformation at two levels:
• Hardware: creating lower-cost infrastructure components based on the cloud paradigm. There has been very significant progress in the use of this infrastructure in Spain, and Mexico is beginning to use it, resulting in an increase in productivity.
• Software: multiple global functionalities have been constructed, reused by various of the Group’s geographic areas, and construction continues on the technological stack with a high level of automation.
Transformation of operations: an initial operations optimization exercise has been carried out with good results, and the necessary working methodology has been created to implement it throughout the whole Group. The first robotics activities have also been carried out in Spain.
It is crucial to obtain the best possible performance from infrastructures, architectures, operations and internal processes, and to do so in a way that is fully reliable. Reliability remains another key factor for the Engineering function and digital transformation.
In 2017 programs have been executed to improve reliability, resulting in a reduction of the volume of incidents in the Group.

StrAtEgy And BuSInESS modEl2017 P. 17
responsible banking model
At BBVA we have a differential banking model that we refer to as responsible banking, based on seeking out a return adjusted to principles, strict legal compliance, best practices and the creation of long-term value for all stakeholders. It is reflected in the Bank’s Corporate Social Responsibility or Responsible Banking Policy. The Policy’s mission is to manage the responsibility for the Bank’s impact on people and society, which is key to the delivery of BBVA’s Purpose.
All the business and support areas integrate this policy into their operational models. The Responsible Business Unit coordinates the implementation and basically operates as a second line for defining standards and offering support.
The responsible banking model is supervised by the Board of Directors and its committees, as well as by the Bank’s Global Leadership Team, chaired by the CEO.
The four pillars of BBVA’s responsible banking model are as follows:
Balanced relations with its customers, based on transparency, clarity and responsibility.
Sustainable finance to combat climate change, respect human rights and achieve the UN Sustainable Development Goals (SDGs).
Responsible practices with employees, suppliers and other stakeholders.
Community investment to promote social change and create opportunities for all.
During 2017, the Group has worked on a climate change and sustainable development strategy which provides comprehensive coverage for the management of risks and opportunities deriving from the fight against climate change and the achievement of the Sustainable Development Goals (SDGs). BBVA’s approach to these kinds of risks and opportunities are described in the section on Sustainable finance.
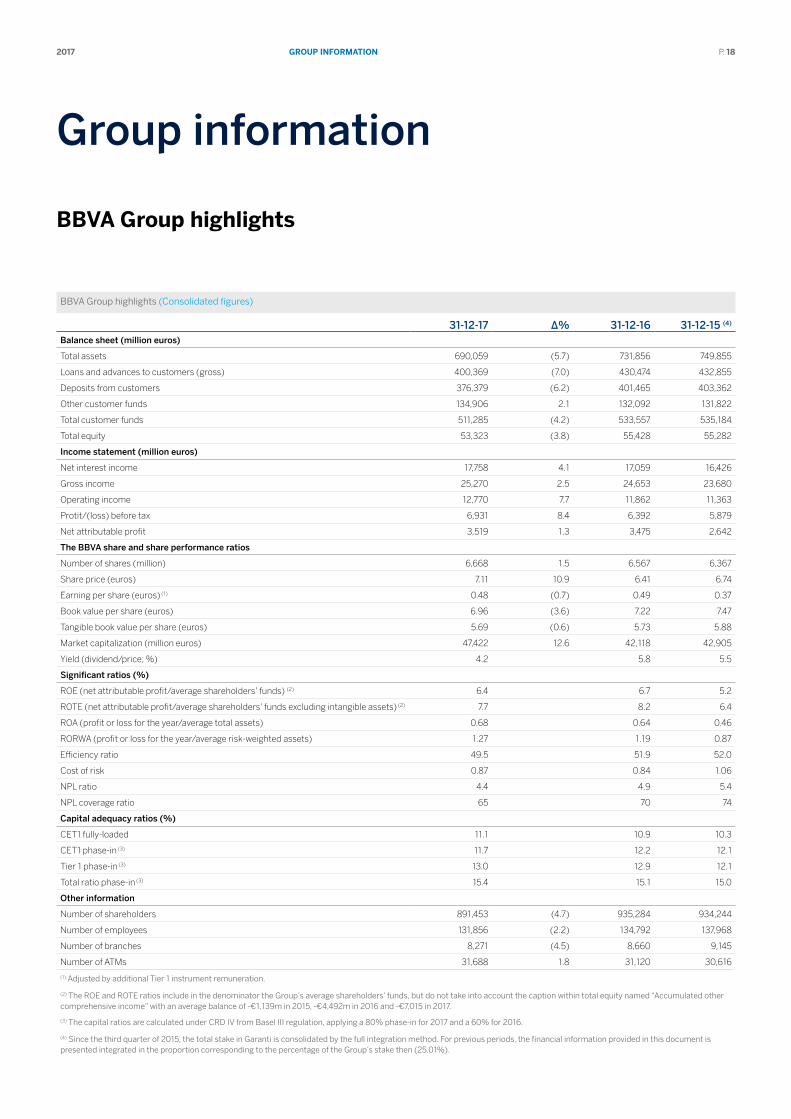
grouP InformAtIon2017 P. 18
Group information
BBVA group highlights
BBVA Group highlights (Consolidated figures)
31-12-17 ∆% 31-12-16 31-12-15 (4)
Balance sheet (million euros)
Total assets 690,059 (5.7) 731,856 749,855
Loans and advances to customers (gross) 400,369 (7.0) 430,474 432,855
Deposits from customers 376,379 (6.2) 401,465 403,362
Other customer funds 134,906 2.1 132,092 131,822
Total customer funds 511,285 (4.2) 533,557 535,184
Total equity 53,323 (3.8) 55,428 55,282
Income statement (million euros)
Net interest income 17,758 4.1 17,059 16,426
Gross income 25,270 2.5 24,653 23,680
Operating income 12,770 7.7 11,862 11,363
Protit/(loss) before tax 6,931 8.4 6,392 5,879
Net attributable profit 3,519 1.3 3,475 2,642
The BBVA share and share performance ratios
Number of shares (million) 6,668 1.5 6,567 6,367
Share price (euros) 7.11 10.9 6.41 6.74
Earning per share (euros) (1) 0.48 (0.7) 0.49 0.37
Book value per share (euros) 6.96 (3.6) 7.22 7.47
Tangible book value per share (euros) 5.69 (0.6) 5.73 5.88
Market capitalization (million euros) 47,422 12.6 42,118 42,905
Yield (dividend/price; %) 4.2 5.8 5.5
Significant ratios (%)
ROE (net attributable profit/average shareholders' funds) (2) 6.4 6.7 5.2
ROTE (net attributable profit/average shareholders' funds excluding intangible assets) (2) 7.7 8.2 6.4
ROA (profit or loss for the year/average total assets) 0.68 0.64 0.46
RORWA (profit or loss for the year/average risk-weighted assets) 1.27 1.19 0.87
Efficiency ratio 49.5 51.9 52.0
Cost of risk 0.87 0.84 1.06
NPL ratio 4.4 4.9 5.4
NPL coverage ratio 65 70 74
Capital adequacy ratios (%)
CET1 fully-loaded 11.1 10.9 10.3
CET1 phase-in (3) 11.7 12.2 12.1
Tier 1 phase-in (3) 13.0 12.9 12.1
Total ratio phase-in (3) 15.4 15.1 15.0
Other information
Number of shareholders 891,453 (4.7) 935,284 934,244
Number of employees 131,856 (2.2) 134,792 137,968
Number of branches 8,271 (4.5) 8,660 9,145
Number of ATMs 31,688 1.8 31,120 30,616
(1) Adjusted by additional Tier 1 instrument remuneration.
(2) The ROE and ROTE ratios include in the denominator the Group’s average shareholders’ funds, but do not take into account the caption within total equity named “Accumulated other comprehensive income” with an average balance of -€1,139m in 2015, -€4,492m in 2016 and -€7,015 in 2017.
(3) The capital ratios are calculated under CRD IV from Basel III regulation, applying a 80% phase-in for 2017 and a 60% for 2016.
(4) Since the third quarter of 2015, the total stake in Garanti is consolidated by the full integration method. For previous periods, the financial information provided in this document is presented integrated in the proportion corresponding to the percentage of the Group’s stake then (25.01%).
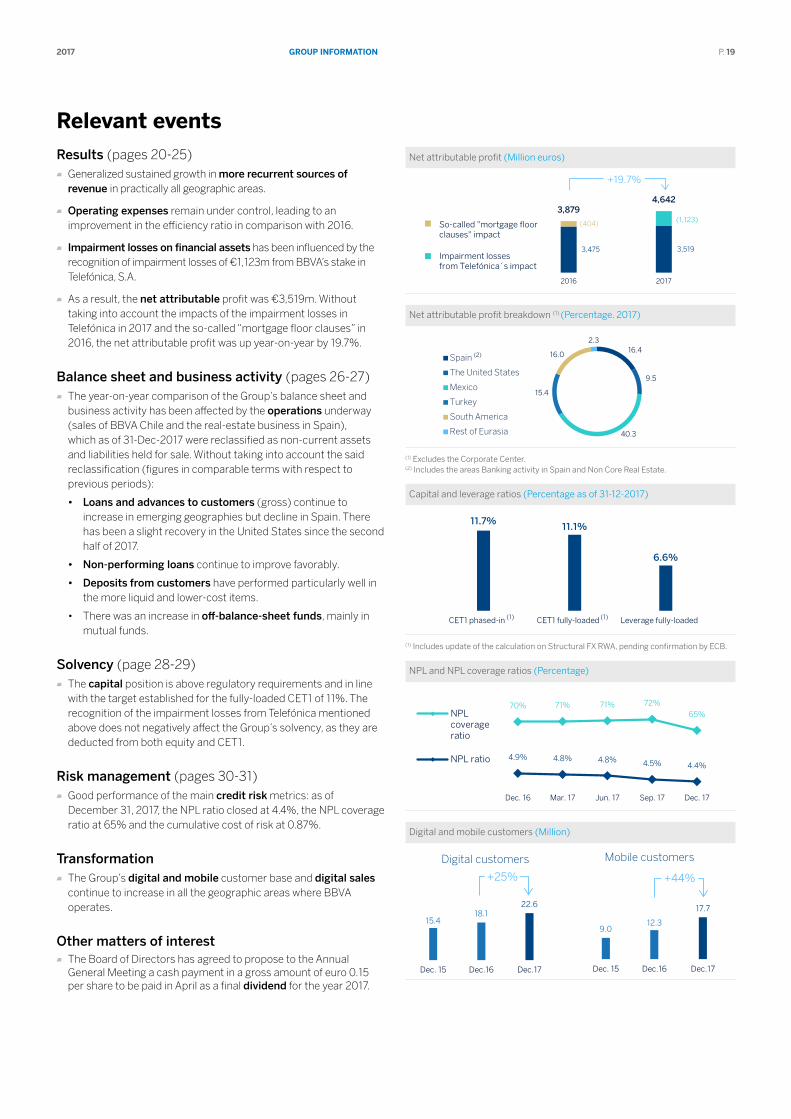
grouP InformAtIon2017 P. 19
relevant eventsResults (pages 20-25)
Generalized sustained growth in more recurrent sources of revenue in practically all geographic areas.
Operating expenses remain under control, leading to an improvement in the efficiency ratio in comparison with 2016.
Impairment losses on financial assets has been influenced by the recognition of impairment losses of €1,123m from BBVA’s stake in Telefónica, S.A.
As a result, the net attributable profit was €3,519m. Without taking into account the impacts of the impairment losses in Telefónica in 2017 and the so-called “mortgage floor clauses” in 2016, the net attributable profit was up year-on-year by 19.7%.
Balance sheet and business activity (pages 26-27) The year-on-year comparison of the Group’s balance sheet and
business activity has been affected by the operations underway (sales of BBVA Chile and the real-estate business in Spain), which as of 31-Dec-2017 were reclassified as non-current assets and liabilities held for sale. Without taking into account the said reclassification (figures in comparable terms with respect to previous periods):
• Loans and advances to customers (gross) continue to increase in emerging geographies but decline in Spain. There has been a slight recovery in the United States since the second half of 2017.
• Non-performing loans continue to improve favorably.
• Deposits from customers have performed particularly well in the more liquid and lower-cost items.
• There was an increase in off-balance-sheet funds, mainly in mutual funds.
Solvency (page 28-29) The capital position is above regulatory requirements and in line
with the target established for the fully-loaded CET1 of 11%. The recognition of the impairment losses from Telefónica mentioned above does not negatively affect the Group’s solvency, as they are deducted from both equity and CET1.
Risk management (pages 30-31) Good performance of the main credit risk metrics: as of
December 31, 2017, the NPL ratio closed at 4.4%, the NPL coverage ratio at 65% and the cumulative cost of risk at 0.87%.
Transformation The Group’s digital and mobile customer base and digital sales
continue to increase in all the geographic areas where BBVA operates.
Other matters of interest The Board of Directors has agreed to propose to the Annual
General Meeting a cash payment in a gross amount of euro 0.15 per share to be paid in April as a final dividend for the year 2017.
Net attributable profit (Million euros)
3,475 3,519
(404) (1,123) 3,879
4,642
2016 2017
+19.7%
So-called "mortgage floor clauses" impact
Impairment losses from Telefónica´s impact
Net attributable profit breakdown (1) (Percentage. 2017)
16.4
9.5
40.3
15.4
16.0
2.3
Spain
The United States
Mexico
Turkey
South America
Rest of Eurasia
(2)
(1) Excludes the Corporate Center.(2) Includes the areas Banking activity in Spain and Non Core Real Estate.
Capital and leverage ratios (Percentage as of 31-12-2017)
11.7% 11.1%
6.6%
CET1 phased-in CET1 fully-loaded Leverage fully-loaded(1) (1)
(1) Includes update of the calculation on Structural FX RWA, pending confirmation by ECB.
NPL and NPL coverage ratios (Percentage)
70% 71% 71% 72% 65%
4.9% 4.8% 4.8% 4.5% 4.4%
04%
05%
06%
07%
08%
09%
30%
35%
40%
45%
50%
55%
60%
65%
70%
75%
80%
Dec. 16 Mar. 17 Jun. 17 Sep. 17 Dec. 17
NPLcoverageratio
NPL ratio
Digital and mobile customers (Million)
15.4 18.1
22.6
Dec. 15 Dec.16 Dec.17
Digital customers
+25%
9.0 12.3
17.7
Dec. 15 Dec.16 Dec.17
Mobile customers
+44%
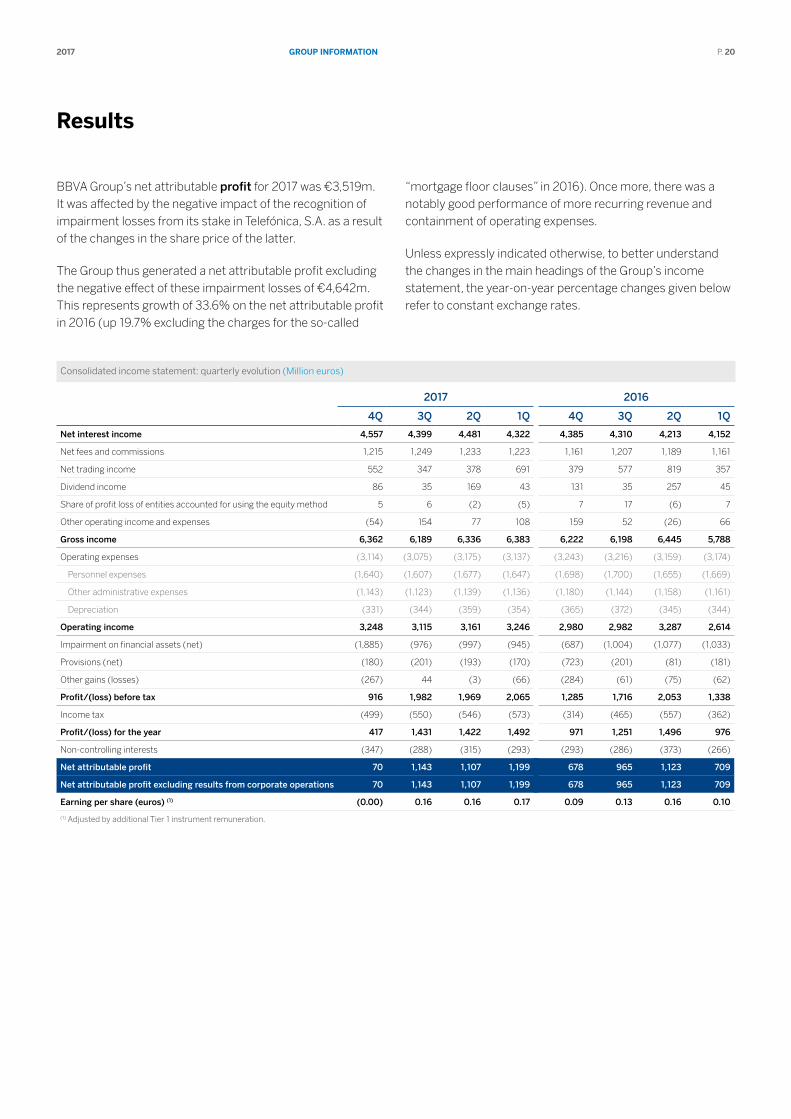
grouP InformAtIon2017 P. 20
results
BBVA Group’s net attributable profit for 2017 was €3,519m. It was affected by the negative impact of the recognition of impairment losses from its stake in Telefónica, S.A. as a result of the changes in the share price of the latter.
The Group thus generated a net attributable profit excluding the negative effect of these impairment losses of €4,642m. This represents growth of 33.6% on the net attributable profit in 2016 (up 19.7% excluding the charges for the so-called
“mortgage floor clauses” in 2016). Once more, there was a notably good performance of more recurring revenue and containment of operating expenses.
Unless expressly indicated otherwise, to better understand the changes in the main headings of the Group’s income statement, the year-on-year percentage changes given below refer to constant exchange rates.
Consolidated income statement: quarterly evolution (Million euros)
2017 2016
4Q 3Q 2Q 1Q 4Q 3Q 2Q 1Q
Net interest income 4,557 4,399 4,481 4,322 4,385 4,310 4,213 4,152
Net fees and commissions 1,215 1,249 1,233 1,223 1,161 1,207 1,189 1,161
Net trading income 552 347 378 691 379 577 819 357
Dividend income 86 35 169 43 131 35 257 45
Share of profit loss of entities accounted for using the equity method 5 6 (2) (5) 7 17 (6) 7
Other operating income and expenses (54) 154 77 108 159 52 (26) 66
Gross income 6,362 6,189 6,336 6,383 6,222 6,198 6,445 5,788
Operating expenses (3,114) (3,075) (3,175) (3,137) (3,243) (3,216) (3,159) (3,174)
Personnel expenses (1,640) (1,607) (1,677) (1,647) (1,698) (1,700) (1,655) (1,669)
Other administrative expenses (1,143) (1,123) (1,139) (1,136) (1,180) (1,144) (1,158) (1,161)
Depreciation (331) (344) (359) (354) (365) (372) (345) (344)
Operating income 3,248 3,115 3,161 3,246 2,980 2,982 3,287 2,614
Impairment on financial assets (net) (1,885) (976) (997) (945) (687) (1,004) (1,077) (1,033)
Provisions (net) (180) (201) (193) (170) (723) (201) (81) (181)
Other gains (losses) (267) 44 (3) (66) (284) (61) (75) (62)
Profit/(loss) before tax 916 1,982 1,969 2,065 1,285 1,716 2,053 1,338
Income tax (499) (550) (546) (573) (314) (465) (557) (362)
Profit/(loss) for the year 417 1,431 1,422 1,492 971 1,251 1,496 976
Non-controlling interests (347) (288) (315) (293) (293) (286) (373) (266)
Net attributable profit 70 1,143 1,107 1,199 678 965 1,123 709
Net attributable profit excluding results from corporate operations 70 1,143 1,107 1,199 678 965 1,123 709
Earning per share (euros) (1) (0.00) 0.16 0.16 0.17 0.09 0.13 0.16 0.10
(1) Adjusted by additional Tier 1 instrument remuneration.
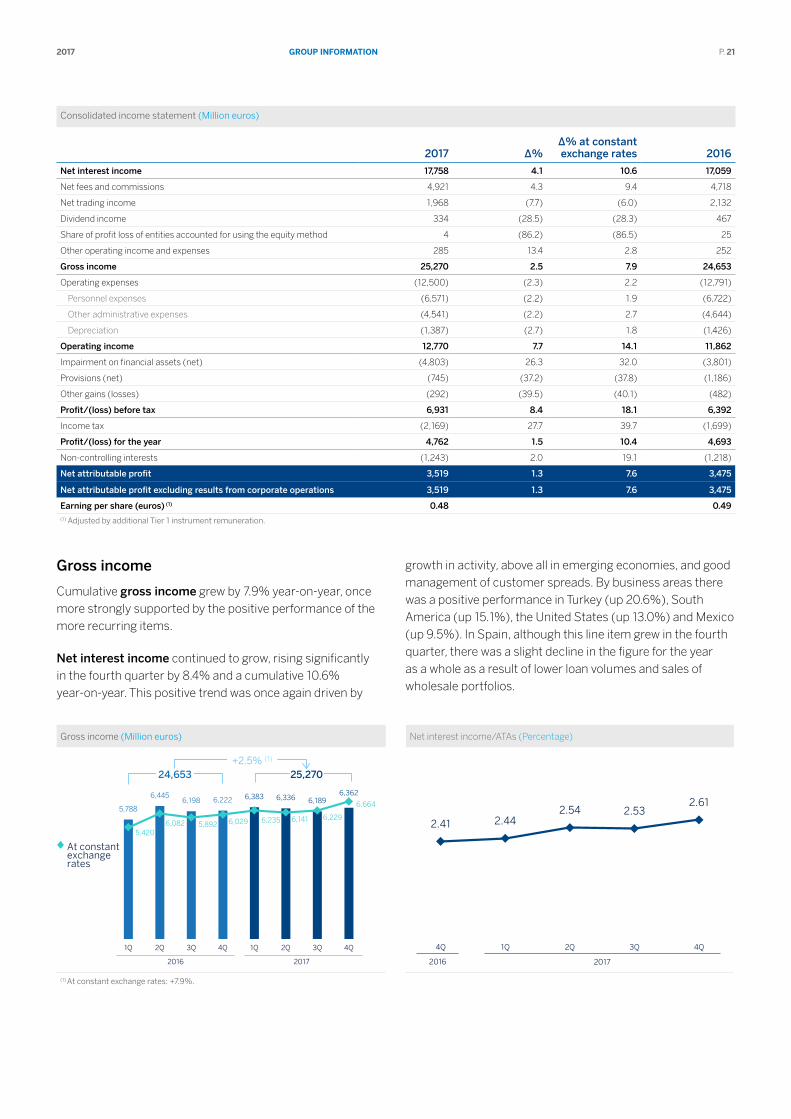
grouP InformAtIon2017 P. 21
Consolidated income statement (Million euros)
2017 ∆%∆% at constant exchange rates 2016
Net interest income 17,758 4.1 10.6 17,059
Net fees and commissions 4,921 4.3 9.4 4,718
Net trading income 1,968 (7.7) (6.0) 2,132
Dividend income 334 (28.5) (28.3) 467
Share of profit loss of entities accounted for using the equity method 4 (86.2) (86.5) 25
Other operating income and expenses 285 13.4 2.8 252
Gross income 25,270 2.5 7.9 24,653
Operating expenses (12,500) (2.3) 2.2 (12,791)
Personnel expenses (6,571) (2.2) 1.9 (6,722)
Other administrative expenses (4,541) (2.2) 2.7 (4,644)
Depreciation (1,387) (2.7) 1.8 (1,426)
Operating income 12,770 7.7 14.1 11,862
Impairment on financial assets (net) (4,803) 26.3 32.0 (3,801)
Provisions (net) (745) (37.2) (37.8) (1,186)
Other gains (losses) (292) (39.5) (40.1) (482)
Profit/(loss) before tax 6,931 8.4 18.1 6,392
Income tax (2,169) 27.7 39.7 (1,699)
Profit/(loss) for the year 4,762 1.5 10.4 4,693
Non-controlling interests (1,243) 2.0 19.1 (1,218)
Net attributable profit 3,519 1.3 7.6 3,475
Net attributable profit excluding results from corporate operations 3,519 1.3 7.6 3,475
Earning per share (euros) (1) 0.48 0.49(1) Adjusted by additional Tier 1 instrument remuneration.
Gross income
Cumulative gross income grew by 7.9% year-on-year, once more strongly supported by the positive performance of the more recurring items.
Net interest income continued to grow, rising significantly in the fourth quarter by 8.4% and a cumulative 10.6% year-on-year. This positive trend was once again driven by
growth in activity, above all in emerging economies, and good management of customer spreads. By business areas there was a positive performance in Turkey (up 20.6%), South America (up 15.1%), the United States (up 13.0%) and Mexico (up 9.5%). In Spain, although this line item grew in the fourth quarter, there was a slight decline in the figure for the year as a whole as a result of lower loan volumes and sales of wholesale portfolios.
Gross income (Million euros) Net interest income/ATAs (Percentage)
5,788
6,445 6,198 6,222 6,383 6,336 6,189
6,362
5,420 6,082 5,892 6,029 6,235 6,141 6,229
6,664
1Q 2Q 3Q 4Q 1Q 2Q 3Q 4Q
2016 2017
At constant exchange rates
24,653 25,270
+2.5% (1)
2.41 2.44 2.54 2.53
2.61
4Q 1Q 2Q 3Q 4Q
20172016
(1) At constant exchange rates: +7.9%.
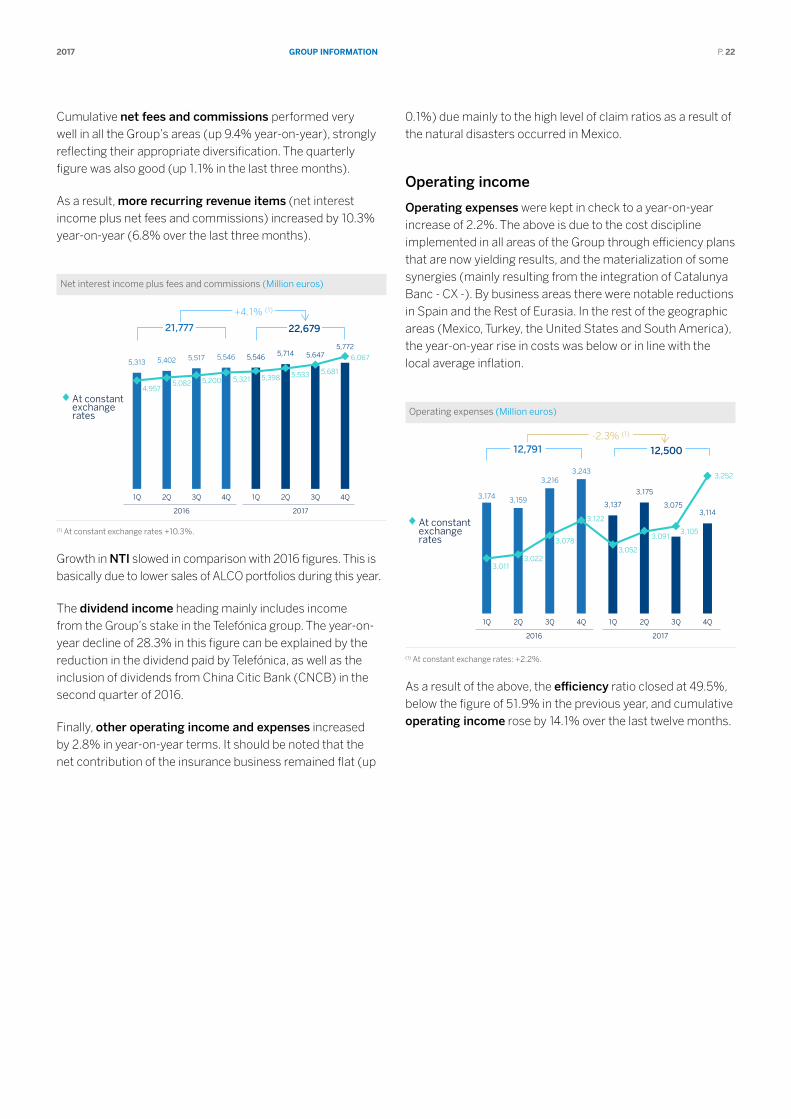
grouP InformAtIon2017 P. 22
Cumulative net fees and commissions performed very well in all the Group’s areas (up 9.4% year-on-year), strongly reflecting their appropriate diversification. The quarterly figure was also good (up 1.1% in the last three months).
As a result, more recurring revenue items (net interest income plus net fees and commissions) increased by 10.3% year-on-year (6.8% over the last three months).
Net interest income plus fees and commissions (Million euros)
5,313 5,402 5,517 5,546 5,546 5,714 5,647 5,772
4,957 5,082 5,200 5,321 5,398 5,533 5,681
6,067
1Q 2Q 3Q 4Q 1Q 2Q 3Q 4Q
2016 2017
+4.1% (1)
At constant exchange rates
22,679 21,777
(1) At constant exchange rates +10.3%.
Growth in NTI slowed in comparison with 2016 figures. This is basically due to lower sales of ALCO portfolios during this year.
The dividend income heading mainly includes income from the Group’s stake in the Telefónica group. The year-on-year decline of 28.3% in this figure can be explained by the reduction in the dividend paid by Telefónica, as well as the inclusion of dividends from China Citic Bank (CNCB) in the second quarter of 2016.
Finally, other operating income and expenses increased by 2.8% in year-on-year terms. It should be noted that the net contribution of the insurance business remained flat (up
0.1%) due mainly to the high level of claim ratios as a result of the natural disasters occurred in Mexico.
Operating income
Operating expenses were kept in check to a year-on-year increase of 2.2%. The above is due to the cost discipline implemented in all areas of the Group through efficiency plans that are now yielding results, and the materialization of some synergies (mainly resulting from the integration of Catalunya Banc - CX -). By business areas there were notable reductions in Spain and the Rest of Eurasia. In the rest of the geographic areas (Mexico, Turkey, the United States and South America), the year-on-year rise in costs was below or in line with the local average inflation.
Operating expenses (Million euros)
3,174 3,159
3,216 3,243
3,137
3,175
3,075 3,114
3,011 3,022
3,078
3,122
3,052
3,091 3,105
3,252
1Q 2Q 3Q 4Q 1Q 2Q 3Q 4Q
2016 2017
-2.3% (1)
At constant exchange rates
12,791 12,500
(1) At constant exchange rates: +2.2%.
As a result of the above, the efficiency ratio closed at 49.5%, below the figure of 51.9% in the previous year, and cumulative operating income rose by 14.1% over the last twelve months.
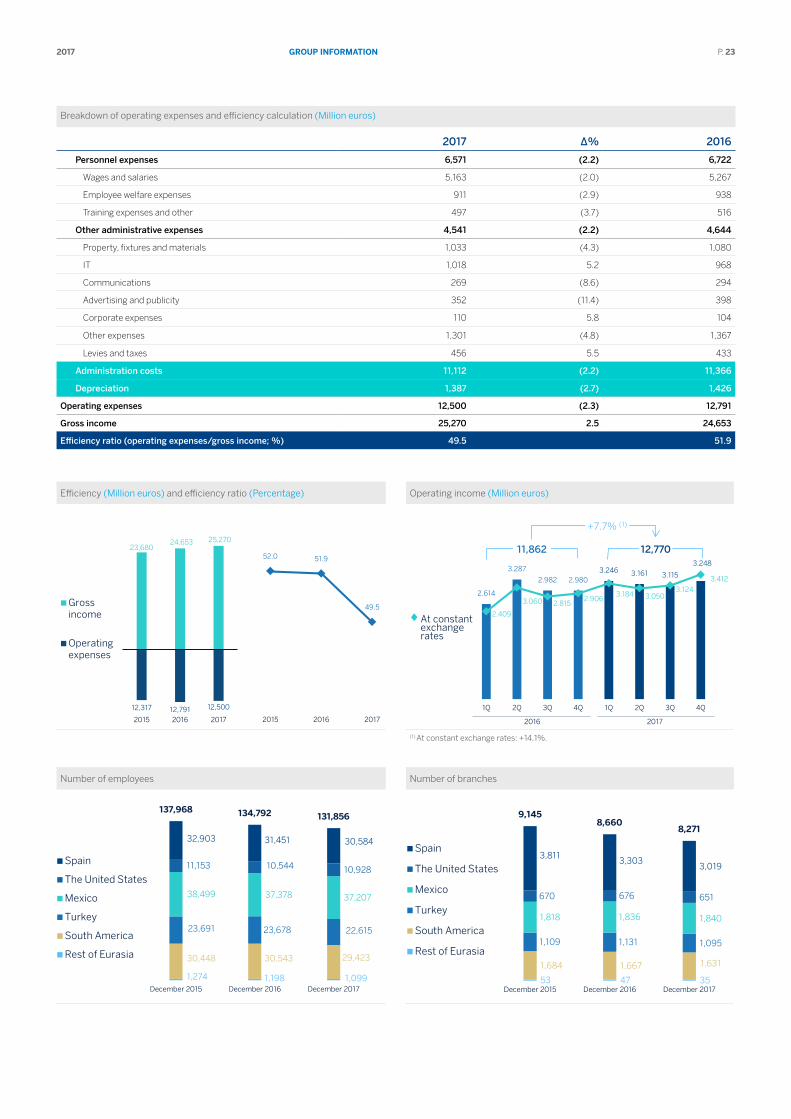
grouP InformAtIon2017 P. 23
Breakdown of operating expenses and efficiency calculation (Million euros)
2017 ∆% 2016
Personnel expenses 6,571 (2.2) 6,722
Wages and salaries 5,163 (2.0) 5,267
Employee welfare expenses 911 (2.9) 938
Training expenses and other 497 (3.7) 516
Other administrative expenses 4,541 (2.2) 4,644
Property, fixtures and materials 1,033 (4.3) 1,080
IT 1,018 5.2 968
Communications 269 (8.6) 294
Advertising and publicity 352 (11.4) 398
Corporate expenses 110 5.8 104
Other expenses 1,301 (4.8) 1,367
Levies and taxes 456 5.5 433
Administration costs 11,112 (2.2) 11,366
Depreciation 1,387 (2.7) 1,426
Operating expenses 12,500 (2.3) 12,791
Gross income 25,270 2.5 24,653
Efficiency ratio (operating expenses/gross income; %) 49.5 51.9
Efficiency (Million euros) and efficiency ratio (Percentage) Operating income (Million euros)
12,317 12,791 12,500
23,680 24,653 25,270
2015 2016 2017
Grossincome
Operatingexpenses
52.0 51.9
49.5
2015 2016 2017
2.614
3.287
2.982 2.980 3.246 3.161 3.115
3.248
2.409
3.060 2.815 2.906
3.184 3.050 3.124
3.412
1Q 2Q 3Q 4Q 1Q 2Q 3Q 4Q
2016 2017
At constant exchange rates
+7.7% (1)
11,862 12,770
(1) At constant exchange rates: +14.1%.
Number of employees Number of branches
1,274 1,198 1,099
30,448 30,543 29,423
23,691 23,678 22,615
38,499 37,378 37,207
11,153 10,544 10,928
32,903 31,451 30,584
137,968 134,792 131,856
December 2015 December 2016 December 2017
Spain
The United States
Mexico
Turkey
South America
Rest of Eurasia
53 47 35
1,684 1,667 1,631
1,109 1,131 1,095
1,818 1,836 1,840
670 676 651
3,811 3,303
3,019
9,145 8,660
8,271
December 2015 December 2016 December 2017
Spain
The United States
Mexico
Turkey
South America
Rest of Eurasia
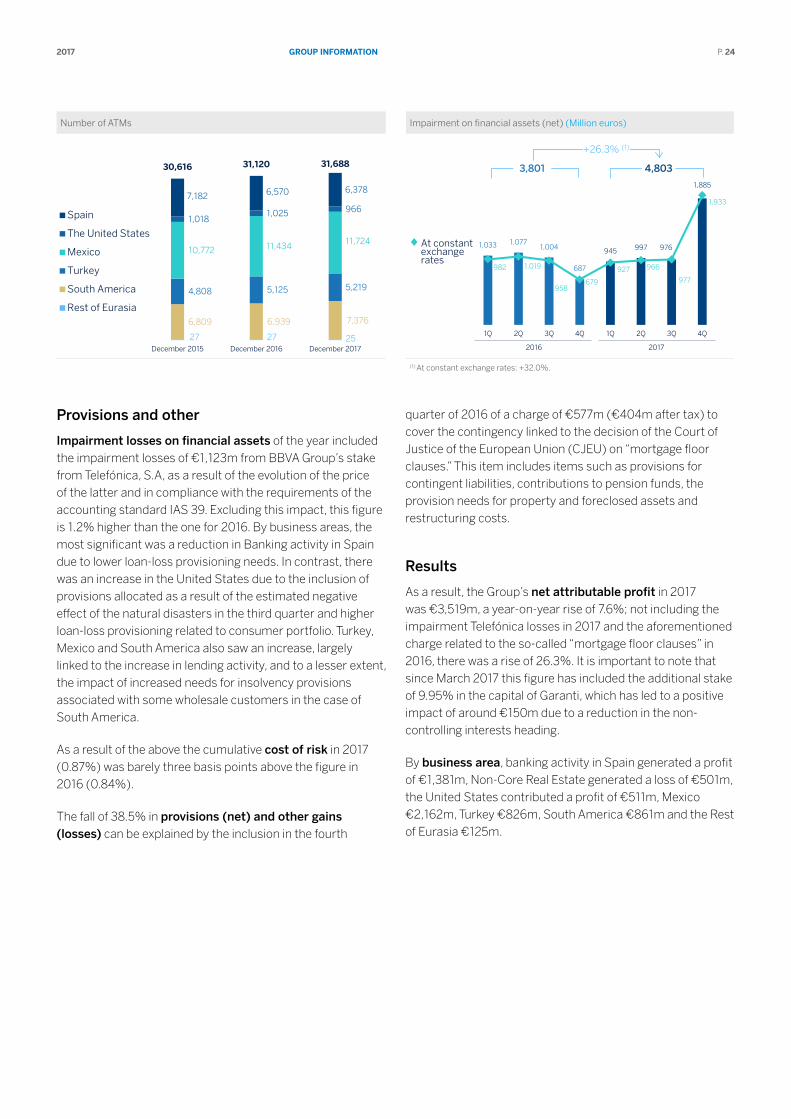
grouP InformAtIon2017 P. 24
Number of ATMs Impairment on financial assets (net) (Million euros)
27 27 25
6,809 6,939 7,376
4,808 5,125 5,219
10,772 11,434 11,724
1,018 1,025 966
7,182 6,570 6,378
30,616 31,120 31,688
December 2015 December 2016 December 2017
Spain
The United States
Mexico
Turkey
South America
Rest of Eurasia
1,033 1,077 1,004
687
945 997 976
1,885
982 1,019
958 679
927 966
977
1,933
1Q 2Q 3Q 4Q 1Q 2Q 3Q 4Q
2016 2017
At constant exchange rates
3,801 4,803
+26.3% (1)
(1) At constant exchange rates: +32.0%.
Provisions and other
Impairment losses on financial assets of the year included the impairment losses of €1,123m from BBVA Group’s stake from Telefónica, S.A, as a result of the evolution of the price of the latter and in compliance with the requirements of the accounting standard IAS 39. Excluding this impact, this figure is 1.2% higher than the one for 2016. By business areas, the most significant was a reduction in Banking activity in Spain due to lower loan-loss provisioning needs. In contrast, there was an increase in the United States due to the inclusion of provisions allocated as a result of the estimated negative effect of the natural disasters in the third quarter and higher loan-loss provisioning related to consumer portfolio. Turkey, Mexico and South America also saw an increase, largely linked to the increase in lending activity, and to a lesser extent, the impact of increased needs for insolvency provisions associated with some wholesale customers in the case of South America.
As a result of the above the cumulative cost of risk in 2017 (0.87%) was barely three basis points above the figure in 2016 (0.84%).
The fall of 38.5% in provisions (net) and other gains (losses) can be explained by the inclusion in the fourth
quarter of 2016 of a charge of €577m (€404m after tax) to cover the contingency linked to the decision of the Court of Justice of the European Union (CJEU) on “mortgage floor clauses.” This item includes items such as provisions for contingent liabilities, contributions to pension funds, the provision needs for property and foreclosed assets and restructuring costs.
Results
As a result, the Group’s net attributable profit in 2017 was €3,519m, a year-on-year rise of 7.6%; not including the impairment Telefónica losses in 2017 and the aforementioned charge related to the so-called “mortgage floor clauses” in 2016, there was a rise of 26.3%. It is important to note that since March 2017 this figure has included the additional stake of 9.95% in the capital of Garanti, which has led to a positive impact of around €150m due to a reduction in the non-controlling interests heading.
By business area, banking activity in Spain generated a profit of €1,381m, Non-Core Real Estate generated a loss of €501m, the United States contributed a profit of €511m, Mexico €2,162m, Turkey €826m, South America €861m and the Rest of Eurasia €125m.
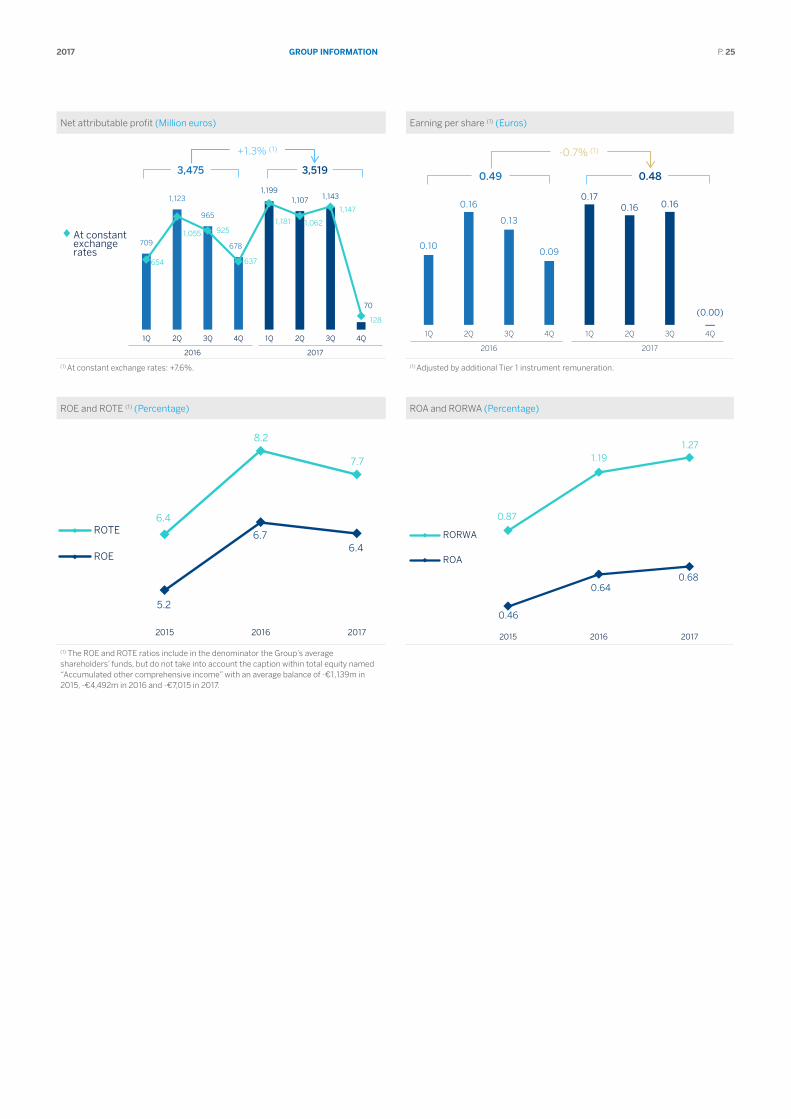
grouP InformAtIon2017 P. 25
Net attributable profit (Million euros) Earning per share (1) (Euros)
709
1,123
965
678
1,199 1,107 1,143
70
654
1,055 925
637
1,181 1,062
1,147
128
1Q 2Q 3Q 4Q 1Q 2Q 3Q 4Q
2016 2017
At constant exchange rates
+1.3% (1)
3,475 3,519
0.10
0.16
0.13
0.09
0.17 0.16 0.16
(0.00)
1Q 2Q 3Q 4Q 1Q 2Q 3Q 4Q
2016 2017
0.48 0.49
-0.7% (1)
(1) At constant exchange rates: +7.6%. (1) Adjusted by additional Tier 1 instrument remuneration.
ROE and ROTE (1) (Percentage) ROA and RORWA (Percentage)
6.4
8.2
7.7
5.2
6.7 6.4
2015 2016 2017
ROTE
ROE
0.87
1.19 1.27
0.46
0.64 0.68
2015 2016 2017
RORWA
ROA
(1) The ROE and ROTE ratios include in the denominator the Group’s average shareholders’ funds, but do not take into account the caption within total equity named “Accumulated other comprehensive income” with an average balance of -€1,139m in 2015, -€4,492m in 2016 and -€7,015 in 2017.
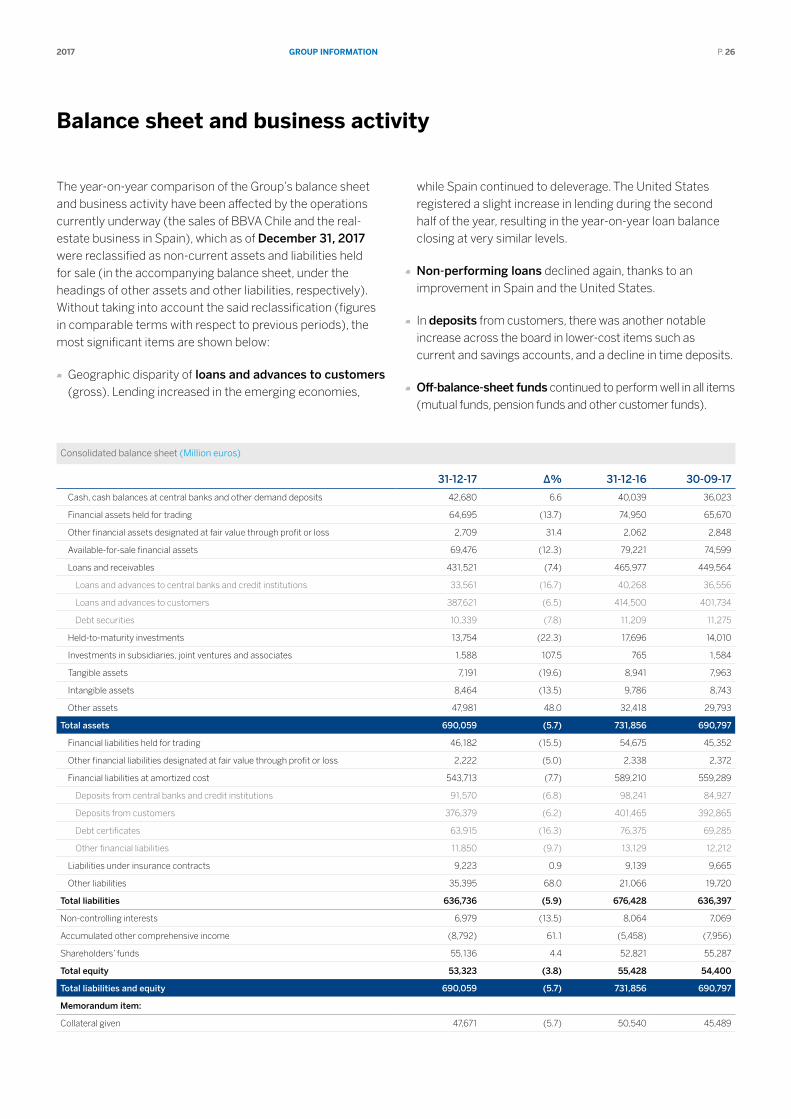
grouP InformAtIon2017 P. 26
Balance sheet and business activity
The year-on-year comparison of the Group’s balance sheet and business activity have been affected by the operations currently underway (the sales of BBVA Chile and the real-estate business in Spain), which as of December 31, 2017 were reclassified as non-current assets and liabilities held for sale (in the accompanying balance sheet, under the headings of other assets and other liabilities, respectively). Without taking into account the said reclassification (figures in comparable terms with respect to previous periods), the most significant items are shown below:
Geographic disparity of loans and advances to customers (gross). Lending increased in the emerging economies,
while Spain continued to deleverage. The United States registered a slight increase in lending during the second half of the year, resulting in the year-on-year loan balance closing at very similar levels.
Non-performing loans declined again, thanks to an improvement in Spain and the United States.
In deposits from customers, there was another notable increase across the board in lower-cost items such as current and savings accounts, and a decline in time deposits.
Off-balance-sheet funds continued to perform well in all items (mutual funds, pension funds and other customer funds).
Consolidated balance sheet (Million euros)
31-12-17 ∆% 31-12-16 30-09-17
Cash, cash balances at central banks and other demand deposits 42,680 6.6 40,039 36,023
Financial assets held for trading 64,695 (13.7) 74,950 65,670
Other financial assets designated at fair value through profit or loss 2,709 31.4 2,062 2,848
Available-for-sale financial assets 69,476 (12.3) 79,221 74,599
Loans and receivables 431,521 (7.4) 465,977 449,564
Loans and advances to central banks and credit institutions 33,561 (16.7) 40,268 36,556
Loans and advances to customers 387,621 (6.5) 414,500 401,734
Debt securities 10,339 (7.8) 11,209 11,275
Held-to-maturity investments 13,754 (22.3) 17,696 14,010
Investments in subsidiaries, joint ventures and associates 1,588 107.5 765 1,584
Tangible assets 7,191 (19.6) 8,941 7,963
Intangible assets 8,464 (13.5) 9,786 8,743
Other assets 47,981 48.0 32,418 29,793
Total assets 690,059 (5.7) 731,856 690,797
Financial liabilities held for trading 46,182 (15.5) 54,675 45,352
Other financial liabilities designated at fair value through profit or loss 2,222 (5.0) 2,338 2,372
Financial liabilities at amortized cost 543,713 (7.7) 589,210 559,289
Deposits from central banks and credit institutions 91,570 (6.8) 98,241 84,927
Deposits from customers 376,379 (6.2) 401,465 392,865
Debt certificates 63,915 (16.3) 76,375 69,285
Other financial liabilities 11,850 (9.7) 13,129 12,212
Liabilities under insurance contracts 9,223 0.9 9,139 9,665
Other liabilities 35,395 68.0 21,066 19,720
Total liabilities 636,736 (5.9) 676,428 636,397
Non-controlling interests 6,979 (13.5) 8,064 7,069
Accumulated other comprehensive income (8,792) 61.1 (5,458) (7,956)
Shareholders’ funds 55,136 4.4 52,821 55,287
Total equity 53,323 (3.8) 55,428 54,400
Total liabilities and equity 690,059 (5.7) 731,856 690,797
Memorandum item:
Collateral given 47,671 (5.7) 50,540 45,489
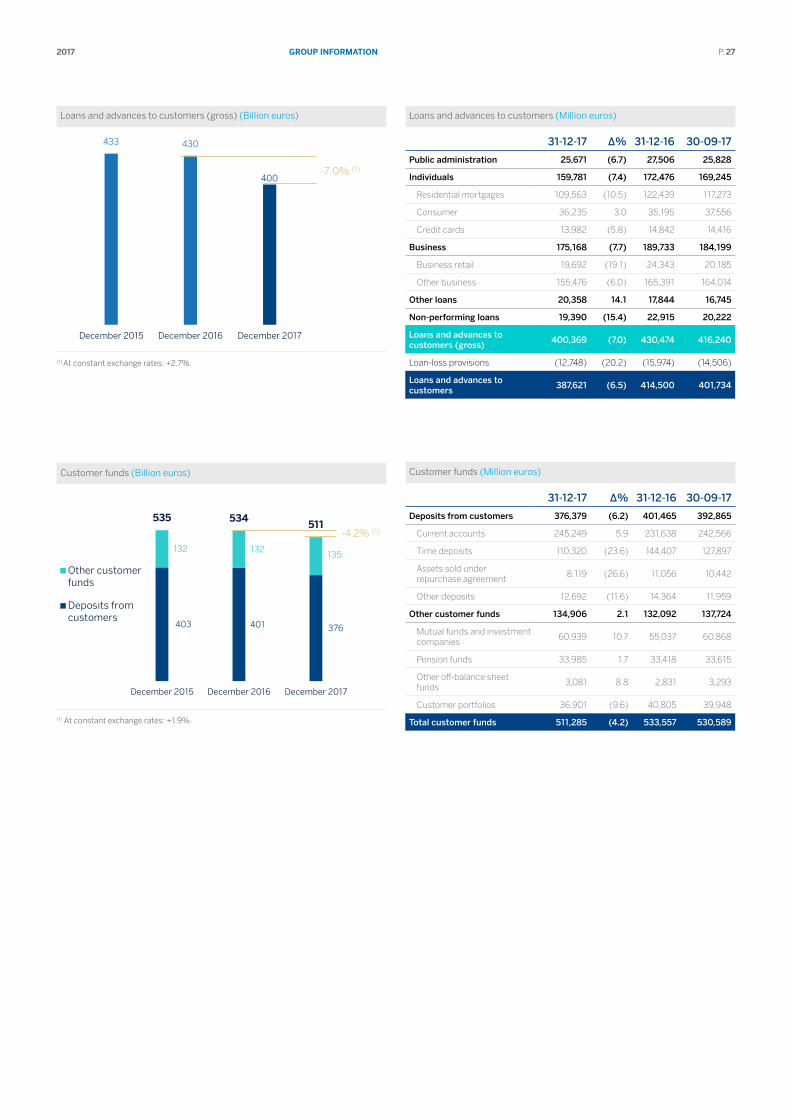
grouP InformAtIon2017 P. 27
Loans and advances to customers (gross) (Billion euros)
433 430
400
December 2015 December 2016 December 2017
-7.0% (1)
(1) At constant exchange rates: +2.7%.
Customer funds (Billion euros)
403 401 376
132 132 135
535 534 511
December 2015 December 2016 December 2017
Other customerfunds
Deposits fromcustomers
-4.2% (1)
(1) At constant exchange rates: +1.9%.
Loans and advances to customers (Million euros)
31-12-17 ∆% 31-12-16 30-09-17
Public administration 25,671 (6.7) 27,506 25,828
Individuals 159,781 (7.4) 172,476 169,245
Residential mortgages 109,563 (10.5) 122,439 117,273
Consumer 36,235 3.0 35,195 37,556
Credit cards 13,982 (5.8) 14,842 14,416
Business 175,168 (7.7) 189,733 184,199
Business retail 19,692 (19.1) 24,343 20,185
Other business 155,476 (6.0) 165,391 164,014
Other loans 20,358 14.1 17,844 16,745
Non-performing loans 19,390 (15.4) 22,915 20,222
Loans and advances to customers (gross) 400,369 (7.0) 430,474 416,240
Loan-loss provisions (12,748) (20.2) (15,974) (14,506)
Loans and advances to customers 387,621 (6.5) 414,500 401,734
Customer funds (Million euros)
31-12-17 ∆% 31-12-16 30-09-17
Deposits from customers 376,379 (6.2) 401,465 392,865
Current accounts 245,249 5.9 231,638 242,566
Time deposits 110,320 (23.6) 144,407 127,897
Assets sold under repurchase agreement
8,119 (26.6) 11,056 10,442
Other deposits 12,692 (11.6) 14,364 11,959
Other customer funds 134,906 2.1 132,092 137,724
Mutual funds and investment companies
60,939 10.7 55,037 60,868
Pension funds 33,985 1.7 33,418 33,615
Other off-balance sheet funds
3,081 8.8 2,831 3,293
Customer portfolios 36,901 (9.6) 40,805 39,948
Total customer funds 511,285 (4.2) 533,557 530,589
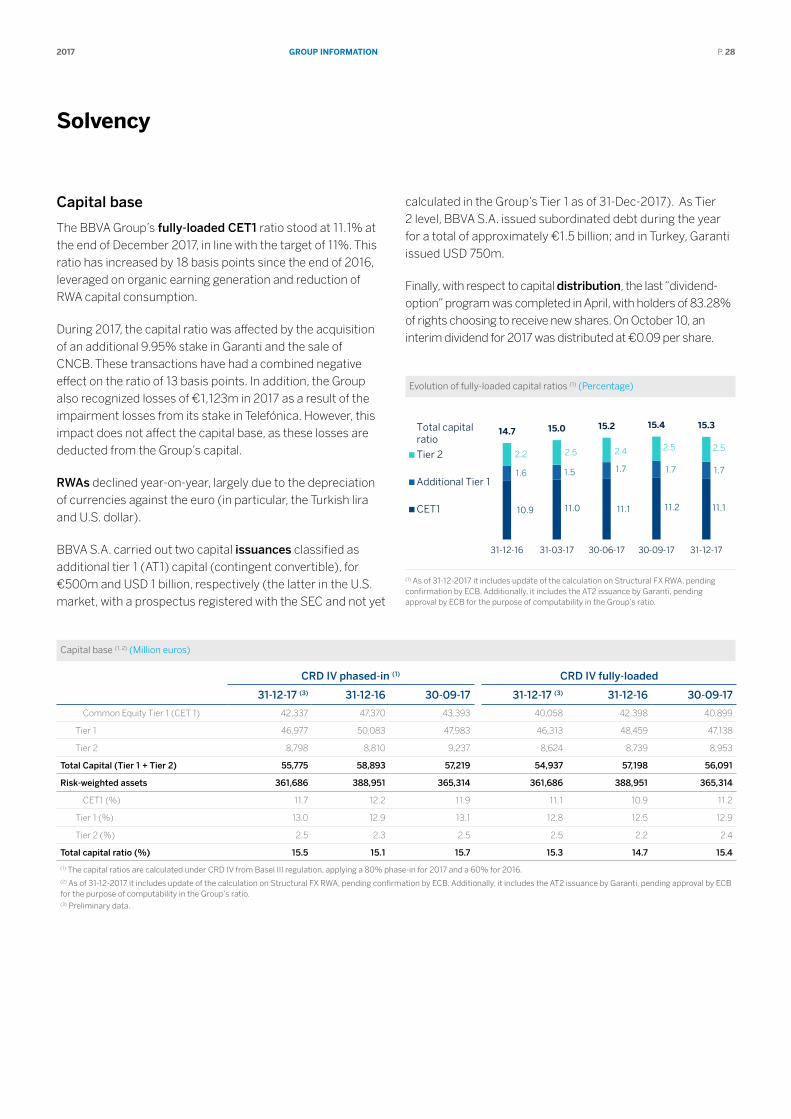
grouP InformAtIon2017 P. 28
Solvency
Capital base
The BBVA Group’s fully-loaded CET1 ratio stood at 11.1% at the end of December 2017, in line with the target of 11%. This ratio has increased by 18 basis points since the end of 2016, leveraged on organic earning generation and reduction of RWA capital consumption.
During 2017, the capital ratio was affected by the acquisition of an additional 9.95% stake in Garanti and the sale of CNCB. These transactions have had a combined negative effect on the ratio of 13 basis points. In addition, the Group also recognized losses of €1,123m in 2017 as a result of the impairment losses from its stake in Telefónica. However, this impact does not affect the capital base, as these losses are deducted from the Group’s capital.
RWAs declined year-on-year, largely due to the depreciation of currencies against the euro (in particular, the Turkish lira and U.S. dollar).
BBVA S.A. carried out two capital issuances classified as additional tier 1 (AT1) capital (contingent convertible), for €500m and USD 1 billion, respectively (the latter in the U.S. market, with a prospectus registered with the SEC and not yet
calculated in the Group’s Tier 1 as of 31-Dec-2017). As Tier 2 level, BBVA S.A. issued subordinated debt during the year for a total of approximately €1.5 billion; and in Turkey, Garanti issued USD 750m.
Finally, with respect to capital distribution, the last “dividend-option” program was completed in April, with holders of 83.28% of rights choosing to receive new shares. On October 10, an interim dividend for 2017 was distributed at €0.09 per share.
Evolution of fully-loaded capital ratios (1) (Percentage)
10.9 11.0 11.1 11.2 11.1
1.6 1.5 1.7 1.7 1.7
2.2 2.5 2.4 2.5 2.5
14.7 15.0 15.2 15.4 15.3
31-12-16 31-03-17 30-06-17 30-09-17 31-12-17
Total capitalratio
Tier 2
Additional Tier 1
CET1
(1) As of 31-12-2017 it includes update of the calculation on Structural FX RWA, pending confirmation by ECB. Additionally, it includes the AT2 issuance by Garanti, pending approval by ECB for the purpose of computability in the Group’s ratio.
Capital base (1, 2) (Million euros)
CRD IV phased-in (1) CRD IV fully-loaded
31-12-17 (3) 31-12-16 30-09-17 31-12-17 (3) 31-12-16 30-09-17
Common Equity Tier 1 (CET 1) 42,337 47,370 43,393 40,058 42,398 40,899
Tier 1 46,977 50,083 47,983 46,313 48,459 47,138
Tier 2 8,798 8,810 9,237 8,624 8,739 8,953
Total Capital (Tier 1 + Tier 2) 55,775 58,893 57,219 54,937 57,198 56,091
Risk-weighted assets 361,686 388,951 365,314 361,686 388,951 365,314
CET1 (%) 11.7 12.2 11.9 11.1 10.9 11.2
Tier 1 (%) 13.0 12.9 13.1 12.8 12.5 12.9
Tier 2 (%) 2.5 2.3 2.5 2.5 2.2 2.4
Total capital ratio (%) 15.5 15.1 15.7 15.3 14.7 15.4
(1) The capital ratios are calculated under CRD IV from Basel III regulation, applying a 80% phase-in for 2017 and a 60% for 2016.(2) As of 31-12-2017 it includes update of the calculation on Structural FX RWA, pending confirmation by ECB. Additionally, it includes the AT2 issuance by Garanti, pending approval by ECB for the purpose of computability in the Group’s ratio.(3) Preliminary data.
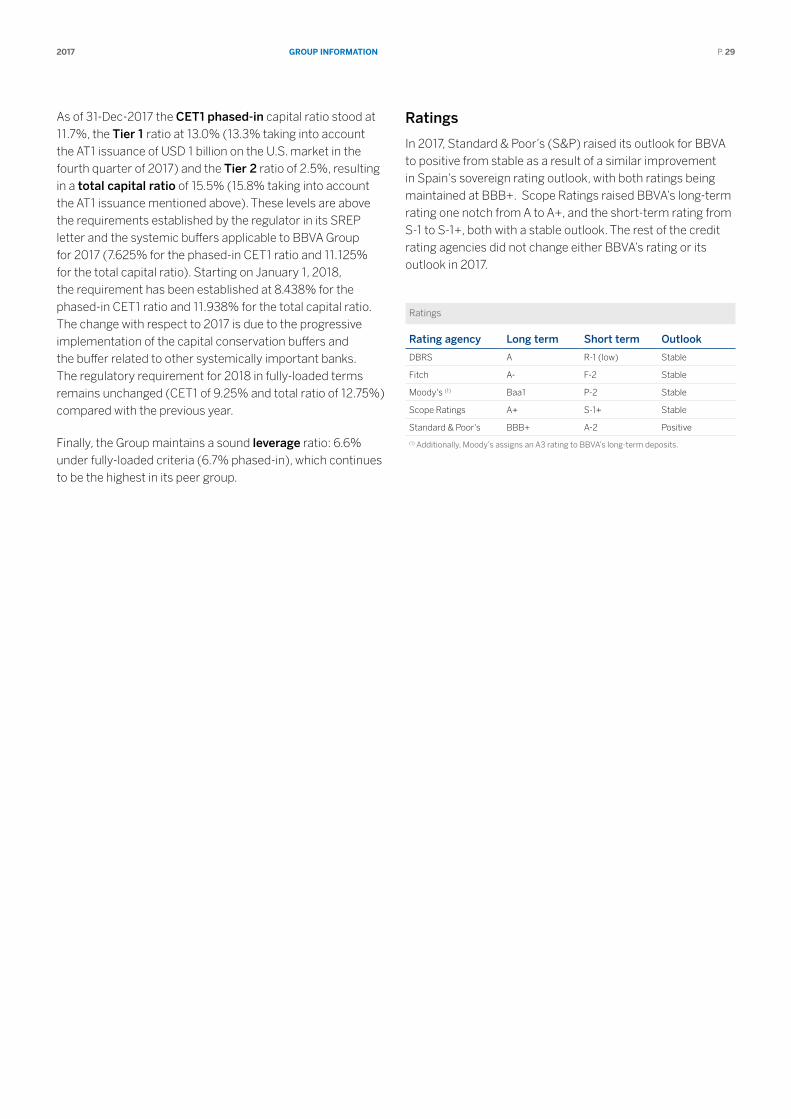
grouP InformAtIon2017 P. 29
As of 31-Dec-2017 the CET1 phased-in capital ratio stood at 11.7%, the Tier 1 ratio at 13.0% (13.3% taking into account the AT1 issuance of USD 1 billion on the U.S. market in the fourth quarter of 2017) and the Tier 2 ratio of 2.5%, resulting in a total capital ratio of 15.5% (15.8% taking into account the AT1 issuance mentioned above). These levels are above the requirements established by the regulator in its SREP letter and the systemic buffers applicable to BBVA Group for 2017 (7.625% for the phased-in CET1 ratio and 11.125% for the total capital ratio). Starting on January 1, 2018, the requirement has been established at 8.438% for the phased-in CET1 ratio and 11.938% for the total capital ratio. The change with respect to 2017 is due to the progressive implementation of the capital conservation buffers and the buffer related to other systemically important banks. The regulatory requirement for 2018 in fully-loaded terms remains unchanged (CET1 of 9.25% and total ratio of 12.75%) compared with the previous year.
Finally, the Group maintains a sound leverage ratio: 6.6% under fully-loaded criteria (6.7% phased-in), which continues to be the highest in its peer group.
Ratings
In 2017, Standard & Poor’s (S&P) raised its outlook for BBVA to positive from stable as a result of a similar improvement in Spain’s sovereign rating outlook, with both ratings being maintained at BBB+. Scope Ratings raised BBVA’s long-term rating one notch from A to A+, and the short-term rating from S-1 to S-1+, both with a stable outlook. The rest of the credit rating agencies did not change either BBVA’s rating or its outlook in 2017.
Ratings
Rating agency Long term Short term Outlook
DBRS A R-1 (low) Stable
Fitch A- F-2 Stable
Moody's (1) Baa1 P-2 Stable
Scope Ratings A+ S-1+ Stable
Standard & Poor's BBB+ A-2 Positive
(1) Additionally, Moody’s assigns an A3 rating to BBVA’s long-term deposits.
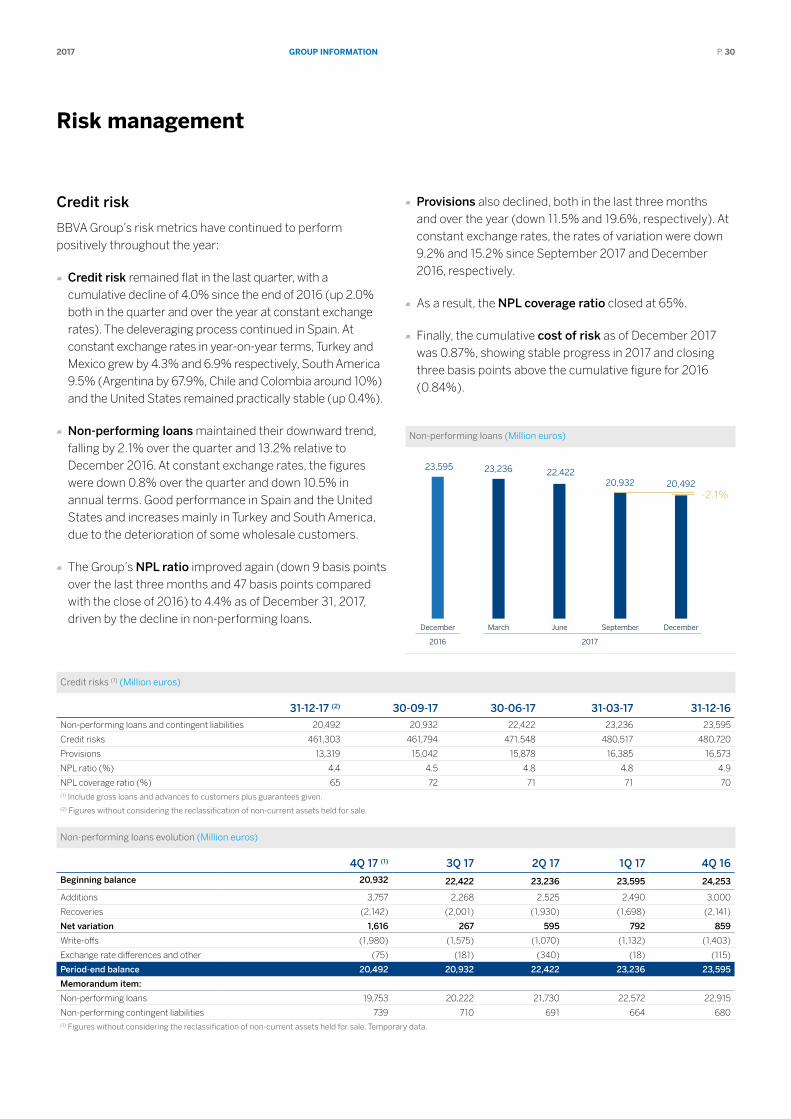
grouP InformAtIon2017 P. 30
risk management
Credit risk
BBVA Group’s risk metrics have continued to perform positively throughout the year:
Credit risk remained flat in the last quarter, with a cumulative decline of 4.0% since the end of 2016 (up 2.0% both in the quarter and over the year at constant exchange rates). The deleveraging process continued in Spain. At constant exchange rates in year-on-year terms, Turkey and Mexico grew by 4.3% and 6.9% respectively, South America 9.5% (Argentina by 67.9%, Chile and Colombia around 10%) and the United States remained practically stable (up 0.4%).
Non-performing loans maintained their downward trend, falling by 2.1% over the quarter and 13.2% relative to December 2016. At constant exchange rates, the figures were down 0.8% over the quarter and down 10.5% in annual terms. Good performance in Spain and the United States and increases mainly in Turkey and South America, due to the deterioration of some wholesale customers.
The Group’s NPL ratio improved again (down 9 basis points over the last three months and 47 basis points compared with the close of 2016) to 4.4% as of December 31, 2017, driven by the decline in non-performing loans.
Provisions also declined, both in the last three months and over the year (down 11.5% and 19.6%, respectively). At constant exchange rates, the rates of variation were down 9.2% and 15.2% since September 2017 and December 2016, respectively.
As a result, the NPL coverage ratio closed at 65%.
Finally, the cumulative cost of risk as of December 2017 was 0.87%, showing stable progress in 2017 and closing three basis points above the cumulative figure for 2016 (0.84%).
Non-performing loans (Million euros)
23,595 23,236 22,422 20,932 20,492
December March June September December
2016 2017
-2.1%
Credit risks (1) (Million euros)
31-12-17 (2) 30-09-17 30-06-17 31-03-17 31-12-16Non-performing loans and contingent liabilities 20,492 20,932 22,422 23,236 23,595
Credit risks 461,303 461,794 471,548 480,517 480,720
Provisions 13,319 15,042 15,878 16,385 16,573
NPL ratio (%) 4.4 4.5 4.8 4.8 4.9
NPL coverage ratio (%) 65 72 71 71 70(1) Include gross loans and advances to customers plus guarantees given.(2) Figures without considering the reclassification of non-current assets held for sale .
Non-performing loans evolution (Million euros)
4Q 17 (1) 3Q 17 2Q 17 1Q 17 4Q 16Beginning balance 20,932 22,422 23,236 23,595 24,253
Additions 3,757 2,268 2,525 2,490 3,000
Recoveries (2,142) (2,001) (1,930) (1,698) (2,141)
Net variation 1,616 267 595 792 859
Write-offs (1,980) (1,575) (1,070) (1,132) (1,403)
Exchange rate differences and other (75) (181) (340) (18) (115)
Period-end balance 20,492 20,932 22,422 23,236 23,595
Memorandum item:
Non-performing loans 19,753 20,222 21,730 22,572 22,915
Non-performing contingent liabilities 739 710 691 664 680(1) Figures without considering the reclassification of non-current assets held for sale . Temporary data.
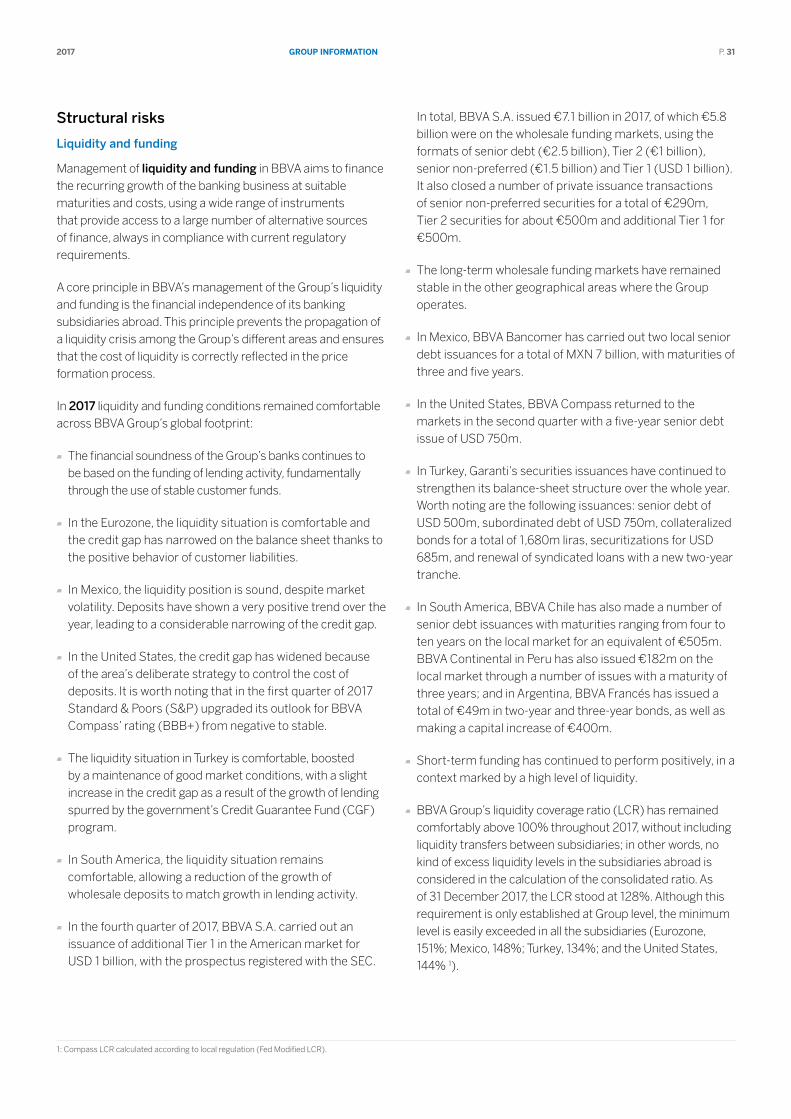
grouP InformAtIon2017 P. 31
Structural risks
Liquidity and funding
Management of liquidity and funding in BBVA aims to finance the recurring growth of the banking business at suitable maturities and costs, using a wide range of instruments that provide access to a large number of alternative sources of finance, always in compliance with current regulatory requirements.
A core principle in BBVA’s management of the Group’s liquidity and funding is the financial independence of its banking subsidiaries abroad. This principle prevents the propagation of a liquidity crisis among the Group’s different areas and ensures that the cost of liquidity is correctly reflected in the price formation process.
In 2017 liquidity and funding conditions remained comfortable across BBVA Group’s global footprint:
The financial soundness of the Group’s banks continues to be based on the funding of lending activity, fundamentally through the use of stable customer funds.
In the Eurozone, the liquidity situation is comfortable and the credit gap has narrowed on the balance sheet thanks to the positive behavior of customer liabilities.
In Mexico, the liquidity position is sound, despite market volatility. Deposits have shown a very positive trend over the year, leading to a considerable narrowing of the credit gap.
In the United States, the credit gap has widened because of the area’s deliberate strategy to control the cost of deposits. It is worth noting that in the first quarter of 2017 Standard & Poors (S&P) upgraded its outlook for BBVA Compass’ rating (BBB+) from negative to stable.
The liquidity situation in Turkey is comfortable, boosted by a maintenance of good market conditions, with a slight increase in the credit gap as a result of the growth of lending spurred by the government’s Credit Guarantee Fund (CGF) program.
In South America, the liquidity situation remains comfortable, allowing a reduction of the growth of wholesale deposits to match growth in lending activity.
In the fourth quarter of 2017, BBVA S.A. carried out an issuance of additional Tier 1 in the American market for USD 1 billion, with the prospectus registered with the SEC.
In total, BBVA S.A. issued €7.1 billion in 2017, of which €5.8 billion were on the wholesale funding markets, using the formats of senior debt (€2.5 billion), Tier 2 (€1 billion), senior non-preferred (€1.5 billion) and Tier 1 (USD 1 billion). It also closed a number of private issuance transactions of senior non-preferred securities for a total of €290m, Tier 2 securities for about €500m and additional Tier 1 for €500m.
The long-term wholesale funding markets have remained stable in the other geographical areas where the Group operates.
In Mexico, BBVA Bancomer has carried out two local senior debt issuances for a total of MXN 7 billion, with maturities of three and five years.
In the United States, BBVA Compass returned to the markets in the second quarter with a five-year senior debt issue of USD 750m.
In Turkey, Garanti’s securities issuances have continued to strengthen its balance-sheet structure over the whole year. Worth noting are the following issuances: senior debt of USD 500m, subordinated debt of USD 750m, collateralized bonds for a total of 1,680m liras, securitizations for USD 685m, and renewal of syndicated loans with a new two-year tranche.
In South America, BBVA Chile has also made a number of senior debt issuances with maturities ranging from four to ten years on the local market for an equivalent of €505m. BBVA Continental in Peru has also issued €182m on the local market through a number of issues with a maturity of three years; and in Argentina, BBVA Francés has issued a total of €49m in two-year and three-year bonds, as well as making a capital increase of €400m.
Short-term funding has continued to perform positively, in a context marked by a high level of liquidity.
BBVA Group’s liquidity coverage ratio (LCR) has remained comfortably above 100% throughout 2017, without including liquidity transfers between subsidiaries; in other words, no kind of excess liquidity levels in the subsidiaries abroad is considered in the calculation of the consolidated ratio. As of 31 December 2017, the LCR stood at 128%. Although this requirement is only established at Group level, the minimum level is easily exceeded in all the subsidiaries (Eurozone, 151%; Mexico, 148%; Turkey, 134%; and the United States, 144% 1).
1: Compass LCR calculated according to local regulation (Fed Modified LCR).
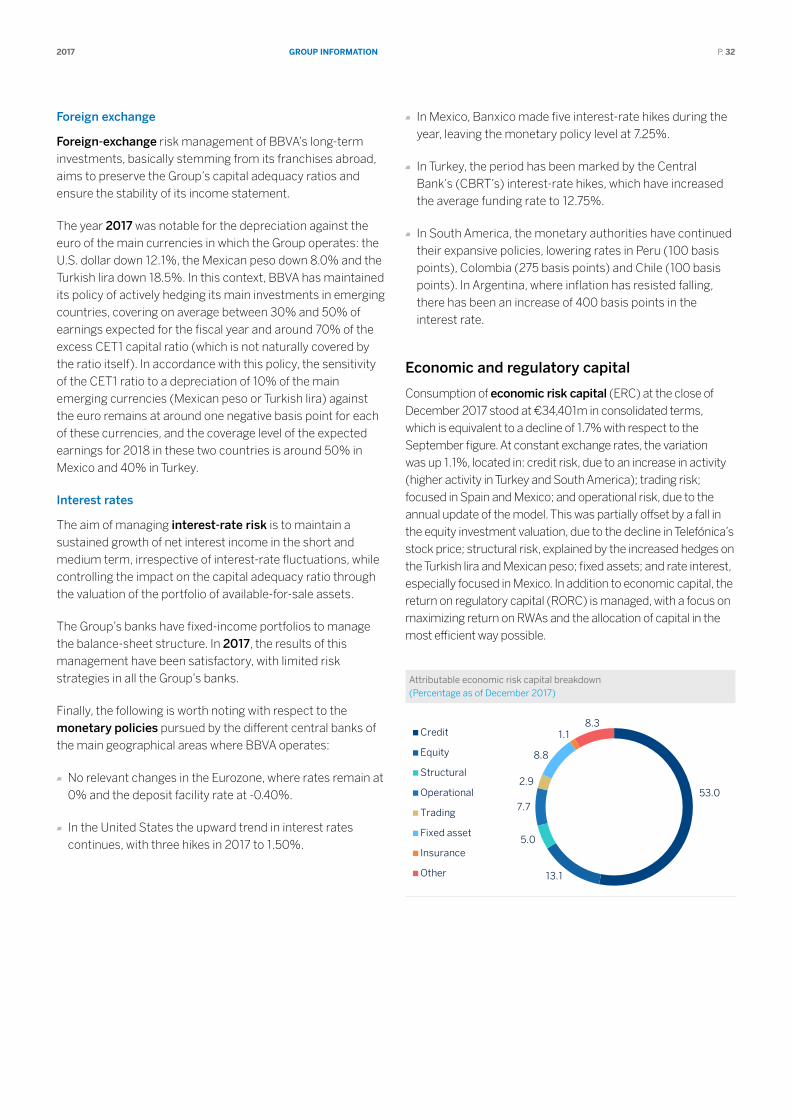
grouP InformAtIon2017 P. 32
Foreign exchange
Foreign-exchange risk management of BBVA’s long-term investments, basically stemming from its franchises abroad, aims to preserve the Group’s capital adequacy ratios and ensure the stability of its income statement.
The year 2017 was notable for the depreciation against the euro of the main currencies in which the Group operates: the U.S. dollar down 12.1%, the Mexican peso down 8.0% and the Turkish lira down 18.5%. In this context, BBVA has maintained its policy of actively hedging its main investments in emerging countries, covering on average between 30% and 50% of earnings expected for the fiscal year and around 70% of the excess CET1 capital ratio (which is not naturally covered by the ratio itself). In accordance with this policy, the sensitivity of the CET1 ratio to a depreciation of 10% of the main emerging currencies (Mexican peso or Turkish lira) against the euro remains at around one negative basis point for each of these currencies, and the coverage level of the expected earnings for 2018 in these two countries is around 50% in Mexico and 40% in Turkey.
Interest rates
The aim of managing interest-rate risk is to maintain a sustained growth of net interest income in the short and medium term, irrespective of interest-rate fluctuations, while controlling the impact on the capital adequacy ratio through the valuation of the portfolio of available-for-sale assets.
The Group’s banks have fixed-income portfolios to manage the balance-sheet structure. In 2017, the results of this management have been satisfactory, with limited risk strategies in all the Group’s banks.
Finally, the following is worth noting with respect to the monetary policies pursued by the different central banks of the main geographical areas where BBVA operates:
No relevant changes in the Eurozone, where rates remain at 0% and the deposit facility rate at -0.40%.
In the United States the upward trend in interest rates continues, with three hikes in 2017 to 1.50%.
In Mexico, Banxico made five interest-rate hikes during the year, leaving the monetary policy level at 7.25%.
In Turkey, the period has been marked by the Central Bank’s (CBRT’s) interest-rate hikes, which have increased the average funding rate to 12.75%.
In South America, the monetary authorities have continued their expansive policies, lowering rates in Peru (100 basis points), Colombia (275 basis points) and Chile (100 basis points). In Argentina, where inflation has resisted falling, there has been an increase of 400 basis points in the interest rate.
Economic and regulatory capital
Consumption of economic risk capital (ERC) at the close of December 2017 stood at €34,401m in consolidated terms, which is equivalent to a decline of 1.7% with respect to the September figure. At constant exchange rates, the variation was up 1.1%, located in: credit risk, due to an increase in activity (higher activity in Turkey and South America); trading risk; focused in Spain and Mexico; and operational risk, due to the annual update of the model. This was partially offset by a fall in the equity investment valuation, due to the decline in Telefónica’s stock price; structural risk, explained by the increased hedges on the Turkish lira and Mexican peso; fixed assets; and rate interest, especially focused in Mexico. In addition to economic capital, the return on regulatory capital (RORC) is managed, with a focus on maximizing return on RWAs and the allocation of capital in the most efficient way possible.
Attributable economic risk capital breakdown (Percentage as of December 2017)
53.0
13.1
5.0
7.7
2.9
8.8
1.1 8.3
Credit
Equity
Structural
Operational
Trading
Fixed asset
Insurance
Other
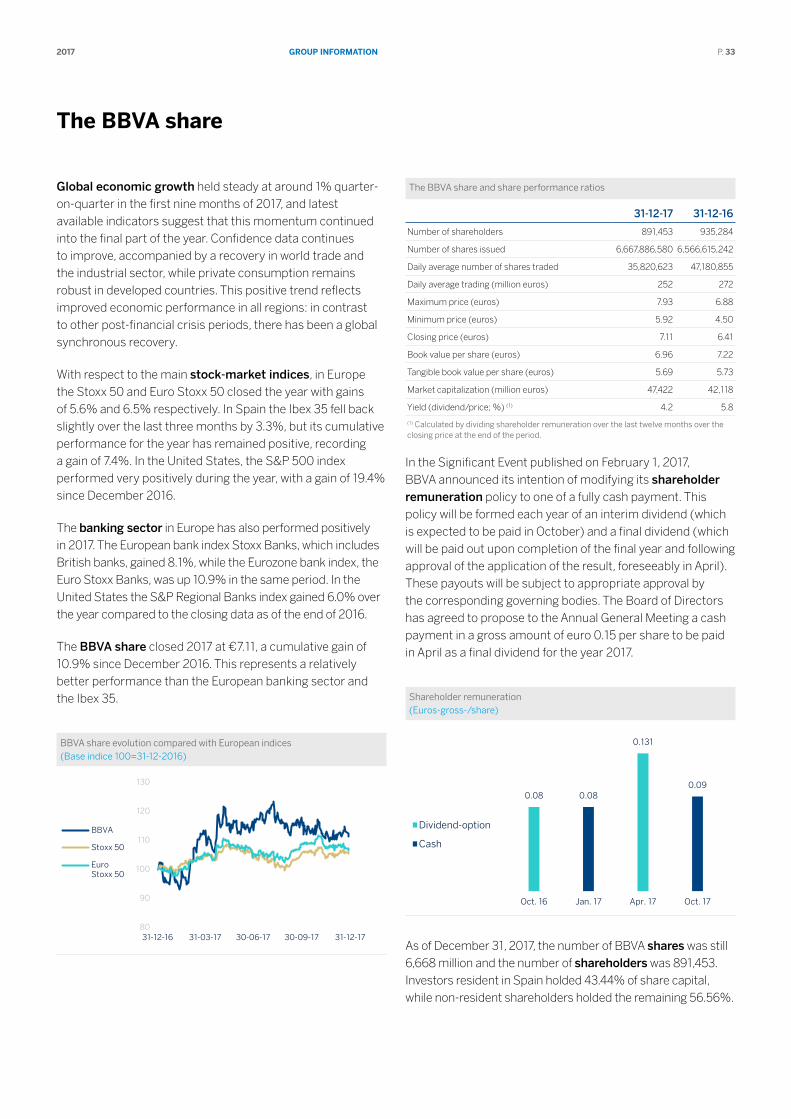
grouP InformAtIon2017 P. 33
the BBVA share
Global economic growth held steady at around 1% quarter-on-quarter in the first nine months of 2017, and latest available indicators suggest that this momentum continued into the final part of the year. Confidence data continues to improve, accompanied by a recovery in world trade and the industrial sector, while private consumption remains robust in developed countries. This positive trend reflects improved economic performance in all regions: in contrast to other post-financial crisis periods, there has been a global synchronous recovery.
With respect to the main stock-market indices, in Europe the Stoxx 50 and Euro Stoxx 50 closed the year with gains of 5.6% and 6.5% respectively. In Spain the Ibex 35 fell back slightly over the last three months by 3.3%, but its cumulative performance for the year has remained positive, recording a gain of 7.4%. In the United States, the S&P 500 index performed very positively during the year, with a gain of 19.4% since December 2016.
The banking sector in Europe has also performed positively in 2017. The European bank index Stoxx Banks, which includes British banks, gained 8.1%, while the Eurozone bank index, the Euro Stoxx Banks, was up 10.9% in the same period. In the United States the S&P Regional Banks index gained 6.0% over the year compared to the closing data as of the end of 2016.
The BBVA share closed 2017 at €7.11, a cumulative gain of 10.9% since December 2016. This represents a relatively better performance than the European banking sector and the Ibex 35.
BBVA share evolution compared with European indices (Base indice 100=31-12-2016)
80
90
100
110
120
130
31-12-16 31-03-17 30-06-17 30-09-17 31-12-17
BBVA
Stoxx 50
EuroStoxx 50
The BBVA share and share performance ratios
31-12-17 31-12-16
Number of shareholders 891,453 935,284
Number of shares issued 6,667,886,580 6,566,615,242
Daily average number of shares traded 35,820,623 47,180,855
Daily average trading (million euros) 252 272
Maximum price (euros) 7.93 6.88
Minimum price (euros) 5.92 4.50
Closing price (euros) 7.11 6.41
Book value per share (euros) 6.96 7.22
Tangible book value per share (euros) 5.69 5.73
Market capitalization (million euros) 47,422 42,118
Yield (dividend/price; %) (1) 4.2 5.8
(1) Calculated by dividing shareholder remuneration over the last twelve months over the closing price at the end of the period.
In the Significant Event published on February 1, 2017, BBVA announced its intention of modifying its shareholder remuneration policy to one of a fully cash payment. This policy will be formed each year of an interim dividend (which is expected to be paid in October) and a final dividend (which will be paid out upon completion of the final year and following approval of the application of the result, foreseeably in April). These payouts will be subject to appropriate approval by the corresponding governing bodies. The Board of Directors has agreed to propose to the Annual General Meeting a cash payment in a gross amount of euro 0.15 per share to be paid in April as a final dividend for the year 2017.
Shareholder remuneration (Euros-gross-/share)
0.08 0.08
0.131
0.09
Oct. 16 Jan. 17 Apr. 17 Oct. 17
Dividend-option
Cash
As of December 31, 2017, the number of BBVA shares was still 6,668 million and the number of shareholders was 891,453. Investors resident in Spain holded 43.44% of share capital, while non-resident shareholders holded the remaining 56.56%.
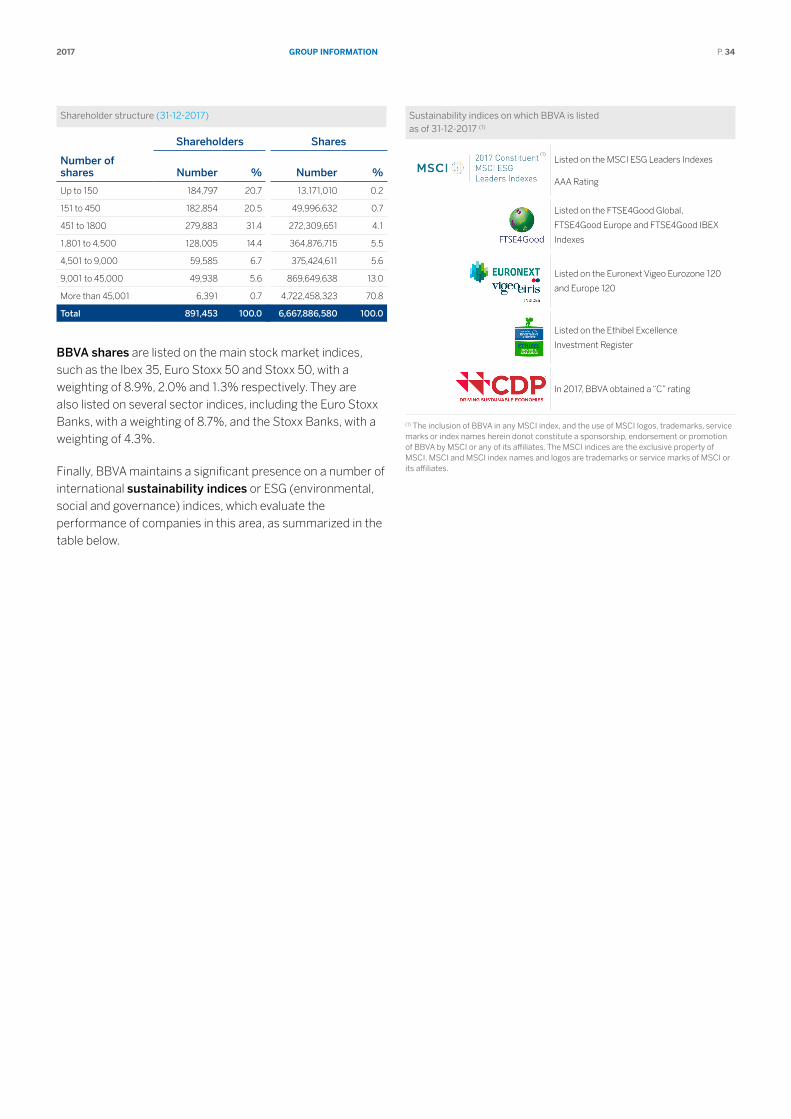
grouP InformAtIon2017 P. 34
Shareholder structure (31-12-2017)
Shareholders Shares
Number of shares Number % Number %
Up to 150 184,797 20.7 13,171,010 0.2
151 to 450 182,854 20.5 49,996,632 0.7
451 to 1800 279,883 31.4 272,309,651 4.1
1,801 to 4,500 128,005 14.4 364,876,715 5.5
4,501 to 9,000 59,585 6.7 375,424,611 5.6
9,001 to 45,000 49,938 5.6 869,649,638 13.0
More than 45,001 6,391 0.7 4,722,458,323 70.8
Total 891,453 100.0 6,667,886,580 100.0
BBVA shares are listed on the main stock market indices, such as the Ibex 35, Euro Stoxx 50 and Stoxx 50, with a weighting of 8.9%, 2.0% and 1.3% respectively. They are also listed on several sector indices, including the Euro Stoxx Banks, with a weighting of 8.7%, and the Stoxx Banks, with a weighting of 4.3%.
Finally, BBVA maintains a significant presence on a number of international sustainability indices or ESG (environmental, social and governance) indices, which evaluate the performance of companies in this area, as summarized in the table below.
Sustainability indices on which BBVA is listed as of 31-12-2017 (1)
Listed on the MSCI ESG Leaders Indexes
AAA Rating
Listed on the FTSE4Good Global,
FTSE4Good Europe and FTSE4Good IBEX
Indexes
Listed on the Euronext Vigeo Eurozone 120
and Europe 120
Listed on the Ethibel Excellence
Investment Register
In 2017, BBVA obtained a “C” rating
(1) The inclusion of BBVA in any MSCI index, and the use of MSCI logos, trademarks, service marks or index names herein donot constitute a sponsorship, endorsement or promotion of BBVA by MSCI or any of its affiliates. The MSCI indices are the exclusive property of MSCI. MSCI and MSCI index names and logos are trademarks or service marks of MSCI or its affiliates.
(1)

BuSInESS ArEAS2017 P. 35
Business areas
This section presents and analyzes the most relevant aspects of the Group’s different business areas. Specifically, it shows a summary of the income statement and balance sheet, the business activity figures and the most significant ratios in each of them.
In 2017 the reporting structure of BBVA Group’s business areas remained basically the same as in 2016. It is worth noting that BBVA announced the signing of two agreements, one for the sale of BBVA Chile to The Bank of Nova Scotia (Scotiabank) and another for the creation of a joint venture to which BBVA’s real-estate business in Spain will be transferred for the subsequent sale of 80% of the company created to a subsidiary of Cerberus Capital Management, L.P. (Cerberus). For the purpose of the explanations given in this report, the figures for Non Core Real Estate and South America are shown on a comparable basis with previous periods, even though within the Group the operations underway that are mentioned above have been reclassified as non-current assets and liabilities held for sale. The Group’s business areas are summarized below:
Banking activity in Spain includes, as in previous years, the Retail Network in Spain, Corporate and Business Banking (CBB), Corporate & Investment Banking (CIB), BBVA Seguros and Asset Management units in Spain. It also includes the portfolios, finance and structural interest-rate positions of the euro balance sheet.
Non Core Real Estate covers specialist management in Spain of loans to developers in difficulties and real-estate assets mainly coming from foreclosed assets, originated from both, residential mortgages, as well as loans to developers. New loan production to developers or loans that are not in difficulties are managed by Banking activity in Spain.
The United States includes the Group’s business activity in the country through the BBVA Compass group and the BBVA New York branch.
Mexico basically includes all the banking and insurance businesses carried out by the Group in the country.
Turkey includes the activity of the Garanti group.
South America basically includes BBVA’s banking and insurance businesses in the region.
The rest of Eurasia includes business activity in the rest of Europe and Asia, i.e. the Group’s retail and wholesale businesses in the area.
In addition to the above, all the areas include a remainder made up basically of other businesses and a supplement that includes deletions and allocations not assigned to the units making up the above areas.
Lastly, the Corporate Center is an aggregate that contains the rest of the items that have not been allocated to the business areas, as it corresponds to the Group’s holding function. It includes: the costs of the head offices that have a corporate function; management of structural exchange-rate positions; specific issues of equity instruments to ensure adequate management of the Group’s global solvency; portfolios and their corresponding results, whose management is not linked to customer relations, such as industrial holdings; certain tax assets and liabilities; funds due to commitments with employees; goodwill and other intangibles.
As usual, in the case of the Americas and Turkey areas, the results of applying constant exchange rates are given in addition to the year-on-year variations at current exchange rates.
The information by areas is based on units at the lowest level and/or companies making up the Group, which are assigned to the different areas according to the main geographical area in which they carry out their activity.
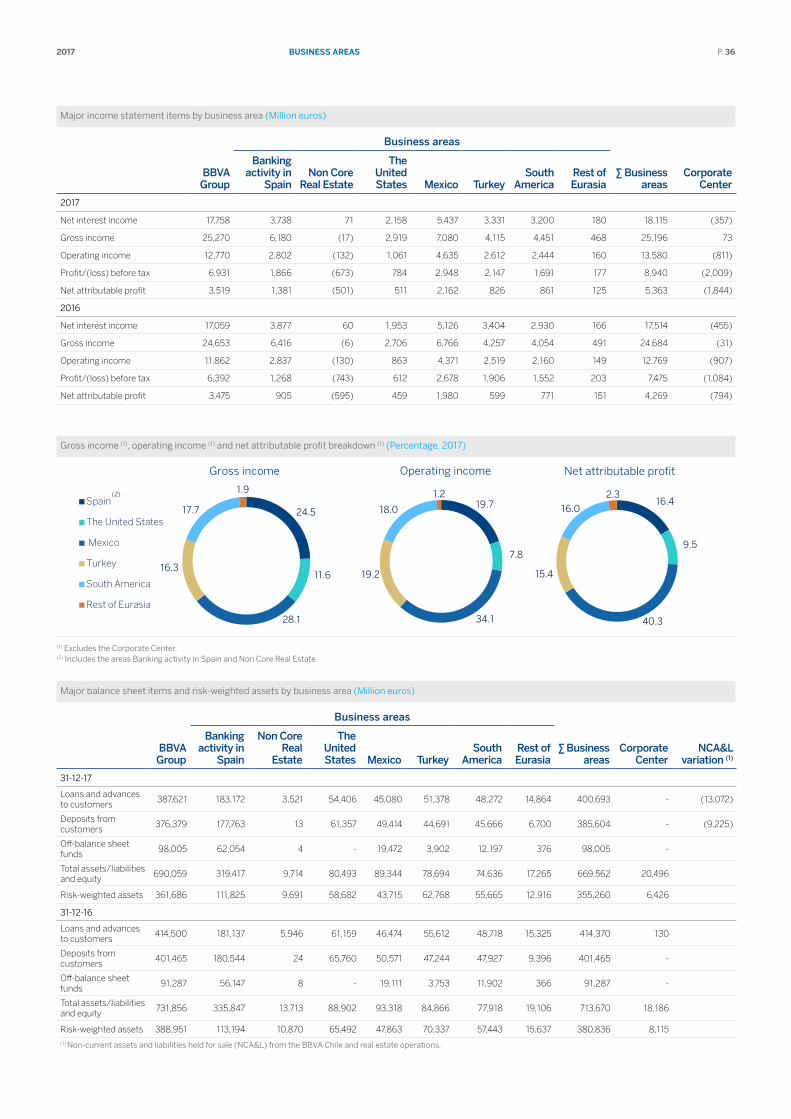
BuSInESS ArEAS2017 P. 36
Major income statement items by business area (Million euros)
Business areas
BBVA Group
Bankingactivity in
SpainNon Core
Real Estate
TheUnitedStates Mexico Turkey
SouthAmerica
Rest of Eurasia
∑ Businessareas
CorporateCenter
2017
Net interest income 17,758 3,738 71 2,158 5,437 3,331 3,200 180 18,115 (357)
Gross income 25,270 6,180 (17) 2,919 7,080 4,115 4,451 468 25,196 73
Operating income 12,770 2,802 (132) 1,061 4,635 2,612 2,444 160 13,580 (811)
Profit/(loss) before tax 6,931 1,866 (673) 784 2,948 2,147 1,691 177 8,940 (2,009)
Net attributable profit 3,519 1,381 (501) 511 2,162 826 861 125 5,363 (1,844)
2016
Net interest income 17,059 3,877 60 1,953 5,126 3,404 2,930 166 17,514 (455)
Gross income 24,653 6,416 (6) 2,706 6,766 4,257 4,054 491 24,684 (31)
Operating income 11,862 2,837 (130) 863 4,371 2,519 2,160 149 12,769 (907)
Profit/(loss) before tax 6,392 1,268 (743) 612 2,678 1,906 1,552 203 7,475 (1,084)
Net attributable profit 3,475 905 (595) 459 1,980 599 771 151 4,269 (794)
Gross income (1), operating income (1) and net attributable profit breakdown (1) (Percentage. 2017)
19.7
7.8
34.1
19.2
18.0
1.2
Operating income
16.4
9.5
40.3
15.4
16.0
2.3
Net attributable profit
24.5
11.6
28.1
16.3
17.7
1.9
Gross income
Spain
The United States
Mexico
Turkey
South America
Rest of Eurasia
(2)
(1) Excludes the Corporate Center. (2) Includes the areas Banking activity in Spain and Non Core Real Estate.
Major balance sheet items and risk-weighted assets by business area (Million euros)
Business areas
BBVA Group
Bankingactivity in
Spain
Non Core Real
Estate
TheUnitedStates Mexico Turkey
SouthAmerica
Rest of Eurasia
∑ Businessareas
CorporateCenter
NCA&L variation (1)
31-12-17
Loans and advances to customers
387,621 183,172 3,521 54,406 45,080 51,378 48,272 14,864 400,693 - (13,072)
Deposits from customers
376,379 177,763 13 61,357 49,414 44,691 45,666 6,700 385,604 - (9,225)
Off-balance sheet funds
98,005 62,054 4 - 19,472 3,902 12,197 376 98,005 -
Total assets/liabilities and equity
690,059 319,417 9,714 80,493 89,344 78,694 74,636 17,265 669,562 20,496
Risk-weighted assets 361,686 111,825 9,691 58,682 43,715 62,768 55,665 12,916 355,260 6,426
31-12-16
Loans and advances to customers
414,500 181,137 5,946 61,159 46,474 55,612 48,718 15,325 414,370 130
Deposits from customers
401,465 180,544 24 65,760 50,571 47,244 47,927 9,396 401,465 -
Off-balance sheet funds
91,287 56,147 8 - 19,111 3,753 11,902 366 91,287 -
Total assets/liabilities and equity
731,856 335,847 13,713 88,902 93,318 84,866 77,918 19,106 713,670 18,186
Risk-weighted assets 388,951 113,194 10,870 65,492 47,863 70,337 57,443 15,637 380,836 8,115(1) Non-current assets and liabilities held for sale (NCA&L) from the BBVA Chile and real estate operations.
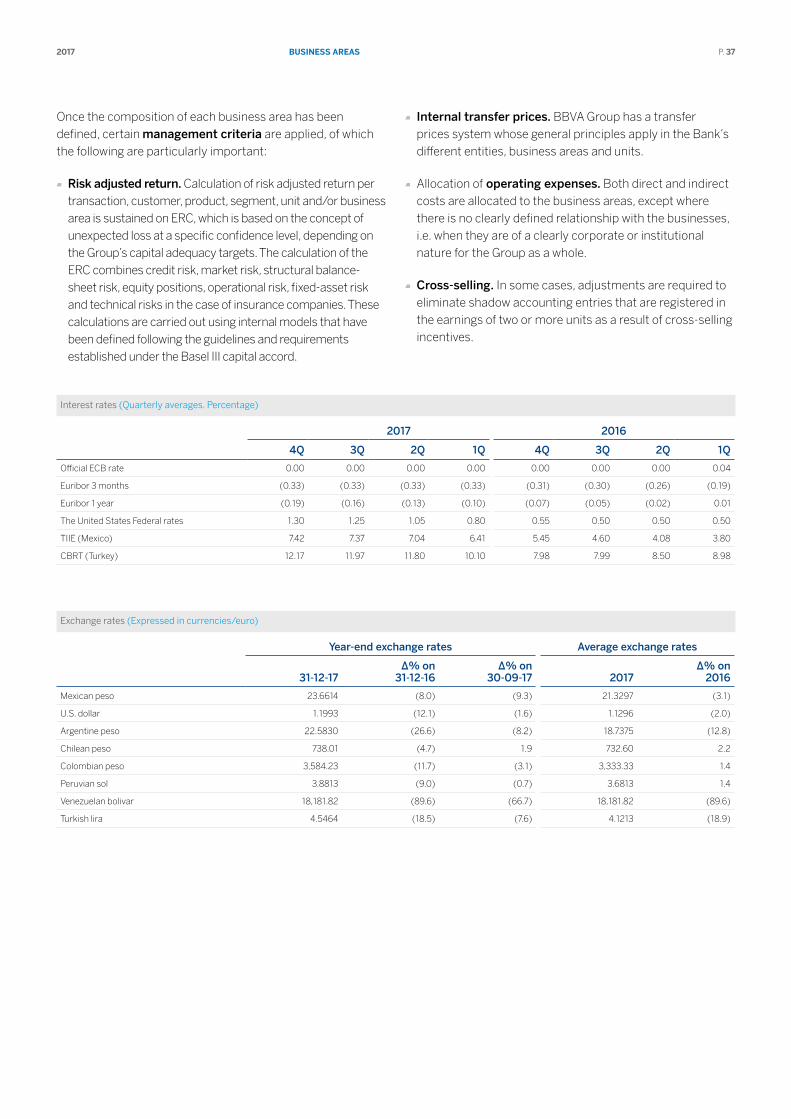
BuSInESS ArEAS2017 P. 37
Once the composition of each business area has been defined, certain management criteria are applied, of which the following are particularly important:
Risk adjusted return. Calculation of risk adjusted return per transaction, customer, product, segment, unit and/or business area is sustained on ERC, which is based on the concept of unexpected loss at a specific confidence level, depending on the Group’s capital adequacy targets. The calculation of the ERC combines credit risk, market risk, structural balance-sheet risk, equity positions, operational risk, fixed-asset risk and technical risks in the case of insurance companies. These calculations are carried out using internal models that have been defined following the guidelines and requirements established under the Basel III capital accord.
Internal transfer prices. BBVA Group has a transfer prices system whose general principles apply in the Bank’s different entities, business areas and units.
Allocation of operating expenses. Both direct and indirect costs are allocated to the business areas, except where there is no clearly defined relationship with the businesses, i.e. when they are of a clearly corporate or institutional nature for the Group as a whole.
Cross-selling. In some cases, adjustments are required to eliminate shadow accounting entries that are registered in the earnings of two or more units as a result of cross-selling incentives.
Interest rates (Quarterly averages. Percentage)
2017 2016
4Q 3Q 2Q 1Q 4Q 3Q 2Q 1Q
Official ECB rate 0.00 0.00 0.00 0.00 0.00 0.00 0.00 0.04
Euribor 3 months (0.33) (0.33) (0.33) (0.33) (0.31) (0.30) (0.26) (0.19)
Euribor 1 year (0.19) (0.16) (0.13) (0.10) (0.07) (0.05) (0.02) 0.01
The United States Federal rates 1.30 1.25 1.05 0.80 0.55 0.50 0.50 0.50
TIIE (Mexico) 7.42 7.37 7.04 6.41 5.45 4.60 4.08 3.80
CBRT (Turkey) 12.17 11.97 11.80 10.10 7.98 7.99 8.50 8.98
Exchange rates (Expressed in currencies/euro)
Year-end exchange rates Average exchange rates
31-12-17∆% on
31-12-16∆% on
30-09-17 2017∆% on
2016
Mexican peso 23.6614 (8.0) (9.3) 21.3297 (3.1)
U.S. dollar 1.1993 (12.1) (1.6) 1.1296 (2.0)
Argentine peso 22.5830 (26.6) (8.2) 18.7375 (12.8)
Chilean peso 738.01 (4.7) 1.9 732.60 2.2
Colombian peso 3,584.23 (11.7) (3.1) 3,333.33 1.4
Peruvian sol 3.8813 (9.0) (0.7) 3.6813 1.4
Venezuelan bolivar 18,181.82 (89.6) (66.7) 18,181.82 (89.6)
Turkish lira 4.5464 (18.5) (7.6) 4.1213 (18.9)
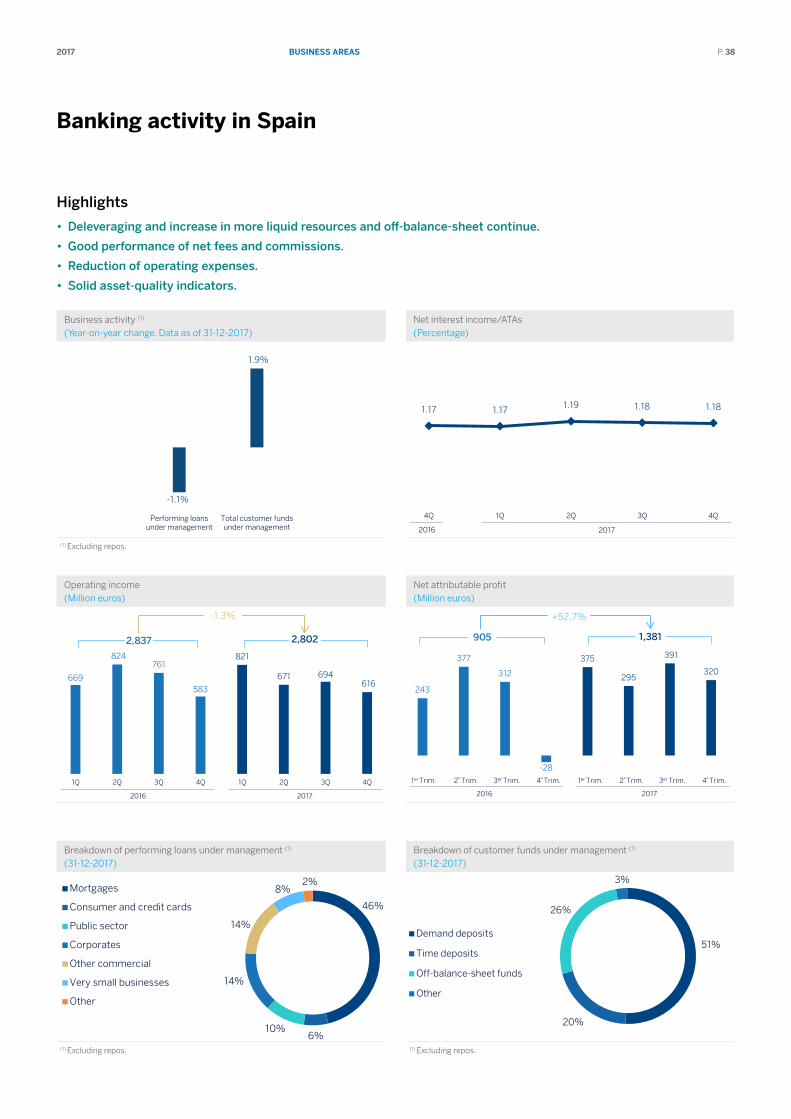
BuSInESS ArEAS2017 P. 38
Banking activity in Spain
Highlights
• Deleveraging and increase in more liquid resources and off-balance-sheet continue.
• Good performance of net fees and commissions.
• Reduction of operating expenses.
• Solid asset-quality indicators.
Business activity (1) (Year-on-year change. Data as of 31-12-2017)
Net interest income/ATAs (Percentage)
-1.1%
1.9%
Performing loansunder management
Total customer fundsunder management
1.17 1.17 1.19 1.18 1.18
4Q 1Q 2Q 3Q 4Q
20172016
(1) Excluding repos.
Operating income (Million euros)
Net attributable profit (Million euros)
669
824 761
583
821
671 694 616
1Q 2Q 3Q 4Q 1Q 2Q 3Q 4Q
2016 2017
-1.3%
2,802 2,837
243
377
312
-28
375
295
391
320
1Q 2Q 3Q 4Q 1Q 2Q 3Q 4Q
2016 2017
+52.7%
1,381
1er Trim. 2º Trim. 3er Trim. 4º Trim. 1er Trim. 2º Trim. 3er Trim. 4º Trim.
905
Breakdown of performing loans under management (1) (31-12-2017)
Breakdown of customer funds under management (1) (31-12-2017)
46%
6% 10%
14%
14%
8% 2%
Mortgages
Consumer and credit cards
Public sector
Corporates
Other commercial
Very small businesses
Other
51%
20%
26%
3%
Demand deposits
Time deposits
Off-balance-sheet funds
Other
(1) Excluding repos. (1) Excluding repos.
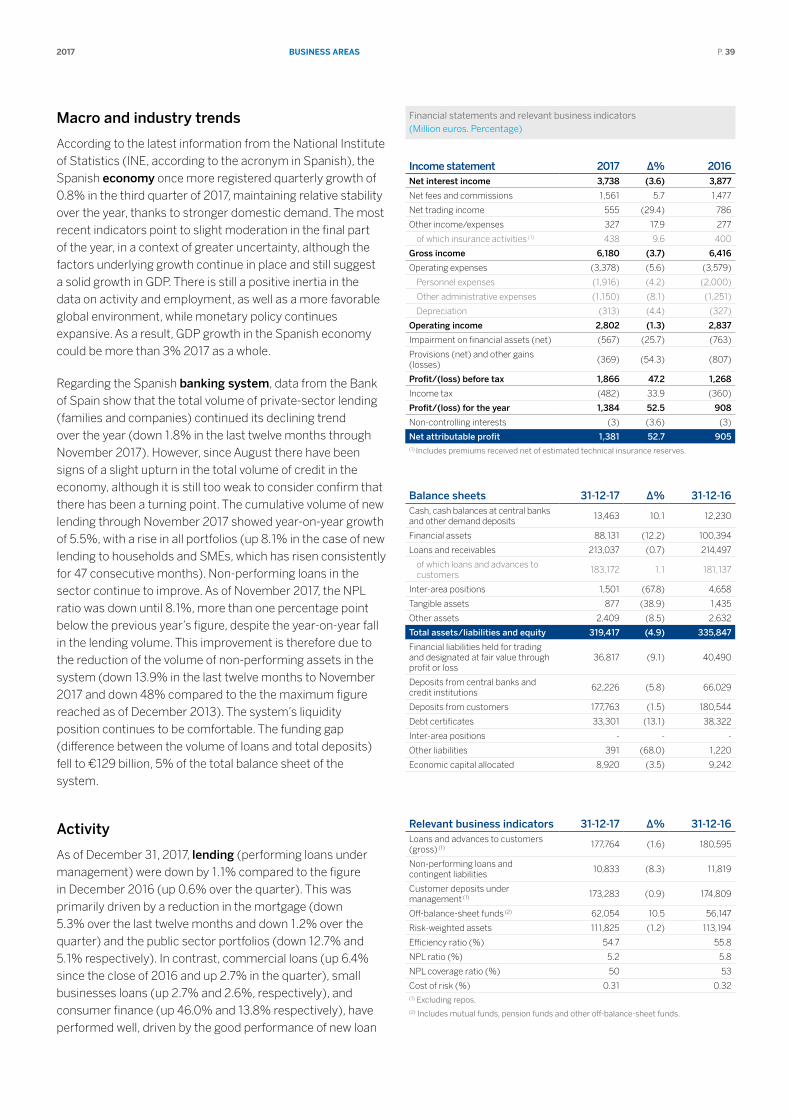
BuSInESS ArEAS2017 P. 39
Macro and industry trends
According to the latest information from the National Institute of Statistics (INE, according to the acronym in Spanish), the Spanish economy once more registered quarterly growth of 0.8% in the third quarter of 2017, maintaining relative stability over the year, thanks to stronger domestic demand. The most recent indicators point to slight moderation in the final part of the year, in a context of greater uncertainty, although the factors underlying growth continue in place and still suggest a solid growth in GDP. There is still a positive inertia in the data on activity and employment, as well as a more favorable global environment, while monetary policy continues expansive. As a result, GDP growth in the Spanish economy could be more than 3% 2017 as a whole.
Regarding the Spanish banking system, data from the Bank of Spain show that the total volume of private-sector lending (families and companies) continued its declining trend over the year (down 1.8% in the last twelve months through November 2017). However, since August there have been signs of a slight upturn in the total volume of credit in the economy, although it is still too weak to consider confirm that there has been a turning point. The cumulative volume of new lending through November 2017 showed year-on-year growth of 5.5%, with a rise in all portfolios (up 8.1% in the case of new lending to households and SMEs, which has risen consistently for 47 consecutive months). Non-performing loans in the sector continue to improve. As of November 2017, the NPL ratio was down until 8.1%, more than one percentage point below the previous year’s figure, despite the year-on-year fall in the lending volume. This improvement is therefore due to the reduction of the volume of non-performing assets in the system (down 13.9% in the last twelve months to November 2017 and down 48% compared to the the maximum figure reached as of December 2013). The system’s liquidity position continues to be comfortable. The funding gap (difference between the volume of loans and total deposits) fell to €129 billion, 5% of the total balance sheet of the system.
Activity
As of December 31, 2017, lending (performing loans under management) were down by 1.1% compared to the figure in December 2016 (up 0.6% over the quarter). This was primarily driven by a reduction in the mortgage (down 5.3% over the last twelve months and down 1.2% over the quarter) and the public sector portfolios (down 12.7% and 5.1% respectively). In contrast, commercial loans (up 6.4% since the close of 2016 and up 2.7% in the quarter), small businesses loans (up 2.7% and 2.6%, respectively), and consumer finance (up 46.0% and 13.8% respectively), have performed well, driven by the good performance of new loan
Financial statements and relevant business indicators (Million euros. Percentage)
Income statement 2017 ∆% 2016Net interest income 3,738 (3.6) 3,877
Net fees and commissions 1,561 5.7 1,477
Net trading income 555 (29.4) 786
Other income/expenses 327 17.9 277
of which insurance activities (1) 438 9.6 400
Gross income 6,180 (3.7) 6,416
Operating expenses (3,378) (5.6) (3,579)
Personnel expenses (1,916) (4.2) (2,000)
Other administrative expenses (1,150) (8.1) (1,251)
Depreciation (313) (4.4) (327)
Operating income 2,802 (1.3) 2,837
Impairment on financial assets (net) (567) (25.7) (763)
Provisions (net) and other gains (losses)
(369) (54.3) (807)
Profit/(loss) before tax 1,866 47.2 1,268
Income tax (482) 33.9 (360)
Profit/(loss) for the year 1,384 52.5 908
Non-controlling interests (3) (3.6) (3)
Net attributable profit 1,381 52.7 905(1) Includes premiums received net of estimated technical insurance reserves.
Balance sheets 31-12-17 ∆% 31-12-16Cash, cash balances at central banks and other demand deposits
13,463 10.1 12,230
Financial assets 88,131 (12.2) 100,394
Loans and receivables 213,037 (0.7) 214,497
of which loans and advances to customers
183,172 1.1 181,137
Inter-area positions 1,501 (67.8) 4,658
Tangible assets 877 (38.9) 1,435
Other assets 2,409 (8.5) 2,632
Total assets/liabilities and equity 319,417 (4.9) 335,847
Financial liabilities held for trading and designated at fair value through profit or loss
36,817 (9.1) 40,490
Deposits from central banks and credit institutions
62,226 (5.8) 66,029
Deposits from customers 177,763 (1.5) 180,544
Debt certificates 33,301 (13.1) 38,322
Inter-area positions - - -
Other liabilities 391 (68.0) 1,220
Economic capital allocated 8,920 (3.5) 9,242
Relevant business indicators 31-12-17 ∆% 31-12-16Loans and advances to customers (gross) (1) 177,764 (1.6) 180,595
Non-performing loans and contingent liabilities
10,833 (8.3) 11,819
Customer deposits under management (1) 173,283 (0.9) 174,809
Off-balance-sheet funds (2) 62,054 10.5 56,147
Risk-weighted assets 111,825 (1.2) 113,194
Efficiency ratio (%) 54.7 55.8
NPL ratio (%) 5.2 5.8
NPL coverage ratio (%) 50 53
Cost of risk (%) 0.31 0.32(1) Excluding repos.(2) Includes mutual funds, pension funds and other off-balance-sheet funds.
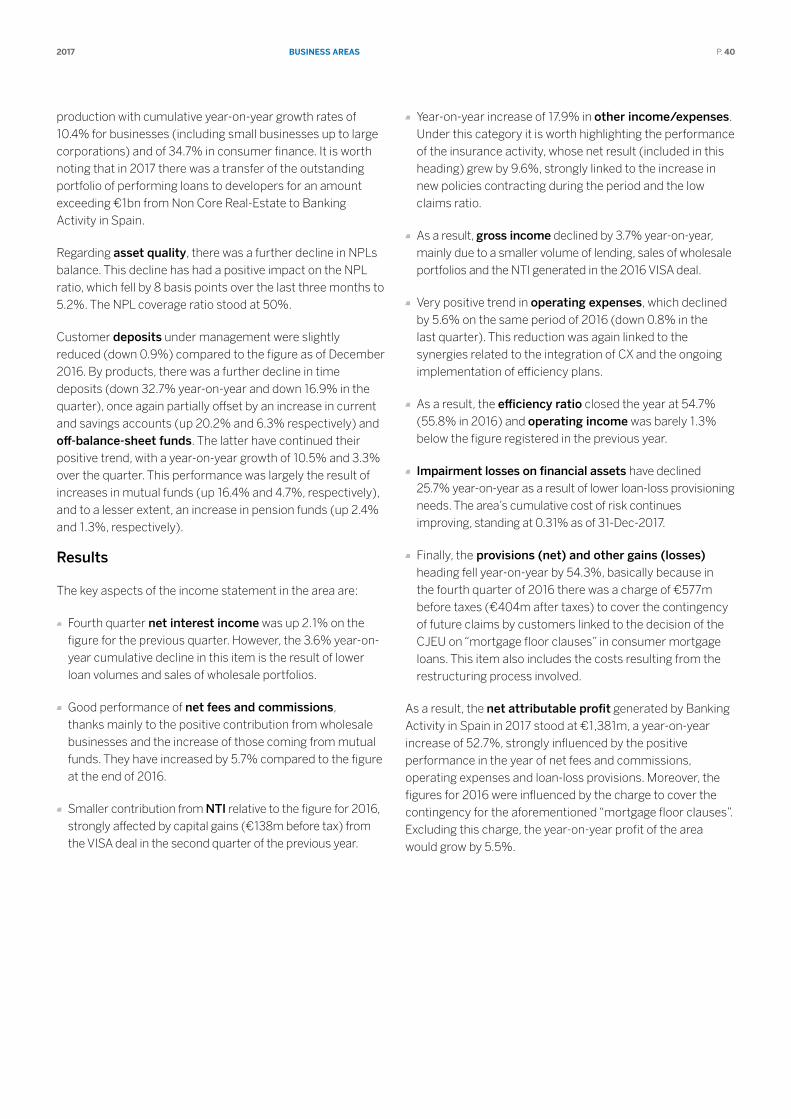
BuSInESS ArEAS2017 P. 40
production with cumulative year-on-year growth rates of 10.4% for businesses (including small businesses up to large corporations) and of 34.7% in consumer finance. It is worth noting that in 2017 there was a transfer of the outstanding portfolio of performing loans to developers for an amount exceeding €1bn from Non Core Real-Estate to Banking Activity in Spain.
Regarding asset quality, there was a further decline in NPLs balance. This decline has had a positive impact on the NPL ratio, which fell by 8 basis points over the last three months to 5.2%. The NPL coverage ratio stood at 50%.
Customer deposits under management were slightly reduced (down 0.9%) compared to the figure as of December 2016. By products, there was a further decline in time deposits (down 32.7% year-on-year and down 16.9% in the quarter), once again partially offset by an increase in current and savings accounts (up 20.2% and 6.3% respectively) and off-balance-sheet funds. The latter have continued their positive trend, with a year-on-year growth of 10.5% and 3.3% over the quarter. This performance was largely the result of increases in mutual funds (up 16.4% and 4.7%, respectively), and to a lesser extent, an increase in pension funds (up 2.4% and 1.3%, respectively).
Results
The key aspects of the income statement in the area are:
Fourth quarter net interest income was up 2.1% on the figure for the previous quarter. However, the 3.6% year-on-year cumulative decline in this item is the result of lower loan volumes and sales of wholesale portfolios.
Good performance of net fees and commissions, thanks mainly to the positive contribution from wholesale businesses and the increase of those coming from mutual funds. They have increased by 5.7% compared to the figure at the end of 2016.
Smaller contribution from NTI relative to the figure for 2016, strongly affected by capital gains (€138m before tax) from the VISA deal in the second quarter of the previous year.
Year-on-year increase of 17.9% in other income/expenses. Under this category it is worth highlighting the performance of the insurance activity, whose net result (included in this heading) grew by 9.6%, strongly linked to the increase in new policies contracting during the period and the low claims ratio.
As a result, gross income declined by 3.7% year-on-year, mainly due to a smaller volume of lending, sales of wholesale portfolios and the NTI generated in the 2016 VISA deal.
Very positive trend in operating expenses, which declined by 5.6% on the same period of 2016 (down 0.8% in the last quarter). This reduction was again linked to the synergies related to the integration of CX and the ongoing implementation of efficiency plans.
As a result, the efficiency ratio closed the year at 54.7% (55.8% in 2016) and operating income was barely 1.3% below the figure registered in the previous year.
Impairment losses on financial assets have declined 25.7% year-on-year as a result of lower loan-loss provisioning needs. The area’s cumulative cost of risk continues improving, standing at 0.31% as of 31-Dec-2017.
Finally, the provisions (net) and other gains (losses) heading fell year-on-year by 54.3%, basically because in the fourth quarter of 2016 there was a charge of €577m before taxes (€404m after taxes) to cover the contingency of future claims by customers linked to the decision of the CJEU on “mortgage floor clauses” in consumer mortgage loans. This item also includes the costs resulting from the restructuring process involved.
As a result, the net attributable profit generated by Banking Activity in Spain in 2017 stood at €1,381m, a year-on-year increase of 52.7%, strongly influenced by the positive performance in the year of net fees and commissions, operating expenses and loan-loss provisions. Moreover, the figures for 2016 were influenced by the charge to cover the contingency for the aforementioned “mortgage floor clauses”. Excluding this charge, the year-on-year profit of the area would grow by 5.5%.
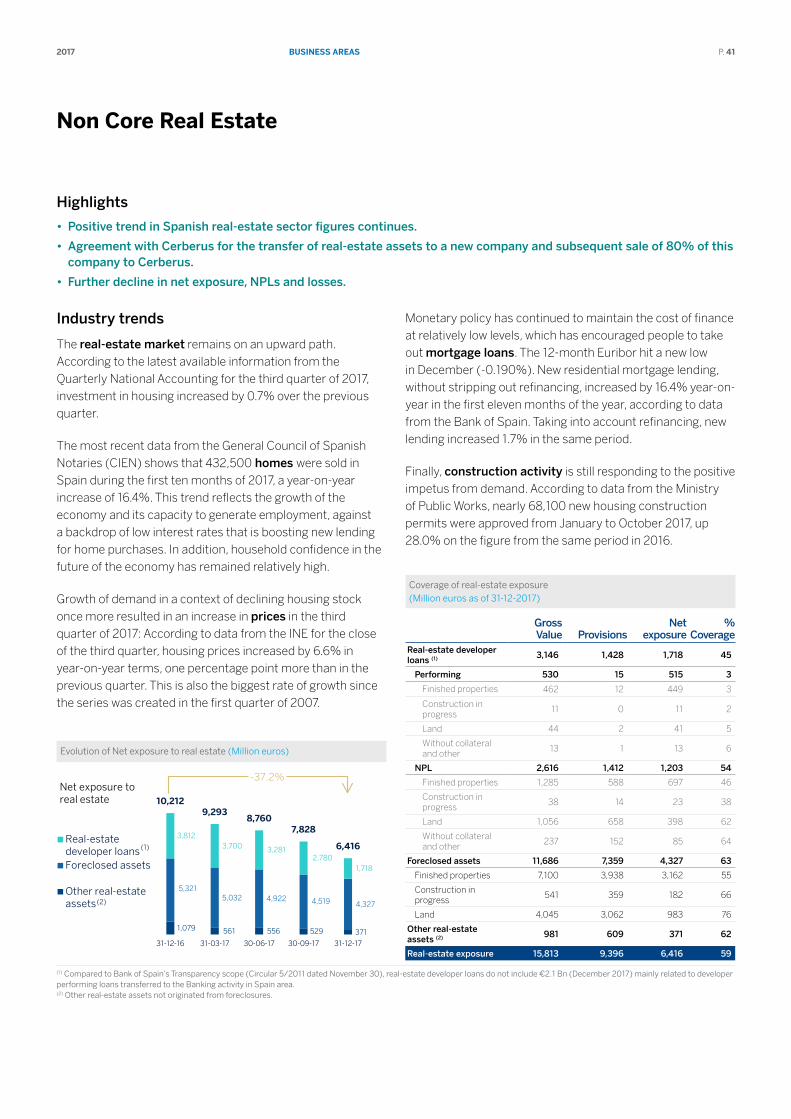
BuSInESS ArEAS2017 P. 41
non core real Estate
Highlights
• Positive trend in Spanish real-estate sector figures continues.
• Agreement with Cerberus for the transfer of real-estate assets to a new company and subsequent sale of 80% of this company to Cerberus.
• Further decline in net exposure, NPLs and losses.
Industry trends
The real-estate market remains on an upward path. According to the latest available information from the Quarterly National Accounting for the third quarter of 2017, investment in housing increased by 0.7% over the previous quarter.
The most recent data from the General Council of Spanish Notaries (CIEN) shows that 432,500 homes were sold in Spain during the first ten months of 2017, a year-on-year increase of 16.4%. This trend reflects the growth of the economy and its capacity to generate employment, against a backdrop of low interest rates that is boosting new lending for home purchases. In addition, household confidence in the future of the economy has remained relatively high.
Growth of demand in a context of declining housing stock once more resulted in an increase in prices in the third quarter of 2017: According to data from the INE for the close of the third quarter, housing prices increased by 6.6% in year-on-year terms, one percentage point more than in the previous quarter. This is also the biggest rate of growth since the series was created in the first quarter of 2007.
Evolution of Net exposure to real estate (Million euros)
1,079 561 556 529 371
5,321 5,032 4,922 4,519 4,327
3,812 3,700 3,281
2,780 1,718
10,212 9,293
8,760 7,828
6,416
31-12-16 31-03-17 30-06-17 30-09-17 31-12-17
Real-estatedeveloper loansForeclosed assets
Other real-estateassets
-37.2%
(1)
(2)
Net exposure to real estate
Monetary policy has continued to maintain the cost of finance at relatively low levels, which has encouraged people to take out mortgage loans. The 12-month Euribor hit a new low in December (-0.190%). New residential mortgage lending, without stripping out refinancing, increased by 16.4% year-on-year in the first eleven months of the year, according to data from the Bank of Spain. Taking into account refinancing, new lending increased 1.7% in the same period.
Finally, construction activity is still responding to the positive impetus from demand. According to data from the Ministry of Public Works, nearly 68,100 new housing construction permits were approved from January to October 2017, up 28.0% on the figure from the same period in 2016.
Coverage of real-estate exposure (Million euros as of 31-12-2017)
Gross Value Provisions
Net exposure
% Coverage
Real-estate developer loans (1) 3,146 1,428 1,718 45
Performing 530 15 515 3
Finished properties 462 12 449 3
Construction in progress
11 0 11 2
Land 44 2 41 5
Without collateral and other
13 1 13 6
NPL 2,616 1,412 1,203 54
Finished properties 1,285 588 697 46
Construction in progress
38 14 23 38
Land 1,056 658 398 62
Without collateral and other
237 152 85 64
Foreclosed assets 11,686 7,359 4,327 63
Finished properties 7,100 3,938 3,162 55
Construction in progress
541 359 182 66
Land 4,045 3,062 983 76
Other real-estate assets (2) 981 609 371 62
Real-estate exposure 15,813 9,396 6,416 59
(1) Compared to Bank of Spain’s Transparency scope (Circular 5/2011 dated November 30), real-estate developer loans do not include €2.1 Bn (December 2017) mainly related to developer performing loans transferred to the Banking activity in Spain area. (2) Other real-estate assets not originated from foreclosures.
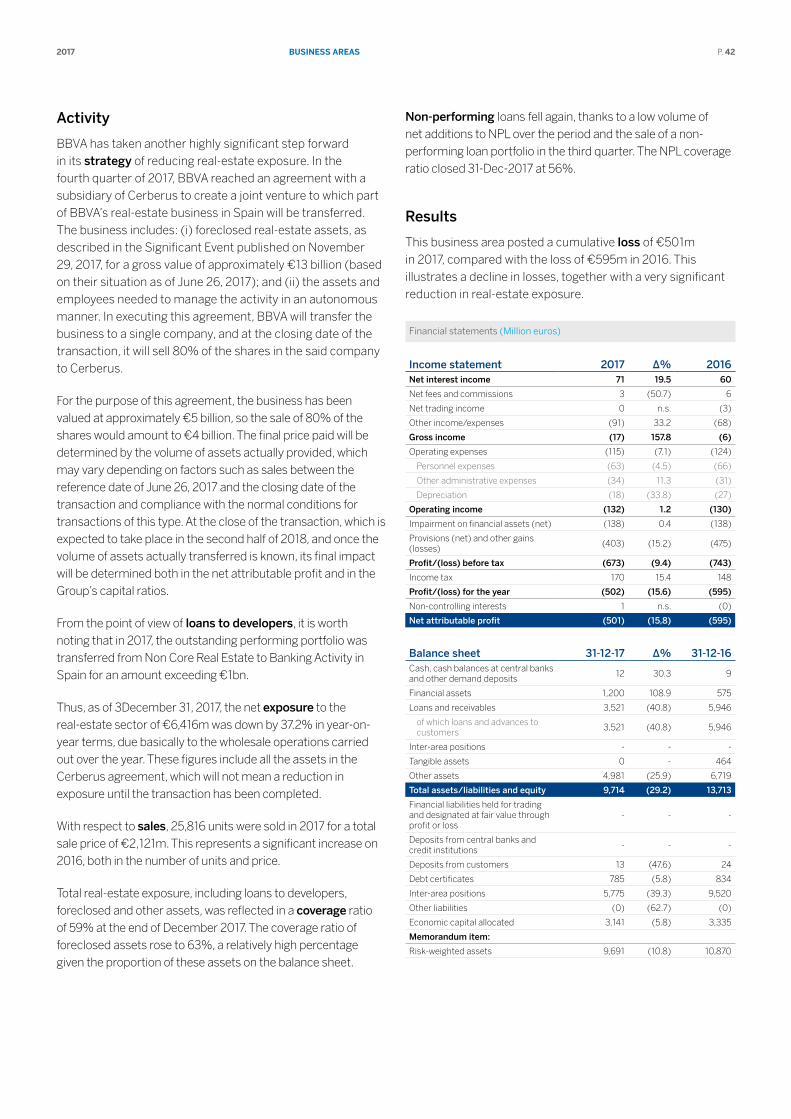
BuSInESS ArEAS2017 P. 42
Activity
BBVA has taken another highly significant step forward in its strategy of reducing real-estate exposure. In the fourth quarter of 2017, BBVA reached an agreement with a subsidiary of Cerberus to create a joint venture to which part of BBVA’s real-estate business in Spain will be transferred. The business includes: (i) foreclosed real-estate assets, as described in the Significant Event published on November 29, 2017, for a gross value of approximately €13 billion (based on their situation as of June 26, 2017); and (ii) the assets and employees needed to manage the activity in an autonomous manner. In executing this agreement, BBVA will transfer the business to a single company, and at the closing date of the transaction, it will sell 80% of the shares in the said company to Cerberus.
For the purpose of this agreement, the business has been valued at approximately €5 billion, so the sale of 80% of the shares would amount to €4 billion. The final price paid will be determined by the volume of assets actually provided, which may vary depending on factors such as sales between the reference date of June 26, 2017 and the closing date of the transaction and compliance with the normal conditions for transactions of this type. At the close of the transaction, which is expected to take place in the second half of 2018, and once the volume of assets actually transferred is known, its final impact will be determined both in the net attributable profit and in the Group’s capital ratios.
From the point of view of loans to developers, it is worth noting that in 2017, the outstanding performing portfolio was transferred from Non Core Real Estate to Banking Activity in Spain for an amount exceeding €1bn.
Thus, as of 3December 31, 2017, the net exposure to the real-estate sector of €6,416m was down by 37.2% in year-on-year terms, due basically to the wholesale operations carried out over the year. These figures include all the assets in the Cerberus agreement, which will not mean a reduction in exposure until the transaction has been completed.
With respect to sales, 25,816 units were sold in 2017 for a total sale price of €2,121m. This represents a significant increase on 2016, both in the number of units and price.
Total real-estate exposure, including loans to developers, foreclosed and other assets, was reflected in a coverage ratio of 59% at the end of December 2017. The coverage ratio of foreclosed assets rose to 63%, a relatively high percentage given the proportion of these assets on the balance sheet.
Non-performing loans fell again, thanks to a low volume of net additions to NPL over the period and the sale of a non-performing loan portfolio in the third quarter. The NPL coverage ratio closed 31-Dec-2017 at 56%.
Results
This business area posted a cumulative loss of €501m in 2017, compared with the loss of €595m in 2016. This illustrates a decline in losses, together with a very significant reduction in real-estate exposure.
Financial statements (Million euros)
Income statement 2017 ∆% 2016Net interest income 71 19.5 60
Net fees and commissions 3 (50.7) 6
Net trading income 0 n.s. (3)
Other income/expenses (91) 33.2 (68)
Gross income (17) 157.8 (6)
Operating expenses (115) (7.1) (124)
Personnel expenses (63) (4.5) (66)
Other administrative expenses (34) 11.3 (31)
Depreciation (18) (33.8) (27)
Operating income (132) 1.2 (130)
Impairment on financial assets (net) (138) 0.4 (138)
Provisions (net) and other gains (losses)
(403) (15.2) (475)
Profit/(loss) before tax (673) (9.4) (743)
Income tax 170 15.4 148
Profit/(loss) for the year (502) (15.6) (595)
Non-controlling interests 1 n.s. (0)
Net attributable profit (501) (15,8) (595)
Balance sheet 31-12-17 ∆% 31-12-16Cash, cash balances at central banks and other demand deposits
12 30.3 9
Financial assets 1,200 108.9 575
Loans and receivables 3,521 (40.8) 5,946
of which loans and advances to customers
3,521 (40.8) 5,946
Inter-area positions - - -
Tangible assets 0 - 464
Other assets 4,981 (25.9) 6,719
Total assets/liabilities and equity 9,714 (29.2) 13,713
Financial liabilities held for trading and designated at fair value through profit or loss
- - -
Deposits from central banks and credit institutions
- - -
Deposits from customers 13 (47.6) 24
Debt certificates 785 (5.8) 834
Inter-area positions 5,775 (39.3) 9,520
Other liabilities (0) (62.7) (0)
Economic capital allocated 3,141 (5.8) 3,335
Memorandum item:
Risk-weighted assets 9,691 (10.8) 10,870
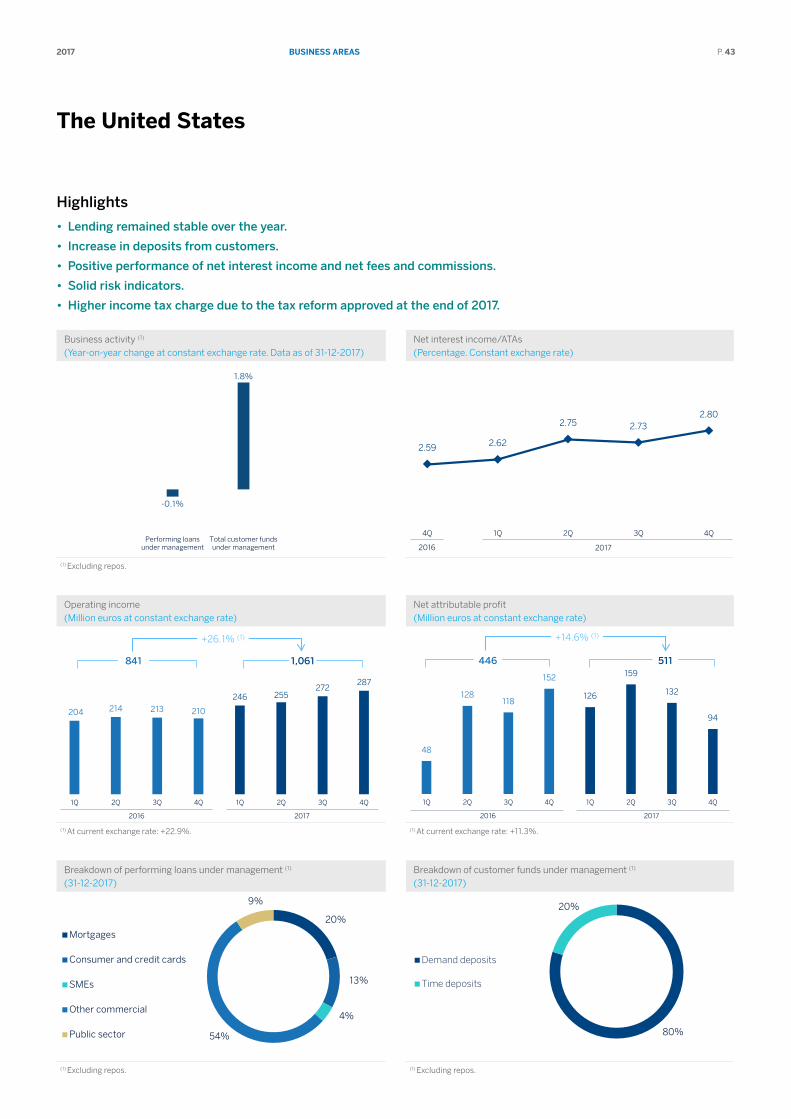
BuSInESS ArEAS2017 P. 43
the united States
Highlights
• Lending remained stable over the year.
• Increase in deposits from customers.
• Positive performance of net interest income and net fees and commissions.
• Solid risk indicators.
• Higher income tax charge due to the tax reform approved at the end of 2017.
Business activity (1) (Year-on-year change at constant exchange rate. Data as of 31-12-2017)
Net interest income/ATAs (Percentage. Constant exchange rate)
-0.1%
1.8%
Performing loansunder management
Total customer fundsunder management
2.59 2.62
2.75 2.73 2.80
4Q 1Q 2Q 3Q 4Q
20172016
(1) Excluding repos.
Operating income (Million euros at constant exchange rate)
Net attributable profit (Million euros at constant exchange rate)
204 214 213 210
246 255 272
287
1Q 2Q 3Q 4Q 1Q 2Q 3Q 4Q
2016 2017
+26.1% (1)
841 1,061
48
128 118
152
126
159
132
94
1Q 2Q 3Q 4Q 1Q 2Q 3Q 4Q
2016 2017
+14.6% (1)
446 511
(1) At current exchange rate: +22.9%. (1) At current exchange rate: +11.3%.
Breakdown of performing loans under management (1) (31-12-2017)
Breakdown of customer funds under management (1) (31-12-2017)
20%
13%
4%
54%
9%
Mortgages
Consumer and credit cards
SMEs
Other commercial
Public sector 80%
20%
Demand deposits
Time deposits
(1) Excluding repos. (1) Excluding repos.
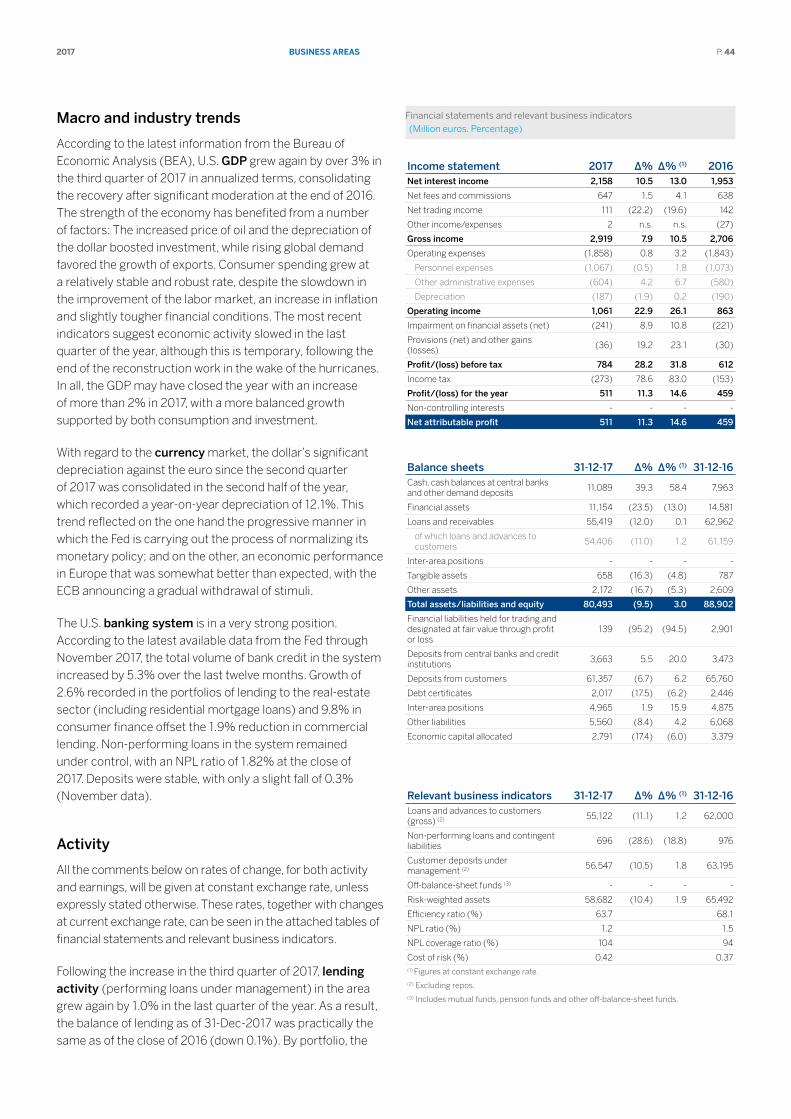
BuSInESS ArEAS2017 P. 44
Macro and industry trends
According to the latest information from the Bureau of Economic Analysis (BEA), U.S. GDP grew again by over 3% in the third quarter of 2017 in annualized terms, consolidating the recovery after significant moderation at the end of 2016. The strength of the economy has benefited from a number of factors: The increased price of oil and the depreciation of the dollar boosted investment, while rising global demand favored the growth of exports. Consumer spending grew at a relatively stable and robust rate, despite the slowdown in the improvement of the labor market, an increase in inflation and slightly tougher financial conditions. The most recent indicators suggest economic activity slowed in the last quarter of the year, although this is temporary, following the end of the reconstruction work in the wake of the hurricanes. In all, the GDP may have closed the year with an increase of more than 2% in 2017, with a more balanced growth supported by both consumption and investment.
With regard to the currency market, the dollar’s significant depreciation against the euro since the second quarter of 2017 was consolidated in the second half of the year, which recorded a year-on-year depreciation of 12.1%. This trend reflected on the one hand the progressive manner in which the Fed is carrying out the process of normalizing its monetary policy; and on the other, an economic performance in Europe that was somewhat better than expected, with the ECB announcing a gradual withdrawal of stimuli.
The U.S. banking system is in a very strong position. According to the latest available data from the Fed through November 2017, the total volume of bank credit in the system increased by 5.3% over the last twelve months. Growth of 2.6% recorded in the portfolios of lending to the real-estate sector (including residential mortgage loans) and 9.8% in consumer finance offset the 1.9% reduction in commercial lending. Non-performing loans in the system remained under control, with an NPL ratio of 1.82% at the close of 2017. Deposits were stable, with only a slight fall of 0.3% (November data).
Activity
All the comments below on rates of change, for both activity and earnings, will be given at constant exchange rate, unless expressly stated otherwise. These rates, together with changes at current exchange rate, can be seen in the attached tables of financial statements and relevant business indicators.
Following the increase in the third quarter of 2017, lending activity (performing loans under management) in the area grew again by 1.0% in the last quarter of the year. As a result, the balance of lending as of 31-Dec-2017 was practically the same as of the close of 2016 (down 0.1%). By portfolio, the
Financial statements and relevant business indicators (Million euros. Percentage)
Income statement 2017 ∆% ∆% (1) 2016Net interest income 2,158 10.5 13.0 1,953
Net fees and commissions 647 1.5 4.1 638
Net trading income 111 (22.2) (19.6) 142
Other income/expenses 2 n.s. n.s. (27)
Gross income 2,919 7.9 10.5 2,706
Operating expenses (1,858) 0.8 3.2 (1,843)
Personnel expenses (1,067) (0.5) 1.8 (1,073)
Other administrative expenses (604) 4.2 6.7 (580)
Depreciation (187) (1.9) 0.2 (190)
Operating income 1,061 22.9 26.1 863
Impairment on financial assets (net) (241) 8.9 10.8 (221)
Provisions (net) and other gains (losses)
(36) 19.2 23.1 (30)
Profit/(loss) before tax 784 28.2 31.8 612
Income tax (273) 78.6 83.0 (153)
Profit/(loss) for the year 511 11.3 14.6 459
Non-controlling interests - - - -
Net attributable profit 511 11.3 14.6 459
Balance sheets 31-12-17 ∆% ∆% (1) 31-12-16Cash, cash balances at central banks and other demand deposits
11,089 39.3 58.4 7,963
Financial assets 11,154 (23.5) (13.0) 14,581
Loans and receivables 55,419 (12.0) 0.1 62,962
of which loans and advances to customers
54,406 (11.0) 1.2 61,159
Inter-area positions - - - -
Tangible assets 658 (16.3) (4.8) 787
Other assets 2,172 (16.7) (5.3) 2,609
Total assets/liabilities and equity 80,493 (9.5) 3.0 88,902
Financial liabilities held for trading and designated at fair value through profit or loss
139 (95.2) (94.5) 2,901
Deposits from central banks and credit institutions
3,663 5.5 20.0 3,473
Deposits from customers 61,357 (6.7) 6.2 65,760
Debt certificates 2,017 (17.5) (6.2) 2,446
Inter-area positions 4,965 1.9 15.9 4,875
Other liabilities 5,560 (8.4) 4.2 6,068
Economic capital allocated 2,791 (17.4) (6.0) 3,379
Relevant business indicators 31-12-17 ∆% ∆% (1) 31-12-16Loans and advances to customers (gross) (2) 55,122 (11.1) 1.2 62,000
Non-performing loans and contingent liabilities
696 (28.6) (18.8) 976
Customer deposits under management (2) 56,547 (10.5) 1.8 63,195
Off-balance-sheet funds (3) - - - -
Risk-weighted assets 58,682 (10.4) 1.9 65,492
Efficiency ratio (%) 63.7 68.1
NPL ratio (%) 1.2 1.5
NPL coverage ratio (%) 104 94
Cost of risk (%) 0.42 0.37(1) Figures at constant exchange rate.(2) Excluding repos.(3) Includes mutual funds, pension funds and other off-balance-sheet funds.
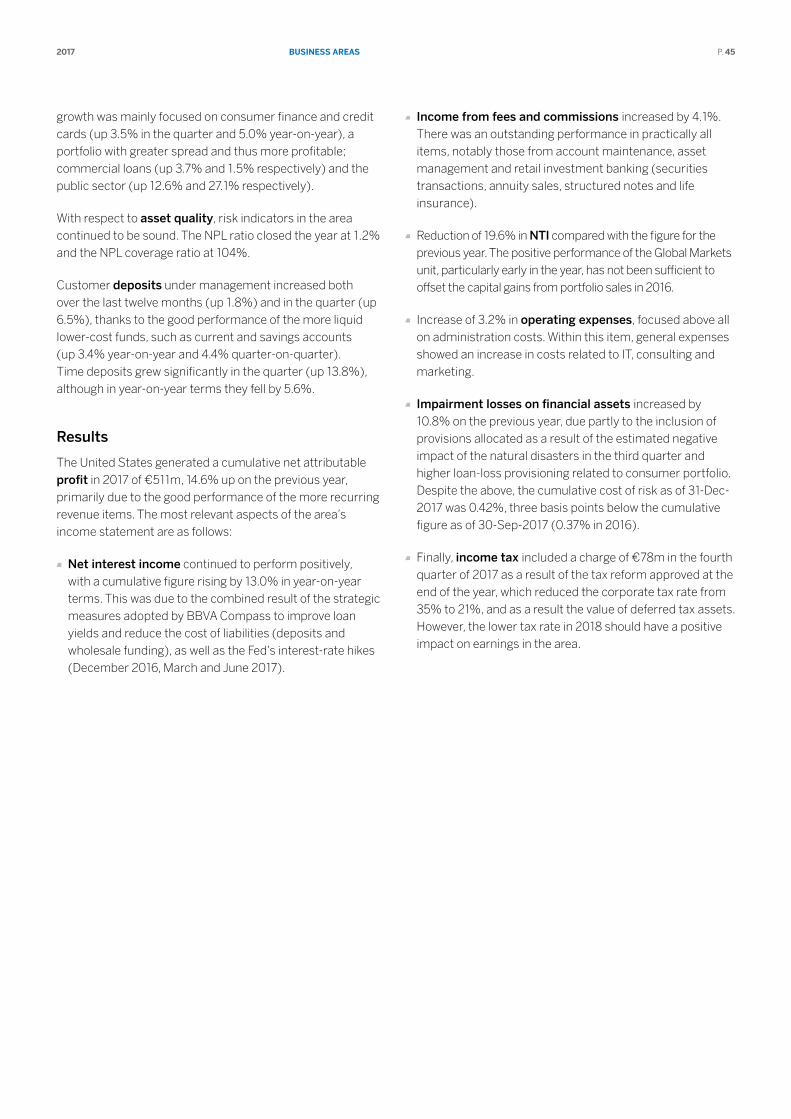
BuSInESS ArEAS2017 P. 45
growth was mainly focused on consumer finance and credit cards (up 3.5% in the quarter and 5.0% year-on-year), a portfolio with greater spread and thus more profitable; commercial loans (up 3.7% and 1.5% respectively) and the public sector (up 12.6% and 27.1% respectively).
With respect to asset quality, risk indicators in the area continued to be sound. The NPL ratio closed the year at 1.2% and the NPL coverage ratio at 104%.
Customer deposits under management increased both over the last twelve months (up 1.8%) and in the quarter (up 6.5%), thanks to the good performance of the more liquid lower-cost funds, such as current and savings accounts (up 3.4% year-on-year and 4.4% quarter-on-quarter). Time deposits grew significantly in the quarter (up 13.8%), although in year-on-year terms they fell by 5.6%.
Results
The United States generated a cumulative net attributable profit in 2017 of €511m, 14.6% up on the previous year, primarily due to the good performance of the more recurring revenue items. The most relevant aspects of the area’s income statement are as follows:
Net interest income continued to perform positively, with a cumulative figure rising by 13.0% in year-on-year terms. This was due to the combined result of the strategic measures adopted by BBVA Compass to improve loan yields and reduce the cost of liabilities (deposits and wholesale funding), as well as the Fed’s interest-rate hikes (December 2016, March and June 2017).
Income from fees and commissions increased by 4.1%. There was an outstanding performance in practically all items, notably those from account maintenance, asset management and retail investment banking (securities transactions, annuity sales, structured notes and life insurance).
Reduction of 19.6% in NTI compared with the figure for the previous year. The positive performance of the Global Markets unit, particularly early in the year, has not been sufficient to offset the capital gains from portfolio sales in 2016.
Increase of 3.2% in operating expenses, focused above all on administration costs. Within this item, general expenses showed an increase in costs related to IT, consulting and marketing.
Impairment losses on financial assets increased by 10.8% on the previous year, due partly to the inclusion of provisions allocated as a result of the estimated negative impact of the natural disasters in the third quarter and higher loan-loss provisioning related to consumer portfolio. Despite the above, the cumulative cost of risk as of 31-Dec-2017 was 0.42%, three basis points below the cumulative figure as of 30-Sep-2017 (0.37% in 2016).
Finally, income tax included a charge of €78m in the fourth quarter of 2017 as a result of the tax reform approved at the end of the year, which reduced the corporate tax rate from 35% to 21%, and as a result the value of deferred tax assets. However, the lower tax rate in 2018 should have a positive impact on earnings in the area.
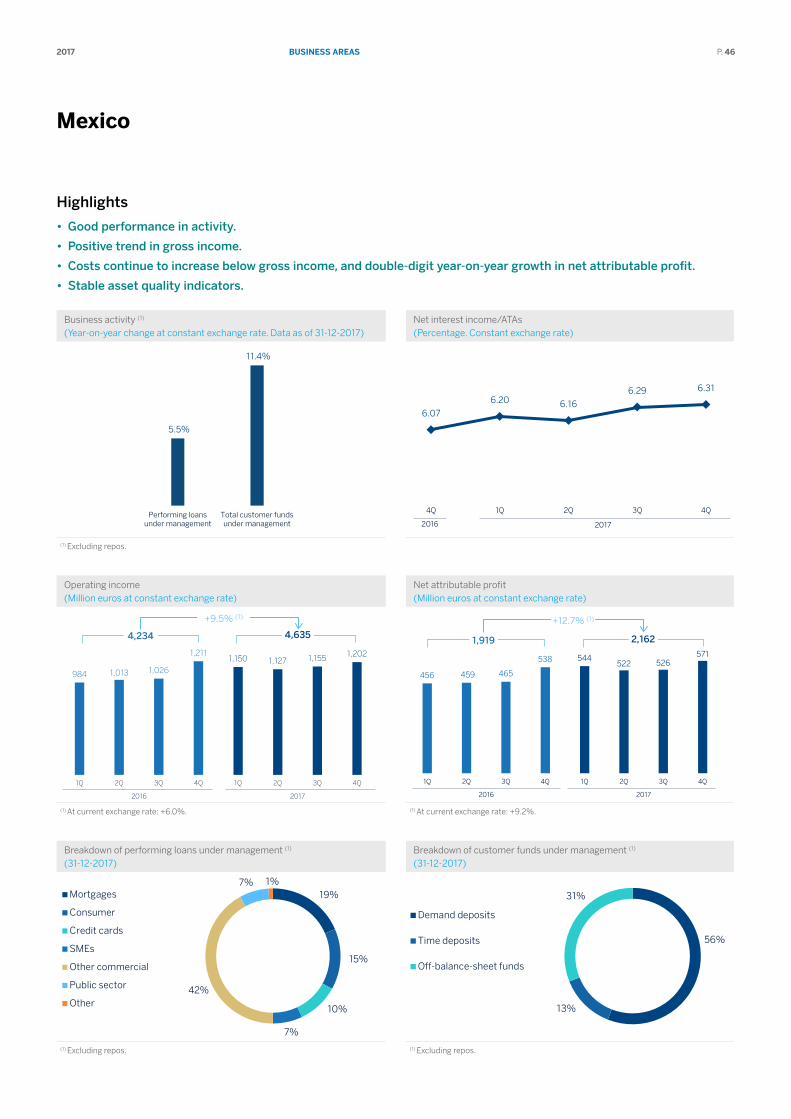
BuSInESS ArEAS2017 P. 46
mexico
Highlights
• Good performance in activity.
• Positive trend in gross income.
• Costs continue to increase below gross income, and double-digit year-on-year growth in net attributable profit.
• Stable asset quality indicators.
Business activity (1) (Year-on-year change at constant exchange rate. Data as of 31-12-2017)
Net interest income/ATAs (Percentage. Constant exchange rate)
5.5%
11.4%
Performing loansunder management
Total customer fundsunder management
6.07
6.20 6.16
6.29 6.31
4Q 1Q 2Q 3Q 4Q
20172016
(1) Excluding repos.
Operating income (Million euros at constant exchange rate)
Net attributable profit (Million euros at constant exchange rate)
984 1,013 1,026
1,211 1,150 1,127 1,155 1,202
1Q 2Q 3Q 4Q 1Q 2Q 3Q 4Q
2016 2017
+9.5% (1)
4,234 4,635
456 459 465
538 544 522 526
571
1Q 2Q 3Q 4Q 1Q 2Q 3Q 4Q
2016 2017
+12.7% (1)
1,919 2,162
(1) At current exchange rate: +6.0%. (1) At current exchange rate: +9.2%.
Breakdown of performing loans under management (1) (31-12-2017)
Breakdown of customer funds under management (1) (31-12-2017)
19%
15%
10%
7%
42%
7% 1% Mortgages
Consumer
Credit cards
SMEs
Other commercial
Public sector
Other
56%
13%
31%
Demand deposits
Time deposits
Off-balance-sheet funds
(1) Excluding repos. (1) Excluding repos.
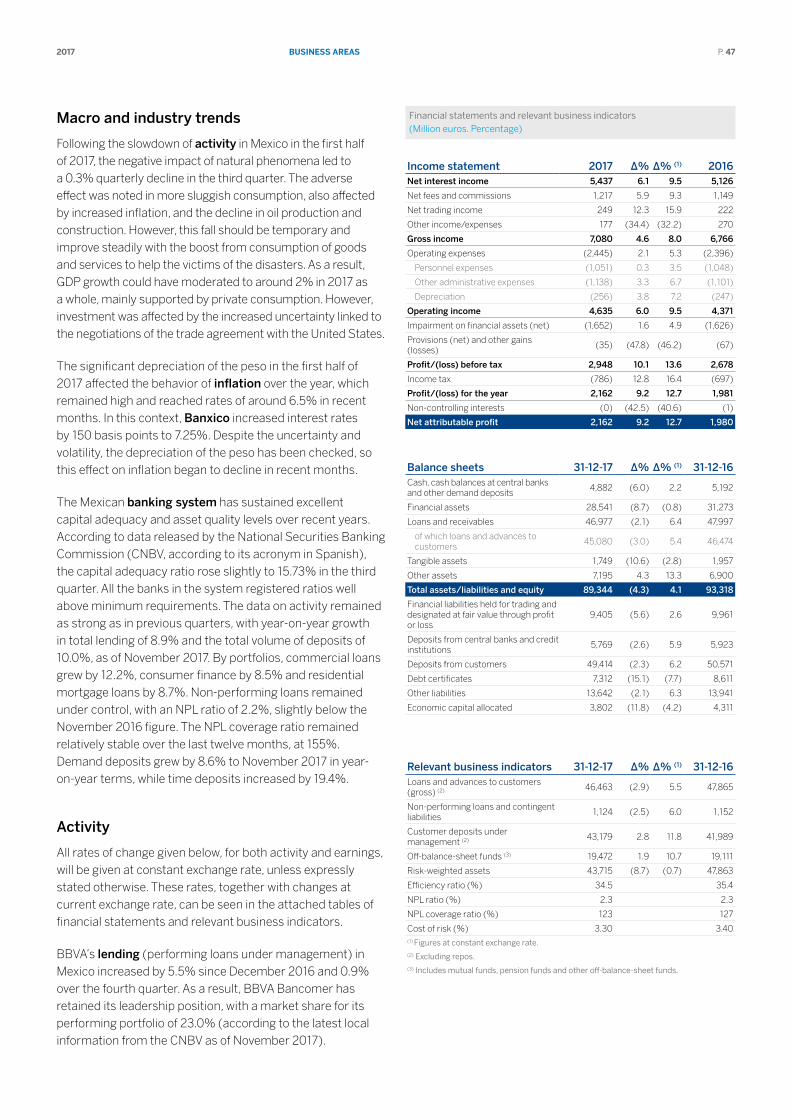
BuSInESS ArEAS2017 P. 47
Macro and industry trends
Following the slowdown of activity in Mexico in the first half of 2017, the negative impact of natural phenomena led to a 0.3% quarterly decline in the third quarter. The adverse effect was noted in more sluggish consumption, also affected by increased inflation, and the decline in oil production and construction. However, this fall should be temporary and improve steadily with the boost from consumption of goods and services to help the victims of the disasters. As a result, GDP growth could have moderated to around 2% in 2017 as a whole, mainly supported by private consumption. However, investment was affected by the increased uncertainty linked to the negotiations of the trade agreement with the United States.
The significant depreciation of the peso in the first half of 2017 affected the behavior of inflation over the year, which remained high and reached rates of around 6.5% in recent months. In this context, Banxico increased interest rates by 150 basis points to 7.25%. Despite the uncertainty and volatility, the depreciation of the peso has been checked, so this effect on inflation began to decline in recent months.
The Mexican banking system has sustained excellent capital adequacy and asset quality levels over recent years. According to data released by the National Securities Banking Commission (CNBV, according to its acronym in Spanish), the capital adequacy ratio rose slightly to 15.73% in the third quarter. All the banks in the system registered ratios well above minimum requirements. The data on activity remained as strong as in previous quarters, with year-on-year growth in total lending of 8.9% and the total volume of deposits of 10.0%, as of November 2017. By portfolios, commercial loans grew by 12.2%, consumer finance by 8.5% and residential mortgage loans by 8.7%. Non-performing loans remained under control, with an NPL ratio of 2.2%, slightly below the November 2016 figure. The NPL coverage ratio remained relatively stable over the last twelve months, at 155%. Demand deposits grew by 8.6% to November 2017 in year-on-year terms, while time deposits increased by 19.4%.
Activity
All rates of change given below, for both activity and earnings, will be given at constant exchange rate, unless expressly stated otherwise. These rates, together with changes at current exchange rate, can be seen in the attached tables of financial statements and relevant business indicators.
BBVA’s lending (performing loans under management) in Mexico increased by 5.5% since December 2016 and 0.9% over the fourth quarter. As a result, BBVA Bancomer has retained its leadership position, with a market share for its performing portfolio of 23.0% (according to the latest local information from the CNBV as of November 2017).
Financial statements and relevant business indicators (Million euros. Percentage)
Income statement 2017 ∆% ∆% (1) 2016Net interest income 5,437 6.1 9.5 5,126
Net fees and commissions 1,217 5.9 9.3 1,149
Net trading income 249 12.3 15.9 222
Other income/expenses 177 (34.4) (32.2) 270
Gross income 7,080 4.6 8.0 6,766
Operating expenses (2,445) 2.1 5.3 (2,396)
Personnel expenses (1,051) 0.3 3.5 (1,048)
Other administrative expenses (1,138) 3.3 6.7 (1,101)
Depreciation (256) 3.8 7.2 (247)
Operating income 4,635 6.0 9.5 4,371
Impairment on financial assets (net) (1,652) 1.6 4.9 (1,626)
Provisions (net) and other gains (losses)
(35) (47.8) (46.2) (67)
Profit/(loss) before tax 2,948 10.1 13.6 2,678
Income tax (786) 12.8 16.4 (697)
Profit/(loss) for the year 2,162 9.2 12.7 1,981
Non-controlling interests (0) (42.5) (40.6) (1)
Net attributable profit 2,162 9.2 12.7 1,980
Balance sheets 31-12-17 ∆% ∆% (1) 31-12-16Cash, cash balances at central banks and other demand deposits
4,882 (6.0) 2.2 5,192
Financial assets 28,541 (8.7) (0.8) 31,273
Loans and receivables 46,977 (2.1) 6.4 47,997
of which loans and advances to customers
45,080 (3.0) 5.4 46,474
Tangible assets 1,749 (10.6) (2.8) 1,957
Other assets 7,195 4.3 13.3 6,900
Total assets/liabilities and equity 89,344 (4.3) 4.1 93,318
Financial liabilities held for trading and designated at fair value through profit or loss
9,405 (5.6) 2.6 9,961
Deposits from central banks and credit institutions
5,769 (2.6) 5.9 5,923
Deposits from customers 49,414 (2.3) 6.2 50,571
Debt certificates 7,312 (15.1) (7.7) 8,611
Other liabilities 13,642 (2.1) 6.3 13,941
Economic capital allocated 3,802 (11.8) (4.2) 4,311
Relevant business indicators 31-12-17 ∆% ∆% (1) 31-12-16Loans and advances to customers (gross) (2) 46,463 (2.9) 5.5 47,865
Non-performing loans and contingent liabilities
1,124 (2.5) 6.0 1,152
Customer deposits under management (2) 43,179 2.8 11.8 41,989
Off-balance-sheet funds (3) 19,472 1.9 10.7 19,111
Risk-weighted assets 43,715 (8.7) (0.7) 47,863
Efficiency ratio (%) 34.5 35.4
NPL ratio (%) 2.3 2.3
NPL coverage ratio (%) 123 127
Cost of risk (%) 3.30 3.40(1) Figures at constant exchange rate.(2) Excluding repos.(3) Includes mutual funds, pension funds and other off-balance-sheet funds.
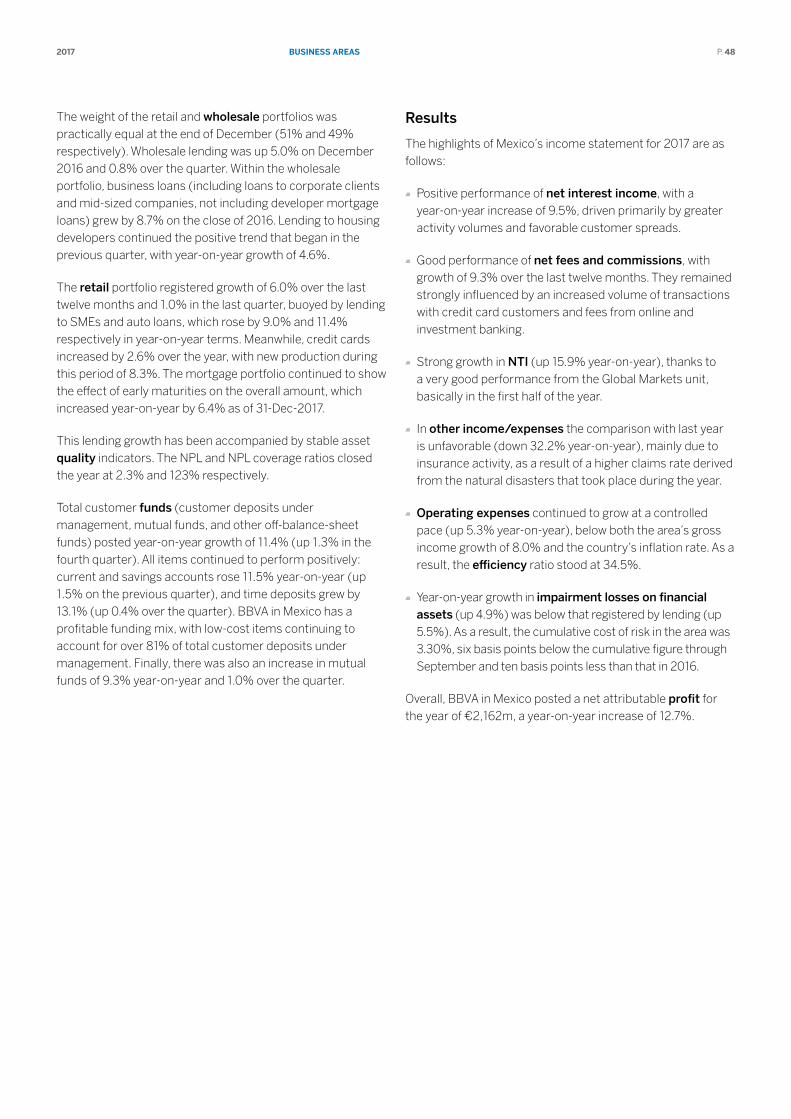
BuSInESS ArEAS2017 P. 48
The weight of the retail and wholesale portfolios was practically equal at the end of December (51% and 49% respectively). Wholesale lending was up 5.0% on December 2016 and 0.8% over the quarter. Within the wholesale portfolio, business loans (including loans to corporate clients and mid-sized companies, not including developer mortgage loans) grew by 8.7% on the close of 2016. Lending to housing developers continued the positive trend that began in the previous quarter, with year-on-year growth of 4.6%.
The retail portfolio registered growth of 6.0% over the last twelve months and 1.0% in the last quarter, buoyed by lending to SMEs and auto loans, which rose by 9.0% and 11.4% respectively in year-on-year terms. Meanwhile, credit cards increased by 2.6% over the year, with new production during this period of 8.3%. The mortgage portfolio continued to show the effect of early maturities on the overall amount, which increased year-on-year by 6.4% as of 31-Dec-2017.
This lending growth has been accompanied by stable asset quality indicators. The NPL and NPL coverage ratios closed the year at 2.3% and 123% respectively.
Total customer funds (customer deposits under management, mutual funds, and other off-balance-sheet funds) posted year-on-year growth of 11.4% (up 1.3% in the fourth quarter). All items continued to perform positively: current and savings accounts rose 11.5% year-on-year (up 1.5% on the previous quarter), and time deposits grew by 13.1% (up 0.4% over the quarter). BBVA in Mexico has a profitable funding mix, with low-cost items continuing to account for over 81% of total customer deposits under management. Finally, there was also an increase in mutual funds of 9.3% year-on-year and 1.0% over the quarter.
Results
The highlights of Mexico’s income statement for 2017 are as follows:
Positive performance of net interest income, with a year-on-year increase of 9.5%, driven primarily by greater activity volumes and favorable customer spreads.
Good performance of net fees and commissions, with growth of 9.3% over the last twelve months. They remained strongly influenced by an increased volume of transactions with credit card customers and fees from online and investment banking.
Strong growth in NTI (up 15.9% year-on-year), thanks to a very good performance from the Global Markets unit, basically in the first half of the year.
In other income/expenses the comparison with last year is unfavorable (down 32.2% year-on-year), mainly due to insurance activity, as a result of a higher claims rate derived from the natural disasters that took place during the year.
Operating expenses continued to grow at a controlled pace (up 5.3% year-on-year), below both the area’s gross income growth of 8.0% and the country’s inflation rate. As a result, the efficiency ratio stood at 34.5%.
Year-on-year growth in impairment losses on financial assets (up 4.9%) was below that registered by lending (up 5.5%). As a result, the cumulative cost of risk in the area was 3.30%, six basis points below the cumulative figure through September and ten basis points less than that in 2016.
Overall, BBVA in Mexico posted a net attributable profit for the year of €2,162m, a year-on-year increase of 12.7%.
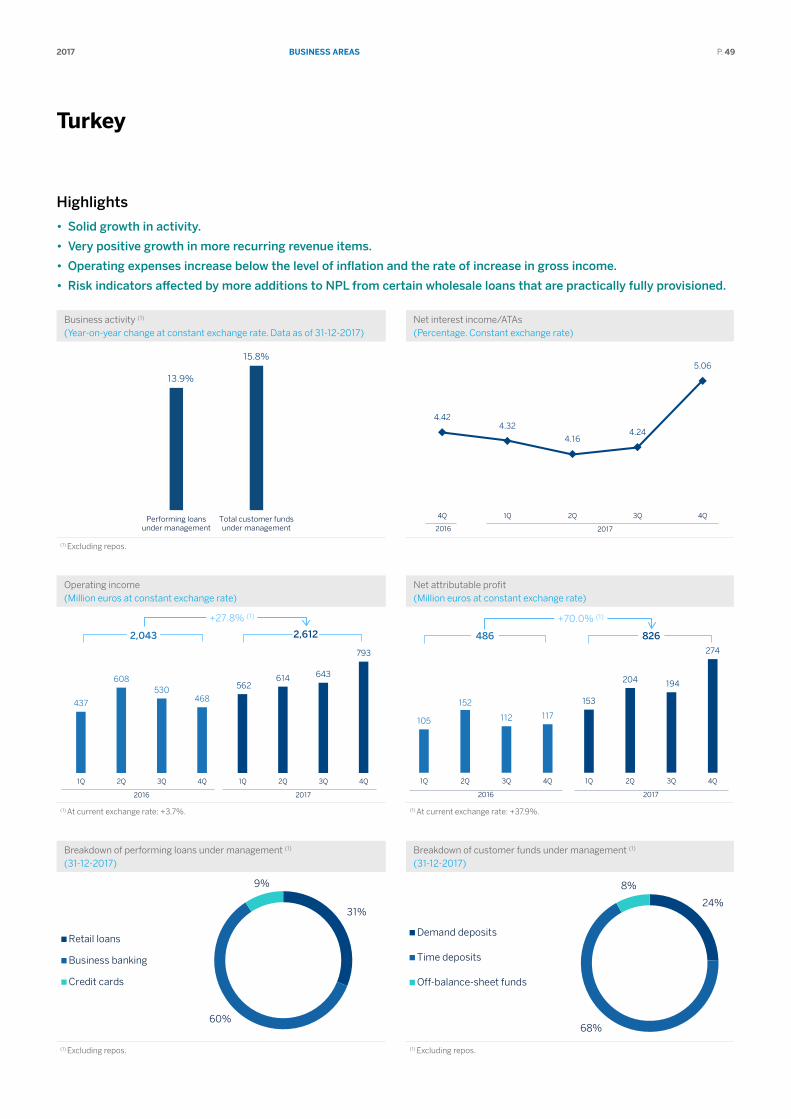
BuSInESS ArEAS2017 P. 49
turkey
Highlights
• Solid growth in activity.
• Very positive growth in more recurring revenue items.
• Operating expenses increase below the level of inflation and the rate of increase in gross income.
• Risk indicators affected by more additions to NPL from certain wholesale loans that are practically fully provisioned.
Business activity (1) (Year-on-year change at constant exchange rate. Data as of 31-12-2017)
Net interest income/ATAs (Percentage. Constant exchange rate)
13.9%
15.8%
Performing loansunder management
Total customer fundsunder management
4.42 4.32
4.16 4.24
5.06
4Q 1Q 2Q 3Q 4Q
20172016
(1) Excluding repos.
Operating income (Million euros at constant exchange rate)
Net attributable profit (Million euros at constant exchange rate)
437
608 530
468
562 614 643
793
1Q 2Q 3Q 4Q 1Q 2Q 3Q 4Q
2016 2017
+27.8% (1)
2,043 2,612
105
152
112 117
153
204 194
274
1Q 2Q 3Q 4Q 1Q 2Q 3Q 4Q
2016 2017
+70.0% (1)
486 826
(1) At current exchange rate: +3.7%. (1) At current exchange rate: +37.9%.
Breakdown of performing loans under management (1) (31-12-2017)
Breakdown of customer funds under management (1) (31-12-2017)
31%
60%
9%
Retail loans
Business banking
Credit cards
24%
68%
8%
Demand deposits
Time deposits
Off-balance-sheet funds
(1) Excluding repos. (1) Excluding repos.
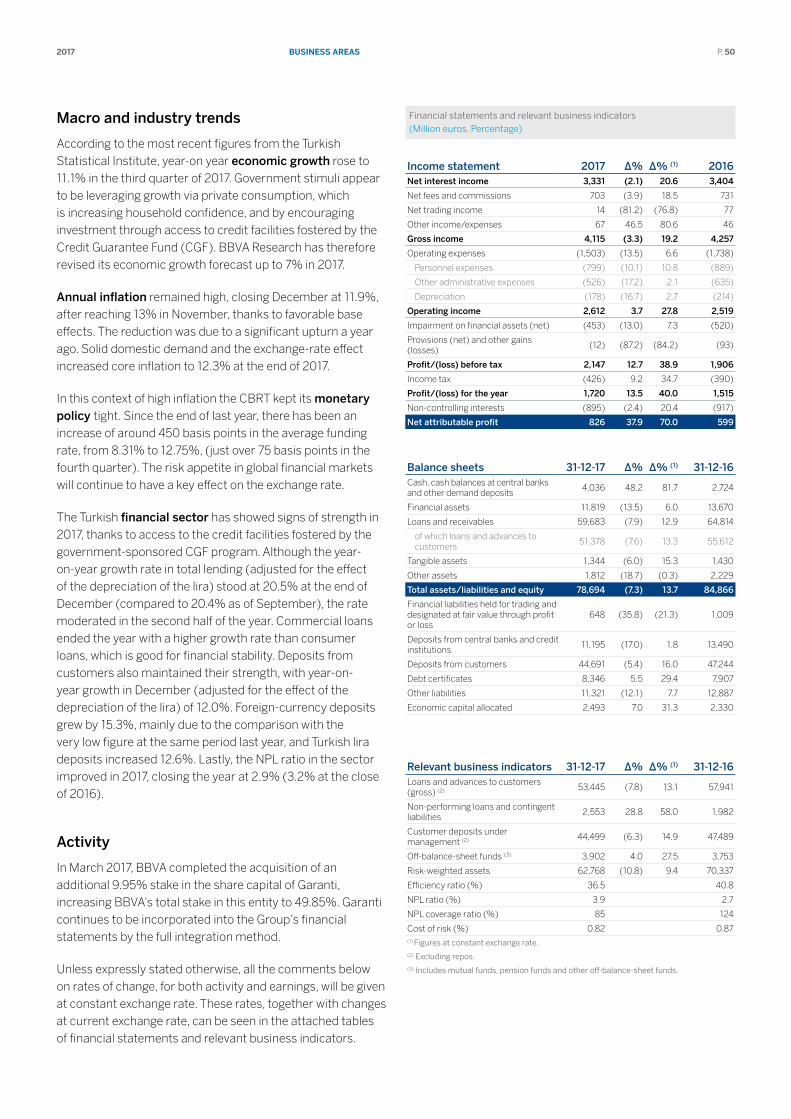
BuSInESS ArEAS2017 P. 50
Macro and industry trends
According to the most recent figures from the Turkish Statistical Institute, year-on year economic growth rose to 11.1% in the third quarter of 2017. Government stimuli appear to be leveraging growth via private consumption, which is increasing household confidence, and by encouraging investment through access to credit facilities fostered by the Credit Guarantee Fund (CGF). BBVA Research has therefore revised its economic growth forecast up to 7% in 2017.
Annual inflation remained high, closing December at 11.9%, after reaching 13% in November, thanks to favorable base effects. The reduction was due to a significant upturn a year ago. Solid domestic demand and the exchange-rate effect increased core inflation to 12.3% at the end of 2017.
In this context of high inflation the CBRT kept its monetary policy tight. Since the end of last year, there has been an increase of around 450 basis points in the average funding rate, from 8.31% to 12.75%, (just over 75 basis points in the fourth quarter). The risk appetite in global financial markets will continue to have a key effect on the exchange rate.
The Turkish financial sector has showed signs of strength in 2017, thanks to access to the credit facilities fostered by the government-sponsored CGF program. Although the year-on-year growth rate in total lending (adjusted for the effect of the depreciation of the lira) stood at 20.5% at the end of December (compared to 20.4% as of September), the rate moderated in the second half of the year. Commercial loans ended the year with a higher growth rate than consumer loans, which is good for financial stability. Deposits from customers also maintained their strength, with year-on-year growth in December (adjusted for the effect of the depreciation of the lira) of 12.0%. Foreign-currency deposits grew by 15.3%, mainly due to the comparison with the very low figure at the same period last year, and Turkish lira deposits increased 12.6%. Lastly, the NPL ratio in the sector improved in 2017, closing the year at 2.9% (3.2% at the close of 2016).
Activity
In March 2017, BBVA completed the acquisition of an additional 9.95% stake in the share capital of Garanti, increasing BBVA’s total stake in this entity to 49.85%. Garanti continues to be incorporated into the Group’s financial statements by the full integration method.
Unless expressly stated otherwise, all the comments below on rates of change, for both activity and earnings, will be given at constant exchange rate. These rates, together with changes at current exchange rate, can be seen in the attached tables of financial statements and relevant business indicators.
Financial statements and relevant business indicators (Million euros. Percentage)
Income statement 2017 ∆% ∆% (1) 2016Net interest income 3,331 (2.1) 20.6 3,404
Net fees and commissions 703 (3.9) 18.5 731
Net trading income 14 (81.2) (76.8) 77
Other income/expenses 67 46.5 80.6 46
Gross income 4,115 (3.3) 19.2 4,257
Operating expenses (1,503) (13.5) 6.6 (1,738)
Personnel expenses (799) (10.1) 10.8 (889)
Other administrative expenses (526) (17.2) 2.1 (635)
Depreciation (178) (16.7) 2.7 (214)
Operating income 2,612 3.7 27.8 2,519
Impairment on financial assets (net) (453) (13.0) 7.3 (520)
Provisions (net) and other gains (losses)
(12) (87.2) (84.2) (93)
Profit/(loss) before tax 2,147 12.7 38.9 1,906
Income tax (426) 9.2 34.7 (390)
Profit/(loss) for the year 1,720 13.5 40.0 1,515
Non-controlling interests (895) (2.4) 20.4 (917)
Net attributable profit 826 37.9 70.0 599
Balance sheets 31-12-17 ∆% ∆% (1) 31-12-16Cash, cash balances at central banks and other demand deposits
4,036 48.2 81.7 2,724
Financial assets 11,819 (13.5) 6.0 13,670
Loans and receivables 59,683 (7.9) 12.9 64,814
of which loans and advances to customers
51,378 (7.6) 13.3 55,612
Tangible assets 1,344 (6.0) 15.3 1,430
Other assets 1,812 (18.7) (0.3) 2,229
Total assets/liabilities and equity 78,694 (7.3) 13.7 84,866
Financial liabilities held for trading and designated at fair value through profit or loss
648 (35.8) (21.3) 1,009
Deposits from central banks and credit institutions
11,195 (17.0) 1.8 13,490
Deposits from customers 44,691 (5.4) 16.0 47,244
Debt certificates 8,346 5.5 29.4 7,907
Other liabilities 11,321 (12.1) 7.7 12,887
Economic capital allocated 2,493 7.0 31.3 2,330
Relevant business indicators 31-12-17 ∆% ∆% (1) 31-12-16Loans and advances to customers (gross) (2) 53,445 (7.8) 13.1 57,941
Non-performing loans and contingent liabilities
2,553 28.8 58.0 1,982
Customer deposits under management (2) 44,499 (6.3) 14.9 47,489
Off-balance-sheet funds (3) 3,902 4.0 27.5 3,753
Risk-weighted assets 62,768 (10.8) 9.4 70,337
Efficiency ratio (%) 36.5 40.8
NPL ratio (%) 3.9 2.7
NPL coverage ratio (%) 85 124
Cost of risk (%) 0.82 0.87(1) Figures at constant exchange rate.(2) Excluding repos.(3) Includes mutual funds, pension funds and other off-balance-sheet funds.
BuSInESS ArEAS2017 P. 51
The growth of lending activity (performing loans under management) in the area rose to 13.9% in year-on-year terms, mainly driven by Turkish lira loans. By segments, business banking loans performed very favorably throughout the year, thanks to the aforementioned CGF program launched at the start of the year. General purpose loans also performed well. In mortgages, Garanti gained market share among private banks thanks to using alternative sale channels effectively and providing flexible payment plan options. Garanti also performed positively, above the average of its private-sector peers, in auto loans, and strengthened its leading position in the credit card segment, thanks to the increase in both commercial and consumer credit cards.
In terms of asset quality, the NPL ratio rose to 3.9% as a result of increased additions to NPLs from certain wholesale loans, although they were practically fully provisioned (with hardly any impact on results). The NPL coverage ratio closed at 85%.
Customer deposits remained the main source of funding for the balance sheet in the area, and grew by 14.9% in 2017 (up 4.6% in the last quarter). Both, Turkish lira and foreign currency deposits grew in year-on-year terms, with current and savings accounts performing well and continuing to support growth in net interest income growth: they have almost zero cost and represent 26% of total customer deposits in Garanti.
Results
Turkey generated a cumulative net attributable profit of €826m in 2017, up 70.0% compared with the figure in 2016. The most significant aspects of the year-on-year changes in the income statement were as follows:
Positive performance of net interest income (up 20.6%). This positive trend is a result of increased in activity, good management of customer spreads (despite the increase in cost of funding) and higher income from inflation-linked bonds (CPI linkers).
Income from fees and commissions increased 18.5% year-on-year, thanks to good diversification (payment systems, money transfers, loans, insurance and brokerage). This positive performance has been achieved despite the lower generation of fees from account maintenance due to the suspension of charges in the retail segment implemented by the Turkish Council of State as of January, 2016, and the high revenues generated in 2016 by the Miles & Smiles program.
Reduction of NTI (down 76.8%), mainly due to the higher base of comparison due to the capital gains generated in the first half of 2016 from the VISA deal.
Overall, gross income was up 19.2% in 2017.
Operating expenses increased by 6.6%, below both the inflation rate and the year-on-year growth rate in gross income, thanks to strict cost discipline. As a result, the efficiency ratio declined to 36.5% (40.8% in 2016).
Impairment losses on financial assets rose by 7.3% year-on-year, less than the rise in lending activity. As a result, the cumulative cost of risk of the area closed 2017 at 0.82%, below the level of 2016 (0.87%).
Finally, BBVA Group’s additional stake of 9.95% in the capital of Garanti had a positive effect on reducing the non-controlling interest heading by approximately €150m.
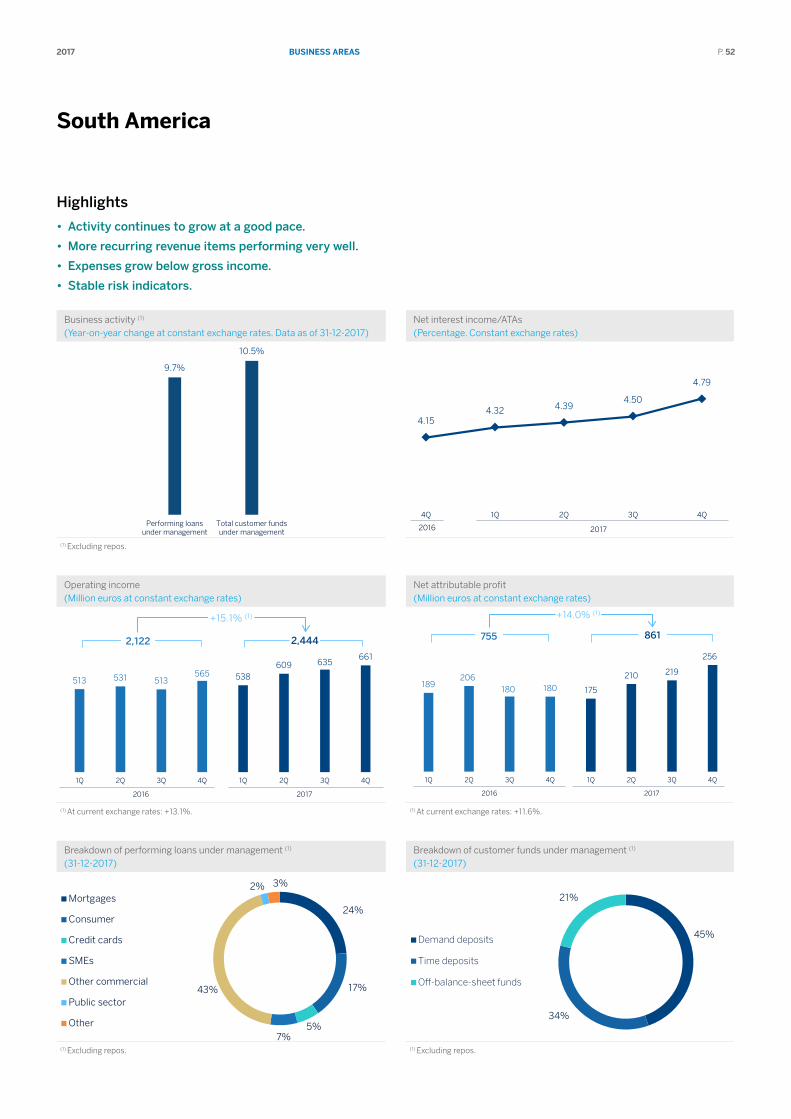
BuSInESS ArEAS2017 P. 52
South America
Highlights
• Activity continues to grow at a good pace.
• More recurring revenue items performing very well.
• Expenses grow below gross income.
• Stable risk indicators.
Business activity (1) (Year-on-year change at constant exchange rates. Data as of 31-12-2017)
Net interest income/ATAs (Percentage. Constant exchange rates)
9.7%
10.5%
Performing loansunder management
Total customer fundsunder management
4.15 4.32 4.39
4.50
4.79
4Q 1Q 2Q 3Q 4Q
20172016
(1) Excluding repos.
Operating income (Million euros at constant exchange rates)
Net attributable profit (Million euros at constant exchange rates)
513 531 513 565 538
609 635 661
1Q 2Q 3Q 4Q 1Q 2Q 3Q 4Q
2016 2017
+15.1% (1)
2,122 2,444
189 206
180 180 175
210 219
256
1Q 2Q 3Q 4Q 1Q 2Q 3Q 4Q
2016 2017
+14.0% (1)
755 861
(1) At current exchange rates: +13.1%. (1) At current exchange rates: +11.6%.
Breakdown of performing loans under management (1) (31-12-2017)
Breakdown of customer funds under management (1) (31-12-2017)
24%
17%
5% 7%
43%
2% 3%
Mortgages
Consumer
Credit cards
SMEs
Other commercial
Public sector
Other
45%
34%
21%
Demand deposits
Time deposits
Off-balance-sheet funds
(1) Excluding repos. (1) Excluding repos.
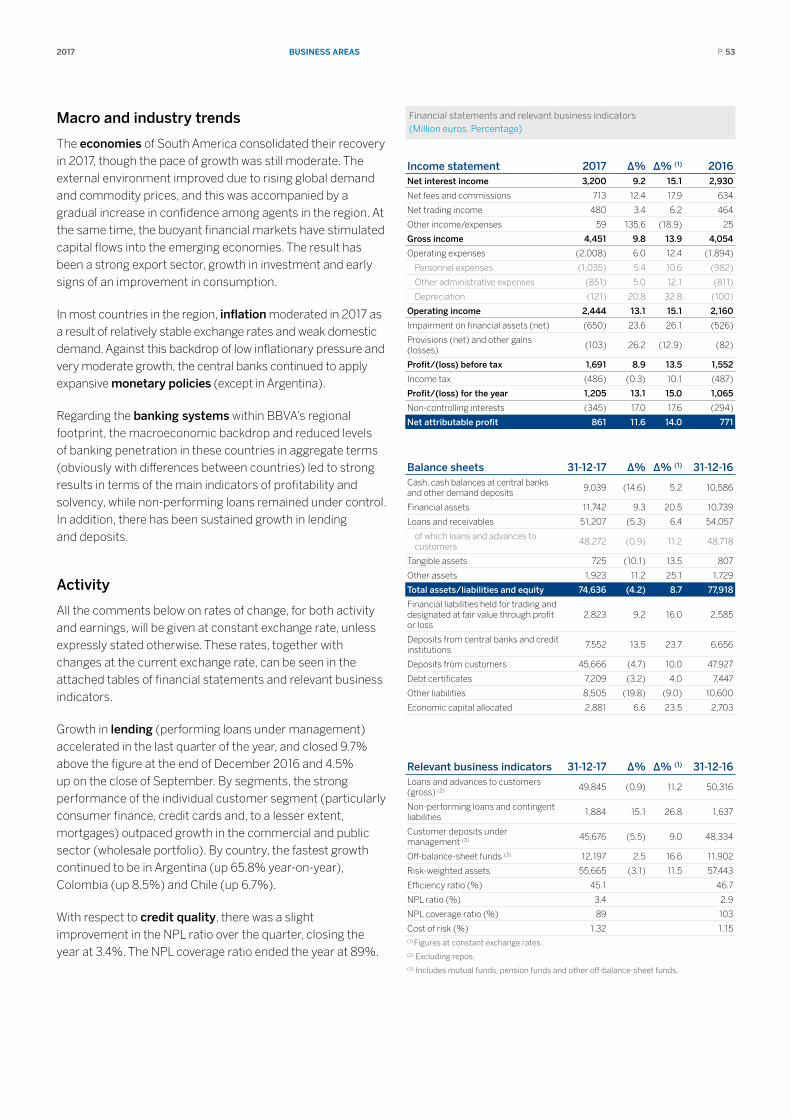
BuSInESS ArEAS2017 P. 53
Macro and industry trends
The economies of South America consolidated their recovery in 2017, though the pace of growth was still moderate. The external environment improved due to rising global demand and commodity prices, and this was accompanied by a gradual increase in confidence among agents in the region. At the same time, the buoyant financial markets have stimulated capital flows into the emerging economies. The result has been a strong export sector, growth in investment and early signs of an improvement in consumption.
In most countries in the region, inflation moderated in 2017 as a result of relatively stable exchange rates and weak domestic demand. Against this backdrop of low inflationary pressure and very moderate growth, the central banks continued to apply expansive monetary policies (except in Argentina).
Regarding the banking systems within BBVA’s regional footprint, the macroeconomic backdrop and reduced levels of banking penetration in these countries in aggregate terms (obviously with differences between countries) led to strong results in terms of the main indicators of profitability and solvency, while non-performing loans remained under control. In addition, there has been sustained growth in lending and deposits.
Activity
All the comments below on rates of change, for both activity and earnings, will be given at constant exchange rate, unless expressly stated otherwise. These rates, together with changes at the current exchange rate, can be seen in the attached tables of financial statements and relevant business indicators.
Growth in lending (performing loans under management) accelerated in the last quarter of the year, and closed 9.7% above the figure at the end of December 2016 and 4.5% up on the close of September. By segments, the strong performance of the individual customer segment (particularly consumer finance, credit cards and, to a lesser extent, mortgages) outpaced growth in the commercial and public sector (wholesale portfolio). By country, the fastest growth continued to be in Argentina (up 65.8% year-on-year), Colombia (up 8.5%) and Chile (up 6.7%).
With respect to credit quality, there was a slight improvement in the NPL ratio over the quarter, closing the year at 3.4%. The NPL coverage ratio ended the year at 89%.
Financial statements and relevant business indicators (Million euros. Percentage)
Income statement 2017 ∆% ∆% (1) 2016Net interest income 3,200 9.2 15.1 2,930
Net fees and commissions 713 12.4 17.9 634
Net trading income 480 3.4 6.2 464
Other income/expenses 59 135.6 (18.9) 25
Gross income 4,451 9.8 13.9 4,054
Operating expenses (2,008) 6.0 12.4 (1,894)
Personnel expenses (1,035) 5.4 10.6 (982)
Other administrative expenses (851) 5.0 12.1 (811)
Depreciation (121) 20.8 32.8 (100)
Operating income 2,444 13.1 15.1 2,160
Impairment on financial assets (net) (650) 23.6 26.1 (526)
Provisions (net) and other gains (losses)
(103) 26.2 (12.9) (82)
Profit/(loss) before tax 1,691 8.9 13.5 1,552
Income tax (486) (0.3) 10.1 (487)
Profit/(loss) for the year 1,205 13.1 15.0 1,065
Non-controlling interests (345) 17.0 17.6 (294)
Net attributable profit 861 11.6 14.0 771
Balance sheets 31-12-17 ∆% ∆% (1) 31-12-16Cash, cash balances at central banks and other demand deposits
9,039 (14.6) 5.2 10,586
Financial assets 11,742 9.3 20.5 10,739
Loans and receivables 51,207 (5.3) 6.4 54,057
of which loans and advances to customers
48,272 (0.9) 11.2 48,718
Tangible assets 725 (10.1) 13.5 807
Other assets 1,923 11.2 25.1 1,729
Total assets/liabilities and equity 74,636 (4.2) 8.7 77,918
Financial liabilities held for trading and designated at fair value through profit or loss
2,823 9.2 16.0 2,585
Deposits from central banks and credit institutions
7,552 13.5 23.7 6,656
Deposits from customers 45,666 (4.7) 10.0 47,927
Debt certificates 7,209 (3.2) 4.0 7,447
Other liabilities 8,505 (19.8) (9.0) 10,600
Economic capital allocated 2,881 6.6 23.5 2,703
Relevant business indicators 31-12-17 ∆% ∆% (1) 31-12-16Loans and advances to customers (gross) (2) 49,845 (0.9) 11.2 50,316
Non-performing loans and contingent liabilities
1,884 15.1 26.8 1,637
Customer deposits under management (3) 45,676 (5.5) 9.0 48,334
Off-balance-sheet funds (3) 12,197 2.5 16.6 11,902
Risk-weighted assets 55,665 (3.1) 11.5 57,443
Efficiency ratio (%) 45.1 46.7
NPL ratio (%) 3.4 2.9
NPL coverage ratio (%) 89 103
Cost of risk (%) 1.32 1.15(1) Figures at constant exchange rates.(2) Excluding repos.(3) Includes mutual funds, pension funds and other off-balance-sheet funds.
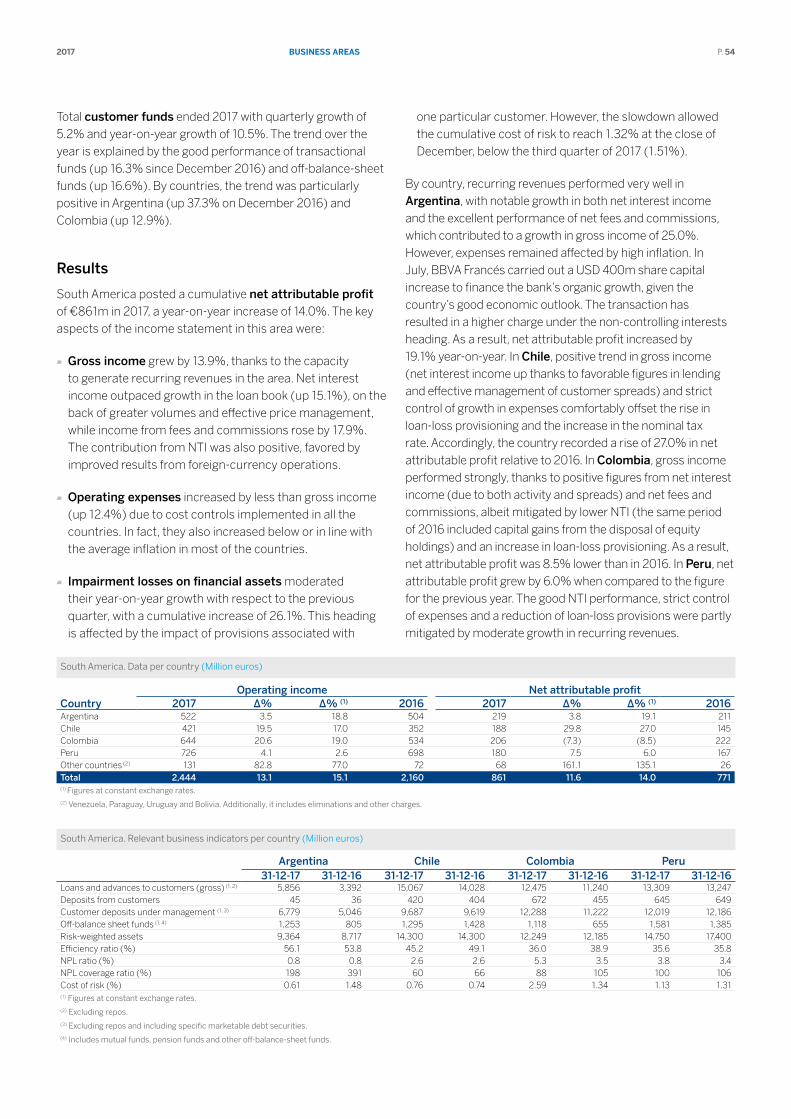
BuSInESS ArEAS2017 P. 54
Total customer funds ended 2017 with quarterly growth of 5.2% and year-on-year growth of 10.5%. The trend over the year is explained by the good performance of transactional funds (up 16.3% since December 2016) and off-balance-sheet funds (up 16.6%). By countries, the trend was particularly positive in Argentina (up 37.3% on December 2016) and Colombia (up 12.9%).
Results
South America posted a cumulative net attributable profit of €861m in 2017, a year-on-year increase of 14.0%. The key aspects of the income statement in this area were:
Gross income grew by 13.9%, thanks to the capacity to generate recurring revenues in the area. Net interest income outpaced growth in the loan book (up 15.1%), on the back of greater volumes and effective price management, while income from fees and commissions rose by 17.9%. The contribution from NTI was also positive, favored by improved results from foreign-currency operations.
Operating expenses increased by less than gross income (up 12.4%) due to cost controls implemented in all the countries. In fact, they also increased below or in line with the average inflation in most of the countries.
Impairment losses on financial assets moderated their year-on-year growth with respect to the previous quarter, with a cumulative increase of 26.1%. This heading is affected by the impact of provisions associated with
one particular customer. However, the slowdown allowed the cumulative cost of risk to reach 1.32% at the close of December, below the third quarter of 2017 (1.51%).
By country, recurring revenues performed very well in Argentina, with notable growth in both net interest income and the excellent performance of net fees and commissions, which contributed to a growth in gross income of 25.0%. However, expenses remained affected by high inflation. In July, BBVA Francés carried out a USD 400m share capital increase to finance the bank’s organic growth, given the country’s good economic outlook. The transaction has resulted in a higher charge under the non-controlling interests heading. As a result, net attributable profit increased by 19.1% year-on-year. In Chile, positive trend in gross income (net interest income up thanks to favorable figures in lending and effective management of customer spreads) and strict control of growth in expenses comfortably offset the rise in loan-loss provisioning and the increase in the nominal tax rate. Accordingly, the country recorded a rise of 27.0% in net attributable profit relative to 2016. In Colombia, gross income performed strongly, thanks to positive figures from net interest income (due to both activity and spreads) and net fees and commissions, albeit mitigated by lower NTI (the same period of 2016 included capital gains from the disposal of equity holdings) and an increase in loan-loss provisioning. As a result, net attributable profit was 8.5% lower than in 2016. In Peru, net attributable profit grew by 6.0% when compared to the figure for the previous year. The good NTI performance, strict control of expenses and a reduction of loan-loss provisions were partly mitigated by moderate growth in recurring revenues.
South America. Data per country (Million euros)
Operating income Net attributable profitCountry 2017 ∆% ∆% (1) 2016 2017 ∆% ∆% (1) 2016Argentina 522 3.5 18.8 504 219 3.8 19.1 211Chile 421 19.5 17.0 352 188 29.8 27.0 145Colombia 644 20.6 19.0 534 206 (7.3) (8.5) 222Peru 726 4.1 2.6 698 180 7.5 6.0 167Other countries (2) 131 82.8 77.0 72 68 161.1 135.1 26Total 2,444 13.1 15.1 2,160 861 11.6 14.0 771(1) Figures at constant exchange rates.(2) Venezuela, Paraguay, Uruguay and Bolivia. Additionally, it includes eliminations and other charges.
South America. Relevant business indicators per country (Million euros)
Argentina Chile Colombia Peru31-12-17 31-12-16 31-12-17 31-12-16 31-12-17 31-12-16 31-12-17 31-12-16
Loans and advances to customers (gross) (1, 2) 5,856 3,392 15,067 14,028 12,475 11,240 13,309 13,247Deposits from customers 45 36 420 404 672 455 645 649Customer deposits under management (1, 3) 6,779 5,046 9,687 9,619 12,288 11,222 12,019 12,186Off-balance sheet funds (1, 4) 1,253 805 1,295 1,428 1,118 655 1,581 1,385Risk-weighted assets 9,364 8,717 14,300 14,300 12,249 12,185 14,750 17,400Efficiency ratio (%) 56.1 53.8 45.2 49.1 36.0 38.9 35.6 35.8NPL ratio (%) 0.8 0.8 2.6 2.6 5.3 3.5 3.8 3.4NPL coverage ratio (%) 198 391 60 66 88 105 100 106Cost of risk (%) 0.61 1.48 0.76 0.74 2.59 1.34 1.13 1.31(1) Figures at constant exchange rates.(2) Excluding repos.(3) Excluding repos and including specific marketable debt securities.(4) Includes mutual funds, pension funds and other off-balance-sheet funds.
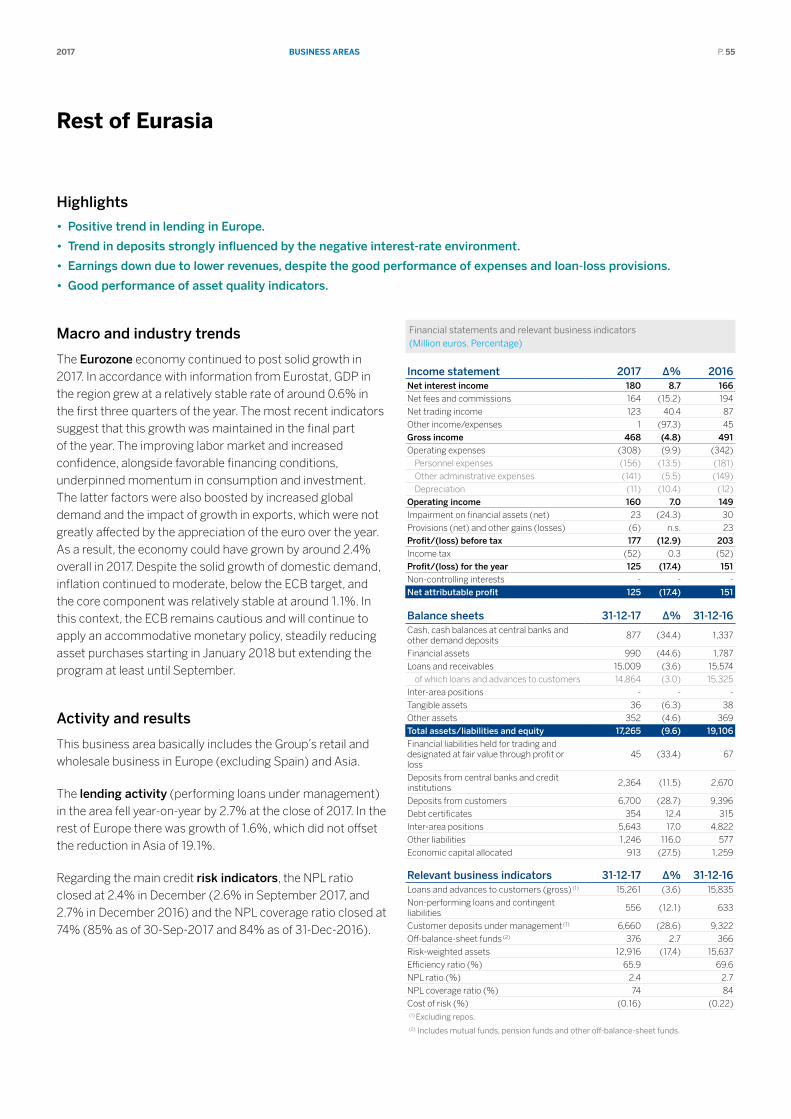
BuSInESS ArEAS2017 P. 55
rest of Eurasia
Highlights
• Positive trend in lending in Europe.
• Trend in deposits strongly influenced by the negative interest-rate environment.
• Earnings down due to lower revenues, despite the good performance of expenses and loan-loss provisions.
• Good performance of asset quality indicators.
Macro and industry trends
The Eurozone economy continued to post solid growth in 2017. In accordance with information from Eurostat, GDP in the region grew at a relatively stable rate of around 0.6% in the first three quarters of the year. The most recent indicators suggest that this growth was maintained in the final part of the year. The improving labor market and increased confidence, alongside favorable financing conditions, underpinned momentum in consumption and investment. The latter factors were also boosted by increased global demand and the impact of growth in exports, which were not greatly affected by the appreciation of the euro over the year. As a result, the economy could have grown by around 2.4% overall in 2017. Despite the solid growth of domestic demand, inflation continued to moderate, below the ECB target, and the core component was relatively stable at around 1.1%. In this context, the ECB remains cautious and will continue to apply an accommodative monetary policy, steadily reducing asset purchases starting in January 2018 but extending the program at least until September.
Activity and results
This business area basically includes the Group’s retail and wholesale business in Europe (excluding Spain) and Asia.
The lending activity (performing loans under management) in the area fell year-on-year by 2.7% at the close of 2017. In the rest of Europe there was growth of 1.6%, which did not offset the reduction in Asia of 19.1%.
Regarding the main credit risk indicators, the NPL ratio closed at 2.4% in December (2.6% in September 2017, and 2.7% in December 2016) and the NPL coverage ratio closed at 74% (85% as of 30-Sep-2017 and 84% as of 31-Dec-2016).
Financial statements and relevant business indicators (Million euros. Percentage)
Income statement 2017 ∆% 2016Net interest income 180 8.7 166Net fees and commissions 164 (15.2) 194
Net trading income 123 40.4 87
Other income/expenses 1 (97.3) 45Gross income 468 (4.8) 491Operating expenses (308) (9.9) (342)
Personnel expenses (156) (13.5) (181)
Other administrative expenses (141) (5.5) (149)
Depreciation (11) (10.4) (12)Operating income 160 7.0 149Impairment on financial assets (net) 23 (24.3) 30
Provisions (net) and other gains (losses) (6) n.s. 23Profit/(loss) before tax 177 (12.9) 203Income tax (52) 0.3 (52)Profit/(loss) for the year 125 (17.4) 151Non-controlling interests - - -Net attributable profit 125 (17.4) 151
Balance sheets 31-12-17 ∆% 31-12-16Cash, cash balances at central banks and other demand deposits
877 (34.4) 1,337
Financial assets 990 (44.6) 1,787
Loans and receivables 15,009 (3.6) 15,574
of which loans and advances to customers 14,864 (3.0) 15,325
Inter-area positions - - -
Tangible assets 36 (6.3) 38
Other assets 352 (4.6) 369Total assets/liabilities and equity 17,265 (9.6) 19,106Financial liabilities held for trading and designated at fair value through profit or loss
45 (33.4) 67
Deposits from central banks and credit institutions
2,364 (11.5) 2,670
Deposits from customers 6,700 (28.7) 9,396
Debt certificates 354 12.4 315
Inter-area positions 5,643 17.0 4,822
Other liabilities 1,246 116.0 577
Economic capital allocated 913 (27.5) 1,259
Relevant business indicators 31-12-17 ∆% 31-12-16Loans and advances to customers (gross) (1) 15,261 (3.6) 15,835
Non-performing loans and contingent liabilities
556 (12.1) 633
Customer deposits under management (1) 6,660 (28.6) 9,322
Off-balance-sheet funds (2) 376 2.7 366
Risk-weighted assets 12,916 (17.4) 15,637
Efficiency ratio (%) 65.9 69.6
NPL ratio (%) 2.4 2.7
NPL coverage ratio (%) 74 84
Cost of risk (%) (0.16) (0.22)(1) Excluding repos.(2) Includes mutual funds, pension funds and other off-balance-sheet funds.

BuSInESS ArEAS2017 P. 56
Customer deposits under management were still strongly influenced by the environment of negative interest rates. With data as of December 2017 they fell by 28.6% year-on-year (down 15.6% in Europe and down 79.3% in Asia).
Regarding earnings, gross income declined 4.8% year-on-year, with the figures differing from geographic area: Rest of Europe showed growth of 12.1%, while Asia posted a
decline of 62.3%, mainly due to the payment of the CNCB dividend in 2016. Operating expenses continue to moderate (down 9.9% year-on-year), mainly due to control of all cost items (personnel, other administrative expenses and depreciation). Finally, there was also a decline in impairment losses on financial assets, as a result of which this geography contributed a cumulative net attributable profit in 2017 of €125m, 17.4% less than in 2016.
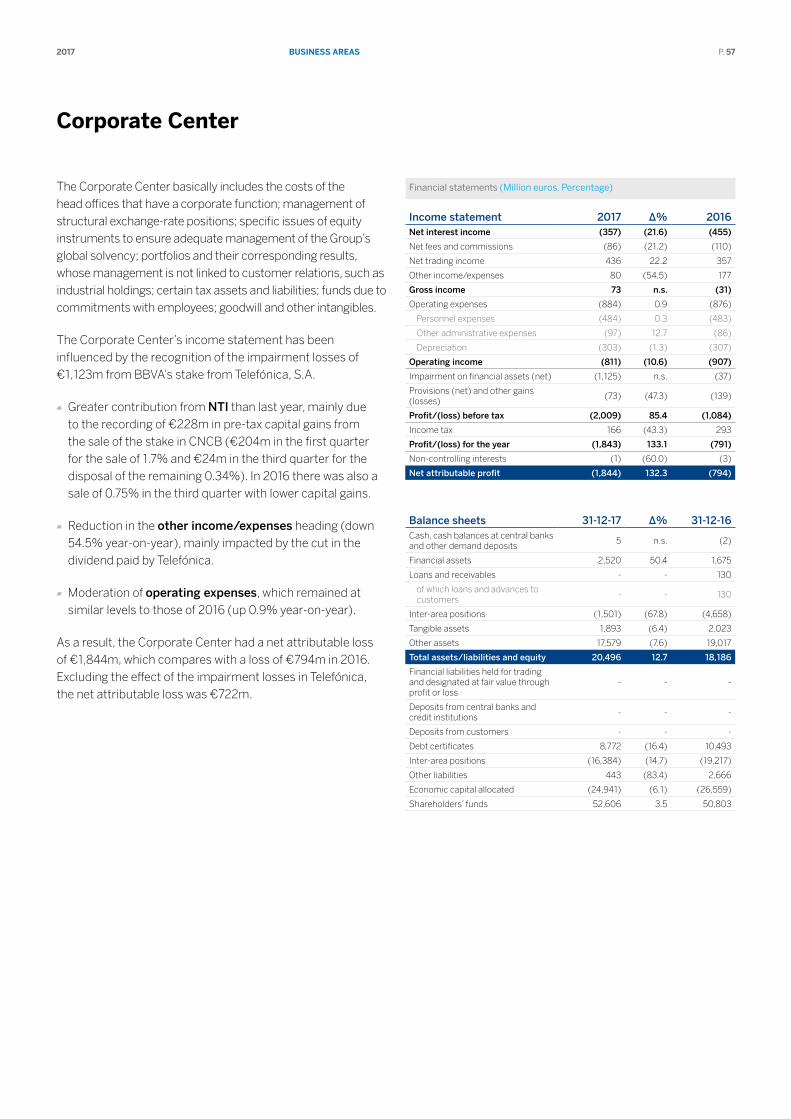
BuSInESS ArEAS2017 P. 57
corporate center
The Corporate Center basically includes the costs of the head offices that have a corporate function; management of structural exchange-rate positions; specific issues of equity instruments to ensure adequate management of the Group’s global solvency; portfolios and their corresponding results, whose management is not linked to customer relations, such as industrial holdings; certain tax assets and liabilities; funds due to commitments with employees; goodwill and other intangibles.
The Corporate Center’s income statement has been influenced by the recognition of the impairment losses of €1,123m from BBVA’s stake from Telefónica, S.A.
Greater contribution from NTI than last year, mainly due to the recording of €228m in pre-tax capital gains from the sale of the stake in CNCB (€204m in the first quarter for the sale of 1.7% and €24m in the third quarter for the disposal of the remaining 0.34%). In 2016 there was also a sale of 0.75% in the third quarter with lower capital gains.
Reduction in the other income/expenses heading (down 54.5% year-on-year), mainly impacted by the cut in the dividend paid by Telefónica.
Moderation of operating expenses, which remained at similar levels to those of 2016 (up 0.9% year-on-year).
As a result, the Corporate Center had a net attributable loss of €1,844m, which compares with a loss of €794m in 2016. Excluding the effect of the impairment losses in Telefónica, the net attributable loss was €722m.
Financial statements (Million euros. Percentage)
Income statement 2017 ∆% 2016Net interest income (357) (21.6) (455)
Net fees and commissions (86) (21.2) (110)
Net trading income 436 22.2 357
Other income/expenses 80 (54.5) 177
Gross income 73 n.s. (31)
Operating expenses (884) 0.9 (876)
Personnel expenses (484) 0.3 (483)
Other administrative expenses (97) 12.7 (86)
Depreciation (303) (1.3) (307)
Operating income (811) (10.6) (907)
Impairment on financial assets (net) (1,125) n.s. (37)
Provisions (net) and other gains (losses)
(73) (47.3) (139)
Profit/(loss) before tax (2,009) 85.4 (1,084)
Income tax 166 (43.3) 293
Profit/(loss) for the year (1,843) 133.1 (791)
Non-controlling interests (1) (60.0) (3)
Net attributable profit (1,844) 132.3 (794)
Balance sheets 31-12-17 ∆% 31-12-16Cash, cash balances at central banks and other demand deposits
5 n.s. (2)
Financial assets 2,520 50.4 1,675
Loans and receivables - - 130
of which loans and advances to customers
- - 130
Inter-area positions (1,501) (67.8) (4,658)
Tangible assets 1,893 (6.4) 2,023
Other assets 17,579 (7.6) 19,017
Total assets/liabilities and equity 20,496 12.7 18,186
Financial liabilities held for trading and designated at fair value through profit or loss
- - -
Deposits from central banks and credit institutions
- - -
Deposits from customers - - -
Debt certificates 8,772 (16.4) 10,493
Inter-area positions (16,384) (14.7) (19,217)
Other liabilities 443 (83.4) 2,666
Economic capital allocated (24,941) (6.1) (26,559)
Shareholders’ funds 52,606 3.5 50,803
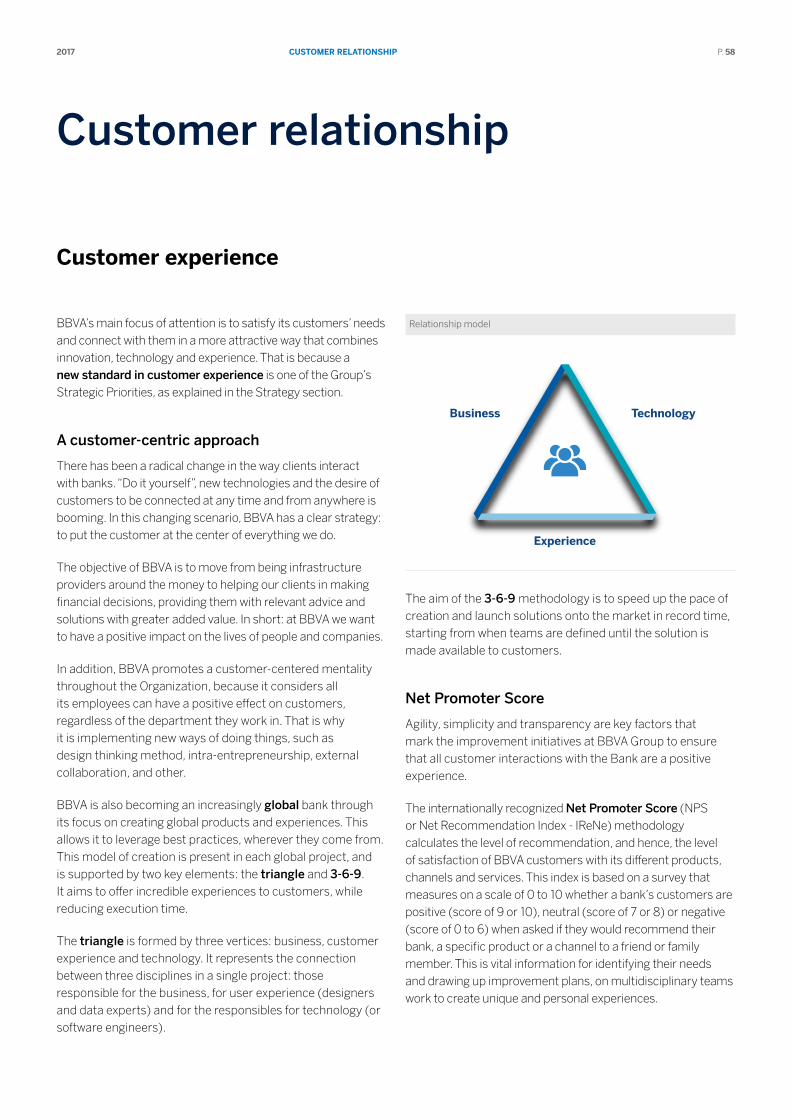
cuStomEr rElAtIonShIP2017 P. 58
Customer relationship
customer experience
BBVA’s main focus of attention is to satisfy its customers’ needs and connect with them in a more attractive way that combines innovation, technology and experience. That is because a new standard in customer experience is one of the Group’s Strategic Priorities, as explained in the Strategy section.
A customer-centric approach
There has been a radical change in the way clients interact with banks. “Do it yourself”, new technologies and the desire of customers to be connected at any time and from anywhere is booming. In this changing scenario, BBVA has a clear strategy: to put the customer at the center of everything we do.
The objective of BBVA is to move from being infrastructure providers around the money to helping our clients in making financial decisions, providing them with relevant advice and solutions with greater added value. In short: at BBVA we want to have a positive impact on the lives of people and companies.
In addition, BBVA promotes a customer-centered mentality throughout the Organization, because it considers all its employees can have a positive effect on customers, regardless of the department they work in. That is why it is implementing new ways of doing things, such as design thinking method, intra-entrepreneurship, external collaboration, and other.
BBVA is also becoming an increasingly global bank through its focus on creating global products and experiences. This allows it to leverage best practices, wherever they come from. This model of creation is present in each global project, and is supported by two key elements: the triangle and 3-6-9. It aims to offer incredible experiences to customers, while reducing execution time.
The triangle is formed by three vertices: business, customer experience and technology. It represents the connection between three disciplines in a single project: those responsible for the business, for user experience (designers and data experts) and for the responsibles for technology (or software engineers).
Relationship model
BBVA IN 2016 5. PrImAry StAKehoLDerS P.71
5. 2. The customer
5. 2. 1. customer experience
One of BBVA’s main Strategic Priorities is to provide “a new standard in customer experience” that stands out for its simplicity, transparency and swiftness; empowering customers while offering them personalized advice.
As mentioned in the section on Strategy, enriching customer experience is done through a customer-centric business model that offers a differential service with a very ambitious goal: to be leaders in customer satisfaction across our global footprint.
Further, as part of the organizational changes taking place within the Group, in July 2016 the customer Solutions area, responsible for the creation and development of new products, was restructured to adapt to our customers’ needs. The new area has four main tasks:
Grow and transform our business, redefining and shaping the Bank’s relationship with our customers.
Develop internal capabilities for creating new products and customer experiences.
Maintain innovation as a fundamental pillar of BBVA.
Launch and acquire new businesses that differ from BBVA’s usual activities.
A customer-centric approach
The way in which customers interact with their banks has changed radically. We are firmly in the “do-it-yourself” era, an era of new technologies, where customers want to be connected anytime, anywhere. To remain competitive and still be a key player in a changing environment, the Customer Solutions area is promoting a customer-centric mentality throughout the Organization. We want to put the customer at the heart of everything we do, in accordance with the following principles:
The transformation of the Group should be guided by our customers’ demand for unique and innovative experiences.
We are investing in capital and talent to create a future of opportunities for our customers.
We are seeking to take advantage of our relations with customers in a fair and transparent manner.
At BBVA we are all creators of experiences for our customers.
In order to achieve this, we rely mostly on the power of design thinking as the basis for designing our products and services. Design thinking is much more than making things look attractive; it involves mainly the ability of leading companies to put their customers at the center of their businesses. It combines social factors, demographic and technological trends and a deep understanding of consumer behavior. It starts with obtaining an understanding of our customers; knowing who they are and what drives their behavior. It helps us to define the problems we want to resolve and ensures that customers are always at the heart of any solution.
BBVA is also becoming an increasingly global bank through its focus on creating global products and experiences. This allows us to leverage our best practices, wherever they come from, to the benefit of our customers.
To do this we are reorganizing around a new concept known as the triangle. The Triangle has three vertices: business, customer experience and technology, where Customer Solutions would be at the center.
Business Technology
Experience
Our Customer Solutions team relies on design thinking and collaborative work to create an inspiring vision for the future. It is also responsible for project planning and execution. The focus on creativity and execution ensures us the possibility to make digital innovation available for our customers. This team was originally located in Spain, the United States and Mexico.
The aim of the 3-6-9 methodology is to speed up the pace of creation and launch solutions onto the market in record time, starting from when teams are defined until the solution is made available to customers.
Net Promoter Score
Agility, simplicity and transparency are key factors that mark the improvement initiatives at BBVA Group to ensure that all customer interactions with the Bank are a positive experience.
The internationally recognized Net Promoter Score (NPS or Net Recommendation Index - IReNe) methodology calculates the level of recommendation, and hence, the level of satisfaction of BBVA customers with its different products, channels and services. This index is based on a survey that measures on a scale of 0 to 10 whether a bank’s customers are positive (score of 9 or 10), neutral (score of 7 or 8) or negative (score of 0 to 6) when asked if they would recommend their bank, a specific product or a channel to a friend or family member. This is vital information for identifying their needs and drawing up improvement plans, on multidisciplinary teams work to create unique and personal experiences.
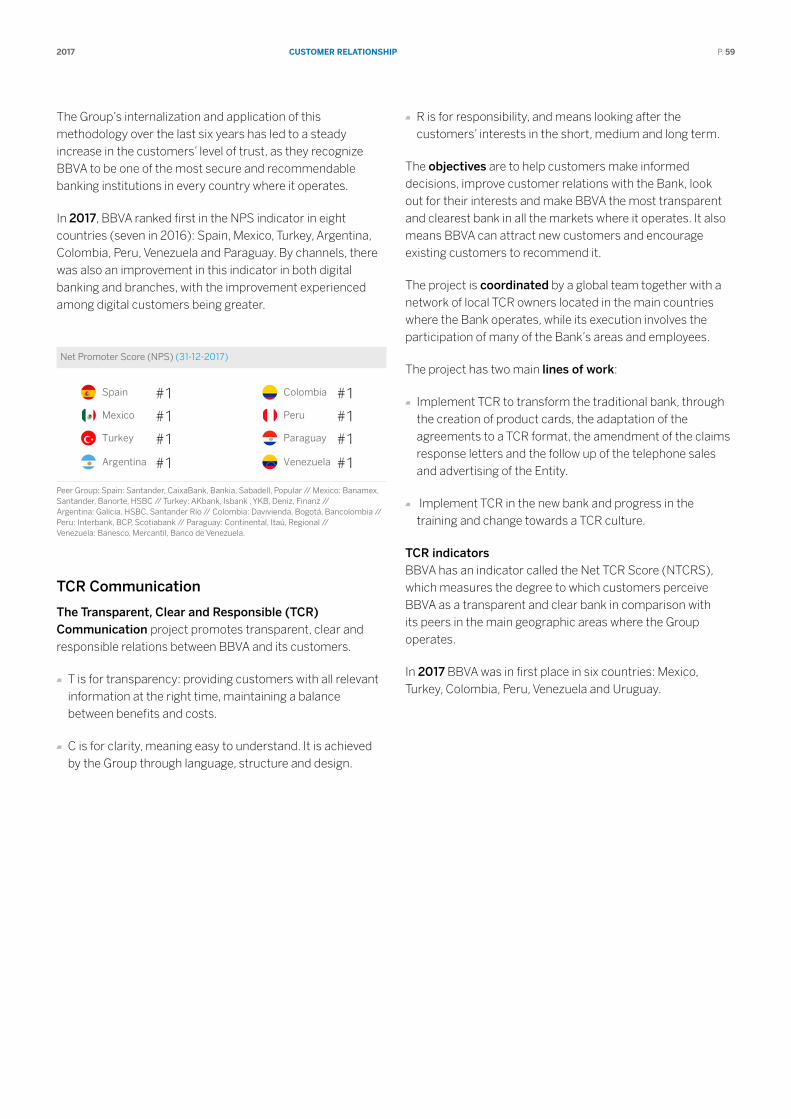
cuStomEr rElAtIonShIP2017 P. 59
The Group’s internalization and application of this methodology over the last six years has led to a steady increase in the customers’ level of trust, as they recognize BBVA to be one of the most secure and recommendable banking institutions in every country where it operates.
In 2017, BBVA ranked first in the NPS indicator in eight countries (seven in 2016): Spain, Mexico, Turkey, Argentina, Colombia, Peru, Venezuela and Paraguay. By channels, there was also an improvement in this indicator in both digital banking and branches, with the improvement experienced among digital customers being greater.
Net Promoter Score (NPS) (31-12-2017)
#1
#1
#1
#1 #1
#1
#1
#1
Spain
Turkey
Mexico
Argentina Venezuela
Colombia
Paraguay
Peru
Peer Group: Spain: Santander, CaixaBank, Bankia, Sabadell, Popular // Mexico: Banamex, Santander, Banorte, HSBC // Turkey: AKbank, Isbank , YKB, Deniz, Finanz // Argentina: Galicia, HSBC, Santander Río // Colombia: Davivienda, Bogotá, Bancolombia // Peru: Interbank, BCP, Scotiabank // Paraguay: Continental, Itaú, Regional // Venezuela: Banesco, Mercantil, Banco de Venezuela.
TCR Communication
The Transparent, Clear and Responsible (TCR) Communication project promotes transparent, clear and responsible relations between BBVA and its customers.
T is for transparency: providing customers with all relevant information at the right time, maintaining a balance between benefits and costs.
C is for clarity, meaning easy to understand. It is achieved by the Group through language, structure and design.
R is for responsibility, and means looking after the customers’ interests in the short, medium and long term.
The objectives are to help customers make informed decisions, improve customer relations with the Bank, look out for their interests and make BBVA the most transparent and clearest bank in all the markets where it operates. It also means BBVA can attract new customers and encourage existing customers to recommend it.
The project is coordinated by a global team together with a network of local TCR owners located in the main countries where the Bank operates, while its execution involves the participation of many of the Bank’s areas and employees.
The project has two main lines of work:
Implement TCR to transform the traditional bank, through the creation of product cards, the adaptation of the agreements to a TCR format, the amendment of the claims response letters and the follow up of the telephone sales and advertising of the Entity.
Implement TCR in the new bank and progress in the training and change towards a TCR culture.
TCR indicators BBVA has an indicator called the Net TCR Score (NTCRS), which measures the degree to which customers perceive BBVA as a transparent and clear bank in comparison with its peers in the main geographic areas where the Group operates.
In 2017 BBVA was in first place in six countries: Mexico, Turkey, Colombia, Peru, Venezuela and Uruguay.
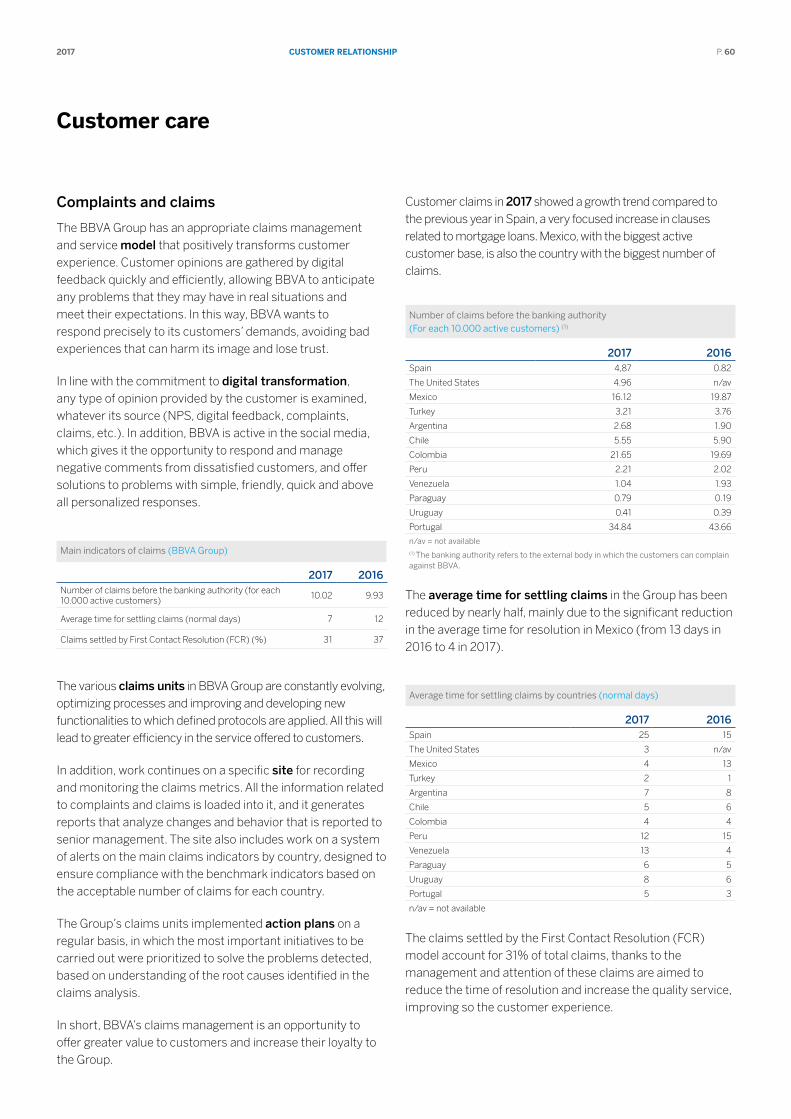
cuStomEr rElAtIonShIP2017 P. 60
customer care
Complaints and claims
The BBVA Group has an appropriate claims management and service model that positively transforms customer experience. Customer opinions are gathered by digital feedback quickly and efficiently, allowing BBVA to anticipate any problems that they may have in real situations and meet their expectations. In this way, BBVA wants to respond precisely to its customers’ demands, avoiding bad experiences that can harm its image and lose trust.
In line with the commitment to digital transformation, any type of opinion provided by the customer is examined, whatever its source (NPS, digital feedback, complaints, claims, etc.). In addition, BBVA is active in the social media, which gives it the opportunity to respond and manage negative comments from dissatisfied customers, and offer solutions to problems with simple, friendly, quick and above all personalized responses.
Main indicators of claims (BBVA Group)
2017 2016Number of claims before the banking authority (for each 10.000 active customers)
10.02 9.93
Average time for settling claims (normal days) 7 12
Claims settled by First Contact Resolution (FCR) (%) 31 37
The various claims units in BBVA Group are constantly evolving, optimizing processes and improving and developing new functionalities to which defined protocols are applied. All this will lead to greater efficiency in the service offered to customers.
In addition, work continues on a specific site for recording and monitoring the claims metrics. All the information related to complaints and claims is loaded into it, and it generates reports that analyze changes and behavior that is reported to senior management. The site also includes work on a system of alerts on the main claims indicators by country, designed to ensure compliance with the benchmark indicators based on the acceptable number of claims for each country.
The Group’s claims units implemented action plans on a regular basis, in which the most important initiatives to be carried out were prioritized to solve the problems detected, based on understanding of the root causes identified in the claims analysis.
In short, BBVA’s claims management is an opportunity to offer greater value to customers and increase their loyalty to the Group.
Customer claims in 2017 showed a growth trend compared to the previous year in Spain, a very focused increase in clauses related to mortgage loans. Mexico, with the biggest active customer base, is also the country with the biggest number of claims.
Number of claims before the banking authority (For each 10.000 active customers) (1)
2017 2016Spain 4,87 0.82
The United States 4.96 n/av
Mexico 16.12 19.87
Turkey 3.21 3.76
Argentina 2.68 1.90
Chile 5.55 5.90
Colombia 21.65 19.69
Peru 2.21 2.02
Venezuela 1.04 1.93
Paraguay 0.79 0.19
Uruguay 0.41 0.39
Portugal 34.84 43.66
n/av = not available(1) The banking authority refers to the external body in which the customers can complain against BBVA.
The average time for settling claims in the Group has been reduced by nearly half, mainly due to the significant reduction in the average time for resolution in Mexico (from 13 days in 2016 to 4 in 2017).
Average time for settling claims by countries (normal days)
2017 2016Spain 25 15
The United States 3 n/av
Mexico 4 13
Turkey 2 1
Argentina 7 8
Chile 5 6
Colombia 4 4
Peru 12 15
Venezuela 13 4
Paraguay 6 5
Uruguay 8 6
Portugal 5 3
n/av = not available
The claims settled by the First Contact Resolution (FCR) model account for 31% of total claims, thanks to the management and attention of these claims are aimed to reduce the time of resolution and increase the quality service, improving so the customer experience.
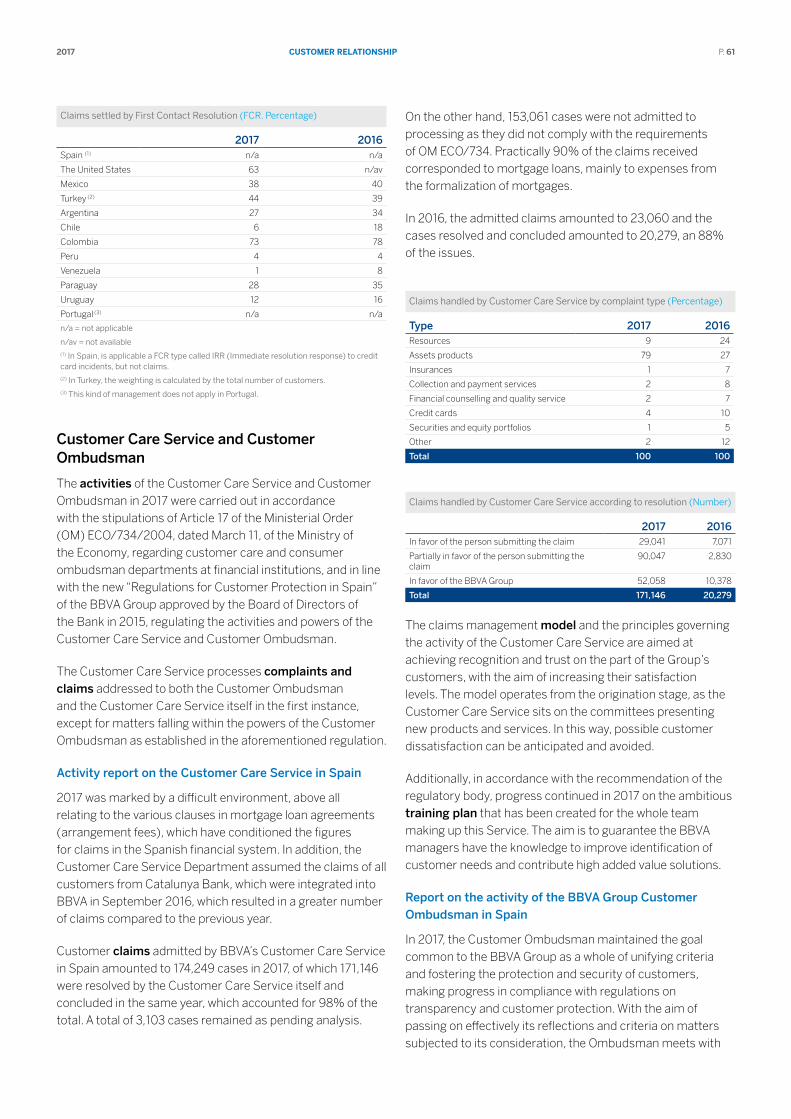
cuStomEr rElAtIonShIP2017 P. 61
Claims settled by First Contact Resolution (FCR. Percentage)
2017 2016Spain (1) n/a n/a
The United States 63 n/av
Mexico 38 40
Turkey (2) 44 39
Argentina 27 34
Chile 6 18
Colombia 73 78
Peru 4 4
Venezuela 1 8
Paraguay 28 35
Uruguay 12 16
Portugal (3) n/a n/a
n/a = not applicable
n/av = not available(1) In Spain, is applicable a FCR type called IRR (Immediate resolution response) to credit card incidents, but not claims.(2) In Turkey, the weighting is calculated by the total number of customers.(3) This kind of management does not apply in Portugal.
Customer Care Service and Customer Ombudsman
The activities of the Customer Care Service and Customer Ombudsman in 2017 were carried out in accordance with the stipulations of Article 17 of the Ministerial Order (OM) ECO/734/2004, dated March 11, of the Ministry of the Economy, regarding customer care and consumer ombudsman departments at financial institutions, and in line with the new “Regulations for Customer Protection in Spain” of the BBVA Group approved by the Board of Directors of the Bank in 2015, regulating the activities and powers of the Customer Care Service and Customer Ombudsman.
The Customer Care Service processes complaints and claims addressed to both the Customer Ombudsman and the Customer Care Service itself in the first instance, except for matters falling within the powers of the Customer Ombudsman as established in the aforementioned regulation.
Activity report on the Customer Care Service in Spain
2017 was marked by a difficult environment, above all relating to the various clauses in mortgage loan agreements (arrangement fees), which have conditioned the figures for claims in the Spanish financial system. In addition, the Customer Care Service Department assumed the claims of all customers from Catalunya Bank, which were integrated into BBVA in September 2016, which resulted in a greater number of claims compared to the previous year.
Customer claims admitted by BBVA’s Customer Care Service in Spain amounted to 174,249 cases in 2017, of which 171,146 were resolved by the Customer Care Service itself and concluded in the same year, which accounted for 98% of the total. A total of 3,103 cases remained as pending analysis.
On the other hand, 153,061 cases were not admitted to processing as they did not comply with the requirements of OM ECO/734. Practically 90% of the claims received corresponded to mortgage loans, mainly to expenses from the formalization of mortgages.
In 2016, the admitted claims amounted to 23,060 and the cases resolved and concluded amounted to 20,279, an 88% of the issues.
Claims handled by Customer Care Service by complaint type (Percentage)
Type 2017 2016Resources 9 24
Assets products 79 27
Insurances 1 7
Collection and payment services 2 8
Financial counselling and quality service 2 7
Credit cards 4 10
Securities and equity portfolios 1 5
Other 2 12
Total 100 100
Claims handled by Customer Care Service according to resolution (Number)
2017 2016In favor of the person submitting the claim 29,041 7,071
Partially in favor of the person submitting the claim
90,047 2,830
In favor of the BBVA Group 52,058 10,378
Total 171,146 20,279
The claims management model and the principles governing the activity of the Customer Care Service are aimed at achieving recognition and trust on the part of the Group’s customers, with the aim of increasing their satisfaction levels. The model operates from the origination stage, as the Customer Care Service sits on the committees presenting new products and services. In this way, possible customer dissatisfaction can be anticipated and avoided.
Additionally, in accordance with the recommendation of the regulatory body, progress continued in 2017 on the ambitious training plan that has been created for the whole team making up this Service. The aim is to guarantee the BBVA managers have the knowledge to improve identification of customer needs and contribute high added value solutions.
Report on the activity of the BBVA Group Customer Ombudsman in Spain
In 2017, the Customer Ombudsman maintained the goal common to the BBVA Group as a whole of unifying criteria and fostering the protection and security of customers, making progress in compliance with regulations on transparency and customer protection. With the aim of passing on effectively its reflections and criteria on matters subjected to its consideration, the Ombudsman meets with
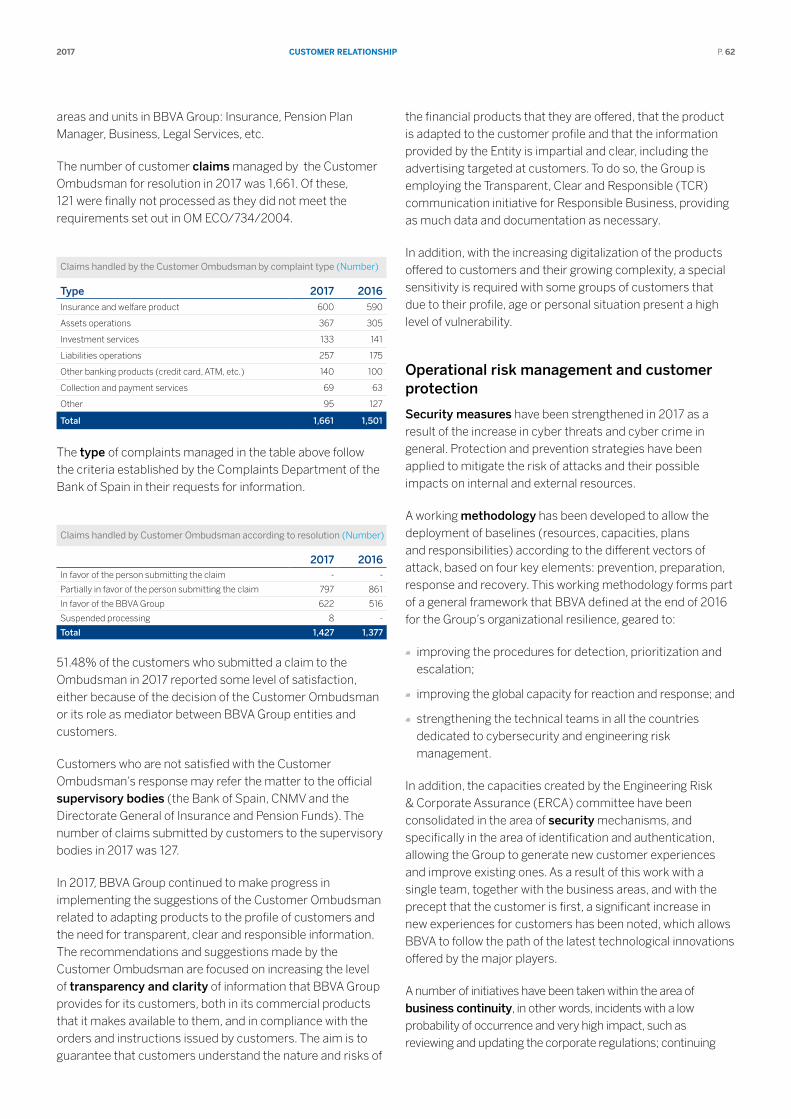
cuStomEr rElAtIonShIP2017 P. 62
areas and units in BBVA Group: Insurance, Pension Plan Manager, Business, Legal Services, etc.
The number of customer claims managed by the Customer Ombudsman for resolution in 2017 was 1,661. Of these, 121 were finally not processed as they did not meet the requirements set out in OM ECO/734/2004.
Claims handled by the Customer Ombudsman by complaint type (Number)
Type 2017 2016Insurance and welfare product 600 590
Assets operations 367 305
Investment services 133 141
Liabilities operations 257 175
Other banking products (credit card, ATM, etc.) 140 100
Collection and payment services 69 63
Other 95 127
Total 1,661 1,501
The type of complaints managed in the table above follow the criteria established by the Complaints Department of the Bank of Spain in their requests for information.
Claims handled by Customer Ombudsman according to resolution (Number)
2017 2016In favor of the person submitting the claim - -
Partially in favor of the person submitting the claim 797 861
In favor of the BBVA Group 622 516
Suspended processing 8 -
Total 1,427 1,377
51.48% of the customers who submitted a claim to the Ombudsman in 2017 reported some level of satisfaction, either because of the decision of the Customer Ombudsman or its role as mediator between BBVA Group entities and customers.
Customers who are not satisfied with the Customer Ombudsman’s response may refer the matter to the official supervisory bodies (the Bank of Spain, CNMV and the Directorate General of Insurance and Pension Funds). The number of claims submitted by customers to the supervisory bodies in 2017 was 127.
In 2017, BBVA Group continued to make progress in implementing the suggestions of the Customer Ombudsman related to adapting products to the profile of customers and the need for transparent, clear and responsible information. The recommendations and suggestions made by the Customer Ombudsman are focused on increasing the level of transparency and clarity of information that BBVA Group provides for its customers, both in its commercial products that it makes available to them, and in compliance with the orders and instructions issued by customers. The aim is to guarantee that customers understand the nature and risks of
the financial products that they are offered, that the product is adapted to the customer profile and that the information provided by the Entity is impartial and clear, including the advertising targeted at customers. To do so, the Group is employing the Transparent, Clear and Responsible (TCR) communication initiative for Responsible Business, providing as much data and documentation as necessary.
In addition, with the increasing digitalization of the products offered to customers and their growing complexity, a special sensitivity is required with some groups of customers that due to their profile, age or personal situation present a high level of vulnerability.
Operational risk management and customer protection
Security measures have been strengthened in 2017 as a result of the increase in cyber threats and cyber crime in general. Protection and prevention strategies have been applied to mitigate the risk of attacks and their possible impacts on internal and external resources.
A working methodology has been developed to allow the deployment of baselines (resources, capacities, plans and responsibilities) according to the different vectors of attack, based on four key elements: prevention, preparation, response and recovery. This working methodology forms part of a general framework that BBVA defined at the end of 2016 for the Group’s organizational resilience, geared to:
improving the procedures for detection, prioritization and escalation;
improving the global capacity for reaction and response; and
strengthening the technical teams in all the countries dedicated to cybersecurity and engineering risk management.
In addition, the capacities created by the Engineering Risk & Corporate Assurance (ERCA) committee have been consolidated in the area of security mechanisms, and specifically in the area of identification and authentication, allowing the Group to generate new customer experiences and improve existing ones. As a result of this work with a single team, together with the business areas, and with the precept that the customer is first, a significant increase in new experiences for customers has been noted, which allows BBVA to follow the path of the latest technological innovations offered by the major players.
A number of initiatives have been taken within the area of business continuity, in other words, incidents with a low probability of occurrence and very high impact, such as reviewing and updating the corporate regulations; continuing
cuStomEr rElAtIonShIP2017 P. 63
with the implementation of the business impact analysis, with the resulting update of the continuity plans; and reviewing technological dependency on critical processes, informing the corresponding continuity committees of their results so they can be aware and improve response where necessary, in a scenario of unavailability due to failures in the information systems.
During 2017 numerous business continuity strategies have been activated in BBVA Group, among them related to the earthquakes in Chile, and particularly Mexico; those affecting the United States as a result of hurricanes and storms: Harvey in Texas, Irma in Florida and Stella in New York; the problems of social conflict in Venezuela; serious flooding in the north of Peru; and the torrential rains in the area of Mocoa, Colombia.
As regards personal data protection, there has been much work done in 2017 to implement the General Data Protection Regulation in BBVA Group, which will enter into force in 2018. Moreover, in compliance with one of the new requirements under the aforementioned Regulation, a Data Protection Officer for the BBVA Group was appointed.
With respect to the personal data security measures, and in line with the above, a supplementary organizational project was implemented to review and update all functions, processes, methodologies, classification models, controls, incident management, etc. and ensure they are adapted to the new Regulation.
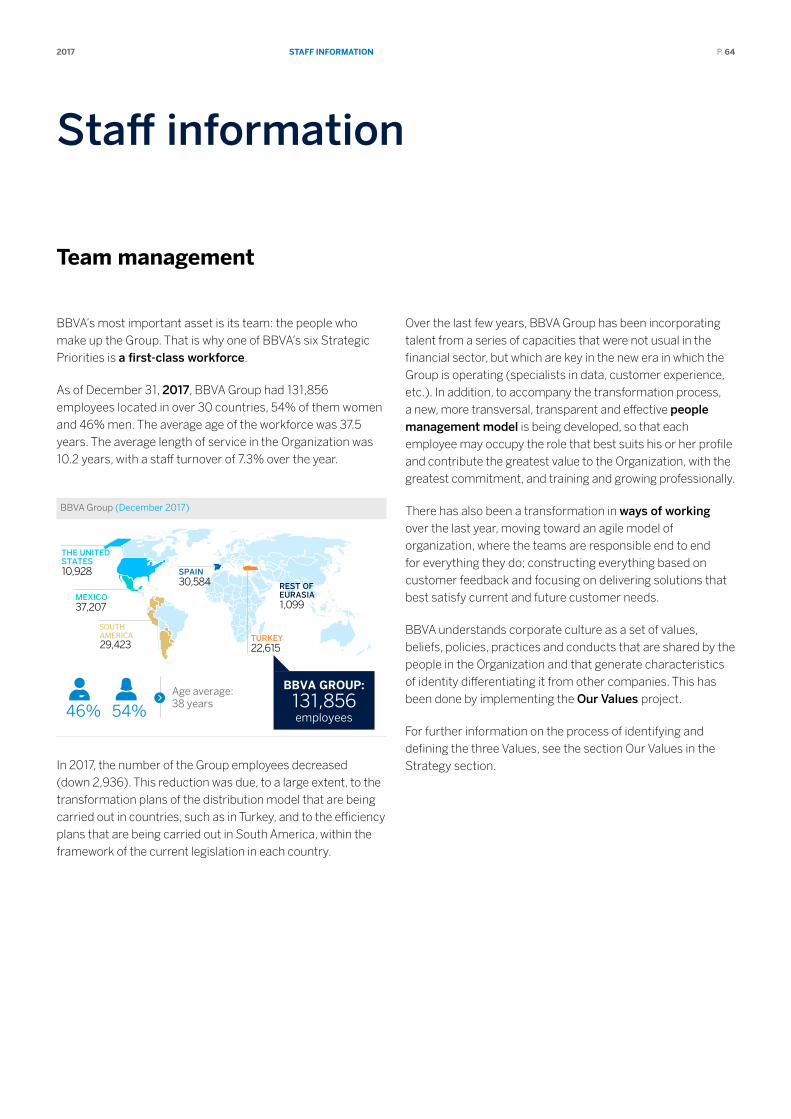
StAff InformAtIon2017 P. 64
Staff information
team management
BBVA’s most important asset is its team: the people who make up the Group. That is why one of BBVA’s six Strategic Priorities is a first-class workforce.
As of December 31, 2017, BBVA Group had 131,856 employees located in over 30 countries, 54% of them women and 46% men. The average age of the workforce was 37.5 years. The average length of service in the Organization was 10.2 years, with a staff turnover of 7.3% over the year.
BBVA Group (December 2017)
Age average: 38 years 46%
BBVA GROUP: 131,856 employees
THE UNITED STATES 10,928
MEXICO 37,207
SPAIN 30,584
TURKEY 22,615
SOUTH AMERICA 29,423
REST OF EURASIA 1,099
54%
In 2017, the number of the Group employees decreased (down 2,936). This reduction was due, to a large extent, to the transformation plans of the distribution model that are being carried out in countries, such as in Turkey, and to the efficiency plans that are being carried out in South America, within the framework of the current legislation in each country.
Over the last few years, BBVA Group has been incorporating talent from a series of capacities that were not usual in the financial sector, but which are key in the new era in which the Group is operating (specialists in data, customer experience, etc.). In addition, to accompany the transformation process, a new, more transversal, transparent and effective people management model is being developed, so that each employee may occupy the role that best suits his or her profile and contribute the greatest value to the Organization, with the greatest commitment, and training and growing professionally.
There has also been a transformation in ways of working over the last year, moving toward an agile model of organization, where the teams are responsible end to end for everything they do; constructing everything based on customer feedback and focusing on delivering solutions that best satisfy current and future customer needs.
BBVA understands corporate culture as a set of values, beliefs, policies, practices and conducts that are shared by the people in the Organization and that generate characteristics of identity differentiating it from other companies. This has been done by implementing the Our Values project.
For further information on the process of identifying and defining the three Values, see the section Our Values in the Strategy section.
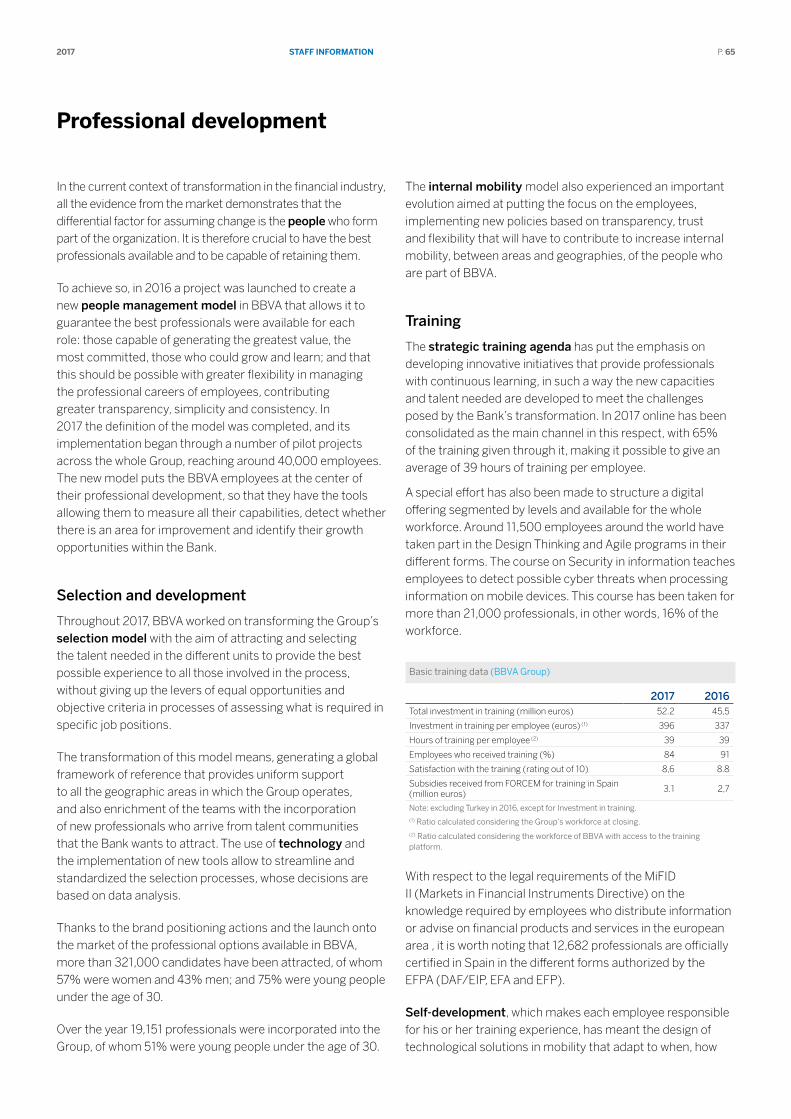
StAff InformAtIon2017 P. 65
Professional development
In the current context of transformation in the financial industry, all the evidence from the market demonstrates that the differential factor for assuming change is the people who form part of the organization. It is therefore crucial to have the best professionals available and to be capable of retaining them.
To achieve so, in 2016 a project was launched to create a new people management model in BBVA that allows it to guarantee the best professionals were available for each role: those capable of generating the greatest value, the most committed, those who could grow and learn; and that this should be possible with greater flexibility in managing the professional careers of employees, contributing greater transparency, simplicity and consistency. In 2017 the definition of the model was completed, and its implementation began through a number of pilot projects across the whole Group, reaching around 40,000 employees. The new model puts the BBVA employees at the center of their professional development, so that they have the tools allowing them to measure all their capabilities, detect whether there is an area for improvement and identify their growth opportunities within the Bank.
Selection and development
Throughout 2017, BBVA worked on transforming the Group’s selection model with the aim of attracting and selecting the talent needed in the different units to provide the best possible experience to all those involved in the process, without giving up the levers of equal opportunities and objective criteria in processes of assessing what is required in specific job positions.
The transformation of this model means, generating a global framework of reference that provides uniform support to all the geographic areas in which the Group operates, and also enrichment of the teams with the incorporation of new professionals who arrive from talent communities that the Bank wants to attract. The use of technology and the implementation of new tools allow to streamline and standardized the selection processes, whose decisions are based on data analysis.
Thanks to the brand positioning actions and the launch onto the market of the professional options available in BBVA, more than 321,000 candidates have been attracted, of whom 57% were women and 43% men; and 75% were young people under the age of 30.
Over the year 19,151 professionals were incorporated into the Group, of whom 51% were young people under the age of 30.
The internal mobility model also experienced an important evolution aimed at putting the focus on the employees, implementing new policies based on transparency, trust and flexibility that will have to contribute to increase internal mobility, between areas and geographies, of the people who are part of BBVA.
Training
The strategic training agenda has put the emphasis on developing innovative initiatives that provide professionals with continuous learning, in such a way the new capacities and talent needed are developed to meet the challenges posed by the Bank’s transformation. In 2017 online has been consolidated as the main channel in this respect, with 65% of the training given through it, making it possible to give an average of 39 hours of training per employee.
A special effort has also been made to structure a digital offering segmented by levels and available for the whole workforce. Around 11,500 employees around the world have taken part in the Design Thinking and Agile programs in their different forms. The course on Security in information teaches employees to detect possible cyber threats when processing information on mobile devices. This course has been taken for more than 21,000 professionals, in other words, 16% of the workforce.
Basic training data (BBVA Group)
2017 2016Total investment in training (million euros) 52.2 45,5
Investment in training per employee (euros) (1) 396 337
Hours of training per employee (2) 39 39
Employees who received training (%) 84 91
Satisfaction with the training (rating out of 10) 8,6 8.8
Subsidies received from FORCEM for training in Spain (million euros)
3.1 2,7
Note: excluding Turkey in 2016, except for Investment in training.(1) Ratio calculated considering the Group’s workforce at closing.(2) Ratio calculated considering the workforce of BBVA with access to the training platform.
With respect to the legal requirements of the MiFID II (Markets in Financial Instruments Directive) on the knowledge required by employees who distribute information or advise on financial products and services in the european area , it is worth noting that 12,682 professionals are officially certified in Spain in the different forms authorized by the EFPA (DAF/EIP, EFA and EFP).
Self-development, which makes each employee responsible for his or her training experience, has meant the design of technological solutions in mobility that adapt to when, how
StAff InformAtIon2017 P. 66
and where employees can choose to receive training. This has allowed specialized training resources to be made available openly to all, as a result of integration with external digital content platforms, thus accounting for more than 76,000 training hours.
Diversity and inclusion
BBVA is committed to diversity in its workforce as one of the key elements to attract and retain the brightest talent and offer the best possible service to its customers. This diversity, understood in the broadest sense, includes not only gender diversity but also generational, experiential, racial, ethnic and geographic diversity (among others).
In terms of gender diversity, women account for 54% of the Group’s workforce. Women are in 48% of management positions, 31% of technology and engineering and 58% of the business and profit generating jobs.
To give greater external and internal visibility to women who are key in their areas of responsibility, as well as providing
incentives and supporting local initiatives in favor of gender equality, the initiative Women@BBVA was launched in 2017. It has given the chance to get to know BBVA professionals whose career paths have made them models both inside and outside the bank. A series of interviews sets out their main professional challenges, their leadership style, what characteristics they value most in their colleagues and why BBVA is an excellent place to develop their professional aspirations.
Meanwhile, BBVA continues to demonstrate its commitment to ensure the labor integration of people with different capabilities through the Plan Integra, which was conceived with the belief that employment is an essential pillar in achieving equal opportunity for everyone.
Progress is also being made on making the branches of the different banks making up the Group more accessible. The corporate headquarters of BBVA in Madrid, BBVA Bancomer in Mexico, BBVA Francés in Argentina and BBVA Chile are all accessible.
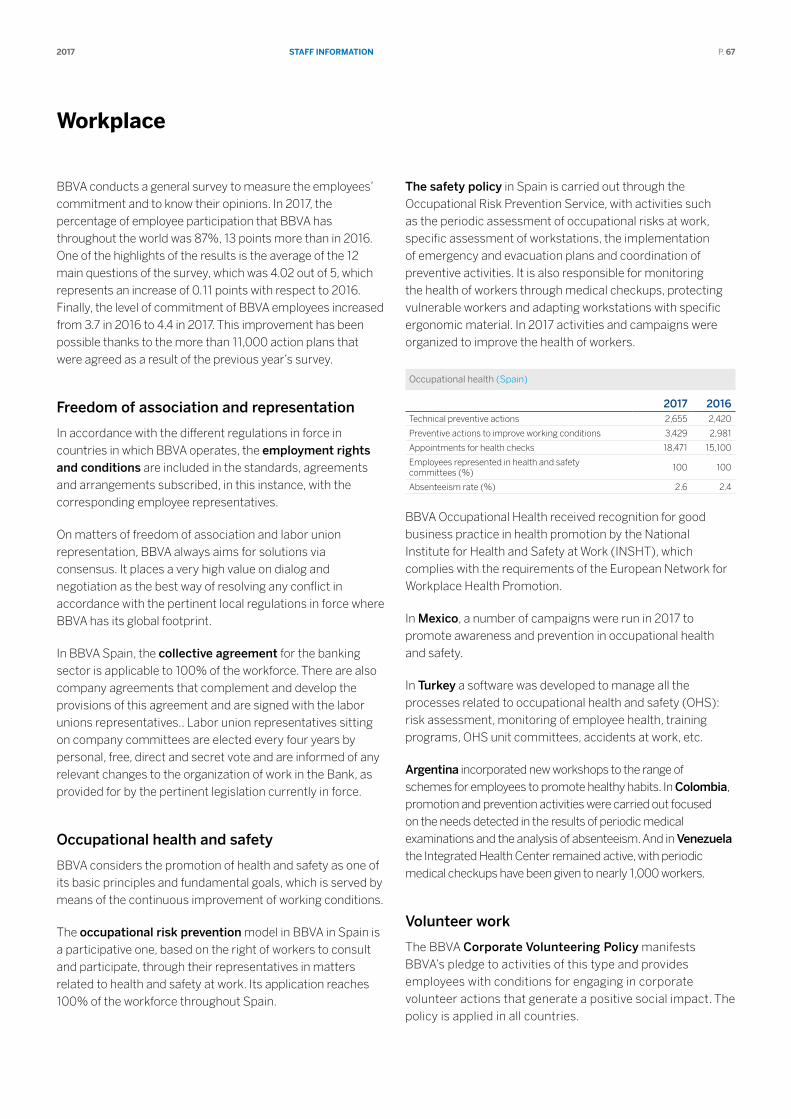
StAff InformAtIon2017 P. 67
Workplace
BBVA conducts a general survey to measure the employees’ commitment and to know their opinions. In 2017, the percentage of employee participation that BBVA has throughout the world was 87%, 13 points more than in 2016.One of the highlights of the results is the average of the 12 main questions of the survey, which was 4.02 out of 5, which represents an increase of 0.11 points with respect to 2016. Finally, the level of commitment of BBVA employees increased from 3.7 in 2016 to 4.4 in 2017. This improvement has been possible thanks to the more than 11,000 action plans that were agreed as a result of the previous year’s survey.
Freedom of association and representation
In accordance with the different regulations in force in countries in which BBVA operates, the employment rights and conditions are included in the standards, agreements and arrangements subscribed, in this instance, with the corresponding employee representatives.
On matters of freedom of association and labor union representation, BBVA always aims for solutions via consensus. It places a very high value on dialog and negotiation as the best way of resolving any conflict in accordance with the pertinent local regulations in force where BBVA has its global footprint.
In BBVA Spain, the collective agreement for the banking sector is applicable to 100% of the workforce. There are also company agreements that complement and develop the provisions of this agreement and are signed with the labor unions representatives.. Labor union representatives sitting on company committees are elected every four years by personal, free, direct and secret vote and are informed of any relevant changes to the organization of work in the Bank, as provided for by the pertinent legislation currently in force.
Occupational health and safety
BBVA considers the promotion of health and safety as one of its basic principles and fundamental goals, which is served by means of the continuous improvement of working conditions.
The occupational risk prevention model in BBVA in Spain is a participative one, based on the right of workers to consult and participate, through their representatives in matters related to health and safety at work. Its application reaches 100% of the workforce throughout Spain.
The safety policy in Spain is carried out through the Occupational Risk Prevention Service, with activities such as the periodic assessment of occupational risks at work, specific assessment of workstations, the implementation of emergency and evacuation plans and coordination of preventive activities. It is also responsible for monitoring the health of workers through medical checkups, protecting vulnerable workers and adapting workstations with specific ergonomic material. In 2017 activities and campaigns were organized to improve the health of workers.
Occupational health (Spain)
2017 2016Technical preventive actions 2,655 2,420
Preventive actions to improve working conditions 3,429 2,981
Appointments for health checks 18,471 15,100
Employees represented in health and safety committees (%)
100 100
Absenteeism rate (%) 2.6 2.4
BBVA Occupational Health received recognition for good business practice in health promotion by the National Institute for Health and Safety at Work (INSHT), which complies with the requirements of the European Network for Workplace Health Promotion.
In Mexico, a number of campaigns were run in 2017 to promote awareness and prevention in occupational health and safety.
In Turkey a software was developed to manage all the processes related to occupational health and safety (OHS): risk assessment, monitoring of employee health, training programs, OHS unit committees, accidents at work, etc.
Argentina incorporated new workshops to the range of schemes for employees to promote healthy habits. In Colombia, promotion and prevention activities were carried out focused on the needs detected in the results of periodic medical examinations and the analysis of absenteeism. And in Venezuela the Integrated Health Center remained active, with periodic medical checkups have been given to nearly 1,000 workers.
Volunteer work
The BBVA Corporate Volunteering Policy manifests BBVA’s pledge to activities of this type and provides employees with conditions for engaging in corporate volunteer actions that generate a positive social impact. The policy is applied in all countries.

StAff InformAtIon2017 P. 68
The activities of corporate volunteering enhance the professional development of employees, channeling their spirit of solidarity, and allowing them to make a personal contribution of their time and knowledge to provide help for people who need it most. This improves self-esteem, increases the sense of pride in belonging to the company and thus has an effect on talent attraction and retention. It also generates a positive impact at the level of corporate social responsibility of the company.
In 2017, nearly 8,000 employees took part in volunteering actions. These corporate volunteering activities are designed to boost initiatives arising from the employees themselves or coordinated by BBVA, in connection with education, primarily to boost financial education and thus support the strategic lines set out in the responsible banking model.

EthIcAl BEhAVIour 2017 P. 69
Ethical behaviour
compliance system
The Group’s compliance system constitutes one of the bases upon which BBVA consolidates its institutional pledge to conduct all operations and businesses in accordance with strict codes of ethical conduct.
A basic element in BBVA’s compliance system is the Code of Conduct, updated in 2015 and available on BBVA’s corporate website (bbva.com).
In line with the principles set by the Bank for International Settlements (BIS) and the reference regulations in this area, the Compliance Unit continues to organize its activity around the development and implementation of policies and procedures; communication and training; and the identification, assessment and mitigation of potential compliance risks, understood as those that affect the following issues:
Prevention of money laundering and terrorist financing (PML&TF).
Conduct with customers.
Conduct on securities markets.
Dealing with conflicts of interest.
Prevention of corruption and bribery.
The model of compliance risk assessment and management associated with these matters is global in nature. It is not a static concept; it evolves over time, strengthening those elements and pillars on which it is based and anticipating any new developments and initiatives that may arise in this field.
This model is built on the following basic pillars:
A suitable organizational structure with a clear assignment of roles and responsibilities throughout the organization.
Policies and procedures that clearly define positions and requirements to be applied.
Mitigation processes and controls applied to enforce these policies and procedures.
A technology infrastructure focused on monitoring and designed to guarantee the above objective.
Communication, training systems and policies implemented to raise employee awareness of the applicable requirements.
Metrics and indicators that allow the supervision of the global model implementation.
Independent periodic review of effective model implementation.
During 2017 the documentation and management of the model continued to be improved through a set of technological tools and improvements to the internal processes in the different countries. With respect to the digital transformation activities, it should be noted that during 2017 the supervision and advice governance teams that operate from Compliance Units were also strengthened. In addition, with the aim of the new European data protection regulations, during 2017 the activities and programs related to personal data protection developed by the Compliance Unit began to be integrated within BBVA’s Legal Services function, in which the position of data protection officer (DPO) was created.
Prevention of money laundering and terrorist activity financing
Prevention of money laundering and terrorist financing (hereinafter PML&TF) constitutes above all an ever-present objective that BBVA Group associates with its pledge to make improvements in the different communities in which it operates.
For BBVA, ensuring that its products and services are not used for illegal purposes likewise constitutes an essential requirement for safeguarding its corporate integrity, and thereby one of its main assets, namely, the trust of the people and institutions it deals with on a day-to-day basis (customers, employees, shareholders, suppliers, etc.) in the different jurisdictions where it operates.
To achieve the above objective, as a global financial group with branches and subsidiaries that operate in numerous countries, BBVA adopted a corporate model for managing the risk associated with PMN&TF. This model is applicable to
EthIcAl BEhAVIour 2017 P. 70
all of the entities forming part of BBVA Group within the scope of PML&TF and not only takes into account regulations on prevention of money laundering in the jurisdictions in which BBVA operates, but also incorporates the best practices in the international financial industry in this regard, as well as the recommendations issued by international institutions such as the FATF (Financial Action Task Force). This management model is constantly evolving. In particular, risk analysis ensures that controls can be tightened and any additional mitigating measures that may be required to enhance the model can be implemented.
The risk management model of PLD&TF is subject to continuous independent review. Pursuant to Spanish regulations, an independent expert annually audits the BBVA Group matrix. This review is complemented by internal and external audits carried out by local supervisory bodies, both in Spain in other jurisdictions.
During 2017, BBVA continued to deploy the new monitoring tool, in Spain, Turkey and Mexico. The Group also began to apply new technologies to enhance PML&TF (for example, identification of customers through videoconference using facial recognition techniques). It carries out ongoing analysis of opportunities for applying new technologies (machine learning, artificial intelligence, etc.) to strengthen both the capacities to detect suspicious activities of the different entities making up BBVA and the efficiency of the PML&TF processes.
In addition, the different entities in BBVA Group in various jurisdictions were selected by local authorities to participate in a mutual review process carried out by FATF-GAFI.
Also worth noting BBVA’s collaboration with the different governmental bodies and international organizations in this field.
In the area of training related to PML&TF, each of the BBVA Group entities has an annual training plan for all its employees. T.
Conduct with customers
BBVA’s Code of Conduct places the customers at the center of its activities, with the aim of establishing lasting relations based on mutual confidence and the contribution of value.
To achieve this objective, BBVA has implemented policies and procedures to get to know its customers better, with the aim of being able to offer them products and services in line with their financial needs, as well as providing them with clear and accurate information, sufficiently in advance, on the risks of the products in which they invest. BBVA has also implemented processes geared to prevention, or where this is not possible, management of the possible conflicts of interest that may arise in the marketing of its products.
During 2017, the Compliance Unit focused its activity on adapting its rules and processes for the entry into force in 2018 of the new regulations on investor protection in the securities markets, such as the EU Markets in Financial Instruments Directive (MiFID II) and Regulation on Packaged Retail and Insurance-Based Investment Products (PRIIPs). During the year work also began to adapt to the European Union directives on distribution of insurance and real-estate credit.
Also of note is progress in the implementation of a global model of customer compliance that aims to establish a minimum framework of rules of conduct to respect in relation to customers, applicable in all jurisdictions and in line with the principles of BBVA Group’s Code of Conduct.
In addition, in 2017 the Compliance Unit carried out training courses for employees in its territorial units and its network of agents to achieve a better level of knowledge of the rules of conduct applicable to the customer products with particular focus on retail customers. Within the work for adapting to the new MiFID II Directive on knowledge and competence of the personnel that offers information or advice, BBVA S.A. has established a program of training and accreditation of the knowledge that the personnel must have to inform or advise on financial instruments.
Conduct on securities markets
Integrity in market activity is one of the commitments of BBVA’s Code of Conduct to the values making up the corporate culture of BBVA Group. For this purpose it establishes the general guidelines for action designed to preserve the integrity of the markets, which include standards and principles geared to the prevention of market abuse and guaranteeing their transparency and free competition.
The Policy for Conduct in the Securities Markets includes the principles and general criteria for action designed to uphold BBVA’s integrity in the markets. Specifically, this Policy contains the minimum procedural guidelines regarding the treatment of privileged information, prevention of price manipulation, management of potential conflicts of interest and own account trading by employees.
It is worth noting in this respect that in 2017 the Policy and the Internal Regulation on Conduct in Securities Markets was updated, incorporating the regulatory changes derived from the Market Abuse Regulation, as well as best practices in the industry. As well as this, during the year the capacities of processes and tools for the detection of suspicious operations initially implemented in 2016 continued to be enhanced. There was also stronger compliance with the U.S. Dodd-Frank Act in terms of BBVA’s condition of swap dealer, with the development of a General Swap Dealer Policy that covers all the aspects of the Act.
EthIcAl BEhAVIour 2017 P. 71
From the point of view of prevention of market abuse, and as an additional measure for strengthening the body of policies and procedures covering this matter, the training of employees continued to be one of the unit’s priorities. In 2017 training actions were implemented for the areas and professionals with greatest exposure to market activity, including courses on privileged information for sales and market analysis teams in Corporate & Investment Banking and on market manipulation for trading and sales teams specializing in currency trading.
Other standards of conduct
The Code of Conduct, together with other internal policies and rules, develop the aspects related with the prevention of money laundering and terrorist financing, commitments with respect to politically exposed persons and those relating to conduct in business.
One of the main mechanisms for managing conduct risk in the Group is its whistleblowing channels. As set out in the Code of Conduct, BBVA employees have the obligation not to tolerate any conduct that is contrary to the Code, or any conduct in the performance of their professional duties that may harm the reputation or good name of BBVA. This whistleblowing channel is a means for enabling employees to report any breaches they observe or are notified by their collaborators, customers, suppliers or colleagues. The channel is available 24/7 and is also open to the Group’s suppliers. The reports are processed diligently and promptly. They are checked and measures are taken to resolve any issues. The information is analyzed in an objective, impartial and confidential manner.
The work carried out in 2017 included ongoing advice on applying the Code of Conduct. In particular, individual written and phone queries were responded to in the Group. Basically, they focused on potential conflicts of interest in matters such as managing personal assets or engaging in professional activities. During the year, BBVA continued its work on communication and dissemination of the new Code of Conduct, as well as training related to its contents.
In addition, since the introduction in Spain of the new regulations on the criminal liability of legal entities, BBVA has been operating in accordance with the legislation in force by establishing effective systems of supervision and control geared to preventing employees from committing crimes. This has been done through the establishment of a specific model of criminal prevention implemented in all the companies controlled by BBVA S.A. in Spain.
Among the possible crimes included in the crime prevention model are those related to corruption and bribery, as there are a number of risks that could arise in this respect in an entity of the nature of BBVA. Among these risks are those
related to the following activities:
Acceptance or delivery of gifts or personal benefits and invitations to events, or similar.
Payments for facilitating activity.
Political contributions.
Donations.
Sponsorship activities.
Handling of corporate and travel expenses.
Hiring of employees.
Contracting of suppliers, agents or intermediaries.
Mergers, acquisitions or joint ventures.
Accounting and registration of transactions.
To regulate the identification and management of risks, BBVA has a body of internal regulations made up of principles, policies and other internal arrangements, including:
Principles:
Principles applicable to the disinvestment processes for BBVA Group goods or services in favor of Group employees.
Principles to be applied to those involved in BBVA’s procurement process.
Policies:
Policy for the prevention and management of conflicts of interest in BBVA.
Responsible procurement policy.
Policy of events and acceptance of gifts related to sporting events of relevance.
Corporate travel policy.
The anti-corruption framework in BBVA is not only composed of this body of regulations, but also has a program that includes a risk map, as well as i) a set of mitigation measures aimed at reducing this risk; ii) procedures for action in case of situations of risk; iii) training programs and plans; and iv) indicators geared to the knowledge of the risk situation and its mitigation and control framework.
In addition to the above, BBVA has established other specific instruments for managing core commitments in each functional area. The most salient of these are:
The Compliance Statute.
Basic principles of risk management and the Risk Management Policy Manual.
Rules on dealing with individuals and entities of public importance in matters of financing and guarantees.

EthIcAl BEhAVIour 2017 P. 72
Within the general training program in this area, there is an online course that describes matters such as the basic principles related to the Group’s prevention framework on anti-corruption that reminds employees of BBVA’s zero tolerance commitment with respect to any form of corruption or bribery in its business activities.
It is worth noting that in 2017 BBVA was the first financial institution to obtain an AENOR certificate accrediting that its system for managing criminal compliance is in accordance with UNE 19601:2017 Standard published in May 2017.
Other basic commitments acquired by the Group are:
Rules of Conduct in Defense.
Environmental Policy.
Responsible Procurement Policy.
Commitment to Human Rights.
EthIcAl BEhAVIour 2017 P. 73
commitment to human rights
BBVA has a commitment to human rights and work was performed to update it throughout 2017. This involved carrying out a due diligence process in all BBVA’s business and support areas across the Group’s whole footprint. This process has been carried out taking as a reference the guidelines on the Guiding Principles on Business and Human Rights, endorsed on June 16, 2011 by the United Nations Human Rights Council. It It has also been anchored in the BBVA’s Purpose: to bring the age of opportunity to everyone. The materiality analysis carried out by the Group among its stakeholders makes clear that the main issues they are concerned with are related to human rights. Combined with this, BBVA has wanted to mitigate any reputational risk related to human rights, and to respond to demands by consumers, investors, analysts and civil society on the role of companies in this highly significant issue.
The Guiding Principles mentioned above are based on three pillars:
The State duty to protect human rights;
The corporate responsibility to respect human rights;
The joint duty to find mechanisms that ensure remedy in the case of any abuse of human rights.
To comply with these Principles and with the responsibility to prevent, mitigate and remedy the potential impacts on human rights in all its areas of operation and all its businesses, BBVA has begun a process in which it has:
identified the potential impacts of its operations on human rights;
designed mechanisms within the Company to prevent and mitigate them;
set up adequate channels and procedures to ensure that in the case of human rights violations there are sufficient measures in place to ensure remedy for the people affected.
Based on an analysis of the different areas in the Group and a study of the corporate culture, the Bank’s processes, its policies and mechanisms for handling claims and complaints, the issues on which BBVA has room for maneuver have been identified. These issues have been prioritized and set out in an action plan.
The main responsibility for applying this commitment relies with each area and each employee in the Organization. They have the duty to know the issues within their area of responsibility that may imply a violation of human rights and apply the due diligence to avoid them. Employees are also
subject to the Bank’s Code of Conduct and each country’s legislation. The Responsible Banking area is in charged of the design, implementation and improvement of the commitment, as well as acting as a second line of defense for the rest of the areas; in this it shares duties with Legal Services and Regulatory Compliance.
In addition to this commitment to human rights, the Bank has a number of policies and regulations that help strengthen compliance, which include:
BBVA’s Code of Conduct, as mentioned above in the section on Compliance;
the Housing Policy in Spain;
the Responsible Procurement Policy;
the Equator Principles, which is developed in the section on Management of environmental and social impacts.
The Housing Policy in Spain
In Spain, the comprehensive plan to provide solutions to families in difficulties implemented by BBVA since the beginning of the crisis has been consolidated under BBVA’s Social Housing Policy, whose main aim is to help customers keep their homes.
This plan is divided into three core areas:
Offering solutions to all families with difficulties to pay their mortgage loans.
Ensuring that any family that is a BBVA customer and at risk of exclusion has a home and is not evicted.
Supporting families through employment programs that enable customers to regain their confidence and self-esteem.
In February 2012, BBVA decided to voluntarily adhere to the Code of Good Practices approved by the Government, which had the objective of granting benefits to families at risk of exclusion who had contracted a mortgage loan. With the approval of Royal Decree-Law (RDL) 27/2012, the Law 1/2013 and, finally, the RDL 1/2015 and the Law 9/2015, BBVA decided to proactively inform all its customers, engaged in a foreclosure process, of the existence of the above mentioned regulations and the extent of their effects, so that they could benefit from the advantages set out. A total of 2,676 homes are assigned to public entities.
BBVA is seeking at every refinancing option available in accordance with the customers’ ability to pay, in order to
EthIcAl BEhAVIour 2017 P. 74
allow them to keep their homes. The Group has done this for 60,900 customers so far. Any situation can be referred to the Committee for the Protection of Mortgage Debtors for review. It analyzes every case in which the customers or their families face the risk of exclusion without legal protection, and provides individual solutions in accordance with each family’s specific circumstances (refinancing, debt remission, dation in payment, rented social housing in the debtor’s own home or the Bank’s available homes, etc.).
In this context, since the beginning of the crisis, BBVA has agreed more than 16,500 dations in payment with its customers (including dations involving products such as mortgage loans, consumer finance, etc.).
Responsible Procurement Policy
BBVA aims to integrate ethical, social and environmental factors in the supply chain for which it is responsible. That is why in 2017 it has drafted an Ethical Code for Suppliers, which defines the minimum standards of behavior in ethical, social and environmental conduct that suppliers are expected to comply with when they provide products and services.
The Responsible Procurement Policy establishes that during the procurement process special attention should be paid to comply with the legal requirements applicable with respect to human rights, employment rights, rights of association and environmental rights by all those affected by this process, and to involve them in the Group’s efforts aimed at preventing corruption. Likewise, the aim is to ensure that the choice of suppliers is adapted to the internal rules in place at any time, and in particular aligned to the values of the Group’s Code of Conduct, based on respect for the law, commitment to integrity, competition, objectivity, transparency, value creation and confidentiality.
The Responsible Procurement Policy also establishes as one of its principles to “raise awareness in social accountability of staff and other stakeholders involved in the Group’s procurement process.”
SuStAInABlE fInAncE 2017 P. 75
Sustainable finance
Banks play a crucial role in the fight against climate change, thanks to their unique position in mobilizing capital through investment, loans and advisory functions. Although most banks have worked in recent years to mitigate the direct impacts of their activity, there are other very important ways they can contribute to this challenge: first, by providing innovative solutions to their customers to help them move to a low-carbon economy and by promoting sustainable finance; and second, by systematically integrating social and environmental risks into decision-making.
BBVA’s commitment to sustainable development is reflected in its Environmental policy , which is global in scope.
During 2017, BBVA has worked on its strategy on climate change and sustainable development. The strategy covers comprehensive management of the risks and opportunities deriving from the fight against climate change and the resolve to achieve the Sustainable Development Goals (SDGs).
This strategy is based on a threefold commitment to 2025:
First, a commitment to finance, which contributes to the mobilization of the capital needed to halt climate change and achieve the SDGs.
Second, a commitment to mitigate the social and environmental risks derived from the Bank’s activity, to minimize their potential direct and indirect negative impacts.
And finally, a commitment to engagement with all the stakeholders involved in the collective promotion of the role of the financial industry in sustainable development.
As of December 31, 2017, the accompanying Annual Financial Statements of the BBVA Group do not include any material item that would warrant inclusion in the environmental information document set forth in the Ministry of Justice Order JUS / 471/2017, of May 19, which approves the new models for the presentation in the Companies Registry of the financial statements of the subjects bound to its publication.
SuStAInABlE fInAncE 2017 P. 76
Sustainable financing
Sustainable bonds and loans
Sustainable bonds and loans are instruments used for channeling funds to finance our customers’ projects in sectors such as renewable energies, energy efficiency, waste management, water treatment and access to essential goods and services such as homes or inclusive finance.
BBVA has the knowledge and experience to provide its customers with comprehensive advice on sustainable financing solutions through both bonds and loans, and it is also playing a relevant role in the development of this market. Since 2014 BBVA is signatory of the green Bond Principles, a series of voluntary guidelines that establish the issuance transparency requirements and promote integrity in the development of the green bond market. In addition, since 2017, it has also formed part of the working group that is developing the Green Lending Principles, an initiative of the Loan Market Association adapted to the needs in the case of loans.
In bonds, the Bank has been very active in the green bond market in the Iberian Peninsula in 2017. It is a globally recognized institution, having advised, placed and structured green bonds for customers in a variety of sectors in Mexico, the United States and Europe in both local currency and euros and U.S. dollars.
On another note, green loans are beginning to take off in the market. In 2017, the Bank has been very active as structuring bank, with a total of ten operations.
Financing sustainable projects
BBVA has been supporting the renewable energy sector for years. Thus, in 2017, the Group financed projects of this type with a total installed capacity of more than 700 MW, for a total volume of €218m.
Among the highlighted operations of 2017 are the financing of seven wind farms in Portugal, two in Italy and Spain and one photovoltaic plant in Mexico. Moreover, in 2017 the Bank also financed social infrastructure projects for an amount of €333m.
Socially Responsible Investment
BBVA assumed its commitment to Socially Responsible Investment (SRI) in 2008 when it joined the United Nations Principles for Responsible Investment (PRI) through the employee pension plan and one of the Group’s major asset management companies, Gestión de Previsión y Pensiones.
The goal at the time was to start building BBVA’s own SRI model from the ground, with the initial implementation focused on employment pension funds. Nine years later, the Group continues to work on improving its model, making it more complete and solid every day.
During 2017, BBVA Asset Management (BBVA AM) continued to adapt to the market and changes in it, working to extend and improve the SRI solutions offered. Among them are the training solutions in place, such as events streamed and available via its website and the regular newsletters addressing SRI matters, which are also posted on the BBVA AM website; and in particular through personal meetings with its customers to address their specific concerns in this field.
BBVA AM’s SRI model has implemented the following strategies:
Integration of ESG criteria in the investment process.
Exclusion: Rules of Conduct in Defense.
ESG analysis of third-party funds.
Engagement and exercise of voting rights.
Financial inclusion
BBVA is aware that greater financial inclusion has a favorable impact on the welfare and sustained economic growth of countries. The fight against financial exclusion is therefore consistent with its ethical and social commitment, as well as its medium-term and long-term business objectives. For this purpose, the Group has developed a financial inclusion (FI) business model to cover the low-income population in emerging countries within its global footprint. This model is based on the development of a responsible business model that is sustainable in the long term, shifting from a model that is intensive in human capital and of limited scalability to a scalable strategy that is intensive in alternative and digital channels with a multi-product focus. In short, this model is based on:
the use of new digital technologies,
an increase in products and services offered through non-branch platforms,
innovative low-cost financial solutions designed for this segment.
At the end of 2017, BBVA had more than 8 million active customers in this segment.
SuStAInABlE fInAncE 2017 P. 77
management of environmental and social impacts
Social, environmental and reputational risks
As a financial institution, BBVA has an impact on the environment and society: directly through the consumption of natural resources and its relationship with stakeholders; and indirectly through its credit activity and the projects it finances.
These non-financial risks may affect the credit profile of borrowers or the projects financed by the Bank. To manage such risks, BBVA takes into account environmental, social and reputational aspects in its risk management, alongside traditional financial variables.
In 2017, BBVA worked with a number of areas involved in the development of new standards for the mining, energy, infrastructure and agricultural business sectors, and a new improved process of due diligence that can assess new operations, customers or products with criteria that are aligned with BBVA’s strategy of climate change and sustainable development.
1. Equator Principles
The energy, transport and social services infrastructures that boost economic development and create jobs can have an impact on the environment and society. BBVA is committed to managing the financing of these projects in order to avoid and reduce their negative impacts and boost their economic, social and environmental value.
All the decisions on project finance are based on the criterion of return adjusted to principles. Placing people at the core of the business implies dealing with stakeholder expectations and the social demand to fight against climate change and respect human rights.
In line with this commitment, BBVA adhered to the Equator Principles in 2004. Based on the International Finance Corporation’s (IFC) Policy and Performance Standards on Social and Environmental Sustainability and the World Bank’s Environmental, Health and Safety guidelines, the Equator Principles are a set of standards for managing environmental and social risks in project finance. These principles have set the benchmark for responsible finance.
During 2017, the Group contributed to their development and dissemination as a member of the working groups in which it participates and has been one of the eleven signatories to the letter sent to the Equator Principles Association, in which it urged measures to be taken to tighten the environmental and social due diligence requirements for project finance.
The Corporate & Investment Banking (CIB) Sustainable Finance and Reputational Risk team is responsible for analysis of the projects, representation of the Bank before its stakeholders, accountability to senior management, and the design and implementation of the management system, proposing the adoption of best practices and contributing toward training and communication on matters related to the Equator Principles.
The application of the Equator Principles in BBVA is integrated into the internal processes for structuring, admission and monitoring of transactions, and is subject to regular controls by the Internal Audit Department.
In 2017, BBVA took the decision to enhance its due diligence procedures associated with the financing of projects whose development affects indigenous communities. When this occurs, the free, prior and informed consent (FPIC) by these communities must be taken into consideration, regardless of the geographic location of the project. This means extending the current demands of the Equator Principles, which limits this requirement to countries classified as “non-designated”, leaving out the “designated” countries (those that are considered to have a robust legal system and an institutional capacity that provides sufficient guarantees of environmental protection and their people’s social rights). BBVA is one of the ten banks that in 2017 called on the rest of the banks adhering to the Equator Principles to support the adoption of amendments in this respect.
Details of the Equator Principles operations analyzed (BBVA Group)
2017 2016Number of operations (1) 22 32
Total Amount (millon euros) 7,069 6,863
Amount financed by BBVA (millon euros) 1,054 1,451
(1) Within the 22 analized operations, 9 are into Ecuator Principles Scope and the other 13 are analized voluntarily by BBVA under the same criteria.
2. Eco-rating
The Eco-rating tool is used to rate the risk portfolio of SMEs from an environmental point of view. This is done by assigning a level of credit risk to each customer in accordance with a combination of several factors such as location, polluting emissions, consumption of resources, potential to affect the environment and applicable legislation.
3. Reputational risk management
Since 2006, BBVA has had a methodology in place for identifying, evaluating and managing reputational risk. Through this methodology, the Bank regularly defines and
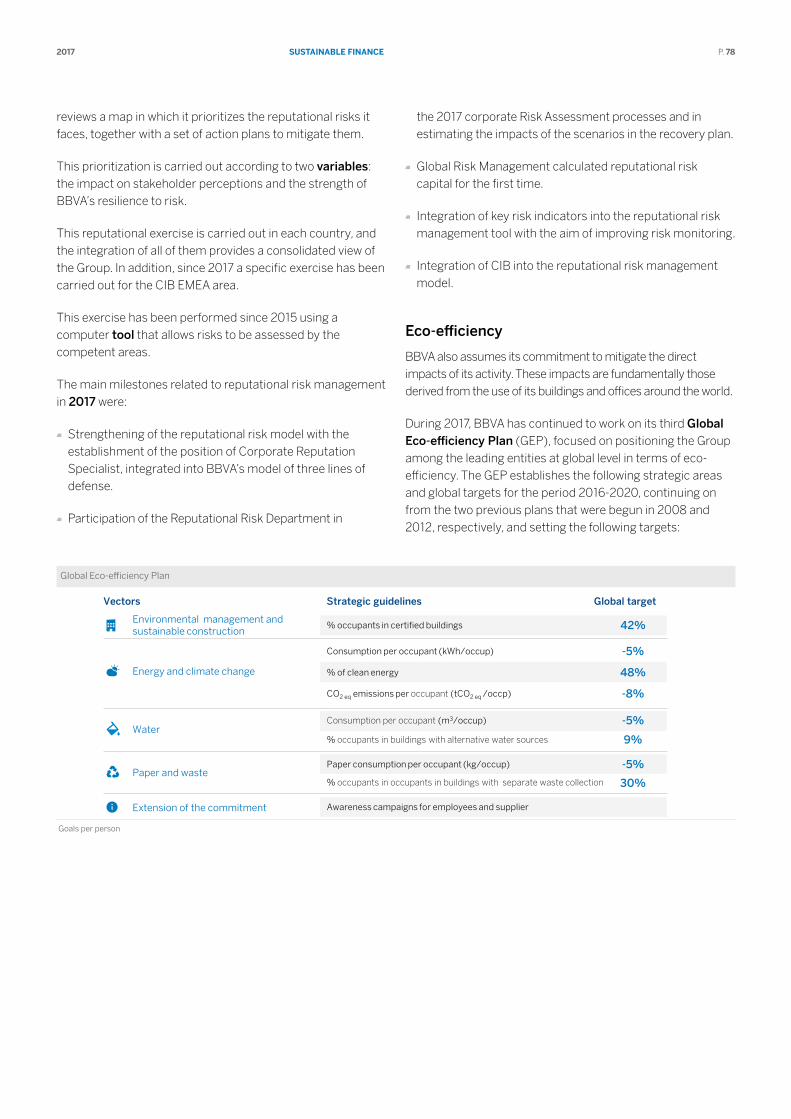
SuStAInABlE fInAncE 2017 P. 78
reviews a map in which it prioritizes the reputational risks it faces, together with a set of action plans to mitigate them.
This prioritization is carried out according to two variables: the impact on stakeholder perceptions and the strength of BBVA’s resilience to risk.
This reputational exercise is carried out in each country, and the integration of all of them provides a consolidated view of the Group. In addition, since 2017 a specific exercise has been carried out for the CIB EMEA area.
This exercise has been performed since 2015 using a computer tool that allows risks to be assessed by the competent areas.
The main milestones related to reputational risk management in 2017 were:
Strengthening of the reputational risk model with the establishment of the position of Corporate Reputation Specialist, integrated into BBVA’s model of three lines of defense.
Participation of the Reputational Risk Department in
the 2017 corporate Risk Assessment processes and in estimating the impacts of the scenarios in the recovery plan.
Global Risk Management calculated reputational risk capital for the first time.
Integration of key risk indicators into the reputational risk management tool with the aim of improving risk monitoring.
Integration of CIB into the reputational risk management model.
Eco-efficiency
BBVA also assumes its commitment to mitigate the direct impacts of its activity. These impacts are fundamentally those derived from the use of its buildings and offices around the world.
During 2017, BBVA has continued to work on its third Global Eco-efficiency Plan (GEP), focused on positioning the Group among the leading entities at global level in terms of eco-efficiency. The GEP establishes the following strategic areas and global targets for the period 2016-2020, continuing on from the two previous plans that were begun in 2008 and 2012, respectively, and setting the following targets:
Global Eco-efficiency Plan
Vectors Strategic guidelines Global target
Environmental management and sustainable construction
% occupants in certified buildings 42%
Energy and climate change
Consumption per occupant (kWh/occup)
% of clean energy
CO2 eq emissions per occupant (tCO2 eq /occp)
-5%
48%
-8%
Water Consumption per occupant (m3/occup)
% occupants in buildings with alternative water sources
-5%
9%
Paper and waste Paper consumption per occupant (kg/occup)
% occupants in occupants in buildings with separate waste collection
Awareness campaigns for employees and supplier
-5%
30%
Extension of the commitment
Goals per person
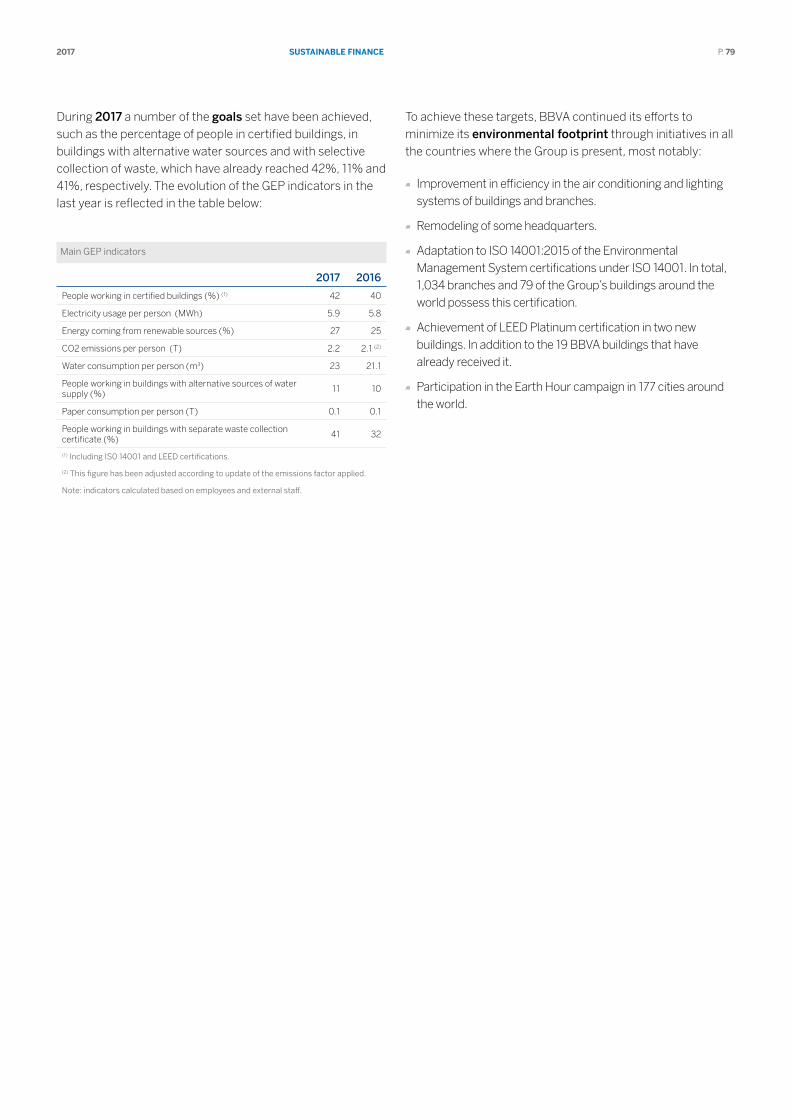
SuStAInABlE fInAncE 2017 P. 79
During 2017 a number of the goals set have been achieved, such as the percentage of people in certified buildings, in buildings with alternative water sources and with selective collection of waste, which have already reached 42%, 11% and 41%, respectively. The evolution of the GEP indicators in the last year is reflected in the table below:
Main GEP indicators
2017 2016
People working in certified buildings (%) (1) 42 40
Electricity usage per person (MWh) 5.9 5.8
Energy coming from renewable sources (%) 27 25
CO2 emissions per person (T) 2.2 2.1 (2)
Water consumption per person (m3) 23 21.1
People working in buildings with alternative sources of water supply (%)
11 10
Paper consumption per person (T) 0.1 0.1
People working in buildings with separate waste collection certificate (%)
41 32
(1) Including IS0 14001 and LEED certifications.
(2) This figure has been adjusted according to update of the emissions factor applied.
Note: indicators calculated based on employees and external staff.
To achieve these targets, BBVA continued its efforts to minimize its environmental footprint through initiatives in all the countries where the Group is present, most notably:
Improvement in efficiency in the air conditioning and lighting systems of buildings and branches.
Remodeling of some headquarters.
Adaptation to ISO 14001:2015 of the Environmental Management System certifications under ISO 14001. In total, 1,034 branches and 79 of the Group’s buildings around the world possess this certification.
Achievement of LEED Platinum certification in two new buildings. In addition to the 19 BBVA buildings that have already received it.
Participation in the Earth Hour campaign in 177 cities around the world.
SuStAInABlE fInAncE 2017 P. 80
Engagement
BBVA is participating in major international sustainable development initiatives (UN Global Compact, Equator Principles, Principles for Responsible Investment, United Nations Environment Programme Finance Initiative, Thun Group of Banks and Human Rights, Green Bond Principles and Social Bond Principles), and has been committed, since 2017, to achieve the United Nations Sustainable Development Goals (SDGs). BBVA is also part of the pilot group of banks that have committed to implement financing and climate change recommendations that were published in July by the Financial Stability Board in the framework of the G20.
Sustainable Development Goals
On September 25, 2015, the world leaders adopted 17 SDGs to protect the planet, fight poverty and try to eradicate it and to achieve a prosperous world for future generations. These goals are part of the 2030 Sustainable Development Agenda. The aim is to involve everyone: governments, companies, civil society and individuals. Each goal, set out with a specific purpose, has in turn a number of targets to be achieved; and each target has its own indicators that serve to determine the level of achievement of each goal.
Given its broad spectrum of business, BBVA contributes to a number of SDGs, together with the BBVA Microfinance Foundation and the different geographic areas in which it operates. To respond to the obligations it has imposed on itself as a bank, BBVA has defined its strategy for climate change and sustainable development that orders its different commitments and relates them directly to the SDGs. In this way, BBVA aims to respond to the commitments of the 2030 Agenda, but at the same time to take advantage of the business opportunities derived from compliance.
Task Force on Climate-related Financial Disclosures (TCFD)
BBVA is committed to mitigating the impacts derived from climate change and to integrating these risks into its risk management model. To further this end, it has joined the pilot group of banks working under the tutelage of the UN Environment Program - Finance Initiative (UNEP FI) to implement the recommendations of the Task Force on Climate Related Climate Disclosures, created by the Financial Stability Board (FSB).
This pilot group of 16 banks aims to analyze how climate change affects the banking industry in its governance model, strategy and risk model.
Over the next two years (2018-2019), a number of possible climate change scenarios will be used to determine how global warming will affect the banking business. The basic aim of the working group will be focused on analyzing risks, whether physical (associated mainly with the direct effects of climate change) or transitional (regulatory, technological or social changes), and how these form part of each entity’s risk model.
Currently, the group is working to determine the sectors on which the analysis will focus, together with the geographic areas of analysis on which the pilot program will be run.
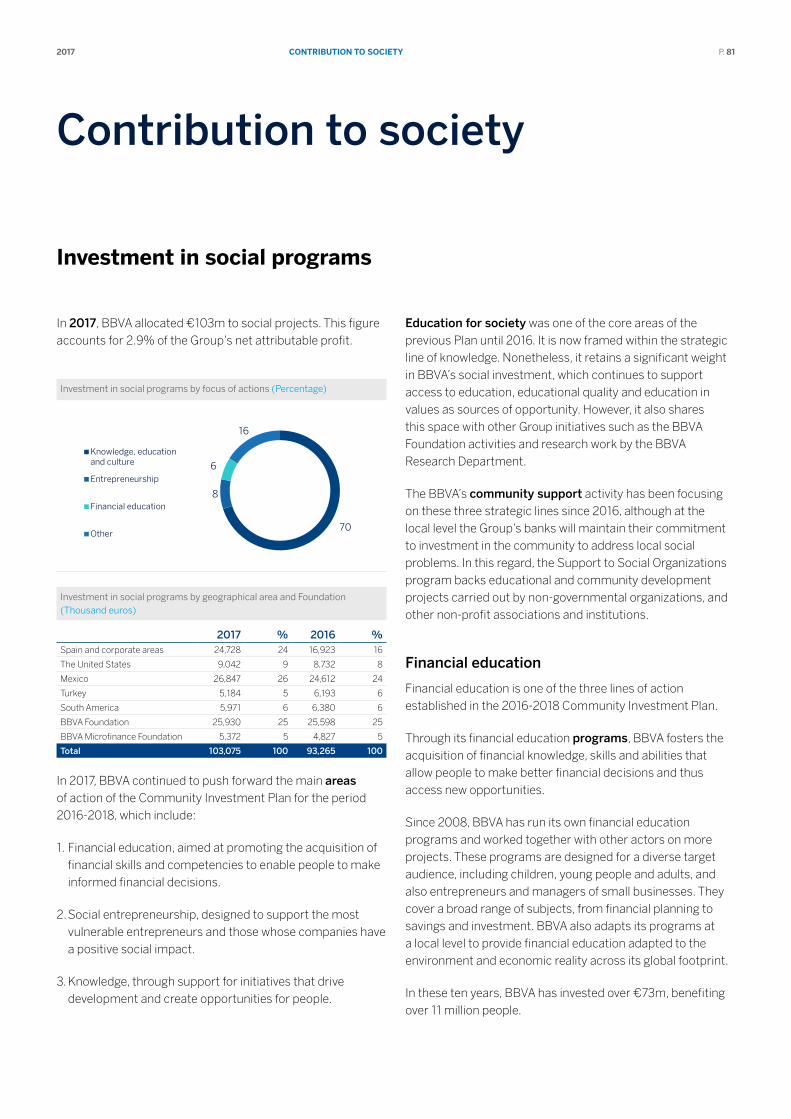
contrIButIon to SocIEty2017 P. 81
Contribution to society
Investment in social programs
In 2017, BBVA allocated €103m to social projects. This figure accounts for 2.9% of the Group’s net attributable profit.
Investment in social programs by focus of actions (Percentage)
70
8
6
16
Knowledge, educationand culture
Entrepreneurship
Financial education
Other
Investment in social programs by geographical area and Foundation (Thousand euros)
2017 % 2016 %Spain and corporate areas 24,728 24 16,923 16
The United States 9,042 9 8,732 8
Mexico 26,847 26 24,612 24
Turkey 5,184 5 6,193 6
South America 5,971 6 6,380 6
BBVA Foundation 25,930 25 25,598 25
BBVA Microfinance Foundation 5,372 5 4,827 5
Total 103,075 100 93,265 100
In 2017, BBVA continued to push forward the main areas of action of the Community Investment Plan for the period 2016-2018, which include:
1. Financial education, aimed at promoting the acquisition of financial skills and competencies to enable people to make informed financial decisions.
2. Social entrepreneurship, designed to support the most vulnerable entrepreneurs and those whose companies have a positive social impact.
3. Knowledge, through support for initiatives that drive development and create opportunities for people.
Education for society was one of the core areas of the previous Plan until 2016. It is now framed within the strategic line of knowledge. Nonetheless, it retains a significant weight in BBVA’s social investment, which continues to support access to education, educational quality and education in values as sources of opportunity. However, it also shares this space with other Group initiatives such as the BBVA Foundation activities and research work by the BBVA Research Department.
The BBVA’s community support activity has been focusing on these three strategic lines since 2016, although at the local level the Group’s banks will maintain their commitment to investment in the community to address local social problems. In this regard, the Support to Social Organizations program backs educational and community development projects carried out by non-governmental organizations, and other non-profit associations and institutions.
Financial education
Financial education is one of the three lines of action established in the 2016-2018 Community Investment Plan.
Through its financial education programs, BBVA fosters the acquisition of financial knowledge, skills and abilities that allow people to make better financial decisions and thus access new opportunities.
Since 2008, BBVA has run its own financial education programs and worked together with other actors on more projects. These programs are designed for a diverse target audience, including children, young people and adults, and also entrepreneurs and managers of small businesses. They cover a broad range of subjects, from financial planning to savings and investment. BBVA also adapts its programs at a local level to provide financial education adapted to the environment and economic reality across its global footprint.
In these ten years, BBVA has invested over €73m, benefiting over 11 million people.

contrIButIon to SocIEty2017 P. 82
Entrepreneurship
In the 2016-2018 Community Investment Plan the entrepreneurship support programs are organized into a single line of action that thus becomes particularly important. Through this line of action, BBVA supports two types of entrepreneurs:
Vulnerable entrepreneurs, who are supported through the BBVA Microfinance Foundation.
Entrepreneurs who create high social impact through their enterprises, who are supported by the BBVA Momentum program.
Knowledge, education and culture
Knowledge, education and culture are three areas of activity that are grouped together in a new line of action included in the new Community Investment Plan for 2016-2018 and that encompasses the activities carried out by the BBVA Foundation and local educational and cultural initiatives.
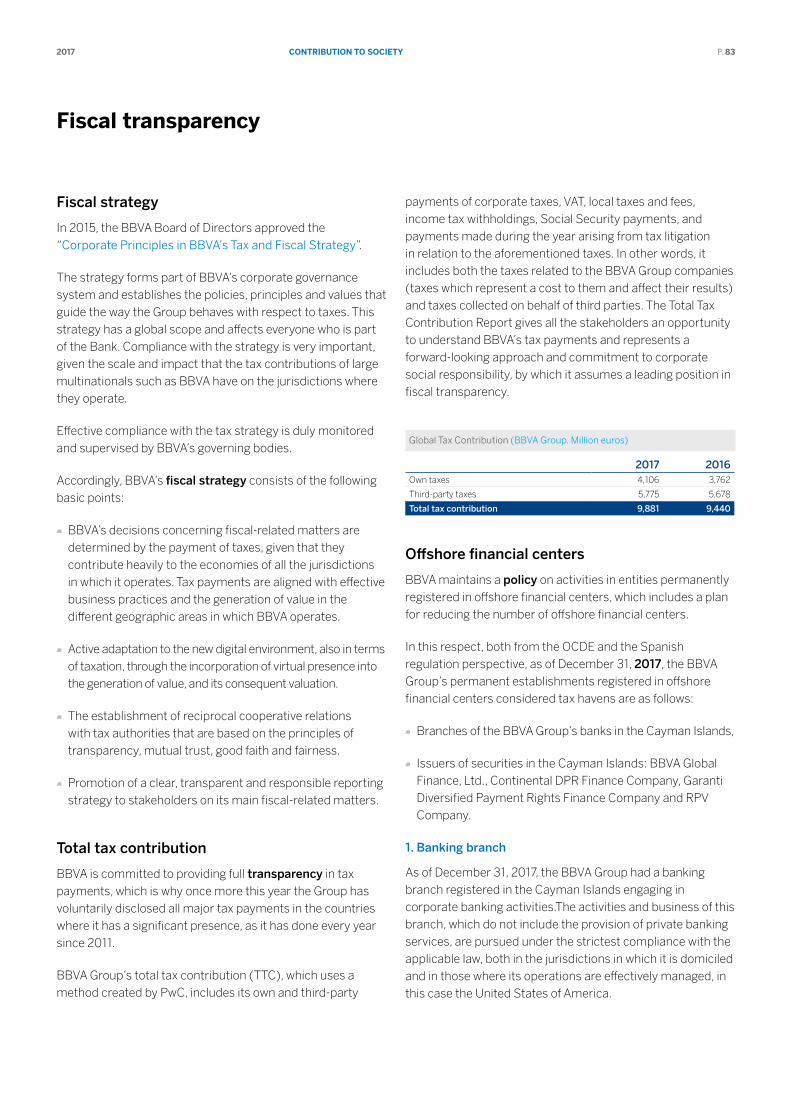
contrIButIon to SocIEty2017 P. 83
fiscal transparency
Fiscal strategy
In 2015, the BBVA Board of Directors approved the “Corporate Principles in BBVA’s Tax and Fiscal Strategy”.
The strategy forms part of BBVA’s corporate governance system and establishes the policies, principles and values that guide the way the Group behaves with respect to taxes. This strategy has a global scope and affects everyone who is part of the Bank. Compliance with the strategy is very important, given the scale and impact that the tax contributions of large multinationals such as BBVA have on the jurisdictions where they operate.
Effective compliance with the tax strategy is duly monitored and supervised by BBVA’s governing bodies.
Accordingly, BBVA’s fiscal strategy consists of the following basic points:
BBVA’s decisions concerning fiscal-related matters are determined by the payment of taxes, given that they contribute heavily to the economies of all the jurisdictions in which it operates. Tax payments are aligned with effective business practices and the generation of value in the different geographic areas in which BBVA operates.
Active adaptation to the new digital environment, also in terms of taxation, through the incorporation of virtual presence into the generation of value, and its consequent valuation.
The establishment of reciprocal cooperative relations with tax authorities that are based on the principles of transparency, mutual trust, good faith and fairness.
Promotion of a clear, transparent and responsible reporting strategy to stakeholders on its main fiscal-related matters.
Total tax contribution
BBVA is committed to providing full transparency in tax payments, which is why once more this year the Group has voluntarily disclosed all major tax payments in the countries where it has a significant presence, as it has done every year since 2011.
BBVA Group’s total tax contribution (TTC), which uses a method created by PwC, includes its own and third-party
payments of corporate taxes, VAT, local taxes and fees, income tax withholdings, Social Security payments, and payments made during the year arising from tax litigation in relation to the aforementioned taxes. In other words, it includes both the taxes related to the BBVA Group companies (taxes which represent a cost to them and affect their results) and taxes collected on behalf of third parties. The Total Tax Contribution Report gives all the stakeholders an opportunity to understand BBVA’s tax payments and represents a forward-looking approach and commitment to corporate social responsibility, by which it assumes a leading position in fiscal transparency.
Global Tax Contribution (BBVA Group. Million euros)
2017 2016Own taxes 4,106 3,762
Third-party taxes 5,775 5,678
Total tax contribution 9,881 9,440
Offshore financial centers
BBVA maintains a policy on activities in entities permanently registered in offshore financial centers, which includes a plan for reducing the number of offshore financial centers.
In this respect, both from the OCDE and the Spanish regulation perspective, as of December 31, 2017, the BBVA Group’s permanent establishments registered in offshore financial centers considered tax havens are as follows:
Branches of the BBVA Group’s banks in the Cayman Islands,
Issuers of securities in the Cayman Islands: BBVA Global Finance, Ltd., Continental DPR Finance Company, Garanti Diversified Payment Rights Finance Company and RPV Company.
1. Banking branch
As of December 31, 2017, the BBVA Group had a banking branch registered in the Cayman Islands engaging in corporate banking activities.The activities and business of this branch, which do not include the provision of private banking services, are pursued under the strictest compliance with the applicable law, both in the jurisdictions in which it is domiciled and in those where its operations are effectively managed, in this case the United States of America.
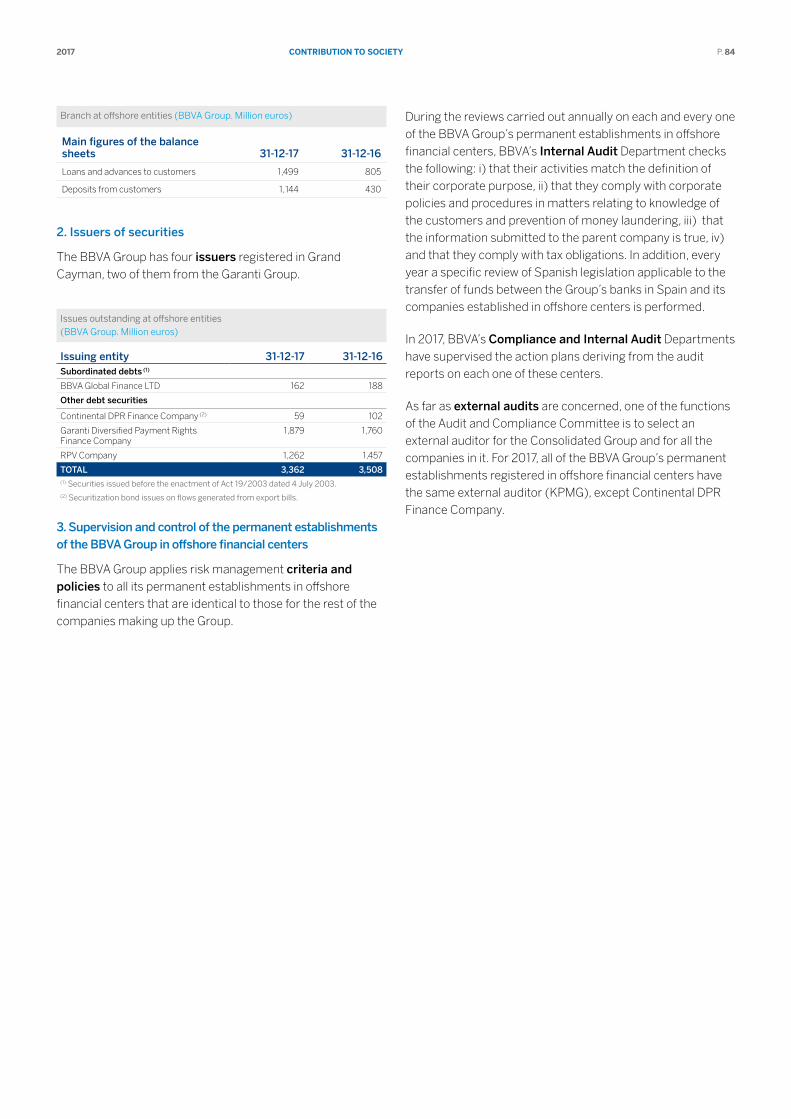
contrIButIon to SocIEty2017 P. 84
Branch at offshore entities (BBVA Group. Million euros)
Main figures of the balance sheets 31-12-17 31-12-16
Loans and advances to customers 1,499 805
Deposits from customers 1,144 430
2. Issuers of securities
The BBVA Group has four issuers registered in Grand Cayman, two of them from the Garanti Group.
Issues outstanding at offshore entities (BBVA Group. Million euros)
Issuing entity 31-12-17 31-12-16Subordinated debts (1)
BBVA Global Finance LTD 162 188
Other debt securities
Continental DPR Finance Company (2) 59 102
Garanti Diversified Payment Rights Finance Company
1,879 1,760
RPV Company 1,262 1,457
TOTAL 3,362 3,508(1) Securities issued before the enactment of Act 19/2003 dated 4 July 2003.(2) Securitization bond issues on flows generated from export bills.
3. Supervision and control of the permanent establishments of the BBVA Group in offshore financial centers
The BBVA Group applies risk management criteria and policies to all its permanent establishments in offshore financial centers that are identical to those for the rest of the companies making up the Group.
During the reviews carried out annually on each and every one of the BBVA Group’s permanent establishments in offshore financial centers, BBVA’s Internal Audit Department checks the following: i) that their activities match the definition of their corporate purpose, ii) that they comply with corporate policies and procedures in matters relating to knowledge of the customers and prevention of money laundering, iii) that the information submitted to the parent company is true, iv) and that they comply with tax obligations. In addition, every year a specific review of Spanish legislation applicable to the transfer of funds between the Group’s banks in Spain and its companies established in offshore centers is performed.
In 2017, BBVA’s Compliance and Internal Audit Departments have supervised the action plans deriving from the audit reports on each one of these centers.
As far as external audits are concerned, one of the functions of the Audit and Compliance Committee is to select an external auditor for the Consolidated Group and for all the companies in it. For 2017, all of the BBVA Group’s permanent establishments registered in offshore financial centers have the same external auditor (KPMG), except Continental DPR Finance Company.
othEr InformAtIon2017 P. 85
Other information
main risks and uncertainties
BBVA Group’s risk management system and risk exposure is described in Note 7 “Risk management” of the accompanying
Consolidated Financial Statements.
Contractual obligations and off-balance-sheet operations
Information on contingent risks and commitments can be found in Note 33 of the accompanying Consolidated Financial Statements. Information on sale and purchase commitments
and future payment obligations can be found in Note 35 of the accompanying Consolidated Financial Statements.
Patents, licenses or similar
At the time of preparing the accompanying Consolidated Financial Statements, the BBVA Group is not materially dependent on the issuance of patents, licenses and industrial,
mercantile or financial contracts or on new manufacturing processes in carrying out its business purpose.
Subsequent events
From January 1, 2018 to the date of preparation of these Annual Consolidated Accounts, no other subsequent events not mentioned above in these financial statements have taken place that could significantly affect the Group’s earnings or its equity position.
Transition to IFRS 9
Under Commission Regulation (EU) No. 2016/2067 of 22 November 2016, all companies governed by the law of a Member State of the European Union, and whose securities are traded on a regulated market in one of the States
of the European Union, must apply IFRS 9 as from the commencement date of their first financial year starting on or after January 1, 2018 (see Note 2.3 from the attached Annual Financial Statements); and it is the Group’s intention to use the option allowed by the standard itself of not reformulating the comparative financial statements for 2017 that will be presented in the Consolidated Financial Statements for 2018.
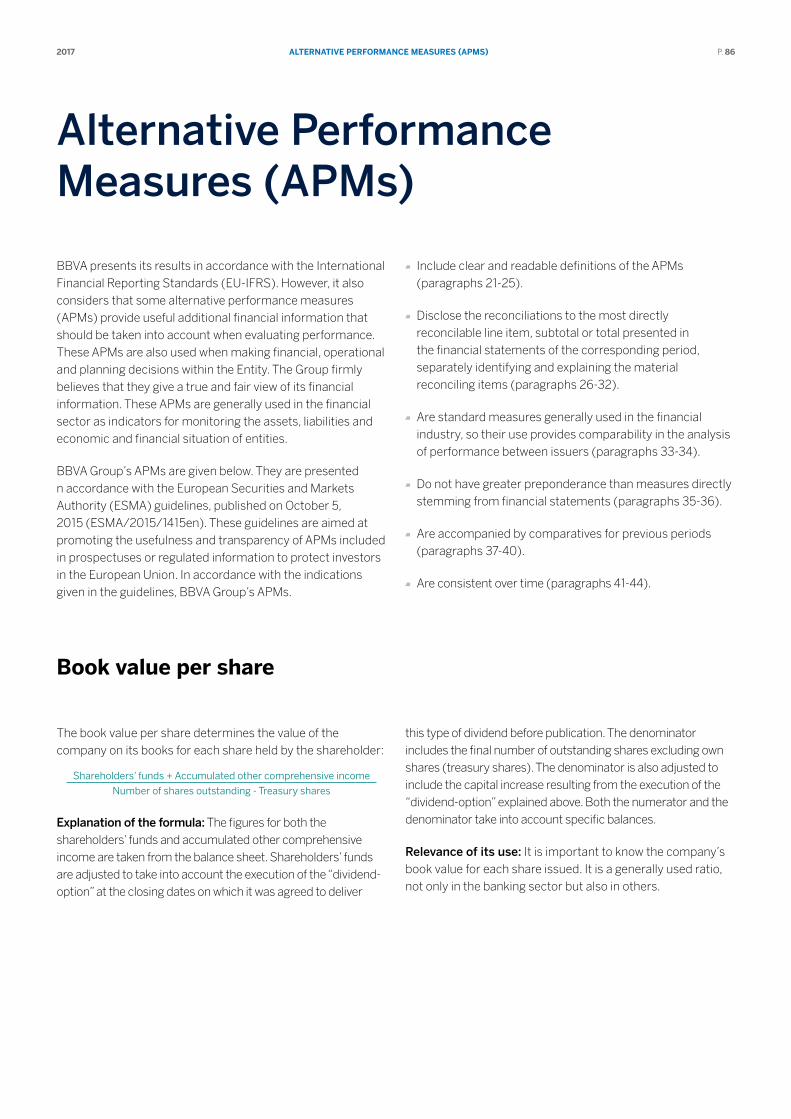
AlternAtive PerformAnCe meASureS (APmS)2017 P. 86
Alternative Performance Measures (APMs)
BBVA presents its results in accordance with the International Financial Reporting Standards (EU-IFRS). However, it also considers that some alternative performance measures (APMs) provide useful additional financial information that should be taken into account when evaluating performance. These APMs are also used when making financial, operational and planning decisions within the Entity. The Group firmly believes that they give a true and fair view of its financial information. These APMs are generally used in the financial sector as indicators for monitoring the assets, liabilities and economic and financial situation of entities.
BBVA Group’s APMs are given below. They are presented n accordance with the European Securities and Markets Authority (ESMA) guidelines, published on October 5, 2015 (ESMA/2015/1415en). These guidelines are aimed at promoting the usefulness and transparency of APMs included in prospectuses or regulated information to protect investors in the European Union. In accordance with the indications given in the guidelines, BBVA Group’s APMs.
Include clear and readable definitions of the APMs (paragraphs 21-25).
Disclose the reconciliations to the most directly reconcilable line item, subtotal or total presented in the financial statements of the corresponding period, separately identifying and explaining the material reconciling items (paragraphs 26-32).
Are standard measures generally used in the financial industry, so their use provides comparability in the analysis of performance between issuers (paragraphs 33-34).
Do not have greater preponderance than measures directly stemming from financial statements (paragraphs 35-36).
Are accompanied by comparatives for previous periods (paragraphs 37-40).
Are consistent over time (paragraphs 41-44).
Book value per share
The book value per share determines the value of the company on its books for each share held by the shareholder:
Shareholders’ funds + Accumulated other comprehensive income
Number of shares outstanding - Treasury shares
Explanation of the formula: The figures for both the shareholders’ funds and accumulated other comprehensive income are taken from the balance sheet. Shareholders’ funds are adjusted to take into account the execution of the “dividend-option” at the closing dates on which it was agreed to deliver
this type of dividend before publication. The denominator includes the final number of outstanding shares excluding own shares (treasury shares). The denominator is also adjusted to include the capital increase resulting from the execution of the “dividend-option” explained above. Both the numerator and the denominator take into account specific balances.
Relevance of its use: It is important to know the company’s book value for each share issued. It is a generally used ratio, not only in the banking sector but also in others.
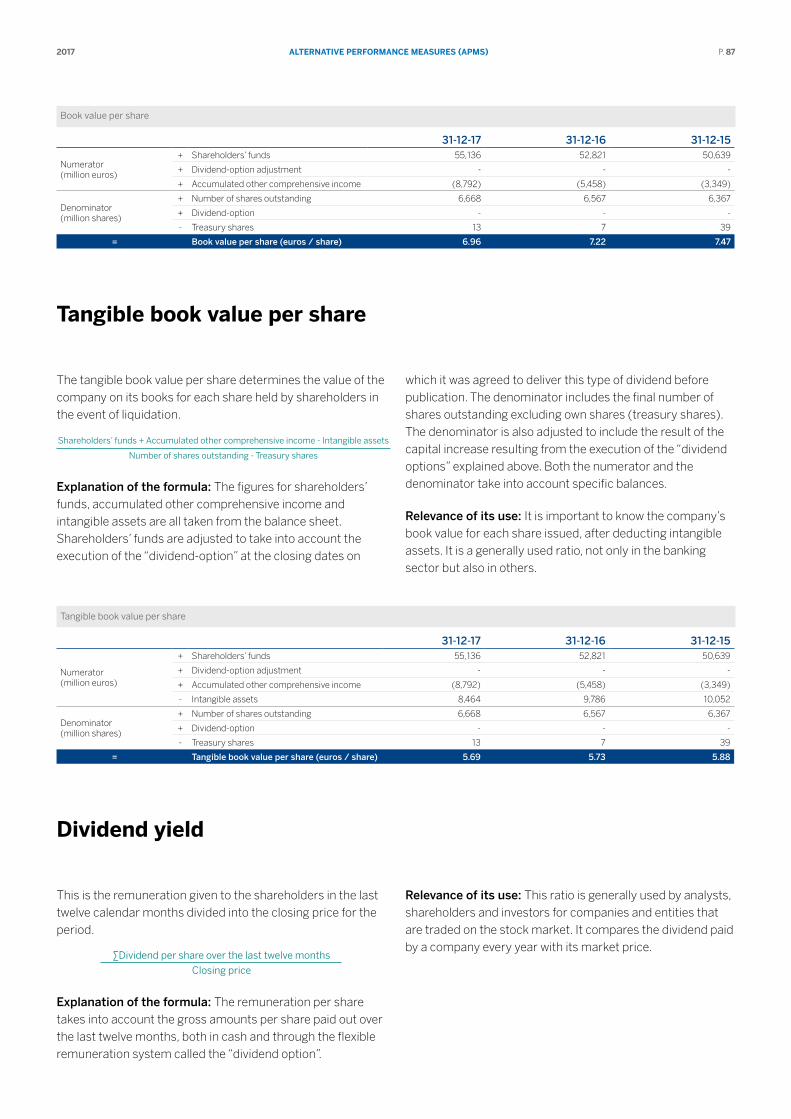
AlternAtive PerformAnCe meASureS (APmS)2017 P. 87
Book value per share
31-12-17 31-12-16 31-12-15
Numerator (million euros)
+ Shareholders’ funds 55,136 52,821 50,639
+ Dividend-option adjustment - - -
+ Accumulated other comprehensive income (8,792) (5,458) (3,349)
Denominator (million shares)
+ Number of shares outstanding 6,668 6,567 6,367
+ Dividend-option - - -
- Treasury shares 13 7 39
= Book value per share (euros / share) 6.96 7.22 7.47
tangible book value per share
The tangible book value per share determines the value of the company on its books for each share held by shareholders in the event of liquidation.
Shareholders’ funds + Accumulated other comprehensive income - Intangible assets
Number of shares outstanding - Treasury shares
Explanation of the formula: The figures for shareholders’ funds, accumulated other comprehensive income and intangible assets are all taken from the balance sheet. Shareholders’ funds are adjusted to take into account the execution of the “dividend-option” at the closing dates on
which it was agreed to deliver this type of dividend before publication. The denominator includes the final number of shares outstanding excluding own shares (treasury shares). The denominator is also adjusted to include the result of the capital increase resulting from the execution of the “dividend options” explained above. Both the numerator and the denominator take into account specific balances.
Relevance of its use: It is important to know the company’s book value for each share issued, after deducting intangible assets. It is a generally used ratio, not only in the banking sector but also in others.
Tangible book value per share
31-12-17 31-12-16 31-12-15
Numerator (million euros)
+ Shareholders’ funds 55,136 52,821 50,639
+ Dividend-option adjustment - - -
+ Accumulated other comprehensive income (8,792) (5,458) (3,349)
- Intangible assets 8,464 9,786 10,052
Denominator (million shares)
+ Number of shares outstanding 6,668 6,567 6,367
+ Dividend-option - - -
- Treasury shares 13 7 39
= Tangible book value per share (euros / share) 5.69 5.73 5.88
dividend yield
This is the remuneration given to the shareholders in the last twelve calendar months divided into the closing price for the period.
∑Dividend per share over the last twelve months
Closing price
Explanation of the formula: The remuneration per share takes into account the gross amounts per share paid out over the last twelve months, both in cash and through the flexible remuneration system called the “dividend option”.
Relevance of its use: This ratio is generally used by analysts, shareholders and investors for companies and entities that are traded on the stock market. It compares the dividend paid by a company every year with its market price.
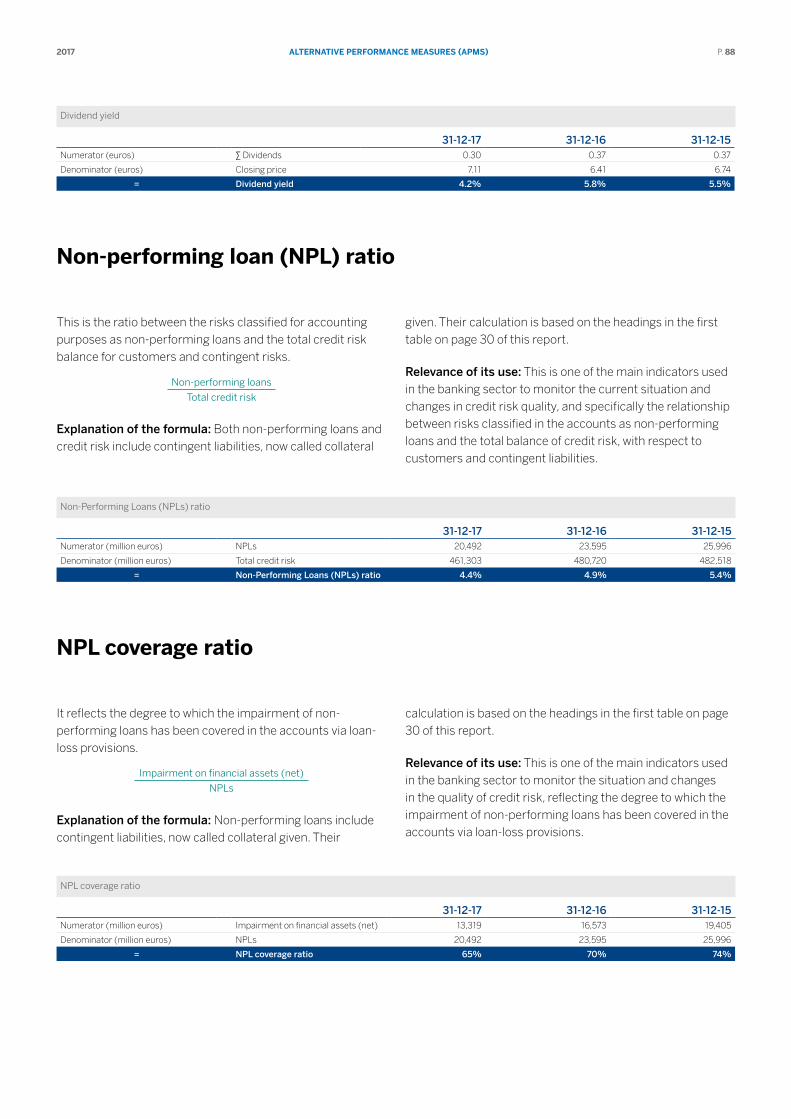
AlternAtive PerformAnCe meASureS (APmS)2017 P. 88
Dividend yield
31-12-17 31-12-16 31-12-15Numerator (euros) ∑ Dividends 0.30 0.37 0.37
Denominator (euros) Closing price 7.11 6.41 6.74
= Dividend yield 4.2% 5.8% 5.5%
non-performing loan (nPl) ratio
This is the ratio between the risks classified for accounting purposes as non-performing loans and the total credit risk balance for customers and contingent risks.
Non-performing loans
Total credit risk
Explanation of the formula: Both non-performing loans and credit risk include contingent liabilities, now called collateral
given. Their calculation is based on the headings in the first table on page 30 of this report.
Relevance of its use: This is one of the main indicators used in the banking sector to monitor the current situation and changes in credit risk quality, and specifically the relationship between risks classified in the accounts as non-performing loans and the total balance of credit risk, with respect to customers and contingent liabilities.
Non-Performing Loans (NPLs) ratio
31-12-17 31-12-16 31-12-15Numerator (million euros) NPLs 20,492 23,595 25,996
Denominator (million euros) Total credit risk 461,303 480,720 482,518
= Non-Performing Loans (NPLs) ratio 4.4% 4.9% 5.4%
nPl coverage ratio
It reflects the degree to which the impairment of non-performing loans has been covered in the accounts via loan-loss provisions.
Impairment on financial assets (net)
NPLs
Explanation of the formula: Non-performing loans include contingent liabilities, now called collateral given. Their
calculation is based on the headings in the first table on page 30 of this report.
Relevance of its use: This is one of the main indicators used in the banking sector to monitor the situation and changes in the quality of credit risk, reflecting the degree to which the impairment of non-performing loans has been covered in the accounts via loan-loss provisions.
NPL coverage ratio
31-12-17 31-12-16 31-12-15Numerator (million euros) Impairment on financial assets (net) 13,319 16,573 19,405
Denominator (million euros) NPLs 20,492 23,595 25,996
= NPL coverage ratio 65% 70% 74%
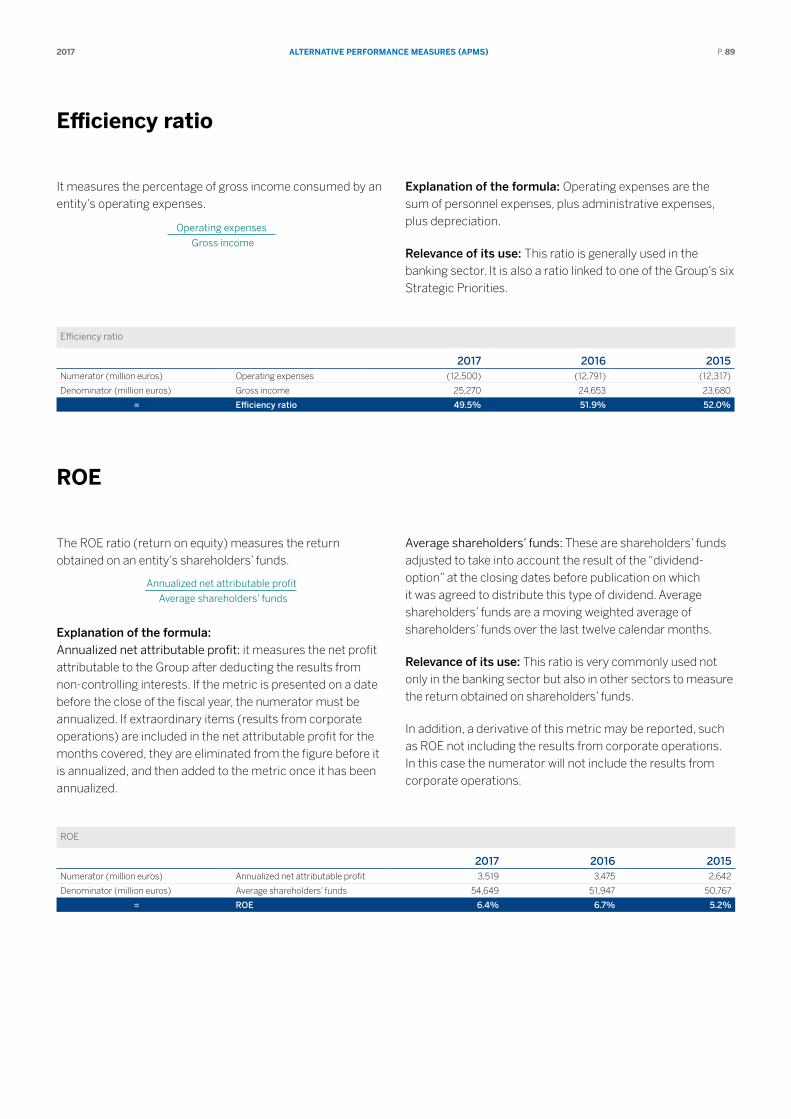
AlternAtive PerformAnCe meASureS (APmS)2017 P. 89
efficiency ratio
It measures the percentage of gross income consumed by an entity’s operating expenses.
Operating expenses
Gross income
Explanation of the formula: Operating expenses are the sum of personnel expenses, plus administrative expenses, plus depreciation.
Relevance of its use: This ratio is generally used in the banking sector. It is also a ratio linked to one of the Group’s six Strategic Priorities.
Efficiency ratio
2017 2016 2015Numerator (million euros) Operating expenses (12,500) (12,791) (12,317)
Denominator (million euros) Gross income 25,270 24,653 23,680
= Efficiency ratio 49.5% 51.9% 52.0%
roE
The ROE ratio (return on equity) measures the return obtained on an entity’s shareholders’ funds.
Annualized net attributable profit
Average shareholders’ funds
Explanation of the formula: Annualized net attributable profit: it measures the net profit attributable to the Group after deducting the results from non-controlling interests. If the metric is presented on a date before the close of the fiscal year, the numerator must be annualized. If extraordinary items (results from corporate operations) are included in the net attributable profit for the months covered, they are eliminated from the figure before it is annualized, and then added to the metric once it has been annualized.
Average shareholders’ funds: These are shareholders’ funds adjusted to take into account the result of the “dividend-option” at the closing dates before publication on which it was agreed to distribute this type of dividend. Average shareholders’ funds are a moving weighted average of shareholders’ funds over the last twelve calendar months.
Relevance of its use: This ratio is very commonly used not only in the banking sector but also in other sectors to measure the return obtained on shareholders’ funds.
In addition, a derivative of this metric may be reported, such as ROE not including the results from corporate operations. In this case the numerator will not include the results from corporate operations.
ROE
2017 2016 2015Numerator (million euros) Annualized net attributable profit 3,519 3,475 2,642
Denominator (million euros) Average shareholders’ funds 54,649 51,947 50,767
= ROE 6.4% 6.7% 5.2%
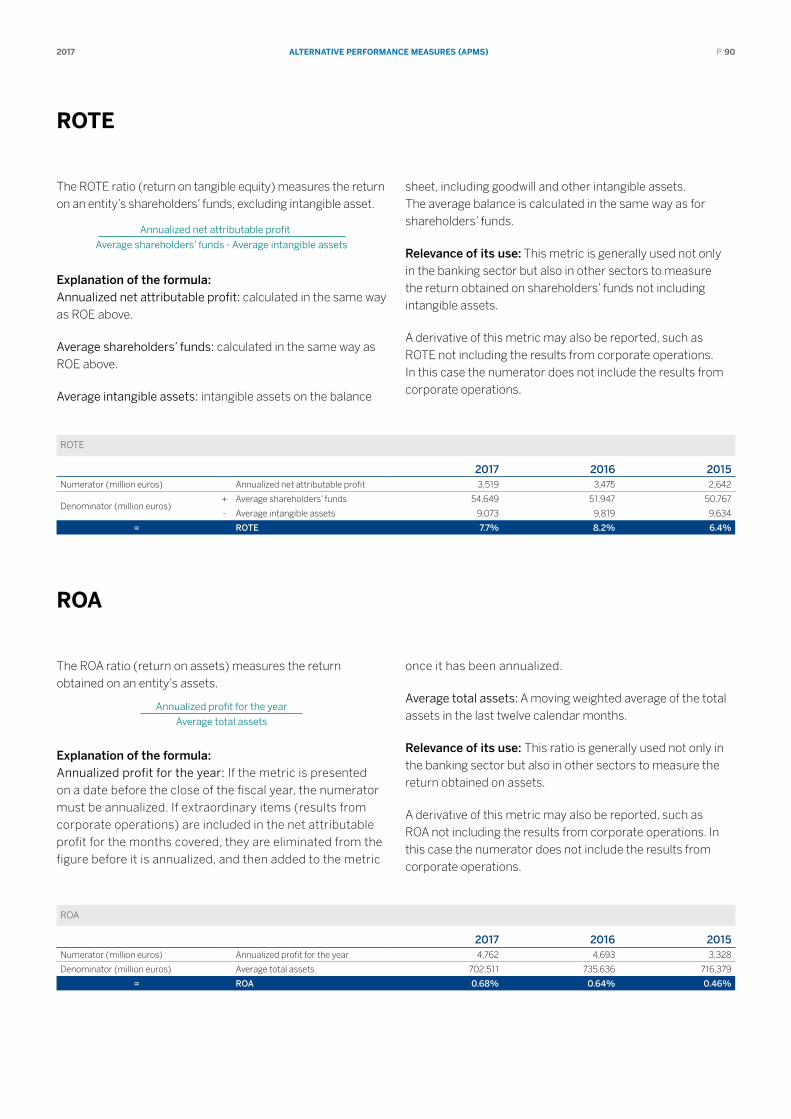
AlternAtive PerformAnCe meASureS (APmS)2017 P. 90
rotE
The ROTE ratio (return on tangible equity) measures the return on an entity’s shareholders’ funds, excluding intangible asset.
Annualized net attributable profit
Average shareholders’ funds - Average intangible assets
Explanation of the formula: Annualized net attributable profit: calculated in the same way as ROE above.
Average shareholders’ funds: calculated in the same way as ROE above.
Average intangible assets: intangible assets on the balance
sheet, including goodwill and other intangible assets. The average balance is calculated in the same way as for shareholders’ funds.
Relevance of its use: This metric is generally used not only in the banking sector but also in other sectors to measure the return obtained on shareholders’ funds not including intangible assets.
A derivative of this metric may also be reported, such as ROTE not including the results from corporate operations. In this case the numerator does not include the results from corporate operations.
ROTE
2017 2016 2015Numerator (million euros) Annualized net attributable profit 3,519 3,475 2,642
Denominator (million euros)+ Average shareholders’ funds 54,649 51,947 50,767
- Average intangible assets 9,073 9,819 9,634
= ROTE 7.7% 8.2% 6.4%
roA
The ROA ratio (return on assets) measures the return obtained on an entity’s assets.
Annualized profit for the year
Average total assets
Explanation of the formula: Annualized profit for the year: If the metric is presented on a date before the close of the fiscal year, the numerator must be annualized. If extraordinary items (results from corporate operations) are included in the net attributable profit for the months covered, they are eliminated from the figure before it is annualized, and then added to the metric
once it has been annualized.
Average total assets: A moving weighted average of the total assets in the last twelve calendar months.
Relevance of its use: This ratio is generally used not only in the banking sector but also in other sectors to measure the return obtained on assets.
A derivative of this metric may also be reported, such as ROA not including the results from corporate operations. In this case the numerator does not include the results from corporate operations.
ROA
2017 2016 2015Numerator (million euros) Annualized profit for the year 4,762 4,693 3,328
Denominator (million euros) Average total assets 702,511 735,636 716,379
= ROA 0.68% 0.64% 0.46%
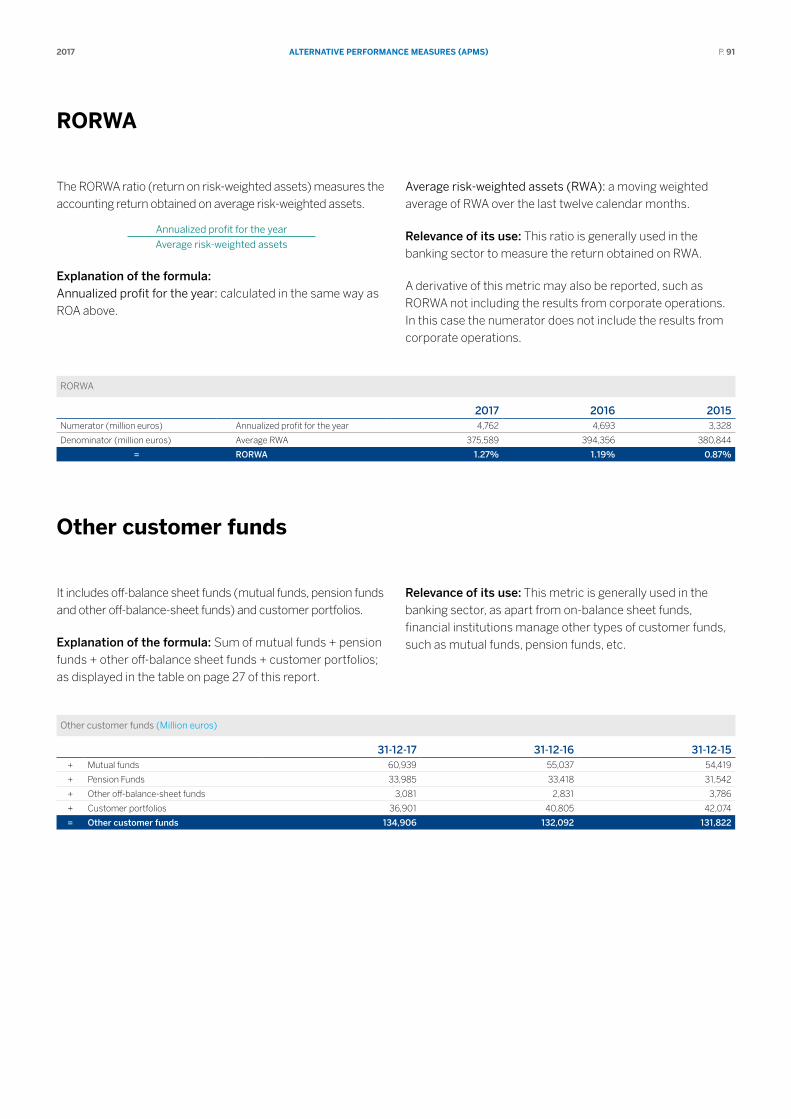
AlternAtive PerformAnCe meASureS (APmS)2017 P. 91
rorWA
The RORWA ratio (return on risk-weighted assets) measures the accounting return obtained on average risk-weighted assets.
Annualized profit for the year
Average risk-weighted assets
Explanation of the formula: Annualized profit for the year: calculated in the same way as ROA above.
Average risk-weighted assets (RWA): a moving weighted average of RWA over the last twelve calendar months.
Relevance of its use: This ratio is generally used in the banking sector to measure the return obtained on RWA.
A derivative of this metric may also be reported, such as RORWA not including the results from corporate operations. In this case the numerator does not include the results from corporate operations.
RORWA
2017 2016 2015Numerator (million euros) Annualized profit for the year 4,762 4,693 3,328
Denominator (million euros) Average RWA 375,589 394,356 380,844
= RORWA 1.27% 1.19% 0.87%
other customer funds
It includes off-balance sheet funds (mutual funds, pension funds and other off-balance-sheet funds) and customer portfolios.
Explanation of the formula: Sum of mutual funds + pension funds + other off-balance sheet funds + customer portfolios; as displayed in the table on page 27 of this report.
Relevance of its use: This metric is generally used in the banking sector, as apart from on-balance sheet funds, financial institutions manage other types of customer funds, such as mutual funds, pension funds, etc.
Other customer funds (Million euros)
31-12-17 31-12-16 31-12-15+ Mutual funds 60,939 55,037 54,419
+ Pension Funds 33,985 33,418 31,542
+ Other off-balance-sheet funds 3,081 2,831 3,786
+ Customer portfolios 36,901 40,805 42,074
= Other customer funds 134,906 132,092 131,822

AnnuAl corPorAtE goVErnAncE rEPort2017 P. 92
Annual Corporate Governance Report
In accordance with the provisions of Article 540 of the Spanish Corporate Act, the BBVA Group prepared the Annual Corporate Governance Report for 2017 (which is an integral part of the Management Report for that year) following the content guidelines set down in Order ECC/461/2013, dated March 20, and in CNMV Circular 5/2013, dated June 12 in the wording provided by Comisión Nacional del Mercado
de Valores (CNMV) Circular 7/2015, dated December 22, including a section detailing the degree to which the Bank is compliant with existing corporate governance recommendations in Spain. In addition, all the information required by Article 539 of the Spanish Corporations Act can be accessed on BBVA’s website www.bbva.com.
This English version is a translation of the original in Spanish for information purposes only. In case of a
discrepancy, the Spanish original will prevail.
93
ANNUAL CORPORATE GOVERNANCE REPORT ON THE PUBLICLY TRADED COMPANIES
ISSUER IDENTIFICATION
FINANCIAL YEAR-END 31/12/2017
TAX ID No.: A-48265169
Registered name: BANCO BILBAO VIZCAYA ARGENTARIA, S.A.
Registered Address: Plaza de San Nicolás 4, 48005 Bilbao (Vizcaya)
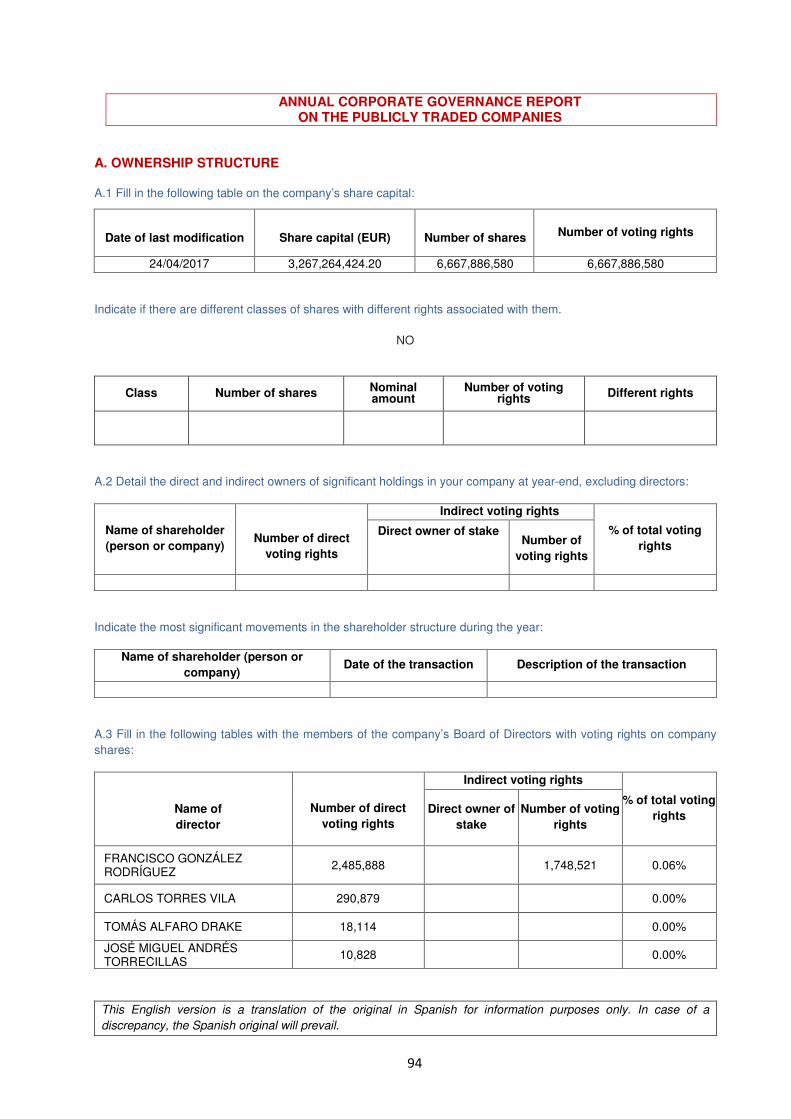
This English version is a translation of the original in Spanish for information purposes only. In case of a
discrepancy, the Spanish original will prevail.
94
ANNUAL CORPORATE GOVERNANCE REPORT ON THE PUBLICLY TRADED COMPANIES
A. OWNERSHIP STRUCTURE
A.1 Fill in the following table on the company’s share capital:
Indicate if there are different classes of shares with different rights associated with them.
NO
Class Number of shares Nominal amount
Number of voting rights
Different rights
A.2 Detail the direct and indirect owners of significant holdings in your company at year-end, excluding directors:
Name of shareholder
(person or company)
Number of direct
voting rights
Indirect voting rights
% of total voting
rights
Direct owner of stake
Number of
voting rights
Indicate the most significant movements in the shareholder structure during the year:
Name of shareholder (person or
company) Date of the transaction Description of the transaction
A.3 Fill in the following tables with the members of the company’s Board of Directors with voting rights on company
shares:
Number of direct
voting rights
Indirect voting rights
% of total voting
rights Name of
director
Direct owner of
stake
Number of voting
rights
FRANCISCO GONZÁLEZ RODRÍGUEZ
2,485,888 1,748,521 0.06%
CARLOS TORRES VILA 290,879 0.00%
TOMÁS ALFARO DRAKE 18,114 0.00%
JOSÉ MIGUEL ANDRÉS TORRECILLAS
10,828 0.00%
Date of last modification
Share capital (EUR)
Number of shares
Number of voting rights
24/04/2017 3,267,264,424.20 6,667,886,580 6,667,886,580
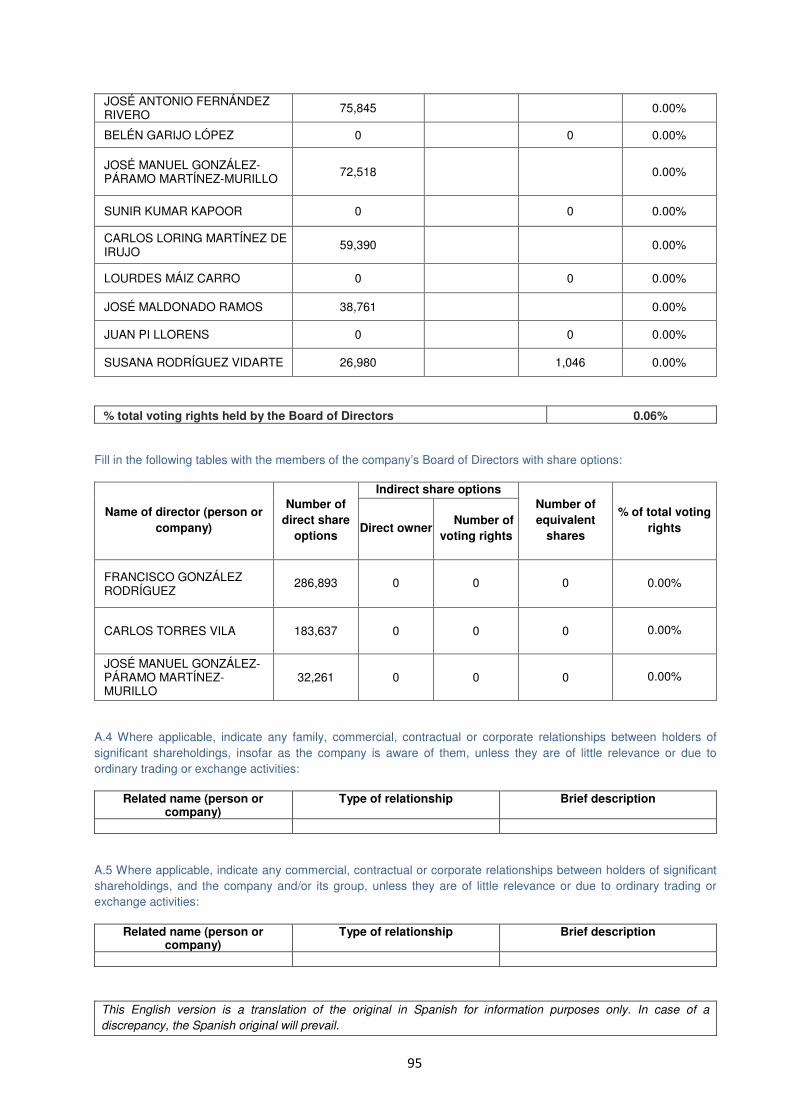
This English version is a translation of the original in Spanish for information purposes only. In case of a
discrepancy, the Spanish original will prevail.
95
JOSÉ ANTONIO FERNÁNDEZ RIVERO
75,845 0.00%
BELÉN GARIJO LÓPEZ 0 0 0.00%
JOSÉ MANUEL GONZÁLEZ-PÁRAMO MARTÍNEZ-MURILLO
72,518 0.00%
SUNIR KUMAR KAPOOR 0 0 0.00%
CARLOS LORING MARTÍNEZ DE IRUJO
59,390 0.00%
LOURDES MÁIZ CARRO 0 0 0.00%
JOSÉ MALDONADO RAMOS 38,761 0.00%
JUAN PI LLORENS 0 0 0.00%
SUSANA RODRÍGUEZ VIDARTE 26,980 1,046 0.00%
% total voting rights held by the Board of Directors 0.06%
Fill in the following tables with the members of the company’s Board of Directors with share options:
Name of director (person or
company)
Number of
direct share
options
Indirect share options
Number of
equivalent
shares
% of total voting
rights Direct owner Number of
voting rights
FRANCISCO GONZÁLEZ RODRÍGUEZ
286,893 0 0 0 0.00%
CARLOS TORRES VILA 183,637 0 0 0 0.00%
JOSÉ MANUEL GONZÁLEZ-PÁRAMO MARTÍNEZ-MURILLO
32,261 0 0 0 0.00%
A.4 Where applicable, indicate any family, commercial, contractual or corporate relationships between holders of
significant shareholdings, insofar as the company is aware of them, unless they are of little relevance or due to
ordinary trading or exchange activities:
Related name (person or company)
Type of relationship Brief description
A.5 Where applicable, indicate any commercial, contractual or corporate relationships between holders of significant
shareholdings, and the company and/or its group, unless they are of little relevance or due to ordinary trading or
exchange activities:
Related name (person or company)
Type of relationship Brief description
This English version is a translation of the original in Spanish for information purposes only. In case of a
discrepancy, the Spanish original will prevail.
96
A.6 Indicate whether the company has been informed of any shareholder agreements that may affect it as set out
under articles 530 and 531 of the Corporate Enterprises Act. Where applicable, briefly describe them and list the
shareholders bound by such agreement:
NO
Participants in shareholders
agreements % of share capital affected Brief description of agreement
Indicate whether the company is aware of the existence of concerted actions amongst its shareholders. If so,
describe them briefly.
NO
Participants in concerted action % of share capital affected Brief description of concerted
action
If there has been any amendment or breaking-off of said pacts or agreements or concerted actions, indicate this
expressly:
A.7 Indicate whether any person or organization exercises or may exercise control over the company pursuant to
article 5 of the Securities Exchange Act. If so, identify names:
NO
Name (person or company)
Comments
A.8 Fill in the following tables regarding the company’s treasury stock:
At year end:
Number of direct shares Number of indirect shares (*) Total % of share capital
0 13,339,582 0.20%
(*) Through:
Name of direct owner of shareholding (person or company) Number of direct shares
CORPORACIÓN GENERAL FINANCIERA, S.A. 13,339,582
Total: 13,339,582
Give details of any significant changes during the year, pursuant to Royal Decree 1362/2007:
Explain the significant changes Five treasury stock communications were made in 2017, of which one correspond to a change in the number of voting rights in the “Dividend Option”, which let shareholders decide whether to receive shares or cash for their
This English version is a translation of the original in Spanish for information purposes only. In case of a
discrepancy, the Spanish original will prevail.
97
dividend payment and the rest correspond to acquisitions passed the 1% threshold. These communications are detailed below:
• Communication date: 22 February 2017 with a total of 2,597,437 direct shares and 14,175,081 indirect shares acquired for 0.255% of the total share capital. This communication was made after acquisitions passed the 1% threshold.
• Communication date: 20 April 2017 with a total of 2,089,826 direct shares and 4,676,084 indirect shares acquired for 0.103% of the total share capital. This communication was made after acquisitions passed the 1% threshold.
• Communication date: 28 April 2017 with a total of 2,370,436 direct shares and 4,676,084 indirect shares acquired for 0.106% on the total share capital. This communication was made on execution of the “Dividend Option” program.
• Communication date: 26 July 2017 with a total of 2,591,747 direct shares and 6,138,937 indirect shares acquired for 0.131% of the total share capital. This communication was made after acquisitions passed the 1% threshold.
• Communication date: 23 November 2017 with a total of 2,627,409 direct shares and 12,020,164 indirect shares acquired for 0.220% on the total share capital. This communication was made after acquisitions passed the 1% threshold.
A.9 Describe the conditions and term of the prevailing mandate from the general meeting to the Board of Directors to
issue, buy back and transfer treasury stock.
• The Annual General Shareholders’ Meeting of BBVA held on March 17, 2017, under item three of the agenda,
passed a resolution to delegate to the Board of Directors the power to increase share capital within five years up
to a maximum amount corresponding to 50% of BBVA's share capital on the date of such authorization, on one
or several occasions, to the amount and on the date that the Board resolves, by issuing new shares of any kind
allowed by law, with or without an issue premium, the countervalue of said shares comprising cash
considerations. The authorization includes the setting out of the terms and conditions of the share capital
increase in any respect not provided for in the resolution, and delegation to the Board of Directors of a power to
wholly or partly exclude pre-emptive subscription rights in relation to any share capital increase carried out by
virtue of the referred resolution when so demanded by the interests of the Company and in compliance with the
applicable legal requirements. However, this power was limited insofar as the nominal amount of the capital
increases resolved upon or actually carried out with an exclusion of the pre-emptive subscription right by virtue
of the above delegation or resolved upon or executed to accommodate the conversion of ordinarily convertible
issues that are also carried out with an exclusion of the pre-emptive subscription right in the exercise of the
delegated power to issue convertible securities granted by the General Shareholders' Meeting itself, under item
five of the agenda, may not exceed the maximum nominal amount, taken as a whole, of 20% of BBVA's share
capital at the time of delegation. This limit does not apply to issues of contingently convertible securities.
To date, BBVA has not adopted any resolution using this delegated power.
• The BBVA Annual General Shareholders’ Meeting of March 17, 2017, under the fifth item on the agenda,
delegated to the Board of Directors a power to issue securities that are convertible into newly issued BBVA
shares, on one or more occasions within a maximum term of five years, up to a total combined maximum
amount of €8,000,000,000 or its equivalent in any other currency; the Board may likewise resolve upon, set and
determine each and every one of the terms and conditions of the issues carried out by virtue of that delegated
power, determine the basis and mode of conversion, and resolve upon, set and determine the conversion ratio,
which may be fixed or variable. Moreover, the General Meeting resolved to delegate to the Board of Directors a
power totally or partially exclude pre-emptive subscription rights over any issue of convertible securities that
may be made hereunder, when the corporate interest so requires, in compliance with any legal requirements
established to this end. However, this power was limited in so far as the normal amount of the capital increases
resolved upon or actually carried out to accommodate the conversion of ordinarily convertible issues executed
by virtue of that delegated power with an exclusion of the pre-emptive subscription right, and those resolved
upon or executed also with an exclusion of the pre-emptive subscription right in the exercise of the delegated
power to increase share capital granted by the General Meeting itself, under item four of the agenda, may not
exceed the maximum nominal amount, taken as a whole, of 20% of BBVA's share capital at the time of
delegation. This limit does not apply to issues of contingently convertible securities.
This English version is a translation of the original in Spanish for information purposes only. In case of a
discrepancy, the Spanish original will prevail.
98
In exercising this delegation in 2017, BBVA executed two issues of perpetual securities that are contingently
convertible (additional tier 1 capital instruments) with exclusion of the pre-emptive subscription rights, amounting
to EUR 500 million and USD 1 billion, respectively.
• The Annual General Shareholders’ Meeting of BBVA of March 14, 2014, under agenda item three, resolved to
authorize BBVA, directly or via any of its subsidiaries, for a maximum term of five years, for the acquisition of
BBVA shares at any time and on as many occasions as it deems appropriate, by any means permitted by law,
and to subsequently dispose of the shares acquired, indicating that derivative acquisition of shares will at all
times be carried out in compliance with the conditions established under applicable legislation and, in particular,
the following conditions: (i) at no time will the nominal value of the treasury shares acquired, directly or
indirectly, under this authorization, added to the shares already owned by the Company and its subsidiaries,
exceed 10% of the subscribed share capital of BBVA or, as appropriate, the maximum amount permitted by
applicable legislation; (ii) the acquisition shall not result in the equity being less than the share capital plus the
legal reserves or the reserves that are restricted by the Company bylaws; (iii) a restricted reserve, equivalent to
the sum of treasury shares of the company recorded to assets, may be established against the net equity; (iv)
shares acquired must be fully paid up, unless the acquisition is without consideration, and must not entail any
obligation to provide ancillary benefits; and (v) the acquisition price per share will not be below the nominal
value of the share or more than 20% above the listed price or any other price associated with the shares on the
acquisition date. Moreover, said General Meeting expressly authorized that the shares acquired by BBVA or its
subsidiaries by exercising the aforementioned authorization may be wholly or partially earmarked for delivery to
workers or administrators of BBVA or its subsidiaries.
A.9 bis Estimated floating capital:
%
Estimated floating capital 100
A.10 Indicate whether there is any restriction on the transferability of securities and/or any restriction on voting rights.
In particular, report the existence of any restrictions that might hinder the take-over of control of the company by
purchasing its shares on the market.
NO
A.11 Indicate whether the General Meeting has agreed to adopt measures to neutralize a public takeover bid,
pursuant to Act 6/2007.
NO
If so, explain the measures approved and the terms and conditions under which the restrictions would become
inefficient:
A.12 Indicate whether the company has issued securities that are not traded on a regulated market in the EU.
YES
Where applicable, indicate the different classes of shares, and what rights and obligations each share class confers.
All the shares in BBVA's capital have the same class and series, and confer the same voting and economic rights.
There are no different voting rights for any shareholder. There are no shares that do not represent capital.
The Bank's shares are admitted for trading on the Securities Exchanges in Madrid, Barcelona, Bilbao and Valencia,
through the Spanish electronic trading platform (Continuous Market), and the stock markets in London and Mexico.
BBVA American Depositary Shares (ADS) are traded on the New York Stock Exchange.
Additionally, as of 31 December 2017, shares of BBVA Banco Continental, S.A., Banco Provincial S.A., BBVA
Colombia, S.A., BBVA Chile, S.A. and BBVA Banco Francés, S.A., were traded on their respective local securities
This English version is a translation of the original in Spanish for information purposes only. In case of a
discrepancy, the Spanish original will prevail.
99
markets and, for the latter entity, on the New York Stock Exchange and in the Latin American securities exchange
(LATIBEX) on the Stock Market of Madrid.
B GENERAL MEETING
B.1 Indicate, and where applicable give details, whether there are any differences from the minimum standards
established under the Corporate Enterprises Act (CEA) with respect to the quorum and constitution of the General
Meeting.
YES
% quorum different from quorum set
out in art. 193 of CEA for general
circumstances
% quorum different from quorum set out in
art. 194 of CEA for special circumstances
in art.194 of CEA
Quorum required on first
summons 0.00% 66.66%
Quorum required on
second summons 0.00% 60.00%
Description of differences
Article 194 of the Corporate Enterprises Act establishes that, in limited companies, in order for a General Meeting
(whether annual or extraordinary) to validly resolve to increase or reduce capital or make any other amendment to
the Company Bylaws, bond issuance, the cancellation or restriction of first refusal subscription rights over new
shares, or the conversion, merger or spin-off of the company or global assignment of assets and liabilities or the
transfer the registered office abroad, the shareholders present and represented on first summons must own at
least fifty percent of the subscribed capital with voting rights.
On second summons, twenty-five percent of said capital will be sufficient.
The above notwithstanding, article 25 of the BBVA Company Bylaws establishes that a reinforced quorum of two-
thirds of subscribed capital with voting rights must attend the General Meeting at first summons or 60% of that
capital at second summons, in order to adopt resolutions on replacing the corporate purpose, the transformation,
total spin off, winding-up of the Company and amending that article of Bylaws establishing this reinforced quorum.
B.2 Indicate, and where applicable give details, whether there are any differences from the minimum standards
established under the Corporate Enterprises Act (CEA) for the adoption of corporate resolutions:
NO
Describe any differences from the minimum standards established under the CEA.
B.3 Indicate the rules applicable to amendments to the company bylaws. In particular, report the majorities
established to amend the bylaws, and the rules, if any, to safeguard shareholders' rights when amending the bylaws.
Article 30 of the BBVA Company Bylaws establishes that the General Meeting is empowered to amend the Company
Bylaws and to confirm and/or rectify Board of Directors’ interpretation of them.
To such end, the rules established under articles 285 et seq. of the Corporate Enterprises Act shall apply.
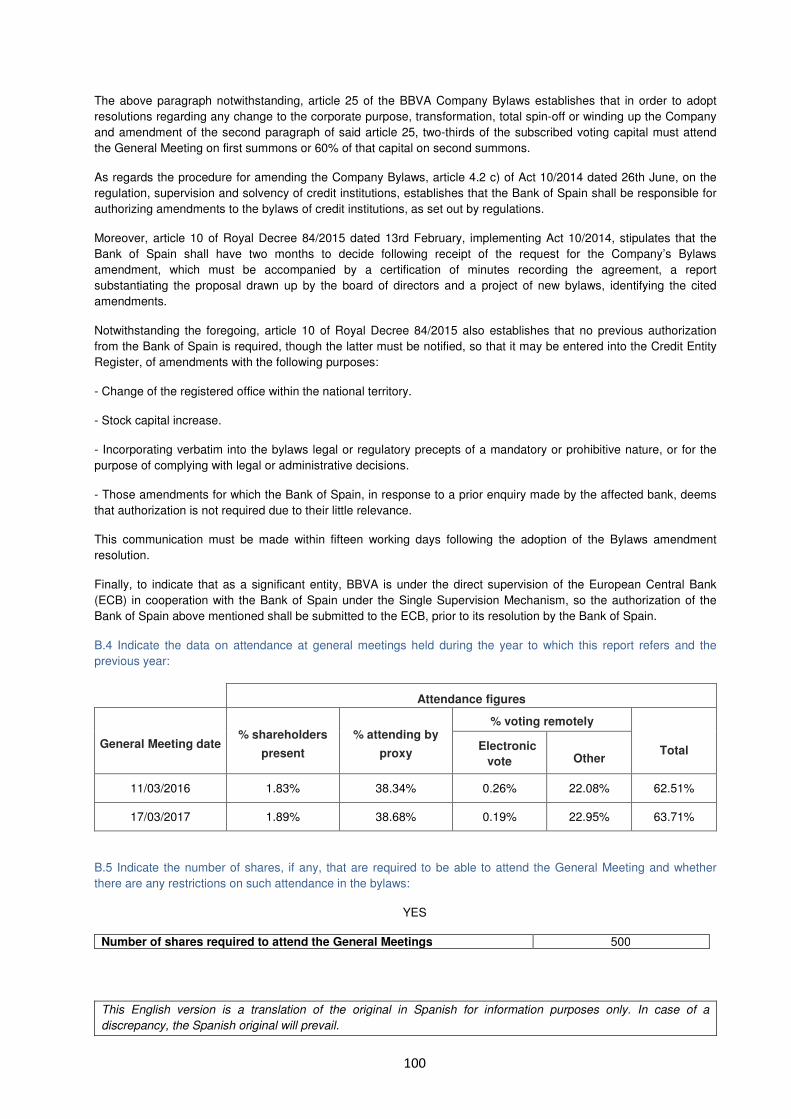
This English version is a translation of the original in Spanish for information purposes only. In case of a
discrepancy, the Spanish original will prevail.
100
The above paragraph notwithstanding, article 25 of the BBVA Company Bylaws establishes that in order to adopt
resolutions regarding any change to the corporate purpose, transformation, total spin-off or winding up the Company
and amendment of the second paragraph of said article 25, two-thirds of the subscribed voting capital must attend
the General Meeting on first summons or 60% of that capital on second summons.
As regards the procedure for amending the Company Bylaws, article 4.2 c) of Act 10/2014 dated 26th June, on the
regulation, supervision and solvency of credit institutions, establishes that the Bank of Spain shall be responsible for
authorizing amendments to the bylaws of credit institutions, as set out by regulations.
Moreover, article 10 of Royal Decree 84/2015 dated 13rd February, implementing Act 10/2014, stipulates that the
Bank of Spain shall have two months to decide following receipt of the request for the Company’s Bylaws
amendment, which must be accompanied by a certification of minutes recording the agreement, a report
substantiating the proposal drawn up by the board of directors and a project of new bylaws, identifying the cited
amendments.
Notwithstanding the foregoing, article 10 of Royal Decree 84/2015 also establishes that no previous authorization
from the Bank of Spain is required, though the latter must be notified, so that it may be entered into the Credit Entity
Register, of amendments with the following purposes:
- Change of the registered office within the national territory.
- Stock capital increase.
- Incorporating verbatim into the bylaws legal or regulatory precepts of a mandatory or prohibitive nature, or for the
purpose of complying with legal or administrative decisions.
- Those amendments for which the Bank of Spain, in response to a prior enquiry made by the affected bank, deems
that authorization is not required due to their little relevance.
This communication must be made within fifteen working days following the adoption of the Bylaws amendment
resolution.
Finally, to indicate that as a significant entity, BBVA is under the direct supervision of the European Central Bank
(ECB) in cooperation with the Bank of Spain under the Single Supervision Mechanism, so the authorization of the
Bank of Spain above mentioned shall be submitted to the ECB, prior to its resolution by the Bank of Spain.
B.4 Indicate the data on attendance at general meetings held during the year to which this report refers and the
previous year:
Attendance figures
General Meeting date
% shareholders
present
% attending by
proxy
% voting remotely
Total Electronic
vote
Other
11/03/2016 1.83% 38.34% 0.26% 22.08% 62.51%
17/03/2017 1.89% 38.68% 0.19% 22.95% 63.71%
B.5 Indicate the number of shares, if any, that are required to be able to attend the General Meeting and whether
there are any restrictions on such attendance in the bylaws:
YES
Number of shares required to attend the General Meetings 500
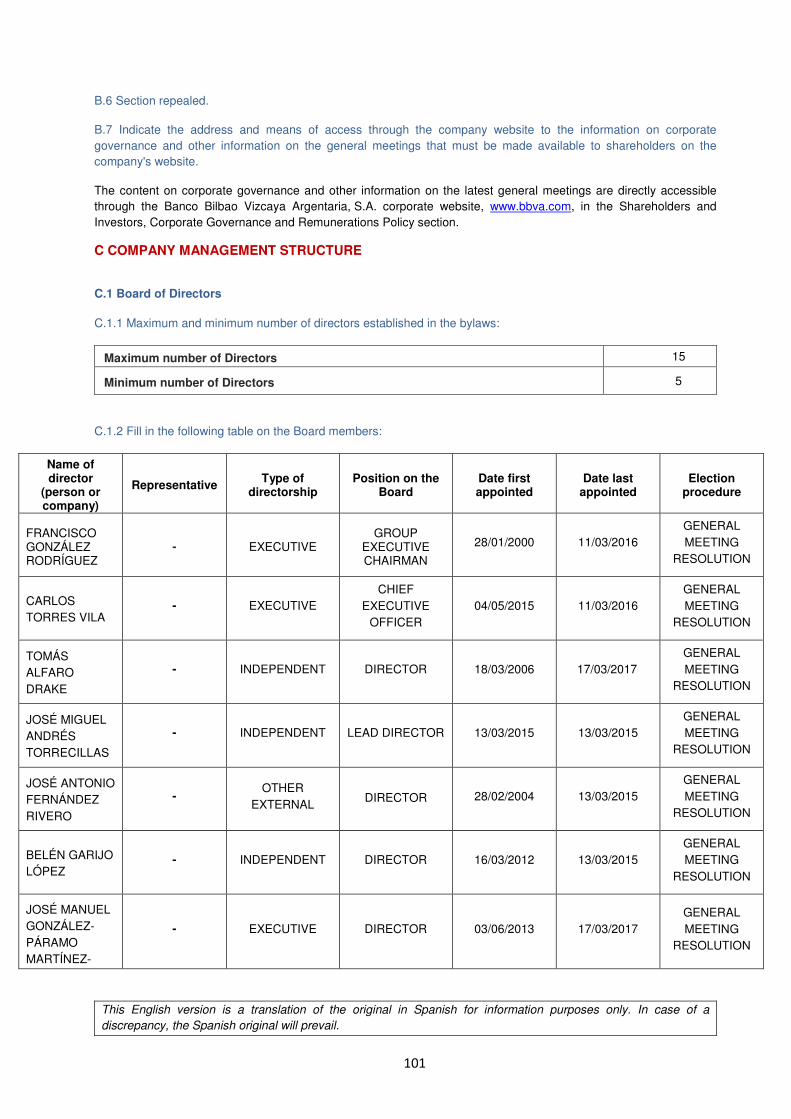
This English version is a translation of the original in Spanish for information purposes only. In case of a
discrepancy, the Spanish original will prevail.
101
B.6 Section repealed.
B.7 Indicate the address and means of access through the company website to the information on corporate
governance and other information on the general meetings that must be made available to shareholders on the
company's website.
The content on corporate governance and other information on the latest general meetings are directly accessible
through the Banco Bilbao Vizcaya Argentaria, S.A. corporate website, www.bbva.com, in the Shareholders and
Investors, Corporate Governance and Remunerations Policy section.
C COMPANY MANAGEMENT STRUCTURE
C.1 Board of Directors
C.1.1 Maximum and minimum number of directors established in the bylaws:
Maximum number of Directors 15
Minimum number of Directors 5
C.1.2 Fill in the following table on the Board members:
Name of director
(person or company)
Representative Type of
directorship Position on the
Board Date first appointed
Date last appointed
Election procedure
FRANCISCO GONZÁLEZ RODRÍGUEZ
- EXECUTIVE GROUP
EXECUTIVE CHAIRMAN
28/01/2000 11/03/2016
GENERAL
MEETING
RESOLUTION
CARLOS
TORRES VILA - EXECUTIVE
CHIEF
EXECUTIVE
OFFICER
04/05/2015 11/03/2016
GENERAL
MEETING
RESOLUTION
TOMÁS
ALFARO
DRAKE
- INDEPENDENT DIRECTOR 18/03/2006 17/03/2017
GENERAL
MEETING
RESOLUTION
JOSÉ MIGUEL
ANDRÉS
TORRECILLAS
- INDEPENDENT LEAD DIRECTOR 13/03/2015 13/03/2015
GENERAL
MEETING
RESOLUTION
JOSÉ ANTONIO
FERNÁNDEZ
RIVERO
- OTHER
EXTERNAL DIRECTOR 28/02/2004 13/03/2015
GENERAL
MEETING
RESOLUTION
BELÉN GARIJO
LÓPEZ - INDEPENDENT DIRECTOR 16/03/2012 13/03/2015
GENERAL
MEETING
RESOLUTION
JOSÉ MANUEL
GONZÁLEZ-
PÁRAMO
MARTÍNEZ-
- EXECUTIVE DIRECTOR 03/06/2013 17/03/2017
GENERAL
MEETING
RESOLUTION
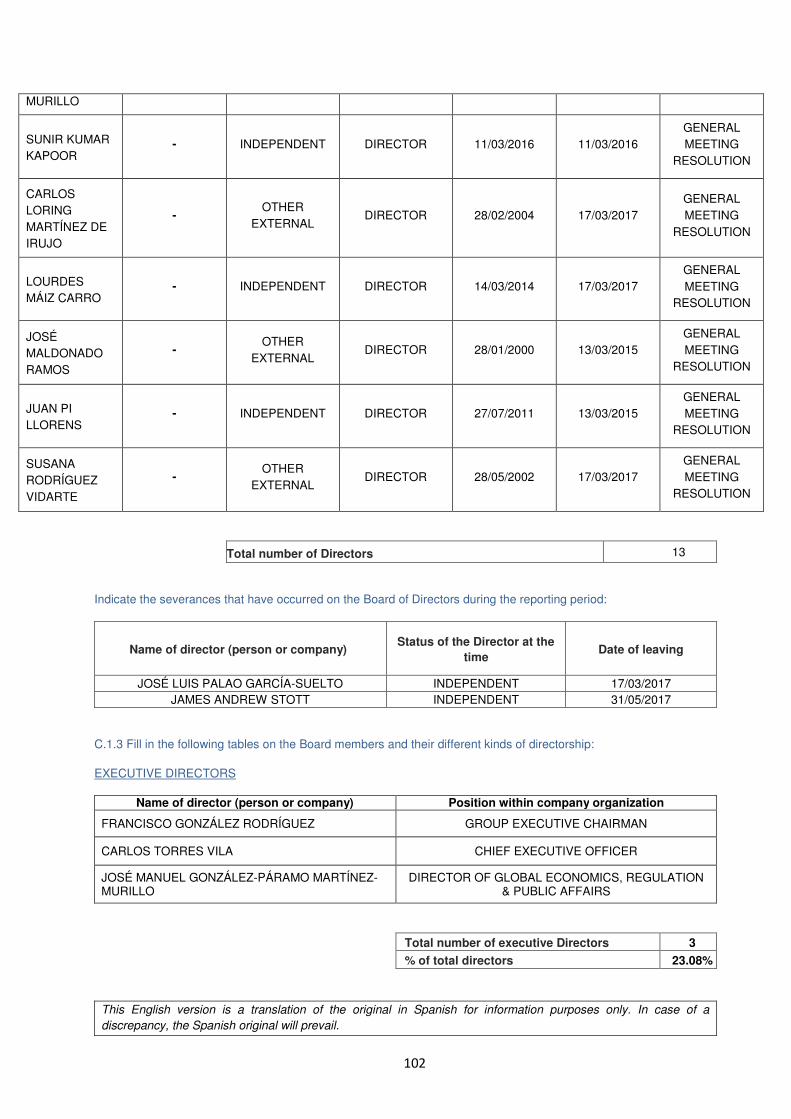
This English version is a translation of the original in Spanish for information purposes only. In case of a
discrepancy, the Spanish original will prevail.
102
MURILLO
SUNIR KUMAR
KAPOOR - INDEPENDENT DIRECTOR 11/03/2016 11/03/2016
GENERAL
MEETING
RESOLUTION
CARLOS
LORING
MARTÍNEZ DE
IRUJO
- OTHER
EXTERNAL DIRECTOR 28/02/2004 17/03/2017
GENERAL
MEETING
RESOLUTION
LOURDES
MÁIZ CARRO - INDEPENDENT DIRECTOR 14/03/2014 17/03/2017
GENERAL
MEETING
RESOLUTION
JOSÉ
MALDONADO
RAMOS
- OTHER
EXTERNAL DIRECTOR 28/01/2000 13/03/2015
GENERAL
MEETING
RESOLUTION
JUAN PI
LLORENS - INDEPENDENT DIRECTOR 27/07/2011 13/03/2015
GENERAL
MEETING
RESOLUTION
SUSANA
RODRÍGUEZ
VIDARTE
- OTHER
EXTERNAL DIRECTOR 28/05/2002 17/03/2017
GENERAL
MEETING
RESOLUTION
Total number of Directors 13
Indicate the severances that have occurred on the Board of Directors during the reporting period:
Name of director (person or company) Status of the Director at the
time Date of leaving
JOSÉ LUIS PALAO GARCÍA-SUELTO INDEPENDENT 17/03/2017
JAMES ANDREW STOTT INDEPENDENT 31/05/2017
C.1.3 Fill in the following tables on the Board members and their different kinds of directorship:
EXECUTIVE DIRECTORS
Name of director (person or company) Position within company organization
FRANCISCO GONZÁLEZ RODRÍGUEZ GROUP EXECUTIVE CHAIRMAN
CARLOS TORRES VILA CHIEF EXECUTIVE OFFICER
JOSÉ MANUEL GONZÁLEZ-PÁRAMO MARTÍNEZ-MURILLO
DIRECTOR OF GLOBAL ECONOMICS, REGULATION & PUBLIC AFFAIRS
Total number of executive Directors 3
% of total directors 23.08%

This English version is a translation of the original in Spanish for information purposes only. In case of a
discrepancy, the Spanish original will prevail.
103
EXTERNAL PROPRIETARY DIRECTORS
EXTERNAL INDEPENDENT DIRECTORS
Name of director (person or company)
PROFILE
TOMÁS ALFARO DRAKE
CHAIR OF THE BOARD'S APPOINTMENTS COMMITTEE.
DIRECTOR OF INTERNAL DEVELOPMENT AND TEACHER IN THE FINANCE AREA AT UNIVERSIDAD FRANCISCO DE VITORIA.
OTHER RELEVANT POSITIONS: WAS DIRECTOR OF THE FOLLOWING BACHELOR'S DEGREES AT UNIVERSIDAD FRANCISCO DE VITORIA: BUSINESS ADMINISTRATION AND MANAGEMENT; BUSINESS STUDIES; MARKETING; BUSINESS ADMINISTRATION. GRADUATED IN ENGINEERING AT ICAI AND BECAME MASTER IN ECONOMICS AND BUSINESS ADMINISTRATION (MBA) AT IESE.
JOSÉ MIGUEL ANDRÉS TORRECILLAS
CHAIR OF THE BOARD'S AUDIT AND COMPLIANCE COMMITTEE AND LEAD DIRECTOR.
HIS PROFESSIONAL CAREER BEGAN WITH ERNST & YOUNG AS GENERAL MANAGING PARTNER FOR AUDIT AND ADVISORY SERVICES AND CHAIRMAN OF ERNST & YOUNG SPAIN UNTIL 2014.
MEMBER OF SEVERAL ENTITIES SUCH AS THE OFFICIAL REGISTRY OF ACCOUNT AUDITORS (ROAC), REGISTRY OF ECONOMIST AUDITORS (REA), SPANISH INSTITUTE OF CHARTERED ACCOUNTANTS AND THE ADVISORY BOARD OF THE INSTITUTE OF INTERNAL AUDITORS. GRADUATED IN BUSINESS SCIENCES AND ECONOMICS FROM THE COMPLUTENSE UNIVERSITY IN MADRID.
BELÉN GARIJO LÓPEZ
CHAIR OF THE BOARD´S REMUNERATION COMMITTEE.
MEMBER OF THE EXECUTIVE BOARD OF MERCK GROUP AND CEO OF MERCK HEALTH CARE. DIRECTOR OF L’OREAL AND CHAIR OF THE PHRMA INTERNATIONAL EXECUTIVE COMMITTEE, ISEC (PHARMACEUTICAL RESEARCH AND MANUFACTURERS OF AMERICA).
OTHER RELEVANT POSITIONS: WAS PRESIDENT OF COMMERCIAL OPERATIONS IN EUROPE AND CANADA AT SANOFI AVENTIS.
GRADUATED IN MEDICINE FROM UNIVERSIDAD DE ALCALÁ DE HENARES, MADRID.
SPECIALIST IN CLINICAL PHARMACOLOGY AT HOSPITAL DE LA PAZ - UNIVERSIDAD AUTÓNOMA DE MADRID.
JUAN PI LLORENS
CHAIR OF THE BOARD'S RISK COMMITTEE.
HAD A PROFESSIONAL CAREER AT IBM HOLDING VARIOUS SENIOR POSITIONS AT A NATIONAL AND INTERNATIONAL LEVEL INCLUDING VICE PRESIDENT FOR SALES AT IBM EUROPE, VICE PRESIDENT OF TECHNOLOGY & SYSTEMS AT IBM EUROPE AND VICE PRESIDENT OF FINANCIAL SERVICES SECTOR, GMU (GROWTH MARKETS UNITS) IN CHINA. HE WAS EXECUTIVE CHAIRMAN OF IBM SPAIN.
GRADUATED IN INDUSTRIAL ENGINEERING FROM UNIVERSIDAD POLITECNICA DE BARCELONA AND TOOK A GENERAL MANAGEMENT PROGRAM AT IESE.
LOURDES MÁIZ CARRO
WAS SECRETARY OF THE BOARD OF DIRECTORS AND DIRECTOR OF THE LEGAL DEPARTMENT OF IBERIA, LÍNEAS AÉREAS DE ESPAÑA UNTIL APRIL 2016.
PHD IN PHILOSOPHY, WORKED IN RESEARCH AND GAVE CLASSES IN METAPHYSICS AT THE COMPLUTENSE UNIVERSITY DURING FIVE YEARS. GRADUATED IN LAW, JOINED THE STATE COUNSEL CORPS AND HELD VARIOUS POSTS OF RESPONSIBILITY IN THE PUBLIC ADMINISTRATIONS SUCH AS GENERAL ORGANIZATIONAL DIRECTOR, WORK AND COMPUTING POSITIONS AT THE MINISTRY OF PUBLIC ADMINISTRATIONS, GENERAL DIRECTOR OF THE SOCIEDAD ESTATAL DE PARTICIPACIONES PATRIMONIALES (SEPPA) IN THE MINISTRY OF ECONOMY AND FINANCES AND GENERAL TECHNICAL SECRETARY AT THE MINISTRY OF AGRICULTURE. SHE HAS BEEN A
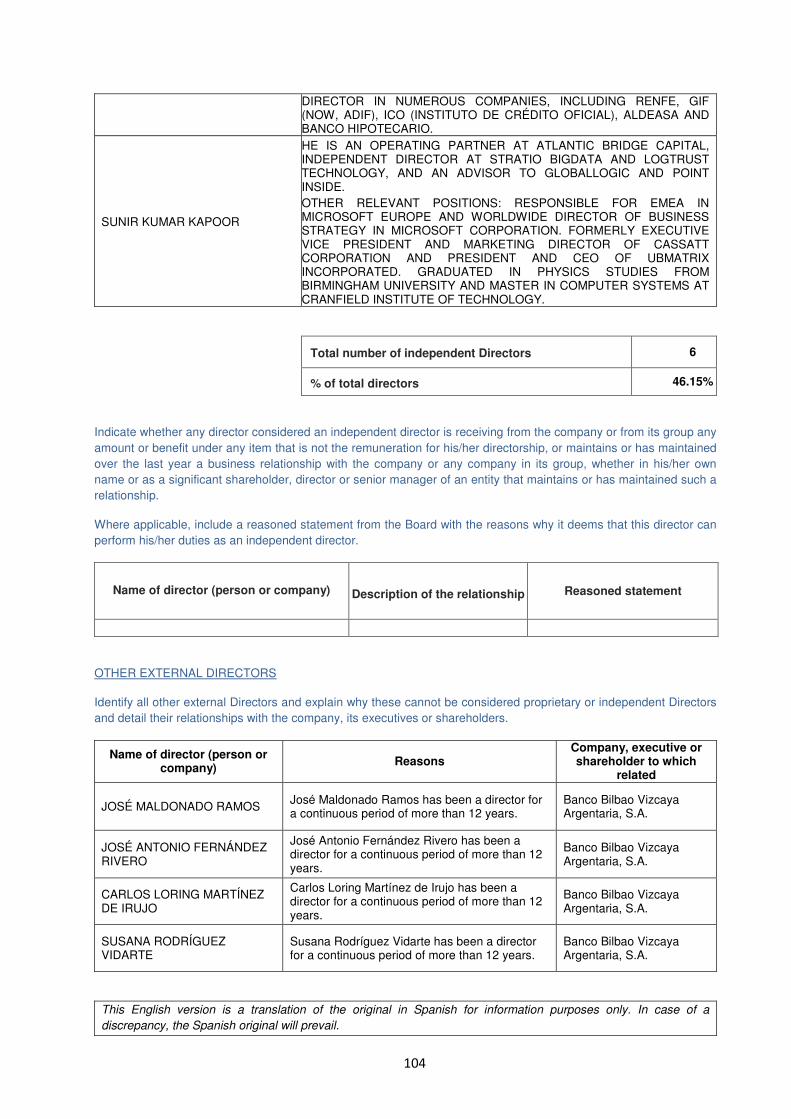
This English version is a translation of the original in Spanish for information purposes only. In case of a
discrepancy, the Spanish original will prevail.
104
DIRECTOR IN NUMEROUS COMPANIES, INCLUDING RENFE, GIF (NOW, ADIF), ICO (INSTITUTO DE CRÉDITO OFICIAL), ALDEASA AND BANCO HIPOTECARIO.
SUNIR KUMAR KAPOOR
HE IS AN OPERATING PARTNER AT ATLANTIC BRIDGE CAPITAL, INDEPENDENT DIRECTOR AT STRATIO BIGDATA AND LOGTRUST TECHNOLOGY, AND AN ADVISOR TO GLOBALLOGIC AND POINT INSIDE.
OTHER RELEVANT POSITIONS: RESPONSIBLE FOR EMEA IN MICROSOFT EUROPE AND WORLDWIDE DIRECTOR OF BUSINESS STRATEGY IN MICROSOFT CORPORATION. FORMERLY EXECUTIVE VICE PRESIDENT AND MARKETING DIRECTOR OF CASSATT CORPORATION AND PRESIDENT AND CEO OF UBMATRIX INCORPORATED. GRADUATED IN PHYSICS STUDIES FROM BIRMINGHAM UNIVERSITY AND MASTER IN COMPUTER SYSTEMS AT CRANFIELD INSTITUTE OF TECHNOLOGY.
Total number of independent Directors 6
% of total directors 46.15%
Indicate whether any director considered an independent director is receiving from the company or from its group any
amount or benefit under any item that is not the remuneration for his/her directorship, or maintains or has maintained
over the last year a business relationship with the company or any company in its group, whether in his/her own
name or as a significant shareholder, director or senior manager of an entity that maintains or has maintained such a
relationship.
Where applicable, include a reasoned statement from the Board with the reasons why it deems that this director can
perform his/her duties as an independent director.
Name of director (person or company)
Description of the relationship Reasoned statement
OTHER EXTERNAL DIRECTORS
Identify all other external Directors and explain why these cannot be considered proprietary or independent Directors
and detail their relationships with the company, its executives or shareholders.
Name of director (person or company)
Reasons Company, executive or shareholder to which
related
JOSÉ MALDONADO RAMOS José Maldonado Ramos has been a director for a continuous period of more than 12 years.
Banco Bilbao Vizcaya Argentaria, S.A.
JOSÉ ANTONIO FERNÁNDEZ RIVERO
José Antonio Fernández Rivero has been a director for a continuous period of more than 12 years.
Banco Bilbao Vizcaya Argentaria, S.A.
CARLOS LORING MARTÍNEZ DE IRUJO
Carlos Loring Martínez de Irujo has been a director for a continuous period of more than 12 years.
Banco Bilbao Vizcaya Argentaria, S.A.
SUSANA RODRÍGUEZ VIDARTE
Susana Rodríguez Vidarte has been a director for a continuous period of more than 12 years.
Banco Bilbao Vizcaya Argentaria, S.A.
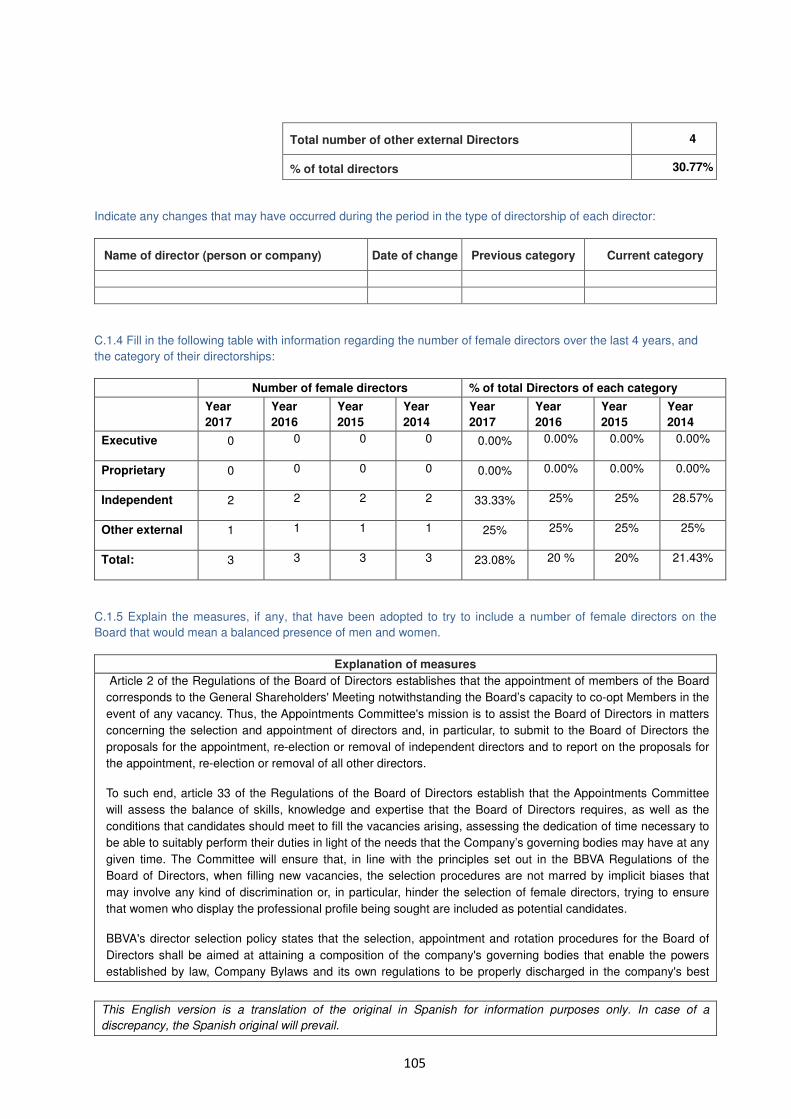
This English version is a translation of the original in Spanish for information purposes only. In case of a
discrepancy, the Spanish original will prevail.
105
Total number of other external Directors 4
% of total directors 30.77%
Indicate any changes that may have occurred during the period in the type of directorship of each director:
Name of director (person or company) Date of change Previous category Current category
C.1.4 Fill in the following table with information regarding the number of female directors over the last 4 years, and
the category of their directorships:
Number of female directors % of total Directors of each category
Year
2017
Year
2016
Year
2015
Year
2014
Year
2017
Year
2016
Year
2015
Year
2014
Executive 0 0 0 0 0.00% 0.00% 0.00% 0.00%
Proprietary 0 0 0 0 0.00% 0.00% 0.00% 0.00%
Independent 2 2 2 2 33.33% 25% 25% 28.57%
Other external 1 1 1 1 25% 25% 25% 25%
Total: 3 3 3 3 23.08% 20 % 20% 21.43%
C.1.5 Explain the measures, if any, that have been adopted to try to include a number of female directors on the
Board that would mean a balanced presence of men and women.
Explanation of measures
Article 2 of the Regulations of the Board of Directors establishes that the appointment of members of the Board
corresponds to the General Shareholders' Meeting notwithstanding the Board’s capacity to co-opt Members in the
event of any vacancy. Thus, the Appointments Committee's mission is to assist the Board of Directors in matters
concerning the selection and appointment of directors and, in particular, to submit to the Board of Directors the
proposals for the appointment, re-election or removal of independent directors and to report on the proposals for
the appointment, re-election or removal of all other directors.
To such end, article 33 of the Regulations of the Board of Directors establish that the Appointments Committee
will assess the balance of skills, knowledge and expertise that the Board of Directors requires, as well as the
conditions that candidates should meet to fill the vacancies arising, assessing the dedication of time necessary to
be able to suitably perform their duties in light of the needs that the Company’s governing bodies may have at any
given time. The Committee will ensure that, in line with the principles set out in the BBVA Regulations of the
Board of Directors, when filling new vacancies, the selection procedures are not marred by implicit biases that
may involve any kind of discrimination or, in particular, hinder the selection of female directors, trying to ensure
that women who display the professional profile being sought are included as potential candidates.
BBVA's director selection policy states that the selection, appointment and rotation procedures for the Board of
Directors shall be aimed at attaining a composition of the company's governing bodies that enable the powers
established by law, Company Bylaws and its own regulations to be properly discharged in the company's best
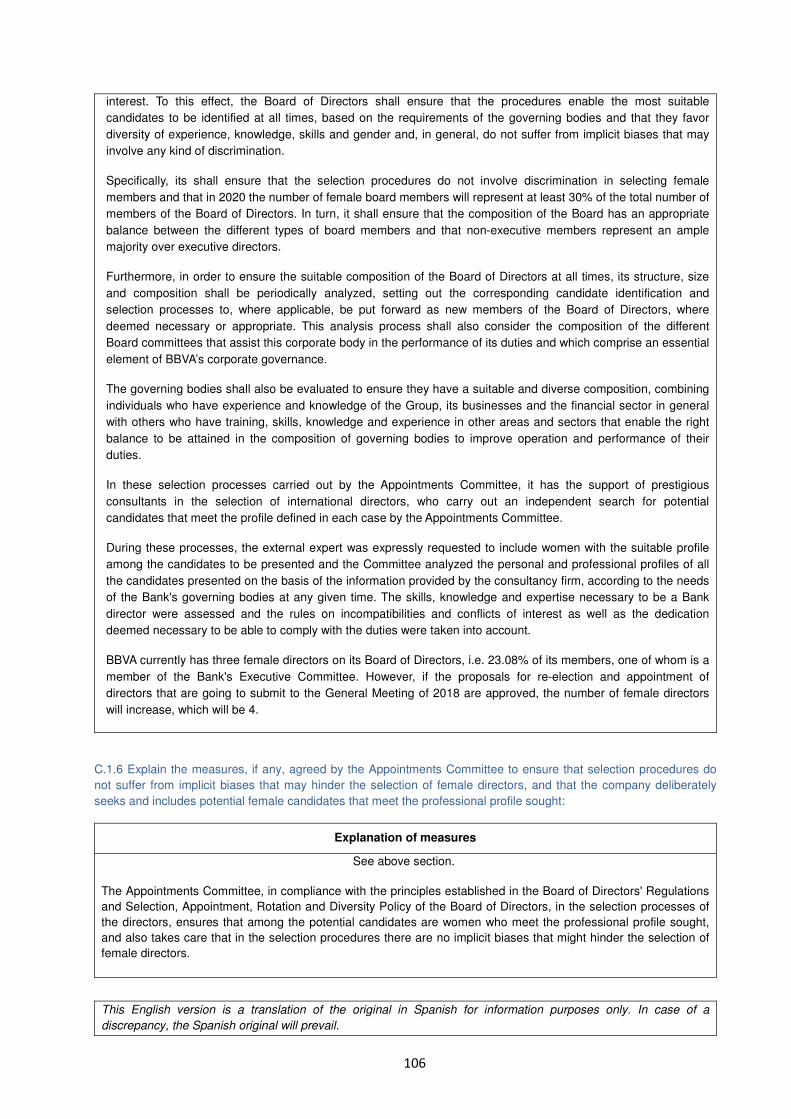
This English version is a translation of the original in Spanish for information purposes only. In case of a
discrepancy, the Spanish original will prevail.
106
interest. To this effect, the Board of Directors shall ensure that the procedures enable the most suitable
candidates to be identified at all times, based on the requirements of the governing bodies and that they favor
diversity of experience, knowledge, skills and gender and, in general, do not suffer from implicit biases that may
involve any kind of discrimination.
Specifically, its shall ensure that the selection procedures do not involve discrimination in selecting female
members and that in 2020 the number of female board members will represent at least 30% of the total number of
members of the Board of Directors. In turn, it shall ensure that the composition of the Board has an appropriate
balance between the different types of board members and that non-executive members represent an ample
majority over executive directors.
Furthermore, in order to ensure the suitable composition of the Board of Directors at all times, its structure, size
and composition shall be periodically analyzed, setting out the corresponding candidate identification and
selection processes to, where applicable, be put forward as new members of the Board of Directors, where
deemed necessary or appropriate. This analysis process shall also consider the composition of the different
Board committees that assist this corporate body in the performance of its duties and which comprise an essential
element of BBVA’s corporate governance.
The governing bodies shall also be evaluated to ensure they have a suitable and diverse composition, combining
individuals who have experience and knowledge of the Group, its businesses and the financial sector in general
with others who have training, skills, knowledge and experience in other areas and sectors that enable the right
balance to be attained in the composition of governing bodies to improve operation and performance of their
duties.
In these selection processes carried out by the Appointments Committee, it has the support of prestigious
consultants in the selection of international directors, who carry out an independent search for potential
candidates that meet the profile defined in each case by the Appointments Committee.
During these processes, the external expert was expressly requested to include women with the suitable profile
among the candidates to be presented and the Committee analyzed the personal and professional profiles of all
the candidates presented on the basis of the information provided by the consultancy firm, according to the needs
of the Bank's governing bodies at any given time. The skills, knowledge and expertise necessary to be a Bank
director were assessed and the rules on incompatibilities and conflicts of interest as well as the dedication
deemed necessary to be able to comply with the duties were taken into account.
BBVA currently has three female directors on its Board of Directors, i.e. 23.08% of its members, one of whom is a
member of the Bank's Executive Committee. However, if the proposals for re-election and appointment of
directors that are going to submit to the General Meeting of 2018 are approved, the number of female directors
will increase, which will be 4.
C.1.6 Explain the measures, if any, agreed by the Appointments Committee to ensure that selection procedures do
not suffer from implicit biases that may hinder the selection of female directors, and that the company deliberately
seeks and includes potential female candidates that meet the professional profile sought:
Explanation of measures
See above section.
The Appointments Committee, in compliance with the principles established in the Board of Directors' Regulations
and Selection, Appointment, Rotation and Diversity Policy of the Board of Directors, in the selection processes of
the directors, ensures that among the potential candidates are women who meet the professional profile sought,
and also takes care that in the selection procedures there are no implicit biases that might hinder the selection of
female directors.
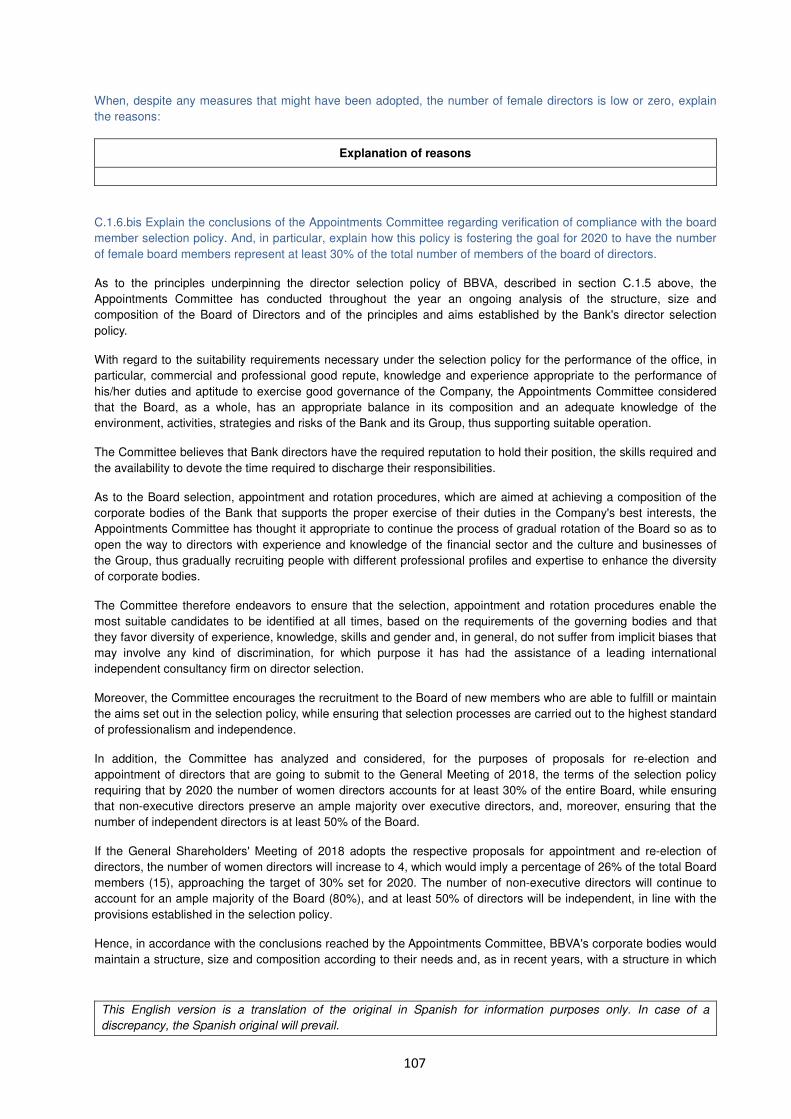
This English version is a translation of the original in Spanish for information purposes only. In case of a
discrepancy, the Spanish original will prevail.
107
When, despite any measures that might have been adopted, the number of female directors is low or zero, explain
the reasons:
Explanation of reasons
C.1.6.bis Explain the conclusions of the Appointments Committee regarding verification of compliance with the board
member selection policy. And, in particular, explain how this policy is fostering the goal for 2020 to have the number
of female board members represent at least 30% of the total number of members of the board of directors.
As to the principles underpinning the director selection policy of BBVA, described in section C.1.5 above, the
Appointments Committee has conducted throughout the year an ongoing analysis of the structure, size and
composition of the Board of Directors and of the principles and aims established by the Bank's director selection
policy.
With regard to the suitability requirements necessary under the selection policy for the performance of the office, in
particular, commercial and professional good repute, knowledge and experience appropriate to the performance of
his/her duties and aptitude to exercise good governance of the Company, the Appointments Committee considered
that the Board, as a whole, has an appropriate balance in its composition and an adequate knowledge of the
environment, activities, strategies and risks of the Bank and its Group, thus supporting suitable operation.
The Committee believes that Bank directors have the required reputation to hold their position, the skills required and
the availability to devote the time required to discharge their responsibilities.
As to the Board selection, appointment and rotation procedures, which are aimed at achieving a composition of the
corporate bodies of the Bank that supports the proper exercise of their duties in the Company's best interests, the
Appointments Committee has thought it appropriate to continue the process of gradual rotation of the Board so as to
open the way to directors with experience and knowledge of the financial sector and the culture and businesses of
the Group, thus gradually recruiting people with different professional profiles and expertise to enhance the diversity
of corporate bodies.
The Committee therefore endeavors to ensure that the selection, appointment and rotation procedures enable the
most suitable candidates to be identified at all times, based on the requirements of the governing bodies and that
they favor diversity of experience, knowledge, skills and gender and, in general, do not suffer from implicit biases that
may involve any kind of discrimination, for which purpose it has had the assistance of a leading international
independent consultancy firm on director selection.
Moreover, the Committee encourages the recruitment to the Board of new members who are able to fulfill or maintain
the aims set out in the selection policy, while ensuring that selection processes are carried out to the highest standard
of professionalism and independence.
In addition, the Committee has analyzed and considered, for the purposes of proposals for re-election and
appointment of directors that are going to submit to the General Meeting of 2018, the terms of the selection policy
requiring that by 2020 the number of women directors accounts for at least 30% of the entire Board, while ensuring
that non-executive directors preserve an ample majority over executive directors, and, moreover, ensuring that the
number of independent directors is at least 50% of the Board.
If the General Shareholders' Meeting of 2018 adopts the respective proposals for appointment and re-election of
directors, the number of women directors will increase to 4, which would imply a percentage of 26% of the total Board
members (15), approaching the target of 30% set for 2020. The number of non-executive directors will continue to
account for an ample majority of the Board (80%), and at least 50% of directors will be independent, in line with the
provisions established in the selection policy.
Hence, in accordance with the conclusions reached by the Appointments Committee, BBVA's corporate bodies would
maintain a structure, size and composition according to their needs and, as in recent years, with a structure in which
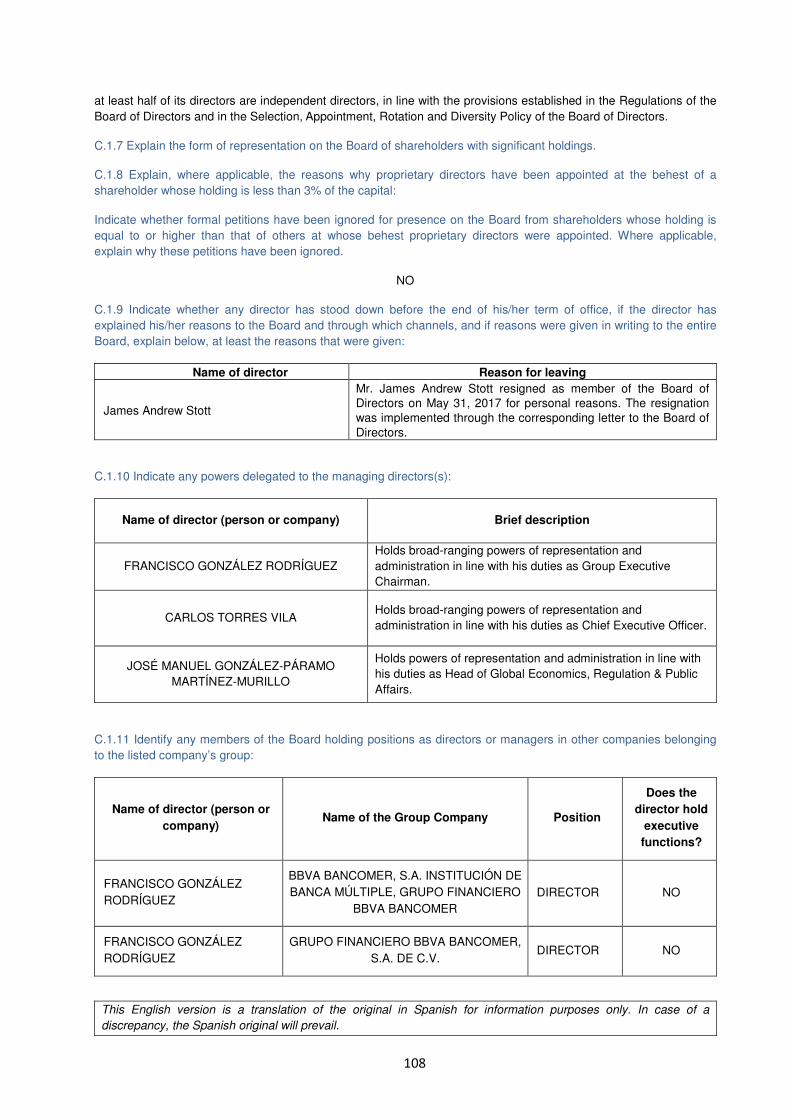
This English version is a translation of the original in Spanish for information purposes only. In case of a
discrepancy, the Spanish original will prevail.
108
at least half of its directors are independent directors, in line with the provisions established in the Regulations of the
Board of Directors and in the Selection, Appointment, Rotation and Diversity Policy of the Board of Directors.
C.1.7 Explain the form of representation on the Board of shareholders with significant holdings.
C.1.8 Explain, where applicable, the reasons why proprietary directors have been appointed at the behest of a
shareholder whose holding is less than 3% of the capital:
Indicate whether formal petitions have been ignored for presence on the Board from shareholders whose holding is
equal to or higher than that of others at whose behest proprietary directors were appointed. Where applicable,
explain why these petitions have been ignored.
NO
C.1.9 Indicate whether any director has stood down before the end of his/her term of office, if the director has
explained his/her reasons to the Board and through which channels, and if reasons were given in writing to the entire
Board, explain below, at least the reasons that were given:
Name of director Reason for leaving
James Andrew Stott
Mr. James Andrew Stott resigned as member of the Board of
Directors on May 31, 2017 for personal reasons. The resignation
was implemented through the corresponding letter to the Board of
Directors.
C.1.10 Indicate any powers delegated to the managing directors(s):
Name of director (person or company) Brief description
FRANCISCO GONZÁLEZ RODRÍGUEZ
Holds broad-ranging powers of representation and
administration in line with his duties as Group Executive
Chairman.
CARLOS TORRES VILA Holds broad-ranging powers of representation and
administration in line with his duties as Chief Executive Officer.
JOSÉ MANUEL GONZÁLEZ-PÁRAMO
MARTÍNEZ-MURILLO
Holds powers of representation and administration in line with
his duties as Head of Global Economics, Regulation & Public
Affairs.
C.1.11 Identify any members of the Board holding positions as directors or managers in other companies belonging
to the listed company’s group:
Name of director (person or
company) Name of the Group Company Position
Does the
director hold
executive
functions?
FRANCISCO GONZÁLEZ
RODRÍGUEZ
BBVA BANCOMER, S.A. INSTITUCIÓN DE
BANCA MÚLTIPLE, GRUPO FINANCIERO
BBVA BANCOMER
DIRECTOR NO
FRANCISCO GONZÁLEZ
RODRÍGUEZ
GRUPO FINANCIERO BBVA BANCOMER,
S.A. DE C.V. DIRECTOR NO
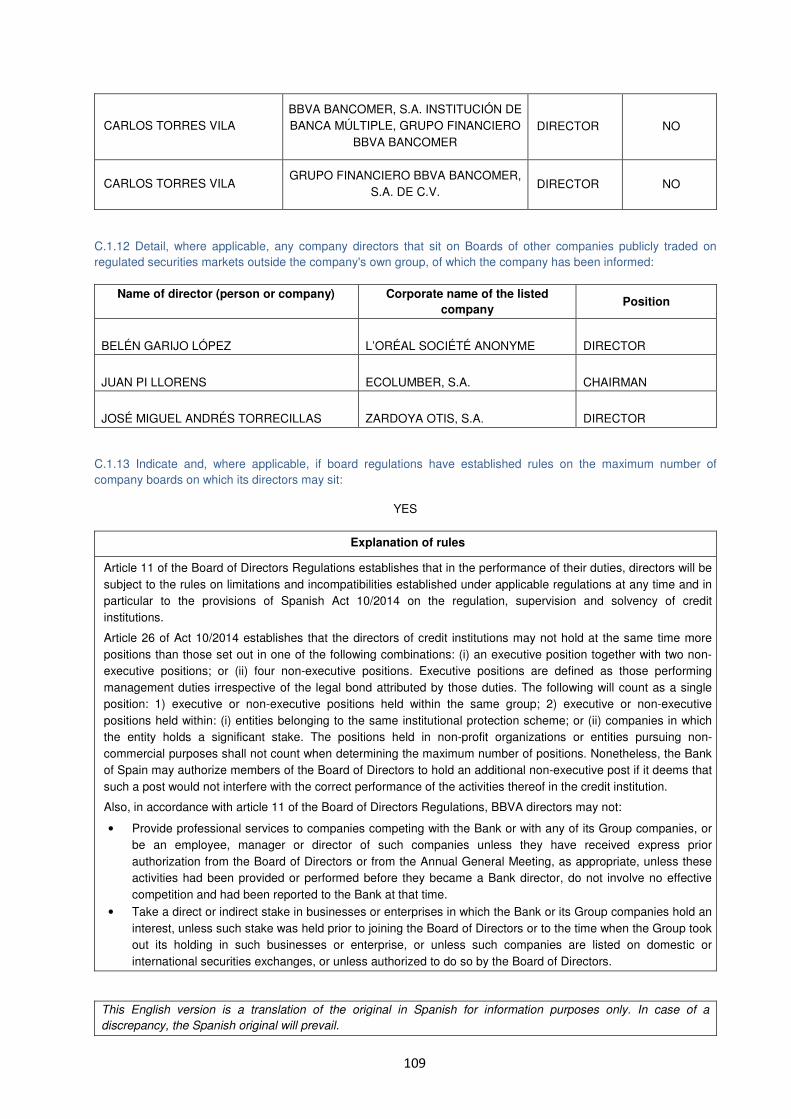
This English version is a translation of the original in Spanish for information purposes only. In case of a
discrepancy, the Spanish original will prevail.
109
CARLOS TORRES VILA
BBVA BANCOMER, S.A. INSTITUCIÓN DE
BANCA MÚLTIPLE, GRUPO FINANCIERO
BBVA BANCOMER
DIRECTOR NO
CARLOS TORRES VILA GRUPO FINANCIERO BBVA BANCOMER,
S.A. DE C.V. DIRECTOR NO
C.1.12 Detail, where applicable, any company directors that sit on Boards of other companies publicly traded on
regulated securities markets outside the company's own group, of which the company has been informed:
Name of director (person or company) Corporate name of the listed
company Position
BELÉN GARIJO LÓPEZ
L’ORÉAL SOCIÉTÉ ANONYME
DIRECTOR
JUAN PI LLORENS
ECOLUMBER, S.A.
CHAIRMAN
JOSÉ MIGUEL ANDRÉS TORRECILLAS
ZARDOYA OTIS, S.A.
DIRECTOR
C.1.13 Indicate and, where applicable, if board regulations have established rules on the maximum number of
company boards on which its directors may sit:
YES
Explanation of rules
Article 11 of the Board of Directors Regulations establishes that in the performance of their duties, directors will be
subject to the rules on limitations and incompatibilities established under applicable regulations at any time and in
particular to the provisions of Spanish Act 10/2014 on the regulation, supervision and solvency of credit
institutions.
Article 26 of Act 10/2014 establishes that the directors of credit institutions may not hold at the same time more
positions than those set out in one of the following combinations: (i) an executive position together with two non-
executive positions; or (ii) four non-executive positions. Executive positions are defined as those performing
management duties irrespective of the legal bond attributed by those duties. The following will count as a single
position: 1) executive or non-executive positions held within the same group; 2) executive or non-executive
positions held within: (i) entities belonging to the same institutional protection scheme; or (ii) companies in which
the entity holds a significant stake. The positions held in non-profit organizations or entities pursuing non-
commercial purposes shall not count when determining the maximum number of positions. Nonetheless, the Bank
of Spain may authorize members of the Board of Directors to hold an additional non-executive post if it deems that
such a post would not interfere with the correct performance of the activities thereof in the credit institution.
Also, in accordance with article 11 of the Board of Directors Regulations, BBVA directors may not:
• Provide professional services to companies competing with the Bank or with any of its Group companies, or
be an employee, manager or director of such companies unless they have received express prior
authorization from the Board of Directors or from the Annual General Meeting, as appropriate, unless these
activities had been provided or performed before they became a Bank director, do not involve no effective
competition and had been reported to the Bank at that time.
• Take a direct or indirect stake in businesses or enterprises in which the Bank or its Group companies hold an
interest, unless such stake was held prior to joining the Board of Directors or to the time when the Group took
out its holding in such businesses or enterprise, or unless such companies are listed on domestic or
international securities exchanges, or unless authorized to do so by the Board of Directors.
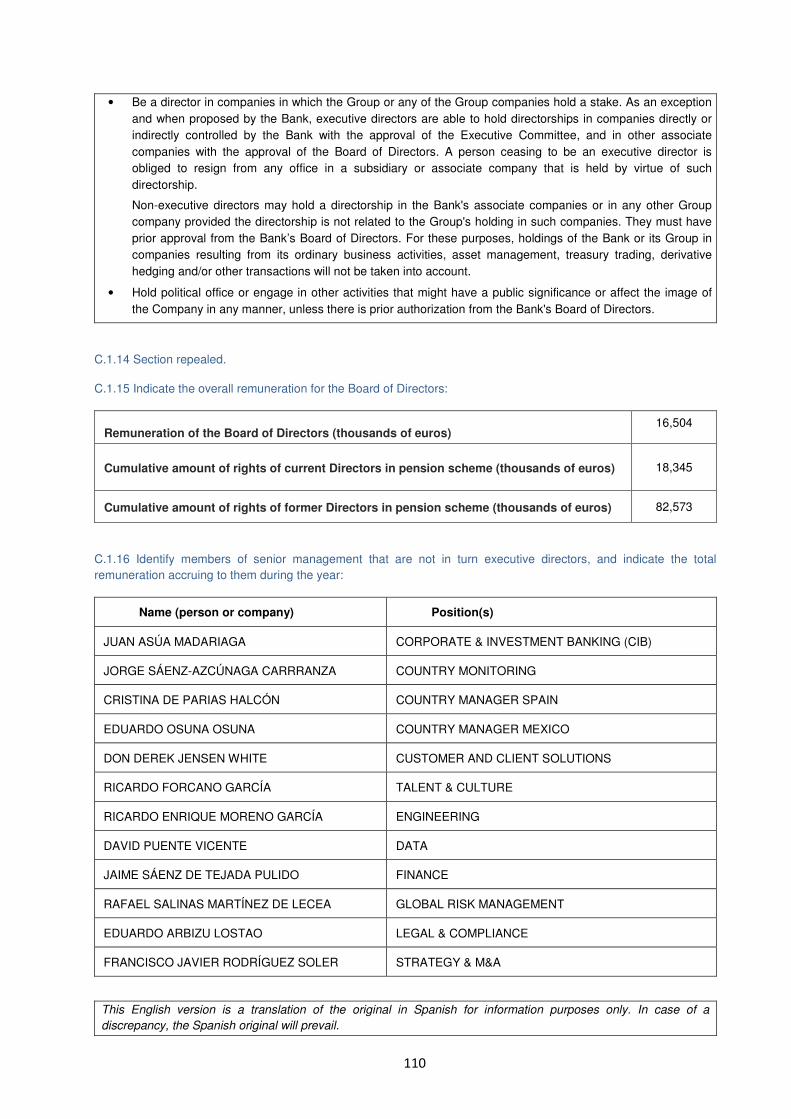
This English version is a translation of the original in Spanish for information purposes only. In case of a
discrepancy, the Spanish original will prevail.
110
• Be a director in companies in which the Group or any of the Group companies hold a stake. As an exception
and when proposed by the Bank, executive directors are able to hold directorships in companies directly or
indirectly controlled by the Bank with the approval of the Executive Committee, and in other associate
companies with the approval of the Board of Directors. A person ceasing to be an executive director is
obliged to resign from any office in a subsidiary or associate company that is held by virtue of such
directorship.
Non-executive directors may hold a directorship in the Bank's associate companies or in any other Group
company provided the directorship is not related to the Group's holding in such companies. They must have
prior approval from the Bank’s Board of Directors. For these purposes, holdings of the Bank or its Group in
companies resulting from its ordinary business activities, asset management, treasury trading, derivative
hedging and/or other transactions will not be taken into account.
• Hold political office or engage in other activities that might have a public significance or affect the image of
the Company in any manner, unless there is prior authorization from the Bank's Board of Directors.
C.1.14 Section repealed.
C.1.15 Indicate the overall remuneration for the Board of Directors:
Remuneration of the Board of Directors (thousands of euros)
16,504
Cumulative amount of rights of current Directors in pension scheme (thousands of euros) 18,345
Cumulative amount of rights of former Directors in pension scheme (thousands of euros) 82,573
C.1.16 Identify members of senior management that are not in turn executive directors, and indicate the total
remuneration accruing to them during the year:
Name (person or company) Position(s)
JUAN ASÚA MADARIAGA CORPORATE & INVESTMENT BANKING (CIB)
JORGE SÁENZ-AZCÚNAGA CARRRANZA COUNTRY MONITORING
CRISTINA DE PARIAS HALCÓN COUNTRY MANAGER SPAIN
EDUARDO OSUNA OSUNA COUNTRY MANAGER MEXICO
DON DEREK JENSEN WHITE CUSTOMER AND CLIENT SOLUTIONS
RICARDO FORCANO GARCÍA TALENT & CULTURE
RICARDO ENRIQUE MORENO GARCÍA ENGINEERING
DAVID PUENTE VICENTE DATA
JAIME SÁENZ DE TEJADA PULIDO FINANCE
RAFAEL SALINAS MARTÍNEZ DE LECEA GLOBAL RISK MANAGEMENT
EDUARDO ARBIZU LOSTAO LEGAL & COMPLIANCE
FRANCISCO JAVIER RODRÍGUEZ SOLER STRATEGY & M&A
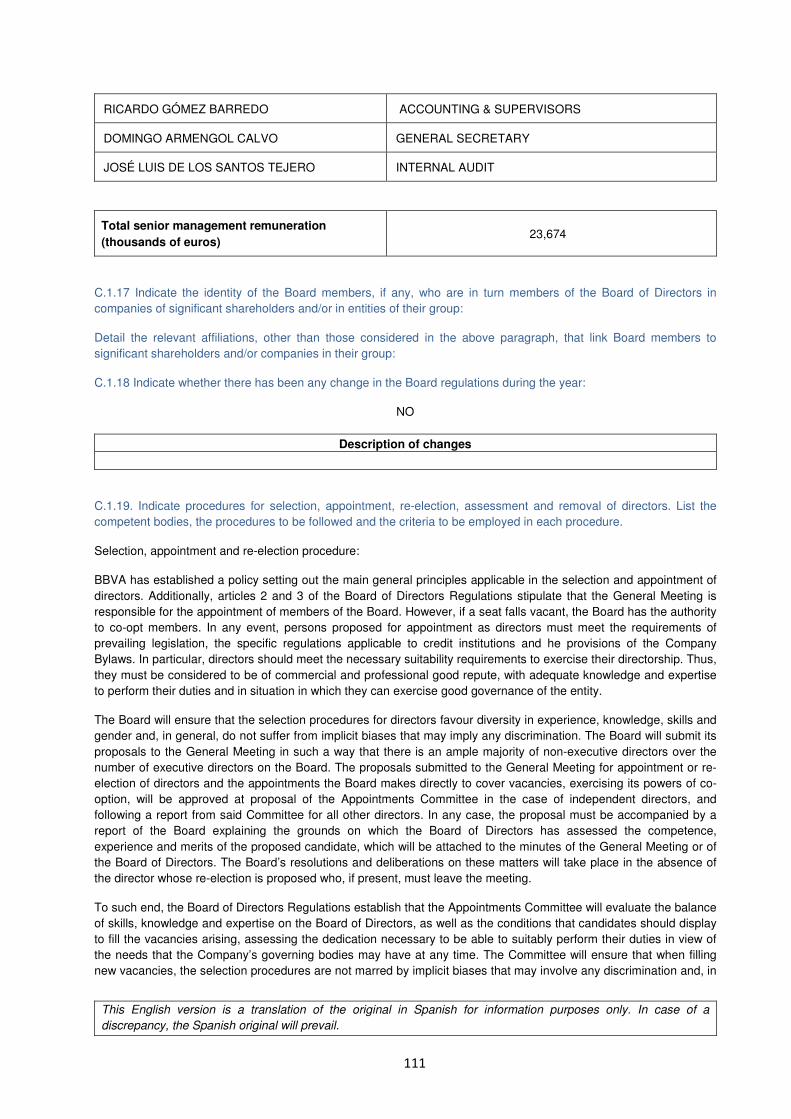
This English version is a translation of the original in Spanish for information purposes only. In case of a
discrepancy, the Spanish original will prevail.
111
RICARDO GÓMEZ BARREDO ACCOUNTING & SUPERVISORS
DOMINGO ARMENGOL CALVO GENERAL SECRETARY
JOSÉ LUIS DE LOS SANTOS TEJERO INTERNAL AUDIT
Total senior management remuneration
(thousands of euros) 23,674
C.1.17 Indicate the identity of the Board members, if any, who are in turn members of the Board of Directors in
companies of significant shareholders and/or in entities of their group:
Detail the relevant affiliations, other than those considered in the above paragraph, that link Board members to
significant shareholders and/or companies in their group:
C.1.18 Indicate whether there has been any change in the Board regulations during the year:
NO
Description of changes
C.1.19. Indicate procedures for selection, appointment, re-election, assessment and removal of directors. List the
competent bodies, the procedures to be followed and the criteria to be employed in each procedure.
Selection, appointment and re-election procedure:
BBVA has established a policy setting out the main general principles applicable in the selection and appointment of
directors. Additionally, articles 2 and 3 of the Board of Directors Regulations stipulate that the General Meeting is
responsible for the appointment of members of the Board. However, if a seat falls vacant, the Board has the authority
to co-opt members. In any event, persons proposed for appointment as directors must meet the requirements of
prevailing legislation, the specific regulations applicable to credit institutions and he provisions of the Company
Bylaws. In particular, directors should meet the necessary suitability requirements to exercise their directorship. Thus,
they must be considered to be of commercial and professional good repute, with adequate knowledge and expertise
to perform their duties and in situation in which they can exercise good governance of the entity.
The Board will ensure that the selection procedures for directors favour diversity in experience, knowledge, skills and
gender and, in general, do not suffer from implicit biases that may imply any discrimination. The Board will submit its
proposals to the General Meeting in such a way that there is an ample majority of non-executive directors over the
number of executive directors on the Board. The proposals submitted to the General Meeting for appointment or re-
election of directors and the appointments the Board makes directly to cover vacancies, exercising its powers of co-
option, will be approved at proposal of the Appointments Committee in the case of independent directors, and
following a report from said Committee for all other directors. In any case, the proposal must be accompanied by a
report of the Board explaining the grounds on which the Board of Directors has assessed the competence,
experience and merits of the proposed candidate, which will be attached to the minutes of the General Meeting or of
the Board of Directors. The Board’s resolutions and deliberations on these matters will take place in the absence of
the director whose re-election is proposed who, if present, must leave the meeting.
To such end, the Board of Directors Regulations establish that the Appointments Committee will evaluate the balance
of skills, knowledge and expertise on the Board of Directors, as well as the conditions that candidates should display
to fill the vacancies arising, assessing the dedication necessary to be able to suitably perform their duties in view of
the needs that the Company’s governing bodies may have at any time. The Committee will ensure that when filling
new vacancies, the selection procedures are not marred by implicit biases that may involve any discrimination and, in
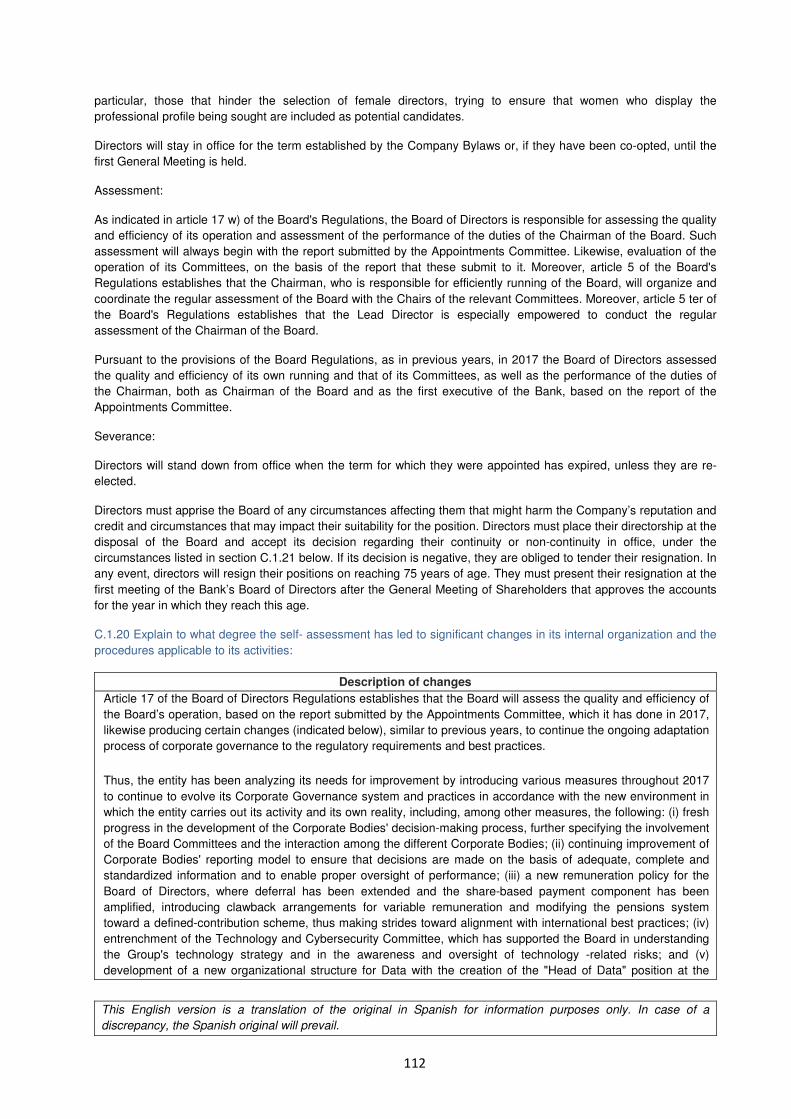
This English version is a translation of the original in Spanish for information purposes only. In case of a
discrepancy, the Spanish original will prevail.
112
particular, those that hinder the selection of female directors, trying to ensure that women who display the
professional profile being sought are included as potential candidates.
Directors will stay in office for the term established by the Company Bylaws or, if they have been co-opted, until the
first General Meeting is held.
Assessment:
As indicated in article 17 w) of the Board's Regulations, the Board of Directors is responsible for assessing the quality
and efficiency of its operation and assessment of the performance of the duties of the Chairman of the Board. Such
assessment will always begin with the report submitted by the Appointments Committee. Likewise, evaluation of the
operation of its Committees, on the basis of the report that these submit to it. Moreover, article 5 of the Board's
Regulations establishes that the Chairman, who is responsible for efficiently running of the Board, will organize and
coordinate the regular assessment of the Board with the Chairs of the relevant Committees. Moreover, article 5 ter of
the Board's Regulations establishes that the Lead Director is especially empowered to conduct the regular
assessment of the Chairman of the Board.
Pursuant to the provisions of the Board Regulations, as in previous years, in 2017 the Board of Directors assessed
the quality and efficiency of its own running and that of its Committees, as well as the performance of the duties of
the Chairman, both as Chairman of the Board and as the first executive of the Bank, based on the report of the
Appointments Committee.
Severance:
Directors will stand down from office when the term for which they were appointed has expired, unless they are re-
elected.
Directors must apprise the Board of any circumstances affecting them that might harm the Company’s reputation and
credit and circumstances that may impact their suitability for the position. Directors must place their directorship at the
disposal of the Board and accept its decision regarding their continuity or non-continuity in office, under the
circumstances listed in section C.1.21 below. If its decision is negative, they are obliged to tender their resignation. In
any event, directors will resign their positions on reaching 75 years of age. They must present their resignation at the
first meeting of the Bank’s Board of Directors after the General Meeting of Shareholders that approves the accounts
for the year in which they reach this age.
C.1.20 Explain to what degree the self- assessment has led to significant changes in its internal organization and the
procedures applicable to its activities:
Description of changes
Article 17 of the Board of Directors Regulations establishes that the Board will assess the quality and efficiency of
the Board’s operation, based on the report submitted by the Appointments Committee, which it has done in 2017,
likewise producing certain changes (indicated below), similar to previous years, to continue the ongoing adaptation
process of corporate governance to the regulatory requirements and best practices.
Thus, the entity has been analyzing its needs for improvement by introducing various measures throughout 2017
to continue to evolve its Corporate Governance system and practices in accordance with the new environment in
which the entity carries out its activity and its own reality, including, among other measures, the following: (i) fresh
progress in the development of the Corporate Bodies' decision-making process, further specifying the involvement
of the Board Committees and the interaction among the different Corporate Bodies; (ii) continuing improvement of
Corporate Bodies' reporting model to ensure that decisions are made on the basis of adequate, complete and
standardized information and to enable proper oversight of performance; (iii) a new remuneration policy for the
Board of Directors, where deferral has been extended and the share-based payment component has been
amplified, introducing clawback arrangements for variable remuneration and modifying the pensions system
toward a defined-contribution scheme, thus making strides toward alignment with international best practices; (iv)
entrenchment of the Technology and Cybersecurity Committee, which has supported the Board in understanding
the Group's technology strategy and in the awareness and oversight of technology -related risks; and (v)
development of a new organizational structure for Data with the creation of the "Head of Data" position at the
This English version is a translation of the original in Spanish for information purposes only. In case of a
discrepancy, the Spanish original will prevail.
113
highest level of the organization to drive the integration of global and strategic data management in all areas and
businesses of the Bank, and of the "Data Protection Officer" position to equip the Group with a system for data
control and protection that is suited to the new supervisory and business environment.
C.1.20.bis Describe the assessment process and the assessed areas conducted by the board of directors assisted,
as the case may be, by an external consultant, regarding the diversity in its composition and capacities, duties and
composition of its committees, the performance of the chair of the board of directors and the first executive of the
company, and the performance and contribution of each board member.
According to article 17 of the Board of Directors Regulations, the Board shall evaluate the quality and efficiency of its
running and the performance of the functions of the Chairman of the Board, based in each case on the report
submitted by the Appointments Committee. Likewise, the Board of Directors shall assess of the running of its
Committees, based on the report they submit.
In the most recent assessment process carried out for 2017, the Board of Directors has assessed: (i) the quality and
efficiency of the Board of Directors' and of the Executive Committee`s operation, (ii) the performance of the Chairman
of the Board of Directors; and (iii) the running of the Committees of the Board of Directors. The procedure to conduct
these assessments was:
• Throughout the year, the Appointments Committee has been analyzing the structure, size and composition of
the Board of Directors during the selection processes to incorporate new members of the Board of Directors,
re-elect directors and while conducting the yearly assessment on the running of the Board of Directors. Thus
the quality and efficiency of the running of the Board of Directors and the Executive Committee was examined
based on the prior report submitted by the Appointments Committee and conveyed to the Board of Directors
where the following matters were reviewed in detail: structure, size and composition of the Board of Directors;
organization, preparation and development of the meetings of the Board of Directors; adequate dedication of
time by Board members; training of members of the Board of Directors and activity of the Board of Directors.
The Appointments Committee, with a view to drawing up its prior report, had the support of a report on the
activities carried out throughout the year by the Board of Directors and the Executive Committee containing
detailed information on the composition and operations thereof, and on the main activities implemented by
these bodies in the performance of the duties attributed thereto by the Company Bylaws and the Regulations
of the Board of Directors.
• The performance of the duties of the Chairman of the Board of Directors, as Chairman and as first executive,
was carried out by the Board of Directors on the basis of a report on its activities during the year and taking
into account the previous report of the Appointments Committee, the Lead Director having conducted the
evaluation process in accordance with the provisions of Article 5 ter of the Board Regulations.
• The Board of Directors conducted the quality and efficiency assessment on the operations of the Audit and
Compliance, Risk, Appointments, Remuneration and Technology and Cybersecurity Committees based on the
reports submitted by their respective Chairs. The activity of the Audit and Compliance Committee is reported
quarterly to the Board at meetings held throughout the year. In addition, the Committee Chair, at the Board
meeting of February 12, 2018, accounted for the oversight work done on the preparation of the Group's
financial statements, the project to implement accounting standard IFRS 9, as well as the oversight of the
adequacy, sufficiency and effective operation of internal control systems in the course of financial reporting.
Moreover, during its meeting on November 29, 2017, the Board of Directors received the report of the director
Chair of the Risk Committee regarding the activities undertaken by the Committee during 2017, reporting on
the tasks executed by the Committee in its ongoing monitoring and oversight of changes in the risks faced by
the Group and the extent to which consistency is maintained with specified strategies and policies. Moreover,
at its meeting of January 31, 2018 the Board heard a report by the Chair of the Remuneration Committee on
that body's activity throughout 2017. Among other matters, the Board was briefed on the work done by the
Committee to prepare and implement the draft resolutions submitted to the Board on remuneration, especially
as to remuneration of executive directors and senior management, and the other projects developed regarding
the adoption of the new remuneration policies of directors, identified staff and BBVA Group. Likewise, in its
session on 31 January 2018, the Board received the report of the director Chair of the Appointments
Committee regarding the activities undertaken by the Committee during 2017 within the different scopes of
This English version is a translation of the original in Spanish for information purposes only. In case of a
discrepancy, the Spanish original will prevail.
114
duties. Finally, at its meeting of November 29, 2017, the Board was briefed by the Chair of the Technology and
Cybersecurity Committee on that body's activities since its constitution in 2016. The Board was briefed, inter
alia, on the review of the global organization of the Engineering Area, the new Group strategy and the ERCA
team's assessment of the Engineering area as to Group's cybersecurity risk.
C.1.20.ter Break down, where pertinent, the business relationship that the consultant or any company of its group
maintains with the company or any company of its group.
C.1.21 Indicate the circumstances under which directors are obliged to resign.
In addition to the circumstances set out in applicable legislation, as established in article 12 of the BBVA Board of
Directors Regulations, the directors shall resign from their office when the term for which they were appointed has
expired, unless they are re-elected. Directors must apprise the Board of Directors of any circumstances affecting
them that might harm the Company’s reputation and credit circumstances that may impact their suitability for the
position.
As set out in article 12 of the BBVA Board of Directors Regulations, directors must place their office at the disposal of
the Board of Directors and accept the Board’s decision regarding their continuity or non-continuity in office. Should
the Board resolve they not continue, they will be obliged to tender their resignation, in the following circumstances:
- When they are affected by circumstances of incompatibility or prohibition as defined under prevailing legislation, in
the Company Bylaws or in the Board of Directors Regulation;
- When significant changes occur in their personal or professional situation that may affect the condition by virtue of
which they were appointed to the Board;
- When they are in serious dereliction of their duties as directors;
- When for reasons attributable to the director in his or her condition as such, serious damage has been done to the
Company's net worth, credit or reputation; or
- When they lose their suitability to hold the position of director of the Bank.
C.1.22 Section repealed.
C.1.23 Are reinforced qualified majorities required, other than the legal majorities, for some type of resolution?
NO
If applicable, describe the differences.
C.1.24 Explain whether there are specific requirements, other than those regarding directors, to be appointed
Chairman of the Board of Directors.
NO
C.1.25 Indicate whether the Chairman has a casting vote:
NO
C.1.26 Indicate whether the bylaws or the Board Regulations establish an age limit for directors:
YES
Age limit for Chairman Age limit for Chief Executive
Officer
Age limit for directors
This English version is a translation of the original in Spanish for information purposes only. In case of a
discrepancy, the Spanish original will prevail.
115
0 0 75
C.1.27 Indicate whether the bylaws or the Board Regulations establish a limited term of office for independent
directors, other than that established by law:
NO
C.1.28 Indicate whether the bylaws or the Board Regulations establish specific rules for proxy voting in the Board of
Directors, the way this is done and, in particular, the maximum number of proxies a director may have, and whether it
has established any limit regarding the categories that may be delegated beyond the limits stipulated by legislation. If
so, briefly give details on such rules.
The BBVA Board of Directors Regulations establishes that directors are required to attend the meetings of corporate
bodies and the meetings of the Board Committees on which they sit, except for a justifiable reason. Directors shall
participate in the deliberations, discussions and debates on matters submitted for their consideration.
However, article 21 of the Board of Directors Regulations establishes that should it not be possible for directors to
attend any of the Board of Directors’ meetings, they may grant proxy to another director to represent and vote for
them. This may be done by a letter or e-mail sent to the Company with the information required for the proxy director
to be able to follow the absent director's instructions, in observance of the applicable legislation, though non-
executive directors may only grant their proxy to another director that is also non-executive.
C.1.29 Indicate the number of meetings the Board of Directors has held during the year. Where applicable, indicate
how many times the Board has met without the Chairman in attendance. In calculating this number, proxies given
with specific instructions will be counted as attendances.
Number of Board meetings 15
Number of Board meetings held without the Chairman’s attendance 0
If the Chairman is an executive Director, indicate the number of meetings held without an executive director present
or represented and chaired by the Lead Director
Number of meetings 0
Indicate the number of meetings of the Board’s different committees held during the year.
Number of Executive Committee meetings 19
Number of Audit and Compliance Committee meetings 14
Number of Appointments Committee meetings 5
Number of Remuneration Committee meetings 5
Number of Risk Committee meetings 20
Number of Technology and Cyber-security Committee meetings 7
C.1.30 Indicate the number of meetings held by the Board of Directors during the year attended by all its members. In
calculating this number, proxies given with specific instructions will be counted as attendances.
Number of meetings attended by all directors 14
% of attendances to total votes during the year 99%
This English version is a translation of the original in Spanish for information purposes only. In case of a
discrepancy, the Spanish original will prevail.
116
C.1.31 Indicate whether the individual and consolidated financial statements presented for Board approval are
certified beforehand:
NO
Where applicable, identify the person(s) who has(have) certified the Company's individual and consolidated financial
statements to be filed by the Board:
C.1.32 Explain the mechanisms, if any, established by the Board of Directors to prevent the individual and
consolidated financial statements that it files from being presented to the General Meeting with a qualified auditors
report.
Article 29 of BBVA's Board of Directors Regulations establishes that the Audit and Compliance Committee will be
formed exclusively by independent directors and its main task is to assist the Board of Directors in overseeing the
financial information and the exercise of the Group control duties. In this regard, its functions are as follows: oversee
the efficacy of the Company's internal control, the internal audit and the risk management systems in the process of
drawing up and reporting the financial information, including tax-related risks, as well as to discuss with the external
auditor any significant weaknesses in the internal control system detected when the audit is conducted, without
undermining its independence and oversee the process of drawing up and reporting the financial information. For
such purposes, the Audit and Compliance Committee may submit recommendations or proposals to the Board of
Directors.
Moreover, article 3 of the Audit and Compliance Committee Regulations establishes that the Committee shall verify
that the external audit schedule is conducted under the agreed conditions at appropriate intervals, and that it meets
the requirements of the competent authorities and the Bank’s governing bodies. The Committee will also periodically
– at least once a year – request from the external auditor its evaluation of the quality of the group’s internal control
procedures regarding the drafting and presentation the financial information of the Group.
The Committee shall also be apprised of any infringements, situations requiring adjustments, or anomalies that may
be detected during the course of the external audit and are of a material nature; materiality in this context signifies
those issues that, in isolation or as a whole, may give rise to a significant and substantive impact or harm to assets,
earnings or the reputation of the Group; discernment of such matters shall be at the discretion of the external auditor
who, if in doubt, must opt to report on them.
In exercising these duties, the Audit and Compliance Committee holds monthly meetings with the external auditor's
representatives without the presence of executives, to monitor their work on an ongoing basis, in order to guarantee
that the activity is carried out under the best conditions and with no interference in management.
C.1.33 Is the company Secretary a director?
NO
Complete if the Secretary is not also a Director:
Name or corporate name of Secretary Representative
DOMINGO ARMENGOL CALVO -
C.1.34 Section repealed.
C.1.35 Indicate the specific mechanisms the company has established, if any, to preserve the independence of the
external auditors, the financial analysts, the investment banks and the rating agencies.
The BBVA Audit and Compliance Committee Regulations establish that this Committee’s duties, described in section
C.2.1, include ensuring the independence of the external auditor in two ways:
This English version is a translation of the original in Spanish for information purposes only. In case of a
discrepancy, the Spanish original will prevail.
117
- Avoiding any possibility of the warnings, opinions or recommendations of the external auditor being adversely
influenced. To this end, the Committee must ensure that compensation for the auditor's work does not compromise
either its quality or independence, in compliance with current legislation on auditing at all times.
- Stipulating as incompatible the provision of audit and consulting services unless they are work required by
supervisors or whose provision by the external auditor is allowed by applicable legislation, and there are not available
in the market alternatives as regards content, quality or efficiency of equal value to those which the auditor could
provide; in this case approval by the Committee will be required, but this decision may be delegated in advance to its
Chair. The external auditor shall be prohibited from providing prohibited services outside the audit, in compliance with
what is set out at all times by audit legislation.
This matter is the subject of special attention by the Audit and Compliance Committee, which holds monthly meetings
with the representatives of the external auditor, without the presence of Bank executives, to know the details of the
progress and quality of their work, as well as to confirm their independence of the performance of their work. It also
monitors the engagement of additional services to ensure compliance with the Committee’s Regulations and
applicable legislation in order to safeguard the independence of the external auditor.
Moreover, in accordance with the provisions of point f), section 4 of article 529 quaterdecies of the Corporate
Enterprises Act and article 30 of the BBVA Board of Directors Regulations, the Audit and Compliance Committee
each year before the external auditor issues their report on the financial statements, has to issue a report expressing
its opinion regarding the independence of the external auditor.
This report must in any event contain the reasoned assessment of the provision of additional services of any kind by
the auditors to the Group's entities, considered individually and as a whole, other than the legal audit and in relation
to the regime of independence or the rules regulating the account audit activity. The external auditor must issue, also
on an annual basis, a report confirming its independence via-à-vis BBVA or entities linked to BBVA, either directly or
indirectly, with information on the additional services of any kind provided to these entities by the external auditor, or
by the individuals or entities linked to them, as set out in the redrafted text of the Audit Act.
In keeping with the legislation in force, the relevant reports confirming the external auditor's independence were
issued in 2017.
In addition, as BBVA's shares are listed on the New York Stock Exchange, it is subject to compliance with the
provisions established in the Sarbanes Oxley Act and its implementing regulations.
Likewise, BBVA has in place a Shareholders and Investors Communication and Contact Policy that has been adopted
by the Board of Directors. The policy is guided by the principle of equal treatment for all shareholders and investors,
who are in the same position in terms of information, involvement and the exercise of their rights as shareholders and
investors, inter alia.
Moreover, the principles and channels set out in the Shareholders and Investors Communication and Contact Policy
govern, where applicable, BBVA relations with other interested parties, such as financial analysts, bank share
management firms and depository institutions, and proxy advisors, among others.
C.1.36 Indicate whether the company has changed its external auditor during the year. If so, identify the incoming
and outgoing auditors:
YES
Outgoing auditor Deloitte, S.L. Incoming auditor KPMG Auditores, S.L.
If there were disagreements with the outgoing auditor, explain their grounds:
NO
Explanation of disagreements
This English version is a translation of the original in Spanish for information purposes only. In case of a
discrepancy, the Spanish original will prevail.
118
C.1.37 Indicate whether the audit firm does other work for the company and/or its group other than the audit. If so,
declare the amount of fees received for such work and the percentage of such fees on the total fees charged to the
company and/or its group:
YES
Company Group Total
Amount of non-audit work (thousands euros) 234 274 508
Amount of non-audit work/total amount billed by the
audit firm (%) 1.68% 1.75% 1.72%
C.1.38 Indicate whether the audit report on the annual financial statements for the previous year contained
reservations or qualifications. If so, indicate the reasons given by the chair of the audit committee to explain the
content and scope of such reservations or qualifications.
NO
C.1.39 Indicate the number of consecutive years during which the current audit firm has been auditing the financial
statements for the company and/or its group. Likewise, indicate the percentage of the number of years audited by the
current audit firm to the total number of years in which the annual financial statements have been audited:
Company Group
Number of consecutive years 1 1
Number of years audited by current audit firm / number of years the company has been audited (%)
5.88% 5.88%
C.1.40 Indicate and, where applicable, give details on the existence of a procedure for directors to engage external
advisory services:
YES
Details of the procedure
Article 6 of the BBVA Board of Directors Regulations expressly recognizes that directors may request any
additional information or advice they require to comply with their duties, and may request the Board of Directors for
assistance from external experts on matters subject to their consideration whose special complexity or importance
so requires.
The Audit and Compliance Committee, pursuant to article 31 of the Board of Directors Regulations, may engage
external advisory services for relevant issues when it considers that these cannot be properly provided by experts
or technical staff within the Group on grounds of specialization or independence.
Under articles 34, 37 and 40 of the Board of Directors Regulations and in accordance with the specific regulations
of the Technology and Cyber-security Committee, the rest of the Committees may obtain such advice as may be
necessary to establish an informed opinion on matters related to its business.
C.1.41 Indicate and, where applicable, give details on the existence of a procedure for directors to obtain the
information they need to prepare the meetings of the governing bodies with sufficient time:
This English version is a translation of the original in Spanish for information purposes only. In case of a
discrepancy, the Spanish original will prevail.
119
YES
Details of the procedure
Article 6 of the Regulations of the Board of Directors establishes that directors will be apprised beforehand of
sufficient information to be able to form their own opinions regarding the questions that the Bank’s governing bodies
are empowered to deal with. They may request any additional information or advice they require to fulfill their
duties.
Exercise of this right will be channeled through the Chairman or Secretary of the Board of Directors who will attend
to requests by providing the information directly or by establishing suitable arrangements within the organization for
this purpose, unless a specific procedure has been established in the regulations governing the Board of Directors
Committees.
In accordance with article 24 of the Board Regulations, directors will be provided with any information or
clarifications as they believe necessary or advisable in connection with the matters to be considered at the meeting.
This can be done before or during the meetings.
BBVA has in place an informational model to allow decisions to be made based on sufficient, complete and
consistent information, and, also, to facilitate appropriate oversight of performance.
Thus, the Bank's corporate bodies have a procedure for verifying the information that is submitted for consideration
to them, coordinated by the Board Secretariat with the areas responsible for information, through the Information of
the Governing Bodies' Department, in order to provide the directors for early consideration sufficient, adequate and
complete information for the meetings of the Bank's various corporate bodies and to enable directors to best
perform their duties. The information that is made available to the Bank’s corporate bodies, prior to the holding of its
sessions, is carried out through an electronic tool, to which all members of the Board of Directors have access,
which ensures his availability.
C.1.42 Indicate and, where applicable give details, whether the company has established rules requiring directors to
inform and, where applicable, resign under circumstances that may undermine the company’s standing and
reputation:
YES
Explanation of rules
In accordance with article 12 of the Board of Directors Regulations, directors must apprise the Board of Directors of
any circumstances affecting them that might harm the Company’s reputation and credit and circumstances that may
impact their suitability for the position.
Directors must place their office at the disposal of the Board of Directors and accept its decision regarding their
continuity or non-continuity in office. Should the Board resolve they not continue, they will be obliged to tender their
resignation when for reasons attributable to the director in his or her condition as such, serious damage has been
done to the Company’s net worth, credit and/or reputation or when they lose their suitability to hold the position of
director of the Bank.
C.1.43 Indicate whether any member of the Board of Directors has informed the company of any legal suit or court
proceedings against him or her for any of the offences listed in article 213 of the Corporate Enterprises Act:
NO
Indicate whether the Board of Directors has analyzed the case. If so, explain the grounds for the decision taken as to
whether or not the director should retain his/her directorship or, where applicable, describe the actions taken or
planned to be taken by the Board of Directors on the date of this report.
This English version is a translation of the original in Spanish for information purposes only. In case of a
discrepancy, the Spanish original will prevail.
120
Decision adopted/action
taken Reasoned explanation
C.1.44 Detail significant agreements reached by the Company that come into force, are amended or concluded in the
event of a change in the control of the company stemming from a public takeover bid, and its effects.
C.1.45 Identify in aggregate terms and indicate in detail any agreements between the company and its directors,
managers or employees that have guarantee or ring-fencing severance clauses for when such persons resign or are
wrongfully dismissed or if the contractual relationship comes to an end due to a public takeover bid or other kinds of
transactions.
Number of beneficiaries 60
Type of beneficiary
15 members of Senior Management (excluding executive directors)
45 technical & specialist professionals
Description of the agreement
The Bank does not have commitments to pay compensations to directors.
As of 31 December 2017, 15 members of Senior Management are entitled to
receive compensation payment in the event of severance on grounds other than
their own will, retirement, disability or dereliction of duties. Its amount will be
calculated by factoring the Bank employee's remuneration and length of office
and which under no circumstances will be paid in the event of lawful dismissal for
misconduct by decision of the employer on grounds of the worker's dereliction of
duties.
The Bank has also agreed compensation clauses with some employees (45
technical and specialist professionals) in the event of unfair dismissal. The
amount of this compensation is calculated as a function of the wage and
professional conditions of each employee.
Indicate whether these contracts must be disclosed to and/or approved by the Company governance bodies:
Board of Directors General Meeting
Body authorizing the clauses YES NO
YES NO
Is the General Meeting informed of the clauses? x
C.2 Board of Directors Committees
C.2.1 Detail all the Board Committees, their members and the proportion of executive, proprietary, independent and
other external directors sitting thereon:
EXECUTIVE OR DELEGATE COMMITTEE
Name Position Category
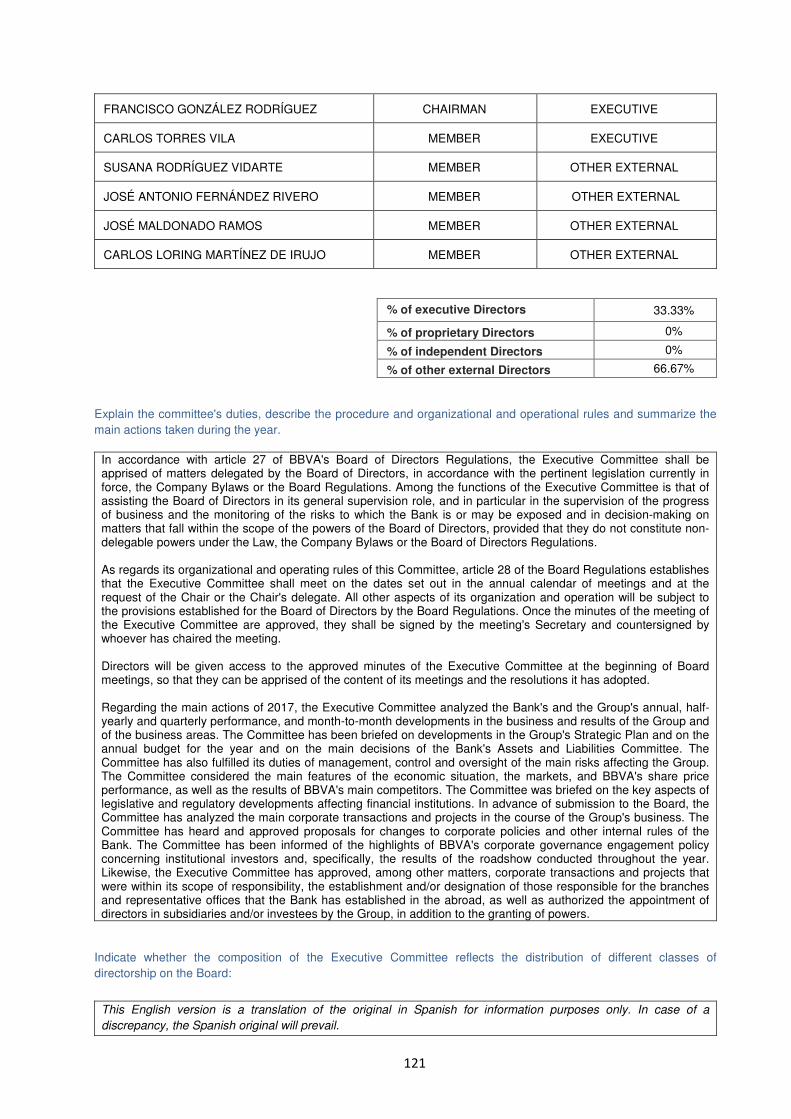
This English version is a translation of the original in Spanish for information purposes only. In case of a
discrepancy, the Spanish original will prevail.
121
FRANCISCO GONZÁLEZ RODRÍGUEZ CHAIRMAN EXECUTIVE
CARLOS TORRES VILA MEMBER EXECUTIVE
SUSANA RODRÍGUEZ VIDARTE MEMBER OTHER EXTERNAL
JOSÉ ANTONIO FERNÁNDEZ RIVERO MEMBER OTHER EXTERNAL
JOSÉ MALDONADO RAMOS MEMBER OTHER EXTERNAL
CARLOS LORING MARTÍNEZ DE IRUJO MEMBER OTHER EXTERNAL
% of executive Directors
33.33%
% of proprietary Directors 0%
% of independent Directors 0%
% of other external Directors 66.67%
Explain the committee's duties, describe the procedure and organizational and operational rules and summarize the
main actions taken during the year.
In accordance with article 27 of BBVA's Board of Directors Regulations, the Executive Committee shall be apprised of matters delegated by the Board of Directors, in accordance with the pertinent legislation currently in force, the Company Bylaws or the Board Regulations. Among the functions of the Executive Committee is that of assisting the Board of Directors in its general supervision role, and in particular in the supervision of the progress of business and the monitoring of the risks to which the Bank is or may be exposed and in decision-making on matters that fall within the scope of the powers of the Board of Directors, provided that they do not constitute non-delegable powers under the Law, the Company Bylaws or the Board of Directors Regulations. As regards its organizational and operating rules of this Committee, article 28 of the Board Regulations establishes that the Executive Committee shall meet on the dates set out in the annual calendar of meetings and at the request of the Chair or the Chair's delegate. All other aspects of its organization and operation will be subject to the provisions established for the Board of Directors by the Board Regulations. Once the minutes of the meeting of the Executive Committee are approved, they shall be signed by the meeting's Secretary and countersigned by whoever has chaired the meeting. Directors will be given access to the approved minutes of the Executive Committee at the beginning of Board meetings, so that they can be apprised of the content of its meetings and the resolutions it has adopted. Regarding the main actions of 2017, the Executive Committee analyzed the Bank's and the Group's annual, half-yearly and quarterly performance, and month-to-month developments in the business and results of the Group and of the business areas. The Committee has been briefed on developments in the Group's Strategic Plan and on the annual budget for the year and on the main decisions of the Bank's Assets and Liabilities Committee. The Committee has also fulfilled its duties of management, control and oversight of the main risks affecting the Group. The Committee considered the main features of the economic situation, the markets, and BBVA's share price performance, as well as the results of BBVA's main competitors. The Committee was briefed on the key aspects of legislative and regulatory developments affecting financial institutions. In advance of submission to the Board, the Committee has analyzed the main corporate transactions and projects in the course of the Group's business. The Committee has heard and approved proposals for changes to corporate policies and other internal rules of the Bank. The Committee has been informed of the highlights of BBVA's corporate governance engagement policy concerning institutional investors and, specifically, the results of the roadshow conducted throughout the year. Likewise, the Executive Committee has approved, among other matters, corporate transactions and projects that were within its scope of responsibility, the establishment and/or designation of those responsible for the branches and representative offices that the Bank has established in the abroad, as well as authorized the appointment of directors in subsidiaries and/or investees by the Group, in addition to the granting of powers.
Indicate whether the composition of the Executive Committee reflects the distribution of different classes of
directorship on the Board:
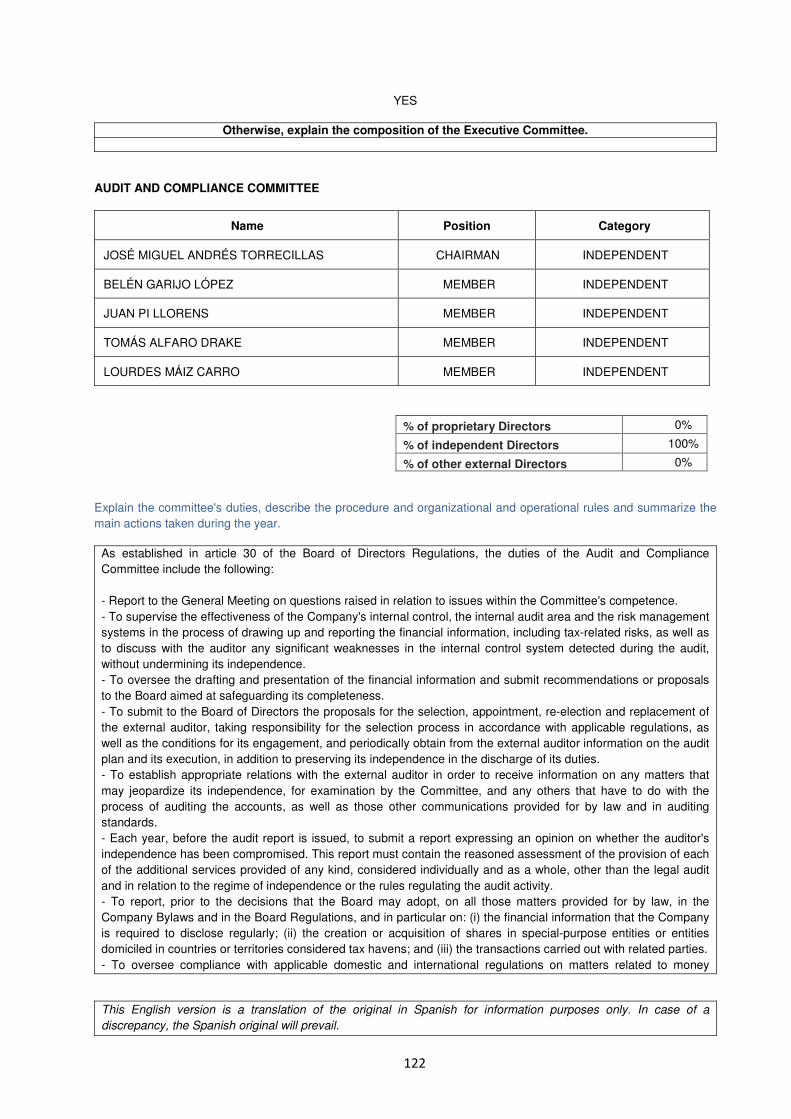
This English version is a translation of the original in Spanish for information purposes only. In case of a
discrepancy, the Spanish original will prevail.
122
YES
Otherwise, explain the composition of the Executive Committee.
AUDIT AND COMPLIANCE COMMITTEE
Name Position Category
JOSÉ MIGUEL ANDRÉS TORRECILLAS CHAIRMAN INDEPENDENT
BELÉN GARIJO LÓPEZ MEMBER INDEPENDENT
JUAN PI LLORENS MEMBER INDEPENDENT
TOMÁS ALFARO DRAKE MEMBER INDEPENDENT
LOURDES MÁIZ CARRO MEMBER INDEPENDENT
% of proprietary Directors 0%
% of independent Directors 100%
% of other external Directors 0%
Explain the committee's duties, describe the procedure and organizational and operational rules and summarize the
main actions taken during the year.
As established in article 30 of the Board of Directors Regulations, the duties of the Audit and Compliance
Committee include the following:
- Report to the General Meeting on questions raised in relation to issues within the Committee's competence.
- To supervise the effectiveness of the Company's internal control, the internal audit area and the risk management
systems in the process of drawing up and reporting the financial information, including tax-related risks, as well as
to discuss with the auditor any significant weaknesses in the internal control system detected during the audit,
without undermining its independence.
- To oversee the drafting and presentation of the financial information and submit recommendations or proposals
to the Board aimed at safeguarding its completeness.
- To submit to the Board of Directors the proposals for the selection, appointment, re-election and replacement of
the external auditor, taking responsibility for the selection process in accordance with applicable regulations, as
well as the conditions for its engagement, and periodically obtain from the external auditor information on the audit
plan and its execution, in addition to preserving its independence in the discharge of its duties.
- To establish appropriate relations with the external auditor in order to receive information on any matters that
may jeopardize its independence, for examination by the Committee, and any others that have to do with the
process of auditing the accounts, as well as those other communications provided for by law and in auditing
standards.
- Each year, before the audit report is issued, to submit a report expressing an opinion on whether the auditor's
independence has been compromised. This report must contain the reasoned assessment of the provision of each
of the additional services provided of any kind, considered individually and as a whole, other than the legal audit
and in relation to the regime of independence or the rules regulating the audit activity.
- To report, prior to the decisions that the Board may adopt, on all those matters provided for by law, in the
Company Bylaws and in the Board Regulations, and in particular on: (i) the financial information that the Company
is required to disclose regularly; (ii) the creation or acquisition of shares in special-purpose entities or entities
domiciled in countries or territories considered tax havens; and (iii) the transactions carried out with related parties.
- To oversee compliance with applicable domestic and international regulations on matters related to money
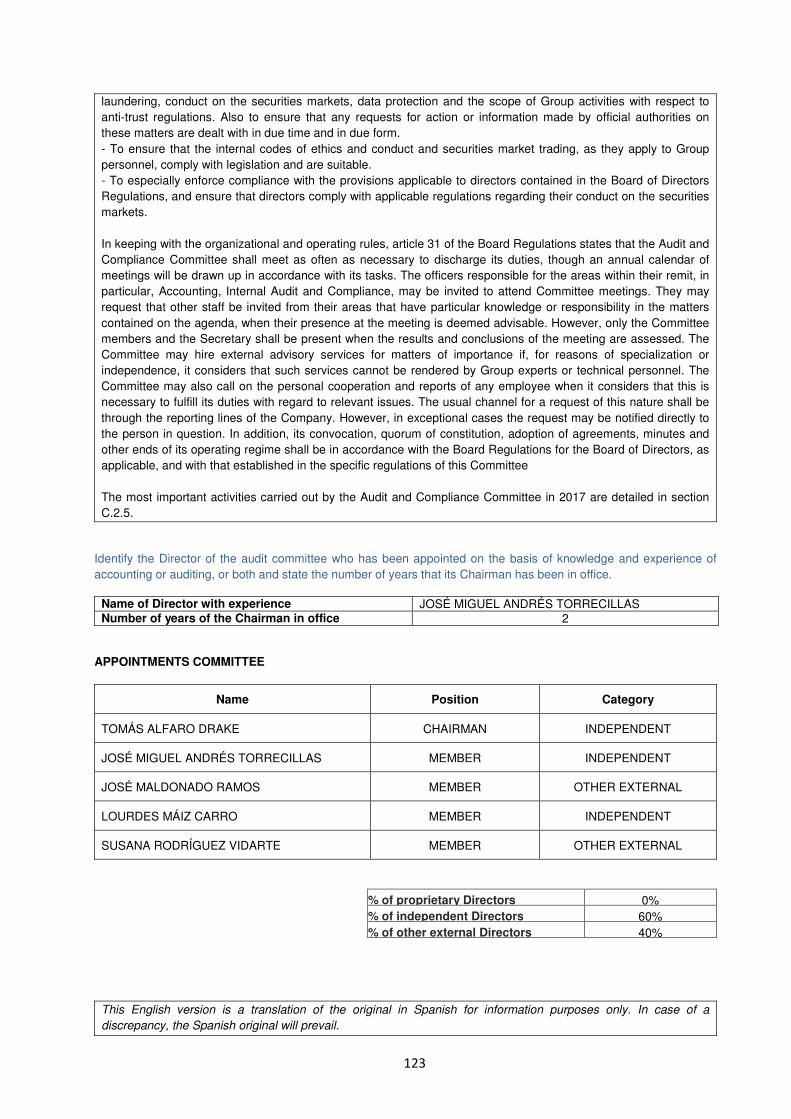
This English version is a translation of the original in Spanish for information purposes only. In case of a
discrepancy, the Spanish original will prevail.
123
laundering, conduct on the securities markets, data protection and the scope of Group activities with respect to
anti-trust regulations. Also to ensure that any requests for action or information made by official authorities on
these matters are dealt with in due time and in due form.
- To ensure that the internal codes of ethics and conduct and securities market trading, as they apply to Group
personnel, comply with legislation and are suitable.
- To especially enforce compliance with the provisions applicable to directors contained in the Board of Directors
Regulations, and ensure that directors comply with applicable regulations regarding their conduct on the securities
markets.
In keeping with the organizational and operating rules, article 31 of the Board Regulations states that the Audit and
Compliance Committee shall meet as often as necessary to discharge its duties, though an annual calendar of
meetings will be drawn up in accordance with its tasks. The officers responsible for the areas within their remit, in
particular, Accounting, Internal Audit and Compliance, may be invited to attend Committee meetings. They may
request that other staff be invited from their areas that have particular knowledge or responsibility in the matters
contained on the agenda, when their presence at the meeting is deemed advisable. However, only the Committee
members and the Secretary shall be present when the results and conclusions of the meeting are assessed. The
Committee may hire external advisory services for matters of importance if, for reasons of specialization or
independence, it considers that such services cannot be rendered by Group experts or technical personnel. The
Committee may also call on the personal cooperation and reports of any employee when it considers that this is
necessary to fulfill its duties with regard to relevant issues. The usual channel for a request of this nature shall be
through the reporting lines of the Company. However, in exceptional cases the request may be notified directly to
the person in question. In addition, its convocation, quorum of constitution, adoption of agreements, minutes and
other ends of its operating regime shall be in accordance with the Board Regulations for the Board of Directors, as
applicable, and with that established in the specific regulations of this Committee
The most important activities carried out by the Audit and Compliance Committee in 2017 are detailed in section
C.2.5.
Identify the Director of the audit committee who has been appointed on the basis of knowledge and experience of
accounting or auditing, or both and state the number of years that its Chairman has been in office.
Name of Director with experience JOSÉ MIGUEL ANDRÉS TORRECILLAS Number of years of the Chairman in office 2
APPOINTMENTS COMMITTEE
Name Position Category
TOMÁS ALFARO DRAKE CHAIRMAN INDEPENDENT
JOSÉ MIGUEL ANDRÉS TORRECILLAS MEMBER INDEPENDENT
JOSÉ MALDONADO RAMOS MEMBER OTHER EXTERNAL
LOURDES MÁIZ CARRO MEMBER INDEPENDENT
SUSANA RODRÍGUEZ VIDARTE MEMBER OTHER EXTERNAL
% of proprietary Directors 0%
% of independent Directors 60%
% of other external Directors 40%
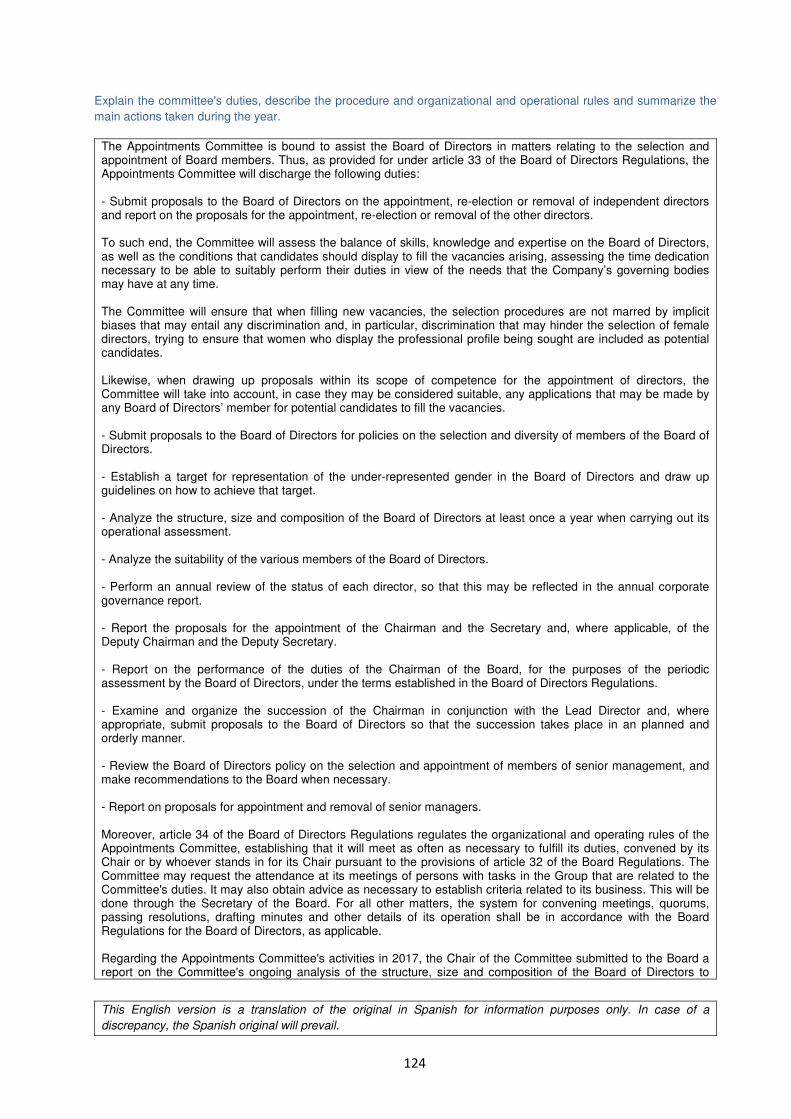
This English version is a translation of the original in Spanish for information purposes only. In case of a
discrepancy, the Spanish original will prevail.
124
Explain the committee's duties, describe the procedure and organizational and operational rules and summarize the
main actions taken during the year.
The Appointments Committee is bound to assist the Board of Directors in matters relating to the selection and appointment of Board members. Thus, as provided for under article 33 of the Board of Directors Regulations, the Appointments Committee will discharge the following duties: - Submit proposals to the Board of Directors on the appointment, re-election or removal of independent directors and report on the proposals for the appointment, re-election or removal of the other directors. To such end, the Committee will assess the balance of skills, knowledge and expertise on the Board of Directors, as well as the conditions that candidates should display to fill the vacancies arising, assessing the time dedication necessary to be able to suitably perform their duties in view of the needs that the Company’s governing bodies may have at any time. The Committee will ensure that when filling new vacancies, the selection procedures are not marred by implicit biases that may entail any discrimination and, in particular, discrimination that may hinder the selection of female directors, trying to ensure that women who display the professional profile being sought are included as potential candidates. Likewise, when drawing up proposals within its scope of competence for the appointment of directors, the Committee will take into account, in case they may be considered suitable, any applications that may be made by any Board of Directors’ member for potential candidates to fill the vacancies. - Submit proposals to the Board of Directors for policies on the selection and diversity of members of the Board of Directors. - Establish a target for representation of the under-represented gender in the Board of Directors and draw up guidelines on how to achieve that target. - Analyze the structure, size and composition of the Board of Directors at least once a year when carrying out its operational assessment. - Analyze the suitability of the various members of the Board of Directors. - Perform an annual review of the status of each director, so that this may be reflected in the annual corporate governance report. - Report the proposals for the appointment of the Chairman and the Secretary and, where applicable, of the Deputy Chairman and the Deputy Secretary. - Report on the performance of the duties of the Chairman of the Board, for the purposes of the periodic assessment by the Board of Directors, under the terms established in the Board of Directors Regulations. - Examine and organize the succession of the Chairman in conjunction with the Lead Director and, where appropriate, submit proposals to the Board of Directors so that the succession takes place in an planned and orderly manner. - Review the Board of Directors policy on the selection and appointment of members of senior management, and make recommendations to the Board when necessary. - Report on proposals for appointment and removal of senior managers. Moreover, article 34 of the Board of Directors Regulations regulates the organizational and operating rules of the Appointments Committee, establishing that it will meet as often as necessary to fulfill its duties, convened by its Chair or by whoever stands in for its Chair pursuant to the provisions of article 32 of the Board Regulations. The Committee may request the attendance at its meetings of persons with tasks in the Group that are related to the Committee's duties. It may also obtain advice as necessary to establish criteria related to its business. This will be done through the Secretary of the Board. For all other matters, the system for convening meetings, quorums, passing resolutions, drafting minutes and other details of its operation shall be in accordance with the Board Regulations for the Board of Directors, as applicable. Regarding the Appointments Committee's activities in 2017, the Chair of the Committee submitted to the Board a report on the Committee's ongoing analysis of the structure, size and composition of the Board of Directors to
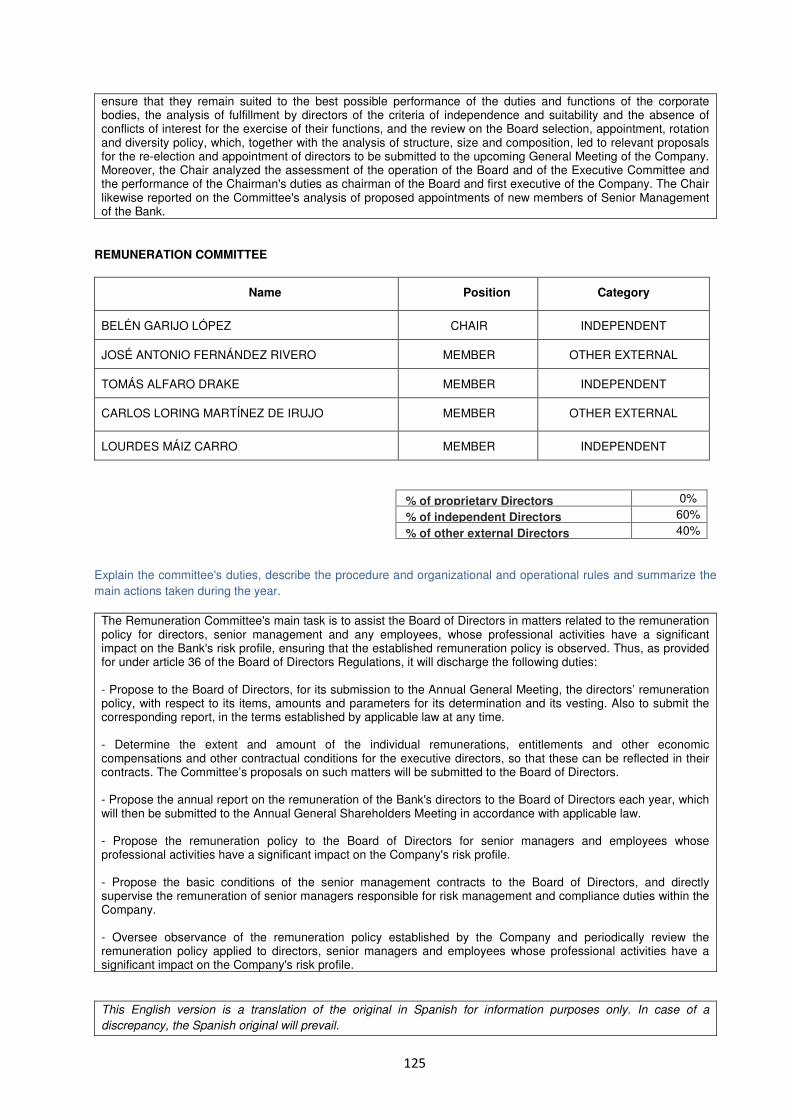
This English version is a translation of the original in Spanish for information purposes only. In case of a
discrepancy, the Spanish original will prevail.
125
ensure that they remain suited to the best possible performance of the duties and functions of the corporate bodies, the analysis of fulfillment by directors of the criteria of independence and suitability and the absence of conflicts of interest for the exercise of their functions, and the review on the Board selection, appointment, rotation and diversity policy, which, together with the analysis of structure, size and composition, led to relevant proposals for the re-election and appointment of directors to be submitted to the upcoming General Meeting of the Company. Moreover, the Chair analyzed the assessment of the operation of the Board and of the Executive Committee and the performance of the Chairman's duties as chairman of the Board and first executive of the Company. The Chair likewise reported on the Committee's analysis of proposed appointments of new members of Senior Management of the Bank.
REMUNERATION COMMITTEE
Name Position Category
BELÉN GARIJO LÓPEZ CHAIR INDEPENDENT
JOSÉ ANTONIO FERNÁNDEZ RIVERO MEMBER OTHER EXTERNAL
TOMÁS ALFARO DRAKE MEMBER INDEPENDENT
CARLOS LORING MARTÍNEZ DE IRUJO MEMBER OTHER EXTERNAL
LOURDES MÁIZ CARRO MEMBER INDEPENDENT
% of proprietary Directors 0%
% of independent Directors 60%
% of other external Directors 40%
Explain the committee's duties, describe the procedure and organizational and operational rules and summarize the
main actions taken during the year.
The Remuneration Committee's main task is to assist the Board of Directors in matters related to the remuneration policy for directors, senior management and any employees, whose professional activities have a significant impact on the Bank's risk profile, ensuring that the established remuneration policy is observed. Thus, as provided for under article 36 of the Board of Directors Regulations, it will discharge the following duties: - Propose to the Board of Directors, for its submission to the Annual General Meeting, the directors’ remuneration policy, with respect to its items, amounts and parameters for its determination and its vesting. Also to submit the corresponding report, in the terms established by applicable law at any time. - Determine the extent and amount of the individual remunerations, entitlements and other economic compensations and other contractual conditions for the executive directors, so that these can be reflected in their contracts. The Committee’s proposals on such matters will be submitted to the Board of Directors. - Propose the annual report on the remuneration of the Bank's directors to the Board of Directors each year, which will then be submitted to the Annual General Shareholders Meeting in accordance with applicable law. - Propose the remuneration policy to the Board of Directors for senior managers and employees whose professional activities have a significant impact on the Company's risk profile. - Propose the basic conditions of the senior management contracts to the Board of Directors, and directly supervise the remuneration of senior managers responsible for risk management and compliance duties within the Company. - Oversee observance of the remuneration policy established by the Company and periodically review the remuneration policy applied to directors, senior managers and employees whose professional activities have a significant impact on the Company's risk profile.
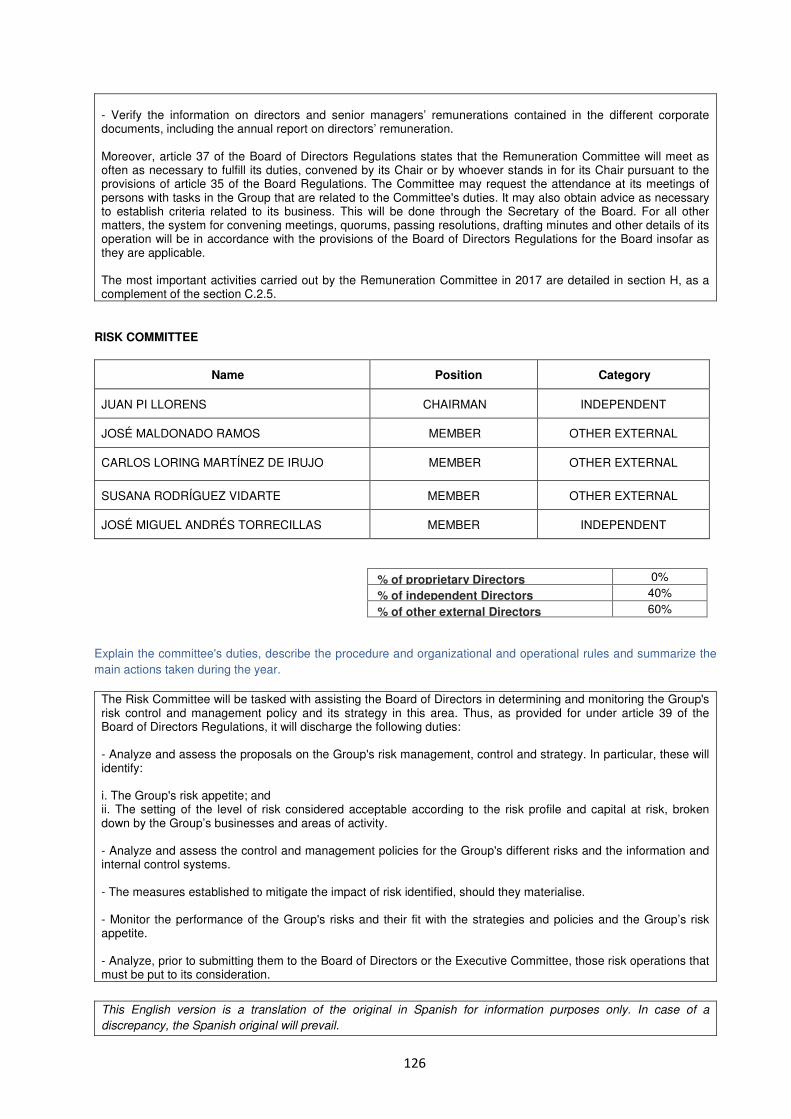
This English version is a translation of the original in Spanish for information purposes only. In case of a
discrepancy, the Spanish original will prevail.
126
- Verify the information on directors and senior managers’ remunerations contained in the different corporate documents, including the annual report on directors’ remuneration. Moreover, article 37 of the Board of Directors Regulations states that the Remuneration Committee will meet as often as necessary to fulfill its duties, convened by its Chair or by whoever stands in for its Chair pursuant to the provisions of article 35 of the Board Regulations. The Committee may request the attendance at its meetings of persons with tasks in the Group that are related to the Committee's duties. It may also obtain advice as necessary to establish criteria related to its business. This will be done through the Secretary of the Board. For all other matters, the system for convening meetings, quorums, passing resolutions, drafting minutes and other details of its operation will be in accordance with the provisions of the Board of Directors Regulations for the Board insofar as they are applicable. The most important activities carried out by the Remuneration Committee in 2017 are detailed in section H, as a complement of the section C.2.5.
RISK COMMITTEE
Name Position Category
JUAN PI LLORENS CHAIRMAN INDEPENDENT
JOSÉ MALDONADO RAMOS MEMBER OTHER EXTERNAL
CARLOS LORING MARTÍNEZ DE IRUJO MEMBER OTHER EXTERNAL
SUSANA RODRÍGUEZ VIDARTE MEMBER OTHER EXTERNAL
JOSÉ MIGUEL ANDRÉS TORRECILLAS MEMBER INDEPENDENT
% of proprietary Directors 0%
% of independent Directors 40%
% of other external Directors 60%
Explain the committee's duties, describe the procedure and organizational and operational rules and summarize the
main actions taken during the year.
The Risk Committee will be tasked with assisting the Board of Directors in determining and monitoring the Group's risk control and management policy and its strategy in this area. Thus, as provided for under article 39 of the Board of Directors Regulations, it will discharge the following duties: - Analyze and assess the proposals on the Group's risk management, control and strategy. In particular, these will identify: i. The Group's risk appetite; and ii. The setting of the level of risk considered acceptable according to the risk profile and capital at risk, broken down by the Group’s businesses and areas of activity. - Analyze and assess the control and management policies for the Group's different risks and the information and internal control systems. - The measures established to mitigate the impact of risk identified, should they materialise. - Monitor the performance of the Group's risks and their fit with the strategies and policies and the Group’s risk appetite. - Analyze, prior to submitting them to the Board of Directors or the Executive Committee, those risk operations that must be put to its consideration.
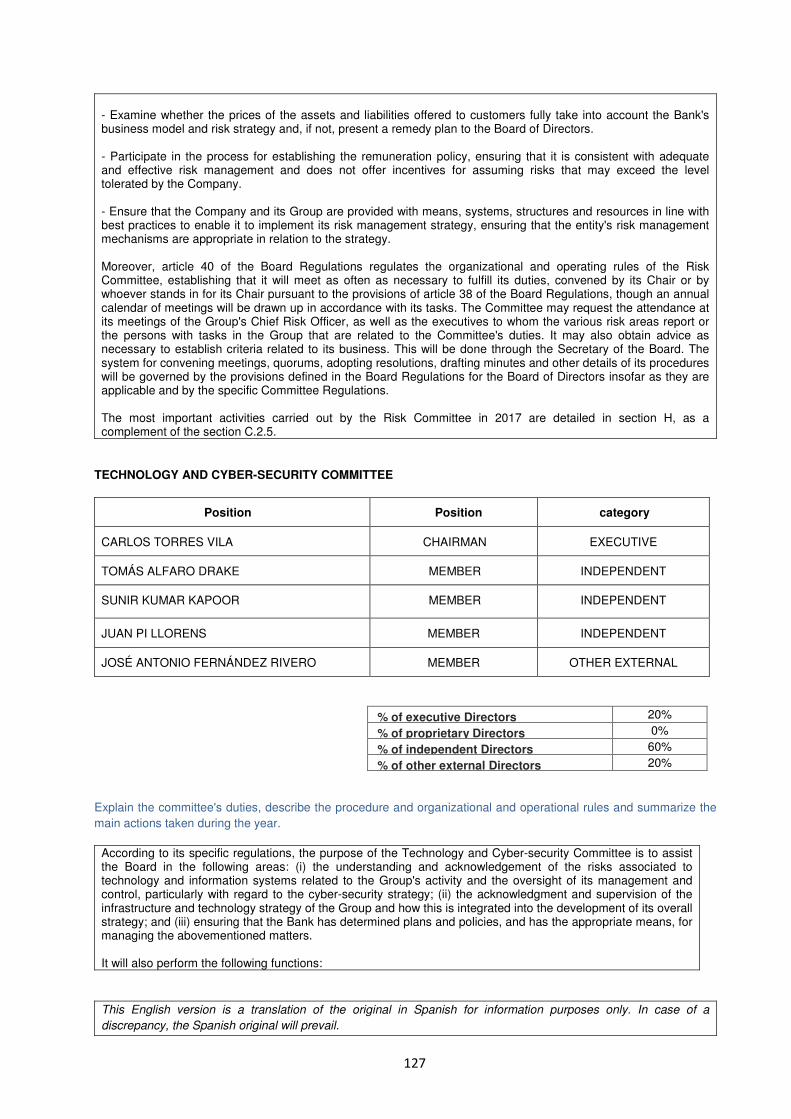
This English version is a translation of the original in Spanish for information purposes only. In case of a
discrepancy, the Spanish original will prevail.
127
- Examine whether the prices of the assets and liabilities offered to customers fully take into account the Bank's business model and risk strategy and, if not, present a remedy plan to the Board of Directors. - Participate in the process for establishing the remuneration policy, ensuring that it is consistent with adequate and effective risk management and does not offer incentives for assuming risks that may exceed the level tolerated by the Company. - Ensure that the Company and its Group are provided with means, systems, structures and resources in line with best practices to enable it to implement its risk management strategy, ensuring that the entity's risk management mechanisms are appropriate in relation to the strategy. Moreover, article 40 of the Board Regulations regulates the organizational and operating rules of the Risk Committee, establishing that it will meet as often as necessary to fulfill its duties, convened by its Chair or by whoever stands in for its Chair pursuant to the provisions of article 38 of the Board Regulations, though an annual calendar of meetings will be drawn up in accordance with its tasks. The Committee may request the attendance at its meetings of the Group's Chief Risk Officer, as well as the executives to whom the various risk areas report or the persons with tasks in the Group that are related to the Committee's duties. It may also obtain advice as necessary to establish criteria related to its business. This will be done through the Secretary of the Board. The system for convening meetings, quorums, adopting resolutions, drafting minutes and other details of its procedures will be governed by the provisions defined in the Board Regulations for the Board of Directors insofar as they are applicable and by the specific Committee Regulations. The most important activities carried out by the Risk Committee in 2017 are detailed in section H, as a complement of the section C.2.5.
TECHNOLOGY AND CYBER-SECURITY COMMITTEE
Position Position category
CARLOS TORRES VILA CHAIRMAN EXECUTIVE
TOMÁS ALFARO DRAKE MEMBER INDEPENDENT
SUNIR KUMAR KAPOOR MEMBER INDEPENDENT
JUAN PI LLORENS MEMBER INDEPENDENT
JOSÉ ANTONIO FERNÁNDEZ RIVERO MEMBER OTHER EXTERNAL
% of executive Directors 20%
% of proprietary Directors 0%
% of independent Directors 60%
% of other external Directors 20%
Explain the committee's duties, describe the procedure and organizational and operational rules and summarize the
main actions taken during the year.
According to its specific regulations, the purpose of the Technology and Cyber-security Committee is to assist the Board in the following areas: (i) the understanding and acknowledgement of the risks associated to technology and information systems related to the Group's activity and the oversight of its management and control, particularly with regard to the cyber-security strategy; (ii) the acknowledgment and supervision of the infrastructure and technology strategy of the Group and how this is integrated into the development of its overall strategy; and (iii) ensuring that the Bank has determined plans and policies, and has the appropriate means, for managing the abovementioned matters. It will also perform the following functions:
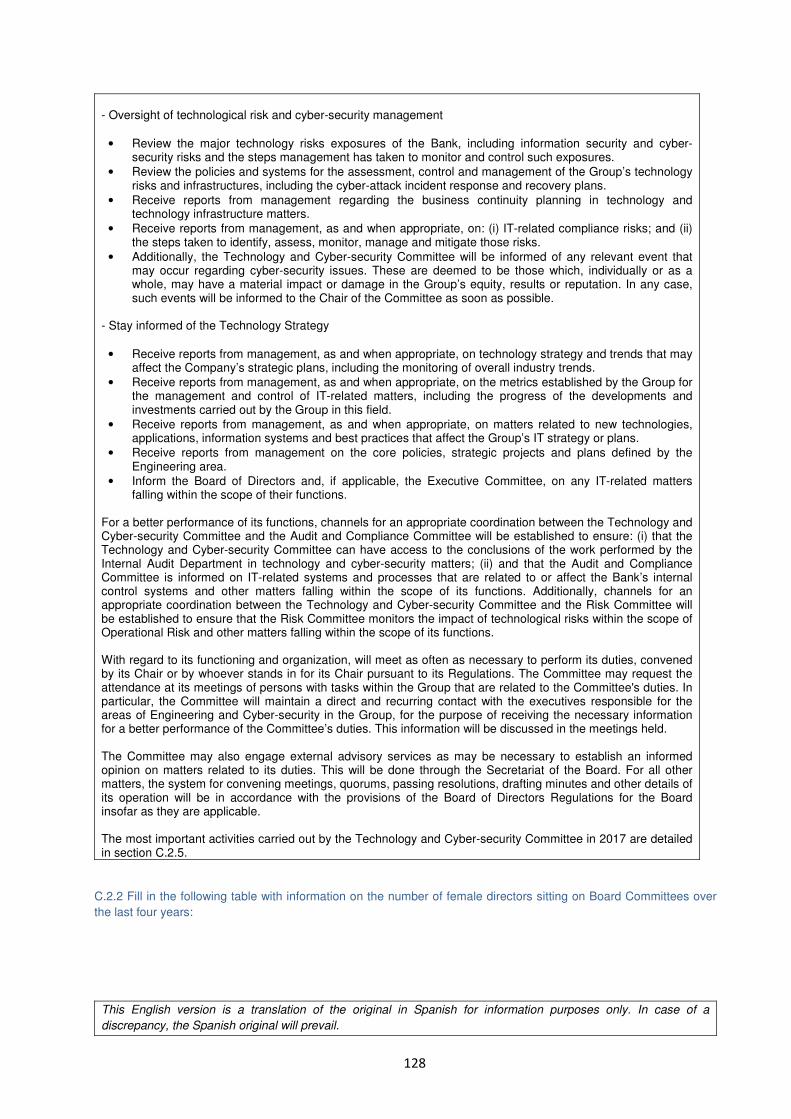
This English version is a translation of the original in Spanish for information purposes only. In case of a
discrepancy, the Spanish original will prevail.
128
- Oversight of technological risk and cyber-security management
• Review the major technology risks exposures of the Bank, including information security and cyber-security risks and the steps management has taken to monitor and control such exposures.
• Review the policies and systems for the assessment, control and management of the Group’s technology risks and infrastructures, including the cyber-attack incident response and recovery plans.
• Receive reports from management regarding the business continuity planning in technology and technology infrastructure matters.
• Receive reports from management, as and when appropriate, on: (i) IT-related compliance risks; and (ii) the steps taken to identify, assess, monitor, manage and mitigate those risks.
• Additionally, the Technology and Cyber-security Committee will be informed of any relevant event that may occur regarding cyber-security issues. These are deemed to be those which, individually or as a whole, may have a material impact or damage in the Group’s equity, results or reputation. In any case, such events will be informed to the Chair of the Committee as soon as possible.
- Stay informed of the Technology Strategy
• Receive reports from management, as and when appropriate, on technology strategy and trends that may affect the Company’s strategic plans, including the monitoring of overall industry trends.
• Receive reports from management, as and when appropriate, on the metrics established by the Group for the management and control of IT-related matters, including the progress of the developments and investments carried out by the Group in this field.
• Receive reports from management, as and when appropriate, on matters related to new technologies, applications, information systems and best practices that affect the Group’s IT strategy or plans.
• Receive reports from management on the core policies, strategic projects and plans defined by the Engineering area.
• Inform the Board of Directors and, if applicable, the Executive Committee, on any IT-related matters falling within the scope of their functions.
For a better performance of its functions, channels for an appropriate coordination between the Technology and Cyber-security Committee and the Audit and Compliance Committee will be established to ensure: (i) that the Technology and Cyber-security Committee can have access to the conclusions of the work performed by the Internal Audit Department in technology and cyber-security matters; (ii) and that the Audit and Compliance Committee is informed on IT-related systems and processes that are related to or affect the Bank’s internal control systems and other matters falling within the scope of its functions. Additionally, channels for an appropriate coordination between the Technology and Cyber-security Committee and the Risk Committee will be established to ensure that the Risk Committee monitors the impact of technological risks within the scope of Operational Risk and other matters falling within the scope of its functions. With regard to its functioning and organization, will meet as often as necessary to perform its duties, convened by its Chair or by whoever stands in for its Chair pursuant to its Regulations. The Committee may request the attendance at its meetings of persons with tasks within the Group that are related to the Committee's duties. In particular, the Committee will maintain a direct and recurring contact with the executives responsible for the areas of Engineering and Cyber-security in the Group, for the purpose of receiving the necessary information for a better performance of the Committee’s duties. This information will be discussed in the meetings held. The Committee may also engage external advisory services as may be necessary to establish an informed opinion on matters related to its duties. This will be done through the Secretariat of the Board. For all other matters, the system for convening meetings, quorums, passing resolutions, drafting minutes and other details of its operation will be in accordance with the provisions of the Board of Directors Regulations for the Board insofar as they are applicable. The most important activities carried out by the Technology and Cyber-security Committee in 2017 are detailed in section C.2.5.
C.2.2 Fill in the following table with information on the number of female directors sitting on Board Committees over
the last four years:
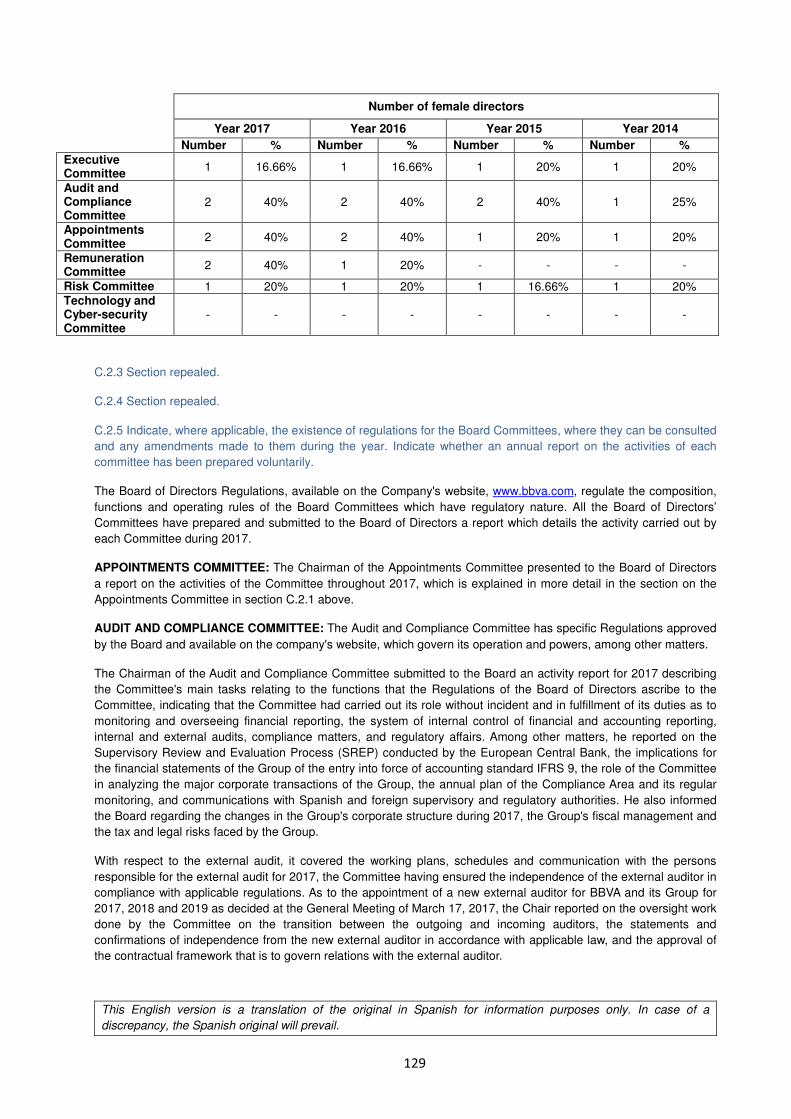
This English version is a translation of the original in Spanish for information purposes only. In case of a
discrepancy, the Spanish original will prevail.
129
Number of female directors
Year 2017 Year 2016 Year 2015 Year 2014
Number % Number % Number % Number %
Executive Committee
1 16.66% 1 16.66% 1 20% 1 20%
Audit and Compliance Committee
2 40% 2 40% 2 40% 1 25%
Appointments Committee
2 40% 2 40% 1 20% 1 20%
Remuneration Committee
2 40% 1 20% - - - -
Risk Committee 1 20% 1 20% 1 16.66% 1 20% Technology and Cyber-security Committee
- - - - - - - -
C.2.3 Section repealed.
C.2.4 Section repealed.
C.2.5 Indicate, where applicable, the existence of regulations for the Board Committees, where they can be consulted
and any amendments made to them during the year. Indicate whether an annual report on the activities of each
committee has been prepared voluntarily.
The Board of Directors Regulations, available on the Company's website, www.bbva.com, regulate the composition,
functions and operating rules of the Board Committees which have regulatory nature. All the Board of Directors’
Committees have prepared and submitted to the Board of Directors a report which details the activity carried out by
each Committee during 2017.
APPOINTMENTS COMMITTEE: The Chairman of the Appointments Committee presented to the Board of Directors
a report on the activities of the Committee throughout 2017, which is explained in more detail in the section on the
Appointments Committee in section C.2.1 above.
AUDIT AND COMPLIANCE COMMITTEE: The Audit and Compliance Committee has specific Regulations approved
by the Board and available on the company's website, which govern its operation and powers, among other matters.
The Chairman of the Audit and Compliance Committee submitted to the Board an activity report for 2017 describing
the Committee's main tasks relating to the functions that the Regulations of the Board of Directors ascribe to the
Committee, indicating that the Committee had carried out its role without incident and in fulfillment of its duties as to
monitoring and overseeing financial reporting, the system of internal control of financial and accounting reporting,
internal and external audits, compliance matters, and regulatory affairs. Among other matters, he reported on the
Supervisory Review and Evaluation Process (SREP) conducted by the European Central Bank, the implications for
the financial statements of the Group of the entry into force of accounting standard IFRS 9, the role of the Committee
in analyzing the major corporate transactions of the Group, the annual plan of the Compliance Area and its regular
monitoring, and communications with Spanish and foreign supervisory and regulatory authorities. He also informed
the Board regarding the changes in the Group's corporate structure during 2017, the Group's fiscal management and
the tax and legal risks faced by the Group.
With respect to the external audit, it covered the working plans, schedules and communication with the persons
responsible for the external audit for 2017, the Committee having ensured the independence of the external auditor in
compliance with applicable regulations. As to the appointment of a new external auditor for BBVA and its Group for
2017, 2018 and 2019 as decided at the General Meeting of March 17, 2017, the Chair reported on the oversight work
done by the Committee on the transition between the outgoing and incoming auditors, the statements and
confirmations of independence from the new external auditor in accordance with applicable law, and the approval of
the contractual framework that is to govern relations with the external auditor.
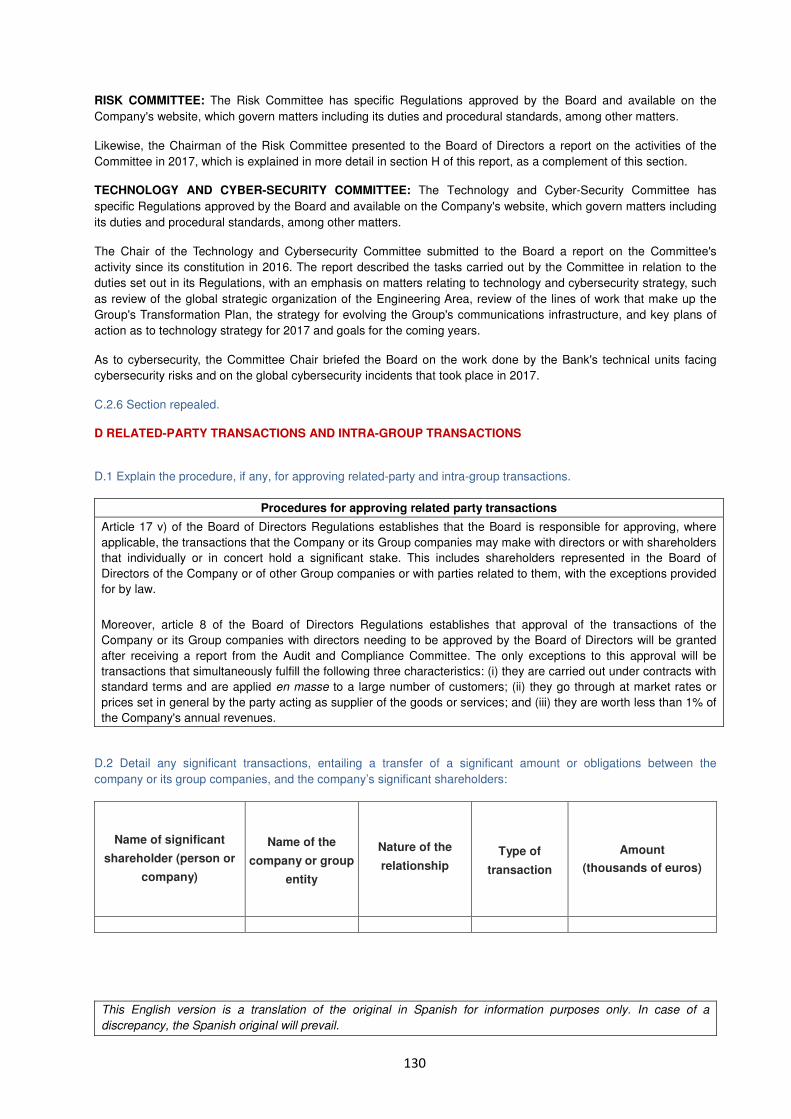
This English version is a translation of the original in Spanish for information purposes only. In case of a
discrepancy, the Spanish original will prevail.
130
RISK COMMITTEE: The Risk Committee has specific Regulations approved by the Board and available on the
Company's website, which govern matters including its duties and procedural standards, among other matters.
Likewise, the Chairman of the Risk Committee presented to the Board of Directors a report on the activities of the
Committee in 2017, which is explained in more detail in section H of this report, as a complement of this section.
TECHNOLOGY AND CYBER-SECURITY COMMITTEE: The Technology and Cyber-Security Committee has
specific Regulations approved by the Board and available on the Company's website, which govern matters including
its duties and procedural standards, among other matters.
The Chair of the Technology and Cybersecurity Committee submitted to the Board a report on the Committee's
activity since its constitution in 2016. The report described the tasks carried out by the Committee in relation to the
duties set out in its Regulations, with an emphasis on matters relating to technology and cybersecurity strategy, such
as review of the global strategic organization of the Engineering Area, review of the lines of work that make up the
Group's Transformation Plan, the strategy for evolving the Group's communications infrastructure, and key plans of
action as to technology strategy for 2017 and goals for the coming years.
As to cybersecurity, the Committee Chair briefed the Board on the work done by the Bank's technical units facing
cybersecurity risks and on the global cybersecurity incidents that took place in 2017.
C.2.6 Section repealed.
D RELATED-PARTY TRANSACTIONS AND INTRA-GROUP TRANSACTIONS
D.1 Explain the procedure, if any, for approving related-party and intra-group transactions.
Procedures for approving related party transactions
Article 17 v) of the Board of Directors Regulations establishes that the Board is responsible for approving, where
applicable, the transactions that the Company or its Group companies may make with directors or with shareholders
that individually or in concert hold a significant stake. This includes shareholders represented in the Board of
Directors of the Company or of other Group companies or with parties related to them, with the exceptions provided
for by law.
Moreover, article 8 of the Board of Directors Regulations establishes that approval of the transactions of the
Company or its Group companies with directors needing to be approved by the Board of Directors will be granted
after receiving a report from the Audit and Compliance Committee. The only exceptions to this approval will be
transactions that simultaneously fulfill the following three characteristics: (i) they are carried out under contracts with
standard terms and are applied en masse to a large number of customers; (ii) they go through at market rates or
prices set in general by the party acting as supplier of the goods or services; and (iii) they are worth less than 1% of
the Company's annual revenues.
D.2 Detail any significant transactions, entailing a transfer of a significant amount or obligations between the
company or its group companies, and the company’s significant shareholders:
Name of significant
shareholder (person or
company)
Name of the
company or group
entity
Nature of the
relationship
Type of
transaction
Amount
(thousands of euros)
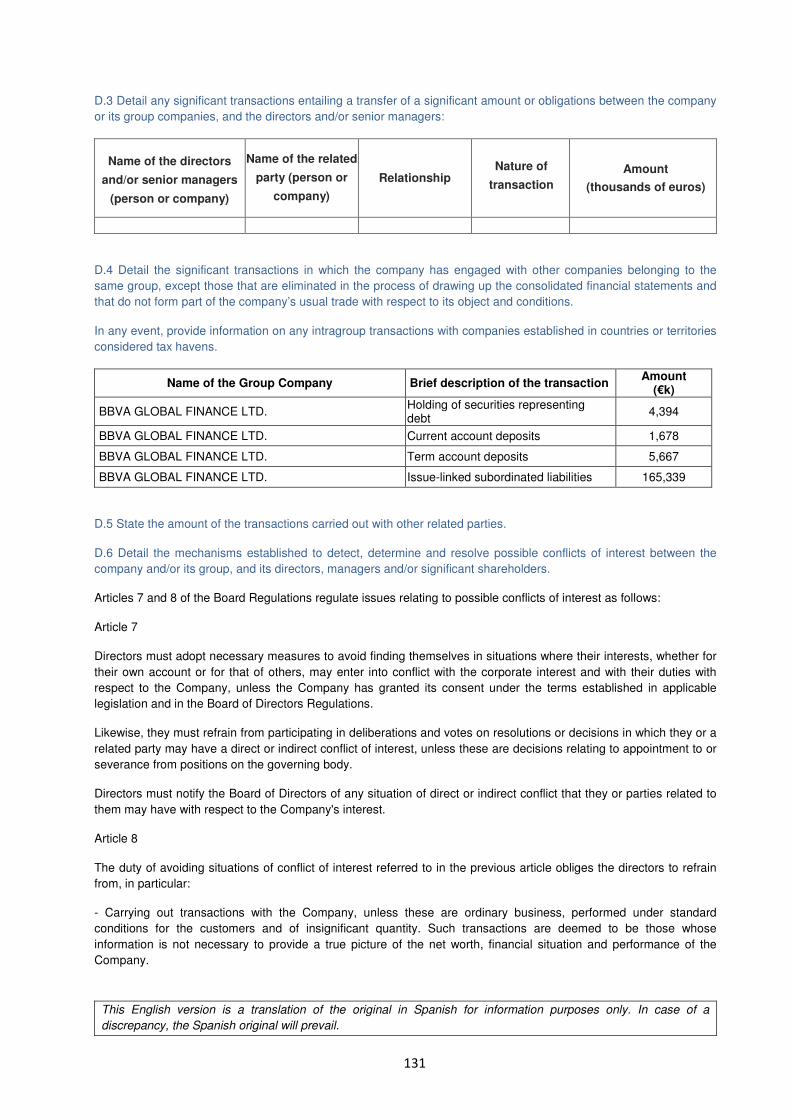
This English version is a translation of the original in Spanish for information purposes only. In case of a
discrepancy, the Spanish original will prevail.
131
D.3 Detail any significant transactions entailing a transfer of a significant amount or obligations between the company
or its group companies, and the directors and/or senior managers:
Name of the directors
and/or senior managers
(person or company)
Name of the related
party (person or
company)
Relationship Nature of
transaction
Amount
(thousands of euros)
D.4 Detail the significant transactions in which the company has engaged with other companies belonging to the
same group, except those that are eliminated in the process of drawing up the consolidated financial statements and
that do not form part of the company’s usual trade with respect to its object and conditions.
In any event, provide information on any intragroup transactions with companies established in countries or territories
considered tax havens.
Name of the Group Company Brief description of the transaction Amount
(€k)
BBVA GLOBAL FINANCE LTD. Holding of securities representing debt
4,394
BBVA GLOBAL FINANCE LTD. Current account deposits 1,678
BBVA GLOBAL FINANCE LTD. Term account deposits 5,667
BBVA GLOBAL FINANCE LTD. Issue-linked subordinated liabilities 165,339
D.5 State the amount of the transactions carried out with other related parties.
D.6 Detail the mechanisms established to detect, determine and resolve possible conflicts of interest between the
company and/or its group, and its directors, managers and/or significant shareholders.
Articles 7 and 8 of the Board Regulations regulate issues relating to possible conflicts of interest as follows:
Article 7
Directors must adopt necessary measures to avoid finding themselves in situations where their interests, whether for
their own account or for that of others, may enter into conflict with the corporate interest and with their duties with
respect to the Company, unless the Company has granted its consent under the terms established in applicable
legislation and in the Board of Directors Regulations.
Likewise, they must refrain from participating in deliberations and votes on resolutions or decisions in which they or a
related party may have a direct or indirect conflict of interest, unless these are decisions relating to appointment to or
severance from positions on the governing body.
Directors must notify the Board of Directors of any situation of direct or indirect conflict that they or parties related to
them may have with respect to the Company's interest.
Article 8
The duty of avoiding situations of conflict of interest referred to in the previous article obliges the directors to refrain
from, in particular:
- Carrying out transactions with the Company, unless these are ordinary business, performed under standard
conditions for the customers and of insignificant quantity. Such transactions are deemed to be those whose
information is not necessary to provide a true picture of the net worth, financial situation and performance of the
Company.
This English version is a translation of the original in Spanish for information purposes only. In case of a
discrepancy, the Spanish original will prevail.
132
- Using the Company's name or invoking their position as director to unduly influence the performance of private
transactions.
- Making use of the corporate assets, including the Company's confidential information, for private ends.
- Taking advantage of the Company’s business opportunities.
- Obtaining advantages or remuneration from third parties other than the Company and its Group, associated to the
performance of their position, unless they are mere tokens of courtesy.
- Engaging in activities for their own account or on behalf of third parties that involve effective actual or potential
competition with the Company or that, in any other way, bring them into permanent conflict with the Company's
interests.
The above provisions will also apply should the beneficiary of the prohibited acts or activities described in the
previous subsections be a related party related to the director. However, the Company may dispense with the
aforementioned prohibitions in specific cases, authorising a director or a related party to carry out a certain
transaction with the Company, to use certain corporate assets, to take advantage of a specific business opportunity
or to obtain an advantage or remuneration from a third party.
When the authorization is intended to dispense with the prohibition against obtaining an advantage or remuneration
from third parties, or affects a transaction whose value is over 10% of the corporate assets, it must necessarily be
agreed by a General Meeting resolution.
The obligation not to compete with the Company may only be dispensed with them no damage is expected to the
Company or when any damage that is expected is compensated by benefits that are foreseen from the dispensation.
The dispensation will be conferred under an express and separate resolution of the General Meeting.
In other cases, the authorization may also be resolved by the Board of Directors, provided the independence of the
members conferring it is guaranteed with respect to the director receiving the dispensation. Moreover, it will be
necessary to ensure that the authorized transaction will not do harm to the corporate net worth or, where applicable,
that it is carried out under market conditions and that the process is transparent.
Approval of the transactions of the Company or its Group companies with directors needing to be approved by the
Board will be granted after receiving a report from the Audit and Compliance Committee. The only exceptions to this
approval will be transactions that simultaneously meet the following 3 specifications: 1) they are carried out under
contracts with standard terms and are applied en masse to a large number of customers; 2) they go through at
market rates or prices set in general by the party acting as supplier of the goods or services; and 3) they are worth
less than one per cent of the Company’s annual revenues.
Since BBVA is a credit institution, it is subject to the provisions of Act 10/2014, dated 26th June, on the regulation,
supervision and solvency of credit institutions, whereby the directors and general managers or similar may not obtain
credits, bonds or guarantees from the Bank on whose board or management they work, above the limit and under the
terms established in article 35 of Royal Decree 84/2015, which implemented Law 10/2014, unless expressly
authorized by the Bank of Spain.
All the members of the Board of Directors and the Senior Management are subject to the Company’s Internal
Standards of Conduct on the Securities Markets. These Standards are intended to control possible Conflicts of
Interest. They establish that all Persons Subject to it must notify the head of their area or the Compliance Department
of situations that could potentially and under specific circumstances may entail Conflicts of Interest that could
compromise their impartiality, before they engage in any transaction or conclude any business in which they could
arise in the scope of the securities markets.
D.7 Are more than one of the Group’s companies listed in Spain as publicly traded companies?
NO
Identify the listed subsidiaries in Spain:
This English version is a translation of the original in Spanish for information purposes only. In case of a
discrepancy, the Spanish original will prevail.
133
Listed subsidiaries
Indicate whether the respective areas of business and any potential relations between them and any potential
business relations between the holding company and the listed subsidiary and other group companies have been
publicly defined;
Define any potential business relations between the holding company and the listed subsidiary company and between the listed subsidiaries and other group companies
Identify the mechanisms established to resolve any potential conflicts of interest between the listed subsidiary and
other companies of the group:
Mechanisms to resolve possible conflicts of interest
E RISK CONTROL AND MANAGEMENT SYSTEMS
E.1 Explain the scope of the company’s Risk Management System, including risks of a tax-related nature.
The BBVA Group has a General Risk Control and Management Model (hereinafter, "the Model") adapted to its business model, organization and the geographical areas in which it operates. It allows it to operate within the framework of strategy and control policy and risk management defined by the Bank's corporate bodies and adapt to an economic and regulatory environment, addressing risk management globally and adapted to the circumstances at any particular time. The Model makes provision for a suitable risk management system in relation to the Bank's risk profile and strategy of the Company, which applies comprehensively across the Group. The Model is composed of the elements set out below: I. Governance and organization. The governance model for risk management at BBVA is characterized by a special involvement of its corporate bodies, both in setting the risk strategy and in the ongoing monitoring and supervision of its implementation. The corporate bodies therefore approve the risk strategy and the corporate policies for the different types of risks, being the risk management function in charge of its implementation and development in terms of management, reporting to the corporate bodies. The responsibility for the day-to-day management of risks lies with the businesses, whose activity is carried out in accordance with the policies, rules, procedures, infrastructures and controls defined by the risk management function, based on the framework set by the corporate bodies. To adequately carry out this task, BBVA Group's risk management function has been configured as a single and global function independent of the commercial areas. II. Risk Appetite Framework. It is approved by the Board and determines the risks and risk levels that the Group is willing to assume to achieve its business objectives, taking into account the organic development of the business. These are expressed in terms of solvency, profitability, liquidity and funding or other metrics, which are reviewed periodically or if there are any substantial changes in the entity's business. The determination of the Risk Appetite Framework has the following objectives:
• Set out the maximum risk levels the Group is willing to accept.
• To establish a set of guidelines for action and a management framework for the medium and long term that prevent actions from being taken which could compromise the future viability of the Group.
• Establish a relationship framework with the geographical and/or business areas.
• To establish a common language throughout the organization and develop a compliance-oriented risk culture.
• Alignment with the new regulatory requirements, facilitating communication with regulators, investors and other stakeholders.
III. Decisions and processes. The transfer of the Risk Appetite Framework to ordinary management is underpinned by three basic elements:
• A harmonized regulatory body.
• Risk planning.
This English version is a translation of the original in Spanish for information purposes only. In case of a
discrepancy, the Spanish original will prevail.
134
• Integrated management of risks over their life cycle IV. Assessment, monitoring and reporting. Assessment, monitoring and reporting is a cross-cutting element that should ensure that the Model has a dynamic and proactive vision to enable compliance with the Risk Appetite Framework approved by the corporate bodies, even in adverse scenarios. There are various phases:
• Identify the risk factors that could compromise compliance with the risk appetite thresholds.
• Assessment of the impact of the materialization of the risk factors on the metrics that define the Risk Appetite Framework based on different scenarios, including stress scenarios.
• Response to undesired situations and proposal of rechanneling measures to allow a dynamic management of the situation, even before it occurs.
• Monitoring of the Group's risk profile and of the identified risk factors, through internal, competitor and market indicators, among others, to anticipate their future development.
• Reporting: Complete and reliable information on the development of risks for the governing bodies and senior management, with the frequency and completeness appropriate to the nature, significance and complexity of the risks reported. The principle of transparency governs all reporting of risk information.
V. Infrastructure. This is an element that must ensure that the Group has the human and technological resources needed for effective management and supervision of risks in order to carry out the functions set out in the Group's risk Model and achieve their aims. With respect to human resources, the Group's risk function has an adequate workforce in terms of number, skills, knowledge and experience. With respect to technology, the Group's risk function assures the integrity of the management information systems and the provision of the infrastructure required to support risk management, using the tools appropriate to the needs derived from the different types of risks in their admission, management, valuation and monitoring. The Group promotes the development of a risk culture that ensures consistent application of the risk control and management model in the Group, and that guarantees that the risks function is understood and internalized at all levels of the organization. Regarding taxation, BBVA has defined a tax-related risk management policy based on a suitable control environment, a system for identifying risks and a monitoring process including continuous improvement of the effectiveness of the established controls. This management model was evaluated and assessed by an independent expert.
E.2 Identify the corporate bodies responsible for drawing up and enforcing the Risk Management System, including
tax-related risks.
The Board of Directors (hereinafter "the Board") approves the risk strategy and supervises the internal control and management systems. Specifically, in relation to the risk strategy, the Board approves the Group's Risk Appetite statement, the core metrics and the main metrics by type of risk, as well as the General Risk Management and Control Model. The Board of Directors is also responsible for approving and monitoring the strategic and business plan, the annual budgets and management goals, as well as the investment and funding policy, in a consistent way and in line with the approved Risk Appetite Framework. For this reason, the processes for defining the Risk Appetite Framework proposals and strategic and budgetary planning at Group level are coordinated by the executive area for submission to the Board. With the aim of ensuring the integration of the Risk Appetite Framework into management, on the basis established by the Board of Directors, the Executive Committee ("EC") approves the rest of metrics by type of risk (in 2017, in relation to concentration, profitability and reputation) and the Group's basic structure of limits in terms of geographic areas, types of risk, asset classes and portfolios. This Committee also approves specific corporate policies for each type of risk. Lastly, the Board of Directors has set up a committee specializing in risks, the Risk Committee ("RC"), that assists the Board and the EC in determining the Group's risk strategy and the risk limits and policies, respectively, analyzing and assessing beforehand the proposals submitted to those bodies. The amendment of the Group's risk strategy and the elements composing it, including the Risk Appetite Framework metrics within its remit, is the exclusive power of the BBVA Board of Directors, while the Executive Committee is responsible for amending the metrics by type of risk within its scope of decision and the Group's basic structure of limits (core limits), when applicable. In both cases, the amendments follow the same decision-making process described
This English version is a translation of the original in Spanish for information purposes only. In case of a
discrepancy, the Spanish original will prevail.
135
above, so the proposals for amendment are submitted by the executive area (CRO) and later analyzed, first by the RC, for later submission to the Board of Directors or to the EC, as appropriate. Moreover, the RC, the EC and the Board itself conduct proper monitoring of the risk strategy implementation and of the Group's risk profile. The risks function regularly reports on the development of the Group's Risk Appetite Framework metrics to the Board and to the Executive Committee, after their analysis by the Risk Committee, whose role in this monitoring and control work is particularly relevant. The head of the risk function in the executive line, the Chief Risk Officer (CRO), carries out his work with the independence, authority, rank, experience, knowledge and resources required. This Officer is appointed by the Bank's Board of Directors, as a member of its Senior Management, and has direct access to the corporate bodies (Board of Directors, EC and RC), to which it reports on a regular basis on the situation of the risks in the Group. The CRO for the best performance of his functions is supported by a structure consisting of cross-cutting risk units in the corporate area and specific risk units in the Group's geographical and/or business areas. Each of these units is headed by a Chief Risk Officer for the geographical and/or business area who, within his/her area of responsibility, carries out risk control and management functions and is responsible for applying the corporate policies and rules approved at Group level in a consistent manner, adapting them if necessary to local requirements and reporting to the local governing bodies. The Chief Risk Officers of the geographical and/or business areas report both to the Group's Chief Risk Officer and to the head of their geographical and/or business area. This dual reporting system aims to ensure the independence of the local risk management function from the operating functions and enable its alignment with the Group's corporate policies and goals related to risks. The risks function has a decision-making process supported by a structure of committees. The Global Risk Management Committee (GRMC) is the highest executive body in the risk area and proposes, examines and, where applicable, approves, among others, the internal risk regulatory framework and the procedures and infrastructures needed to identify, assess, measure and manage the risks facing the Group in its businesses, as well as the admission of operations involving more relevant risks. Regarding the tax-related risk, the Tax Department establishes the control mechanisms and internal rules necessary to ensure compliance with the tax laws in force and the tax strategy approved by the Board of Directors. This function is subject to supervision by the Audit and Compliance Committee of the BBVA Group, and is evidenced by the appearances made before the same by the Head of the Fiscal Function of the BBVA Group.
E.3 Indicate the primary risks, including tax-related risks that could prevent business targets from being met.
BBVA has risk identification and scenario analysis processes in place that enables to conduct a dynamic and proactive risk management. These processes are forward-looking to ensure the identification of emerging risks, and take into account the concerns of both the business areas and the corporate areas and Senior Management. Risks are captured and measured in a consistent way using the most appropriate methodologies in each case. Their measurement includes the design and application of scenario analyses and stress testing, and considers the controls the risks are subjected to. A forward projection is performed of the Risk Appetite Framework variables in stress scenarios with the aim of identifying possible deviations from the established thresholds; if such deviations are detected, the appropriate measures are adopted to keep those variables within the target risk profile. In this context, there are a series of emerging risks that could affect the Group's business performance. These risks are described in the following main blocks:
• Macroeconomic and geopolitical risks o Global growth improved in 2017 and developed and emerging markets came into better synchrony, thus
making recovery more sustainable. The growth of world trade, calm financial markets - which depend on the support of central banks - and the absence of inflation further contribute to a brighter outlook. The more advanced economies are performing strongly, especially in the euro area. Growth in the United States will be supported in short term by the recently passed tax reform, although its long-term impact is unlikely to be significant. In the emerging economies, growth in China continues to moderate, with a combination of policies designed to smooth out financial imbalances. In Latin America, activity is picking up in a context of higher prices for basic products and favorable conditions in financial markets.
o The uncertainty surrounding these positive economic prospects, though trending downward, continues
This English version is a translation of the original in Spanish for information purposes only. In case of a
discrepancy, the Spanish original will prevail.
136
to be high. After a protracted period of exceptionally loose monetary policy, the main central banks are scaling down their support. Uncertainty now arises as to the effect on the markets and the economy, given the background of high leverage and signs of overvaluation in some financial assets. A second source of uncertainty is the extent of political support for multilateral governance of global trade. Thirdly, global geopolitics and internal politics in some countries may have an effect on the economic outlook within the purview of BBVA.
o The Group's geographical diversification is the key to achieving a high level of recurring revenue, despite the conditions of the environment and the cycles of the economies in which it operates.
• Regulatory and reputational risks o Financial institutions are exposed to a complex and changing regulatory and legal environment that can
impact their growth capacity and the conducting of certain businesses, with higher liquidity and capital requirements and lower profitability ratios. The Group monitors changes in the regulatory framework (e.g., IFRS 9, Basel IV, etc.) on an ongoing basis to enable it to anticipate and adapt to those changes sufficiently in advance, adopt the best practices and the most efficient and rigorous criteria for their
implementation.
o The financial sector is coming under intense scrutiny by regulators, governments and society itself. Negative news or inappropriate conduct can seriously damage an institution's reputation and affect its ability to conduct a sustainable business. The attitudes and conduct of the Group and of its members are governed by the principles of integrity, honesty, long-term vision and best practices, thanks to the internal control model, the Code of Conduct, tax strategy and the Group's Responsible Business strategy, among others.
• Business, legal and operational risks o New technologies and forms of customer relationships: The development of the digital world and the
information technologies poses major challenges for financial institutions, that represent threats (new competitors, disintermediation, etc.) and also opportunities (new customer relations framework, greater ability to adapt to their needs, new products and distribution channels, etc.). Digital transformation is one of the priorities for the Group, which aims to lead the digital banking of the future.
o Technological risks and security breaches: Financial institutions are exposed to new threats such as cyber-attacks, internal and customer database theft, or payment system fraud that require major investments in security from the technological and human point of view. The Group attaches a great deal of importance to active management and control of operational and technological risk. One example is the early adoption of advanced models for managing these risks.
o The financial sector is exposed to growing litigation rates and is facing an elevated number of lawsuits whose economic consequences cannot be easily foreseen. The Group carries out a constant management and tracking of such lawsuits in defense of its own interests, and allocates, when considered necessary, the corresponding provisions for coverage thereof, following the criteria of internal lawyers and external legal experts handle the conduct of the proceedings themselves.
E.4 Identify whether the entity has a risk tolerance level, including tax-related risks.
The Group's Risk Appetite Framework approved by the governing bodies determines the risks and the risk level that the Group is willing to assume to achieve its business objectives taking into account its natural development. These are expressed in terms of solvency, profitability, liquidity and funding or other metrics, which are reviewed periodically or if there are any substantial changes in the entity's business or relevant corporate operations. The Risk Appetite Framework is expressed through the following elements:
• Risk Appetite Statement: sets out the general principles of the Group's risk strategy and the target risk profile.
• Core metrics: based on the Risk Appetite Statement, these statements specify the general principles of risk management in terms of solvency, profitability, liquidity, funding, and recurring revenue. Moreover, the core metrics reflect, in quantitative terms, the principles and the target risk profiles set out in the Risk Appetite Statement and are aligned with the Group's strategy.
• Metrics by type of risk: based on the core metrics and their thresholds for each type of risk, statements are established that set out the general management principles for the risk and a number of metrics are calibrated, whose observance enables compliance with the core metrics and the Group's Risk Appetite Statement.
This English version is a translation of the original in Spanish for information purposes only. In case of a
discrepancy, the Spanish original will prevail.
137
• Core limits structure: The core limits structure is designed to shape the Risk Appetite Framework at geographical area, risk type, asset type and portfolio level, ensuring that management is within the metrics by type of risk.
In addition to this Framework, there is a level of management limits that is defined and managed by the risks function when developing the basic structure of limits, with the aim of ensuring that proactive management of risks by risk subcategory within each type or by subportfolio is in line with that basic structure of limits and in general with the established Risk Appetite Framework. The corporate risk area works with the various geographical and/or business areas to define their Risk Appetite Framework, so that it is coordinated with, and integrated into the Group's Risk Appetite, making sure that its profile is in line with the one defined. The Risk Appetite Framework expresses the levels and types of risk that the Bank is willing to assume to be able to implement its strategic plan with no relevant deviations, even in situations of stress. The Risk Appetite Framework is integrated within management, and the processes for defining the Risk Appetite Framework proposals are coordinated with the strategic and budgetary planning at Group level. As mentioned earlier, the core metrics of the BBVA Risk Appetite Framework measure the Group's performance in terms of solvency, liquidity, funding, profitability and revenue recurrence. Most of the core metrics are accounting and/or regulatory metrics, and are therefore regularly disclosed to the market in the BBVA Group's annual and quarterly financial reporting. In 2017 the Risk Appetite metrics changed in line with the metrics of the Risk Appetite Framework.
E.5 State what risks, including tax-related risks, have occurred during the year.
Risk is inherent to financial business, so the occurrence of risk to a greater or lesser extent is absolutely implicit in the Group’s activities. BBVA thus provides detailed information on its annual financial statements (note 7 in the Report and note 19 in the consolidated accounts covering tax-related risks) regarding the developments of such risks, since their very nature can permanently affect the Group in undertaking its activities. Furthermore, as stated in note 24 to the financial statements, after the decision of the Court of Justice of the European Union on interest rate limitation clauses in consumer mortgage loans (known as "floor clauses"), BBVA recognized a provision to cover any future claims in this respect.
E.6 Explain the response and supervision plans for the principal risks faced by the company, including tax-related
risks
The BBVA Group's internal control system takes its inspiration from the best practices developed both in the “Enterprise Risk Management – Integrated Framework” of COSO (Committee of Sponsoring Organizations of the Treadway Commission) and in the “Framework for Internal Control Systems in Banking Organizations”, drawn up by the Basel Bank of International Settlements (BIS). The control model has a system with three lines of defense:
• The Group's business units constitute the first line of defense. They are responsible for managing current and emerging risks and implementing control procedures. It is also responsible for reporting to its business/support unit.
• The second line of defense is made up of the units specializing in control: Compliance, Accounting & Supervisors (Internal Financial Control), Global Risk Management (Internal Risk Control) and Engineering (Internal Operations Control and IT Control). This line collaborates in identifying current and emerging risks, defines the control policies within the scope of its cross-sector specialty, ensures that they are implemented correctly, and provides training and advice to the first line. In addition, one of its main functions is to monitor and question the control activity carried out by the first line of defense. The control activity of the first and second line of defense will be coordinated by the Internal Control Unit, which will also be responsible for providing these units with a common internal control methodology and global tools. The Group's Head of Internal Risk Control is responsible for the function and reports its activities to the CRO and to the Board's Risk Committee, assisting it in any matters where requested.
This English version is a translation of the original in Spanish for information purposes only. In case of a
discrepancy, the Spanish original will prevail.
138
• The third line of defense is made up of the Internal Audit unit, for which the Group assumes the guidelines of the Basel Committee on Banking Supervision and of the Institute of Internal Auditors. Its function is that of providing independent and objective assurance and consulting activity designed to add value and improve the Organization's operations.
In addition, within the risk area, the Group has units for Internal Risk Control and Internal Validation that are independent of the units that develop the models, manage the processes and execute the controls. Its scope of action is global, both from the geographical point of view and in terms of the types of risks. It encompasses all the areas of the organization and is designed to identify and manage the risks faced by the Group entities, in order to guarantee the established corporate objectives. The main function of Internal Risk Control is to ensure the existence of a sufficient internal regulatory framework, a process and measures defined for each type of risks identified in the Group, and for those other types of risk that may potentially affect the Group, control their application and operation, and ensure that the risk strategy is integrated into the Group's management. The Group's Head of Internal Risk Control is responsible for the function and reports its activities and informs on its work plans to CRO and to the Board's Risk Committee, assisting it in any matters where requested. To perform its duties, the unit has a structure of teams at a corporate level and also in the most important geographical areas in which the Group operates. As in the case of the corporate area, local units are independent of the business areas that execute the processes, and of the units that execute the controls. They report functionally to the Internal Risk Control unit. This unit's lines of action are established at Group level, and it is responsible for adapting and executing them locally, as well as for reporting the most relevant aspects. Among other functions, Internal Validation is responsible for the internal review and independent validation of the models used for risk measurement and assumption and for determining the Group's capital requirements. With regard to tax risks, the Board of Directors approved the Tax Strategy for the BBVA Group. This strategy reflects the tax-related postures of the Group. This strategy integrates the results of the OECD BEPS project and the guidelines given in Chapter XI, Part I of the "OECD Guidelines for Multinational Enterprises". In this regard, the Tax Department establishes the policies and control processes for guaranteeing compliance with the tax laws currently in force and the tax strategy.
F SYSTEMS OF RISK MANAGEMENT AND INTERNAL CONTROL OVER FINANCIAL REPORTING (ICFR)
Describe the mechanisms comprising the risk management and control systems for financial reporting (ICFR) in the
entity.
F.1 The entity’s control environment
Give information, describing the key features of at least:
F.1.1. Which bodies and/or functions are responsible for: (i) the existence and maintenance of an adequate and
effective ICFR; (ii) its implementation; and (iii) its supervision.
Pursuant to article 17 of the Board Regulations, the Board of Directors approves the financial information that BBVA
is required to publish periodically as a publicly traded company. The Board of Directors has an Audit and Compliance
Committee, whose mission is to assist the Board in overseeing the financial information and the exercise of the
Group control duties.
In this respect, the BBVA Audit and Compliance Committee Regulations establish that the Committee's duties include
the supervision of the sufficiency, suitability and effective operation of the internal control systems in the process of
drawing up and preparing financial information, so as to rest assured of the correctness, accuracy, sufficiency and
clarity of the financial information of the Entity and its consolidated Group.
The BBVA Group complies with the requirements imposed by the Sarbanes Oxley Act ("SOX") for each year's
consolidated annual financial statements due to its status as a publicly traded company listed with the United States
This English version is a translation of the original in Spanish for information purposes only. In case of a
discrepancy, the Spanish original will prevail.
139
Securities Exchange Commission ("SEC"). The main Group executives are involved in the design, compliance and
maintenance of an effective internal control model that guarantees the quality and veracity of the financial
information. The Accounting & Supervisors Unit ("A&S") is in charge of producing the consolidated annual financial
statements and maintaining the model of control over financial information generation. Specifically, this function is
performed by the Financial Internal Control area, which is integrated within the general internal control model of the
Group, which is outlined below.
The BBVA Group has established and maintains an internal control model that has two components. The first element
is the structure of control organized into three lines of defense (3LD); the second is a scheme of governance known
as Corporate Assurance.
In accordance with the most advanced standards of internal control, the three lines of defense model is configured as
follows:
• The first line of defense rests with the various areas and/or business units of the Group that are in charge of
managing the risks relating to their operations and carrying out the controls required to mitigate them.
• The second line of defense is made up of the areas/units specializing in control, such as: Compliance, Internal
Financial Control, Internal Risk Control, Internal Operations Control and Internal Technology Control. This
second line of defense cooperates with the first line of defense to identify current and emerging risks in
connection with operations, specifies control policies and models within its cross-cutting remit, monitors
progress, and regularly assesses the proper design and effectiveness of implemented controls.
• The third line of defense is the Internal Audit area, which depends directly on the Group's Executive Chairman. It
is completely independent from the functions being audited and is not part of any other activity that may be
subject to an audit. It has global scope, meaning it covers each and every one of BBVA Group activities and
entities.
In addition, to reinforce the internal control environment, the Group has in place a scheme of governance called
Corporate Assurance, which establishes a framework for the supervision of the internal control model and for
escalation to Senior Management of the main issues relating to internal control within the Group. The Corporate
Assurance model (in which the business areas, support areas and the areas specializing in internal control
participate) is organized into a system of committees that analyze the most relevant issues related to internal control
in each geographical area, with the participation of the country's top managers. These committees report to the
Group's Global Committee, chaired by the CEO with the assistance of the main global executives responsible for the
business and control areas.
The effectiveness of this internal control system is assessed on an annual basis for those risks that may have an
impact on the proper drawing up of the Group's financial statements. The assessment is conducted under the
coordination of the Internal Financial Control area, and is assisted by the control specialists of the business and
support areas and the Group's Internal Audit department. In addition, the external auditor of the BBVA Group issues
an opinion every year on the effectiveness of internal control over financial reporting based on criteria established by
COSO (Committee of Sponsoring Organizations of the Treadway Commission) and in accordance with the standards
of the United States Public Company Accounting Oversight Board (PCAOB). This opinion appears in the Form 20-F
that is filed every year with the SEC.
The result of the annual internal assessment of the System of Internal Control over Financial Reporting is reported to
the Group's Audit and Compliance Committee by the heads of Internal Audit and Internal Financial Control.
F.1.2. Whether, especially in the process of drawing up the financial information, the following elements exist:
• Departments and/or mechanisms responsible for: (i) the design and review of the organisational structure; (ii) the
clear definition of lines of responsibility and authority, with an adequate distribution of tasks and functions; and (iii)
ensuring that sufficient procedures exist for their correct dissemination within the entity.
The drafting of the financial information is carried out by the local Financial Management units of the countries and
the related consolidation work is done by the A&S Division, which is overall responsible for the drafting and reporting
of financial and regulatory information of the Group.
This English version is a translation of the original in Spanish for information purposes only. In case of a
discrepancy, the Spanish original will prevail.
140
BBVA has an organizational structure that clearly defines action lines and responsibility in the areas involved in the
preparation of financial information, both in each entity and in the consolidated Group, and has the necessary
channels and circuits for its correct dissemination. The units responsible for drawing up these financial statements
have an adequate distribution of tasks and segregation of functions necessary to draw up these statements in an
appropriate operational and control framework.
Additionally, there is a cascade accountability assumption model aimed at extending the internal control culture and
the commitment of its compliance. Those in charge of the design and operation of the processes that have an impact
on financial information certify that all the controls associated with its operation under their responsibility are sufficient
and have worked correctly.
• Code of conduct, approval body, degree of dissemination and instruction, principles and values included (indicating
whether specific mention is made of recording the transactions and drawing up of the financial information), body in
charge of analysing non-compliance and proposing corrective measures and sanctions.
BBVA has a Code of Conduct, approved by the Board of Directors, that sets out BBVA's specific commitments in
developing one of the principles of its Corporate Culture: Integrity as a means of understanding and conducting
business. This Code likewise establishes the corresponding channel for whistleblowers regarding possible
infringements of the Code. It is the subject of ongoing training and refresher programs including key personnel in the
financial function.
Since 2016, and after the Code was updated in 2015, campaigns have been developed to communicate and
disseminate its new contents, taking advantage of new formats and digital channels. In addition, an ambitious training
plan has been developed at a global level, reaching the entire workforce of the Group.
The Code of Conduct is published on the Bank's website (www.bbva.com) and on the employees website (intranet).
Additionally, Group members undertake personally and individually to observe its principles and rules in an express
declaration of awareness and adhesion.
The duties of the Audit and Compliance Committee include ensuring that the internal codes of ethics and conduct
and on securities markets, applicable to all group personnel, comply with legal requirements and are adequate for the
Bank.
Additionally, BBVA has adopted a structure of Corporate Integrity Management Committees (with individual powers at
jurisdiction or Group entity levels, as applicable). Their joint scope of action covers all the Group businesses and
activities and their main duty is to ensure effective application of the Code of Conduct. There is also a Corporate
Integrity Management Committee, whose scope of responsibility extends throughout BBVA. The critical mission of
this committee entails ensuring uniform application of the Code in BBVA.
The Compliance Unit in turn independently and objectively promotes and supervises to ensure that BBVA acts with
integrity, particularly in areas such as money-laundering prevention, conduct with clients, security market conduct,
corruption prevention, and other areas that could entail a reputational risk for BBVA. The unit's duties include
fostering the knowledge and application of the Code of Conduct, promoting the drafting and distribution of its
implementing standards, assisting in the resolution of any concern insofar as interpretation of the Code that may
arise, and managing the Whistle-Blowing Channel.
• Whistle-blowing channel, to allow financial and accounting irregularities to be communicated to the Audit
Committee, as well as possible non-compliance with the code of conduct and irregular activities in the organization,
reporting where applicable if this is confidential in nature.
Preservation of the Corporate Integrity of BBVA transcends the merely personal accountability for individual actions, it
calls for all employees to have zero tolerance for activities outside the Code of Conduct or that could harm the
reputation or good name of BBVA, an attitude that is reflected in everyone's commitment to whistle-blowing, by timely
communication, of situations that, even when unrelated to their activity or area of responsibility, could be illegal or
infringe upon the values and guidelines of the Code.
This English version is a translation of the original in Spanish for information purposes only. In case of a
discrepancy, the Spanish original will prevail.
141
The Code of Conduct itself establishes the communication guidelines to follow and contemplates a Whistle-Blowing
Channel, likewise guaranteeing the duty to reserve of the reporting parties, confidentiality of the investigations and
the prohibition of retaliation or adverse consequences in light of communications made in good faith.
Telephone lines and email boxes have been set up for these communications in each jurisdiction. A list of these
appears on the Group Intranet.
As described in the previous section, BBVA has adopted a structure of Corporate Integrity Management Committees
(with individual powers at jurisdiction or Group entity levels, as applicable), whose joint scope of action covers all the
Group businesses and activities and whose functions and responsibilities (explained in greater detail in their
corresponding regulations) include:
• Drive and monitor global initiatives to foster and promote a culture of ethics and integrity among members of the
Group.
• Ensure uniform application of the Code.
• Promote and monitor the functioning and effectiveness of the Whistle-blowing Channel.
• In exceptional cases where they are not already included among the members of the Committee, inform Senior
Management and/or the person responsible for the preparation of the financial statements of those events and
circumstances from which significant risks might arise for BBVA.
In addition, periodic reports are made to the Audit and Compliance Committee that supervises and controls their
proper functioning (independently managed by the Compliance area).
• Periodic training and refresher courses for employees involved in preparing and revising the financial information,
and in ICFR assessment, covering at least accounting standards, audit, internal control and risk management.
Specific training and periodic refresher courses are given on accounting and tax-related standards, internal control
and risk management in units involved in drawing up and reviewing the financial and tax-related information and in
evaluating the internal control system, to help them perform their functions correctly.
Within the A&S area, there is an annual training program for all members of the area on aspects related to the
preparation of financial information and new regulations applicable in accounting, financial and fiscal matters, as well
as other courses adapted to the needs of the area. These courses are taught by professionals from the area and
renowned external providers.
This specific training program is in addition to the general Group training, which includes courses on finance and
technology among other subjects.
Additionally, the BBVA Group has a personal development plan for all employees, which forms the basis of a
personalized training program to deal with the areas of knowledge necessary to perform their functions.
F.2 Financial reporting risk assessment
Give information on at least:
F.2.1. The key features of the risk identification process, including error and fraud risks, with respect to:
• Whether the process exists and is documented.
The ICFR was developed by the Group Management in accordance with international standards set forth by the
Committee of Sponsoring Organizations of the Treadway Commission (“COSO”), establishing five components on
which the effectiveness and efficiency of internal control systems must be based:
• Establishing an adequate control environment for monitoring all these activities.
• Evaluating the risks that may be incurred by an entity in drawing up its financial information.
This English version is a translation of the original in Spanish for information purposes only. In case of a
discrepancy, the Spanish original will prevail.
142
• Designing the necessary controls to mitigate the most critical risks.
• Establishing the adequate information circuits to detect and communicate the system's weaknesses or
inefficiencies.
• Monitoring such controls to ensure they are operational and the validity of their effectiveness over time.
In order to identify the risks with a greater potential impact on the generation of financial information, the processes
from which such information is generated are analyzed and documented, and an analysis of the risk situation that
may arise in each is later conducted.
Based on the corporate internal control and operational risk methodology, the risks are included in a range of
categories by type, which include the error and fraud (internal/external) categories, and their probability of occurrence
and possible impact is analyzed.
The process of identifying risks in the preparation of the Financial Statements, including risks of error, misstatement
or omission, is conducted by the parties responsible for each of the processes that underpin financial reporting,
together with the Financial Internal Control unit, which, in turn, manages mitigation plans and reports to the Audit and
Compliance Committee.
The scope of the annual/quarterly or monthly assessment of their controls is determined based on the materiality of
the risks, thus ensuring coverage of the risks believed to be critical for the financial statements.
The assessment of the aforementioned risks and the design and effectiveness of their controls begins with the
management's understanding of and insight into the business and the analyzed operating process, considering
criteria of quantitative materiality, likelihood of occurrence and economic impact, in addition to qualitative criteria
associated with the type, complexity and nature of the risks or of the business structure itself.
The system for identifying and assessing the risks of internal control over financial reporting is dynamic. It evolves
continuously, always reflecting the reality of the Group's business, changes in operating processes, the risks affecting
them and the controls that mitigate them.
All this is documented in a corporate management tool developed and managed by Operational Risk (STORM). This
tool documents all the processes, risks and controls managed by the different control specialists, including the
Financial Internal Control unit.
• Whether the process covers all the objectives of financial reporting (existence and occurrence; completeness;
valuation; presentation, breakdown and comparability; and rights and obligations), whether the information is updated
and with what frequency.
Each of the processes developed and identified in the BBVA Group for drawing up financial information aim to record
all financial transactions, value the assets and liabilities in accordance with applicable accounting regulations and
provide a breakdown of the information in accordance with regulator requirements and market needs.
The financial reporting control model analyzes each of the above processes to ensure that identified risks are
properly covered by efficiently functioning controls. The control model is updated when changes arise in the relevant
processes for producing financial information.
• The existence of a process for identifying the consolidation perimeter, taking into account aspects including the
possible existence of complex corporate structures, instrumental or special purpose vehicles.
The A&S (Accounting and Supervisors) organization includes a Consolidation department that carries out a monthly
process of identification, analysis and updating of the Group's consolidation perimeter.
In addition, the information from the consolidation department on new companies set up by the Group's different units
and the changes made to existing companies is compared with the data analyzed by two specific committees whose
This English version is a translation of the original in Spanish for information purposes only. In case of a
discrepancy, the Spanish original will prevail.
143
function is to analyze and document the changes in the composition of the corporate group (Holding Structure
Committee and Investments in Non-Banking Companies Committee, both corporate).
In addition, with regard to special purpose vehicle control, the Internal Audit and Compliance areas of the Bank make
a periodic report of the Group's structure to the Board of Directors and to the Audit and Compliance Committee.
• Whether the process takes into account the effects of other types of risks (operational, technological, financial,
legal, tax-related, reputational, environmental, etc.) insofar as they impact the financial statements.
The internal control model over financial reporting applies to processes for directly drawing up such financial
information and all operational or technical processes that could have a relevant impact on the financial, accounting,
tax-related or management information.
As explained above, all the specialist control areas apply a standard methodology and use a common tool (STORM)
to document the identification of the risks, of the controls that mitigate those risks and of the assessment of their
effectiveness.
There are control specialists in all the operational or support areas, and therefore any type of risk that may affect the
Group's operations is analyzed under that methodology (market, credit, operational, technological, financial, legal,
tax-related, reputational or any other type of risk) and is included in the ICFR insofar as it may have an impact on the
financial information.
• Which of the entity's governing bodies supervises the process.
The process for identifying risks and assessing the design, effectiveness and suitability of the controls is documented
at least once a year, and it is supervised by the Internal Audit area.
Moreover, the Head of Internal Audit and the Head of Internal Financial Control of the Group report annually to the
Audit and Compliance Committee in respect of analysis work and the conclusions of the assessment of the control
model for financial reporting and the certification process. This work follows the SOX methodology to comply with the
legal requirements under laws and regulations on systems of internal control over financial reporting, and is included
in report 20-F, submitted annually to the SEC, as indicated in the first point of the control environment.
F.3 Control activities
Give information on the main features, if at least the following exist:
F.3.1. Procedures for review and authorization of the financial information and the description of the ICFR, to be
published on the securities markets, indicating who is responsible for it, and the documentation describing the activity
flows and controls (including those concerning risk of fraud) for the different types of transactions that may materially
impact the financial statements, including the procedure for closing the accounts and the specific review of the
relevant judgements, estimates, valuations and projections.
All the processes related to the drawing up of the financial information are documented, together with their control
model: potential risks linked to each process and controls established for their mitigation. As explained in point F.2.1,
the aforementioned risks and controls are recorded in the corporate tool STORM, which also includes the result of the
assessment of the operation of the controls and the degree of risk mitigation.
In particular, the main processes related to the generation of financial information are: accounting, consolidation,
financial reporting, financial planning and monitoring, financial and tax-related management. The analysis of these
processes, their risks and their controls is also supplemented by all other critical risks that may have a financial
impact from business areas or other support areas.
Likewise, there are procedures for review by the areas responsible for generating the financial and tax-related
information disseminated to the securities markets, including the specific review of the relevant judgments, estimates
and projections.
This English version is a translation of the original in Spanish for information purposes only. In case of a
discrepancy, the Spanish original will prevail.
144
As mentioned in the annual financial statements, it is occasionally necessary to make estimates to determine the
amount at which some assets, liabilities, income and expenses and commitments should be recorded. These
estimates relate mainly to the following:
• Impairment losses on certain financial assets.
• The assumptions used to quantify certain provisions and in the actuarial calculation of liabilities and
commitments for post-employment and other obligations.
• The useful life and impairment losses of tangible and intangible assets.
• The appraisal of goodwill and price assignments in business combinations.
• The fair value of certain unlisted assets and liabilities.
• The recoverability of deferred tax assets.
• The exchange rate and inflation index in certain countries.
These estimates are made based on the best information available on the financial statement closing date and,
together with the other relevant issues for the closing of the annual and six-monthly financial statements, are
analyzed and authorized by a Technical Committee at A&S (A&S Executive Steering Committee) and submitted to
the Audit and Compliance Committee before their filing by the Board of Directors.
F.3.2. Internal control procedures and policies for information systems (among others, access security, change
control, their operation, operational continuity and segregation of functions) that support the relevant processes in the
entity with respect to the drawing up and publication of the financial information.
Internal control models include procedures and controls regarding the operation of information systems and access
security, functional segregation, development and modification of computer applications used to generate financial
information.
The current methodology for internal control and operational risk establishes a list of controls by category whose
breakdown includes (among others) two categories: access control and functional segregation. Both categories of
controls are identified in the model of internal control of financial information and their risks and controls are analyzed
and assessed on a regular basis, so the integrity and reliability of the information drawn up can be guaranteed.
Additionally, there is a corporate level procedure for managing system access profiles. It is developed, implemented
and updated by the Group's Engineering internal control unit. This unit is also in charge of providing support for
control processes in change management (development in test environments and putting changes into production),
incident management, management of transactions, media and backup copy management, and management of
business continuity, among other things.
With all these mechanisms, the BBVA Group ensures the maintenance of adequate management of access control,
the establishment of the correct and necessary steps to put applications into production and their subsequent
support, the creation of backup copies, and assurance of continuity in the processing and recording of transactions.
In summary, the entire process of preparing and publishing financial information has established and documented the
procedures and control models necessary to provide reasonable assurance about the correctness of BBVA Group's
public financial information.
F.3.3. Internal control procedures and policies designed to supervise the management of activities subcontracted to
third parties, and those aspects of the evaluation, calculation and assessment outsourced to independent experts,
which may materially impact the financial statements.
The internal control model set out specific controls and procedures for the management of subcontracted activities or
those aspects of evaluation, calculation and assessment of assets or liabilities outsourced to independent experts.
This English version is a translation of the original in Spanish for information purposes only. In case of a
discrepancy, the Spanish original will prevail.
145
There is a set of standards and an Outsourcing Committee that establishes and supervises the requirements that
must be met at group level for the activities to be subcontracted. Regarding the financial processes, there are
procedural manuals contemplating the outsourced activity that identify the processes to be executed and the controls
to be applied by the service provider units and units entrusted with the outsourcing thereof. The controls established
in the outsourced processes concerning the generation of financial information are also tested by the Internal
Financial Control area.
The valuations from independent experts used for matters relevant for generating financial information are included
within the standard circuit of review procedures executed by internal control, Internal Audit and external Audit.
F.4 Information and communication
Give information on the main features, if at least the following exist:
F.4.1. A specific function in charge of defining and keeping the accounting policies updated (accounting policy
department or area) and dealing with queries or conflicts stemming from their interpretation, ensuring fluent
communication with those in charge of operations in the organization, and an up-to-date manual of accounting
policies, communicated to the units through which the entity operates.
The organization has two areas within A&S (Group Financial Accounting and Global Supervisory Relations) in charge
of the Accounting (Accounting Working Group) and Solvency Technical Committees. Their purpose is to analyze,
study and issue standards that may impact the drawing up of the Group's financial and regulatory information,
determining the accounting and solvency criteria required to ensure correct recording of transactions to the accounts
and calculation of capital requirements within the framework of applicable rules and standards.
The Group has in place an updated accounting policies manual, disseminated over the Company intranet to all the
units in the Group. This manual is the tool that guarantees that all the decisions related to accounting policies or
specific accounting criteria to be applied in the Group are supported and are standardized. The Accounting Policies
Manual is approved in the Accounting Working Group and is documented and updated for its use and analysis by all
the Group's entities.
F.4.2. Mechanisms to capture and prepare the financial reporting in standardised formats, for application and use by
all the units of the entity or the group, that support the main financial statements and the notes, and the information
detailed on ICFR.
The Group's A&S area and the financial directorates of the countries are responsible for the preparation of the
financial statements in accordance with the current accounting and consolidation manuals. There is also a
consolidation computer application that includes the information on the accounting of the various Group companies
and performs the consolidation processes, including the standardization of accounting criteria, aggregation of
balances and consolidation adjustments.
Control measures have also been implemented in each of the said processes, locally and at consolidated level, in
order to guarantee that all the data underpinning the financial information are collected in a comprehensive, exact
and timely manner. There is also a single and standardized format for the financial reporting system. It is applicable
to and used by all the Group units and supports the main financial statements and the explanatory notes. There are
also control measures and procedures to ensure that the information disclosed to the markets includes a sufficient
level of detail to enable investors and other users of the financial information to understand and interpret it.
F.5 Supervision of the system's operation
Give information, describing the key features of at least:
F.5.1. The ICFR supervision activities carried out by the Audit Committee and whether the entity has an internal audit
function whose powers include providing support to the Audit Committee in its task of supervising the internal control
system, including the ICFR. Likewise, information will be given on the scope of the ICFR assessment carried out
during the year and of the procedure by which the person in charge of performing the assessment communicates its
results, whether the entity has an action plan listing the possible corrective measures, and whether its impact on the
financial reporting has been considered.
This English version is a translation of the original in Spanish for information purposes only. In case of a
discrepancy, the Spanish original will prevail.
146
The internal control units of the business areas and of the support areas conduct a preliminary assessment of the
internal control model, assess the risks identified in the processes, the effectiveness of controls, and the degree of
mitigation of the risks, and also identify weaknesses, design, implement and monitor the mitigation measures and
action plans.
BBVA also has an Internal Audit unit that provides support to the Audit and Compliance Committee on the
independent supervision of the financial information internal control system. The Internal Audit function is entirely
independent of the units that draw up the financial information.
All the control weaknesses, mitigation measures and specific action plans are documented in the corporate tool
STORM and submitted to the internal control and operational risk committees of the areas, as well as to the local or
global Corporate Assurance Committees, based on the relevance of the detected issues.
To sum up: both the weaknesses identified by the internal control units and those detected by the internal or external
auditor have an action plan in place to correct or mitigate the risks.
During 2017, internal control areas conducted a full assessment of the financial information internal control system,
and, to date, no material or significant weakness have been revealed therein. The assessment was reported to the
Audit and Compliance Committee.
Additionally, in compliance with SOX, the Group annually assesses the effectiveness of the internal control model for
financial reporting on group of risks (within the perimeter of SOX companies and critical risks) that could impact the
drawing up of financial statements at local and consolidated levels. This perimeter considers risks and controls of
other specialties that are not directly financial (regulatory compliance, technology, risks, operational, human
resources, procurement, legal, etc.).
F.5.2. Whether there is a discussion procedure by which the auditor (in line with the technical auditing notes), the
internal audit function and other experts can inform senior management and the audit committee or the directors of
the entity of significant weaknesses in the internal control encountered during the review processes for the annual
accounts or any others within their remit. Likewise, give information on whether there is an action plan to try to correct
or mitigate the weaknesses observed.
As mentioned in the preceding section (F.5.1) of this Annual Corporate Governance Report, the Group does have a
procedure in place whereby the internal auditor, the external auditor and the heads of Internal Financial Control can
report to the Audit and Compliance Committee any internal control weaknesses detected in the course of their work.
Any material weaknesses will likewise be reported. Thus, a plan of action is prepared for all detected weaknesses,
which is presented to the Audit and Compliance Committee.
Since BBVA is a company listed with the SEC, the BBVA Group's auditor issues on an annual basis its opinion on the
effectiveness of the internal control over the financial information contained in the Group's annual consolidated
financial statements as of 31 December each year under PCAOB standards (“Public Company Accounting Oversight
Board”), with a view to filing the financial information under Form 20-F with the SEC. The latest report issued on the
financial information for 2016 is available on www.sec.gov.
The internal control oversight carried out by the Audit and Compliance Committee, described in the Audit and
Compliance Committee Regulations published on the Group website, includes the following activities:
• Analyze the financial statements of the Bank and of its consolidated Group contained in the annual, six-monthly
and quarterly reports prior to their submission to the Board, as well as all other required financial information,
with the necessary detail deemed appropriate. For this purpose, the Committee shall be provided with the
necessary support by the Group's Senior Management, especially that of the Accounting Department and the
Company and Group auditor.
• Review the necessary scope of consolidation, the correct application of accounting criteria, and all the relevant
changes relating to the accounting principles used and the presentation of the financial statements.
This English version is a translation of the original in Spanish for information purposes only. In case of a
discrepancy, the Spanish original will prevail.
147
• Oversee the effectiveness of the company's internal control, internal audit and risk management systems in the
process of drawing up and reporting the mandatory financial information, including tax-related risks, as well as
discuss with the auditor any significant weaknesses in the internal control systems detected during the audit,
without undermining its independence. For such purposes, and where appropriate, they may submit
recommendations or proposals to the Board of Directors, along with the period for their follow-up.
• Analyze, and approve as the case may be, the Annual Internal Audit Plan, monitoring it and being apprised of
the degree to which the audited units are complying with the corrective measures recommended.
The external auditor and the Head of Internal Audit regularly attend all meetings of the Audit and Compliance
Committee and are properly informed of the matters addressed therein.
F.6 Other relevant information
F.7 External auditor report
Report on:
F.7.1. Whether the ICFR information disclosed to the markets has been submitted by the external auditor, in which
case the entity must attach the corresponding report as an annex. Otherwise, explain the reasons why it was not.
The information related to internal control over the financial information of the BBVA Group described in this report is
reviewed by the external auditor, which issues its opinion on the control system and on its effectiveness in relation to
the statements published at the close of each financial year.
On 31 March 2017, the BBVA Group, as a private foreign issuer in the United States, filed the Annual Report Form
20-F which was published on the SEC website on that same date.
In accordance with the requirements set out in Section 404 of the Sarbanes-Oxley Act of 2002 by the Securities and
Exchange Commission (SEC), the Annual Report Form 20-F included the certification of the main Group executives
on the establishment, maintenance and assessment of the Group's internal control system of financial reporting.
Form 20-F report also included the opinion of the external auditor regarding the effectiveness of the entity's internal
control system of financial reporting at year-end 2016.
G DEGREE OF COMPLIANCE WITH CORPORATE GOVERNANCE RECOMMENDATIONS
Indicate the extent to which the company follows the recommendations of the Good Governance Code of listed
companies.
Should any recommendation not be followed or be only partially followed, a detailed explanation should be given of
the reasons so that the shareholders, investors and the market in general have sufficient information to assess the
way the company works. General explanations will not be acceptable.
1. The bylaws of listed companies should not place an upper limit on the votes that can be cast by a single
shareholder, or impose other obstacles to the takeover of the company by means of share purchases on the market.
COMPLIANT
2. When a dominant and subsidiary company are both listed, they should provide detailed disclosure on:
a) The activity they engage in and any business dealings between them, as well as between the listed
subsidiary and other group companies.
b) The mechanisms in place to resolve possible conflicts of interest.
NOT APPLICABLE
This English version is a translation of the original in Spanish for information purposes only. In case of a
discrepancy, the Spanish original will prevail.
148
3. During the annual general meeting the chairman of the board should verbally inform shareholders in sufficient
detail of the most relevant aspects of the company’s corporate governance, supplementing the written information
circulated in the annual corporate governance report. In particular:
a) Changes taking place since the previous annual general meeting.
b) The specific reasons for the company not following a given Good Governance Code recommendation, and
any alternative procedures followed in its stead.
COMPLIANT
4. The company should draw up and implement a policy of communication and contacts with shareholders,
institutional investors and proxy advisors that complies in full with market abuse regulations and accords equitable
treatment to shareholders in the same position.
This policy should be disclosed on the company’s website, complete with details of how it has been put into practice
and the identities of the relevant interlocutors or those charged with its implementation.
COMPLIANT
5. The board of directors should not make a proposal to the general meeting for the delegation of powers to issue
shares or convertible securities without pre-emptive subscription rights for an amount exceeding 20% of capital at the
time of such delegation.
When a board approves the issuance of shares or convertible securities without pre-emptive subscription rights, the
company should immediately post a report on its website explaining the exclusion as envisaged in company
legislation.
PARTIALLY COMPLIANT
The General Shareholders' Meeting of the Company of March 17, 2017 delegated to the Board of Directors a power
to increase capital and issue convertible securities, with an attached power to wholly or partially exclude pre-emptive
subscription rights in respect of capital increases and issues of convertible securities carried out using such
delegated power. The power to exclude pre-emptive subscription rights is limited, overall, to 20% of share capital as it
stood at the time of the delegation, except for the issuance of contingently convertible securities which foresee its
conversion to satisfy regulatory capital adequacy requirements as to eligibility as capital instruments in accordance
with applicable laws and regulations, because such instruments do not dilute the interests of shareholders.
6. Listed companies drawing up the following reports on a voluntary or compulsory basis should publish them on their
website well in advance of the annual general meeting, even if their distribution is not obligatory:
a) Report on auditor independence.
b) Reviews of the operation of the audit committee and the nomination and remuneration committee.
c) Audit committee report on related-party transactions.
d) Report on corporate social responsibility policy.
COMPLIANT
7. The company should broadcast its general meetings live on the corporate website.
COMPLIANT
8. The audit committee should strive to ensure that the board of directors can present the company’s accounts to the
general meeting without limitations or qualifications in the auditor’s report. In the exceptional case that qualifications

This English version is a translation of the original in Spanish for information purposes only. In case of a
discrepancy, the Spanish original will prevail.
149
exist, both the chairman of the audit committee and the auditors should give a clear account to shareholders of their
scope and content.
COMPLIANT
9. The company should disclose its conditions and procedures for admitting share ownership, the right to attend
general meetings and the exercise or delegation of voting rights, and display them permanently on its website.
Such conditions and procedures should encourage shareholders to attend and exercise their rights and be applied in
a non-discriminatory manner.
COMPLIANT
10. When an accredited shareholder exercises the right to supplement the agenda or submit new proposals prior to
the general meeting, the company should:
a) Immediately circulate the supplementary items and new proposals.
b) Disclose the model of attendance card or proxy appointment or remote voting form duly modified so that
new agenda items and alternative proposals can be voted on in the same terms as those submitted by the
board of directors.
c) Put all these items or alternative proposals to the vote applying the same voting rules as for those submitted
by the board of directors, with particular regard to presumptions or deductions about the direction of votes.
d) After the general meeting, disclose the breakdown of votes on such supplementary items or alternative
proposals.
NOT APPLICABLE
11. In the event that a company plans to pay for attendance at the general meeting, it should first establish a general,
long-term policy in this respect.
NOT APPLICABLE
12. The Board of Directors should perform its duties with unity of purpose and independent judgement, according the
same treatment to all shareholders in the same position. It should be guided at all times by the company’s best
interest, understood as the creation of a profitable business that promotes its sustainable success over time, while
maximizing its economic value.
In pursuing the corporate interest, it should not only abide by laws and regulations and conduct itself according to
principles of good faith, ethics and respect for commonly accepted customs and good practices, but also strive to
reconcile its own interests with the legitimate interests of its employees, suppliers, clients and other stakeholders, as
well as with the impact of its activities on the broader community and the natural environment.
COMPLIANT
13. The board of directors should have an optimal size to promote its efficient functioning and maximize participation.
The recommended range is accordingly between five and fifteen members.
COMPLIANT
14. The board of directors should approve a director selection policy that:
a) Is concrete and verifiable;
b) Ensures that appointment or re-election proposals are based on a prior analysis of the board’s needs; and
This English version is a translation of the original in Spanish for information purposes only. In case of a
discrepancy, the Spanish original will prevail.
150
c) Favours a diversity of knowledge, experience and gender.
The results of the prior analysis of board needs should be written up in the nomination committee’s explanatory
report, to be published when the general meeting is convened that will ratify the appointment and re-election of each
director.
The director selection policy should pursue the goal of having at least 30% of total board places occupied by women
directors before the year 2020.
The nomination committee should run an annual check on compliance with the director selection policy and set out its
findings in the annual corporate governance report.
COMPLIANT
15. Proprietary and independent directors should constitute an ample majority on the board of directors, while the
number of executive directors should be the minimum practical bearing in mind the complexity of the corporate group
and the ownership interests they control.
COMPLIANT
16. The percentage of proprietary directors out of all non-executive directors should be no greater than the proportion
between the ownership stake of the shareholders they represent and the remainder of the company’s capital.
This criterion can be relaxed:
a) In large cap companies where few or no equity stakes attain the legal threshold for significant shareholdings.
b) In companies with a plurality of shareholders represented on the board but not otherwise related.
COMPLIANT
17. Independent directors should be at least half of all board members.
However, when the company does not have a large market capitalization, or when a large cap company has
shareholders individually or concertedly controlling over 30 percent of capital, independent directors should occupy,
at least, a third of board places.
EXPLAIN
Until May 2017, the BBVA Board of Directors was composed by a majority of non-executive directors and
independent directors accounted, at least, the half of the total members of the Board. Notwithstanding, an
independent director resigned from the BBVA Board on May 31, 2017 for personal reasons. From that day onward
and at year-end, BBVA independent directors accounted for 46.15% of all Bank directors.
In the exercise of its powers and duties the Appointments Committee has in the course of the year undertaken an
ongoing analysis of the structure, size and composition of the Board such that it support the best possible discharge
of its duties, and of the terms of the Board selection, appointment, rotation and diversity policy, which, for these
purposes, provides that the composition of the Board of Directors should comprise a suitable balance among the
different classes of director, with non-executive directors accounting for an ample majority over executive directors
and independent directors making up at least 50% of the entire Board. Based on its analysis, the Committee decided
to set in motion in 2017 a process of selection of candidates who fulfill the required professional profile and suitability
requirements under applicable laws and regulations and might be appointed members of the Board of Directors as
independent directors.
The candidate selection process conducted by the Committee with the assistance of a leading international external
consultant on director selection concluded with the proposals for re-election and appointment of directors submitted
by the Board of Directors to the General Shareholders’ Meeting of the Company of 2018. A highlight is the proposal
to appoint three new independent directors. If the proposals for re-election and appointment submitted to the Annual
This English version is a translation of the original in Spanish for information purposes only. In case of a
discrepancy, the Spanish original will prevail.
151
General Meeting are approved, the BBVA Board will then be composed by a total of 15 directors, of whom 3 will be
executive, 12 non-executive, 4 being "other external" and 8 being independent, such that independent directors will
account for more than half of all directors of the Bank.
18. Companies should disclose the following director particulars on their websites and keep them regularly updated:
a) Background and professional experience.
b) Directorships held in other companies, listed or otherwise, and other paid activities they engage in, of
whatever nature.
c) Statement of the director class to which they belong, in the case of proprietary directors indicating the
shareholder they represent or have links with.
d) Dates of their first appointment as a board member and subsequent re-elections.
e) Shares held in the company, and any options on the same.
COMPLIANT
19. Following verification by the nomination committee, the annual corporate governance report should disclose the
reasons for the appointment of proprietary directors at the urging of shareholders controlling less than 3 percent of
capital; and explain any rejection of a formal request for a board place from shareholders whose equity stake is equal
to or greater than that of others applying successfully for a proprietary directorship.
NOT APPLICABLE
20. Proprietary directors should resign when the shareholders they represent dispose of their ownership interest in its
entirety. If such shareholders reduce their stakes, thereby losing some of their entitlement to proprietary directors, the
latters’ number should be reduced accordingly.
COMPLIANT
21. The board of directors should not propose the removal of independent directors before the expiry of their tenure
as mandated by the bylaws, except where they find just cause, based on a proposal from the nomination committee.
In particular, just cause will be presumed when directors take up new posts or responsibilities that prevent them
allocating sufficient time to the work of a board member, or are in breach of their fiduciary duties or come under one
of the disqualifying grounds for classification as independent enumerated in the applicable legislation.
The removal of independent directors may also be proposed when a takeover bid, merger or similar corporate
transaction alters the company’s capital structure, provided the changes in board membership ensue from the
proportionality criterion set out in recommendation 16.
COMPLIANT
22. Companies should establish rules obliging directors to disclose any circumstance that might harm the
organization’s name or reputation, tendering their resignation as the case may be, and, in particular, to inform the
board of any criminal charges brought against them and the progress of any subsequent trial.
The moment a director is indicted or tried for any of the offences stated in company legislation, the board of directors
should open an investigation and, in light of the particular circumstances, decides whether or not he or she should be
called on to resign. The board should give a reasoned account of all such determinations in the annual corporate
governance report.
COMPLIANT
23. Directors should express their clear opposition when they feel a proposal submitted for the board’s approval
might damage the corporate interest. In particular, independents and other directors not subject to potential conflicts

This English version is a translation of the original in Spanish for information purposes only. In case of a
discrepancy, the Spanish original will prevail.
152
of interest should strenuously challenge any decision that could harm the interests of shareholders lacking board
representation.
When the board makes material or reiterated decisions about which a director has expressed serious reservations,
then he or she must draw the pertinent conclusions. Directors resigning for such causes should set out their reasons
in the letter referred to in the next recommendation.
The terms of this recommendation also apply to the secretary of the board, even if he or she is not a director.
COMPLIANT
24. Directors who give up their place before their tenure expires, through resignation or otherwise, should state their
reasons in a letter to be sent to all members of the board. Whether or not such resignation is disclosed as a material
event, the motivating factors should be explained in the annual corporate governance report.
COMPLIANT
25. The nomination committee should ensure that non-executive directors have sufficient time available to discharge
their responsibilities effectively.
The board of director’s regulations should lay down the maximum number of company boards on which directors can
serve.
COMPLIANT
26. The board should meet with the necessary frequency to properly perform its functions, eight times a year at least,
in accordance with a calendar and agendas set at the start of the year, to which each director may propose the
addition of initially unscheduled items.
COMPLIANT
27. Director absences should be kept to a strict minimum and quantified in the annual corporate governance report.
In the event of absence, directors should delegate their powers of representation with the appropriate instructions.
COMPLIANT
28. When directors or the secretary express concerns about some proposal or, in the case of directors, about the
company’s performance, and such concerns are not resolved at the meeting, they should be recorded in the minute
book if the person expressing them so requests.
COMPLIANT
29. The company should provide suitable channels for directors to obtain the advice they need to carry out their
duties, extending if necessary to external assistance at the company’s expense.
COMPLIANT
30. Regardless of the knowledge directors must possess to carry out their duties, they should also be offered
refresher programmes when circumstances so advise.
COMPLIANT
31. The agendas of board meetings should clearly indicate on which points directors must arrive at a decision, so
they can study the matter beforehand or gather together the material they need.
For reasons of urgency, the chairman may wish to present decisions or resolutions for board approval that were not
on the meeting agenda. In such exceptional circumstances, their inclusion will require the express prior consent, duly
minuted, of the majority of directors present.
This English version is a translation of the original in Spanish for information purposes only. In case of a
discrepancy, the Spanish original will prevail.
153
COMPLIANT
32. Directors should be regularly informed of movements in share ownership and of the views of major shareholders,
investors and rating agencies on the company and its group.
COMPLIANT
33. The chairman, as the person charged with the efficient functioning of the board of directors, in addition to the
functions assigned by law and the company’s bylaws, should prepare and submit to the board a schedule of meeting
dates and agendas; organize and coordinate regular evaluations of the board and, where appropriate, the company’s
first executive; exercise leadership of the board and be accountable for its proper functioning; ensure that sufficient
time is given to the discussion of strategic issues, and approve and review refresher courses for each director, when
circumstances so advise.
COMPLIANT
34. When a lead director has been appointed, the bylaws or board of directors regulations should grant him or her the
following powers over and above those conferred by law: chair the board of directors in the absence of the chairman
or vice chairmen; give voice to the concerns of non-executive directors; maintain contacts with investors and
shareholders to hear their views and develop a balanced understanding of their concerns, especially those to do with
the company’s corporate governance; and coordinate the chairman’s succession plan.
COMPLIANT
35. The board secretary should strive to ensure that the board’s actions and decisions are informed by the
governance recommendations of the Good Governance Code of relevance to the company.
COMPLIANT
36. The board in full should conduct an annual evaluation, adopting, where necessary, an action plan to correct
weakness detected in:
a) The quality and efficiency of the board’s operation.
b) The performance and composition of its committees.
c) The diversity of board membership and competences of the board.
d) The performance of the chairman of the board of directors and the company’s first executive.
e) The performance and contribution of individual directors, with particular attention to the chairmen of board
committees.
The evaluation of board committees should start from the reports they send the board of directors, while that of the
board itself should start from the report of the appointments committee.
Every three years, the board of directors should engage an external consultant to aid in the evaluation process. This
consultant’s independence should be verified by the appointments committee.
Any business dealings that the consultant or members of its corporate group maintain with the company or members
of its corporate group should be detailed in the annual corporate governance report.
The process followed and areas evaluated should be detailed in the annual corporate governance report.
COMPLIANT
37. When an executive committee exists, its membership mix by director class should resemble that of the board.
The secretary of the board should also act as secretary to the executive committee.
This English version is a translation of the original in Spanish for information purposes only. In case of a
discrepancy, the Spanish original will prevail.
154
PARTIALLY COMPLIANT
The current composition of the Executive Committee of BBVA was agreed by the Board of Directors at its meeting on
31 March 2016, and it was considered that it had the most adequate composition for the performance of its functions.
Thus, in accordance with article 26 of the Board of Directors Regulations of BBVA, which establishes that in its
composition non-executive directors have to be a majority over executive directors, as of 31 December 2017, the
Executive Committee of the Board of Directors partially reflects the participation on the Board of Directors since its
Chairman and Secretary are those of the Board of Directors and is composed of two executive directors and four
non-executive directors with the status of other external directors, which represents a majority of non-executive
directors in accordance with the provisions of the Regulations of the Board of Directors.
38. The board should be kept fully informed of the business transacted and decisions made by the executive
committee. To this end, all board members should receive a copy of the committee’s minutes.
COMPLIANT
39. All members of the audit committee, particularly its chairman, should be appointed with regard to their knowledge
and experience in accounting, auditing and risk management matters. A majority of committee places should be held
by independent directors.
COMPLIANT
40. Listed companies should have a unit in charge of the internal audit function, under the supervision of the audit
committee, to monitor the effectiveness of reporting and control systems. This unit should report functionally to the
board’s non-executive chairman or the chairman of the audit committee.
COMPLIANT
41. The head of the unit handling the internal audit function should present an annual work programme to the audit
committee, inform it directly of any incidents arising during its implementation and submit an activities report at the
end of each year.
COMPLIANT
42. The audit committee should have the following functions over and above those legally assigned:
1. With respect to internal control and reporting systems:
a) Monitor the preparation and the integrity of the financial information prepared on the company and, where
appropriate, the group, checking for compliance with legal provisions, the accurate demarcation of the
consolidation perimeter, and the correct application of accounting principles.
b) Monitor the independence of the unit handling the internal audit function; propose the selection,
appointment, re-election and removal of the head of the internal audit service; propose the service’s budget;
approve its priorities and work programmes, ensuring that it focuses primarily on the main risks the company
is exposed to; receive regular report-backs on its activities; and verify that senior management are acting on
the findings and recommendations of its reports.
c) Establish and supervise a mechanism whereby staff can report, confidentially and, if appropriate and
feasible, anonymously, any significant irregularities that they detect in the course of their duties, in particular
financial or accounting irregularities.
2. With regard to the external auditor:
a) Investigate the issues giving rise to the resignation of the external auditor, should this come about.
b) Ensure that the remuneration of the external auditor does not compromise its quality or independence.
This English version is a translation of the original in Spanish for information purposes only. In case of a
discrepancy, the Spanish original will prevail.
155
c) Ensure that the company notifies any change of external auditor to the CNMV as a material event,
accompanied by a statement of any disagreements arising with the outgoing auditor and the reasons for the
same.
d) Ensure that the external auditor has a yearly meeting with the board in full to inform it of the work
undertaken and developments in the company’s risk and accounting positions.
e) Ensure that the company and the external auditor adhere to current regulations on the provision of non-audit
services, limits on the concentration of the auditor’s business and other requirements concerning auditor
independence.
COMPLIANT
43. The audit committee should be empowered to meet with any company employee or manager, even ordering their
appearance without the presence of another senior officer.
COMPLIANT
44. The audit committee should be informed of any fundamental changes or corporate transactions the company is
planning, so the committee can analyze the operation and report to the board beforehand on its economic conditions
and accounting impact and, when applicable, the exchange ratio proposed.
COMPLIANT
45. Risk control and management policy should identify at least:
a) The different types of financial and non-financial risk the company is exposed to (including operational,
technological, financial, legal, social, environmental, political and reputational risks), with the inclusion under
financial or economic risks of contingent liabilities and other off-balance sheet risks.
b) The determination of the risk level the company sees as acceptable.
c) The measures in place to mitigate the impact of identified risk events should they occur.
d) The internal control and reporting systems to be used to control and manage the above risks, including
contingent liabilities and off-balance sheet risks.
COMPLIANT
46. Companies should establish a risk control and management function in the charge of one of the company’s
internal department or units and under the direct supervision of the audit committee or some other dedicated board
committee. This function should be expressly charged with the following responsibilities:
a) Ensure that risk control and management systems are functioning correctly and, specifically, that major risks
the company is exposed to are correctly identified, managed and quantified.
b) Participate actively in the preparation of risk strategies and in key decisions about their management.
c) Ensure that risk control and management systems are mitigating risks effectively in the frame of the policy
drawn up by the board of directors.
COMPLIANT
47. Appointees to the nomination and remuneration committee – or of the nomination committee and remuneration
committee, if separately constituted – should have the right balance of knowledge, skills and experience for the
functions they are called on to discharge. The majority of their members should be independent directors.
COMPLIANT
This English version is a translation of the original in Spanish for information purposes only. In case of a
discrepancy, the Spanish original will prevail.
156
48. Large-cap companies should operate separately constituted nomination and remuneration committees.
COMPLIANT
49. The nomination committee should consult with the company’s chairman and first executive, especially on matters
relating to executive directors.
When there are vacancies on the board, any director may approach the nomination committee to propose candidates
that it might consider suitable.
COMPLIANT
50. The remuneration committee should operate independently and have the following functions in addition to those
assigned by law:
a) Propose to the board the standard conditions for senior officer contracts.
b) Monitor compliance with the remuneration policy set by the company.
c) Periodically review the remuneration policy for directors and senior officers, including share-based
remuneration systems and their application, and ensure that their individual compensation is proportionate
to the amounts paid to other directors and senior officers in the company.
d) Ensure that conflicts of interest do not undermine the independence of any external advice the committee
engages.
e) Verify the information on director and senior officers’ pay contained in corporate documents, including the
annual directors’ remuneration report.
COMPLIANT
51. The remuneration committee should consult with the company’s chairman and first executive, especially on
matters relating to executive directors and senior managers.
COMPLIANT
52. The terms of reference of supervision and control committees should be set out in the board of directors
regulations and aligned with those governing legally mandatory board committees as specified in the preceding sets
of recommendations.
They should include at least the following terms:
a) Committees should be formed exclusively by non-executive directors, with a majority of independents.
b) They should be chaired by independent directors.
c) The board should appoint the members of such committees with regard to the knowledge, skills and
experience of its directors and each committee’s terms of reference; discuss their proposals and reports;
and provide report-backs on their activities and work at the first board plenary following each committee
meeting.
d) They may engage external advice, when they feel it necessary for the discharge of their functions.
e) Meeting proceedings should be minuted and a copy made available to all board members.
PARTIALLY COMPLIANT
This English version is a translation of the original in Spanish for information purposes only. In case of a
discrepancy, the Spanish original will prevail.
157
Until May 31, 2017, when a member of the Board resigned for personal reasons, the Board committees of oversight
and control were made up exclusively by non-executive directors, the majority being independents, except the Audit
and Compliance Committee which is composed exclusively by independent directors. As a result of that resignation,
and from that date onward, the composition of the Risk Committee ceased to have a majority of independent
directors.
Therefore, so that it adapts to the requirements of the Regulations of the Board of Directors and to assist in their
proper functioning, the Board of Directors reviewed the composition of the Committees during the year, rotating their
members to ensure that the members of each Committee has the appropriate, knowledge, skills and experience for
the responsibilities attributed to them.
After that review, the oversight and control committees of the Board are made up of non-executive directors, with a
majority of independents, except the Risk Committee, which, in compliance with the Regulations of the Board of
Directors as to composition, comprises 3 "other external" directors and 2 independent directors. All the Chairs of the
oversight and control committees are independent directors; specifically, the Chairs of the Audit and Compliance,
Appointments, Remuneration and Risk Committees.
After the Annual General Meeting of the Company to be held in March 2018, the Board will perform another analysis
of the composition of Board Committees, taking into account the potential new additions of directors that will be
approved at the General Meeting and, as appropriate, changes in the status of current directors and any regulatory
requirements prevailing in this respect.
53. The task of supervising compliance with corporate governance rules, internal codes of conduct and corporate
social responsibility policy should be assigned to one board committee or split between several, which could be the
audit committee, the nomination committee, the corporate social responsibility committee, where one exists, or a
dedicated committee established ad hoc by the board under its powers of self-organization, with at the least the
following functions:
a) Monitor compliance with the company’s internal codes of conduct and corporate governance rules.
b) Oversee the communication and relations strategy with shareholders and investors, including small and
medium-sized shareholders.
c) Periodically evaluate the effectiveness of the company’s corporate governance system, to confirm that it is
fulfilling its mission to promote the corporate interest and catering, as appropriate, to the legitimate interests
of remaining stakeholders.
d) Review the company’s corporate social responsibility policy, ensuring that it is geared to value creation.
e) Monitor corporate social responsibility strategy and practices and assess compliance in their respect.
f) Monitor and evaluate the company’s interaction with its stakeholder groups.
g) Evaluate all aspects of the non-financial risks the company is exposed to, including operational,
technological, legal, social, environmental, political and reputational risks.
h) Coordinate non-financial and diversity reporting processes in accordance with applicable legislation and
international benchmarks.
COMPLIANT
54. The corporate social responsibility policy should state the principles or commitments the company will voluntarily
adhere to in its dealings with stakeholder groups, specifying at least:
a) The goals of its corporate social responsibility policy and the support instruments to be deployed.
b) The corporate strategy with regard to sustainability, the environment and social issues.
This English version is a translation of the original in Spanish for information purposes only. In case of a
discrepancy, the Spanish original will prevail.
158
c) Concrete practices in matters relative to: shareholders, employees, clients, suppliers, social welfare issues,
the environment, diversity, fiscal responsibility, respect for human rights and the prevention of illegal
conducts.
d) The methods or systems for monitoring the results of the practices referred to above and identifying and
managing related risks.
e) The mechanisms for supervising non-financial risk, ethics and business conduct.
f) Channels for stakeholder communication, participation and dialogue.
g) Responsible communication practices that prevent the manipulation of information and protect the
company’s honor and integrity.
COMPLIANT
55. The company should report on corporate social responsibility developments in its management’s report or in a
separate document, using an internationally accepted methodology.
COMPLIANT
56. Director remuneration should be sufficient to attract individuals with the desired profile and compensate the
commitment, abilities and responsibility that the post demands, but not so high as to compromise the independent
judgement of non-executive directors.
COMPLIANT
57. Variable remuneration linked to the company and the director’s performance, the award of shares, options or any
other right to acquire shares or to be remunerated on the basis of share price movements, and membership of long-
term savings schemes such as pension plans should be confined to executive directors.
The company may consider the share-based remuneration of non-executive directors provided they retain such
shares until the end of their mandate. This condition, however, will not apply to shares that the director must dispose
of to defray costs related to their acquisition.
COMPLIANT
58. In the case of variable awards, remuneration policies should include limits and technical safeguards to ensure
they reflect the professional performance of the beneficiaries and not simply the general progress of the markets or
the company’s sector, or circumstances of that kind.
In particular, variable remuneration items should meet the following conditions:
a) Be subject to predetermined and measurable performance criteria that factor the risk assumed to obtain a
given outcome.
b) Promote the long-term sustainability of the company and include non-financial criteria that are relevant for
the company’s long-term value, such as compliance with its internal rules and procedures and its risk control
and management policies.
c) Be focused on achieving a balance between the delivery of short, medium and long-term objectives, such
that performance-related pay rewards ongoing achievement, maintained over sufficient time to appreciate its
contribution to long-term value creation. This will ensure that performance measurement is not based solely
on one-off, occasional or extraordinary events.
COMPLIANT
This English version is a translation of the original in Spanish for information purposes only. In case of a
discrepancy, the Spanish original will prevail.
159
59. A major part of variable remuneration components should be deferred for a long enough period to ensure that
predetermined performance criteria have effectively been met.
COMPLIANT
60. Remuneration linked to company earnings should bear in mind any qualifications stated in the external auditor’s
report that reduce their amount.
COMPLIANT
61. A major part of executive directors’ variable remuneration should be linked to the award of shares or financial
instruments whose value is linked to the share price.
COMPLIANT
62. Following the award of shares, share options or other rights on shares derived from the remuneration system,
directors should not be allowed to transfer a number of shares equivalent to twice their annual fixed remuneration, or
to exercise the share options or other rights on shares for at least three years after their award.
The above condition will not apply to any shares that the director must dispose of to defray costs related to their
acquisition.
COMPLIANT
63. Contractual arrangements should include provisions that permit the company to reclaim variable components of
remuneration when payment was out of step with the director’s actual performance or based on data subsequently
found to be misstated.
COMPLIANT
64. Termination payments should not exceed a fixed amount equivalent to two years of the director’s total annual
remuneration and should not be paid until the company confirms that he or she has met the predetermined
performance criteria.
COMPLIANT
H OTHER INFORMATION OF INTEREST
1. If there is any other aspect relevant to the corporate government in the company or in the group entities that has
not been reflected in the rest of the sections of this report, but is necessary to include to provide more comprehensive
and well-grounded information on the corporate governance structure and practices in your entity or its group, detail
them briefly.
2. This section may also include any other relevant information, clarification or detail related to previous sections of
the report insofar as they are relevant and not reiterative.
Specifically indicate whether the company is subject to corporate governance legislation from a country other than
Spain and, if so, include the mandatory information to be provided when different from that required by this report.
3. The company may also indicate if it has voluntarily signed up to other international, industry-wide or any other
codes of ethical principles or best practices. Where applicable, the code in question will be identified along with the
date of signing. In particular, mention will be made as to whether it has adhered to the Code of Best Tax Practices
(Código de Buenas Prácticas Tributarias) of 20 July 2010.
The data in this report refer to the year ending 31 December 2017, except in those cases when another date of
reference is specifically stated.
Further to Section A.2, State Street Bank and Trust Co., The Bank of New York Mellon S.A.N.V. and Chase
Nominees Ltd., as international custodian/depositary banks, held 12.53%, 3.80% and 6.48% of BBVA's share capital,
This English version is a translation of the original in Spanish for information purposes only. In case of a
discrepancy, the Spanish original will prevail.
160
respectively, as of December 31 2017. Of said positions held by the custodian banks, BBVA is not aware of any
individual shareholders with direct or indirect holdings greater than or equal to 3% of BBVA common stock.
Filings of significant holdings to CNMV: On 18 October 2017, Blackrock Inc. filed a report with the CNMV (National
Securities Market Commission) stating that it now had an indirect holding of 5.708% of the BBVA share capital,
through the company Blackrock Investment Management.
The director holdings indicated in section A.3 are those reported as of 31 December 2017 and therefore may have
subsequently changed. Moreover, following the instructions in Circular 7/2015 of the CNMV to complete the
Corporate Governance Report, the owners of indirect holdings are not identified in this section, as none of them
reaches the 3% of share capital and none of them reside in tax havens.
Moreover, as an explanation to the second table of section A.3., the number of direct rights on shares in the
Company corresponds with the shares from the Annual Variable Remuneration (AVR) from previous years that was
deferred and pending payment on the date of this Report, if conditions are met. Thus, it is included the total number
of “rights to shares” of BBVA executive directors corresponding to the third and last third deferred of year 2014 that
they will receive in 2018; the 50% deferred of the AVR 2015 they will receive in 2019, and the 50% deferred of the
AVR 2016 they will receive in 2020, the two latter amounts, are subject to the applicable multi-year indicators that
may reduce the deferred amount, even become zero, yet never be increased.
These amounts are disclosed in an individual manner for each executive director in the following way:
- In the case of the Group Executive Chairman: 37,390 shares corresponding to the third and last third
deferred of the AVR 2014; 135,299 shares corresponding to the 50% of AVR 2015; and 114,204 shares
corresponding to the 50% of AVR 2016.
- In the case of the CEO: 11,766 shares corresponding to the third and last third deferred of AVR 2014;
79,956 shares corresponding to the 50% of AVR 2015; and 91,915 shares corresponding to the 50% of AVR
2016.
- In the case of the executive director Head of GERPA: 3,678 shares corresponding to the third and last third
deferred of AVR 2014; 14,815 shares corresponding to the 50% of AVR 2015; and 13,768 shares
corresponding to the 50% of AVR 2016.
The payment of these deferred shares is also subject to the non-occurrence of any of the conditions established by
the remuneration policy applicable in each year that could impede payment thereof (malus and clawback clauses), as
well as the remaining conditions of the settlement and payment system.
Further to the information in section A.8, regarding earnings from treasury-stock trading, rule 21 of Circular 4/2004
and IAS 32, paragraph 33, expressly prohibit the recognition in the income statement of profits or losses made on
transactions carried out with treasury shares, including their issue and redemption. Said profits and losses are directly
booked against the company’s net equity. In the table of significant variations, the date of entry of CNMV Model IV in
the registries of that organism, model corresponding to the communications with own shares and the reason for such
communication.
Regarding section A.9 bis, the resulting estimated floating capital of BBVA less the capital held by the members of
the Board of Directors and as treasury shares, both as of December 31, 2017, following the instructions to complete
the Annual Corporate Governance Report is 99.74%.
Further to the information in section A.10, there are no legal or bylaws restrictions on the exercise of voting rights and
there are no legal or bylaws restrictions on the free acquisition or transfer of shares in the company’s share capital.
As for the legal restrictions on the free acquisition or transfer of shares in the company’s share capital, Spanish Act
10/2014, dated 26th June, on the regulation, supervision and solvency of credit institutions establishes that the direct
or indirect acquisition of a significant holding (as defined in article 16 of that Act) is subject to assessment by the
Bank of Spain as set out in articles 16 et seq. of that Act. Additionally, article 25 of Royal Decree 84/2015,
implementing Act 10/2014, establishes that the Bank of Spain shall evaluate proposals for acquisitions of significant
shares and submit a proposal to the European Central Bank regarding whether to oppose this acquisition or not. This
same article establishes the criteria that should be considered during said evaluation and the applicable timelines.
This English version is a translation of the original in Spanish for information purposes only. In case of a
discrepancy, the Spanish original will prevail.
161
Further to the information included in section C.1.15:
The amount indicated as "Remuneration of the Board of Directors" includes remuneration stemming from the
remuneration systems established for non-executive and executive directors as provided for in the Remuneration
Policy for BBVA directors approved by the General Shareholders’ Meeting held in March 17, 2017 and pursuant to
article 33 bis and 50 bis of the Company Bylaws, respectively, and includes:
a) The fixed remuneration (for pertaining to the Board and Committees) and remuneration in kind
corresponding to 2017 of non-executive board members.
b) The fixed remuneration and in kind for executive directors corresponding to 2017.
c) The 2017 Annual Variable Remuneration in cash and in shares monetized for executive directors. It should
nonetheless be noted that this remuneration, has not accrued to the executive directors in its entirety on the
date of this Report, since, according to the BBVA Director Remuneration Policy applicable to them, they will
only receive 40% of this amount in 2018, while the remaining 60% will be deferred for a period of 5 years,
subject to compliance with multi-year performance indicators, 40% in cash and 60% in shares, if conditions
are met, with the following payment schedule: 60% after the third year of deferral; 20% after the fourth year
of deferral; and 20% after the fifth year of deferral.
Moreover, the 2017 Annual Variable Remuneration will be subject to the remaining conditions established in
the settlement and payment system provided in the BBVA Directors’ Remuneration Policy, and in particular
to: mandatory withholding and unavailability periods; hedging prohibitions; criteria for the update of the
deferred component in cash; forfeiture and recovery arrangements for the entire AVR
d) The remuneration paid for all concepts to two non-executive directors who ceased in their position in 2017
and who, consequently, did not remain in office as of 31 December 2017.
The total amount indicated, pursuant to the instructions in this Report, corresponds to the amount declared as total
remuneration accrued according to chart c) "Summary of Remuneration", section D.1 in the Annual Report on
Directors' Remuneration of BBVA.
All these items are included for each individual director in Note 54 of the Annual Report for year 2017.
For the purpose of calculating the cash value of the shares corresponding to the Annual Variable Remuneration for
2017 for executive directors, and in accordance with the BBVA Directors’ Remuneration Policy, the reference used
was the average BBVA share closing price corresponding to the trading days between 15 December 2017 and 15
January 2018, namely €7.25 per share.
In regard of the “Cumulative amount of rights of current directors in pension scheme” indicated in section C.1.15 of
this Report, the Bank has the Bank undertaken pension commitments with the Chief Executive Officer and the Head
of GERPA to cover retirement, disability and death contingencies as established in the Corporate Bylaws, BBVA
Directors’ Remuneration Policy, and their respective contracts with the Bank.
The amount established in the Remuneration Policy for BBVA Directors for the Chief Executive Officer, as annual
contribution to cover the retirement benefit under the new defined-contribution scheme, amounts to €1,642 thousand,
amount which shall be updated in the same proportion as the annual fixed remuneration for the Chief Executive
Officer, in the terms established in said Policy.
Likewise, pursuant to the Policy, 15% of the agreed annual contribution, mentioned above, shall be based on variable
components and be considered "discretionary pension benefits", thus subject to the conditions of delivery in shares,
retention and clawback established in applicable regulations, as well as to those other conditions of variable
remuneration applicable to them pursuant to the aforementioned Policy.
On the other hand, the Bank will assume payment of the annual insurance premiums in order to top up the coverage
of death and disability of the Chief Executive Officer’s benefits scheme, in the terms established in the Remuneration
Policy for BBVA Directors.
This English version is a translation of the original in Spanish for information purposes only. In case of a
discrepancy, the Spanish original will prevail.
162
Pursuant to the foregoing, in the year 2017 an amount of €1,853 thousand has been recorded to attend the benefits
commitments undertaken with the Chief Executive Officer, amount which includes the contribution to retirement
coverage (€1,642 thousand), as well as to death and disability (€211 thousand), with the total accumulated fund to
cover retirement commitments amounting €17,503 thousand, as at December 31, 2017.
15% of the agreed annual contribution to retirement (€246 thousand) has been registered in the year 2017 as
“discretionary pension benefits” and, following year-end 2017, said amount has been adjusted according to the
criteria established for the determination of the Chief Executive Officer’s annual variable remuneration for 2017.
Accordingly, the “discretionary pension benefits” for the year 2017 have been determined in an amount of €288
thousand, amount which will be included in the accumulated fund in the year 2018, subject to the same conditions as
the Deferred Component of annual variable remuneration for the year 2017, as well as the remaining conditions
established for these benefits in the Remuneration Policy for BBVA Directors.
As regards the executive director Head of GERPA, the pension scheme established in the Remuneration Policy for
BBVA Directors establishes an annual contribution of 30% of his fixed remuneration as of January 1, 2017, to cover
retirement benefit, as well as payment of the corresponding annual insurance premiums in order to top up the
coverage of death and disability.
As in the case of the Chief Executive Officer, 15% of the agreed annual contribution, mentioned above, shall be
based on variable components and be considered "discretionary pension benefits", thus subject to the conditions of
delivery in shares, retention and clawback established in applicable regulations, as well as to those other conditions
of variable remuneration applicable to them pursuant to the aforementioned Policy.
Pursuant to the foregoing, in the year 2017 an amount of €393 thousand has been recorded to attend the benefits
commitments undertaken with the executive director Head of GERPA, amount which includes the contribution to
retirement coverage (€250 thousand), as well as to death and disability (€143 thousand), with the total accumulated
fund to cover retirement commitments amounting €842 thousand, as at December 31, 2017.
15% of the agreed annual contribution to retirement (€38 thousand) has been registered in the year 2017 as
“discretionary pension benefits” and, following year-end 2017, said amount has been adjusted according to the
criteria established for the determination of the executive director Head of GERPA’s annual variable remuneration for
2017. Accordingly, the “discretionary pension benefits” for the year 2017 have been determined in an amount of €46
thousand, amount which will be included in the accumulated fund in the year 2018, subject to the same conditions as
the Deferred Component of annual variable remuneration for the year 2017, as well as the remaining conditions
established for these benefits in the Remuneration Policy for BBVA Directors.
There are no other pension obligations undertaken in favor of other executive directors.
The balance of the item "Provisions - Funds for pensions and similar liabilities" on the Group's consolidated balance
sheet as of 31 December 2017 includes €82,57 million under the item for post-employment benefit commitments
maintained with former members of the Board of Directors.
The explanation of the principal characteristics of the mentioned pension scheme is detailed in the Remuneration
Policy for BBVA Directors and Note 54 of the Annual Report for 2017.
Further to the information included in section C.1.16:
The heading “Total senior management remuneration” includes the remuneration of members of Senior Management
listed as such as of 31 December 2017 (15 members), comprising:
a) The fixed remuneration and the remuneration in kind during 2017;
b) The Annual Variable Remuneration received during 2017 corresponding to 2016, both in cash and in
shares;
c) The deferred part of the variable remuneration received during 2017, corresponding to previous years (2014
and 2013) both in cash and in shares, plus the amount of the corresponding updates.
For the purpose of calculating the cash value of the shares corresponding to said remuneration, the price considered
the delivery price in 2017 has been €6.22.
This English version is a translation of the original in Spanish for information purposes only. In case of a
discrepancy, the Spanish original will prevail.
163
In 2017, an amount of €5,630 thousand has been recorded to attend the benefits commitments undertaken with
members of the Senior Management, excluding executive directors, amount which includes the contribution to
retirement coverage (€4,910 thousand), as well as to death and disability (€720 thousand), with the total accumulated
fund to cover retirement commitments with the Senior Management amounting €55,689 thousand, as at December
31, 2017.
As in the case of executive directors, 15% of the annual contributions agreed for members of the Senior Management
shall be based on variable components and be considered "discretionary pension benefits", thus subject to the
conditions of delivery in shares, retention and clawback established in applicable regulations, as well as to those
other conditions of variable remuneration applicable to them pursuant to the remuneration policy applicable to Senior
Management.
Pursuant to the foregoing, from the annual contribution to cover retirement of €4,910 thousand recorded in 2017, an
amount of €585 thousand has been recorded in the year 2017 as “discretionary pension benefits” and, following year-
end 2017, said amount has been adjusted according to the criteria established for the determination of the Senior
Management’s annual variable remuneration for 2017. Accordingly, the “discretionary pension benefits” for the year
2017 have been determined in an amount of €589 thousand, subject to the same conditions as the Deferred
Component of annual variable remuneration for the year 2017, as well as the remaining conditions established for
these benefits in the remuneration policy applicable to members of the Senior Management.
The balance of the item "Provisions - Funds for pensions and similar liabilities" on the Group's consolidated balance
sheet as of 31 December 2017 includes €259 million under the item for post-employment benefit commitments
maintained with former members of the Bank's Senior Management.
In reference to section C.1.29, the Board of Directors always meets with the attendance of its chair and therefore the
Lead Director has never chaired a meeting of the Board of Directors. The Lead Director, in the scope of his entrusted
duties, maintains fluid contact with the independent directors to simplify the discharge of his duties.
As a supplement to section C.1.30, it is to be noted that normally the Board of Directors meets monthly in accordance
with the annual meeting schedule drawn up before the beginning of the year, and extraordinarily as often as deemed
necessary. In 2017, the Board held 15 meetings, of which 13 were ordinary and 2 extraordinary. All directors were
present at all Board meetings, whether in person or by proxy, except the meeting of June 6, 2017, at which 2
directors were absent.
With regard to section C.1.31, as BBVA shares are listed on the New York Stock Exchange, it is subject to the
supervision of the Securities & Exchange Commission (SEC) and, thus, to compliance with the Sarbanes Oxley Act
and its implementing regulations, and for this reason each year the Group Executive Chairman, the CEO and the
executive tasked with preparing the Accounts sign and submit the certifications described in sections 302 and 906 of
this Act, related to the content of the Annual Financial Statements. These certificates are contained in the annual
registration statement (Form 20-F) which the Company files with this authority for the official record.
As reference to section C.1.45, the Board of Directors only approves the contract conditions related to executive
directors and Senior Management members as set out in article 17 of the Board Regulations, which are reported to
the General Meeting through this Report and the Annual Report on Directors' Remuneration of BBVA, but does not
authorize those of other technical and specialist professionals.
In this regard, the Board of Directors has approved the new contractual conditions for the Chief Executive Officer and
the executive director Head of GERPA that, according to the framework established in the Policy, includes, among
others, the transformation of the previous defined-benefits system of the Chief Executive Officer has been
transformed into a defined-contribution system, as well as the determination of the annual contribution to such
system. Moreover, these contractual changes have involved the elimination of the possibility for the Chief Executive
Officer of receiving the retirement pension in advance and established a post-contractual non-compete agreement for
a period of two years, after they cease as BBVA executive directors, in accordance to which they shall receive
remuneration in an amount equivalent to one annual fixed remuneration for every year of duration of the non-
compete arrangement which shall be paid periodically over the course of the two years in the event of severance on
grounds other than their own retirement, disability or dereliction of duties; as well as the removal of the right of the
executive director Head of GERPA to receive an indemnity.
This English version is a translation of the original in Spanish for information purposes only. In case of a
discrepancy, the Spanish original will prevail.
164
According to the new applicable regulation to credit institutions on remuneration, in particular, to the Circular 2/2016
of the Bank of Spain and the European Banking Authority Guidelines on sound remuneration policies, the Board has
approved in 2017, the new basic contractual framework for notice, compensation and post-contractual non-
competition applicable to Senior Management with effect from January, 1, 2018.
Further to section C.2.1, we provide brief indications regarding what the regulations establish about the composition
and functions of each board committee:
• Audit and Compliance Committee: Article 29 of the Board Regulations establishes that the Audit and Compliance
Committee will be formed exclusively by independent directors and its mission will be to assist the Board of Directors
in overseeing the financial information and the exercise of the Group control duties. The members of the Audit and
Compliance Committee, and particularly its Chair, shall be appointed taking into account their knowledge and
background in accounting, auditing and risk management. It will have a minimum of four members appointed by the
Board, one of whom will be appointed taking into account their knowledge of accounting, auditing or both. The Board
of Directors will also nominate the Chair of this Committee, who must be replaced every four years. However, the
same person may be re-elected once a year has elapsed since ceasing to hold the position. When the Chair cannot
be present, his/her duties will be performed by the most long-standing independent director of the Committee, and,
where more than one person of equal seniority is present, by the eldest. The Committee will appoint a Secretary who
may or may not be a member of the Committee.
• Appointments Committee: Article 32 of the Board Regulations establishes that the Appointments Committee will
consist of at least three members, who will be appointed by the Board of Directors, which will also appoint the
Committee Chair. All Committee members must be non-executive directors, with a majority of independent directors.
Its Chair must be an independent director. When the Chair cannot be present, his/her duties will be performed by the
most long-standing independent member of the Committee, and, where more than one person of equal seniority are
present, by the eldest.
• Remuneration Committee: Article 35 of the Board Regulations establishes that the Remuneration Committee will
consist of at least three members, appointed by the Board of Directors, which will also appoint the Committee Chair.
All Committee members must be non-executive directors, with a majority of independent directors. Its Chair must also
be an independent director. When the Chair cannot be present, his/her duties will be performed by the most long-
standing independent member of the Committee, and, where more than one person of equal seniority are present, by
the eldest.
• Executive Committee: Article 26 of the Board Regulations states that the Board of Directors may, in accordance
with the Company Bylaws and with the favorable vote of two-thirds of its members, appoint an Executive Committee,
ensuring that there is a majority of non-executive directors over executive directors. The Executive Committee will be
chaired by the Chairman of the Board of Directors, or when this is not possible, by whomever the Company Bylaws
determines. The secretary of the Committee will be the Secretary of the Board. If absent, the person the meeting’s
members appoint for this purpose will stand in for the secretary.
• Risk Committee: Article 38 of the Company Board Regulations establishes that the Risk Committee will consist of at
least three members, appointed by the Board of Directors, which will also appoint the Committee Chair. All
Committee members must be non-executive directors, of whom at least one third must be independent directors. Its
Chair must also be an independent director. When the Chair cannot be present, his/her duties will be performed by
the most long-standing independent director of the Committee, and, where more than one person of equal seniority is
present, by the eldest.
• Technology and Cybersecurity Committee: The Technology and Cybersecurity Committee regulations establish that
it will have a minimum of three members appointed by the Board among its directors, which will also nominate the
Chair of this Committee. For this purpose, the Board will take into consideration the knowledge and experience in
technology, information systems and cybersecurity matters. When the Chair cannot be present, the Committee
meetings will be chaired by the most senior member of the Committee and, where more than one person of equal
seniority are present, by the eldest.
As a supplement to section C.2.5 on the key activities of the Risk Committee throughout 2017, it is to be noted that
the Chairman of the Risk Committee presented to the Board of Directors a report on the activities of the Committee in
This English version is a translation of the original in Spanish for information purposes only. In case of a
discrepancy, the Spanish original will prevail.
165
2017. The report gave an account of the meetings held by the Committee over the year and explained that the direct
relationship had been strengthened between the Committee and the Group Chief Risk Officer. This was
supplemented by the involvement of the heads of the various divisions of the Risk area, both at the holding level and
at the level of each business unit of the Group. In his opinion this allowed for the proper performance of the duties
assigned to the Committee by the Board. As to the Committee's activity in each of the main functions assigned to it
by the Board, he referred to the General Risk Appetite Framework of the BBVA Group, which the Committee had
analyzed before submitting it to the consideration of the Board. In particular, he said that the Committee had
analyzed in detail the Risk Appetite Statement and the core metrics for risk management and control in the BBVA
Group, which in addition were monitored on an ongoing basis by the Committee to ensure that they stay within the
thresholds specified by the Board. He said that the Risk Committee permanently monitors the performance of metrics
"by type of risk" approved by the Executive Committee, and the disaggregation of the core metrics. The Committee
Chair pointed out that another of the Committee's main function is to monitor the performance of the Group's risks. It
does this in a structured manner by monitoring the risks by type per business unit, portfolio and sector, paying special
attention to the main borrowers and risks in each category and sector to be appropriately aware of the trends of the
entity's main risks. Regarding other risks, he explained that the Committee monitors them, holding specific meetings
for each, in addition to regular, monthly reporting to the Chief Risk Officer on the core metrics and factors impacting
their performance. Also pointed that special attention is also paid by the Committee to the performance, monitoring
and control of non-financial risks, namely operational risk. In the domain of risk policy, he said that the Committee
had monitored and controlled corporate policies prior to their submission to the Executive Committee. The report
touched upon the Committee's monitoring of the infrastructure and resources relied on by the Risk area for the proper
performance of its duties, and said that it had been verified that the Group's Risk area had the resources, systems,
structures and means required to implement the Board's risk strategy. As to other functions, he said that the Risk
Committee had been directly involved in the analysis of the indicators included in the Remuneration Policy approved
by the Board of Directors, which were submitted to the Annual General Meeting for approval, to ensure said
indicators are aligned with an adequate institution-wide risk control and management model and with the parameters
established in the Group's General Risk Appetite Framework. He also noted that the Committee has reviewed the
regulatory reports that are relevant to the Group, including the Capital and Liquidity Self-Assessment Plan and the
Group Recovery Plan, to align them with the General Risk Appetite Framework and verify the adequate preparation
and implementation of the applicable stress scenarios. He also said that the Committee supervises the risk strategy's
alignment with price policies on an ongoing basis, fostering the inclusion of profitability metrics in terms of risk
appetite in the risk monitoring and control model. Finally, was set out the tasks that the Risk Committee has analyzed
and debated the Group's Risk Appetite Framework proposal for 2018, in accordance with the Institution's general
decision making process, which is coordinated with the annual budget preparation process.
Likewise, regarding the most important actions of the Remuneration Committee during 2017, the Chairman of the
Remuneration Committee submitted a report to the Board on its activities during 2017 including, among others, the
Committee works on the proposals to the Board on the remuneration policy for directors, senior managers and other
employees whose professional activities may have a significant impact on the Group’s risk profile (Identified Staff).
Therefore, it should be noted that as the main activities carried out in 2017, the Remuneration Committee has
submitted to the Board a proposal for a new BBVA Directors’ Remuneration Policy for the years 2017, 2018 and
2019, which was approved by the General Shareholders’ Meeting held on March 17, 2017, as well as a new
remuneration policy for BBVA’s Identified Staff, and the approval of a new corporate remuneration policy applicable
to all employees of the Bank and of subsidiaries forming part of its consolidated group, in line with the new
regulations published in 2016 and best market practices on remuneration.
In execution of said remuneration policies, the Committee has analyzed the necessary proposals to be submitted to
the Board for application of the policies.
In particular, regarding the remuneration issues of executive directors, the Committee submitted to the Board: the
settlement of the Annual Variable Remuneration; the updating of the deferred parts of the variable remuneration of
previous years; the determination of the fixed and target variable remuneration for 2017; the determination of the
annual and multi-year indicators for the calculation of the Annual Variable Remuneration as well as their weightings,
targets and new scales for achievement, minimum thresholds Attributable Profit and Capital Ratio established in the
respective remuneration policies for Directors and Identified Staff as ex ante adjustments to variable remuneration,
and the corresponding scales established to determine the generation of annual variable remuneration in 2017.
This English version is a translation of the original in Spanish for information purposes only. In case of a
discrepancy, the Spanish original will prevail.
166
Moreover, the Committee has determined, for its proposal to the Board, the contractual conditions for the Chief
Executive Officer and the executive Global Economics Regulations and Public Affairs Director ("GERPA Director").
Regarding the remuneration issues of Senior Management, the Committee’s activities have been especially intense
on reviewing its basic contractual framework in light of the new applicable regulations. In this regard, has carried out
the determination of the basic contractual conditions for the Senior Management regarding its fixed and target
variable remuneration; has determined the contributions to the pension schemes and other applicable remuneration;
has analyzed the Bank’s contractual commitments with members of the Senior Management for notice, compensation
and post-contractual non-competition, submitting to the Board the corresponding proposals.
The Committee has reviewed as well the application of the Remuneration Policy for Identified Staff during the closing
exercise 2016, including the process carried out by the Bank to identify this Staff, and as well has received
information concerning application of the procedure for identification of Identified Staff in the BBVA Group in 2017.
Furthermore, among other duties, the Committee has proposed to the Board for its approval and submission to the
General Shareholders Meeting: the Annual Report on Directors’ Remuneration, and the agreement concerning the
ratio 1:2 between the fixed and the variable remuneration for a specified number of members of the Identified Staff.
Detailed information on the activity carried out by the Remuneration Committee is available in the Bank’s corporate
website (www.bbva.com).
With respect to section D (Related-party and Intragroup Transactions), see Note 53 of the BBVA Annual
Consolidated Financial Statements for 2017. With respect to section D.4, it details the transactions conducted by
Banco Bilbao Vizcaya Argentaria, S.A. at the close of the year, with the company issuing securities on international
markets, carried out as part of ordinary trading related to the management of outstanding issuances. Moreover, with
respect to section D.4, please refer to the section entitled “Offshore financial centers” in the BBVA Consolidated
Management Report for 2017.
As to adherence to codes of ethics or good practice, it is to be noted that in 2011 the BBVA Board of Directors
approved the Bank's adhesion to the Code of Best Tax Practices (Código de Buenas Prácticas Tributarias) approved
by Foro de Grandes Empresas according to the wording proposed by the State Tax Administration Agency (AEAT).
During this year, it has been compliant with the contents of this Code. Moreover, BBVA is committed to applying the
provisions of the Universal Declaration of Human Rights, Principles of United Nations Global Compact (which BBVA
has formally signed), Equator Principles (to which BBVA has been formally adhered since 2004), the United Nations
Responsible Investment Principles, the Green Bond Principles, and other conventions and treaties involving
international organizations such as the Organization for Economic Cooperation and Development and the
International Labor Organization. In addition, BBVA is a member of the United Nations Environmental Program
Finance Initiative and the Thun Group of Banks on Human Rights.
This annual report on corporate governance has been approved by the company’s board of directors on 12 February
2018.
List whether any Directors voted against or abstained from voting on the approval of this Report.
NO