Embed Size (px)
Citation preview
Consolidated Financial Statements
Horizon Group Properties, Inc.
For the years ended December 31, 2018 and 2017
Horizon Group Properties, Inc.
Consolidated Financial Statements
For the years ended December 31, 2018 and 2017
Contents
Independent Auditors’ Report ........................................................................................................................................ 3
Consolidated Balance Sheets ......................................................................................................................................... 5
Consolidated Statements of Operations .......................................................................................................................... 6
Consolidated Statements of Stockholders’ Equity .......................................................................................................... 7
Consolidated Statements of Cash Flows .............................................................................................................................. 8
Notes to Consolidated Financial Statements ...................................................................................................................... 10
2
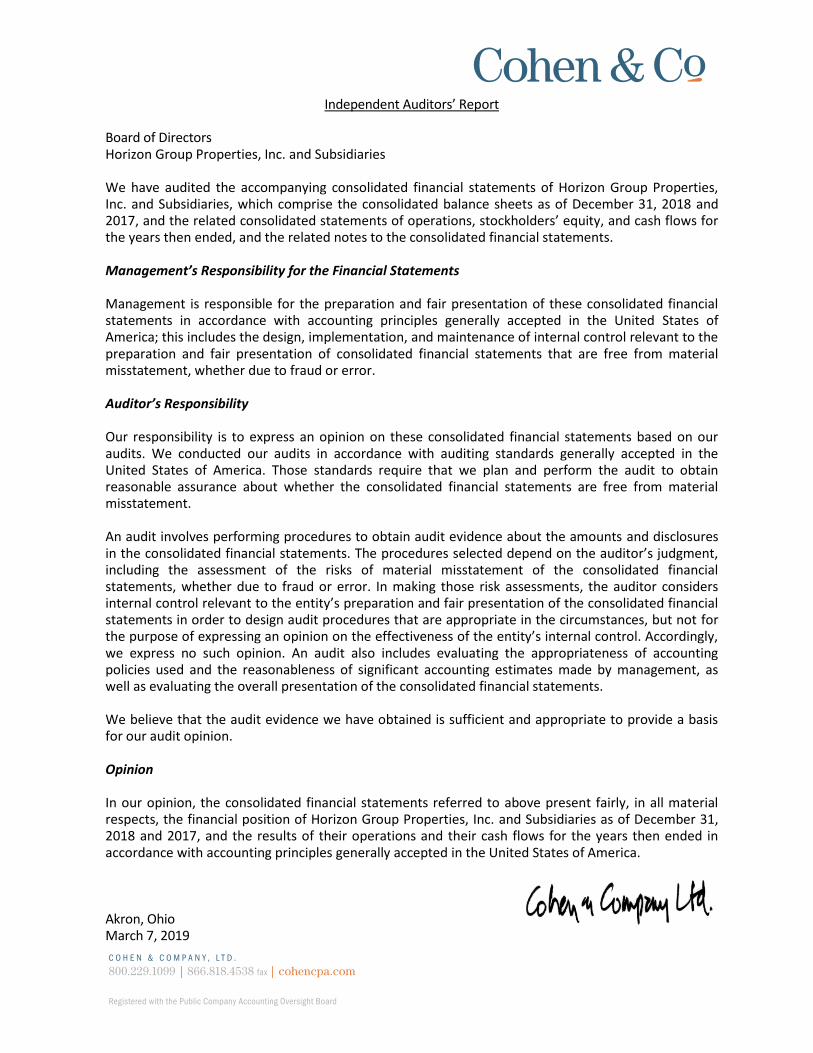
C O H E N & C O M P A N Y , L T D .
800.229.1099 | 866.818.4538 fax | cohencpa.com
Registered with the Public Company Accounting Oversight Board
Independent Auditors’ Report Board of Directors Horizon Group Properties, Inc. and Subsidiaries We have audited the accompanying consolidated financial statements of Horizon Group Properties, Inc. and Subsidiaries, which comprise the consolidated balance sheets as of December 31, 2018 and 2017, and the related consolidated statements of operations, stockholders’ equity, and cash flows for the years then ended, and the related notes to the consolidated financial statements. Management’s Responsibility for the Financial Statements Management is responsible for the preparation and fair presentation of these consolidated financial statements in accordance with accounting principles generally accepted in the United States of America; this includes the design, implementation, and maintenance of internal control relevant to the preparation and fair presentation of consolidated financial statements that are free from material misstatement, whether due to fraud or error. Auditor’s Responsibility Our responsibility is to express an opinion on these consolidated financial statements based on our audits. We conducted our audits in accordance with auditing standards generally accepted in the United States of America. Those standards require that we plan and perform the audit to obtain reasonable assurance about whether the consolidated financial statements are free from material misstatement. An audit involves performing procedures to obtain audit evidence about the amounts and disclosures in the consolidated financial statements. The procedures selected depend on the auditor’s judgment, including the assessment of the risks of material misstatement of the consolidated financial statements, whether due to fraud or error. In making those risk assessments, the auditor considers internal control relevant to the entity’s preparation and fair presentation of the consolidated financial statements in order to design audit procedures that are appropriate in the circumstances, but not for the purpose of expressing an opinion on the effectiveness of the entity’s internal control. Accordingly, we express no such opinion. An audit also includes evaluating the appropriateness of accounting policies used and the reasonableness of significant accounting estimates made by management, as well as evaluating the overall presentation of the consolidated financial statements. We believe that the audit evidence we have obtained is sufficient and appropriate to provide a basis for our audit opinion. Opinion In our opinion, the consolidated financial statements referred to above present fairly, in all material respects, the financial position of Horizon Group Properties, Inc. and Subsidiaries as of December 31, 2018 and 2017, and the results of their operations and their cash flows for the years then ended in accordance with accounting principles generally accepted in the United States of America. Akron, Ohio March 7, 2019
HORIZON GROUP PROPERTIES, INC.
The accompanying notes are an integral part of these consolidated financial statements. 5
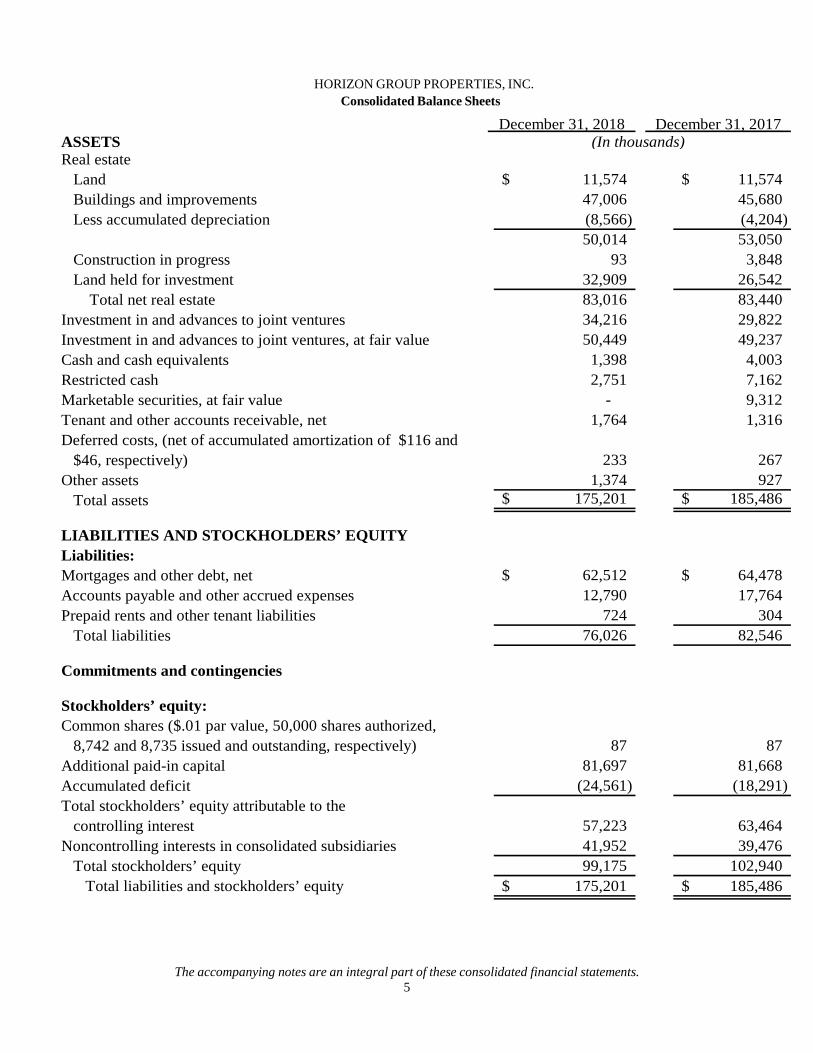
Consolidated Balance Sheets
ASSETSReal estate
Land 11,574$ 11,574$ Buildings and improvements 47,006 45,680 Less accumulated depreciation (8,566) (4,204)
50,014 53,050 Construction in progress 93 3,848 Land held for investment 32,909 26,542
Total net real estate 83,016 83,440 Investment in and advances to joint ventures 34,216 29,822 Investment in and advances to joint ventures, at fair value 50,449 49,237 Cash and cash equivalents 1,398 4,003 Restricted cash 2,751 7,162 Marketable securities, at fair value - 9,312 Tenant and other accounts receivable, net 1,764 1,316 Deferred costs, (net of accumulated amortization of $116 and
$46, respectively) 233 267 Other assets 1,374 927
Total assets 175,201$ 185,486$
LIABILITIES AND STOCKHOLDERS’ EQUITYLiabilities:Mortgages and other debt, net 62,512$ 64,478$ Accounts payable and other accrued expenses 12,790 17,764 Prepaid rents and other tenant liabilities 724 304
Total liabilities 76,026 82,546
Commitments and contingencies
Stockholders’ equity:Common shares ($.01 par value, 50,000 shares authorized,
8,742 and 8,735 issued and outstanding, respectively) 87 87 Additional paid-in capital 81,697 81,668 Accumulated deficit (24,561) (18,291) Total stockholders’ equity attributable to the
controlling interest 57,223 63,464 Noncontrolling interests in consolidated subsidiaries 41,952 39,476
Total stockholders’ equity 99,175 102,940 Total liabilities and stockholders’ equity 175,201$ 185,486$
December 31, 2018 December 31, 2017(In thousands)
HORIZON GROUP PROPERTIES, INC.
The accompanying notes are an integral part of these consolidated financial statements. 6
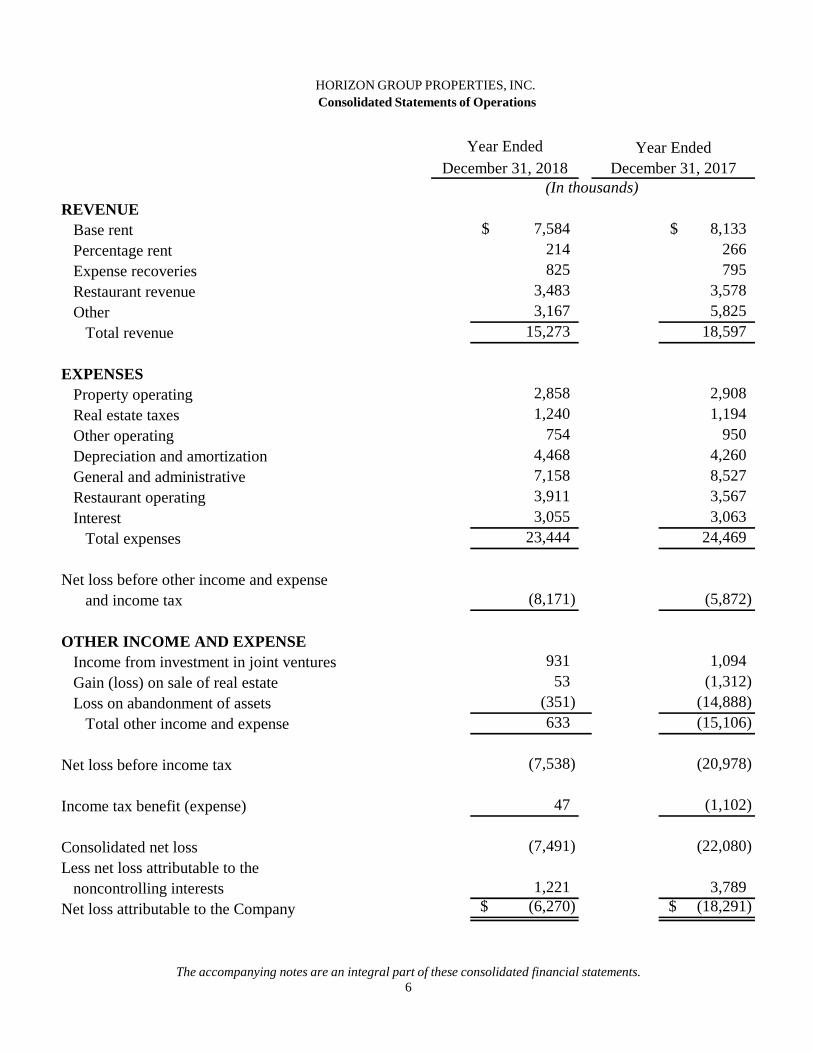
Consolidated Statements of Operations
REVENUEBase rent 7,584$ 8,133$ Percentage rent 214 266 Expense recoveries 825 795 Restaurant revenue 3,483 3,578 Other 3,167 5,825
Total revenue 15,273 18,597
EXPENSESProperty operating 2,858 2,908 Real estate taxes 1,240 1,194 Other operating 754 950 Depreciation and amortization 4,468 4,260 General and administrative 7,158 8,527 Restaurant operating 3,911 3,567 Interest 3,055 3,063
Total expenses 23,444 24,469
Net loss before other income and expense and income tax (8,171) (5,872)
OTHER INCOME AND EXPENSEIncome from investment in joint ventures 931 1,094 Gain (loss) on sale of real estate 53 (1,312) Loss on abandonment of assets (351) (14,888)
Total other income and expense 633 (15,106)
Net loss before income tax (7,538) (20,978)
Income tax benefit (expense) 47 (1,102)
Consolidated net loss (7,491) (22,080) Less net loss attributable to the
noncontrolling interests 1,221 3,789 Net loss attributable to the Company (6,270)$ (18,291)$
(In thousands)
Year Ended Year EndedDecember 31, 2018 December 31, 2017
HORIZON GROUP PROPERTIES, INC.
The accompanying notes are an integral part of these consolidated financial statements. 7
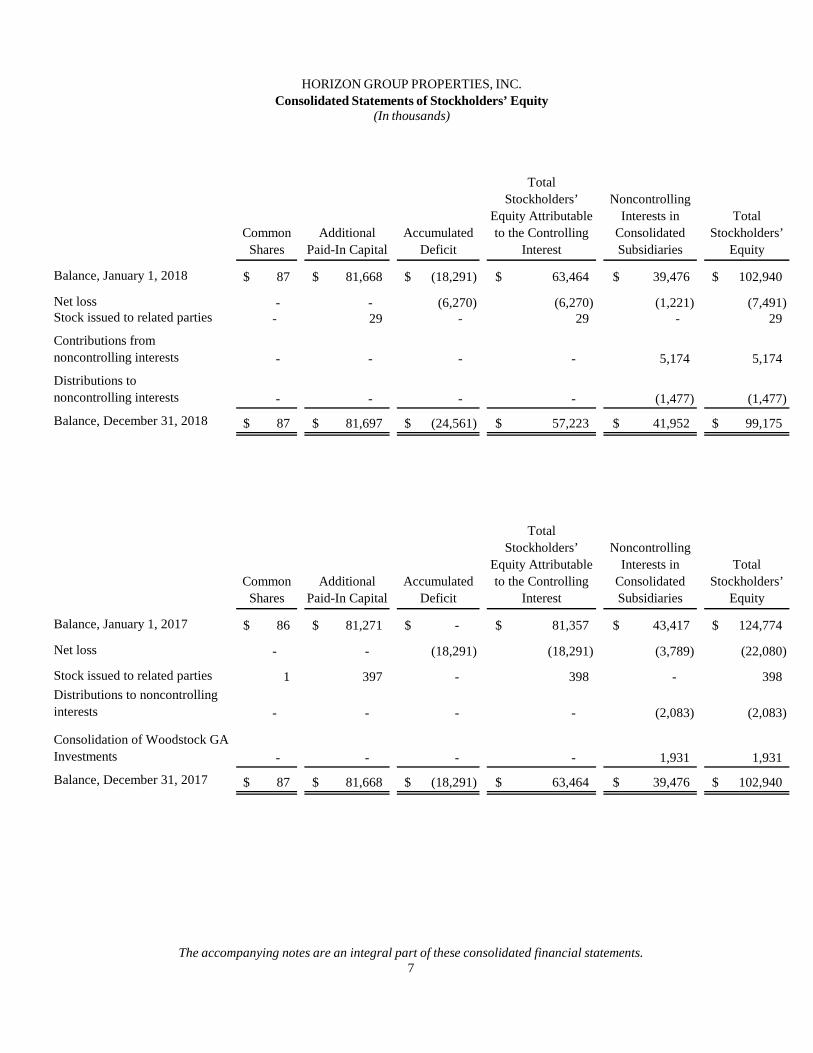
Consolidated Statements of Stockholders’ Equity (In thousands)
Common Shares
Additional Paid-In Capital
Accumulated Deficit
Total Stockholders’
Equity Attributable to the Controlling
Interest
Noncontrolling Interests in
Consolidated Subsidiaries
Total Stockholders’
Equity
Balance, January 1, 2018 87$ 81,668$ (18,291)$ 63,464$ 39,476$ 102,940$
Net loss - - (6,270) (6,270) (1,221) (7,491) Stock issued to related parties - 29 - 29 - 29
Contributions from noncontrolling interests - - - - 5,174 5,174
Distributions to noncontrolling interests - - - - (1,477) (1,477)
Balance, December 31, 2018 87$ 81,697$ (24,561)$ 57,223$ 41,952$ 99,175$
Common Shares
Additional Paid-In Capital
Accumulated Deficit
Total Stockholders’
Equity Attributable to the Controlling
Interest
Noncontrolling Interests in
Consolidated Subsidiaries
Total Stockholders’
Equity
Balance, January 1, 2017 86$ 81,271$ -$ 81,357$ 43,417$ 124,774$
Net loss - - (18,291) (18,291) (3,789) (22,080)
Stock issued to related parties 1 397 - 398 - 398 Distributions to noncontrolling interests - - - - (2,083) (2,083)
Consolidation of Woodstock GA Investments - - - - 1,931 1,931
Balance, December 31, 2017 87$ 81,668$ (18,291)$ 63,464$ 39,476$ 102,940$
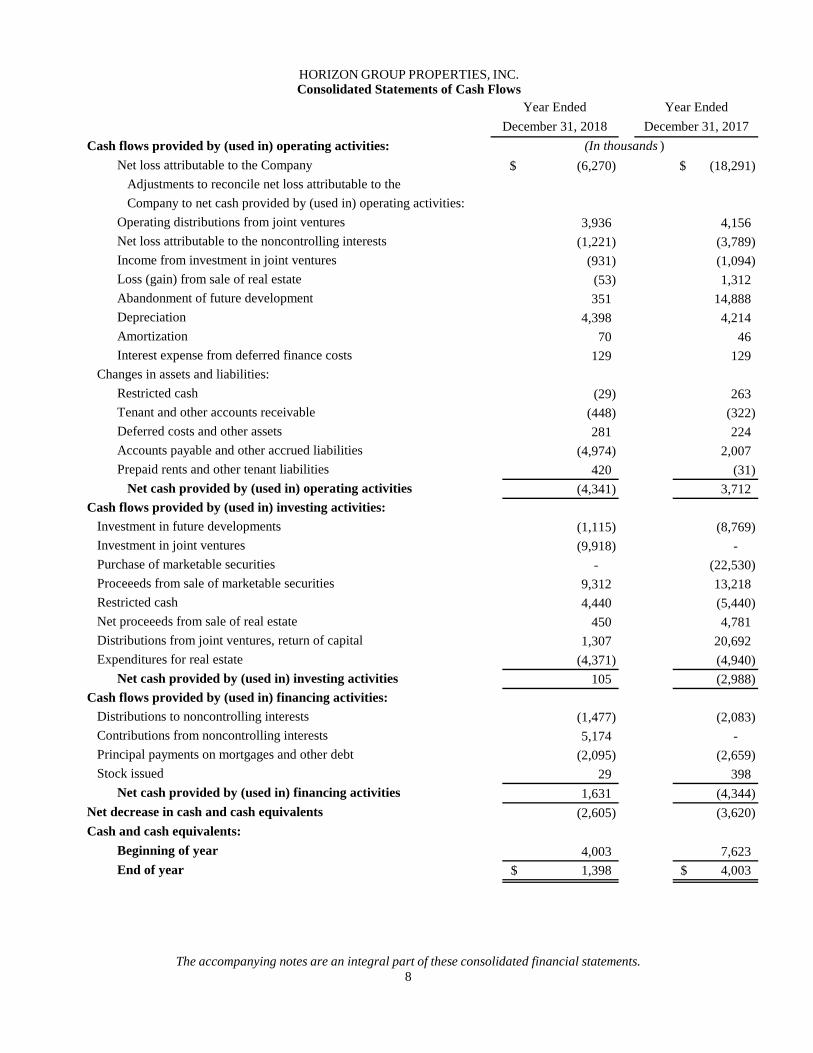
HORIZON GROUP PROPERTIES, INC. Consolidated Statements of Cash Flows
The accompanying notes are an integral part of these consolidated financial statements. 8
Cash flows provided by (used in) operating activities:Net loss attributable to the Company (6,270)$ (18,291)$
Adjustments to reconcile net loss attributable to theCompany to net cash provided by (used in) operating activities:
Operating distributions from joint ventures 3,936 4,156 Net loss attributable to the noncontrolling interests (1,221) (3,789) Income from investment in joint ventures (931) (1,094) Loss (gain) from sale of real estate (53) 1,312
Abandonment of future development 351 14,888 Depreciation 4,398 4,214 Amortization 70 46 Interest expense from deferred finance costs 129 129
Changes in assets and liabilities:Restricted cash (29) 263 Tenant and other accounts receivable (448) (322) Deferred costs and other assets 281 224 Accounts payable and other accrued liabilities (4,974) 2,007 Prepaid rents and other tenant liabilities 420 (31)
Net cash provided by (used in) operating activities (4,341) 3,712 Cash flows provided by (used in) investing activities:
Investment in future developments (1,115) (8,769) Investment in joint ventures (9,918) - Purchase of marketable securities - (22,530) Proceeeds from sale of marketable securities 9,312 13,218 Restricted cash 4,440 (5,440) Net proceeeds from sale of real estate 450 4,781 Distributions from joint ventures, return of capital 1,307 20,692 Expenditures for real estate (4,371) (4,940)
Net cash provided by (used in) investing activities 105 (2,988) Cash flows provided by (used in) financing activities:
Distributions to noncontrolling interests (1,477) (2,083) Contributions from noncontrolling interests 5,174 - Principal payments on mortgages and other debt (2,095) (2,659) Stock issued 29 398
Net cash provided by (used in) financing activities 1,631 (4,344) Net decrease in cash and cash equivalents (2,605) (3,620) Cash and cash equivalents:
Beginning of year 4,003 7,623 End of year 1,398$ 4,003$
(In thousands )
Year EndedYear EndedDecember 31, 2018 December 31, 2017
HORIZON GROUP PROPERTIES, INC. NOTES TO THE CONSOLIDATED FINANCIAL STATEMENTS
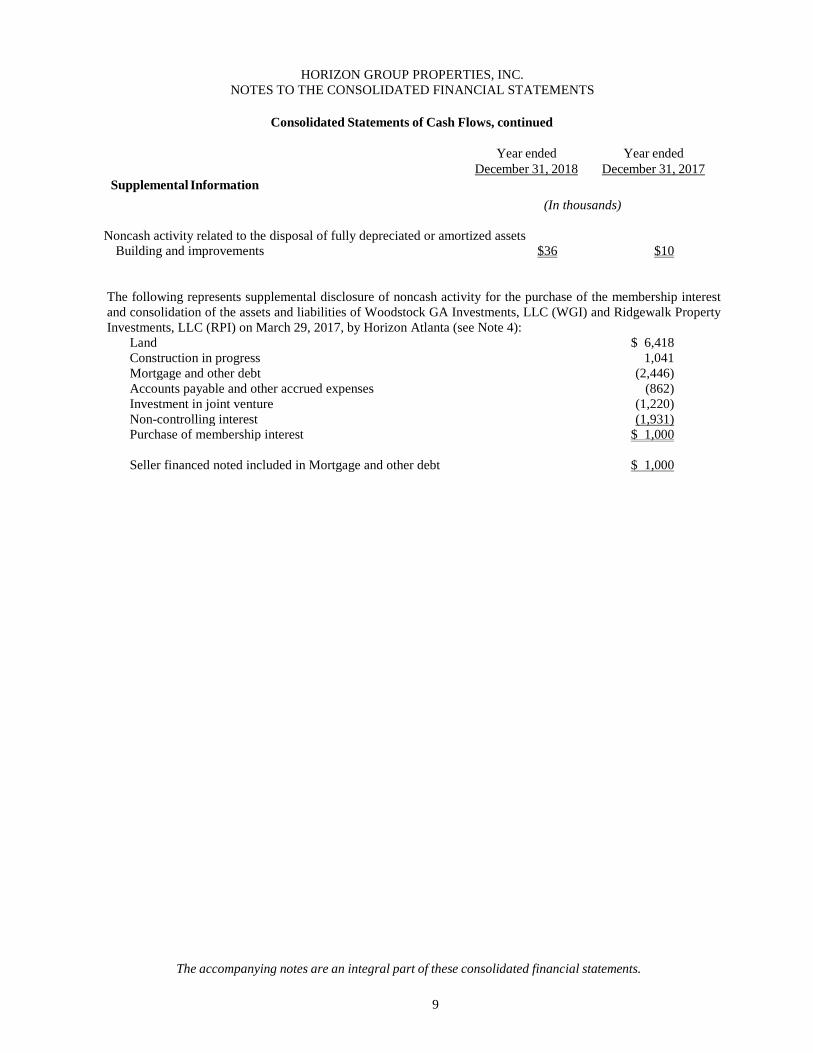
Consolidated Statements of Cash Flows, continued
Supplemental Information
Year ended December 31, 2018
Year ended December 31, 2017
(In thousands) Noncash activity related to the disposal of fully depreciated or amortized assets Building and improvements $36 $10 The following represents supplemental disclosure of noncash activity for the purchase of the membership interest and consolidation of the assets and liabilities of Woodstock GA Investments, LLC (WGI) and Ridgewalk Property Investments, LLC (RPI) on March 29, 2017, by Horizon Atlanta (see Note 4):
Land $ 6,418 Construction in progress 1,041 Mortgage and other debt (2,446) Accounts payable and other accrued expenses (862) Investment in joint venture (1,220) Non-controlling interest (1,931) Purchase of membership interest $ 1,000 Seller financed noted included in Mortgage and other debt $ 1,000
The accompanying notes are an integral part of these consolidated financial statements.
9
HORIZON GROUP PROPERTIES, INC. NOTES TO THE CONSOLIDATED FINANCIAL STATEMENTS
10
Note 1 – Organization and Principles of Consolidation
Horizon Group Properties, Inc. (“HGPI” or, together with its subsidiaries “HGP” or the “Company”) is a Maryland corporation that was established on June 15, 1998. The Company conducts operations primarily through a subsidiary limited partnership, Horizon Group Properties, L.P. (“HGP LP”) of which HGPI is the sole general partner. As of December 31, 2018 and 2017, HGPI owned approximately 87% of the partnership interests (the “Common Units”) of HGP LP. In general, Common Units are exchangeable for shares of Common Stock on a one-for-one basis (or for an equivalent cash amount at HGPI’s election).
The Company’s primary assets are its investments in subsidiary entities that own real estate. HGPI consolidates the results of operations and the balance sheets of those entities of which the Company owns the majority interest and of those variable interest entities of which the Company is the primary beneficiary. The Company accounts for its investments in entities that do not meet these criteria using the cost or equity methods. The entities referred to herein are consolidated subsidiaries of the Company excluding the entities discussed in Note 4; those entities are accounted for using the equity method of accounting or the cost method, as identified.
Note 2 - Summary of Significant Accounting Policies Principles of Consolidation
The consolidated financial statements include the accounts of HGPI and all subsidiaries that HGPI controls, including HGP LP. The Company considers itself to control an entity if it is the majority owner of or has voting control over such entity. All significant intercompany balances and transactions are eliminated in consolidation.
Use of Estimates
The preparation of financial statements in conformity with accounting principles generally accepted in the United States of America (“GAAP”) requires management to make estimates and assumptions that affect the amounts reported and disclosed in the financial statements and accompanying notes. Actual results could differ from those estimates.
Investment in Real Estate
The Company allocates the purchase price of properties to net tangible and intangible assets acquired based on their fair values in accordance with the provisions of GAAP. In making estimates of fair values for purposes of allocating purchase price, the Company utilizes a number of sources, including independent appraisals obtained in connection with the acquisition or financing of the respective property and other market data. The Company also considers information obtained about each property from its pre-acquisition due diligence, marketing, and leasing activities, in estimating the fair value of the tangible and intangible assets acquired.
The Company allocates a portion of the purchase price to above-market and below-market lease values for acquired properties based on the present value (using an interest rate which reflects the risks associated with the leases acquired) of the difference between: (i) the contractual amounts to be paid pursuant to the in-place leases and (ii) management’s estimate of fair market lease rates for the corresponding in-place leases, measured over the remaining non-cancelable term of the lease. In the case of below market leases, the Company considers the remaining contractual lease period and renewal periods, taking into consideration the likelihood of the tenant exercising its renewal options. The capitalized above/below-market lease values (included in Deferred Costs or Prepaid Rents and Other Tenant Liabilities on the consolidated balance sheets) are amortized as either a reduction of, or addition to, rental income over the remaining noncancelable terms of the respective leases. Should a tenant terminate its lease prior to its scheduled expiration, the unamortized portion of the related lease intangibles would be added to income or charged to expense, as applicable.
The Company allocates a portion of the purchase price to the value of leases acquired based on the difference between: (i) the property valued with existing in-place leases adjusted to market rental rates and (ii) the property valued as if vacant. The Company utilizes independent appraisals or its internally developed estimates to determine the respective in-place lease values. The Company makes estimates of fair value using methods similar to those used by independent appraisers. Factors management considers in its analysis include an estimate of carrying costs during the expected lease-up periods considering current market conditions and costs to execute similar leases
HORIZON GROUP PROPERTIES, INC. NOTES TO THE CONSOLIDATED FINANCIAL STATEMENTS
11
including leasing commissions, legal and other related expenses.
The value of in-place leases (included in Buildings and Improvements on the consolidated balance sheets) is amortized over the remaining initial terms of the respective leases. Should a tenant terminate its lease prior to its scheduled expiration, the unamortized portion would be charged to expense.
Real Estate and Depreciation
Costs incurred for the acquisition, development, construction and improvement of properties, as well as significant renovations and betterments to the properties, are capitalized. Maintenance and repairs are charged to expense as incurred. Interest costs incurred with respect to qualified expenditures relating to the construction of assets are capitalized during the construction period.
Amounts included under Buildings and Improvements on the consolidated balance sheets include the following types of assets, which are depreciated on the straight-line method over estimated useful lives, which are:
Buildings and improvements 31.5 years Tenant improvements / origination costs 10 years or lease term, if less Furniture, fixtures and equipment 3 – 7 years
In accordance with GAAP, the Company records impairment losses on long-lived assets used in operations when events and circumstances indicate that the assets might be impaired and the undiscounted cash flows estimated to be generated over their expected holding periods are less than the carrying amounts of those assets. For assets held in the portfolio, impairment losses are measured as the difference between carrying value and fair value. For assets to be sold, impairment is measured as the difference between carrying value and fair value, less cost to dispose. Fair value is based upon estimated cash flows discounted at a risk-adjusted rate of interest, comparable or anticipated sales in the marketplace, or estimated replacement cost, as adjusted to consider the costs of retenanting and repositioning those properties which have significant vacancy issues, depending on the facts and circumstances of each property. No impairment loss was recorded for the years ended December 31, 2018 and 2017.
Pre-Development Costs
The pre-development stage of a project involves certain costs to ascertain the viability of a potential project and to secure the necessary land. Direct costs to acquire the assets are capitalized once the acquisition becomes probable. These costs are carried in Other Assets until conditions are met that indicate that development is forthcoming, at which point the costs are reclassified to Construction in Progress. In the event a development is no longer deemed probable and costs are deemed to be non-recoverable, the applicable costs previously capitalized are expensed when the project is abandoned or the costs are determined to be non-recoverable.
At December 31, 2018, predevelopment costs classified as Other Assets included projects in Cleveland, OH and Woodstock, GA, and totaled $470,000. At December 31, 2017, predevelopment costs classified as Other Assets and Construction in Progress totaled $181,000 and $1.5 million, respectively.
During March of 2018, the Company ceased development of projects in Hartford, CT and Malaysia. The Company recognized a loss on abandonment of $351,000 and $14.8 million in 2018 and 2017, respectively.
Reclassifications
Certain prior year amounts have been reclassified to conform to current year presentation. Cash Equivalents
The Company considers all liquid investments with a maturity of three months or less when purchased to be cash equivalents. The Company’s cash is held in accounts with balances, which at times, exceed federally insured limits. The Company has not experienced any losses on such accounts and believes it is not exposed to any significant credit risk on cash and cash equivalents.
HORIZON GROUP PROPERTIES, INC. NOTES TO THE CONSOLIDATED FINANCIAL STATEMENTS
12
Restricted Cash
Restricted Cash consists of amounts deposited in accounts with the Company’s primary lenders in connection with certain loans and funds escrowed to be used for the development of the Ridgewalk property in Woodstock, GA (see Notes 4 & 9). At December 31, 2018 and 2017, the escrow accounts related to the Company’s primary lenders included approximately $271,000 and $273,000 in capital improvement and tenant allowance reserves, respectively, $863,000 and $849,000 in real estate tax and insurance escrows, respectively, and approximately $574,000 and $557,000 for cash collateral accounts, respectively. At December 31, 2018 and 2017, the Huntley interest, infrastructure and expense escrow accounts totaled $43,000. At December 31, 2018 and 2017 the Ridgewalk development escrow totaled $1.0 million and $5.44 million, respectively.
Tenant Accounts Receivable
Management regularly reviews accounts receivable and estimates the necessary amounts to be recorded as an allowance for uncollectability. These reserves are established on a tenant-specific basis and are based upon, among other factors, the period of time an amount is past due and the financial condition of the obligor. Balances that are still outstanding after management has used reasonable collection efforts are written off against the allowance.
At December 31, 2018 and 2017, total tenant accounts receivable is reflected net of reserves of $238,000 and $109,000, respectively. The bad debt expense was $106,000 and $109,000 for the years ended December 31, 2018 and 2017, respectively. This charge is included in the line items entitled “Other operating” and “General and administrative” in the consolidated statements of operations.
Deferred Costs
Deferred costs consist of fees and direct internal costs incurred to initiate and renew operating leases and are amortized over the life of the lease.
Restaurant Revenue and Operating Expense
The Company owns four Johnny Rockets restaurants at the outlet malls in Oshkosh WI, Atlanta GA, Louisville KY and Laredo TX. The Company also owns a Stone and Stein restaurant in Laredo TX. Revenues are from sales of food products, and operating expenses are primarily from cost of sales, supplies, payroll, franchise fees, and rent.
Revenue Recognition
Leases with tenants are accounted for as operating leases. Minimum annual rentals are recognized on a straight-line basis over the terms of the respective leases. As a result of recording rental revenue on a straight-line basis, tenant accounts receivable include $370,000 and $371,000 as of December 31, 2018 and 2017, respectively, which is expected to be collected over the remaining lives of the leases. Rents that represent basic occupancy costs, including fixed amounts and amounts computed as a function of sales, are classified as base rent. Amounts which may become payable in addition to base rent and which are computed as a function of sales in excess of certain thresholds are classified as percentage rents and are accrued after the reported tenant sales exceed the applicable thresholds. Expense recoveries based on common area maintenance expenses and certain other expenses are accrued in the period in which the related expense is incurred.
Other Revenue
Other revenue consists of income from management, leasing and development agreements and income from tenants with lease terms of less than one year.
Income Taxes
Deferred income taxes are recorded based on enacted statutory rates to reflect the tax consequences in future years of the differences between the tax bases of assets and liabilities and their financial reporting amounts. Deferred tax assets, such as net operating loss carryforwards which will generate future tax benefits, are recognized to the extent that realization of such benefits through future taxable earnings or alternative tax strategies in the foreseeable future is more likely than not.
HORIZON GROUP PROPERTIES, INC. NOTES TO THE CONSOLIDATED FINANCIAL STATEMENTS
13
As of December 31, 2018 and 2017, and for the years then ended, the Company did not have a net liability for any unrecognized tax benefits. The Company recognizes interest and penalties, if any, related to unrecognized tax benefits as interest or general and administrative expense in the consolidated statements of operations. During 2018 and 2017, the Company did not incur any interest or penalties.
Investments in Joint Ventures
The Company uses the equity method of accounting for its investments in Joint Ventures, as the Company can significantly influence the operations of the underlying investment, but does not have the ability to control the underlying investment. The investments are recorded at initial cost and adjusted for the Company’s proportionate share of income or loss. Contributions and distributions are treated as additions or reductions of the investments’ cost basis.
The Company elected the fair value option for its investments in Horizon Atlanta and Horizon Louisville (see note 4). Due to the nature of these investments, the Company elected the fair value option to more accurately present the Company’s portion of the value and changes thereof in the underlying investments. Changes in the fair value of the joint ventures are recorded as a component of income from investment in joint ventures on the consolidated statements of operations.
Distributions are reported in cash flows from operations unless the facts and circumstances of a specific distribution clearly indicate that it is a return of capital, which would then be presented as cash flows from investing activities.
Marketable Securities
As of December 31, 2017, the Company held approximately $9.3 million in marketable securities that are classified as available-for-sale and are carried at fair value. Unrealized gains and losses, net of taxes, are recorded within accumulated other comprehensive income, a component of stockholders’ equity. Realized gains and losses are recorded in other income. Purchases of marketable securities for the year ended December 31, 2017, totaled approximately $22.5 million. The cost of securities sold is based on the specific identification method. Proceeds from sales of available-for-sale securities for the years ended December 31, 2018 and 2017, were approximately $9.3 and $13.5 million, respectively. For the years ended December 31, 2018 and 2017, realized and unrealized gains and losses were immaterial.
Subsequent Events
Management has evaluated subsequent events through March 7, 2019, the date the consolidated financial statements were available to be issued.
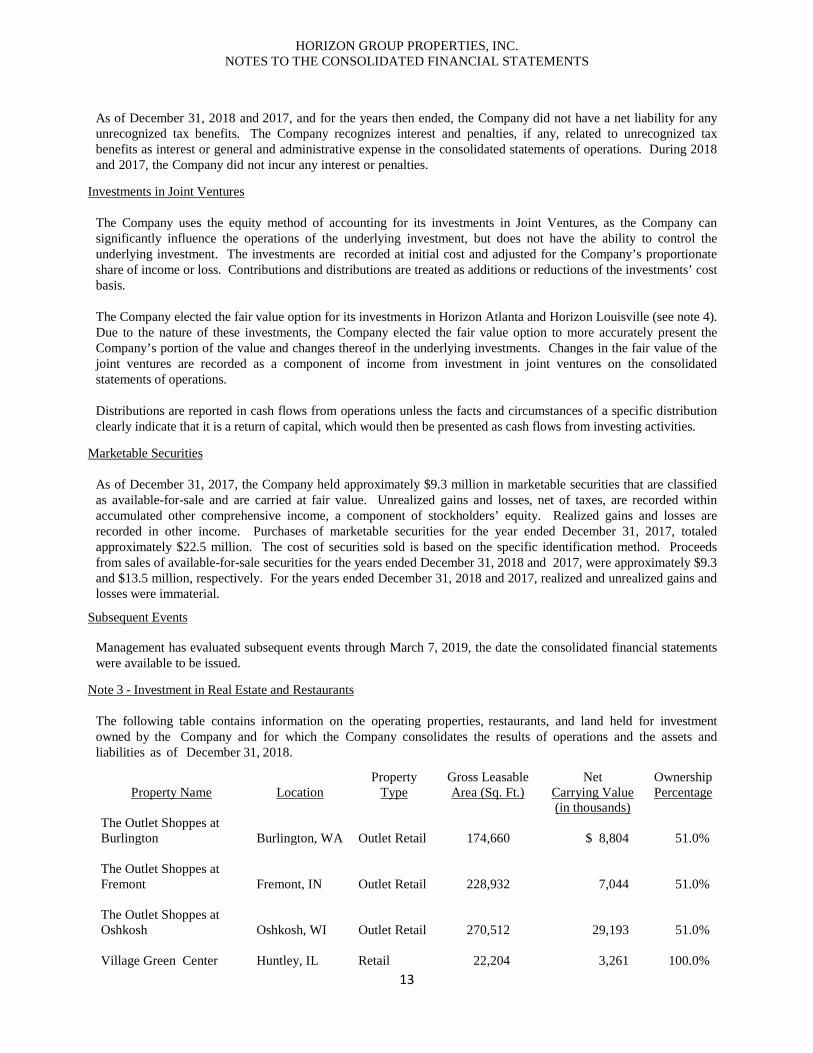
Note 3 - Investment in Real Estate and Restaurants
The following table contains information on the operating properties, restaurants, and land held for investment owned by the Company and for which the Company consolidates the results of operations and the assets and liabilities as of December 31, 2018.
Property Name
Location
Property Type
Gross Leasable Area (Sq. Ft.)
Net Carrying Value (in thousands)
Ownership Percentage
The Outlet Shoppes at Burlington
Burlington, WA
Outlet Retail
174,660
$ 8,804
51.0%
The Outlet Shoppes at Fremont
Fremont, IN
Outlet Retail
228,932
7,044
51.0%
The Outlet Shoppes at Oshkosh
Oshkosh, WI
Outlet Retail
270,512
29,193
51.0%
Village Green Center Huntley, IL Retail 22,204 3,261 100.0%
HORIZON GROUP PROPERTIES, INC. NOTES TO THE CONSOLIDATED FINANCIAL STATEMENTS
14
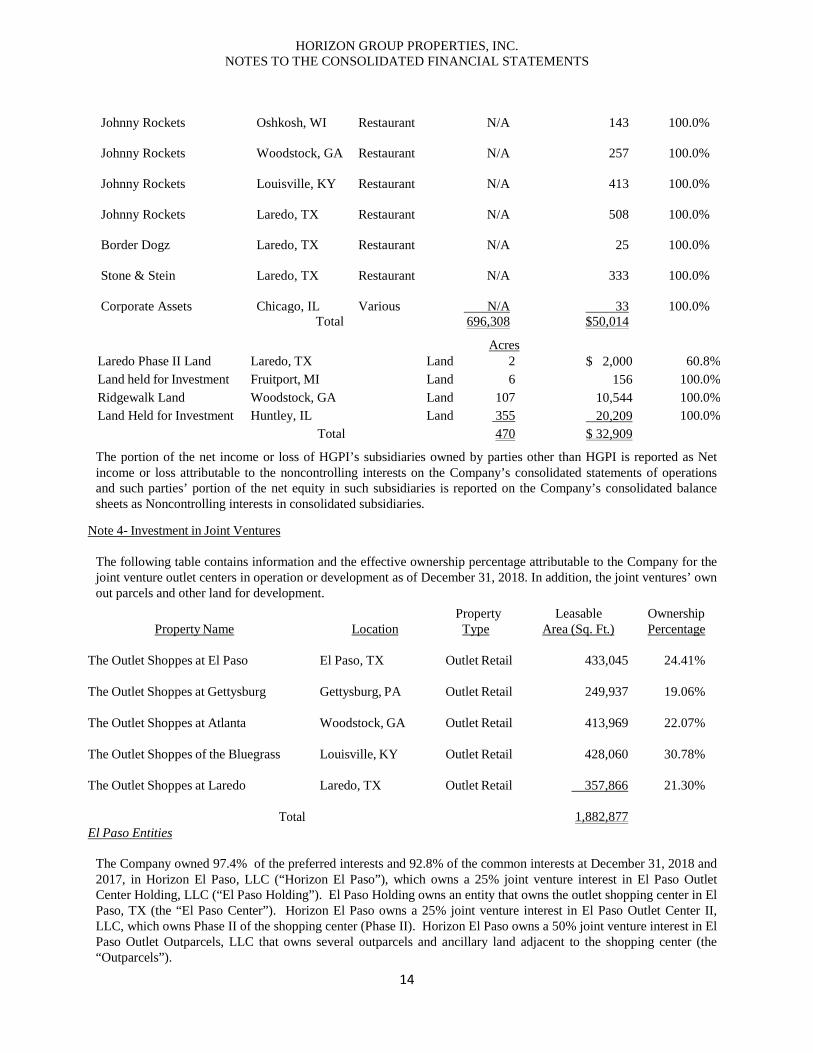
Johnny Rockets Oshkosh, WI Restaurant N/A 143 100.0% Johnny Rockets Woodstock, GA Restaurant N/A 257 100.0% Johnny Rockets Louisville, KY Restaurant N/A 413 100.0% Johnny Rockets Laredo, TX Restaurant N/A 508 100.0% Border Dogz Laredo, TX Restaurant N/A 25 100.0% Stone & Stein Laredo, TX Restaurant N/A 333 100.0% Corporate Assets Chicago, IL Various N/A 33 100.0%
Total 696,308 $50,014 Acres Laredo Phase II Land Laredo, TX Land 2 $ 2,000 60.8% Land held for Investment Fruitport, MI Land 6 156 100.0% Ridgewalk Land Woodstock, GA Land 107 10,544 100.0% Land Held for Investment Huntley, IL Land 355
20,209 100.0%
Total 470 $ 32,909
The portion of the net income or loss of HGPI’s subsidiaries owned by parties other than HGPI is reported as Net income or loss attributable to the noncontrolling interests on the Company’s consolidated statements of operations and such parties’ portion of the net equity in such subsidiaries is reported on the Company’s consolidated balance sheets as Noncontrolling interests in consolidated subsidiaries.
Note 4- Investment in Joint Ventures
The following table contains information and the effective ownership percentage attributable to the Company for the joint venture outlet centers in operation or development as of December 31, 2018. In addition, the joint ventures’ own out parcels and other land for development.
Property Name
Location
Property Type
Leasable Area (Sq. Ft.)
Ownership Percentage
The Outlet Shoppes at El Paso El Paso, TX Outlet Retail 433,045 24.41%
The Outlet Shoppes at Gettysburg Gettysburg, PA Outlet Retail 249,937 19.06%
The Outlet Shoppes at Atlanta Woodstock, GA Outlet Retail 413,969 22.07%
The Outlet Shoppes of the Bluegrass Louisville, KY Outlet Retail 428,060 30.78%
The Outlet Shoppes at Laredo Laredo, TX Outlet Retail 357,866 21.30%
Total 1,882,877 El Paso Entities
The Company owned 97.4% of the preferred interests and 92.8% of the common interests at December 31, 2018 and 2017, in Horizon El Paso, LLC (“Horizon El Paso”), which owns a 25% joint venture interest in El Paso Outlet Center Holding, LLC (“El Paso Holding”). El Paso Holding owns an entity that owns the outlet shopping center in El Paso, TX (the “El Paso Center”). Horizon El Paso owns a 25% joint venture interest in El Paso Outlet Center II, LLC, which owns Phase II of the shopping center (Phase II). Horizon El Paso owns a 50% joint venture interest in El Paso Outlet Outparcels, LLC that owns several outparcels and ancillary land adjacent to the shopping center (the “Outparcels”).
HORIZON GROUP PROPERTIES, INC. NOTES TO THE CONSOLIDATED FINANCIAL STATEMENTS
15
On September 10, 2018, Deutche Bank refinanced the loans on Phase I and II of the shopping center in the amount of $75 million. The shopping center secures the loan. The annual interest rate is 5.103%. Payments are $407,350 per month, based on a 30-year amortization. The loan matures on October 6, 2028. The principal balance at December 31, 2018 was $74.8 million.
The loans for Phase I and Phase II had principal balances of $61.3 million and $6.6 million, respectively at December 31, 2017. As of December 31, 2018 and 2017, the Company’s investment in the entities that own the Outlet Shoppes at El Paso, the Outparcels, and Phase II exceeded its proportional share of the underlying equity as reflected in the entities financial statements by approximately $10.3 million and $11.2 million, respectively. Such difference is primarily related to the increased value in real estate and is being amortized over a period of 5 to 30 years.
The Company received management, leasing and similar fees from El Paso Center and El Paso Outlet Centers II, LLC that totaled $1.0 million and $818,000 during the years ended December 31, 2018 and 2017, respectively.
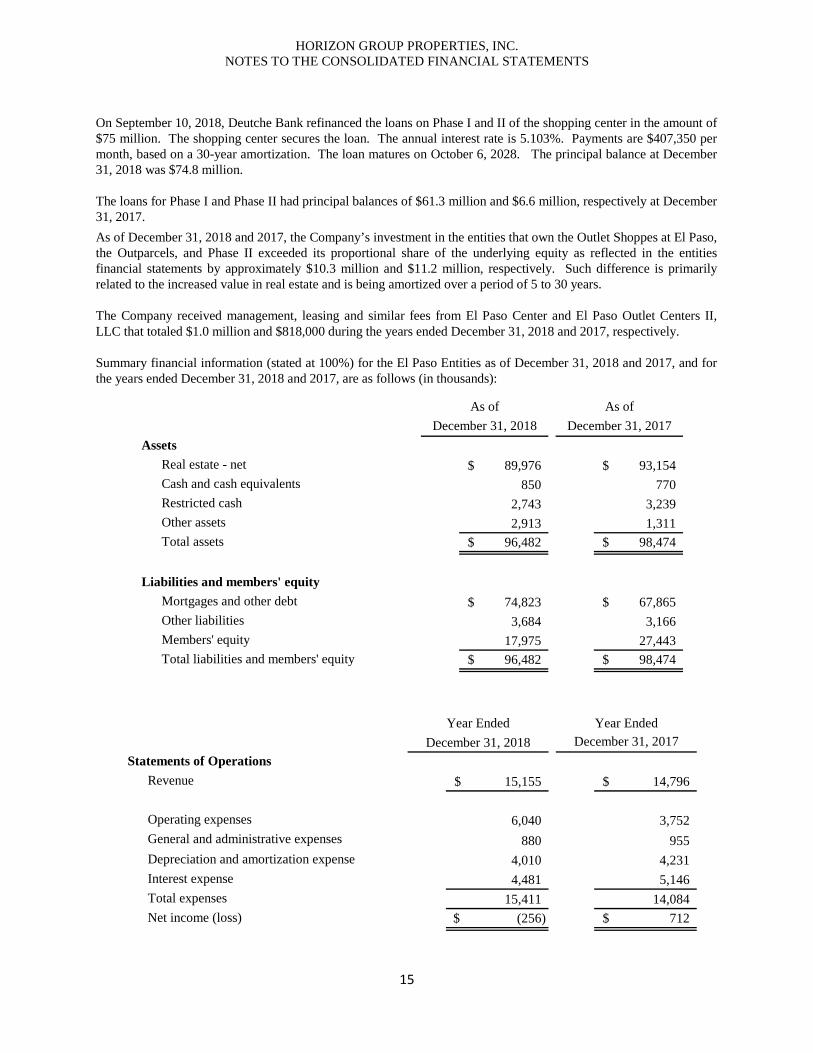
Summary financial information (stated at 100%) for the El Paso Entities as of December 31, 2018 and 2017, and for the years ended December 31, 2018 and 2017, are as follows (in thousands):
AssetsReal estate - net 89,976$ 93,154$ Cash and cash equivalents 850 770 Restricted cash 2,743 3,239 Other assets 2,913 1,311 Total assets 96,482$ 98,474$
Liabilities and members' equityMortgages and other debt 74,823$ 67,865$ Other liabilities 3,684 3,166 Members' equity 17,975 27,443 Total liabilities and members' equity 96,482$ 98,474$
As of As ofDecember 31, 2018 December 31, 2017
Statements of OperationsRevenue 15,155$ 14,796$
Operating expenses 6,040 3,752 General and administrative expenses 880 955 Depreciation and amortization expense 4,010 4,231 Interest expense 4,481 5,146 Total expenses 15,411 14,084 Net income (loss) (256)$ 712$
Year EndedYear EndedDecember 31, 2018 December 31, 2017
HORIZON GROUP PROPERTIES, INC. NOTES TO THE CONSOLIDATED FINANCIAL STATEMENTS
16
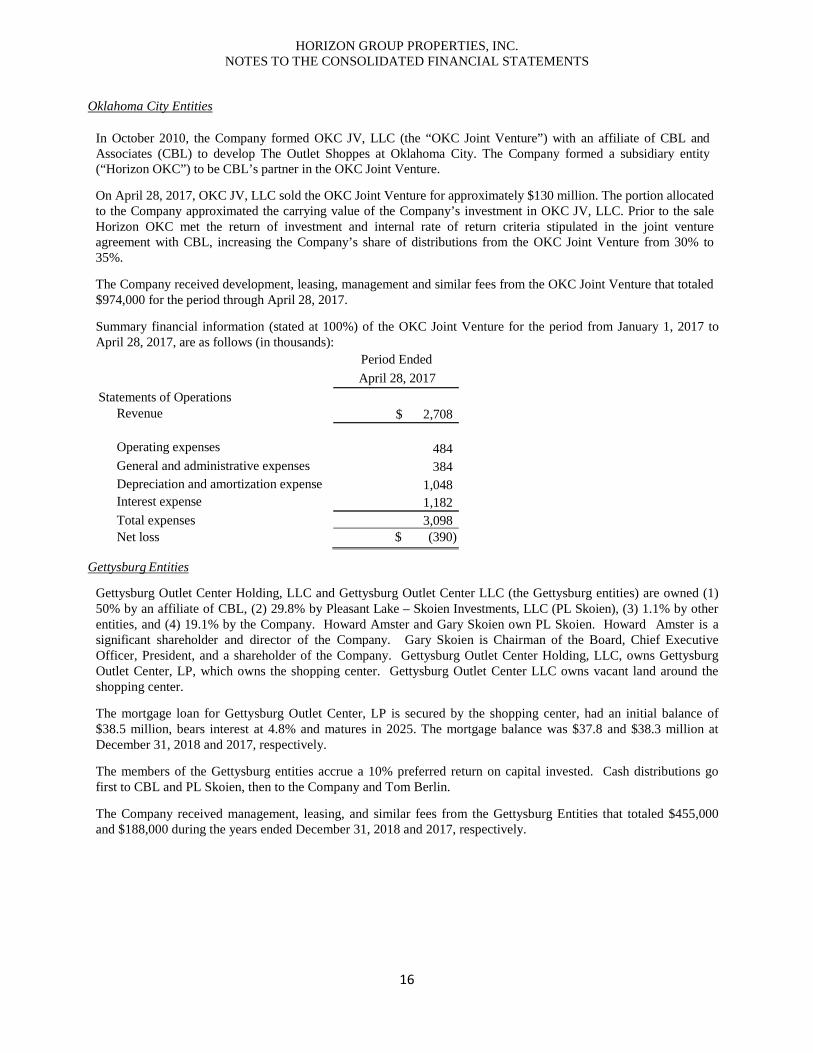
Oklahoma City Entities
In October 2010, the Company formed OKC JV, LLC (the “OKC Joint Venture”) with an affiliate of CBL and Associates (CBL) to develop The Outlet Shoppes at Oklahoma City. The Company formed a subsidiary entity (“Horizon OKC”) to be CBL’s partner in the OKC Joint Venture.
On April 28, 2017, OKC JV, LLC sold the OKC Joint Venture for approximately $130 million. The portion allocated to the Company approximated the carrying value of the Company’s investment in OKC JV, LLC. Prior to the sale Horizon OKC met the return of investment and internal rate of return criteria stipulated in the joint venture agreement with CBL, increasing the Company’s share of distributions from the OKC Joint Venture from 30% to 35%.
The Company received development, leasing, management and similar fees from the OKC Joint Venture that totaled $974,000 for the period through April 28, 2017.
Summary financial information (stated at 100%) of the OKC Joint Venture for the period from January 1, 2017 to April 28, 2017, are as follows (in thousands): Period Ended
April 28, 2017 Statements of Operations
Revenue $ 2,708
Operating expenses
484 General and administrative expenses 384 Depreciation and amortization expense 1,048 Interest expense 1,182 Total expenses 3,098 Net loss $ (390)
Gettysburg Entities
Gettysburg Outlet Center Holding, LLC and Gettysburg Outlet Center LLC (the Gettysburg entities) are owned (1) 50% by an affiliate of CBL, (2) 29.8% by Pleasant Lake – Skoien Investments, LLC (PL Skoien), (3) 1.1% by other entities, and (4) 19.1% by the Company. Howard Amster and Gary Skoien own PL Skoien. Howard Amster is a significant shareholder and director of the Company. Gary Skoien is Chairman of the Board, Chief Executive Officer, President, and a shareholder of the Company. Gettysburg Outlet Center Holding, LLC, owns Gettysburg Outlet Center, LP, which owns the shopping center. Gettysburg Outlet Center LLC owns vacant land around the shopping center.
The mortgage loan for Gettysburg Outlet Center, LP is secured by the shopping center, had an initial balance of $38.5 million, bears interest at 4.8% and matures in 2025. The mortgage balance was $37.8 and $38.3 million at December 31, 2018 and 2017, respectively.
The members of the Gettysburg entities accrue a 10% preferred return on capital invested. Cash distributions go first to CBL and PL Skoien, then to the Company and Tom Berlin.
The Company received management, leasing, and similar fees from the Gettysburg Entities that totaled $455,000 and $188,000 during the years ended December 31, 2018 and 2017, respectively.
HORIZON GROUP PROPERTIES, INC. NOTES TO THE CONSOLIDATED FINANCIAL STATEMENTS
17
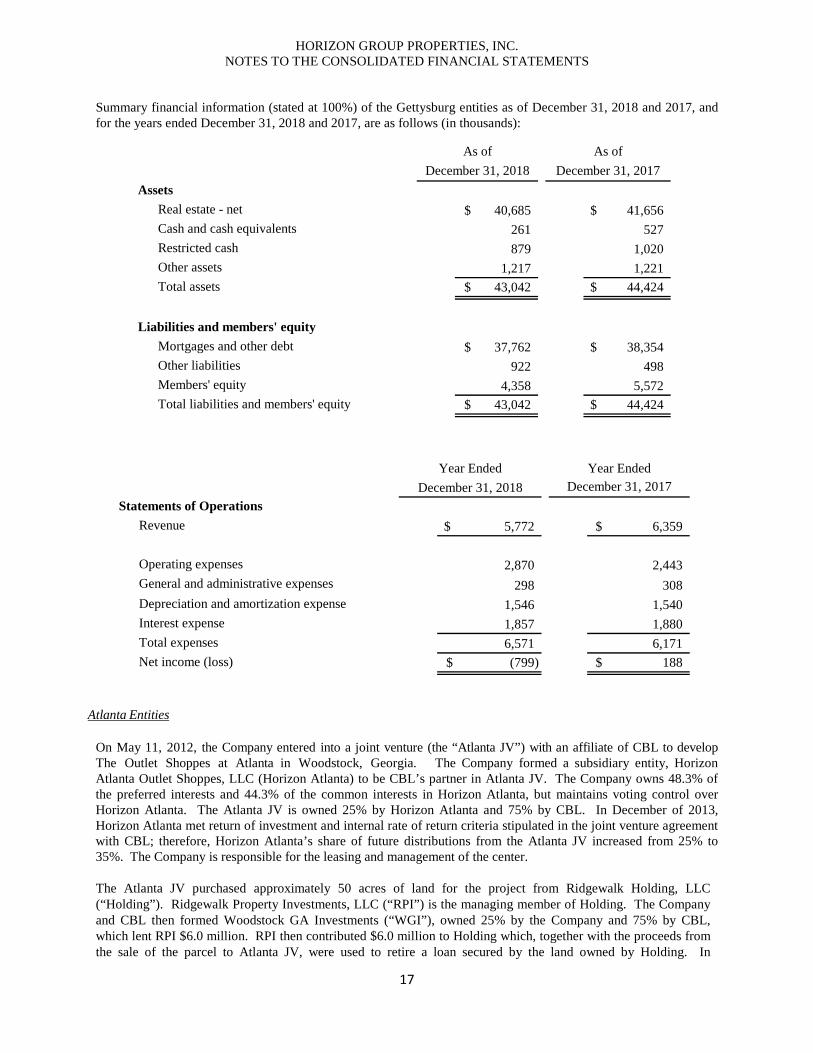
Summary financial information (stated at 100%) of the Gettysburg entities as of December 31, 2018 and 2017, and for the years ended December 31, 2018 and 2017, are as follows (in thousands):
AssetsReal estate - net 40,685$ 41,656$ Cash and cash equivalents 261 527 Restricted cash 879 1,020 Other assets 1,217 1,221 Total assets 43,042$ 44,424$
Liabilities and members' equityMortgages and other debt 37,762$ 38,354$ Other liabilities 922 498 Members' equity 4,358 5,572 Total liabilities and members' equity 43,042$ 44,424$
As of As ofDecember 31, 2018 December 31, 2017
Statements of OperationsRevenue 5,772$ 6,359$
Operating expenses 2,870 2,443 General and administrative expenses 298 308 Depreciation and amortization expense 1,546 1,540 Interest expense 1,857 1,880 Total expenses 6,571 6,171 Net income (loss) (799)$ 188$
Year Ended Year EndedDecember 31, 2018 December 31, 2017
Atlanta Entities
On May 11, 2012, the Company entered into a joint venture (the “Atlanta JV”) with an affiliate of CBL to develop The Outlet Shoppes at Atlanta in Woodstock, Georgia. The Company formed a subsidiary entity, Horizon Atlanta Outlet Shoppes, LLC (Horizon Atlanta) to be CBL’s partner in Atlanta JV. The Company owns 48.3% of the preferred interests and 44.3% of the common interests in Horizon Atlanta, but maintains voting control over Horizon Atlanta. The Atlanta JV is owned 25% by Horizon Atlanta and 75% by CBL. In December of 2013, Horizon Atlanta met return of investment and internal rate of return criteria stipulated in the joint venture agreement with CBL; therefore, Horizon Atlanta’s share of future distributions from the Atlanta JV increased from 25% to 35%. The Company is responsible for the leasing and management of the center.
The Atlanta JV purchased approximately 50 acres of land for the project from Ridgewalk Holding, LLC (“Holding”). Ridgewalk Property Investments, LLC (“RPI”) is the managing member of Holding. The Company and CBL then formed Woodstock GA Investments (“WGI”), owned 25% by the Company and 75% by CBL, which lent RPI $6.0 million. RPI then contributed $6.0 million to Holding which, together with the proceeds from the sale of the parcel to Atlanta JV, were used to retire a loan secured by the land owned by Holding. In
HORIZON GROUP PROPERTIES, INC. NOTES TO THE CONSOLIDATED FINANCIAL STATEMENTS
18
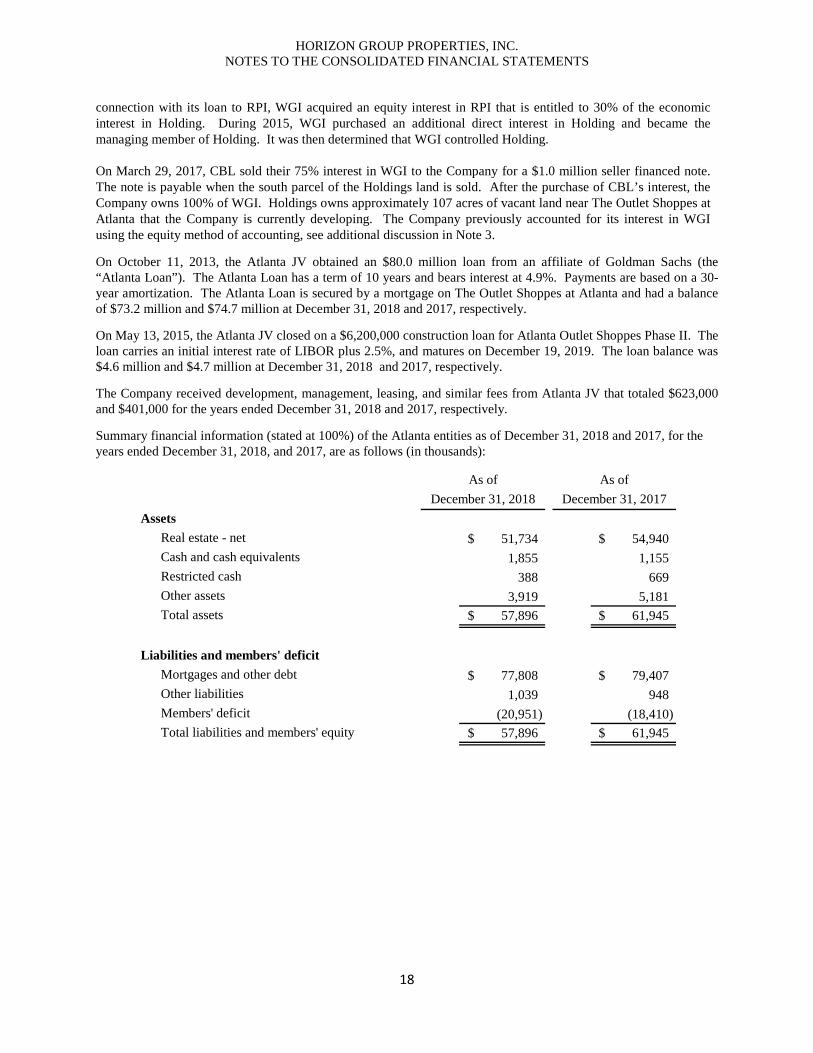
connection with its loan to RPI, WGI acquired an equity interest in RPI that is entitled to 30% of the economic interest in Holding. During 2015, WGI purchased an additional direct interest in Holding and became the managing member of Holding. It was then determined that WGI controlled Holding.
On March 29, 2017, CBL sold their 75% interest in WGI to the Company for a $1.0 million seller financed note. The note is payable when the south parcel of the Holdings land is sold. After the purchase of CBL’s interest, the Company owns 100% of WGI. Holdings owns approximately 107 acres of vacant land near The Outlet Shoppes at Atlanta that the Company is currently developing. The Company previously accounted for its interest in WGI using the equity method of accounting, see additional discussion in Note 3.
On October 11, 2013, the Atlanta JV obtained an $80.0 million loan from an affiliate of Goldman Sachs (the “Atlanta Loan”). The Atlanta Loan has a term of 10 years and bears interest at 4.9%. Payments are based on a 30-year amortization. The Atlanta Loan is secured by a mortgage on The Outlet Shoppes at Atlanta and had a balance of $73.2 million and $74.7 million at December 31, 2018 and 2017, respectively.
On May 13, 2015, the Atlanta JV closed on a $6,200,000 construction loan for Atlanta Outlet Shoppes Phase II. The loan carries an initial interest rate of LIBOR plus 2.5%, and matures on December 19, 2019. The loan balance was $4.6 million and $4.7 million at December 31, 2018 and 2017, respectively.
The Company received development, management, leasing, and similar fees from Atlanta JV that totaled $623,000 and $401,000 for the years ended December 31, 2018 and 2017, respectively.
Summary financial information (stated at 100%) of the Atlanta entities as of December 31, 2018 and 2017, for the years ended December 31, 2018, and 2017, are as follows (in thousands):
AssetsReal estate - net 51,734$ 54,940$ Cash and cash equivalents 1,855 1,155 Restricted cash 388 669 Other assets 3,919 5,181 Total assets 57,896$ 61,945$
Liabilities and members' deficitMortgages and other debt 77,808$ 79,407$ Other liabilities 1,039 948 Members' deficit (20,951) (18,410) Total liabilities and members' equity 57,896$ 61,945$
As of As ofDecember 31, 2018 December 31, 2017
HORIZON GROUP PROPERTIES, INC. NOTES TO THE CONSOLIDATED FINANCIAL STATEMENTS
19
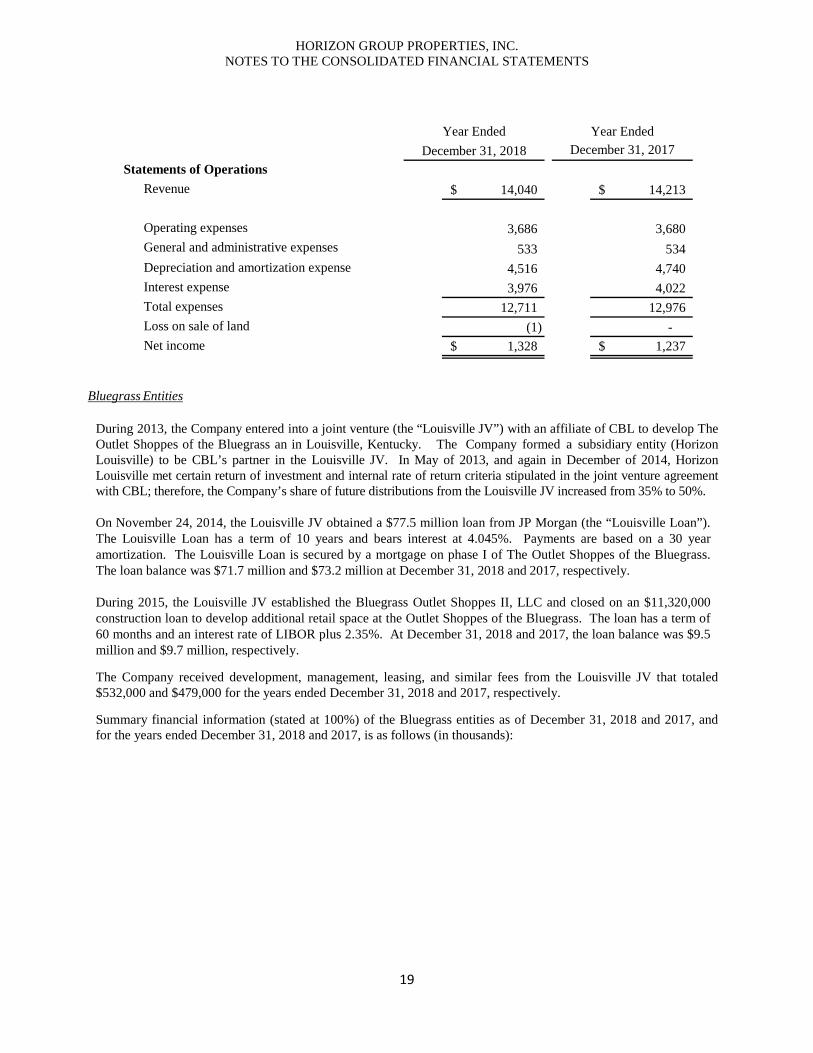
Statements of OperationsRevenue 14,040$ 14,213$
Operating expenses 3,686 3,680 General and administrative expenses 533 534 Depreciation and amortization expense 4,516 4,740 Interest expense 3,976 4,022 Total expenses 12,711 12,976 Loss on sale of land (1) - Net income 1,328$ 1,237$
Year Ended Year EndedDecember 31, 2018 December 31, 2017
Bluegrass Entities
During 2013, the Company entered into a joint venture (the “Louisville JV”) with an affiliate of CBL to develop The Outlet Shoppes of the Bluegrass an in Louisville, Kentucky. The Company formed a subsidiary entity (Horizon Louisville) to be CBL’s partner in the Louisville JV. In May of 2013, and again in December of 2014, Horizon Louisville met certain return of investment and internal rate of return criteria stipulated in the joint venture agreement with CBL; therefore, the Company’s share of future distributions from the Louisville JV increased from 35% to 50%.
On November 24, 2014, the Louisville JV obtained a $77.5 million loan from JP Morgan (the “Louisville Loan”). The Louisville Loan has a term of 10 years and bears interest at 4.045%. Payments are based on a 30 year amortization. The Louisville Loan is secured by a mortgage on phase I of The Outlet Shoppes of the Bluegrass. The loan balance was $71.7 million and $73.2 million at December 31, 2018 and 2017, respectively.
During 2015, the Louisville JV established the Bluegrass Outlet Shoppes II, LLC and closed on an $11,320,000 construction loan to develop additional retail space at the Outlet Shoppes of the Bluegrass. The loan has a term of 60 months and an interest rate of LIBOR plus 2.35%. At December 31, 2018 and 2017, the loan balance was $9.5 million and $9.7 million, respectively.
The Company received development, management, leasing, and similar fees from the Louisville JV that totaled $532,000 and $479,000 for the years ended December 31, 2018 and 2017, respectively.
Summary financial information (stated at 100%) of the Bluegrass entities as of December 31, 2018 and 2017, and for the years ended December 31, 2018 and 2017, is as follows (in thousands):
HORIZON GROUP PROPERTIES, INC. NOTES TO THE CONSOLIDATED FINANCIAL STATEMENTS
20
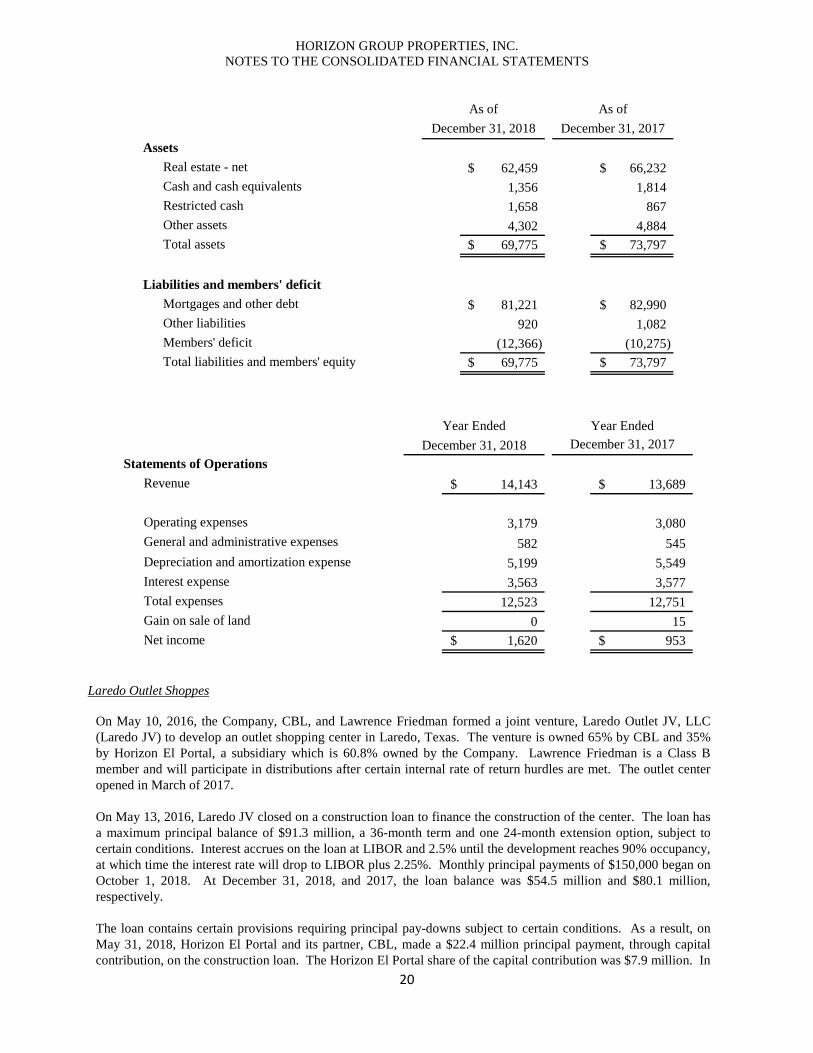
AssetsReal estate - net 62,459$ 66,232$ Cash and cash equivalents 1,356 1,814 Restricted cash 1,658 867 Other assets 4,302 4,884 Total assets 69,775$ 73,797$
Liabilities and members' deficitMortgages and other debt 81,221$ 82,990$ Other liabilities 920 1,082 Members' deficit (12,366) (10,275) Total liabilities and members' equity 69,775$ 73,797$
As of As ofDecember 31, 2018 December 31, 2017
Statements of OperationsRevenue 14,143$ 13,689$
Operating expenses 3,179 3,080 General and administrative expenses 582 545 Depreciation and amortization expense 5,199 5,549 Interest expense 3,563 3,577 Total expenses 12,523 12,751 Gain on sale of land 0 15 Net income 1,620$ 953$
Year Ended Year EndedDecember 31, 2018 December 31, 2017
Laredo Outlet Shoppes
On May 10, 2016, the Company, CBL, and Lawrence Friedman formed a joint venture, Laredo Outlet JV, LLC (Laredo JV) to develop an outlet shopping center in Laredo, Texas. The venture is owned 65% by CBL and 35% by Horizon El Portal, a subsidiary which is 60.8% owned by the Company. Lawrence Friedman is a Class B member and will participate in distributions after certain internal rate of return hurdles are met. The outlet center opened in March of 2017.
On May 13, 2016, Laredo JV closed on a construction loan to finance the construction of the center. The loan has a maximum principal balance of $91.3 million, a 36-month term and one 24-month extension option, subject to certain conditions. Interest accrues on the loan at LIBOR and 2.5% until the development reaches 90% occupancy, at which time the interest rate will drop to LIBOR plus 2.25%. Monthly principal payments of $150,000 began on October 1, 2018. At December 31, 2018, and 2017, the loan balance was $54.5 million and $80.1 million, respectively.
The loan contains certain provisions requiring principal pay-downs subject to certain conditions. As a result, on May 31, 2018, Horizon El Portal and its partner, CBL, made a $22.4 million principal payment, through capital contribution, on the construction loan. The Horizon El Portal share of the capital contribution was $7.9 million. In
HORIZON GROUP PROPERTIES, INC. NOTES TO THE CONSOLIDATED FINANCIAL STATEMENTS
21
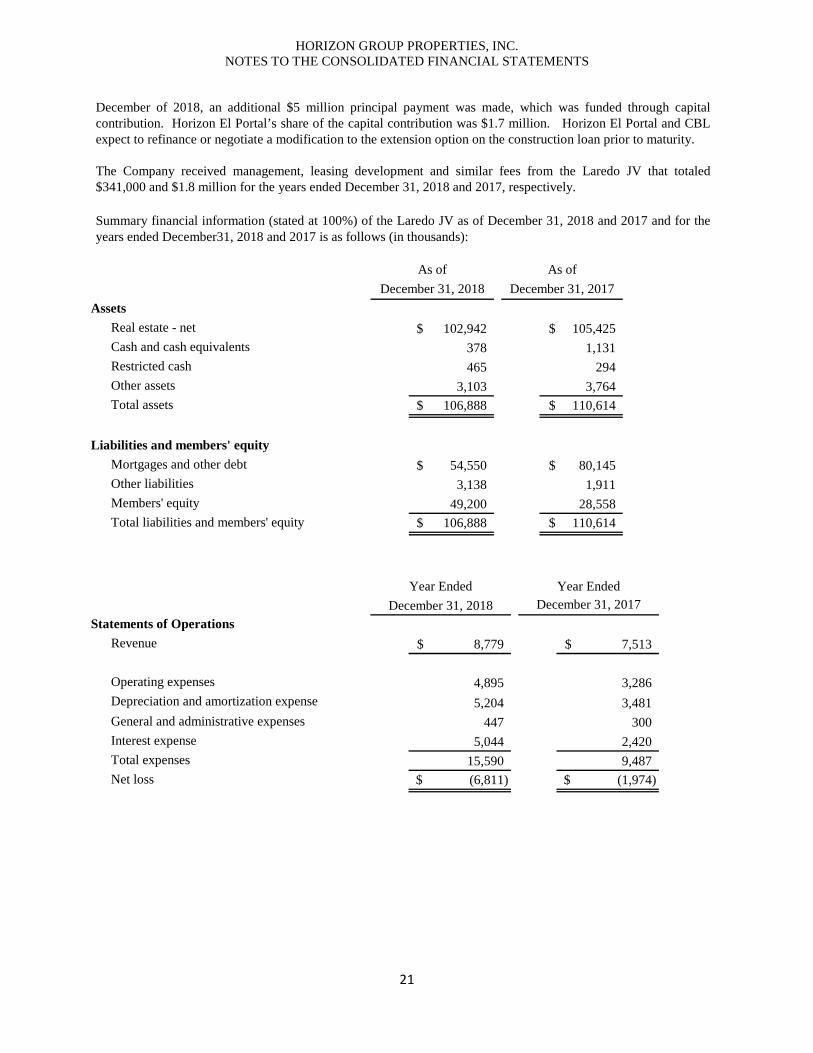
December of 2018, an additional $5 million principal payment was made, which was funded through capital contribution. Horizon El Portal’s share of the capital contribution was $1.7 million. Horizon El Portal and CBL expect to refinance or negotiate a modification to the extension option on the construction loan prior to maturity.
The Company received management, leasing development and similar fees from the Laredo JV that totaled $341,000 and $1.8 million for the years ended December 31, 2018 and 2017, respectively.
Summary financial information (stated at 100%) of the Laredo JV as of December 31, 2018 and 2017 and for the years ended December31, 2018 and 2017 is as follows (in thousands):
AssetsReal estate - net 102,942$ 105,425$ Cash and cash equivalents 378 1,131 Restricted cash 465 294 Other assets 3,103 3,764 Total assets 106,888$ 110,614$
Liabilities and members' equityMortgages and other debt 54,550$ 80,145$ Other liabilities 3,138 1,911 Members' equity 49,200 28,558 Total liabilities and members' equity 106,888$ 110,614$
As of As ofDecember 31, 2018 December 31, 2017
Statements of OperationsRevenue 8,779$ 7,513$
Operating expenses 4,895 3,286 Depreciation and amortization expense 5,204 3,481 General and administrative expenses 447 300 Interest expense 5,044 2,420 Total expenses 15,590 9,487 Net loss (6,811)$ (1,974)$
Year Ended Year EndedDecember 31, 2018 December 31, 2017
HORIZON GROUP PROPERTIES, INC. NOTES TO THE CONSOLIDATED FINANCIAL STATEMENTS
22
Note 5 – Income Taxes
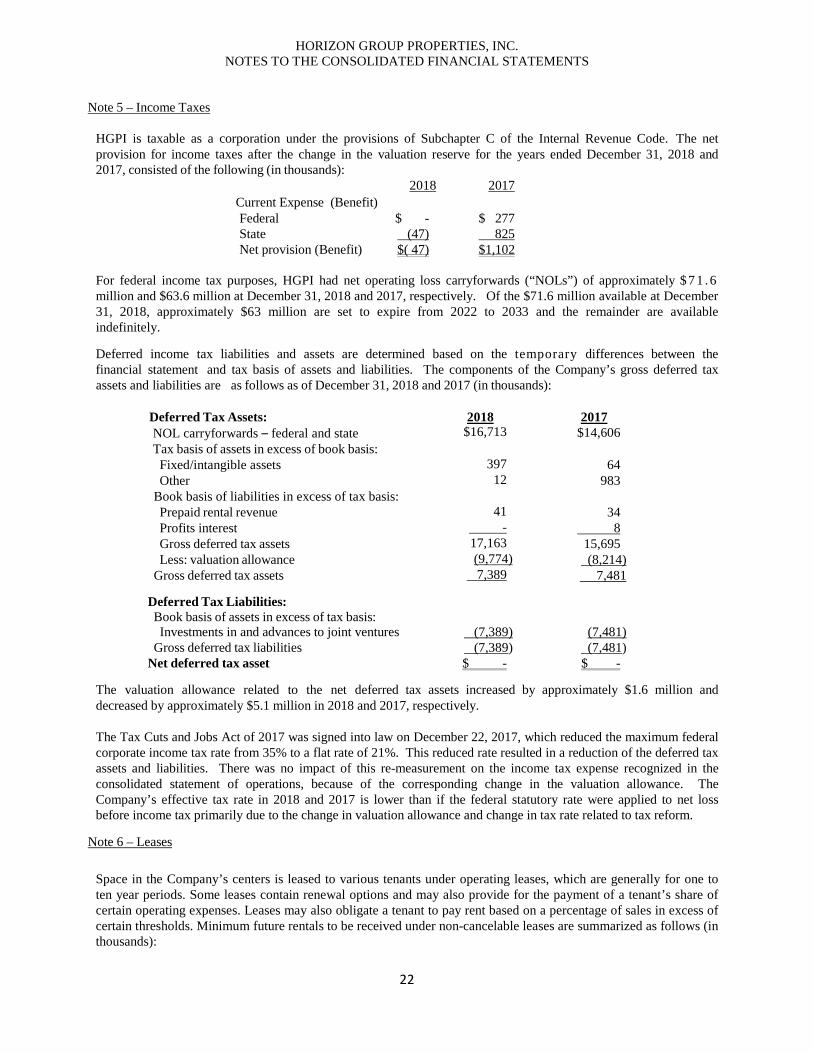
HGPI is taxable as a corporation under the provisions of Subchapter C of the Internal Revenue Code. The net provision for income taxes after the change in the valuation reserve for the years ended December 31, 2018 and 2017, consisted of the following (in thousands):
2018 2017 Current Expense (Benefit) Federal $ - $ 277 State (47) 825 Net provision (Benefit) $( 47) $1,102
For federal income tax purposes, HGPI had net operating loss carryforwards (“NOLs”) of approximately $ 7 1 .6 million and $63.6 million at December 31, 2018 and 2017, respectively. Of the $71.6 million available at December 31, 2018, approximately $63 million are set to expire from 2022 to 2033 and the remainder are available indefinitely.
Deferred income tax liabilities and assets are determined based on the temporary differences between the financial statement and tax basis of assets and liabilities. The components of the Company’s gross deferred tax assets and liabilities are as follows as of December 31, 2018 and 2017 (in thousands):
Deferred Tax Assets: 2018 2017 NOL carryforwards – federal and state $16,713 $14,606 Tax basis of assets in excess of book basis:
Fixed/intangible assets 397 64 Other 12 983
Book basis of liabilities in excess of tax basis: Prepaid rental revenue 41 34 Profits interest - 8 Gross deferred tax assets 17,163 15,695 Less: valuation allowance (9,774) (8,214)
Gross deferred tax assets 7,389 7,481 Deferred Tax Liabilities: Book basis of assets in excess of tax basis:
Investments in and advances to joint ventures (7,389) (7,481) Gross deferred tax liabilities (7,389) (7,481)
Net deferred tax asset $ - $ -
The valuation allowance related to the net deferred tax assets increased by approximately $1.6 million and decreased by approximately $5.1 million in 2018 and 2017, respectively.
The Tax Cuts and Jobs Act of 2017 was signed into law on December 22, 2017, which reduced the maximum federal corporate income tax rate from 35% to a flat rate of 21%. This reduced rate resulted in a reduction of the deferred tax assets and liabilities. There was no impact of this re-measurement on the income tax expense recognized in the consolidated statement of operations, because of the corresponding change in the valuation allowance. The Company’s effective tax rate in 2018 and 2017 is lower than if the federal statutory rate were applied to net loss before income tax primarily due to the change in valuation allowance and change in tax rate related to tax reform.
Note 6 – Leases
Space in the Company’s centers is leased to various tenants under operating leases, which are generally for one to ten year periods. Some leases contain renewal options and may also provide for the payment of a tenant’s share of certain operating expenses. Leases may also obligate a tenant to pay rent based on a percentage of sales in excess of certain thresholds. Minimum future rentals to be received under non-cancelable leases are summarized as follows (in thousands):
HORIZON GROUP PROPERTIES, INC. NOTES TO THE CONSOLIDATED FINANCIAL STATEMENTS
23
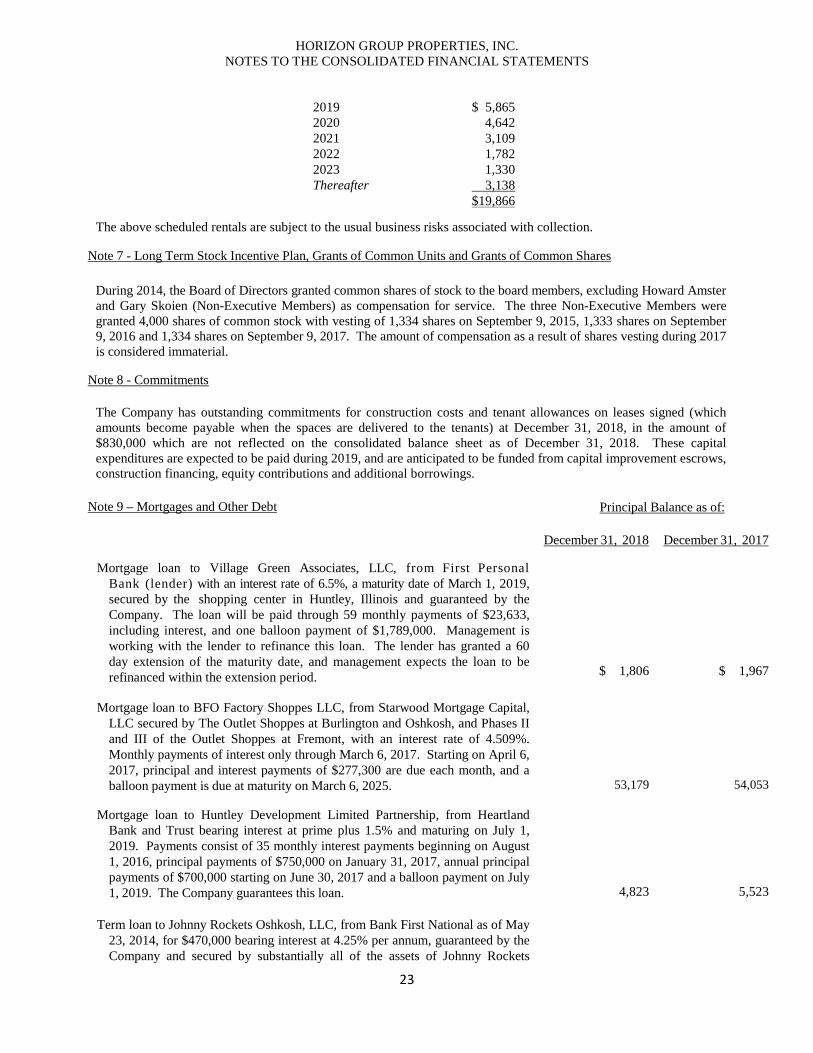
2019 $ 5,865 2020 4,642 2021 3,109 2022 1,782 2023 1,330 Thereafter 3,138
$19,866
The above scheduled rentals are subject to the usual business risks associated with collection. Note 7 - Long Term Stock Incentive Plan, Grants of Common Units and Grants of Common Shares
During 2014, the Board of Directors granted common shares of stock to the board members, excluding Howard Amster and Gary Skoien (Non-Executive Members) as compensation for service. The three Non-Executive Members were granted 4,000 shares of common stock with vesting of 1,334 shares on September 9, 2015, 1,333 shares on September 9, 2016 and 1,334 shares on September 9, 2017. The amount of compensation as a result of shares vesting during 2017 is considered immaterial.
Note 8 - Commitments
The Company has outstanding commitments for construction costs and tenant allowances on leases signed (which amounts become payable when the spaces are delivered to the tenants) at December 31, 2018, in the amount of $830,000 which are not reflected on the consolidated balance sheet as of December 31, 2018. These capital expenditures are expected to be paid during 2019, and are anticipated to be funded from capital improvement escrows, construction financing, equity contributions and additional borrowings.
Note 9 – Mortgages and Other Debt
Principal Balance as of:
December 31, 2018 December 31, 2017
Mortgage loan to Village Green Associates, LLC, from First Personal Bank (lender) with an interest rate of 6.5%, a maturity date of March 1, 2019, secured by the shopping center in Huntley, Illinois and guaranteed by the Company. The loan will be paid through 59 monthly payments of $23,633, including interest, and one balloon payment of $1,789,000. Management is working with the lender to refinance this loan. The lender has granted a 60 day extension of the maturity date, and management expects the loan to be refinanced within the extension period.
$ 1,806
$ 1,967
Mortgage loan to BFO Factory Shoppes LLC, from Starwood Mortgage Capital,
LLC secured by The Outlet Shoppes at Burlington and Oshkosh, and Phases II and III of the Outlet Shoppes at Fremont, with an interest rate of 4.509%. Monthly payments of interest only through March 6, 2017. Starting on April 6, 2017, principal and interest payments of $277,300 are due each month, and a balloon payment is due at maturity on March 6, 2025.
53,179
54,053
Mortgage loan to Huntley Development Limited Partnership, from Heartland Bank and Trust bearing interest at prime plus 1.5% and maturing on July 1, 2019. Payments consist of 35 monthly interest payments beginning on August 1, 2016, principal payments of $750,000 on January 31, 2017, annual principal payments of $700,000 starting on June 30, 2017 and a balloon payment on July 1, 2019. The Company guarantees this loan.
4,823
5,523 Term loan to Johnny Rockets Oshkosh, LLC, from Bank First National as of May
23, 2014, for $470,000 bearing interest at 4.25% per annum, guaranteed by the Company and secured by substantially all of the assets of Johnny Rockets
HORIZON GROUP PROPERTIES, INC. NOTES TO THE CONSOLIDATED FINANCIAL STATEMENTS
24
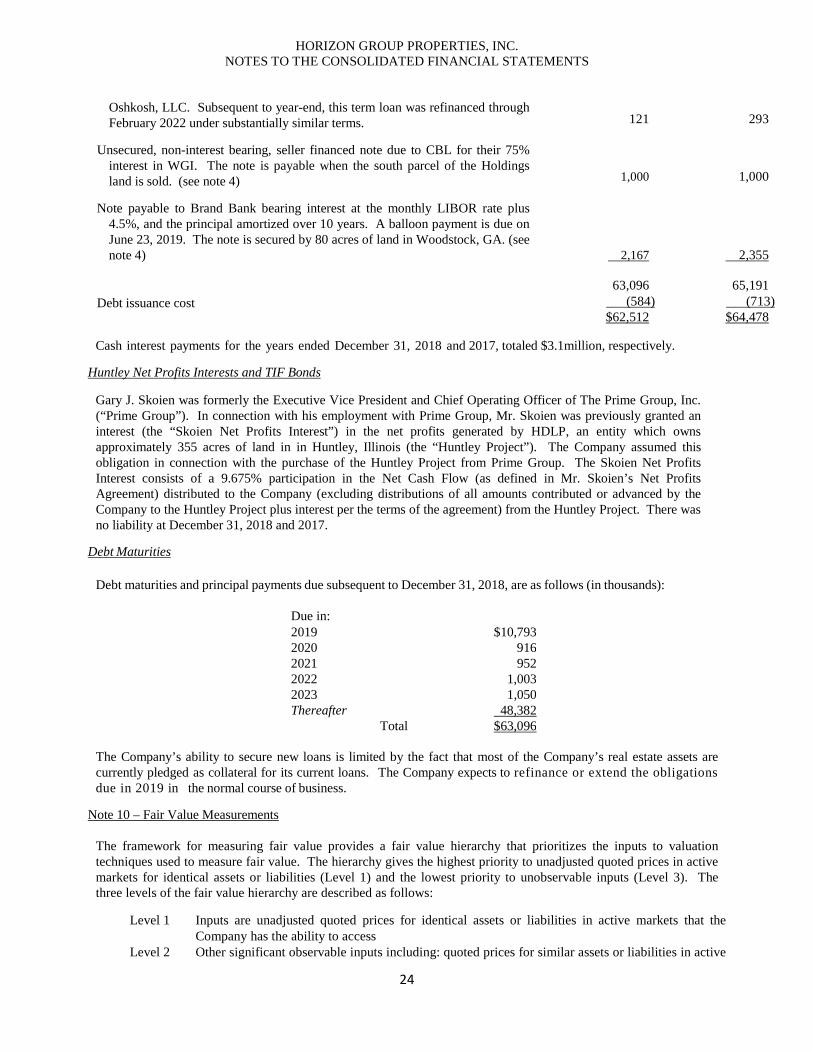
Oshkosh, LLC. Subsequent to year-end, this term loan was refinanced through February 2022 under substantially similar terms.
121
293
Unsecured, non-interest bearing, seller financed note due to CBL for their 75%
interest in WGI. The note is payable when the south parcel of the Holdings land is sold. (see note 4)
Note payable to Brand Bank bearing interest at the monthly LIBOR rate plus
4.5%, and the principal amortized over 10 years. A balloon payment is due on June 23, 2019. The note is secured by 80 acres of land in Woodstock, GA. (see note 4)
1,000
2,167
1,000
2,355
63,096 65,191 Debt issuance cost (584) (713) $62,512 $64,478
Cash interest payments for the years ended December 31, 2018 and 2017, totaled $3.1million, respectively.
Huntley Net Profits Interests and TIF Bonds
Gary J. Skoien was formerly the Executive Vice President and Chief Operating Officer of The Prime Group, Inc. (“Prime Group”). In connection with his employment with Prime Group, Mr. Skoien was previously granted an interest (the “Skoien Net Profits Interest”) in the net profits generated by HDLP, an entity which owns approximately 355 acres of land in in Huntley, Illinois (the “Huntley Project”). The Company assumed this obligation in connection with the purchase of the Huntley Project from Prime Group. The Skoien Net Profits Interest consists of a 9.675% participation in the Net Cash Flow (as defined in Mr. Skoien’s Net Profits Agreement) distributed to the Company (excluding distributions of all amounts contributed or advanced by the Company to the Huntley Project plus interest per the terms of the agreement) from the Huntley Project. There was no liability at December 31, 2018 and 2017.
Debt Maturities
Debt maturities and principal payments due subsequent to December 31, 2018, are as follows (in thousands):
Due in: 2019 $10,793 2020 916 2021 952 2022 1,003 2023 1,050 Thereafter 48,382
Total $63,096
The Company’s ability to secure new loans is limited by the fact that most of the Company’s real estate assets are currently pledged as collateral for its current loans. The Company expects to refinance or extend the obligations due in 2019 in the normal course of business.
Note 10 – Fair Value Measurements
The framework for measuring fair value provides a fair value hierarchy that prioritizes the inputs to valuation techniques used to measure fair value. The hierarchy gives the highest priority to unadjusted quoted prices in active markets for identical assets or liabilities (Level 1) and the lowest priority to unobservable inputs (Level 3). The three levels of the fair value hierarchy are described as follows:
Level 1 Inputs are unadjusted quoted prices for identical assets or liabilities in active markets that the
Company has the ability to access Level 2 Other significant observable inputs including: quoted prices for similar assets or liabilities in active
HORIZON GROUP PROPERTIES, INC. NOTES TO THE CONSOLIDATED FINANCIAL STATEMENTS
25
markets; quoted prices for identical or similar assets or liabilities in inactive markets; inputs other than quoted prices that are observable for the asset or liability; or inputs that are derived principally from or corroborated by observable market data by correlation or other means
Level 3 Inputs are significant and unobservable (including the Company’s own assumptions used to determine value)
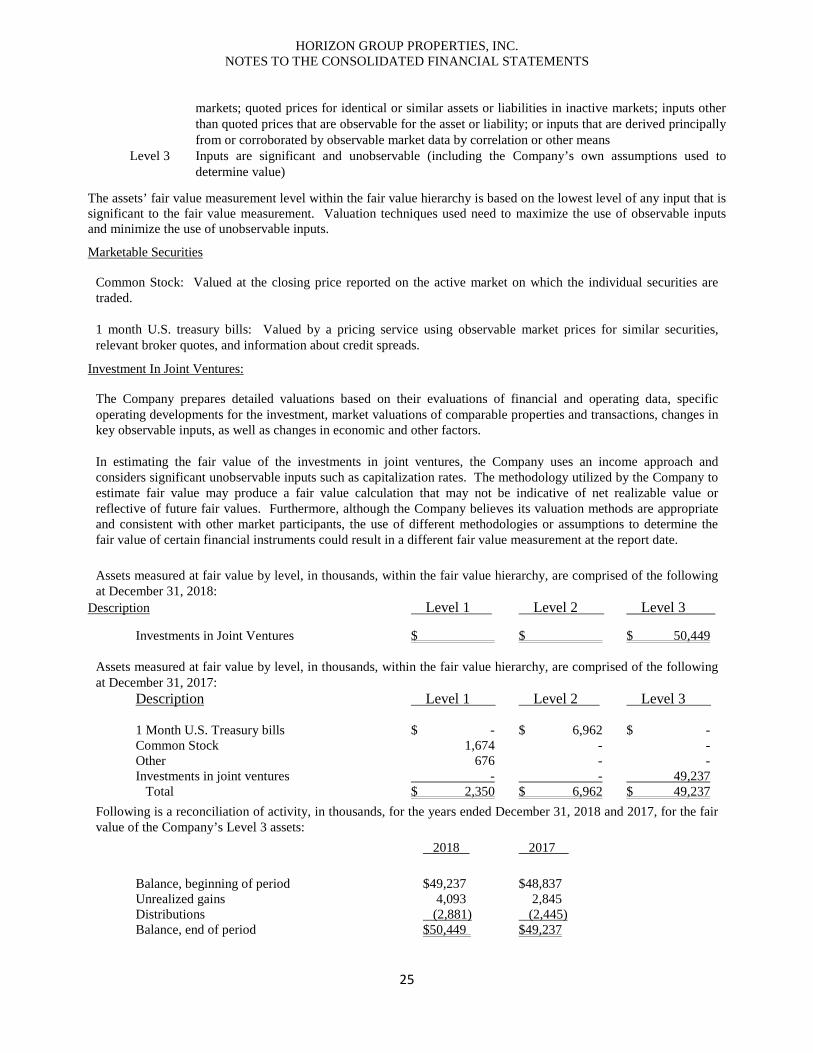
The assets’ fair value measurement level within the fair value hierarchy is based on the lowest level of any input that is significant to the fair value measurement. Valuation techniques used need to maximize the use of observable inputs and minimize the use of unobservable inputs. Marketable Securities
Common Stock: Valued at the closing price reported on the active market on which the individual securities are traded.
1 month U.S. treasury bills: Valued by a pricing service using observable market prices for similar securities, relevant broker quotes, and information about credit spreads.
Investment In Joint Ventures:
The Company prepares detailed valuations based on their evaluations of financial and operating data, specific operating developments for the investment, market valuations of comparable properties and transactions, changes in key observable inputs, as well as changes in economic and other factors.
In estimating the fair value of the investments in joint ventures, the Company uses an income approach and considers significant unobservable inputs such as capitalization rates. The methodology utilized by the Company to estimate fair value may produce a fair value calculation that may not be indicative of net realizable value or reflective of future fair values. Furthermore, although the Company believes its valuation methods are appropriate and consistent with other market participants, the use of different methodologies or assumptions to determine the fair value of certain financial instruments could result in a different fair value measurement at the report date.
Assets measured at fair value by level, in thousands, within the fair value hierarchy, are comprised of the following at December 31, 2018:
Description Level 1 Level 2 Level 3
Investments in Joint Ventures $ $ $ 50,449
Assets measured at fair value by level, in thousands, within the fair value hierarchy, are comprised of the following at December 31, 2017:
Description Level 1 Level 2 Level 3 1 Month U.S. Treasury bills $ - $ 6,962 $ - Common Stock 1,674 - - Other 676 - - Investments in joint ventures - - 49,237 Total $ 2,350 $ 6,962 $ 49,237
Following is a reconciliation of activity, in thousands, for the years ended December 31, 2018 and 2017, for the fair value of the Company’s Level 3 assets: 2018 2017
Balance, beginning of period $49,237 $48,837 Unrealized gains 4,093 2,845 Distributions (2,881) (2,445) Balance, end of period $50,449 $49,237
HORIZON GROUP PROPERTIES, INC. NOTES TO THE CONSOLIDATED FINANCIAL STATEMENTS
26
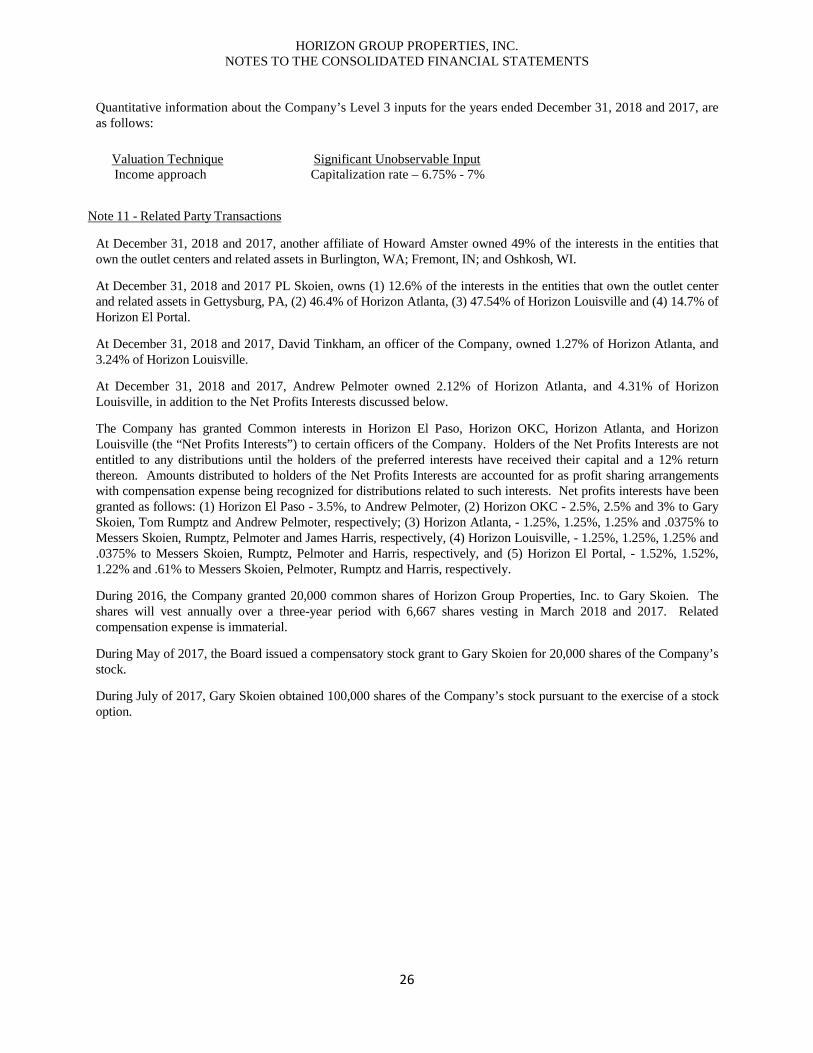
Quantitative information about the Company’s Level 3 inputs for the years ended December 31, 2018 and 2017, are as follows:
Valuation Technique Significant Unobservable Input Income approach Capitalization rate – 6.75% - 7% Note 11 - Related Party Transactions
At December 31, 2018 and 2017, another affiliate of Howard Amster owned 49% of the interests in the entities that own the outlet centers and related assets in Burlington, WA; Fremont, IN; and Oshkosh, WI.
At December 31, 2018 and 2017 PL Skoien, owns (1) 12.6% of the interests in the entities that own the outlet center and related assets in Gettysburg, PA, (2) 46.4% of Horizon Atlanta, (3) 47.54% of Horizon Louisville and (4) 14.7% of Horizon El Portal.
At December 31, 2018 and 2017, David Tinkham, an officer of the Company, owned 1.27% of Horizon Atlanta, and 3.24% of Horizon Louisville.
At December 31, 2018 and 2017, Andrew Pelmoter owned 2.12% of Horizon Atlanta, and 4.31% of Horizon Louisville, in addition to the Net Profits Interests discussed below.
The Company has granted Common interests in Horizon El Paso, Horizon OKC, Horizon Atlanta, and Horizon Louisville (the “Net Profits Interests”) to certain officers of the Company. Holders of the Net Profits Interests are not entitled to any distributions until the holders of the preferred interests have received their capital and a 12% return thereon. Amounts distributed to holders of the Net Profits Interests are accounted for as profit sharing arrangements with compensation expense being recognized for distributions related to such interests. Net profits interests have been granted as follows: (1) Horizon El Paso - 3.5%, to Andrew Pelmoter, (2) Horizon OKC - 2.5%, 2.5% and 3% to Gary Skoien, Tom Rumptz and Andrew Pelmoter, respectively; (3) Horizon Atlanta, - 1.25%, 1.25%, 1.25% and .0375% to Messers Skoien, Rumptz, Pelmoter and James Harris, respectively, (4) Horizon Louisville, - 1.25%, 1.25%, 1.25% and .0375% to Messers Skoien, Rumptz, Pelmoter and Harris, respectively, and (5) Horizon El Portal, - 1.52%, 1.52%, 1.22% and .61% to Messers Skoien, Pelmoter, Rumptz and Harris, respectively.
During 2016, the Company granted 20,000 common shares of Horizon Group Properties, Inc. to Gary Skoien. The shares will vest annually over a three-year period with 6,667 shares vesting in March 2018 and 2017. Related compensation expense is immaterial.
During May of 2017, the Board issued a compensatory stock grant to Gary Skoien for 20,000 shares of the Company’s stock.
During July of 2017, Gary Skoien obtained 100,000 shares of the Company’s stock pursuant to the exercise of a stock option.