Embed Size (px)
Citation preview

Contents
Consolidated Financial Statements for the
Years Ended December 31, 2016 and 2015 and
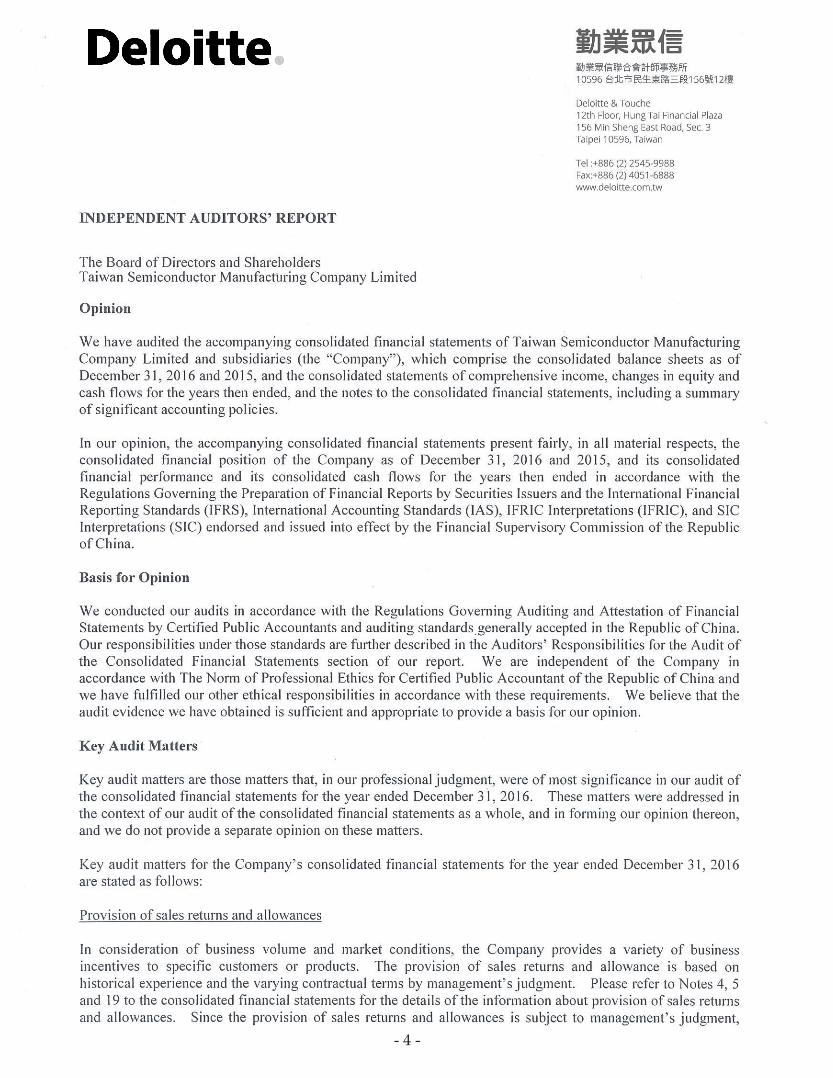
Independent Auditors’ Report 1
Parent Company Only Financial Statements for the
Years Ended December 31, 2016 and 2015 and
Independent Auditors’ Report 101

Taiwan Semiconductor Manufacturing Company Limited and Subsidiaries Consolidated Financial Statements for the Years Ended December 31, 2016 and 2015 and Independent Auditors’ Report
- 1 -

- 2 -

- 3 -
REPRESENTATION LETTER The entities that are required to be included in the combined financial statements of Taiwan Semiconductor
Manufacturing Company Limited as of and for the year ended December 31, 2016, under the Criteria Governing
the Preparation of Affiliation Reports, Consolidated Business Reports and Consolidated Financial Statements of
Affiliated Enterprises are the same as those included in the consolidated financial statements prepared in
conformity with the International Financial Reporting Standard 10, “Consolidated Financial Statements.” In
addition, the information required to be disclosed in the combined financial statements is included in the
consolidated financial statements. Consequently, Taiwan Semiconductor Manufacturing Company Limited
and Subsidiaries do not prepare a separate set of combined financial statements.
Very truly yours, TAIWAN SEMICONDUCTOR MANUFACTURING COMPANY LIMITED By MORRIS CHANG Chairman February 14, 2017
- 3 -
- 4 -

- 5 -

- 6 -

- 7 -

- 8 -
Taiwan Semiconductor Manufacturing Company Limited and Subsidiaries CONSOLIDATED BALANCE SHEETS (In Thousands of New Taiwan Dollars) December 31, 2016 December 31, 2015 ASSETS Amount % Amount % CURRENT ASSETS
Cash and cash equivalents (Note 6) $ 541,253,833 29 $ 562,688,930 34 Financial assets at fair value through profit or loss (Note 7) 6,451,112 - 6,026 - Available-for-sale financial assets (Notes 8 and 14) 67,788,767 4 14,299,361 1 Held-to-maturity financial assets (Note 9) 16,610,116 1 9,166,523 1 Hedging derivative financial assets (Note 10) 5,550 - 1,739 - Notes and accounts receivable, net (Note 11) 128,335,271 7 85,059,675 5 Receivables from related parties (Note 37) 969,559 - 505,722 - Other receivables from related parties (Note 37) 146,788 - 125,018 - Inventories (Notes 5, 12 and 41) 48,682,233 3 67,052,270 4 Other financial assets (Notes 38 and 41) 4,100,475 - 4,305,358 - Other current assets (Note 17) 3,385,422 - 3,533,369 -
Total current assets 817,729,126 44 746,743,991 45
NONCURRENT ASSETS
Held-to-maturity financial assets (Note 9) 22,307,561 1 6,910,873 - Financial assets carried at cost (Note 13) 4,102,467 - 3,990,882 - Investments accounted for using equity method (Notes 5 and 14) 19,743,888 1 24,091,828 2 Property, plant and equipment (Notes 5 and 15) 997,777,687 53 853,470,392 52 Intangible assets (Notes 5, 16 and 33) 14,614,846 1 14,065,880 1 Deferred income tax assets (Notes 5 and 30) 8,271,421 - 6,384,974 - Refundable deposits 407,874 - 430,802 - Other noncurrent assets (Note 17) 1,500,432 - 1,428,676 -
Total noncurrent assets 1,068,726,176 56 910,774,307 55
TOTAL $ 1,886,455,302 100 $ 1,657,518,298 100 LIABILITIES AND EQUITY CURRENT LIABILITIES
Short-term loans (Note 18) $ 57,958,200 3 $ 39,474,000 2 Financial liabilities at fair value through profit or loss (Note 7) 191,135 - 72,610 - Accounts payable 26,062,351 2 18,575,286 1 Payables to related parties (Note 37) 1,262,174 - 1,149,988 - Salary and bonus payable 13,681,817 1 11,702,042 1 Accrued profit sharing bonus to employees and compensation to directors and supervisors (Notes 23 and 32) 22,894,006 1 20,958,893 1 Payables to contractors and equipment suppliers 63,154,514 3 26,012,192 2 Income tax payable (Notes 5 and 30) 40,306,054 2 32,901,106 2 Provisions (Notes 5 and 19) 18,037,789 1 10,163,536 1 Long-term liabilities - current portion (Note 20) 38,109,680 2 23,517,612 1 Accrued expenses and other current liabilities (Note 22) 36,581,553 2 27,701,329 2
Total current liabilities 318,239,273 17 212,228,594 13
NONCURRENT LIABILITIES
Bonds payable (Note 20) 153,093,557 8 191,965,082 12 Long-term bank loans 21,780 - 32,500 - Deferred income tax liabilities (Notes 5 and 30) 141,183 - 31,271 - Net defined benefit liability (Notes 5 and 21) 8,551,408 - 7,448,026 - Guarantee deposits (Note 22) 14,670,433 1 21,564,801 1 Others (Note 19) 1,686,542 - 1,613,545 -
Total noncurrent liabilities 178,164,903 9 222,655,225 13
Total liabilities 496,404,176 26 434,883,819 26
EQUITY ATTRIBUTABLE TO SHAREHOLDERS OF THE PARENT
Capital stock (Note 23) 259,303,805 14 259,303,805 16 Capital surplus (Note 23) 56,272,304 3 56,300,215 3 Retained earnings (Note 23)
Appropriated as legal capital reserve 208,297,945 11 177,640,561 11 Unappropriated earnings 863,710,224 46 716,653,025 43
1,072,008,169 57 894,293,586 54 Others (Note 23) 1,663,983 - 11,774,113 1
Equity attributable to shareholders of the parent 1,389,248,261 74 1,221,671,719 74
NONCONTROLLING INTERESTS 802,865 - 962,760 -
Total equity 1,390,051,126 74 1,222,634,479 74 TOTAL $ 1,886,455,302 100 $ 1,657,518,298 100 The accompanying notes are an integral part of the consolidated financial statements.
- 8 -

- 9 -
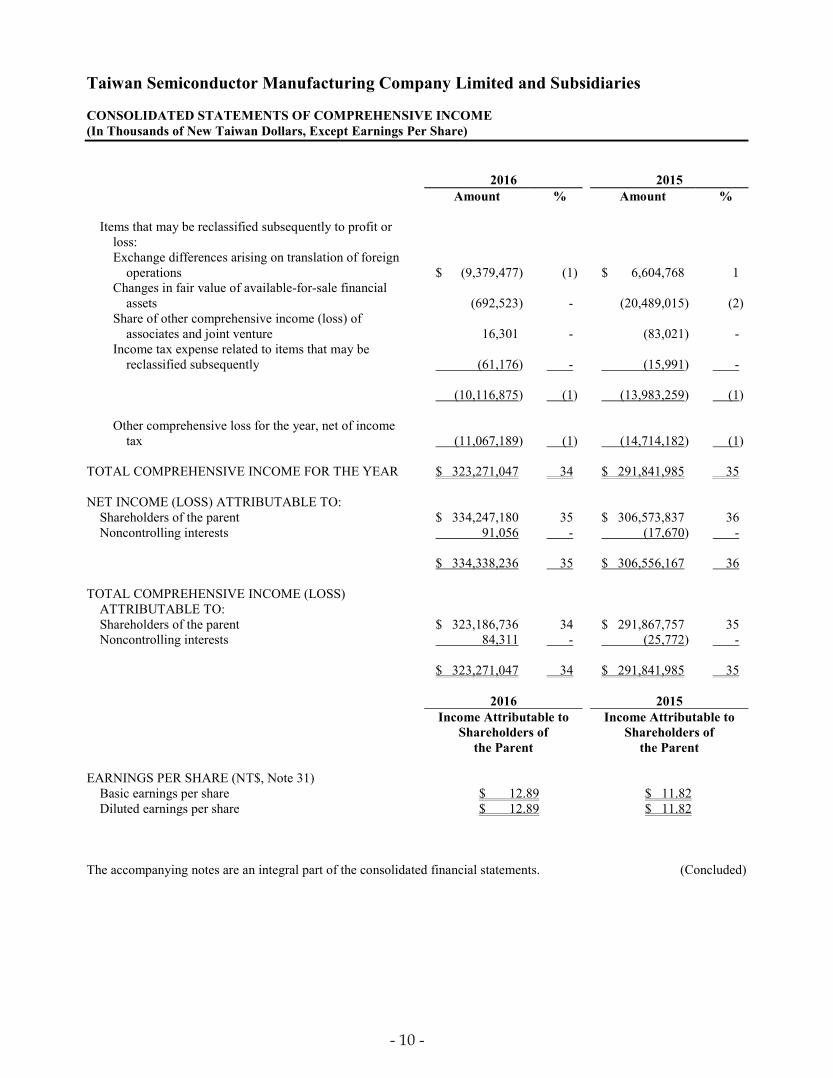
Taiwan Semiconductor Manufacturing Company Limited and Subsidiaries CONSOLIDATED STATEMENTS OF COMPREHENSIVE INCOME (In Thousands of New Taiwan Dollars, Except Earnings Per Share) 2016 2015 Amount % Amount % NET REVENUE (Notes 5, 25, 37 and 43) $ 947,938,344 100 $ 843,497,368 100 COST OF REVENUE (Notes 5, 12, 32, 37 and 41) 473,077,173 50 433,117,601 51 GROSS PROFIT BEFORE REALIZED (UNREALIZED)
GROSS PROFIT ON SALES TO ASSOCIATES 474,861,171 50 410,379,767 49 REALIZED (UNREALIZED) GROSS PROFIT ON SALES
TO ASSOCIATES (29,073) - 15,126 - GROSS PROFIT 474,832,098 50 410,394,893 49 OPERATING EXPENSES (Notes 5, 32 and 37)
Research and development 71,207,703 7 65,544,579 8 General and administrative 19,795,593 2 17,257,237 2 Marketing 5,900,837 1 5,664,684 1
Total operating expenses 96,904,133 10 88,466,500 11
OTHER OPERATING INCOME AND EXPENSES, NET
(Notes 15, 16, 26 and 32) 29,813 - (1,880,618) - INCOME FROM OPERATIONS (Note 43) 377,957,778 40 320,047,775 38 NON-OPERATING INCOME AND EXPENSES
Share of profits of associates and joint venture (Notes 14 and 43) 3,495,600 - 4,132,128 -
Other income (Note 27) 6,454,901 1 4,750,829 1 Foreign exchange gain, net (Note 42) 1,161,322 - 2,481,446 - Finance costs (Note 28) (3,306,153) - (3,190,331) - Other gains and losses (Note 29) 195,932 - 22,207,064 3
Total non-operating income and expenses 8,001,602 1 30,381,136 4
INCOME BEFORE INCOME TAX 385,959,380 41 350,428,911 42 INCOME TAX EXPENSE (Notes 5, 30 and 43) 51,621,144 6 43,872,744 6 NET INCOME 334,338,236 35 306,556,167 36 OTHER COMPREHENSIVE INCOME (LOSS) (Notes 14,
21, 23 and 30) Items that will not be reclassified subsequently to profit or
loss: Remeasurement of defined benefit obligation (1,057,220) - (827,703) - Share of other comprehensive loss of associates and
joint venture (19,961) - (2,546) - Income tax benefit related to items that will not be
reclassified subsequently 126,867 - 99,326 - (950,314) - (730,923) -
(Continued)
- 9 -
- 10 -
Taiwan Semiconductor Manufacturing Company Limited and Subsidiaries CONSOLIDATED STATEMENTS OF COMPREHENSIVE INCOME (In Thousands of New Taiwan Dollars, Except Earnings Per Share) 2016 2015 Amount % Amount %
Items that may be reclassified subsequently to profit or loss: Exchange differences arising on translation of foreign
operations $ (9,379,477) (1) $ 6,604,768 1 Changes in fair value of available-for-sale financial
assets (692,523) - (20,489,015) (2) Share of other comprehensive income (loss) of
associates and joint venture 16,301 - (83,021) - Income tax expense related to items that may be
reclassified subsequently (61,176) - (15,991) - (10,116,875) (1) (13,983,259) (1)
Other comprehensive loss for the year, net of income tax (11,067,189) (1) (14,714,182) (1)
TOTAL COMPREHENSIVE INCOME FOR THE YEAR $ 323,271,047 34 $ 291,841,985 35 NET INCOME (LOSS) ATTRIBUTABLE TO:
Shareholders of the parent $ 334,247,180 35 $ 306,573,837 36 Noncontrolling interests 91,056 - (17,670) -
$ 334,338,236 35 $ 306,556,167 36 TOTAL COMPREHENSIVE INCOME (LOSS)
ATTRIBUTABLE TO: Shareholders of the parent $ 323,186,736 34 $ 291,867,757 35 Noncontrolling interests 84,311 - (25,772) -
$ 323,271,047 34 $ 291,841,985 35
2016 2015
Income Attributable to Shareholders of
the Parent
Income Attributable to Shareholders of
the Parent EARNINGS PER SHARE (NT$, Note 31)
Basic earnings per share $ 12.89 $ 11.82 Diluted earnings per share $ 12.89 $ 11.82
The accompanying notes are an integral part of the consolidated financial statements. (Concluded)
- 10 -

- 11
-
Tai
wan
Sem
icon
duct
or M
anuf
actu
ring
Com
pany
Lim
ited
and
Subs
idia
ries
C
ON
SOL
IDA
TE
D S
TA
TE
ME
NT
S O
F C
HA
NG
ES
IN E
QU
ITY
(I
n T
hous
ands
of N
ew T
aiw
an D
olla
rs, E
xcep
t Div
iden
ds P
er S
hare
)
E
quity
Attr
ibut
able
to S
hare
hold
ers o
f the
Par
ent
Oth
ers
Unr
ealiz
ed
Fore
ign
G
ain/
Los
s
C
apita
l Sto
ck -
Com
mon
Sto
ck
R
etai
ned
Ear
ning
s
Cur
renc
y
from
Ava
ilabl
e-
Shar
es
L
egal
Cap
ital
U
napp
ropr
iate
d
Tra
nsla
tion
fo
r-sa
le
C
ash
Flow
Non
cont
rolli
ng
T
otal
(I
n T
hous
ands
)
Am
ount
Cap
ital S
urpl
us
R
eser
ve
E
arni
ngs
T
otal
Res
erve
Fina
ncia
l Ass
ets
H
edge
s Res
erve
Tot
al
T
otal
Inte
rest
s
Equ
ity
B
ALA
NC
E, JA
NU
AR
Y 1
, 201
5
25
,929
,662
$
259,
296,
624
$
55
,989
,922
$
151,
250,
682
$
55
3,91
4,59
2
$
705,
165,
274
$
4,
502,
113
$
21
,247
,483
$
(305
)
$
25,7
49,2
91
$
1,0
46,2
01,1
11
$
12
7,22
1
$ 1
,046
,328
,332
A
ppro
pria
tions
of p
rior y
ear’
s ear
ning
s
Le
gal c
apita
l res
erve
-
-
-
26,3
89,8
79
(26,
389,
879 )
-
-
-
-
-
-
-
- C
ash
divi
dend
s to
shar
ehol
ders
- N
T$4.
5 pe
r sha
re
-
-
-
-
(116
,683
,481
)
(1
16,6
83,4
81 )
-
-
-
-
(116
,683
,481
)
-
(116
,683
,481
) To
tal
-
-
-
26
,389
,879
(1
43,0
73,3
60 )
(116
,683
,481
)
-
-
-
-
(1
16,6
83,4
81 )
-
(1
16,6
83,4
81 )
Net
inco
me
(loss
) in
2015
-
-
-
-
30
6,57
3,83
7
30
6,57
3,83
7
-
-
-
-
30
6,57
3,83
7
(1
7,67
0 )
306,
556,
167
Oth
er c
ompr
ehen
sive
inco
me
(loss
) in
2015
, net
of i
ncom
e ta
x
-
-
-
-
(7
30,9
02 )
(730
,902
)
6,
537,
836
(20,
512,
712 )
(3
02 )
(13,
975,
178 )
(1
4,70
6,08
0 )
(8,1
02 )
(14,
714,
182 )
To
tal c
ompr
ehen
sive
inco
me
(loss
) in
2015
-
-
-
-
30
5,84
2,93
5
30
5,84
2,93
5
6,
537,
836
(20,
512,
712 )
(3
02 )
(13,
975,
178 )
29
1,86
7,75
7
(2
5,77
2 )
291,
841,
985
Issu
ance
of s
tock
from
exe
rcise
of e
mpl
oyee
stoc
k op
tions
71
8
7,
181
130,
974
-
-
-
-
-
-
-
13
8,15
5
-
138,
155
Dis
posa
l of i
nves
tmen
ts a
ccou
nted
for u
sing
equ
ity m
etho
d
-
-
(4
7,85
0 )
-
-
-
-
-
-
-
(4
7,85
0 )
-
(4
7,85
0 )
Adj
ustm
ents
to sh
are
of c
hang
es in
equ
ities
of a
ssoc
iate
s and
join
t ven
ture
-
-
23
0,74
3
-
-
-
-
-
-
-
230,
743
(4,2
30 )
226,
513
From
diff
eren
ces b
etw
een
equi
ty p
urch
ase
pric
e an
d ca
rryi
ng a
mou
nt a
risin
g fr
om
actu
al a
cqui
sitio
n or
disp
osal
of s
ubsi
diar
ies
-
-
-
-
(31,
142 )
(3
1,14
2 )
-
-
-
-
(31,
142 )
31
,142
-
From
sha
re o
f cha
nges
in e
quiti
es o
f sub
sidi
arie
s
-
-
(3
,574
)
-
-
-
-
-
-
-
(3,5
74 )
3,57
4
-
Dec
reas
e in
non
cont
rolli
ng in
tere
sts
-
-
-
-
-
-
-
-
-
-
-
(5
0,21
8 )
(50,
218 )
Ef
fect
of a
cqui
sitio
n of
sub
sidi
ary
-
-
-
-
-
-
-
-
-
-
-
92
3,68
3
92
3,68
3
Ef
fect
of d
ispos
al o
f sub
sidi
ary
-
-
-
-
-
-
-
-
-
-
-
(4
2,64
0 )
(42,
640 )
B
ALA
NC
E, D
ECEM
BER
31,
201
5
25
,930
,380
25
9,30
3,80
5
56
,300
,215
17
7,64
0,56
1
71
6,65
3,02
5
89
4,29
3,58
6
11
,039
,949
73
4,77
1
(6
07 )
11,7
74,1
13
1,22
1,67
1,71
9
96
2,76
0
1,
222,
634,
479
App
ropr
iatio
ns o
f prio
r yea
r’s e
arni
ngs
Lega
l cap
ital r
eser
ve
-
-
-
30
,657
,384
(3
0,65
7,38
4 )
-
-
-
-
-
-
-
-
Cas
h di
vide
nds t
o sh
areh
olde
rs -
NT$
6.0
per s
hare
-
-
-
-
(1
55,5
82,2
83 )
(155
,582
,283
)
-
-
-
-
(1
55,5
82,2
83 )
-
(1
55,5
82,2
83 )
Tota
l
-
-
-
30,6
57,3
84
(186
,239
,667
)
(1
55,5
82,2
83 )
-
-
-
-
(155
,582
,283
)
-
(155
,582
,283
)
N
et in
com
e in
201
6
-
-
-
-
33
4,24
7,18
0
33
4,24
7,18
0
-
-
-
-
33
4,24
7,18
0
91
,056
33
4,33
8,23
6
O
ther
com
preh
ensi
ve in
com
e (lo
ss) i
n 20
16, n
et o
f inc
ome
tax
-
-
-
-
(950
,314
)
(9
50,3
14 )
(9,3
78,7
12 )
(732
,130
)
71
2
(1
0,11
0,13
0 )
(11,
060,
444 )
(6
,745
)
(1
1,06
7,18
9 )
Tota
l com
preh
ensi
ve in
com
e (lo
ss) i
n 20
16
-
-
-
-
333,
296,
866
333,
296,
866
(9,3
78,7
12 )
(732
,130
)
71
2
(1
0,11
0,13
0 )
323,
186,
736
84,3
11
323,
271,
047
Dis
posa
l of i
nves
tmen
ts a
ccou
nted
for u
sing
equ
ity m
etho
d
-
-
(5
6,16
9 )
-
-
-
-
-
-
-
(5
6,16
9 )
-
(5
6,16
9 )
Adj
ustm
ents
to sh
are
of c
hang
es in
equ
ities
of a
ssoc
iate
s and
join
t ven
ture
-
-
21
,221
-
-
-
-
-
-
-
21,2
21
9
21
,230
Fr
om s
hare
of c
hang
es in
equ
ities
of s
ubsi
diar
ies
-
-
7,03
7
-
-
-
-
-
-
-
7,03
7
(7
,037
)
-
Dec
reas
e in
non
cont
rolli
ng in
tere
sts
-
-
-
-
-
-
-
-
-
-
-
(2
35,2
24 )
(235
,224
)
Ef
fect
of d
ispos
al o
f sub
sidi
ary
-
-
-
-
-
-
-
-
-
-
-
(1
,954
)
(1
,954
)
B
ALA
NC
E, D
ECEM
BER
31,
201
6
25
,930
,380
$
259,
303,
805
$
56
,272
,304
$
208,
297,
945
$
86
3,71
0,22
4
$ 1
,072
,008
,169
$
1,66
1,23
7
$
2,64
1
$
105
$
1,
663,
983
$
1,3
89,2
48,2
61
$
80
2,86
5
$ 1
,390
,051
,126
Th
e ac
com
pany
ing
note
s are
an
inte
gral
par
t of t
he c
onso
lidat
ed fi
nanc
ial s
tate
men
ts.
- 11
-

- 12 -
Taiwan Semiconductor Manufacturing Company Limited and Subsidiaries CONSOLIDATED STATEMENTS OF CASH FLOWS (In Thousands of New Taiwan Dollars) 2016 2015
CASH FLOWS FROM OPERATING ACTIVITIES
Income before income tax $ 385,959,380 $ 350,428,911 Adjustments for:
Depreciation expense 220,084,998 219,303,369 Amortization expense 3,743,406 3,202,200 Finance costs 3,306,153 3,190,331 Share of profits of associates and joint venture (3,495,600) (4,132,128) Interest income (6,317,500) (4,129,316) Gain on disposal of property, plant and equipment, net (46,548) (433,559) Impairment loss on property, plant and equipment - 2,545,584 Impairment loss on intangible assets - 58,514 Impairment loss on financial assets 122,240 154,721 Loss (gain) on disposal of available-for-sale financial assets, net 4,014 (22,070,736) Gain on disposal of financial assets carried at cost, net (37,241) (87,193) Loss (gain) on disposal of investments accounted for using equity
method, net 259,960 (2,507,707) Loss from liquidation of subsidiaries 36,105 138,243 Unrealized (realized) gross profit on sales to associates 29,073 (15,126) Loss (gain) on foreign exchange, net (2,656,406) 2,563,439 Dividend income (137,401) (621,513) Loss (gain) from hedging instruments (12,725) 134,112 Loss (gain) arising from changes in fair value of available-for-sale
financial assets in hedge effective portion (4,248) 305,619 Gain from lease agreement modification - (430,041)
Changes in operating assets and liabilities: Financial instruments at fair value through profit or loss (6,326,561) (228,560) Notes and accounts receivable, net (49,342,698) 26,630,123 Receivables from related parties (463,837) (192,767) Other receivables from related parties (21,770) 53,607 Inventories 18,370,037 (655,249) Other financial assets (41,554) 720,301 Other current assets 94,512 263,384 Other noncurrent assets (349,771) - Accounts payable 7,295,491 (2,693,358) Payables to related parties 139,818 (369,134) Salary and bonus payable 1,979,775 945,030 Accrued profit sharing bonus to employees and compensation to
directors and supervisors 1,935,113 2,860,250 Accrued expenses and other current liabilities 3,693,638 (3,778,322) Provisions 7,931,877 (382,774) Net defined benefit liability 46,163 52,540
Cash generated from operations 585,777,893 570,822,795 Income taxes paid (45,943,301) (40,943,357)
Net cash generated by operating activities 539,834,592 529,879,438 (Continued)
- 12 -
- 13 -
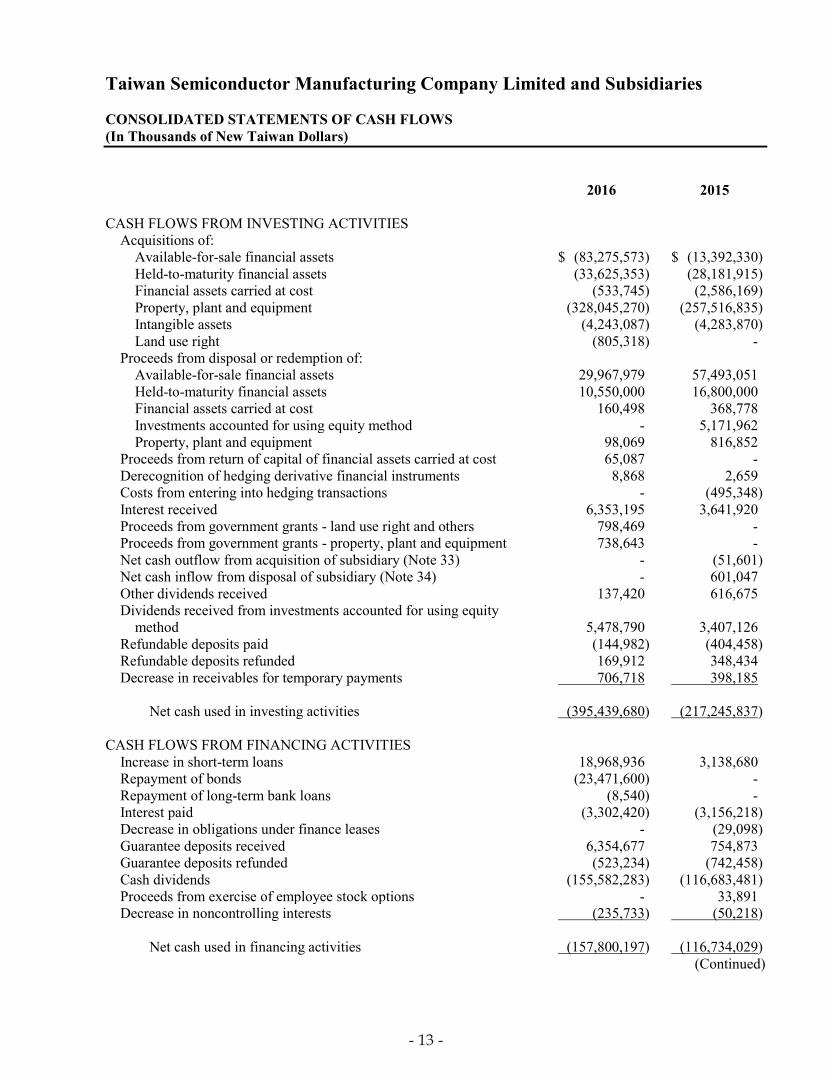
Taiwan Semiconductor Manufacturing Company Limited and Subsidiaries CONSOLIDATED STATEMENTS OF CASH FLOWS (In Thousands of New Taiwan Dollars) 2016 2015 CASH FLOWS FROM INVESTING ACTIVITIES
Acquisitions of: Available-for-sale financial assets $ (83,275,573) $ (13,392,330) Held-to-maturity financial assets (33,625,353) (28,181,915) Financial assets carried at cost (533,745) (2,586,169) Property, plant and equipment (328,045,270) (257,516,835) Intangible assets (4,243,087) (4,283,870) Land use right (805,318) -
Proceeds from disposal or redemption of: Available-for-sale financial assets 29,967,979 57,493,051 Held-to-maturity financial assets 10,550,000 16,800,000 Financial assets carried at cost 160,498 368,778 Investments accounted for using equity method - 5,171,962 Property, plant and equipment 98,069 816,852
Proceeds from return of capital of financial assets carried at cost 65,087 - Derecognition of hedging derivative financial instruments 8,868 2,659 Costs from entering into hedging transactions - (495,348) Interest received 6,353,195 3,641,920 Proceeds from government grants - land use right and others 798,469 - Proceeds from government grants - property, plant and equipment 738,643 - Net cash outflow from acquisition of subsidiary (Note 33) - (51,601) Net cash inflow from disposal of subsidiary (Note 34) - 601,047 Other dividends received 137,420 616,675 Dividends received from investments accounted for using equity
method 5,478,790 3,407,126 Refundable deposits paid (144,982) (404,458) Refundable deposits refunded 169,912 348,434 Decrease in receivables for temporary payments 706,718 398,185
Net cash used in investing activities (395,439,680) (217,245,837)
CASH FLOWS FROM FINANCING ACTIVITIES
Increase in short-term loans 18,968,936 3,138,680 Repayment of bonds (23,471,600) - Repayment of long-term bank loans (8,540) - Interest paid (3,302,420) (3,156,218) Decrease in obligations under finance leases - (29,098) Guarantee deposits received 6,354,677 754,873 Guarantee deposits refunded (523,234) (742,458) Cash dividends (155,582,283) (116,683,481) Proceeds from exercise of employee stock options - 33,891 Decrease in noncontrolling interests (235,733) (50,218)
Net cash used in financing activities (157,800,197) (116,734,029)
(Continued)
- 13 -
- 14 -
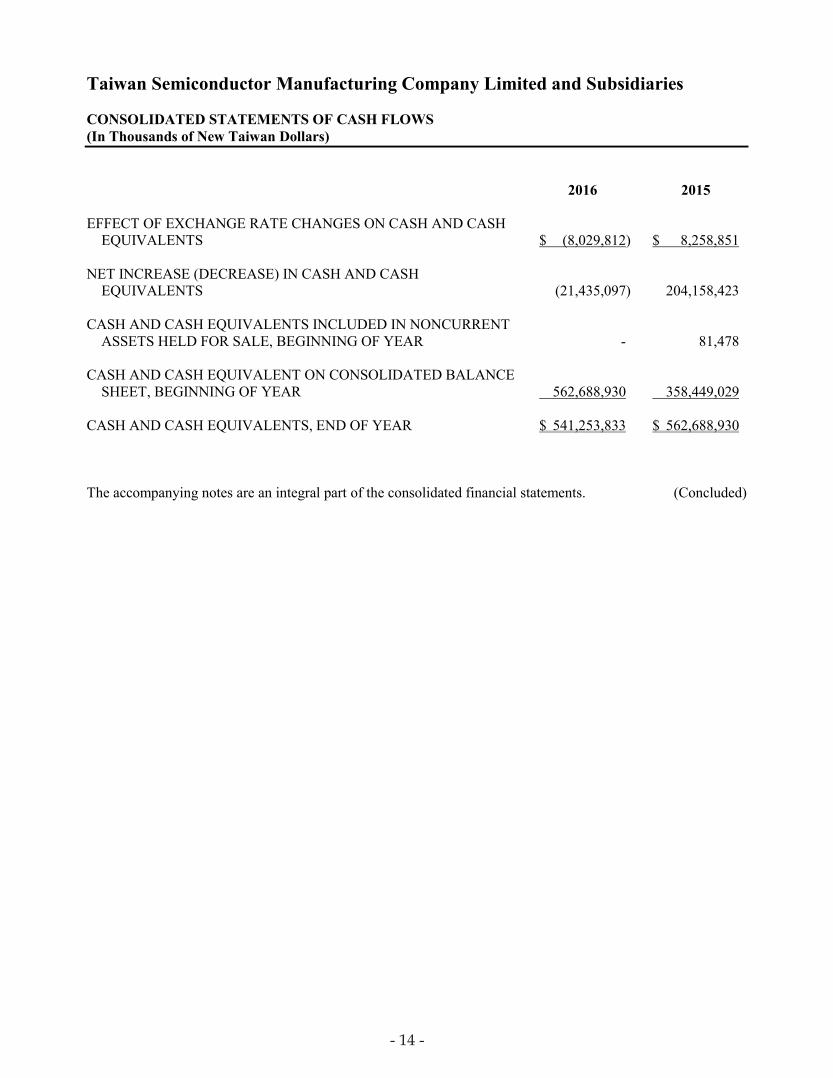
Taiwan Semiconductor Manufacturing Company Limited and Subsidiaries CONSOLIDATED STATEMENTS OF CASH FLOWS (In Thousands of New Taiwan Dollars) 2016 2015 EFFECT OF EXCHANGE RATE CHANGES ON CASH AND CASH
EQUIVALENTS $ (8,029,812) $ 8,258,851 NET INCREASE (DECREASE) IN CASH AND CASH
EQUIVALENTS (21,435,097) 204,158,423 CASH AND CASH EQUIVALENTS INCLUDED IN NONCURRENT
ASSETS HELD FOR SALE, BEGINNING OF YEAR - 81,478 CASH AND CASH EQUIVALENT ON CONSOLIDATED BALANCE
SHEET, BEGINNING OF YEAR 562,688,930 358,449,029 CASH AND CASH EQUIVALENTS, END OF YEAR $ 541,253,833 $ 562,688,930 The accompanying notes are an integral part of the consolidated financial statements. (Concluded)
- 14 -

- 15 -
Taiwan Semiconductor Manufacturing Company Limited and Subsidiaries NOTES TO CONSOLIDATED FINANCIAL STATEMENTS FOR THE YEARS ENDED DECEMBER 31, 2016 AND 2015 (Amounts in Thousands of New Taiwan Dollars, Unless Specified Otherwise) 1. GENERAL
Taiwan Semiconductor Manufacturing Company Limited (TSMC), a Republic of China (R.O.C.) corporation, was incorporated on February 21, 1987. TSMC is a dedicated foundry in the semiconductor industry which engages mainly in the manufacturing, selling, packaging, testing and computer-aided design of integrated circuits and other semiconductor devices and the manufacturing of masks. On September 5, 1994, TSMC’s shares were listed on the Taiwan Stock Exchange (TWSE). On October 8, 1997, TSMC listed some of its shares of stock on the New York Stock Exchange (NYSE) in the form of American Depositary Shares (ADSs). The address of its registered office and principal place of business is No. 8, Li-Hsin Rd. 6, Hsinchu Science Park, Taiwan. The principal operating activities of TSMC’s subsidiaries are described in Note 4.
2. THE AUTHORIZATION OF FINANCIAL STATEMENTS The accompanying consolidated financial statements were approved and authorized for issue by the Board of Directors on February 14, 2017.
3. APPLICATION OF NEW AND REVISED INTERNATIONAL FINANCIAL REPORTING STANDARDS
As of the date that the accompanying consolidated financial statements were authorized for issue, TSMC and its subsidiaries (collectively as the “Company”) have not applied the following amendments to the Regulations Governing the Preparation of Financial Reports by Securities Issuers and International Financial Reporting Standards (IFRS), International Accounting Standards (IAS), IFRIC Interpretations (IFRIC), and SIC Interpretations (SIC) issued by the International Accounting Standards Board (IASB) (collectively, “IFRSs”).
a. Amendments to the Regulations Governing the Preparation of Financial Reports by Securities Issuers
Rule No. 1050050021 issued by Financial Supervisory Commission (FSC) stipulated that starting January 1, 2017, the Company should apply the amendments to the Regulations Governing the Preparation of Financial Reports by Securities Issuers. The amendments include additions of several accounting items and requirements for disclosures of impairment of non-financial assets as a consequence of the IFRSs endorsed by the FSC for application starting from 2017. In addition, as a result of the post implementation review of IFRSs in Taiwan, the amendments also include emphasis on certain recognition and measurement considerations and add requirements for disclosures of related party transactions and goodwill. The amendments stipulate that other companies or institutions of which the chairman of the board of directors or president serves as the chairman of the board of directors or the president, or is the spouse or second immediate family of the chairman of the board of directors or president of the Company are deemed to have a substantive related party relationship, unless it can be demonstrated that no control, joint control, or significant influence exists. Furthermore, the amendments require the disclosure of the names of the related parties and the relationship with whom the Company has significant transaction.
- 15 -

- 16 -
If the transaction or balance with a specific related party is 10% or more of the Company’s respective total transaction or balance, such transaction should be separately disclosed by the name of each related party. The amendments also require additional disclosure if there is a significant difference between the actual operation after business combination and the expected benefits on acquisition date. The disclosures of related party transactions and impairment of goodwill will be enhanced when the above amendments are retrospectively applied in 2017. Except for the aforementioned impact, as of the date that the accompanying consolidated financial statements were authorized for issue, the Company continues in evaluating the impact on its financial position and financial performance as a result of amendments to the Regulations Governing the Preparation of Financial Reports by Securities Issuers. The related impact will be disclosed when the Company completes the evaluation.
b. The IFRSs in issue and endorsed by FSC with effective date starting 2017
According to Rule No. 1050026834 issued by the FSC, the following IFRSs issued by the IASB and endorsed by the FSC should be adopted by the Company starting 2017.
New, Revised or Amended Standards and Interpretations Effective Date Issued
by IASB (Note 1) Annual Improvements to IFRSs 2010 - 2012 Cycle July 1, 2014 or transactions
on or after July 1, 2014 Annual Improvements to IFRSs 2011 - 2013 Cycle July 1, 2014 Annual Improvements to IFRSs 2012 - 2014 Cycle January 1, 2016 (Note 2) Amendments to IFRS 10, IFRS 12 and IAS 28 “Investment Entities:
Applying the Consolidation Exception” January 1, 2016
Amendment to IFRS 11 “Accounting for Acquisitions of Interests in Joint Operations”
January 1, 2016
Amendment to IAS 1 “Disclosure Initiative” January 1, 2016 Amendments to IAS 16 and IAS 38 “Clarification of Acceptable Methods
of Depreciation and Amortization” January 1, 2016
Amendment to IAS 19 “Defined Benefit Plans: Employee Contributions” July 1, 2014 Amendment to IAS 27 “Equity Method in Separate Financial Statements” January 1, 2016 Amendment to IAS 36 “Recoverable Amount Disclosures for
Non-Financial Assets” January 1, 2014
Amendment to IAS 39 “Novation of Derivatives and Continuation of Hedge Accounting”
January 1, 2014
Note 1: The aforementioned new, revised or amended standards or interpretations are effective after
fiscal year beginning on or after the effective dates, unless specified otherwise. Note 2: The amendment to IFRS 5 is applied prospectively to changes in a method of disposal that
occur in annual periods beginning on or after January 1, 2016; the remaining amendments are effective for annual periods beginning on or after January 1, 2016.
- 16 -

- 17 -
Except for the following, the Company believes that the adoption of aforementioned IFRSs with effective date starting 2017 will not have a significant effect on the Company’s accounting policies:
1) Amendments to IAS 36, “Recoverable Amount Disclosures for Non-Financial Assets”
The amendments to IAS 36 clarify that the Company is required to disclose the recoverable amount of an asset or a cash-generating unit only when an impairment loss on the asset has been recognized or reversed during the period. Furthermore, if the recoverable amount for which impairment loss has been recognized or reversed is fair value less costs of disposal, the Company is required to disclose the fair value hierarchy. If the fair value measurements are categorized within Level 2 or Level 3, the valuation technique and key assumptions used to measure the fair value are disclosed. The discount rate used is disclosed if such fair value less costs of disposal is measured by using present value technique. The Company expects the aforementioned amendments will result in a broader disclosure of recoverable amount for non-financial assets.
Except for the aforementioned impact, as of the date that the accompanying consolidated financial statements were authorized for issue, the Company continues in evaluating the impact on its financial position and financial performance as a result of IFRSs with effective date starting 2017. The related impact will be disclosed when the Company completes the evaluation.
c. The IFRSs issued by IASB but not yet endorsed by FSC
The Company has not applied the following IFRSs issued by the IASB but not endorsed by the FSC. The FSC announced that the Company should apply IFRS 9 and IFRS 15 starting January 1, 2018. As of the date the consolidated financial statements were authorized for issue, the FSC has not announced the effective dates of other new IFRSs.
New, Revised or Amended Standards and Interpretations Effective Date Issued
by IASB (Note 3) Annual Improvements to IFRSs 2014-2016 Cycle Note 4 Amendment to IFRS 2 “Classification and Measurement of Share-based
Payment Transactions” January 1, 2018
IFRS 9 “Financial Instruments” January 1, 2018 Amendments to IFRS 9 and IFRS 7 “Mandatory Effective Date of IFRS 9
and Transition Disclosure” January 1, 2018
Amendments to IFRS 10 and IAS 28 “Sale or Contribution of Assets between an Investor and its Associate or Joint Venture”
To be determined by IASB
IFRS 15 “Revenue from Contracts with Customers” January 1, 2018 Amendment to IFRS 15 “Clarifications to IFRS 15” January 1, 2018 IFRS 16 “Leases” January 1, 2019 Amendment to IAS 7 “Disclosure Initiative” January 1, 2017 Amendment to IAS 12 “Recognition of Deferred Tax Assets for
Unrealized Losses” January 1, 2017
IFRIC 22 “Foreign Currency Transactions and Advance Consideration” January 1, 2018
Note 3: The aforementioned new, revised or amended standards or interpretations are effective after fiscal year beginning on or after the effective dates, unless specified otherwise.
Note 4: The amendment to IFRS 12 is retrospectively applied for annual periods beginning on or after
January 1, 2017; the amendment to IAS 28 is retrospectively applied for annual periods beginning on or after January 1, 2018.
- 17 -
- 18 -
Except for the following items, the Company believes that the adoption of aforementioned standards or interpretations will not have a significant effect on the Company’s accounting policies. 1) IFRS 9, “Financial Instruments”
All recognized financial assets currently in the scope of IAS 39, “Financial Instruments: Recognition and Measurement,” will be subsequently measured at either the amortized cost or the fair value. The classification and measurement requirements in IFRS 9 are stated as follows: For the debt instruments invested by the Company, if the contractual cash flows that are solely for payments of principal and interest on the principal amount outstanding, the classification and measurement requirements are stated as follows: a) If the objective of the Company’s business model is to hold the financial asset to collect the
contractual cash flows, such assets are measured at the amortized cost. Interest revenue should be recognized in profit or loss by using the effective interest method, continuously assessed for impairment and the impairment loss or reversal of impairment loss should be recognized in profit and loss.
b) If the objective of the Company’s business model is to hold the financial asset both to collect
the contractual cash flows and to sell the financial assets, such assets are measured at fair value through other comprehensive income and are continuously assessed for impairment. Interest revenue should be recognized in profit or loss by using the effective interest method. A gain or loss on a financial asset measured at fair value through other comprehensive income should be recognized in other comprehensive income, except for impairment gains or losses and foreign exchange gains and losses. When such financial asset is derecognized or reclassified, the cumulative gain or loss previously recognized in other comprehensive income is reclassified from equity to profit or loss.
The other financial assets which do not meet the aforementioned criteria should be measured at the fair value through profit or loss. However, the Company may irrevocably designate an investment in equity instruments that is not held for trading as measured at fair value through other comprehensive income. All relevant gains and losses shall be recognized in other comprehensive income, except for dividends which are recognized in profit or loss. No subsequent impairment assessment is required, and the cumulative gain or loss previously recognized in other comprehensive income cannot be reclassified from equity to profit or loss. IFRS 9 adds a new expected loss impairment model to measure the impairment of financial assets. A loss allowance for expected credit losses should be recognized on financial assets measured at amortized cost and financial assets mandatorily measured at fair value through other comprehensive income. If the credit risk on a financial instrument has not increased significantly since initial recognition, the Company should measure the loss allowance for that financial instrument at an amount equal to 12-month expected credit losses. If the credit risk on a financial instrument has increased significantly since initial recognition and is not deemed to be a low credit risk, the Company should measure the loss allowance for that financial instrument at an amount equal to the lifetime expected credit losses. The Company should always measure the loss allowance at an amount equal to lifetime expected credit losses for trade receivables. The main changes in hedge accounting amended the application requirements for hedge accounting to better reflect the entity’s risk management activities. Compared with IAS 39, the main changes include: (1) enhancing types of transactions eligible for hedge accounting, specifically broadening the risks eligible for hedge accounting of non-financial items; (2) changing the way hedging derivative instruments are accounted for to reduce profit or loss volatility; and (3) replacing retrospective effectiveness assessment with the principle of economic relationship between the hedging instrument and the hedged item.
- 18 -

- 19 -
2) IFRS 15, “Revenue from Contracts with Customers” and related amendment
IFRS 15 establishes principles for recognizing revenue that apply to all contracts with customers, and will supersede IAS 18, “Revenue,” IAS 11, “Construction Contracts,” and a number of revenue-related interpretations. When applying IFRS 15, the Company shall recognize revenue by applying the following steps:
Identify the contract with the customer; Identify the performance obligations in the contract; Determine the transaction price; Allocate the transaction price to the performance obligations in the contracts; and Recognize revenue when the entity satisfies a performance obligation.
When IFRS 15 and related amendment are effective, the Company may elect to apply this Standard either retrospectively to each prior reporting period presented or retrospectively with the cumulative effect of initially applying this Standard recognized at the date of initial application.
3) IFRS 16, “Leases”
IFRS 16 sets out the accounting standards for leases that will supersede IAS 17 and a number of related interpretations. Under IFRS 16, if the Company is a lessee, it shall recognize right-of-use assets and lease liabilities for all leases on the consolidated balance sheets except for low-value and short-term leases. The Company may elect to apply the accounting method similar to the accounting for operating lease under IAS 17 to the low-value and short-term leases. On the consolidated statements of comprehensive income, the Company should present the depreciation expense charged on the right-of-use asset separately from interest expense accrued on the lease liability; interest is computed by using effective interest method. On the consolidated statements of cash flows, cash payments for both the principal and interest portion of the lease liability are classified within financing activities. When IFRS 16 becomes effective, the Company may elect to apply this Standard either retrospectively to each prior reporting period presented or retrospectively with the cumulative effect of the initial application of this Standard recognized at the date of initial application.
Except for the aforementioned impact, as of the date that the accompanying consolidated financial statements were authorized for issue, the Company continues in evaluating the impact on its financial position and financial performance as a result of the initial adoption of the other standards or interpretations. The related impact will be disclosed when the Company completes the evaluation.
4. SUMMARY OF SIGNIFICANT ACCOUNTING POLICIES
For the convenience of readers, the accompanying consolidated financial statements have been translated into English from the original Chinese version prepared and used in the R.O.C. If there is any conflict between the English version and the original Chinese version or any difference in the interpretation of the two versions, the Chinese-language consolidated financial statements shall prevail.
- 19 -

- 20 -
Statement of Compliance The accompanying consolidated financial statements have been prepared in conformity with the Regulations Governing the Preparation of Financial Reports by Securities Issuers and the IFRSs endorsed by the FSC with the effective dates (collectively, “Taiwan-IFRSs”). Basis of Preparation The accompanying consolidated financial statements have been prepared on the historical cost basis except for financial instruments that are measured at fair values, as explained in the accounting policies below. Historical cost is generally based on the fair value of the consideration given in exchange for the assets.
Basis of Consolidation The basis for the consolidated financial statements The consolidated financial statements incorporate the financial statements of TSMC and entities controlled by TSMC (its subsidiaries). Income and expenses of subsidiaries acquired or disposed of are included in the consolidated statement of comprehensive income from the effective date of acquisition and up to the effective date of disposal, as appropriate. Total comprehensive income of subsidiaries is attributed to the shareholders of the parent and to the noncontrolling interests even if this results in the noncontrolling interests having a deficit balance. When necessary, adjustments are made to the financial statements of subsidiaries to bring their accounting policies into line with those used by the Company. All intra-group transactions, balances, income and expenses are eliminated in full on consolidation. Changes in the Company’s ownership interests in subsidiaries that do not result in the Company losing control over the subsidiaries are accounted for as equity transactions. The carrying amounts of the Company’s interests and the noncontrolling interests are adjusted to reflect the changes in their relative interests in the subsidiaries. Any difference between the amount by which the noncontrolling interests are adjusted and the fair value of the consideration paid or received is recognized directly in equity and attributed to shareholders of the parent. When the Company loses control of a subsidiary, a gain or loss is recognized in profit or loss and is calculated as the difference between: a. the aggregate of the fair value of consideration received and the fair value of any retained interest at the
date when control is lost; and b. the previous carrying amount of the assets (including goodwill), and liabilities of the subsidiary and any
noncontrolling interest. The Company shall account for all amounts recognized in other comprehensive income in relation to the subsidiary on the same basis as would be required if the Company had directly disposed of the related assets and liabilities. The fair value of any investment retained in the former subsidiary at the date when control is lost is regarded as the cost on initial recognition of an investment in an associate.
- 20 -

- 21 -
The subsidiaries in the consolidated financial statements The detail information of the subsidiaries at the end of reporting period was as follows:
Establishment Percentage of Ownership
Name of Investor Name of Investee Main Businesses and Products and Operating
Location December 31,
2016 December 31,
2015 Note TSMC TSMC North America Selling and marketing of integrated circuits
and semiconductor devices San Jose, California,
U.S.A. 100% 100% -
TSMC Japan Limited (TSMC Japan)
Marketing activities Yokohama, Japan 100% 100% a)
TSMC Partners, Ltd. (TSMC Partners)
Investing in companies involved in the design, manufacture, and other related business in the semiconductor industry
Tortola, British Virgin Islands
100% 100% a)
TSMC Korea Limited (TSMC Korea)
Customer service and technical supporting activities
Seoul, Korea 100% 100% a)
TSMC Europe B.V. (TSMC Europe)
Marketing and engineering supporting activities
Amsterdam, the Netherlands
100% 100% a)
TSMC Global, Ltd. (TSMC Global)
Investment activities Tortola, British Virgin Islands
100% 100% -
TSMC China Company Limited (TSMC China)
Manufacturing and selling of integrated circuits at the order of and pursuant to product design specifications provided by customers
Shanghai, China 100% 100% -
TSMC Nanjing Company Limited (TSMC Nanjing)
Manufacturing and selling of integrated circuits at the order of and pursuant to product design specifications provided by customers
Nanjing, China 100% - b)
VentureTech Alliance Fund III, L.P. (VTAF III)
Investing in new start-up technology companies
Cayman Islands 98% 98% a)
VentureTech Alliance Fund II, L.P. (VTAF II)
Investing in new start-up technology companies
Cayman Islands 98% 98% a)
Emerging Alliance Fund, L.P. (Emerging Alliance)
Investing in new start-up technology companies
Cayman Islands - 99.5% a), c)
TSMC Solar Europe GmbH Selling of solar related products and providing customer service
Hamburg, Germany 100% 100% a), d)
Chi Cherng Investment Co., Ltd. (Chi Cherng)
Investment activities Taipei, Taiwan - 100% e), f)
VisEra Technologies Company Ltd. (VisEra Tech)
Engaged in manufacturing electronic spare parts and in researching, developing, designing, manufacturing, selling, packaging and testing of color filter
Hsin-Chu, Taiwan 87% -
e) , g)
TSMC Partners TSMC Design Technology Canada Inc. (TSMC Canada)
Engineering support activities Ontario, Canada 100% 100% a)
TSMC Technology, Inc. (TSMC Technology)
Engineering support activities Delaware, U.S.A. 100% 100% a)
TSMC Development, Inc. (TSMC Development)
Investment activities Delaware, U.S.A. 100% 100% -
InveStar Semiconductor Development Fund, Inc. (ISDF)
Investing in new start-up technology companies
Cayman Islands 97% 97% a) , h)
InveStar Semiconductor Development Fund, Inc. (II) LDC. (ISDF II)
Investing in new start-up technology companies
Cayman Islands 97% 97% a) , h)
VisEra Holding Company (VisEra Holding)
Investing in companies involved in the design, manufacturing and other related businesses in the semiconductor industry
Cayman Islands - 98% a), e), g)
TSMC Development WaferTech, LLC (WaferTech)
Manufacturing, selling, testing and computer-aided designing of integrated circuits and other semiconductor devices
Washington, U.S.A. 100% 100% -
VTAF III Mutual-Pak Technology Co., Ltd. (Mutual-Pak)
Manufacturing of electronic parts, wholesaling and retailing of electronic materials, and researching, developing and testing of RFID
New Taipei, Taiwan 58% 58% a)
Growth Fund Limited (Growth Fund)
Investing in new start-up technology companies
Cayman Islands 100% 100% a)
VTAF III, VTAF II and Emerging Alliance
VentureTech Alliance Holdings, LLC (VTA Holdings)
Investing in new start-up technology companies
Delaware, U.S.A. - 100% a) , c)
VTAF III, VTAF II and TSMC
VentureTech Alliance Holdings, LLC (VTA Holdings)
Investing in new start-up technology companies
Delaware, U.S.A. 100% -
a) , c)
VisEra Holding VisEra Tech Engaged in manufacturing electronic spare parts and in researching, developing, designing, manufacturing, selling, packaging and testing of color filter
Hsin-Chu, Taiwan - 87% e), g)
Note a: This is an immaterial subsidiary for which the consolidated financial statements are not audited by the Company’s independent accountants. Note b: Under the investment agreement entered into with the municipal government of Nanjing, China on March 28, 2016, the Company will make an investment in Nanjing in the amount of
approximately US$3 billion to establish a subsidiary managing a 300mm wafer fab with the capacity of 20,000 12-inch wafers per month, and a design service center. TSMC Nanjing was established in May 2016.
Note c: Due to the expiration of the investment agreement between Emerging Alliance and TSMC, Emerging Alliance completed the liquidation procedures in April 2016. Emerging Alliance’s
ownership in VTA Holdings is held directly by TSMC. Note d: In August 2015, TSMC Solar Ltd. (TSMC Solar) ceased its manufacturing operations. TSMC Solar and TSMC Guang Neng Investment, Ltd. (TSMC GN) were incorporated into TSMC
in December 2015. After the incorporation, TSMC Solar Europe GmbH, the subsidiary of TSMC Solar, is held directly by TSMC and TSMC Solar Europe GmbH has started the liquidation procedures. TSMC Solar North America, Inc. (TSMC Solar NA), the subsidiary of TSMC Solar, completed the liquidation procedures in December 2015.
Note e: The Company acquired OmniVision Technologies, Inc.’s (OVT’s) 49.1% ownership in VisEra Holding and 100% ownership in Taiwan OmniVision Investment Holding Co. (OVT
Taiwan) on November 20, 2015. As a result, the Company has obtained controls of VisEra Holding and OVT Taiwan; therefore the Company has consolidated VisEra Holding, OVT Taiwan and VisEra Tech, held directly by VisEra Holding, since November 20, 2015. Please refer to Note 33.
Note f: OVT Taiwan that originally acquired by the Company was renamed as Chi Cherng in December 2015. Chi Cherng was incorporated into TSMC in December 2016. Note g: To simplify investment structure, VisEra Tech owned by VisEra Holding was transferred to TSMC in the third quarter of 2016. In October 2016, VisEra Holding was incorporated into
TSMC Partners, the subsidiary of TSMC.
- 21 -

- 22 -
Note h: ISDF and ISDF II have started the liquidation procedures.
Foreign Currencies The financial statements of each individual consolidated entity were expressed in the currency which reflected its primary economic environment (functional currency). The functional currency of TSMC and presentation currency of the consolidated financial statements are both New Taiwan Dollars (NT$). In preparing the consolidated financial statements, the operating results and financial positions of each consolidated entity are translated into NT$. In preparing the financial statements of each individual consolidated entity, transactions in currencies other than the entity’s functional currency (foreign currencies) are recognized at the rates of exchange prevailing at the dates of the transactions. At the end of each reporting period, monetary items denominated in foreign currencies are retranslated at the rates prevailing at that date. Such exchange differences are recognized in profit or loss in the year in which they arise. Non-monetary items measured at fair value that are denominated in foreign currencies are retranslated at the rates prevailing at the date when the fair value was determined. Exchange differences arising on the retranslation of non-monetary items are included in profit or loss for the year except for exchange differences arising on the retranslation of non-monetary items in respect of which gains and losses are recognized directly in other comprehensive income, in which case, the exchange differences are also recognized directly in other comprehensive income. Non-monetary items that are measured in terms of historical cost in foreign currencies are not retranslated. For the purposes of presenting consolidated financial statements, the assets and liabilities of the Company’s foreign operations are translated into NT$ using exchange rates prevailing at the end of each reporting period. Income and expense items are translated at the average exchange rates for the period. Exchange differences arising, if any, are recognized in other comprehensive income and accumulated in equity (attributed to noncontrolling interests as appropriate).
Classification of Current and Noncurrent Assets and Liabilities Current assets are assets held for trading purposes and assets expected to be converted to cash, sold or consumed within one year from the end of the reporting period. Current liabilities are obligations incurred for trading purposes and obligations expected to be settled within one year from the end of the reporting period. Assets and liabilities that are not classified as current are noncurrent assets and liabilities, respectively. Cash Equivalents Cash equivalents, for the purpose of meeting short-term cash commitments, consist of highly liquid time deposits and investments that are readily convertible to known amounts of cash and which are subject to an insignificant risk of changes in value. Financial Instruments Financial assets and liabilities shall be recognized when the Company becomes a party to the contractual provisions of the instruments. Financial assets and liabilities are initially recognized at fair values. Transaction costs that are directly attributable to the acquisition or issue of financial assets and financial liabilities (other than financial assets and financial liabilities at fair value through profit or loss) are added to or deducted from the fair value of the financial assets or financial liabilities, as appropriate, on initial recognition. Transaction costs directly attributable to the acquisition of financial assets or financial liabilities at fair value through profit or loss are recognized immediately in profit or loss.
- 22 -

- 23 -
Financial Assets Financial assets are classified into the following specified categories: Financial assets “at fair value through profit or loss” (FVTPL), “held-to-maturity” financial assets, “available-for-sale” financial assets and “loans and receivables”. The classification depends on the nature and purpose of the financial assets and is determined at the time of initial recognition. Regular way purchases or sales of financial assets are recognized and derecognized on a trade date or settlement date basis for which financial assets were classified in the same way, respectively. Regular way purchases or sales are purchases or sales of financial assets that require delivery of assets within the time frame established by regulation or convention in the marketplace. Financial assets at fair value through profit or loss Financial assets are classified as at fair value through profit or loss when the financial asset is either held for trading or it is designated as at fair value through profit or loss. Financial assets at fair value through profit or loss are stated at fair value, with any gains or losses arising on remeasurement recognized in profit or loss. Held-to-maturity financial assets Held-to-maturity investments are non-derivative financial assets with fixed or determinable payments and fixed maturity dates that the Company has the positive intent and ability to hold to maturity. Subsequent to initial recognition, held-to-maturity financial assets are measured at amortized cost using the effective interest method less any impairment. Available-for-sale financial assets Available-for-sale financial assets are non-derivative financial assets that are either designated as available-for-sale or are not classified as (a) loans and receivables, (b) held-to-maturity financial assets or (c) financial assets at fair value through profit or loss. Available-for-sale financial assets are measured at fair value. Interest income from available-for-sale monetary financial assets and dividends on available-for-sale equity investments are recognized in profit or loss. Other changes in the carrying amount of available-for-sale financial assets are recognized in other comprehensive income. When the investment is disposed of or is determined to be impaired, the cumulative gain or loss previously recognized in other comprehensive income is reclassified to profit or loss. Dividends on available-for-sale equity instruments are recognized in profit or loss when the Company’s right to receive the dividends is established. Available-for-sale equity instruments that do not have a quoted market price in an active market and whose fair value cannot be reliably measured are measured at cost less any identified impairment losses at the end of each reporting period. Such equity instruments are subsequently remeasured at fair value when their fair value can be reliably measured, and the difference between the carrying amount and fair value is recognized in profit or loss or other comprehensive income. Loans and receivables Loans and receivables are non-derivative financial assets with fixed or determinable payments that are not quoted in an active market. Loans and receivables including cash and cash equivalents, notes and accounts receivable and other receivables are measured at amortized cost using the effective interest method, less any impairment, except for those loans and receivables with immaterial discounted effect.
- 23 -

- 24 -
Impairment of financial assets Financial assets, other than those carried at FVTPL, are assessed for indicators of impairment at the end of each reporting period. Those financial assets are considered to be impaired when there is objective evidence that, as a result of one or more events that occurred after the initial recognition of the financial assets, their estimated future cash flows have been affected. For financial assets carried at amortized cost, such as trade receivables, assets that are assessed not to be impaired individually are, in addition, assessed for impairment on a collective basis. The Company assesses the collectability of receivables by performing the account aging analysis and examining current trends in the credit quality of its customers. For financial assets carried at amortized cost, the amount of the impairment loss is the difference between the asset’s carrying amount and the present value of estimated future cash flows, discounted at the financial asset’s original effective interest rate. For financial assets measured at amortized cost, if, in a subsequent period, the amount of the impairment loss decreases and the decrease can be related objectively to an event occurring after the impairment loss was recognized, the previously recognized impairment loss is reversed through profit or loss to the extent that the carrying amount of the financial assets at the date the impairment loss is reversed does not exceed what the amortized cost would have been had the impairment loss not been recognized. When an available-for-sale financial asset is considered to be impaired, cumulative gains or losses previously recognized in other comprehensive income are reclassified to profit or loss in the year. In respect of available-for-sale equity instruments, impairment losses previously recognized in profit or loss are not reversed through profit or loss. Any increase in fair value subsequent to the recognition of an impairment loss is recognized in other comprehensive income and accumulated under the heading of unrealized gains or losses from available-for-sale financial assets. For financial assets carried at cost, the amount of the impairment loss is measured as the difference between the asset’s carrying amount and the present value of the estimated future cash flows discounted at the current market rate of return for a similar financial asset. Such impairment loss will not be reversed in subsequent periods. The carrying amount of the financial asset is reduced by the impairment loss directly for all financial assets with the exception of trade receivables, where the carrying amount is reduced through the use of an allowance account. When a trade receivable is considered uncollectible, it is written off against the allowance account. Subsequent recoveries of amounts previously written off are credited against the allowance account. Derecognition of financial assets The Company derecognizes a financial asset only when the contractual rights to the cash flows from the financial asset expire, or when it transfers the financial asset and substantially all the risks and rewards of ownership of the financial asset to another entity. On derecognition of a financial asset in its entirety, the difference between the financial asset’s carrying amount and the sum of the consideration received and receivable and the cumulative gain or loss that had been recognized in other comprehensive income and accumulated in equity is recognized in profit or loss.
- 24 -

- 25 -
Financial Liabilities and Equity Instruments Classification as debt or equity Debt and equity instruments issued by the Company are classified as either financial liabilities or as equity in accordance with the substance of the contractual arrangements and the definitions of a financial liability and an equity instrument. Equity instruments An equity instrument is any contract that evidences a residual interest in the assets of an entity after deducting all of its liabilities. Equity instruments issued by the Company are recognized at the proceeds received, net of direct issue costs. Financial liabilities Financial liabilities are subsequently measured either at amortized cost using effective interest method or at FVTPL. Financial liabilities are classified as at fair value through profit or loss when the financial liability is either held for trading or is designated as at fair value through profit or loss. Financial liabilities at fair value through profit or loss are stated at fair value, with any gains or losses arising on remeasurement recognized in profit or loss. Financial liabilities other than those held for trading purposes and designated as at FVTPL are subsequently measured at amortized cost at the end of each reporting period. Derecognition of financial liabilities The Company derecognizes financial liabilities when, and only when, the Company’s obligations are discharged, cancelled or they expire. The difference between the carrying amount of the financial liability derecognized and the consideration paid and payable is recognized in profit or loss. Derivative Financial Instruments Derivative financial instruments are initially recognized at fair value at the date the derivative contracts are entered into and are subsequently remeasured to their fair value at the end of each reporting period. The resulting gain or loss is recognized in profit or loss immediately unless the derivative financial instrument is designated and effective as a hedging instrument, in which event the timing of the recognition in profit or loss depends on the nature of the hedge relationship. Financial Instruments Designated as at Fair Value through Profit or Loss A financial instrument may be designated as at fair value through profit or loss (FVTPL) upon initial recognition. The financial instrument forms part of a group of financial assets or financial liabilities or both, which is managed and its performance is evaluated on a fair value basis, in accordance with the Company’s documented risk management or investment strategy, and information about the grouping is provided internally on that basis. Hedge Accounting The Company designates certain hedging instruments, which include stock forward contracts and interest rate futures contracts in respect of foreign currency risk, as fair value hedge. Changes in the fair value of derivatives that are designated and qualify as fair value hedges are recognized in profit or loss immediately. Hedge accounting is discontinued prospectively when the Company revokes the designated hedging
- 25 -

- 26 -
relationship, or when the hedging instrument expires or is sold, terminated, or exercised, or when it no longer meets the criteria for hedge accounting. The effective portion of changes in the fair value of derivative financial instruments that are designated and qualify as cash flow hedges is recognized in other comprehensive income and accumulated under the heading of cash flow hedges reserve. Amounts previously recognized in other comprehensive income and accumulated in equity are reclassified to profit or loss in the period when the hedged item is recognized in profit or loss. Inventories Inventories are stated at the lower of cost or net realizable value. Inventories are recorded at standard cost and adjusted to approximate weighted-average cost at the end of the reporting period. Net realizable value represents the estimated selling price of inventories less all estimated costs of completion and costs necessary to make the sale. Noncurrent Assets Held for Sale Noncurrent assets or disposal groups are classified as noncurrent assets held for sale if their carrying amount will be recovered principally through a sale transaction rather than through continuing use. This condition is regarded as met only when the sale is highly probable and the noncurrent asset held for sale is available for immediate sale in its present condition. To meet the criteria for the sale being highly probable, the appropriate level of management must be committed to the sale, which should be expected to qualify for recognition as a completed sale within one year from the date of classification. When the committed sale plan involves loss of control of a subsidiary, all of the assets and liabilities of that subsidiary are classified as held for sale, regardless of whether a noncontrolling interest in its former subsidiary is retained after the sale.
Noncurrent assets classified as held for sale are measured at the lower of their previous carrying amount and fair value less costs to sell. Recognition of depreciation would cease. Investments Accounted for Using Equity Method Investments accounted for using the equity method include investments in associates and interests in joint venture. An associate is an entity over which the Company has significant influence and that is neither a subsidiary nor a joint venture. Significant influence is the power to participate in the financial and operating policy decisions of the investee but is not control or joint control over those policies. A joint venture is a joint arrangement whereby the Company and other parties that have joint control of the arrangement have rights to the net assets of the joint arrangement. Joint control is the contractually agreed sharing of control of an arrangement, which exists only when decisions about the relevant activities require unanimous consent of the parties sharing control. The operating results and assets and liabilities of associates and joint venture are incorporated in these consolidated financial statements using the equity method of accounting. Under the equity method, an investment in an associate or a joint venture is initially recognized in the consolidated statement of financial position at cost and adjusted thereafter to recognize the Company’s share of profit or loss and other comprehensive income of the associate and joint venture as well as the distribution received. The Company also recognizes its share in the changes in the equities of associates and joint venture.
- 26 -

- 27 -
Any excess of the cost of acquisition over the Company’s share of the net fair value of the identifiable assets, liabilities and contingent liabilities of an associate or a joint venture recognized at the date of acquisition is recognized as goodwill, which is included within the carrying amount of the investment. Any excess of the Company’s share of the net fair value of the identifiable assets, liabilities and contingent liabilities over the cost of acquisition, after reassessment, is recognized immediately in profit or loss. When necessary, the entire carrying amount of the investment (including goodwill) is tested for impairment as a single asset by comparing its recoverable amount (higher of value in use and fair value less costs to sell) with its carrying amount. Any impairment loss recognized forms part of the carrying amount of the investment. Any reversal of that impairment loss is recognized to the extent that the recoverable amount of the investment subsequently increases. The Company discontinues the use of the equity method from the date when the Company ceases to have significant influence over an associate. When the Company retains an interest in the former associate, the Company measures the retained interest at fair value at that date. The difference between the carrying amount of the associate at the date the equity method was discontinued, and the fair value of any retained interest and any proceeds from disposing of a part interest in the associate is included in the determination of the gain or loss on disposal of the associate. In addition, the Company shall account for all amounts recognized in other comprehensive income in relation to that associate on the same basis as would be required if the associate had directly disposed of the related assets or liabilities. If the Company’s ownership interest in an associate is reduced as a result of disposal, but the investment continues to be an associate, the Company should reclassify to profit or loss only a proportionate amount of the gain or loss previously recognized in other comprehensive income.
When the Company subscribes to additional shares in an associate or a joint venture at a percentage different from its existing ownership percentage, the resulting carrying amount of the investment differs from the amount of the Company’s proportionate interest in the net assets of the associate or joint venture. The Company records such a difference as an adjustment to investments with the corresponding amount charged or credited to capital surplus. If the Company’s ownership interest is reduced due to the additional subscription to the shares of associate or joint venture by other investors, the proportionate amount of the gains or losses previously recognized in other comprehensive income in relation to that associate or joint venture shall be reclassified to profit or loss on the same basis as would be required if the associate or joint venture had directly disposed of the related assets or liabilities. When a consolidated entity transacts with an associate or a joint venture, profits and losses resulting from the transactions with the associate or joint venture are recognized in the Company’s consolidated financial statements only to the extent of interests in the associate or joint venture that are not owned by the Company. Property, Plant and Equipment Property, plant and equipment are measured at cost less accumulated depreciation and accumulated impairment. Costs include any incremental costs that are directly attributable to the construction or acquisition of the item of property, plant and equipment. Properties in the course of construction for production, supply or administrative purposes are carried at cost, less any recognized impairment loss. Such properties are classified to the appropriate categories of property, plant and equipment when completed and ready for intended use. Depreciation of these assets, on the same basis as other property assets, commences when the assets are ready for their intended use. Depreciation is recognized so as to write off the cost of the assets less their residual values over their useful lives, and it is computed using the straight-line method over the following estimated useful lives: land improvements - 20 years; buildings - 5 to 20 years; machinery and equipment - 2 to 5 years; office equipment - 3 to 15 years; and leased assets - 20 years. The estimated useful lives, residual values and depreciation method are reviewed at the end of each reporting period, with the effect of any changes in estimates accounted for on a prospective basis. Land is not depreciated.
- 27 -

- 28 -
Assets held under finance leases are depreciated over their expected useful lives on the same basis as owned assets. However, when there is no reasonable certainty that ownership will be obtained by the end of the lease term, assets are depreciated over the shorter of the lease term and their useful lives. An item of property, plant and equipment is derecognized upon disposal or when no future economic benefits are expected to arise from the continued use of the assets. Any gain or loss arising on the disposal or retirement of an item of property, plant and equipment is determined as the difference between the sales proceeds and the carrying amount of the asset and is recognized in profit or loss. Leases Leases are classified as finance lease whenever the terms of the lease transfer substantially all the risks and rewards of ownership to the lessee. All other leases are classified as operating leases. The Company as lessor Rental income from operating leases is recognized on a straight-line basis over the term of the relevant lease. The Company as lessee Assets held under finance lease are initially recognized as assets of the Company at the fair value at the inception of the lease or, if lower, at the present value of the minimum lease payments. The corresponding liability to the lessor is included in the consolidated balance sheet as an obligation under finance lease. Lease payments are apportioned between finance expense and reduction of the lease obligation so as to achieve a constant rate of interest on the remaining balance of the liability. Operating lease payments are recognized as an expense on a straight-line basis over the lease term. Intangible Assets Goodwill Goodwill arising on an acquisition of a business is carried at cost as established at the date of acquisition of the business less accumulated impairment losses, if any. Other intangible assets Other separately acquired intangible assets with finite useful lives are carried at cost less accumulated amortization and accumulated impairment losses. Amortization is recognized using the straight-line method over the following estimated useful lives: Technology license fees - the estimated life of the technology or the term of the technology transfer contract; software and system design costs - 3 years or contract period; patent and others - the economic life or contract period. The estimated useful life and amortization method are reviewed at the end of each reporting period, with the effect of any changes in estimate being accounted for on a prospective basis. Impairment of Tangible and Intangible Assets Goodwill Goodwill is not amortized and instead is tested for impairment annually, or more frequently when there is an indication that the cash generating unit may be impaired. For the purpose of impairment testing, goodwill is allocated to each of the Company’s cash-generating units or groups of cash-generating units
- 28 -

- 29 -
that are expected to benefit from the synergies of the combination. If the recoverable amount of a cash-generating unit is less than its carrying amount, the difference is allocated first to reduce the carrying amount of any goodwill allocated to such cash generating unit and then to the other assets of the cash generating unit pro rata based on the carrying amount of each asset in the cash generating unit. Any impairment loss for goodwill is recognized directly in profit or loss. An impairment loss recognized for goodwill is not reversed in subsequent periods. Other tangible and intangible assets At the end of each reporting period, the Company reviews the carrying amounts of its tangible and intangible assets to determine whether there is any indication that those assets have suffered an impairment loss. If any such indication exists, the recoverable amount of the asset is estimated in order to determine the extent of the impairment loss. When it is not possible to estimate the recoverable amount of an individual asset, the Company estimates the recoverable amount of the cash-generating unit to which the asset belongs. When a reasonable and consistent basis of allocation can be identified, corporate assets are also allocated to individual cash-generating units, or otherwise they are allocated to the smallest group of cash-generating units for which a reasonable and consistent allocation basis can be identified. Recoverable amount is the higher of fair value less costs to sell and value in use. In assessing value in use, the estimated future cash flows are discounted to their present value using a pre-tax discount rate that reflects current market assessments of the time value of money and the risks specific to the asset for which the estimates of future cash flows have not been adjusted. If the recoverable amount of an asset or cash-generating unit is estimated to be less than its carrying amount, the carrying amount of the asset or cash-generating unit is reduced to its recoverable amount. An impairment loss is recognized immediately in profit or loss. When an impairment loss subsequently reverses, the carrying amount of the asset or a cash-generating unit is increased to the revised estimate of its recoverable amount, but the increased carrying amount does not exceed the carrying amount that would have been determined had no impairment loss been recognized for the asset or cash-generating unit in prior years. A reversal of an impairment loss is recognized immediately in profit or loss. Provision Provisions are recognized when the Company has a present obligation (legal or constructive) as a result of a past event, it is probable that the Company will be required to settle the obligation, and a reliable estimate can be made of the amount of the obligation. The amount recognized as a provision is the best estimate of the consideration required to settle the present obligation at the end of the reporting period, taking into account the risks and uncertainties surrounding the obligation. When a provision is measured using the cash flows estimated to settle the present obligation, its carrying amount is the present value of those cash flows. Guarantee Deposit Guarantee deposit mainly consists of cash received under deposit agreements with customers to ensure they have access to the Company’s specified capacity; and as guarantee of accounts receivable to ensure payment from customers. Cash received from customers is recorded as guarantee deposit upon receipt. Guarantee deposits are refunded to customers when terms and conditions set forth in the deposit agreements have been satisfied. Revenue Recognition Revenue is measured at the fair value of the consideration received or receivable. Revenue is reduced for estimated customer returns, rebates and other similar allowances.
- 29 -

- 30 -
Sale of goods Revenue from the sale of goods is recognized when the goods are delivered and titles have passed, at which time all the following conditions are satisfied:
The Company has transferred to the buyer the significant risks and rewards of ownership of the goods; The Company retains neither continuing managerial involvement to the degree usually associated with
ownership nor effective control over the goods sold; The amount of revenue can be measured reliably; It is probable that the economic benefits associated with the transaction will flow to the Company; and The costs incurred or to be incurred in respect of the transaction can be measured reliably.
In principle, payment term granted to customers is due 30 days from the invoice date or 30 days from the end of the month of when the invoice is issued. Due to the short term nature of the receivables from sale of goods with the immaterial discounted effect, the Company measures them at the original invoice amounts without discounting. Royalties, dividend and interest income Revenue from royalties is recognized on an accrual basis in accordance with the substance of the relevant agreement, provided that it is probable that the economic benefits will flow to the Company and the amount of revenue can be measured reliably. Dividend income from investments is recognized when the shareholder’s right to receive payment has been established, provided that it is probable that the economic benefits will flow to the Company and the amount of income can be measured reliably. Interest income from a financial asset is recognized when it is probable that the economic benefits will flow to the Company and the amount of income can be measured reliably. Interest income is accrued on a time basis, by reference to the principal outstanding and at the effective interest rate applicable. Employee Benefits Short-term employee benefits Liabilities recognized in respect of short-term employee benefits are measured at the undiscounted amount of the benefits expected to be paid in exchange for service rendered by employees. Retirement benefits For defined contribution retirement benefit plans, payments to the benefit plan are recognized as an expense when the employees have rendered service entitling them to the contribution. For defined benefit retirement benefit plans, the cost of providing benefit is recognized based on actuarial calculations. Defined benefit costs (including service cost, net interest and remeasurement) under the defined benefit retirement benefit plans are determined using the Projected Unit Credit Method. Service cost (including current service cost), and net interest on the net defined benefit liability (asset) are recognized as employee benefits expense in the period they occur. Remeasurement, comprising actuarial gains and losses and the return on plan assets (excluding interest), is recognized in other comprehensive income in the period in which they occur. Remeasurement recognized in other comprehensive income is reflected immediately in retained earnings and will not be reclassified to profit or loss. Net defined benefit liability represents the actual deficit in the Company’s defined benefit plan.
- 30 -

- 31 -
Share-based Payment Arrangements The Company elected to take the optional exemption under IFRS 1 for the share-based payment transactions granted and vested before January 1, 2012, the date of transition to Taiwan-IFRSs. There were no stock options granted prior to but unvested at the date of transition. The compensation costs of employee stock options that were granted after January 1, 2012 are measured at the fair value of the stock options at the grant date. The fair value of the stock option granted determined at the grant date of the stock options is expensed on a straight-line basis over the vesting period, based on the Company’s estimate of the number of stock options that will eventually vest, with a corresponding increase in capital surplus - employee stock option. The estimate is revised if subsequent information indicates that the number of stock options expected to vest differs from original estimates. Taxation Income tax expense represents the sum of the tax currently payable and deferred tax. Current tax Income tax on unappropriated earnings (excluding earnings from foreign consolidated subsidiaries) at a rate of 10% is expensed in the year the shareholders approved the appropriation of earnings which is the year subsequent to the year the earnings are generated. Adjustments of prior years’ tax liabilities are added to or deducted from the current year’s tax provision. Deferred tax Deferred tax is recognized on temporary differences between the carrying amounts of assets and liabilities in the consolidated financial statements and the corresponding tax bases used in the computation of taxable profit. Deferred tax liabilities are generally recognized for all taxable temporary differences. Deferred tax assets are generally recognized for all deductible temporary differences, net operating loss carryforwards and unused tax credits to the extent that it is probable that taxable profits will be available against which those deductible temporary differences can be utilized. Deferred tax liabilities are recognized for taxable temporary differences associated with investments in subsidiaries and associates, and interests in joint venture, except where the Company is able to control the reversal of the temporary difference and it is probable that the temporary difference will not reverse in the foreseeable future. Deferred tax assets arising from deductible temporary differences associated with such investments are only recognized to the extent that it is probable that there will be sufficient taxable profits against which to utilize the benefits of the temporary differences and they are expected to reverse in the foreseeable future. The carrying amount of deferred tax assets is reviewed at the end of each reporting period and reduced to the extent that it is no longer probable that sufficient taxable profits will be available to allow all or part of the deferred tax asset to be recovered. The deferred tax assets which originally not recognized is also reviewed at the end of each reporting period and recognized to the extent that it is probable that sufficient taxable profits will be available to allow all or part of the deferred tax asset to be recovered. Deferred tax liabilities and assets are measured at the tax rates that are expected to apply in the year in which the liability is settled or the asset is realized, based on tax rates (and tax laws) that have been enacted or substantively enacted by the end of the reporting period. The measurement of deferred tax liabilities and assets reflects the tax consequences that would follow from the manner in which the Company expects, at the end of the reporting period, to recover or settle the carrying amount of its assets and liabilities.
- 31 -
- 32 -
Current and deferred tax for the year Current and deferred tax are recognized in profit or loss, except when they relate to items that are recognized in other comprehensive income or directly in equity, in which case, the current and deferred tax are also recognized in other comprehensive income or directly in equity, respectively. Business Combinations
Acquisitions of businesses are accounted for using the acquisition method. Acquisition-related costs are generally recognized in profit or loss as incurred.
Goodwill is measured as the excess of the sum of the consideration transferred, the amount of any noncontrolling interests in the acquiree, and the fair value of the acquirer’s previously held equity interest in the acquiree over the net of the acquisition-date amounts of the identifiable assets acquired and the liabilities assumed. Noncontrolling interests are initially measured at the noncontrolling interests’ proportionate share of the fair value of the acquiree’s identifiable net assets. When a business combination is achieved in stages, the Company’s previously held equity interest in the acquiree is remeasured to fair value at the acquisition date, and the resulting gain or loss is recognized in profit or loss. Insurance Claim The Company recognizes insurance claim reimbursement for losses incurred related to disaster damages. Insurance claim reimbursements are recorded, net of any deductible amounts, at the time while there is evidence that the claim reimbursement is virtually certain to be received. Government Grants Government grants are not recognized until there is reasonable assurance that the Company will comply with the conditions attaching to them and that the grants will be received. Government grants whose primary condition is that the Company should purchase, construct or otherwise acquire non-current assets (mainly including land use right and depreciable assets) are recognized as a deduction from the carrying amount of the related assets and recognized as a reduced depreciation or amortization charge in profit or loss over the contract period or useful lives of the related assets. Government grants that are receivables as compensation for expenses already incurred are deducted from incurred expenses in the period in which they become receivables.
5. CRITICAL ACCOUNTING JUDGMENTS AND KEY SOURCES OF ESTIMATION AND
UNCERTAINTY In the application of the aforementioned Company’s accounting policies, the directors are required to make judgments, estimates and assumptions about the carrying amounts of assets and liabilities that are not readily apparent from other sources. The estimates and associated assumptions are based on historical experience and other factors that are considered to be relevant. Actual results may differ from these estimates. The estimates and underlying assumptions are reviewed on an ongoing basis. Revisions to accounting estimates are recognized in the year in which the estimate is revised if the revision affects only that year, or in the year of the revision and future years if the revision affects both current and future years.
- 32 -
- 33 -
The following are the critical judgments, apart from those involving estimations, that the directors have made in the process of applying the Company’s accounting policies and that have the most significant effect on the amounts recognized in the consolidated financial statements. Revenue Recognition The Company recognizes revenue when the conditions described in Note 4 are satisfied. The Company also records a provision for estimated future returns and other allowances in the same period the related revenue is recorded. Provision for estimated sales returns and other allowances is generally made and adjusted based on historical experience and the consideration of varying contractual terms, and our management periodically reviews the adequacy of the estimation used. Impairment of Tangible and Intangible Assets Other than Goodwill In the process of evaluating the potential impairment of tangible and intangible assets other than goodwill, the Company is required to make subjective judgments in determining the independent cash flows, useful lives, expected future revenue and expenses related to the specific asset groups with the consideration of the nature of semiconductor industry. Any changes in these estimates based on changed economic conditions or business strategies could result in significant impairment charges or reversal in future years. Impairment of Goodwill The assessment of impairment of goodwill requires the Company to make subjective judgment to determine the identified cash-generating units, allocate the goodwill to relevant cash-generating units and estimate the recoverable amount of relevant cash-generating units. Impairment Assessment on Investment Using Equity Method The Company assesses the impairment of investments accounted for using the equity method whenever triggering events or changes in circumstances indicate that an investment may be impaired and carrying value may not be recoverable. The Company measures the impairment based on a projected future cash flow of the investees, including the underlying assumptions of sales growth rate and capacity utilization rate formulated by such investees’ internal management team. The Company also takes into account market conditions and the relevant industry trends to ensure the reasonableness of such assumptions. Realization of Deferred Income Tax Assets Deferred tax assets are recognized to the extent that it is probable that future taxable profits will be available against which those deferred tax assets can be utilized. Assessment of the realization of the deferred tax assets requires the Company’s subjective judgment and estimate, including the future revenue growth and profitability, tax holidays, the amount of tax credits can be utilized and feasible tax planning strategies. Any changes in the global economic environment, the industry trends and relevant laws and regulations could result in significant adjustments to the deferred tax assets. Valuation of Inventory Inventories are stated at the lower of cost or net realizable value, and the Company uses judgment and estimate to determine the net realizable value of inventory at the end of each reporting period. Due to the rapid technological changes, the Company estimates the net realizable value of inventory for obsolescence and unmarketable items at the end of reporting period and then writes down the cost of inventories to net realizable value. The net realizable value of the inventory is mainly determined based on assumptions of future demand within a specific time horizon.
- 33 -

- 34 -
Recognition and Measurement of Defined Benefit Plans Net defined benefit liability and the resulting defined benefit costs under defined benefit pension plans are calculated using the Projected Unit Credit Method. Actuarial assumptions comprise the discount rate, rate of employee turnover, and future salary increase rate. Changes in economic circumstances and market conditions will affect these assumptions and may have a material impact on the amount of the expense and the liability.
6. CASH AND CASH EQUIVALENTS
December 31,
2016 December 31,
2015 Cash and deposits in banks $ 536,895,344 $ 557,270,910 Repurchase agreements collateralized by corporate bonds 2,361,250 5,132,778 Commercial paper 1,997,239 - Repurchase agreements collateralized by government bonds - 285,242 $ 541,253,833 $ 562,688,930
Deposits in banks consisted of highly liquid time deposits that were readily convertible to known amounts of cash and were subject to an insignificant risk of changes in value.
7. FINANCIAL ASSETS AND LIABILITIES AT FAIR VALUE THROUGH PROFIT OR LOSS
December 31,
2016 December 31,
2015 Financial assets Held for trading
Forward exchange contracts $ 142,406 $ 6,026 Cross currency swap contracts 10,976 - 153,382 6,026
Designated as at FVTPL Time deposit 6,297,708 - Forward exchange contracts 22 - 6,297,730 -
$ 6,451,112 $ 6,026 Financial liabilities Held for trading
Forward exchange contracts $ 91,585 $ 72,610 Designated as at FVTPL
Forward exchange contracts 99,550 - $ 191,135 $ 72,610
- 34 -

- 35 -
The Company entered into derivative contracts to manage exposures due to fluctuations of foreign exchange rates. The derivative contracts entered into by the Company did not meet the criteria for hedge accounting. Therefore, the Company did not apply hedge accounting treatment for derivative contracts. Outstanding forward exchange contracts consisted of the following: Contract Amount Maturity Date (In Thousands) December 31, 2016 Sell NT$/Buy EUR January 2017 NT$5,393,329/EUR159,400 Sell NT$/Buy JPY January 2017 NT$7,314,841/JPY26,501,800 Sell US$/Buy EUR January 2017 US$4,180/EUR4,000 Sell US$/Buy JPY January 2017 US$428/JPY50,000 Sell US$/Buy NT$ January 2017 to February 2017 US$439,000/NT$14,138,202 Sell US$/Buy RMB January 2017 to June 2017 US$421,750/RMB2,908,380 December 31, 2015 Sell US$/Buy JPY January 2016 US$128,418/JPY15,449,355 Sell US$/Buy RMB January 2016 US$226,000/RMB1,464,472 Sell US$/Buy NT$ January 2016 to February 2016 US$440,000/NT$14,434,179 Outstanding cross currency swap contracts consisted of the following:
Maturity Date
Contract Amount
(In Thousands)
Range of Interest Rates
Paid
Range of Interest Rates
Received December 31, 2016 January 2017 US$170,000/NT$5,487,600 3.98% -
8. AVAILABLE-FOR-SALE FINANCIAL ASSETS
December 31,
2016 December 31,
2015 Corporate bonds $ 29,999,508 $ 6,267,768 Agency bonds 14,880,482 2,627,367 Corporate issued asset-backed securities 11,254,757 3,154,366 Government bonds 8,457,362 878,377 Publicly traded stocks 3,196,658 1,371,483 $ 67,788,767 $ 14,299,361
- 35 -

- 36 -
9. HELD-TO-MATURITY FINANCIAL ASSETS
December 31,
2016 December 31,
2015 Corporate bonds/Bank debentures $ 23,849,701 $ 8,143,146 Commercial paper 8,628,176 - Negotiable certificate of deposit 4,829,850 4,934,250 Structured product 1,609,950 3,000,000 $ 38,917,677 $ 16,077,396 Current portion $ 16,610,116 $ 9,166,523 Noncurrent portion 22,307,561 6,910,873 $ 38,917,677 $ 16,077,396
10. HEDGING DERIVATIVE FINANCIAL INSTRUMENTS
December 31,
2016 December 31,
2015 Financial assets- current Fair value hedges
Interest rate futures contracts $ 5,550 $ 1,739
The Company entered into interest rate futures contracts, which are used to hedge against price risk caused by changes in interest rates in the Company’s investments in fixed income securities. The outstanding interest rate futures contracts consisted of the following:
Maturity Period Contract Amount
(US$ in Thousands) December 31, 2016 March 2017 US$ 53,600 December 31, 2015 March 2016 US$ 13,800
11. NOTES AND ACCOUNTS RECEIVABLE, NET
December 31,
2016 December 31,
2015 Notes and accounts receivable $ 128,815,389 $ 85,547,926 Allowance for doubtful receivables (480,118) (488,251) Notes and accounts receivable, net $ 128,335,271 $ 85,059,675
- 36 -

- 37 -
In principle, the payment term granted to customers is due 30 days from the invoice date or 30 days from the end of the month of when the invoice is issued. The allowance for doubtful receivables is assessed by reference to the collectability of receivables by performing the account aging analysis, historical experience and current financial condition of customers. Except for those impaired, for the rest of the notes and accounts receivable, the account aging analysis at the end of the reporting period is summarized in the following table. Notes and accounts receivable include amounts that are past due but for which the Company has not recognized a specific allowance for doubtful receivables after the assessment since there has not been a significant change in the credit quality of its customers and the amounts are still considered recoverable. In addition, the Company has obtained guarantee to certain receivables. Aging analysis of notes and accounts receivable, net
December 31,
2016 December 31,
2015 Neither past due nor impaired $ 108,411,408 $ 71,482,666 Past due but not impaired
Past due within 30 days 15,017,824 13,577,009 Past due 31-60 days 1,844,726 - Past due 61-120 days 3,061,313 -
$ 128,335,271 $ 85,059,675
Movements of the allowance for doubtful receivables Individually
Assessed for Impairment
Collectively Assessed for Impairment Total
Balance at January 1, 2016 $ 10,241 $ 478,010 $ 488,251 Provision - 321 321 Reversal/Write-off (8,393) - (8,393) Effect of exchange rate changes - (61) (61) Balance at December 31, 2016 $ 1,848 $ 478,270 $ 480,118 Balance at January 1, 2015 $ 8,093 $ 478,637 $ 486,730 Provision 28,593 4,814 33,407 Reversal/Write-off (29,065) (4,737) (33,802) Effect of acquisition of subsidiary 1,847 - 1,847 Effect of exchange rate changes 773 (704) 69 Balance at December 31, 2015 $ 10,241 $ 478,010 $ 488,251 Aging analysis of accounts receivable that is individually determined as impaired
December 31,
2016 December 31,
2015 Past due over 121 days $ 1,848 $ 10,241
- 37 -

- 38 -
12. INVENTORIES
December 31,
2016 December 31,
2015 Finished goods $ 8,521,873 $ 7,974,902 Work in process 33,330,870 53,632,056 Raw materials 4,012,190 3,038,756 Supplies and spare parts 2,817,300 2,406,556 $ 48,682,233 $ 67,052,270 Write-down of inventories to net realizable value (excluding earthquake losses) in the amount of NT$1,542,779 thousand and NT$464,361 thousand, respectively, were included in the cost of revenue for the years ended December 31, 2016 and 2015. Please refer to related earthquake losses in Note 41.
13. FINANCIAL ASSETS CARRIED AT COST
December 31,
2016 December 31,
2015 Non-publicly traded stocks $ 2,944,859 $ 3,268,100 Mutual funds 1,157,608 722,782 $ 4,102,467 $ 3,990,882
Since there is a wide range of estimated fair values of the Company’s investments in non-publicly traded stocks, the Company concludes that the fair value cannot be reliably measured and therefore should be measured at the cost less any impairment. The stocks of Impinj, Inc. and Richwave Technology Corp. were listed in July 2016 and November 2015, respectively. Accordingly, the Company reclassified the aforementioned investments from financial assets carried at cost to available-for-sale financial assets.
14. INVESTMENTS ACCOUNTED FOR USING EQUITY METHOD
a. Investments in associates
Associates consisted of the following:
Place of
Carrying Amount % of Ownership and Voting
Rights Held by the Company
Name of Associate Principal Activities Incorporation and Operation
December 31, 2016
December 31, 2015
December 31, 2016
December 31, 2015
Vanguard International
Semiconductor Corporation (VIS)
Research, design, development, manufacture, packaging, testing and sale of memory integrated circuits, LSI, VLSI and related parts
Hsinchu, Taiwan $ 8,806,384 $ 8,446,054 28% 28%
Systems on Silicon Manufacturing Company Pte Ltd. (SSMC)
Fabrication and supply of integrated circuits
Singapore 7,163,516 9,511,515 39% 39%
Xintec Inc. (Xintec) Wafer level chip size packaging service
Taoyuan, Taiwan 2,599,807 2,928,362 41% 41%
(Continued)
- 38 -
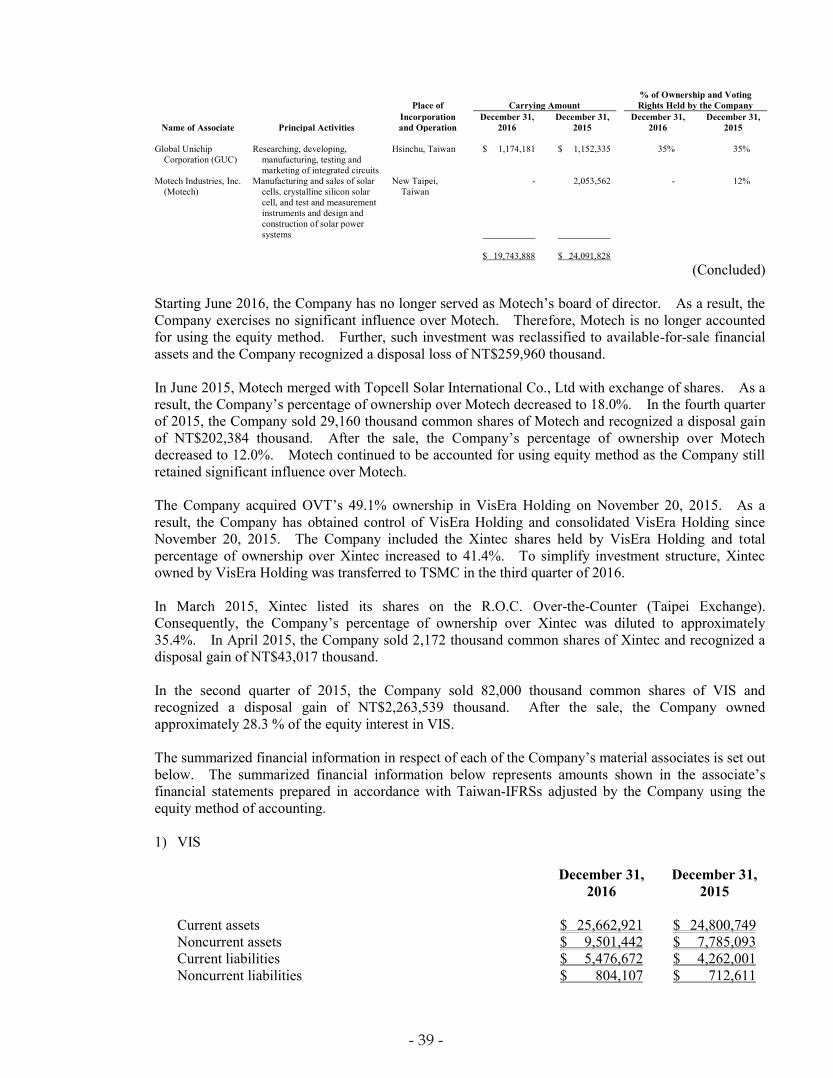
- 39 -
Place of
Carrying Amount
% of Ownership and Voting Rights Held by the Company
Name of Associate Principal Activities Incorporation and Operation
December 31, 2016
December 31, 2015
December 31, 2016
December 31, 2015
Global Unichip
Corporation (GUC) Researching, developing,
manufacturing, testing and marketing of integrated circuits
Hsinchu, Taiwan $ 1,174,181
$ 1,152,335
35% 35%
Motech Industries, Inc. (Motech)
Manufacturing and sales of solar cells, crystalline silicon solar cell, and test and measurement instruments and design and construction of solar power systems
New Taipei, Taiwan
-
2,053,562
- 12%
$ 19,743,888 $ 24,091,828
(Concluded) Starting June 2016, the Company has no longer served as Motech’s board of director. As a result, the Company exercises no significant influence over Motech. Therefore, Motech is no longer accounted for using the equity method. Further, such investment was reclassified to available-for-sale financial assets and the Company recognized a disposal loss of NT$259,960 thousand. In June 2015, Motech merged with Topcell Solar International Co., Ltd with exchange of shares. As a result, the Company’s percentage of ownership over Motech decreased to 18.0%. In the fourth quarter of 2015, the Company sold 29,160 thousand common shares of Motech and recognized a disposal gain of NT$202,384 thousand. After the sale, the Company’s percentage of ownership over Motech decreased to 12.0%. Motech continued to be accounted for using equity method as the Company still retained significant influence over Motech. The Company acquired OVT’s 49.1% ownership in VisEra Holding on November 20, 2015. As a result, the Company has obtained control of VisEra Holding and consolidated VisEra Holding since November 20, 2015. The Company included the Xintec shares held by VisEra Holding and total percentage of ownership over Xintec increased to 41.4%. To simplify investment structure, Xintec owned by VisEra Holding was transferred to TSMC in the third quarter of 2016. In March 2015, Xintec listed its shares on the R.O.C. Over-the-Counter (Taipei Exchange). Consequently, the Company’s percentage of ownership over Xintec was diluted to approximately 35.4%. In April 2015, the Company sold 2,172 thousand common shares of Xintec and recognized a disposal gain of NT$43,017 thousand. In the second quarter of 2015, the Company sold 82,000 thousand common shares of VIS and recognized a disposal gain of NT$2,263,539 thousand. After the sale, the Company owned approximately 28.3 % of the equity interest in VIS.
The summarized financial information in respect of each of the Company’s material associates is set out below. The summarized financial information below represents amounts shown in the associate’s financial statements prepared in accordance with Taiwan-IFRSs adjusted by the Company using the equity method of accounting. 1) VIS
December 31,
2016 December 31,
2015 Current assets $ 25,662,921 $ 24,800,749 Noncurrent assets $ 9,501,442 $ 7,785,093 Current liabilities $ 5,476,672 $ 4,262,001 Noncurrent liabilities $ 804,107 $ 712,611
- 39 -

- 40 -
Years Ended December 31 2016 2015 Net revenue $ 25,828,634 $ 23,319,721 Income from operations $ 6,083,625 $ 4,593,430 Net income $ 5,520,645 $ 4,139,031 Other comprehensive income (loss) $ 5,592 $ (61,886) Total comprehensive income $ 5,526,237 $ 4,077,145 Cash dividends received $ 1,206,981 $ 1,206,414
Reconciliation of the above summarized financial information to the carrying amount of the interest in the associate recognized in the consolidated balance sheets was as follows:
December 31,
2016 December 31,
2015 Net assets $ 28,883,584 $ 27,611,230 Percentage of ownership 28% 28% The Company’s share of net assets of the associate 8,179,830 7,819,500 Goodwill 626,554 626,554 Carrying amount of the investment $ 8,806,384 $ 8,446,054
2) SSMC
December 31,
2016 December 31,
2015 Current assets $ 14,585,150 $ 20,078,179 Noncurrent assets $ 5,360,076 $ 6,144,263 Current liabilities $ 1,746,602 $ 1,954,057 Noncurrent liabilities $ 286,340 $ 303,217
Years Ended December 31 2016 2015 Net revenue $ 14,045,927 $ 15,026,016 Income from operations $ 4,921,735 $ 5,802,261 Net income $ 4,918,140 $ 5,904,586 Total comprehensive income $ 4,918,140 $ 5,904,586 Cash dividends received $ 4,076,170 $ 1,556,592
Reconciliation of the above summarized financial information to the carrying amount of the interest in the associate recognized in the consolidated balance sheets was as follows:
December 31,
2016 December 31,
2015 Net assets $ 17,912,284 $ 23,965,168 Percentage of ownership 39% 39% The Company’s share of net assets of the associate 6,948,175 9,296,089 Goodwill 213,984 213,984 Other adjustments 1,357 1,442 Carrying amount of the investment $ 7,163,516 $ 9,511,515
- 40 -
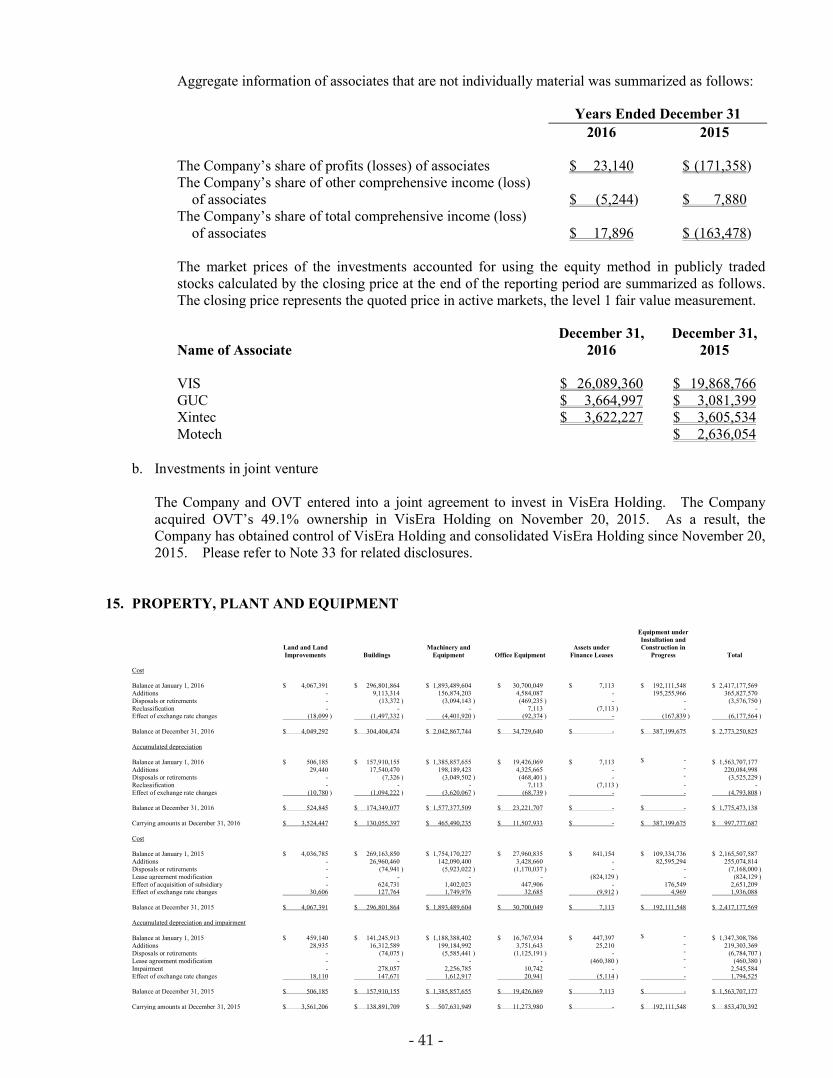
- 41 -
Aggregate information of associates that are not individually material was summarized as follows: Years Ended December 31 2016 2015 The Company’s share of profits (losses) of associates $ 23,140 $ (171,358) The Company’s share of other comprehensive income (loss)
of associates
$ (5,244)
$ 7,880 The Company’s share of total comprehensive income (loss)
of associates
$ 17,896
$ (163,478)
The market prices of the investments accounted for using the equity method in publicly traded stocks calculated by the closing price at the end of the reporting period are summarized as follows. The closing price represents the quoted price in active markets, the level 1 fair value measurement.
Name of Associate December 31,
2016 December 31,
2015 VIS $ 26,089,360 $ 19,868,766 GUC $ 3,664,997 $ 3,081,399 Xintec $ 3,622,227 $ 3,605,534 Motech $ 2,636,054
b. Investments in joint venture
The Company and OVT entered into a joint agreement to invest in VisEra Holding. The Company acquired OVT’s 49.1% ownership in VisEra Holding on November 20, 2015. As a result, the Company has obtained control of VisEra Holding and consolidated VisEra Holding since November 20, 2015. Please refer to Note 33 for related disclosures.
15. PROPERTY, PLANT AND EQUIPMENT
Land and Land Improvements Buildings
Machinery and Equipment Office Equipment
Assets under Finance Leases
Equipment under Installation and Construction in
Progress Total Cost Balance at January 1, 2016 $ 4,067,391 $ 296,801,864 $ 1,893,489,604 $ 30,700,049 $ 7,113 $ 192,111,548 $ 2,417,177,569 Additions - 9,113,314 156,874,203 4,584,087 - 195,255,966 365,827,570 Disposals or retirements - (13,372 ) (3,094,143 ) (469,235 ) - - (3,576,750 ) Reclassification - - - 7,113 (7,113 ) - - Effect of exchange rate changes (18,099 ) (1,497,332 ) (4,401,920 ) (92,374 ) - (167,839 ) (6,177,564 ) Balance at December 31, 2016 $ 4,049,292 $ 304,404,474 $ 2,042,867,744 $ 34,729,640 $ - $ 387,199,675 $ 2,773,250,825 Accumulated depreciation Balance at January 1, 2016 $ 506,185 $ 157,910,155 $ 1,385,857,655 $ 19,426,069 $ 7,113 $ - $ 1,563,707,177 Additions 29,440 17,540,470 198,189,423 4,325,665 - - 220,084,998 Disposals or retirements - (7,326 ) (3,049,502 ) (468,401 ) - - (3,525,229 ) Reclassification - - - 7,113 (7,113 ) - - Effect of exchange rate changes (10,780 ) (1,094,222 ) (3,620,067 ) (68,739 ) - - (4,793,808 )
Balance at December 31, 2016 $ 524,845 $ 174,349,077 $ 1,577,377,509 $ 23,221,707 $ - $ - $ 1,775,473,138 Carrying amounts at December 31, 2016 $ 3,524,447 $ 130,055,397 $ 465,490,235 $ 11,507,933 $ - $ 387,199,675 $ 997,777,687 Cost Balance at January 1, 2015 $ 4,036,785 $ 269,163,850 $ 1,754,170,227 $ 27,960,835 $ 841,154 $ 109,334,736 $ 2,165,507,587 Additions - 26,960,460 142,090,400 3,428,660 - 82,595,294 255,074,814 Disposals or retirements - (74,941 ) (5,923,022 ) (1,170,037 ) - - (7,168,000 ) Lease agreement modification - - - - (824,129 ) - (824,129 ) Effect of acquisition of subsidiary - 624,731 1,402,023 447,906 - 176,549 2,651,209 Effect of exchange rate changes 30,606 127,764 1,749,976 32,685 (9,912 ) 4,969 1,936,088 Balance at December 31, 2015 $ 4,067,391 $ 296,801,864 $ 1,893,489,604 $ 30,700,049 $ 7,113 $ 192,111,548 $ 2,417,177,569 Accumulated depreciation and impairment Balance at January 1, 2015 $ 459,140 $ 141,245,913 $ 1,188,388,402 $ 16,767,934 $ 447,397 $ - $ 1,347,308,786 Additions 28,935 16,312,589 199,184,992 3,751,643 25,210 - 219,303,369 Disposals or retirements - (74,075 ) (5,585,441 ) (1,125,191 ) - - (6,784,707 ) Lease agreement modification - - - - (460,380 ) - (460,380 ) Impairment - 278,057 2,256,785 10,742 - - 2,545,584 Effect of exchange rate changes 18,110 147,671 1,612,917 20,941 (5,114 ) - 1,794,525
Balance at December 31, 2015 $ 506,185 $ 157,910,155 $ 1,385,857,655 $ 19,426,069 $ 7,113 $ - $ 1,563,707,177 Carrying amounts at December 31, 2015 $ 3,561,206 $ 138,891,709 $ 507,631,949 $ 11,273,980 $ - $ 192,111,548 $ 853,470,392
- 41 -

- 42 -
The significant part of the Company’s buildings includes main plants, mechanical and electrical power equipment and clean rooms, and the related depreciation is calculated using the estimated useful lives of 20 years, 10 years and 10 years, respectively. For the year ended December 31, 2015, the Company recognized an impairment loss of NT$259,568 thousand under foundry segment since the carrying amount of some of property, plant and equipment was expected to be unrecoverable. Such impairment loss was included in other operating income and expenses. In August 2015, TSMC Solar ceased its manufacturing operations. In the third quarter of 2015, the Company recognized an impairment loss of NT$2,286,016 thousand since the carrying amounts of certain machinery and equipment, office equipment and mechanical and electrical power equipment were not expected to be recoverable. Such impairment loss was included in other operating income and expenses. The Company had a building lease agreement with leasing terms from December 2003 to November 2018 and such lease was accounted for as a finance lease. In August 2015, the lease was determined to be an operating lease due to a modification on lease conditions; as such, the Company recognized a gain of NT$430,041 thousand from the modification. Such gain was included in other operating income and expenses.
16. INTANGIBLE ASSETS
Goodwill Technology License
Fees
Software and System Design
Costs Patent and Others
Total Cost Balance at January 1, 2016 $ 6,104,784 $ 8,454,304 $ 19,474,428 $ 4,879,026 $ 38,912,542 Additions - 1,091,261 2,788,512 519,289 4,399,062 Retirements - - (5,273 ) - (5,273 ) Effect of exchange rate changes (96,809 ) 442 (14,072 ) (11,880 ) (122,319 ) Balance at December 31, 2016 $ 6,007,975 $ 9,546,007 $ 22,243,595 $ 5,386,435 $ 43,184,012 Accumulated amortization Balance at January 1, 2016 $ - $ 4,779,388 $ 16,431,666 $ 3,635,608 $ 24,846,662 Additions - 1,367,370 1,730,834 645,202 3,743,406 Retirements - - (5,273 ) - (5,273 ) Effect of exchange rate changes - 442 (12,799 ) (3,272 ) (15,629 ) Balance at December 31, 2016 $ - $ 6,147,200 $ 18,144,428 $ 4,277,538 $ 28,569,166 Carrying amounts at December 31, 2016 $ 6,007,975 $ 3,398,807 $ 4,099,167 $ 1,108,897 $ 14,614,846 Cost Balance at January 1, 2015 $ 5,888,813 $ 6,350,253 $ 18,697,098 $ 4,292,555 $ 35,228,719 Additions - 2,112,572 867,774 587,754 3,568,100 Retirements - - (101,377 ) - (101,377 ) Effect of acquisition of subsidiary 52,669 - 12,111 - 64,780 Effect of exchange rate changes 163,302 (8,521 ) (1,178 ) (1,283 ) 152,320 Balance at December 31, 2015 $ 6,104,784 $ 8,454,304 $ 19,474,428 $ 4,879,026 $ 38,912,542 Accumulated amortization and impairment Balance at January 1, 2015 $ - $ 3,778,912 $ 14,861,146 $ 3,057,151 $ 21,697,209 Additions - 950,867 1,672,627 578,706 3,202,200 Retirements - - (101,377 ) - (101,377 ) Impairment - 58,130 384 - 58,514 Effect of exchange rate changes - (8,521 ) (1,114 ) (249 ) (9,884 ) Balance at December 31, 2015 $ - $ 4,779,388 $ 16,431,666 $ 3,635,608 $ 24,846,662 Carrying amounts at December 31, 2015 $ 6,104,784 $ 3,674,916 $ 3,042,762 $ 1,243,418 $ 14,065,880
- 42 -

- 43 -
The Company’s goodwill has been tested for impairment at the end of the annual reporting period and the recoverable amount is determined based on the value in use. The value in use was calculated based on the cash flow forecast from the financial budgets covering the future five-year period, and the Company used annual discount rate of 8.40% in its test of impairment for both December 31, 2016 and 2015 to reflect the relevant specific risk in the cash-generating unit. For the years ended December 31, 2016 and 2015, the Company did not recognize any impairment loss on goodwill. In August 2015, TSMC Solar ceased its manufacturing operation and the Company recognized an impairment loss of NT$58,514 thousand in the third quarter of 2015 since the carrying amounts of technology license fees, software and system design costs were expected to be unrecoverable. Such impairment loss was included in other operating income and expenses.
17. OTHER ASSETS
December 31,
2016 December 31,
2015 Tax receivable $ 2,325,825 $ 2,026,509 Prepaid expenses 1,007,026 1,457,044 Net Input VAT 333,140 - Long-term receivable - 360,000 Others 1,219,863 1,118,492 $ 4,885,854 $ 4,962,045 Current portion $ 3,385,422 $ 3,533,369 Noncurrent portion 1,500,432 1,428,676 $ 4,885,854 $ 4,962,045
18. SHORT-TERM LOANS
December 31,
2016 December 31,
2015 Unsecured loans
Amount $ 57,958,200 $ 39,474,000 Original loan content
US$ (in thousands) $ 1,800,000 $ 1,200,000 Annual interest rate 0.87%-1.07% 0.50%-0.77% Maturity date Due by January
2017 Due by February
2016
- 43 -

- 44 -
19. PROVISIONS
December 31,
2016 December 31,
2015 Sales returns and allowances $ 18,037,789 $ 10,163,536 Warranties 28,187 46,304 $ 18,065,976 $ 10,209,840 Current portion $ 18,037,789 $ 10,163,536 Noncurrent portion (classified under other noncurrent liabilities) 28,187 46,304 $ 18,065,976 $ 10,209,840
Sales Returns
and Allowances Warranties Total Year ended December 31, 2016 Balance, beginning of year $ 10,163,536 $ 46,304 $ 10,209,840 Provision (Reversal) 36,519,312 (13,629) 36,505,683 Payment (28,569,318) (4,488) (28,573,806) Effect of exchange rate changes (75,741) - (75,741) Balance, end of year $ 18,037,789 $ 28,187 $ 18,065,976 Year ended December 31, 2015 Balance, beginning of year $ 10,445,452 $ 19,828 $ 10,465,280 Provision 17,723,154 41,831 17,764,985 Payment (18,133,061) (14,698) (18,147,759) Effect of acquisition of subsidiary 126,049 - 126,049 Effect of exchange rate changes 1,942 (657) 1,285 Balance, end of year $ 10,163,536 $ 46,304 $ 10,209,840
Provisions for sales returns and allowances are estimated based on historical experience, management judgment, and any known factors that would significantly affect the returns and allowances, and are recognized as a reduction of revenue in the same year of the related product sales. The provision for warranties represents the present value of the Company’s best estimate of the future outflow of the economic benefits that will be required under the Company’s obligations for warranties. The best estimate has been made on the basis of historical warranty trends of business.
20. BONDS PAYABLE
December 31,
2016 December 31,
2015 Domestic unsecured bonds $ 154,200,000 $ 166,200,000 Overseas unsecured bonds 37,028,850 49,342,500
191,228,850 215,542,500 Less: Discounts on bonds payable (35,293) (67,306) Less: Current portion (38,100,000) (23,510,112)
$ 153,093,557 $ 191,965,082
- 44 -

- 45 -
The major terms of domestic unsecured bonds are as follows:
Issuance Tranche Issuance Period Total Amount Coupon
Rate Repayment and
Interest Payment 100-1 A September 2011 to
September 2016 $ 10,500,000 1.40% Bullet repayment;
interest payable annually
B September 2011 to September 2018
7,500,000 1.63% The same as above
100-2 A January 2012 to January 2017
10,000,000 1.29% The same as above
B January 2012 to January 2019
7,000,000 1.46% The same as above
101-1 A August 2012 to August 2017
9,900,000 1.28% The same as above
B August 2012 to August 2019
9,000,000 1.40% The same as above
101-2 A September 2012 to September 2017
12,700,000 1.28% The same as above
B September 2012 to September 2019
9,000,000 1.39% The same as above
101-3 - October 2012 to October 2022
4,400,000 1.53% The same as above
101-4 A January 2013 to January 2018
10,600,000 1.23% The same as above
B January 2013 to January 2020
10,000,000 1.35% The same as above
C January 2013 to January 2023
3,000,000 1.49% The same as above
102-1 A February 2013 to February 2018
6,200,000 1.23% The same as above
B February 2013 to February 2020
11,600,000 1.38% The same as above
C February 2013 to February 2023
3,600,000 1.50% The same as above
102-2 A July 2013 to July 2020 10,200,000 1.50% The same as above B July 2013 to July 2023 3,500,000 1.70% The same as above 102-3 A August 2013 to
August 2017 4,000,000 1.34% The same as above
B August 2013 to August 2019
8,500,000 1.52% The same as above
102-4 A September 2013 to September 2016
1,500,000 1.35% The same as above
B September 2013 to September 2017
1,500,000 1.45% The same as above
(Continued)
- 45 -
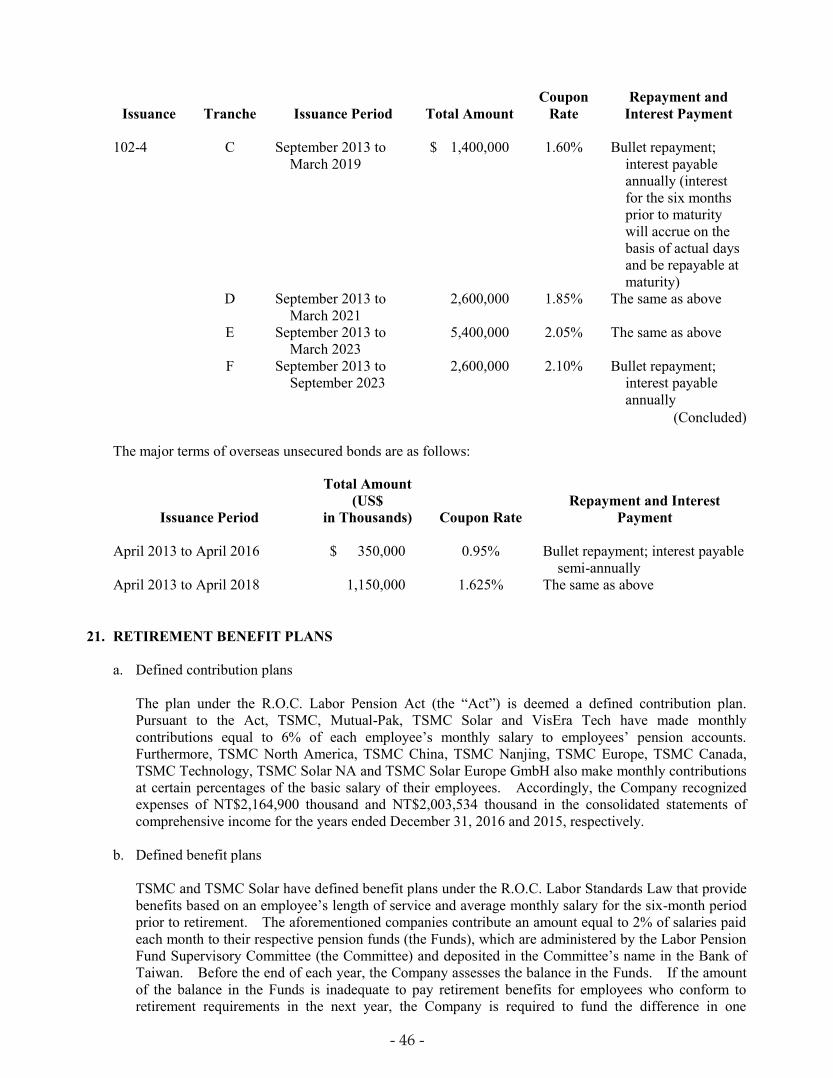
- 46 -
Issuance Tranche Issuance Period Total Amount Coupon
Rate Repayment and
Interest Payment 102-4 C September 2013 to
March 2019 $ 1,400,000 1.60% Bullet repayment;
interest payable annually (interest for the six months prior to maturity will accrue on the basis of actual days and be repayable at maturity)
D September 2013 to March 2021
2,600,000 1.85% The same as above
E September 2013 to March 2023
5,400,000 2.05% The same as above
F September 2013 to September 2023
2,600,000 2.10% Bullet repayment; interest payable annually
(Concluded) The major terms of overseas unsecured bonds are as follows:
Issuance Period
Total Amount (US$
in Thousands) Coupon Rate Repayment and Interest
Payment
April 2013 to April 2016 $ 350,000
0.95% Bullet repayment; interest payable
semi-annually April 2013 to April 2018 1,150,000 1.625% The same as above
21. RETIREMENT BENEFIT PLANS
a. Defined contribution plans
The plan under the R.O.C. Labor Pension Act (the “Act”) is deemed a defined contribution plan. Pursuant to the Act, TSMC, Mutual-Pak, TSMC Solar and VisEra Tech have made monthly contributions equal to 6% of each employee’s monthly salary to employees’ pension accounts. Furthermore, TSMC North America, TSMC China, TSMC Nanjing, TSMC Europe, TSMC Canada, TSMC Technology, TSMC Solar NA and TSMC Solar Europe GmbH also make monthly contributions at certain percentages of the basic salary of their employees. Accordingly, the Company recognized expenses of NT$2,164,900 thousand and NT$2,003,534 thousand in the consolidated statements of comprehensive income for the years ended December 31, 2016 and 2015, respectively.
b. Defined benefit plans
TSMC and TSMC Solar have defined benefit plans under the R.O.C. Labor Standards Law that provide benefits based on an employee’s length of service and average monthly salary for the six-month period prior to retirement. The aforementioned companies contribute an amount equal to 2% of salaries paid each month to their respective pension funds (the Funds), which are administered by the Labor Pension Fund Supervisory Committee (the Committee) and deposited in the Committee’s name in the Bank of Taiwan. Before the end of each year, the Company assesses the balance in the Funds. If the amount of the balance in the Funds is inadequate to pay retirement benefits for employees who conform to retirement requirements in the next year, the Company is required to fund the difference in one
- 46 -

- 47 -
appropriation that should be made before the end of March of the next year. The Funds are operated and managed by the government’s designated authorities; as such, the Company does not have any right to intervene in the investments of the Funds.
Amounts recognized in the consolidated statements of comprehensive income in respect of these defined benefit plans were as follows: Years Ended December 31 2016 2015 Current service cost $ 132,786 $ 134,541 Net interest expense 139,355 144,389 Components of defined benefit costs recognized in profit or loss 272,141 278,930 Remeasurement on the net defined benefit liability:
Return on plan assets (excluding amounts included in net interest expense) 45,721 (13,707)
Actuarial loss arising from experience adjustments 38,195 297,077 Actuarial loss arising from changes in financial assumptions 694,632 544,333 Actuarial loss arising from changes in demographic
assumptions 278,672 - Components of defined benefit costs recognized in other
comprehensive income 1,057,220 827,703
Total $ 1,329,361 $ 1,106,633 The pension costs of the aforementioned defined benefit plans were recognized in profit or loss by the following categories: Years Ended December 31 2016 2015 Cost of revenue $ 176,977 $ 189,523 Research and development expenses 73,395 81,333 General and administrative expenses 17,367 3,102 Marketing expenses 4,402 4,972 $ 272,141 $ 278,930 The amounts arising from the defined benefit obligation of the Company in the consolidated balance sheets were as follows:
December 31,
2016 December 31,
2015 Present value of defined benefit obligation $ 12,480,480 $ 11,318,174 Fair value of plan assets (3,929,072) (3,870,148) Net defined benefit liability $ 8,551,408 $ 7,448,026
- 47 -

- 48 -
Movements in the present value of the defined benefit obligation were as follows: Years Ended December 31 2016 2015 Balance, beginning of year $ 11,318,174 $ 10,265,284 Current service cost 132,786 134,541 Interest expense 212,909 228,444 Remeasurement losses:
Actuarial loss arising from experience adjustments 38,195 297,077 Actuarial loss arising from changes in financial assumptions 694,632 544,333 Actuarial loss arising from changes in demographic
assumptions 278,672 - Benefits paid from plan assets (194,888) (146,136) Benefits paid directly by the Company - (5,369) Balance, end of year $ 12,480,480 $ 11,318,174 Movements in the fair value of the plan assets were as follows: Years Ended December 31 2016 2015 Balance, beginning of year $ 3,870,148 $ 3,697,502 Interest income 73,554 84,055 Remeasurement gains (losses):
Return on plan assets (excluding amounts included in net interest expense) (45,721) 13,707
Contributions from employer 225,979 221,020 Benefits paid from plan assets (194,888) (146,136) Balance, end of year $ 3,929,072 $ 3,870,148 The fair value of the plan assets by major categories at the end of reporting period was as follows:
December 31,
2016 December 31,
2015 Cash $ 818,426 $ 690,821 Equity instruments 1,852,950 2,070,142 Debt instruments 1,257,696 1,109,185 $ 3,929,072 $ 3,870,148 The actuarial valuations of the present value of the defined benefit obligation were carried out by qualified actuaries. The principal assumptions of the actuarial valuation were as follows: Measurement Date
December 31,
2016 December 31,
2015 Discount rate 1.50% 1.90% Future salary increase rate 3.00% 3.00%
- 48 -
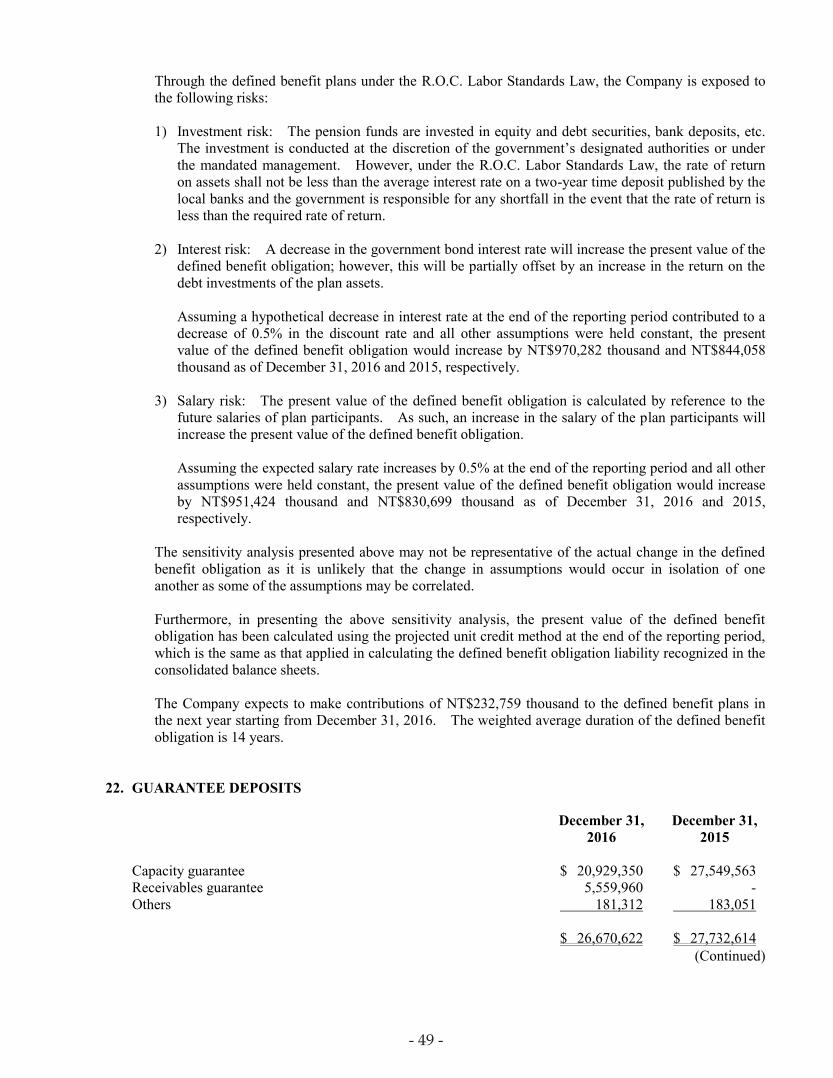
- 49 -
Through the defined benefit plans under the R.O.C. Labor Standards Law, the Company is exposed to the following risks: 1) Investment risk: The pension funds are invested in equity and debt securities, bank deposits, etc.
The investment is conducted at the discretion of the government’s designated authorities or under the mandated management. However, under the R.O.C. Labor Standards Law, the rate of return on assets shall not be less than the average interest rate on a two-year time deposit published by the local banks and the government is responsible for any shortfall in the event that the rate of return is less than the required rate of return.
2) Interest risk: A decrease in the government bond interest rate will increase the present value of the
defined benefit obligation; however, this will be partially offset by an increase in the return on the debt investments of the plan assets.
Assuming a hypothetical decrease in interest rate at the end of the reporting period contributed to a decrease of 0.5% in the discount rate and all other assumptions were held constant, the present value of the defined benefit obligation would increase by NT$970,282 thousand and NT$844,058 thousand as of December 31, 2016 and 2015, respectively.
3) Salary risk: The present value of the defined benefit obligation is calculated by reference to the
future salaries of plan participants. As such, an increase in the salary of the plan participants will increase the present value of the defined benefit obligation.
Assuming the expected salary rate increases by 0.5% at the end of the reporting period and all other assumptions were held constant, the present value of the defined benefit obligation would increase by NT$951,424 thousand and NT$830,699 thousand as of December 31, 2016 and 2015, respectively.
The sensitivity analysis presented above may not be representative of the actual change in the defined benefit obligation as it is unlikely that the change in assumptions would occur in isolation of one another as some of the assumptions may be correlated. Furthermore, in presenting the above sensitivity analysis, the present value of the defined benefit obligation has been calculated using the projected unit credit method at the end of the reporting period, which is the same as that applied in calculating the defined benefit obligation liability recognized in the consolidated balance sheets. The Company expects to make contributions of NT$232,759 thousand to the defined benefit plans in the next year starting from December 31, 2016. The weighted average duration of the defined benefit obligation is 14 years.
22. GUARANTEE DEPOSITS
December 31,
2016 December 31,
2015 Capacity guarantee $ 20,929,350 $ 27,549,563 Receivables guarantee 5,559,960 - Others 181,312 183,051 $ 26,670,622 $ 27,732,614
(Continued)
- 49 -
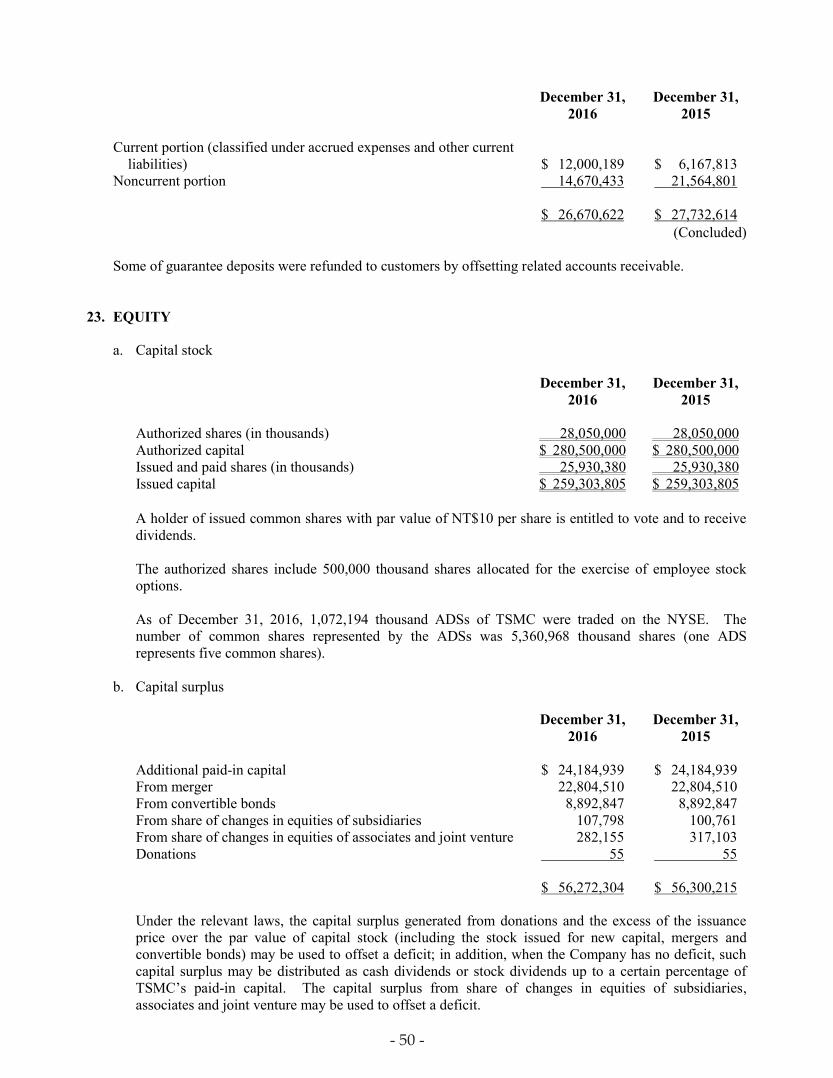
- 50 -
December 31,
2016 December 31,
2015 Current portion (classified under accrued expenses and other current
liabilities)
$ 12,000,189 $ 6,167,813 Noncurrent portion 14,670,433 21,564,801 $ 26,670,622 $ 27,732,614
(Concluded)
Some of guarantee deposits were refunded to customers by offsetting related accounts receivable.
23. EQUITY
a. Capital stock
December 31,
2016 December 31,
2015 Authorized shares (in thousands) 28,050,000 28,050,000 Authorized capital $ 280,500,000 $ 280,500,000 Issued and paid shares (in thousands) 25,930,380 25,930,380 Issued capital $ 259,303,805 $ 259,303,805
A holder of issued common shares with par value of NT$10 per share is entitled to vote and to receive dividends. The authorized shares include 500,000 thousand shares allocated for the exercise of employee stock options. As of December 31, 2016, 1,072,194 thousand ADSs of TSMC were traded on the NYSE. The number of common shares represented by the ADSs was 5,360,968 thousand shares (one ADS represents five common shares).
b. Capital surplus
December 31,
2016 December 31,
2015 Additional paid-in capital $ 24,184,939 $ 24,184,939 From merger 22,804,510 22,804,510 From convertible bonds 8,892,847 8,892,847 From share of changes in equities of subsidiaries 107,798 100,761 From share of changes in equities of associates and joint venture 282,155 317,103 Donations 55 55 $ 56,272,304 $ 56,300,215
Under the relevant laws, the capital surplus generated from donations and the excess of the issuance price over the par value of capital stock (including the stock issued for new capital, mergers and convertible bonds) may be used to offset a deficit; in addition, when the Company has no deficit, such capital surplus may be distributed as cash dividends or stock dividends up to a certain percentage of TSMC’s paid-in capital. The capital surplus from share of changes in equities of subsidiaries, associates and joint venture may be used to offset a deficit.
- 50 -
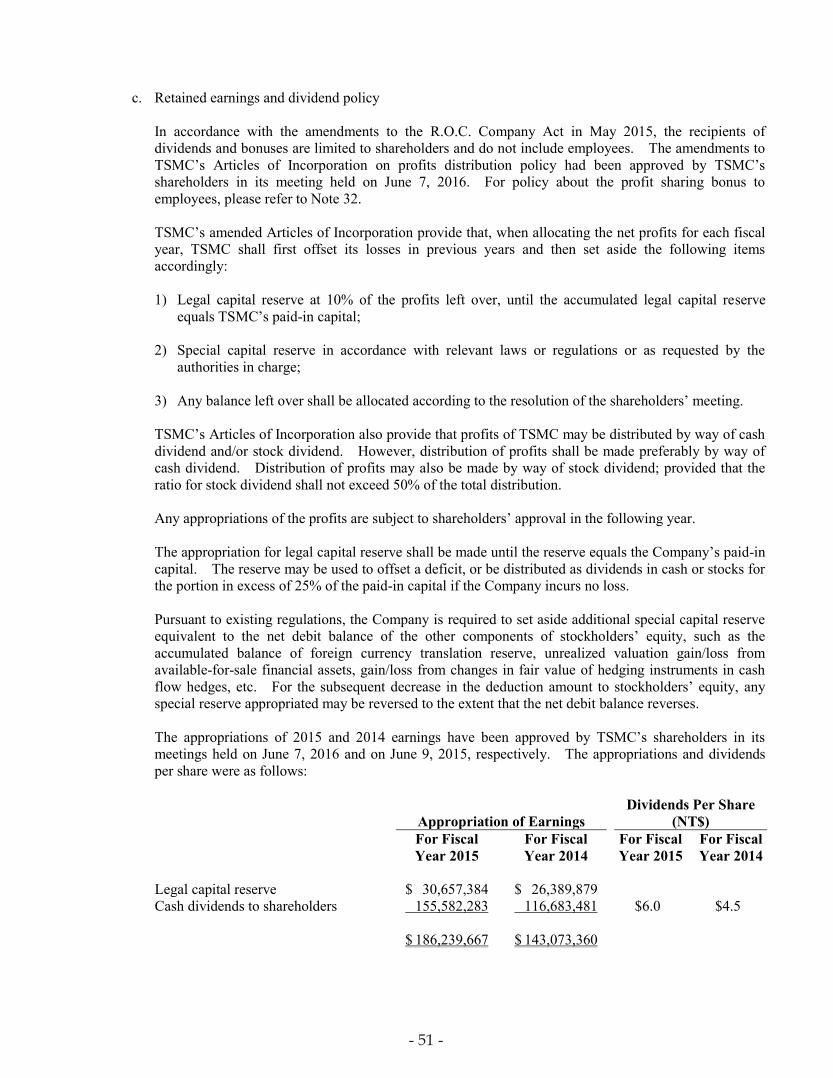
- 51 -
c. Retained earnings and dividend policy
In accordance with the amendments to the R.O.C. Company Act in May 2015, the recipients of dividends and bonuses are limited to shareholders and do not include employees. The amendments to TSMC’s Articles of Incorporation on profits distribution policy had been approved by TSMC’s shareholders in its meeting held on June 7, 2016. For policy about the profit sharing bonus to employees, please refer to Note 32. TSMC’s amended Articles of Incorporation provide that, when allocating the net profits for each fiscal year, TSMC shall first offset its losses in previous years and then set aside the following items accordingly: 1) Legal capital reserve at 10% of the profits left over, until the accumulated legal capital reserve
equals TSMC’s paid-in capital; 2) Special capital reserve in accordance with relevant laws or regulations or as requested by the
authorities in charge; 3) Any balance left over shall be allocated according to the resolution of the shareholders’ meeting. TSMC’s Articles of Incorporation also provide that profits of TSMC may be distributed by way of cash dividend and/or stock dividend. However, distribution of profits shall be made preferably by way of cash dividend. Distribution of profits may also be made by way of stock dividend; provided that the ratio for stock dividend shall not exceed 50% of the total distribution.
Any appropriations of the profits are subject to shareholders’ approval in the following year.
The appropriation for legal capital reserve shall be made until the reserve equals the Company’s paid-in capital. The reserve may be used to offset a deficit, or be distributed as dividends in cash or stocks for the portion in excess of 25% of the paid-in capital if the Company incurs no loss.
Pursuant to existing regulations, the Company is required to set aside additional special capital reserve equivalent to the net debit balance of the other components of stockholders’ equity, such as the accumulated balance of foreign currency translation reserve, unrealized valuation gain/loss from available-for-sale financial assets, gain/loss from changes in fair value of hedging instruments in cash flow hedges, etc. For the subsequent decrease in the deduction amount to stockholders’ equity, any special reserve appropriated may be reversed to the extent that the net debit balance reverses. The appropriations of 2015 and 2014 earnings have been approved by TSMC’s shareholders in its meetings held on June 7, 2016 and on June 9, 2015, respectively. The appropriations and dividends per share were as follows:
Appropriation of Earnings Dividends Per Share
(NT$) For Fiscal For Fiscal For Fiscal For Fiscal Year 2015 Year 2014 Year 2015 Year 2014 Legal capital reserve $ 30,657,384 $ 26,389,879 Cash dividends to shareholders 155,582,283 116,683,481 $6.0 $4.5 $ 186,239,667 $ 143,073,360
- 51 -
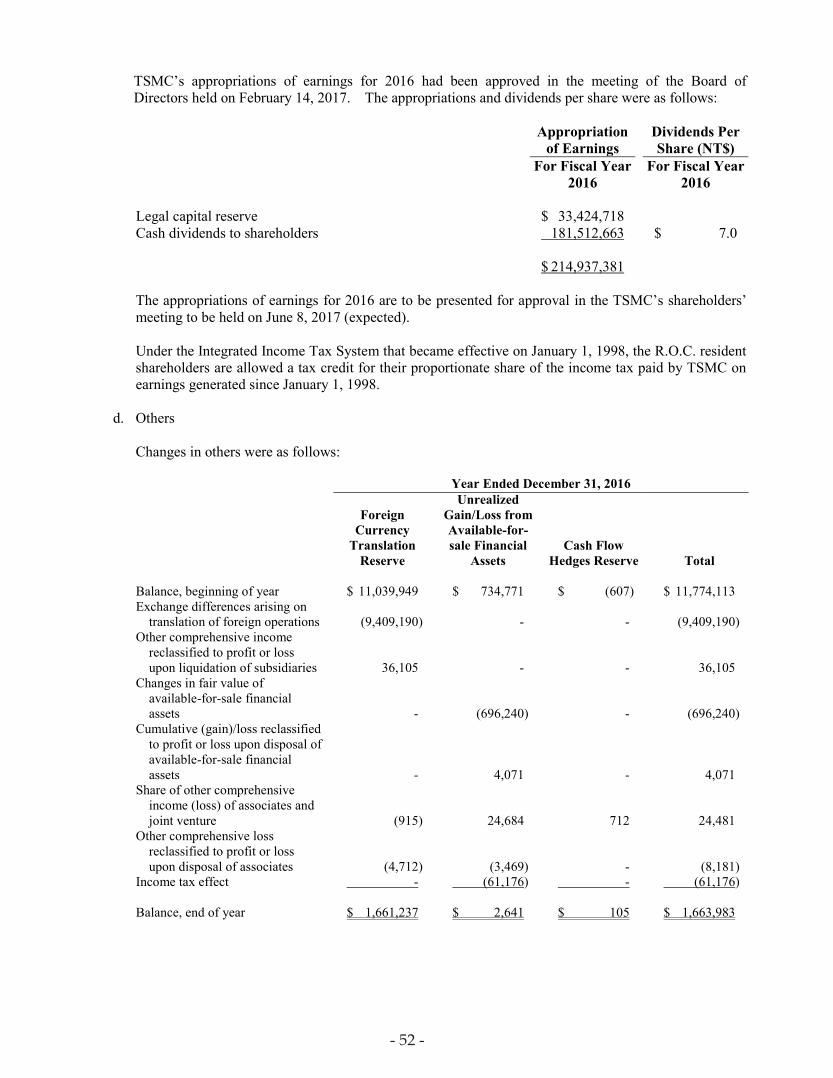
- 52 -
TSMC’s appropriations of earnings for 2016 had been approved in the meeting of the Board of Directors held on February 14, 2017. The appropriations and dividends per share were as follows:
Appropriation
of Earnings Dividends Per
Share (NT$) For Fiscal Year
2016 For Fiscal Year
2016 Legal capital reserve $ 33,424,718 Cash dividends to shareholders 181,512,663 $ 7.0 $ 214,937,381
The appropriations of earnings for 2016 are to be presented for approval in the TSMC’s shareholders’ meeting to be held on June 8, 2017 (expected). Under the Integrated Income Tax System that became effective on January 1, 1998, the R.O.C. resident shareholders are allowed a tax credit for their proportionate share of the income tax paid by TSMC on earnings generated since January 1, 1998.
d. Others
Changes in others were as follows: Year Ended December 31, 2016
Foreign Currency
Translation Reserve
Unrealized Gain/Loss from Available-for- sale Financial
Assets Cash Flow
Hedges Reserve Total Balance, beginning of year $ 11,039,949 $ 734,771 $ (607) $ 11,774,113 Exchange differences arising on
translation of foreign operations
(9,409,190)
-
-
(9,409,190) Other comprehensive income
reclassified to profit or loss upon liquidation of subsidiaries
36,105
-
-
36,105 Changes in fair value of
available-for-sale financial assets
-
(696,240)
-
(696,240) Cumulative (gain)/loss reclassified
to profit or loss upon disposal of available-for-sale financial assets
-
4,071
-
4,071 Share of other comprehensive
income (loss) of associates and joint venture
(915)
24,684
712
24,481 Other comprehensive loss
reclassified to profit or loss upon disposal of associates
(4,712)
(3,469)
-
(8,181) Income tax effect - (61,176) - (61,176) Balance, end of year $ 1,661,237 $ 2,641 $ 105 $ 1,663,983
- 52 -

- 53 -
Year Ended December 31, 2015
Foreign Currency
Translation Reserve
Unrealized Gain/Loss from Available-for- sale Financial
Assets Cash Flow
Hedges Reserve Total Balance, beginning of year $ 4,502,113 $ 21,247,483 $ (305) $ 25,749,291 Exchange differences arising on
translation of foreign operations
8,061,882
-
-
8,061,882 Other comprehensive
income/losses reclassified to profit or loss upon liquidation of subsidiaries
138,087
- -
138,087 Changes in fair value of
available-for-sale financial assets
-
(5,543)
-
(5,543) Cumulative (gain)/loss reclassified
to profit or loss upon disposal of available-for-sale financial assets
(1,595,413)
(20,475,233)
-
(22,070,646) Share of other comprehensive
income of associates and joint venture
(60,642)
(17,996)
(313)
(78,951) The proportionate share of other
comprehensive income/losses reclassified to profit or loss upon partial disposal of associates
(6,078)
2,051
11
(4,016) Income tax effect - (15,991) - (15,991) Balance, end of year $ 11,039,949 $ 734,771 $ (607) $ 11,774,113
The exchange differences arising on translation of foreign operation’s net assets from its functional currency to TSMC’s presentation currency are recognized directly in other comprehensive income and also accumulated in the foreign currency translation reserve. Unrealized gain/loss on available-for-sale financial assets represents the cumulative gains or losses arising from the fair value measurement on available-for-sale financial assets that are recognized in other comprehensive income, excluding the amounts recognized in profit or loss for the effective portion from changes in fair value of the hedging instruments. When those available-for-sale financial assets have been disposed of or are determined to be impaired subsequently, the related cumulative gains or losses in other comprehensive income are reclassified to profit or loss. The cash flow hedges reserve represents the cumulative effective portion of gains or losses arising on changes in fair value of the hedging instruments entered into as cash flow hedges. The cumulative gains or losses arising on changes in fair value of the hedging instruments that are recognized and accumulated in cash flow hedges reserve will be reclassified to profit or loss only when the hedge transaction affects profit or loss.
- 53 -

- 54 -
24. SHARE-BASED PAYMENT TSMC’s Employee Stock Option Plans, consisting of the TSMC 2004 Plan, TSMC 2003 Plan and TSMC 2002 Plan, were approved by the Securities and Futures Bureau on January 6, 2005, October 29, 2003 and June 25, 2002, respectively. The maximum number of stock options authorized to be granted under the TSMC 2004 Plan, TSMC 2003 Plan and TSMC 2002 Plan was 11,000 thousand, 120,000 thousand and 100,000 thousand, respectively, with each stock option eligible to subscribe for one common share of TSMC when exercised. The stock options may be granted to qualified employees of TSMC or any of its domestic or foreign subsidiaries, in which TSMC’s shareholding with voting rights, directly or indirectly, is more than fifty percent (50%). The stock options of all the plans are valid for ten years and exercisable at certain percentages subsequent to the second anniversary of the grant date. Under the terms of the plans, the stock options are granted at an exercise price equal to the closing price of TSMC’s common shares quoted on the TWSE on the grant date. The Company did not issue employee stock option plans for years ended December 31, 2016 and 2015. Information about the TSMC’s outstanding employee stock options is described as follows:
Number of Stock Options
(In Thousands)
Weighted- average
Exercise Price (NT$)
Year ended December 31, 2015 Balance, beginning of year 718 $47.2 Options exercised (718) 47.2 Balance, end of year - - Balance exercisable, end of year - -
The numbers of outstanding stock options and exercise prices have been adjusted to reflect the distribution of earnings by TSMC in accordance with the plans.
The employee stock options have been fully exercised in the second quarter of 2015.
25. NET REVENUE
Years Ended December 31 2016 2015 Net revenue from sale of goods $ 947,415,900 $ 842,997,542 Net revenue from royalties 522,444 499,826 $ 947,938,344 $ 843,497,368
26. OTHER OPERATING INCOME AND EXPENSES, NET
Years Ended December 31 2016 2015 Gain on disposal of property, plant and equipment $ 46,548 $ 433,559 Impairment loss on property, plant and equipment - (2,545,584) Gain from lease agreement modification - 430,041 Others (16,735) (198,634) $ 29,813 $ (1,880,618)
- 54 -

- 55 -
27. OTHER INCOME
Years Ended December 31 2016 2015 Interest income
Bank deposits $ 4,892,652 $ 3,928,030 Available-for-sale financial assets 816,185 35,811 Held-to-maturity financial assets 383,261 76,818 Structured product 225,402 88,657 6,317,500 4,129,316
Dividend income 137,401 621,513
$ 6,454,901 $ 4,750,829 28. FINANCE COSTS
Years Ended December 31 2016 2015 Interest expense
Corporate bonds $ 3,014,753 $ 3,103,702 Bank loans 291,178 74,664 Finance leases - 11,666 Others 222 299
$ 3,306,153 $ 3,190,331
29. OTHER GAINS AND LOSSES
Years Ended December 31 2016 2015 Gain (loss) on disposal of financial assets, net
Available-for-sale financial assets $ (4,014) $ 22,070,736 Financial assets carried at cost 37,241 87,193
Gain (loss) on disposal of investments accounted for using equity method, net (259,960) 2,507,707
Other gains 176,734 189,330 Net gain (loss) on financial instruments at FVTPL
Held for trading 467,051 (1,769,253) Designated as at FVTPL (37,369) -
Fair value hedges Gain (loss) from hedging instruments 12,725 (134,112) Gain (loss) arising from changes in fair value of available-for-sale
financial assets in hedge effective portion 4,248 (305,619) Impairment loss of financial assets
Financial assets carried at cost (122,240) (154,721) Loss from liquidation of subsidiaries (36,105) (138,243) Other losses (42,379) (145,954) $ 195,932 $ 22,207,064
- 55 -

- 56 -
30. INCOME TAX
a. Income tax expense recognized in profit or loss
Income tax expense consisted of the following:
Years Ended December 31 2016 2015
Current income tax expense
Current tax expense recognized in the current year $ 54,315,433 $ 45,857,504 Income tax adjustments on prior years (1,041,762) (992,995) Other income tax adjustments 122,461 247,835
53,396,132 45,112,344 Deferred income tax expense (benefit)
The origination and reversal of temporary differences (1,775,023) (1,542,786) Investment tax credits and operating loss carryforward 35 303,186
(1,774,988) (1,239,600) Income tax expense recognized in profit or loss $ 51,621,144 $ 43,872,744 A reconciliation of income before income tax and income tax expense recognized in profit or loss was as follows: Years Ended December 31 2016 2015 Income before tax $ 385,959,380 $ 350,428,911 Income tax expense at the statutory rate $ 66,945,088 $ 60,666,157 Tax effect of adjusting items:
Deductible items in determining taxable income (51,324) (6,332,097) Tax-exempt income (19,594,962) (22,144,303)
Additional income tax under the Alternative Minimum Tax Act - 6,041,603 Additional income tax on unappropriated earnings 11,957,213 12,103,356 The origination and reversal of temporary differences (1,775,023) (1,542,786) Income tax credits (4,940,147) (4,243,661) Remeasurement of operating loss carryforward (400) 69,635 52,540,445 44,617,904 Income tax adjustments on prior years (1,041,762) (992,995) Other income tax adjustments 122,461 247,835 Income tax expense recognized in profit or loss $ 51,621,144 $ 43,872,744 For the years ended December 31, 2016 and 2015, the Company applied a tax rate of 17% for entities subject to the R.O.C. Income Tax Law; for other jurisdictions, the Company measures taxes by using the applicable tax rate for each individual jurisdiction.
- 56 -
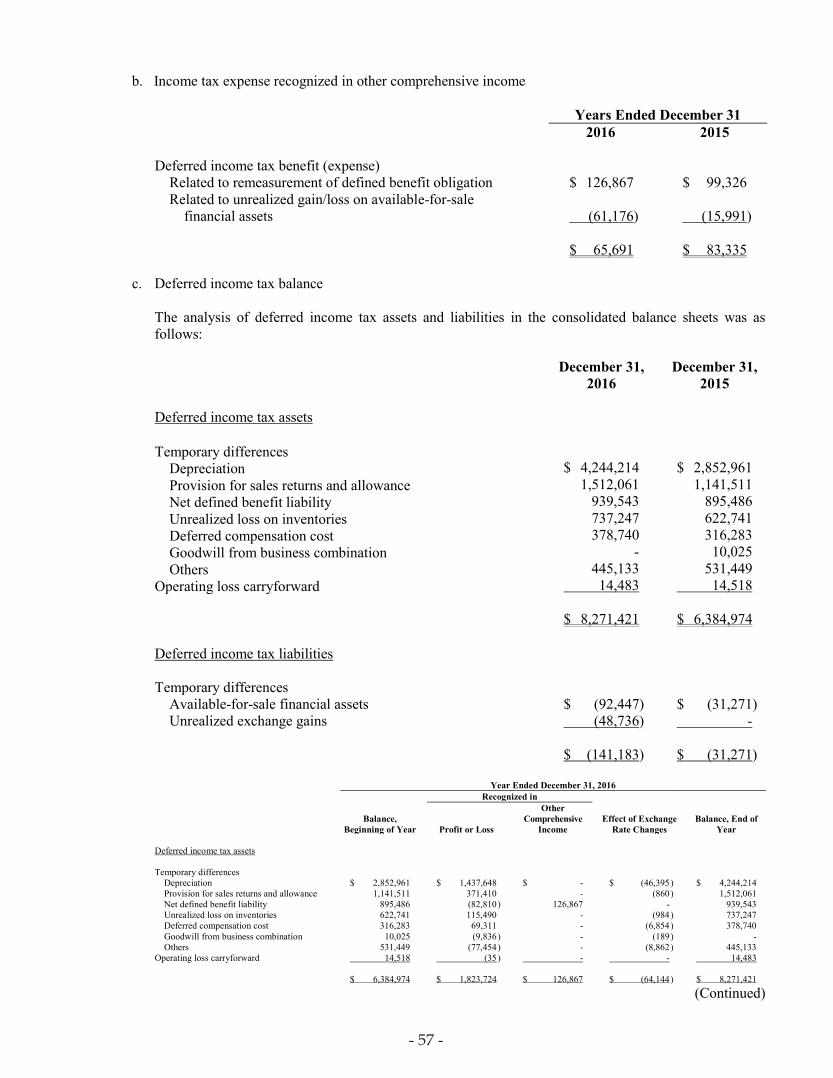
- 57 -
b. Income tax expense recognized in other comprehensive income
Years Ended December 31 2016 2015
Deferred income tax benefit (expense)
Related to remeasurement of defined benefit obligation $ 126,867 $ 99,326 Related to unrealized gain/loss on available-for-sale
financial assets
(61,176) (15,991) $ 65,691 $ 83,335
c. Deferred income tax balance
The analysis of deferred income tax assets and liabilities in the consolidated balance sheets was as follows:
December 31,
2016 December 31,
2015 Deferred income tax assets Temporary differences
Depreciation $ 4,244,214 $ 2,852,961 Provision for sales returns and allowance 1,512,061 1,141,511 Net defined benefit liability 939,543 895,486 Unrealized loss on inventories 737,247 622,741 Deferred compensation cost 378,740 316,283 Goodwill from business combination - 10,025 Others 445,133 531,449
Operating loss carryforward 14,483 14,518 $ 8,271,421 $ 6,384,974
Deferred income tax liabilities Temporary differences
Available-for-sale financial assets $ (92,447) $ (31,271) Unrealized exchange gains (48,736) - $ (141,183) $ (31,271)
Year Ended December 31, 2016 Recognized in
Balance, Beginning of Year
Profit or Loss
Other Comprehensive
Income Effect of Exchange
Rate Changes
Balance, End of
Year Deferred income tax assets Temporary differences
Depreciation $ 2,852,961 $ 1,437,648 $ - $ (46,395 ) $ 4,244,214 Provision for sales returns and allowance 1,141,511 371,410 - (860 ) 1,512,061 Net defined benefit liability 895,486 (82,810 ) 126,867 - 939,543 Unrealized loss on inventories 622,741 115,490 - (984 ) 737,247 Deferred compensation cost 316,283 69,311 - (6,854 ) 378,740 Goodwill from business combination 10,025 (9,836 ) - (189 ) - Others 531,449 (77,454 ) - (8,862 ) 445,133
Operating loss carryforward 14,518 (35 ) - - 14,483 $ 6,384,974 $ 1,823,724 $ 126,867 $ (64,144 ) $ 8,271,421
(Continued)
- 57 -

- 58 -
Year Ended December 31, 2016 Recognized in
Balance, Beginning of Year
Profit or Loss
Other Comprehensive
Income Effect of Exchange
Rate Changes
Balance, End of
Year Deferred income tax liabilities Temporary differences Available-for-sale financial assets $ (31,271 ) $ - $ (61,176 ) $ - $ (92,447 ) Unrealized exchange gains - (48,736 ) - - (48,736 ) $ (31,271 ) $ (48,736 ) $ (61,176 ) $ - $ (141,183 )
(Concluded)
Year Ended December 31, 2015 Recognized in Balance,
Beginning of Year
Profit or Loss
Other Comprehensive
Income
Effect of Acquisition of
Subsidiary
Effect of Exchange Rate
Changes
Balance, End of
Year Deferred income tax assets Temporary differences
Depreciation $ 1,011,065 $ 1,808,736 $ - $ 11,899 $ 21,261 $ 2,852,961 Provision for sales returns and
allowance
1,230,752
(104,428 )
- 13,815
1,372
1,141,511 Net defined benefit liability 787,391 8,769 99,326 - - 895,486 Unrealized loss on inventories 591,871 25,088 - 4,081 1,701 622,741 Deferred compensation cost 255,621 49,348 - - 11,314 316,283 Goodwill from business
combination
195,453
(185,799 ) - -
371 10,025 Others 749,678 (243,398 ) - 148 25,021 531,449
Operating loss carryforward 316,951 (303,186 ) - - 753 14,518 $ 5,138,782 $ 1,055,130 $ 99,326 $ 29,943 $ 61,793 $ 6,384,974 Deferred income tax liabilities Temporary differences
Available-for-sale financial assets
$ (15,280 )
$ -
$ (15,991 ) $ -
$ -
$ (31,271 )
Unrealized exchange gains (184,470 ) 184,470 - - - - $ (199,750 ) $ 184,470 $ (15,991 ) $ - $ - $ (31,271 )
d. The investment operating loss carryforward and deductible temporary differences for which no deferred
income tax assets have been recognized in the consolidated financial statements The information of the operating loss carryforward for which no deferred tax assets have been recognized was as follows:
December 31,
2016 December 31,
2015 Expiry period
1 - 4 years $ 136,703 $ 85,402 5 - 10 years 41,389 97,831 $ 178,092 $ 183,233
As of December 31, 2016 and 2015, the aggregate deductible temporary differences for which no deferred income tax assets have been recognized amounted to NT$1,919,784 thousand and NT$1,972,286 thousand, respectively.
- 58 -

- 59 -
e. Unused operating loss carryforward and tax-exemption information As of December 31, 2016, operating loss carryforward of Mutual-Pak consisted of the following: Remaining Creditable Amount Expiry period 1 - 4 years $ 136,703 5 - 10 years 126,585
$ 263,288
As of December 31, 2016, the profits generated from the following projects of TSMC are exempt from income tax for a five-year period: Tax-exemption Period Construction and expansion of 2007 by TSMC 2014 to 2018 Construction and expansion of 2008 by TSMC 2015 to 2019 Construction and expansion of 2009 by TSMC 2018 to 2022
f. The information of unrecognized deferred income tax liabilities associated with investments
As of December 31, 2016 and 2015, the aggregate taxable temporary differences associated with investments in subsidiaries not recognized as deferred income tax liabilities amounted to NT$83,181,401 thousand and NT$80,919,309 thousand, respectively.
g. Integrated income tax information
December 31,
2016 December 31,
2015 Balance of the Imputation
Credit Account - TSMC $ 82,072,562 $ 59,973,516 The estimated and actual creditable ratio for distribution of TSMC’s earnings of 2016 and 2015 were 13.94% and 12.57%, respectively; however, effective from January 1, 2015, the creditable ratio for individual shareholders residing in the R.O.C. will be half of the original creditable ratio according to the revised Article 66 - 6 of the R.O.C. Income Tax Law. The imputation credit allocated to shareholders is based on its balance as of the date of the dividend distribution. The estimated creditable ratio may change when the actual distribution of the imputation credit is made. All of TSMC’s earnings generated prior to December 31, 1997 have been appropriated.
h. Income tax examination The tax authorities have examined income tax returns of TSMC through 2013. All investment tax credit adjustments assessed by the tax authorities have been recognized accordingly.
- 59 -

- 60 -
31. EARNINGS PER SHARE
Years Ended December 31 2016 2015
Basic EPS $12.89 $11.82 Diluted EPS $12.89 $11.82 EPS is computed as follows:
Amounts (Numerator)
Number of Shares
(Denominator) (In Thousands)
EPS (NT$) Year ended December 31, 2016 Basic/Diluted EPS
Net income available to common shareholders of the parent
$ 334,247,180 25,930,380 $12.89
Year ended December 31, 2015 Basic EPS
Net income available to common shareholders of the parent
$ 306,573,837 25,930,288 $11.82
Effect of dilutive potential common shares - 92 Diluted EPS
Net income available to common shareholders of the parent (including effect of dilutive potential common shares)
$ 306,573,837 25,930,380 $11.82 32. ADDITIONAL INFORMATION OF EXPENSES BY NATURE
Years Ended December 31 2016 2015 a. Depreciation of property, plant and equipment
Recognized in cost of revenue $ 203,476,848 $ 204,126,243 Recognized in operating expenses 16,583,067 15,152,174 Recognized in other operating income and expenses 25,083 24,952
$ 220,084,998 $ 219,303,369 b. Amortization of intangible assets
Recognized in cost of revenue $ 2,028,492 $ 1,642,051 Recognized in operating expenses 1,714,914 1,560,149 $ 3,743,406 $ 3,202,200
c. Research and development costs expensed as incurred $ 71,207,703 $ 65,544,579
- 60 -

- 61 -
Years Ended December 31 2016 2015 d. Employee benefits expenses
Post-employment benefits
Defined contribution plans $ 2,164,900 $ 2,003,534 Defined benefit plans 272,141 278,930
2,437,041 2,282,464 Other employee benefits 97,248,082 89,322,946
$ 99,685,123 $ 91,605,410
Employee benefits expense summarized by function Recognized in cost of revenue $ 58,493,500 $ 52,983,173 Recognized in operating expenses 41,191,623 38,622,237 $ 99,685,123 $ 91,605,410
In accordance with the amendments to the R.O.C. Company Act in May 2015 and the amended TSMC’s Articles of Incorporation approved by TSMC’s shareholders in its meeting held on June 7, 2016, TSMC shall allocate compensation to directors and profit sharing bonus to employees of TSMC not more than 0.3% and not less than 1% of annual profits during the period, respectively. Prior to the amendments, TSMC’s Articles of Incorporation provided that, when allocating the net profits for each fiscal year, TSMC shall first set aside legal capital reserve and special capital reserve, then set aside not more than 0.3% of the balance as compensation to directors and not less than 1% as profit sharing bonus to employees, respectively. TSMC accrued profit sharing bonus to employees based on a percentage of net income before income tax, profit sharing bonus to employees and compensation to directors during the period, which amounted to NT$22,418,339 thousand and NT$20,556,888 thousand for the years ended December 31, 2016 and 2015, respectively; Compensation to directors was expensed based on estimated amount payable. If there is a change in the proposed amounts after the annual consolidated financial statements are authorized for issue, the differences are recorded as a change in accounting estimate. The Board of Directors of TSMC held on February 14, 2017 approved the profit sharing bonus to employees and compensation to directors in the amounts of NT$22,418,339 thousand and NT$376,432 thousand in cash for 2016, respectively. There is no significant difference between the aforementioned approved amounts and the amounts charged against earnings of 2016. TSMC’s profit sharing bonus to employees and compensation to directors in the amounts of NT$20,556,888 thousand and NT$356,186 thousand in cash for 2015, respectively, had been approved by the Board of Directors on February 2, 2016. The profit sharing bonus to employees and compensation to directors in cash for 2015 had been reported to TSMC’s shareholders in its meeting held on June 7, 2016, after the amended TSMC’s Articles of Incorporation had been approved. The aforementioned approved amount has no difference with the one recognized in the consolidated financial statements for the year ended December 31, 2015. TSMC’s profit sharing bonus to employees and compensation to directors in the amounts of NT$17,645,966 thousand and NT$406,854 thousand in cash for 2014, respectively, had been approved by the shareholders in its meetings held on June 9, 2015. The aforementioned approved amount has no difference with the one recognized in the consolidated financial statements for the year ended December 31, 2014.
- 61 -
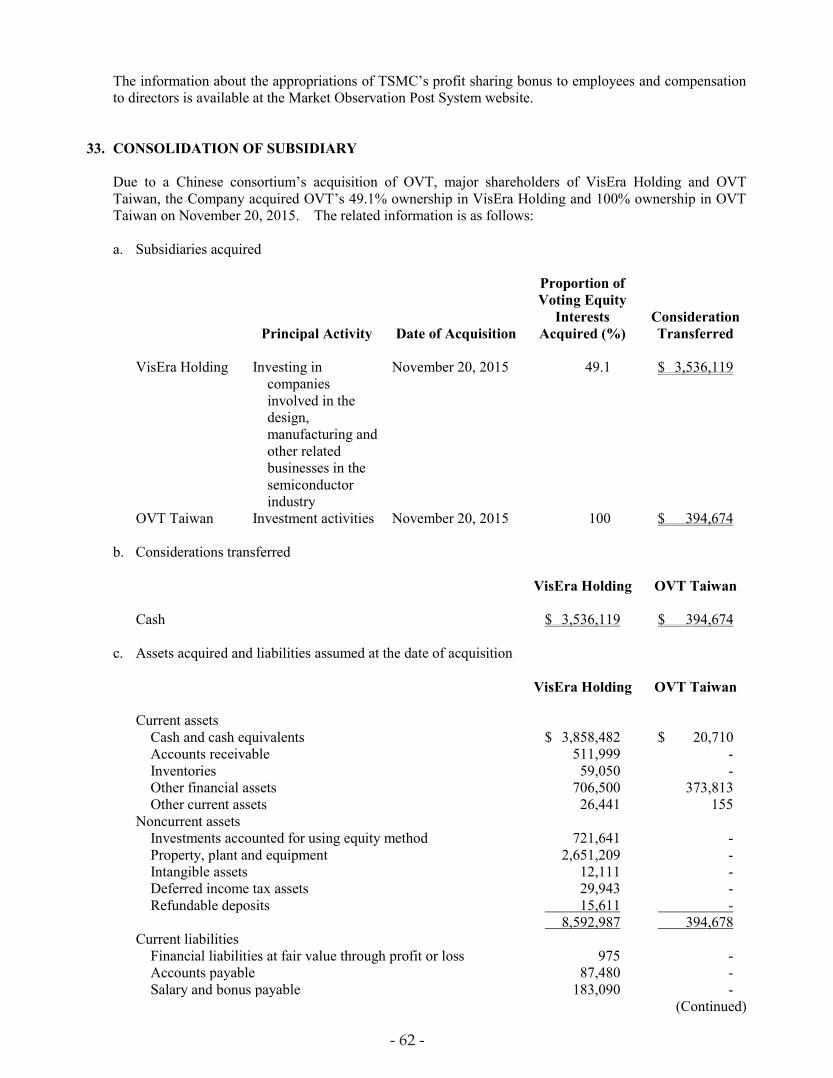
- 62 -
The information about the appropriations of TSMC’s profit sharing bonus to employees and compensation to directors is available at the Market Observation Post System website.
33. CONSOLIDATION OF SUBSIDIARY Due to a Chinese consortium’s acquisition of OVT, major shareholders of VisEra Holding and OVT Taiwan, the Company acquired OVT’s 49.1% ownership in VisEra Holding and 100% ownership in OVT Taiwan on November 20, 2015. The related information is as follows: a. Subsidiaries acquired
Principal Activity Date of Acquisition
Proportion of Voting Equity
Interests Acquired (%)
Consideration Transferred
VisEra Holding Investing in
companies involved in the design, manufacturing and other related businesses in the semiconductor industry
November 20, 2015 49.1 $ 3,536,119
OVT Taiwan Investment activities November 20, 2015 100 $ 394,674 b. Considerations transferred
VisEra Holding OVT Taiwan Cash $ 3,536,119 $ 394,674
c. Assets acquired and liabilities assumed at the date of acquisition
VisEra Holding OVT Taiwan Current assets
Cash and cash equivalents $ 3,858,482 $ 20,710 Accounts receivable 511,999 - Inventories 59,050 - Other financial assets 706,500 373,813 Other current assets 26,441 155
Noncurrent assets Investments accounted for using equity method 721,641 - Property, plant and equipment 2,651,209 - Intangible assets 12,111 - Deferred income tax assets 29,943 - Refundable deposits 15,611 - 8,592,987 394,678
Current liabilities Financial liabilities at fair value through profit or loss 975 - Accounts payable 87,480 - Salary and bonus payable 183,090 -
(Continued)
- 62 -

- 63 -
VisEra Holding OVT Taiwan
Accrued profit sharing bonus to employees and compensation to directors and supervisors $ 45,819 $ 4
Payables to contractors and equipment suppliers 132,305 - Income tax payable 47,860 - Provisions 126,049 - Accrued expenses and other current liabilities 102,851 -
Noncurrent liabilities Guarantee deposits 1,279 -
727,708 4 Net assets $ 7,865,279 $ 394,674
(Concluded) d. Goodwill arising on acquisition
VisEra Holding
Consideration transferred $ 3,536,119 Fair value of investments previously owned 3,458,146 Less: Fair value of identifiable net assets acquired (7,865,279) Noncontrolling interests 923,683 Goodwill arising on acquisition $ 52,669
e. Net cash outflow on acquisition of subsidiaries
VisEra Holding OVT Taiwan Consideration paid in cash $ 3,536,119 $ 394,674 Less: Cash and cash equivalent balances acquired (3,858,482) (20,710) $ (322,363) $ 373,964
f. Impact of acquisitions on the results of the Company
The results of VisEra Holding since the acquisition date included in the consolidated statements of comprehensive income for the year ended December 31, 2015 were as follows:
VisEra Holding Net revenue $ 254,319 Net income $ 16,264 Had the business combination of VisEra Holding been in effect on January 1, 2015, the Company’s net revenue and net income for the year ended December 31, 2015 would have been NT$846,401,819 thousand and NT$306,687,674 thousand, respectively. This pro-forma information is for illustrative purposes only and is not necessarily an indication of revenue and results of operations of the Company that actually would have been achieved had the acquisition been completed on January 1, 2015, nor is it intended to be a projection of future results. The aforementioned pro-forma net revenue and net income were calculated based on the fair value of assets acquired and liabilities assumed at the date of acquisition.
- 63 -

- 64 -
34. DISPOSAL OF SUBSIDIARY
In January 2015, the Board of Directors of TSMC approved a sale of TSMC SSL common shares of 565,480 thousand held by TSMC and TSMC GN to Epistar Corporation. The transaction was completed in February 2015. a. Consideration received from the disposal
Total consideration received $ 825,000 Expenditure associated with consideration received (142,475) Net consideration received $ 682,525
b. Analysis of assets and liabilities over which the control was lost
Assets Cash and cash equivalents $ 81,478 Inventories 28,519 Other current assets 91,331 Property, plant and equipment 643,699 Intangible assets 47,373 Others 51,808
944,208 Liabilities
Salary and bonus payable 38,151 Accrued expenses and other current liabilities 68,132 Net defined benefit liability 35,845 Others 76,915
219,043
Net assets disposed of $ 725,165 c. Gain/loss on disposal of subsidiary
Net consideration received $ 682,525 Net assets disposed of (725,165) Noncontrolling interests 42,640 Gain/loss on disposal of subsidiary $ -
d. Net cash inflow arising from disposal of subsidiary
Net consideration received $ 682,525 Less: Balance of cash and cash equivalents disposed of 81,478 $ 601,047
- 64 -
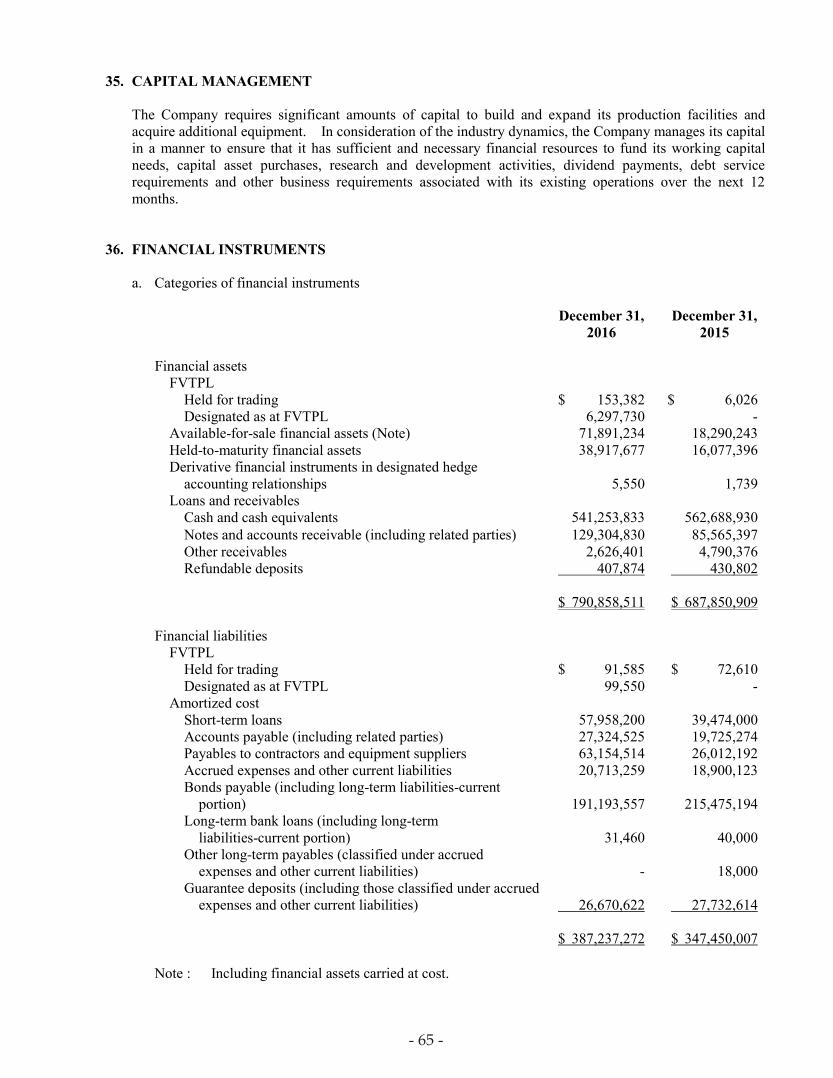
- 65 -
35. CAPITAL MANAGEMENT The Company requires significant amounts of capital to build and expand its production facilities and acquire additional equipment. In consideration of the industry dynamics, the Company manages its capital in a manner to ensure that it has sufficient and necessary financial resources to fund its working capital needs, capital asset purchases, research and development activities, dividend payments, debt service requirements and other business requirements associated with its existing operations over the next 12 months.
36. FINANCIAL INSTRUMENTS a. Categories of financial instruments
December 31,
2016 December 31,
2015 Financial assets
FVTPL Held for trading $ 153,382 $ 6,026 Designated as at FVTPL 6,297,730 -
Available-for-sale financial assets (Note) 71,891,234 18,290,243 Held-to-maturity financial assets 38,917,677 16,077,396 Derivative financial instruments in designated hedge
accounting relationships 5,550 1,739 Loans and receivables
Cash and cash equivalents 541,253,833 562,688,930 Notes and accounts receivable (including related parties) 129,304,830 85,565,397 Other receivables 2,626,401 4,790,376 Refundable deposits 407,874 430,802
$ 790,858,511 $ 687,850,909
Financial liabilities FVTPL
Held for trading $ 91,585 $ 72,610 Designated as at FVTPL 99,550 -
Amortized cost Short-term loans 57,958,200 39,474,000 Accounts payable (including related parties) 27,324,525 19,725,274 Payables to contractors and equipment suppliers 63,154,514 26,012,192 Accrued expenses and other current liabilities 20,713,259 18,900,123 Bonds payable (including long-term liabilities-current
portion) 191,193,557 215,475,194 Long-term bank loans (including long-term
liabilities-current portion) 31,460 40,000 Other long-term payables (classified under accrued
expenses and other current liabilities) - 18,000 Guarantee deposits (including those classified under accrued
expenses and other current liabilities) 26,670,622 27,732,614 $ 387,237,272 $ 347,450,007
Note : Including financial assets carried at cost.
- 65 -

- 66 -
b. Financial risk management objectives
The Company seeks to ensure sufficient cost-efficient funding readily available when needed. The Company manages its exposure to foreign currency risk, interest rate risk, equity price risk, credit risk and liquidity risk with the objective to reduce the potentially adverse effects the market uncertainties may have on its financial performance. The plans for material treasury activities are reviewed by Audit Committees and/or Board of Directors in accordance with procedures required by relevant regulations or internal controls. During the implementation of such plans, Corporate Treasury function must comply with certain treasury procedures that provide guiding principles for overall financial risk management and segregation of duties.
c. Market risk The Company is exposed to the market risks arising from changes in foreign exchange rates, interest rates and the prices in equity investments, and utilizes some derivative financial instruments to reduce the related risks. Foreign currency risk Most of the Company’s operating activities are denominated in foreign currencies. Consequently, the Company is exposed to foreign currency risk. To protect against reductions in value and the volatility of future cash flows caused by changes in foreign exchange rates, the Company utilizes derivative financial instruments, including currency forward contracts and cross currency swaps, to hedge its currency exposure. These instruments help to reduce, but do not eliminate, the impact of foreign currency exchange rate movements. The Company also holds short-term borrowings in foreign currencies in proportion to its expected future cash flows. This allows foreign-currency-denominated borrowings to be serviced with expected future cash flows and provides a partial hedge against transaction translation exposure. The Company’s sensitivity analysis to foreign currency risk mainly focuses on the foreign currency monetary items at the end of the reporting period. Assuming an unfavorable 10% movement in the levels of foreign exchanges against the New Taiwan dollar, the net income for the years ended December 31, 2016 and 2015 would have decreased by NT$111,347 thousand and NT$902,083 thousand, respectively, after taking into consideration of the hedging contracts and the hedged items. Interest rate risk The Company is exposed to interest rate risk arising from borrowing at both fixed and floating interest rates and from fixed income securities. All of the Company’s long-term bonds have fixed interest rates and are measured at amortized cost. As such, changes in interest rates would not affect the future cash flows. On the other hand, because interest rates of the Company’s long-term bank loans are floating, changes in interest rates would affect the future cash flows but not the fair value. Assuming the amount of floating interest rate bank loans at the end of the reporting period had been outstanding for the entire period and all other variables were held constant, a hypothetical increase in interest rates of 100 basis point (1%) would have resulted in an increase in the interest expense, net of tax, by approximately NT$261 thousand and NT$332 thousand for the years ended December 31, 2016 and 2015, respectively.
- 66 -

- 67 -
The Company classified fixed income securities as held-to-maturity and available-for-sale financial assets. Because held-to-maturity fixed income securities are measured at amortized cost, changes in interest rates would not affect the fair value. On the other hand, available-for-sale fixed income securities are exposed to fair value fluctuations caused by changes in interest rates. To manage its exposure to the fair value fluctuations, the Company enters into interest rate futures contract to hedge against price risk caused by changes in risk-free interest rates in the Company’s investments in available-for-sale fixed income securities. Assuming a hypothetical increase of 100 basis point (1%) in interest rates of available-for-sale fixed income securities at the end of the reporting period, the net income for the years ended December 31, 2016 and 2015 would have been unaffected as they were classified as available-for-sale; however, the other comprehensive income for the years ended December 31, 2016 and 2015 would have decreased by NT$1,600,929 thousand and NT$271,547 thousand, respectively. Other price risk The Company is exposed to equity price risk arising from available-for-sale equity investments. Assuming a hypothetical decrease of 5% in equity prices of the equity investments at the end of the reporting period, the net income for the years ended December 31, 2016 and 2015 would have been unaffected as they were classified as available-for-sale; however, the other comprehensive income for the years ended December 31, 2016 and 2015 would have decreased by NT$342,565 thousand and NT$259,996 thousand, respectively.
d. Credit risk management Credit risk refers to the risk that a counterparty will default on its contractual obligations resulting in financial loss to the Company. The Company is exposed to credit risk from operating activities, primarily trade receivables, and from investing activities, primarily deposits, fixed-income investments and other financial instruments with banks. Credit risk is managed separately for business related and financial related exposures. As of the end of the reporting period, the Company’s maximum credit risk exposure is mainly from the carrying amount of financial assets recognized in the consolidated balance sheet. Business related credit risk The Company has considerable trade receivables outstanding with its customers worldwide. A substantial majority of the Company’s outstanding trade receivables are not covered by collateral or credit insurance. While the Company has procedures to monitor and limit exposure to credit risk on trade receivables, there can be no assurance such procedures will effectively limit its credit risk and avoid losses. This risk is heightened during periods when economic conditions worsen. As of December 31, 2016 and 2015, the Company’s ten largest customers accounted for 74% and 68% of accounts receivable, respectively. The Company believes the concentration of credit risk is insignificant for the remaining accounts receivable. Financial credit risk The Company regularly monitors and reviews the transaction limit applied to counterparties and adjusts the concentration limit according to market conditions and the credit standing of the counterparties. The Company mitigates its exposure by selecting counterparties with investment-grade credit ratings.
- 67 -

- 68 -
e. Liquidity risk management The objective of liquidity risk management is to ensure the Company has sufficient liquidity to fund its business requirements associated with existing operations over the next 12 months. The Company manages its liquidity risk by maintaining adequate cash. The table below summarizes the maturity profile of the Company’s financial liabilities based on contractual undiscounted payments, including principal and interest.
Less Than
1 Year 2-3 Years 4-5 Years 5+ Years
Total December 31, 2016 Non-derivative financial liabilities Short-term loans $ 57,974,562 $ - $ - $ - $ 57,974,562 Accounts payable (including related
parties) 27,324,525 - - - 27,324,525 Payables to contractors and
equipment suppliers 63,154,514 - - - 63,154,514 Accrued expenses and other current
liabilities 20,713,259 - - - 20,713,259 Bonds payable 40,669,468 99,161,486 35,340,742 22,979,426 198,151,122 Long-term bank loans 10,543 20,116 2,423 - 33,082 Guarantee deposits (including those
classified under accrued expenses and other current liabilities) 12,000,189 13,060,483 1,609,950 - 26,670,622
221,847,060 112,242,085 36,953,115 22,979,426 394,021,686 Derivative financial instruments Forward exchange contracts
Outflows 40,571,841 - - - 40,571,841 Inflows (40,586,344 ) - - - (40,586,344 ) (14,503 ) - - - (14,503 )
Cross currency swap contracts Outflows 5,478,066 - - - 5,478,066 Inflows (5,487,600 ) - - - (5,487,600 ) (9,534 ) - - - (9,534 ) $ 221,823,023 $ 112,242,085 $ 36,953,115 $ 22,979,426 $ 393,997,649
December 31, 2015 Non-derivative financial liabilities Short-term loans $ 39,488,957 $ - $ - $ - $ 39,488,957 Accounts payable (including related
parties) 19,725,274 - - - 19,725,274 Payables to contractors and
equipment suppliers 26,012,192 - - - 26,012,192 Accrued expenses and other current
liabilities 18,900,123 - - - 18,900,123 Bonds payable 26,494,990 104,462,371 68,378,787 25,981,316 225,317,464 Long-term bank loans 8,800 21,540 12,741 - 43,081 Other long-term payables (classified
under accrued expenses and other current liabilities) 18,000 - - - 18,000
Guarantee deposits (including those classified under accrued expenses and other current liabilities) 6,167,813 13,341,051 8,223,750 - 27,732,614
136,816,149 117,824,962 76,615,278 25,981,316 357,237,705 Derivative financial instruments Forward exchange contracts
Outflows 23,192,477 - - - 23,192,477 Inflows (23,135,579 ) - - - (23,135,579 ) 56,898 - - - 56,898 $ 136,873,047 $ 117,824,962 $ 76,615,278 $ 25,981,316 $ 357,294,603
- 68 -

- 69 -
f. Fair value of financial instruments
1) Fair value measurements recognized in the consolidated balance sheets Fair value measurements are grouped into Levels 1 to 3 based on the degree to which the fair value is observable:
Level 1 fair value measurements are those derived from quoted prices (unadjusted) in active markets for identical assets or liabilities;
Level 2 fair value measurements are those derived from inputs other than quoted prices included within Level 1 that are observable for the asset or liability, either directly (i.e. as prices) or indirectly (i.e. derived from prices); and
Level 3 fair value measurements are those derived from valuation techniques that include inputs for the asset or liability that are not based on observable market data (unobservable inputs).
2) Fair value of financial instruments that are measured at fair value on a recurring basis
Fair value hierarchy The following table presents the Company’s financial assets and liabilities measured at fair value on a recurring basis: December 31, 2016 Level 1 Level 2 Level 3 Total Financial assets at FVTPL Held for trading
Forward exchange contracts $ - $ 142,406 $ - $ 142,406 Cross currency swap contracts - 10,976 - 10,976
Designated as at FVTPL Time deposit - 6,297,708 - 6,297,708 Forward exchange contracts - 22 - 22
$ - $ 6,451,112 $ - $ 6,451,112 Available-for-sale financial assets Corporate bonds $ 29,999,508 $ - $ - $ 29,999,508 Agency bonds 14,880,482 - - 14,880,482 Corporate issued asset-backed
securities
- 11,254,757 - 11,254,757 Government bonds 8,457,362 - - 8,457,362 Publicly traded stocks 3,196,658 - - 3,196,658
$ 56,534,010 $ 11,254,757 $ - $ 67,788,767
Hedging derivative financial assets
Interest rate futures contracts $ 5,550 $ - $ - $ 5,550
Financial liabilities at FVTPL Held for trading
Forward exchange contracts $ - $ 91,585 $ - $ 91,585 Designated as at FVTPL
Forward exchange contracts - 99,550 - 99,550
$ - $ 191,135 $ - $ 191,135
- 69 -
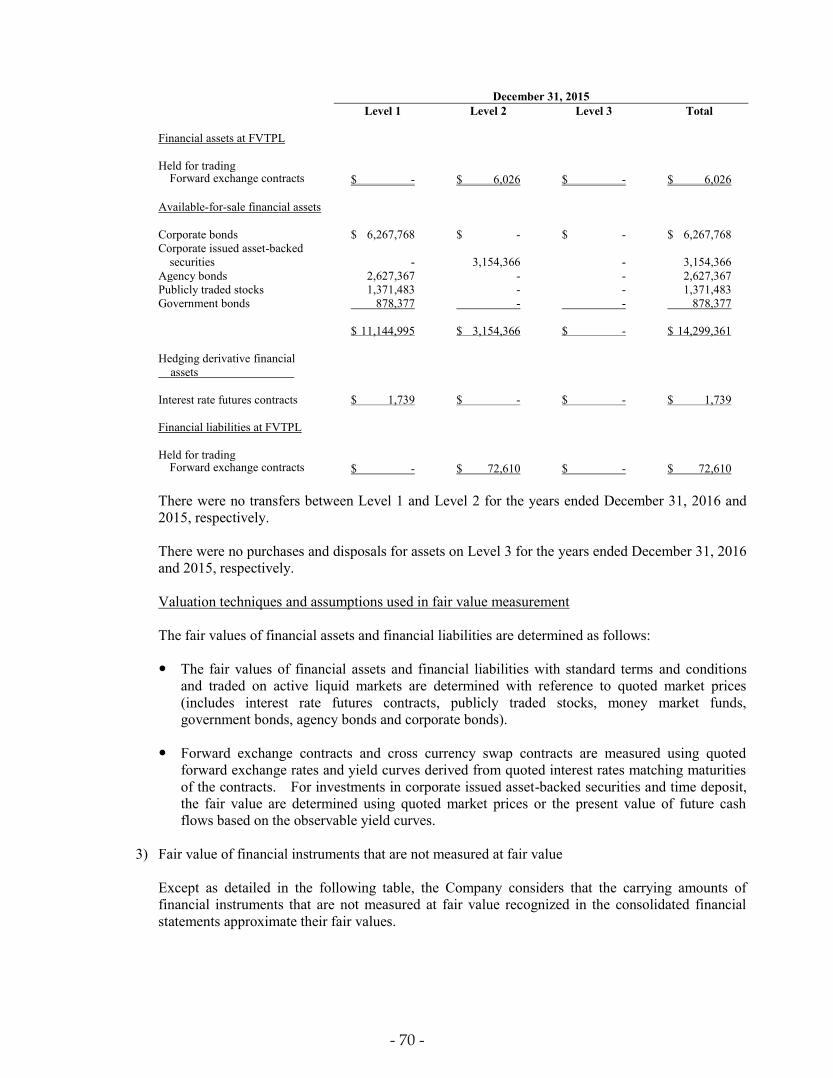
- 70 -
December 31, 2015 Level 1 Level 2 Level 3 Total Financial assets at FVTPL Held for trading
Forward exchange contracts $ - $ 6,026 $ - $ 6,026 Available-for-sale financial assets Corporate bonds $ 6,267,768 $ - $ - $ 6,267,768 Corporate issued asset-backed
securities
- 3,154,366 -
3,154,366 Agency bonds 2,627,367 - - 2,627,367 Publicly traded stocks 1,371,483 - - 1,371,483 Government bonds 878,377 - - 878,377
$ 11,144,995 $ 3,154,366 $ - $ 14,299,361
Hedging derivative financial assets
Interest rate futures contracts $ 1,739 $ - $ - $ 1,739 Financial liabilities at FVTPL Held for trading
Forward exchange contracts $ - $ 72,610 $ - $ 72,610
There were no transfers between Level 1 and Level 2 for the years ended December 31, 2016 and 2015, respectively. There were no purchases and disposals for assets on Level 3 for the years ended December 31, 2016 and 2015, respectively. Valuation techniques and assumptions used in fair value measurement The fair values of financial assets and financial liabilities are determined as follows:
The fair values of financial assets and financial liabilities with standard terms and conditions
and traded on active liquid markets are determined with reference to quoted market prices (includes interest rate futures contracts, publicly traded stocks, money market funds, government bonds, agency bonds and corporate bonds).
Forward exchange contracts and cross currency swap contracts are measured using quoted
forward exchange rates and yield curves derived from quoted interest rates matching maturities of the contracts. For investments in corporate issued asset-backed securities and time deposit, the fair value are determined using quoted market prices or the present value of future cash flows based on the observable yield curves.
3) Fair value of financial instruments that are not measured at fair value
Except as detailed in the following table, the Company considers that the carrying amounts of financial instruments that are not measured at fair value recognized in the consolidated financial statements approximate their fair values.
- 70 -
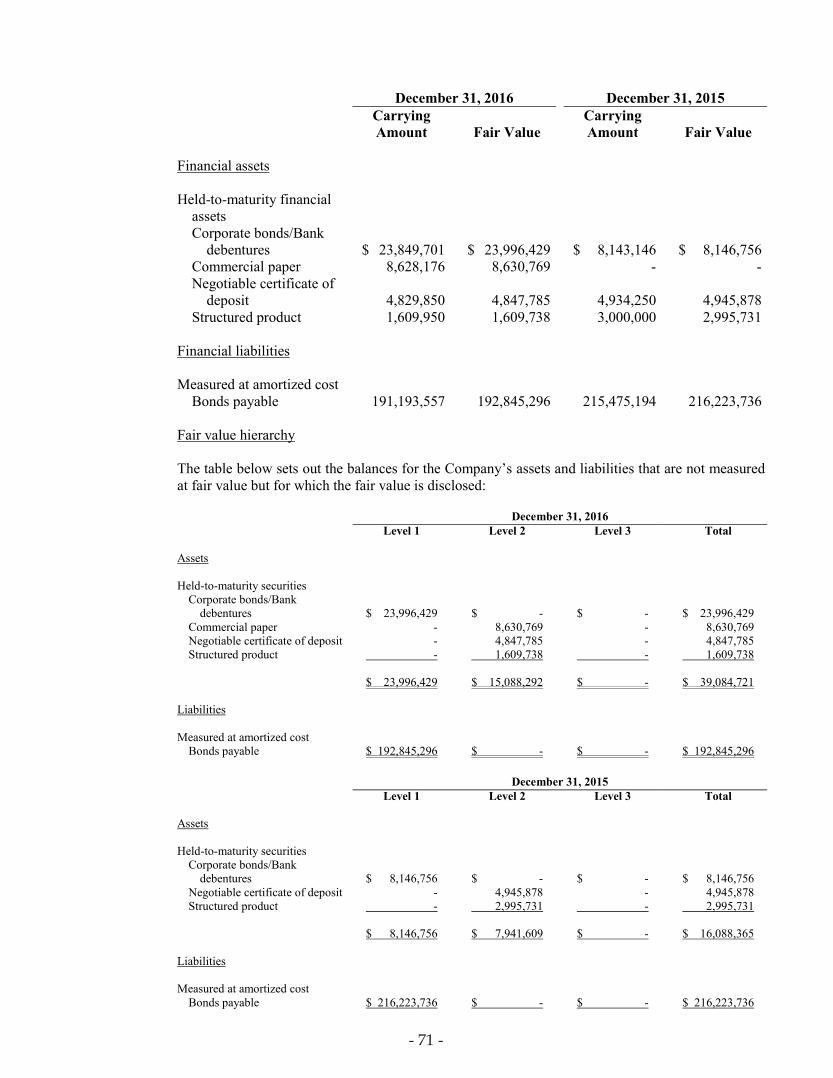
- 71 -
December 31, 2016 December 31, 2015
Carrying
Amount Fair Value Carrying
Amount Fair Value Financial assets Held-to-maturity financial
assets
Corporate bonds/Bank debentures
$ 23,849,701
$ 23,996,429
$ 8,143,146
$ 8,146,756
Commercial paper 8,628,176 8,630,769 - - Negotiable certificate of
deposit
4,829,850
4,847,785
4,934,250
4,945,878 Structured product 1,609,950 1,609,738 3,000,000 2,995,731
Financial liabilities Measured at amortized cost
Bonds payable 191,193,557 192,845,296 215,475,194 216,223,736
Fair value hierarchy The table below sets out the balances for the Company’s assets and liabilities that are not measured at fair value but for which the fair value is disclosed: December 31, 2016 Level 1 Level 2 Level 3 Total Assets Held-to-maturity securities
Corporate bonds/Bank debentures $ 23,996,429 $ - $ -
$ 23,996,429
Commercial paper - 8,630,769 - 8,630,769 Negotiable certificate of deposit - 4,847,785 - 4,847,785 Structured product - 1,609,738 - 1,609,738 $ 23,996,429 $ 15,088,292 $ - $ 39,084,721
Liabilities Measured at amortized cost
Bonds payable $ 192,845,296 $ - $ - $ 192,845,296
December 31, 2015 Level 1 Level 2 Level 3 Total Assets Held-to-maturity securities
Corporate bonds/Bank debentures $ 8,146,756 $ - $ -
$ 8,146,756
Negotiable certificate of deposit - 4,945,878 - 4,945,878 Structured product - 2,995,731 - 2,995,731 $ 8,146,756 $ 7,941,609 $ - $ 16,088,365
Liabilities Measured at amortized cost
Bonds payable $ 216,223,736 $ - $ - $ 216,223,736
- 71 -

- 72 -
Fair value measurement
For investments in bonds, the fair value is determined using active market prices. For investments in commercial paper, negotiable certificate of deposit and structured product, the fair value is determined using the present value of future cash flows based on the observable yield curves.
The fair value of the Company’s bonds payable is determined using active market prices.
37. RELATED PARTY TRANSACTIONS Intercompany balances and transactions between TSMC and its subsidiaries, which are related parties of TSMC, have been eliminated upon consolidation; therefore those items are not disclosed in this note. The following is a summary of significant transactions between the Company and other related parties: a. Net revenue
Years Ended December 31 2016 2015 Item Related Party Categories Net revenue from sale of goods Associates $ 5,929,141 $ 4,253,961
Joint venture - 1,206 $ 5,929,141 $ 4,255,167 Net revenue from royalties Associates $ 516,749 $ 489,420
b. Purchases
Years Ended December 31 2016 2015 Related Party Categories Associates $ 10,108,210 $ 11,126,415
c. Receivables from related parties
December 31, 2016
December 31, 2015
Item Related Party Categories Receivables from related
parties Associates $ 969,559 $ 505,722
Other receivables from related
parties Associates $ 146,788 $ 125,018
- 72 -

- 73 -
d. Payables to related parties
December 31, 2016
December 31, 2015
Item Related Party Categories Payables to related parties Associates $ 1,262,174 $ 1,149,988
e. Acquisition of property, plant and equipment
Acquisition Price Years Ended December 31 2016 2015 Related Party Categories Associates $ - $ 26,207
f. Others
Years Ended December 31 2016 2015 Item Related Party Categories Manufacturing expenses Associates $ 1,389,164 $ 2,321,858 Joint venture - 12,819 $ 1,389,164 $ 2,334,677 Research and development Associates $ 161,735 $ 142,833
expenses Joint venture - 1,398 $ 161,735 $ 144,231
The sales prices and payment terms to related parties were not significantly different from those of sales to third parties. For other related party transactions, price and terms were determined in accordance with mutual agreements. The Company leased machinery and equipment, factory and office from Xintec and VIS. The lease terms and prices were both determined in accordance with mutual agreements. The rental expenses were paid to Xintec and VIS quarterly or monthly; the related expenses were both classified under manufacturing expenses. The Company deferred the disposal gain/loss derived from sales of property, plant and equipment to related parties (transactions with associates and joint venture), and then recognized such gain/loss over the depreciable lives of the disposed assets.
- 73 -

- 74 -
g. Compensation of key management personnel
The compensation to directors and other key management personnel for the years ended December 31, 2016 and 2015 were as follows: Years Ended December 31 2016 2015 Short-term employee benefits $ 2,023,971 $ 1,883,013 Post-employment benefits 3,992 10,926 $ 2,027,963 $ 1,893,939 The compensation to directors and other key management personnel were determined by the Compensation Committee of TSMC in accordance with the individual performance and the market trends.
38. PLEDGED ASSETS The Company provided certificate of deposits recorded in other financial assets as collateral mainly for building lease agreements. As of December 31, 2016 and 2015, the aforementioned other financial assets amounted to NT$185,698 thousand and NT$177,229 thousand, respectively.
39. SIGNIFICANT OPERATING LEASE ARRANGEMENTS The Company leases several parcels of land, office premises and certain office equipment. These operating leases expire between January 2017 and June 2066 and can be renewed upon expiration. The Company expensed the lease payments as follows: Years Ended December 31 2016 2015 Minimum lease payments $ 1,135,735 $ 995,983 Future minimum lease payments under the above non-cancellable operating leases are as follows:
December 31,
2016 December 31,
2015 Not later than 1 year $ 1,321,546 $ 1,099,017 Later than 1 year and not later than 5 years 3,677,432 3,635,180 Later than 5 years 6,623,957 6,921,891 $ 11,622,935 $ 11,656,088
- 74 -

- 75 -
40. SIGNIFICANT CONTINGENT LIABILITIES AND UNRECOGNIZED COMMITMENTS
Significant contingent liabilities and unrecognized commitments of the Company as of the end of the reporting period, excluding those disclosed in other notes, were as follows: a. Under a technical cooperation agreement with Industrial Technology Research Institute, the R.O.C.
Government or its designee approved by TSMC can use up to 35% of TSMC’s capacity provided TSMC’s outstanding commitments to its customers are not prejudiced. The term of this agreement is for five years beginning from January 1, 1987 and is automatically renewed for successive periods of five years unless otherwise terminated by either party with one year prior notice. As of December 31, 2016, the R.O.C. Government did not invoke such right.
b. Under a Shareholders Agreement entered into with Philips and EDB Investments Pte Ltd. on March 30,
1999, the parties formed a joint venture company, SSMC, which is an integrated circuit foundry in Singapore. TSMC’s equity interest in SSMC was 32%. Nevertheless, in September 2006, Philips spun-off its semiconductor subsidiary which was renamed as NXP B.V. Further, TSMC and NXP B.V. purchased all the SSMC shares owned by EDB Investments Pte Ltd. pro rata according to the Shareholders Agreement on November 15, 2006. After the purchase, TSMC and NXP B.V. currently own approximately 39% and 61% of the SSMC shares, respectively. TSMC and NXP B.V. are required, in the aggregate, to purchase at least 70% of SSMC’s capacity, but TSMC alone is not required to purchase more than 28% of the capacity. If any party defaults on the commitment and the capacity utilization of SSMC falls below a specific percentage of its capacity, the defaulting party is required to compensate SSMC for all related unavoidable costs. There was no default from the aforementioned commitment as of December 31, 2016.
c. In June 2010, Keranos, LLC. filed a complaint in the U.S. District Court for the Eastern District of
Texas alleging that TSMC, TSMC North America, and several other leading technology companies infringe three expired U.S. patents. In response, TSMC, TSMC North America, and several co-defendants in the Texas case filed a lawsuit against Keranos in the U.S. District Court for the Northern District of California in November 2010, seeking a judgment declaring that they did not infringe the asserted patents, and that those patents were invalid. These two litigations have been consolidated into a single lawsuit in the U.S. District Court for the Eastern District of Texas. In February 2014, the Court entered a final judgment in favor of TSMC and TSMC North America, dismissing all of Keranos’s claims against TSMC and TSMC North America with prejudice. Keranos appealed the final judgment to the U.S. Court of Appeals for the Federal Circuit, and in August 2015, the Federal Circuit remanded the case back to the Texas court for further proceedings. In January 2017, the Texas court dismissed all of Keranos’s claims against TSMC and TSMC North America with prejudice, and dismissed TSMC’s and TSMC North America’s counterclaims without prejudice. The case is over as to TSMC and TSMC North America.
d. In December 2010, Ziptronix, Inc. filed a complaint in the U.S. District Court for the Northern District
of California accusing TSMC, TSMC North America and one other company of infringing several U.S. patents. In September 2014, the Court granted summary judgment of noninfringement in favor of TSMC and TSMC North America. Ziptronix, Inc. can appeal the Court’s order. In August 2015, Tessera Technologies, Inc. announced it had acquired Ziptronix. In February 2017, the Court dismissed all of Ziptronix’s claims against TSMC and TSMC North America with prejudice.
e. TSMC joined the Customer Co-Investment Program of ASML and entered into the investment
agreement in August 2012. The agreement includes an investment of EUR837,816 thousand by TSMC Global to acquire 5% of ASML’s equity with a lock-up period of 2.5 years. TSMC Global has acquired the aforementioned equity on October 31, 2012. The lock-up period expired on May 1, 2015 and as of October 8, 2015, all ASML shares had been disposed.
Both parties also signed the research and development funding agreement whereby TSMC shall provide EUR276,000 thousand to ASML’s research and development programs from 2013 to 2017. As of
- 75 -

- 76 -
December 31, 2016, TSMC has paid EUR228,603 thousand to ASML under the research and development funding agreement.
f. In March 2014, DSS Technology Management, Inc. (DSS) filed a complaint in the U.S. District Court
for the Eastern District of Texas alleging that TSMC, TSMC North America, TSMC Development and several other companies infringe one U.S. patent. TSMC Development has subsequently been dismissed. In May 2015, the Court entered a final judgment of noninfringement in favor of TSMC and TSMC North America. DSS appealed the final judgment to the U.S. Court of Appeals for the Federal Circuit (Federal Circuit). In November 2015, the Patent Trial and Appeal Board (PTAB) determined after concluding an Inter Partes Review (IPR) that the patent claims asserted by DSS in the District Court litigation are unpatentable. DSS appealed the PTAB’s decision to the Federal Circuit in January 2016. In March 2016, the District Court’s judgment of noninfringement was affirmed by the Federal Circuit. In April 2016, the District Court litigation between the parties and the related Federal Circuit appeal were dismissed, and the appeal proceeding of the PTAB’s decision is also over as to TSMC.
g. Amounts available under unused letters of credit as of December 31, 2016 and 2015 were NT$122,356
thousand and NT$144,738 thousand, respectively. 41. SIGNIFICANT LOSS FROM DISASTER
On February 6, 2016, an earthquake struck Taiwan. The resulting damage was mostly to inventories and equipment. The Company recognized related earthquake losses of NT$2,492,138 thousand, net of insurance claim, for the year ended December 31, 2016. Such losses were primarily included in cost of revenue.
42. EXCHANGE RATE INFORMATION OF FOREIGN-CURRENCY FINANCIAL ASSETS AND
LIABILITIES The following information was summarized according to the foreign currencies other than the functional currency of the Company. The exchange rates disclosed were used to translate the foreign currencies into the functional currency. The significant financial assets and liabilities denominated in foreign currencies were as follows:
Foreign Currencies
(In Thousands) Exchange Rate
(Note 1)
Carrying Amount
(In Thousands) December 31, 2016 Financial assets Monetary items
USD $ 5,042,715 32.199 $ 162,370,381 EUR 19,556 34.30 670,767 JPY 37,024,347 0.2775 10,274,256
Non-monetary items HKD 257,056 4.15 1,066,780
Financial liabilities Monetary items
USD 4,000,930 32.199 128,825,952 EUR 183,922 34.30 6,308,513 JPY 61,062,114 0.2775 16,944,737
(Continued)
- 76 -
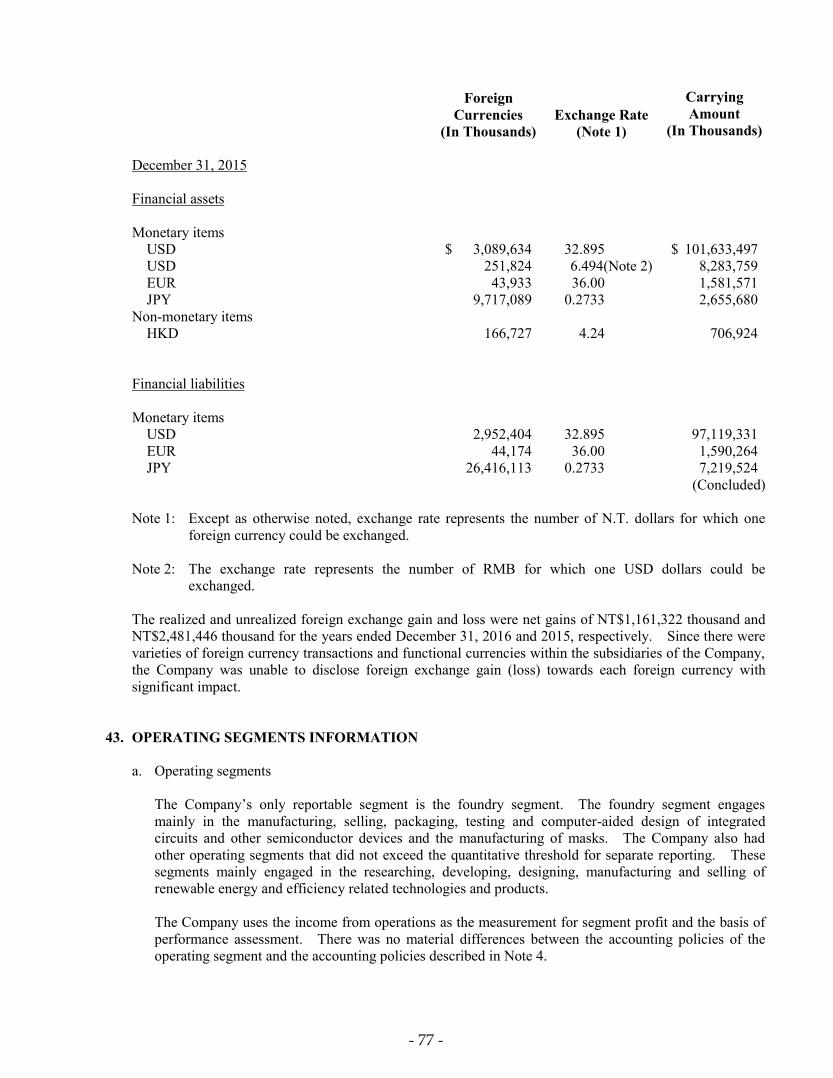
- 77 -
Foreign Currencies
(In Thousands) Exchange Rate
(Note 1)
Carrying Amount
(In Thousands) December 31, 2015 Financial assets Monetary items
USD $ 3,089,634 32.895 $ 101,633,497 USD 251,824 6.494(Note 2) 8,283,759 EUR 43,933 36.00 1,581,571 JPY 9,717,089 0.2733 2,655,680
Non-monetary items HKD 166,727 4.24 706,924
Financial liabilities Monetary items
USD 2,952,404 32.895 97,119,331 EUR 44,174 36.00 1,590,264 JPY 26,416,113 0.2733 7,219,524
(Concluded) Note 1: Except as otherwise noted, exchange rate represents the number of N.T. dollars for which one
foreign currency could be exchanged. Note 2: The exchange rate represents the number of RMB for which one USD dollars could be
exchanged. The realized and unrealized foreign exchange gain and loss were net gains of NT$1,161,322 thousand and NT$2,481,446 thousand for the years ended December 31, 2016 and 2015, respectively. Since there were varieties of foreign currency transactions and functional currencies within the subsidiaries of the Company, the Company was unable to disclose foreign exchange gain (loss) towards each foreign currency with significant impact.
43. OPERATING SEGMENTS INFORMATION
a. Operating segments The Company’s only reportable segment is the foundry segment. The foundry segment engages mainly in the manufacturing, selling, packaging, testing and computer-aided design of integrated circuits and other semiconductor devices and the manufacturing of masks. The Company also had other operating segments that did not exceed the quantitative threshold for separate reporting. These segments mainly engaged in the researching, developing, designing, manufacturing and selling of renewable energy and efficiency related technologies and products. The Company uses the income from operations as the measurement for segment profit and the basis of performance assessment. There was no material differences between the accounting policies of the operating segment and the accounting policies described in Note 4.
- 77 -
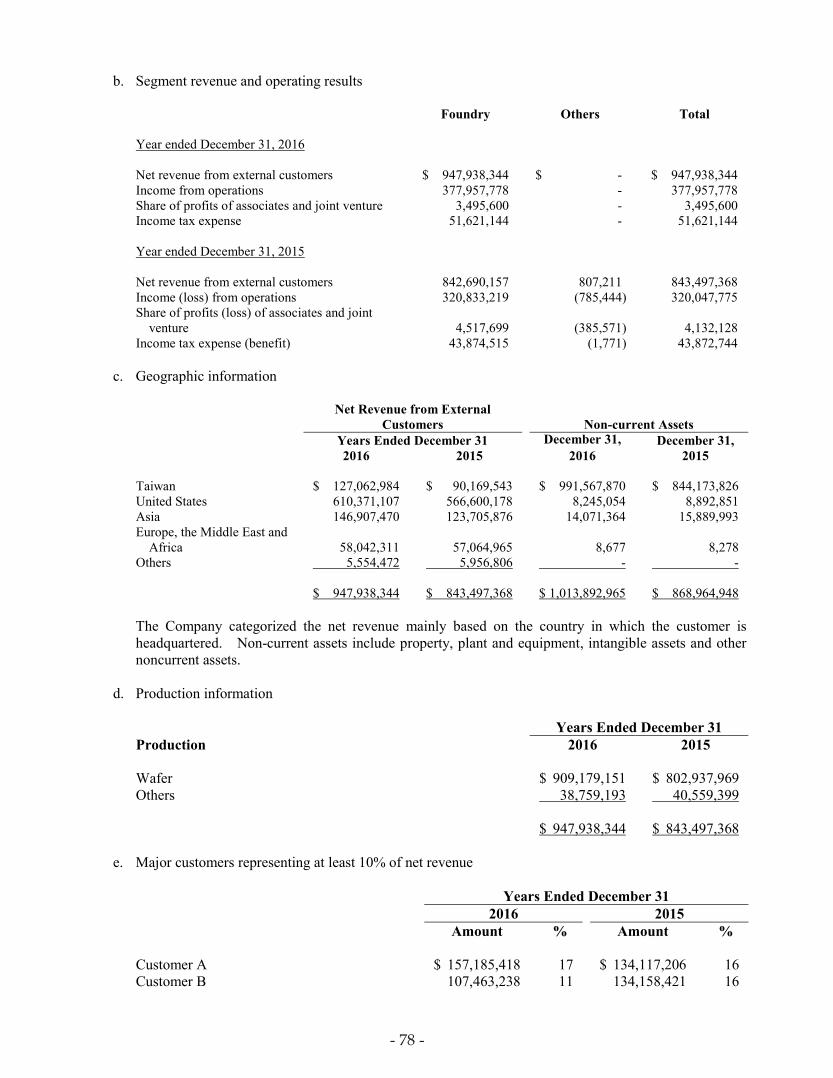
- 78 -
b. Segment revenue and operating results
Foundry Others Total Year ended December 31, 2016 Net revenue from external customers $ 947,938,344 $ - $ 947,938,344 Income from operations 377,957,778 - 377,957,778 Share of profits of associates and joint venture 3,495,600 - 3,495,600 Income tax expense 51,621,144 - 51,621,144 Year ended December 31, 2015 Net revenue from external customers 842,690,157 807,211 843,497,368 Income (loss) from operations 320,833,219 (785,444) 320,047,775 Share of profits (loss) of associates and joint
venture 4,517,699 (385,571) 4,132,128 Income tax expense (benefit) 43,874,515 (1,771) 43,872,744
c. Geographic information
Net Revenue from External Customers
Non-current Assets
Years Ended December 31 December 31, December 31, 2016 2015 2016 2015 Taiwan $ 127,062,984 $ 90,169,543 $ 991,567,870 $ 844,173,826 United States 610,371,107 566,600,178 8,245,054 8,892,851 Asia 146,907,470 123,705,876 14,071,364 15,889,993 Europe, the Middle East and
Africa
58,042,311 57,064,965 8,677 8,278 Others 5,554,472 5,956,806 - - $ 947,938,344 $ 843,497,368 $ 1,013,892,965 $ 868,964,948
The Company categorized the net revenue mainly based on the country in which the customer is headquartered. Non-current assets include property, plant and equipment, intangible assets and other noncurrent assets.
d. Production information
Years Ended December 31 Production 2016 2015 Wafer $ 909,179,151 $ 802,937,969 Others 38,759,193 40,559,399 $ 947,938,344 $ 843,497,368
e. Major customers representing at least 10% of net revenue
Years Ended December 31 2016 2015 Amount % Amount % Customer A $ 157,185,418 17 $ 134,117,206 16 Customer B 107,463,238 11 134,158,421 16
- 78 -
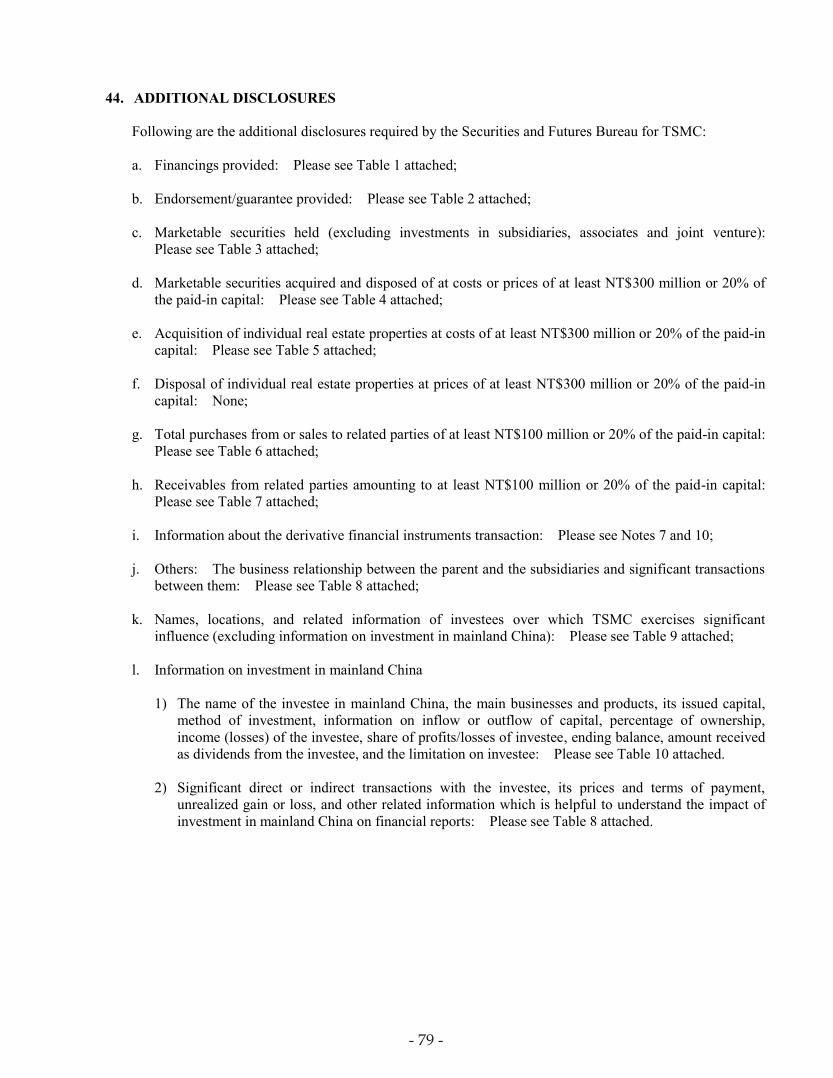
- 79 -
44. ADDITIONAL DISCLOSURES
Following are the additional disclosures required by the Securities and Futures Bureau for TSMC: a. Financings provided: Please see Table 1 attached; b. Endorsement/guarantee provided: Please see Table 2 attached; c. Marketable securities held (excluding investments in subsidiaries, associates and joint venture):
Please see Table 3 attached; d. Marketable securities acquired and disposed of at costs or prices of at least NT$300 million or 20% of
the paid-in capital: Please see Table 4 attached; e. Acquisition of individual real estate properties at costs of at least NT$300 million or 20% of the paid-in
capital: Please see Table 5 attached; f. Disposal of individual real estate properties at prices of at least NT$300 million or 20% of the paid-in
capital: None; g. Total purchases from or sales to related parties of at least NT$100 million or 20% of the paid-in capital:
Please see Table 6 attached; h. Receivables from related parties amounting to at least NT$100 million or 20% of the paid-in capital:
Please see Table 7 attached; i. Information about the derivative financial instruments transaction: Please see Notes 7 and 10; j. Others: The business relationship between the parent and the subsidiaries and significant transactions
between them: Please see Table 8 attached; k. Names, locations, and related information of investees over which TSMC exercises significant
influence (excluding information on investment in mainland China): Please see Table 9 attached; l. Information on investment in mainland China
1) The name of the investee in mainland China, the main businesses and products, its issued capital, method of investment, information on inflow or outflow of capital, percentage of ownership, income (losses) of the investee, share of profits/losses of investee, ending balance, amount received as dividends from the investee, and the limitation on investee: Please see Table 10 attached.
2) Significant direct or indirect transactions with the investee, its prices and terms of payment,
unrealized gain or loss, and other related information which is helpful to understand the impact of investment in mainland China on financial reports: Please see Table 8 attached.
- 79 -

- 80
-
TA
BL
E 1
T
aiw
an S
emic
ondu
ctor
Man
ufac
turi
ng C
ompa
ny L
imite
d an
d Su
bsid
iari
es
FIN
AN
CIN
GS
PRO
VID
ED
FO
R T
HE
YE
AR
EN
DE
D D
EC
EM
BE
R 3
1, 2
016
(Am
ount
s in
Tho
usan
ds o
f New
Tai
wan
Dol
lars
, Unl
ess S
peci
fied
Oth
erw
ise)
N
o.
Fina
ncin
g C
ompa
ny
Cou
nter
-par
ty
Fina
ncia
l Sta
tem
ent
Acc
ount
R
elat
ed
Part
y
Max
imum
B
alan
ce fo
r th
e Pe
riod
(RM
B in
T
hous
ands
) (N
ote
2)
End
ing
Bal
ance
(R
MB
in
Tho
usan
ds)
(Not
e 2)
Am
ount
A
ctua
lly D
raw
n (R
MB
in
Tho
usan
ds)
Inte
rest
Rat
e N
atur
e fo
r Fi
nanc
ing
Tra
nsac
tion
Am
ount
s R
easo
n fo
r Fi
nanc
ing
(Not
e 3)
A
llow
ance
for
Bad
Deb
t
Col
late
ral
Fina
ncin
g L
imits
for
Eac
h B
orro
win
g C
ompa
ny
Fina
ncin
g C
ompa
ny’s
T
otal
Fin
anci
ng
Am
ount
Lim
its
Item
V
alue
1
TSM
C C
hina
TS
MC
Nan
jing
O
ther
rece
ivab
les
from
rela
ted
parti
es
Yes
$
21
,313
,180
(R
MB
4,60
0,00
0) $
21
,313
,180
(R
MB
4,60
0,00
0) $
4,
169,
970
(RM
B
900,
000)
0.
35%
-1.5
%
The
need
for
shor
t-ter
m/lo
ng-te
rm
finan
cing
(Not
e 3)
$
- O
pera
ting
capi
tal
$
- -
$
- $
42
,850
,549
(N
ote
1)
$
42,8
50,5
49
(Not
e 1)
N
ote
1:
The
tota
l am
ount
for l
endi
ng to
a c
ompa
ny fo
r fun
ding
for a
shor
t-ter
m p
erio
d sh
all n
ot e
xcee
d te
n pe
rcen
t (10
%) o
f the
net
wor
th o
f TSM
C C
hina
. I
n ad
ditio
n, th
e to
tal a
mou
nt le
ndab
le to
any
one
bor
row
er sh
all b
e no
mor
e th
an th
irty
perc
ent (
30%
) of t
he b
orro
wer
’s n
et w
orth
. T
he a
bove
re
stric
tion
does
not
app
ly to
the
subs
idia
ries
who
se v
otin
g sh
ares
are
100
% o
wne
d, d
irect
ly o
r ind
irect
ly, b
y TS
MC
. H
owev
er, t
he to
tal a
mou
nt le
ndab
le to
100
% o
wne
d su
bsid
iarie
s by
TSM
C s
hall
not e
xcee
d fo
rty p
erce
nt (4
0%) o
f the
net
wor
th o
f TSM
C C
hina
. W
hen
ther
e is
a le
ndin
g fo
r fun
ding
nee
ds b
y TS
MC
Chi
na to
TSM
C, o
r to
the
subs
idia
ries,
whi
ch a
re n
ot lo
cate
d in
Tai
wan
, dire
ctly
or i
ndire
ctly
who
lly o
wne
d by
TSM
C, t
he le
ndin
g w
ill n
ot b
e su
bjec
t to
the
rest
rictio
n se
t for
th in
the
abov
e pa
ragr
aph
of th
is A
rticl
e.
Not
with
stan
ding
the
fore
goin
g, th
e ag
greg
ate
amou
nt a
vaila
ble
for l
endi
ng a
nd th
e to
tal a
mou
nt le
ndin
g lim
it fo
r suc
h bo
rrow
er st
ill sh
all n
ot e
xcee
d th
e ne
t wor
th o
f TSM
C C
hina
. N
ote
2:
The
max
imum
bal
ance
for t
he p
erio
d an
d en
ding
bal
ance
repr
esen
t the
am
ount
s app
rove
d by
the
Boa
rd o
f Dire
ctor
s.
Not
e 3:
Th
e re
stric
tion
of th
e te
rm o
f eac
h lo
an fo
r fun
ding
not
exc
eedi
ng o
ne y
ear s
hall
not a
pply
to in
ter-
com
pany
loan
s for
fund
ing
betw
een
offs
hore
subs
idia
ries i
n w
hich
the
Com
pany
hol
ds, d
irect
ly o
r ind
irect
ly, 1
00%
of t
he v
otin
g sh
ares
.
- 80
-

- 81
-
TA
BL
E 2
T
aiw
an S
emic
ondu
ctor
Man
ufac
turi
ng C
ompa
ny L
imite
d an
d Su
bsid
iari
es
EN
DO
RSE
ME
NT
S/G
UA
RA
NT
EE
S PR
OV
IDE
D
FOR
TH
E Y
EA
R E
ND
ED
DE
CE
MB
ER
31,
201
6 (A
mou
nts i
n T
hous
ands
of N
ew T
aiw
an D
olla
rs, U
nles
s Spe
cifie
d O
ther
wis
e)
No.
E
ndor
sem
ent/
Gua
rant
ee P
rovi
der
Gua
rant
eed
Part
y L
imits
on
End
orse
men
t/ G
uara
ntee
A
mou
nt
Prov
ided
to E
ach
Gua
rant
eed
Part
y (N
otes
1 a
nd 2
)
Max
imum
B
alan
ce
for
the
Peri
od
(US$
in
Tho
usan
ds)
(Not
e 3)
End
ing
Bal
ance
(U
S$ in
T
hous
ands
) (N
ote
3)
Am
ount
Act
ually
D
raw
n (U
S$ in
T
hous
ands
)
Am
ount
of
End
orse
men
t/ G
uara
ntee
C
olla
tera
lized
by
Prop
ertie
s
Rat
io o
f A
ccum
ulat
ed
End
orse
men
t/ G
uara
ntee
to N
et
Equ
ity p
er
Lat
est F
inan
cial
St
atem
ents
Max
imum
E
ndor
sem
ent/
Gua
rant
ee
Am
ount
A
llow
able
(N
ote
2)
Gua
rant
ee
Prov
ided
by
Pare
nt
Com
pany
Gua
rant
ee
Prov
ided
by
A S
ubsi
diar
y
Gua
rant
ee
Prov
ided
to
Subs
idia
ries
in
Mai
nlan
d C
hina
Nam
e N
atur
e of
R
elat
ions
hip
0 TS
MC
TS
MC
Glo
bal
Subs
idia
ry
$
347,
312,
065
$
48,2
98,5
00
( U
S$ 1
,500
,000
)
$ 37
,028
,850
(
US$
1,1
50,0
00 )
$
37,0
28,8
50
( U
S$ 1
,150
,000
) $
-
2.67
%
$
347,
312,
065
Yes
N
o N
o
TSM
C N
orth
A
mer
ica
Subs
idia
ry
34
7,31
2,06
5
2,
679,
385
( U
S$
83,2
13 )
2,67
9,38
5 (
US$
83
,213
)
2,
679,
385
( U
S$
83,2
13 )
-
0.19
%
347,
312,
065
Yes
N
o N
o
Not
e 1:
Th
e to
tal a
mou
nt o
f th
e gu
aran
tee
prov
ided
by
TSM
C to
any
indi
vidu
al e
ntity
sha
ll no
t exc
eed
ten
perc
ent (
10%
) of
TSM
C’s
net
wor
th, o
r th
e ne
t wor
th o
f suc
h en
tity.
H
owev
er, s
ubsi
diar
ies
who
se v
otin
g sh
ares
are
100
% o
wne
d,
dire
ctly
or i
ndire
ctly
, by
TSM
C a
re n
ot su
bjec
t to
the
abov
e re
stric
tions
afte
r the
app
rova
l of t
he B
oard
of D
irect
ors.
Not
e 2:
Th
e to
tal a
mou
nt o
f gua
rant
ee sh
all n
ot e
xcee
d tw
enty
-five
per
cent
(25%
) of T
SMC
’s n
et w
orth
. N
ote
3:
The
max
imum
bal
ance
for t
he p
erio
d an
d en
ding
bal
ance
repr
esen
t the
am
ount
s app
rove
d by
the
Boa
rd o
f Dire
ctor
s.
- 81
-
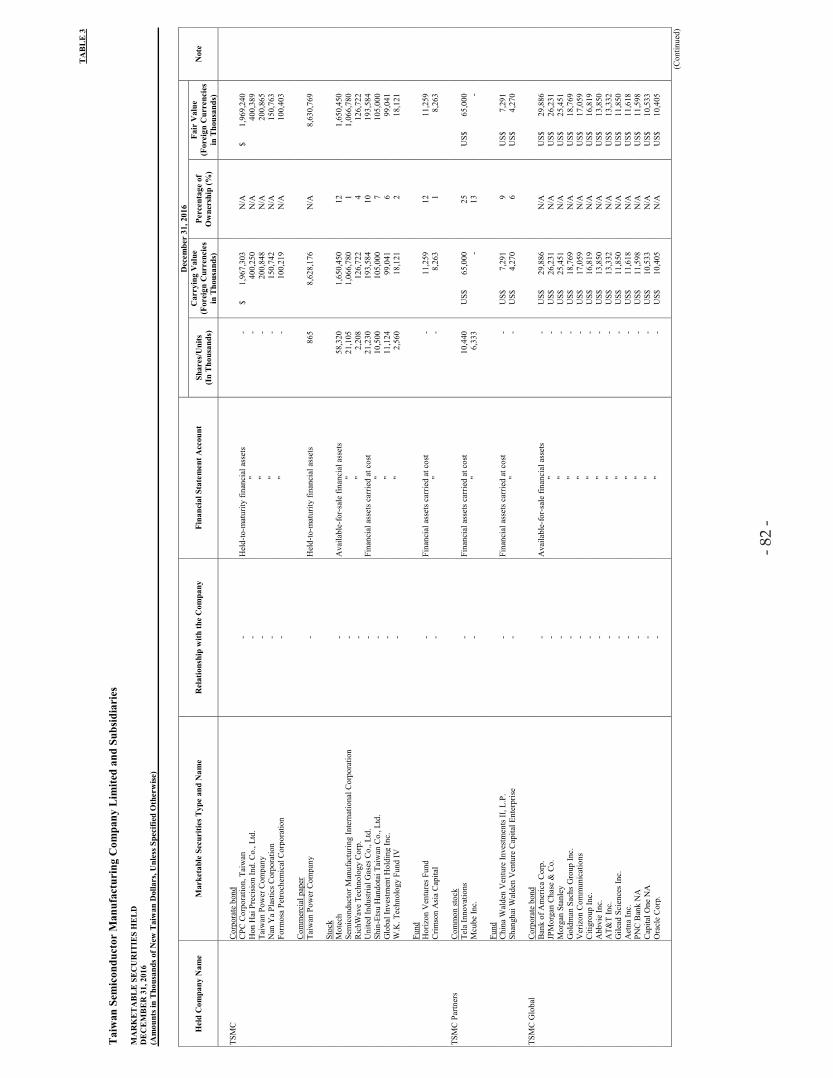
- 82
-
TA
BL
E 3
T
aiw
an S
emic
ondu
ctor
Man
ufac
turi
ng C
ompa
ny L
imite
d an
d Su
bsid
iari
es
MA
RK
ET
AB
LE
SE
CU
RIT
IES
HE
LD
D
EC
EM
BE
R 3
1, 2
016
(Am
ount
s in
Tho
usan
ds o
f New
Tai
wan
Dol
lars
, Unl
ess S
peci
fied
Oth
erw
ise)
Hel
d C
ompa
ny N
ame
Mar
keta
ble
Secu
ritie
s Typ
e an
d N
ame
Rel
atio
nshi
p w
ith th
e C
ompa
ny
Fina
ncia
l Sta
tem
ent A
ccou
nt
Dec
embe
r 31
, 201
6
Not
e Sh
ares
/Uni
ts
(In
Tho
usan
ds)
Car
ryin
g V
alue
(F
orei
gn C
urre
ncie
s in
Tho
usan
ds)
Perc
enta
ge o
f O
wne
rshi
p (%
)
Fair
Val
ue
(For
eign
Cur
renc
ies
in T
hous
ands
)
TSM
C
Cor
pora
te b
ond
CPC
Cor
pora
tion,
Tai
wan
-
Hel
d-to
-mat
urity
fina
ncia
l ass
ets
-
$
1,96
7,30
3 N
/A
$
1,
969,
240
Hon
Hai
Pre
cisi
on In
d. C
o., L
td.
- "
-
40
0,25
0 N
/A
400,
389
Taiw
an P
ower
Com
pany
-
"
-
200,
848
N/A
20
0,86
5
N
an Y
a Pl
astic
s Cor
pora
tion
- "
-
15
0,74
2 N
/A
150,
763
Form
osa
Petro
chem
ical
Cor
pora
tion
- "
-
10
0,21
9 N
/A
100,
403
C
omm
erci
al p
aper
Ta
iwan
Pow
er C
ompa
ny
- H
eld-
to-m
atur
ity fi
nanc
ial a
sset
s
86
5
8,
628,
176
N/A
8,
630,
769
St
ock
Mot
ech
- A
vaila
ble-
for-
sale
fina
ncia
l ass
ets
58,3
20
1,65
0,45
0 12
1,
650,
450
Sem
icon
duct
or M
anuf
actu
ring
Inte
rnat
iona
l Cor
pora
tion
- "
21,1
05
1,06
6,78
0 1
1,06
6,78
0
R
ichW
ave
Tech
nolo
gy C
orp.
-
"
2,
208
126,
722
4
12
6,72
2
U
nite
d In
dust
rial G
ases
Co.
, Ltd
. -
Fina
ncia
l ass
ets c
arrie
d at
cos
t
21
,230
19
3,58
4 10
19
3,58
4
Sh
in-E
tsu
Han
dota
i Tai
wan
Co.
, Ltd
. -
"
10
,500
10
5,00
0 7
105,
000
Glo
bal I
nves
tmen
t Hol
ding
Inc.
-
"
11
,124
99
,041
6
99,0
41
W.K
. Tec
hnol
ogy
Fund
IV
- "
2,56
0
18
,121
2
18,1
21
Fu
nd
Hor
izon
Ven
ture
s Fun
d -
Fina
ncia
l ass
ets c
arrie
d at
cos
t
-
11,2
59
12
11,2
59
Crim
son
Asi
a C
apita
l -
"
-
8,26
3 1
8,26
3
TS
MC
Par
tner
s C
omm
on st
ock
Tela
Inno
vatio
ns
- Fi
nanc
ial a
sset
s car
ried
at c
ost
10,4
40
U
S$
65,0
00
25
U
S$
65,0
00
Mcu
be In
c.
- "
6,33
3
-
13
-
Fund
C
hina
Wal
den
Ven
ture
Inve
stm
ents
II, L
.P.
- Fi
nanc
ial a
sset
s car
ried
at c
ost
-
US$
7,
291
9
US$
7,
291
Shan
ghai
Wal
den
Ven
ture
Cap
ital E
nter
pris
e -
"
-
U
S$
4,27
0 6
U
S$
4,27
0
TS
MC
Glo
bal
Cor
pora
te b
ond
Ban
k of
Am
eric
a C
orp.
-
Ava
ilabl
e-fo
r-sa
le fi
nanc
ial a
sset
s
-
U
S$
29,8
86
N/A
US$
29
,886
JP
Mor
gan
Cha
se &
Co.
-
"
-
U
S$
26,2
31
N/A
US$
26
,231
M
orga
n St
anle
y -
"
-
U
S$
25,4
51
N/A
US$
25
,451
G
oldm
an S
achs
Gro
up In
c.
- "
-
US$
18
,769
N
/A
U
S$
18,7
69
Ver
izon
Com
mun
icat
ions
-
"
-
U
S$
17,0
59
N/A
US$
17
,059
C
itigr
oup
Inc.
-
"
-
U
S$
16,8
19
N/A
US$
16
,819
A
bbvi
e In
c.
- "
-
US$
13
,850
N
/A
U
S$
13,8
50
AT&
T In
c.
- "
-
US$
13
,332
N
/A
U
S$
13,3
32
Gile
ad S
cien
ces I
nc.
- "
-
US$
11
,850
N
/A
U
S$
11,8
50
Aet
na In
c.
- "
-
US$
11
,618
N
/A
U
S$
11,6
18
PNC
Ban
k N
A
- "
-
US$
11
,598
N
/A
U
S$
11,5
98
Cap
ital O
ne N
A
- "
-
US$
10
,533
N
/A
U
S$
10,5
33
Ora
cle
Cor
p.
- "
-
US$
10
,405
N
/A
U
S$
10,4
05
(Con
tinue
d)
- 82
-

- 83
-
Hel
d C
ompa
ny N
ame
Mar
keta
ble
Secu
ritie
s Typ
e an
d N
ame
Rel
atio
nshi
p w
ith th
e C
ompa
ny
Fina
ncia
l Sta
tem
ent A
ccou
nt
Dec
embe
r 31
, 201
6
Not
e Sh
ares
/Uni
ts
(In
Tho
usan
ds)
Car
ryin
g V
alue
(F
orei
gn C
urre
ncie
s in
Tho
usan
ds)
Perc
enta
ge o
f O
wne
rshi
p (%
)
Fair
Val
ue
(For
eign
Cur
renc
ies
in T
hous
ands
)
TSM
C G
loba
l Sv
ensk
a H
ande
lsba
nken
AB
-
Ava
ilabl
e-fo
r-sa
le fi
nanc
ial a
sset
s
-
U
S$
9,83
7 N
/A
U
S$
9,83
7
C
VS
Hea
lth C
orp.
-
"
-
U
S$
9,73
6 N
/A
U
S$
9,73
6
W
estp
ac B
anki
ng C
orp.
-
"
-
U
S$
8,90
5 N
/A
U
S$
8,90
5
A
nheu
ser B
usch
InB
ev F
in.
- "
-
US$
8,
737
N/A
US$
8,
737
Ford
Mot
or C
redi
t Co
LLC
-
"
-
U
S$
8,68
1 N
/A
U
S$
8,68
1
A
nalo
g D
evic
es, I
nc.
- "
-
US$
8,
619
N/A
US$
8,
619
Teva
Pha
rmac
eutic
als N
ethe
rland
s -
"
-
U
S$
8,46
7 N
/A
U
S$
8,46
7
A
mer
ican
Intl.
Gro
up
- "
-
US$
7,
944
N/A
US$
7,
944
Cre
dit S
uiss
e N
ew Y
ork
- "
-
US$
7,
267
N/A
US$
7,
267
BB
&T
Cor
pora
tion
- "
-
US$
7,
189
N/A
US$
7,
189
BM
W U
S C
apita
l LLC
-
"
-
U
S$
7,18
0 N
/A
U
S$
7,18
0
Pr
icoa
Glo
bal F
undi
ng I
- "
-
US$
7,
140
N/A
US$
7,
140
Dai
mle
r Fin
ance
NA
LLC
. -
"
-
U
S$
7,10
1 N
/A
U
S$
7,10
1
B
ank
of N
y M
ello
n C
orp.
-
"
-
U
S$
7,00
6 N
/A
U
S$
7,00
6
B
P C
apita
l Mar
kets
PLC
-
"
-
U
S$
6,65
8 N
/A
U
S$
6,65
8
ER
AC
USA
Fin
ance
LLC
-
"
-
U
S$
6,62
3 N
/A
U
S$
6,62
3
D
uke
Ener
gy C
orp.
-
"
-
U
S$
6,53
5 N
/A
U
S$
6,53
5
So
uthe
rn C
o.
- "
-
US$
6,
510
N/A
US$
6,
510
Ven
tas R
ealty
LP/
Cap
Crp
. -
"
-
U
S$
6,42
9 N
/A
U
S$
6,42
9
C
itize
ns B
ank
NA
/RI
- "
-
US$
6,
331
N/A
US$
6,
331
Sunt
rust
Ban
ks In
c.
- "
-
US$
6,
203
N/A
US$
6,
203
Wel
ltow
er In
c.
- "
-
US$
6,
145
N/A
US$
6,
145
Wel
ls F
argo
& C
ompa
ny
- "
-
US$
6,
127
N/A
US$
6,
127
Am
eric
an E
xpre
ss C
redi
t -
"
-
U
S$
6,04
5 N
/A
U
S$
6,04
5
B
erks
hire
Hat
haw
ay F
in.
- "
-
US$
6,
017
N/A
US$
6,
017
Skan
dina
visk
a En
skild
a B
anke
n A
B
- "
-
US$
6,
001
N/A
US$
6,
001
Sysc
o C
orpo
ratio
n -
"
-
U
S$
5,97
8 N
/A
U
S$
5,97
8
Ex
pres
s Scr
ipts
Hol
ding
-
"
-
U
S$
5,89
9 N
/A
U
S$
5,89
9
To
ront
o D
omin
ion
Ban
k -
"
-
U
S$
5,80
6 N
/A
U
S$
5,80
6
G
roup
e D
anon
e S.
A.
- "
-
US$
5,
763
N/A
US$
5,
763
Shel
l Int
erna
tiona
l Fin
. -
"
-
U
S$
5,71
3 N
/A
U
S$
5,71
3
To
yota
Mot
or C
redi
t Cor
p.
- "
-
US$
5,
633
N/A
US$
5,
633
TIA
A A
sset
Man
agem
ent F
inan
ce L
LC
- "
-
US$
5,
617
N/A
US$
5,
617
AB
N A
MR
O B
ank
N.V
. -
"
-
U
S$
5,57
2 N
/A
U
S$
5,57
2
Pr
otec
tive
Life
Glo
bal F
undi
ng
- "
-
US$
5,
552
N/A
US$
5,
552
Key
Ban
k N
.A.
- "
-
US$
5,
532
N/A
US$
5,
532
Mits
ubis
hi U
FJ F
in G
rp.
- "
-
US$
5,
524
N/A
US$
5,
524
Cis
co S
yste
ms I
nc.
- "
-
US$
5,
511
N/A
US$
5,
511
Hyu
ndai
Cap
ital A
mer
ica
- "
-
US$
5,
471
N/A
US$
5,
471
New
Yor
k Li
fe G
loba
l FD
G
- "
-
US$
5,
445
N/A
US$
5,
445
Siem
ens F
inan
cier
ings
mat
-
"
-
U
S$
5,35
7 N
/A
U
S$
5,35
7
Fi
fth T
hird
Ban
k -
"
-
U
S$
5,34
1 N
/A
U
S$
5,34
1
A
viat
ion
Cap
ital G
roup
-
"
-
U
S$
5,14
4 N
/A
U
S$
5,14
4
Se
mpr
a En
ergy
-
"
-
U
S$
5,14
4 N
/A
U
S$
5,14
4
In
tl. B
ank
Rec
on. &
Dev
elop
men
t -
"
-
U
S$
5,13
7 N
/A
U
S$
5,13
7
H
SBC
Hol
ding
s PLC
-
"
-
U
S$
5,12
4 N
/A
U
S$
5,12
4
U
BS
AG
Sta
mfo
rd C
T -
"
-
U
S$
5,01
7 N
/A
U
S$
5,01
7
Su
mito
mo
Mits
ui T
rust
Ban
k, L
imite
d -
"
-
U
S$
5,00
8 N
/A
U
S$
5,00
8
M
acqu
arie
Gro
up L
td.
- "
-
US$
4,
984
N/A
US$
4,
984
Rel
ianc
e St
and
Life
II
- "
-
US$
4,
925
N/A
US$
4,
925
(Con
tinue
d)
- 83
-
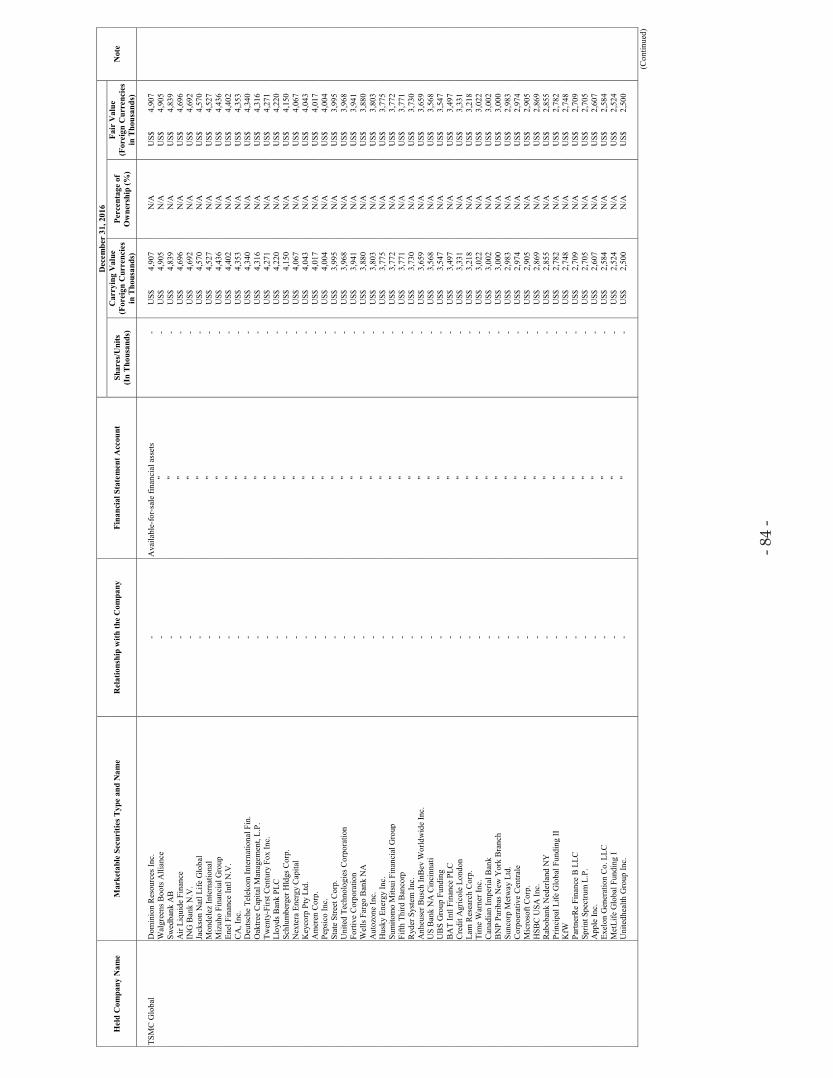
- 84
-
Hel
d C
ompa
ny N
ame
Mar
keta
ble
Secu
ritie
s Typ
e an
d N
ame
Rel
atio
nshi
p w
ith th
e C
ompa
ny
Fina
ncia
l Sta
tem
ent A
ccou
nt
Dec
embe
r 31
, 201
6
Not
e Sh
ares
/Uni
ts
(In
Tho
usan
ds)
Car
ryin
g V
alue
(F
orei
gn C
urre
ncie
s in
Tho
usan
ds)
Perc
enta
ge o
f O
wne
rshi
p (%
)
Fair
Val
ue
(For
eign
Cur
renc
ies
in T
hous
ands
)
TSM
C G
loba
l D
omin
ion
Res
ourc
es In
c.
- A
vaila
ble-
for-
sale
fina
ncia
l ass
ets
-
US$
4,
907
N/A
US$
4,
907
Wal
gree
ns B
oots
Alli
ance
-
"
-
U
S$
4,90
5 N
/A
U
S$
4,90
5
Sw
edba
nk A
B
- "
-
US$
4,
839
N/A
US$
4,
839
Air
Liqu
ide
Fina
nce
- "
-
US$
4,
696
N/A
US$
4,
696
ING
Ban
k N
.V.
- "
-
US$
4,
692
N/A
US$
4,
692
Jack
son
Nat
l Life
Glo
bal
- "
-
US$
4,
570
N/A
US$
4,
570
Mon
dele
z In
tern
atio
nal
- "
-
US$
4,
527
N/A
US$
4,
527
Miz
uho
Fina
ncia
l Gro
up
- "
-
US$
4,
436
N/A
US$
4,
436
Enel
Fin
ance
Intl
N.V
. -
"
-
U
S$
4,40
2 N
/A
U
S$
4,40
2
C
A, I
nc.
- "
-
US$
4,
353
N/A
US$
4,
353
Deu
tsch
e Te
leko
m In
tern
atio
nal F
in.
- "
-
US$
4,
340
N/A
US$
4,
340
Oak
tree
Cap
ital M
anag
emen
t, L.
P.
- "
-
US$
4,
316
N/A
US$
4,
316
Twen
ty-F
irst C
entu
ry F
ox In
c.
- "
-
US$
4,
271
N/A
US$
4,
271
Lloy
ds B
ank
PLC
-
"
-
U
S$
4,22
0 N
/A
U
S$
4,22
0
Sc
hlum
berg
er H
ldgs
Cor
p.
- "
-
US$
4,
150
N/A
US$
4,
150
Nex
tera
Ene
rgy
Cap
ital
- "
-
US$
4,
067
N/A
US$
4,
067
Key
corp
Pty
Ltd
. -
"
-
U
S$
4,04
3 N
/A
U
S$
4,04
3
A
mer
en C
orp.
-
"
-
U
S$
4,01
7 N
/A
U
S$
4,01
7
Pe
psic
o In
c.
- "
-
US$
4,
004
N/A
US$
4,
004
Stat
e St
reet
Cor
p.
- "
-
US$
3,
995
N/A
US$
3,
995
Uni
ted
Tech
nolo
gies
Cor
pora
tion
- "
-
US$
3,
968
N/A
US$
3,
968
Forti
ve C
orpo
ratio
n -
"
-
U
S$
3,94
1 N
/A
U
S$
3,94
1
W
ells
Far
go B
ank
NA
-
"
-
U
S$
3,88
0 N
/A
U
S$
3,88
0
A
utoz
one
Inc.
-
"
-
U
S$
3,80
3 N
/A
U
S$
3,80
3
H
usky
Ene
rgy
Inc.
-
"
-
U
S$
3,77
5 N
/A
U
S$
3,77
5
Su
mito
mo
Mits
ui F
inan
cial
Gro
up
- "
-
US$
3,
772
N/A
US$
3,
772
Fifth
Thi
rd B
anco
rp
- "
-
US$
3,
771
N/A
US$
3,
771
Ryd
er S
yste
m In
c.
- "
-
US$
3,
730
N/A
US$
3,
730
Anh
euse
r Bus
ch In
Bev
Wor
ldw
ide
Inc.
-
"
-
U
S$
3,65
9 N
/A
U
S$
3,65
9
U
S B
ank
NA
Cin
cinn
ati
- "
-
US$
3,
568
N/A
US$
3,
568
UB
S G
roup
Fun
ding
-
"
-
U
S$
3,54
7 N
/A
U
S$
3,54
7
B
AT
Intl
Fina
nce
PLC
-
"
-
U
S$
3,49
7 N
/A
U
S$
3,49
7
C
redi
t Agr
icol
e Lo
ndon
-
"
-
U
S$
3,33
1 N
/A
U
S$
3,33
1
La
m R
esea
rch
Cor
p.
- "
-
US$
3,
218
N/A
US$
3,
218
Tim
e W
arne
r Inc
. -
"
-
U
S$
3,02
2 N
/A
U
S$
3,02
2
C
anad
ian
Impe
rial B
ank
- "
-
US$
3,
002
N/A
US$
3,
002
BN
P Pa
ribas
New
Yor
k B
ranc
h -
"
-
U
S$
3,00
0 N
/A
U
S$
3,00
0
Su
ncor
p M
etw
ay L
td.
- "
-
US$
2,
983
N/A
US$
2,
983
Cor
poer
ativ
e C
entra
le
- "
-
US$
2,
974
N/A
US$
2,
974
Mic
roso
ft C
orp.
-
"
-
U
S$
2,90
5 N
/A
U
S$
2,90
5
H
SBC
USA
Inc.
-
"
-
U
S$
2,86
9 N
/A
U
S$
2,86
9
R
abob
ank
Ned
erla
nd N
Y
- "
-
US$
2,
855
N/A
US$
2,
855
Prin
cipa
l Life
Glo
bal F
undi
ng II
-
"
-
U
S$
2,78
2 N
/A
U
S$
2,78
2
K
fW
- "
-
US$
2,
748
N/A
US$
2,
748
Partn
erR
e Fi
nanc
e B
LLC
-
"
-
U
S$
2,70
9 N
/A
U
S$
2,70
9
Sp
rint S
pect
rum
L.P
. -
"
-
U
S$
2,70
5 N
/A
U
S$
2,70
5
A
pple
Inc.
-
"
-
U
S$
2,60
7 N
/A
U
S$
2,60
7
Ex
elon
Gen
erat
ion
Co.
LLC
-
"
-
U
S$
2,58
4 N
/A
U
S$
2,58
4
M
etLi
fe G
loba
l Fun
ding
I -
"
-
U
S$
2,52
4 N
/A
U
S$
2,52
4
U
nite
dhea
lth G
roup
Inc.
-
"
-
U
S$
2,50
0 N
/A
U
S$
2,50
0
(C
ontin
ued)
- 84
-

- 85
-
Hel
d C
ompa
ny N
ame
Mar
keta
ble
Secu
ritie
s Typ
e an
d N
ame
Rel
atio
nshi
p w
ith th
e C
ompa
ny
Fina
ncia
l Sta
tem
ent A
ccou
nt
Dec
embe
r 31
, 201
6
Not
e Sh
ares
/Uni
ts
(In
Tho
usan
ds)
Car
ryin
g V
alue
(F
orei
gn C
urre
ncie
s in
Tho
usan
ds)
Perc
enta
ge o
f O
wne
rshi
p (%
)
Fair
Val
ue
(For
eign
Cur
renc
ies
in T
hous
ands
)
TSM
C G
loba
l To
ront
o D
omin
Hol
ding
-
Ava
ilabl
e-fo
r-sa
le fi
nanc
ial a
sset
s
-
U
S$
2,47
8 N
/A
U
S$
2,47
8
N
orde
a B
ank
AB
-
"
-
U
S$
2,45
7 N
/A
U
S$
2,45
7
C
omm
onw
ealth
Ban
k A
ustra
lia N
Y
- "
-
US$
2,
404
N/A
US$
2,
404
Mar
riott
Inte
rnat
iona
l, In
c.
- "
-
US$
2,
399
N/A
US$
2,
399
Dow
Che
mic
al C
o/Th
e -
"
-
U
S$
2,35
7 N
/A
U
S$
2,35
7
M
ckes
son
Cor
p.
- "
-
US$
2,
253
N/A
US$
2,
253
Publ
ic S
ervi
ce C
olor
ado
- "
-
US$
2,
166
N/A
US$
2,
166
Alli
ed W
orld
Ass
uran
ce
- "
-
US$
2,
155
N/A
US$
2,
155
Cel
gene
Cor
p.
- "
-
US$
2,
115
N/A
US$
2,
115
Stan
corp
Fin
anci
al G
roup
-
"
-
U
S$
2,09
7 N
/A
U
S$
2,09
7
Jo
hnso
n Co
ntro
ls In
tern
atio
nal P
LC
- "
-
US$
2,
052
N/A
US$
2,
052
The
Bea
r Ste
arns
Com
pani
es L
LC.
- "
-
US$
2,
011
N/A
US$
2,
011
Brit
ish
Tele
com
mun
icat
ions
PLC
-
"
-
U
S$
2,01
1 N
/A
U
S$
2,01
1
Er
ste
Ban
k de
r oes
terr
eich
isch
en S
park
asse
n A
G
- "
-
US$
2,
000
N/A
US$
2,
000
Nor
inch
ukin
Ban
k -
"
-
U
S$
2,00
0 N
/A
U
S$
2,00
0
N
ordi
c In
vest
men
t Ban
k -
"
-
U
S$
1,99
6 N
/A
U
S$
1,99
6
FM
S W
ertm
anag
emen
t -
"
-
U
S$
1,99
5 N
/A
U
S$
1,99
5
A
sian
Dev
elop
men
t Ban
k -
"
-
U
S$
1,99
4 N
/A
U
S$
1,99
4
K
ells
Fun
ding
LLC
-
"
-
U
S$
1,99
3 N
/A
U
S$
1,99
3
M
agel
lan
Mid
stre
am P
artn
ers L
P -
"
-
U
S$
1,97
1 N
/A
U
S$
1,97
1
St
ryke
r Cor
p.
- "
-
US$
1,
951
N/A
US$
1,
951
Nat
iona
l Aus
tralia
Ban
k/N
Y
- "
-
US$
1,
944
N/A
US$
1,
944
Hun
tingt
on N
atio
nal B
ank
- "
-
US$
1,
911
N/A
US$
1,
911
BPC
E SA
-
"
-
U
S$
1,91
0 N
/A
U
S$
1,91
0
Su
mito
mo
Mits
ui B
anki
ng
- "
-
US$
1,
898
N/A
US$
1,
898
Roy
al B
ank
of C
anad
a -
"
-
U
S$
1,89
3 N
/A
U
S$
1,89
3
O
ncor
Ele
ctric
Del
iver
y -
"
-
U
S$
1,85
3 N
/A
U
S$
1,85
3
W
estR
ock
RK
T C
ompa
ny
- "
-
US$
1,
843
N/A
US$
1,
843
Ora
nge
S.A
. -
"
-
U
S$
1,82
4 N
/A
U
S$
1,82
4
R
egen
cy C
ente
rs, L
.P.
- "
-
US$
1,
817
N/A
US$
1,
817
Lyon
dellB
asel
l Ind
ustri
es N
.V.
- "
-
US$
1,
796
N/A
US$
1,
796
Aus
t. &
NZ
Ban
king
Grp
. NY
-
"
-
U
S$
1,79
4 N
/A
U
S$
1,79
4
So
uthe
rn P
ower
Com
pany
-
"
-
U
S$
1,78
5 N
/A
U
S$
1,78
5
D
omin
ion
Gas
Hol
ding
s, LL
C
- "
-
US$
1,
764
N/A
US$
1,
764
Car
dina
l Hea
lth In
c.
- "
-
US$
1,
754
N/A
US$
1,
754
Kim
co R
ealty
Cor
p.
- "
-
US$
1,
739
N/A
US$
1,
739
Am
gen
Inc.
-
"
-
U
S$
1,70
6 N
/A
U
S$
1,70
6
Ty
son
Food
s, In
c.
- "
-
US$
1,
704
N/A
US$
1,
704
Ente
rpris
e Pr
oduc
ts O
pera
ting,
LLC
-
"
-
U
S$
1,69
7 N
/A
U
S$
1,69
7
D
euts
che
Ban
k A
G, L
ondo
n -
"
-
U
S$
1,64
4 N
/A
U
S$
1,64
4
Pa
cific
Gas
& E
lect
ric
- "
-
US$
1,
633
N/A
US$
1,
633
Tran
s Can
ada
Pipe
lines
-
"
-
U
S$
1,56
6 N
/A
U
S$
1,56
6
A
frica
n D
evel
opm
ent B
ank
- "
-
US$
1,
562
N/A
US$
1,
562
Cap
ital O
ne B
ank
(USA
), N
A
- "
-
US$
1,
553
N/A
US$
1,
553
Bra
nch
Ban
king
& T
rust
-
"
-
U
S$
1,53
2 N
/A
U
S$
1,53
2
Si
mon
Pro
perty
Gro
up L
P -
"
-
U
S$
1,50
7 N
/A
U
S$
1,50
7
H
allib
urto
n Co
. -
"
-
U
S$
1,50
5 N
/A
U
S$
1,50
5
Pf
izer
Inc.
-
"
-
U
S$
1,49
1 N
/A
U
S$
1,49
1
St
anda
rd C
harte
red
PLC
-
"
-
U
S$
1,48
7 N
/A
U
S$
1,48
7
Su
ncor
Ene
rgy,
Inc.
-
"
-
U
S$
1,48
2 N
/A
U
S$
1,48
2
(C
ontin
ued)
- 85
-

- 86
-
Hel
d C
ompa
ny N
ame
Mar
keta
ble
Secu
ritie
s Typ
e an
d N
ame
Rel
atio
nshi
p w
ith th
e C
ompa
ny
Fina
ncia
l Sta
tem
ent A
ccou
nt
Dec
embe
r 31
, 201
6
Not
e Sh
ares
/Uni
ts
(In
Tho
usan
ds)
Car
ryin
g V
alue
(F
orei
gn C
urre
ncie
s in
Tho
usan
ds)
Perc
enta
ge o
f O
wne
rshi
p (%
)
Fair
Val
ue
(For
eign
Cur
renc
ies
in T
hous
ands
)
TSM
C G
loba
l W
estp
ac B
anki
ng C
orp.
-
Ava
ilabl
e-fo
r-sa
le fi
nanc
ial a
sset
s
-
U
S$
1,48
1 N
/A
U
S$
1,48
1
Pr
octe
r & G
ambl
e C
o/Th
e -
"
-
U
S$
1,47
2 N
/A
U
S$
1,47
2
H
SBC
Ban
k PL
C
- "
-
US$
1,
468
N/A
US$
1,
468
Gua
rdia
n Li
fe G
loba
l Fun
ding
-
"
-
U
S$
1,46
1 N
/A
U
S$
1,46
1
G
ener
al E
lect
ric C
o.
- "
-
US$
1,
417
N/A
US$
1,
417
East
man
Che
mic
al C
ompa
ny
- "
-
US$
1,
407
N/A
US$
1,
407
Con
ocoP
hilli
ps
- "
-
US$
1,
396
N/A
US$
1,
396
Wal
t Dis
ney
Com
pany
/The
-
"
-
U
S$
1,39
6 N
/A
U
S$
1,39
6
Pa
cifiC
orp
- "
-
US$
1,
387
N/A
US$
1,
387
Deu
tsch
e B
ank
AG
-
"
-
U
S$
1,35
1 N
/A
U
S$
1,35
1
B
ioge
n In
c.
- "
-
US$
1,
343
N/A
US$
1,
343
IBM
Cor
p.
- "
-
US$
1,
308
N/A
US$
1,
308
Eato
n Co
rp.
- "
-
US$
1,
307
N/A
US$
1,
307
Sant
ande
r UK
PLC
-
"
-
U
S$
1,28
9 N
/A
U
S$
1,28
9
Ph
ilip
Mor
ris In
tl In
c.
- "
-
US$
1,
287
N/A
US$
1,
287
Equi
fax
Inc.
-
"
-
U
S$
1,28
2 N
/A
U
S$
1,28
2
A
mer
ican
Airl
ines
201
3-2
- "
-
US$
1,
278
N/A
US$
1,
278
Vis
a In
c.
- "
-
US$
1,
277
N/A
US$
1,
277
Nis
san
Mot
or A
ccep
tanc
e -
"
-
U
S$
1,25
6 N
/A
U
S$
1,25
6
K
roge
r Co.
-
"
-
U
S$
1,25
4 N
/A
U
S$
1,25
4
C
SX C
orp.
-
"
-
U
S$
1,24
8 N
/A
U
S$
1,24
8
B
anqu
e Fe
d C
red
Mut
uel
- "
-
US$
1,
178
N/A
US$
1,
178
ON
EOK
Par
tner
s LP
- "
-
US$
1,
160
N/A
US$
1,
160
Cor
ning
Inc.
-
"
-
U
S$
1,14
2 N
/A
U
S$
1,14
2
Pu
blic
Ser
vice
Ent
erpr
ise
Gro
up In
c.
- "
-
US$
1,
138
N/A
US$
1,
138
ERP
Ope
ratin
g LP
-
"
-
U
S$
1,12
3 N
/A
U
S$
1,12
3
B
erks
hire
Hat
haw
ay In
c.
- "
-
US$
1,
119
N/A
US$
1,
119
Che
vron
Cor
p.
- "
-
US$
1,
103
N/A
US$
1,
103
Med
troni
c In
c.
- "
-
US$
1,
098
N/A
US$
1,
098
Wes
farm
ers L
td.
-
"
-
U
S$
1,09
4 N
/A
U
S$
1,09
4
M
arsh
& M
clen
nan
Cos
Inc.
-
"
-
U
S$
1,08
8 N
/A
U
S$
1,08
8
In
tern
atio
nal P
aper
Com
pany
-
"
-
U
S$
1,08
0 N
/A
U
S$
1,08
0
B
NP
Parib
as
- "
-
US$
1,
071
N/A
US$
1,
071
Cig
na C
orpo
ratio
n -
"
-
U
S$
1,06
9 N
/A
U
S$
1,06
9
C
omca
st C
orp.
-
"
-
U
S$
1,05
6 N
/A
U
S$
1,05
6
M
erck
& C
o In
c.
- "
-
US$
1,
055
N/A
US$
1,
055
EOG
Res
ourc
es, I
nc.
- "
-
US$
1,
053
N/A
US$
1,
053
Ber
kshi
re H
atha
way
Ene
rgy
Co.
-
"
-
U
S$
1,05
1 N
/A
U
S$
1,05
1
Li
ncol
n N
atio
nal C
orp.
-
"
-
U
S$
1,04
8 N
/A
U
S$
1,04
8
M
acy's
Ret
ail H
oldi
ngs I
nc.
- "
-
US$
1,
027
N/A
US$
1,
027
Stat
oil A
SA
- "
-
US$
1,
020
N/A
US$
1,
020
Am
azon
.com
Inc.
-
"
-
U
S$
1,01
9 N
/A
U
S$
1,01
9
A
ltera
Cor
p.
- "
-
US$
1,
017
N/A
US$
1,
017
HP
Ente
rpris
e C
o.
- "
-
US$
1,
010
N/A
US$
1,
010
Hom
e D
epot
Inc.
-
"
-
U
S$
1,00
9 N
/A
U
S$
1,00
9
R
ealty
Inco
me
Cor
p.
- "
-
US$
1,
008
N/A
US$
1,
008
Man
uf &
Tra
ders
Tru
st C
o.
- "
-
US$
1,
007
N/A
US$
1,
007
Car
niva
l Cor
p.
- "
-
US$
1,
004
N/A
US$
1,
004
John
Dee
re C
apita
l Cor
p.
- "
-
US$
1,
004
N/A
US$
1,
004
Mac
quar
ie B
ank
Ltd.
-
"
-
U
S$
1,00
3 N
/A
U
S$
1,00
3
(C
ontin
ued)
- 86
-

- 87
-
Hel
d C
ompa
ny N
ame
Mar
keta
ble
Secu
ritie
s Typ
e an
d N
ame
Rel
atio
nshi
p w
ith th
e C
ompa
ny
Fina
ncia
l Sta
tem
ent A
ccou
nt
Dec
embe
r 31
, 201
6
Not
e Sh
ares
/Uni
ts
(In
Tho
usan
ds)
Car
ryin
g V
alue
(F
orei
gn C
urre
ncie
s in
Tho
usan
ds)
Perc
enta
ge o
f O
wne
rshi
p (%
)
Fair
Val
ue
(For
eign
Cur
renc
ies
in T
hous
ands
)
TSM
C G
loba
l C
ater
pilla
r Fin
anci
al S
ervi
ces C
orp.
-
Ava
ilabl
e-fo
r-sa
le fi
nanc
ial a
sset
s
-
U
S$
1,00
0 N
/A
U
S$
1,00
0
N
isou
rce
Fina
nce
Cor
p.
- "
-
US$
99
6 N
/A
U
S$
996
Geo
rgia
-Pac
ific
LLC
-
"
-
U
S$
988
N/A
US$
98
8
D
uke
Rea
lty L
P -
"
-
U
S$
972
N/A
US$
97
2
Te
xas E
aste
rn T
rans
mis
sion
, LP
- "
-
US$
97
2 N
/A
U
S$
972
Duk
e En
ergy
Pro
gres
s Inc
. -
"
-
U
S$
962
N/A
US$
96
2
G
laxo
smith
klin
e C
ap. I
nc.
- "
-
US$
95
0 N
/A
U
S$
950
Sout
hern
Ele
ctric
Gen
erat
ing
Com
pany
-
"
-
U
S$
909
N/A
US$
90
9
Lo
ckhe
ed M
artin
Cor
p.
- "
-
US$
90
4 N
/A
U
S$
904
Sven
ska
Han
dels
bank
en A
B (p
ubl)
- "
-
US$
89
1 N
/A
U
S$
891
AX
A F
inan
cial
, Inc
. -
"
-
U
S$
886
N/A
US$
88
6
Fe
dera
l Rea
lty In
vs T
rust
-
"
-
U
S$
883
N/A
US$
88
3
M
aste
rcar
d In
c.
- "
-
US$
85
5 N
/A
U
S$
855
Nuc
or C
orpo
ratio
n -
"
-
U
S$
843
N/A
US$
84
3
A
XIS
Spe
cial
ty F
inan
ce P
LC
- "
-
US$
82
1 N
/A
U
S$
821
Paci
fic L
ifeC
orp
- "
-
US$
81
6 N
/A
U
S$
816
Ban
k O
f Mon
treal
-
"
-
U
S$
812
N/A
US$
81
2
So
ciet
e G
ener
ale
Gro
up
- "
-
US$
81
0 N
/A
U
S$
810
Xyl
em In
c.
- "
-
US$
80
9 N
/A
U
S$
809
Man
ulife
Fin
anci
al C
orpo
ratio
n -
"
-
U
S$
804
N/A
US$
80
4
C
ox C
omm
unic
atio
ns, I
nc.
- "
-
US$
79
1 N
/A
U
S$
791
Kon
inkl
ijke
Phili
ps N
.V.
- "
-
US$
78
6 N
/A
U
S$
786
CM
S En
ergy
Cor
p.
- "
-
US$
77
2 N
/A
U
S$
772
Cro
wn
Cas
tle T
ower
s LLC
-
"
-
U
S$
758
N/A
US$
75
8
H
CP
Inc.
-
"
-
U
S$
751
N/A
US$
75
1
So
uthe
rn R
ailw
ay C
o.
- "
-
US$
74
1 N
/A
U
S$
741
DTE
Ele
ctric
Com
pany
-
"
-
U
S$
718
N/A
US$
71
8
B
aker
Hug
hes I
ncor
pora
ted
- "
-
US$
71
4 N
/A
U
S$
714
Reg
ions
Fin
anci
al C
orpo
ratio
n -
"
-
U
S$
710
N/A
US$
71
0
To
tal C
apita
l Int
erna
tiona
l S.A
. -
"
-
U
S$
703
N/A
US$
70
3
C
ontin
enta
l Airl
ines
Inc.
-
"
-
U
S$
700
N/A
US$
70
0
TT
X C
o.
- "
-
US$
70
0 N
/A
U
S$
700
Scen
tre G
roup
-
"
-
U
S$
699
N/A
US$
69
9
A
ir Le
ase
Cor
pora
tion
- "
-
US$
69
6 N
/A
U
S$
696
Car
gill,
Inco
rpor
ated
-
"
-
U
S$
693
N/A
US$
69
3
D
ansk
e B
ank
A/S
-
"
-
U
S$
689
N/A
US$
68
9
En
terg
y Lo
uisi
ana,
LLC
-
"
-
U
S$
676
N/A
US$
67
6
O
hio
Pow
er C
ompa
ny
- "
-
US$
66
9 N
/A
U
S$
669
Nat
iona
l Ret
ail P
rope
rties
, Inc
. -
"
-
U
S$
663
N/A
US$
66
3
C
apita
l One
Fin
anci
al C
o.
- "
-
US$
66
1 N
/A
U
S$
661
Libe
rty P
rope
rty L
P -
"
-
U
S$
638
N/A
US$
63
8
G
rupo
Bim
bo, S
.A.B
. de
C.V
. -
"
-
U
S$
637
N/A
US$
63
7
Po
tash
Cor
p Sa
skat
chew
an In
c.
- "
-
US$
63
7 N
/A
U
S$
637
AB
C In
c.
- "
-
US$
62
1 N
/A
U
S$
621
Life
Tec
hnol
ogie
s Cor
p.
- "
-
US$
62
0 N
/A
U
S$
620
Dr P
eppe
r Sna
pple
Gro
up, I
nc.
- "
-
US$
61
4 N
/A
U
S$
614
Kim
berly
Cla
rk C
orp.
-
"
-
U
S$
604
N/A
US$
60
4
B
ayer
US
Fina
nce
LLC
-
"
-
U
S$
599
N/A
US$
59
9
C
ente
rPoi
nt E
nerg
y R
esou
rces
-
"
-
U
S$
594
N/A
US$
59
4
H
ost H
otel
s & R
esor
ts, I
nc.
- "
-
US$
59
0 N
/A
U
S$
590
(Con
tinue
d)
- 87
-

- 88
-
Hel
d C
ompa
ny N
ame
Mar
keta
ble
Secu
ritie
s Typ
e an
d N
ame
Rel
atio
nshi
p w
ith th
e C
ompa
ny
Fina
ncia
l Sta
tem
ent A
ccou
nt
Dec
embe
r 31
, 201
6
Not
e Sh
ares
/Uni
ts
(In
Tho
usan
ds)
Car
ryin
g V
alue
(F
orei
gn C
urre
ncie
s in
Tho
usan
ds)
Perc
enta
ge o
f O
wne
rshi
p (%
)
Fair
Val
ue
(For
eign
Cur
renc
ies
in T
hous
ands
)
TSM
C G
loba
l M
UFG
Uni
on B
ank,
N.A
. -
Ava
ilabl
e-fo
r-sa
le fi
nanc
ial a
sset
s
-
U
S$
586
N/A
US$
58
6
A
valo
nBay
Com
mun
ities
Inc.
-
"
-
U
S$
581
N/A
US$
58
1
B
unge
Lim
ited
Fina
nce
Cor
p.
- "
-
US$
57
3 N
/A
U
S$
573
Bos
ton
Prop
ertie
s LP
- "
-
US$
56
2 N
/A
U
S$
562
Nor
dstro
m In
c.
- "
-
US$
55
3 N
/A
U
S$
553
Cai
sse
Cen
trale
Des
jard
ins
- "
-
US$
54
9 N
/A
U
S$
549
Dig
ital R
ealty
Tru
st, L
.P.
- "
-
US$
54
4 N
/A
U
S$
544
Mcd
onal
d's C
orp.
-
"
-
U
S$
543
N/A
US$
54
3
So
uthw
este
rn E
lect
ric P
ower
Com
pany
-
"
-
U
S$
543
N/A
US$
54
3
Pr
uden
tial F
inan
cial
Inc.
-
"
-
U
S$
540
N/A
US$
54
0
O
'Rei
lly A
utom
otiv
e In
c.
- "
-
US$
53
7 N
/A
U
S$
537
TD A
mer
itrad
e H
oldi
ng C
orp.
-
"
-
U
S$
535
N/A
US$
53
5
A
mer
ican
Exp
ress
Co.
-
"
-
U
S$
531
N/A
US$
53
1
B
urlin
gton
Nor
ther
n Sa
nta
Fe C
orp.
-
"
-
U
S$
526
N/A
US$
52
6
In
ter-
Am
eric
an D
evel
opm
ent B
ank
- "
-
US$
50
7 N
/A
U
S$
507
PSEG
Pow
er L
LC
- "
-
US$
50
4 N
/A
U
S$
504
CB
S C
orp.
-
"
-
U
S$
503
N/A
US$
50
3
C
omer
ica
Inc.
-
"
-
U
S$
474
N/A
US$
47
4
H
oney
wel
l Int
erna
tiona
l Inc
. -
"
-
U
S$
464
N/A
US$
46
4
N
atio
nwid
e B
uild
ing
Soci
ety
- "
-
US$
44
5 N
/A
U
S$
445
Val
ero
Ener
gy C
orp.
-
"
-
U
S$
441
N/A
US$
44
1
B
lack
ston
e H
oldi
ngs F
inan
ce C
o., L
LC
- "
-
US$
42
9 N
/A
U
S$
429
Exxo
n M
obil
Corp
orat
ion
- "
-
US$
40
0 N
/A
U
S$
400
Con
ocop
hilli
ps C
ompa
ny
- "
-
US$
39
9 N
/A
U
S$
399
Vol
ksw
agen
Gro
up o
f Am
eric
a, In
c.
- "
-
US$
39
8 N
/A
U
S$
398
Firs
t Nia
gara
Fin
anci
al G
roup
, Inc
. -
"
-
U
S$
394
N/A
US$
39
4
A
on C
orp.
-
"
-
U
S$
394
N/A
US$
39
4
N
atio
nwid
e Fi
nanc
ial S
ervi
ce, I
nc.
- "
-
US$
38
2 N
/A
U
S$
382
Am
eric
an H
onda
Fin
ance
-
"
-
U
S$
368
N/A
US$
36
8
W
m. W
rigle
y Jr
. Co.
-
"
-
U
S$
353
N/A
US$
35
3
M
etlif
e In
c.
- "
-
US$
32
9 N
/A
U
S$
329
Pear
son
Dol
Fin
Tw
o PL
C
- "
-
US$
31
5 N
/A
U
S$
315
Bar
clay
s Ban
k PL
C
- "
-
US$
29
2 N
/A
U
S$
292
BA
E Sy
stem
s Hol
ding
s, In
c.
- "
-
US$
29
2 N
/A
U
S$
292
EMD
Fin
ance
LLC
-
"
-
U
S$
278
N/A
US$
27
8
M
atte
l Inc
. -
"
-
U
S$
268
N/A
US$
26
8
U
.S. B
anco
rp
- "
-
US$
26
2 N
/A
U
S$
262
Nom
ura
Hol
ding
s Inc
. -
"
-
U
S$
252
N/A
US$
25
2
K
ansa
s City
Pow
er &
Lig
ht C
ompa
ny
- "
-
US$
24
7 N
/A
U
S$
247
Ban
k of
Nov
a Sc
otia
-
"
-
U
S$
246
N/A
US$
24
6
A
on P
LC
- "
-
US$
24
5 N
/A
U
S$
245
Prot
ectiv
e Li
fe C
orpo
ratio
n -
"
-
U
S$
238
N/A
US$
23
8
W
estR
ock
MW
V, L
LC
- "
-
US$
23
5 N
/A
U
S$
235
Rol
ls R
oyce
PLC
-
"
-
U
S$
223
N/A
US$
22
3
A
ssur
ant,
Inc.
-
"
-
U
S$
212
N/A
US$
21
2
W
oolw
orth
s Lim
ited
- "
-
US$
19
6 N
/A
U
S$
196
JPM
orga
n C
hase
& C
o.
- H
eld-
to-m
atur
ity fi
nanc
ial a
sset
s
-
U
S$
153,
147
N/A
US$
15
4,71
0
W
ells
Far
go &
Com
pany
-
"
-
U
S$
150,
007
N/A
US$
15
0,32
1
G
oldm
an S
achs
Gro
up, I
nc.
- "
-
US$
10
0,00
0 N
/A
U
S$
100,
959
Wes
tpac
Ban
king
Cor
p.
- "
-
US$
10
0,00
0 N
/A
U
S$
100,
743
(Con
tinue
d)
- 88
-

- 89
-
Hel
d C
ompa
ny N
ame
Mar
keta
ble
Secu
ritie
s Typ
e an
d N
ame
Rel
atio
nshi
p w
ith th
e C
ompa
ny
Fina
ncia
l Sta
tem
ent A
ccou
nt
Dec
embe
r 31
, 201
6
Not
e Sh
ares
/Uni
ts
(In
Tho
usan
ds)
Car
ryin
g V
alue
(F
orei
gn C
urre
ncie
s in
Tho
usan
ds)
Perc
enta
ge o
f O
wne
rshi
p (%
)
Fair
Val
ue
(For
eign
Cur
renc
ies
in T
hous
ands
)
TSM
C G
loba
l C
omm
onw
ealth
Ban
k of
Aus
tralia
-
Hel
d-to
-mat
urity
fina
ncia
l ass
ets
-
US$
50
,000
N
/A
U
S$
50,4
19
Nat
iona
l Aus
tralia
Ban
k -
"
-
U
S$
50,0
00
N/A
US$
50
,313
B
ank
of N
ova
Scot
ia
- "
-
US$
49
,982
N
/A
U
S$
50,1
58
G
over
nmen
t bon
d
U
S Tr
easu
ry N
/B
- A
vaila
ble-
for-
sale
fina
ncia
l ass
ets
-
US$
25
9,23
1 N
/A
U
S$
259,
231
Abu
Dha
bi G
over
nmen
t Int
erna
tiona
l Bon
d -
"
-
U
S$
3,42
8 N
/A
U
S$
3,42
8
Age
ncy
bond
Fe
dera
l Nat
iona
l Mor
tgag
e A
ssoc
iatio
n -
Ava
ilabl
e-fo
r-sa
le fi
nanc
ial a
sset
s
-
U
S$
271,
325
N/A
US$
27
1,32
5
Fe
dera
l Hom
e Lo
an M
ortg
age
Cor
pora
tion
- "
-
US$
15
4,30
0 N
/A
U
S$
154,
300
Gov
ernm
ent N
atio
nal M
ortg
age
Ass
ocia
tion
- "
-
US$
18
,007
N
/A
U
S$
18,0
07
Fede
ral H
ome
Loan
Ban
k -
"
-
U
S$
9,66
3 N
/A
U
S$
9,66
3
Ex
port
Impo
rt B
ank
Kor
ea
- "
-
US$
3,
008
N/A
US$
3,
008
Expo
rt D
evel
opm
nt C
anad
a -
"
-
U
S$
2,64
8 N
/A
U
S$
2,64
8
G
over
nmen
t Nat
iona
l Mor
tgag
e A
ssoc
iatio
n -
"
-
U
S$
1,93
7 N
/A
U
S$
1,93
7
Fe
dera
l Far
m C
redi
t Ban
k -
"
-
U
S$
898
N/A
US$
89
8
Fh
lmc
Mul
tifam
ily S
truct
ured
PTC
-
"
-
U
S$
356
N/A
US$
35
6
Neg
otia
ble
certi
ficat
e of
dep
osit
Chi
na C
onst
ruct
ion
Ban
k -
Hel
d-to
-mat
urity
fina
ncia
l ass
ets
-
US$
50
,000
N
/A
U
S$
50,2
45
Chi
na D
evel
opm
ent B
ank
- "
-
US$
50
,000
N
/A
U
S$
50,1
79
Ban
k of
Chi
na
- "
-
US$
50
,000
N
/A
U
S$
50,1
34
C
orpo
rate
issu
ed a
sset
-bac
ked
secu
ritie
s
C
apita
l One
Mul
ti A
sset
Exe
cutio
n Tr
ust
- A
vaila
ble-
for-
sale
fina
ncia
l ass
ets
-
US$
39
,626
N
/A
U
S$
39,6
26
Cha
se Is
suan
ce T
rust
-
"
-
U
S$
31,2
76
N/A
US$
31
,276
A
mer
ican
Exp
ress
Cre
dit A
ccou
nt M
aste
r Tru
st
- "
-
US$
23
,114
N
/A
U
S$
23,1
14
Dis
cove
r Car
d Ex
ecut
ion
Not
e Tr
ust
- "
-
US$
23
,076
N
/A
U
S$
23,0
76
Citi
bank
Cre
dit C
ard
Issu
ance
Tru
st
- "
-
US$
22
,585
N
/A
U
S$
22,5
85
Ban
k of
Am
eric
a C
redi
t Car
d Tr
ust
- "
-
US$
19
,464
N
/A
U
S$
19,4
64
Nis
san
Aut
o Le
ase
Trus
t -
"
-
U
S$
13,7
80
N/A
US$
13
,780
G
S M
ortg
age
Secu
ritie
s Tru
st
- "
-
US$
12
,386
N
/A
U
S$
12,3
86
Ford
Cre
dit F
loor
plan
Mas
ter O
wne
r Tru
st
- "
-
US$
11
,944
N
/A
U
S$
11,9
44
Ford
Cre
dit A
uto
Ow
ner T
rust
-
"
-
U
S$
10,9
10
N/A
US$
10
,910
U
BS-
Bar
clay
s Com
mer
cial
Mor
tgag
e Tr
ust
- "
-
US$
10
,161
N
/A
U
S$
10,1
61
Nis
san
Aut
o R
ecei
vabl
es O
wne
r Tru
st
- "
-
US$
10
,067
N
/A
U
S$
10,0
67
Mer
cede
s Ben
z M
aste
r Ow
ner T
rust
-
"
-
U
S$
10,0
12
N/A
US$
10
,012
G
M F
inan
cial
Aut
omob
ile L
easi
ng T
rust
-
"
-
U
S$
9,55
7 N
/A
U
S$
9,55
7
H
onda
Aut
o R
ecei
vabl
es O
wne
r Tru
st
- "
-
US$
7,
632
N/A
US$
7,
632
J.P. M
orga
n C
hase
Com
mer
cial
Mor
tgag
e Se
curit
ies T
rust
-
"
-
U
S$
7,51
0 N
/A
U
S$
7,51
0
H
yund
ai A
uto
Rec
eiva
bles
Tru
st
- "
-
US$
7,
315
N/A
US$
7,
315
Toyo
ta A
uto
Rec
eiva
bles
Ow
ner T
rust
-
"
-
U
S$
7,13
4 N
/A
U
S$
7,13
4
H
yund
ai A
uto
Leas
e Se
curit
izat
ion
Trus
t -
"
-
U
S$
6,37
1 N
/A
U
S$
6,37
1
B
MW
Veh
icle
Lea
se T
rust
-
"
-
U
S$
5,93
6 N
/A
U
S$
5,93
6
M
orga
n St
anle
y B
ank
of A
mer
ica
Mer
rill L
ynch
Tru
st
- "
-
US$
5,
790
N/A
US$
5,
790
Che
sape
ake
Fund
ing
II L
LC
- "
-
US$
5,
746
N/A
US$
5,
746
Ford
Cre
dit A
uto
Ow
ner T
rust
-
"
-
U
S$
5,65
1 N
/A
U
S$
5,65
1
JP
MB
B C
omm
erci
al M
ortg
age
Secu
ritie
s Tru
st
- "
-
US$
5,
472
N/A
US$
5,
472
CO
MM
Mor
tgag
e Tr
ust
- "
-
US$
5,
208
N/A
US$
5,
208
Mer
cede
s Ben
z A
uto
Leas
e Tr
ust
- "
-
US$
4,
517
N/A
US$
4,
517
(Con
tinue
d)
- 89
-
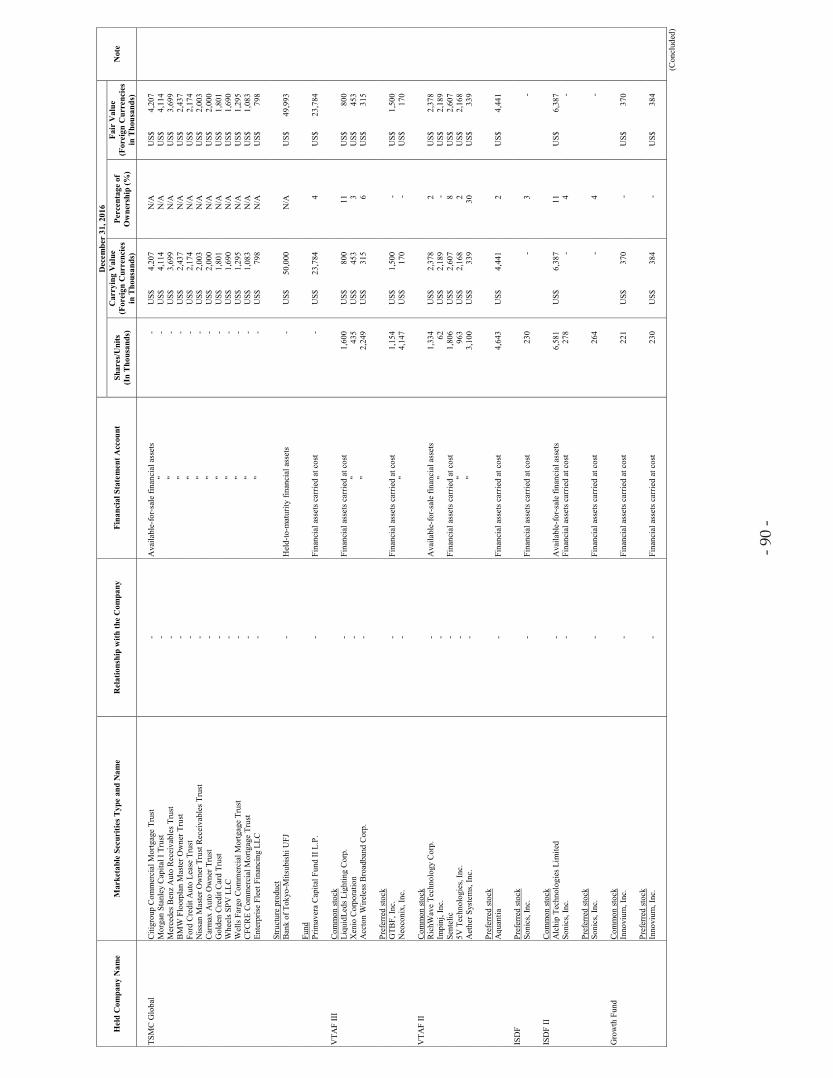
- 90
-
Hel
d C
ompa
ny N
ame
Mar
keta
ble
Secu
ritie
s Typ
e an
d N
ame
Rel
atio
nshi
p w
ith th
e C
ompa
ny
Fina
ncia
l Sta
tem
ent A
ccou
nt
Dec
embe
r 31
, 201
6
Not
e Sh
ares
/Uni
ts
(In
Tho
usan
ds)
Car
ryin
g V
alue
(F
orei
gn C
urre
ncie
s in
Tho
usan
ds)
Perc
enta
ge o
f O
wne
rshi
p (%
)
Fair
Val
ue
(For
eign
Cur
renc
ies
in T
hous
ands
)
TSM
C G
loba
l C
itigr
oup
Com
mer
cial
Mor
tgag
e Tr
ust
- A
vaila
ble-
for-
sale
fina
ncia
l ass
ets
-
US$
4,
207
N/A
US$
4,
207
Mor
gan
Stan
ley
Cap
ital I
Tru
st
- "
-
US$
4,
114
N/A
US$
4,
114
Mer
cede
s Ben
z A
uto
Rec
eiva
bles
Tru
st
- "
-
US$
3,
699
N/A
US$
3,
699
BM
W F
loor
plan
Mas
ter O
wne
r Tru
st
- "
-
US$
2,
437
N/A
US$
2,
437
Ford
Cre
dit A
uto
Leas
e Tr
ust
- "
-
US$
2,
174
N/A
US$
2,
174
Nis
san
Mas
ter O
wne
r Tru
st R
ecei
vabl
es T
rust
-
"
-
U
S$
2,00
3 N
/A
U
S$
2,00
3
C
arm
ax A
uto
Ow
ner T
rust
-
"
-
U
S$
2,00
0 N
/A
U
S$
2,00
0
G
olde
n C
redi
t Car
d Tr
ust
- "
-
US$
1,
801
N/A
US$
1,
801
Whe
els S
PV L
LC
- "
-
US$
1,
690
N/A
US$
1,
690
Wel
ls F
argo
Com
mer
cial
Mor
tgag
e Tr
ust
- "
-
US$
1,
295
N/A
US$
1,
295
CFC
RE
Com
mer
cial
Mor
tgag
e Tr
ust
- "
-
US$
1,
083
N/A
US$
1,
083
Ente
rpris
e Fl
eet F
inan
cing
LLC
-
"
-
U
S$
798
N/A
US$
79
8
Stru
ctur
e pr
oduc
t
B
ank
of T
okyo
-Mits
ubis
hi U
FJ
- H
eld-
to-m
atur
ity fi
nanc
ial a
sset
s
-
U
S$
50,0
00
N/A
US$
49
,993
Fund
Pr
imav
era
Cap
ital F
und
II L
.P.
- Fi
nanc
ial a
sset
s car
ried
at c
ost
-
US$
23
,784
4
U
S$
23,7
84
VTA
F II
I C
omm
on st
ock
Liqu
idLe
ds L
ight
ing
Cor
p.
- Fi
nanc
ial a
sset
s car
ried
at c
ost
1,60
0
US$
80
0 11
US$
80
0
X
enio
Cor
pora
tion
- "
435
U
S$
453
3
US$
45
3
A
ccto
n W
irele
ss B
road
band
Cor
p.
- "
2,24
9
US$
31
5 6
U
S$
315
Pr
efer
red
stoc
k
G
TBF,
Inc.
-
Fina
ncia
l ass
ets c
arrie
d at
cos
t
1,
154
U
S$
1,50
0 -
U
S$
1,50
0
N
eoco
nix,
Inc.
-
"
4,
147
U
S$
170
-
US$
17
0
V
TAF
II
Com
mon
stoc
k
R
ichW
ave
Tech
nolo
gy C
orp.
-
Ava
ilabl
e-fo
r-sa
le fi
nanc
ial a
sset
s
1,
334
U
S$
2,37
8 2
U
S$
2,37
8
Im
pinj
, Inc
. -
"
62
US$
2,
189
-
US$
2,
189
Sent
elic
-
Fina
ncia
l ass
ets c
arrie
d at
cos
t
1,
806
U
S$
2,60
7 8
U
S$
2,60
7
5V
Tec
hnol
ogie
s, In
c.
- "
963
U
S$
2,16
8 2
U
S$
2,16
8
A
ethe
r Sys
tem
s, In
c.
- "
3,10
0
US$
33
9 30
US$
33
9
Pref
erre
d st
ock
Aqu
antia
-
Fina
ncia
l ass
ets c
arrie
d at
cos
t
4,
643
U
S$
4,44
1 2
U
S$
4,44
1
IS
DF
Pref
erre
d st
ock
Soni
cs, I
nc.
- Fi
nanc
ial a
sset
s car
ried
at c
ost
230
- 3
-
IS
DF
II C
omm
on st
ock
Alc
hip
Tech
nolo
gies
Lim
ited
- A
vaila
ble-
for-
sale
fina
ncia
l ass
ets
6,58
1
US$
6,
387
11
U
S$
6,38
7
So
nics
, Inc
. -
Fina
ncia
l ass
ets c
arrie
d at
cos
t
27
8
-
4
-
Pr
efer
red
stoc
k
So
nics
, Inc
. -
Fina
ncia
l ass
ets c
arrie
d at
cos
t
26
4
-
4
-
Gro
wth
Fun
d C
omm
on st
ock
Inno
vium
, Inc
. -
Fina
ncia
l ass
ets c
arrie
d at
cos
t
22
1
US$
37
0 -
U
S$
370
Pr
efer
red
stoc
k
In
novi
um, I
nc.
- Fi
nanc
ial a
sset
s car
ried
at c
ost
230
U
S$
384
-
US$
38
4
(C
oncl
uded
)
- 90
-

- 91
-
TA
BL
E 4
T
aiw
an S
emic
ondu
ctor
Man
ufac
turi
ng C
ompa
ny L
imite
d an
d Su
bsid
iari
es
MA
RK
ET
AB
LE
SE
CU
RIT
IES
AC
QU
IRE
D A
ND
DIS
POSE
D O
F A
T C
OST
S O
R P
RIC
ES
OF
AT
LE
AST
NT
$300
MIL
LIO
N O
R 2
0% O
F T
HE
PA
ID-I
N C
API
TA
L
FOR
TH
E Y
EA
R E
ND
ED
DE
CE
MB
ER
31,
201
6 (A
mou
nts i
n T
hous
ands
of N
ew T
aiw
an D
olla
rs, U
nles
s Spe
cifie
d O
ther
wis
e)
Com
pany
Nam
e M
arke
tabl
e Se
curi
ties
T
ype
and
Nam
e Fi
nanc
ial S
tate
men
t A
ccou
nt
Cou
nter
-par
ty
Nat
ure
of
Rel
atio
nshi
p
Beg
inni
ng B
alan
ce
Acq
uisi
tion
Dis
posa
l E
ndin
g B
alan
ce (N
ote
1)
Shar
es/U
nits
(I
n T
hous
ands
) A
mou
nt
Shar
es/U
nits
(I
n T
hous
ands
) A
mou
nt
Shar
es/U
nits
(I
n T
hous
ands
) A
mou
nt
Car
ryin
g V
alue
G
ain/
Los
s on
Dis
posa
l Sh
ares
/Uni
ts
(In
Tho
usan
ds)
Am
ount
TS
MC
B
ank
debe
ntur
es
HSB
C B
ank
(Tai
wan
) Lim
ited
Hel
d-to
-mat
urity
fina
ncia
l as
sets
-
-
- $
3,
305,
475
-
$
-
- $
3,
300,
000
$
3,30
0,00
0 $
-
-
$
-
C
orpo
rate
bon
d
CPC
Cor
pora
tion,
Tai
wan
H
eld-
to-m
atur
ity fi
nanc
ial
asse
ts
- -
-
1,
543,
723
-
1,
513,
743
-
1,
075,
000
1,
075,
000
-
-
1,
967,
303
H
on H
ai P
reci
sion
Ind.
Co.
, Ltd
. "
- -
-
1,
003,
858
-
-
-
60
0,00
0
600,
000
-
-
40
0,25
0
Taiw
an P
ower
Com
pany
"
- -
-
1,
207,
601
-
-
-
1,
000,
000
1,
000,
000
-
-
20
0,84
8
Nan
Ya
Plas
tics C
orpo
ratio
n "
- -
-
-
-
30
2,13
9
-
150,
000
15
0,00
0
-
-
150,
742
St
ruct
ure
prod
uct
H
ua N
an C
omm
erci
al B
ank
Hel
d-to
-mat
urity
fina
ncia
l as
sets
-
-
-
2,00
0,00
0
-
-
-
2,00
0,00
0
2,00
0,00
0
-
-
-
C
atha
y U
nite
d B
ank
" -
-
-
1,00
0,00
0
-
-
-
1,00
0,00
0
1,00
0,00
0
-
-
-
Com
mer
cial
pap
er
Ta
iwan
Pow
er C
ompa
ny
Hel
d-to
-mat
urity
fina
ncia
l as
sets
-
-
-
-
945
9,
426,
884
80
800,
000
80
0,00
0
-
865
8,
628,
176
St
ock
TS
MC
Glo
bal
Inve
stm
ents
acc
ount
ed fo
r us
ing
equi
ty m
etho
d
- Su
bsid
iary
5
203,
425,
723
2
64
,451
,983
-
-
-
-
7
265,
634,
729
TS
MC
Nan
jing
" -
Subs
idia
ry
-
-
-
6,
435,
200
-
-
-
-
-
6,
331,
094
V
isEr
a Te
ch
" V
isEr
a H
oldi
ng
Subs
idia
ry
-
-
25
3,12
0
5,00
5,17
1
-
-
-
-
253,
120
5,
234,
883
N
ote
2
X
inte
c "
Vis
Era
Hol
ding
A
ssoc
iate
92,7
78
2,
209,
785
18
,504
678,
348
-
-
-
-
11
1,28
2
2,59
9,80
7
Not
e 2
TS
MC
Glo
bal
Cor
pora
te b
ond
B
ank
of A
mer
ica
Cor
p.
Ava
ilabl
e-fo
r-sa
le fi
nanc
ial
asse
ts
- -
-
US$
6,
993
-
US$
25
,862
- U
S$
4,62
4 U
S$
4,53
2 U
S$
92
-
US$
27
,973
JP
Mor
gan
Cha
se &
Co.
"
- -
-
US$
4,
971
-
US$
28
,534
- U
S$
11,1
21
US$
10
,999
U
S$
122
-
US$
22
,330
Ver
izon
Com
mun
icat
ions
"
- -
-
US$
4,
994
-
US$
12
,385
-
-
-
-
- U
S$
17,0
59
C
itigr
oup
Inc.
"
- -
-
US$
2,
986
-
US$
13
,979
-
-
-
-
- U
S$
16,8
19
A
bbvi
e In
c.
" -
-
-
-
- U
S$
14,3
38
-
US$
25
1 U
S$
251
-
-
US$
13
,850
AT&
T In
c.
" -
-
- U
S$
3,88
2
- U
S$
10,0
44
-
US$
38
4 U
S$
390
US$
(6
)
- U
S$
13,3
32
G
ilead
Sci
ence
s Inc
. "
- -
-
US$
1,
000
-
US$
11
,222
-
-
-
-
- U
S$
11,8
50
A
etna
Inc.
"
- -
-
-
-
US$
11
,687
-
-
-
-
- U
S$
11,6
18
M
orga
n St
anle
y "
- -
-
US$
1,
005
-
US$
10
,359
-
-
-
-
- U
S$
11,2
37
O
racl
e C
orp.
"
- -
-
US$
2,
428
-
US$
9,
572
-
US$
1,
447
US$
1,
426
US$
21
- U
S$
10,4
05
Sv
ensk
a H
ande
lsba
nken
AB
"
- -
-
-
-
US$
9,
922
-
-
-
-
-
US$
9,
837
Te
va P
harm
aceu
tical
s N
ethe
rland
s "
- -
-
-
-
US$
14
,629
- U
S$
5,85
6 U
S$
5,98
7 U
S$
(131
)
- U
S$
8,46
7
(C
ontin
ued)
- 91
-

- 92
-
Com
pany
Nam
e M
arke
tabl
e Se
curi
ties
T
ype
and
Nam
e Fi
nanc
ial S
tate
men
t A
ccou
nt
Cou
nter
-par
ty
Nat
ure
of
Rel
atio
nshi
p
Beg
inni
ng B
alan
ce
Acq
uisi
tion
Dis
posa
l E
ndin
g B
alan
ce (N
ote
1)
Shar
es/U
nits
(I
n T
hous
ands
) A
mou
nt
Shar
es/U
nits
(I
n T
hous
ands
) A
mou
nt
Shar
es/U
nits
(I
n T
hous
ands
) A
mou
nt
Car
ryin
g V
alue
G
ain/
Los
s on
Dis
posa
l Sh
ares
/Uni
ts
(In
Tho
usan
ds)
Am
ount
TS
MC
Glo
bal
BM
W U
S C
apita
l LLC
A
vaila
ble-
for-
sale
fina
ncia
l as
sets
-
-
- U
S$
-
- U
S$
11,2
11
-
US$
3,
990
US$
3,
990
US$
-
-
US$
7,
180
W
ells
Far
go &
Com
pany
"
- -
-
US$
2,
475
-
US$
9,
706
-
US$
6,
008
US$
5,
967
US$
41
- U
S$
6,12
7
Sysc
o C
orpo
ratio
n "
- -
-
-
-
US$
13
,622
- U
S$
7,60
5 U
S$
7,49
6 U
S$
109
-
US$
5,
978
Sh
ell I
nter
natio
nal F
in.
" -
-
- U
S$
1,24
3
- U
S$
9,75
2
- U
S$
5,21
2 U
S$
5,23
4 U
S$
(22 )
- U
S$
5,71
3
Cis
co S
yste
ms I
nc.
" -
-
-
-
- U
S$
13,5
45
-
US$
8,
079
US$
8,
007
US$
72
- U
S$
5,51
1
US
Ban
k N
A C
inci
nnat
i "
- -
-
-
-
US$
12
,590
- U
S$
9,01
8 U
S$
8,98
5 U
S$
33
-
US$
3,
568
JP
Mor
gan
Cha
se &
Co.
H
eld-
to-m
atur
ity fi
nanc
ial
asse
ts
- -
-
US$
10
,798
- U
S$
143,
533
-
-
-
-
-
US$
15
3,14
7
W
ells
Far
go &
Com
pany
"
- -
-
-
-
US$
15
0,00
8
-
-
-
-
- U
S$
150,
007
W
estp
ac B
anki
ng C
orp.
"
- -
-
-
-
US$
10
0,00
0
-
-
-
-
- U
S$
100,
000
G
oldm
an S
achs
Gro
up, I
nc.
"
- -
-
-
-
US$
10
0,00
0
-
-
-
-
- U
S$
100,
000
C
omm
onw
ealth
Ban
k of
Aus
tralia
"
- -
-
-
-
US$
50
,000
-
-
-
-
- U
S$
50,0
00
N
atio
nal A
ustra
lia B
ank
" -
-
-
-
- U
S$
50,0
00
-
-
-
-
-
US$
50
,000
Ban
k of
Nov
a Sc
otia
"
- -
-
-
-
US$
49
,978
-
-
-
-
- U
S$
49,9
82
Gov
ernm
ent b
ond
US
Trea
sury
N/B
A
vaila
ble-
for-
sale
fina
ncia
l as
sets
-
-
- U
S$
26,7
02
-
US$
28
5,94
9
- U
S$
110,
552
US$
11
1,20
5 U
S$
(653
)
- U
S$
195,
285
U
S Tr
easu
ry F
loat
ing
Rat
e N
ote
" -
-
-
-
- U
S$
104,
729
-
US$
74
,021
U
S$
73,9
90
US$
31
- U
S$
30,7
56
Tr
easu
ry In
flatio
n-In
dexe
d N
/B
" -
-
-
-
- U
S$
19,4
92
-
-
-
-
-
US$
19
,349
US
Trea
sury
N/B
"
- -
-
-
-
US$
27
,040
- U
S$
12,9
38
US$
12
,963
U
S$
(25 )
- U
S$
13,8
42
W
I Tre
asur
y Se
curit
ies
" -
-
-
-
- U
S$
14,6
98
-
US$
14
,699
U
S$
14,6
98
US$
1
-
-
Tr
easu
ry B
ill
" -
-
-
-
- U
S$
10,4
86
-
US$
10
,494
U
S$
10,4
86
US$
8
-
-
Age
ncy
bond
Fe
d H
m L
n Pc
Poo
l G60
594
Ava
ilabl
e-fo
r-sa
le fi
nanc
ial
asse
ts
- -
-
-
-
US$
16
,185
- U
S$
609
US$
69
8 U
S$
(89 )
- U
S$
15,3
22
Fn
ma
Pool
AL9
128
" -
-
-
-
- U
S$
23,7
24
-
US$
9,
288
US$
9,
351
US$
(6
3 )
-
US$
14
,067
Fnm
a Po
ol A
L719
1 "
- -
-
US$
5,
864
-
US$
9,
855
-
US$
2,
925
US$
3,
333
US$
(4
08 )
-
US$
12
,533
Fnm
a Po
ol A
L843
0 "
- -
-
-
-
US$
10
,171
- U
S$
516
US$
58
4 U
S$
(68 )
- U
S$
9,46
2
Fnm
a Po
ol 8
8857
7 "
- -
-
-
-
US$
11
,995
- U
S$
2,29
2 U
S$
2,61
9 U
S$
(327
)
- U
S$
9,28
1
Fed
Hm
Ln
Pc P
ool G
1860
5 "
- -
-
-
-
US$
9,
855
-
US$
42
5 U
S$
447
US$
(2
2 )
-
US$
9,
177
Fe
d H
m L
n Pc
Poo
l G60
081
" -
-
-
-
- U
S$
9,95
4
- U
S$
439
US$
47
8 U
S$
(39 )
- U
S$
9,17
3
Fnm
a Po
ol A
V50
62
" -
-
-
-
- U
S$
9,97
5
- U
S$
1,30
9 U
S$
1,36
6 U
S$
(57 )
- U
S$
8,45
7
Fed
Hm
Ln
Pc P
ool G
6034
4 "
- -
-
-
-
US$
9,
385
-
US$
9,
351
US$
9,
385
US$
(3
4 )
-
-
Fn
ma
Pool
AS8
074
" -
-
-
-
- U
S$
19,9
67
-
US$
20
,007
U
S$
19,9
67
US$
40
-
-
Fed
Hom
e Ln
Dis
coun
t Nt.
" -
-
-
-
- U
S$
12,4
96
-
US$
12
,504
U
S$
12,4
96
US$
8
-
-
Fn
ma
Tba
15 Y
r 2.5
"
- -
-
US$
3,
964
-
US$
11
,998
- U
S$
16,0
06
US$
15
,978
U
S$
28
-
-
C
orpo
rate
issu
ed a
sset
-bac
ked
secu
ritie
s
C
apita
l One
Mul
ti A
sset
Ex
ecut
ion
Trus
t A
vaila
ble-
for-
sale
fina
ncia
l as
sets
-
-
- U
S$
8,96
1
- U
S$
32,7
85
-
US$
1,
999
US$
1,
996
US$
3
-
US$
39
,626
C
hase
Issu
ance
Tru
st
" -
-
- U
S$
15,5
07
-
US$
21
,462
- U
S$
5,74
4 U
S$
5,75
3 U
S$
(9 )
-
US$
31
,276
Dis
cove
r Car
d Ex
ecut
ion
Not
e Tr
ust
" -
-
- U
S$
12,1
26
-
US$
17
,060
- U
S$
6,10
4 U
S$
6,15
2 U
S$
(48 )
- U
S$
23,0
76
C
itiba
nk C
redi
t Car
d Is
suan
ce
Trus
t "
- -
-
US$
9,
756
-
US$
19
,801
- U
S$
6,85
0 U
S$
6,84
3 U
S$
7
- U
S$
22,5
85
B
ank
of A
mer
ica
Cre
dit C
ard
Trus
t "
- -
-
US$
4,
433
-
US$
13
,019
-
-
-
-
- U
S$
17,4
65
Fo
rd C
redi
t Flo
orpl
an M
aste
r O
wne
r Tru
st
" -
-
- U
S$
5,92
2
- U
S$
9,46
5
- U
S$
3,45
9 U
S$
3,46
0 U
S$
(1 )
-
US$
11
,944
(C
ontin
ued)
- 92
-

- 93
-
Com
pany
Nam
e M
arke
tabl
e Se
curi
ties
T
ype
and
Nam
e Fi
nanc
ial S
tate
men
t A
ccou
nt
Cou
nter
-par
ty
Nat
ure
of
Rel
atio
nshi
p
Beg
inni
ng B
alan
ce
Acq
uisi
tion
Dis
posa
l E
ndin
g B
alan
ce (N
ote
1)
Shar
es/U
nits
(I
n T
hous
ands
) A
mou
nt
Shar
es/U
nits
(I
n T
hous
ands
) A
mou
nt
Shar
es/U
nits
(I
n T
hous
ands
) A
mou
nt
Car
ryin
g V
alue
G
ain/
Los
s on
Dis
posa
l Sh
ares
/Uni
ts
(In
Tho
usan
ds)
Am
ount
TS
MC
Glo
bal
Stru
ctur
e pr
oduc
t
B
ank
of T
okyo
-Mits
ubis
hi U
FJ
Hel
d-to
-mat
urity
fina
ncia
l as
sets
-
-
- U
S$
-
- U
S$
50,0
00
-
US$
-
US$
-
US$
-
-
US$
50
,000
Fund
Pr
imav
era
Cap
ital F
und
II L
.P.
Fina
ncia
l ass
ets c
arrie
d at
cos
t -
-
- U
S$
12,0
17
-
US$
11
,767
-
-
-
-
- U
S$
23,7
84
Mon
ey m
arke
t fun
d
G
oldm
an S
achs
US$
Liq
uid
Res
erve
s Fun
d A
vaila
ble-
for-
sale
fina
ncia
l as
sets
-
-
-
-
199,
144
US$
19
9,14
4
199,
144
US$
19
9,14
4 U
S$
199,
144
-
-
-
Not
e 1:
Th
e en
ding
bal
ance
incl
udes
the
amor
tizat
ion
of p
rem
ium
/dis
coun
t on
bond
s inv
estm
ents
, sha
re o
f pro
fits/
loss
es o
f inv
este
es a
nd o
ther
rela
ted
adju
stm
ent.
Not
e 2:
Th
e C
ompa
ny re
stru
ctur
ed th
e or
gani
zatio
nal s
truct
ure
to si
mpl
ify in
vest
men
t stru
ctur
e. T
here
fore
, the
acq
uisit
ion
amou
nt w
as th
e ca
rryi
ng v
alue
of V
isEr
a H
oldi
ng’s
inve
stm
ent i
n V
isEr
a Te
ch a
nd X
inte
c, re
spec
tivel
y.
(C
oncl
uded
)
- 93
-

- 94
-
TA
BL
E 5
T
aiw
an S
emic
ondu
ctor
Man
ufac
turi
ng C
ompa
ny L
imite
d an
d Su
bsid
iari
es
AC
QU
ISIT
ION
OF
IND
IVID
UA
L R
EA
L E
STA
TE
PR
OPE
RT
IES
AT
CO
STS
OF
AT
LE
AST
NT
$300
MIL
LIO
N O
R 2
0% O
F T
HE
PA
ID-I
N C
API
TA
L
FOR
TH
E Y
EA
R E
ND
ED
DE
CE
MB
ER
31,
201
6 (A
mou
nts i
n T
hous
ands
of N
ew T
aiw
an D
olla
rs, U
nles
s Spe
cifie
d O
ther
wis
e)
Com
pany
N
ame
Typ
es o
f Pr
oper
ty
Tra
nsac
tion
Dat
e
Tra
nsac
tion
Am
ount
(F
orei
gn
Cur
renc
ies i
n T
hous
ands
)
Paym
ent T
erm
C
ount
er-p
arty
N
atur
e of
R
elat
ions
hips
Prio
r T
rans
actio
n of
Rel
ated
Cou
nter
-par
ty
Pric
e R
efer
ence
Pu
rpos
e of
A
cqui
sitio
n O
ther
T
erm
s O
wne
r R
elat
ions
hips
T
rans
fer
Dat
e A
mou
nt
TSM
C
Fab
Apr
il 15
, 201
5 to
Feb
ruar
y 17
, 201
6 $
36
2,11
1 M
onth
ly se
ttlem
ent b
y th
e co
nstru
ctio
n pr
ogre
ss
and
acce
ptan
ce
Envi
rone
tics D
esig
n G
roup
Co.
, Lt
d.
- N
/A
N/A
N
/A
N/A
B
iddi
ng, p
rice
com
paris
on
and
pric
e ne
gotia
tion
Man
ufac
turin
g pu
rpos
e N
one
Fa
b Se
ptem
ber 1
7, 2
015
to
Janu
ary
25, 2
016
3,
201,
800
Mon
thly
settl
emen
t by
the
cons
truct
ion
prog
ress
an
d ac
cept
ance
DA
CIN
Con
stru
ctio
n C
o., L
td.
- N
/A
N/A
N
/A
N/A
B
iddi
ng, p
rice
com
paris
on
and
pric
e ne
gotia
tion
Man
ufac
turin
g pu
rpos
e N
one
Fa
b N
ovem
ber 2
0, 2
015
to
Oct
ober
26,
201
6
32
9,01
0 M
onth
ly se
ttlem
ent b
y th
e co
nstru
ctio
n pr
ogre
ss
and
acce
ptan
ce
TASA
Con
stru
ctio
n C
orpo
ratio
n -
N/A
N
/A
N/A
N
/A
Bid
ding
, pric
e co
mpa
rison
an
d pr
ice
nego
tiatio
n
Man
ufac
turin
g pu
rpos
e N
one
Fa
b D
ecem
ber 1
0, 2
015
to
Apr
il 11
, 201
6
3,16
7,76
8 M
onth
ly se
ttlem
ent b
y th
e co
nstru
ctio
n pr
ogre
ss
and
acce
ptan
ce
Fu T
su C
onst
ruct
ion
Co.
, Ltd
. -
N/A
N
/A
N/A
N
/A
Bid
ding
, pric
e co
mpa
rison
an
d pr
ice
nego
tiatio
n
Man
ufac
turin
g pu
rpos
e N
one
Fa
b D
ecem
ber 3
1, 2
015
to
Janu
ary
04, 2
016
1,
250,
000
Mon
thly
settl
emen
t by
the
cons
truct
ion
prog
ress
an
d ac
cept
ance
Chi
na S
teel
Stru
ctur
e C
o., L
td.
- N
/A
N/A
N
/A
N/A
B
iddi
ng, p
rice
com
paris
on
and
pric
e ne
gotia
tion
Man
ufac
turin
g pu
rpos
e N
one
Fa
b Ja
nuar
y 22
, 201
6 to
Ja
nuar
y 25
, 201
6
75
0,00
0 M
onth
ly se
ttlem
ent b
y th
e co
nstru
ctio
n pr
ogre
ss
and
acce
ptan
ce
KED
GE
Con
stru
ctio
n C
o., L
td.
- N
/A
N/A
N
/A
N/A
B
iddi
ng, p
rice
com
paris
on
and
pric
e ne
gotia
tion
Man
ufac
turin
g pu
rpos
e N
one
TSM
C
Nan
jing
Land
use
rig
ht
June
16,
201
6 R
MB
160
,521
10
0% p
aym
ent
Nan
jing
Mun
icip
al B
urea
u of
La
nd a
nd R
esou
rces
-
N/A
N
/A
N/A
N
/A
Bid
ding
M
anuf
actu
ring
purp
ose
Non
e
Fa
b Ju
ne 3
0, 2
016
RM
B 8
99,9
97
Mon
thly
settl
emen
t by
the
cons
truct
ion
prog
ress
an
d ac
cept
ance
Chi
na C
onst
ruct
ion
Firs
t D
ivis
ion
Gro
up C
onst
ruct
ion
& D
evel
opm
ent C
o., L
td.
- N
/A
N/A
N
/A
N/A
B
iddi
ng, p
rice
com
paris
on
and
pric
e ne
gotia
tion
Man
ufac
turin
g pu
rpos
e N
one
Fa
b O
ctob
er 1
7, 2
016
RM
B 4
08,9
80
Mon
thly
settl
emen
t by
the
cons
truct
ion
prog
ress
an
d ac
cept
ance
Shan
ghai
Bao
ye G
roup
Co.
, Lt
d.
- N
/A
N/A
N
/A
N/A
B
iddi
ng, p
rice
com
paris
on
and
pric
e ne
gotia
tion
Man
ufac
turin
g pu
rpos
e N
one
- 94
-

- 95
-
TA
BL
E 6
T
aiw
an S
emic
ondu
ctor
Man
ufac
turi
ng C
ompa
ny L
imite
d an
d Su
bsid
iari
es
TO
TA
L P
UR
CH
ASE
S FR
OM
OR
SA
LE
S T
O R
ELA
TE
D P
AR
TIE
S O
F A
T L
EA
ST N
T$1
00 M
ILL
ION
OR
20%
OF
TH
E P
AID
-IN
CA
PIT
AL
FO
R T
HE
YE
AR
EN
DE
D D
EC
EM
BE
R 3
1, 2
016
(Am
ount
s in
Tho
usan
ds o
f New
Tai
wan
Dol
lars
, Unl
ess S
peci
fied
Oth
erw
ise)
Com
pany
Nam
e R
elat
ed P
arty
N
atur
e of
Rel
atio
nshi
ps
Tra
nsac
tion
Det
ails
A
bnor
mal
Tra
nsac
tion
Not
es/A
ccou
nts P
ayab
le o
r R
ecei
vabl
e N
ote
Purc
hase
s/
Sale
s
Am
ount
(F
orei
gn C
urre
ncie
s in
Tho
usan
ds)
% to
T
otal
Pa
ymen
t Ter
ms
Uni
t Pri
ce
Paym
ent T
erm
s E
ndin
g B
alan
ce
(For
eign
Cur
renc
ies
in T
hous
ands
)
% to
T
otal
TSM
C
TSM
C N
orth
Am
eric
a Su
bsid
iary
Sa
les
$
63
3,91
7,88
8 65
N
et 3
0 da
ys fr
om in
voic
e da
te
(Not
e)
- N
ote
$
85
,874
,678
67
G
UC
A
ssoc
iate
Sa
les
5,00
8,68
4 1
Net
30
days
from
the
end
of th
e m
onth
of w
hen
invo
ice
is is
sued
-
-
93
1,78
7 1
TS
MC
Chi
na
Subs
idia
ry
Purc
hase
s
19
,256
,773
27
N
et 3
0 da
ys fr
om th
e en
d of
the
mon
th o
f whe
n in
voic
e is
issu
ed
- -
(1,7
75,7
74)
6
W
afer
Tech
In
dire
ct su
bsid
iary
Pu
rcha
ses
8,53
1,56
2 12
N
et 3
0 da
ys fr
om th
e en
d of
the
mon
th o
f whe
n in
voic
e is
issu
ed
- -
(1,3
03,7
95)
4
V
IS
Ass
ocia
te
Purc
hase
s
6,
732,
298
10
Net
30
days
from
the
end
of th
e m
onth
of w
hen
invo
ice
is is
sued
-
-
(5
87,4
07)
2
SS
MC
A
ssoc
iate
Pu
rcha
ses
3,37
5,42
2 5
Net
30
days
from
the
end
of th
e m
onth
of w
hen
invo
ice
is is
sued
-
-
(5
05,6
55)
2
TSM
C N
orth
Am
eric
a G
UC
A
ssoc
iate
of T
SMC
Sa
les
842,
301
- N
et 3
0 da
ys fr
om in
voic
e da
te
- -
37,3
49
-
(U
S$
26,0
98)
(U
S$
1,16
0)
Not
e:
The
teno
r is 3
0 da
ys fr
om T
SMC
’s in
voic
e da
te o
r det
erm
ined
by
the
paym
ent t
erm
s gra
nted
to it
s clie
nts b
y TS
MC
Nor
th A
mer
ica.
- 95
-

- 96
-
TA
BL
E 7
T
aiw
an S
emic
ondu
ctor
Man
ufac
turi
ng C
ompa
ny L
imite
d an
d Su
bsid
iari
es
RE
CE
IVA
BL
ES
FRO
M R
EL
AT
ED
PA
RT
IES
AM
OU
NT
ING
TO
AT
LEA
ST N
T$1
00 M
ILL
ION
OR
20%
OF
THE
PA
ID-I
N C
API
TA
L
DE
CE
MB
ER
31,
201
6 (A
mou
nts i
n T
hous
ands
of N
ew T
aiw
an D
olla
rs, U
nles
s Spe
cifie
d O
ther
wis
e)
Com
pany
Nam
e R
elat
ed P
arty
N
atur
e of
Rel
atio
nshi
ps
End
ing
Bal
ance
(F
orei
gn C
urre
ncie
s in
Tho
usan
ds)
Tur
nove
r D
ays
(Not
e 1)
Ove
rdue
A
mou
nts R
ecei
ved
in S
ubse
quen
t Pe
riod
Allo
wan
ce fo
r B
ad D
ebts
A
mou
nt
Act
ion
Tak
en
TS
MC
TS
MC
Nor
th A
mer
ica
Subs
idia
ry
$
86
,675
,335
41
$
5,76
7,08
7 -
$
14
,527
,760
$
-
GU
C
Ass
ocia
te
931,
787
52
593,
265
-
59
3,26
5
-
TSM
C N
orth
A
mer
ica
TSM
C
Pare
nt c
ompa
ny
200,
701
(U
S$
6,23
3)
N
ote
2
-
-
-
-
TSM
C C
hina
TS
MC
Pa
rent
com
pany
1,
775,
774
(R
MB
383,
265)
31
-
-
-
-
TS
MC
Nan
jing
The
sam
e pa
rent
com
pany
4,
190,
708
(R
MB
904,
476)
N
ote
2
-
-
-
-
TSM
C T
echn
olog
y TS
MC
Pa
rent
com
pany
20
9,11
2
(US$
6,
494)
N
ote
2
-
-
-
-
Waf
erTe
ch
TSM
C
The
ultim
ate
pare
nt o
f the
C
ompa
ny
1,30
3,79
5 42
-
-
-
-
(US$
40
,492
)
TS
MC
Dev
elop
men
t Pa
rent
com
pany
17
2,01
5 N
ote
2
-
-
-
-
(U
S$
5,34
2)
N
ote
1:
The
calc
ulat
ion
of tu
rnov
er d
ays e
xclu
des o
ther
rece
ivab
les f
rom
rela
ted
parti
es.
Not
e 2:
Th
e en
ding
bal
ance
is p
rimar
ily c
onsi
sted
of o
ther
rece
ivab
les,
whi
ch is
not
app
licab
le fo
r the
cal
cula
tion
of tu
rnov
er d
ays.
- 96
-

- 97
-
TA
BL
E 8
T
aiw
an S
emic
ondu
ctor
Man
ufac
turi
ng C
ompa
ny L
imite
d an
d Su
bsid
iari
es
INT
ER
CO
MPA
NY
RE
LAT
ION
SHIP
S A
ND
SIG
NIF
ICA
NT
INT
ER
CO
MPA
NY
TR
AN
SAC
TIO
NS
FOR
TH
E Y
EA
R E
ND
ED
DE
CE
MB
ER
31,
201
6 (A
mou
nts i
n T
hous
ands
of N
ew T
aiw
an D
olla
rs)
No.
C
ompa
ny N
ame
Cou
nter
Par
ty
Nat
ure
of
Rel
atio
nshi
p (N
ote
1)
Inte
rcom
pany
Tra
nsac
tions
Fina
ncia
l Sta
tem
ents
Item
A
mou
nt
Ter
ms
(Not
e 2)
Perc
enta
ge o
f C
onso
lidat
ed N
et R
even
ue
or T
otal
Ass
ets
0 TS
MC
TS
MC
Nor
th A
mer
ica
1 N
et re
venu
e fr
om sa
le o
f goo
ds
$
63
3,91
7,88
8 -
67%
R
ecei
vabl
es fr
om re
late
d pa
rties
85
,874
,678
-
5%
Oth
er re
ceiv
able
s fro
m re
late
d pa
rties
80
0,65
7 -
-
Pa
yabl
es to
rela
ted
parti
es
200,
701
-
-
TSM
C Ja
pan
1 M
arke
ting
expe
nses
- co
mm
issi
on
262,
274
-
-
TSM
C E
urop
e 1
Mar
ketin
g ex
pens
es -
com
mis
sion
45
1,80
1 -
-
TS
MC
Chi
na
1 Pu
rcha
ses
19,2
56,7
73
-
2%
M
arke
ting
expe
nses
- co
mm
issi
on
133,
704
-
-
Paya
bles
to re
late
d pa
rties
1,
775,
774
-
-
TSM
C C
anad
a 1
Res
earc
h an
d de
velo
pmen
t exp
ense
s
24
1,16
3 -
-
TS
MC
Tec
hnol
ogy
1 R
esea
rch
and
deve
lopm
ent e
xpen
ses
1,87
0,32
4 -
-
Pa
yabl
es to
rela
ted
parti
es
209,
112
-
-
Waf
erTe
ch
1 Pu
rcha
ses
8,53
1,56
2 -
1%
Paya
bles
to re
late
d pa
rties
1,
303,
795
-
-
1 TS
MC
Chi
na
TSM
C N
anjin
g 3
Oth
er re
ceiv
able
s fro
m re
late
d pa
rties
4,
190,
708
-
-
2 TS
MC
Dev
elop
men
t W
afer
Tech
3
Oth
er p
ayab
les f
rom
rela
ted
parti
es
172,
015
-
-
Not
e 1:
N
o. 1
repr
esen
ts th
e tra
nsac
tions
from
par
ent c
ompa
ny to
subs
idia
ry.
No.
3 re
pres
ents
the
trans
actio
ns b
etw
een
subs
idia
ries.
N
ote
2:
The
sale
s pric
es a
nd p
aym
ent t
erm
s of i
nter
com
pany
sale
s are
not
sign
ifica
ntly
diff
eren
t fro
m th
ose
to th
ird p
artie
s. F
or o
ther
inte
rcom
pany
tran
sact
ions
, pric
es a
nd te
rms a
re d
eter
min
ed in
acc
orda
nce
with
mut
ual a
gree
men
ts.
- 97
-

- 98
-
TA
BL
E 9
T
aiw
an S
emic
ondu
ctor
Man
ufac
turi
ng C
ompa
ny L
imite
d an
d Su
bsid
iari
es
NA
ME
S, L
OC
AT
ION
S, A
ND
RE
LA
TE
D IN
FOR
MA
TIO
N O
F IN
VE
STE
ES
OV
ER
WH
ICH
TH
E C
OM
PAN
Y E
XE
RC
ISE
S SI
GN
IFIC
AN
T IN
FLU
EN
CE
(EX
CL
UD
ING
INFO
RM
AT
ION
ON
INV
EST
ME
NT
IN M
AIN
LA
ND
CH
INA
) FO
R T
HE
YE
AR
EN
DE
D D
EC
EM
BE
R 3
1, 2
016
(Am
ount
s in
Tho
usan
ds o
f New
Tai
wan
Dol
lars
, Unl
ess S
peci
fied
Oth
erw
ise)
Inve
stor
Com
pany
In
vest
ee C
ompa
ny
Loc
atio
n M
ain
Bus
ines
ses a
nd P
rodu
cts
Ori
gina
l Inv
estm
ent A
mou
nt
Bal
ance
as o
f Dec
embe
r 31
, 201
6 N
et In
com
e (L
osse
s) o
f the
In
vest
ee
(For
eign
C
urre
ncie
s in
Tho
usan
ds)
Shar
e of
Pr
ofits
/Los
ses
of In
vest
ee
(Not
e 1)
(F
orei
gn
Cur
renc
ies i
n T
hous
ands
)
Not
e
Dec
embe
r 31
, 20
16
(For
eign
C
urre
ncie
s in
Tho
usan
ds)
Dec
embe
r 31
,
2015
(F
orei
gn
Cur
renc
ies i
n T
hous
ands
)
Shar
es (I
n T
hous
ands
) Pe
rcen
tage
of
Ow
ners
hip
Car
ryin
g V
alue
(F
orei
gn
Cur
renc
ies i
n T
hous
ands
)
TSM
C
TSM
C G
loba
l To
rtola
, Brit
ish V
irgin
Isla
nds
Inve
stm
ent a
ctiv
ities
$
232
,207
,219
$
167
,755
,236
7 10
0 $
265
,634
,729
$
2,
818,
659
$
2,81
8,65
9 Su
bsid
iary
TSM
C P
artn
ers
Torto
la, B
ritish
Virg
in Is
land
s In
vest
ing
in c
ompa
nies
invo
lved
in th
e de
sign
, m
anuf
actu
re, a
nd o
ther
rela
ted
busi
ness
in th
e se
mic
ondu
ctor
indu
stry
31
,456
,130
31,4
56,1
30
98
8,26
8 10
0
51,7
49,9
10
2,
145,
629
2,
145,
629
Subs
idia
ry
V
IS
Hsi
n-C
hu, T
aiw
an
Res
earc
h, d
esig
n, d
evel
opm
ent,
man
ufac
ture
, pa
ckag
ing,
test
ing
and
sale
of m
emor
y in
tegr
ated
circ
uits
, LSI
, VLS
I and
rela
ted
parts
10
,180
,677
10,1
80,6
77
46
4,22
3 28
8,80
6,38
4
5,53
7,92
5
1,56
3,44
6 A
ssoc
iate
SS
MC
Sing
apor
e Fa
bric
atio
n an
d su
pply
of i
nteg
rate
d ci
rcui
ts
5,
120,
028
5,
120,
028
31
4 39
7,16
3,51
6
4,92
1,40
6
1,90
9,01
3 A
ssoc
iate
Vis
Era
Tech
H
sin-
Chu
, Tai
wan
En
gage
d in
man
ufac
turin
g el
ectro
nic
spar
e pa
rts
and
in re
sear
chin
g, d
evel
opin
g, d
esig
ning
, m
anuf
actu
ring,
selli
ng, p
acka
ging
and
test
ing
of c
olor
filte
r
5,
005,
171
-
25
3,12
0 87
5,23
4,88
3
661,
562
22
9,71
2 Su
bsid
iary
TS
MC
Nor
th A
mer
ica
San
Jose
, Cal
iforn
ia, U
.S.A
Se
lling
and
mar
ketin
g of
inte
grat
ed c
ircui
ts a
nd
sem
icon
duct
or d
evic
es
33
3,71
8
333,
718
11
,000
10
0
4,34
0,30
3
195,
672
19
5,67
2 Su
bsid
iary
X
inte
c Ta
oyua
n, T
aiw
an
Waf
er le
vel c
hip
size
pac
kagi
ng se
rvic
e
1,98
8,31
7
1,30
9,96
9
111,
282
41
2,
599,
807
(6
36,8
19)
(2
42,9
99)
Ass
ocia
te
G
UC
H
sin-
Chu
, Tai
wan
R
esea
rchi
ng, d
evel
opin
g, m
anuf
actu
ring,
test
ing
and
mar
ketin
g of
inte
grat
ed c
ircui
ts
38
6,56
8
386,
568
46
,688
35
1,17
4,18
1
551,
082
19
2,42
6 A
ssoc
iate
V
TAF
II
Cay
man
Isla
nds
Inve
stin
g in
new
star
t-up
tech
nolo
gy c
ompa
nies
608,
562
60
8,56
2
- 98
467,
171
(8
7,45
1)
(8
5,70
2) S
ubsid
iary
TSM
C E
urop
e A
mst
erda
m, t
he N
ethe
rland
s M
arke
ting
and
engi
neer
ing
supp
ortin
g ac
tiviti
es
15
,749
15,7
49
-
100
35
3,69
5
40,4
71
40
,471
Su
bsid
iary
VTA
F II
I C
aym
an Is
land
s In
vest
ing
in n
ew st
art-u
p te
chno
logy
com
pani
es
1,
355,
417
1,
499,
452
-
98
21
9,35
0
(13,
072)
(12,
810)
Sub
sidia
ry
TS
MC
Japa
n Y
okoh
ama,
Japa
n M
arke
ting
activ
ities
83,7
60
83
,760
6 10
0
132,
999
3,
861
3,
861
Subs
idia
ry
TS
MC
Kor
ea
Seou
l, K
orea
C
usto
mer
serv
ice
and
tech
nica
l sup
porti
ng
activ
ities
13,6
56
13
,656
80
100
35
,706
2,07
4
2,07
4 Su
bsid
iary
TS
MC
Sol
ar E
urop
e G
mbH
H
ambu
rg, G
erm
any
Selli
ng o
f sol
ar re
late
d pr
oduc
ts a
nd p
rovi
ding
cu
stom
er se
rvic
e
25,2
66
25
,266
1 10
0
(6,3
28)
(7
,810
)
(7,8
10)
Subs
idia
ry
V
TA H
oldi
ngs
Del
awar
e, U
.S.A
In
vest
ing
in n
ew st
art-u
p te
chno
logy
com
pani
es
-
-
-
7
-
-
- Su
bsid
iary
Emer
ging
Alli
ance
C
aym
an Is
land
s In
vest
ing
in n
ew st
art-u
p te
chno
logy
com
pani
es
-
84
4,77
5
- -
-
(3
13)
(3
11)
Subs
idia
ry
C
hi C
hern
g Ta
ipei
, Tai
wan
In
vest
men
t act
iviti
es
Not
e 4
39
4,67
4 N
ote
4 N
ote
4 N
ote
4
1,61
2
1,61
2 N
ote
4
Mot
ech
New
Tai
pei,
Taiw
an
Man
ufac
turin
g an
d sa
les o
f sol
ar c
ells
, cry
stal
line
silic
on so
lar c
ell,
and
test
and
mea
sure
men
t in
stru
men
ts a
nd d
esig
n an
d co
nstru
ctio
n of
so
lar p
ower
syst
ems
Not
e 3
5,
221,
931
Not
e 3
Not
e 3
Not
e 3
Not
e 3
93
,030
N
ote
3
TSM
C P
artn
ers
TSM
C D
evel
opm
ent
Del
awar
e, U
.S.A
In
vest
men
t act
iviti
es
18
,898
,843
18,8
98,8
43
-
100
27
,109
,843
1,60
6,93
6 N
ote
2 Su
bsid
iary
(U
S$ 5
86,9
39)
(US$
586
,939
)
(US$
841
,947
) (U
S$
49,7
90)
TS
MC
Tec
hnol
ogy
Del
awar
e, U
.S.A
En
gine
erin
g su
ppor
t act
iviti
es
45
9,86
7
459,
867
-
100
54
3,17
7
9,71
9 N
ote
2 Su
bsid
iary
(U
S$
14,2
82)
(US$
14
,282
)
(US$
16
,869
) (U
S$
301)
ISD
F II
Cay
man
Isla
nds
Inve
stin
g in
new
star
t-up
tech
nolo
gy c
ompa
nies
167,
236
29
9,41
9
9,29
9 97
195,
721
2,
925
Not
e 2
Subs
idia
ry
(US$
5,
194)
(U
S$
9,29
9)
(U
S$
6,07
8) (
US$
91
)
TSM
C C
anad
a O
ntar
io, C
anad
a En
gine
erin
g su
ppor
t act
iviti
es
74
,058
74,0
58
2,
300
100
16
8,34
6
14,8
70
Not
e 2
Subs
idia
ry
(US$
2,
300)
(U
S$
2,30
0)
(U
S$
5,22
8) (
US$
46
1)
IS
DF
Cay
man
Isla
nds
Inve
stin
g in
new
star
t-up
tech
nolo
gy c
ompa
nies
15,3
01
18
,772
583
97
48
9
(69)
N
ote
2 Su
bsid
iary
(U
S$
475)
(U
S$
583)
(US$
15
) (U
S$
(2))
(Con
tinue
d)
- 98
-
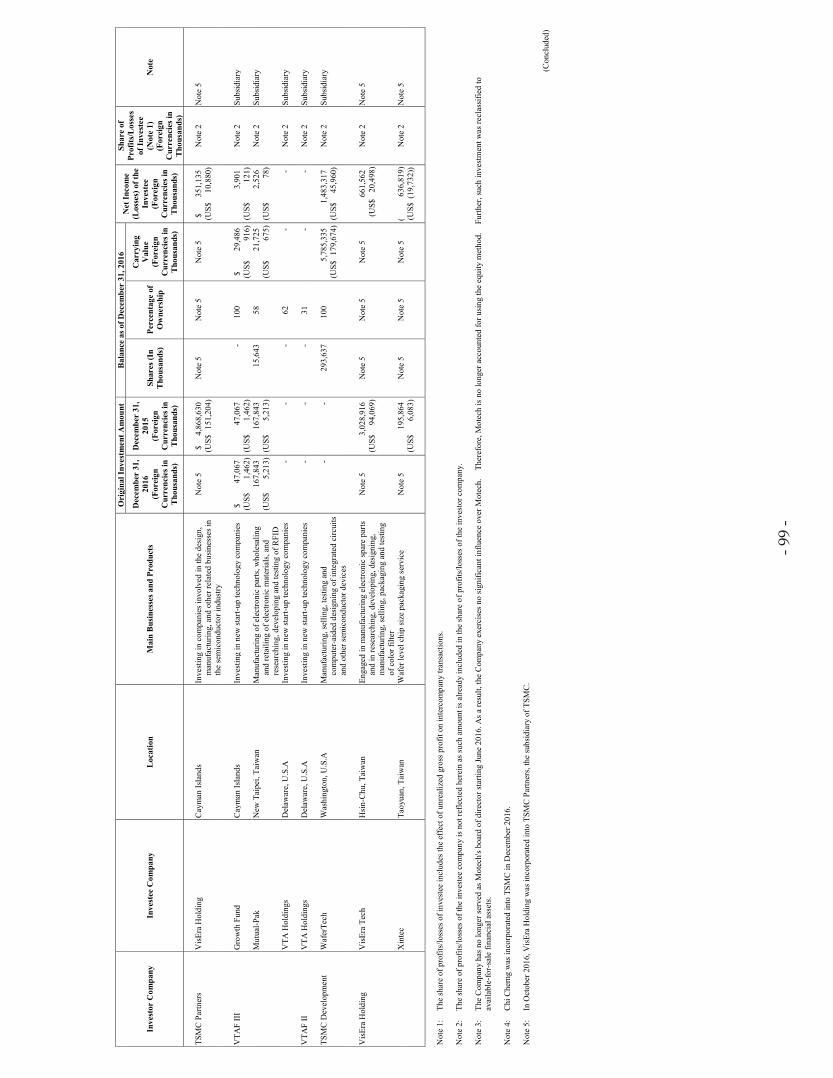
- 99
-
Inve
stor
Com
pany
In
vest
ee C
ompa
ny
Loc
atio
n M
ain
Bus
ines
ses a
nd P
rodu
cts
Ori
gina
l Inv
estm
ent A
mou
nt
Bal
ance
as o
f Dec
embe
r 31
, 201
6 N
et In
com
e (L
osse
s) o
f the
In
vest
ee
(For
eign
C
urre
ncie
s in
Tho
usan
ds)
Shar
e of
Pr
ofits
/Los
ses
of In
vest
ee
(Not
e 1)
(F
orei
gn
Cur
renc
ies i
n T
hous
ands
)
Not
e
Dec
embe
r 31
, 20
16
(For
eign
C
urre
ncie
s in
Tho
usan
ds)
Dec
embe
r 31
,
2015
(F
orei
gn
Cur
renc
ies i
n T
hous
ands
)
Shar
es (I
n T
hous
ands
) Pe
rcen
tage
of
Ow
ners
hip
Car
ryin
g V
alue
(F
orei
gn
Cur
renc
ies i
n T
hous
ands
)
TSM
C P
artn
ers
Vis
Era
Hol
ding
C
aym
an Is
land
s In
vest
ing
in c
ompa
nies
invo
lved
in th
e de
sign
, m
anuf
actu
ring,
and
oth
er re
late
d bu
sine
sses
in
the
sem
icon
duct
or in
dust
ry
Not
e 5
$
4,86
8,63
0 (U
S$ 1
51,2
04)
Not
e 5
Not
e 5
Not
e 5
$
351,
135
(US$
10
,880
) N
ote
2 N
ote
5
V
TAF
III
Gro
wth
Fun
d C
aym
an Is
land
s In
vest
ing
in n
ew st
art-u
p te
chno
logy
com
pani
es
$
47,0
67
47
,067
- 10
0 $
29
,486
3,90
1 N
ote
2 Su
bsid
iary
(U
S$
1,46
2) (
US$
1,
462)
(US$
91
6) (
US$
12
1)
M
utua
l-Pak
N
ew T
aipe
i, Ta
iwan
M
anuf
actu
ring
of e
lect
roni
c pa
rts, w
hole
salin
g an
d re
taili
ng o
f ele
ctro
nic
mat
eria
ls, a
nd
rese
arch
ing,
dev
elop
ing
and
test
ing
of R
FID
16
7,84
3 (U
S$
5,21
3)
167,
843
(US$
5,
213)
15
,643
58
21,7
25
(US$
67
5)
2,52
6 (U
S$
78)
Not
e 2
Subs
idia
ry
V
TA H
oldi
ngs
Del
awar
e, U
.S.A
In
vest
ing
in n
ew st
art-u
p te
chno
logy
com
pani
es
-
-
-
62
-
-
Not
e 2
Subs
idia
ry
V
TAF
II
VTA
Hol
ding
s D
elaw
are,
U.S
.A
Inve
stin
g in
new
star
t-up
tech
nolo
gy c
ompa
nies
-
-
- 31
-
- N
ote
2 Su
bsid
iary
TSM
C D
evel
opm
ent
Waf
erTe
ch
Was
hing
ton,
U.S
.A
Man
ufac
turin
g, se
lling
, tes
ting
and
com
pute
r-ai
ded
desi
gnin
g of
inte
grat
ed c
ircui
ts
and
othe
r sem
icon
duct
or d
evic
es
-
-
29
3,63
7 10
0
5,78
5,33
5 (U
S$ 1
79,6
74)
1,
483,
317
(US$
45
,960
) N
ote
2 Su
bsid
iary
V
isEr
a H
oldi
ng
Vis
Era
Tech
H
sin-
Chu
, Tai
wan
En
gage
d in
man
ufac
turin
g el
ectro
nic
spar
e pa
rts
and
in re
sear
chin
g, d
evel
opin
g, d
esig
ning
, m
anuf
actu
ring,
selli
ng, p
acka
ging
and
test
ing
of c
olor
filte
r
Not
e 5
3,
028,
916
(US$
94
,069
) N
ote
5 N
ote
5 N
ote
5
661,
562
(U
S$
20,4
98)
Not
e 2
Not
e 5
X
inte
c Ta
oyua
n, T
aiw
an
Waf
er le
vel c
hip
size
pac
kagi
ng se
rvic
e N
ote
5
195,
864
Not
e 5
Not
e 5
Not
e 5
( 63
6,81
9)
Not
e 2
Not
e 5
(U
S$
6,08
3)
(US$
(19
,732
))
N
ote
1:
The
shar
e of
pro
fits/
loss
es o
f inv
este
e in
clud
es th
e ef
fect
of u
nrea
lized
gro
ss p
rofit
on
inte
rcom
pany
tran
sact
ions
. N
ote
2:
The
shar
e of
pro
fits/
loss
es o
f the
inve
stee
com
pany
is n
ot re
flect
ed h
erei
n as
such
am
ount
is a
lread
y in
clud
ed in
the
shar
e of
pro
fits/
loss
es o
f the
inve
stor
com
pany
.
Not
e 3:
Th
e C
ompa
ny h
as n
o lo
nger
serv
ed a
s Mot
ech'
s boa
rd o
f dire
ctor
star
ting
June
201
6. A
s a re
sult,
the
Com
pany
exe
rcis
es n
o si
gnifi
cant
influ
ence
ove
r Mot
ech.
Th
eref
ore,
Mot
ech
is n
o lo
nger
acc
ount
ed fo
r usin
g th
e eq
uity
met
hod.
Fu
rther
, suc
h in
vest
men
t was
recl
assi
fied
to
avai
labl
e-fo
r-sa
le fi
nanc
ial a
sset
s. N
ote
4:
Chi
Che
rng
was
inco
rpor
ated
into
TSM
C in
Dec
embe
r 201
6.
Not
e 5:
In
Oct
ober
201
6, V
isEr
a H
oldi
ng w
as in
corp
orat
ed in
to T
SMC
Par
tner
s, th
e su
bsid
iary
of T
SMC
.
(Con
clud
ed)
- 99
-

- 100
-
TA
BL
E 1
0 T
aiw
an S
emic
ondu
ctor
Man
ufac
turi
ng C
ompa
ny L
imite
d an
d Su
bsid
iari
es
INFO
RM
AT
ION
ON
INV
EST
ME
NT
IN M
AIN
LA
ND
CH
INA
FO
R T
WE
LV
E M
ON
THS
EN
DE
D D
EC
EM
BE
R 3
1, 2
016
(Am
ount
s in
Tho
usan
ds o
f New
Tai
wan
Dol
lars
, Unl
ess S
peci
fied
Oth
erw
ise)
In
vest
ee C
ompa
ny
Mai
n B
usin
esse
s and
Pr
oduc
ts
Tot
al A
mou
nt o
f Pa
id-in
Cap
ital
(R
MB
in
Tho
usan
ds)
Met
hod
of
Inve
stm
ent
Acc
umul
ated
O
utflo
w o
f In
vest
men
t fro
m
Tai
wan
as o
f Ja
nuar
y 1,
201
6 (U
S$ in
T
hous
ands
)
Inve
stm
ent F
low
s A
ccum
ulat
ed
Out
flow
of
Inve
stm
ent f
rom
T
aiw
an a
s of
Dec
embe
r 31
, 20
16 (U
S$ in
T
hous
ands
)
Net
Inco
me
(Los
ses)
of t
he
Inve
stee
C
ompa
ny
Perc
enta
ge o
f O
wne
rshi
p Sh
are
of
Prof
its/L
osse
s
Car
ryin
g A
mou
nt
as o
f
Dec
embe
r 31
, 20
16
Acc
umul
ated
In
war
d R
emitt
ance
of
Ear
ning
s as o
f
Dec
embe
r 31
, 20
16
Out
flow
(U
S$ in
T
hous
ands
) In
flow
TS
MC
Chi
na
Man
ufac
turin
g an
d se
lling
of i
nteg
rate
d ci
rcui
ts a
t the
ord
er o
f an
d pu
rsua
nt to
pr
oduc
t des
ign
spec
ifica
tions
pr
ovid
ed b
y cu
stom
ers
$
18,9
39,6
67
(R
MB
4,50
2,08
0)
Not
e 1
$
18,9
39,6
67
(US$
59
6,00
0)
$
- $
-
$
18,9
39,6
67
(US$
59
6,00
0) $
6,
181,
335
100%
$
6,
094,
460
(Not
e 2)
$
42
,618
,308
$
-
TS
MC
Nan
jing
Man
ufac
turin
g an
d se
lling
of i
nteg
rate
d ci
rcui
ts a
t the
ord
er o
f an
d pu
rsua
nt to
pr
oduc
t des
ign
spec
ifica
tions
pr
ovid
ed b
y cu
stom
ers
6,43
5,20
0 (
RM
B 1,
366,
240)
N
ote
1
-
6,43
5,20
0 (U
S$ 2
00,0
00)
-
6,
435,
200
(US$
20
0,00
0)
939
100%
939
(Not
e 2)
6,33
1,09
4
-
A
ccum
ulat
ed In
vest
men
t in
Mai
nlan
d C
hina
as
of D
ecem
ber
31, 2
016
(US$
in T
hous
ands
)
Inve
stm
ent A
mou
nts A
utho
rize
d by
In
vest
men
t Com
miss
ion,
MO
EA
(U
S$ in
Tho
usan
ds)
Upp
er L
imit
on In
vest
men
t
$
25,3
74,8
67
(U
S$ 7
96,0
00)
$
119
,412
,667
(US$
3,59
6,00
0)
Not
e 3
N
ote
1:
TSM
C d
irect
ly in
vest
ed U
S$59
6,00
0 th
ousa
nd in
TSM
C C
hina
and
US$
200,
000
thou
sand
s in
TSM
C N
anjin
g.
Not
e 2:
A
mou
nt w
as re
cogn
ized
bas
ed o
n th
e au
dite
d fin
anci
al st
atem
ents
. N
ote
3:
As
the
Com
pany
has
obt
aine
d th
e ce
rtific
ate
of b
eing
qua
lifie
d fo
r ope
ratin
g he
adqu
arte
rs is
sued
by
Indu
stria
l Dev
elop
men
t Bur
eau,
MO
EA o
n A
ugus
t 201
6, th
e up
per
limit
on in
vest
men
t in
mai
nlan
d C
hina
pur
suan
t to
“Prin
cipl
e of
In
vest
men
t or T
echn
ical
Coo
pera
tion
in M
ainl
and
Chi
na”
is n
ot a
pplic
able
.
- 100
-

Taiwan Semiconductor Manufacturing Company Limited Parent Company Only Financial Statements for the Years Ended December 31, 2016 and 2015 and Independent Auditors’ Report
- 101 -

- 102 -

- 103 -

- 104 -

- 105 -

- 106 -
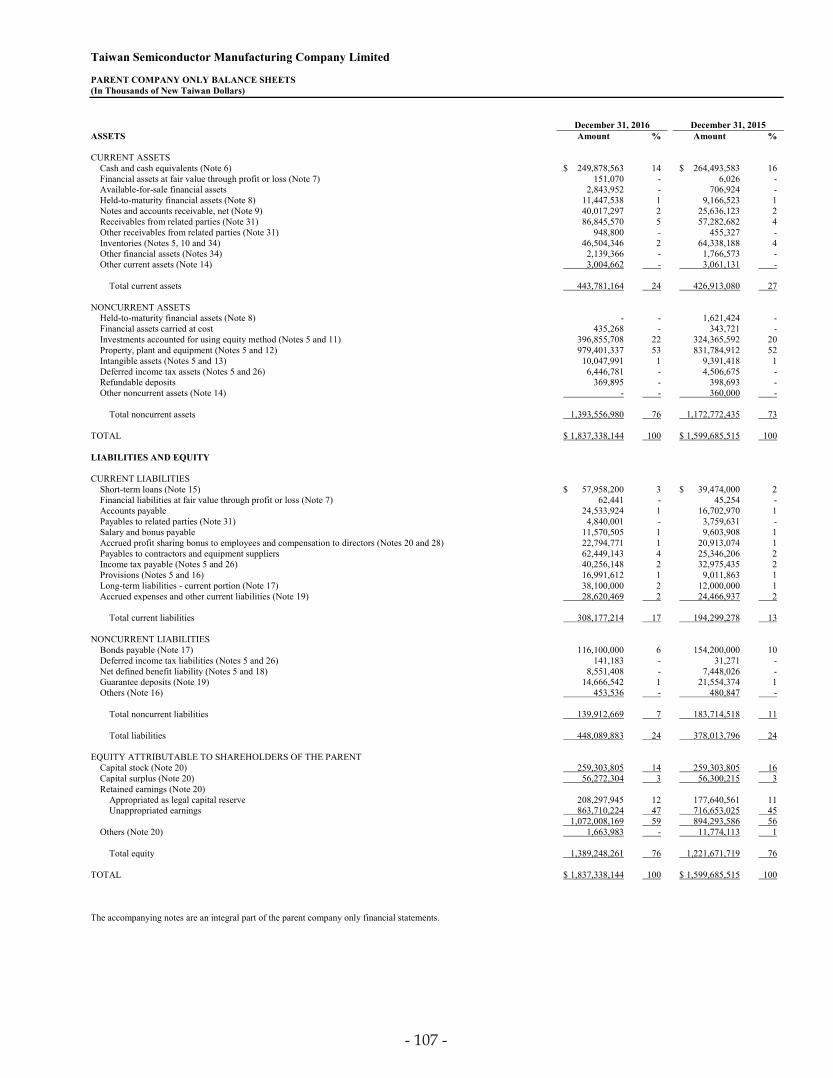
- 107 -
Taiwan Semiconductor Manufacturing Company Limited PARENT COMPANY ONLY BALANCE SHEETS (In Thousands of New Taiwan Dollars) December 31, 2016 December 31, 2015 ASSETS Amount % Amount % CURRENT ASSETS
Cash and cash equivalents (Note 6) $ 249,878,563 14 $ 264,493,583 16 Financial assets at fair value through profit or loss (Note 7) 151,070 - 6,026 - Available-for-sale financial assets 2,843,952 - 706,924 - Held-to-maturity financial assets (Note 8) 11,447,538 1 9,166,523 1 Notes and accounts receivable, net (Note 9) 40,017,297 2 25,636,123 2 Receivables from related parties (Note 31) 86,845,570 5 57,282,682 4 Other receivables from related parties (Note 31) 948,800 - 455,327 - Inventories (Notes 5, 10 and 34) 46,504,346 2 64,338,188 4 Other financial assets (Notes 34) 2,139,366 - 1,766,573 - Other current assets (Note 14) 3,004,662 - 3,061,131 -
Total current assets 443,781,164 24 426,913,080 27
NONCURRENT ASSETS
Held-to-maturity financial assets (Note 8) - - 1,621,424 - Financial assets carried at cost 435,268 - 343,721 - Investments accounted for using equity method (Notes 5 and 11) 396,855,708 22 324,365,592 20 Property, plant and equipment (Notes 5 and 12) 979,401,337 53 831,784,912 52 Intangible assets (Notes 5 and 13) 10,047,991 1 9,391,418 1 Deferred income tax assets (Notes 5 and 26) 6,446,781 - 4,506,675 - Refundable deposits 369,895 - 398,693 - Other noncurrent assets (Note 14) - - 360,000 -
Total noncurrent assets 1,393,556,980 76 1,172,772,435 73
TOTAL $ 1,837,338,144 100 $ 1,599,685,515 100 LIABILITIES AND EQUITY CURRENT LIABILITIES
Short-term loans (Note 15) $ 57,958,200 3 $ 39,474,000 2 Financial liabilities at fair value through profit or loss (Note 7) 62,441 - 45,254 - Accounts payable 24,533,924 1 16,702,970 1 Payables to related parties (Note 31) 4,840,001 - 3,759,631 - Salary and bonus payable 11,570,505 1 9,603,908 1 Accrued profit sharing bonus to employees and compensation to directors (Notes 20 and 28) 22,794,771 1 20,913,074 1 Payables to contractors and equipment suppliers 62,449,143 4 25,346,206 2 Income tax payable (Notes 5 and 26) 40,256,148 2 32,975,435 2 Provisions (Notes 5 and 16) 16,991,612 1 9,011,863 1 Long-term liabilities - current portion (Note 17) 38,100,000 2 12,000,000 1 Accrued expenses and other current liabilities (Note 19) 28,620,469 2 24,466,937 2
Total current liabilities 308,177,214 17 194,299,278 13
NONCURRENT LIABILITIES
Bonds payable (Note 17) 116,100,000 6 154,200,000 10 Deferred income tax liabilities (Notes 5 and 26) 141,183 - 31,271 - Net defined benefit liability (Notes 5 and 18) 8,551,408 - 7,448,026 - Guarantee deposits (Note 19) 14,666,542 1 21,554,374 1 Others (Note 16) 453,536 - 480,847 -
Total noncurrent liabilities 139,912,669 7 183,714,518 11
Total liabilities 448,089,883 24 378,013,796 24
EQUITY ATTRIBUTABLE TO SHAREHOLDERS OF THE PARENT
Capital stock (Note 20) 259,303,805 14 259,303,805 16 Capital surplus (Note 20) 56,272,304 3 56,300,215 3 Retained earnings (Note 20)
Appropriated as legal capital reserve 208,297,945 12 177,640,561 11 Unappropriated earnings 863,710,224 47 716,653,025 45
1,072,008,169 59 894,293,586 56 Others (Note 20) 1,663,983 - 11,774,113 1
Total equity 1,389,248,261 76 1,221,671,719 76
TOTAL $ 1,837,338,144 100 $ 1,599,685,515 100 The accompanying notes are an integral part of the parent company only financial statements.
- 107 -

- 108 -
Taiwan Semiconductor Manufacturing Company Limited PARENT COMPANY ONLY STATEMENTS OF COMPREHENSIVE INCOME (In Thousands of New Taiwan Dollars, Except Earnings Per Share) 2016 2015 Amount % Amount % NET REVENUE (Notes 5, 22 and 31) $ 936,387,291 100 $ 837,046,888 100 COST OF REVENUE (Notes 5, 10, 28, 31 and 34) 474,552,913 51 439,356,165 52 GROSS PROFIT BEFORE REALIZED
(UNREALIZED) GROSS PROFIT ON SALES TO SUBSIDIARIES AND ASSOCIATES 461,834,378 49 397,690,723 48
REALIZED (UNREALIZED) GROSS PROFIT ON
SALES TO SUBSIDIARIES AND ASSOCIATES (26,082) - 18,117 - GROSS PROFIT 461,808,296 49 397,708,840 48 OPERATING EXPENSES (Notes 5, 28 and 31)
Research and development 70,366,179 8 64,831,860 8 General and administrative 18,697,463 2 16,138,095 2 Marketing 3,098,086 - 2,983,080 -
Total operating expenses 92,161,728 10 83,953,035 10
OTHER OPERATING INCOME AND EXPENSES,
NET (Notes 12 and 28) 83,965 - (347,107) - INCOME FROM OPERATIONS 369,730,533 39 313,408,698 38 NON-OPERATING INCOME AND EXPENSES
Share of profits of subsidiaries and associates (Note 11) 14,941,372 2 33,694,186 4
Other income (Note 23) 1,816,803 - 1,839,862 - Foreign exchange gain, net (Note 35) 609,345 - 2,698,396 - Finance costs (Note 24) (2,643,193) - (2,440,459) - Other gains and losses (Note 25) 734,100 - 787,985 -
Total non-operating income and expenses 15,458,427 2 36,579,970 4
INCOME BEFORE INCOME TAX 385,188,960 41 349,988,668 42 INCOME TAX EXPENSE (Notes 5 and 26) 50,941,780 5 43,414,831 5 NET INCOME 334,247,180 36 306,573,837 37
(Continued)
- 108 -

- 109 -
Taiwan Semiconductor Manufacturing Company Limited PARENT COMPANY ONLY STATEMENTS OF COMPREHENSIVE INCOME (In Thousands of New Taiwan Dollars, Except Earnings Per Share) 2016 2015 Amount % Amount % OTHER COMPREHENSIVE INCOME (LOSS)
(Notes 11, 18, 20 and 26) Items that will not be reclassified subsequently to
profit or loss: Remeasurement of defined benefit obligation $ (1,057,220) - $ (827,703) - Share of other comprehensive loss of subsidiaries
and associates (19,961) - (2,523) - Income tax benefit related to items that will not be
reclassified subsequently 126,867 - 99,324 - (950,314) - (730,902) -
Items that may be reclassified subsequently to profit or loss: Exchange differences arising on translation of
foreign operations (9,439,776) (1) 6,525,608 1 Changes in fair value of available-for-sale
financial assets 47,506 - 94,064 - Share of other comprehensive loss of subsidiaries
and associates (656,684) - (20,578,859) (3) Income tax expense related to items that may be
reclassified subsequently (61,176) - (15,991) - (10,110,130) (1) (13,975,178) (2)
Other comprehensive loss for the year, net of income tax (11,060,444) (1) (14,706,080) (2)
TOTAL COMPREHENSIVE INCOME FOR THE
YEAR $ 323,186,736 35 $ 291,867,757 35 EARNINGS PER SHARE (NT$, Note 27)
Basic earnings per share $ 12.89 $ 11.82 Diluted earnings per share $ 12.89 $ 11.82
The accompanying notes are an integral part of the parent company only financial statements. (Concluded)
- 109 -

- 110
-
Tai
wan
Sem
icon
duct
or M
anuf
actu
ring
Com
pany
Lim
ited
PAR
EN
T C
OM
PAN
Y O
NL
Y S
TA
TEM
EN
TS
OF
CH
AN
GE
S IN
EQ
UIT
Y
(In
Tho
usan
ds o
f New
Tai
wan
Dol
lars
, Exc
ept D
ivid
ends
Per
Sha
re)
Oth
ers
Unr
ealiz
ed
Fore
ign
G
ain/
Los
s
C
apita
l Sto
ck -
Com
mon
Sto
ck
R
etai
ned
Ear
ning
s
Cur
renc
y
from
Ava
ilabl
e-
Shar
es
L
egal
Cap
ital
U
napp
ropr
iate
d
Tra
nsla
tion
fo
r-sa
le
C
ash
Flow
Tot
al
(In
Tho
usan
ds)
A
mou
nt
C
apita
l Sur
plus
Res
erve
Ear
ning
s
Tot
al
R
eser
ve
Fi
nanc
ial A
sset
s
Hed
ges R
eser
ve
T
otal
Equ
ity
B
ALA
NC
E, JA
NU
AR
Y 1
, 201
5
25,9
29,6
62
$
259,
296,
624
$
55,9
89,9
22
$
151,
250,
682
$
553,
914,
592
$
705,
165,
274
$
4,50
2,11
3
$
21
,247
,483
$
(3
05 )
$
25,7
49,2
91
$
1,04
6,20
1,11
1
App
ropr
iatio
ns o
f prio
r yea
r’s e
arni
ngs
Le
gal c
apita
l res
erve
-
-
-
26,3
89,8
79
(2
6,38
9,87
9 )
-
-
-
-
-
-
Cas
h di
vide
nds t
o sh
areh
olde
rs -
NT$
4.5
per s
hare
-
-
-
-
(116
,683
,481
)
(116
,683
,481
)
-
-
-
-
(116
,683
,481
) To
tal
-
-
-
26
,389
,879
(143
,073
,360
)
(116
,683
,481
)
-
-
-
-
(116
,683
,481
)
Net
inco
me
in 2
015
-
-
-
-
30
6,57
3,83
7
306,
573,
837
-
-
-
-
30
6,57
3,83
7
Oth
er c
ompr
ehen
sive
inco
me
(loss
) in
2015
, net
of i
ncom
e ta
x
-
-
-
-
(730
,902
)
(730
,902
)
6,53
7,83
6
(20,
512,
712 )
(302
)
(13,
975,
178 )
(14,
706,
080 )
Tota
l com
preh
ensi
ve in
com
e (lo
ss) i
n 20
15
-
-
-
-
30
5,84
2,93
5
305,
842,
935
6,
537,
836
(2
0,51
2,71
2 )
(3
02 )
(1
3,97
5,17
8 )
29
1,86
7,75
7
Issu
ance
of s
tock
from
exe
rcise
of e
mpl
oyee
stoc
k op
tions
718
7,
181
13
0,97
4
-
-
-
-
-
-
-
138,
155
D
ispo
sal o
f inv
estm
ents
acc
ount
ed fo
r usi
ng e
quity
met
hod
-
-
(2
6,53
7 )
-
-
-
-
-
-
-
(2
6,53
7 )
A
djus
tmen
ts to
shar
e of
cha
nges
in e
quiti
es o
f ass
ocia
tes
-
-
20
9,43
0
-
-
-
-
-
-
-
209,
430
Fr
om d
iffer
ence
s bet
wee
n eq
uity
pur
chas
e pr
ice
and
carr
ying
am
ount
aris
ing
from
act
ual
acqu
isiti
on o
r disp
osal
of s
ubsi
diar
ies
-
-
-
-
(3
1,14
2 )
(3
1,14
2 )
-
-
-
-
(3
1,14
2 )
Fr
om s
hare
of c
hang
es in
equ
ities
of s
ubsi
diar
ies
-
-
(3
,574
)
-
-
-
-
-
-
-
(3,5
74 )
B
ALA
NC
E, D
ECEM
BER
31,
201
5
25,9
30,3
80
25
9,30
3,80
5
56,3
00,2
15
17
7,64
0,56
1
716,
653,
025
89
4,29
3,58
6
11,0
39,9
49
73
4,77
1
(607
)
11,7
74,1
13
1,
221,
671,
719
A
ppro
pria
tions
of p
rior y
ear’
s ear
ning
s
Lega
l cap
ital r
eser
ve
-
-
-
30
,657
,384
(30,
657,
384 )
-
-
-
-
-
- C
ash
divi
dend
s to
shar
ehol
ders
- N
T$6.
0 pe
r sha
re
-
-
-
-
(1
55,5
82,2
83 )
(1
55,5
82,2
83 )
-
-
-
-
(1
55,5
82,2
83 )
Tota
l
-
-
-
30,6
57,3
84
(1
86,2
39,6
67 )
(1
55,5
82,2
83 )
-
-
-
-
(1
55,5
82,2
83 )
N
et in
com
e in
201
6
-
-
-
-
334,
247,
180
33
4,24
7,18
0
-
-
-
-
334,
247,
180
O
ther
com
preh
ensi
ve in
com
e (lo
ss) i
n 20
16, n
et o
f inc
ome
tax
-
-
-
-
(9
50,3
14 )
(9
50,3
14 )
(9
,378
,712
)
(732
,130
)
712
(1
0,11
0,13
0 )
(1
1,06
0,44
4 )
To
tal c
ompr
ehen
sive
inco
me
(loss
) in
2016
-
-
-
-
333,
296,
866
33
3,29
6,86
6
(9,3
78,7
12 )
(7
32,1
30 )
71
2
(10,
110,
130 )
323,
186,
736
D
ispo
sal o
f inv
estm
ents
acc
ount
ed fo
r usi
ng e
quity
met
hod
-
-
(5
6,16
9 )
-
-
-
-
-
-
-
(5
6,16
9 )
A
djus
tmen
ts to
shar
e of
cha
nges
in e
quiti
es o
f ass
ocia
tes
-
-
21
,221
-
-
-
-
-
-
-
21,2
21
Fr
om s
hare
of c
hang
es in
equ
ities
of s
ubsi
diar
ies
-
-
7,
037
-
-
-
-
-
-
-
7,
037
B
ALA
NC
E, D
ECEM
BER
31,
201
6
25,9
30,3
80
$
259,
303,
805
$
56,2
72,3
04
$
208,
297,
945
$
863,
710,
224
$
1,07
2,00
8,16
9
$
1,
661,
237
$
2,64
1
$
10
5
$
1,
663,
983
$
1,38
9,24
8,26
1
The
acco
mpa
nyin
g no
tes a
re a
n in
tegr
al p
art o
f the
par
ent c
ompa
ny o
nly
finan
cial
stat
emen
ts.
- 110
-

- 111 -
Taiwan Semiconductor Manufacturing Company Limited PARENT COMPANY ONLY STATEMENTS OF CASH FLOWS (In Thousands of New Taiwan Dollars) 2016 2015
CASH FLOWS FROM OPERATING ACTIVITIES
Income before income tax $ 385,188,960 $ 349,988,668 Adjustments for:
Depreciation expense 213,977,324 213,293,810 Amortization expense 3,724,066 3,159,437 Finance costs 2,643,193 2,440,459 Share of profits of subsidiaries and associates (14,941,372) (33,694,186) Interest income (1,683,150) (1,726,503) Gain on disposal of property, plant and equipment, net (100,503) (21,569) Impairment loss on property, plant and equipment - 228,037 Impairment loss on financial assets 4,537 21,437 Gain on disposal of available-for-sale financial assets, net (101,411) (51) Loss (gain) on disposal of investments accounted for using equity
method, net 296,065 (2,419,785) Unrealized (realized) gross profit on sales to subsidiaries and
associates 26,082 (18,117) Loss (gain) on foreign exchange, net (2,656,406) 2,548,291 Dividend income (133,653) (113,359)
Changes in operating assets and liabilities: Financial instruments at fair value through profit or loss (127,857) (249,322) Notes and accounts receivable, net (20,448,337) (6,375,554) Receivables from related parties (29,562,888) 31,322,516 Other receivables from related parties (493,473) 108,834 Inventories 17,833,842 (759,653) Other financial assets (22,662) 823,847 Other current assets 18,337 (142,763) Accounts payable 7,639,380 (1,916,970) Payables to related parties 1,108,002 (1,024,427) Salary and bonus payable 1,966,597 595,592 Accrued profit sharing bonus to employees and compensation to
directors 1,881,697 2,860,254 Accrued expenses and other current liabilities 3,891,345 (2,788,099) Provisions 7,961,632 (948,176) Net defined benefit liability 46,163 73,473
Cash generated from operations 577,935,510 555,266,121 Income taxes paid (45,387,724) (40,493,290)
Net cash generated by operating activities 532,547,786 514,772,831
CASH FLOWS FROM INVESTING ACTIVITIES
Acquisitions of: Available-for-sale financial assets (172) (3,628) Held to maturity financial assets (11,242,766) (23,074,925) Investments accounted for using equity method (445,012) -
(Continued)
- 111 -

- 112 -
Taiwan Semiconductor Manufacturing Company Limited PARENT COMPANY ONLY STATEMENTS OF CASH FLOWS (In Thousands of New Taiwan Dollars) 2016 2015
Equity interest in subsidiary $ (1,630,700) $ (394,674) Property, plant and equipment (323,009,940) (249,921,656) Intangible assets (4,207,065) (4,269,815)
Proceeds from disposal or redemption of: Available-for-sale financial assets 126,289 3,679 Held-to-maturity financial assets 10,550,000 16,800,000 Financial assets carried at cost - 8,000 Investments accounted for using equity method - 3,962,848 Equity interest in subsidiary 2,325 806,807 Property, plant and equipment 104,020 347,840
Proceeds from return of capital of financial assets carried at cost 7,493 - Interest received 1,748,570 1,636,497 Other dividends received 133,653 113,359 Dividends received from investments accounted for using equity
method 5,469,549 3,001,834 Refundable deposits paid (138,204) (404,253) Refundable deposits refunded 169,464 348,283 Decrease (increase) in receivables for temporary payments 47,924 (47,924) Cash inflow (outflow) from incorporation of subsidiary 396,262 (3,725,916)
Net cash used in investing activities (321,918,310) (254,813,644)
CASH FLOWS FROM FINANCING ACTIVITIES
Increase in short-term loans 18,968,936 3,138,680 Repayment of bonds (12,000,000) - Interest paid (2,644,187) (2,456,299) Guarantee deposits received 420,719 747,108 Guarantee deposits refunded (421,002) (740,829) Cash dividends (155,582,283) (116,683,481) Proceeds from exercise of employee stock options - 33,891 Payment of partial acquisition of interests in subsidiaries (74,130,714) (64,744,242) Proceeds from partial disposal of interests in subsidiaries 144,035 380,336
Net cash used in financing activities (225,244,496) (180,324,836)
NET INCREASE (DECREASE) IN CASH AND CASH
EQUIVALENTS (14,615,020) 79,634,351 CASH AND CASH EQUIVALENTS, BEGINNING OF YEAR 264,493,583 184,859,232 CASH AND CASH EQUIVALENTS, END OF YEAR $ 249,878,563 $ 264,493,583 The accompanying notes are an integral part of the parent company only financial statements. (Concluded)
- 112 -

- 113 -
Taiwan Semiconductor Manufacturing Company Limited NOTES TO PARENT COMPANY ONLY FINANCIAL STATEMENTS FOR THE YEARS ENDED DECEMBER 31, 2016 AND 2015 (Amounts in Thousands of New Taiwan Dollars, Unless Specified Otherwise) 1. GENERAL
Taiwan Semiconductor Manufacturing Company Limited (the “Company” or “TSMC”), a Republic of China (R.O.C.) corporation, was incorporated on February 21, 1987. The Company is a dedicated foundry in the semiconductor industry which engages mainly in the manufacturing, selling, packaging, testing and computer-aided design of integrated circuits and other semiconductor devices and the manufacturing of masks. On September 5, 1994, the Company’s shares were listed on the Taiwan Stock Exchange (TWSE). On October 8, 1997, the Company listed some of its shares of stock on the New York Stock Exchange (NYSE) in the form of American Depositary Shares (ADSs). The address of its registered office and principal place of business is No. 8, Li-Hsin Rd. 6, Hsinchu Science Park, Taiwan.
2. THE AUTHORIZATION OF FINANCIAL STATEMENTS The accompanying parent company only financial statements were approved and authorized for issue by the Board of Directors on February 14, 2017.
3. APPLICATION OF NEW AND REVISED INTERNATIONAL FINANCIAL REPORTING STANDARDS
As of the date that the accompanying parent company only financial statements were authorized for issue, the Company have not applied the following amendments to the Regulations Governing the Preparation of Financial Reports by Securities Issuers and International Financial Reporting Standards (IFRS), International Accounting Standards (IAS), Interpretations of IFRS (IFRIC), and Interpretations of IAS (SIC) issued by the International Accounting Standards Board (IASB) (collectively, “IFRSs”).
a. Amendments to the Regulations Governing the Preparation of Financial Reports by Securities Issuers
Rule No. 1050050021 issued by Financial Supervisory Commission (FSC) stipulated that starting January 1, 2017, the Company should apply the amendments to the Regulations Governing the Preparation of Financial Reports by Securities Issuers. The amendments include additions of several accounting items and requirements for disclosures of impairment of non-financial assets as a consequence of the IFRSs endorsed by the FSC for application starting from 2017. In addition, as a result of the post implementation review of IFRSs in Taiwan, the amendments also include emphasis on certain recognition and measurement considerations and add requirements for disclosures of related party transactions and goodwill. The amendments stipulate that other companies or institutions of which the chairman of the board of directors or president serves as the chairman of the board of directors or the president, or is the spouse or second immediate family of the chairman of the board of directors or president of the Company are deemed to have a substantive related party relationship, unless it can be demonstrated that no control, joint control, or significant influence exists. Furthermore, the amendments require the disclosure of the names of the related parties and the relationship with whom the Company has significant transaction.
- 113 -

- 114 -
If the transaction or balance with a specific related party is 10% or more of the Company’s respective total transaction or balance, such transaction should be separately disclosed by the name of each related party. The amendments also require additional disclosure if there is a significant difference between the actual operation after business combination and the expected benefits on acquisition date. The disclosures of related party transactions and impairment of goodwill will be enhanced when the above amendments are retrospectively applied in 2017. Except for the aforementioned impact, as of the date that the accompanying parent company only financial statements were authorized for issue, the Company continues in evaluating the impact on its financial position and financial performance as a result of amendments to the Regulations Governing the Preparation of Financial Reports by Securities Issuers. The related impact will be disclosed when the Company completes the evaluation.
b. The IFRSs in issue and endorsed by FSC with effective date starting 2017
According to Rule No. 1050026834 issued by the FSC, the following IFRSs issued by the IASB and endorsed by the FSC should be adopted by the Company starting 2017.
New, Revised or Amended Standards and Interpretations Effective Date Issued
by IASB (Note 1) Annual Improvements to IFRSs 2010 - 2012 Cycle July 1, 2014 or transactions
on or after July 1, 2014 Annual Improvements to IFRSs 2011 - 2013 Cycle July 1, 2014 Annual Improvements to IFRSs 2012 - 2014 Cycle January 1, 2016 (Note 2) Amendments to IFRS 10, IFRS 12 and IAS 28 “Investment Entities:
Applying the Consolidation Exception” January 1, 2016
Amendment to IFRS 11 “Accounting for Acquisitions of Interests in Joint Operations”
January 1, 2016
Amendment to IAS 1 “Disclosure Initiative” January 1, 2016 Amendments to IAS 16 and IAS 38 “Clarification of Acceptable Methods
of Depreciation and Amortization” January 1, 2016
Amendment to IAS 19 “Defined Benefit Plans: Employee Contributions” July 1, 2014 Amendment to IAS 27 “Equity Method in Separate Financial Statements” January 1, 2016 Amendment to IAS 36 “Recoverable Amount Disclosures for
Non-Financial Assets” January 1, 2014
Amendment to IAS 39 “Novation of Derivatives and Continuation of Hedge Accounting”
January 1, 2014
Note 1: The aforementioned new, revised or amended standards or interpretations are effective after
fiscal year beginning on or after the effective dates, unless specified otherwise. Note 2: The amendment to IFRS 5 is applied prospectively to changes in a method of disposal that
occur in annual periods beginning on or after January 1, 2016; the remaining amendments are effective for annual periods beginning on or after January 1, 2016.
- 114 -

- 115 -
Except for the following, the Company believes that the adoption of aforementioned IFRSs with effective date starting 2017 will not have a significant effect on the Company’s accounting policies:
1) Amendments to IAS 36, “Recoverable Amount Disclosures for Non-Financial Assets”
The amendments to IAS 36 clarify that the Company is required to disclose the recoverable amount of an asset or a cash-generating unit only when an impairment loss on the asset has been recognized or reversed during the period. Furthermore, if the recoverable amount for which impairment loss has been recognized or reversed is fair value less costs of disposal, the Company is required to disclose the fair value hierarchy. If the fair value measurements are categorized within Level 2 or Level 3, the valuation technique and key assumptions used to measure the fair value are disclosed. The discount rate used is disclosed if such fair value less costs of disposal is measured by using present value technique. The Company expects the aforementioned amendments will result in a broader disclosure of recoverable amount for non-financial assets.
Except for the aforementioned impact, as of the date that the accompanying parent company only financial statements were authorized for issue, the Company continues in evaluating the impact on its financial position and financial performance as a result of IFRSs with effective date starting 2017. The related impact will be disclosed when the Company completes the evaluation.
c. The IFRSs issued by IASB but not yet endorsed by FSC
The Company has not applied the following IFRSs issued by the IASB but not endorsed by the FSC. The FSC announced that the Company should apply IFRS 9 and IFRS 15 starting January 1, 2018. As of the date the parent company only financial statements were authorized for issue, the FSC has not announced the effective dates of other new IFRSs.
New, Revised or Amended Standards and Interpretations Effective Date Issued
by IASB (Note 3) Annual Improvements to IFRSs 2014-2016 Cycle Note 4 Amendment to IFRS 2 “Classification and Measurement of Share-based
Payment Transactions” January 1, 2018
IFRS 9 “Financial Instruments” January 1, 2018 Amendments to IFRS 9 and IFRS 7 “Mandatory Effective Date of IFRS 9
and Transition Disclosure” January 1, 2018
Amendments to IFRS 10 and IAS 28 “Sale or Contribution of Assets between an Investor and its Associate or Joint Venture”
To be determined by IASB
IFRS 15 “Revenue from Contracts with Customers” January 1, 2018 Amendment to IFRS 15 “Clarifications to IFRS 15” January 1, 2018 IFRS 16 “Leases” January 1, 2019 Amendment to IAS 7 “Disclosure Initiative” January 1, 2017 Amendment to IAS 12 “Recognition of Deferred Tax Assets for
Unrealized Losses” January 1, 2017
IFRIC 22 “Foreign Currency Transactions and Advance Consideration” January 1, 2018
Note 3: The aforementioned new, revised or amended standards or interpretations are effective after fiscal year beginning on or after the effective dates , unless specified otherwise.
Note 4: The amendment to IFRS 12 is retrospectively applied for annual periods beginning on or after
January 1, 2017; the amendment to IAS 28 is retrospectively applied for annual periods beginning on or after January 1, 2018.
Except for the following items, the Company believes that the adoption of aforementioned standards or interpretations will not have a significant effect on the Company’s accounting policies.
- 115 -

- 116 -
1) IFRS 9, “Financial Instruments”
All recognized financial assets currently in the scope of IAS 39, “Financial Instruments: Recognition and Measurement,” will be subsequently measured at either the amortized cost or the fair value. The classification and measurement requirements in IFRS 9 are stated as follows: For the debt instruments invested by the Company, if the contractual cash flows that are solely for payments of principal and interest on the principal amount outstanding, the classification and measurement requirements are stated as follows: a) If the objective of the Company’s business model is to hold the financial asset to collect the
contractual cash flows, such assets are measured at the amortized cost. Interest revenue should be recognized in profit or loss by using the effective interest method, continuously assessed for impairment and the impairment loss or reversal of impairment loss should be recognized in profit and loss.
b) If the objective of the Company’s business model is to hold the financial asset both to collect
the contractual cash flows and to sell the financial assets, such assets are measured at fair value through other comprehensive income and are continuously assessed for impairment. Interest revenue should be recognized in profit or loss by using the effective interest method. A gain or loss on a financial asset measured at fair value through other comprehensive income should be recognized in other comprehensive income, except for impairment gains or losses and foreign exchange gains and losses. When such financial asset is derecognized or reclassified, the cumulative gain or loss previously recognized in other comprehensive income is reclassified from equity to profit or loss.
The other financial assets which do not meet the aforementioned criteria should be measured at the fair value through profit or loss. However, the Company may irrevocably designate an investment in equity instruments that is not held for trading as measured at fair value through other comprehensive income. All relevant gains and losses shall be recognized in other comprehensive income, except for dividends which are recognized in profit or loss. No subsequent impairment assessment is required, and the cumulative gain or loss previously recognized in other comprehensive income cannot be reclassified from equity to profit or loss. IFRS 9 adds a new expected loss impairment model to measure the impairment of financial assets. A loss allowance for expected credit losses should be recognized on financial assets measured at amortized cost and financial assets mandatorily measured at fair value through other comprehensive income. If the credit risk on a financial instrument has not increased significantly since initial recognition, the Company should measure the loss allowance for that financial instrument at an amount equal to 12-month expected credit losses. If the credit risk on a financial instrument has increased significantly since initial recognition and is not deemed to be a low credit risk, the Company should measure the loss allowance for that financial instrument at an amount equal to the lifetime expected credit losses. The Company should always measure the loss allowance at an amount equal to lifetime expected credit losses for trade receivables. The main changes in hedge accounting amended the application requirements for hedge accounting to better reflect the entity’s risk management activities. Compared with IAS 39, the main changes include: (1) enhancing types of transactions eligible for hedge accounting, specifically broadening the risks eligible for hedge accounting of non-financial items; (2) changing the way hedging derivative instruments are accounted for to reduce profit or loss volatility; and (3) replacing retrospective effectiveness assessment with the principle of economic relationship between the hedging instrument and the hedged item.
- 116 -

- 117 -
2) IFRS 15, “Revenue from Contracts with Customers” and related amendment
IFRS 15 establishes principles for recognizing revenue that apply to all contracts with customers, and will supersede IAS 18, “Revenue,” IAS 11, “Construction Contracts,” and a number of revenue-related interpretations. When applying IFRS 15, the Company shall recognize revenue by applying the following steps:
Identify the contract with the customer; Identify the performance obligations in the contract; Determine the transaction price; Allocate the transaction price to the performance obligations in the contracts; and Recognize revenue when the entity satisfies a performance obligation.
When IFRS 15 and related amendment are effective, the Company may elect to apply this Standard either retrospectively to each prior reporting period presented or retrospectively with the cumulative effect of initially applying this Standard recognized at the date of initial application.
3) IFRS 16, “Leases”
IFRS 16 sets out the accounting standards for leases that will supersede IAS 17 and a number of related interpretations. Under IFRS 16, if the Company is a lessee, it shall recognize right-of-use assets and lease liabilities for all leases on the parent company only balance sheets except for low-value and short-term leases. The Company may elect to apply the accounting method similar to the accounting for operating lease under IAS 17 to the low-value and short-term leases. On the parent company only statements of comprehensive income, the Company should present the depreciation expense charged on the right-of-use asset separately from interest expense accrued on the lease liability; interest is computed by using effective interest method. On the parent company only statements of cash flows, cash payments for both the principal and interest portion of the lease liability are classified within financing activities. When IFRS 16 becomes effective, the Company may elect to apply this Standard either retrospectively to each prior reporting period presented or retrospectively with the cumulative effect of the initial application of this Standard recognized at the date of initial application.
Except for the aforementioned impact, as of the date that the accompanying parent company only financial statements were authorized for issue, the Company continues in evaluating the impact on its financial position and financial performance as a result of the initial adoption of the other standards or interpretations. The related impact will be disclosed when the Company completes the evaluation.
4. SUMMARY OF SIGNIFICANT ACCOUNTING POLICIES
For the convenience of readers, the accompanying parent company only financial statements have been translated into English from the original Chinese version prepared and used in the R.O.C. If there is any conflict between the English version and the original Chinese version or any difference in the interpretation of the two versions, the Chinese-language parent company only financial statements shall prevail. Statement of Compliance The accompanying parent company only financial statements have been prepared in conformity with the Regulations Governing the Preparation of Financial Reports by Securities Issuers (the “Accounting Standards Used in Preparation of the Parent Company Only Financial Statements”).
- 117 -

- 118 -
Basis of Preparation The accompanying parent company only financial statements have been prepared on the historical cost basis except for financial instruments that are measured at fair values, as explained in the accounting policies below. Historical cost is generally based on the fair value of the consideration given in exchange for the assets. When preparing the parent company only financial statements, the Company account for subsidiaries and associates by using the equity method. In order to agree with the amount of net income, other comprehensive income and equity attributable to shareholders of the parent in the consolidated financial statements, the differences of the accounting treatment between the parent company only basis and the consolidated basis are adjusted under the heading of investments accounted for using equity method, share of profits of subsidiaries and associates and share of other comprehensive income of subsidiaries and associates in the parent company only financial statements. Foreign Currencies In preparing the parent company only financial statements, transactions in currencies other than the entity’s functional currency (foreign currencies) are recognized at the rates of exchange prevailing at the dates of the transactions. At the end of each reporting period, monetary items denominated in foreign currencies are retranslated at the rates prevailing at that date. Such exchange differences are recognized in profit or loss in the year in which they arise. Non-monetary items measured at fair value that are denominated in foreign currencies are retranslated at the rates prevailing at the date when the fair value was determined. Exchange differences arising on the retranslation of non-monetary items are included in profit or loss for the year except for exchange differences arising on the retranslation of non-monetary items in respect of which gains and losses are recognized directly in other comprehensive income, in which case, the exchange differences are also recognized directly in other comprehensive income. Non-monetary items that are measured in terms of historical cost in foreign currencies are not retranslated. For the purposes of presenting parent company only financial statements, the assets and liabilities of the Company’s foreign operations are translated into NT$ using exchange rates prevailing at the end of each reporting period. Income and expense items are translated at the average exchange rates for the period. Exchange differences arising, if any, are recognized in other comprehensive income and accumulated in equity. Classification of Current and Noncurrent Assets and Liabilities Current assets are assets held for trading purposes and assets expected to be converted to cash, sold or consumed within one year from the end of the reporting period. Current liabilities are obligations incurred for trading purposes and obligations expected to be settled within one year from the end of the reporting period. Assets and liabilities that are not classified as current are noncurrent assets and liabilities, respectively. Cash Equivalents Cash equivalents, for the purpose of meeting short-term cash commitments, consist of highly liquid time deposits and investments that are readily convertible to known amounts of cash and which are subject to an insignificant risk of changes in value. Financial Instruments Financial assets and liabilities shall be recognized when the Company becomes a party to the contractual provisions of the instruments.
- 118 -

- 119 -
Financial assets and liabilities are initially recognized at fair values. Transaction costs that are directly attributable to the acquisition or issue of financial assets and financial liabilities (other than financial assets and financial liabilities at fair value through profit or loss) are added to or deducted from the fair value of the financial assets or financial liabilities, as appropriate, on initial recognition. Transaction costs directly attributable to the acquisition of financial assets or financial liabilities at fair value through profit or loss are recognized immediately in profit or loss. Financial Assets Financial assets are classified into the following specified categories: Financial assets “at fair value through profit or loss” (FVTPL), “held-to-maturity” financial assets, “available-for-sale” financial assets and “loans and receivables”. The classification depends on the nature and purpose of the financial assets and is determined at the time of initial recognition. Regular way purchases or sales of financial assets are recognized and derecognized on a trade date or settlement date basis for which financial assets were classified in the same way, respectively. Regular way purchases or sales are purchases or sales of financial assets that require delivery of assets within the time frame established by regulation or convention in the marketplace. Financial assets at fair value through profit or loss Financial assets are classified as at fair value through profit or loss when the financial asset is either held for trading or it is designated as at fair value through profit or loss. Financial assets at fair value through profit or loss are stated at fair value, with any gains or losses arising on remeasurement recognized in profit or loss. Held-to-maturity financial assets Held-to-maturity investments are non-derivative financial assets with fixed or determinable payments and fixed maturity dates that the Company has the positive intent and ability to hold to maturity. Subsequent to initial recognition, held-to-maturity financial assets are measured at amortized cost using the effective interest method less any impairment. Available-for-sale financial assets Available-for-sale financial assets are non-derivative financial assets that are either designated as available-for-sale or are not classified as (a) loans and receivables, (b) held-to-maturity financial assets or (c) financial assets at fair value through profit or loss. Available-for-sale financial assets are measured at fair value. Interest income from available-for-sale monetary financial assets and dividends on available-for-sale equity investments are recognized in profit or loss. Other changes in the carrying amount of available-for-sale financial assets are recognized in other comprehensive income. When the investment is disposed of or is determined to be impaired, the cumulative gain or loss previously recognized in other comprehensive income is reclassified to profit or loss. Dividends on available-for-sale equity instruments are recognized in profit or loss when the Company’s right to receive the dividends is established. Available-for-sale equity instruments that do not have a quoted market price in an active market and whose fair value cannot be reliably measured are measured at cost less any identified impairment losses at the end of each reporting period. Such equity instruments are subsequently remeasured at fair value when their fair value can be reliably measured, and the difference between the carrying amount and fair value is recognized in profit or loss or other comprehensive income.
- 119 -

- 120 -
Loans and receivables Loans and receivables are non-derivative financial assets with fixed or determinable payments that are not quoted in an active market. Loans and receivables including cash and cash equivalents, notes and accounts receivable and other receivables are measured at amortized cost using the effective interest method, less any impairment, except for those loans and receivables with immaterial discounted effect. Impairment of financial assets Financial assets, other than those carried at FVTPL, are assessed for indicators of impairment at the end of each reporting period. Those financial assets are considered to be impaired when there is objective evidence that, as a result of one or more events that occurred after the initial recognition of the financial assets, their estimated future cash flows have been affected. For financial assets carried at amortized cost, such as trade receivables, assets that are assessed not to be impaired individually are, in addition, assessed for impairment on a collective basis. The Company assesses the collectability of receivables by performing the account aging analysis and examining current trends in the credit quality of its customers. For financial assets carried at amortized cost, the amount of the impairment loss is the difference between the asset’s carrying amount and the present value of estimated future cash flows, discounted at the financial asset’s original effective interest rate. For financial assets measured at amortized cost, if, in a subsequent period, the amount of the impairment loss decreases and the decrease can be related objectively to an event occurring after the impairment loss was recognized, the previously recognized impairment loss is reversed through profit or loss to the extent that the carrying amount of the financial assets at the date the impairment loss is reversed does not exceed what the amortized cost would have been had the impairment loss not been recognized. When an available-for-sale financial asset is considered to be impaired, cumulative gains or losses previously recognized in other comprehensive income are reclassified to profit or loss in the year. In respect of available-for-sale equity instruments, impairment losses previously recognized in profit or loss are not reversed through profit or loss. Any increase in fair value subsequent to the recognition of an impairment loss is recognized in other comprehensive income and accumulated under the heading of unrealized gains or losses from available-for-sale financial assets. For financial assets carried at cost, the amount of the impairment loss is measured as the difference between the asset’s carrying amount and the present value of the estimated future cash flows discounted at the current market rate of return for a similar financial asset. Such impairment loss will not be reversed in subsequent periods. The carrying amount of the financial asset is reduced by the impairment loss directly for all financial assets with the exception of trade receivables, where the carrying amount is reduced through the use of an allowance account. When a trade receivable is considered uncollectible, it is written off against the allowance account. Subsequent recoveries of amounts previously written off are credited against the allowance account.
Derecognition of financial assets The Company derecognizes a financial asset only when the contractual rights to the cash flows from the financial asset expire, or when it transfers the financial asset and substantially all the risks and rewards of ownership of the financial asset to another entity.
- 120 -

- 121 -
On derecognition of a financial asset in its entirety, the difference between the financial asset’s carrying amount and the sum of the consideration received and receivable and the cumulative gain or loss that had been recognized in other comprehensive income and accumulated in equity is recognized in profit or loss. Financial Liabilities and Equity Instruments Classification as debt or equity Debt and equity instruments issued by the Company are classified as either financial liabilities or as equity in accordance with the substance of the contractual arrangements and the definitions of a financial liability and an equity instrument. Equity instruments An equity instrument is any contract that evidences a residual interest in the assets of an entity after deducting all of its liabilities. Equity instruments issued by the Company are recognized at the proceeds received, net of direct issue costs. Financial liabilities Financial liabilities are subsequently measured either at amortized cost using effective interest method or at FVTPL. Financial liabilities are classified as at fair value through profit or loss when the financial liability is either held for trading or is designated as at fair value through profit or loss. Financial liabilities at fair value through profit or loss are stated at fair value, with any gains or losses arising on remeasurement recognized in profit or loss. Financial liabilities other than those held for trading purposes and designated as at FVTPL are subsequently measured at amortized cost at the end of each reporting period. Derecognition of financial liabilities The Company derecognizes financial liabilities when, and only when, the Company’s obligations are discharged, cancelled or they expire. The difference between the carrying amount of the financial liability derecognized and the consideration paid and payable is recognized in profit or loss. Derivative Financial Instruments Derivative financial instruments are initially recognized at fair value at the date the derivative contracts are entered into and are subsequently remeasured to their fair value at the end of each reporting period. The resulting gain or loss is recognized in profit or loss immediately unless the derivative financial instrument is designated and effective as a hedging instrument, in which event the timing of the recognition in profit or loss depends on the nature of the hedge relationship. Financial Instruments Designated as at Fair Value through Profit or Loss A financial instrument may be designated as at fair value through profit or loss (FVTPL) upon initial recognition. The financial instrument forms part of a group of financial assets or financial liabilities or both, which is managed and its performance is evaluated on a fair value basis, in accordance with the Company’s documented risk management or investment strategy, and information about the grouping is provided internally on that basis.
- 121 -

- 122 -
Inventories Inventories are stated at the lower of cost or net realizable value. Inventories are recorded at standard cost and adjusted to approximate weighted-average cost at the end of the reporting period. Net realizable value represents the estimated selling price of inventories less all estimated costs of completion and costs necessary to make the sale. Noncurrent Assets Held for Sale Noncurrent assets are classified as held for sale if their carrying amount will be recovered principally through a sale transaction rather than through continuing use. This condition is regarded as met only when the sale is highly probable and the noncurrent asset held for sale is available for immediate sale in its present condition. To meet the criteria for the sale being highly probable, the appropriate level of management must be committed to the sale, which should be expected to qualify for recognition as a completed sale within one year from the date of classification. When the committed sale plan involves loss of control of a subsidiary, all of the investments of that subsidiary are classified as held for sale and still using equity methods, regardless of whether investments in its former subsidiary is retained after the sale.
Noncurrent assets classified as held for sale are measured at the lower of their previous carrying amount and fair value less costs to sell. Recognition of depreciation would cease. Investments Accounted for Using Equity Method Investments accounted for using the equity method include investments in subsidiaries and associates. Investment in subsidiaries A subsidiary is an entity that is controlled by the Company. Under the equity method, an investment in a subsidiary is initially recognized at cost and adjusted thereafter to recognize the Company’s share of profit or loss and other comprehensive income of the subsidiary as well as the distribution received. The Company also recognized its share in the changes in the equity of subsidiaries. Changes in the Company’s ownership interests in subsidiaries that do not result in the Company losing control over the subsidiaries are accounted for as equity transactions. Any difference between the carrying amount of the subsidiary and the fair value of the consideration paid or received is recognized directly in equity. When the Company loses control of a subsidiary, any retained investment of the former subsidiary is measured at the fair value at that date. A gain or loss is recognized in profit or loss and calculated as the difference between (a) the aggregate of the fair value of consideration received and the fair value of any retained interest at the date when control is lost; and (b) the previous carrying amount of the investments in such subsidiary. In addition, the Company shall account for all amounts previously recognized in other comprehensive income in relation to the subsidiary on the same basis as would be required if the subsidiary had directly disposed of the related assets and liabilities. When the Company transacts with its subsidiaries, profits and losses resulting from the transactions with the subsidiaries are recognized in the Company’s parent company only financial statements only to the extent of interests in the subsidiaries that are not owned by the Company.
- 122 -
- 123 -
Investment in associates An associate is an entity over which the Company has significant influence and that is neither a subsidiary nor a joint venture. Significant influence is the power to participate in the financial and operating policy decisions of the investee but is not control or joint control over those policies. The operating results and assets and liabilities of associates are incorporated in these parent company only financial statements using the equity method of accounting. Under the equity method, an investment in an associate is initially recognized in the statement of financial position at cost and adjusted thereafter to recognize the Company’s share of profit or loss and other comprehensive income of the associate as well as the distribution received. The Company also recognizes its share in the changes in the equities of associates. Any excess of the cost of acquisition over the Company’s share of the net fair value of the identifiable assets, liabilities and contingent liabilities of an associate recognized at the date of acquisition is recognized as goodwill, which is included within the carrying amount of the investment. Any excess of the Company’s share of the net fair value of the identifiable assets, liabilities and contingent liabilities over the cost of acquisition, after reassessment, is recognized immediately in profit or loss. When necessary, the entire carrying amount of the investment (including goodwill) is tested for impairment as a single asset by comparing its recoverable amount (higher of value in use and fair value less costs to sell) with its carrying amount. Any impairment loss recognized forms part of the carrying amount of the investment. Any reversal of that impairment loss is recognized to the extent that the recoverable amount of the investment subsequently increases. The Company discontinues the use of the equity method from the date when the Company ceases to have significant influence over an associate. When the Company retains an interest in the former associate, the Company measures the retained interest at fair value at that date. The difference between the carrying amount of the associate at the date the equity method was discontinued, and the fair value of any retained interest and any proceeds from disposing of a part interest in the associate is included in the determination of the gain or loss on disposal of the associate. In addition, the Company shall account for all amounts recognized in other comprehensive income in relation to that associate on the same basis as would be required if the associate had directly disposed of the related assets or liabilities. If the Company’s ownership interest in an associate is reduced as a result of disposal, but the investment continues to be an associate, the Company should reclassify to profit or loss only a proportionate amount of the gain or loss previously recognized in other comprehensive income.
When the Company subscribes to additional shares in an associate at a percentage different from its existing ownership percentage, the resulting carrying amount of the investment differs from the amount of the Company’s proportionate interest in the net assets of the associate. The Company records such a difference as an adjustment to investments with the corresponding amount charged or credited to capital surplus. If the Company’s ownership interest is reduced due to the additional subscription to the shares of associate, the proportionate amount of the gains or losses previously recognized in other comprehensive income in relation to that associate shall be reclassified to profit or loss on the same basis as would be required if the associate or jointly controlled entity had directly disposed of the related assets or liabilities. When the Company transacts with an associate, profits and losses resulting from the transactions with the associate are recognized in the Company’ parent company only financial statements only to the extent of interests in the associate that are not owned by the Company. Property, Plant and Equipment Property, plant and equipment are measured at cost less accumulated depreciation and accumulated impairment. Costs include any incremental costs that are directly attributable to the construction or acquisition of the item of property, plant and equipment.
- 123 -

- 124 -
Properties in the course of construction for production, supply or administrative purposes are carried at cost, less any recognized impairment loss. Such properties are classified to the appropriate categories of property, plant and equipment when completed and ready for intended use. Depreciation of these assets, on the same basis as other property assets, commences when the assets are ready for their intended use. Depreciation is recognized so as to write off the cost of the assets less their residual values over their useful lives, and it is computed using the straight-line method over the following estimated useful lives: buildings - 10 to 20 years; machinery and equipment - 2 to 5 years; and office equipment - 3 to 5 years. The estimated useful lives, residual values and depreciation method are reviewed at the end of each reporting period, with the effect of any changes in estimates accounted for on a prospective basis. Land is not depreciated. An item of property, plant and equipment is derecognized upon disposal or when no future economic benefits are expected to arise from the continued use of the assets. Any gain or loss arising on the disposal or retirement of an item of property, plant and equipment is determined as the difference between the sales proceeds and the carrying amount of the asset and is recognized in profit or loss. Leases Leases are classified as finance lease whenever the terms of the lease transfer substantially all the risks and rewards of ownership to the lessee. All other leases are classified as operating leases. The Company as lessor Rental income from operating leases is recognized on a straight-line basis over the term of the relevant lease. The Company as lessee Operating lease payments are recognized as an expense on a straight-line basis over the lease term. Intangible Assets Goodwill Goodwill arising on an acquisition of a business is carried at cost as established at the date of acquisition of the business less accumulated impairment losses, if any. Other intangible assets Other separately acquired intangible assets with finite useful lives are carried at cost less accumulated amortization and accumulated impairment losses. Amortization is recognized using the straight-line method over the following estimated useful lives: Technology license fees - the estimated life of the technology or the term of the technology transfer contract; software and system design costs - 3 years or contract period; patent and others – the economic life or contract period. The estimated useful life and amortization method are reviewed at the end of each reporting period, with the effect of any changes in estimate being accounted for on a prospective basis. Impairment of Tangible and Intangible Assets Goodwill Goodwill is not amortized and instead is tested for impairment annually, or more frequently when there is an indication that the cash-generating unit may be impaired. For the purpose of impairment testing, goodwill is allocated to each of the Company’s cash-generating units or groups of cash-generating units that are expected to benefit. If the recoverable amount of a cash-generating unit is less than its carrying
- 124 -

- 125 -
amount, the difference is allocated first to reduce the carrying amount of any goodwill allocated to such cash-generating unit and then to the other assets of the cash-generating unit pro rata based on the carrying amount of each asset in the cash-generating unit. Any impairment loss for goodwill is recognized directly in profit or loss. An impairment loss recognized for goodwill is not reversed in subsequent periods. Other tangible and intangible assets At the end of each reporting period, the Company reviews the carrying amounts of its tangible and intangible assets to determine whether there is any indication that those assets have suffered an impairment loss. If any such indication exists, the recoverable amount of the asset is estimated in order to determine the extent of the impairment loss. When it is not possible to estimate the recoverable amount of an individual asset, the Company estimates the recoverable amount of the cash-generating unit to which the asset belongs. When a reasonable and consistent basis of allocation can be identified, corporate assets are also allocated to individual cash-generating units, or otherwise they are allocated to the smallest group of cash-generating units for which a reasonable and consistent allocation basis can be identified. Recoverable amount is the higher of fair value less costs to sell and value in use. In assessing value in use, the estimated future cash flows are discounted to their present value using a pre-tax discount rate that reflects current market assessments of the time value of money and the risks specific to the asset for which the estimates of future cash flows have not been adjusted. If the recoverable amount of an asset or cash-generating unit is estimated to be less than its carrying amount, the carrying amount of the asset or cash-generating unit is reduced to its recoverable amount. An impairment loss is recognized immediately in profit or loss. When an impairment loss subsequently reverses, the carrying amount of the asset or a cash-generating unit is increased to the revised estimate of its recoverable amount, but the increased carrying amount does not exceed the carrying amount that would have been determined had no impairment loss been recognized for the asset or cash-generating unit in prior years. A reversal of an impairment loss is recognized immediately in profit or loss. Provision Provisions are recognized when the Company has a present obligation (legal or constructive) as a result of a past event, it is probable that the Company will be required to settle the obligation, and a reliable estimate can be made of the amount of the obligation. The amount recognized as a provision is the best estimate of the consideration required to settle the present obligation at the end of the reporting period, taking into account the risks and uncertainties surrounding the obligation. When a provision is measured using the cash flows estimated to settle the present obligation, its carrying amount is the present value of those cash flows. Guarantee Deposit Guarantee deposit mainly consists of cash received under deposit agreements with customers to ensure they have access to the Company’s specified capacity; and as guarantee of accounts receivable to ensure payment from customers. Cash received from customers is recorded as guarantee deposit upon receipt. Guarantee deposits are refunded to customers when terms and conditions set forth in the deposit agreements have been satisfied. Revenue Recognition Revenue is measured at the fair value of the consideration received or receivable. Revenue is reduced for estimated customer returns, rebates and other similar allowances.
- 125 -
- 126 -
Sale of goods Revenue from the sale of goods is recognized when the goods are delivered and titles have passed, at which time all the following conditions are satisfied:
The Company has transferred to the buyer the significant risks and rewards of ownership of the goods; The Company retains neither continuing managerial involvement to the degree usually associated with
ownership nor effective control over the goods sold; The amount of revenue can be measured reliably; It is probable that the economic benefits associated with the transaction will flow to the Company; and The costs incurred or to be incurred in respect of the transaction can be measured reliably.
In principle, payment term granted to customers is due 30 days from the invoice date or 30 days from the end of the month of when the invoice is issued. Due to the short term nature of the receivables from sale of goods with the immaterial discounted effect, the Company measures them at the original invoice amounts without discounting. Royalties, dividend and interest income Revenue from royalties is recognized on an accrual basis in accordance with the substance of the relevant agreement, provided that it is probable that the economic benefits will flow to the Company and the amount of revenue can be measured reliably. Dividend income from investments is recognized when the shareholder’s right to receive payment has been established, provided that it is probable that the economic benefits will flow to the Company and the amount of income can be measured reliably. Interest income from a financial asset is recognized when it is probable that the economic benefits will flow to the Company and the amount of income can be measured reliably. Interest income is accrued on a time basis, by reference to the principal outstanding and at the effective interest rate applicable. Employee Benefits Short-term employee benefits Liabilities recognized in respect of short-term employee benefits are measured at the undiscounted amount of the benefits expected to be paid in exchange for service rendered by employees. Retirement benefits For defined contribution retirement benefit plans, payments to the benefit plan are recognized as an expense when the employees have rendered service entitling them to the contribution. For defined benefit retirement benefit plans, the cost of providing benefit is recognized based on actuarial calculations. Defined benefit costs (including service cost, net interest and remeasurement) under the defined benefit retirement benefit plans are determined using the Projected Unit Credit Method. Service cost (including current service cost), and net interest on the net defined benefit liability (asset) are recognized as employee benefits expense in the period they occur. Remeasurement, comprising actuarial gains and losses and the return on plan assets (excluding interest), is recognized in other comprehensive income in the period in which they occur. Remeasurement recognized in other comprehensive income is reflected immediately in retained earnings and will not be reclassified to profit or loss. Net defined benefit liability represents the actual deficit in the Company’s defined benefit plan.
- 126 -
- 127 -
Share-based Payment Arrangements The Company elected to take the optional exemption according to related guidance for the share-based payment transactions granted and vested before January 1, 2012, the date of transition to Accounting Standards Used in Preparation of the Parent Company Only Financial Statements. There were no stock options granted prior to but unvested at the date of transition. The compensation costs of employee stock options that were granted after January 1, 2012 are measured at the fair value of the stock options at the grant date. The fair value of the stock option granted determined at the grant date of the stock options is expensed on a straight-line basis over the vesting period, based on the Company’s estimate of the number of stock options that will eventually vest, with a corresponding increase in capital surplus - employee stock option. The estimate is revised if subsequent information indicates that the number of stock options expected to vest differs from original estimates.
Taxation Income tax expense represents the sum of the tax currently payable and deferred tax. Current tax Income tax on unappropriated earnings at a rate of 10% is expensed in the year the shareholders approved the appropriation of earnings which is the year subsequent to the year the earnings are generated. Adjustments of prior years’ tax liabilities are added to or deducted from the current year’s tax provision. Deferred tax Deferred tax is recognized on temporary differences between the carrying amounts of assets and liabilities in the parent company only financial statements and the corresponding tax bases used in the computation of taxable profit. Deferred tax liabilities are generally recognized for all taxable temporary differences. Deferred tax assets are generally recognized for all deductible temporary differences and unused tax credits to the extent that it is probable that taxable profits will be available against which those deductible temporary differences can be utilized. Deferred tax liabilities are recognized for taxable temporary differences associated with investments in subsidiaries and associates, except where the Company is able to control the reversal of the temporary difference and it is probable that the temporary difference will not reverse in the foreseeable future. Deferred tax assets arising from deductible temporary differences associated with such investments are only recognized to the extent that it is probable that there will be sufficient taxable profits against which to utilize the benefits of the temporary differences and they are expected to reverse in the foreseeable future. The carrying amount of deferred tax assets is reviewed at the end of each reporting period and reduced to the extent that it is no longer probable that sufficient taxable profits will be available to allow all or part of the deferred tax asset to be recovered. The deferred tax assets which originally not recognized is also reviewed at the end of each reporting period and recognized to the extent that it is probable that sufficient taxable profits will be available to allow all or part of the deferred tax asset to be recovered. Deferred tax liabilities and assets are measured at the tax rates that are expected to apply in the year in which the liability is settled or the asset is realized, based on tax rates (and tax laws) that have been enacted or substantively enacted by the end of the reporting period. The measurement of deferred tax liabilities and assets reflects the tax consequences that would follow from the manner in which the Company expects, at the end of the reporting period, to recover or settle the carrying amount of its assets and liabilities.
- 127 -

- 128 -
Current and deferred tax for the year Current and deferred tax are recognized in profit or loss, except when they relate to items that are recognized in other comprehensive income or directly in equity, in which case, the current and deferred tax are also recognized in other comprehensive income or directly in equity, respectively.
Insurance Claim The Company recognizes insurance claim reimbursement for losses incurred related to disaster damages. Insurance claim reimbursements are recorded, net of any deductible amounts, at the time while there is evidence that the claim reimbursement is virtually certain to be received.
Business Combinations Business combination involving group reorganization is not accounted for by acquisition method but accounted for at the carrying amounts of the entity.
5. CRITICAL ACCOUNTING JUDGMENTS AND KEY SOURCES OF ESTIMATION AND
UNCERTAINTY In the application of the aforementioned Company’s accounting policies, the directors are required to make judgments, estimates and assumptions about the carrying amounts of assets and liabilities that are not readily apparent from other sources. The estimates and associated assumptions are based on historical experience and other factors that are considered to be relevant. Actual results may differ from these estimates. The estimates and underlying assumptions are reviewed on an ongoing basis. Revisions to accounting estimates are recognized in the year in which the estimate is revised if the revision affects only that year, or in the year of the revision and future years if the revision affects both current and future years. The following are the critical judgments, apart from those involving estimations, that the directors have made in the process of applying the Company’s accounting policies and that have the most significant effect on the amounts recognized in the parent company only financial statements. Revenue Recognition The Company recognizes revenue when the conditions described in Note 4 are satisfied. The Company also records a provision for estimated future returns and other allowances in the same period the related revenue is recorded. Provision for estimated sales returns and other allowances is generally made and adjusted based on historical experience and the consideration of varying contractual terms, and our management periodically reviews the adequacy of the estimation used. Impairment of Tangible and Intangible Assets Other than Goodwill In the process of evaluating the potential impairment of tangible and intangible assets other than goodwill, the Company is required to make subjective judgments in determining the independent cash flows, useful lives, expected future revenue and expenses related to the specific asset groups with the consideration of the nature of semiconductor industry. Any changes in these estimates based on changed economic conditions or business strategies could result in significant impairment charges or reversal in future years.
- 128 -

- 129 -
Impairment of Goodwill The assessment of impairment of goodwill requires the Company to make subjective judgment to determine the identified cash-generating units, allocate the goodwill to relevant cash-generating units and estimate the recoverable amount of relevant cash-generating units. Impairment Assessment on Investment Using Equity Method The Company assesses the impairment of investments accounted for using the equity method whenever triggering events or changes in circumstances indicate that an investment may be impaired and carrying value may not be recoverable. The Company measures the impairment based on a projected future cash flow of the investees, including the underlying assumptions of sales growth rate and capacity utilization rate formulated by such investees’ internal management team. The Company also takes into account market conditions and the relevant industry trends to ensure the reasonableness of such assumptions. Realization of Deferred Income Tax Assets Deferred tax assets are recognized to the extent that it is probable that future taxable profits will be available against which those deferred tax assets can be utilized. Assessment of the realization of the deferred tax assets requires the Company’s subjective judgment and estimate, including the future revenue growth and profitability, tax holidays, the amount of tax credits can be utilized and feasible tax planning strategies. Any changes in the global economic environment, the industry trends and relevant laws and regulations could result in significant adjustments to the deferred tax assets. Valuation of Inventory Inventories are stated at the lower of cost or net realizable value, and the Company uses judgment and estimate to determine the net realizable value of inventory at the end of each reporting period. Due to the rapid technological changes, the Company estimates the net realizable value of inventory for obsolescence and unmarketable items at the end of reporting period and then writes down the cost of inventories to net realizable value. The net realizable value of the inventory is mainly determined based on assumptions of future demand within a specific time horizon. Recognition and Measurement of Defined Benefit Plans Net defined benefit liability and the resulting defined benefit costs under defined benefit pension plans are calculated using the Projected Unit Credit Method. Actuarial assumptions comprise the discount rate, rate of employee turnover, and future salary increase rate. Changes in economic circumstances and market conditions will affect these assumptions and may have a material impact on the amount of the expense and the liability.
6. CASH AND CASH EQUIVALENTS
December 31,
2016 December 31,
2015 Cash and deposits in banks $ 245,520,074 $ 259,075,563 Repurchase agreements collateralized by corporate bonds 2,361,250 5,132,778 Commercial paper 1,997,239 - Repurchase agreements collateralized by government bonds - 285,242 $ 249,878,563 $ 264,493,583
- 129 -

- 130 -
Deposits in banks consisted of highly liquid time deposits that were readily convertible to known amounts of cash and were subject to an insignificant risk of changes in value.
7. FINANCIAL ASSETS AND LIABILITIES AT FAIR VALUE THROUGH PROFIT OR LOSS
December 31,
2016 December 31,
2015 Financial assets Held for trading
Forward exchange contracts $ 140,094 $ 6,026 Cross currency swap contracts 10,976 -
$ 151,070 $ 6,026 Financial liabilities Held for trading
Forward exchange contracts $ 62,441 $ 45,254 The Company entered into derivative contracts to manage exposures due to fluctuations of foreign exchange rates. The derivative contracts entered into by the Company did not meet the criteria for hedge accounting. Therefore, the Company did not apply hedge accounting treatment for derivative contracts. Outstanding forward exchange contracts consisted of the following: Contract Amount Maturity Date (In Thousands) December 31, 2016 Sell NT$/Buy EUR January 2017 NT$5,393,329/EUR159,400 Sell NT$/Buy JPY January 2017 NT$7,314,841/JPY26,501,800 Sell US$/Buy EUR January 2017 US$4,180/EUR4,000 Sell US$/Buy NT$ January 2017 to February 2017 US$420,000/NT$13,531,450 December 31, 2015 Sell US$/Buy JPY January 2016 US$126,944/JPY15,272,035 Sell US$/Buy NT$ January 2016 US$430,000/NT$14,106,892 Outstanding cross currency swap contracts consisted of the following:
Maturity Date
Contract Amount
(In Thousands)
Range of Interest Rates
Paid
Range of Interest Rates
Received December 31, 2016 January 2017 US$170,000/NT$5,487,600 3.98% -
- 130 -

- 131 -
8. HELD-TO-MATURITY FINANCIAL ASSETS
December 31,
2016 December 31,
2015 Commercial paper $ 8,628,176 $ - Corporate bonds/Bank debentures 2,819,362 7,787,947 Structured product - 3,000,000 $ 11,447,538 $ 10,787,947 Current portion $ 11,447,538 $ 9,166,523 Noncurrent portion - 1,621,424 $ 11,447,538 $ 10,787,947
9. NOTES AND ACCOUNTS RECEIVABLE, NET
December 31,
2016 December 31,
2015 Notes and accounts receivable $ 40,492,727 $ 26,119,625 Allowance for doubtful receivables (475,430) (483,502) Notes and accounts receivable, net $ 40,017,297 $ 25,636,123
In principle, the payment term granted to customers is due 30 days from the invoice date or 30 days from the end of the month of when the invoice is issued. The allowance for doubtful receivables is assessed by reference to the collectability of receivables by performing the account aging analysis, historical experience and current financial condition of customers. Except for those impaired, for the rest of the notes and accounts receivable, the account aging analysis at the end of the reporting period is summarized in the following table. Notes and accounts receivable include amounts that are past due but for which the Company has not recognized a specific allowance for doubtful receivables after the assessment since there has not been a significant change in the credit quality of its customers and the amounts are still considered recoverable. In addition, the Company’s subsidiary has obtained guarantee of NT$5,559,960 thousand to certain receivables. Aging analysis of notes and accounts receivable, net
December 31,
2016 December 31,
2015 Neither past due nor impaired $ 28,511,717 $ 20,024,433 Past due but not impaired
Past due within 30 days 6,755,262 5,611,690 Past due 31-60 days 1,693,463 - Past due 61-120 days 3,056,855 -
$ 40,017,297 $ 25,636,123
- 131 -

- 132 -
Movements of the allowance for doubtful receivables
Individually Assessed for Impairment
Collectively Assessed for Impairment Total
Balance at January 1, 2016 $ 8,393 $ 475,109 $ 483,502 Provision - 321 321 Reversal/Write-off (8,393) - (8,393) Balance at December 31, 2016 $ - $ 475,430 $ 475,430 Balance at January 1, 2015 $ 8,093 $ 475,409 $ 483,502 Provision 300 4,803 5,103 Reversal/Write-off - (5,103) (5,103) Balance at December 31, 2015 $ 8,393 $ 475,109 $ 483,502
Aging analysis of accounts receivable that is individually determined as impaired
December 31,
2016 December 31,
2015 Past due over 121 days $ - $ 8,393
10. INVENTORIES
December 31,
2016 December 31,
2015 Finished goods $ 8,324,267 $ 7,733,331 Work in process 32,317,210 52,251,863 Raw materials 3,864,429 2,813,029 Supplies and spare parts 1,998,440 1,539,965 $ 46,504,346 $ 64,338,188
Write-down of inventories to net realizable value (excluding earthquake losses) in the amount of NT$1,508,452 thousand and NT$466,825 thousand, respectively, were included in the cost of revenue for the years ended December 31, 2016 and 2015. Please refer to related earthquake losses in Note 34.
11. INVESTMENTS ACCOUNTED FOR USING EQUITY METHOD
Investments accounted for using the equity method consisted of the following:
December 31,
2016 December 31,
2015 Subsidiaries $ 377,111,820 $ 300,992,341 Associates 19,743,888 23,373,251 $ 396,855,708 $ 324,365,592
- 132 -

- 133 -
a. Investments in subsidiaries Subsidiaries consisted of the following:
Place of
Carrying Amount % of Ownership and Voting
Rights Held by the Company
Subsidiaries Principal Activities Incorporation and Operation
December 31, 2016
December 31, 2015
December 31, 2016
December 31, 2015
TSMC Global Ltd.
(TSMC Global) Investment activities Tortola, British
Virgin Islands $ 265,634,729 $ 203,425,723 100% 100%
TSMC Partners, Ltd. (TSMC Partners)
Investing in companies involved in the design, manufacture, and other related business in the semiconductor industry
Tortola, British Virgin Islands
51,749,910 50,827,318 100% 100%
TSMC China Company Limited (TSMC China)
Manufacturing and selling of integrated circuits at the order of and pursuant to product design specifications provided by customers
Shanghai, China 42,618,308 40,234,742 100% 100%
TSMC Nanjing Company Limited (TSMC Nanjing)
Manufacturing and selling of integrated circuits at the order of and pursuant to product design specifications provided by customers
Nanjing, China 6,331,094 - 100% -
VisEra Technologies Company Ltd. (VisEra Tech)
Engaged in manufacturing electronic spare parts and in researching, developing, designing, manufacturing, selling, packaging and testing of color filter
Hsin-Chu, Taiwan 5,234,883 - 87% -
TSMC North America Selling and marketing of integrated circuits and semiconductor devices
San Jose, California, U.S.A.
4,340,303 4,234,685 100% 100%
VentureTech Alliance Fund II, L.P. (VTAF II)
Investing in new start-up technology companies
Cayman Islands 467,171 554,240 98% 98%
TSMC Europe B.V. (TSMC Europe)
Marketing and engineering supporting activities
Amsterdam, the Netherlands
353,695 330,664 100% 100%
VentureTech Alliance Fund III, L.P. (VTAF III)
Investing in new start-up technology companies
Cayman Islands 219,350 385,834 98% 98%
TSMC Japan Limited (TSMC Japan)
Marketing activities Yokohama, Japan 132,999 127,453 100% 100%
TSMC Korea Limited (TSMC Korea)
Customer service and technical supporting activities
Seoul, Korea 35,706 35,231 100% 100%
TSMC Solar Europe GmbH
Selling of solar related products and providing customer service
Hamburg, Germany
(6,328 ) 1,186 100% 100%
Venture Tech Alliance Holdings, LLC (VTA Holdings)
Investing in new start-up technology companies
Delaware, U.S.A. - - 7% -
Emerging Alliance Fund, L.P. (Emerging Alliance)
Investing in new start-up technology companies
Cayman Islands - 440,901 - 99.5%
Chi Cherng Investment Co., Ltd.(Chi Cherng)
Investment activities Taipei, Taiwan - 394,364 - 100%
$ 377,111,820 $ 300,992,341
In August 2015, TSMC Solar Ltd. (TSMC Solar) ceased its manufacturing operations. TSMC Solar and TSMC Guang Neng Investment, Ltd. (TSMC GN) were incorporated into TSMC in December 2015. After the incorporation, TSMC Solar Europe GmbH, the subsidiary of TSMC Solar, is held directly by TSMC. The Company acquired OmniVision Technologies, Inc.’s (“OVT’s”) 100% ownership in OVT Taiwan (changed to Chi Cherng) on November 20, 2015. As a result, the Company obtained control of OVT Taiwan. For more information on acquisition of subsidiary, please refer to Note 33 to the consolidated financial statements for the year ended December 31, 2016. In December 2016, Chi Cherng was incorporated into the Company. To simplify investment structure, the Company acquired 253,120 thousand shares of VisEra Tech previously held by VisEra Holding Company (VisEra Holding) by NT$4,874,231 thousand in August 2016. The percentage of ownership held by the Company was 87%.
- 133 -

- 134 -
Due to the expiration of the investment agreement between Emerging Alliance and the Company, Emerging Alliance completed the liquidation procedures in April 2016. Emerging Alliance’s ownership in VTA Holdings is held directly by TSMC. Under the investment agreement entered into with the municipal government of Nanjing, China on March 28, 2016, the Company and its subsidiaries will make an investment in Nanjing in the amount of approximately US$3 billion to establish a subsidiary managing a 300mm wafer fab with the capacity of 20,000 12-inch wafers per month, and a design service center. TSMC Nanjing was established in May 2016. In 2016, the Company continually increased its investment in TSMC Nanjing for the amount of NT$6,435,200 thousand. This project was approved by the Investment Commission, Ministry of Economic Affairs, R.O.C. (MOEA).
To lower the hedging cost, in both of 2016 and 2015, the Company continually increased its investment in TSMC Global for the amount of NT$64,451,983 thousand and NT$64,640,368 thousand, respectively. This project was approved by the Investment Commission, MOEA. In January 2015, the Board of Directors of TSMC approved a sale of TSMC Solid State Lighting common shares of 565,480 thousand held by TSMC and TSMC GN to Epistar Corporation. The transaction was completed in February 2015.
b. Investments in associates
Associates consisted of the following:
Place of
Carrying Amount % of Ownership and Voting
Rights Held by the Company
Name of Associate Principal Activities Incorporation and Operation
December 31, 2016
December 31, 2015
December 31, 2016
December 31, 2015
Vanguard International
Semiconductor Corporation (VIS)
Research, design, development, manufacture, packaging, testing and sale of memory integrated circuits, LSI, VLSI and related parts
Hsinchu, Taiwan $ 8,806,384 $ 8,446,054 28% 28%
Systems on Silicon Manufacturing Company Pte Ltd. (SSMC)
Fabrication and supply of integrated circuits
Singapore 7,163,516 9,511,515 39% 39%
Xintec Inc. (Xintec) Wafer level chip size packaging service
Taoyuan, Taiwan 2,599,807 2,209,785 41% 35%
Global Unichip Corporation (GUC)
Researching, developing, manufacturing, testing and marketing of integrated circuits
Hsinchu, Taiwan 1,174,181 1,152,335 35% 35%
Motech Industries, Inc. (Motech)
Manufacturing and sales of solar cells, crystalline silicon solar cell, and test and measurement instruments and design and construction of solar power systems
New Taipei, Taiwan
- 2,053,562 - 12%
$ 19,743,888 $ 23,373,251
After TSMC Solar incorporated into the Company in December 2015, the Company directly owned 12% of the equity interest in Motech previously held by TSMC Solar. Starting June 2016, the Company has no longer served as Motech’s board of director. As a result, the Company exercises no significant influence over Motech. Therefore, Motech is no longer accounted for using the equity method. Further, such investment was reclassified to available-for-sale financial assets and the Company recognized a disposal loss of NT$259,960 thousand. In March 2015, Xintec listed its shares on the R.O.C. Over-the-Counter (Taipei Exchange). Consequently, the Company’s percentage of ownership over Xintec was diluted to approximately 35.4%. In April 2015, the Company sold 2,172 thousand common shares of Xintec and recognized a disposal gain of NT$43,017 thousand. To simplify investment structure, the Company acquired 18,504 thousand shares of Xintec previously held by VisEra Holding by NT$445,012 thousand in August 2016. The percentage of ownership held by the Company increased to 41.4%.
- 134 -

- 135 -
In the second quarter of 2015, the Company sold 82,000 thousand common shares of VIS and recognized a disposal gain of NT$2,263,539 thousand. After the sale, the Company owned approximately 28.3% of the equity interest in VIS. The summarized financial information in respect of each of the Company’s material associates is set out below. The summarized financial information below represents amounts shown in the associate’s financial statements prepared in accordance with the Accounting Standards Used in Preparation of the Parent Company Only Financial Statements, which is also adjusted by the Company using the equity method of accounting. 1) VIS
December 31,
2016 December 31,
2015 Current assets $ 25,662,921 $ 24,800,749 Noncurrent assets $ 9,501,442 $ 7,785,093 Current liabilities $ 5,476,672 $ 4,262,001 Noncurrent liabilities $ 804,107 $ 712,611
Years Ended December 31 2016 2015 Net revenue $ 25,828,634 $ 23,319,721 Income from operations $ 6,083,625 $ 4,593,430 Net income $ 5,520,645 $ 4,139,031 Other comprehensive income (loss) $ 5,592 $ (61,886) Total comprehensive income $ 5,526,237 $ 4,077,145 Cash dividends received $ 1,206,981 $ 1,206,414
Reconciliation of the above summarized financial information to the carrying amount of the interest in the associate recognized in the parent company only balance sheets was as follows:
December 31,
2016 December 31,
2015 Net assets $ 28,883,584 $ 27,611,230 Percentage of ownership 28% 28% The Company’s share of net assets of the associate 8,179,830 7,819,500 Goodwill 626,554 626,554 Carrying amount of the investment $ 8,806,384 $ 8,446,054
2) SSMC
December 31,
2016 December 31,
2015 Current assets $ 14,585,150 $ 20,078,179 Noncurrent assets $ 5,360,076 $ 6,144,263 Current liabilities $ 1,746,602 $ 1,954,057 Noncurrent liabilities $ 286,340 $ 303,217
- 135 -

- 136 -
Years Ended December 31 2016 2015 Net revenue $ 14,045,927 $ 15,026,016 Income from operations $ 4,921,735 $ 5,802,261 Net income $ 4,918,140 $ 5,904,586 Total comprehensive income $ 4,918,140 $ 5,904,586 Cash dividends received $ 4,076,170 $ 1,556,592
Reconciliation of the above summarized financial information to the carrying amount of the interest in the associate recognized in the parent company only balance sheets was as follows:
December 31,
2016 December 31,
2015 Net assets $ 17,912,284 $ 23,965,168 Percentage of ownership 39% 39% The Company’s share of net assets of the associate 6,948,175 9,296,089 Goodwill 213,984 213,984 Other adjustments 1,357 1,442 Carrying amount of the investment $ 7,163,516 $ 9,511,515
Aggregate information of associates that are not individually material was summarized as follows: Years Ended December 31 2016 2015 The Company’s share of profits of associates $ 42,457 $ 219,007 The Company’s share of other comprehensive loss of
associates
$ (17,777) $ (855) The Company’s share of total comprehensive income of
associates
$ 24,680 $ 218,152 The market prices of the investments accounted for using the equity method in publicly traded stocks calculated by the closing price at the end of the reporting period are summarized as follows. The closing price represents the quoted price in active markets, the level 1 fair value measurement.
Name of Associate December 31,
2016 December 31,
2015 VIS $ 26,089,360 $ 19,868,766 GUC $ 3,664,997 $ 3,081,399 Xintec $ 3,622,227 $ 3,006,017 Motech $ 2,636,054
- 136 -

- 137 -
12. PROPERTY, PLANT AND EQUIPMENT
Land Buildings Machinery and
Equipment Office Equipment
Equipment under Installation and Construction in
Progress Total Cost Balance at January 1, 2016 $ 3,212,000 $ 272,949,721 $ 1,807,955,631 $ 27,809,576 $ 191,052,758 $ 2,302,979,686 Additions - 9,000,012 155,226,807 4,264,166 193,144,768 361,635,753 Disposals or retirements - (13,321 ) (2,724,958 ) (243,085 ) - (2,981,364 ) Balance at December 31, 2016 $ 3,212,000 $ 281,936,412 $ 1,960,457,480 $ 31,830,657 $ 384,197,526 $ 2,661,634,075 Accumulated depreciation Balance at January 1, 2016 $ - $ 140,493,396 $ 1,313,095,298 $ 17,606,080 $ - $ 1,471,194,774 Additions - 16,368,395 193,655,507 3,953,422 - 213,977,324 Disposals or retirements - (7,278 ) (2,688,997 ) (243,085 ) - (2,939,360 )
Balance at December 31, 2016 $ - $ 156,854,513 $ 1,504,061,808 $ 21,316,417 $ - $ 1,682,232,738 Carrying amounts at December 31, 2016 $ 3,212,000 $ 125,081,899 $ 456,395,672 $ 10,514,240 $ 384,197,526 $ 979,401,337 Cost Balance at January 1, 2015 $ 3,212,000 $ 244,902,026 $ 1,676,843,858 $ 25,494,170 $ 105,716,759 $ 2,056,168,813 Additions - 26,671,505 133,048,817 2,958,321 85,335,999 248,014,642 Disposals or retirements - (74,721 ) (2,109,856 ) (675,443 ) - (2,860,020 ) Effect of merger of subsidiary - 1,450,911 172,812 32,528 - 1,656,251 Balance at December 31, 2015 $ 3,212,000 $ 272,949,721 $ 1,807,955,631 $ 27,809,576 $ 191,052,758 $ 2,302,979,686 Accumulated depreciation and impairment Balance at January 1, 2015 $ - $ 124,864,919 $ 1,119,908,770 $ 14,710,763 $ - $ 1,259,484,452 Additions - 15,032,971 194,722,607 3,538,232 - 213,293,810 Disposals or retirements - (73,855 ) (1,936,928 ) (675,443 ) - (2,686,226 ) Impairment - - 228,037 - - 228,037 Effect of merger of subsidiary - 669,361 172,812 32,528 - 874,701
Balance at December 31, 2015 $ - $ 140,493,396 $ 1,313,095,298 $ 17,606,080 $ - $ 1,471,194,774 Carrying amounts at December 31, 2015 $ 3,212,000 $ 132,456,325 $ 494,860,333 $ 10,203,496 $ 191,052,758 $ 831,784,912
The significant part of the Company’s buildings includes main plants, mechanical and electrical power equipment and clean rooms, and the related depreciation is calculated using the estimated useful lives of 20 years, 10 years and 10 years, respectively. For the year ended December 31, 2015, the Company recognized an impairment loss of NT$228,037 thousand under foundry segment since the carrying amount of some of property, plant and equipment was expected to be unrecoverable. Such impairment loss was included in other operating income and expenses.
13. INTANGIBLE ASSETS
Goodwill Technology License Fees
Software and System Design
Costs Patent and
Others
Total Cost Balance at January 1, 2016 $ 1,567,756 $ 8,399,059 $ 19,297,534 $ 4,722,667 $ 33,987,016 Additions - 1,091,261 2,770,842 518,536 4,380,639 Retirements - - (4,787 ) - (4,787 ) Balance at December 31, 2016 $ 1,567,756 $ 9,490,320 $ 22,063,589 $ 5,241,203 $ 38,362,868 Accumulated amortization Balance at January 1, 2016 $ - $ 4,724,143 $ 16,279,451 $ 3,592,004 $ 24,595,598 Additions - 1,367,370 1,716,836 639,860 3,724,066 Retirements - - (4,787 ) - (4,787 ) Balance at December 31, 2016 $ - $ 6,091,513 $ 17,991,500 $ 4,231,864 $ 28,314,877 Carrying amounts at December 31, 2016 $ 1,567,756 $ 3,398,807 $ 4,072,089 $ 1,009,339 $ 10,047,991
(Continued)
- 137 -

- 138 -
Goodwill Technology License Fees
Software and System Design
Costs Patent and
Others
Total Cost Balance at January 1, 2015 $ 1,567,756 $ 6,093,450 $ 18,532,060 $ 4,136,156 $ 30,329,422 Additions - 2,112,572 854,962 586,511 3,554,045 Retirements - - (101,218 ) - (101,218 ) Effect of merger of subsidiary - 193,037 11,730 - 204,767 Balance at December 31, 2015 $ 1,567,756 $ 8,399,059 $ 19,297,534 $ 4,722,667 $ 33,987,016 Accumulated amortization Balance at January 1, 2015 $ - $ 3,605,977 $ 14,706,168 $ 3,020,467 $ 21,332,612 Additions - 925,129 1,662,771 571,537 3,159,437 Retirements - - (101,218 ) - (101,218 ) Effect of merger of subsidiary - 193,037 11,730 - 204,767 Balance at December 31, 2015 $ - $ 4,724,143 $ 16,279,451 $ 3,592,004 $ 24,595,598 Carrying amounts at December 31, 2015 $ 1,567,756 $ 3,674,916 $ 3,018,083 $ 1,130,663 $ 9,391,418
(Concluded)
The Company’s goodwill has been tested for impairment at the end of the annual reporting period and the recoverable amount is determined based on the value in use. The value in use was calculated based on the cash flow forecast from the financial budgets covering the future five-year period, and the Company used annual discount rate of 8.40% in its test of impairment for both December 31, 2016 and 2015 to reflect the relevant specific risk in the cash-generating unit. For the years ended December 31, 2016 and 2015, the Company did not recognize any impairment loss on goodwill.
14. OTHER ASSETS
December 31,
2016 December 31,
2015 Tax receivable $ 2,182,159 $ 1,875,772 Prepaid expenses 821,648 1,185,194 Long-term receivable - 360,000 Others 855 165 $ 3,004,662 $ 3,421,131 Current portion $ 3,004,662 $ 3,061,131 Noncurrent portion - 360,000 $ 3,004,662 $ 3,421,131
- 138 -

- 139 -
15. SHORT-TERM LOANS
December 31,
2016 December 31,
2015 Unsecured loans
Amount $ 57,958,200 $ 39,474,000 Original loan content
US$ (in thousands) $ 1,800,000 $ 1,200,000 Annual interest rate 0.87%-1.07% 0.50%-0.77% Maturity date Due by January
2017 Due by February
2016 16. PROVISIONS
December 31,
2016 December 31,
2015 Sales returns and allowances $ 16,991,612 $ 9,011,863 Warranties 28,187 46,304 $ 17,019,799 $ 9,058,167 Current portion $ 16,991,612 $ 9,011,863 Noncurrent portion (classified under other noncurrent liabilities) 28,187 46,304 $ 17,019,799 $ 9,058,167
Sales Returns and Allowances Warranties Total
Year ended December 31, 2016 Balance, beginning of year $ 9,011,863 $ 46,304 $ 9,058,167 Provision (Reversal) 35,699,912 (13,629) 35,686,283 Payment (27,720,163) (4,488) (27,724,651) Balance, end of year $ 16,991,612 $ 28,187 $ 17,019,799 Year ended December 31, 2015 Balance, beginning of year $ 9,959,817 $ - $ 9,959,817 Provision (Reversal) 16,811,021 (222) 16,810,799 Payment (17,758,975) - (17,758,975) Effect of merger of subsidiary - 46,526 46,526 Balance, end of year $ 9,011,863 $ 46,304 $ 9,058,167
Provisions for sales returns and allowances are estimated based on historical experience, management judgment, and any known factors that would significantly affect the returns and allowances, and are recognized as a reduction of revenue in the same year of the related product sales. The provision for warranties represents the present value of the Company’s best estimate of the future outflow of the economic benefits that will be required under the Company’s obligations for warranties. The best estimate has been made on the basis of historical warranty trends of business.
- 139 -

- 140 -
17. BONDS PAYABLE
December 31,
2016 December 31,
2015 Domestic unsecured bonds $ 154,200,000 $ 166,200,000 Less: Current portion (38,100,000) (12,000,000) $ 116,100,000 $ 154,200,000
The major terms of domestic unsecured bonds are as follows:
Issuance Tranche Issuance Period Total Amount Coupon
Rate Repayment and
Interest Payment 100-1 A September 2011 to
September 2016 $ 10,500,000 1.40% Bullet repayment;
interest payable annually
B September 2011 to September 2018
7,500,000 1.63% The same as above
100-2 A January 2012 to January 2017
10,000,000 1.29% The same as above
B January 2012 to January 2019
7,000,000 1.46% The same as above
101-1 A August 2012 to August 2017
9,900,000 1.28% The same as above
B August 2012 to August 2019
9,000,000 1.40% The same as above
101-2 A September 2012 to September 2017
12,700,000 1.28% The same as above
B September 2012 to September 2019
9,000,000 1.39% The same as above
101-3 - October 2012 to October 2022
4,400,000 1.53% The same as above
101-4 A January 2013 to January 2018
10,600,000 1.23% The same as above
B January 2013 to January 2020
10,000,000 1.35% The same as above
C January 2013 to January 2023
3,000,000 1.49% The same as above
102-1 A February 2013 to February 2018
6,200,000 1.23% The same as above
B February 2013 to February 2020
11,600,000 1.38% The same as above
C February 2013 to February 2023
3,600,000 1.50% The same as above
102-2 A July 2013 to July 2020 10,200,000 1.50% The same as above B July 2013 to July 2023 3,500,000 1.70% The same as above
(Continued)
- 140 -
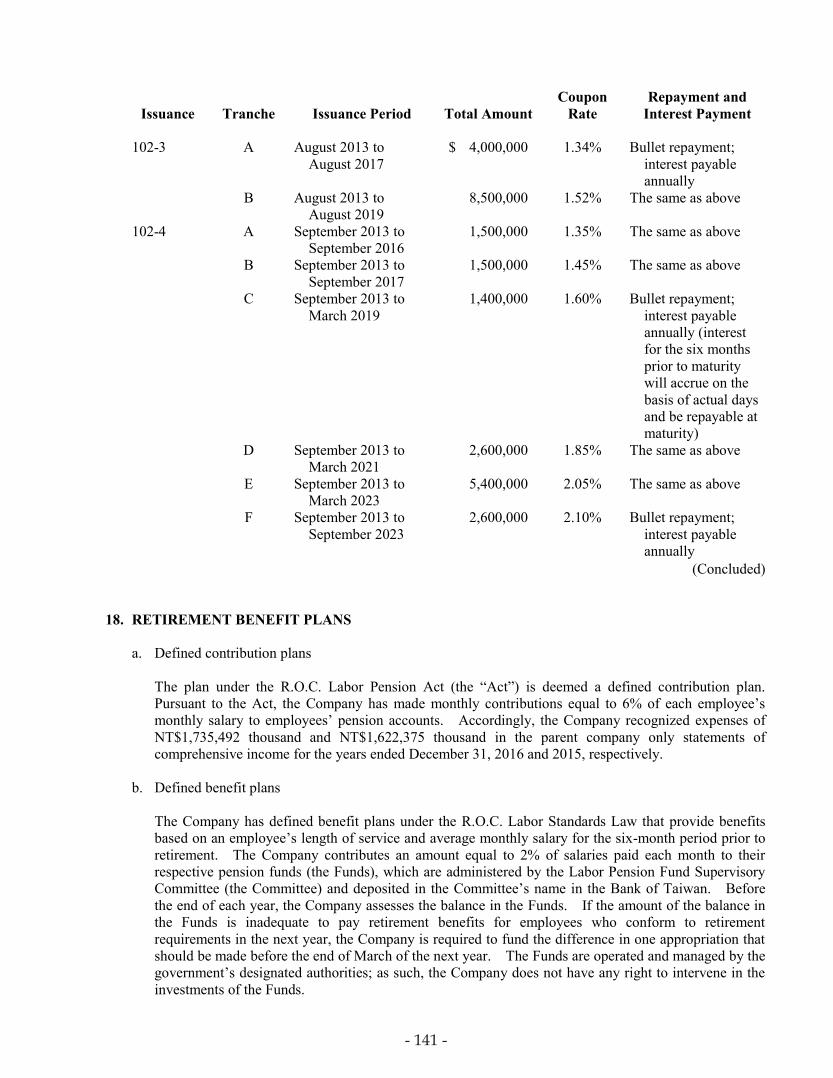
- 141 -
Issuance Tranche Issuance Period Total Amount Coupon
Rate Repayment and
Interest Payment 102-3 A August 2013 to
August 2017 $ 4,000,000 1.34% Bullet repayment;
interest payable annually
B August 2013 to August 2019
8,500,000 1.52% The same as above
102-4 A September 2013 to September 2016
1,500,000 1.35% The same as above
B September 2013 to September 2017
1,500,000 1.45% The same as above
C September 2013 to March 2019
1,400,000 1.60% Bullet repayment; interest payable annually (interest for the six months prior to maturity will accrue on the basis of actual days and be repayable at maturity)
D September 2013 to March 2021
2,600,000 1.85% The same as above
E September 2013 to March 2023
5,400,000 2.05% The same as above
F September 2013 to September 2023
2,600,000 2.10% Bullet repayment; interest payable annually
(Concluded) 18. RETIREMENT BENEFIT PLANS
a. Defined contribution plans
The plan under the R.O.C. Labor Pension Act (the “Act”) is deemed a defined contribution plan. Pursuant to the Act, the Company has made monthly contributions equal to 6% of each employee’s monthly salary to employees’ pension accounts. Accordingly, the Company recognized expenses of NT$1,735,492 thousand and NT$1,622,375 thousand in the parent company only statements of comprehensive income for the years ended December 31, 2016 and 2015, respectively.
b. Defined benefit plans
The Company has defined benefit plans under the R.O.C. Labor Standards Law that provide benefits based on an employee’s length of service and average monthly salary for the six-month period prior to retirement. The Company contributes an amount equal to 2% of salaries paid each month to their respective pension funds (the Funds), which are administered by the Labor Pension Fund Supervisory Committee (the Committee) and deposited in the Committee’s name in the Bank of Taiwan. Before the end of each year, the Company assesses the balance in the Funds. If the amount of the balance in the Funds is inadequate to pay retirement benefits for employees who conform to retirement requirements in the next year, the Company is required to fund the difference in one appropriation that should be made before the end of March of the next year. The Funds are operated and managed by the government’s designated authorities; as such, the Company does not have any right to intervene in the investments of the Funds.
- 141 -

- 142 -
Amounts recognized in the parent company only statements of comprehensive income in respect of these defined benefit plans were as follows: Years Ended December 31 2016 2015 Current service cost $ 132,786 $ 149,216 Net interest expense 139,355 144,754 Components of defined benefit costs recognized in profit or loss 272,141 293,970 Remeasurement on the net defined benefit liability:
Return on plan assets (excluding amounts included in net interest expense) 45,721 (13,707)
Actuarial loss arising from experience adjustments 38,195 297,077 Actuarial loss arising from changes in financial assumptions 694,632 544,333 Actuarial loss arising from changes in demographic
assumptions 278,672 - Components of defined benefit costs recognized in other
comprehensive income 1,057,220 827,703
Total $ 1,329,361 $ 1,121,673
The pension costs of the aforementioned defined benefit plans were recognized in profit or loss by the following categories: Years Ended December 31 2016 2015 Cost of revenue $ 176,977 $ 188,761 Research and development expenses 73,395 81,203 General and administrative expenses 17,367 19,091 Marketing expenses 4,402 4,915 $ 272,141 $ 293,970 The amounts arising from the defined benefit obligation of the Company in the parent company only balance sheets were as follows:
December 31,
2016 December 31,
2015 Present value of defined benefit obligation $ 12,480,480 $ 11,318,174 Fair value of plan assets (3,929,072) (3,870,148) Net defined benefit liability $ 8,551,408 $ 7,448,026
- 142 -

- 143 -
Movements in the present value of the defined benefit obligation were as follows: Years Ended December 31 2016 2015 Balance, beginning of year $ 11,318,174 $ 10,236,262 Current service cost 132,786 149,216 Interest expense 212,909 228,444 Remeasurement losses:
Actuarial loss arising from experience adjustments 38,195 297,077 Actuarial loss arising from changes in financial assumptions 694,632 544,333 Actuarial loss arising from changes in demographic
assumptions 278,672 - Benefits paid from plan assets (194,888) (146,136) Effect of merger of subsidiary - 8,978 Balance, end of year $ 12,480,480 $ 11,318,174 Movements in the fair value of the plan assets were as follows: Years Ended December 31 2016 2015 Balance, beginning of year $ 3,870,148 $ 3,689,413 Interest income 73,554 83,690 Remeasurement gains (losses):
Return on plan assets (excluding amounts included in net interest expense) (45,721) 13,707
Contributions from employer 225,979 220,496 Benefits paid from plan assets (194,888) (146,136) Effect of merger of subsidiary - 8,978 Balance, end of year $ 3,929,072 $ 3,870,148 The fair value of the plan assets by major categories at the end of reporting period was as follows:
December 31,
2016 December 31,
2015 Cash $ 818,426 $ 690,821 Equity instruments 1,852,950 2,070,142 Debt instruments 1,257,696 1,109,185 $ 3,929,072 $ 3,870,148 The actuarial valuations of the present value of the defined benefit obligation were carried out by qualified actuaries. The principal assumptions of the actuarial valuation were as follows: Measurement Date
December 31,
2016 December 31,
2015 Discount rate 1.50% 1.90% Future salary increase rate 3.00% 3.00%
- 143 -

- 144 -
Through the defined benefit plans under the R.O.C. Labor Standards Law, the Company is exposed to the following risks: 1) Investment risk: The pension funds are invested in equity and debt securities, bank deposits, etc.
The investment is conducted at the discretion of the government’s designated authorities or under the mandated management. However, under the R.O.C. Labor Standards Law, the rate of return on assets shall not be less than the average interest rate on a two-year time deposit published by the local banks and the government is responsible for any shortfall in the event that the rate of return is less than the required rate of return.
2) Interest risk: A decrease in the government bond interest rate will increase the present value of the
defined benefit obligation; however, this will be partially offset by an increase in the return on the debt investments of the plan assets.
Assuming a hypothetical decrease in interest rate at the end of the reporting period contributed to a decrease of 0.5% in the discount rate and all other assumptions were held constant, the present value of the defined benefit obligation would increase by NT$970,282 thousand and NT$844,058 thousand as of December 31, 2016 and 2015, respectively.
3) Salary risk: The present value of the defined benefit obligation is calculated by reference to the
future salaries of plan participants. As such, an increase in the salary of the plan participants will increase the present value of the defined benefit obligation.
Assuming the expected salary rate increases by 0.5% at the end of the reporting period and all other assumptions were held constant, the present value of the defined benefit obligation would increase by NT$951,424 thousand and NT$830,699 thousand as of December 31, 2016 and 2015, respectively.
The sensitivity analysis presented above may not be representative of the actual change in the defined benefit obligation as it is unlikely that the change in assumptions would occur in isolation of one another as some of the assumptions may be correlated. Furthermore, in presenting the above sensitivity analysis, the present value of the defined benefit obligation has been calculated using the projected unit credit method at the end of the reporting period, which is the same as that applied in calculating the defined benefit obligation liability recognized in the parent company only balance sheets. The Company expects to make contributions of NT$232,759 thousand to the defined benefit plans in the next year starting from December 31, 2016. The weighted average duration of the defined benefit obligation is 14 years.
19. GUARANTEE DEPOSITS
December 31,
2016 December 31,
2015 Capacity guarantee $ 20,929,350 $ 27,549,563 Others 176,992 172,624 $ 21,106,342 $ 27,722,187 Current portion (classified under accrued expenses and other current
liabilities)
$ 6,439,800 $ 6,167,813 Noncurrent portion 14,666,542 21,554,374 $ 21,106,342 $ 27,722,187
- 144 -
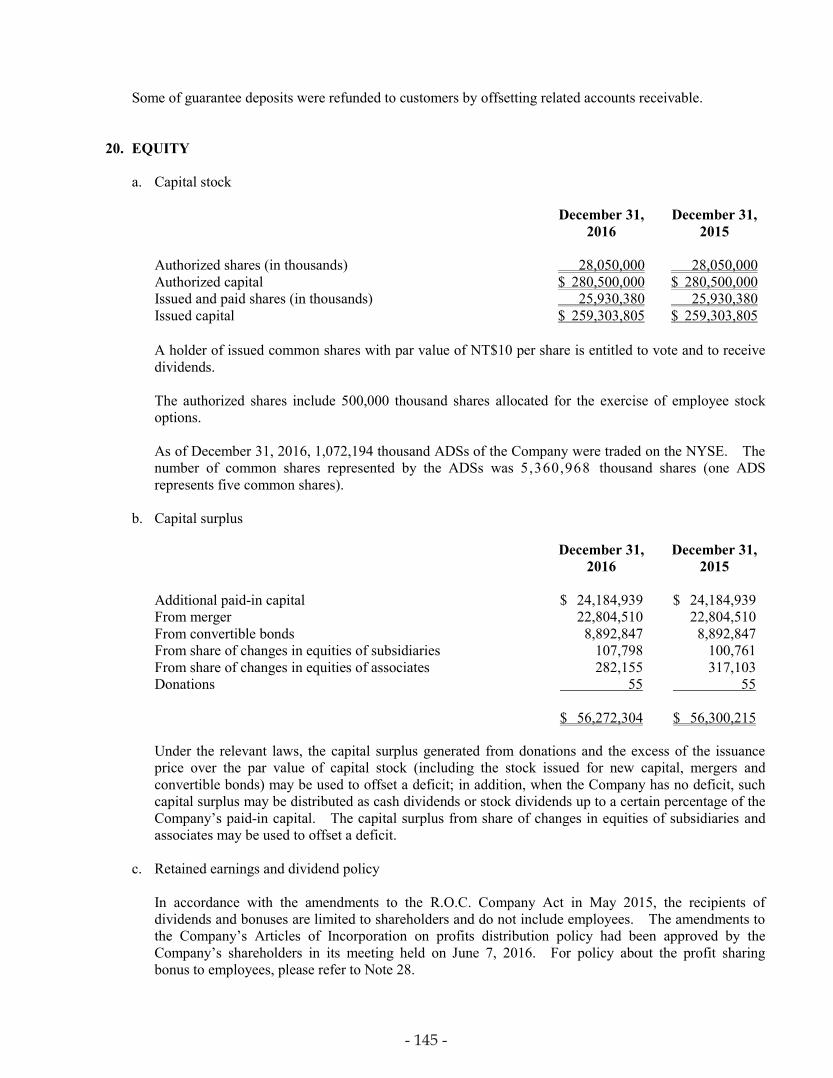
- 145 -
Some of guarantee deposits were refunded to customers by offsetting related accounts receivable.
20. EQUITY a. Capital stock
December 31,
2016 December 31,
2015 Authorized shares (in thousands) 28,050,000 28,050,000 Authorized capital $ 280,500,000 $ 280,500,000 Issued and paid shares (in thousands) 25,930,380 25,930,380 Issued capital $ 259,303,805 $ 259,303,805
A holder of issued common shares with par value of NT$10 per share is entitled to vote and to receive dividends. The authorized shares include 500,000 thousand shares allocated for the exercise of employee stock options. As of December 31, 2016, 1,072,194 thousand ADSs of the Company were traded on the NYSE. The number of common shares represented by the ADSs was 5,360,968 thousand shares (one ADS represents five common shares).
b. Capital surplus
December 31,
2016 December 31,
2015 Additional paid-in capital $ 24,184,939 $ 24,184,939 From merger 22,804,510 22,804,510 From convertible bonds 8,892,847 8,892,847 From share of changes in equities of subsidiaries 107,798 100,761 From share of changes in equities of associates 282,155 317,103 Donations 55 55 $ 56,272,304 $ 56,300,215
Under the relevant laws, the capital surplus generated from donations and the excess of the issuance price over the par value of capital stock (including the stock issued for new capital, mergers and convertible bonds) may be used to offset a deficit; in addition, when the Company has no deficit, such capital surplus may be distributed as cash dividends or stock dividends up to a certain percentage of the Company’s paid-in capital. The capital surplus from share of changes in equities of subsidiaries and associates may be used to offset a deficit.
c. Retained earnings and dividend policy
In accordance with the amendments to the R.O.C. Company Act in May 2015, the recipients of dividends and bonuses are limited to shareholders and do not include employees. The amendments to the Company’s Articles of Incorporation on profits distribution policy had been approved by the Company’s shareholders in its meeting held on June 7, 2016. For policy about the profit sharing bonus to employees, please refer to Note 28.
- 145 -

- 146 -
The Company’s amended Articles of Incorporation provide that, when allocating the net profits for each fiscal year, the Company shall first offset its losses in previous years and then set aside the following items accordingly: 1) Legal capital reserve at 10% of the profits left over, until the accumulated legal capital reserve
equals the Company’s paid-in capital; 2) Special capital reserve in accordance with relevant laws or regulations or as requested by the
authorities in charge; 3) Any balance left over shall be allocated according to the resolution of the shareholders’ meeting. The Company’s Articles of Incorporation also provide that profits of the Company may be distributed by way of cash dividend and/or stock dividend. However, distribution of profits shall be made preferably by way of cash dividend. Distribution of profits may also be made by way of stock dividend; provided that the ratio for stock dividend shall not exceed 50% of the total distribution.
Any appropriations of the profits are subject to shareholders’ approval in the following year.
The appropriation for legal capital reserve shall be made until the reserve equals the Company’s paid-in capital. The reserve may be used to offset a deficit, or be distributed as dividends in cash or stocks for the portion in excess of 25% of the paid-in capital if the Company incurs no loss.
Pursuant to existing regulations, the Company is required to set aside additional special capital reserve equivalent to the net debit balance of the other components of stockholders’ equity, such as the accumulated balance of foreign currency translation reserve, unrealized valuation gain/loss from available-for-sale financial assets, gain/loss from changes in fair value of hedging instruments in cash flow hedges, etc. For the subsequent decrease in the deduction amount to stockholders’ equity, any special reserve appropriated may be reversed to the extent that the net debit balance reverses. The appropriations of 2015 and 2014 earnings have been approved by the Company’s shareholders in its meetings held on June 7, 2016 and on June 9, 2015, respectively. The appropriations and dividends per share were as follows:
Appropriation of Earnings Dividends Per Share
(NT$) For Fiscal For Fiscal For Fiscal For Fiscal Year 2015 Year 2014 Year 2015 Year 2014 Legal capital reserve $ 30,657,384 $ 26,389,879 Cash dividends to shareholders 155,582,283 116,683,481 $6.0 $4.5 $ 186,239,667 $ 143,073,360 The Company’s appropriations of earnings for 2016 had been approved in the meeting of the Board of Directors held on February 14, 2017. The appropriations and dividends per share were as follows:
Appropriation
of Earnings Dividends Per
Share (NT$) For Fiscal Year
2016 For Fiscal Year
2016 Legal capital reserve $ 33,424,718 Cash dividends to shareholders 181,512,663 $ 7.0 $ 214,937,381
- 146 -

- 147 -
The appropriations of earnings for 2016 are to be presented for approval in the Company’s shareholders’ meeting to be held on June 8, 2017 (expected). Under the Integrated Income Tax System that became effective on January 1, 1998, the R.O.C. resident shareholders are allowed a tax credit for their proportionate share of the income tax paid by the Company on earnings generated since January 1, 1998.
d. Others
Changes in others were as follows: Year Ended December 31, 2016
Foreign Currency
Translation Reserve
Unrealized Gain/Loss from Available-for- sale Financial
Assets Cash Flow
Hedges Reserve Total Balance, beginning of year $ 11,039,949 $ 734,771 $ (607) $ 11,774,113
Exchange differences arising on translation of foreign operations
(9,439,776)
-
-
(9,439,776) Changes in fair value of
available-for-sale financial assets
-
148,917
-
148,917 Cumulative gain reclassified to
profit or loss upon disposal of available-for-sale financial assets
-
(101,411)
-
(101,411) Share of other comprehensive
income of subsidiaries and associates
65,776
(714,991)
712
(648,503) The proportionate share of other
comprehensive income/losses reclassified to profit or loss upon partial disposal of associates
(4,712)
(3,469)
-
(8,181) Income tax effect - (61,176) - (61,176)
Balance, end of year $ 1,661,237 $ 2,641 $ 105 $ 1,663,983
Year Ended December 31, 2015
Foreign Currency
Translation Reserve
Unrealized Gain/Loss from Available-for- sale Financial
Assets Cash Flow
Hedges Reserve Total Balance, beginning of year $ 4,502,113 $ 21,247,483 $ (305) $ 25,749,291
Exchange differences arising on translation of foreign operations
6,525,608
-
-
6,525,608 Changes in fair value of
available-for-sale financial assets
-
94,115
-
94,115 (Continued)
- 147 -

- 148 -
Year Ended December 31, 2015
Foreign Currency
Translation Reserve
Unrealized Gain/Loss from Available-for- sale Financial
Assets Cash Flow
Hedges Reserve Total
Cumulative gain reclassified to profit or loss upon disposal of available-for-sale financial assets
$ -
$ (51)
$ -
$ (51) Share of other comprehensive
income of subsidiaries and associates
9,102
(20,592,836)
(313)
(20,584,047) The proportionate share of other
comprehensive income/losses reclassified to profit or loss upon partial disposal of associates
3,126
2,051
11
5,188 Income tax effect - (15,991) - (15,991)
Balance, end of year $ 11,039,949 $ 734,771 $ (607) $ 11,774,113 (Concluded)
The exchange differences arising on translation of foreign operation’s net assets from its functional currency to the Company’s presentation currency are recognized directly in other comprehensive income and also accumulated in the foreign currency translation reserve. Unrealized gain/loss on available-for-sale financial assets represents the cumulative gains or losses arising from the fair value measurement on available-for-sale financial assets that are recognized in other comprehensive income. When those available-for-sale financial assets have been disposed of or are determined to be impaired subsequently, the related cumulative gains or losses in other comprehensive income are reclassified to profit or loss. The cash flow hedges reserve represents the cumulative effective portion of gains or losses arising on changes in fair value of the hedging instruments entered into as cash flow hedges. The cumulative gains or losses arising on changes in fair value of the hedging instruments that are recognized and accumulated in cash flow hedges reserve will be reclassified to profit or loss only when the hedge transaction affects profit or loss.
21. SHARE-BASED PAYMENT
The Company’s Employee Stock Option Plans, consisting of the TSMC 2004 Plan, TSMC 2003 Plan and TSMC 2002 Plan, were approved by the Securities and Futures Bureau on January 6, 2005, October 29, 2003 and June 25, 2002, respectively. The maximum number of stock options authorized to be granted under the TSMC 2004 Plan, TSMC 2003 Plan and TSMC 2002 Plan was 11,000 thousand, 120,000 thousand and 100,000 thousand, respectively, with each stock option eligible to subscribe for one common share of the Company when exercised. The stock options may be granted to qualified employees of the Company or any of its domestic or foreign subsidiaries, in which the Company’s shareholding with voting rights, directly or indirectly, is more than fifty percent (50%). The stock options of all the plans are valid for ten years and exercisable at certain percentages subsequent to the second anniversary of the grant date. Under the terms of the plans, the stock options are granted at an exercise price equal to the closing price of the Company’s common shares quoted on the TWSE on the grant date.
- 148 -
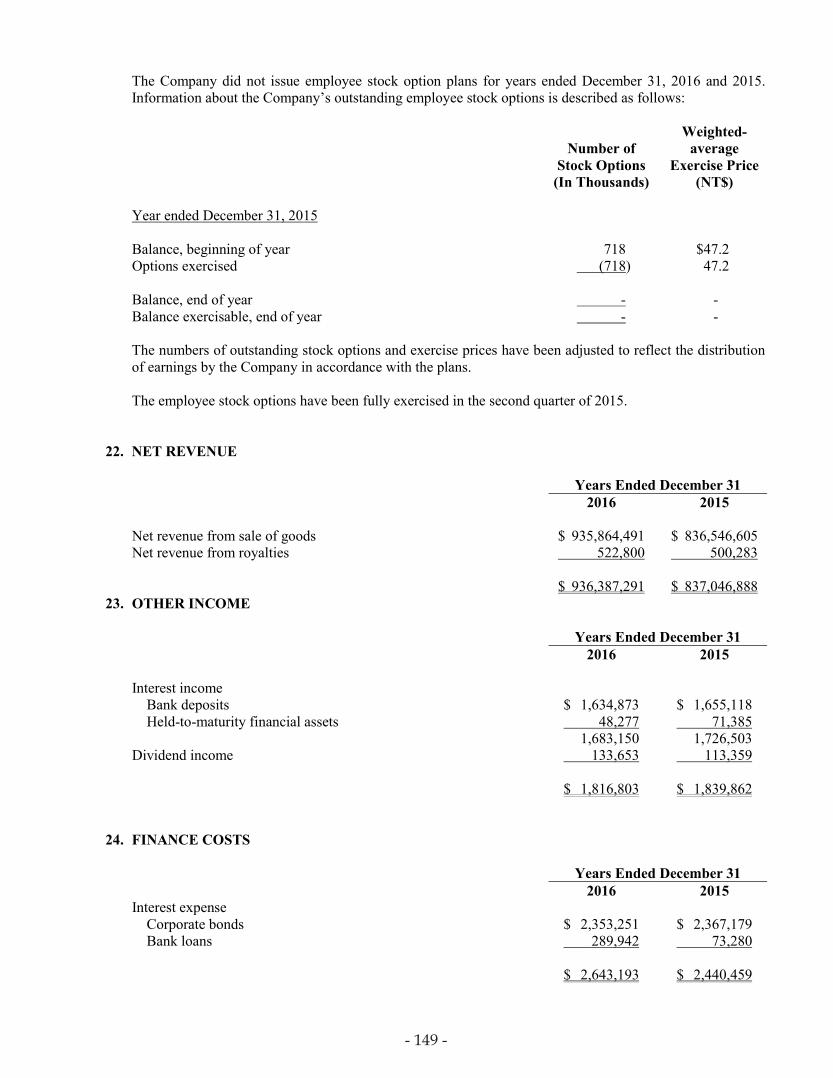
- 149 -
The Company did not issue employee stock option plans for years ended December 31, 2016 and 2015. Information about the Company’s outstanding employee stock options is described as follows:
Number of Stock Options
(In Thousands)
Weighted- average
Exercise Price (NT$)
Year ended December 31, 2015 Balance, beginning of year 718 $47.2 Options exercised (718) 47.2 Balance, end of year - - Balance exercisable, end of year - -
The numbers of outstanding stock options and exercise prices have been adjusted to reflect the distribution of earnings by the Company in accordance with the plans. The employee stock options have been fully exercised in the second quarter of 2015.
22. NET REVENUE
Years Ended December 31 2016 2015 Net revenue from sale of goods $ 935,864,491 $ 836,546,605 Net revenue from royalties 522,800 500,283 $ 936,387,291 $ 837,046,888
23. OTHER INCOME
Years Ended December 31 2016 2015
Interest income
Bank deposits $ 1,634,873 $ 1,655,118 Held-to-maturity financial assets 48,277 71,385 1,683,150 1,726,503
Dividend income 133,653 113,359
$ 1,816,803 $ 1,839,862 24. FINANCE COSTS
Years Ended December 31 2016 2015 Interest expense
Corporate bonds $ 2,353,251 $ 2,367,179 Bank loans 289,942 73,280 $ 2,643,193 $ 2,440,459
- 149 -

- 150 -
25. OTHER GAINS AND LOSSES
Years Ended December 31 2016 2015 Gain on disposal of financial assets, net
Available-for-sale financial assets $ 101,411 $ 51 Other gains 125,282 123,920 Net gain (loss) on financial instruments at FVTPL
Held for trading 899,991 (1,719,106) Designated as at FVTPL (76,691) -
Gain (loss) on disposal of investments accounted for using equity method, net (296,065) 2,419,785
Impairment loss of financial assets Financial assets carried at cost (4,537) (21,437)
Other losses (15,291) (15,228) $ 734,100 $ 787,985
26. INCOME TAX
a. Income tax expense recognized in profit or loss
Income tax expense consisted of the following:
Years Ended December 31 2016 2015
Current income tax expense
Current tax expense recognized in the current year $ 53,577,418 $ 45,633,743 Income tax adjustments on prior years (1,039,175) (979,196) Other income tax adjustments 168,040 142,426
52,706,283 44,796,973 Deferred income tax benefit
The origination and reversal of temporary differences (1,764,503) (1,382,142) Income tax expense recognized in profit or loss $ 50,941,780 $ 43,414,831
A reconciliation of income before income tax and income tax expense recognized in profit or loss was as follows: Years Ended December 31 2016 2015 Income before tax $ 385,188,960 $ 349,988,668 Income tax expense at the statutory rate (17%) $ 65,482,123 $ 59,498,074 Tax effect of adjusting items:
Nondeductible (deductible) items in determining taxable income 121,152 (6,011,617)
Tax-exempt income (19,075,801) (21,760,175) Additional income tax under the Alternative Minimum Tax Act - 6,041,603
(Continued)
- 150 -

- 151 -
Years Ended December 31 2016 2015 Additional income tax on unappropriated earnings $ 11,957,213 $ 12,103,200 The origination and reversal of temporary differences (1,764,503) (1,382,142) Income tax credits (4,907,269) (4,237,342) 51,812,915 44,251,601 Income tax adjustments on prior years (1,039,175) (979,196) Other income tax adjustments 168,040 142,426 Income tax expense recognized in profit or loss $ 50,941,780 $ 43,414,831
(Concluded)
b. Income tax expense recognized in other comprehensive income
Years Ended December 31 2016 2015
Deferred income tax benefit (expense)
Related to remeasurement of defined benefit obligation $ 126,867 $ 99,324 Related to unrealized gain/loss on available-for-sale financial
assets
(61,176) (15,991) $ 65,691 $ 83,333
c. Deferred income tax balance
The analysis of deferred income tax assets and liabilities in the parent company only balance sheets was as follows:
December 31,
2016 December 31,
2015 Deferred income tax assets
Temporary differences Depreciation $ 3,284,735 $ 1,874,632 Provision for sales returns and allowance 1,428,787 1,081,423 Net defined benefit liability 939,543 895,486 Unrealized loss on inventories 698,858 573,243 Others 94,858 81,891
$ 6,446,781 $ 4,506,675
Deferred income tax liabilities
Temporary differences Available-for-sale financial assets $ (92,447) $ (31,271) Unrealized exchange gains (48,736) -
$ (141,183) $ (31,271)
- 151 -

- 152 -
Recognized in Balance, Other Beginning of Comprehensive Balance, Year Profit or Loss Income End of Year Year Ended December 31, 2016 Deferred income tax assets
Temporary differences Depreciation $ 1,874,632 $ 1,410,103 $ - 3,284,735 Provision for sales returns and
allowance
1,081,423
347,364
-
1,428,787 Net defined benefit liability 895,486 (82,810) 126,867 939,543 Unrealized loss on inventories 573,243 125,615 - 698,858 Others 81,891 12,967 - 94,858
$ 4,506,675 $ 1,813,239 $ 126,867 $ 6,446,781 Deferred income tax liabilities
Temporary differences Available-for-sale financial
assets
$ (31,271)
$ -
$ (61,176)
$ (92,447) Unrealized exchange gains - (48,736) - (48,736)
$ (31,271) $ (48,736) $ (61,176) $ (141,183) Year Ended December 31, 2015 Deferred income tax assets
Temporary differences Depreciation $ 610,819 $ 1,263,813 $ - $ 1,874,632 Provision for sales returns and
allowance
1,195,178
(113,755)
-
1,081,423 Net defined benefit liability 787,492 8,670 99,324 895,486 Unrealized loss on inventories 547,249 25,994 - 573,243 Others 68,941 12,950 - 81,891
$ 3,209,679 $ 1,197,672 $ 99,324 $ 4,506,675 Deferred income tax liabilities
Temporary differences Available-for-sale financial
assets
$ (15,280)
$ -
$ (15,991)
$ (31,271) Unrealized exchange gains (184,470) 184,470 - -
$ (199,750) $ 184,470 $ (15,991) $ (31,271)
d. The deductible temporary differences for which no deferred income tax assets have been recognized in
the parent company only financial statements
As of December 31, 2016 and 2015, the aggregate deductible temporary differences for which no deferred income tax assets have been recognized amounted to NT$1,919,784 thousand and NT$1,972,286 thousand, respectively.
- 152 -

- 153 -
e. Unused tax-exemption information
As of December 31, 2016, the profits generated from the following projects of the Company are exempt from income tax for a five-year period:
Tax-exemption Period Construction and expansion of 2007 2014 to 2018 Construction and expansion of 2008 2015 to 2019 Construction and expansion of 2009 2018 to 2022
f. The information of unrecognized deferred income tax liabilities associated with investments
As of December 31, 2016 and 2015, the aggregate taxable temporary differences associated with investments in subsidiaries not recognized as deferred income tax liabilities amounted to NT$83,181,401 thousand and NT$80,919,309 thousand, respectively.
g. Integrated income tax information
December 31,
2016 December 31,
2015 Balance of the Imputation
Credit Account $ 82,072,562 $ 59,973,516 The estimated and actual creditable ratio for distribution of the Company’s earnings of 2016 and 2015 were 13.94% and 12.57%, respectively; however, effective from January 1, 2015, the creditable ratio for individual shareholders residing in the R.O.C. will be half of the original creditable ratio according to the revised Article 66 - 6 of the R.O.C. Income Tax Law. The imputation credit allocated to shareholders is based on its balance as of the date of the dividend distribution. The estimated creditable ratio may change when the actual distribution of the imputation credit is made. All earnings generated prior to December 31, 1997 have been appropriated.
h. Income tax examination
The tax authorities have examined income tax returns of the Company through 2013. All investment tax credit adjustments assessed by the tax authorities have been recognized accordingly.
27. EARNINGS PER SHARE
Years Ended December 31 2016 2015
Basic EPS $12.89 $11.82 Diluted EPS $12.89 $11.82
- 153 -

- 154 -
EPS is computed as follows:
Amounts (Numerator)
Number of Shares
(Denominator) (In Thousands)
EPS (NT$) Year ended December 31, 2016 Basic/Diluted EPS
Net income available to common shareholders $ 334,247,180 25,930,380 $12.89 Year ended December 31, 2015 Basic EPS
Net income available to common shareholders $ 306,573,837 25,930,288 $11.82 Effect of dilutive potential common shares - 92
Diluted EPS
Net income available to common shareholders (including effect of dilutive potential common shares)
$ 306,573,837 25,930,380 $11.82 28. ADDITIONAL INFORMATION OF EXPENSES BY NATURE
Years Ended December 31 2016 2015 a. Depreciation of property, plant and equipment
Recognized in cost of revenue $ 197,595,313 $ 198,343,742 Recognized in operating expenses 16,357,124 14,925,181 Recognized in other operating income and expenses 24,887 24,887
$ 213,977,324 $ 213,293,810 b. Amortization of intangible assets
Recognized in cost of revenue $ 2,014,814 $ 1,605,572 Recognized in operating expenses 1,709,252 1,553,865 $ 3,724,066 $ 3,159,437
c. Research and development costs expensed as incurred $ 70,366,179 $ 64,831,860 d. Employee benefits expenses
Post-employment benefits
Defined contribution plans $ 1,735,492 $ 1,622,375 Defined benefit plans 272,141 293,970
2,007,633 1,916,345 Other employee benefits 86,133,216 79,254,303
$ 88,140,849 $ 81,170,648
(Continued)
- 154 -

- 155 -
Years Ended December 31 2016 2015
Employee benefits expense summarized by function
Recognized in cost of revenue $ 53,109,947 $ 48,246,789 Recognized in operating expenses 35,030,902 32,923,859 $ 88,140,849 $ 81,170,648
(Concluded) In accordance with the amendments to the R.O.C. Company Act in May 2015 and the amended the Company’s Articles of Incorporation approved by the Company’s shareholders in its meeting held on June 7, 2016, the Company shall allocate compensation to directors and profit sharing bonus to employees of the Company not more than 0.3% and not less than 1% of annual profits during the period, respectively. Prior to the amendments, the Company’s Articles of Incorporation provided that, when allocating the net profits for each fiscal year, the Company shall first set aside legal capital reserve and special capital reserve, then set aside not more than 0.3% of the balance as compensation to directors and not less than 1% as profit sharing bonus to employees, respectively. The Company accrued profit sharing bonus to employees based on a percentage of net income before income tax, profit sharing bonus to employees and compensation to directors during the period, which amounted to NT$22,418,339 thousand and NT$20,556,888 thousand for the years ended December 31, 2016 and 2015, respectively; compensation to directors was expensed based on estimated amount payable. If there is a change in the proposed amounts after the annual parent company only financial statements are authorized for issue, the differences are recorded as a change in accounting estimate. The Board of Directors of the Company held on February 14, 2017 approved the profit sharing bonus to employees and compensation to directors in the amounts of NT$22,418,339 thousand and NT$376,432 thousand in cash for 2016, respectively. There is no significant difference between the aforementioned approved amounts and the amounts charged against earnings of 2016. The Company’s profit sharing bonus to employees and compensation to directors in the amounts of NT$20,556,888 thousand and NT$356,186 thousand in cash for 2015, respectively, had been approved by the Board of Directors on February 2, 2016. The profit sharing bonus to employees and compensation to directors in cash for 2015 had been reported to the Company’s shareholders in its meeting held on June 7, 2016, after the amended the Company’s Articles of Incorporation had been approved. The aforementioned approved amount has no difference with the one recognized in the parent company only financial statements for the year ended December 31, 2015.
The Company’s profit sharing bonus to employees and compensation to directors in the amounts of NT$17,645,966 thousand and NT$406,854 thousand in cash for 2014, respectively, had been approved by the shareholders in its meetings held on June 9, 2015. The aforementioned approved amount has no difference with the one recognized in the parent company only financial statements for the year ended December 31, 2014. The information about the appropriations of the Company’s profit sharing bonus to employees and compensation to directors is available at the Market Observation Post System website.
- 155 -
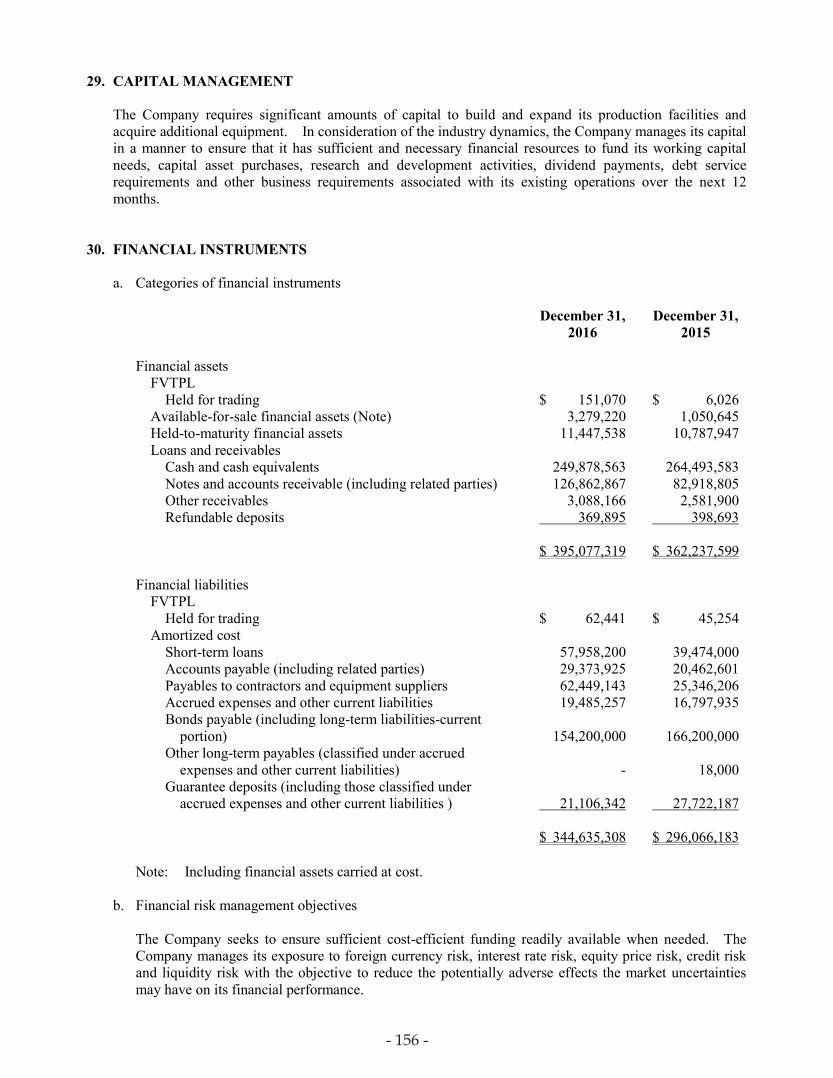
- 156 -
29. CAPITAL MANAGEMENT
The Company requires significant amounts of capital to build and expand its production facilities and acquire additional equipment. In consideration of the industry dynamics, the Company manages its capital in a manner to ensure that it has sufficient and necessary financial resources to fund its working capital needs, capital asset purchases, research and development activities, dividend payments, debt service requirements and other business requirements associated with its existing operations over the next 12 months.
30. FINANCIAL INSTRUMENTS a. Categories of financial instruments
December 31,
2016 December 31,
2015 Financial assets
FVTPL Held for trading $ 151,070 $ 6,026
Available-for-sale financial assets (Note) 3,279,220 1,050,645 Held-to-maturity financial assets 11,447,538 10,787,947 Loans and receivables
Cash and cash equivalents 249,878,563 264,493,583 Notes and accounts receivable (including related parties) 126,862,867 82,918,805 Other receivables 3,088,166 2,581,900 Refundable deposits 369,895 398,693
$ 395,077,319 $ 362,237,599
Financial liabilities
FVTPL Held for trading $ 62,441 $ 45,254
Amortized cost Short-term loans 57,958,200 39,474,000 Accounts payable (including related parties) 29,373,925 20,462,601 Payables to contractors and equipment suppliers 62,449,143 25,346,206 Accrued expenses and other current liabilities 19,485,257 16,797,935 Bonds payable (including long-term liabilities-current
portion) 154,200,000 166,200,000 Other long-term payables (classified under accrued
expenses and other current liabilities) - 18,000 Guarantee deposits (including those classified under
accrued expenses and other current liabilities ) 21,106,342 27,722,187 $ 344,635,308 $ 296,066,183
Note: Including financial assets carried at cost.
b. Financial risk management objectives
The Company seeks to ensure sufficient cost-efficient funding readily available when needed. The Company manages its exposure to foreign currency risk, interest rate risk, equity price risk, credit risk and liquidity risk with the objective to reduce the potentially adverse effects the market uncertainties may have on its financial performance.
- 156 -

- 157 -
The plans for material treasury activities are reviewed by Audit Committees and/or Board of Directors in accordance with procedures required by relevant regulations or internal controls. During the implementation of such plans, Corporate Treasury function must comply with certain treasury procedures that provide guiding principles for overall financial risk management and segregation of duties.
c. Market risk
The Company is exposed to the market risks arising from changes in foreign exchange rates, interest rates and the prices in equity investments, and utilizes some derivative financial instruments to reduce the related risks. Foreign currency risk Most of the Company’s operating activities are denominated in foreign currencies. Consequently, the Company is exposed to foreign currency risk. To protect against reductions in value and the volatility of future cash flows caused by changes in foreign exchange rates, the Company utilizes derivative financial instruments, including currency forward contracts and cross currency swaps, to hedge its currency exposure. These instruments help to reduce, but do not eliminate, the impact of foreign currency exchange rate movements. The Company also holds short-term borrowings in foreign currencies in proportion to its expected future cash flows. This allows foreign-currency-denominated borrowings to be serviced with expected future cash flows and provides a partial hedge against transaction translation exposure. The Company’s sensitivity analysis to foreign currency risk mainly focuses on the foreign currency monetary items at the end of the reporting period. Assuming an unfavorable 10% movement in the levels of foreign exchanges against the New Taiwan dollar, the net income for the years ended December 31, 2016 and 2015 would have decreased by NT$116,345 thousand and NT$902,173 thousand, respectively, after taking into consideration of the hedging contracts and the hedged items. Interest rate risk The Company is exposed to interest rate risk arising from borrowing at fixed interest rates and from fixed income securities. All of the Company’s long-term bonds have fixed interest rates and are measured at amortized cost. As such, changes in interest rates would not affect the future cash flows. The Company classified fixed income securities as held-to-maturity financial assets. Because held-to-maturity fixed income securities are measured at amortized cost, changes in interest rates would not affect the fair value. Other price risk The Company is exposed to equity price risk arising from available-for-sale equity investments. Assuming a hypothetical decrease of 5% in equity prices of the equity investments at the end of the reporting period, the net income for the years ended December 31, 2016 and 2015 would have been unaffected as they were classified as available-for-sale; however, the other comprehensive income for the years ended December 31, 2016 and 2015 would have decreased by NT$141,570 thousand and NT$44,410 thousand, respectively.
- 157 -

- 158 -
d. Credit risk management
Credit risk refers to the risk that a counterparty will default on its contractual obligations resulting in financial loss to the Company. The Company is exposed to credit risk from operating activities, primarily trade receivables, and from investing activities, primarily deposits, fixed-income investments and other financial instruments with banks. Credit risk is managed separately for business related and financial related exposures. As of the end of the reporting period, the Company’s maximum credit risk exposure is mainly from the carrying amount of financial assets recognized in the parent company only balance sheet. Business related credit risk The Company has considerable trade receivables outstanding with its customers worldwide. A substantial majority of the Company’s outstanding trade receivables are not covered by collateral or credit insurance. While the Company has procedures to monitor and limit exposure to credit risk on trade receivables, there can be no assurance such procedures will effectively limit its credit risk and avoid losses. This risk is heightened during periods when economic conditions worsen. As of December 31, 2016 and 2015, the Company’s ten largest customers accounted for 74% and 67% of accounts receivable, respectively. The Company believes the concentration of credit risk is insignificant for the remaining accounts receivable. Financial credit risk The Company regularly monitors and reviews the transaction limit applied to counterparties and adjusts the concentration limit according to market conditions and the credit standing of the counterparties. The Company mitigates its exposure by selecting counterparties with investment-grade credit ratings.
e. Liquidity risk management The objective of liquidity risk management is to ensure the Company has sufficient liquidity to fund its business requirements associated with existing operations over the next 12 months. The Company manages its liquidity risk by maintaining adequate cash. The table below summarizes the maturity profile of the Company’s financial liabilities based on contractual undiscounted payments, including principal and interest.
Less Than
1 Year 2-3 Years 4-5 Years 5+ Years
Total December 31, 2016 Non-derivative financial liabilities Short-term loans $ 57,974,562 $ - $ - $ - $ 57,974,562 Accounts payable (including related
parties) 29,373,925 - - - 29,373,925 Payables to contractors and
equipment suppliers 62,449,143 - - - 62,449,143 Accrued expenses and other current
liabilities 19,485,257 - - - 19,485,257 Bonds payable 40,067,749 61,831,777 35,340,742 22,979,426 160,219,694 Guarantee deposits (including those
classified under accrued expenses and other current liabilities) 6,439,800 13,056,592 1,609,950 - 21,106,342
215,790,436 74,888,369 36,950,692 22,979,426 350,608,923 (Continued)
- 158 -

- 159 -
Less Than
1 Year 2-3 Years 4-5 Years 5+ Years
Total Derivative financial instruments Forward exchange contracts
Outflows $ 26,366,343 $ - $ - $ - $ 26,366,343 Inflows (26,490,320 ) - - - (26,490,320 ) (123,977 ) - - - (123,977 )
Cross currency swap contracts Outflows 5,478,066 - - - 5,478,066 Inflows (5,487,600 ) - - - (5,487,600 ) (9,534 ) - - - (9,534 ) $ 215,656,925 $ 74,888,369 $ 36,950,692 $ 22,979,426 $ 350,475,412
December 31, 2015 Non-derivative financial liabilities Short-term loans $ 39,488,957 $ - $ - $ - $ 39,488,957 Accounts payable (including related
parties) 20,462,601 - - - 20,462,601 Payables to contractors and
equipment suppliers 25,346,206 - - - 25,346,206 Accrued expenses and other current
liabilities 16,797,935 - - - 16,797,935 Bonds payable 14,338,760 65,859,591 68,378,787 25,981,316 174,558,454 Other long-term payables (classified
under accrued expenses and other current liabilities) 18,000 - - - 18,000
Guarantee deposits (including those classified under accrued expenses and other current liabilities) 6,167,813 13,330,624 8,223,750 - 27,722,187
122,620,272 79,190,215 76,602,537 25,981,316 304,394,340 Derivative financial instruments Forward exchange contracts
Outflows 15,380,767 - - - 15,380,767 Inflows (15,341,109 ) - - - (15,341,109 ) 39,658 - - - 39,658 $ 122,659,930 $ 79,190,215 $ 76,602,537 $ 25,981,316 $ 304,433,998
(Concluded) f. Fair value of financial instruments
1) Fair value measurements recognized in the parent company only balance sheets Fair value measurements are grouped into Levels 1 to 3 based on the degree to which the fair value is observable:
Level 1 fair value measurements are those derived from quoted prices (unadjusted) in active markets for identical assets or liabilities;
Level 2 fair value measurements are those derived from inputs other than quoted prices included within Level 1 that are observable for the asset or liability, either directly (i.e. as prices) or indirectly (i.e. derived from prices); and
Level 3 fair value measurements are those derived from valuation techniques that include inputs for the asset or liability that are not based on observable market data (unobservable inputs).
- 159 -

- 160 -
2) Fair value of financial instruments that are measured at fair value on a recurring basis
Fair value hierarchy The following table presents the Company’s financial assets and liabilities measured at fair value on a recurring basis: December 31, 2016 Level 1 Level 2 Level 3 Total Financial assets at FVTPL Held for trading
Forward exchange contracts $ - $ 140,094 $ - $ 140,094 Cross currency swap contracts - 10,976 - 10,976 $ - $ 151,070 $ - $ 151,070
Available-for-sale financial assets Publicly traded stocks $ 2,843,952 $ - $ - $ 2,843,952
Financial liabilities at FVTPL Held for trading
Forward exchange contracts $ - $ 62,441 $ - $ 62,441 December 31, 2015 Level 1 Level 2 Level 3 Total Financial assets at FVTPL Held for trading
Forward exchange contracts $ - $ 6,026 $ - $ 6,026 Available-for-sale financial assets Publicly traded stocks $ 706,924 $ - $ - $ 706,924
Financial liabilities at FVTPL Held for trading
Forward exchange contracts $ - $ 45,254 $ - $ 45,254
There were no transfers between Level 1 and Level 2 for the years ended December 31, 2016 and 2015, respectively. There were no purchases and disposals for assets on Level 3 for the years ended December 31, 2016 and 2015, respectively. Valuation techniques and assumptions used in fair value measurement The fair values of financial assets and financial liabilities are determined as follows:
The fair values of financial assets and financial liabilities with standard terms and conditions
and traded on active liquid markets are determined with reference to quoted market prices (includes publicly traded stocks).
Forward exchange contracts and cross currency swap contracts are measured using quoted forward exchange rates and yield curves derived from quoted interest rates matching maturities of the contracts.
- 160 -

- 161 -
3) Fair value of financial instruments that are not measured at fair value Except as detailed in the following table, the Company considers that the carrying amounts of financial instruments that are not measured at fair value recognized in the parent company only financial statements approximate their fair values.
December 31, 2016 December 31, 2015
Carrying
Amount Fair Value Carrying
Amount Fair Value Financial assets Held-to-maturity financial
assets
Commercial paper $ 8,628,176 $ 8,630,769 $ - $ - Corporate bonds/Bank
debentures
2,819,362
2,821,660
7,787,947
7,792,428 Structured product - - 3,000,000 2,995,731
Financial liabilities Measured at amortized cost
Bonds payable 154,200,000 155,930,125 166,200,000 167,709,976 Fair value hierarchy The table below sets out the balances for the Company’s assets and liabilities that are not measured at fair value but for which the fair value is disclosed: December 31, 2016 Level 1 Level 2 Level 3 Total Assets Held-to-maturity securities
Commercial paper $ - $ 8,630,769 $ - $ 8,630,769 Corporate bonds 2,821,660 - - 2,821,660 $ 2,821,660 $ 8,630,769 $ - $ 11,452,429
Liabilities Measured at amortized cost
Bonds payable $ 155,930,125 $ - $ - $ 155,930,125 December 31, 2015 Level 1 Level 2 Level 3 Total Assets Held-to-maturity securities
Corporate bonds/Bank debentures $ 7,792,428 $ - $ - $ 7,792,428 Structured product - 2,995,731 - 2,995,731 $ 7,792,428 $ 2,995,731 $ - $ 10,788,159
Liabilities Measured at amortized cost
Bonds payable $ 167,709,976 $ - $ - $ 167,709,976
Fair value measurement
For investments in bonds, the fair value is determined using active market prices.
- 161 -

- 162 -
For investments in commercial paper and structured product, the fair value is determined using the present value of future cash flows based on the observable yield curves.
The fair value of the Company’s bonds payable is determined using active market prices.
31. RELATED PARTY TRANSACTIONS The significant transactions between the Company and its related parties, other than those disclosed in other notes, are summarized as follows: a. Net revenue
Years Ended December 31 2016 2015 Item Related Party Categories Net revenue from sale of goods Subsidiaries $ 633,923,575 $ 564,722,352 Associates 5,084,397 3,356,734 Joint venture of the Company’s
subsidiaries
-
1,206 $ 639,007,972 $ 568,080,292 Net revenue from royalties Subsidiaries $ 355 $ 457 Associates 516,749 489,420 $ 517,104 $ 489,877
b. Purchases
Years Ended December 31 2016 2015 Related Party Categories Subsidiaries $ 27,788,470 $ 31,090,925 Associates 10,107,719 11,126,415 $ 37,896,189 $ 42,217,340
c. Receivables from related parties
December 31,
2016 December 31,
2015 Item Related Party Categories Receivables from related Subsidiaries $ 85,913,783 $ 56,798,070
parties Associates 931,787 484,612 $ 86,845,570 $ 57,282,682 Other receivables from related Subsidiaries $ 802,179 $ 330,456
parties Associates 146,621 124,871 $ 948,800 $ 455,327
- 162 -

- 163 -
d. Payables to related parties
December 31,
2016 December 31,
2015 Item Related Party Categories Payables to related parties Subsidiaries $ 3,579,248 $ 2,609,731
Associates 1,260,753 1,149,900 $ 4,840,001 $ 3,759,631
e. Acquisition of property, plant and equipment and intangible assets
Acquisition Price Years Ended December 31 2016 2015 Related Party Categories Subsidiaries $ - $ 41,146 Associates - 26,207 $ - $ 67,353
f. Disposal of property, plant and equipment
Proceeds Years Ended December 31 2016 2015 Related Party Categories Subsidiaries $ 10,622 $ 183,838
Gains Years Ended December 31 2016 2015 Related Party Categories Subsidiaries $ 49,108 $ 41,583
Deferred Gains from Disposal of Property, Plant and Equipment
December 31,
2016 December 31,
2015 Related Party Categories Subsidiaries $ 144,689 $ 183,175
- 163 -

- 164 -
g. Others
Years Ended December 31 2016 2015 Item Related Party Categories Manufacturing expenses Subsidiaries $ 15,954 $ 806 Associates 1,376,763 2,321,774 Joint venture of the Company’s
subsidiaries - 12,819
$ 1,392,717 $ 2,335,399 Research and development Subsidiaries $ 2,179,813 $ 2,070,611
expenses Associates 161,671 142,833 Joint venture of the Company’s
subsidiaries - 1,398
$ 2,341,484 $ 2,214,842 Marketing expenses - Subsidiaries $ 873,117 $ 782,254
commission The sales prices and payment terms to related parties were not significantly different from those of sales to third parties. For other related party transactions, price and terms were determined in accordance with mutual agreements. The Company leased machinery and equipment, factory and office from Xintec and VIS. The lease terms and prices were both determined in accordance with mutual agreements. The rental expenses were paid to Xintec and VIS quarterly or monthly; the related expenses were both classified under manufacturing expenses. The Company deferred the disposal gain/loss derived from sales of property, plant and equipment to related parties using equity method, and then recognized such gain/loss over the depreciable lives of the disposed assets.
h. Compensation of key management personnel
The compensation to directors and other key management personnel for the years ended December 31, 2016 and 2015 were as follows: Years Ended December 31 2016 2015 Short-term employee benefits $ 1,926,654 $ 1,798,390 Post-employment benefits 3,617 10,567 $ 1,930,271 $ 1,808,957 The compensation to directors and other key management personnel were determined by the Compensation Committee of the Company in accordance with the individual performance and the market trends.
- 164 -

- 165 -
32. SIGNIFICANT OPERATING LEASE ARRANGEMENTS
The Company leases several parcels of land. These operating leases expire between January 2017 and March 2035 and can be renewed upon expiration. The Company expensed the lease payments as follows: Years Ended December 31 2016 2015 Minimum lease payments $ 815,178 $ 720,494 Future minimum lease payments under the above non-cancellable operating leases are as follows:
December 31,
2016 December 31,
2015 Not later than 1 year $ 777,233 $ 742,592 Later than 1 year and not later than 5 years 2,683,437 2,574,330 Later than 5 years 5,300,624 5,398,730 $ 8,761,294 $ 8,715,652
33. SIGNIFICANT CONTINGENT LIABILITIES AND UNRECOGNIZED COMMITMENTS
Significant contingent liabilities and unrecognized commitments of the Company as of the end of the reporting period, excluding those disclosed in other notes, were as follows: a. Under a technical cooperation agreement with Industrial Technology Research Institute, the R.O.C.
Government or its designee approved by the Company can use up to 35% of the Company’s capacity provided the Company’s outstanding commitments to its customers are not prejudiced. The term of this agreement is for five years beginning from January 1, 1987 and is automatically renewed for successive periods of five years unless otherwise terminated by either party with one year prior notice. As of December 31, 2016, the R.O.C. Government did not invoke such right.
b. Under a Shareholders Agreement entered into with Philips and EDB Investments Pte Ltd. on March 30,
1999, the parties formed a joint venture company, SSMC, which is an integrated circuit foundry in Singapore. The Company’s equity interest in SSMC was 32%. Nevertheless, in September 2006, Philips spun-off its semiconductor subsidiary which was renamed as NXP B.V. Further, the Company and NXP B.V. purchased all the SSMC shares owned by EDB Investments Pte Ltd. pro rata according to the Shareholders Agreement on November 15, 2006. After the purchase, the Company and NXP B.V. currently own approximately 39% and 61% of the SSMC shares, respectively. The Company and NXP B.V. are required, in the aggregate, to purchase at least 70% of SSMC’s capacity, but the Company alone is not required to purchase more than 28% of the capacity. If any party defaults on the commitment and the capacity utilization of SSMC falls below a specific percentage of its capacity, the defaulting party is required to compensate SSMC for all related unavoidable costs. There was no default from the aforementioned commitment as of December 31, 2016.
c. In June 2010, Keranos, LLC. filed a complaint in the U.S. District Court for the Eastern District of
Texas alleging that the Company, TSMC North America, and several other leading technology companies infringe three expired U.S. patents. In response, the Company, TSMC North America, and several co-defendants in the Texas case filed a lawsuit against Keranos in the U.S. District Court for the Northern District of California in November 2010, seeking a judgment declaring that they did not infringe the asserted patents, and that those patents were invalid. These two litigations have been consolidated into a single lawsuit in the U.S. District Court for the Eastern District of Texas. In
- 165 -

- 166 -
February 2014, the Court entered a final judgment in favor of the Company and TSMC North America, dismissing all of Keranos’ claims against the Company and TSMC North America with prejudice. Keranos appealed the final judgment to the U.S. Court of Appeals for the Federal Circuit, and in August 2015, the Federal Circuit remanded the case back to the Texas court for further proceedings. In January 2017, the Texas court dismissed all of Keranos’s claims against the Company and TSMC North America with prejudice, and dismissed the Company’s and TSMC North America’s counterclaims without prejudice. The case is over as to the Company and TSMC North America.
d. In December 2010, Ziptronix, Inc. filed a complaint in the U.S. District Court for the Northern District
of California accusing the Company, TSMC North America and one other company of infringing several U.S. patents. In September 2014, the Court granted summary judgment of noninfringement in favor of the Company and TSMC North America. Ziptronix, Inc. can appeal the Court’s order. In August 2015, Tessera Technologies, Inc. announced it had acquired Ziptronix. In February 2017, the Court dismissed all of Ziptronix’s claims against the Company and TSMC North America with prejudice.
e. The Company joined the Customer Co-Investment Program of ASML and entered into the investment
agreement in August 2012. The agreement includes an investment of EUR837,816 thousand by TSMC Global to acquire 5% of ASML’s equity with a lock-up period of 2.5 years. TSMC Global has acquired the aforementioned equity on October 31, 2012. The lock-up period expired on May 1, 2015 and as of October 8, 2015, all ASML shares had been disposed.
Both parties also signed the research and development funding agreement whereby the Company shall provide EUR276,000 thousand to ASML’s research and development programs from 2013 to 2017. As of December 31, 2016, the Company has paid EUR228,603 thousand to ASML under the research and development funding agreement.
f. In March 2014, DSS Technology Management, Inc. (DSS) filed a complaint in the U.S. District Court
for the Eastern District of Texas alleging that the Company, TSMC North America, TSMC Development and several other companies infringe one U.S. patent. TSMC Development has subsequently been dismissed. In May 2015, the Court entered a final judgment of noninfringement in favor of the Company and TSMC North America. DSS appealed the final judgment to the U.S. Court of Appeals for the Federal Circuit (Federal Circuit). In November 2015, the Patent Trial and Appeal Board (PTAB) determined after concluding an Inter Partes Review (IPR) that the patent claims asserted by DSS in the District Court litigation are unpatentable. DSS appealed the PTAB’s decision to the Federal Circuit in January 2016. In March 2016, the District Court’s judgment of noninfringement was affirmed by the Federal Circuit. In April 2016, the District Court litigation between the parties and the related Federal Circuit appeal were dismissed, and the appeal proceeding of the PTAB’s decision is also over as to the Company.
g. As of December 31, 2016, the Company provided financial guarantees of NT$37,028,850 thousand to
its subsidiary, TSMC Global, in respect of the issuance of unsecured corporate bonds. h. As of December 31, 2016, the Company provided endorsement guarantees of NT$2,679,385 thousand
to its subsidiary, TSMC North America, in respect of providing endorsement guarantees for office leasing contract.
34. SIGNIFICANT LOSS FROM DISASTER
On February 6, 2016, an earthquake struck Taiwan. The resulting damage was mostly to inventories and equipment. The Company recognized related earthquake losses of NT$2,492,138 thousand, net of insurance claim, for the year ended December 31, 2016. Such losses were primarily included in cost of revenue.
- 166 -

- 167 -
35. EXCHANGE RATE INFORMATION OF FOREIGN-CURRENCY FINANCIAL ASSETS AND LIABILITIES The following information was summarized according to the foreign currencies other than the functional currency of the Company. The exchange rates disclosed were used to translate the foreign currencies into the functional currency. The significant financial assets and liabilities denominated in foreign currencies were as follows:
Foreign Currencies
(In Thousands) Exchange Rate
(Note)
Carrying Amount
(In Thousands) December 31, 2016 Financial assets Monetary items
USD $ 4,583,146 32.199 $ 147,572,712 EUR 19,545 34.30 670,405 JPY 36,963,829 0.2775 10,257,463
Non-monetary items HKD 257,056 4.15 1,066,780
Financial liabilities Monetary items
USD 3,981,333 32.199 128,194,952 EUR 183,821 34.30 6,305,052 JPY 60,843,106 0.2775 16,883,962
December 31, 2015 Financial assets Monetary items
USD 3,075,149 32.895 101,157,030 EUR 43,050 36.00 1,549,813 JPY 9,626,627 0.2733 2,630,957
Non-monetary items HKD 166,727 4.24 706,924
Financial liabilities Monetary items
USD 2,925,009 32.895 96,218,162 EUR 43,293 36.00 1,558,534 JPY 25,993,829 0.2733 7,104,113
Note: Exchange rate represents the number of N.T. dollars for which one foreign currency could be
exchanged. The realized and unrealized foreign exchange gain and loss were net gains of NT$609,345 thousand and NT$2,698,396 thousand for the years ended December 31, 2016 and 2015, respectively. Since there were varieties of foreign currency transactions of the Company, the Company was unable to disclose foreign exchange gain (loss) towards each foreign currency with significant impact.
- 167 -

- 168 -
36. ADDITIONAL DISCLOSURES
Following are the additional disclosures required by the Securities and Futures Bureau for the Company: a. Financings provided: Please see Table 1 attached; b. Endorsement/guarantee provided: Please see Table 2 attached; c. Marketable securities held (excluding investments in subsidiaries, associates and joint venture):
Please see Table 3 attached; d. Marketable securities acquired and disposed of at costs or prices of at least NT$300 million or 20% of
the paid-in capital: Please see Table 4 attached; e. Acquisition of individual real estate properties at costs of at least NT$300 million or 20% of the paid-in
capital: Please see Table 5 attached; f. Disposal of individual real estate properties at prices of at least NT$300 million or 20% of the paid-in
capital: None; g. Total purchases from or sales to related parties of at least NT$100 million or 20% of the paid-in capital:
Please see Table 6 attached; h. Receivables from related parties amounting to at least NT$100 million or 20% of the paid-in capital:
Please see Table 7 attached; i. Information about the derivative financial instruments transaction: Please see Note 7; j. Names, locations, and related information of investees over which the Company exercises significant
influence (excluding information on investment in mainland China): Please see Table 8 attached; k. Information on investment in mainland China
1) The name of the investee in mainland China, the main businesses and products, its issued capital, method of investment, information on inflow or outflow of capital, percentage of ownership, income (losses) of the investee, share of profits/losses of investee, ending balance, amount received as dividends from the investee, and the limitation on investee: Please see Table 9 attached.
2) Significant direct or indirect transactions with the investee, its prices and terms of payment,
unrealized gain or loss, and other related information which is helpful to understand the impact of investment in mainland China on financial reports: Please see Note 31.
37. OPERATING SEGMENTS INFORMATION
The Company has provided the operating segments disclosure in the consolidated financial statements.
- 168 -
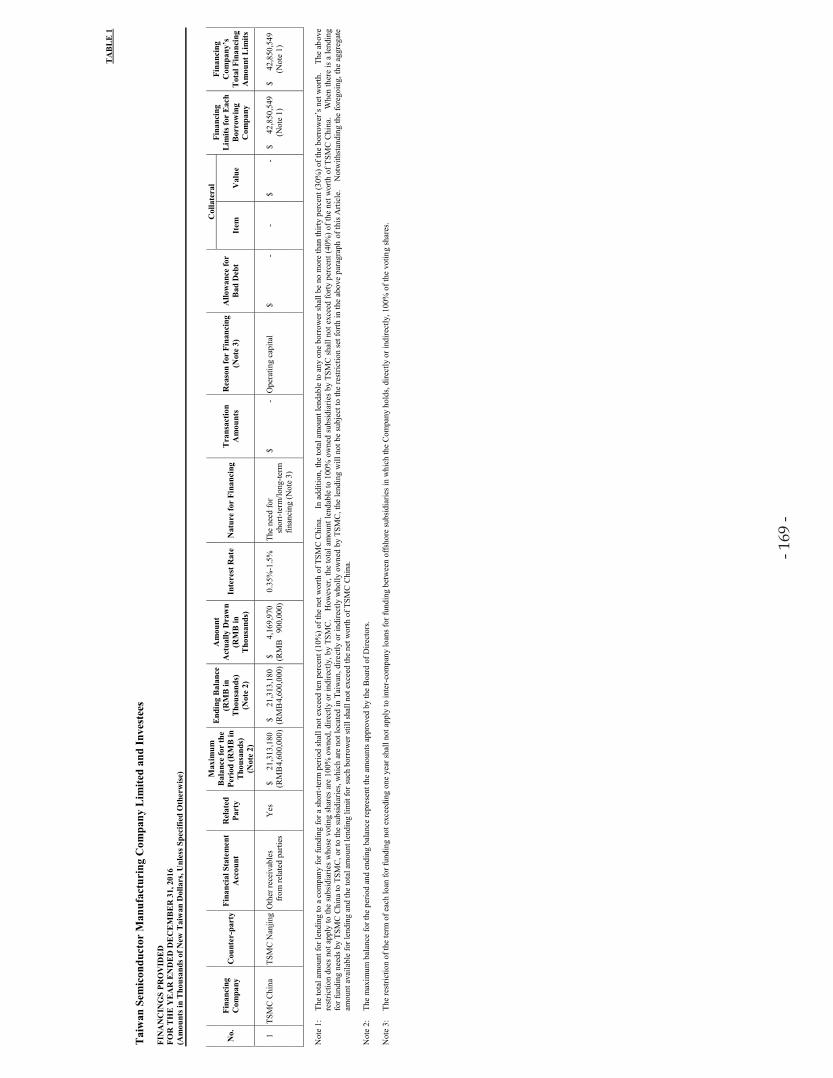
- 169
-
TA
BL
E 1
T
aiw
an S
emic
ondu
ctor
Man
ufac
turi
ng C
ompa
ny L
imite
d an
d In
vest
ees
FIN
AN
CIN
GS
PRO
VID
ED
FO
R T
HE
YE
AR
EN
DE
D D
EC
EM
BE
R 3
1, 2
016
(Am
ount
s in
Tho
usan
ds o
f New
Tai
wan
Dol
lars
, Unl
ess S
peci
fied
Oth
erw
ise)
N
o.
Fina
ncin
g C
ompa
ny
Cou
nter
-par
ty
Fina
ncia
l Sta
tem
ent
Acc
ount
R
elat
ed
Part
y
Max
imum
B
alan
ce fo
r th
e Pe
riod
(RM
B in
T
hous
ands
) (N
ote
2)
End
ing
Bal
ance
(R
MB
in
Tho
usan
ds)
(Not
e 2)
Am
ount
A
ctua
lly D
raw
n (R
MB
in
Tho
usan
ds)
Inte
rest
Rat
e N
atur
e fo
r Fi
nanc
ing
Tra
nsac
tion
Am
ount
s R
easo
n fo
r Fi
nanc
ing
(Not
e 3)
A
llow
ance
for
Bad
Deb
t
Col
late
ral
Fina
ncin
g L
imits
for
Eac
h B
orro
win
g C
ompa
ny
Fina
ncin
g C
ompa
ny’s
T
otal
Fin
anci
ng
Am
ount
Lim
its
Item
V
alue
1
TSM
C C
hina
TS
MC
Nan
jing
O
ther
rece
ivab
les
from
rela
ted
parti
es
Yes
$
21
,313
,180
(R
MB
4,60
0,00
0) $
21
,313
,180
(R
MB
4,60
0,00
0) $
4,
169,
970
(RM
B
900,
000)
0.
35%
-1.5
%
The
need
for
shor
t-ter
m/lo
ng-te
rm
finan
cing
(Not
e 3)
$
- O
pera
ting
capi
tal
$
- -
$
- $
42
,850
,549
(N
ote
1)
$
42,8
50,5
49
(Not
e 1)
N
ote
1:
The
tota
l am
ount
for l
endi
ng to
a c
ompa
ny fo
r fun
ding
for a
shor
t-ter
m p
erio
d sh
all n
ot e
xcee
d te
n pe
rcen
t (10
%) o
f the
net
wor
th o
f TSM
C C
hina
. I
n ad
ditio
n, th
e to
tal a
mou
nt le
ndab
le to
any
one
bor
row
er sh
all b
e no
mor
e th
an th
irty
perc
ent (
30%
) of t
he b
orro
wer
’s n
et w
orth
. T
he a
bove
re
stric
tion
does
not
app
ly to
the
subs
idia
ries
who
se v
otin
g sh
ares
are
100
% o
wne
d, d
irect
ly o
r ind
irect
ly, b
y TS
MC
. H
owev
er, t
he to
tal a
mou
nt le
ndab
le to
100
% o
wne
d su
bsid
iarie
s by
TSM
C s
hall
not e
xcee
d fo
rty p
erce
nt (4
0%) o
f the
net
wor
th o
f TSM
C C
hina
. W
hen
ther
e is
a le
ndin
g fo
r fun
ding
nee
ds b
y TS
MC
Chi
na to
TSM
C, o
r to
the
subs
idia
ries,
whi
ch a
re n
ot lo
cate
d in
Tai
wan
, dire
ctly
or i
ndire
ctly
who
lly o
wne
d by
TSM
C, t
he le
ndin
g w
ill n
ot b
e su
bjec
t to
the
rest
rictio
n se
t for
th in
the
abov
e pa
ragr
aph
of th
is A
rticl
e.
Not
with
stan
ding
the
fore
goin
g, th
e ag
greg
ate
amou
nt a
vaila
ble
for l
endi
ng a
nd th
e to
tal a
mou
nt le
ndin
g lim
it fo
r suc
h bo
rrow
er st
ill sh
all n
ot e
xcee
d th
e ne
t wor
th o
f TSM
C C
hina
. N
ote
2:
The
max
imum
bal
ance
for t
he p
erio
d an
d en
ding
bal
ance
repr
esen
t the
am
ount
s app
rove
d by
the
Boa
rd o
f Dire
ctor
s.
Not
e 3:
Th
e re
stric
tion
of th
e te
rm o
f eac
h lo
an fo
r fun
ding
not
exc
eedi
ng o
ne y
ear s
hall
not a
pply
to in
ter-
com
pany
loan
s for
fund
ing
betw
een
offs
hore
subs
idia
ries i
n w
hich
the
Com
pany
hol
ds, d
irect
ly o
r ind
irect
ly, 1
00%
of t
he v
otin
g sh
ares
.
- 169
-

- 170
-
TA
BL
E 2
T
aiw
an S
emic
ondu
ctor
Man
ufac
turi
ng C
ompa
ny L
imite
d an
d In
vest
ees
EN
DO
RSE
ME
NT
S/G
UA
RA
NT
EE
S PR
OV
IDE
D
FOR
TH
E Y
EA
R E
ND
ED
DE
CE
MB
ER
31,
201
6 (A
mou
nts i
n T
hous
ands
of N
ew T
aiw
an D
olla
rs, U
nles
s Spe
cifie
d O
ther
wis
e)
No.
E
ndor
sem
ent/
Gua
rant
ee P
rovi
der
Gua
rant
eed
Part
y L
imits
on
End
orse
men
t/ G
uara
ntee
A
mou
nt
Prov
ided
to E
ach
Gua
rant
eed
Part
y (N
otes
1 a
nd 2
)
Max
imum
B
alan
ce
for
the
Peri
od
(US$
in
Tho
usan
ds)
(Not
e 3)
End
ing
Bal
ance
(U
S$ in
T
hous
ands
) (N
ote
3)
Am
ount
Act
ually
D
raw
n (U
S$ in
T
hous
ands
)
Am
ount
of
End
orse
men
t/ G
uara
ntee
C
olla
tera
lized
by
Prop
ertie
s
Rat
io o
f A
ccum
ulat
ed
End
orse
men
t/ G
uara
ntee
to N
et
Equ
ity p
er
Lat
est F
inan
cial
St
atem
ents
Max
imum
E
ndor
sem
ent/
Gua
rant
ee
Am
ount
A
llow
able
(N
ote
2)
Gua
rant
ee
Prov
ided
by
Pare
nt
Com
pany
Gua
rant
ee
Prov
ided
by
A S
ubsi
diar
y
Gua
rant
ee
Prov
ided
to
Subs
idia
ries
in
Mai
nlan
d C
hina
Nam
e N
atur
e of
R
elat
ions
hip
0 TS
MC
TS
MC
Glo
bal
Subs
idia
ry
$
347,
312,
065
$
48,2
98,5
00
( U
S$ 1
,500
,000
)
$ 37
,028
,850
(
US$
1,1
50,0
00 )
$
37,0
28,8
50
( U
S$ 1
,150
,000
) $
-
2.67
%
$
347,
312,
065
Yes
N
o N
o
TSM
C N
orth
A
mer
ica
Subs
idia
ry
34
7,31
2,06
5
2,
679,
385
( U
S$
83,2
13 )
2,67
9,38
5 (
US$
83
,213
)
2,
679,
385
( U
S$
83,2
13 )
-
0.19
%
347,
312,
065
Yes
N
o N
o
Not
e 1:
Th
e to
tal a
mou
nt o
f th
e gu
aran
tee
prov
ided
by
TSM
C to
any
indi
vidu
al e
ntity
sha
ll no
t exc
eed
ten
perc
ent (
10%
) of
TSM
C’s
net
wor
th, o
r th
e ne
t wor
th o
f suc
h en
tity.
H
owev
er, s
ubsi
diar
ies
who
se v
otin
g sh
ares
are
100
% o
wne
d,
dire
ctly
or i
ndire
ctly
, by
TSM
C a
re n
ot su
bjec
t to
the
abov
e re
stric
tions
afte
r the
app
rova
l of t
he B
oard
of D
irect
ors.
N
ote
2:
The
tota
l am
ount
of g
uara
ntee
shal
l not
exc
eed
twen
ty-fi
ve p
erce
nt (2
5%) o
f TSM
C’s
net
wor
th.
Not
e 3:
Th
e m
axim
um b
alan
ce fo
r the
per
iod
and
endi
ng b
alan
ce re
pres
ent t
he a
mou
nts a
ppro
ved
by th
e B
oard
of D
irect
ors.
- 170
-
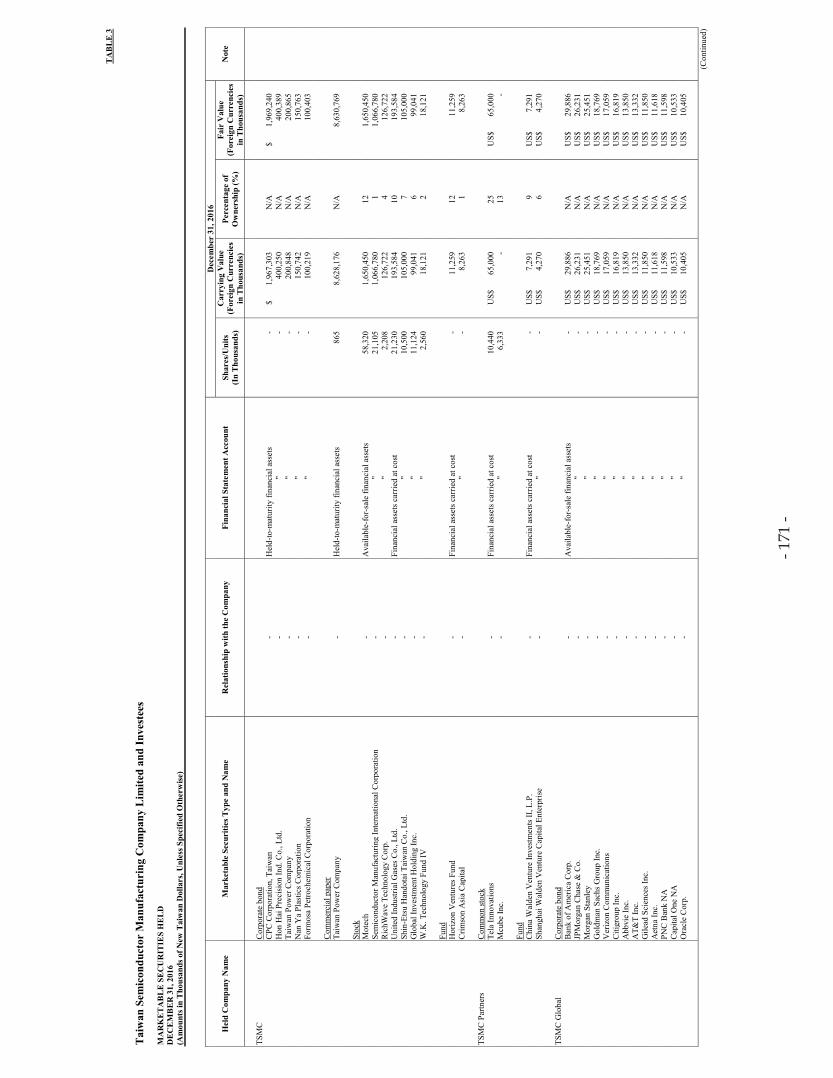
- 171
-
TA
BL
E 3
T
aiw
an S
emic
ondu
ctor
Man
ufac
turi
ng C
ompa
ny L
imite
d an
d In
vest
ees
MA
RK
ET
AB
LE
SE
CU
RIT
IES
HE
LD
D
EC
EM
BE
R 3
1, 2
016
(Am
ount
s in
Tho
usan
ds o
f New
Tai
wan
Dol
lars
, Unl
ess S
peci
fied
Oth
erw
ise)
Hel
d C
ompa
ny N
ame
Mar
keta
ble
Secu
ritie
s Typ
e an
d N
ame
Rel
atio
nshi
p w
ith th
e C
ompa
ny
Fina
ncia
l Sta
tem
ent A
ccou
nt
Dec
embe
r 31
, 201
6
Not
e Sh
ares
/Uni
ts
(In
Tho
usan
ds)
Car
ryin
g V
alue
(F
orei
gn C
urre
ncie
s in
Tho
usan
ds)
Perc
enta
ge o
f O
wne
rshi
p (%
)
Fair
Val
ue
(For
eign
Cur
renc
ies
in T
hous
ands
)
TSM
C
Cor
pora
te b
ond
CPC
Cor
pora
tion,
Tai
wan
-
Hel
d-to
-mat
urity
fina
ncia
l ass
ets
-
$
1,96
7,30
3 N
/A
$
1,
969,
240
Hon
Hai
Pre
cisi
on In
d. C
o., L
td.
- "
-
40
0,25
0 N
/A
400,
389
Taiw
an P
ower
Com
pany
-
"
-
200,
848
N/A
20
0,86
5
N
an Y
a Pl
astic
s Cor
pora
tion
- "
-
15
0,74
2 N
/A
150,
763
Form
osa
Petro
chem
ical
Cor
pora
tion
- "
-
10
0,21
9 N
/A
100,
403
C
omm
erci
al p
aper
Ta
iwan
Pow
er C
ompa
ny
- H
eld-
to-m
atur
ity fi
nanc
ial a
sset
s
86
5
8,
628,
176
N/A
8,
630,
769
St
ock
Mot
ech
- A
vaila
ble-
for-
sale
fina
ncia
l ass
ets
58,3
20
1,65
0,45
0 12
1,
650,
450
Sem
icon
duct
or M
anuf
actu
ring
Inte
rnat
iona
l Cor
pora
tion
- "
21,1
05
1,06
6,78
0 1
1,06
6,78
0
R
ichW
ave
Tech
nolo
gy C
orp.
-
"
2,
208
126,
722
4
12
6,72
2
U
nite
d In
dust
rial G
ases
Co.
, Ltd
. -
Fina
ncia
l ass
ets c
arrie
d at
cos
t
21
,230
19
3,58
4 10
19
3,58
4
Sh
in-E
tsu
Han
dota
i Tai
wan
Co.
, Ltd
. -
"
10
,500
10
5,00
0 7
105,
000
Glo
bal I
nves
tmen
t Hol
ding
Inc.
-
"
11
,124
99
,041
6
99,0
41
W.K
. Tec
hnol
ogy
Fund
IV
- "
2,56
0
18
,121
2
18,1
21
Fu
nd
Hor
izon
Ven
ture
s Fun
d -
Fina
ncia
l ass
ets c
arrie
d at
cos
t
-
11,2
59
12
11,2
59
Crim
son
Asi
a C
apita
l -
"
-
8,26
3 1
8,26
3
TS
MC
Par
tner
s C
omm
on st
ock
Tela
Inno
vatio
ns
- Fi
nanc
ial a
sset
s car
ried
at c
ost
10,4
40
U
S$
65,0
00
25
U
S$
65,0
00
Mcu
be In
c.
- "
6,33
3
-
13
-
Fund
C
hina
Wal
den
Ven
ture
Inve
stm
ents
II, L
.P.
- Fi
nanc
ial a
sset
s car
ried
at c
ost
-
US$
7,
291
9
US$
7,
291
Shan
ghai
Wal
den
Ven
ture
Cap
ital E
nter
pris
e -
"
-
U
S$
4,27
0 6
U
S$
4,27
0
TS
MC
Glo
bal
Cor
pora
te b
ond
Ban
k of
Am
eric
a C
orp.
-
Ava
ilabl
e-fo
r-sa
le fi
nanc
ial a
sset
s
-
U
S$
29,8
86
N/A
US$
29
,886
JP
Mor
gan
Cha
se &
Co.
-
"
-
U
S$
26,2
31
N/A
US$
26
,231
M
orga
n St
anle
y -
"
-
U
S$
25,4
51
N/A
US$
25
,451
G
oldm
an S
achs
Gro
up In
c.
- "
-
US$
18
,769
N
/A
U
S$
18,7
69
Ver
izon
Com
mun
icat
ions
-
"
-
U
S$
17,0
59
N/A
US$
17
,059
C
itigr
oup
Inc.
-
"
-
U
S$
16,8
19
N/A
US$
16
,819
A
bbvi
e In
c.
- "
-
US$
13
,850
N
/A
U
S$
13,8
50
AT&
T In
c.
- "
-
US$
13
,332
N
/A
U
S$
13,3
32
Gile
ad S
cien
ces I
nc.
- "
-
US$
11
,850
N
/A
U
S$
11,8
50
Aet
na In
c.
- "
-
US$
11
,618
N
/A
U
S$
11,6
18
PNC
Ban
k N
A
- "
-
US$
11
,598
N
/A
U
S$
11,5
98
Cap
ital O
ne N
A
- "
-
US$
10
,533
N
/A
U
S$
10,5
33
Ora
cle
Cor
p.
- "
-
US$
10
,405
N
/A
U
S$
10,4
05
(Con
tinue
d)
- 171
-

- 172
-
Hel
d C
ompa
ny N
ame
Mar
keta
ble
Secu
ritie
s Typ
e an
d N
ame
Rel
atio
nshi
p w
ith th
e C
ompa
ny
Fina
ncia
l Sta
tem
ent A
ccou
nt
Dec
embe
r 31
, 201
6
Not
e Sh
ares
/Uni
ts
(In
Tho
usan
ds)
Car
ryin
g V
alue
(F
orei
gn C
urre
ncie
s in
Tho
usan
ds)
Perc
enta
ge o
f O
wne
rshi
p (%
)
Fair
Val
ue
(For
eign
Cur
renc
ies
in T
hous
ands
)
TSM
C G
loba
l Sv
ensk
a H
ande
lsba
nken
AB
-
Ava
ilabl
e-fo
r-sa
le fi
nanc
ial a
sset
s
-
U
S$
9,83
7 N
/A
U
S$
9,83
7
C
VS
Hea
lth C
orp.
-
"
-
U
S$
9,73
6 N
/A
U
S$
9,73
6
W
estp
ac B
anki
ng C
orp.
-
"
-
U
S$
8,90
5 N
/A
U
S$
8,90
5
A
nheu
ser B
usch
InB
ev F
in.
- "
-
US$
8,
737
N/A
US$
8,
737
Ford
Mot
or C
redi
t Co
LLC
-
"
-
U
S$
8,68
1 N
/A
U
S$
8,68
1
A
nalo
g D
evic
es, I
nc.
- "
-
US$
8,
619
N/A
US$
8,
619
Teva
Pha
rmac
eutic
als N
ethe
rland
s -
"
-
U
S$
8,46
7 N
/A
U
S$
8,46
7
A
mer
ican
Intl.
Gro
up
- "
-
US$
7,
944
N/A
US$
7,
944
Cre
dit S
uiss
e N
ew Y
ork
- "
-
US$
7,
267
N/A
US$
7,
267
BB
&T
Cor
pora
tion
- "
-
US$
7,
189
N/A
US$
7,
189
BM
W U
S C
apita
l LLC
-
"
-
U
S$
7,18
0 N
/A
U
S$
7,18
0
Pr
icoa
Glo
bal F
undi
ng I
- "
-
US$
7,
140
N/A
US$
7,
140
Dai
mle
r Fin
ance
NA
LLC
. -
"
-
U
S$
7,10
1 N
/A
U
S$
7,10
1
B
ank
of N
y M
ello
n C
orp.
-
"
-
U
S$
7,00
6 N
/A
U
S$
7,00
6
B
P C
apita
l Mar
kets
PLC
-
"
-
U
S$
6,65
8 N
/A
U
S$
6,65
8
ER
AC
USA
Fin
ance
LLC
-
"
-
U
S$
6,62
3 N
/A
U
S$
6,62
3
D
uke
Ener
gy C
orp.
-
"
-
U
S$
6,53
5 N
/A
U
S$
6,53
5
So
uthe
rn C
o.
- "
-
US$
6,
510
N/A
US$
6,
510
Ven
tas R
ealty
LP/
Cap
Crp
. -
"
-
U
S$
6,42
9 N
/A
U
S$
6,42
9
C
itize
ns B
ank
NA
/RI
- "
-
US$
6,
331
N/A
US$
6,
331
Sunt
rust
Ban
ks In
c.
- "
-
US$
6,
203
N/A
US$
6,
203
Wel
ltow
er In
c.
- "
-
US$
6,
145
N/A
US$
6,
145
Wel
ls F
argo
& C
ompa
ny
- "
-
US$
6,
127
N/A
US$
6,
127
Am
eric
an E
xpre
ss C
redi
t -
"
-
U
S$
6,04
5 N
/A
U
S$
6,04
5
B
erks
hire
Hat
haw
ay F
in.
- "
-
US$
6,
017
N/A
US$
6,
017
Skan
dina
visk
a En
skild
a B
anke
n A
B
- "
-
US$
6,
001
N/A
US$
6,
001
Sysc
o C
orpo
ratio
n -
"
-
U
S$
5,97
8 N
/A
U
S$
5,97
8
Ex
pres
s Scr
ipts
Hol
ding
-
"
-
U
S$
5,89
9 N
/A
U
S$
5,89
9
To
ront
o D
omin
ion
Ban
k -
"
-
U
S$
5,80
6 N
/A
U
S$
5,80
6
G
roup
e D
anon
e S.
A.
- "
-
US$
5,
763
N/A
US$
5,
763
Shel
l Int
erna
tiona
l Fin
. -
"
-
U
S$
5,71
3 N
/A
U
S$
5,71
3
To
yota
Mot
or C
redi
t Cor
p.
- "
-
US$
5,
633
N/A
US$
5,
633
TIA
A A
sset
Man
agem
ent F
inan
ce L
LC
- "
-
US$
5,
617
N/A
US$
5,
617
AB
N A
MR
O B
ank
N.V
. -
"
-
U
S$
5,57
2 N
/A
U
S$
5,57
2
Pr
otec
tive
Life
Glo
bal F
undi
ng
- "
-
US$
5,
552
N/A
US$
5,
552
Key
Ban
k N
.A.
- "
-
US$
5,
532
N/A
US$
5,
532
Mits
ubis
hi U
FJ F
in G
rp.
- "
-
US$
5,
524
N/A
US$
5,
524
Cis
co S
yste
ms I
nc.
- "
-
US$
5,
511
N/A
US$
5,
511
Hyu
ndai
Cap
ital A
mer
ica
- "
-
US$
5,
471
N/A
US$
5,
471
New
Yor
k Li
fe G
loba
l FD
G
- "
-
US$
5,
445
N/A
US$
5,
445
Siem
ens F
inan
cier
ings
mat
-
"
-
U
S$
5,35
7 N
/A
U
S$
5,35
7
Fi
fth T
hird
Ban
k -
"
-
U
S$
5,34
1 N
/A
U
S$
5,34
1
A
viat
ion
Cap
ital G
roup
-
"
-
U
S$
5,14
4 N
/A
U
S$
5,14
4
Se
mpr
a En
ergy
-
"
-
U
S$
5,14
4 N
/A
U
S$
5,14
4
In
tl. B
ank
Rec
on. &
Dev
elop
men
t -
"
-
U
S$
5,13
7 N
/A
U
S$
5,13
7
H
SBC
Hol
ding
s PLC
-
"
-
U
S$
5,12
4 N
/A
U
S$
5,12
4
U
BS
AG
Sta
mfo
rd C
T -
"
-
U
S$
5,01
7 N
/A
U
S$
5,01
7
Su
mito
mo
Mits
ui T
rust
Ban
k, L
imite
d -
"
-
U
S$
5,00
8 N
/A
U
S$
5,00
8
M
acqu
arie
Gro
up L
td.
- "
-
US$
4,
984
N/A
US$
4,
984
Rel
ianc
e St
and
Life
II
- "
-
US$
4,
925
N/A
US$
4,
925
(Con
tinue
d)
- 172
-

- 173
-
Hel
d C
ompa
ny N
ame
Mar
keta
ble
Secu
ritie
s Typ
e an
d N
ame
Rel
atio
nshi
p w
ith th
e C
ompa
ny
Fina
ncia
l Sta
tem
ent A
ccou
nt
Dec
embe
r 31
, 201
6
Not
e Sh
ares
/Uni
ts
(In
Tho
usan
ds)
Car
ryin
g V
alue
(F
orei
gn C
urre
ncie
s in
Tho
usan
ds)
Perc
enta
ge o
f O
wne
rshi
p (%
)
Fair
Val
ue
(For
eign
Cur
renc
ies
in T
hous
ands
)
TSM
C G
loba
l D
omin
ion
Res
ourc
es In
c.
- A
vaila
ble-
for-
sale
fina
ncia
l ass
ets
-
US$
4,
907
N/A
US$
4,
907
Wal
gree
ns B
oots
Alli
ance
-
"
-
U
S$
4,90
5 N
/A
U
S$
4,90
5
Sw
edba
nk A
B
- "
-
US$
4,
839
N/A
US$
4,
839
Air
Liqu
ide
Fina
nce
- "
-
US$
4,
696
N/A
US$
4,
696
ING
Ban
k N
.V.
- "
-
US$
4,
692
N/A
US$
4,
692
Jack
son
Nat
l Life
Glo
bal
- "
-
US$
4,
570
N/A
US$
4,
570
Mon
dele
z In
tern
atio
nal
- "
-
US$
4,
527
N/A
US$
4,
527
Miz
uho
Fina
ncia
l Gro
up
- "
-
US$
4,
436
N/A
US$
4,
436
Enel
Fin
ance
Intl
N.V
. -
"
-
U
S$
4,40
2 N
/A
U
S$
4,40
2
C
A, I
nc.
- "
-
US$
4,
353
N/A
US$
4,
353
Deu
tsch
e Te
leko
m In
tern
atio
nal F
in.
- "
-
US$
4,
340
N/A
US$
4,
340
Oak
tree
Cap
ital M
anag
emen
t, L.
P.
- "
-
US$
4,
316
N/A
US$
4,
316
Twen
ty-F
irst C
entu
ry F
ox In
c.
- "
-
US$
4,
271
N/A
US$
4,
271
Lloy
ds B
ank
PLC
-
"
-
U
S$
4,22
0 N
/A
U
S$
4,22
0
Sc
hlum
berg
er H
ldgs
Cor
p.
- "
-
US$
4,
150
N/A
US$
4,
150
Nex
tera
Ene
rgy
Cap
ital
- "
-
US$
4,
067
N/A
US$
4,
067
Key
corp
Pty
Ltd
. -
"
-
U
S$
4,04
3 N
/A
U
S$
4,04
3
A
mer
en C
orp.
-
"
-
U
S$
4,01
7 N
/A
U
S$
4,01
7
Pe
psic
o In
c.
- "
-
US$
4,
004
N/A
US$
4,
004
Stat
e St
reet
Cor
p.
- "
-
US$
3,
995
N/A
US$
3,
995
Uni
ted
Tech
nolo
gies
Cor
pora
tion
- "
-
US$
3,
968
N/A
US$
3,
968
Forti
ve C
orpo
ratio
n -
"
-
U
S$
3,94
1 N
/A
U
S$
3,94
1
W
ells
Far
go B
ank
NA
-
"
-
U
S$
3,88
0 N
/A
U
S$
3,88
0
A
utoz
one
Inc.
-
"
-
U
S$
3,80
3 N
/A
U
S$
3,80
3
H
usky
Ene
rgy
Inc.
-
"
-
U
S$
3,77
5 N
/A
U
S$
3,77
5
Su
mito
mo
Mits
ui F
inan
cial
Gro
up
- "
-
US$
3,
772
N/A
US$
3,
772
Fifth
Thi
rd B
anco
rp
- "
-
US$
3,
771
N/A
US$
3,
771
Ryd
er S
yste
m In
c.
- "
-
US$
3,
730
N/A
US$
3,
730
Anh
euse
r Bus
ch In
Bev
Wor
ldw
ide
Inc.
-
"
-
U
S$
3,65
9 N
/A
U
S$
3,65
9
U
S B
ank
NA
Cin
cinn
ati
- "
-
US$
3,
568
N/A
US$
3,
568
UB
S G
roup
Fun
ding
-
"
-
U
S$
3,54
7 N
/A
U
S$
3,54
7
B
AT
Intl
Fina
nce
PLC
-
"
-
U
S$
3,49
7 N
/A
U
S$
3,49
7
C
redi
t Agr
icol
e Lo
ndon
-
"
-
U
S$
3,33
1 N
/A
U
S$
3,33
1
La
m R
esea
rch
Cor
p.
- "
-
US$
3,
218
N/A
US$
3,
218
Tim
e W
arne
r Inc
. -
"
-
U
S$
3,02
2 N
/A
U
S$
3,02
2
C
anad
ian
Impe
rial B
ank
- "
-
US$
3,
002
N/A
US$
3,
002
BN
P Pa
ribas
New
Yor
k B
ranc
h -
"
-
U
S$
3,00
0 N
/A
U
S$
3,00
0
Su
ncor
p M
etw
ay L
td.
- "
-
US$
2,
983
N/A
US$
2,
983
Cor
poer
ativ
e C
entra
le
- "
-
US$
2,
974
N/A
US$
2,
974
Mic
roso
ft C
orp.
-
"
-
U
S$
2,90
5 N
/A
U
S$
2,90
5
H
SBC
USA
Inc.
-
"
-
U
S$
2,86
9 N
/A
U
S$
2,86
9
R
abob
ank
Ned
erla
nd N
Y
- "
-
US$
2,
855
N/A
US$
2,
855
Prin
cipa
l Life
Glo
bal F
undi
ng II
-
"
-
U
S$
2,78
2 N
/A
U
S$
2,78
2
K
fW
- "
-
US$
2,
748
N/A
US$
2,
748
Partn
erR
e Fi
nanc
e B
LLC
-
"
-
U
S$
2,70
9 N
/A
U
S$
2,70
9
Sp
rint S
pect
rum
L.P
. -
"
-
U
S$
2,70
5 N
/A
U
S$
2,70
5
A
pple
Inc.
-
"
-
U
S$
2,60
7 N
/A
U
S$
2,60
7
Ex
elon
Gen
erat
ion
Co.
LLC
-
"
-
U
S$
2,58
4 N
/A
U
S$
2,58
4
M
etLi
fe G
loba
l Fun
ding
I -
"
-
U
S$
2,52
4 N
/A
U
S$
2,52
4
U
nite
dhea
lth G
roup
Inc.
-
"
-
U
S$
2,50
0 N
/A
U
S$
2,50
0
(C
ontin
ued)
- 173
-

- 174
-
Hel
d C
ompa
ny N
ame
Mar
keta
ble
Secu
ritie
s Typ
e an
d N
ame
Rel
atio
nshi
p w
ith th
e C
ompa
ny
Fina
ncia
l Sta
tem
ent A
ccou
nt
Dec
embe
r 31
, 201
6
Not
e Sh
ares
/Uni
ts
(In
Tho
usan
ds)
Car
ryin
g V
alue
(F
orei
gn C
urre
ncie
s in
Tho
usan
ds)
Perc
enta
ge o
f O
wne
rshi
p (%
)
Fair
Val
ue
(For
eign
Cur
renc
ies
in T
hous
ands
)
TSM
C G
loba
l To
ront
o D
omin
Hol
ding
-
Ava
ilabl
e-fo
r-sa
le fi
nanc
ial a
sset
s
-
U
S$
2,47
8 N
/A
U
S$
2,47
8
N
orde
a B
ank
AB
-
"
-
U
S$
2,45
7 N
/A
U
S$
2,45
7
C
omm
onw
ealth
Ban
k A
ustra
lia N
Y
- "
-
US$
2,
404
N/A
US$
2,
404
Mar
riott
Inte
rnat
iona
l, In
c.
- "
-
US$
2,
399
N/A
US$
2,
399
Dow
Che
mic
al C
o/Th
e -
"
-
U
S$
2,35
7 N
/A
U
S$
2,35
7
M
ckes
son
Cor
p.
- "
-
US$
2,
253
N/A
US$
2,
253
Publ
ic S
ervi
ce C
olor
ado
- "
-
US$
2,
166
N/A
US$
2,
166
Alli
ed W
orld
Ass
uran
ce
- "
-
US$
2,
155
N/A
US$
2,
155
Cel
gene
Cor
p.
- "
-
US$
2,
115
N/A
US$
2,
115
Stan
corp
Fin
anci
al G
roup
-
"
-
U
S$
2,09
7 N
/A
U
S$
2,09
7
Jo
hnso
n Co
ntro
ls In
tern
atio
nal P
LC
- "
-
US$
2,
052
N/A
US$
2,
052
The
Bea
r Ste
arns
Com
pani
es L
LC.
- "
-
US$
2,
011
N/A
US$
2,
011
Brit
ish
Tele
com
mun
icat
ions
PLC
-
"
-
U
S$
2,01
1 N
/A
U
S$
2,01
1
Er
ste
Ban
k de
r oes
terr
eich
isch
en S
park
asse
n A
G
- "
-
US$
2,
000
N/A
US$
2,
000
Nor
inch
ukin
Ban
k -
"
-
U
S$
2,00
0 N
/A
U
S$
2,00
0
N
ordi
c In
vest
men
t Ban
k -
"
-
U
S$
1,99
6 N
/A
U
S$
1,99
6
FM
S W
ertm
anag
emen
t -
"
-
U
S$
1,99
5 N
/A
U
S$
1,99
5
A
sian
Dev
elop
men
t Ban
k -
"
-
U
S$
1,99
4 N
/A
U
S$
1,99
4
K
ells
Fun
ding
LLC
-
"
-
U
S$
1,99
3 N
/A
U
S$
1,99
3
M
agel
lan
Mid
stre
am P
artn
ers L
P -
"
-
U
S$
1,97
1 N
/A
U
S$
1,97
1
St
ryke
r Cor
p.
- "
-
US$
1,
951
N/A
US$
1,
951
Nat
iona
l Aus
tralia
Ban
k/N
Y
- "
-
US$
1,
944
N/A
US$
1,
944
Hun
tingt
on N
atio
nal B
ank
- "
-
US$
1,
911
N/A
US$
1,
911
BPC
E SA
-
"
-
U
S$
1,91
0 N
/A
U
S$
1,91
0
Su
mito
mo
Mits
ui B
anki
ng
- "
-
US$
1,
898
N/A
US$
1,
898
Roy
al B
ank
of C
anad
a -
"
-
U
S$
1,89
3 N
/A
U
S$
1,89
3
O
ncor
Ele
ctric
Del
iver
y -
"
-
U
S$
1,85
3 N
/A
U
S$
1,85
3
W
estR
ock
RK
T C
ompa
ny
- "
-
US$
1,
843
N/A
US$
1,
843
Ora
nge
S.A
. -
"
-
U
S$
1,82
4 N
/A
U
S$
1,82
4
R
egen
cy C
ente
rs, L
.P.
- "
-
US$
1,
817
N/A
US$
1,
817
Lyon
dellB
asel
l Ind
ustri
es N
.V.
- "
-
US$
1,
796
N/A
US$
1,
796
Aus
t. &
NZ
Ban
king
Grp
. NY
-
"
-
U
S$
1,79
4 N
/A
U
S$
1,79
4
So
uthe
rn P
ower
Com
pany
-
"
-
U
S$
1,78
5 N
/A
U
S$
1,78
5
D
omin
ion
Gas
Hol
ding
s, LL
C
- "
-
US$
1,
764
N/A
US$
1,
764
Car
dina
l Hea
lth In
c.
- "
-
US$
1,
754
N/A
US$
1,
754
Kim
co R
ealty
Cor
p.
- "
-
US$
1,
739
N/A
US$
1,
739
Am
gen
Inc.
-
"
-
U
S$
1,70
6 N
/A
U
S$
1,70
6
Ty
son
Food
s, In
c.
- "
-
US$
1,
704
N/A
US$
1,
704
Ente
rpris
e Pr
oduc
ts O
pera
ting,
LLC
-
"
-
U
S$
1,69
7 N
/A
U
S$
1,69
7
D
euts
che
Ban
k A
G, L
ondo
n -
"
-
U
S$
1,64
4 N
/A
U
S$
1,64
4
Pa
cific
Gas
& E
lect
ric
- "
-
US$
1,
633
N/A
US$
1,
633
Tran
s Can
ada
Pipe
lines
-
"
-
U
S$
1,56
6 N
/A
U
S$
1,56
6
A
frica
n D
evel
opm
ent B
ank
- "
-
US$
1,
562
N/A
US$
1,
562
Cap
ital O
ne B
ank
(USA
), N
A
- "
-
US$
1,
553
N/A
US$
1,
553
Bra
nch
Ban
king
& T
rust
-
"
-
U
S$
1,53
2 N
/A
U
S$
1,53
2
Si
mon
Pro
perty
Gro
up L
P -
"
-
U
S$
1,50
7 N
/A
U
S$
1,50
7
H
allib
urto
n Co
. -
"
-
U
S$
1,50
5 N
/A
U
S$
1,50
5
Pf
izer
Inc.
-
"
-
U
S$
1,49
1 N
/A
U
S$
1,49
1
St
anda
rd C
harte
red
PLC
-
"
-
U
S$
1,48
7 N
/A
U
S$
1,48
7
Su
ncor
Ene
rgy,
Inc.
-
"
-
U
S$
1,48
2 N
/A
U
S$
1,48
2
(C
ontin
ued)
- 174
-

- 175
-
Hel
d C
ompa
ny N
ame
Mar
keta
ble
Secu
ritie
s Typ
e an
d N
ame
Rel
atio
nshi
p w
ith th
e C
ompa
ny
Fina
ncia
l Sta
tem
ent A
ccou
nt
Dec
embe
r 31
, 201
6
Not
e Sh
ares
/Uni
ts
(In
Tho
usan
ds)
Car
ryin
g V
alue
(F
orei
gn C
urre
ncie
s in
Tho
usan
ds)
Perc
enta
ge o
f O
wne
rshi
p (%
)
Fair
Val
ue
(For
eign
Cur
renc
ies
in T
hous
ands
)
TSM
C G
loba
l W
estp
ac B
anki
ng C
orp.
-
Ava
ilabl
e-fo
r-sa
le fi
nanc
ial a
sset
s
-
U
S$
1,48
1 N
/A
U
S$
1,48
1
Pr
octe
r & G
ambl
e C
o/Th
e -
"
-
U
S$
1,47
2 N
/A
U
S$
1,47
2
H
SBC
Ban
k PL
C
- "
-
US$
1,
468
N/A
US$
1,
468
Gua
rdia
n Li
fe G
loba
l Fun
ding
-
"
-
U
S$
1,46
1 N
/A
U
S$
1,46
1
G
ener
al E
lect
ric C
o.
- "
-
US$
1,
417
N/A
US$
1,
417
East
man
Che
mic
al C
ompa
ny
- "
-
US$
1,
407
N/A
US$
1,
407
Con
ocoP
hilli
ps
- "
-
US$
1,
396
N/A
US$
1,
396
Wal
t Dis
ney
Com
pany
/The
-
"
-
U
S$
1,39
6 N
/A
U
S$
1,39
6
Pa
cifiC
orp
- "
-
US$
1,
387
N/A
US$
1,
387
Deu
tsch
e B
ank
AG
-
"
-
U
S$
1,35
1 N
/A
U
S$
1,35
1
B
ioge
n In
c.
- "
-
US$
1,
343
N/A
US$
1,
343
IBM
Cor
p.
- "
-
US$
1,
308
N/A
US$
1,
308
Eato
n Co
rp.
- "
-
US$
1,
307
N/A
US$
1,
307
Sant
ande
r UK
PLC
-
"
-
U
S$
1,28
9 N
/A
U
S$
1,28
9
Ph
ilip
Mor
ris In
tl In
c.
- "
-
US$
1,
287
N/A
US$
1,
287
Equi
fax
Inc.
-
"
-
U
S$
1,28
2 N
/A
U
S$
1,28
2
A
mer
ican
Airl
ines
201
3-2
- "
-
US$
1,
278
N/A
US$
1,
278
Vis
a In
c.
- "
-
US$
1,
277
N/A
US$
1,
277
Nis
san
Mot
or A
ccep
tanc
e -
"
-
U
S$
1,25
6 N
/A
U
S$
1,25
6
K
roge
r Co.
-
"
-
U
S$
1,25
4 N
/A
U
S$
1,25
4
C
SX C
orp.
-
"
-
U
S$
1,24
8 N
/A
U
S$
1,24
8
B
anqu
e Fe
d C
red
Mut
uel
- "
-
US$
1,
178
N/A
US$
1,
178
ON
EOK
Par
tner
s LP
- "
-
US$
1,
160
N/A
US$
1,
160
Cor
ning
Inc.
-
"
-
U
S$
1,14
2 N
/A
U
S$
1,14
2
Pu
blic
Ser
vice
Ent
erpr
ise
Gro
up In
c.
- "
-
US$
1,
138
N/A
US$
1,
138
ERP
Ope
ratin
g LP
-
"
-
U
S$
1,12
3 N
/A
U
S$
1,12
3
B
erks
hire
Hat
haw
ay In
c.
- "
-
US$
1,
119
N/A
US$
1,
119
Che
vron
Cor
p.
- "
-
US$
1,
103
N/A
US$
1,
103
Med
troni
c In
c.
- "
-
US$
1,
098
N/A
US$
1,
098
Wes
farm
ers L
td.
-
"
-
U
S$
1,09
4 N
/A
U
S$
1,09
4
M
arsh
& M
clen
nan
Cos
Inc.
-
"
-
U
S$
1,08
8 N
/A
U
S$
1,08
8
In
tern
atio
nal P
aper
Com
pany
-
"
-
U
S$
1,08
0 N
/A
U
S$
1,08
0
B
NP
Parib
as
- "
-
US$
1,
071
N/A
US$
1,
071
Cig
na C
orpo
ratio
n -
"
-
U
S$
1,06
9 N
/A
U
S$
1,06
9
C
omca
st C
orp.
-
"
-
U
S$
1,05
6 N
/A
U
S$
1,05
6
M
erck
& C
o In
c.
- "
-
US$
1,
055
N/A
US$
1,
055
EOG
Res
ourc
es, I
nc.
- "
-
US$
1,
053
N/A
US$
1,
053
Ber
kshi
re H
atha
way
Ene
rgy
Co.
-
"
-
U
S$
1,05
1 N
/A
U
S$
1,05
1
Li
ncol
n N
atio
nal C
orp.
-
"
-
U
S$
1,04
8 N
/A
U
S$
1,04
8
M
acy's
Ret
ail H
oldi
ngs I
nc.
- "
-
US$
1,
027
N/A
US$
1,
027
Stat
oil A
SA
- "
-
US$
1,
020
N/A
US$
1,
020
Am
azon
.com
Inc.
-
"
-
U
S$
1,01
9 N
/A
U
S$
1,01
9
A
ltera
Cor
p.
- "
-
US$
1,
017
N/A
US$
1,
017
HP
Ente
rpris
e C
o.
- "
-
US$
1,
010
N/A
US$
1,
010
Hom
e D
epot
Inc.
-
"
-
U
S$
1,00
9 N
/A
U
S$
1,00
9
R
ealty
Inco
me
Cor
p.
- "
-
US$
1,
008
N/A
US$
1,
008
Man
uf &
Tra
ders
Tru
st C
o.
- "
-
US$
1,
007
N/A
US$
1,
007
Car
niva
l Cor
p.
- "
-
US$
1,
004
N/A
US$
1,
004
John
Dee
re C
apita
l Cor
p.
- "
-
US$
1,
004
N/A
US$
1,
004
Mac
quar
ie B
ank
Ltd.
-
"
-
U
S$
1,00
3 N
/A
U
S$
1,00
3
(C
ontin
ued)
- 175
-

- 176
-
Hel
d C
ompa
ny N
ame
Mar
keta
ble
Secu
ritie
s Typ
e an
d N
ame
Rel
atio
nshi
p w
ith th
e C
ompa
ny
Fina
ncia
l Sta
tem
ent A
ccou
nt
Dec
embe
r 31
, 201
6
Not
e Sh
ares
/Uni
ts
(In
Tho
usan
ds)
Car
ryin
g V
alue
(F
orei
gn C
urre
ncie
s in
Tho
usan
ds)
Perc
enta
ge o
f O
wne
rshi
p (%
)
Fair
Val
ue
(For
eign
Cur
renc
ies
in T
hous
ands
)
TSM
C G
loba
l C
ater
pilla
r Fin
anci
al S
ervi
ces C
orp.
-
Ava
ilabl
e-fo
r-sa
le fi
nanc
ial a
sset
s
-
U
S$
1,00
0 N
/A
U
S$
1,00
0
N
isou
rce
Fina
nce
Cor
p.
- "
-
US$
99
6 N
/A
U
S$
996
Geo
rgia
-Pac
ific
LLC
-
"
-
U
S$
988
N/A
US$
98
8
D
uke
Rea
lty L
P -
"
-
U
S$
972
N/A
US$
97
2
Te
xas E
aste
rn T
rans
mis
sion
, LP
- "
-
US$
97
2 N
/A
U
S$
972
Duk
e En
ergy
Pro
gres
s Inc
. -
"
-
U
S$
962
N/A
US$
96
2
G
laxo
smith
klin
e C
ap. I
nc.
- "
-
US$
95
0 N
/A
U
S$
950
Sout
hern
Ele
ctric
Gen
erat
ing
Com
pany
-
"
-
U
S$
909
N/A
US$
90
9
Lo
ckhe
ed M
artin
Cor
p.
- "
-
US$
90
4 N
/A
U
S$
904
Sven
ska
Han
dels
bank
en A
B (p
ubl)
- "
-
US$
89
1 N
/A
U
S$
891
AX
A F
inan
cial
, Inc
. -
"
-
U
S$
886
N/A
US$
88
6
Fe
dera
l Rea
lty In
vs T
rust
-
"
-
U
S$
883
N/A
US$
88
3
M
aste
rcar
d In
c.
- "
-
US$
85
5 N
/A
U
S$
855
Nuc
or C
orpo
ratio
n -
"
-
U
S$
843
N/A
US$
84
3
A
XIS
Spe
cial
ty F
inan
ce P
LC
- "
-
US$
82
1 N
/A
U
S$
821
Paci
fic L
ifeC
orp
- "
-
US$
81
6 N
/A
U
S$
816
Ban
k O
f Mon
treal
-
"
-
U
S$
812
N/A
US$
81
2
So
ciet
e G
ener
ale
Gro
up
- "
-
US$
81
0 N
/A
U
S$
810
Xyl
em In
c.
- "
-
US$
80
9 N
/A
U
S$
809
Man
ulife
Fin
anci
al C
orpo
ratio
n -
"
-
U
S$
804
N/A
US$
80
4
C
ox C
omm
unic
atio
ns, I
nc.
- "
-
US$
79
1 N
/A
U
S$
791
Kon
inkl
ijke
Phili
ps N
.V.
- "
-
US$
78
6 N
/A
U
S$
786
CM
S En
ergy
Cor
p.
- "
-
US$
77
2 N
/A
U
S$
772
Cro
wn
Cas
tle T
ower
s LLC
-
"
-
U
S$
758
N/A
US$
75
8
H
CP
Inc.
-
"
-
U
S$
751
N/A
US$
75
1
So
uthe
rn R
ailw
ay C
o.
- "
-
US$
74
1 N
/A
U
S$
741
DTE
Ele
ctric
Com
pany
-
"
-
U
S$
718
N/A
US$
71
8
B
aker
Hug
hes I
ncor
pora
ted
- "
-
US$
71
4 N
/A
U
S$
714
Reg
ions
Fin
anci
al C
orpo
ratio
n -
"
-
U
S$
710
N/A
US$
71
0
To
tal C
apita
l Int
erna
tiona
l S.A
. -
"
-
U
S$
703
N/A
US$
70
3
C
ontin
enta
l Airl
ines
Inc.
-
"
-
U
S$
700
N/A
US$
70
0
TT
X C
o.
- "
-
US$
70
0 N
/A
U
S$
700
Scen
tre G
roup
-
"
-
U
S$
699
N/A
US$
69
9
A
ir Le
ase
Cor
pora
tion
- "
-
US$
69
6 N
/A
U
S$
696
Car
gill,
Inco
rpor
ated
-
"
-
U
S$
693
N/A
US$
69
3
D
ansk
e B
ank
A/S
-
"
-
U
S$
689
N/A
US$
68
9
En
terg
y Lo
uisi
ana,
LLC
-
"
-
U
S$
676
N/A
US$
67
6
O
hio
Pow
er C
ompa
ny
- "
-
US$
66
9 N
/A
U
S$
669
Nat
iona
l Ret
ail P
rope
rties
, Inc
. -
"
-
U
S$
663
N/A
US$
66
3
C
apita
l One
Fin
anci
al C
o.
- "
-
US$
66
1 N
/A
U
S$
661
Libe
rty P
rope
rty L
P -
"
-
U
S$
638
N/A
US$
63
8
G
rupo
Bim
bo, S
.A.B
. de
C.V
. -
"
-
U
S$
637
N/A
US$
63
7
Po
tash
Cor
p Sa
skat
chew
an In
c.
- "
-
US$
63
7 N
/A
U
S$
637
AB
C In
c.
- "
-
US$
62
1 N
/A
U
S$
621
Life
Tec
hnol
ogie
s Cor
p.
- "
-
US$
62
0 N
/A
U
S$
620
Dr P
eppe
r Sna
pple
Gro
up, I
nc.
- "
-
US$
61
4 N
/A
U
S$
614
Kim
berly
Cla
rk C
orp.
-
"
-
U
S$
604
N/A
US$
60
4
B
ayer
US
Fina
nce
LLC
-
"
-
U
S$
599
N/A
US$
59
9
C
ente
rPoi
nt E
nerg
y R
esou
rces
-
"
-
U
S$
594
N/A
US$
59
4
H
ost H
otel
s & R
esor
ts, I
nc.
- "
-
US$
59
0 N
/A
U
S$
590
(Con
tinue
d)
- 176
-

- 177
-
Hel
d C
ompa
ny N
ame
Mar
keta
ble
Secu
ritie
s Typ
e an
d N
ame
Rel
atio
nshi
p w
ith th
e C
ompa
ny
Fina
ncia
l Sta
tem
ent A
ccou
nt
Dec
embe
r 31
, 201
6
Not
e Sh
ares
/Uni
ts
(In
Tho
usan
ds)
Car
ryin
g V
alue
(F
orei
gn C
urre
ncie
s in
Tho
usan
ds)
Perc
enta
ge o
f O
wne
rshi
p (%
)
Fair
Val
ue
(For
eign
Cur
renc
ies
in T
hous
ands
)
TSM
C G
loba
l M
UFG
Uni
on B
ank,
N.A
. -
Ava
ilabl
e-fo
r-sa
le fi
nanc
ial a
sset
s
-
U
S$
586
N/A
US$
58
6
A
valo
nBay
Com
mun
ities
Inc.
-
"
-
U
S$
581
N/A
US$
58
1
B
unge
Lim
ited
Fina
nce
Cor
p.
- "
-
US$
57
3 N
/A
U
S$
573
Bos
ton
Prop
ertie
s LP
- "
-
US$
56
2 N
/A
U
S$
562
Nor
dstro
m In
c.
- "
-
US$
55
3 N
/A
U
S$
553
Cai
sse
Cen
trale
Des
jard
ins
- "
-
US$
54
9 N
/A
U
S$
549
Dig
ital R
ealty
Tru
st, L
.P.
- "
-
US$
54
4 N
/A
U
S$
544
Mcd
onal
d's C
orp.
-
"
-
U
S$
543
N/A
US$
54
3
So
uthw
este
rn E
lect
ric P
ower
Com
pany
-
"
-
U
S$
543
N/A
US$
54
3
Pr
uden
tial F
inan
cial
Inc.
-
"
-
U
S$
540
N/A
US$
54
0
O
'Rei
lly A
utom
otiv
e In
c.
- "
-
US$
53
7 N
/A
U
S$
537
TD A
mer
itrad
e H
oldi
ng C
orp.
-
"
-
U
S$
535
N/A
US$
53
5
A
mer
ican
Exp
ress
Co.
-
"
-
U
S$
531
N/A
US$
53
1
B
urlin
gton
Nor
ther
n Sa
nta
Fe C
orp.
-
"
-
U
S$
526
N/A
US$
52
6
In
ter-
Am
eric
an D
evel
opm
ent B
ank
- "
-
US$
50
7 N
/A
U
S$
507
PSEG
Pow
er L
LC
- "
-
US$
50
4 N
/A
U
S$
504
CB
S C
orp.
-
"
-
U
S$
503
N/A
US$
50
3
C
omer
ica
Inc.
-
"
-
U
S$
474
N/A
US$
47
4
H
oney
wel
l Int
erna
tiona
l Inc
. -
"
-
U
S$
464
N/A
US$
46
4
N
atio
nwid
e B
uild
ing
Soci
ety
- "
-
US$
44
5 N
/A
U
S$
445
Val
ero
Ener
gy C
orp.
-
"
-
U
S$
441
N/A
US$
44
1
B
lack
ston
e H
oldi
ngs F
inan
ce C
o., L
LC
- "
-
US$
42
9 N
/A
U
S$
429
Exxo
n M
obil
Corp
orat
ion
- "
-
US$
40
0 N
/A
U
S$
400
Con
ocop
hilli
ps C
ompa
ny
- "
-
US$
39
9 N
/A
U
S$
399
Vol
ksw
agen
Gro
up o
f Am
eric
a, In
c.
- "
-
US$
39
8 N
/A
U
S$
398
Firs
t Nia
gara
Fin
anci
al G
roup
, Inc
. -
"
-
U
S$
394
N/A
US$
39
4
A
on C
orp.
-
"
-
U
S$
394
N/A
US$
39
4
N
atio
nwid
e Fi
nanc
ial S
ervi
ce, I
nc.
- "
-
US$
38
2 N
/A
U
S$
382
Am
eric
an H
onda
Fin
ance
-
"
-
U
S$
368
N/A
US$
36
8
W
m. W
rigle
y Jr
. Co.
-
"
-
U
S$
353
N/A
US$
35
3
M
etlif
e In
c.
- "
-
US$
32
9 N
/A
U
S$
329
Pear
son
Dol
Fin
Tw
o PL
C
- "
-
US$
31
5 N
/A
U
S$
315
Bar
clay
s Ban
k PL
C
- "
-
US$
29
2 N
/A
U
S$
292
BA
E Sy
stem
s Hol
ding
s, In
c.
- "
-
US$
29
2 N
/A
U
S$
292
EMD
Fin
ance
LLC
-
"
-
U
S$
278
N/A
US$
27
8
M
atte
l Inc
. -
"
-
U
S$
268
N/A
US$
26
8
U
.S. B
anco
rp
- "
-
US$
26
2 N
/A
U
S$
262
Nom
ura
Hol
ding
s Inc
. -
"
-
U
S$
252
N/A
US$
25
2
K
ansa
s City
Pow
er &
Lig
ht C
ompa
ny
- "
-
US$
24
7 N
/A
U
S$
247
Ban
k of
Nov
a Sc
otia
-
"
-
U
S$
246
N/A
US$
24
6
A
on P
LC
- "
-
US$
24
5 N
/A
U
S$
245
Prot
ectiv
e Li
fe C
orpo
ratio
n -
"
-
U
S$
238
N/A
US$
23
8
W
estR
ock
MW
V, L
LC
- "
-
US$
23
5 N
/A
U
S$
235
Rol
ls R
oyce
PLC
-
"
-
U
S$
223
N/A
US$
22
3
A
ssur
ant,
Inc.
-
"
-
U
S$
212
N/A
US$
21
2
W
oolw
orth
s Lim
ited
- "
-
US$
19
6 N
/A
U
S$
196
JPM
orga
n C
hase
& C
o.
- H
eld-
to-m
atur
ity fi
nanc
ial a
sset
s
-
U
S$
153,
147
N/A
US$
15
4,71
0
W
ells
Far
go &
Com
pany
-
"
-
U
S$
150,
007
N/A
US$
15
0,32
1
G
oldm
an S
achs
Gro
up, I
nc.
- "
-
US$
10
0,00
0 N
/A
U
S$
100,
959
Wes
tpac
Ban
king
Cor
p.
- "
-
US$
10
0,00
0 N
/A
U
S$
100,
743
(Con
tinue
d)
- 177
-
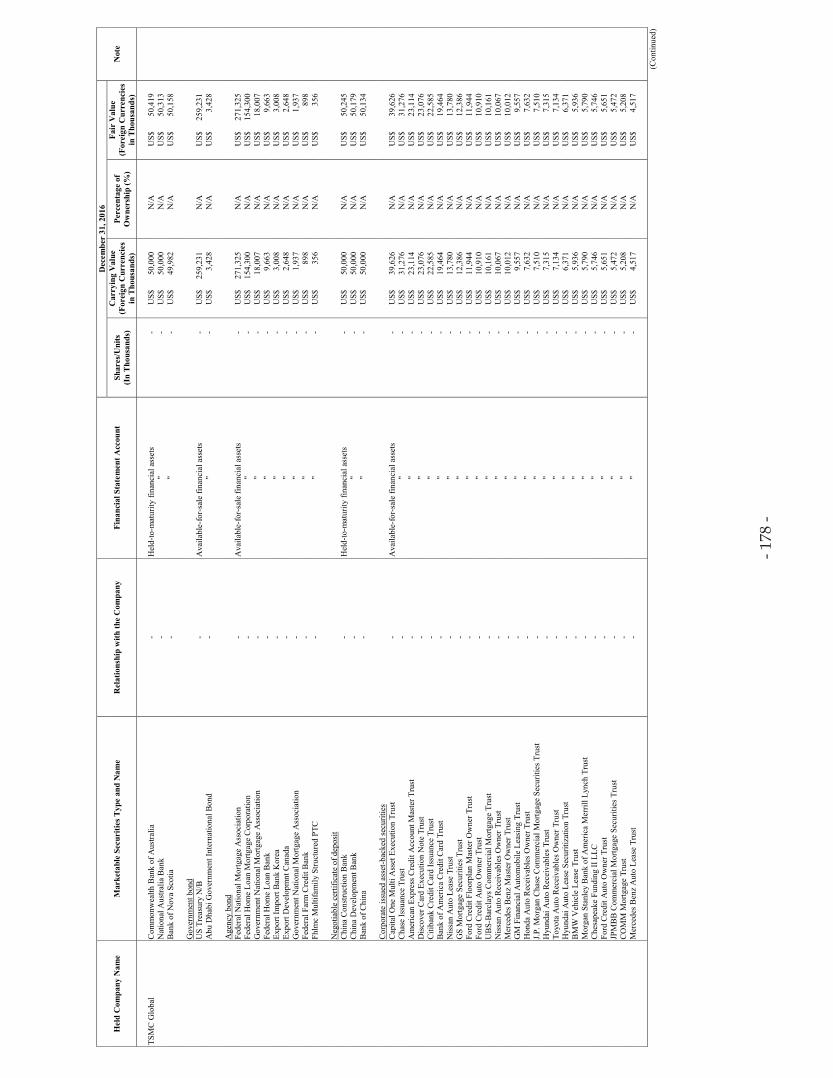
- 178
-
Hel
d C
ompa
ny N
ame
Mar
keta
ble
Secu
ritie
s Typ
e an
d N
ame
Rel
atio
nshi
p w
ith th
e C
ompa
ny
Fina
ncia
l Sta
tem
ent A
ccou
nt
Dec
embe
r 31
, 201
6
Not
e Sh
ares
/Uni
ts
(In
Tho
usan
ds)
Car
ryin
g V
alue
(F
orei
gn C
urre
ncie
s in
Tho
usan
ds)
Perc
enta
ge o
f O
wne
rshi
p (%
)
Fair
Val
ue
(For
eign
Cur
renc
ies
in T
hous
ands
)
TSM
C G
loba
l C
omm
onw
ealth
Ban
k of
Aus
tralia
-
Hel
d-to
-mat
urity
fina
ncia
l ass
ets
-
US$
50
,000
N
/A
U
S$
50,4
19
Nat
iona
l Aus
tralia
Ban
k -
"
-
U
S$
50,0
00
N/A
US$
50
,313
B
ank
of N
ova
Scot
ia
- "
-
US$
49
,982
N
/A
U
S$
50,1
58
G
over
nmen
t bon
d
U
S Tr
easu
ry N
/B
- A
vaila
ble-
for-
sale
fina
ncia
l ass
ets
-
US$
25
9,23
1 N
/A
U
S$
259,
231
Abu
Dha
bi G
over
nmen
t Int
erna
tiona
l Bon
d -
"
-
U
S$
3,42
8 N
/A
U
S$
3,42
8
Age
ncy
bond
Fe
dera
l Nat
iona
l Mor
tgag
e A
ssoc
iatio
n -
Ava
ilabl
e-fo
r-sa
le fi
nanc
ial a
sset
s
-
U
S$
271,
325
N/A
US$
27
1,32
5
Fe
dera
l Hom
e Lo
an M
ortg
age
Cor
pora
tion
- "
-
US$
15
4,30
0 N
/A
U
S$
154,
300
Gov
ernm
ent N
atio
nal M
ortg
age
Ass
ocia
tion
- "
-
US$
18
,007
N
/A
U
S$
18,0
07
Fede
ral H
ome
Loan
Ban
k -
"
-
U
S$
9,66
3 N
/A
U
S$
9,66
3
Ex
port
Impo
rt B
ank
Kor
ea
- "
-
US$
3,
008
N/A
US$
3,
008
Expo
rt D
evel
opm
nt C
anad
a -
"
-
U
S$
2,64
8 N
/A
U
S$
2,64
8
G
over
nmen
t Nat
iona
l Mor
tgag
e A
ssoc
iatio
n -
"
-
U
S$
1,93
7 N
/A
U
S$
1,93
7
Fe
dera
l Far
m C
redi
t Ban
k -
"
-
U
S$
898
N/A
US$
89
8
Fh
lmc
Mul
tifam
ily S
truct
ured
PTC
-
"
-
U
S$
356
N/A
US$
35
6
Neg
otia
ble
certi
ficat
e of
dep
osit
Chi
na C
onst
ruct
ion
Ban
k -
Hel
d-to
-mat
urity
fina
ncia
l ass
ets
-
US$
50
,000
N
/A
U
S$
50,2
45
Chi
na D
evel
opm
ent B
ank
- "
-
US$
50
,000
N
/A
U
S$
50,1
79
Ban
k of
Chi
na
- "
-
US$
50
,000
N
/A
U
S$
50,1
34
C
orpo
rate
issu
ed a
sset
-bac
ked
secu
ritie
s
C
apita
l One
Mul
ti A
sset
Exe
cutio
n Tr
ust
- A
vaila
ble-
for-
sale
fina
ncia
l ass
ets
-
US$
39
,626
N
/A
U
S$
39,6
26
Cha
se Is
suan
ce T
rust
-
"
-
U
S$
31,2
76
N/A
US$
31
,276
A
mer
ican
Exp
ress
Cre
dit A
ccou
nt M
aste
r Tru
st
- "
-
US$
23
,114
N
/A
U
S$
23,1
14
Dis
cove
r Car
d Ex
ecut
ion
Not
e Tr
ust
- "
-
US$
23
,076
N
/A
U
S$
23,0
76
Citi
bank
Cre
dit C
ard
Issu
ance
Tru
st
- "
-
US$
22
,585
N
/A
U
S$
22,5
85
Ban
k of
Am
eric
a C
redi
t Car
d Tr
ust
- "
-
US$
19
,464
N
/A
U
S$
19,4
64
Nis
san
Aut
o Le
ase
Trus
t -
"
-
U
S$
13,7
80
N/A
US$
13
,780
G
S M
ortg
age
Secu
ritie
s Tru
st
- "
-
US$
12
,386
N
/A
U
S$
12,3
86
Ford
Cre
dit F
loor
plan
Mas
ter O
wne
r Tru
st
- "
-
US$
11
,944
N
/A
U
S$
11,9
44
Ford
Cre
dit A
uto
Ow
ner T
rust
-
"
-
U
S$
10,9
10
N/A
US$
10
,910
U
BS-
Bar
clay
s Com
mer
cial
Mor
tgag
e Tr
ust
- "
-
US$
10
,161
N
/A
U
S$
10,1
61
Nis
san
Aut
o R
ecei
vabl
es O
wne
r Tru
st
- "
-
US$
10
,067
N
/A
U
S$
10,0
67
Mer
cede
s Ben
z M
aste
r Ow
ner T
rust
-
"
-
U
S$
10,0
12
N/A
US$
10
,012
G
M F
inan
cial
Aut
omob
ile L
easi
ng T
rust
-
"
-
U
S$
9,55
7 N
/A
U
S$
9,55
7
H
onda
Aut
o R
ecei
vabl
es O
wne
r Tru
st
- "
-
US$
7,
632
N/A
US$
7,
632
J.P. M
orga
n C
hase
Com
mer
cial
Mor
tgag
e Se
curit
ies T
rust
-
"
-
U
S$
7,51
0 N
/A
U
S$
7,51
0
H
yund
ai A
uto
Rec
eiva
bles
Tru
st
- "
-
US$
7,
315
N/A
US$
7,
315
Toyo
ta A
uto
Rec
eiva
bles
Ow
ner T
rust
-
"
-
U
S$
7,13
4 N
/A
U
S$
7,13
4
H
yund
ai A
uto
Leas
e Se
curit
izat
ion
Trus
t -
"
-
U
S$
6,37
1 N
/A
U
S$
6,37
1
B
MW
Veh
icle
Lea
se T
rust
-
"
-
U
S$
5,93
6 N
/A
U
S$
5,93
6
M
orga
n St
anle
y B
ank
of A
mer
ica
Mer
rill L
ynch
Tru
st
- "
-
US$
5,
790
N/A
US$
5,
790
Che
sape
ake
Fund
ing
II L
LC
- "
-
US$
5,
746
N/A
US$
5,
746
Ford
Cre
dit A
uto
Ow
ner T
rust
-
"
-
U
S$
5,65
1 N
/A
U
S$
5,65
1
JP
MB
B C
omm
erci
al M
ortg
age
Secu
ritie
s Tru
st
- "
-
US$
5,
472
N/A
US$
5,
472
CO
MM
Mor
tgag
e Tr
ust
- "
-
US$
5,
208
N/A
US$
5,
208
Mer
cede
s Ben
z A
uto
Leas
e Tr
ust
- "
-
US$
4,
517
N/A
US$
4,
517
(Con
tinue
d)
- 178
-

- 179
-
Hel
d C
ompa
ny N
ame
Mar
keta
ble
Secu
ritie
s Typ
e an
d N
ame
Rel
atio
nshi
p w
ith th
e C
ompa
ny
Fina
ncia
l Sta
tem
ent A
ccou
nt
Dec
embe
r 31
, 201
6
Not
e Sh
ares
/Uni
ts
(In
Tho
usan
ds)
Car
ryin
g V
alue
(F
orei
gn C
urre
ncie
s in
Tho
usan
ds)
Perc
enta
ge o
f O
wne
rshi
p (%
)
Fair
Val
ue
(For
eign
Cur
renc
ies
in T
hous
ands
)
TSM
C G
loba
l C
itigr
oup
Com
mer
cial
Mor
tgag
e Tr
ust
- A
vaila
ble-
for-
sale
fina
ncia
l ass
ets
-
US$
4,
207
N/A
US$
4,
207
Mor
gan
Stan
ley
Cap
ital I
Tru
st
- "
-
US$
4,
114
N/A
US$
4,
114
Mer
cede
s Ben
z A
uto
Rec
eiva
bles
Tru
st
- "
-
US$
3,
699
N/A
US$
3,
699
BM
W F
loor
plan
Mas
ter O
wne
r Tru
st
- "
-
US$
2,
437
N/A
US$
2,
437
Ford
Cre
dit A
uto
Leas
e Tr
ust
- "
-
US$
2,
174
N/A
US$
2,
174
Nis
san
Mas
ter O
wne
r Tru
st R
ecei
vabl
es T
rust
-
"
-
U
S$
2,00
3 N
/A
U
S$
2,00
3
C
arm
ax A
uto
Ow
ner T
rust
-
"
-
U
S$
2,00
0 N
/A
U
S$
2,00
0
G
olde
n C
redi
t Car
d Tr
ust
- "
-
US$
1,
801
N/A
US$
1,
801
Whe
els S
PV L
LC
- "
-
US$
1,
690
N/A
US$
1,
690
Wel
ls F
argo
Com
mer
cial
Mor
tgag
e Tr
ust
- "
-
US$
1,
295
N/A
US$
1,
295
CFC
RE
Com
mer
cial
Mor
tgag
e Tr
ust
- "
-
US$
1,
083
N/A
US$
1,
083
Ente
rpris
e Fl
eet F
inan
cing
LLC
-
"
-
U
S$
798
N/A
US$
79
8
Stru
ctur
e pr
oduc
t
B
ank
of T
okyo
-Mits
ubis
hi U
FJ
- H
eld-
to-m
atur
ity fi
nanc
ial a
sset
s
-
U
S$
50,0
00
N/A
US$
49
,993
Fund
Pr
imav
era
Cap
ital F
und
II L
.P.
- Fi
nanc
ial a
sset
s car
ried
at c
ost
-
US$
23
,784
4
U
S$
23,7
84
VTA
F II
I C
omm
on st
ock
Liqu
idLe
ds L
ight
ing
Cor
p.
- Fi
nanc
ial a
sset
s car
ried
at c
ost
1,60
0
US$
80
0 11
US$
80
0
X
enio
Cor
pora
tion
- "
435
U
S$
453
3
US$
45
3
A
ccto
n W
irele
ss B
road
band
Cor
p.
- "
2,24
9
US$
31
5 6
U
S$
315
Pr
efer
red
stoc
k
G
TBF,
Inc.
-
Fina
ncia
l ass
ets c
arrie
d at
cos
t
1,
154
U
S$
1,50
0 -
U
S$
1,50
0
N
eoco
nix,
Inc.
-
"
4,
147
U
S$
170
-
US$
17
0
V
TAF
II
Com
mon
stoc
k
R
ichW
ave
Tech
nolo
gy C
orp.
-
Ava
ilabl
e-fo
r-sa
le fi
nanc
ial a
sset
s
1,
334
U
S$
2,37
8 2
U
S$
2,37
8
Im
pinj
, Inc
. -
"
62
US$
2,
189
-
US$
2,
189
Sent
elic
-
Fina
ncia
l ass
ets c
arrie
d at
cos
t
1,
806
U
S$
2,60
7 8
U
S$
2,60
7
5V
Tec
hnol
ogie
s, In
c.
- "
963
U
S$
2,16
8 2
U
S$
2,16
8
A
ethe
r Sys
tem
s, In
c.
- "
3,10
0
US$
33
9 30
US$
33
9
Pref
erre
d st
ock
Aqu
antia
-
Fina
ncia
l ass
ets c
arrie
d at
cos
t
4,
643
U
S$
4,44
1 2
U
S$
4,44
1
IS
DF
Pref
erre
d st
ock
Soni
cs, I
nc.
- Fi
nanc
ial a
sset
s car
ried
at c
ost
230
- 3
-
IS
DF
II C
omm
on st
ock
Alc
hip
Tech
nolo
gies
Lim
ited
- A
vaila
ble-
for-
sale
fina
ncia
l ass
ets
6,58
1
US$
6,
387
11
U
S$
6,38
7
So
nics
, Inc
. -
Fina
ncia
l ass
ets c
arrie
d at
cos
t
27
8
-
4
-
Pr
efer
red
stoc
k
So
nics
, Inc
. -
Fina
ncia
l ass
ets c
arrie
d at
cos
t
26
4
-
4
-
Gro
wth
Fun
d C
omm
on st
ock
Inno
vium
, Inc
. -
Fina
ncia
l ass
ets c
arrie
d at
cos
t
22
1
US$
37
0 -
U
S$
370
Pr
efer
red
stoc
k
In
novi
um, I
nc.
- Fi
nanc
ial a
sset
s car
ried
at c
ost
230
U
S$
384
-
US$
38
4
(C
oncl
uded
)
- 179
-

- 180
-
TA
BL
E 4
T
aiw
an S
emic
ondu
ctor
Man
ufac
turi
ng C
ompa
ny L
imite
d an
d In
vest
ees
MA
RK
ET
AB
LE
SE
CU
RIT
IES
AC
QU
IRE
D A
ND
DIS
POSE
D O
F A
T C
OST
S O
R P
RIC
ES
OF
AT
LE
AST
NT
$300
MIL
LIO
N O
R 2
0% O
F T
HE
PA
ID-I
N C
API
TA
L
FOR
TH
E Y
EA
R E
ND
ED
DE
CE
MB
ER
31,
201
6 (A
mou
nts i
n T
hous
ands
of N
ew T
aiw
an D
olla
rs, U
nles
s Spe
cifie
d O
ther
wis
e)
Com
pany
Nam
e M
arke
tabl
e Se
curi
ties
T
ype
and
Nam
e Fi
nanc
ial S
tate
men
t A
ccou
nt
Cou
nter
-par
ty
Nat
ure
of
Rel
atio
nshi
p
Beg
inni
ng B
alan
ce
Acq
uisi
tion
Dis
posa
l E
ndin
g B
alan
ce (N
ote
1)
Shar
es/U
nits
(I
n T
hous
ands
) A
mou
nt
Shar
es/U
nits
(I
n T
hous
ands
) A
mou
nt
Shar
es/U
nits
(I
n T
hous
ands
) A
mou
nt
Car
ryin
g V
alue
G
ain/
Los
s on
Dis
posa
l Sh
ares
/Uni
ts
(In
Tho
usan
ds)
Am
ount
TS
MC
B
ank
debe
ntur
es
HSB
C B
ank
(Tai
wan
) Lim
ited
Hel
d-to
-mat
urity
fina
ncia
l as
sets
-
-
- $
3,
305,
475
-
$
-
- $
3,
300,
000
$
3,30
0,00
0 $
-
-
$
-
C
orpo
rate
bon
d
CPC
Cor
pora
tion,
Tai
wan
H
eld-
to-m
atur
ity fi
nanc
ial
asse
ts
- -
-
1,
543,
723
-
1,
513,
743
-
1,
075,
000
1,
075,
000
-
-
1,
967,
303
H
on H
ai P
reci
sion
Ind.
Co.
, Ltd
. "
- -
-
1,
003,
858
-
-
-
60
0,00
0
600,
000
-
-
40
0,25
0
Taiw
an P
ower
Com
pany
"
- -
-
1,
207,
601
-
-
-
1,
000,
000
1,
000,
000
-
-
20
0,84
8
Nan
Ya
Plas
tics C
orpo
ratio
n "
- -
-
-
-
30
2,13
9
-
150,
000
15
0,00
0
-
-
150,
742
St
ruct
ure
prod
uct
H
ua N
an C
omm
erci
al B
ank
Hel
d-to
-mat
urity
fina
ncia
l as
sets
-
-
-
2,00
0,00
0
-
-
-
2,00
0,00
0
2,00
0,00
0
-
-
-
C
atha
y U
nite
d B
ank
" -
-
-
1,00
0,00
0
-
-
-
1,00
0,00
0
1,00
0,00
0
-
-
-
Com
mer
cial
pap
er
Ta
iwan
Pow
er C
ompa
ny
Hel
d-to
-mat
urity
fina
ncia
l as
sets
-
-
-
-
945
9,
426,
884
80
800,
000
80
0,00
0
-
865
8,
628,
176
St
ock
TS
MC
Glo
bal
Inve
stm
ents
acc
ount
ed fo
r us
ing
equi
ty m
etho
d
- Su
bsid
iary
5
203,
425,
723
2
64
,451
,983
-
-
-
-
7
265,
634,
729
TS
MC
Nan
jing
" -
Subs
idia
ry
-
-
-
6,
435,
200
-
-
-
-
-
6,
331,
094
V
isEr
a Te
ch
" V
isEr
a H
oldi
ng
Subs
idia
ry
-
-
25
3,12
0
5,00
5,17
1
-
-
-
-
253,
120
5,
234,
883
N
ote
2
X
inte
c "
Vis
Era
Hol
ding
A
ssoc
iate
92,7
78
2,
209,
785
18
,504
678,
348
-
-
-
-
11
1,28
2
2,59
9,80
7
Not
e 2
TS
MC
Glo
bal
Cor
pora
te b
ond
B
ank
of A
mer
ica
Cor
p.
Ava
ilabl
e-fo
r-sa
le fi
nanc
ial
asse
ts
- -
-
US$
6,
993
-
US$
25
,862
- U
S$
4,62
4 U
S$
4,53
2 U
S$
92
-
US$
27
,973
JP
Mor
gan
Cha
se &
Co.
"
- -
-
US$
4,
971
-
US$
28
,534
- U
S$
11,1
21
US$
10
,999
U
S$
122
-
US$
22
,330
Ver
izon
Com
mun
icat
ions
"
- -
-
US$
4,
994
-
US$
12
,385
-
-
-
-
- U
S$
17,0
59
C
itigr
oup
Inc.
"
- -
-
US$
2,
986
-
US$
13
,979
-
-
-
-
- U
S$
16,8
19
A
bbvi
e In
c.
" -
-
-
-
- U
S$
14,3
38
-
US$
25
1 U
S$
251
-
-
US$
13
,850
AT&
T In
c.
" -
-
- U
S$
3,88
2
- U
S$
10,0
44
-
US$
38
4 U
S$
390
US$
(6
)
- U
S$
13,3
32
G
ilead
Sci
ence
s Inc
. "
- -
-
US$
1,
000
-
US$
11
,222
-
-
-
-
- U
S$
11,8
50
A
etna
Inc.
"
- -
-
-
-
US$
11
,687
-
-
-
-
- U
S$
11,6
18
M
orga
n St
anle
y "
- -
-
US$
1,
005
-
US$
10
,359
-
-
-
-
- U
S$
11,2
37
O
racl
e C
orp.
"
- -
-
US$
2,
428
-
US$
9,
572
-
US$
1,
447
US$
1,
426
US$
21
- U
S$
10,4
05
Sv
ensk
a H
ande
lsba
nken
AB
"
- -
-
-
-
US$
9,
922
-
-
-
-
-
US$
9,
837
Te
va P
harm
aceu
tical
s N
ethe
rland
s "
- -
-
-
-
US$
14
,629
- U
S$
5,85
6 U
S$
5,98
7 U
S$
(131
)
- U
S$
8,46
7
(C
ontin
ued)
- 180
-
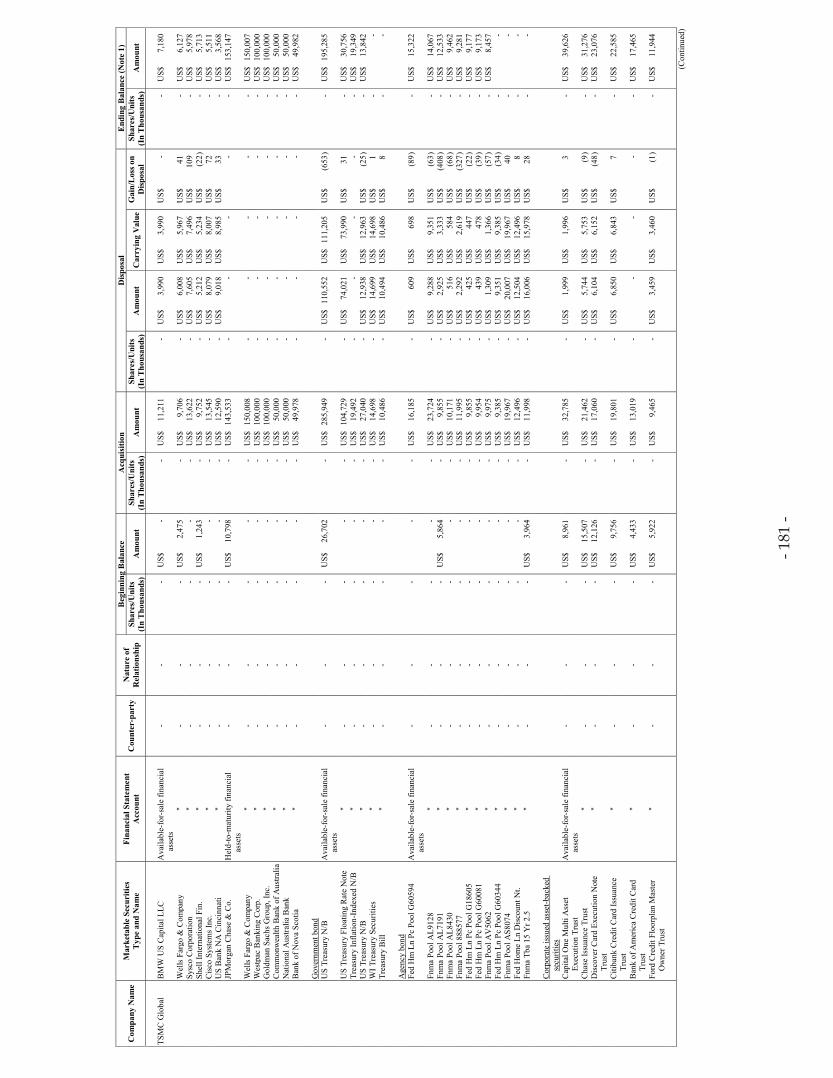
- 181
-
Com
pany
Nam
e M
arke
tabl
e Se
curi
ties
T
ype
and
Nam
e Fi
nanc
ial S
tate
men
t A
ccou
nt
Cou
nter
-par
ty
Nat
ure
of
Rel
atio
nshi
p
Beg
inni
ng B
alan
ce
Acq
uisi
tion
Dis
posa
l E
ndin
g B
alan
ce (N
ote
1)
Shar
es/U
nits
(I
n T
hous
ands
) A
mou
nt
Shar
es/U
nits
(I
n T
hous
ands
) A
mou
nt
Shar
es/U
nits
(I
n T
hous
ands
) A
mou
nt
Car
ryin
g V
alue
G
ain/
Los
s on
Dis
posa
l Sh
ares
/Uni
ts
(In
Tho
usan
ds)
Am
ount
TS
MC
Glo
bal
BM
W U
S C
apita
l LLC
A
vaila
ble-
for-
sale
fina
ncia
l as
sets
-
-
- U
S$
-
- U
S$
11,2
11
-
US$
3,
990
US$
3,
990
US$
-
-
US$
7,
180
W
ells
Far
go &
Com
pany
"
- -
-
US$
2,
475
-
US$
9,
706
-
US$
6,
008
US$
5,
967
US$
41
- U
S$
6,12
7
Sysc
o C
orpo
ratio
n "
- -
-
-
-
US$
13
,622
- U
S$
7,60
5 U
S$
7,49
6 U
S$
109
-
US$
5,
978
Sh
ell I
nter
natio
nal F
in.
" -
-
- U
S$
1,24
3
- U
S$
9,75
2
- U
S$
5,21
2 U
S$
5,23
4 U
S$
(22 )
- U
S$
5,71
3
Cis
co S
yste
ms I
nc.
" -
-
-
-
- U
S$
13,5
45
-
US$
8,
079
US$
8,
007
US$
72
- U
S$
5,51
1
US
Ban
k N
A C
inci
nnat
i "
- -
-
-
-
US$
12
,590
- U
S$
9,01
8 U
S$
8,98
5 U
S$
33
-
US$
3,
568
JP
Mor
gan
Cha
se &
Co.
H
eld-
to-m
atur
ity fi
nanc
ial
asse
ts
- -
-
US$
10
,798
- U
S$
143,
533
-
-
-
-
-
US$
15
3,14
7
W
ells
Far
go &
Com
pany
"
- -
-
-
-
US$
15
0,00
8
-
-
-
-
- U
S$
150,
007
W
estp
ac B
anki
ng C
orp.
"
- -
-
-
-
US$
10
0,00
0
-
-
-
-
- U
S$
100,
000
G
oldm
an S
achs
Gro
up, I
nc.
"
- -
-
-
-
US$
10
0,00
0
-
-
-
-
- U
S$
100,
000
C
omm
onw
ealth
Ban
k of
Aus
tralia
"
- -
-
-
-
US$
50
,000
-
-
-
-
- U
S$
50,0
00
N
atio
nal A
ustra
lia B
ank
" -
-
-
-
- U
S$
50,0
00
-
-
-
-
-
US$
50
,000
Ban
k of
Nov
a Sc
otia
"
- -
-
-
-
US$
49
,978
-
-
-
-
- U
S$
49,9
82
Gov
ernm
ent b
ond
US
Trea
sury
N/B
A
vaila
ble-
for-
sale
fina
ncia
l as
sets
-
-
- U
S$
26,7
02
-
US$
28
5,94
9
- U
S$
110,
552
US$
11
1,20
5 U
S$
(653
)
- U
S$
195,
285
U
S Tr
easu
ry F
loat
ing
Rat
e N
ote
" -
-
-
-
- U
S$
104,
729
-
US$
74
,021
U
S$
73,9
90
US$
31
- U
S$
30,7
56
Tr
easu
ry In
flatio
n-In
dexe
d N
/B
" -
-
-
-
- U
S$
19,4
92
-
-
-
-
-
US$
19
,349
US
Trea
sury
N/B
"
- -
-
-
-
US$
27
,040
- U
S$
12,9
38
US$
12
,963
U
S$
(25 )
- U
S$
13,8
42
W
I Tre
asur
y Se
curit
ies
" -
-
-
-
- U
S$
14,6
98
-
US$
14
,699
U
S$
14,6
98
US$
1
-
-
Tr
easu
ry B
ill
" -
-
-
-
- U
S$
10,4
86
-
US$
10
,494
U
S$
10,4
86
US$
8
-
-
Age
ncy
bond
Fe
d H
m L
n Pc
Poo
l G60
594
Ava
ilabl
e-fo
r-sa
le fi
nanc
ial
asse
ts
- -
-
-
-
US$
16
,185
- U
S$
609
US$
69
8 U
S$
(89 )
- U
S$
15,3
22
Fn
ma
Pool
AL9
128
" -
-
-
-
- U
S$
23,7
24
-
US$
9,
288
US$
9,
351
US$
(6
3 )
-
US$
14
,067
Fnm
a Po
ol A
L719
1 "
- -
-
US$
5,
864
-
US$
9,
855
-
US$
2,
925
US$
3,
333
US$
(4
08 )
-
US$
12
,533
Fnm
a Po
ol A
L843
0 "
- -
-
-
-
US$
10
,171
- U
S$
516
US$
58
4 U
S$
(68 )
- U
S$
9,46
2
Fnm
a Po
ol 8
8857
7 "
- -
-
-
-
US$
11
,995
- U
S$
2,29
2 U
S$
2,61
9 U
S$
(327
)
- U
S$
9,28
1
Fed
Hm
Ln
Pc P
ool G
1860
5 "
- -
-
-
-
US$
9,
855
-
US$
42
5 U
S$
447
US$
(2
2 )
-
US$
9,
177
Fe
d H
m L
n Pc
Poo
l G60
081
" -
-
-
-
- U
S$
9,95
4
- U
S$
439
US$
47
8 U
S$
(39 )
- U
S$
9,17
3
Fnm
a Po
ol A
V50
62
" -
-
-
-
- U
S$
9,97
5
- U
S$
1,30
9 U
S$
1,36
6 U
S$
(57 )
- U
S$
8,45
7
Fed
Hm
Ln
Pc P
ool G
6034
4 "
- -
-
-
-
US$
9,
385
-
US$
9,
351
US$
9,
385
US$
(3
4 )
-
-
Fn
ma
Pool
AS8
074
" -
-
-
-
- U
S$
19,9
67
-
US$
20
,007
U
S$
19,9
67
US$
40
-
-
Fed
Hom
e Ln
Dis
coun
t Nt.
" -
-
-
-
- U
S$
12,4
96
-
US$
12
,504
U
S$
12,4
96
US$
8
-
-
Fn
ma
Tba
15 Y
r 2.5
"
- -
-
US$
3,
964
-
US$
11
,998
- U
S$
16,0
06
US$
15
,978
U
S$
28
-
-
C
orpo
rate
issu
ed a
sset
-bac
ked
secu
ritie
s
C
apita
l One
Mul
ti A
sset
Ex
ecut
ion
Trus
t A
vaila
ble-
for-
sale
fina
ncia
l as
sets
-
-
- U
S$
8,96
1
- U
S$
32,7
85
-
US$
1,
999
US$
1,
996
US$
3
-
US$
39
,626
C
hase
Issu
ance
Tru
st
" -
-
- U
S$
15,5
07
-
US$
21
,462
- U
S$
5,74
4 U
S$
5,75
3 U
S$
(9 )
-
US$
31
,276
Dis
cove
r Car
d Ex
ecut
ion
Not
e Tr
ust
" -
-
- U
S$
12,1
26
-
US$
17
,060
- U
S$
6,10
4 U
S$
6,15
2 U
S$
(48 )
- U
S$
23,0
76
C
itiba
nk C
redi
t Car
d Is
suan
ce
Trus
t "
- -
-
US$
9,
756
-
US$
19
,801
- U
S$
6,85
0 U
S$
6,84
3 U
S$
7
- U
S$
22,5
85
B
ank
of A
mer
ica
Cre
dit C
ard
Trus
t "
- -
-
US$
4,
433
-
US$
13
,019
-
-
-
-
- U
S$
17,4
65
Fo
rd C
redi
t Flo
orpl
an M
aste
r O
wne
r Tru
st
" -
-
- U
S$
5,92
2
- U
S$
9,46
5
- U
S$
3,45
9 U
S$
3,46
0 U
S$
(1 )
-
US$
11
,944
(C
ontin
ued)
- 181
-

- 182
-
Com
pany
Nam
e M
arke
tabl
e Se
curi
ties
T
ype
and
Nam
e Fi
nanc
ial S
tate
men
t A
ccou
nt
Cou
nter
-par
ty
Nat
ure
of
Rel
atio
nshi
p
Beg
inni
ng B
alan
ce
Acq
uisi
tion
Dis
posa
l E
ndin
g B
alan
ce (N
ote
1)
Shar
es/U
nits
(I
n T
hous
ands
) A
mou
nt
Shar
es/U
nits
(I
n T
hous
ands
) A
mou
nt
Shar
es/U
nits
(I
n T
hous
ands
) A
mou
nt
Car
ryin
g V
alue
G
ain/
Los
s on
Dis
posa
l Sh
ares
/Uni
ts
(In
Tho
usan
ds)
Am
ount
TS
MC
Glo
bal
Stru
ctur
e pr
oduc
t
B
ank
of T
okyo
-Mits
ubis
hi U
FJ
Hel
d-to
-mat
urity
fina
ncia
l as
sets
-
-
- U
S$
-
- U
S$
50,0
00
-
US$
-
US$
-
US$
-
-
US$
50
,000
Fund
Pr
imav
era
Cap
ital F
und
II L
.P.
Fina
ncia
l ass
ets c
arrie
d at
cos
t -
-
- U
S$
12,0
17
-
US$
11
,767
-
-
-
-
- U
S$
23,7
84
Mon
ey m
arke
t fun
d
G
oldm
an S
achs
US$
Liq
uid
Res
erve
s Fun
d A
vaila
ble-
for-
sale
fina
ncia
l as
sets
-
-
-
-
199,
144
US$
19
9,14
4
199,
144
US$
19
9,14
4 U
S$
199,
144
-
-
-
Not
e 1:
Th
e en
ding
bal
ance
incl
udes
the
amor
tizat
ion
of p
rem
ium
/dis
coun
t on
bond
s inv
estm
ents
, sha
re o
f pro
fits/
loss
es o
f inv
este
es a
nd o
ther
rela
ted
adju
stm
ent.
Not
e 2:
Th
e C
ompa
ny re
stru
ctur
ed th
e or
gani
zatio
nal s
truct
ure
to si
mpl
ify in
vest
men
t stru
ctur
e. T
here
fore
, the
acq
uisit
ion
amou
nt w
as th
e ca
rryi
ng v
alue
of V
isEr
a H
oldi
ng’s
inve
stm
ent i
n V
isEr
a Te
ch a
nd X
inte
c, re
spec
tivel
y.
(C
oncl
uded
)
- 182
-

- 183
-
TA
BL
E 5
T
aiw
an S
emic
ondu
ctor
Man
ufac
turi
ng C
ompa
ny L
imite
d an
d In
vest
ees
AC
QU
ISIT
ION
OF
IND
IVID
UA
L R
EA
L E
STA
TE
PR
OPE
RT
IES
AT
CO
STS
OF
AT
LE
AST
NT
$300
MIL
LIO
N O
R 2
0% O
F T
HE
PA
ID-I
N C
API
TA
L
FOR
TH
E Y
EA
R E
ND
ED
DE
CE
MB
ER
31,
201
6 (A
mou
nts i
n T
hous
ands
of N
ew T
aiw
an D
olla
rs, U
nles
s Spe
cifie
d O
ther
wis
e)
Com
pany
N
ame
Typ
es o
f Pr
oper
ty
Tra
nsac
tion
Dat
e
Tra
nsac
tion
Am
ount
(F
orei
gn
Cur
renc
ies i
n T
hous
ands
)
Paym
ent T
erm
C
ount
er-p
arty
N
atur
e of
R
elat
ions
hips
Prio
r T
rans
actio
n of
Rel
ated
Cou
nter
-par
ty
Pric
e R
efer
ence
Pu
rpos
e of
A
cqui
sitio
n O
ther
T
erm
s O
wne
r R
elat
ions
hips
T
rans
fer
Dat
e A
mou
nt
TSM
C
Fab
Apr
il 15
, 201
5 to
Feb
ruar
y 17
, 201
6 $
36
2,11
1 M
onth
ly se
ttlem
ent b
y th
e co
nstru
ctio
n pr
ogre
ss
and
acce
ptan
ce
Envi
rone
tics D
esig
n G
roup
Co.
, Lt
d.
- N
/A
N/A
N
/A
N/A
B
iddi
ng, p
rice
com
paris
on
and
pric
e ne
gotia
tion
Man
ufac
turin
g pu
rpos
e N
one
Fa
b Se
ptem
ber 1
7, 2
015
to
Janu
ary
25, 2
016
3,
201,
800
Mon
thly
settl
emen
t by
the
cons
truct
ion
prog
ress
an
d ac
cept
ance
DA
CIN
Con
stru
ctio
n C
o., L
td.
- N
/A
N/A
N
/A
N/A
B
iddi
ng, p
rice
com
paris
on
and
pric
e ne
gotia
tion
Man
ufac
turin
g pu
rpos
e N
one
Fa
b N
ovem
ber 2
0, 2
015
to
Oct
ober
26,
201
6
32
9,01
0 M
onth
ly se
ttlem
ent b
y th
e co
nstru
ctio
n pr
ogre
ss
and
acce
ptan
ce
TASA
Con
stru
ctio
n C
orpo
ratio
n -
N/A
N
/A
N/A
N
/A
Bid
ding
, pric
e co
mpa
rison
an
d pr
ice
nego
tiatio
n
Man
ufac
turin
g pu
rpos
e N
one
Fa
b D
ecem
ber 1
0, 2
015
to
Apr
il 11
, 201
6
3,16
7,76
8 M
onth
ly se
ttlem
ent b
y th
e co
nstru
ctio
n pr
ogre
ss
and
acce
ptan
ce
Fu T
su C
onst
ruct
ion
Co.
, Ltd
. -
N/A
N
/A
N/A
N
/A
Bid
ding
, pric
e co
mpa
rison
an
d pr
ice
nego
tiatio
n
Man
ufac
turin
g pu
rpos
e N
one
Fa
b D
ecem
ber 3
1, 2
015
to
Janu
ary
04, 2
016
1,
250,
000
Mon
thly
settl
emen
t by
the
cons
truct
ion
prog
ress
an
d ac
cept
ance
Chi
na S
teel
Stru
ctur
e C
o., L
td.
- N
/A
N/A
N
/A
N/A
B
iddi
ng, p
rice
com
paris
on
and
pric
e ne
gotia
tion
Man
ufac
turin
g pu
rpos
e N
one
Fa
b Ja
nuar
y 22
, 201
6 to
Ja
nuar
y 25
, 201
6
75
0,00
0 M
onth
ly se
ttlem
ent b
y th
e co
nstru
ctio
n pr
ogre
ss
and
acce
ptan
ce
KED
GE
Con
stru
ctio
n C
o., L
td.
- N
/A
N/A
N
/A
N/A
B
iddi
ng, p
rice
com
paris
on
and
pric
e ne
gotia
tion
Man
ufac
turin
g pu
rpos
e N
one
TSM
C
Nan
jing
Land
use
rig
ht
June
16,
201
6 R
MB
160
,521
10
0% p
aym
ent
Nan
jing
Mun
icip
al B
urea
u of
La
nd a
nd R
esou
rces
-
N/A
N
/A
N/A
N
/A
Bid
ding
M
anuf
actu
ring
purp
ose
Non
e
Fa
b Ju
ne 3
0, 2
016
RM
B 8
99,9
97
Mon
thly
settl
emen
t by
the
cons
truct
ion
prog
ress
an
d ac
cept
ance
Chi
na C
onst
ruct
ion
Firs
t D
ivis
ion
Gro
up C
onst
ruct
ion
& D
evel
opm
ent C
o., L
td.
- N
/A
N/A
N
/A
N/A
B
iddi
ng, p
rice
com
paris
on
and
pric
e ne
gotia
tion
Man
ufac
turin
g pu
rpos
e N
one
Fa
b O
ctob
er 1
7, 2
016
RM
B 4
08,9
80
Mon
thly
settl
emen
t by
the
cons
truct
ion
prog
ress
an
d ac
cept
ance
Shan
ghai
Bao
ye G
roup
Co.
, Lt
d.
- N
/A
N/A
N
/A
N/A
B
iddi
ng, p
rice
com
paris
on
and
pric
e ne
gotia
tion
Man
ufac
turin
g pu
rpos
e N
one
- 183
-

- 184
-
TA
BL
E 6
T
aiw
an S
emic
ondu
ctor
Man
ufac
turi
ng C
ompa
ny L
imite
d an
d In
vest
ees
TO
TA
L P
UR
CH
ASE
S FR
OM
OR
SA
LE
S T
O R
ELA
TE
D P
AR
TIE
S O
F A
T L
EA
ST N
T$1
00 M
ILL
ION
OR
20%
OF
TH
E P
AID
-IN
CA
PIT
AL
FO
R T
HE
YE
AR
EN
DE
D D
EC
EM
BE
R 3
1, 2
016
(Am
ount
s in
Tho
usan
ds o
f New
Tai
wan
Dol
lars
, Unl
ess S
peci
fied
Oth
erw
ise)
Com
pany
Nam
e R
elat
ed P
arty
N
atur
e of
Rel
atio
nshi
ps
Tra
nsac
tion
Det
ails
A
bnor
mal
Tra
nsac
tion
Not
es/A
ccou
nts P
ayab
le o
r R
ecei
vabl
e N
ote
Purc
hase
s/
Sale
s
Am
ount
(F
orei
gn C
urre
ncie
s in
Tho
usan
ds)
% to
T
otal
Pa
ymen
t Ter
ms
Uni
t Pri
ce
Paym
ent T
erm
s E
ndin
g B
alan
ce
(For
eign
Cur
renc
ies
in T
hous
ands
)
% to
T
otal
TSM
C
TSM
C N
orth
Am
eric
a Su
bsid
iary
Sa
les
$
63
3,91
7,88
8 65
N
et 3
0 da
ys fr
om in
voic
e da
te
(Not
e)
- N
ote
$
85
,874
,678
67
G
UC
A
ssoc
iate
Sa
les
5,00
8,68
4 1
Net
30
days
from
the
end
of th
e m
onth
of w
hen
invo
ice
is is
sued
-
-
93
1,78
7 1
TS
MC
Chi
na
Subs
idia
ry
Purc
hase
s
19
,256
,773
27
N
et 3
0 da
ys fr
om th
e en
d of
the
mon
th o
f whe
n in
voic
e is
issu
ed
- -
(1,7
75,7
74)
6
W
afer
Tech
In
dire
ct su
bsid
iary
Pu
rcha
ses
8,53
1,56
2 12
N
et 3
0 da
ys fr
om th
e en
d of
the
mon
th o
f whe
n in
voic
e is
issu
ed
- -
(1,3
03,7
95)
4
V
IS
Ass
ocia
te
Purc
hase
s
6,
732,
298
10
Net
30
days
from
the
end
of th
e m
onth
of w
hen
invo
ice
is is
sued
-
-
(5
87,4
07)
2
SS
MC
A
ssoc
iate
Pu
rcha
ses
3,37
5,42
2 5
Net
30
days
from
the
end
of th
e m
onth
of w
hen
invo
ice
is is
sued
-
-
(5
05,6
55)
2
TSM
C N
orth
Am
eric
a G
UC
A
ssoc
iate
of T
SMC
Sa
les
842,
301
- N
et 3
0 da
ys fr
om in
voic
e da
te
- -
37,3
49
-
(U
S$
26,0
98)
(U
S$
1,16
0)
Not
e:
The
teno
r is 3
0 da
ys fr
om T
SMC
’s in
voic
e da
te o
r det
erm
ined
by
the
paym
ent t
erm
s gra
nted
to it
s clie
nts b
y TS
MC
Nor
th A
mer
ica.
- 184
-

- 185
-
TA
BL
E 7
T
aiw
an S
emic
ondu
ctor
Man
ufac
turi
ng C
ompa
ny L
imite
d an
d In
vest
ees
RE
CE
IVA
BL
ES
FRO
M R
EL
AT
ED
PA
RT
IES
AM
OU
NT
ING
TO
AT
LEA
ST N
T$1
00 M
ILL
ION
OR
20%
OF
THE
PA
ID-I
N C
API
TA
L
DE
CE
MB
ER
31,
201
6 (A
mou
nts i
n T
hous
ands
of N
ew T
aiw
an D
olla
rs, U
nles
s Spe
cifie
d O
ther
wis
e)
Com
pany
Nam
e R
elat
ed P
arty
N
atur
e of
Rel
atio
nshi
ps
End
ing
Bal
ance
(F
orei
gn C
urre
ncie
s in
Tho
usan
ds)
Tur
nove
r D
ays
(Not
e 1)
Ove
rdue
A
mou
nts R
ecei
ved
in S
ubse
quen
t Pe
riod
Allo
wan
ce fo
r B
ad D
ebts
A
mou
nt
Act
ion
Tak
en
TS
MC
TS
MC
Nor
th A
mer
ica
Subs
idia
ry
$
86
,675
,335
41
$
5,76
7,08
7 -
$
14
,527
,760
$
-
GU
C
Ass
ocia
te
931,
787
52
593,
265
-
59
3,26
5
-
TSM
C N
orth
A
mer
ica
TSM
C
Pare
nt c
ompa
ny
200,
701
(U
S$
6,23
3)
N
ote
2
-
-
-
-
TSM
C C
hina
TS
MC
Pa
rent
com
pany
1,
775,
774
(R
MB
383,
265)
31
-
-
-
-
TS
MC
Nan
jing
The
sam
e pa
rent
com
pany
4,
190,
708
(R
MB
904,
476)
N
ote
2
-
-
-
-
TSM
C T
echn
olog
y TS
MC
Pa
rent
com
pany
20
9,11
2
(US$
6,
494)
N
ote
2
-
-
-
-
Waf
erTe
ch
TSM
C
The
ultim
ate
pare
nt o
f the
C
ompa
ny
1,30
3,79
5 42
-
-
-
-
(US$
40
,492
)
TS
MC
Dev
elop
men
t Pa
rent
com
pany
17
2,01
5 N
ote
2
-
-
-
-
(U
S$
5,34
2)
N
ote
1:
The
calc
ulat
ion
of tu
rnov
er d
ays e
xclu
des o
ther
rece
ivab
les f
rom
rela
ted
parti
es.
Not
e 2:
Th
e en
ding
bal
ance
is p
rimar
ily c
onsi
sted
of o
ther
rece
ivab
les,
whi
ch is
not
app
licab
le fo
r the
cal
cula
tion
of tu
rnov
er d
ays.
- 185
-
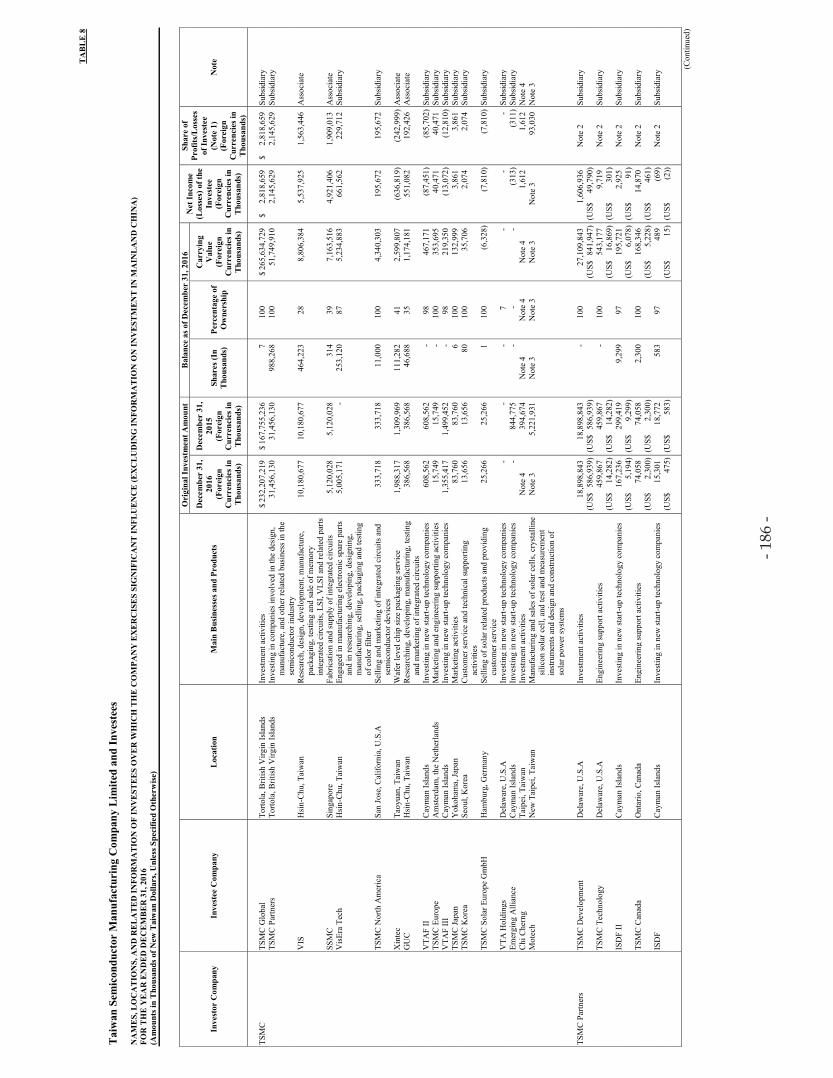
- 186
-
TA
BL
E 8
T
aiw
an S
emic
ondu
ctor
Man
ufac
turi
ng C
ompa
ny L
imite
d an
d In
vest
ees
NA
ME
S, L
OC
AT
ION
S, A
ND
RE
LA
TE
D IN
FOR
MA
TIO
N O
F IN
VE
STE
ES
OV
ER
WH
ICH
TH
E C
OM
PAN
Y E
XE
RC
ISE
S SI
GN
IFIC
AN
T IN
FLU
EN
CE
(EX
CL
UD
ING
INFO
RM
AT
ION
ON
INV
EST
ME
NT
IN M
AIN
LA
ND
CH
INA
) FO
R T
HE
YE
AR
EN
DE
D D
EC
EM
BE
R 3
1, 2
016
(Am
ount
s in
Tho
usan
ds o
f New
Tai
wan
Dol
lars
, Unl
ess S
peci
fied
Oth
erw
ise)
Inve
stor
Com
pany
In
vest
ee C
ompa
ny
Loc
atio
n M
ain
Bus
ines
ses a
nd P
rodu
cts
Ori
gina
l Inv
estm
ent A
mou
nt
Bal
ance
as o
f Dec
embe
r 31
, 201
6 N
et In
com
e (L
osse
s) o
f the
In
vest
ee
(For
eign
C
urre
ncie
s in
Tho
usan
ds)
Shar
e of
Pr
ofits
/Los
ses
of In
vest
ee
(Not
e 1)
(F
orei
gn
Cur
renc
ies i
n T
hous
ands
)
Not
e
Dec
embe
r 31
, 20
16
(For
eign
C
urre
ncie
s in
Tho
usan
ds)
Dec
embe
r 31
,
2015
(F
orei
gn
Cur
renc
ies i
n T
hous
ands
)
Shar
es (I
n T
hous
ands
) Pe
rcen
tage
of
Ow
ners
hip
Car
ryin
g V
alue
(F
orei
gn
Cur
renc
ies i
n T
hous
ands
)
TSM
C
TSM
C G
loba
l To
rtola
, Brit
ish V
irgin
Isla
nds
Inve
stm
ent a
ctiv
ities
$
232
,207
,219
$
167
,755
,236
7 10
0 $
265
,634
,729
$
2,
818,
659
$
2,81
8,65
9 Su
bsid
iary
TSM
C P
artn
ers
Torto
la, B
ritish
Virg
in Is
land
s In
vest
ing
in c
ompa
nies
invo
lved
in th
e de
sign
, m
anuf
actu
re, a
nd o
ther
rela
ted
busi
ness
in th
e se
mic
ondu
ctor
indu
stry
31
,456
,130
31,4
56,1
30
98
8,26
8 10
0
51,7
49,9
10
2,
145,
629
2,
145,
629
Subs
idia
ry
V
IS
Hsi
n-C
hu, T
aiw
an
Res
earc
h, d
esig
n, d
evel
opm
ent,
man
ufac
ture
, pa
ckag
ing,
test
ing
and
sale
of m
emor
y in
tegr
ated
circ
uits
, LSI
, VLS
I and
rela
ted
parts
10
,180
,677
10,1
80,6
77
46
4,22
3 28
8,80
6,38
4
5,53
7,92
5
1,56
3,44
6 A
ssoc
iate
SS
MC
Sing
apor
e Fa
bric
atio
n an
d su
pply
of i
nteg
rate
d ci
rcui
ts
5,
120,
028
5,
120,
028
31
4 39
7,16
3,51
6
4,92
1,40
6
1,90
9,01
3 A
ssoc
iate
Vis
Era
Tech
H
sin-
Chu
, Tai
wan
En
gage
d in
man
ufac
turin
g el
ectro
nic
spar
e pa
rts
and
in re
sear
chin
g, d
evel
opin
g, d
esig
ning
, m
anuf
actu
ring,
selli
ng, p
acka
ging
and
test
ing
of c
olor
filte
r
5,
005,
171
-
25
3,12
0 87
5,23
4,88
3
661,
562
22
9,71
2 Su
bsid
iary
TS
MC
Nor
th A
mer
ica
San
Jose
, Cal
iforn
ia, U
.S.A
Se
lling
and
mar
ketin
g of
inte
grat
ed c
ircui
ts a
nd
sem
icon
duct
or d
evic
es
33
3,71
8
333,
718
11
,000
10
0
4,34
0,30
3
195,
672
19
5,67
2 Su
bsid
iary
X
inte
c Ta
oyua
n, T
aiw
an
Waf
er le
vel c
hip
size
pac
kagi
ng se
rvic
e
1,98
8,31
7
1,30
9,96
9
111,
282
41
2,
599,
807
(6
36,8
19)
(2
42,9
99)
Ass
ocia
te
G
UC
H
sin-
Chu
, Tai
wan
R
esea
rchi
ng, d
evel
opin
g, m
anuf
actu
ring,
test
ing
and
mar
ketin
g of
inte
grat
ed c
ircui
ts
38
6,56
8
386,
568
46
,688
35
1,17
4,18
1
551,
082
19
2,42
6 A
ssoc
iate
V
TAF
II
Cay
man
Isla
nds
Inve
stin
g in
new
star
t-up
tech
nolo
gy c
ompa
nies
608,
562
60
8,56
2
- 98
467,
171
(8
7,45
1)
(8
5,70
2) S
ubsid
iary
TSM
C E
urop
e A
mst
erda
m, t
he N
ethe
rland
s M
arke
ting
and
engi
neer
ing
supp
ortin
g ac
tiviti
es
15
,749
15,7
49
-
100
35
3,69
5
40,4
71
40
,471
Su
bsid
iary
VTA
F II
I C
aym
an Is
land
s In
vest
ing
in n
ew st
art-u
p te
chno
logy
com
pani
es
1,
355,
417
1,
499,
452
-
98
21
9,35
0
(13,
072)
(12,
810)
Sub
sidia
ry
TS
MC
Japa
n Y
okoh
ama,
Japa
n M
arke
ting
activ
ities
83,7
60
83
,760
6 10
0
132,
999
3,
861
3,
861
Subs
idia
ry
TS
MC
Kor
ea
Seou
l, K
orea
C
usto
mer
serv
ice
and
tech
nica
l sup
porti
ng
activ
ities
13,6
56
13
,656
80
100
35
,706
2,07
4
2,07
4 Su
bsid
iary
TS
MC
Sol
ar E
urop
e G
mbH
H
ambu
rg, G
erm
any
Selli
ng o
f sol
ar re
late
d pr
oduc
ts a
nd p
rovi
ding
cu
stom
er se
rvic
e
25,2
66
25
,266
1 10
0
(6,3
28)
(7
,810
)
(7,8
10)
Subs
idia
ry
V
TA H
oldi
ngs
Del
awar
e, U
.S.A
In
vest
ing
in n
ew st
art-u
p te
chno
logy
com
pani
es
-
-
-
7
-
-
- Su
bsid
iary
Emer
ging
Alli
ance
C
aym
an Is
land
s In
vest
ing
in n
ew st
art-u
p te
chno
logy
com
pani
es
-
84
4,77
5
- -
-
(3
13)
(3
11)
Subs
idia
ry
C
hi C
hern
g Ta
ipei
, Tai
wan
In
vest
men
t act
iviti
es
Not
e 4
39
4,67
4 N
ote
4 N
ote
4 N
ote
4
1,61
2
1,61
2 N
ote
4
Mot
ech
New
Tai
pei,
Taiw
an
Man
ufac
turin
g an
d sa
les o
f sol
ar c
ells
, cry
stal
line
silic
on so
lar c
ell,
and
test
and
mea
sure
men
t in
stru
men
ts a
nd d
esig
n an
d co
nstru
ctio
n of
so
lar p
ower
syst
ems
Not
e 3
5,
221,
931
Not
e 3
Not
e 3
Not
e 3
Not
e 3
93
,030
N
ote
3
TSM
C P
artn
ers
TSM
C D
evel
opm
ent
Del
awar
e, U
.S.A
In
vest
men
t act
iviti
es
18
,898
,843
18,8
98,8
43
-
100
27
,109
,843
1,60
6,93
6 N
ote
2 Su
bsid
iary
(U
S$ 5
86,9
39)
(US$
586
,939
)
(US$
841
,947
) (U
S$
49,7
90)
TS
MC
Tec
hnol
ogy
Del
awar
e, U
.S.A
En
gine
erin
g su
ppor
t act
iviti
es
45
9,86
7
459,
867
-
100
54
3,17
7
9,71
9 N
ote
2 Su
bsid
iary
(U
S$
14,2
82)
(US$
14
,282
)
(US$
16
,869
) (U
S$
301)
ISD
F II
Cay
man
Isla
nds
Inve
stin
g in
new
star
t-up
tech
nolo
gy c
ompa
nies
167,
236
29
9,41
9
9,29
9 97
195,
721
2,
925
Not
e 2
Subs
idia
ry
(US$
5,
194)
(U
S$
9,29
9)
(U
S$
6,07
8) (
US$
91
)
TSM
C C
anad
a O
ntar
io, C
anad
a En
gine
erin
g su
ppor
t act
iviti
es
74
,058
74,0
58
2,
300
100
16
8,34
6
14,8
70
Not
e 2
Subs
idia
ry
(US$
2,
300)
(U
S$
2,30
0)
(U
S$
5,22
8) (
US$
46
1)
IS
DF
Cay
man
Isla
nds
Inve
stin
g in
new
star
t-up
tech
nolo
gy c
ompa
nies
15,3
01
18
,772
583
97
48
9
(69)
N
ote
2 Su
bsid
iary
(U
S$
475)
(U
S$
583)
(US$
15
) (U
S$
(2))
(Con
tinue
d)
- 186
-
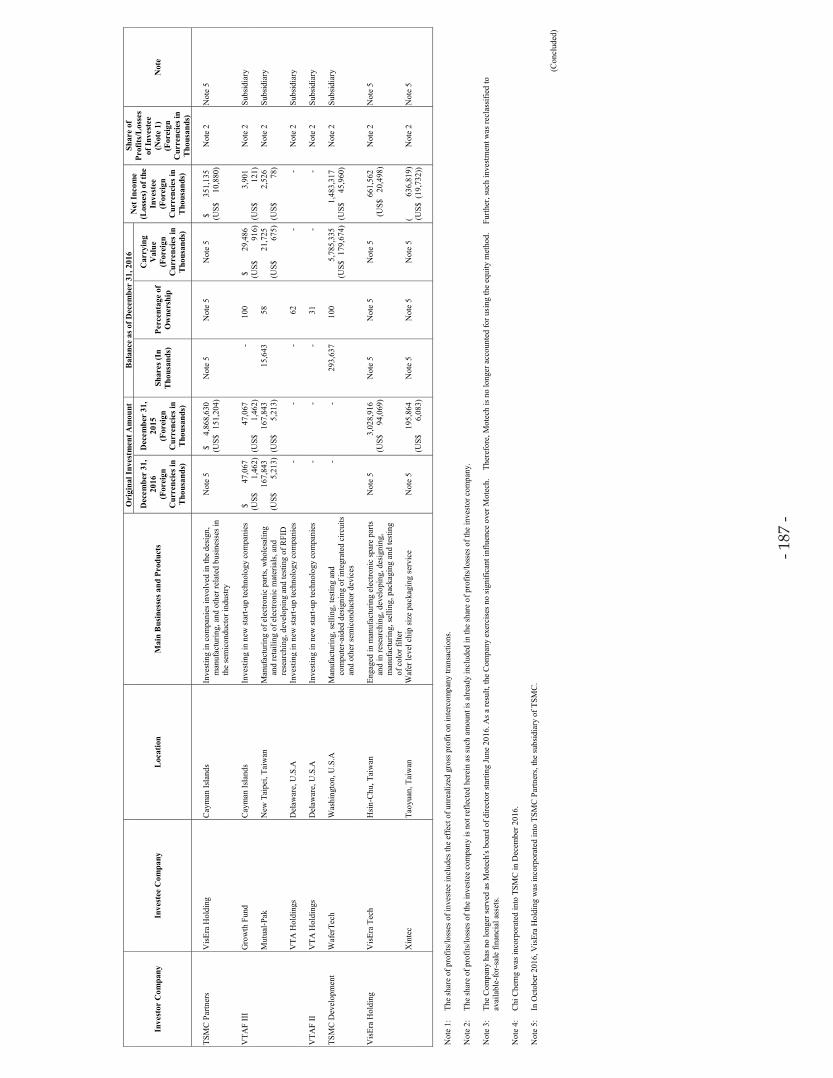
- 187
-
Inve
stor
Com
pany
In
vest
ee C
ompa
ny
Loc
atio
n M
ain
Bus
ines
ses a
nd P
rodu
cts
Ori
gina
l Inv
estm
ent A
mou
nt
Bal
ance
as o
f Dec
embe
r 31
, 201
6 N
et In
com
e (L
osse
s) o
f the
In
vest
ee
(For
eign
C
urre
ncie
s in
Tho
usan
ds)
Shar
e of
Pr
ofits
/Los
ses
of In
vest
ee
(Not
e 1)
(F
orei
gn
Cur
renc
ies i
n T
hous
ands
)
Not
e
Dec
embe
r 31
, 20
16
(For
eign
C
urre
ncie
s in
Tho
usan
ds)
Dec
embe
r 31
,
2015
(F
orei
gn
Cur
renc
ies i
n T
hous
ands
)
Shar
es (I
n T
hous
ands
) Pe
rcen
tage
of
Ow
ners
hip
Car
ryin
g V
alue
(F
orei
gn
Cur
renc
ies i
n T
hous
ands
)
TSM
C P
artn
ers
Vis
Era
Hol
ding
C
aym
an Is
land
s In
vest
ing
in c
ompa
nies
invo
lved
in th
e de
sign
, m
anuf
actu
ring,
and
oth
er re
late
d bu
sine
sses
in
the
sem
icon
duct
or in
dust
ry
Not
e 5
$
4,86
8,63
0 (U
S$ 1
51,2
04)
Not
e 5
Not
e 5
Not
e 5
$
351,
135
(US$
10
,880
) N
ote
2 N
ote
5
V
TAF
III
Gro
wth
Fun
d C
aym
an Is
land
s In
vest
ing
in n
ew st
art-u
p te
chno
logy
com
pani
es
$
47,0
67
47
,067
- 10
0 $
29
,486
3,90
1 N
ote
2 Su
bsid
iary
(U
S$
1,46
2) (
US$
1,
462)
(US$
91
6) (
US$
12
1)
M
utua
l-Pak
N
ew T
aipe
i, Ta
iwan
M
anuf
actu
ring
of e
lect
roni
c pa
rts, w
hole
salin
g an
d re
taili
ng o
f ele
ctro
nic
mat
eria
ls, a
nd
rese
arch
ing,
dev
elop
ing
and
test
ing
of R
FID
16
7,84
3 (U
S$
5,21
3)
167,
843
(US$
5,
213)
15
,643
58
21,7
25
(US$
67
5)
2,52
6 (U
S$
78)
Not
e 2
Subs
idia
ry
V
TA H
oldi
ngs
Del
awar
e, U
.S.A
In
vest
ing
in n
ew st
art-u
p te
chno
logy
com
pani
es
-
-
-
62
-
-
Not
e 2
Subs
idia
ry
V
TAF
II
VTA
Hol
ding
s D
elaw
are,
U.S
.A
Inve
stin
g in
new
star
t-up
tech
nolo
gy c
ompa
nies
-
-
- 31
-
- N
ote
2 Su
bsid
iary
TSM
C D
evel
opm
ent
Waf
erTe
ch
Was
hing
ton,
U.S
.A
Man
ufac
turin
g, se
lling
, tes
ting
and
com
pute
r-ai
ded
desi
gnin
g of
inte
grat
ed c
ircui
ts
and
othe
r sem
icon
duct
or d
evic
es
-
-
29
3,63
7 10
0
5,78
5,33
5 (U
S$ 1
79,6
74)
1,
483,
317
(US$
45
,960
) N
ote
2 Su
bsid
iary
V
isEr
a H
oldi
ng
Vis
Era
Tech
H
sin-
Chu
, Tai
wan
En
gage
d in
man
ufac
turin
g el
ectro
nic
spar
e pa
rts
and
in re
sear
chin
g, d
evel
opin
g, d
esig
ning
, m
anuf
actu
ring,
selli
ng, p
acka
ging
and
test
ing
of c
olor
filte
r
Not
e 5
3,
028,
916
(US$
94
,069
) N
ote
5 N
ote
5 N
ote
5
661,
562
(U
S$
20,4
98)
Not
e 2
Not
e 5
X
inte
c Ta
oyua
n, T
aiw
an
Waf
er le
vel c
hip
size
pac
kagi
ng se
rvic
e N
ote
5
195,
864
Not
e 5
Not
e 5
Not
e 5
( 63
6,81
9)
Not
e 2
Not
e 5
(U
S$
6,08
3)
(US$
(19
,732
))
N
ote
1:
The
shar
e of
pro
fits/
loss
es o
f inv
este
e in
clud
es th
e ef
fect
of u
nrea
lized
gro
ss p
rofit
on
inte
rcom
pany
tran
sact
ions
. N
ote
2:
The
shar
e of
pro
fits/
loss
es o
f the
inve
stee
com
pany
is n
ot re
flect
ed h
erei
n as
such
am
ount
is a
lread
y in
clud
ed in
the
shar
e of
pro
fits/
loss
es o
f the
inve
stor
com
pany
.
Not
e 3:
Th
e C
ompa
ny h
as n
o lo
nger
serv
ed a
s Mot
ech'
s boa
rd o
f dire
ctor
star
ting
June
201
6. A
s a re
sult,
the
Com
pany
exe
rcis
es n
o si
gnifi
cant
influ
ence
ove
r Mot
ech.
Th
eref
ore,
Mot
ech
is n
o lo
nger
acc
ount
ed fo
r usi
ng th
e eq
uity
met
hod.
Fu
rther
, suc
h in
vest
men
t was
recl
assi
fied
to
avai
labl
e-fo
r-sa
le fi
nanc
ial a
sset
s. N
ote
4:
Chi
Che
rng
was
inco
rpor
ated
into
TSM
C in
Dec
embe
r 201
6.
Not
e 5:
In
Oct
ober
201
6, V
isEr
a H
oldi
ng w
as in
corp
orat
ed in
to T
SMC
Par
tner
s, th
e su
bsid
iary
of T
SMC
.
(Con
clud
ed)
- 187
-

- 188
-
TA
BL
E 9
T
aiw
an S
emic
ondu
ctor
Man
ufac
turi
ng C
ompa
ny L
imite
d an
d In
vest
ees
INFO
RM
AT
ION
ON
INV
EST
ME
NT
IN M
AIN
LA
ND
CH
INA
FO
R T
WE
LV
E M
ON
THS
EN
DE
D D
EC
EM
BE
R 3
1, 2
016
(Am
ount
s in
Tho
usan
ds o
f New
Tai
wan
Dol
lars
, Unl
ess S
peci
fied
Oth
erw
ise)
In
vest
ee C
ompa
ny
Mai
n B
usin
esse
s and
Pr
oduc
ts
Tot
al A
mou
nt o
f Pa
id-in
Cap
ital
(R
MB
in
Tho
usan
ds)
Met
hod
of
Inve
stm
ent
Acc
umul
ated
O
utflo
w o
f In
vest
men
t fro
m
Tai
wan
as o
f Ja
nuar
y 1,
201
6 (U
S$ in
T
hous
ands
)
Inve
stm
ent F
low
s A
ccum
ulat
ed
Out
flow
of
Inve
stm
ent f
rom
T
aiw
an a
s of
Dec
embe
r 31
, 20
16 (U
S$ in
T
hous
ands
)
Net
Inco
me
(Los
ses)
of t
he
Inve
stee
C
ompa
ny
Perc
enta
ge o
f O
wne
rshi
p Sh
are
of
Prof
its/L
osse
s
Car
ryin
g A
mou
nt
as o
f
Dec
embe
r 31
, 20
16
Acc
umul
ated
In
war
d R
emitt
ance
of
Ear
ning
s as o
f
Dec
embe
r 31
, 20
16
Out
flow
(U
S$ in
T
hous
ands
) In
flow
TS
MC
Chi
na
Man
ufac
turin
g an
d se
lling
of i
nteg
rate
d ci
rcui
ts a
t the
ord
er o
f an
d pu
rsua
nt to
pr
oduc
t des
ign
spec
ifica
tions
pr
ovid
ed b
y cu
stom
ers
$
18,9
39,6
67
(R
MB
4,50
2,08
0)
Not
e 1
$
18,9
39,6
67
(US$
59
6,00
0)
$
- $
-
$
18,9
39,6
67
(US$
59
6,00
0) $
6,
181,
335
100%
$
6,
094,
460
(Not
e 2)
$
42
,618
,308
$
-
TS
MC
Nan
jing
Man
ufac
turin
g an
d se
lling
of i
nteg
rate
d ci
rcui
ts a
t the
ord
er o
f an
d pu
rsua
nt to
pr
oduc
t des
ign
spec
ifica
tions
pr
ovid
ed b
y cu
stom
ers
6,43
5,20
0 (
RM
B 1,
366,
240)
N
ote
1
-
6,43
5,20
0 (U
S$ 2
00,0
00)
-
6,
435,
200
(US$
20
0,00
0)
939
100%
939
(Not
e 2)
6,33
1,09
4
-
A
ccum
ulat
ed In
vest
men
t in
Mai
nlan
d C
hina
as
of D
ecem
ber
31, 2
016
(US$
in T
hous
ands
)
Inve
stm
ent A
mou
nts A
utho
rize
d by
In
vest
men
t Com
miss
ion,
MO
EA
(U
S$ in
Tho
usan
ds)
Upp
er L
imit
on In
vest
men
t
$
25,3
74,8
67
(U
S$ 7
96,0
00)
$
119
,412
,667
(US$
3,59
6,00
0)
Not
e 3
N
ote
1:
TSM
C d
irect
ly in
vest
ed U
S$59
6,00
0 th
ousa
nd in
TSM
C C
hina
and
US$
200,
000
thou
sand
s in
TSM
C N
anjin
g.
Not
e 2:
A
mou
nt w
as re
cogn
ized
bas
ed o
n th
e au
dite
d fin
anci
al st
atem
ents
. N
ote
3:
As
the
Com
pany
has
obt
aine
d th
e ce
rtific
ate
of b
eing
qua
lifie
d fo
r ope
ratin
g he
adqu
arte
rs is
sued
by
Indu
stria
l Dev
elop
men
t Bur
eau,
MO
EA o
n A
ugus
t 201
6, th
e up
per
limit
on in
vest
men
t in
mai
nlan
d C
hina
pur
suan
t to
“Prin
cipl
e of
In
vest
men
t or T
echn
ical
Coo
pera
tion
in M
ainl
and
Chi
na”
is n
ot a
pplic
able
.
- 188
-

- 189 -
THE CONTENTS OF STATEMENTS OF MAJOR ACCOUNTING ITEMS
ITEM STATEMENT INDEX
MAJOR ACCOUNTING ITEMS IN ASSETS, LIABILITIES AND
EQUITY
STATEMENT OF CASH AND CASH EQUIVALENTS 1 STATEMENT OF NOTES AND ACCOUNTS RECEIVABLE,
NET 2
STATEMENT OF RECEIVABLES FROM RELATED PARTIES
3
STATEMENT OF INVENTORIES 4 STATEMENT OF OTHER CURRENT ASSETS Note 14 STATEMENT OF CHANGES IN INVESTMENTS
ACCOUNTED FOR USING EQUITY METHOD 5
STATEMENT OF CHANGES IN PROPERTY, PLANT AND EQUIPMENT
Note 12
STATEMENT OF CHANGES IN ACCUMULATED DEPRECIATION AND ACCUMULATED IMPAIRMENT OF PROPERTY, PLANT AND EQUIPMENT
Note 12
STATEMENT OF CHANGES IN INTANGIBLE ASSETS Note 13 STATEMENT OF GUARANTEE DEPOSITS Note 19 STATEMENT OF DEFERRED INCOME TAX
ASSETS/LIABILITIES Note 26
STATEMENT OF SHORT-TERM LOANS 6 STATEMENT OF PAYABLES TO RELATED PARTIES 7 STATEMENT OF PAYABLES TO CONTRACTORS AND
EQUIPMENT SUPPLIERS 8
STATEMENT OF PROVISIONS Note 16 STATEMENT OF ACCRUED EXPENSES AND OTHER
CURRENT LIABILITIES 9
STATEMENT OF BONDS PAYABLE 10 MAJOR ACCOUNTING ITEMS IN PROFIT OR LOSS
STATEMENT OF NET REVENUE 11 STATEMENT OF COST OF REVENUE 12 STATEMENT OF OPERATING EXPENSES 13 STATEMENT OF FINANCE COSTS Note 24 STATEMENT OF LABOR, DEPRECIATION AND
AMORTIZATION BY FUNCTION 14
- 189 -

- 190 -
STATEMENT 1
Taiwan Semiconductor Manufacturing Company Limited STATEMENT OF CASH AND CASH EQUIVALENTS DECEMBER 31, 2016 (In Thousands of New Taiwan Dollars, Unless Specified Otherwise)
Item Description Amount
Cash Petty cash $ 330 Cash in banks
Checking accounts and demand deposits 58,649,136 Foreign currency deposits Including US$484,702 thousand @32.199,
JPY36,954,884 thousand @0.2775 and EUR5,746 thousand @34.30
26,058,971
Time deposits From 2016.01.22 to 2017.12.30, interest rates at 0.19%-1.16%, including NT$159,061,551 thousand and US$53,700 thousand @32.199
160,811,637
Cash equivalents Repurchase agreements collateralized by
corporate bonds Expired by 2017.01.13 , interest rates at
0.5%-1.5% 2,361,250
Commercial paper Expired by 2017.03.15 , interest rates at 0.61%-0.62%
1,997,239
Total $ 249,878,563
- 190 -

- 191 -
STATEMENT 2 Taiwan Semiconductor Manufacturing Company Limited STATEMENT OF NOTES AND ACCOUNTS RECEIVABLE, NET DECEMBER 31, 2016 (In Thousands of New Taiwan Dollars)
Client Name Amount Spreadtrum Communications, Inc. $ 9,368,967 MediaTek Inc. 5,097,068 Huawei Technologies Co., Ltd. 3,556,318 Sony Electronics Inc. 3,275,717 NXP Semiconductors N.V. 2,189,935 Analog Devices, Inc. 2,097,785 Others (Note 1) 14,906,937 40,492,727 Less: Allowance for doubtful accounts (475,430)
Total $ 40,017,297 Note 1: The amount of individual client included in others does not exceed 5% of the account balance. Note 2: The accounts receivable past due over one year amounted to NT$35 thousand for which the Company
has recognized appropriate allowance for doubtful accounts.
- 191 -

- 192 -
STATEMENT 3 Taiwan Semiconductor Manufacturing Company Limited STATEMENT OF RECEIVABLES FROM RELATED PARTIES DECEMBER 31, 2016 (In Thousands of New Taiwan Dollars)
Client Name Amount TSMC North America $ 85,874,678 Others (Note) 970,892
Total $ 86,845,570 Note: The amount of individual client included in others does not exceed 5% of the account balance.
- 192 -

- 193 -
STATEMENT 4 Taiwan Semiconductor Manufacturing Company Limited STATEMENT OF INVENTORIES DECEMBER 31, 2016 (In Thousands of New Taiwan Dollars)
Amount
Item
Cost Net Realizable
Value Finished goods $ 8,324,267 $ 22,312,989 Work in process 32,317,210 131,492,618 Raw materials 3,864,429 3,735,628 Supplies and spare parts 1,998,440 2,009,039
Total $ 46,504,346 $ 159,550,274
- 193 -

- 194
-
STA
TE
ME
NT
5
Tai
wan
Sem
icon
duct
or M
anuf
actu
ring
Com
pany
Lim
ited
STA
TE
ME
NT
OF
CH
AN
GE
S IN
INV
EST
ME
NT
S A
CC
OU
NT
ED
FO
R U
SIN
G E
QU
ITY
ME
TH
OD
FO
R T
HE
YE
AR
EN
DE
D D
EC
EMB
ER
31,
201
6 (I
n T
hous
ands
of N
ew T
aiw
an D
olla
rs, U
nles
s Spe
cifie
d O
ther
wis
e)
A
djus
tmen
ts
Adj
ustm
ents
to
A
djus
tmen
ts
R
esul
ting
Incr
ease
Shar
e of
Ari
sing
from
from
the
(Dec
reas
e)
C
hang
es in
Cha
nges
in
T
rans
actio
ns
in U
sing
the
E
quity
of
Pe
rcen
tage
of
w
ith
Bal
ance
, Jan
uary
1, 2
016
A
dditi
ons
D
ecre
ase
E
quity
Met
hod
Su
bsid
iari
es
O
wne
rshi
p in
Subs
idia
ries
Eff
ect o
f Mer
ger
of S
ubsi
diar
y
Bal
ance
, Dec
embe
r 31
, 201
6
Mar
ket V
alue
or
Net
Ass
ets V
alue
Sh
ares
Shar
es
Sh
ares
Am
ount
and
Ass
ocia
tes
Su
bsid
iari
es
an
d A
ssoc
iate
s
Shar
es
Sh
ares
Uni
t Pri
ce
Inve
stee
s
(In
Tho
usan
ds)
A
mou
nt
(I
n T
hous
ands
)
Am
ount
(In
Tho
usan
ds)
A
mou
nt
(N
ote
3)
A
mou
nt
A
mou
nt
A
mou
nt
(I
n T
hous
ands
)
Am
ount
(In
Tho
usan
ds)
%
Am
ount
(NT
$)
T
otal
Am
ount
Col
late
ral
St
ocks
TSM
C G
loba
l
5
$
203
,425
,723
2
$
64
,451
,983
-
$
-
$
(2
,242
,977
)
$
-
$
-
$
-
-
$
-
7
100
$
265
,634
,729
$
265
,634
,729
Nil
TSM
C P
artn
ers
988,
268
50,8
27,3
18
-
-
-
(3
64,2
76 )
1,27
0,90
4
82
2
7,
037
8,10
5
-
-
98
8,26
8
100
51,7
49,9
10
51
,799
,183
Nil
VIS
46
4,22
3
8,
446,
054
-
-
-
-
358,
049
2,28
1
-
-
-
-
46
4,22
3
28
8,80
6,38
4
$ 5
6.2
(Not
e 1)
26,0
89,3
60
N
il SS
MC
31
4
9,
511,
515
-
-
-
-
(2,3
47,9
99 )
-
-
-
-
-
31
4
39
7,16
3,51
6
7,
163,
516
N
il V
isEr
a Te
ch
-
-
253,
120
5,00
5,17
1
-
-
22
9,71
2
-
-
-
-
-
253,
120
87
5,
234,
883
5,23
4,88
3
Nil
TSM
C N
orth
Am
eric
a
11
,000
4,
234,
685
-
-
-
-
105,
618
-
-
-
-
-
11
,000
100
4,34
0,30
3
4,
340,
303
N
il X
inte
c
92
,778
2,
209,
785
18,5
04
678,
348
-
-
(288
,382
)
56
-
-
-
-
11
1,28
2
41
2,59
9,80
7
32
.55
(Not
e 1)
3,62
2,22
7
Nil
GU
C
46,6
88
1,15
2,33
5
-
-
-
-
50
,925
(6
)
-
(29,
073 )
-
-
46,6
88
35
1,
174,
181
78.5
(Not
e 2)
3,66
4,99
7
Nil
TSM
C E
urop
e
-
330,
664
-
-
-
-
23,0
31
-
-
-
-
-
-
10
0
35
3,69
5
353,
695
N
il TS
MC
Japa
n
6
127,
453
-
-
-
-
5,54
6
-
-
-
-
-
6
100
132,
999
13
2,99
9
Nil
TSM
C K
orea
80
35
,231
-
-
-
-
47
5
-
-
-
-
-
80
10
0
35
,706
35,7
06
N
il TS
MC
Sol
ar E
urop
e G
mbH
1
1,18
6
-
-
-
-
(7
,514
)
-
-
-
-
-
1
100
(6,3
28 )
(6,3
28 )
N
il C
hi C
hern
g
36
,600
39
4,36
4
-
-
-
-
1,
612
-
-
-
(3
6,60
0 )
(3
95,9
76 )
-
-
-
-
N
il M
otec
h
58
,320
2,
053,
562
-
-
(58,
320 )
(2,1
55,5
51 )
83,9
21
18,0
68
-
-
-
-
-
-
-
-
N
il Su
btot
al
282,
749,
875
70,1
35,5
02
(2,5
19,8
27 )
(2,7
57,0
79 )
21,2
21
7,03
7
(2
0,96
8 )
(3
95,9
76 )
347,
219,
785
368,
065,
270
C
apita
l
TSM
C C
hina
-
40,2
34,7
42
-
-
-
-
2,35
0,19
3
-
-
33
,373
-
-
-
10
0
42
,618
,308
42,8
50,5
49
N
il TS
MC
Nan
jing
-
-
-
6,
435,
200
-
-
(104
,106
)
-
-
-
-
-
-
100
6,33
1,09
4
6,
331,
094
N
il V
TAF
II
-
55
4,24
0
-
-
-
-
(8
7,06
9 )
-
-
-
-
-
-
98
467,
171
46
7,17
1
Nil
VTA
F II
I
-
385,
834
-
-
-
(1
44,0
35 )
(22,
449 )
-
-
-
-
-
-
98
21
9,35
0
219,
350
N
il V
TA H
oldi
ngs
-
-
-
-
-
-
-
-
-
-
-
-
-
7
-
-
Nil
Emer
ging
Alli
ance
-
440,
901
-
-
-
-
(52,
011 )
-
-
-
-
(388
,890
)
-
-
-
-
Nil
Subt
otal
41
,615
,717
6,
435,
200
(144
,035
)
2,
084,
558
-
-
33,3
73
(388
,890
)
49
,635
,923
49
,868
,164
Tota
l
$
324
,365
,592
$
76,5
70,7
02
$
(2
,663
,862
)
$
(672
,521
)
$
21,2
21
$
7,
037
$
12
,405
$
(7
84,8
66 )
$ 3
96,8
55,7
08
$ 4
17,9
33,4
34
Not
e 1:
Th
e un
it pr
ice
is ca
lcul
ated
by
clos
ing
pric
e of
Gre
Tai
Sec
uriti
es M
arke
t as o
f Dec
embe
r 30,
201
6.
Not
e 2:
Th
e un
it pr
ice
is ca
lcul
ated
by
clos
ing
pric
e of
the
Taiw
an S
tock
Exc
hang
e as
of D
ecem
ber 3
0, 2
016.
N
ote
3:
Incl
udin
g sh
are
of p
rofit
or l
oss o
f sub
sidi
arie
s and
ass
ocia
tes,
shar
e of
oth
er c
ompr
ehen
sive
inco
me
of s
ubsi
diar
ies a
nd a
ssoc
iate
s and
cas
h di
vide
nds r
ecei
ved
from
sub
sidi
arie
s and
ass
ocia
tes.
- 194
-

- 195
-
STA
TE
ME
NT
6
Tai
wan
Sem
icon
duct
or M
anuf
actu
ring
Com
pany
Lim
ited
STA
TE
ME
NT
OF
SHO
RT
-TE
RM
LO
AN
S D
EC
EM
BE
R 3
1, 2
016
(In
Tho
usan
ds o
f New
Tai
wan
Dol
lars
, Unl
ess S
peci
fied
Oth
erw
ise)
Typ
e
Bal
ance
,
End
of Y
ear
C
ontr
act P
erio
d
Ran
ge o
f In
tere
st R
ates
(%)
L
oan
Com
mitm
ents
Col
late
ral
R
emar
k
Uns
ecur
ed lo
ans
Ban
k O
f Am
eric
a
$
8,69
3,73
0
2016
.12.
02-2
017.
01.0
3
0.87
U
S$
300,
000
N
il
- C
itiba
nk T
aipe
i
7,88
8,75
5
2016
.12.
02-2
017.
01.1
3
0.93
-1.0
3
U
S$
484,
000
N
il
- Su
mito
mo
Mits
ui B
anki
ng C
orpo
ratio
n
5,
956,
815
20
16.1
2.16
-201
7.01
.19
1.
03
US$
20
0,00
0
Nil
-
Miz
uho
Ban
k, L
td.
5,79
5,82
0
2016
.12.
14-2
017.
01.1
7
0.98
5
U
S$
200,
000
N
il
- JP
Mor
gan
Cha
se B
ank
N.A
.
5,
795,
820
20
16.1
2.07
-201
7.01
.19
0.
95-1
.02
US$
20
0,00
0
Nil
-
Cré
dit A
gric
ole
CIB
5,
795,
820
20
16.1
2.19
-201
7.01
.19
1.
00
US$
20
0,00
0
Nil
-
The
Ban
k O
f Tok
yo-M
itsub
ishi
UFJ
, Ltd
.
5,
795,
820
20
16.1
2.02
-201
7.01
.03
0.
91
US$
20
0,00
0
Nil
-
Citi
bank
Tai
wan
3,54
1,89
0
2016
.12.
02-2
017.
01.0
3
0.93
U
S$
110,
000
N
il
- St
anda
rd C
harte
red
Ban
k
3,
219,
900
20
16.1
1.23
-201
7.01
.03
0.
88
US$
45
0,00
0
Nil
-
BN
P
2,
253,
930
20
16.1
2.07
-201
7.01
.09
0.
93
US$
75
,000
Nil
-
HSB
C T
aiw
an
1,93
1,94
0
2016
.12.
23-2
017.
01.2
3
1.07
U
S$
70,0
00
N
il
- H
SBC
1,
287,
960
20
16.1
2.23
-201
7.01
.23
1.
07
US$
55
,000
Nil
-
$
57
,958
,200
- 195
-
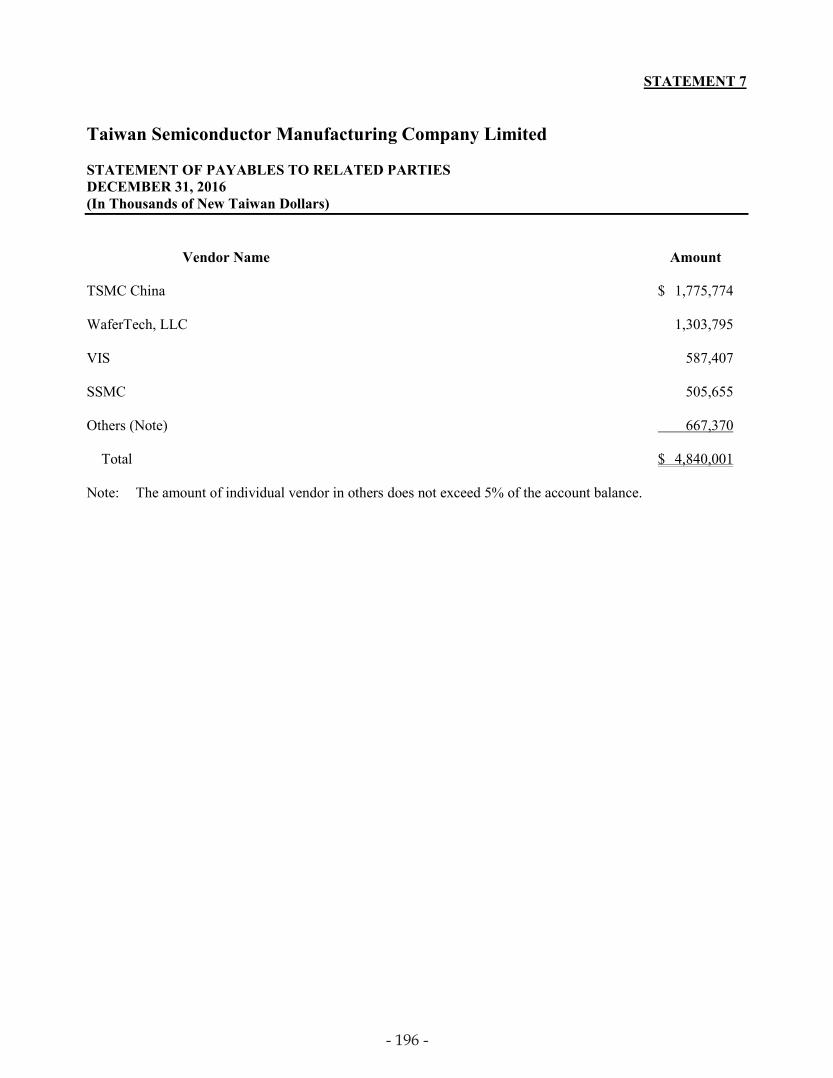
- 196 -
STATEMENT 7 Taiwan Semiconductor Manufacturing Company Limited STATEMENT OF PAYABLES TO RELATED PARTIES DECEMBER 31, 2016 (In Thousands of New Taiwan Dollars)
Vendor Name Amount TSMC China $ 1,775,774 WaferTech, LLC 1,303,795 VIS 587,407 SSMC 505,655 Others (Note) 667,370
Total $ 4,840,001 Note: The amount of individual vendor in others does not exceed 5% of the account balance.
- 196 -

- 197 -
STATEMENT 8 Taiwan Semiconductor Manufacturing Company Limited STATEMENT OF PAYABLES TO CONTRACTORS AND EQUIPMENT SUPPLIERS DECEMBER 31, 2016 (In Thousands of New Taiwan Dollars)
Vendor Name Amount Applied Materials South East Asia Pte Ltd. $ 14,916,260 Lam Research International Sarl 5,256,320 ASML Hong Kong Ltd. 4,859,978 TOKYO Electron Ltd. 4,707,932 Others (Note) 32,708,653
Total $ 62,449,143 Note: The amount of individual vendor included in others does not exceed 5% of the account balance.
- 197 -

- 198 -
STATEMENT 9 Taiwan Semiconductor Manufacturing Company Limited STATEMENT OF ACCRUED EXPENSES AND OTHER CURRENT LIABILITIES DECEMBER 31, 2016 (In Thousands of New Taiwan Dollars)
Item Amount Guarantee deposit $ 6,439,800 Receipts in advance 2,695,412 Utilities 2,043,240 Insurance expense 1,766,864 Research and development expense 1,458,825 Others (Note) 14,216,328
Total $ 28,620,469 Note: The amount of each item in others does not exceed 5% of the account balance.
- 198 -
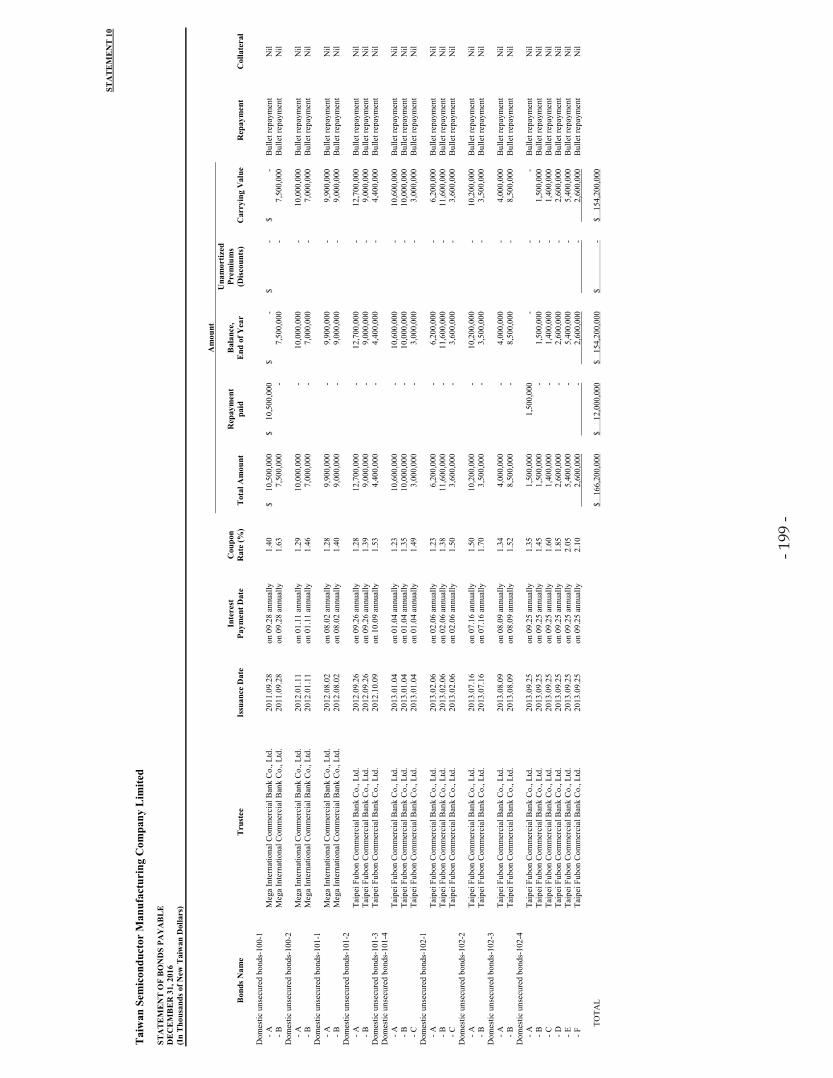
- 199
-
STA
TE
ME
NT
10
Tai
wan
Sem
icon
duct
or M
anuf
actu
ring
Com
pany
Lim
ited
STA
TE
ME
NT
OF
BO
ND
S PA
YA
BL
E
DE
CE
MB
ER
31,
201
6 (I
n T
hous
ands
of N
ew T
aiw
an D
olla
rs)
A
mou
nt
U
nam
ortiz
ed
Inte
rest
Cou
pon
Rep
aym
ent
B
alan
ce,
Prem
ium
s
Bon
ds N
ame
T
rust
ee
Is
suan
ce D
ate
Pa
ymen
t Dat
e
Rat
e (%
)
Tot
al A
mou
nt
pa
id
E
nd o
f Yea
r
(Dis
coun
ts)
C
arry
ing
Val
ue
R
epay
men
t
Col
late
ral
Dom
estic
uns
ecur
ed b
onds
-100
-1
- A
M
ega
Inte
rnat
iona
l Com
mer
cial
Ban
k C
o., L
td.
20
11.0
9.28
on 0
9.28
ann
ually
1.40
$
10,5
00,0
00
$
10
,500
,000
$
-
$
-
$
- B
ulle
t rep
aym
ent
N
il - B
M
ega
Inte
rnat
iona
l Com
mer
cial
Ban
k C
o., L
td.
20
11.0
9.28
on 0
9.28
ann
ually
1.63
7,
500,
000
-
7,
500,
000
-
7,
500,
000
Bul
let r
epay
men
t
Nil
Dom
estic
uns
ecur
ed b
onds
-100
-2
- A
Meg
a In
tern
atio
nal C
omm
erci
al B
ank
Co.
, Ltd
.
2012
.01.
11
on
01.
11 a
nnua
lly
1.
29
10,0
00,0
00
-
10
,000
,000
-
10,0
00,0
00
Bul
let r
epay
men
t
Nil
- B
Meg
a In
tern
atio
nal C
omm
erci
al B
ank
Co.
, Ltd
.
2012
.01.
11
on
01.
11 a
nnua
lly
1.
46
7,00
0,00
0
-
7,00
0,00
0
-
7,00
0,00
0 B
ulle
t rep
aym
ent
N
il D
omes
tic u
nsec
ured
bon
ds-1
01-1
- A
Meg
a In
tern
atio
nal C
omm
erci
al B
ank
Co.
, Ltd
.
2012
.08.
02
on
08.
02 a
nnua
lly
1.
28
9,90
0,00
0
-
9,90
0,00
0
-
9,90
0,00
0 B
ulle
t rep
aym
ent
N
il - B
M
ega
Inte
rnat
iona
l Com
mer
cial
Ban
k C
o., L
td.
20
12.0
8.02
on 0
8.02
ann
ually
1.40
9,
000,
000
-
9,
000,
000
-
9,
000,
000
Bul
let r
epay
men
t
Nil
Dom
estic
uns
ecur
ed b
onds
-101
-2
- A
T
aipe
i Fub
on C
omm
erci
al B
ank
Co.
, Ltd
.
2012
.09.
26
on
09.
26 a
nnua
lly
1.
28
12,7
00,0
00
-
12
,700
,000
-
12,7
00,0
00
Bul
let r
epay
men
t
Nil
- B
Tai
pei F
ubon
Com
mer
cial
Ban
k C
o., L
td.
20
12.0
9.26
on 0
9.26
ann
ually
1.39
9,
000,
000
-
9,
000,
000
-
9,
000,
000
Bul
let r
epay
men
t
Nil
Dom
estic
uns
ecur
ed b
onds
-101
-3
Tai
pei F
ubon
Com
mer
cial
Ban
k C
o., L
td.
20
12.1
0.09
on 1
0.09
ann
ually
1.53
4,
400,
000
-
4,
400,
000
-
4,
400,
000
Bul
let r
epay
men
t
Nil
Dom
estic
uns
ecur
ed b
onds
-101
-4
- A
Tai
pei F
ubon
Com
mer
cial
Ban
k C
o., L
td.
20
13.0
1.04
on 0
1.04
ann
ually
1.23
10
,600
,000
-
10,6
00,0
00
-
10
,600
,000
B
ulle
t rep
aym
ent
N
il - B
T
aipe
i Fub
on C
omm
erci
al B
ank
Co.
, Ltd
.
2013
.01.
04
on
01.
04 a
nnua
lly
1.
35
10,0
00,0
00
-
10
,000
,000
-
10,0
00,0
00
Bul
let r
epay
men
t
Nil
- C
Tai
pei F
ubon
Com
mer
cial
Ban
k C
o., L
td.
20
13.0
1.04
on 0
1.04
ann
ually
1.49
3,
000,
000
-
3,
000,
000
-
3,
000,
000
Bul
let r
epay
men
t
Nil
Dom
estic
uns
ecur
ed b
onds
-102
-1
- A
T
aipe
i Fub
on C
omm
erci
al B
ank
Co.
, Ltd
.
2013
.02.
06
on
02.
06 a
nnua
lly
1.
23
6,20
0,00
0
-
6,20
0,00
0
-
6,20
0,00
0 B
ulle
t rep
aym
ent
N
il - B
T
aipe
i Fub
on C
omm
erci
al B
ank
Co.
, Ltd
.
2013
.02.
06
on
02.
06 a
nnua
lly
1.
38
11,6
00,0
00
-
11
,600
,000
-
11,6
00,0
00
Bul
let r
epay
men
t
Nil
- C
Tai
pei F
ubon
Com
mer
cial
Ban
k C
o., L
td.
20
13.0
2.06
on 0
2.06
ann
ually
1.50
3,
600,
000
-
3,
600,
000
-
3,
600,
000
Bul
let r
epay
men
t
Nil
Dom
estic
uns
ecur
ed b
onds
-102
-2
- A
T
aipe
i Fub
on C
omm
erci
al B
ank
Co.
, Ltd
.
2013
.07.
16
on
07.
16 a
nnua
lly
1.
50
10,2
00,0
00
-
10
,200
,000
-
10,2
00,0
00
Bul
let r
epay
men
t
Nil
- B
Tai
pei F
ubon
Com
mer
cial
Ban
k C
o., L
td.
20
13.0
7.16
on 0
7.16
ann
ually
1.70
3,
500,
000
-
3,
500,
000
-
3,
500,
000
Bul
let r
epay
men
t
Nil
Dom
estic
uns
ecur
ed b
onds
-102
-3
- A
T
aipe
i Fub
on C
omm
erci
al B
ank
Co.
, Ltd
.
2013
.08.
09
on
08.
09 a
nnua
lly
1.
34
4,00
0,00
0
-
4,00
0,00
0
-
4,00
0,00
0 B
ulle
t rep
aym
ent
N
il - B
T
aipe
i Fub
on C
omm
erci
al B
ank
Co.
, Ltd
.
2013
.08.
09
on
08.
09 a
nnua
lly
1.
52
8,50
0,00
0
-
8,50
0,00
0
-
8,50
0,00
0 B
ulle
t rep
aym
ent
N
il D
omes
tic u
nsec
ured
bon
ds-1
02-4
- A
Tai
pei F
ubon
Com
mer
cial
Ban
k C
o., L
td.
20
13.0
9.25
on 0
9.25
ann
ually
1.35
1,
500,
000
1,50
0,00
0
-
-
-
Bul
let r
epay
men
t
Nil
- B
Tai
pei F
ubon
Com
mer
cial
Ban
k C
o., L
td.
20
13.0
9.25
on 0
9.25
ann
ually
1.45
1,
500,
000
-
1,
500,
000
-
1,
500,
000
Bul
let r
epay
men
t
Nil
- C
Tai
pei F
ubon
Com
mer
cial
Ban
k C
o., L
td.
20
13.0
9.25
on 0
9.25
ann
ually
1.60
1,
400,
000
-
1,
400,
000
-
1,
400,
000
Bul
let r
epay
men
t
Nil
- D
Tai
pei F
ubon
Com
mer
cial
Ban
k C
o., L
td.
20
13.0
9.25
on 0
9.25
ann
ually
1.85
2,
600,
000
-
2,
600,
000
-
2,
600,
000
Bul
let r
epay
men
t
Nil
- E
Tai
pei F
ubon
Com
mer
cial
Ban
k C
o., L
td.
20
13.0
9.25
on 0
9.25
ann
ually
2.05
5,
400,
000
-
5,
400,
000
-
5,
400,
000
Bul
let r
epay
men
t
Nil
- F
Tai
pei F
ubon
Com
mer
cial
Ban
k C
o., L
td.
20
13.0
9.25
on 0
9.25
ann
ually
2.10
2,
600,
000
-
2,
600,
000
-
2,
600,
000
Bul
let r
epay
men
t
Nil
TO
TAL
$
166,
200,
000
$
12
,000
,000
$
154,
200,
000
$
-
$
15
4,20
0,00
0
- 199
-

- 200 -
STATEMENT 11 Taiwan Semiconductor Manufacturing Company Limited STATEMENT OF NET REVENUE FOR THE YEAR ENDED DECEMBER 31, 2016 (In Thousands of New Taiwan Dollars, Unless Specified Otherwise)
Item Shipments
(Piece) (Note) Amount Wafer 9,604,226 $ 897,955,740 Other 38,431,551 Net revenue $ 936,387,291 Note: 12-inch equivalent wafers.
- 200 -

- 201 -
STATEMENT 12 Taiwan Semiconductor Manufacturing Company Limited STATEMENT OF COST OF REVENUE FOR THE YEAR ENDED DECEMBER 31, 2016 (In Thousands of New Taiwan Dollars)
Item Amount Raw materials used
Balance, beginning of year $ 2,813,029 Raw material purchased 32,811,307 Raw materials, end of year (3,864,429) Transferred to manufacturing or operating expenses (6,984,906) Others (22,648)
Subtotal 24,752,353 Direct labor 13,355,882 Manufacturing expenses 392,240,592 Manufacturing cost 430,348,827 Work in process, beginning of year 52,251,863 Work in process, end of year (32,317,210) Transferred to manufacturing or operating expenses (7,557,644) Cost of finished goods 442,725,836 Finished goods, beginning of year 7,733,331 Finished goods purchased 37,927,662 Finished goods, end of year (8,324,267) Transferred to manufacturing or operating expenses (8,020,109) Scrapped (153,660)
Subtotal 471,888,793 Others 2,664,120
Total $ 474,552,913
- 201 -

- 202 -
STATEMENT 13 Taiwan Semiconductor Manufacturing Company Limited STATEMENT OF OPERATING EXPENSES FOR THE YEAR ENDED DECEMBER 31, 2016 (In Thousands of New Taiwan Dollars)
Item
Research and Development
Expenses
General and Administrative
Expenses Selling
Expenses Payroll and related expense $ 25,585,675 $ 7,075,633 $ 2,038,528 Depreciation expense 15,515,812 830,609 10,703 Consumables 15,161,280 261,522 4,779 Repair and maintenance expense 2,475,463 1,149,395 362 Moving expense 277,529 1,462,185 1,771 Patents - 1,775,446 - Management fees of the Science Park Administration - 1,685,164 - Commission - - 873,088 Others (Note) 11,350,420 4,457,509 168,855
Total $ 70,366,179 $ 18,697,463 $ 3,098,086 Note: The amount of each item in others does not exceed 5% of the account balance.
- 202 -

- 203
-
STA
TE
ME
NT
14
Tai
wan
Sem
icon
duct
or M
anuf
actu
ring
Com
pany
Lim
ited
STA
TE
ME
NT
OF
LA
BO
R, D
EPR
EC
IAT
ION
AN
D A
MO
RT
IZA
TIO
N B
Y F
UN
CT
ION
FO
R T
HE
YE
AR
EN
DE
D D
EC
EM
BE
R 3
1, 2
016
AN
D 2
015
(In
Tho
usan
ds o
f New
Tai
wan
Dol
lars
, Unl
ess S
peci
fied
Oth
erw
ise)
Y
ear
End
ed D
ecem
ber
31, 2
016
Y
ear
End
ed D
ecem
ber
31, 2
015
C
lass
ified
as
C
lass
ified
as
O
ther
Oth
er
C
lass
ified
as
O
pera
ting
C
lass
ified
as
O
pera
ting
C
lass
ified
as
O
pera
ting
In
com
e
C
lass
ified
as
O
pera
ting
In
com
e
Cos
t of R
even
ue
Exp
ense
s
and
Exp
ense
s
Tot
al
Cos
t of R
even
ue
Exp
ense
s
and
Exp
ense
s
Tot
al
Labo
r cos
t (N
ote)
Sala
ry a
nd b
onus
$
47
,718
,885
$
32,0
54,8
21
$
-
$
79
,773
,706
$
43,2
17,0
80
$
30
,018
,535
$
-
$
73,2
35,6
15
Labo
r and
hea
lth in
sura
nce
2,
393,
838
1,42
5,65
3
-
3,81
9,49
1
2,
305,
905
1,42
9,35
5
-
3,73
5,26
0 Pe
nsio
n
1,30
5,08
3
70
2,55
0
-
2,00
7,63
3
1,
230,
033
686,
312
-
1,
916,
345
Oth
ers
1,
692,
141
847,
878
-
2,
540,
019
1,49
3,77
1
78
9,65
7
-
2,28
3,42
8
$
53,1
09,9
47
$
35
,030
,902
$
-
$
88,1
40,8
49
$
48
,246
,789
$
32,9
23,8
59
$
-
$
81
,170
,648
D
epre
ciat
ion
$ 1
97,5
95,3
13
$
16
,357
,124
$
24,8
87
$
213
,977
,324
$ 1
98,3
43,7
42
$
14
,925
,181
$
24,8
87
$
213
,293
,810
A
mor
tizat
ion
$
2,01
4,81
4
$
1,70
9,25
2
$
-
$
3,72
4,06
6
$
1,60
5,57
2
$
1,55
3,86
5
$
-
$
3,15
9,43
7 N
ote:
A
s of D
ecem
ber 3
1, 2
016
and
2015
, the
Com
pany
had
41,
850
and
40,1
52 e
mpl
oyee
s, re
spec
tivel
y.
- 203
-