Embed Size (px)
Citation preview
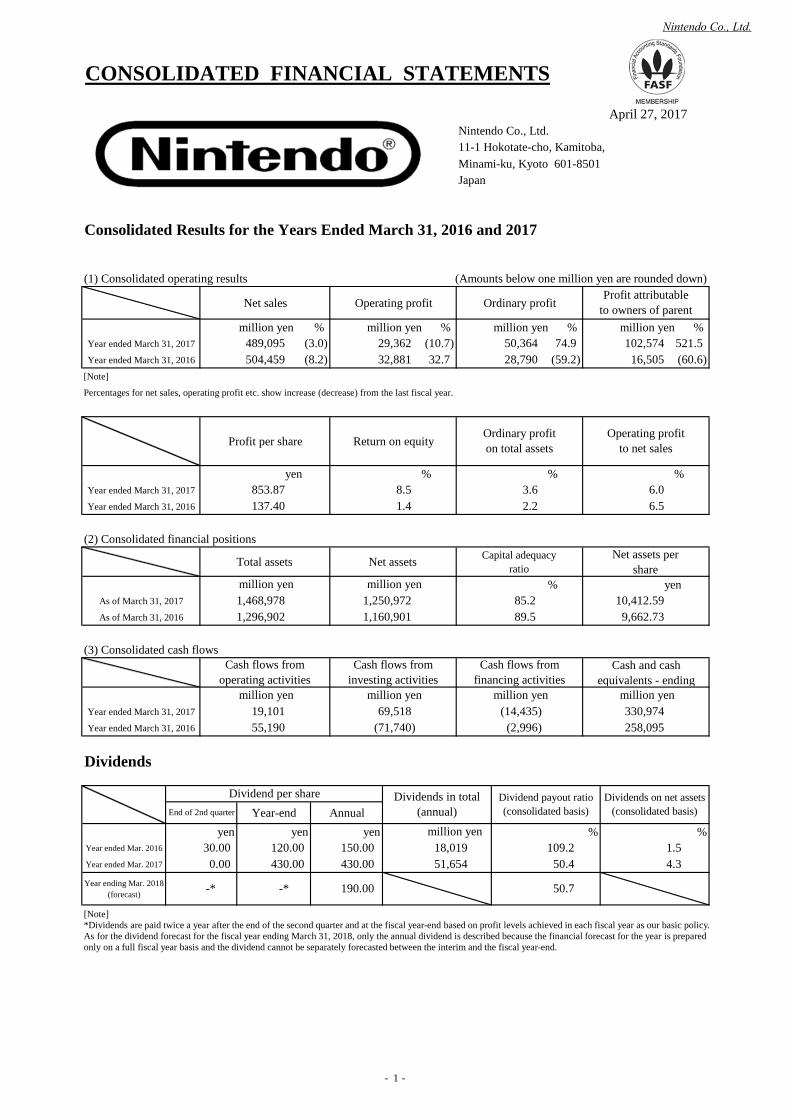
CONSOLIDATED FINANCIAL STATEMENTS
April 27, 2017Nintendo Co., Ltd. 11-1 Hokotate-cho, Kamitoba,Minami-ku, Kyoto 601-8501Japan
Consolidated Results for the Years Ended March 31, 2016 and 2017
(1) Consolidated operating results (Amounts below one million yen are rounded down)
Net sales Operating profit Ordinary profit
million yen % million yen % million yen % million yen % Year ended March 31, 2017
Year ended March 31, 2016
[Note]
Percentages for net sales, operating profit etc. show increase (decrease) from the last fiscal year.
Profit per share Return on equity
yen % % % Year ended March 31, 2017
Year ended March 31, 2016
(2) Consolidated financial positions
Total assets Net assets Capital adequacyratio
Net assets pershare
% yen As of March 31, 2017
As of March 31, 2016
(3) Consolidated cash flowsCash and cash
equivalents - ending
Year ended March 31, 2017
Year ended March 31, 2016
Dividends
Year-end Annualyen yen yen % %
Year ended Mar. 2016
Year ended Mar. 2017
Year ending Mar. 2018(forecast)
million yen
51,65418,019
69,518
1,296,902
-*
Dividend per share
150.00
(3.0)
Cash flows fromoperating activities
(8.2)504,459
853.87137.40
1,468,978million yen
1,160,901
55,190
million yen million yen
million yen1,250,972
End of 2nd quarter
430.00 430.00120.0030.00
Operating profitto net sales
6.06.5
Cash flows fromfinancing activities
10,412.5985.2
Ordinary profiton total assets
89.5 9,662.73
19,101
-* 190.00
0.00
(14,435)(2,996)
16,505
1.4
million yen
32,881(10.7)29,36232.7
Dividends in total(annual)
Dividend payout ratio(consolidated basis)
Dividends on net assets(consolidated basis)
8.5
50,36428,790
521.5(60.6)
102,574
4.3
million yen
258,095330,974
489,095
Cash flows frominvesting activities
(71,740)
50.4
50.7
Profit attributableto owners of parent
109.2 1.5
74.9(59.2)
3.62.2
[Note]*Dividends are paid twice a year after the end of the second quarter and at the fiscal year-end based on profit levels achieved in each fiscal year as our basic policy.As for the dividend forecast for the fiscal year ending March 31, 2018, only the annual dividend is described because the financial forecast for the year is preparedonly on a full fiscal year basis and the dividend cannot be separately forecasted between the interim and the fiscal year-end.
Nintendo Co., Ltd.
- 1 -
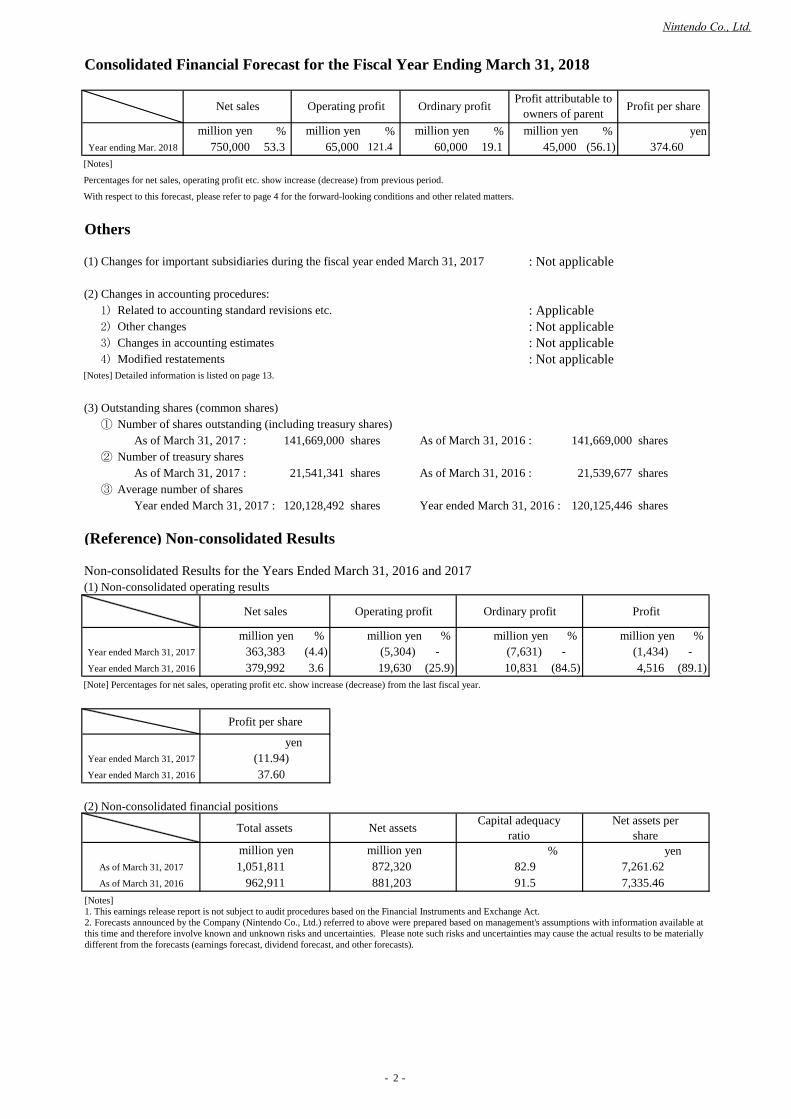
Consolidated Financial Forecast for the Fiscal Year Ending March 31, 2018
% % % % yenYear ending Mar. 2018
[Notes]
Percentages for net sales, operating profit etc. show increase (decrease) from previous period.
With respect to this forecast, please refer to page 4 for the forward-looking conditions and other related matters.
Others
(1) Changes for important subsidiaries during the fiscal year ended March 31, 2017 : Not applicable
(2) Changes in accounting procedures:1) Related to accounting standard revisions etc. : Applicable2) Other changes : Not applicable3) Changes in accounting estimates : Not applicable4) Modified restatements : Not applicable
[Notes] Detailed information is listed on page 13.
(3) Outstanding shares (common shares)① Number of shares outstanding (including treasury shares)
As of March 31, 2017 : 141,669,000 shares As of March 31, 2016 : 141,669,000 shares② Number of treasury shares
As of March 31, 2017 : 21,541,341 shares As of March 31, 2016 : 21,539,677 shares③ Average number of shares
Year ended March 31, 2017 : 120,128,492 shares Year ended March 31, 2016 : 120,125,446 shares
(Reference) Non-consolidated Results
Non-consolidated Results for the Years Ended March 31, 2016 and 2017(1) Non-consolidated operating results
Net sales Operating profit Ordinary profit Profit
million yen % million yen % million yen % million yen % Year ended March 31, 2017
Year ended March 31, 2016
[Note] Percentages for net sales, operating profit etc. show increase (decrease) from the last fiscal year.
Profit per share
yen Year ended March 31, 2017
Year ended March 31, 2016
(2) Non-consolidated financial positions
Total assets Net assets Capital adequacyratio
Net assets pershare
% yen As of March 31, 2017
As of March 31, 2016
60,000 45,000
-
121.4
37.60(11.94)
379,992
750,000
363,383
53.3 65,000
Ordinary profitNet sales
3.6 (25.9)19,630(7,631)(4.4)
Operating profit
million yen
(5,304)
1,051,811962,911
872,320881,203
million yen million yen82.9 91.5
million yen
Profit per share
(56.1)
-
374.60
(89.1)
19.1
-
7,335.467,261.62
million yen million yen
(84.5)
Profit attributable toowners of parent
4,51610,831(1,434)
[Notes]1. This earnings release report is not subject to audit procedures based on the Financial Instruments and Exchange Act.2. Forecasts announced by the Company (Nintendo Co., Ltd.) referred to above were prepared based on management's assumptions with information available atthis time and therefore involve known and unknown risks and uncertainties. Please note such risks and uncertainties may cause the actual results to be materiallydifferent from the forecasts (earnings forecast, dividend forecast, and other forecasts).
Nintendo Co., Ltd.
- 2 -
Description of Operating Results
1. Operating Results and Financial Positions for the Fiscal Year Ended March 31, 2017
Net cash provided by (used in) operating activities:
Net cash provided by (used in) investing activities:
Net cash provided by (used in) financing activities:
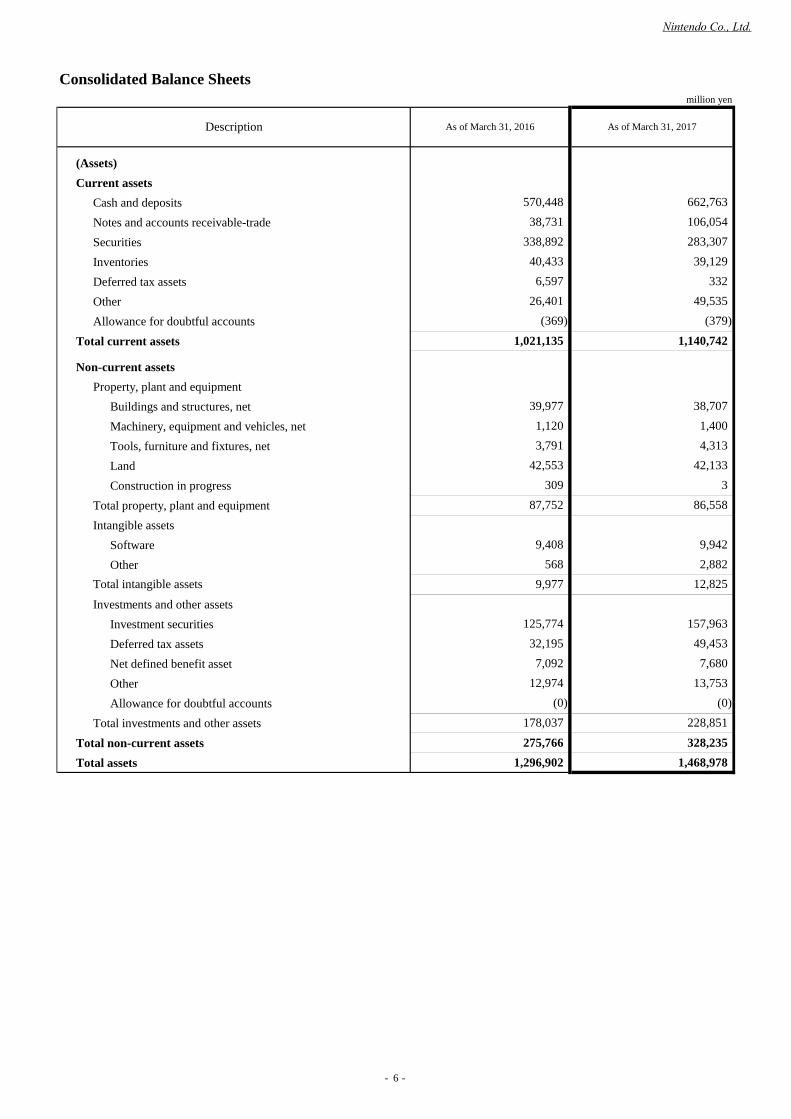
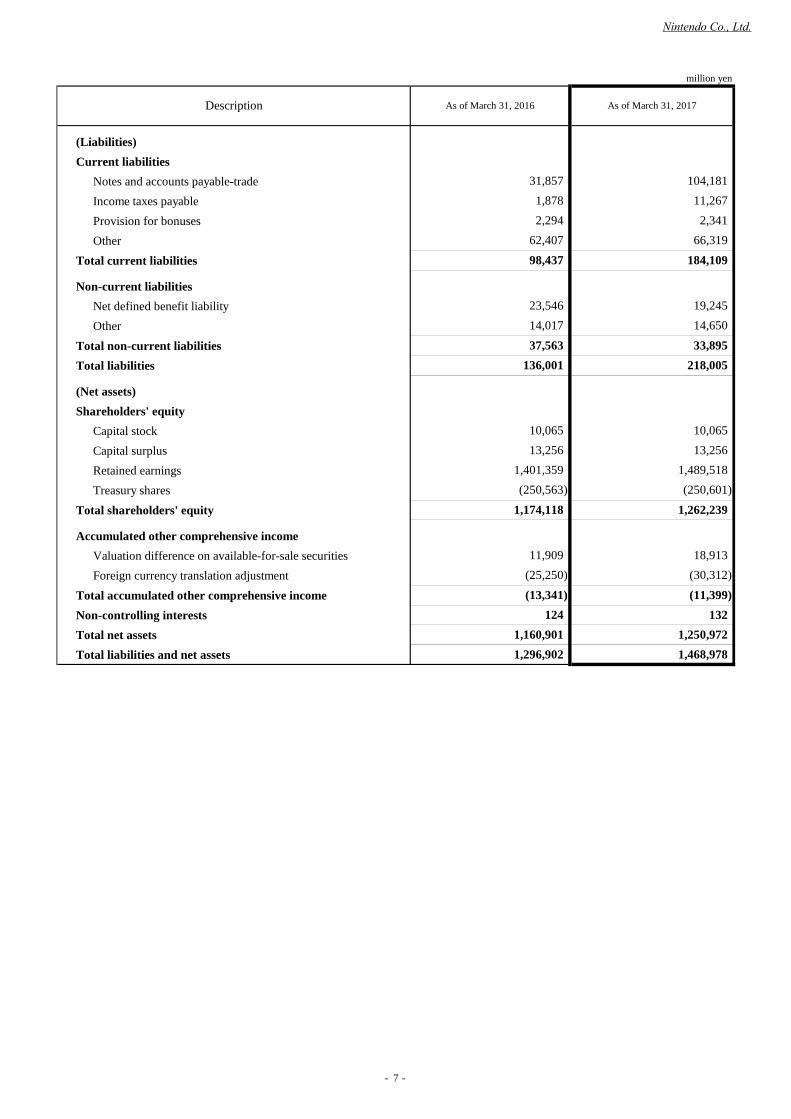
(2) Financial positions as of March 31, 2017Total assets increased by 172.0 billion yen compared to the prior fiscal year-end to 1,468.9 billion yen mainly due to an increase in
cash and deposits as well as notes and accounts receivable-trade. Total liabilities increased by 82.0 billion yen compared to the priorfiscal year-end to 218.0 billion yen mainly due to an increase in notes and accounts payable-trade. Net assets increased by 90.0 billionyen compared to the prior fiscal year-end to 1,250.9 billion yen.
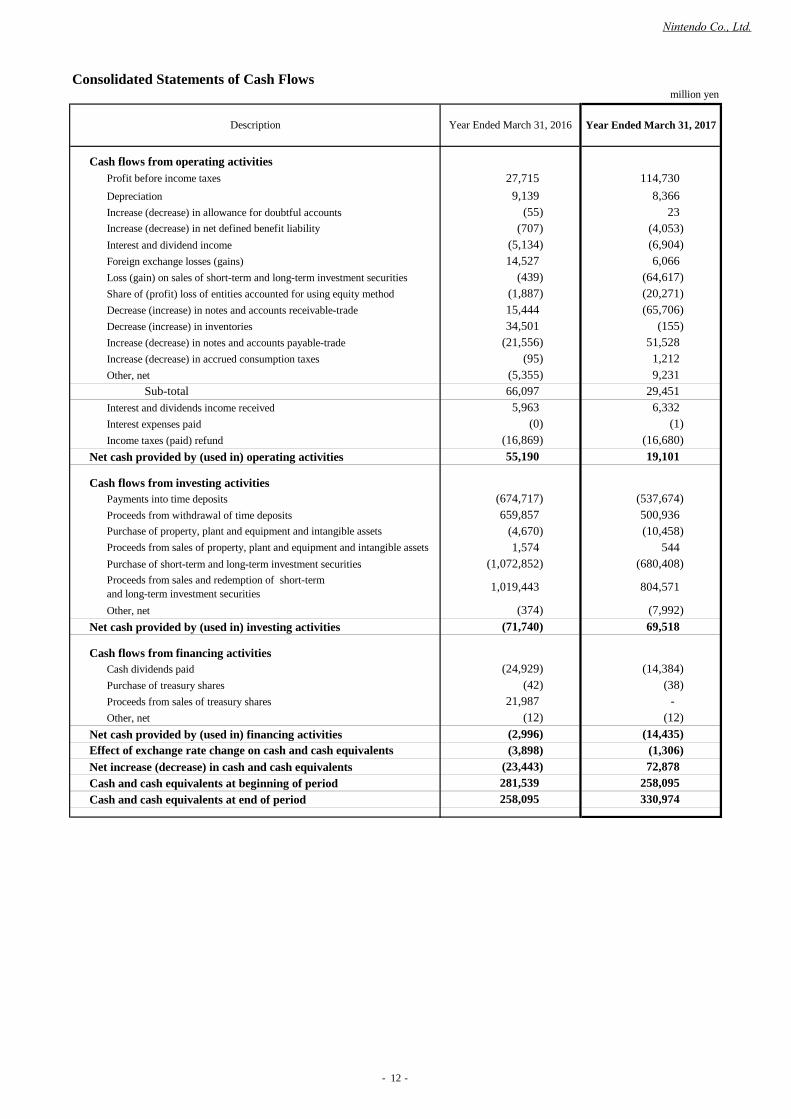
(3) Cash flows for the fiscal year ended March 31, 2017The ending balance of “Cash and cash equivalents” (collectively, “Cash”) as of March 31, 2017 was 330.9 billion yen, with an
increase of 72.8 billion yen during the fiscal year. During the prior fiscal year, there was a decrease of 23.4 billion yen. Net increase(decrease) of Cash and contributing factors during the fiscal year ended March 31, 2017 are as follows:
There were decreasing factors contributing to 114.7 billion yen of profit before income taxes such as a record of gain on sales ofshort-term and long-term investment securities and an increase in notes and accounts receivable - trade. However, due to increasingfactors such as an increase in notes and accounts payable - trade, net cash resulted in an increase of 19.1 billion yen compared to anincrease of 55.1 billion yen during the prior year.
Net cash from investing activities increased by 69.5 billion yen compared to a decrease of 71.7 billion yen during the prior yearmainly due to proceeds from withdrawal of time deposits and sales and redemption of short-term and long-term investment securitiesexceeding payments into time deposits and purchase of short-term and long-term investment securities.
Net cash from financing activities decreased by 14.4 billion yen compared to a decrease of 2.9 billion yen during the prior yearmainly due to payments of cash dividends.
(1) Operating results for the fiscal year ended March 31, 2017Nintendo Switch, a new home console system that diversifies the ways you can play games, launched during this period on March 3
worldwide and is off to a promising start. In particular, The Legend of Zelda: Breath of the Wild has won immense popularity withrecorded sales of 2.76 million units (the total units sold including the Wii U version is 3.84 million units) and 1-2-Switch has beengenerating buzz. Both of these games were released at the same time as the hardware. The sales volume for hardware and softwareduring this period reached 2.74 million units and 5.46 million units respectively.
Sales volume for the Nintendo 3DS software also grew favorably. In addition to Pokémon Sun and Pokémon Moon, which releasedworldwide in November and generated a tremendous amount of buzz with recorded sales of 15.44 million units, Super Mario Maker forNintendo 3DS sold 2.34 million units and Kirby: Planet Robobot sold 1.36 million units. The release of the smart device applicationPokémon GO led to increased sales of software in the Pokémon series and drove the Nintendo 3DS family hardware sales growthoutside of Japan. The worldwide sales volume for the Nintendo 3DS hardware this period was 7.27 million units (7% increase on ayear-on-year basis), while the Nintendo 3DS software sales volume reached 55.08 million units (14% increase on a year-on-year basis).
For Wii U, while The Legend of Zelda: Breath of the Wild released worldwide in March and reached sales of 1.08 million units, theWii U software sales volume during this period was 14.8 million units (46% decrease on a year-on-year basis) and hardware sales werein alignment with our expectations at the start of the fiscal year, decreasing to a sales volume of 760 thousand units (77% decrease on ayear-on-year basis).
On the smart device front, we released Super Mario Run, a new action game application featuring Mario, in December for the iOSand March for the Android. This title elicited a fantastic response from consumers worldwide. Furthermore, we released Fire EmblemHeroes, a full-fledged simulation RPG game application that can be enjoyed casually on smart devices, in February. The game is beingenjoyed by both long-time fans of the Fire Emblem series and consumers who have never played the series on dedicated video gamesystems.
The Nintendo Entertainment System: NES Classic Edition also launched in Japan and overseas in November to widespreadpopularity. Although the release of some new titles offering amiibo functionality restored some momentum, amiibo sales remainedlimited to 9.1 million units for figure-type and 9.3 million units for card-type. In addition, there were relatively fewer offerings ofdownloadable content during this period, so digital sales were also down to a large extent on the same period last year.
These factors resulted in an operating profit of 29.3 billion yen against net sales of 489.0 billion yen (of which 359.0 billion yen, or73.4% of the total sales, were overseas sales). We have also included 20.2 billion yen share of profit of entities accounted for using theequity method related to The Pokémon Company and other investments, resulting in an ordinary profit of 50.3 billion yen. In addition,due to the sale of part of our equity in the company that manages the Seattle Mariners Major League Baseball team, we recorded gainon sales of investment securities totaling 64.5 billion yen as extraordinary income, meaning that the profit attributable to owners ofparent was 102.5 billion yen.
Nintendo Co., Ltd.
- 3 -
2. Outlook for the Fiscal Year Ending March 31, 2018
3. Basic Policy of Profit Distribution and Dividends
It is the Company’s basic policy to internally provide the capital necessary to fund future growth, including capital investments, andto maintain a strong and liquid financial position in preparation for changes in the business environment and intensified competition. Asfor direct profit returns to our shareholders, dividends are paid based on profit levels achieved in each fiscal period.
The annual dividend per share will be established at the higher of the amount calculated by dividing 33% of consolidated operatingprofit by the total number of outstanding shares, excluding treasury shares, as of the end of the fiscal year rounded up to the 10 yen digit,and the amount calculated based on the 50% consolidated profit standard rounded up to the 10 yen digit.
The end of 2nd quarter (interim) dividend per share is calculated by dividing 33% of consolidated operating profit by the total numberof outstanding shares, excluding treasury shares, as of the end of the six-month period rounded up to the 10 yen digit.
As a result, the dividend for the fiscal year ended March 31, 2017 has been established at 430 yen (interim: no dividend, year-end:430 yen) and dividend for fiscal year ending March 31, 2018 will be 190 yen if earnings are in line with the financial forecast herein.The end of 2nd quarter dividends are yet to be determined as there are no interim financial forecasts, but there are no changes to ourdividend policy.
Retained earnings are maintained for effective use in research of new technology and development of new products and services,capital investments and securing materials, enhancement of selling power including advertisements, strengthening of networkinfrastructure, and treasury share buyback whenever deemed appropriate.
[Note] Forecasts announced by the Company referred to above were prepared based on management's assumptions with informationavailable at this time and therefore involve known and unknown risks and uncertainties. Please note such risks and uncertainties maycause the actual results to be materially different from the forecasts (earnings forecast, dividend forecast and other forecasts).
Regarding Nintendo Switch, we will maintain buzz about The Legend of Zelda: Breath of the Wild and 1-2-Switch, which are off to aphenomenal start, and release Mario Kart 8 Deluxe in April and ARMS in June worldwide. We will release Splatoon 2 in July. Splatoon2 exemplifies the concept of Nintendo Switch, enabling consumers to play anywhere, anytime, and with anyone, and will bringcompetition between consumers to new levels of excitement. In addition, we will maintain favorable conditions surrounding NintendoSwitch by providing a continuous stream of appealing third-party titles across varying genres. We aim to stimulate the platform andexpand sales going into the holiday season this year.
Total sales volume for the Nintendo 3DS hardware worldwide has surpassed 66 million units and it has developed into a platform thatwe can rely on for software sales.
We will release Fire Emblem Echoes: Shadows of Valentia overseas in May (April in Japan) and plan to release Ever Oasis and Hey!Pikmin in June and July. Furthermore, this year is Kirby’s 25th anniversary, so we are planning to release downloadable titles and anew multiplayer action game for Nintendo 3DS. Third-party developers have also announced major titles for Nintendo 3DS. Duringthis period we will continue striving to maintain the momentum of the platform and to reach a broader audience, including females andchildren, across the world.
In the smart-device business, we released three game applications during this period, each with different playstyles and profit models.We were able to present opportunities for consumers who had never played Nintendo games before and those who live in regions wehad previously been unable to reach to experience Nintendo’s intellectual property (Nintendo IP) and the different worlds featured inNintendo games. Going forward we will endeavor to expand our smart-device business by making use of the experience we havegained so far to provide new game applications, while also focusing on continued operations for our released applications so thatconsumers can enjoy playing them for a long time.
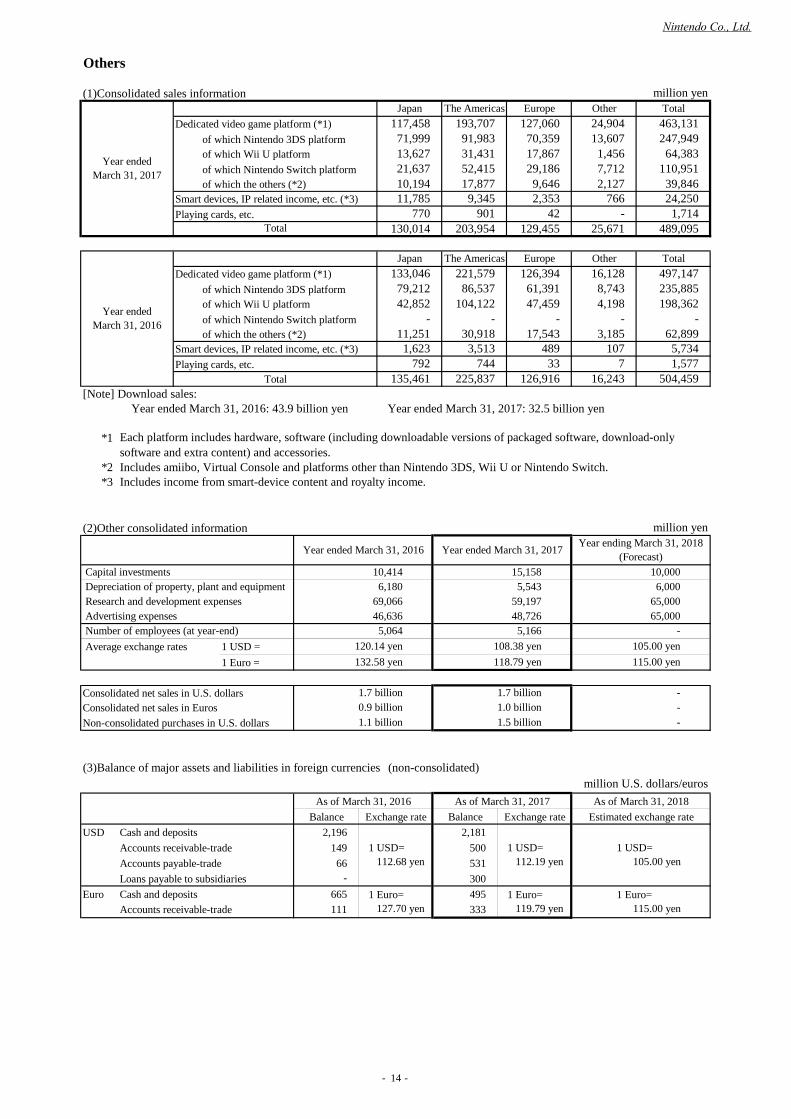
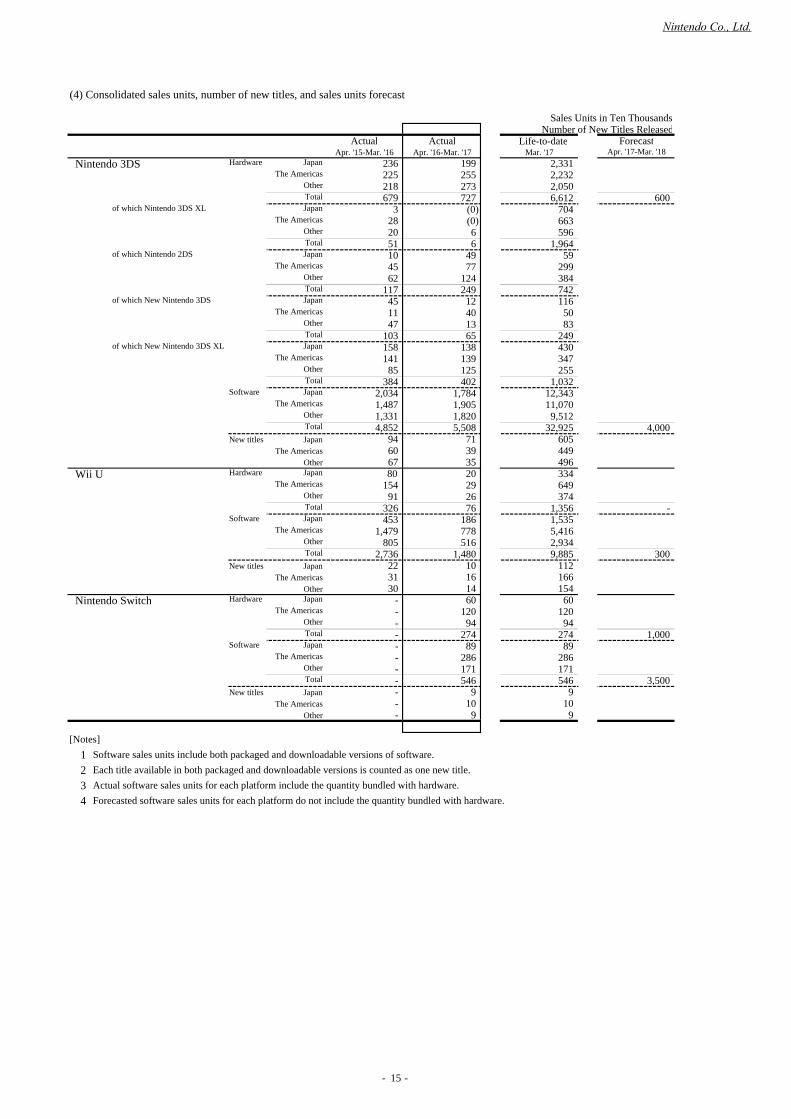
Based on these efforts, we project a net sales of 750.0 billion yen, an operating profit of 65.0 billion yen, an ordinary profit of 60.0billion yen and a net profit attributable to owners of parent of 45.0 billion yen. Unit sales of the major products used for the forecast arelisted on page 15 under the heading of “(4) Consolidated sales units, number of new titles, and sales units forecast" in the "Others"section. Exchange rate assumptions for the major currencies used for the forecasts are 105 yen per US dollar and 115 yen per euro.
Nintendo Co., Ltd.
- 4 -
Management Policy
1. Basic Management Policy
2. Targeted Management Index
3. Mid to Long-Term Corporate Business Strategy and Issues to Address
Basic Policy on the Selection of Accounting Standards
Nintendo strives to create new and unique forms of entertainment while maintaining a robust business structure. Nintendo places thehighest emphasis on providing consumers with innovative entertainment that has never been experienced.
With the belief in our mission to put smiles on people's faces around the world through products and services, our company group willfocus on expanding the population that can experience Nintendo IP by offering products that can be enjoyed by everyone regardless ofage, gender or gaming experience.
In accordance with our basic strategy, we will drive continual growth for Nintendo by expanding the dedicated video game businessand establishing the smart-device business. For our dedicated video game business, our unique hardware-software integrated businesswith focus on software will continue to constitute the core business for Nintendo and we will actively seek to invest resources in ourNintendo-specific platform business. In order to expand the scope of our business, we will seek to strengthen our business foundation,generate synergy with our dedicated video game business and maximize business for Nintendo as a whole by building our smart-devicebusiness into one of our major pillars of profit.
In addition to our gaming business, we are also making active use of Nintendo IP by providing theme park attractions using ourcharacters, showing off our characters through video content and merchandising, and in collaborations with our partner companies.Through these efforts, we are hoping to pursue every business possibility and add value to our company by actively offering NintendoIP in a variety of different ways so that not only current players of our video games but all consumers - including those who used toplay our games but currently do not and even those who have never played our video games before - can experience Nintendo IP.
We will continue to flexibly transform ourselves by adapting to changing times while constantly valuing the spirit of originality basedon the belief that the "true value of entertainment lies in its uniqueness" - and will endeavor to continue providing products and servicesthat people will be surprised and delighted by.
It is essential for us to provide new and entertaining products and services consistently. Upon accomplishing this, Nintendo aims toimprove its corporate value by sustaining robust growth and increasing profit. Because Nintendo deals with entertainment products,which by nature hold many uncertainties in terms of their research & development, and operates in a market which involves intensecompetition, flexible business decisions are made without being constrained by any specific management index.
Nintendo is preparing for mandatory International Financial Reporting Standards adoption by attending seminars held by outsideagencies to collect information, and conducting a deliberation on its adoption. However, the effective date has not been determined.
Nintendo Co., Ltd.
- 5 -
Consolidated Balance Sheetsmillion yen
(Assets)Current assets
Cash and depositsNotes and accounts receivable-tradeSecuritiesInventoriesDeferred tax assetsOtherAllowance for doubtful accounts
Total current assets
Non-current assetsProperty, plant and equipment
Buildings and structures, netMachinery, equipment and vehicles, netTools, furniture and fixtures, net Land Construction in progress
Total property, plant and equipment Intangible assets
Software
Other
Investments and other assetsInvestment securitiesDeferred tax assetsNet defined benefit assetOtherAllowance for doubtful accounts
Total investments and other assetsTotal non-current assetsTotal assets
12,825
3,791 4,31342,553 42,133
309 3
As of March 31, 2017
106,054
6,597 33240,433
283,307
Total intangible assets
178,037 228,851
9,977
Description
38,731
As of March 31, 2016
570,448 662,763
39,129338,892
26,401 49,535(369) (379)
1,021,135 1,140,742
39,977 38,7071,120 1,400
87,752 86,558
9,408 9,942568 2,882
125,774 157,96332,195 49,453
12,974 13,7537,092
(0) (0)
328,235
7,680
1,296,902 1,468,978275,766
Nintendo Co., Ltd.
- 6 -
million yen
(Liabilities)Current liabilities
Notes and accounts payable-tradeIncome taxes payableProvision for bonusesOther
Total current liabilities
Non-current liabilitiesNet defined benefit liabilityOther
Total non-current liabilitiesTotal liabilities
(Net assets)Shareholders' equity
Capital stockCapital surplus Retained earningsTreasury shares
Total shareholders' equity
Accumulated other comprehensive incomeValuation difference on available-for-sale securitiesForeign currency translation adjustment
Total accumulated other comprehensive income Non-controlling interestsTotal net assetsTotal liabilities and net assets
As of March 31, 2017
14,017 14,650
104,181
Description As of March 31, 2016
31,8571,878 11,2672,294 2,341
62,407 66,319184,10998,437
23,546 19,245
33,895136,001 218,005
37,563
10,06513,256 13,25610,065
1,489,518(250,563) (250,601)
1,401,359
1,262,239
11,909 18,913
1,174,118
(30,312)(13,341) (11,399)(25,250)
1321,160,901 1,250,972
124
1,296,902 1,468,978
Nintendo Co., Ltd.
- 7 -
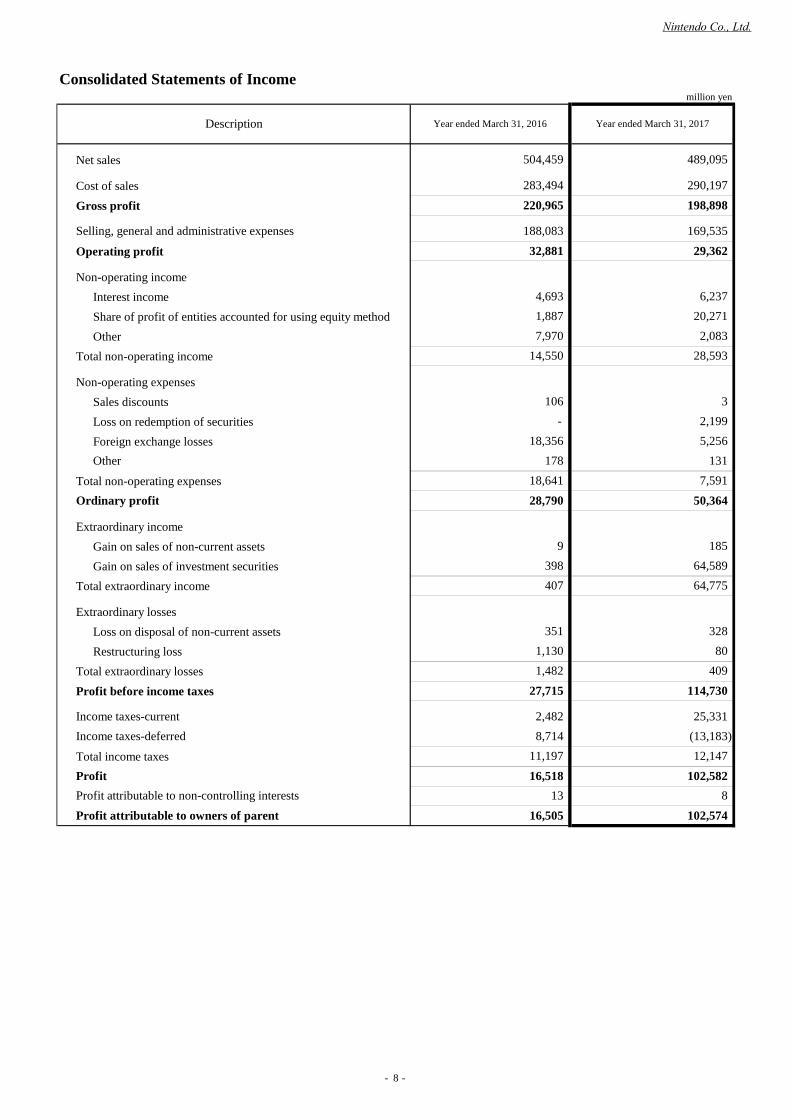
Consolidated Statements of Incomemillion yen
Net sales
Cost of salesGross profit
Operating profit
Non-operating incomeInterest incomeShare of profit of entities accounted for using equity methodOther
Total non-operating income
Non-operating expensesSales discountsLoss on redemption of securitiesForeign exchange losses
Total non-operating expenses
Extraordinary incomeGain on sales of non-current assetsGain on sales of investment securities
Total extraordinary income
Extraordinary lossesLoss on disposal of non-current assetsRestructuring loss
Total extraordinary lossesProfit before income taxes
Total income taxes
Year ended March 31, 2017Year ended March 31, 2016
18,356 5,256
50,364
Description
504,459 489,095
283,494 290,197198,898
Selling, general and administrative expenses 188,083 169,535
220,965
32,881 29,362
4,693 6,237
7,970 2,08314,550 28,593
106 3- 2,199
Other 178 13118,641 7,591
Ordinary profit 28,790
407 64,775
351 3281,130 801,482 409
27,715 114,730
Income taxes-current 2,482
8
25,331Income taxes-deferred 8,714 (13,183)
11,197 12,147Profit 16,518 102,582
102,574Profit attributable to non-controlling interests 13Profit attributable to owners of parent 16,505
9 185398 64,589
1,887 20,271
Nintendo Co., Ltd.
- 8 -
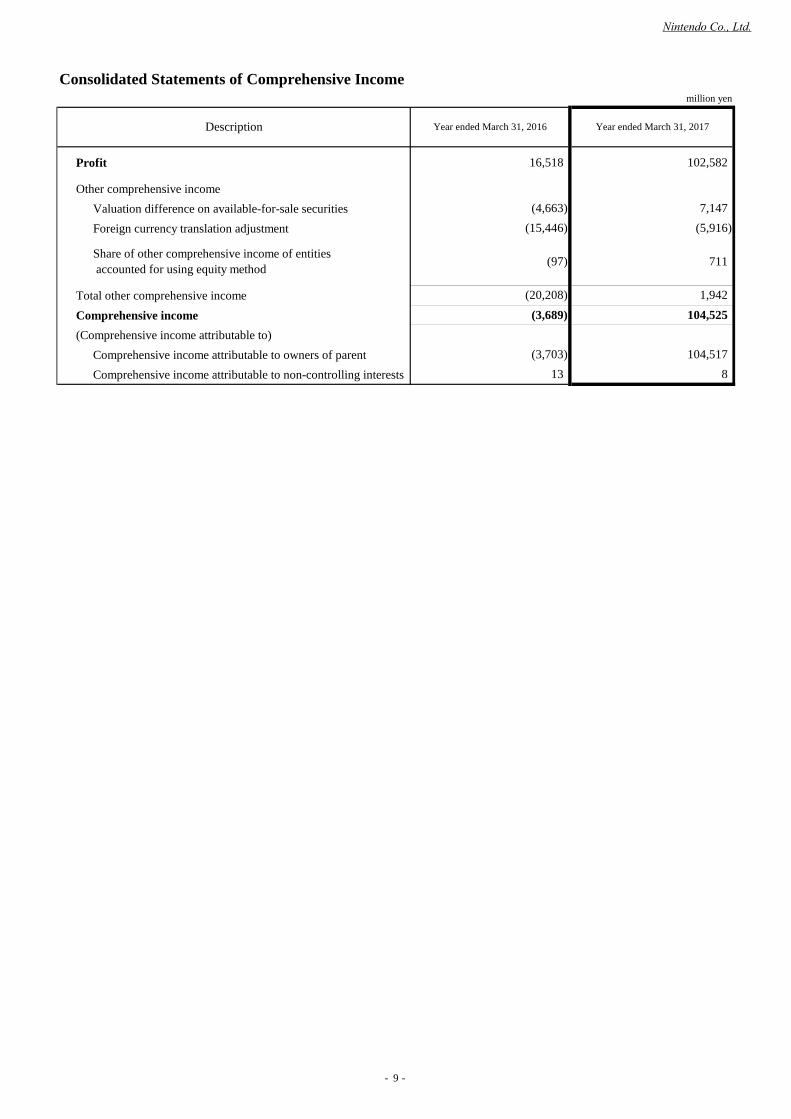
Consolidated Statements of Comprehensive Incomemillion yen
Other comprehensive incomeValuation difference on available-for-sale securitiesForeign currency translation adjustment
Total other comprehensive incomeComprehensive income(Comprehensive income attributable to)
Comprehensive income attributable to owners of parentComprehensive income attributable to non-controlling interests
102,582
Year ended March 31, 2016 Year ended March 31, 2017Description
Profit 16,518
(4,663)
Share of other comprehensive income of entities accounted for using equity method (97)
104,525
7,147(5,916)
104,517
711
(15,446)
1,942(3,689)
(20,208)
(3,703)13 8
Nintendo Co., Ltd.
- 9 -
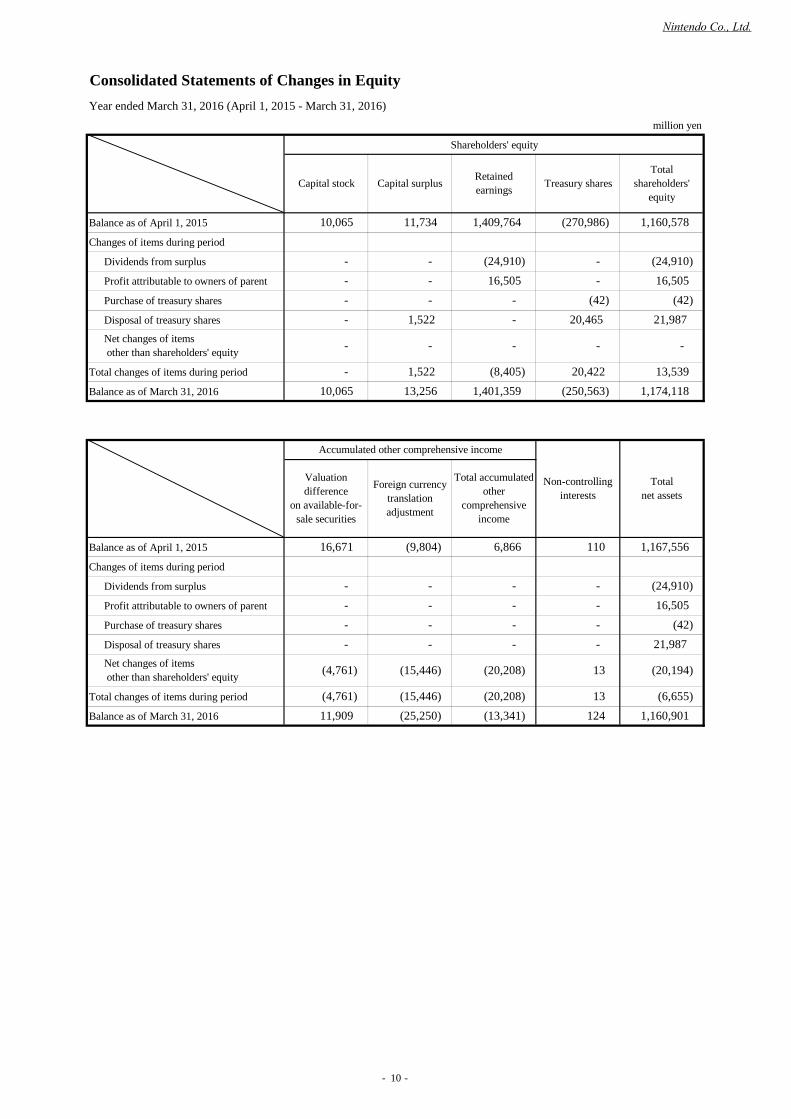
Consolidated Statements of Changes in EquityYear ended March 31, 2016 (April 1, 2015 - March 31, 2016)
million yen
Shareholders' equity
Balance as of April 1, 2015
Changes of items during period
Dividends from surplus
Profit attributable to owners of parent
Purchase of treasury shares
Disposal of treasury shares
Total changes of items during period
Balance as of March 31, 2016
Balance as of April 1, 2015
Changes of items during period
Dividends from surplus
Profit attributable to owners of parent
Purchase of treasury shares
Disposal of treasury shares
Total changes of items during period
Balance as of March 31, 2016
Capital stock Capital surplus Retainedearnings Treasury shares
Totalshareholders'
equity
10,065 11,734 1,409,764 (270,986) 1,160,578
- - (24,910) - (24,910)- - 16,505 - 16,505- - - (42) (42)- 1,522 - 20,465 21,987
Net changes of items other than shareholders' equity - - - - -
- 1,522 (8,405) 20,422 13,53910,065 13,256 1,401,359 (250,563) 1,174,118
Accumulated other comprehensive income
Non-controllinginterests
Totalnet assets
Valuationdifference
on available-for-sale securities
Foreign currencytranslationadjustment
Total accumulatedother
comprehensiveincome
16,671 (9,804) 6,866 110 1,167,556
- - - - (24,910)- - - - 16,505- - - - (42)- - - - 21,987
Net changes of items other than shareholders' equity (4,761) (15,446) (20,208) 13 (20,194)
(4,761) (15,446) (20,208) 13 (6,655)11,909 (25,250) (13,341) 124 1,160,901
Nintendo Co., Ltd.
- 10 -

Consolidated Statements of Changes in EquityYear ended March 31, 2017 (April 1, 2016 - March 31, 2017)
million yen
Shareholders' equity
Balance as of April 1, 2016
Changes of items during period
Dividends from surplus
Profit attributable to owners of parent
Purchase of treasury shares
Disposal of treasury shares
Total changes of items during period
Balance as of March 31, 2017
Balance as of April 1, 2016
Changes of items during period
Dividends from surplus
Profit attributable to owners of parent
Purchase of treasury shares
Disposal of treasury shares
Total changes of items during period
Balance as of March 31, 2017 18,913
Valuationdifference
on available-for-sale securities
Foreign currencytranslationadjustment
7,004
11,909 (25,250)
(5,061)(30,312)
-
-
Totalshareholders'
equity
1,401,359 (250,563) 1,174,118
Retainedearnings
- -
Treasury sharesCapital stock Capital surplus
10,065 13,256
(14,415)-
- -
(14,415) - 102,574 102,574
Total accumulatedother
comprehensiveincome
(13,341)
Accumulated other comprehensive income
-
- -
88,1591,489,518
-
-
- -
10,065
- -
-
(5,061)
- -
1,9427,004
- - -
-
-
Net changes of items other than shareholders' equity
Non-controllinginterests
Net changes of items other than shareholders' equity
- -
- - 13,256
-
1,160,901
-
(38)-
(38)
- -
88,121
(38)
1,250,972132(11,399)
1,262,239(250,601)
8
124
-
Totalnet assets
1,950
(14,415)102,574
(38)-
1,942 90,0718
- -
Nintendo Co., Ltd.
- 11 -
Consolidated Statements of Cash Flowsmillion yen
Cash flows from operating activities
DepreciationIncrease (decrease) in allowance for doubtful accounts
Interest and dividend income Foreign exchange losses (gains) Loss (gain) on sales of short-term and long-term investment securitiesShare of (profit) loss of entities accounted for using equity methodDecrease (increase) in notes and accounts receivable-tradeDecrease (increase) in inventories Increase (decrease) in notes and accounts payable-trade Increase (decrease) in accrued consumption taxesOther, net
Interest and dividends income received Interest expenses paid Income taxes (paid) refund
Net cash provided by (used in) operating activities
Cash flows from investing activitiesPayments into time deposits Proceeds from withdrawal of time deposits
Purchase of short-term and long-term investment securities
Other, net Net cash provided by (used in) investing activities
Cash flows from financing activitiesCash dividends paid Purchase of treasury sharesProceeds from sales of treasury sharesOther, net
Net cash provided by (used in) financing activities
Net increase (decrease) in cash and cash equivalentsCash and cash equivalents at beginning of periodCash and cash equivalents at end of period
-
Year Ended March 31, 2016 Year Ended March 31, 2017
34,501
(55)
Description
(5,134)(707)
114,7308,366
Proceeds from sales and redemption of short-termand long-term investment securities
14,527(64,617)
6,066
(680,408)
(5,355)
1,019,443
659,857
66,097
(20,271)
Sub-total
(7,992)
804,571
69,518
5,963
(1,306)(14,435)
(71,740)
6,332
330,974
72,878258,095
(3,898)
19,101
(12)
(24,929)
(674,717)
1,574
(12)
(14,384)
(374)
(537,674)
(10,458)
281,539(23,443)
55,190
(4,670)
(1,072,852)
(16,869)(0)
(2,996)Effect of exchange rate change on cash and cash equivalents
258,095
21,987
Profit before income taxes 27,7159,139
(1,887)15,444
Increase (decrease) in net defined benefit liability
(155)51,528
(439)
(65,706)
23
544
(16,680)(1)
1,2129,231
29,451
500,936
(4,053)
Purchase of property, plant and equipment and intangible assetsProceeds from sales of property, plant and equipment and intangible assets
(42) (38)
(6,904)
(21,556)(95)
Nintendo Co., Ltd.
- 12 -
Notes Pertaining to Consolidated Financial Statements
Changes in accounting procedures
Additional Information
(Consolidated balance sheets information) million yen million yenAs of March 31, 2016 As of March 31, 2017
(Consolidated statements of cash flows information)
million yen million yen
Cash and deposits
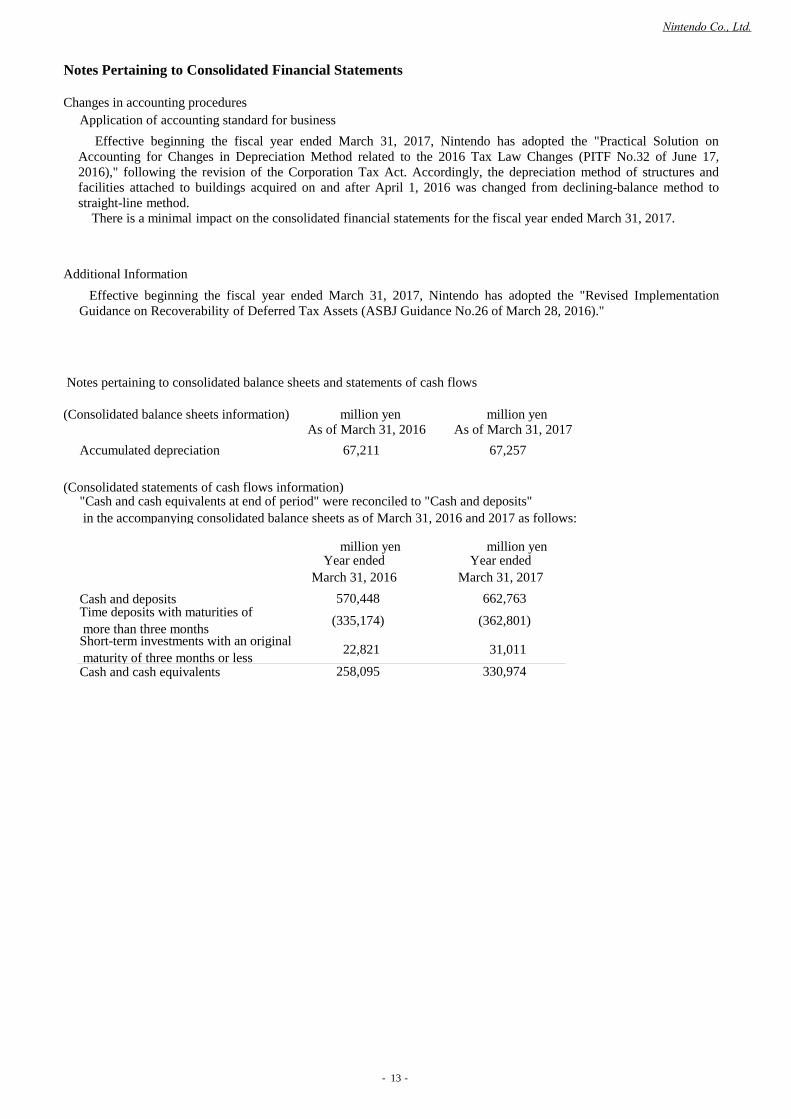
Cash and cash equivalents 258,095 330,974
Notes pertaining to consolidated balance sheets and statements of cash flows
Accumulated depreciation
Time deposits with maturities of more than three months
67,25767,211
Short-term investments with an original maturity of three months or less
Application of accounting standard for business
"Cash and cash equivalents at end of period" were reconciled to "Cash and deposits" in the accompanying consolidated balance sheets as of March 31, 2016 and 2017 as follows:
(335,174)
22,821
(362,801)
31,011
Year endedMarch 31, 2016
Year endedMarch 31, 2017
570,448 662,763
Effective beginning the fiscal year ended March 31, 2017, Nintendo has adopted the "Revised ImplementationGuidance on Recoverability of Deferred Tax Assets (ASBJ Guidance No.26 of March 28, 2016)."
Effective beginning the fiscal year ended March 31, 2017, Nintendo has adopted the "Practical Solution onAccounting for Changes in Depreciation Method related to the 2016 Tax Law Changes (PITF No.32 of June 17,2016)," following the revision of the Corporation Tax Act. Accordingly, the depreciation method of structures andfacilities attached to buildings acquired on and after April 1, 2016 was changed from declining-balance method tostraight-line method.
There is a minimal impact on the consolidated financial statements for the fiscal year ended March 31, 2017.
Nintendo Co., Ltd.
- 13 -
Others
(1)Consolidated sales information
Dedicated video game platform (*1) of which Nintendo 3DS platform of which Wii U platform of which Nintendo Switch platform of which the others (*2)Smart devices, IP related income, etc. (*3)Playing cards, etc.
Dedicated video game platform (*1) of which Nintendo 3DS platform of which Wii U platform of which Nintendo Switch platform of which the others (*2)Smart devices, IP related income, etc. (*3)Playing cards, etc.
[Note] Download sales: Year ended March 31, 2016: 43.9 billion yen Year ended March 31, 2017: 32.5 billion yen
*1
*2 Includes amiibo, Virtual Console and platforms other than Nintendo 3DS, Wii U or Nintendo Switch.*3 Includes income from smart-device content and royalty income.
(2)Other consolidated information
Average exchange rates 1 USD =1 Euro =
Consolidated net sales in U.S. dollarsConsolidated net sales in EurosNon-consolidated purchases in U.S. dollars
USDAccounts receivable-tradeAccounts payable-tradeLoans payable to subsidiaries
EuroAccounts receivable-trade
135,461 225,837 126,916 16,243 504,459
1,623 3,513 489 107 5,734792 744 33 7 1,577
- - - - -11,251 30,918 17,543 3,185 62,899
86,537 61,391 8,743 235,88542,852
489,095
133,046 221,579 126,394 16,128 497,147
203,954 129,455 25,671
Total
463,131247,949
64,383110,951
39,84624,2509,345 2,353 766
901 42 -
1,45652,415 29,186 7,71217,877 9,646 2,127
117,45871,99913,62721,63710,194
127,060 24,904
11,785770
130,014
Total
79,212104,122 47,459 4,198
91,983
Total
Total
31,431
193,707
Year endedMarch 31, 2016
Japan The Americas Europe Other
198,362
Year endedMarch 31, 2017
Japan The Americas Europe Other
1,714
70,359 13,60717,867
1 Euro= 115.00 yen
1 USD= 112.68 yen
1 Euro= 127.70 yen
1 Euro= 119.79 yen
1 USD= 112.19 yen
495333
300531
111
6,180
2,181
132.58 yen
-665
1.5 billion
120.14 yen
1.7 billion
Balance
0.9 billion
2,196
1.7 billion1.0 billion
-
1 USD= 105.00 yen
149
As of March 31, 2016 As of March 31, 2017
66
105.00 yen
As of March 31, 2018million U.S. dollars/euros
--
118.79 yen
million yen
10,414
Year ended March 31, 2016
10,000
115.00 yen
48,726
6,00065,00065,000
-108.38 yen
Year ending March 31, 2018(Forecast)
million yen
Number of employees (at year-end) Advertising expenses
Depreciation of property, plant and equipment Research and development expenses
15,1585,543
59,197
Each platform includes hardware, software (including downloadable versions of packaged software, download-onlysoftware and extra content) and accessories.
5,166
Capital investments
Year ended March 31, 2017
Cash and deposits
69,06646,6365,064
Balance
1.1 billion
(3)Balance of major assets and liabilities in foreign currencies (non-consolidated)
500Cash and deposits
Exchange rate Exchange rate Estimated exchange rate
Nintendo Co., Ltd.
- 14 -
(4) Consolidated sales units, number of new titles, and sales units forecast
Sales Units in Ten ThousandsNumber of New Titles Released
Actual Actual Life-to-date ForecastApr. '15-Mar. '16 Apr. '16-Mar. '17 Mar. '17
Nintendo 3DS Hardware JapanThe Americas
OtherTotal
of which Nintendo 3DS XL JapanThe Americas
OtherTotal
of which Nintendo 2DS JapanThe Americas
OtherTotal
of which New Nintendo 3DS JapanThe Americas
OtherTotal
of which New Nintendo 3DS XL JapanThe Americas
OtherTotal
Software JapanThe Americas
OtherTotal
New titles JapanThe Americas
Other Wii U Hardware Japan
The AmericasOtherTotal
Software JapanThe Americas
OtherTotal
New titles JapanThe Americas
Other Nintendo Switch Hardware Japan
The AmericasOtherTotal
Software JapanThe Americas
OtherTotal
New titles JapanThe Americas
Other
[Notes]1 2 Each title available in both packaged and downloadable versions is counted as one new title.3 Actual software sales units for each platform include the quantity bundled with hardware.4 Forecasted software sales units for each platform do not include the quantity bundled with hardware.
Apr. '17-Mar. '18236 199 2,331 225 255 2,232 218 273 2,050 679 727 6,612 600
45 12 116 11 40 50 47 13 83
103 65 249 158 138 430 141 139 347 85 125 255
384 402 1,032 2,034 1,784 12,343 1,487 1,905 11,070 1,331 1,820 9,512 4,852 5,508 32,925 4,000
94 71 605 60 39 449 67 35 496 80 20 334
154 29 649 91 26 374
326 76 1,356 - 453 186 1,535
1,479 778 5,416 805 516 2,934
2,736 1,480 9,885 300 22 10 112 31 16 166 30 14 154
274 1,000
- 60 60 - 120 120
- 286 286
- 94 94 -
- 171 171 - 546 546 3,500 - 9 9 - 10 10
Software sales units include both packaged and downloadable versions of software.
3 (0) 704 28 (0) 663
45 77 299
20 6 596 51 6 1,964
- 9 9
10 49 59
- 89 89 274
62 124 384 117 249 742
Nintendo Co., Ltd.
- 15 -