Embed Size (px)
Citation preview
AARP
Consolidated Financial Statements
December 31, 2011 and 2010
(With Independent Auditors’ Report Thereon)
2/1/2011 1:02 PM
AARP
Consolidated Financial Statements
December 31, 2011 and 2010
Table of Contents
Page
Independent Auditors’ Report 1
Consolidated Statements of Financial Position 2
Consolidated Statements of Activities 3
Consolidated Statements of Cash Flows 5
Notes to Consolidated Financial Statements 6

Independent Auditors’ Report
The Board of Directors AARP, Inc.:
We have audited the accompanying consolidated statements of financial position of AARP, Inc. and affiliates (collectively, AARP) as of December 31, 2011 and 2010, and the related consolidated statements of activities and cash flows for the years then ended. These consolidated financial statements are the responsibility of AARP management. Our responsibility is to express an opinion on these consolidated financial statements based on our audits.
We conducted our audits in accordance with auditing standards generally accepted in the United States of America. Those standards require that we plan and perform the audit to obtain reasonable assurance about whether the financial statements are free of material misstatement. An audit includes consideration of internal control over financial reporting as a basis for designing audit procedures that are appropriate in the circumstances, but not for the purpose of expressing an opinion on the effectiveness of AARP’s internal control over financial reporting. Accordingly, we express no such opinion. An audit also includes examining, on a test basis, evidence supporting the amounts and disclosures in the financial statements, assessing the accounting principles used and significant estimates made by management, as well as evaluating the overall financial statement presentation. We believe that our audits provide a reasonable basis for our opinion.
In our opinion, the consolidated financial statements referred to above present fairly, in all material respects, the financial position of AARP as of December 31, 2011 and 2010, and the changes in its net assets and its cash flows for the years then ended in conformity with U.S. generally accepted accounting principles.
March 23, 2012
KPMG LLP Suite 12000 1801 K Street, NW Washington, DC 20006
KPMG LLP is a Delaware limited liability partnership, the U.S. member firm of KPMG International Cooperative (“KPMG International”), a Swiss entity.
AARP
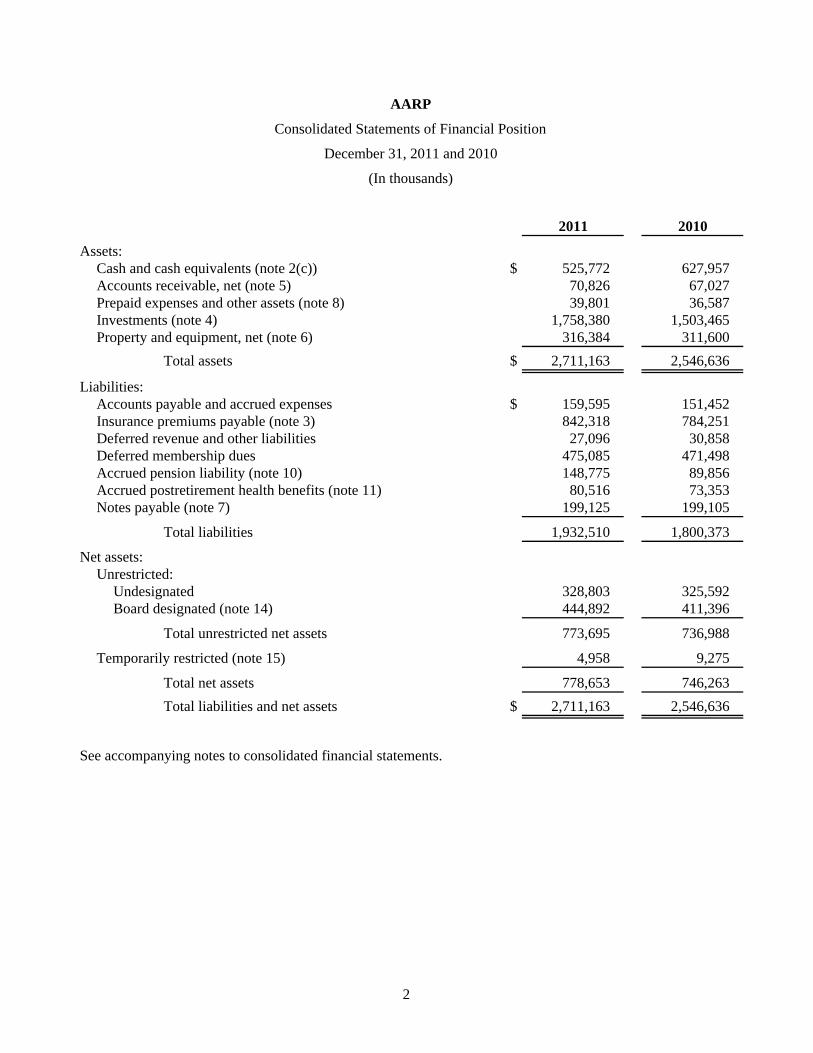
Consolidated Statements of Financial Position
December 31, 2011 and 2010
(In thousands)
2011 2010
Assets:Cash and cash equivalents (note 2(c)) $ 525,772 627,957 Accounts receivable, net (note 5) 70,826 67,027 Prepaid expenses and other assets (note 8) 39,801 36,587 Investments (note 4) 1,758,380 1,503,465 Property and equipment, net (note 6) 316,384 311,600
Total assets $ 2,711,163 2,546,636
Liabilities:Accounts payable and accrued expenses $ 159,595 151,452 Insurance premiums payable (note 3) 842,318 784,251 Deferred revenue and other liabilities 27,096 30,858 Deferred membership dues 475,085 471,498 Accrued pension liability (note 10) 148,775 89,856 Accrued postretirement health benefits (note 11) 80,516 73,353 Notes payable (note 7) 199,125 199,105
Total liabilities 1,932,510 1,800,373
Net assets:Unrestricted:
Undesignated 328,803 325,592 Board designated (note 14) 444,892 411,396
Total unrestricted net assets 773,695 736,988
Temporarily restricted (note 15) 4,958 9,275
Total net assets 778,653 746,263 Total liabilities and net assets $ 2,711,163 2,546,636
See accompanying notes to consolidated financial statements.
2

AARP
Consolidated Statement of Activities
Year ended December 31, 2011
(In thousands)
TemporarilyUnrestricted restricted Total
Operating revenues:Membership dues $ 265,845 — 265,845 Royalties (note 3) 704,630 — 704,630 Publications advertising 129,407 — 129,407 Grant revenue (note 9) 100,744 — 100,744 Program income 44,086 — 44,086 Contributions (note 2(l)) 94,640 1,675 96,315 Other 2,642 — 2,642 Net assets released from restrictions 5,992 (5,992) —
Total operating revenues 1,347,986 (4,317) 1,343,669
Operating expenses:Program services:
Programs and field services 322,634 — 322,634 Publications 173,568 — 173,568 Member services 315,534 — 315,534 Legislation and research 111,644 — 111,644
Total program services 923,380 — 923,380
Supporting services:Membership development 129,669 — 129,669 Management and general (note 2(l)) 211,838 — 211,838
Total supporting services 341,507 — 341,507
Total operating expenses 1,264,887 — 1,264,887
Change in net assets from operations 83,099 (4,317) 78,782
Nonoperating activity:Investment income (notes 3 and 4) 17,911 — 17,911 Investment loss from sinking fund (notes 4 and 7) (1,842) — (1,842) Income taxes (note 8) (5,808) — (5,808) Charges other than net periodic benefit cost
(notes 10 and 11) (56,653) — (56,653)
Change in net assets 36,707 (4,317) 32,390
Net assets, beginning of year 736,988 9,275 746,263 Net assets, end of year $ 773,695 4,958 778,653
See accompanying notes to consolidated financial statements.
3

AARP
Consolidated Statement of Activities
Year ended December 31, 2010
(In thousands)
TemporarilyUnrestricted restricted Total
Operating revenues:Membership dues $ 247,895 — 247,895 Royalties (note 3) 679,534 — 679,534 Publications advertising 122,572 — 122,572 Grant revenue (note 9) 144,326 — 144,326 Program income 48,838 — 48,838 Contributions (note 2(l)) 48,325 4,959 53,284 Other 2,730 — 2,730 Net assets released from restrictions 3,956 (3,956) —
Total operating revenues 1,298,176 1,003 1,299,179
Operating expenses:Program services:
Programs and field services 330,672 — 330,672 Publications 178,990 — 178,990 Member services 298,157 — 298,157 Legislation and research 75,920 — 75,920
Total program services 883,739 — 883,739
Supporting services:Membership development 125,155 — 125,155 Management and general 186,373 — 186,373
Total supporting services 311,528 — 311,528
Total operating expenses 1,195,267 — 1,195,267
Change in net assets from operations 102,909 1,003 103,912
Nonoperating activity:Investment income (notes 3 and 4) 126,411 126,411 Investment gain from sinking fund (notes 4 and 7) 10,305 — 10,305 Income taxes (note 8) (3,345) — (3,345) Charges other than net periodic benefit cost
(notes 10 and 11) (10,966) — (10,966)
Change in net assets 225,314 1,003 226,317
Net assets, beginning of year 511,674 8,272 519,946 Net assets, end of year $ 736,988 9,275 746,263
See accompanying notes to consolidated financial statements.
4

AARP
Consolidated Statements of Cash Flows
Years ended December 31, 2011 and 2010
(In thousands)
2011 2010
Cash flows from operating activities:Change in net assets $ 32,390 226,317 Adjustments to reconcile change in net assets to net
cash provided by operating activities:Depreciation and amortization 37,366 33,778 (Recovery) reserve for uncollectible accounts (73) 47 Charges other than net periodic benefit cost 56,653 10,966 Net loss (gain) on investments 30,391 (95,407) Deferred income taxes 1,901 (545) Changes in operating assets and liabilities:
Cash and cash equivalents held as collateralAccounts receivable (3,726) 3,491 Prepaid expenses and other assets (5,168) 5,388 Prepaid pension assetAccounts payable and accrued expenses 8,143 47,010 Insurance premiums payable 58,067 30,983 Securities loan payableDeferred revenue and other liabilities (3,762) (6,003) Deferred membership dues 3,587 22,425 Accrued pension liability 6,942 (2,408) Accrued postretirement health benefits 2,487 3,374
Total adjustments 192,808 53,099
Net cash provided by operating activities 225,198 279,416
Cash flows from investing activities:Purchases of property and equipment (42,077) (34,118) Proceeds from sale and maturities of investments 1,021,245 671,885 Purchases of investments (1,306,551) (993,782)
Net cash used in investing activities (327,383) (356,015)
Cash flows from financing activities:
Payments on commercial bank borrowings — (13,750)
Net cash used in financing activities — (13,750)
Net decrease in cash and cash equivalents (102,185) (90,349)
Cash and cash equivalents, beginning of year 627,957 718,306 Cash and cash equivalents, end of year $ 525,772 627,957
Supplemental disclosures:Cash paid for interest $ 9,796 10,221 Cash paid for income taxes 6,580 9,683
See accompanying notes to consolidated financial statements.
5
AARP
Notes to Consolidated Financial Statements
December 31, 2011 and 2010
6 (Continued)
(1) Description of Organizations and Activities
(a) AARP, Inc.
AARP, Inc. was organized in 1958 as a District of Columbia not-for-profit corporation for the purpose of promoting the interests of older persons. AARP, Inc. is qualified as a tax-exempt social welfare organization under Section 501(c)(4) of the Internal Revenue Code (IRC). The mission of AARP, Inc. is to meet the needs and promote the independence, dignity, and purpose of persons 50 and older. The programs and activities of AARP, Inc. and its affiliates include education, advocacy, research, service programs, other social welfare activities, and charitable programs serving the needs of older persons.
AARP, Inc.’s programs, activities and operations are managed and supported primarily from its National Headquarters in Washington, D.C. AARP, Inc. and its affiliates also have offices in all fifty U.S. states, Washington, D.C., Puerto Rico, and the U.S. Virgin Islands, as well as a membership processing center located in Lakewood, California, and an advertising sales office in New York City.
(b) AARP Services, Inc. and AARP Financial, Inc.
AARP Services, Inc. (AARP Services) is a wholly owned taxable subsidiary of AARP, Inc., and was incorporated in Delaware in 1998.
Pursuant to an agreement with AARP, AARP Services is responsible for providing quality control services designed to ensure that licensees of AARP’s intellectual property are using such property appropriately. AARP Services also provides membership development, new product development, institutional relationship services, and other services designed to support AARP’s efforts to select, improve and expand member benefits and services made available to AARP members, and to improve the lives of the 50+ population. AARP Services receives fees from AARP for performing these services.
AARP Financial, Inc. (AARP Financial) was incorporated in Delaware in September 2005, as a wholly owned taxable subsidiary of AARP Services. AARP Financial was formed to design, develop and manage AARP, Inc. branded financial services and related products. The company’s Board of Directors elected to discontinue operations as an investment advisor and administrator to the AARP Funds and AARP Portfolios; subsequently, AARP Financial deregistered as an investment advisor with the U.S. Securities and Exchange Commission effective October 26, 2010. The AARP Funds and AARP Portfolios were liquidated on September 30, 2010. Effective December 30, 2010, AARP Services assumed all rights, title, and interest in the assets and liabilities of AARP Financial and absorbed all remaining AARP Financial operations.
(c) AARP Insurance Plan
The AARP Insurance Plan (the Plan) is a grantor trust established in 1958 by an Agreement and Declaration of Trust for the purpose of making group health insurance and other health-related products and services available to AARP, Inc. members. Insurance premiums collected by the Plan are paid directly by participants. At the direction of the third party insurance carriers, certain agreed

AARP
Notes to Consolidated Financial Statements
December 31, 2011 and 2010
7 (Continued)
upon payments are made for royalties payable to AARP, Inc. The Plan is administered by a Board of Trustees appointed by the Board of Directors of AARP, Inc.
(d) AARP Foundation and AARP Institute
AARP Foundation was organized in 1961 as a District of Columbia not-for-profit corporation. AARP Foundation is dedicated to serving vulnerable people 50+ by creating solutions that help them secure the essentials – food, housing, income and personal connection - and achieve their best life. AARP Foundation, an AARP affiliate, is a qualified nonprofit organization under Section 501(c)(3) of the IRC and is therefore exempt from federal income taxes on its charitable operations. In addition, AARP Foundation is a public charity as defined in Section 509(a)(1) of the IRC. AARP Foundation receives funding principally from the federal government, AARP, Inc., foundations, corporations and individuals. AARP Foundation’s Board of Directors is composed of members appointed by AARP, Inc.’s Board of Directors.
AARP Institute (the Institute), a wholly owned subsidiary of AARP Foundation, was organized in 1963 as a District of Columbia not-for-profit corporation. The Institute qualifies as a tax-exempt organization under Section 501(c)(3) of the IRC. AARP Foundation and the Institute are collectively referred to as the Foundation.
(e) Legal Counsel for the Elderly
Legal Counsel for the Elderly (LCE) was incorporated in the District of Columbia in 1980 for the purpose of providing free legal assistance and education to the elderly, primarily in the District of Columbia. LCE publishes manuals, conducts seminars on issues affecting the elderly, and operates legal services and long-term care ombudsman programs. LCE qualifies as a tax-exempt charitable organization under Section 501(c)(3) of the IRC. Funding for LCE is obtained primarily through contributions from AARP, Inc., government grants, foundations, corporations and individuals. LCE’s Board of Directors is comprised of seven members appointed by AARP, Inc.’s Chief Executive Officer.
(f) Other Affiliates
AARP Global Network was a limited liability company (LLC) formed as a joint international program. AARP Global Network ceased operations in 2011. AARP Andrus Insurance Fund LLC, a single-member LLC with AARP, Inc. as its sole member, was formed in 2007 to serve as a self-funding mechanism for the deductible portion of certain AARP, Inc. and affiliates insurance coverages with third party insurance carriers. Various special purpose taxable affiliated entities own and operate the AARP headquarters building located in Washington, D.C., the related parking garage facilities and buildings in California. These properties are primarily occupied by AARP, Inc. and its affiliates.

AARP
Notes to Consolidated Financial Statements
December 31, 2011 and 2010
8 (Continued)
(2) Summary of Significant Accounting Policies
(a) Basis of Presentation
These consolidated financial statements are prepared on the accrual basis of accounting and include the accounts of the entities listed in note 1, collectively referred to as AARP.
All significant intercompany transactions have been eliminated in consolidation. The consolidated financial statements do not include the operations and accounts of over 1,500 local chapters of AARP that are organized and operated as separate entities. AARP neither controls nor derives beneficial economic interest from these organizations, as defined by U.S. generally accepted accounting principles.
AARP summarizes the costs of providing and managing its various programs and supporting activities on a functional basis in the accompanying consolidated statements of activities. Accordingly, certain operating costs are allocated among the benefiting program and supporting services based on specific identification or reasonable allocation methodologies.
Net assets and changes in net assets are classified based on the existence or absence of donor-imposed restrictions. Accordingly, net assets are classified and reported as follows:
Unrestricted – net assets that are not subject to donor-imposed stipulations including amounts designated by the Board of Directors for specific purposes.
Temporarily restricted – net assets subject to donor-imposed stipulations that will be met by actions of AARP and/or the passage of time.
(b) Use of Estimates
The preparation of financial statements in conformity with U.S. generally accepted accounting principles requires management to make estimates and assumptions that affect reported amounts and disclosures in the financial statements. Although actual results could differ from these estimates, management does not believe that such differences will be material.
(c) Cash Equivalents
Investments with original maturities of three months or less are reported as cash equivalents. As of December 31, 2011 and 2010, $207,000,000 and $170,000,000, respectively, were held by the AARP Insurance Plan for the payment of member insurance premiums.
(d) Accounts Receivable
AARP estimates uncollectible amounts based on the aging of outstanding accounts receivable and management’s estimate of their net realizable values.

AARP
Notes to Consolidated Financial Statements
December 31, 2011 and 2010
9 (Continued)
(e) Investments
Investments are measured and reported at fair value. Changes in fair value are reported as investment income in the accompanying consolidated statements of activities.
The fair value of debt and equity securities with a readily determinable fair value is based on quotations obtained from national security exchanges. The fair value of non-U.S. Treasury debt securities is determined by a nationally recognized independent pricing service (pricing service).
Institutional mutual funds are carried at net asset values as provided by the investment managers. AARP management reviews and evaluates the values provided by the investment managers and agrees with the valuation methods and assumptions used in determining their estimated fair value. Due to the inherent uncertainties of these estimates, these values may differ from the values that would have been reported had a ready market for such investments existed. In 2011 and 2010, the estimated fair values represented approximately 64% and 75%, respectively, of total investments.
All investment securities are exposed to various risks such as interest rate, market, and credit risks. Due to the level of risk associated with certain investment securities, it is at least reasonably possible that changes in the values of investment securities will occur in the near term and such changes could materially affect the amounts reported in the consolidated statements of financial position.
(f) Property and Equipment
Property and equipment are stated at cost. Computer software is composed of external and certain qualifying internal costs related to software development. Management periodically evaluates whether events or circumstances have occurred indicating that the carrying amount of long-lived assets may not be recovered. If the sum of the undiscounted expected future cash flows is less than the carrying amount of an asset, AARP recognizes an impairment loss based on the amount by which the carrying amount of the asset exceeds the fair value of the asset. Depreciation and amortization are calculated using the straight-line method over the lesser of the estimated useful lives of the assets or the lease term. The useful lives range from three to 30 years. Maintenance and repair costs are expensed as incurred.
(g) Membership Dues
Membership dues are deferred upon receipt and recognized as revenue ratably over the membership term of one, two, three or five years.
(h) Royalties
Royalties are received from AARP branded third party providers of member benefit programs, in return for the rights to use AARP’s intellectual property (including name, logo and mailing list) in offering programs. These royalties are recognized as revenue as earned.
The service provider United Healthcare Corporation accounted for 65% of total royalties earned in 2011 and 2010.

AARP
Notes to Consolidated Financial Statements
December 31, 2011 and 2010
10 (Continued)
(i) Publications Advertising
AARP sells advertising space in its major publications, which are provided to members without additional charge as part of their membership benefits. Advertising revenue is recognized as earned in the month of each publication’s issue date.
(j) Grant Revenues
The Foundation and LCE report activities under grant agreements as exchange transactions. Accordingly, grant-related revenue is recognized to the extent that allowable expenses are incurred under program agreements. Amounts reported as grants receivable represent grant program expenses incurred in advance of the receipt of funds. Funds received in advance of incurred grant program expenses are reported as deferred revenue. Federal funds are only received by the Foundation and LCE.
The Foundation and LCE receive a majority of their revenue from government grants, which are subject to audit by various federal and state agencies. The ultimate determination of amounts received under these grants generally is based upon allowable costs reported to and audited by the governments or their designees. The liabilities, if any, arising from such compliance audits cannot be determined at this time. In the opinion of management, adjustments resulting from such audits, if any, will not have a significant effect on the financial position of the Foundation or LCE.
(k) Program Income
AARP receives service fees from providers of and participants in member programs, for consulting and specific program services. These fees are recognized as earned.
(l) Contributions and Fundraising Expense
AARP reports contributions as revenue when received or pledged by the donor. Contributions are reported as temporarily restricted revenue if such gifts are restricted by the donor to a specific program or include an explicit or implied time restriction.
Expirations of temporary restrictions on net assets (i.e. the donor-stipulated purpose has been fulfilled and/or the stipulated time period has elapsed) are reported as net assets released from restrictions. Gifts whose donor-stipulated purposes are met in the same year as received are reported as unrestricted revenue.
Contributions include cash received in support of both charitable and advocacy program activities. Charitable contributions are only received by the Foundation and LCE, while advocacy contributions are only received by AARP, Inc. Contributions also include in-kind contributed professional services totaling $36,622,000 and $18,500,000 for the years ended December 31, 2011 and 2010, respectively.
Fundraising expenses, which are reported as part of management and general expenses, were $20,660,000 and $18,077,000 for the years ended December 31, 2011 and 2010, respectively.

AARP
Notes to Consolidated Financial Statements
December 31, 2011 and 2010
11 (Continued)
(m) Volunteer Services
AARP and its members benefit from the efforts of many volunteers. These in-kind contributions by volunteers are not recorded as revenue in the consolidated financial statements because they do not meet the requirements for recognition under U.S. generally accepted accounting principles.
(n) Income Taxes
Income taxes are accounted for under the asset and liability method. Deferred tax assets and liabilities are recognized for the future tax consequences attributable to the differences between the financial statement carrying amounts of existing assets and liabilities and their respective tax bases and operating loss and tax credit carry-forwards. Deferred tax assets and liabilities are measured using enacted rates expected to apply to taxable income in the years in which those temporary differences are expected to be recovered or settled. The effect on deferred tax assets and liabilities of a change in tax rates is recognized in other income (expenses) in the period that includes the enactment date.
AARP does not believe that there are any unrecognized tax benefits/liabilities that should be recorded.
(o) Measure of Operating Results
AARP reports as operating all activities except for any required provision for federal and state income taxes, investment income and pension and post-retirement related charges other than net periodic benefit cost.
(p) Advertising Expenses
AARP expenses advertising costs as incurred except to the extent of any direct response marketing costs that qualify for capitalization. These costs include brand awareness, member acquisition and retention, member program marketing, and advocacy advertising. For the years ended December 31, 2011 and 2010, advertising expense was $187,490,000 and $146,751,000 respectively, and no costs were capitalized.
(q) Fair Value Measurements
Fair value is defined as the exchange price that would be received to sell an asset or paid to transfer a liability in the principal or most advantageous market for the asset or liability in an orderly transaction between market participants on the measurement date. Fair value should be based on the assumptions market participants would use when pricing an asset or liability and a fair value hierarchy that prioritizes the information used to develop those assumptions. The fair value hierarchy gives the highest priority to quoted prices in active markets (observable inputs) and the lowest priority to AARP’s assumptions (unobservable inputs). AARP groups assets and liabilities at fair value in three levels, based on the markets in which the assets and liabilities are traded and the reliability of the assumptions used to determine fair value. These levels are:
Level 1 – Unadjusted quoted market prices for identical assets or liabilities in active markets.

AARP
Notes to Consolidated Financial Statements
December 31, 2011 and 2010
12 (Continued)
Level 2 – Other observable inputs, either directly or indirectly, including:
• Quoted prices for similar assets/liabilities in active markets;
• Quoted prices for identical or similar assets in nonactive markets;
• Inputs other than quoted prices that are observable for the asset/liability; and
• Inputs that are derived principally from or corroborated by other observable market data.
Level 3 – Unobservable inputs that cannot be corroborated by observable market data.
At December 31, 2011 and 2010, the carrying value of financial instruments such as cash equivalents, accounts receivable, accounts payable and variable rate debt approximated their fair value, based on the short-term maturities or floating interest rates of these instruments. The fair values of investments, notes payable and fixed rate debt (with related swap agreements) are discussed in notes 4 and 7, respectively.
(r) Reclassifications
Certain reclassifications have been made to the 2010 reported amounts to conform to the 2011 presentation.
(3) Grantor Trust
AARP established a grantor trust for the purpose of making certain types of insurance available to its members through third party insurance carriers. Agreements between AARP, Inc., AARP Services, United HealthCare Corporation (United), Metropolitan Life Insurance Company (MetLife), Genworth Life Insurance Company (Genworth), and Aetna Life Insurance Company (Aetna) make certain types of insurance available to AARP members.
The Plan, a grantor trust, holds group policies, and maintains depository accounts to initially collect insurance premiums received from participating members. In accordance with the agreements referenced above, collections are remitted to third party insurance carriers within contractually specified periods of time, net of the contractual royalty payments that are due to AARP, Inc., which are reported as royalties in the consolidated statements of activities. AARP derived 51% of total royalties from the Plan for each of the years ended December 31, 2011 and 2010. Billing of insurance premiums and issuance of certificates of insurance to insured members is the responsibility of the third party insurance carrier. The collection of premiums and submission of amounts due to the insurance carrier are classified as agency transactions and, as such, are not recorded as either revenue or expenses on the accompanying consolidated statements of activities. For the years ended December 31, 2011 and 2010, the Plan processed $7.5 billion and $7.1 billion, respectively, of premium payments from member participants.
The premiums are collected from insured members and are subsequently remitted to the third party insurance carriers, and are invested and recorded as an offsetting liability, insurance premiums payable on the consolidated statements of financial position. For the years ended December 31, 2011 and 2010, the Plan experienced net investment income of $14,484,000 and $56,669,000, respectively, which is included in investment income in the accompanying consolidated statements of activities.

AARP
Notes to Consolidated Financial Statements
December 31, 2011 and 2010
13 (Continued)
At December 31, 2011 and 2010, insurance premiums payable were comprised of the following (in thousands):
2011 2010
Premiums payable to the insurance carriers $ 611,399 577,421 Payments received in advance 211,622 184,920 Partial and unprocessed payments 19,297 21,910
Total insurance premiums payable $ 842,318 784,251

AARP
Notes to Consolidated Financial Statements
December 31, 2011 and 2010
14 (Continued)
(4) Investments
Investments as of December 31, 2011 are summarized in the following table by their classification in the fair value hierarchy (in thousands):
Total Level 1 Level 2
Investments:U.S Treasury securities $ 65,925 65,925 — Foreign Government fixed income securities 7,853 — 7,853 Mortgage-backed fixed income securities 114,774 — 114,774 U.S. corporate fixed income securities 206,457 7,555 198,902 International corporate fixed income securities 62,153 — 62,153 International equity securities 48,324 48,324 — Emerging market equity securities 22,308 22,308 — Large-mid cap equity securities 58,710 58,710 — Small cap equity securities 46,549 46,549 — Institutional mutual funds:
Large-mid cap equity funds 193,552 — 193,552 International equity fund 119,394 — 119,394 Real asset funds 59,137 — 59,137 Emerging market income fund 9,755 — 9,755 Emerging equity fund 6,180 — 6,180 Fixed income sector funds:
Short term fund 14,387 — 14,387 Private ST floating II NAV fund 35,982 — 35,982 U.S. Government portfolio 129,343 — 129,343 Mortgage portfolio 240,930 — 240,930 Municipal portfolio 7,633 — 7,633 Real return bond fund 87,584 — 87,584 Private developing local market fund 3,383 — 3,383 Private emerging markets bond fund 22,192 — 22,192 International portfolio 61,428 — 61,428 High yield portfolio 13,013 — 13,013 Investment grade corporate portfolio 106,449 — 106,449 Asset-backed fund 14,985 — 14,985
$ 1,758,380 249,371 1,509,009

AARP
Notes to Consolidated Financial Statements
December 31, 2011 and 2010
15 (Continued)
Investments as of December 31, 2010 are summarized in the following table by their classification in the fair value hierarchy (in thousands):
Total Level 1 Level 2
Investments:U.S Treasury securities $ 25,747 25,747 — Mortgage-backed fixed income securities 57,016 — 57,016 U.S. corporate fixed income securities 112,852 6,906 105,946 International corporate fixed income securities 48,244 — 48,244 International equity securities 73,892 73,892 — Emerging market equity securities 27,135 27,135 — Small cap equity securities 29,621 29,621 — Institutional mutual funds:
Large-mid cap equity funds 247,487 — 247,487 International equity fund 98,373 — 98,373 Real asset funds 50,798 — 50,798 Emerging market income fund 10,014 — 10,014 Fixed income sector funds:
Short term fund 14,626 — 14,626 Private ST floating II NAV fund 11,692 — 11,692 U.S. Government portfolio 130,029 — 130,029 Mortgage portfolio 298,679 — 298,679 Municipal portfolio 16,666 — 16,666 Real return bond fund 29,127 — 29,127 Private developing local market fund 5,147 — 5,147 Private emerging markets bond fund 21,995 — 21,995 International portfolio 52,349 — 52,349 High yield portfolio 7,305 — 7,305 Investment grade corporate portfolio 120,042 — 120,042 Asset-backed fund 14,629 — 14,629
$ 1,503,465 163,301 1,340,164
Fixed income securities other than U.S. Treasury securities generally do not trade on a daily basis. The fair value estimates of such fixed income securities are based on observable market information rather than market quotes. Accordingly, the estimates of fair value for such fixed income securities as provided by the pricing service are included in the fixed income securities amount disclosed in Level 2 of the hierarchy. The values of U.S. Treasury securities are disclosed in Level 1 based on unadjusted market prices. AARP’s equity securities trade on a major exchange. Accordingly, such equity securities are disclosed in Level 1.
AARP invests in several institutional mutual funds. These funds are not available to retail investors and are not publicly traded however, the underlying investments in these funds are publicly traded. The fair value
AARP
Notes to Consolidated Financial Statements
December 31, 2011 and 2010
16 (Continued)
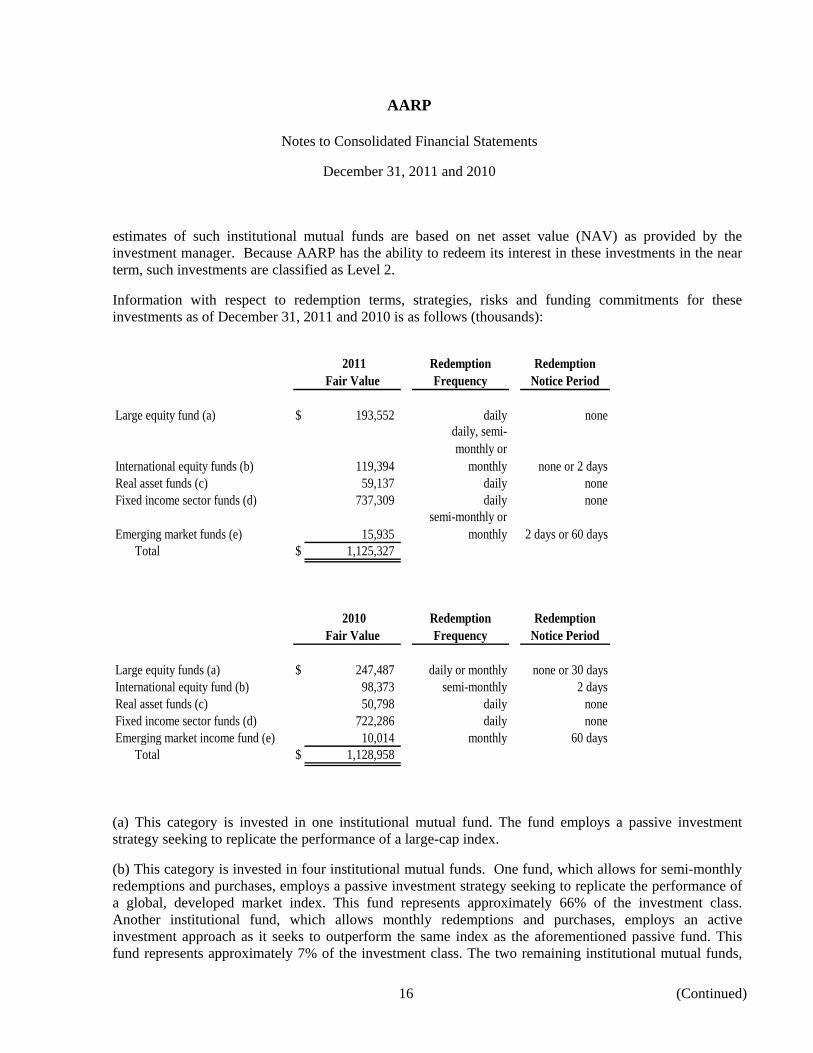
estimates of such institutional mutual funds are based on net asset value (NAV) as provided by the investment manager. Because AARP has the ability to redeem its interest in these investments in the near term, such investments are classified as Level 2.
Information with respect to redemption terms, strategies, risks and funding commitments for these investments as of December 31, 2011 and 2010 is as follows (thousands):
2011 Fair Value
Redemption Frequency
Redemption Notice Period
Large equity fund (a) $ 193,552 daily none
International equity funds (b) 119,394
daily, semi-monthly or
monthly none or 2 daysReal asset funds (c) 59,137 daily noneFixed income sector funds (d) 737,309 daily none
Emerging market funds (e) 15,935 semi-monthly or
monthly 2 days or 60 days Total $ 1,125,327
2010 Fair Value
Redemption Frequency
Redemption Notice Period
Large equity funds (a) $ 247,487 daily or monthly none or 30 daysInternational equity fund (b) 98,373 semi-monthly 2 daysReal asset funds (c) 50,798 daily noneFixed income sector funds (d) 722,286 daily noneEmerging market income fund (e) 10,014 monthly 60 days
Total $ 1,128,958
(a) This category is invested in one institutional mutual fund. The fund employs a passive investment strategy seeking to replicate the performance of a large-cap index.
(b) This category is invested in four institutional mutual funds. One fund, which allows for semi-monthly redemptions and purchases, employs a passive investment strategy seeking to replicate the performance of a global, developed market index. This fund represents approximately 66% of the investment class. Another institutional fund, which allows monthly redemptions and purchases, employs an active investment approach as it seeks to outperform the same index as the aforementioned passive fund. This fund represents approximately 7% of the investment class. The two remaining institutional mutual funds,

AARP
Notes to Consolidated Financial Statements
December 31, 2011 and 2010
17 (Continued)
which allow for daily purchases and redemptions, are actively managed. One fund seeks to outperform the same index as the two previously mentioned funds while the other fund seeks to outperform a different global, developed market index. The approximate values of these two funds within this asset class are 23% and 4% respectively.
(c) This category is invested in both equity funds and a fixed income fund. The funds can provide inflation protection potential, added diversification outside of equities and fixed income investments, and finally additional sources of absolute return and income. During periods of strong stock market performance, the funds will probably underperform. Additionally macroeconomic trends such as demand for natural resources or demand for real estate can contribute to volatility within this investment class.
(d) This category is handled by one fund manager who employs different sector funds. This fund manager is given wide latitude under mutually-agreed-upon investment guidelines to rotate in and out of sectors, such as mortgages, municipalities, high-yield, etc.
(e) This category is invested in two emerging market institutional funds. One fund employs an active investment strategy of seeking to replicate the performance of a global market index. This fund, which is approximately 61% of the asset class, allows for monthly purchases and redemptions. The other fund employs a passive investment strategy to replicate the performance of a different global benchmark. This fund allows for semi-monthly redemptions and purchases.
AARP did not have any unfunded commitments related to the above investments as of December 31, 2011 and 2010. AARP does not currently hold any Level 3 financial instruments and did not have any significant transfers of assets or liabilities between Levels 1 and 2 of the fair value hierarchy during 2011.
Investment income for the years ended December 31, 2011 and 2010 was as follows (in thousands):
2011 2010
Interest and dividend income $ 46,460 41,309 Net (loss) gain (30,391) 95,407
Total $ 16,069 136,716
Investment income as reported on the consolidated statements of activities was as follows (in thousands):
2011 2010
Investment income $ 17,911 126,411 Investment (loss) gain – sinking fund (1,842) 10,305
Total $ 16,069 136,716
As of December 31, 2011 and 2010, $638,000,000 and $617,000,000 of consolidated investments, respectively, is held by the AARP Insurance Plan for the payment of member insurance premiums.

AARP
Notes to Consolidated Financial Statements
December 31, 2011 and 2010
18 (Continued)
Futures Contracts
The cash position on futures contracts settles daily for changes in their fair value. Realized and unrealized gains and losses based on changes in market values of open futures contracts were fully recognized in the accompanying consolidated statements of activities for the years ended December 31, 2011 and 2010. AARP had no direct exposure to futures contracts at December 31, 2011 and 2010, although they were used in several commingled funds.
(5) Accounts Receivable
Accounts receivable as of December 31 were as follows (in thousands):
2011 2010
Royalties $ 41,471 38,981 Program fees 995 249 Publication advertising 13,488 12,482 Interest and dividends 2,179 1,516 Grants 3,995 6,959 Other 9,247 7,462
Accounts receivable, gross 71,375 67,649
Allowance for doubtful accounts (549) (622) Accounts receivable, net $ 70,826 67,027
(6) Property and Equipment
Property and equipment as of December 31 were as follows (in thousands):
2011 2010
Land $ 55,110 55,110 Buildings and improvements 256,183 254,860 Furniture and equipment 112,408 108,374 Computer software 139,192 111,025 Leasehold improvements 9,070 8,898 Less accumulated depreciation and amortization (255,579) (226,667)
Property and equipment, net $ 316,384 311,600

AARP
Notes to Consolidated Financial Statements
December 31, 2011 and 2010
19 (Continued)
(7) Notes Payable
The carrying amounts of notes payable and other long-term debt as of December 31 were as follows (in thousands):
2011 2010
Fixed rate notes, maturing May 2031, net of discount of $875in 2011 and $895 in 2010 (a) $ 124,125 124,105
Variable rate notes, maturing May 2031 (b) 50,000 50,000 District of Columbia Variable Rate Revenue Bonds, maturing
October 2034 (c) 25,000 25,000 Total notes payable $ 199,125 199,105
The maturity dates of notes payable were as follows (in thousands):
2031 $ 175,000 2034 25,000
$ 200,000
Total interest expense incurred for the years ended December 31, 2011 and 2010 was $9,532,000 and $9,792,000, respectively.
(a) Fixed Rate Notes
On May 1, 2001, AARP, Inc. issued unsecured fixed rate notes in the aggregate amount of $125,000,000 for permanent financing of the AARP Headquarters Building and bearing interest at 7.5%. Interest is payable semi-annually. Based on the borrowing rates currently available to AARP for fixed rate bonds with similar terms and average maturities, the fair value of the $125,000,000 fixed rate debentures is approximately $188,324,000 and $167,828,000 as of December 31, 2011 and 2010, respectively.
(b) Variable Rate Notes
On May 1, 2001, AARP, Inc. issued unsecured variable rate notes in the amount of $75,000,000, for permanent financing of the AARP Headquarters Building. The variable rates were 0.14% and 0.53% at December 31, 2011 and 2010, respectively. Interest is payable monthly. On December 1, 2004, AARP made debt repayments of $25,000,000 on the unsecured variable notes.

AARP
Notes to Consolidated Financial Statements
December 31, 2011 and 2010
20 (Continued)
(c) District of Columbia Variable Rate Revenue Bonds
On October 21, 2004, the Foundation issued 30 year District of Columbia Variable Rate Revenue Bonds Series 2004 in the amount of $25,000,000 to finance the purchase of two condominium units located within the AARP Headquarters Building. The bonds bear interest at a variable rate determined by the Remarketing Agent, based upon market conditions of reselling the bonds in a secondary market sale. Accrued interest is payable monthly. The Foundation may elect at any time to convert to a fixed interest rate. As of December 31, 2011 and 2010, the notes had an interest rate of 0.10% and 0.41% , respectively.
The Foundation has obtained a letter of credit to secure repayment of the bond financing of its office space. The letter of credit constitutes an irrevocable obligation to pay the bond trustee up to an amount equal to the sum of the principal amount of the bonds outstanding, plus an amount equal to interest for 35 days on the principal amount of each bond outstanding.
(d) Revolving Credit Facility
On January 3, 2005, AARP, Inc. obtained an unsecured revolving credit facility with a maximum principal amount of $15,000,000 from a commercial bank. Borrowings under the credit facility bore interest at a floating LIBOR rate plus 92.50 basis points. AARP repaid the outstanding balance on this revolving credit facility and it was not renewed.
On July 17, 2009, AARP Inc. entered into an unsecured revolving credit facility with a maximum principal amount of $50,000,000 from a commercial bank. Borrowings under the credit facility bear interest at a floating LIBOR rate plus 70 basis points. AARP did not draw any funds from this credit facility in 2011 or 2010. The credit facility expires July 15, 2014.
(e) Swap Agreements
AARP Inc. had two interest rate swap agreements (swaps), each covering $25,000,000 of the variable rate notes, which were executed to manage the variability of the interest expense associated with the floating rate debt. Under the swap agreements, AARP paid fixed annual rates of approximately 5.40% and received an amount based on the notional amount of each swap at an interest rate equal to LIBOR. The terms of the swaps provided for net receipt or payment on the first of each month. The swaps were reported at their fair value on the accompanying consolidated statements of financial position as accounts payable and accrued expenses. AARP allowed the swaps to expire in April 2011 and did not renew them.
The net interest accrual, which was the difference between the monthly fixed payment on the swap and the variable receipt from the swap counter-party, was recorded as interest expense together with the interest expense on the fixed rate and other variable rate debt in the accompanying consolidated statements of activities. For the years ended December 31, 2011 and 2010, AARP recognized a gain of $216,000 and $441,000 on the change in fair value of the swaps, respectively. The estimates of fair value for such swaps as provided by an outside valuation firm were considered Level 2 as of December 31, 2010.

AARP
Notes to Consolidated Financial Statements
December 31, 2011 and 2010
21 (Continued)
(f) Board Designated Sinking Fund
In 2001, the AARP Board of Directors authorized the creation and funding of a Sinking Fund for the purpose of repayment of outstanding notes payable. The designated minimum funding is $3,600,000 per year, to be transferred on or about January 1 of each year. The balance in the Sinking Fund as of December 31, 2011 and 2010 was $84,842,000 and $83,083,000, respectively, and the Sinking Fund assets were included in investments in the accompanying consolidated statements of financial position. The Sinking Fund investments had a net investment loss of $1,842,000 for the year ended December 31, 2011 and a net investment gain of $10,305,000 for the year ended December 31, 2010.
(8) Income Taxes
The significant components of the provision for income taxes were as follows for the years ended December 31, 2011 and 2010 (in thousands):
2011 2010
Current:Federal income tax $ 2,908 3,235 State income tax 1,000 1,074
Current income tax expense 3,908 4,309
Deferred:Federal income tax 1,228 (502) State income tax 672 (462)
Deferred income tax expense (benefit) 1,900 (964) Total income tax expense $ 5,808 3,345
The significant components of the net deferred tax asset, which was included in prepaid expenses and other assets at December 31, 2011 and 2010, were as follows (in thousands):
2011 2010
Deferred income tax assets:Employee benefits $ 3,477 3,107 Accrued expenses 1,191 1,205 Deferred revenue 6,914 9,220 Depreciation 110 60
Total deferred income tax assets 11,692 13,592
Deferred income tax liability:Property tax expense (16) (15)
Total deferred income tax liability (16) (15) Net deferred income tax asset $ 11,676 13,577

AARP
Notes to Consolidated Financial Statements
December 31, 2011 and 2010
22 (Continued)
Income taxes paid by AARP, Inc., Financial Services Corp., and AARP Services during 2011 and 2010 totaled $6,580,000 and $9,683,000, respectively, and consisted entirely of estimated federal and state income tax payments.
(9) Grant Revenue
The Foundation and LCE administer grants received from federal agencies and private organizations. The two largest grant programs are described below.
(a) WorkSearch Program
The WorkSearch program provides subsidized assignments and job training for persons 55 and older whose income is at or below 125% of the federal poverty level. The WorkSearch program is primarily funded by the U.S. Department of Labor (DOL) with grants totaling approximately $86 million and $127 million for the years ended December 31, 2011 and 2010, respectively. The current DOL commitment expires in June 2012.
(b) Tax Counseling for the Elderly (Tax-Aide)
Tax-Aide provides volunteer assistance for federal and state income tax preparation assistance to low and moderate income persons throughout the country, with special attention to those 60 and older. The Tax-Aide program is primarily funded by AARP and the Internal Revenue Service (IRS) totaling approximately $6 million and $7 million for the years ended December 31, 2011 and 2010, respectively. The current IRS commitment expires in September 2012.
The continuation of all grant programs beyond expiration of the current agreements is subject to future commitment of funds by sponsoring agencies.
(10) Defined Benefit Pension Plan
Eligible employees of AARP participate in a noncontributory defined benefit pension plan called the AARP Employees’ Pension Plan (the Plan). The Plan covers all employees meeting eligibility service requirements. AARP’s funding policy is to contribute an amount equal to or greater than the minimum funding requirements of the Employee Retirement Income Security Act of 1974, as actuarially determined, calculated on a level percentage of payroll costs basis, but not greater than the maximum tax deductible limit. Plan assets are invested in equity and fixed income securities managed by outside fund managers.
In 2011 and 2010, employer contributions to the Plan were $30,000,000 in each year. AARP was required to make annual minimum contributions of $13,500,000 and $18,100,000 in 2011 and 2010, respectively. AARP plans to make a discretionary $30,000,000 contribution in 2012.

AARP
Notes to Consolidated Financial Statements
December 31, 2011 and 2010
23 (Continued)
The components of net periodic pension benefit cost for the years ended December 31, 2011 and 2010 were as follows (in thousands):
2011 2010
Service cost $ 22,564 18,922 Interest cost 28,503 25,413 Expected return on plan assets (28,901) (25,183) Amortization of actuarial loss 14,582 8,248 Amortization of prior service cost 193 193
$ 36,941 27,593
The following sets forth the funded status of the Plan and accrued pension liability shown in the accompanying consolidated statements of financial position at December 31 (in thousands):
2011 2010
Change in benefit obligation:Benefit obligation at beginning of year $ (508,272) (425,855) Service cost (22,564) (18,922) Interest cost (28,503) (25,413) Actuarial loss (32,880) (49,634) Benefits paid 12,689 11,552
Benefit obligation at end of year (579,530) (508,272)
Change in plan assets:Fair value at beginning of year 418,416 347,442 Actual return on plan assets (4,972) 52,526 Contribution to the plan 30,000 30,000 Benefits paid (12,689) (11,552)
Fair value at end of year 430,755 418,416 Accrued pension liability $ (148,775) (89,856)
At December 31, 2011 and 2010, the accumulated benefit obligation was $518,716,000 and $462,170,000, respectively.

AARP
Notes to Consolidated Financial Statements
December 31, 2011 and 2010
24 (Continued)
The assumptions used to determine the benefit obligation in the actuarial valuations at the December 31, 2011 and 2010 measurement dates were as follows:
2011 2010
Discount rate 5.18% 5.45%Future salary increases 4.00 4.00
The assumptions used to determine net periodic benefit cost in the actuarial valuations at December 31, 2011 and 2010 measurement dates were as follows:
2011 2010
Discount rate 5.45% 6.00%Expected long-term rate of return on plan assets 7.50 7.50Future salary increases 4.00 4.00
The following benefit payments, which reflect expected future service, are expected to be paid (in thousands):
2012 $ 14,608 2013 16,397 2014 18,333 2015 20,143 2016 22,660 Years 2017 – 2021 151,851
Amounts not yet recognized as a component of net periodic benefit cost for 2011 and 2010 (in thousands):
2011 2010Net actuarial loss $ 177,981 125,810 Prior service cost 346 539
$ 178,327 126,349
Estimated amounts to be amortized into net periodic benefit cost in 2012 are $15,059,000 from actuarial loss and $167,000 from prior service cost.
In order to determine an appropriate return on plan assets, AARP considers its current asset allocation along with historical and expected returns that can be achieved with the various asset types in the Plan. Management believes that the current asset allocation justifies an expected long-term rate of return on plan assets of 7.5%.

AARP
Notes to Consolidated Financial Statements
December 31, 2011 and 2010
25 (Continued)
The weighted average asset allocation for plan assets was as follows at December 31:
2011 2010
Asset categories:Equity securities 64% 68%Debt securities 30 26Alternatives 5 5Cash equivalents 1 1
100% 100%
The targeted allocation of the investment assets in the Plan is for equities to comprise 65% of the investment portfolio, debt securities to comprise 30%, and alternatives to comprise the remaining 5%. These targets are not intended to serve as a rigid constraint on the investment allocation. The following chart sets out the minimum and maximum positions for the various asset classes in the Plan:
Minimum Target Maximum
Asset class:Equity securities 61% 65% 71%Debt securities 24 30 32Alternatives — 5 7Cash equivalents — — 7

AARP
Notes to Consolidated Financial Statements
December 31, 2011 and 2010
26 (Continued)
As of December 31, 2011 and 2010, the fair value measurement of AARP’s pension plan assets by asset category within the fair value hierarchy was as follows (in thousands):
2011 Level 1 Level 2Cash & cash equivalents and receivables $ 5,111 5,111 — Common stocks 98,271 98,271 — Preferred stock 371 371 — Institutional mutual funds
Real asset fund 21,211 — 21,211 Large cap fund 153,554 — 153,554 Mid cap fund 7,686 — 7,686 Emerging market equity fund 14,368 — 14,368 Fixed income sector funds:
Asset-backed securities portfolio 2,671 — 2,671 Emerging markets portfolio 3,930 — 3,930 High yield portfolio 2,320 — 2,320 International portfolio 10,923 — 10,923 Investment grade corporate portfolio 18,963 — 18,963 Mortgage portfolio 43,039 — 43,039 Municipal sector portfolio 1,345 — 1,345 Developing local market porfolio 895 — 895 Various short term portfolios 7,303 — 7,303 Real return portfolio 15,576 — 15,576 US Government sector portfolio 23,218 — 23,218
$ 430,755 103,753 327,002

AARP
Notes to Consolidated Financial Statements
December 31, 2011 and 2010
27 (Continued)
2010 Level 1 Level 2
Cash and cash equivalents and receivables $ 4,605 4,605 — Common stocks 68,782 68,782 — Preferred stock 557 557 — Institutional mutual funds:
Real asset fund 21,146 — 21,146 Fixed income sector funds:
Asset-backed securities portfolio 2,229 — 2,229 Emerging markets portfolio 3,332 — 3,332 High yield portfolio 1,154 — 1,154 International portfolio 7,989 — 7,989 Investment grade corporate portfolio 18,246 — 18,246 Mortgage portfolio 45,306 — 45,306 Municipal sector portfolio 2,440 — 2,440 Developing local market portfolio 787 — 787 Various short term portfolios 3,360 — 3,360 Real return portfolio 4,412 — 4,412 U.S. Government sector portfolio 19,764 — 19,764
Large cap fund 151,305 — 151,305 Mid cap fund 45,519 — 45,519 Emerging market income fund 17,483 — 17,483
$ 418,416 73,944 344,472
The fair values of the institutional mutual funds have been estimated using the net asset value per share of the investment. Information with respect to redemptions, strategies, risks and funding commitments for these investments as of December 31, 2011 and 2010 is as follows (in thousands):
2011 Fair Value
Redemption Frequency
Redemption Notice Period
Real asset funds (a) $ 21,211 daily noneLarge cap fund ( c) 153,554 daily noneMid cap fund (d) 7,686 daily noneEmerging market equity fund (e) 14,368 daily noneFixed income sector funds (b) 130,183 daily none
Total $ 327,002

AARP
Notes to Consolidated Financial Statements
December 31, 2011 and 2010
28 (Continued)
Real asset funds (a) $ 21,146 daily noneLarge cap fund ( c) 151,305 daily noneMid cap fund (d) 45,519 daily noneEmerging market equity fund (e) 17,483 daily noneFixed income sector funds (b) 109,019 daily none
Total $ 344,472
2010 Fair value
Redemption Frequency
Redemption Notice Period
(a) This category is invested in both equity funds and a fixed income fund. The funds can provide inflation protection potential, added diversification outside of equities and fixed income investments, and finally additional sources of absolute return and income. During periods of strong stock market performance, the funds will probably underperform. Additionally macroeconomic trends such as demand for natural resources or demand for real estate can contribute to volatility within this investment class.
(b) This category is invested with one fund manager who employs different sector funds to obtain the highest performance possible. This fund manager is given wide latitude under mutually-agreed-upon investment guidelines to rotate in and out of sectors, such as mortgages, municipalities, high-yield, etc.
(c) This category is invested in a single institutional mutual fund. The fund employs a passive investment strategy of seeking to replicate the performance of a large-cap market index.
(d) This category is invested in a single institutional mutual fund. The fund employs a passive investment strategy of seeking to replicate the performance of a mid-cap market index.
(e) This category is invested in a single institutional mutual fund. The fund is actively managed and seeks to provide returns in excess of a well-established international market index.
The Plan did not have any unfunded commitments related to the above investments as of December 31, 2011 and 2010. The Plan did not have any significant transfers of assets or liabilities between Levels 1 and 2 of the fair value hierarchy during 2011 and 2010.
(11) Postretirement Health Benefits
All employees of AARP and its affiliates may become eligible for continuing health care benefits after retirement if they meet minimum age and service requirements and are covered by an AARP employee health insurance plan at the date of retirement. Healthcare benefits are provided through the AARP Employees’ Welfare Plan.

AARP
Notes to Consolidated Financial Statements
December 31, 2011 and 2010
29 (Continued)
The components of net periodic postretirement health benefit cost for the years ended December 31, 2011 and 2010 are as follows (in thousands):
2011 2010
Service cost $ 2,321 2,388 Interest cost 3,922 4,267 Amortization of actuarial gain (968) (685) Amortization of prior service credit (702) (702)
$ 4,573 5,268
The following sets forth the changes in benefit obligations, changes in plan assets, and the composition of accrued postretirement benefit cost shown in the accompanying consolidated statements of financial position at December 31 (in thousands):
2011 2010
Change in benefit obligation:Benefit obligation at beginning of year $ (73,353) (72,864) Service cost (2,321) (2,388) Interest cost (3,922) (4,267) Actuarial (loss) gain (3,006) 4,272 Participant contributions (366) (278) Benefits paid, net subsidy 2,452 2,172
Benefit obligation at end of year $ (80,516) (73,353)
Change in plan assets:Fair value at beginning of year $ — — Employer contribution 2,378 2,168 Plan participants’ contributions 366 278 Benefits paid (2,744) (2,446)
Fair value at end of year $ — — Accrued postretirement health benefits $ (80,516) (73,353)

AARP
Notes to Consolidated Financial Statements
December 31, 2011 and 2010
30 (Continued)
As of December 31, 2011 and 2010, the weighted average discount rates used in the actuarial valuation were as follows:
2011 2010
End of year benefit obligation 5.14% 5.45%Net periodic benefit cost 5.45% 6.00%
For measurement purposes, the health care cost trend rate was 8% for 2011 and 2010 (the rate is assumed to decrease gradually to 5% in 2017 and remain level thereafter). The following benefit payments are expected to be paid (in thousands):
2012 $ 3,403 2013 3,808 2014 4,228 2015 4,620 2016 4,954 Years 2017 – 2021 31,254
Amounts not yet recognized as a component of net periodic benefit cost at 2011 and 2010 (in thousands):
2011 2010Net actuarial gain $ (12,234) (16,208) Prior service credit (4,988) (5,690)
$ (17,222) (21,898)
Estimated amounts to be amortized into net periodic benefit cost in 2012 are $308,000 from actuarial gain and $702,000 from prior service credit.
The healthcare cost trend rate assumption has a significant impact on the postretirement benefit costs and obligations. A 1% change in the assumed healthcare cost trend rate at December 31, 2011 would have resulted in an $14,025,000 increase or a $11,239,000 decrease in the accumulated postretirement benefit obligation, and a $1,251,000 increase or a $987,000 decrease in the 2011 aggregate service and interest cost.
A 1% change in the assumed healthcare cost trend rate at December 31, 2010 would have resulted in an $11,414,000 increase or a $9,293,000 decrease in the accumulated postretirement benefit obligation, and a $1,374,000 increase or a $1,079,000 decrease in the 2010 aggregate service and interest cost.

AARP
Notes to Consolidated Financial Statements
December 31, 2011 and 2010
31 (Continued)
(12) Employee Health Care Benefits
AARP operates under a “pay as you go” model for employee health benefits, with obligations being funded from general corporate assets. For the years ended December 31, 2011 and 2010, expenses for the AARP Welfare Plan for current health care benefits were $19,387,000 and $19,662,000, respectively. As of December 31, 2011 and 2010, AARP had a liability related to these benefits of $3,416,000 and $3,554,000, respectively, which was included in accounts payable and accrued expenses on the accompanying consolidated statements of financial position.
(13) Defined Contribution Plan
Effective January 1, 1998, AARP and certain affiliates participate in a single-employer defined contribution plan through the AARP Employees’ 401(k) Plan.
AARP provides an employer contribution to the 401(k) Plan, which matches 100% of employee contributions up to 3% of employee compensation, and 50% of employee contributions for the next 2% of employee compensation, up to the maximum limit allowed by law. For the years ended December 31, 2011 and 2010, AARP employer contributions to this plan totaled $8,075,000 and $9,068,000, respectively.
(14) Board Designated Unrestricted Net Assets
Board designated net assets at December 31, 2011 and 2010 were available to fund the following (in thousands):
2011 2010
Debt retirement sinking fund $ 84,842 83,083 Investment earnings reserve 318,740 291,030 Foundation quasi-endowment 14,790 15,218 Foundation board designated operating reserve 23,445 19,016 LCE quasi-endowments 3,075 2,988 Other board designations — 61
Board designated net assets $ 444,892 411,396
(15) Temporarily Restricted Net Assets
Temporarily restricted net assets consist of amounts restricted for use for specific program purposes and assets available for future periods.
(16) Commitments and Contingencies
(a) Lease Commitments
AARP leases offices, information centers, and warehouse facilities in 96 locations in the U.S. and its territories under operating leases with various lease terms. Total rent expense incurred under operating leases was $20,142,000 and $19,422,000 in 2011 and 2010, respectively.

AARP
Notes to Consolidated Financial Statements
December 31, 2011 and 2010
32
Future minimum lease payments, exclusive of additional operating costs, at December 31, 2011 are (in thousands):
2012 $ 19,486 2013 17,960 2014 12,562 2015 10,409 2016 7,314 2017 – 2022 32,047
Total $ 99,778
(b) Contingencies
In the normal course of business, AARP is subject to various claims and lawsuits. Certain lawsuits may be covered, in full or in part, by external insurance coverage. The amount of loss from these lawsuits could not be estimated as of December 31, 2011.
(17) Subsequent Events
In preparing these financial statements, AARP has evaluated events and transactions for potential recognition or disclosure through the date the financial statements were issued, March 23, 2012.