Embed Size (px)
Citation preview
www.ocpgroup.ma
CONSOLIDATED FINANCIAL STATEMENTS
AT 30 JUNE 2016
Key figures and significant events of the periodKEY FIGURES 4
SIGNIFICANT EVENTS OF THE PERIOD 4
POST-REPORTING PERIOD EVENTS 4
Consolidated financial statementsCONSOLIDATED STATEMENT OF PROFIT AND LOSS 5
CONSOLIDATED STATEMENT OF COMPREHENSIVE INCOME 6
CONSOLIDATED STATEMENT OF FINANCIAL POSITION 6
CONSOLIDATED STATEMENT OF CHANGES IN EQUITY 8
CONSOLIDATED CASH FLOW STATEMENT 10
Notes to consolidated financial statementsNOTE 1 - ACCOUNTING RULES AND METHODS 11
NOTE 2 - CONSOLIDATION SCOPE 12
NOTE 3 - INFORMATION BY OPERATING SEGMENT 13
NOTE 4 - OPERATIONAL ITEMS 15
NOTE 5 - EXPENSES AND EMPLOYEE BENEFITS 18
NOTE 6 - COMPANIES ACCOUNTED FOR UNDER THE EQUITY METHOD: ASSOCIATES AND JOINT VENTURES 20
NOTE 7 - OTHER OPERATING ITEMS 23
NOTE 8 - PROPERTY, PLANT AND EQUIPMENT AND INTANGIBLE ASSETS 24
NOTE 9 - PROVISIONS & CONTINGENT LIABILITIES 26
NOTE 10 - FINANCIAL INSTRUMENTS, NET DEBT AND NET COST OF FINANCING 27
NOTE 11 - CORPORATE INCOME TAXES 34
NOTE 12 - EQUITY, DIVIDENDS AND EARNINGS PER SHARE 35
NOTE 13 - RELATIONS WITH THE MOROCCAN STATE 36
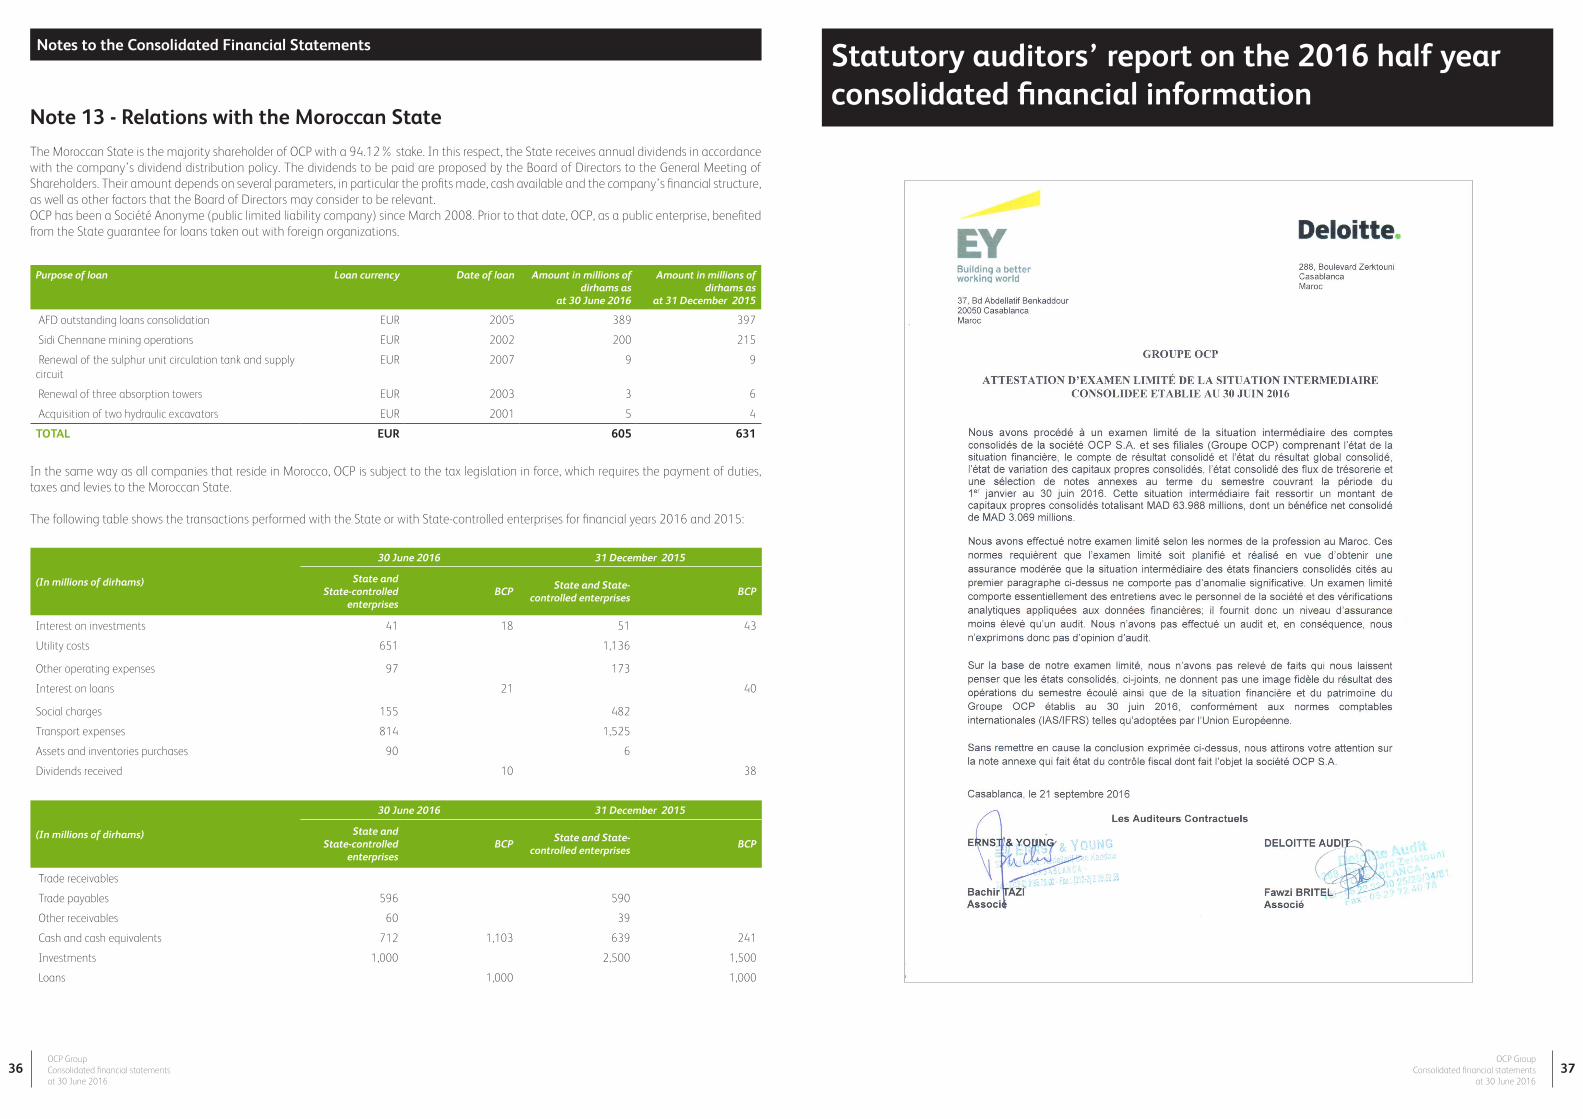
Statutory auditors’ report on the 2016 half year consolidated financial informationSTATUTORY AUDITORS’ REPORT ON THE 2016 HALF YEAR CONSOLIDATED FINANCIAL INFORMATION 37
Contents
OCP Group Consolidated financial statements
at 30 June 2016
OCP Group Consolidated financial statementsat 30 June 2016
4 5
Key figures and significant events of the period
Significant events of the period
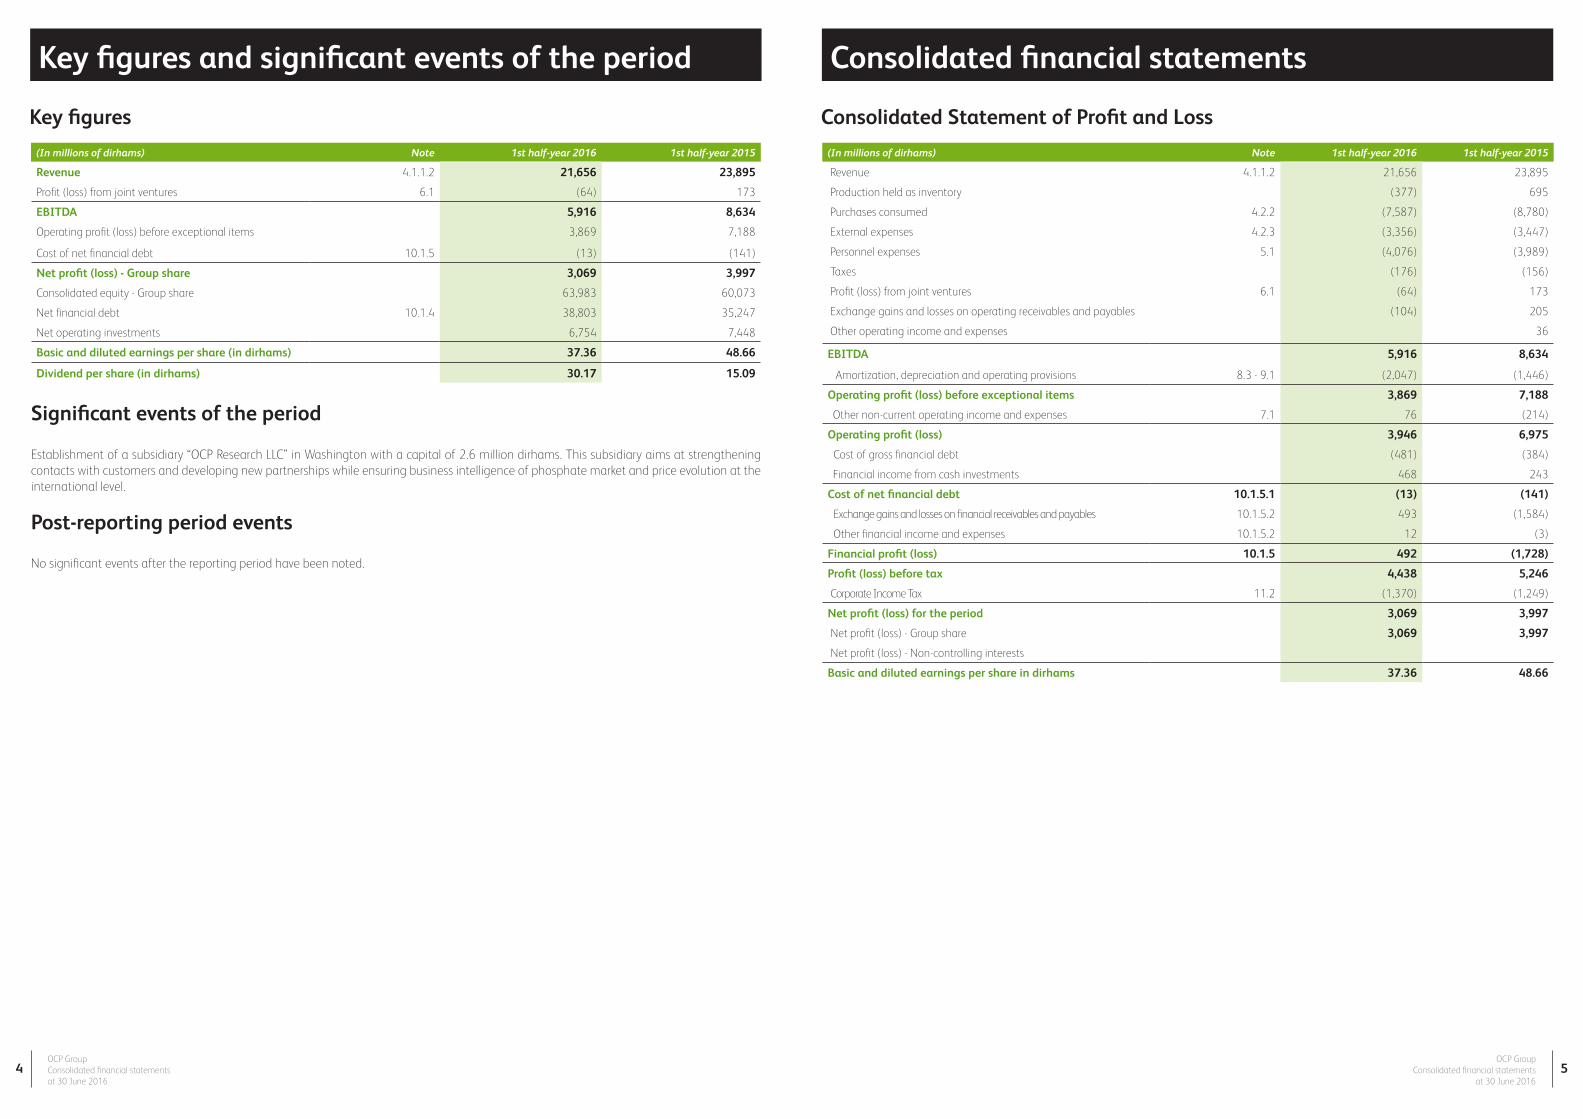
Establishment of a subsidiary “OCP Research LLC” in Washington with a capital of 2.6 million dirhams. This subsidiary aims at strengthening contacts with customers and developing new partnerships while ensuring business intelligence of phosphate market and price evolution at the international level.
Post-reporting period events
No significant events after the reporting period have been noted.
(In millions of dirhams) Note 1st half-year 2016 1st half-year 2015
Revenue 4.1.1.2 21,656 23,895
Profit (loss) from joint ventures 6.1 (64) 173
EBITDA 5,916 8,634
Operating profit (loss) before exceptional items 3,869 7,188
Cost of net financial debt 10.1.5 (13) (141)
Net profit (loss) - Group share 3,069 3,997
Consolidated equity - Group share 63,983 60,073
Net financial debt 10.1.4 38,803 35,247
Net operating investments 6,754 7,448
Basic and diluted earnings per share (in dirhams) 37.36 48.66
Dividend per share (in dirhams) 30.17 15.09
(In millions of dirhams) Note 1st half-year 2016 1st half-year 2015
Revenue 4.1.1.2 21,656 23,895
Production held as inventory (377) 695
Purchases consumed 4.2.2 (7,587) (8,780)
External expenses 4.2.3 (3,356) (3,447)
Personnel expenses 5.1 (4,076) (3,989)
Taxes (176) (156)
Profit (loss) from joint ventures 6.1 (64) 173
Exchange gains and losses on operating receivables and payables (104) 205
Other operating income and expenses 36
EBITDA 5,916 8,634
Amortization, depreciation and operating provisions 8.3 - 9.1 (2,047) (1,446)
Operating profit (loss) before exceptional items 3,869 7,188
Other non-current operating income and expenses 7.1 76 (214)
Operating profit (loss) 3,946 6,975
Cost of gross financial debt (481) (384)
Financial income from cash investments 468 243
Cost of net financial debt 10.1.5.1 (13) (141)
Exchange gains and losses on financial receivables and payables 10.1.5.2 493 (1,584)
Other financial income and expenses 10.1.5.2 12 (3)
Financial profit (loss) 10.1.5 492 (1,728)
Profit (loss) before tax 4,438 5,246
Corporate Income Tax 11.2 (1,370) (1,249)
Net profit (loss) for the period 3,069 3,997
Net profit (loss) - Group share 3,069 3,997
Net profit (loss) - Non-controlling interests
Basic and diluted earnings per share in dirhams 37.36 48.66
Consolidated financial statements
Consolidated Statement of Profit and LossKey figures
OCP Group Consolidated financial statements
at 30 June 2016
OCP Group Consolidated financial statementsat 30 June 2016
6 7
(In millions of dirhams) 1st half-year 2016 1st half-year 2015
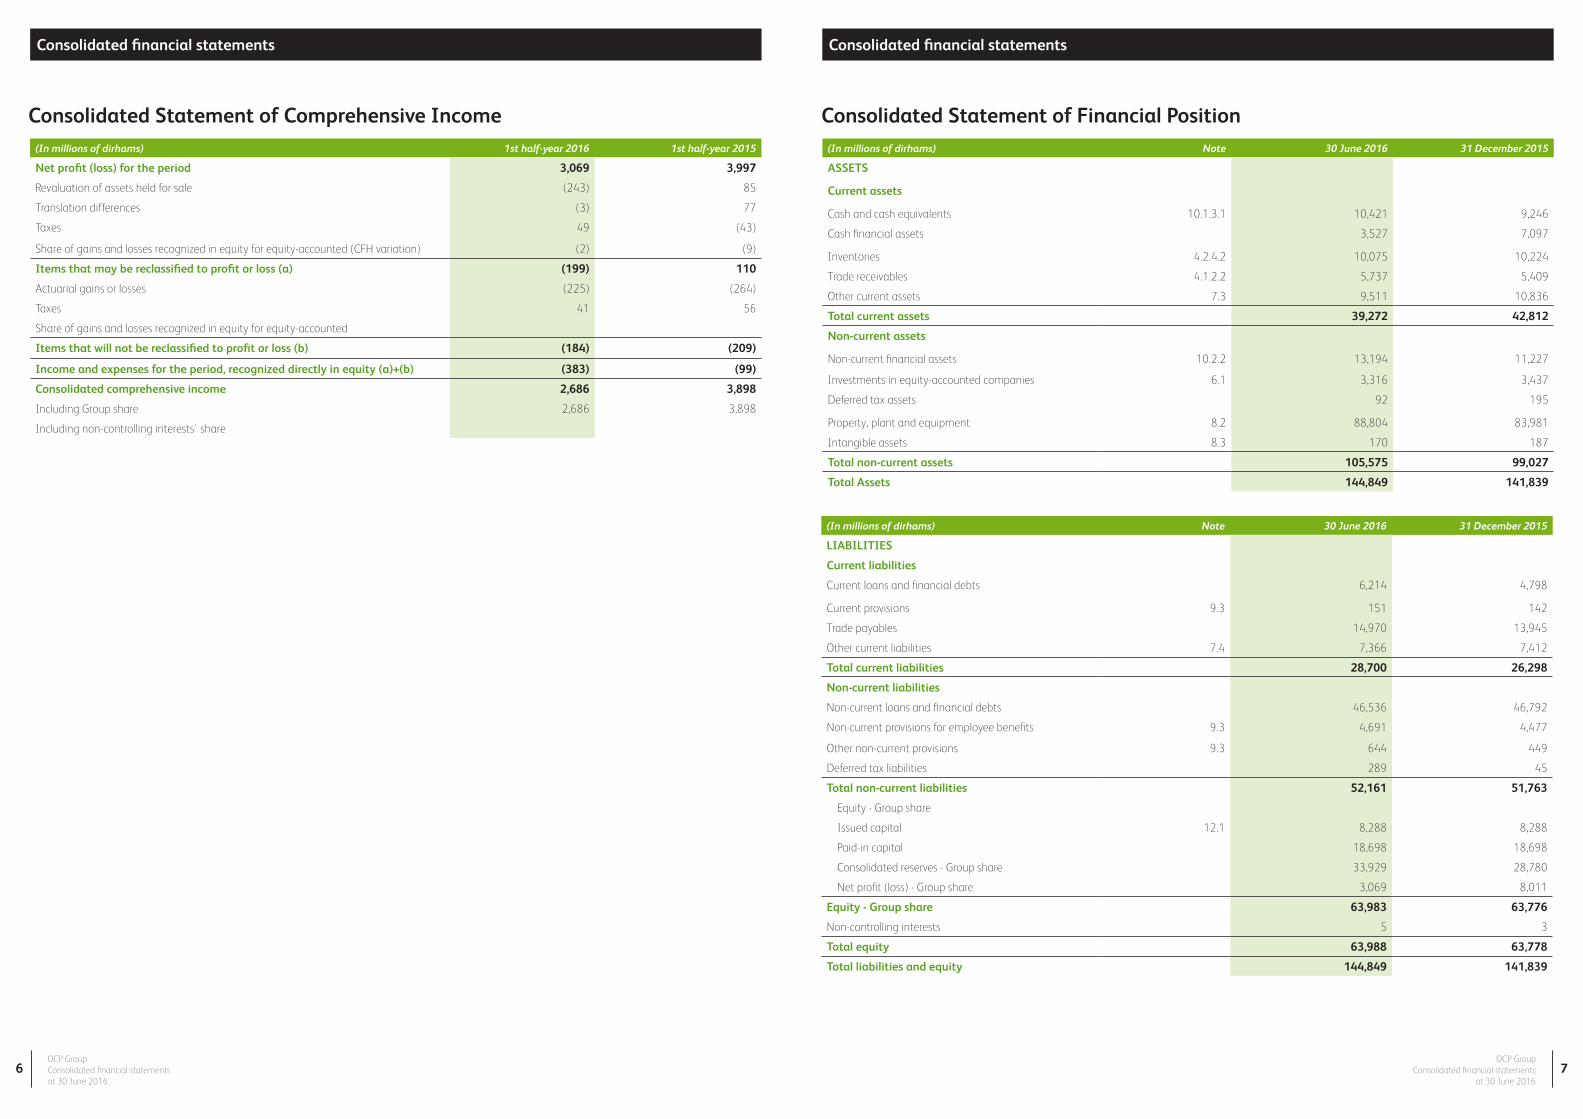
Net profit (loss) for the period 3,069 3,997
Revaluation of assets held for sale (243) 85
Translation differences (3) 77
Taxes 49 (43)
Share of gains and losses recognized in equity for equity-accounted (CFH variation) (2) (9)
Items that may be reclassified to profit or loss (a) (199) 110
Actuarial gains or losses (225) (264)
Taxes 41 56
Share of gains and losses recognized in equity for equity-accounted
Items that will not be reclassified to profit or loss (b) (184) (209)
Income and expenses for the period, recognized directly in equity (a)+(b) (383) (99)
Consolidated comprehensive income 2,686 3,898
Including Group share 2,686 3,898
Including non-controlling interests' share
(In millions of dirhams) Note 30 June 2016 31 December 2015
ASSETS
Current assets
Cash and cash equivalents 10.1.3.1 10,421 9,246
Cash financial assets 3,527 7,097
Inventories 4.2.4.2 10,075 10,224
Trade receivables 4.1.2.2 5,737 5,409
Other current assets 7.3 9,511 10,836
Total current assets 39,272 42,812
Non-current assets
Non-current financial assets 10.2.2 13,194 11,227
Investments in equity-accounted companies 6.1 3,316 3,437
Deferred tax assets 92 195
Property, plant and equipment 8.2 88,804 83,981
Intangible assets 8.3 170 187
Total non-current assets 105,575 99,027
Total Assets 144,849 141,839
Consolidated Statement of Financial PositionConsolidated Statement of Comprehensive Income
Consolidated financial statements Consolidated financial statements
(In millions of dirhams) Note 30 June 2016 31 December 2015
LIABILITIES
Current liabilities
Current loans and financial debts 6,214 4,798
Current provisions 9.3 151 142
Trade payables 14,970 13,945
Other current liabilities 7.4 7,366 7,412
Total current liabilities 28,700 26,298
Non-current liabilities
Non-current loans and financial debts 46,536 46,792
Non-current provisions for employee benefits 9.3 4,691 4,477
Other non-current provisions 9.3 644 449
Deferred tax liabilities 289 45
Total non-current liabilities 52,161 51,763
Equity - Group share
Issued capital 12.1 8,288 8,288
Paid-in capital 18,698 18,698
Consolidated reserves - Group share 33,929 28,780
Net profit (loss) - Group share 3,069 8,011
Equity - Group share 63,983 63,776
Non-controlling interests 5 3
Total equity 63,988 63,778
Total liabilities and equity 144,849 141,839
OCP Group Consolidated financial statements
at 30 June 2016
OCP Group Consolidated financial statementsat 30 June 2016
8 9
(In millions of dirhams) Issued capital Paid-in capitalActuarial gains or
lossesOther consolidated
reservesTranslation difference Assets held for sale
Share of gains and losses recognized in
equity for equity-accounted (CFH
variation)
Net profit (loss)Total equity - Group
share Non-controlling
interests Total equity
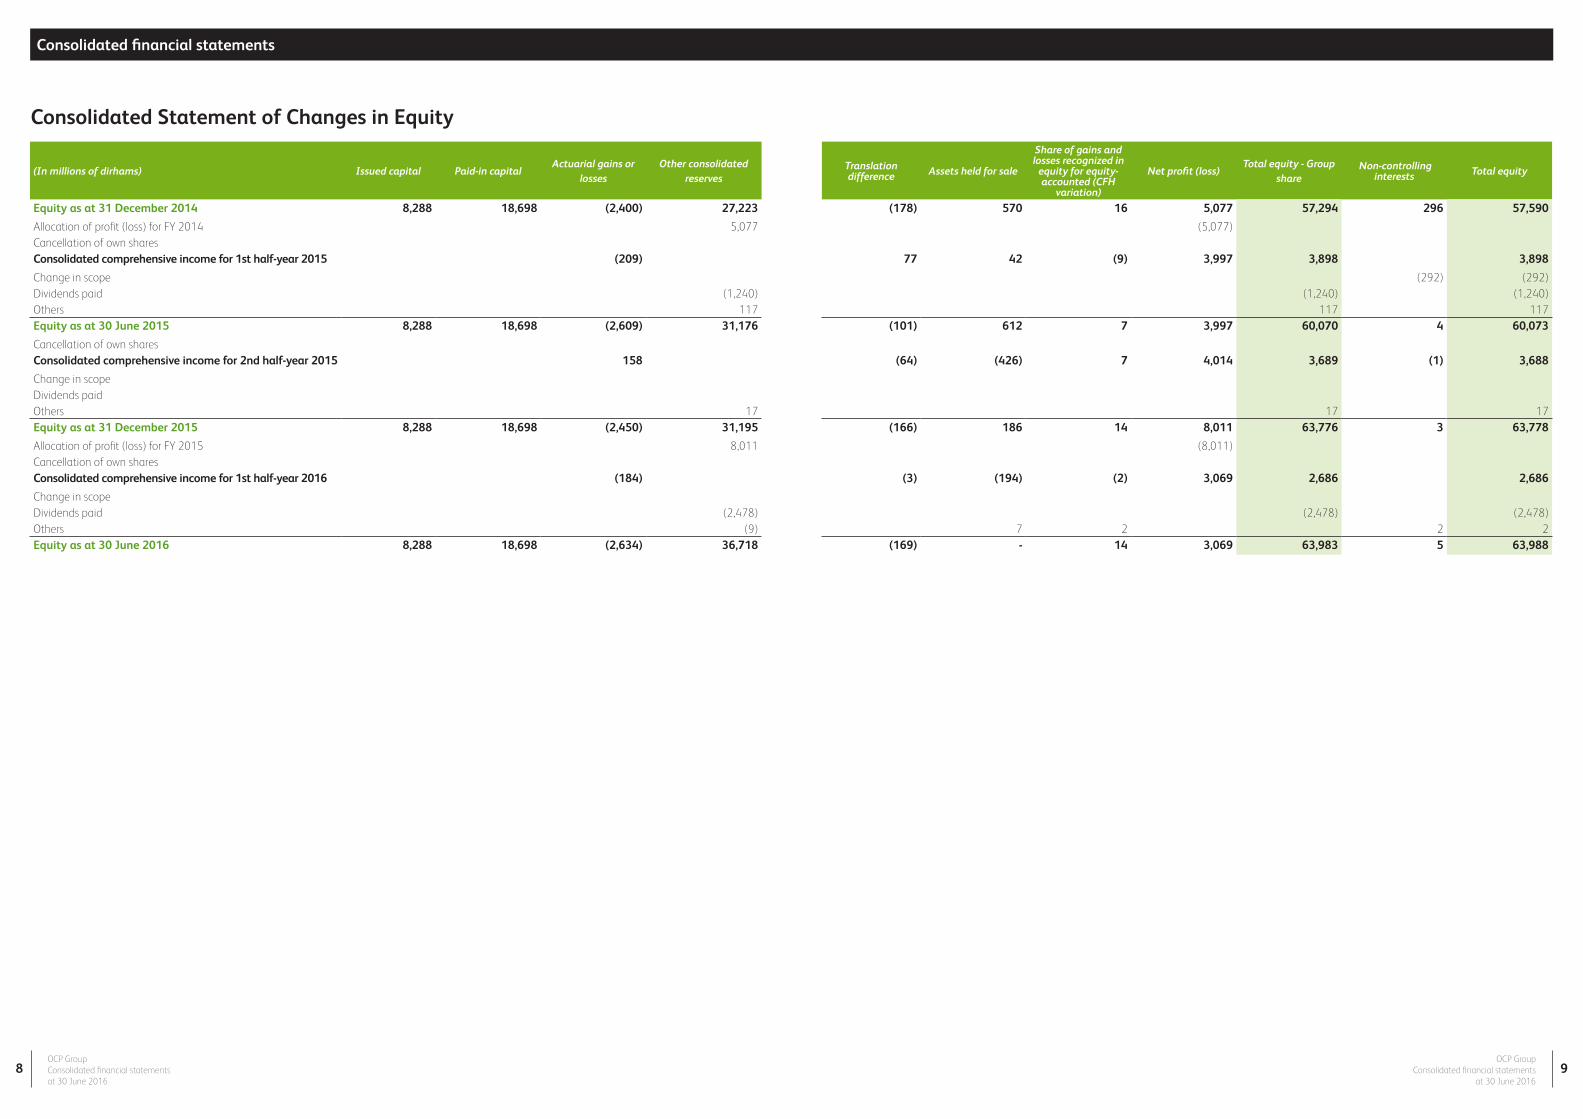
Equity as at 31 December 2014 8,288 18,698 (2,400) 27,223 (178) 570 16 5,077 57,294 296 57,590
Allocation of profit (loss) for FY 2014 5,077 (5,077) Cancellation of own shares Consolidated comprehensive income for 1st half-year 2015 (209) 77 42 (9) 3,997 3,898 3,898
Change in scope (292) (292) Dividends paid (1,240) (1,240) (1,240) Others 117 117 117 Equity as at 30 June 2015 8,288 18,698 (2,609) 31,176 (101) 612 7 3,997 60,070 4 60,073
Cancellation of own shares Consolidated comprehensive income for 2nd half-year 2015 158 (64) (426) 7 4,014 3,689 (1) 3,688
Change in scope Dividends paid Others 17 17 17 Equity as at 31 December 2015 8,288 18,698 (2,450) 31,195 (166) 186 14 8,011 63,776 3 63,778
Allocation of profit (loss) for FY 2015 8,011 (8,011) Cancellation of own shares Consolidated comprehensive income for 1st half-year 2016 (184) (3) (194) (2) 3,069 2,686 2,686
Change in scope Dividends paid (2,478) (2,478) (2,478) Others (9) 7 2 2 2 Equity as at 30 June 2016 8,288 18,698 (2,634) 36,718 (169) - 14 3,069 63,983 5 63,988
Consolidated Statement of Changes in Equity
Consolidated financial statements
OCP Group Consolidated financial statements
at 30 June 2016
OCP Group Consolidated financial statementsat 30 June 2016
10 11
(In millions of dirhams) Note 1st half-year 2016 1st half-year 2015 FY 2015
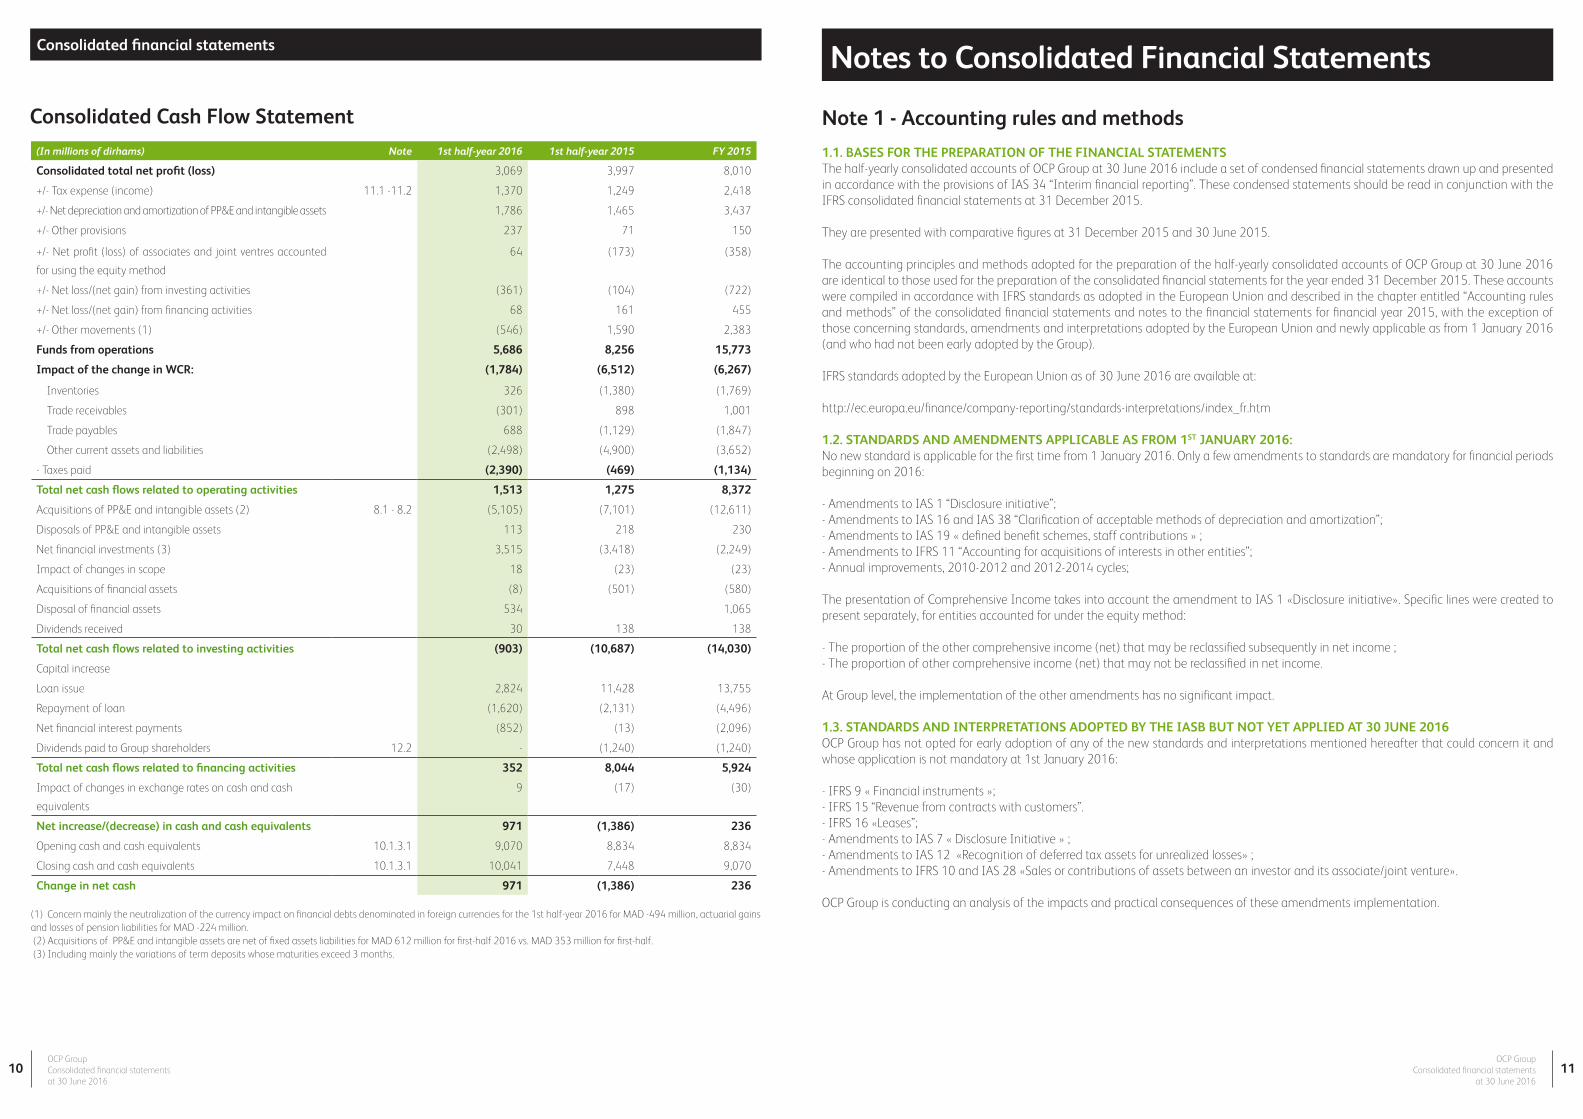
Consolidated total net profit (loss) 3,069 3,997 8,010
+/- Tax expense (income) 11.1 -11.2 1,370 1,249 2,418
+/- Net depreciation and amortization of PP&E and intangible assets 1,786 1,465 3,437
+/- Other provisions 237 71 150
+/- Net profit (loss) of associates and joint ventres accounted
for using the equity method
64 (173) (358)
+/- Net loss/(net gain) from investing activities (361) (104) (722)
+/- Net loss/(net gain) from financing activities 68 161 455
+/- Other movements (1) (546) 1,590 2,383
Funds from operations 5,686 8,256 15,773
Impact of the change in WCR: (1,784) (6,512) (6,267)
Inventories 326 (1,380) (1,769)
Trade receivables (301) 898 1,001
Trade payables 688 (1,129) (1,847)
Other current assets and liabilities (2,498) (4,900) (3,652)
- Taxes paid (2,390) (469) (1,134)
Total net cash flows related to operating activities 1,513 1,275 8,372
Acquisitions of PP&E and intangible assets (2) 8.1 - 8.2 (5,105) (7,101) (12,611)
Disposals of PP&E and intangible assets 113 218 230
Net financial investments (3) 3,515 (3,418) (2,249)
Impact of changes in scope 18 (23) (23)
Acquisitions of financial assets (8) (501) (580)
Disposal of financial assets 534 1,065
Dividends received 30 138 138
Total net cash flows related to investing activities (903) (10,687) (14,030)
Capital increase
Loan issue 2,824 11,428 13,755
Repayment of loan (1,620) (2,131) (4,496)
Net financial interest payments (852) (13) (2,096)
Dividends paid to Group shareholders 12.2 - (1,240) (1,240)
Total net cash flows related to financing activities 352 8,044 5,924
Impact of changes in exchange rates on cash and cash
equivalents
9 (17) (30)
Net increase/(decrease) in cash and cash equivalents 971 (1,386) 236
Opening cash and cash equivalents 10.1.3.1 9,070 8,834 8,834
Closing cash and cash equivalents 10.1.3.1 10,041 7,448 9,070
Change in net cash 971 (1,386) 236
Consolidated Cash Flow Statement
(1) Concern mainly the neutralization of the currency impact on financial debts denominated in foreign currencies for the 1st half-year 2016 for MAD -494 million, actuarial gains and losses of pension liabilities for MAD -224 million. (2) Acquisitions of PP&E and intangible assets are net of fixed assets liabilities for MAD 612 million for first-half 2016 vs. MAD 353 million for first-half. (3) Including mainly the variations of term deposits whose maturities exceed 3 months.
Notes to Consolidated Financial Statements
Note 1 - Accounting rules and methods
1.1. BASES FOR THE PREPARATION OF THE FINANCIAL STATEMENTSThe half-yearly consolidated accounts of OCP Group at 30 June 2016 include a set of condensed financial statements drawn up and presented in accordance with the provisions of IAS 34 “Interim financial reporting”. These condensed statements should be read in conjunction with the IFRS consolidated financial statements at 31 December 2015.
They are presented with comparative figures at 31 December 2015 and 30 June 2015.
The accounting principles and methods adopted for the preparation of the half-yearly consolidated accounts of OCP Group at 30 June 2016 are identical to those used for the preparation of the consolidated financial statements for the year ended 31 December 2015. These accounts were compiled in accordance with IFRS standards as adopted in the European Union and described in the chapter entitled “Accounting rules and methods” of the consolidated financial statements and notes to the financial statements for financial year 2015, with the exception of those concerning standards, amendments and interpretations adopted by the European Union and newly applicable as from 1 January 2016 (and who had not been early adopted by the Group).
IFRS standards adopted by the European Union as of 30 June 2016 are available at:
http://ec.europa.eu/finance/company-reporting/standards-interpretations/index_fr.htm
1.2. STANDARDS AND AMENDMENTS APPLICABLE AS FROM 1ST JANUARY 2016: No new standard is applicable for the first time from 1 January 2016. Only a few amendments to standards are mandatory for financial periods beginning on 2016:
- Amendments to IAS 1 “Disclosure initiative”; - Amendments to IAS 16 and IAS 38 “Clarification of acceptable methods of depreciation and amortization”;- Amendments to IAS 19 « defined benefit schemes, staff contributions » ; - Amendments to IFRS 11 “Accounting for acquisitions of interests in other entities”; - Annual improvements, 2010-2012 and 2012-2014 cycles;
The presentation of Comprehensive Income takes into account the amendment to IAS 1 «Disclosure initiative». Specific lines were created to present separately, for entities accounted for under the equity method:
- The proportion of the other comprehensive income (net) that may be reclassified subsequently in net income ;- The proportion of other comprehensive income (net) that may not be reclassified in net income.
At Group level, the implementation of the other amendments has no significant impact.
1.3. STANDARDS AND INTERPRETATIONS ADOPTED BY THE IASB BUT NOT YET APPLIED AT 30 JUNE 2016OCP Group has not opted for early adoption of any of the new standards and interpretations mentioned hereafter that could concern it and whose application is not mandatory at 1st January 2016:
- IFRS 9 « Financial instruments »;- IFRS 15 “Revenue from contracts with customers”. - IFRS 16 «Leases”;- Amendments to IAS 7 « Disclosure Initiative » ; - Amendments to IAS 12 «Recognition of deferred tax assets for unrealized losses» ;- Amendments to IFRS 10 and IAS 28 «Sales or contributions of assets between an investor and its associate/joint venture».
OCP Group is conducting an analysis of the impacts and practical consequences of these amendments implementation.
Consolidated financial statements
OCP Group Consolidated financial statements
at 30 June 2016
OCP Group Consolidated financial statementsat 30 June 2016
12 13
Note 2 - Consolidation scope
2.1. CONSOLIDATION SCOPE
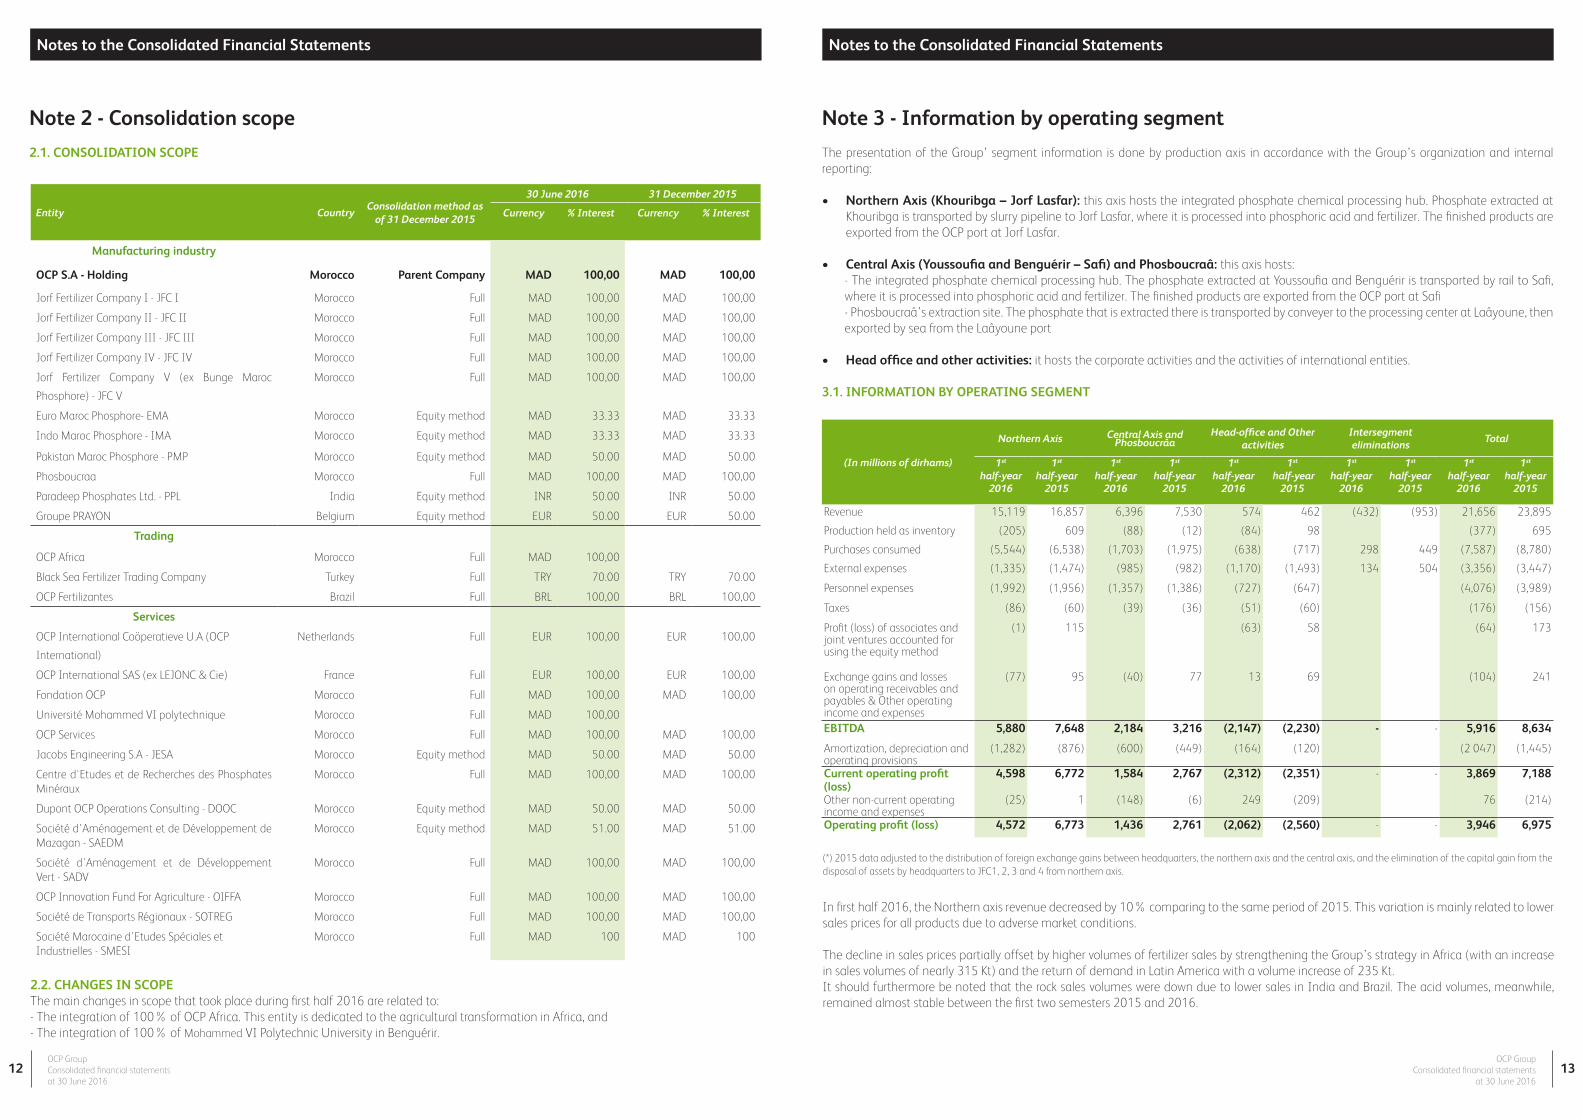
2.2. CHANGES IN SCOPEThe main changes in scope that took place during first half 2016 are related to:- The integration of 100% of OCP Africa. This entity is dedicated to the agricultural transformation in Africa, and- The integration of 100% of Mohammed VI Polytechnic University in Benguérir.
In first half 2016, the Northern axis revenue decreased by 10% comparing to the same period of 2015. This variation is mainly related to lower sales prices for all products due to adverse market conditions.
The decline in sales prices partially offset by higher volumes of fertilizer sales by strengthening the Group’s strategy in Africa (with an increase in sales volumes of nearly 315 Kt) and the return of demand in Latin America with a volume increase of 235 Kt.It should furthermore be noted that the rock sales volumes were down due to lower sales in India and Brazil. The acid volumes, meanwhile, remained almost stable between the first two semesters 2015 and 2016.
Entity CountryConsolidation method as
of 31 December 2015
30 June 2016 31 December 2015
Currency % Interest Currency % Interest
Manufacturing industry
OCP S.A - Holding Morocco Parent Company MAD 100,00 MAD 100,00
Jorf Fertilizer Company I - JFC I Morocco Full MAD 100,00 MAD 100,00
Jorf Fertilizer Company II - JFC II Morocco Full MAD 100,00 MAD 100,00
Jorf Fertilizer Company III - JFC III Morocco Full MAD 100,00 MAD 100,00
Jorf Fertilizer Company IV - JFC IV Morocco Full MAD 100,00 MAD 100,00
Jorf Fertilizer Company V (ex Bunge Maroc
Phosphore) - JFC V
Morocco Full MAD 100,00 MAD 100,00
Euro Maroc Phosphore- EMA Morocco Equity method MAD 33.33 MAD 33.33
Indo Maroc Phosphore - IMA Morocco Equity method MAD 33.33 MAD 33.33
Pakistan Maroc Phosphore - PMP Morocco Equity method MAD 50.00 MAD 50.00
Phosboucraa Morocco Full MAD 100,00 MAD 100,00
Paradeep Phosphates Ltd. - PPL India Equity method INR 50.00 INR 50.00
Groupe PRAYON Belgium Equity method EUR 50.00 EUR 50.00
Trading
OCP Africa Morocco Full MAD 100,00
Black Sea Fertilizer Trading Company Turkey Full TRY 70.00 TRY 70.00
OCP Fertilizantes Brazil Full BRL 100,00 BRL 100,00
Services
OCP International Coöperatieve U.A (OCP
International)
Netherlands Full EUR 100,00 EUR 100,00
OCP International SAS (ex LEJONC & Cie) France Full EUR 100,00 EUR 100,00
Fondation OCP Morocco Full MAD 100,00 MAD 100,00
Université Mohammed VI polytechnique Morocco Full MAD 100,00
OCP Services Morocco Full MAD 100,00 MAD 100,00
Jacobs Engineering S.A - JESA Morocco Equity method MAD 50.00 MAD 50.00
Centre d'Etudes et de Recherches des Phosphates Minéraux
Morocco Full MAD 100,00 MAD 100,00
Dupont OCP Operations Consulting - DOOC Morocco Equity method MAD 50.00 MAD 50.00
Société d'Aménagement et de Développement de Mazagan - SAEDM
Morocco Equity method MAD 51.00 MAD 51.00
Société d'Aménagement et de Développement Vert - SADV
Morocco Full MAD 100,00 MAD 100,00
OCP Innovation Fund For Agriculture - OIFFA Morocco Full MAD 100,00 MAD 100,00
Société de Transports Régionaux - SOTREG Morocco Full MAD 100,00 MAD 100,00
Société Marocaine d'Etudes Spéciales et Industrielles - SMESI
Morocco Full MAD 100 MAD 100
Note 3 - Information by operating segment
The presentation of the Group’ segment information is done by production axis in accordance with the Group’s organization and internal reporting:
• Northern Axis (Khouribga – Jorf Lasfar): this axis hosts the integrated phosphate chemical processing hub. Phosphate extracted at Khouribga is transported by slurry pipeline to Jorf Lasfar, where it is processed into phosphoric acid and fertilizer. The finished products are exported from the OCP port at Jorf Lasfar.
• Central Axis (Youssoufia and Benguérir – Safi) and Phosboucraâ: this axis hosts:- The integrated phosphate chemical processing hub. The phosphate extracted at Youssoufia and Benguérir is transported by rail to Safi, where it is processed into phosphoric acid and fertilizer. The finished products are exported from the OCP port at Safi- Phosboucraâ’s extraction site. The phosphate that is extracted there is transported by conveyer to the processing center at Laâyoune, then exported by sea from the Laâyoune port
• Head office and other activities: it hosts the corporate activities and the activities of international entities.
3.1. INFORMATION BY OPERATING SEGMENT
(In millions of dirhams)
Northern Axis Central Axis and Phosboucrâa
Head-office and Other activities
Intersegment eliminations
Total
1st half-year
2016
1st half-year
2015
1st half-year
2016
1st half-year
2015
1st half-year
2016
1st half-year
2015
1st half-year
2016
1st half-year
2015
1st half-year
2016
1st half-year
2015
Revenue 15,119 16,857 6,396 7,530 574 462 (432) (953) 21,656 23,895
Production held as inventory (205) 609 (88) (12) (84) 98 (377) 695
Purchases consumed (5,544) (6,538) (1,703) (1,975) (638) (717) 298 449 (7,587) (8,780)
External expenses (1,335) (1,474) (985) (982) (1,170) (1,493) 134 504 (3,356) (3,447)
Personnel expenses (1,992) (1,956) (1,357) (1,386) (727) (647) (4,076) (3,989)
Taxes (86) (60) (39) (36) (51) (60) (176) (156)
Profit (loss) of associates and joint ventures accounted for using the equity method
(1) 115 (63) 58 (64) 173
Exchange gains and losses on operating receivables and payables & Other operating income and expenses
(77) 95 (40) 77 13 69 (104) 241
EBITDA 5,880 7,648 2,184 3,216 (2,147) (2,230) - - 5,916 8,634
Amortization, depreciation and operating provisions
(1,282) (876) (600) (449) (164) (120) (2 047) (1,445)
Current operating profit (loss)
4,598 6,772 1,584 2,767 (2,312) (2,351) - - 3,869 7,188
Other non-current operating income and expenses
(25) 1 (148) (6) 249 (209) 76 (214)
Operating profit (loss) 4,572 6,773 1,436 2,761 (2,062) (2,560) - - 3,946 6,975
(*) 2015 data adjusted to the distribution of foreign exchange gains between headquarters, the northern axis and the central axis, and the elimination of the capital gain from the disposal of assets by headquarters to JFC1, 2, 3 and 4 from northern axis.
Notes to the Consolidated Financial Statements Notes to the Consolidated Financial Statements
OCP Group Consolidated financial statements
at 30 June 2016
OCP Group Consolidated financial statementsat 30 June 2016
14 15
The Northern axis production held as inventory was down, reflecting the destocking of fertilizer and lower raw material costs which impacts the cost of inventory valuation.
The Central axis shows the same trends of lower volumes and prices as the Northern axis.
Purchases consumed of Northern and Central axis show a decrease of 14% due to the decline in commodity prices.
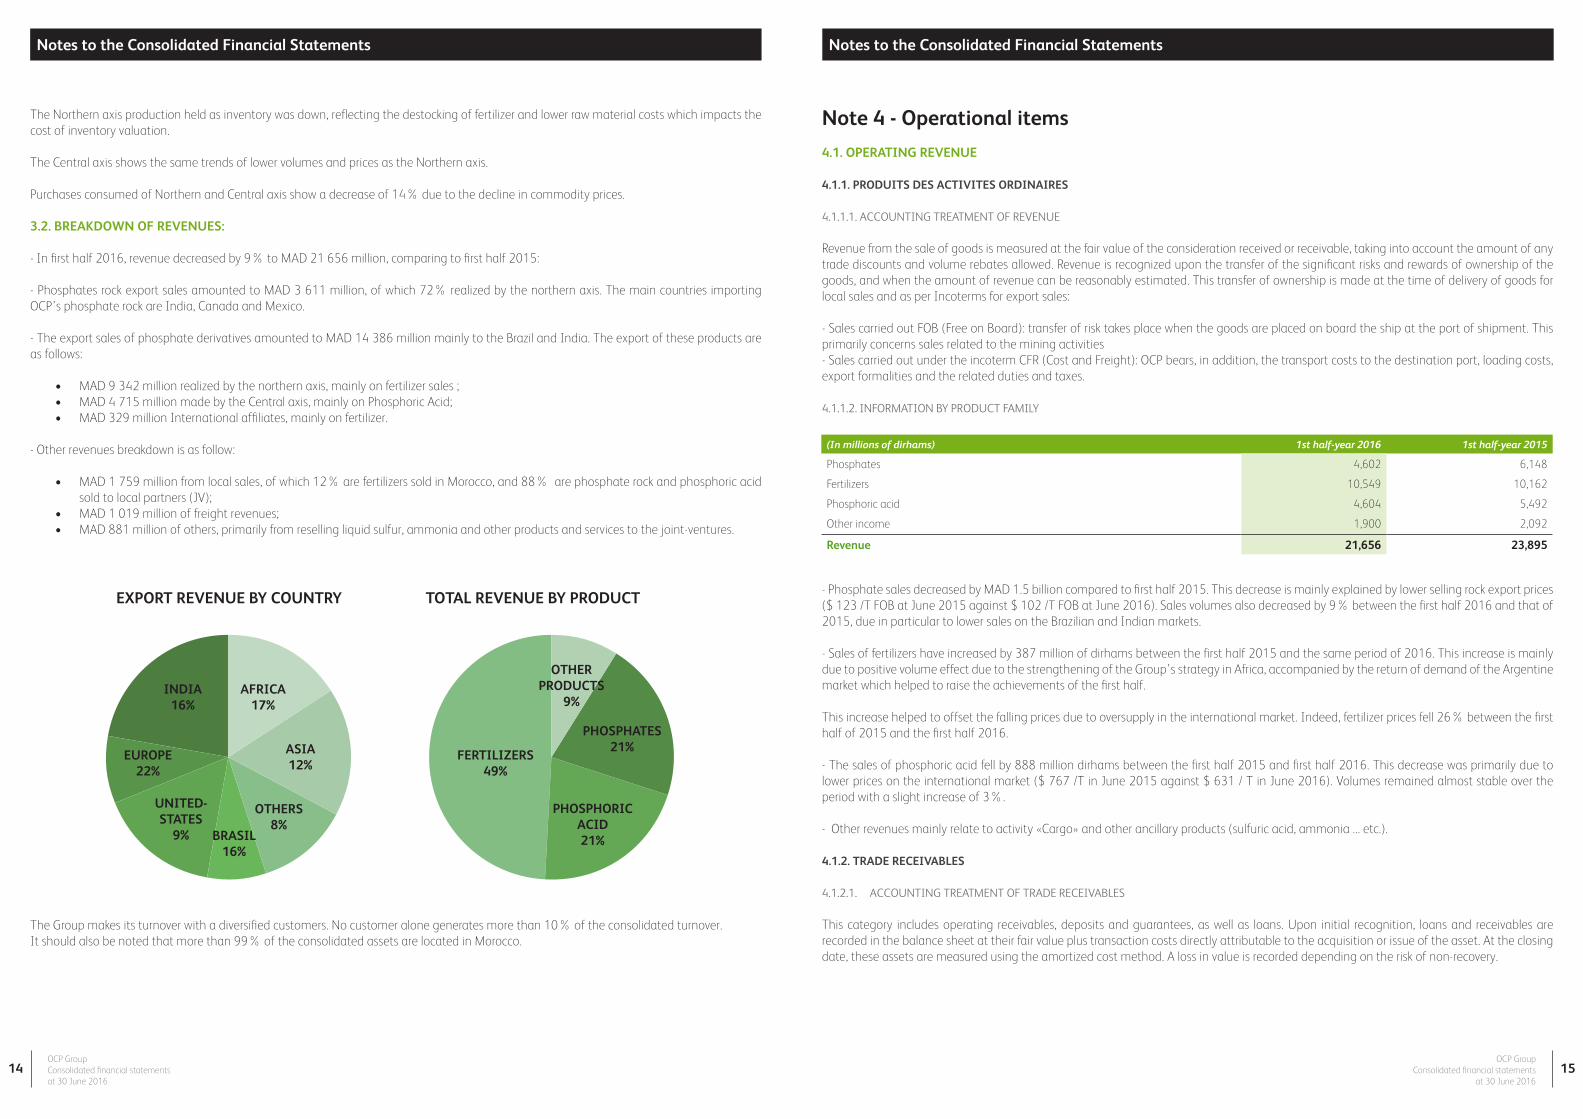
3.2. BREAKDOWN OF REVENUES: - In first half 2016, revenue decreased by 9% to MAD 21 656 million, comparing to first half 2015:
- Phosphates rock export sales amounted to MAD 3 611 million, of which 72% realized by the northern axis. The main countries importing OCP’s phosphate rock are India, Canada and Mexico.
- The export sales of phosphate derivatives amounted to MAD 14 386 million mainly to the Brazil and India. The export of these products are as follows:
• MAD 9 342 million realized by the northern axis, mainly on fertilizer sales ;• MAD 4 715 million made by the Central axis, mainly on Phosphoric Acid;• MAD 329 million International affiliates, mainly on fertilizer.
- Other revenues breakdown is as follow:
• MAD 1 759 million from local sales, of which 12% are fertilizers sold in Morocco, and 88% are phosphate rock and phosphoric acid sold to local partners (JV);
• MAD 1 019 million of freight revenues;• MAD 881 million of others, primarily from reselling liquid sulfur, ammonia and other products and services to the joint-ventures.
The Group makes its turnover with a diversified customers. No customer alone generates more than 10% of the consolidated turnover.It should also be noted that more than 99% of the consolidated assets are located in Morocco.
Note 4 - Operational items
4.1. OPERATING REVENUE
4.1.1. PRODUITS DES ACTIVITES ORDINAIRES
4.1.1.1. ACCOUNTING TREATMENT OF REVENUE
Revenue from the sale of goods is measured at the fair value of the consideration received or receivable, taking into account the amount of any trade discounts and volume rebates allowed. Revenue is recognized upon the transfer of the significant risks and rewards of ownership of the goods, and when the amount of revenue can be reasonably estimated. This transfer of ownership is made at the time of delivery of goods for local sales and as per Incoterms for export sales:
- Sales carried out FOB (Free on Board): transfer of risk takes place when the goods are placed on board the ship at the port of shipment. This primarily concerns sales related to the mining activities- Sales carried out under the incoterm CFR (Cost and Freight): OCP bears, in addition, the transport costs to the destination port, loading costs, export formalities and the related duties and taxes.
4.1.1.2. INFORMATION BY PRODUCT FAMILY
- Phosphate sales decreased by MAD 1.5 billion compared to first half 2015. This decrease is mainly explained by lower selling rock export prices ($ 123 /T FOB at June 2015 against $ 102 /T FOB at June 2016). Sales volumes also decreased by 9% between the first half 2016 and that of 2015, due in particular to lower sales on the Brazilian and Indian markets.
- Sales of fertilizers have increased by 387 million of dirhams between the first half 2015 and the same period of 2016. This increase is mainly due to positive volume effect due to the strengthening of the Group’s strategy in Africa, accompanied by the return of demand of the Argentine market which helped to raise the achievements of the first half.
This increase helped to offset the falling prices due to oversupply in the international market. Indeed, fertilizer prices fell 26% between the first half of 2015 and the first half 2016.
- The sales of phosphoric acid fell by 888 million dirhams between the first half 2015 and first half 2016. This decrease was primarily due to lower prices on the international market ($ 767 /T in June 2015 against $ 631 / T in June 2016). Volumes remained almost stable over the period with a slight increase of 3%.
- Other revenues mainly relate to activity «Cargo» and other ancillary products (sulfuric acid, ammonia ... etc.).
4.1.2. TRADE RECEIVABLES
4.1.2.1. ACCOUNTING TREATMENT OF TRADE RECEIVABLES
This category includes operating receivables, deposits and guarantees, as well as loans. Upon initial recognition, loans and receivables are recorded in the balance sheet at their fair value plus transaction costs directly attributable to the acquisition or issue of the asset. At the closing date, these assets are measured using the amortized cost method. A loss in value is recorded depending on the risk of non-recovery.
EXPORT REVENUE BY COUNTRY
OTHERPRODUCTS
9%
PHOSPHATES21%
PHOSPHORIC ACID21%
FERTILIZERS49%
INDIA16%
AFRICA17%
ASIA12%
OTHERS8%
BRASIL16%
UNITED-STATES
9%
EUROPE22%
TOTAL REVENUE BY PRODUCT
(In millions of dirhams) 1st half-year 2016 1st half-year 2015
Phosphates 4,602 6,148
Fertilizers 10,549 10,162
Phosphoric acid 4,604 5,492
Other income 1,900 2,092
Revenue 21,656 23,895
Notes to the Consolidated Financial Statements Notes to the Consolidated Financial Statements
OCP Group Consolidated financial statements
at 30 June 2016
OCP Group Consolidated financial statementsat 30 June 2016
16 17
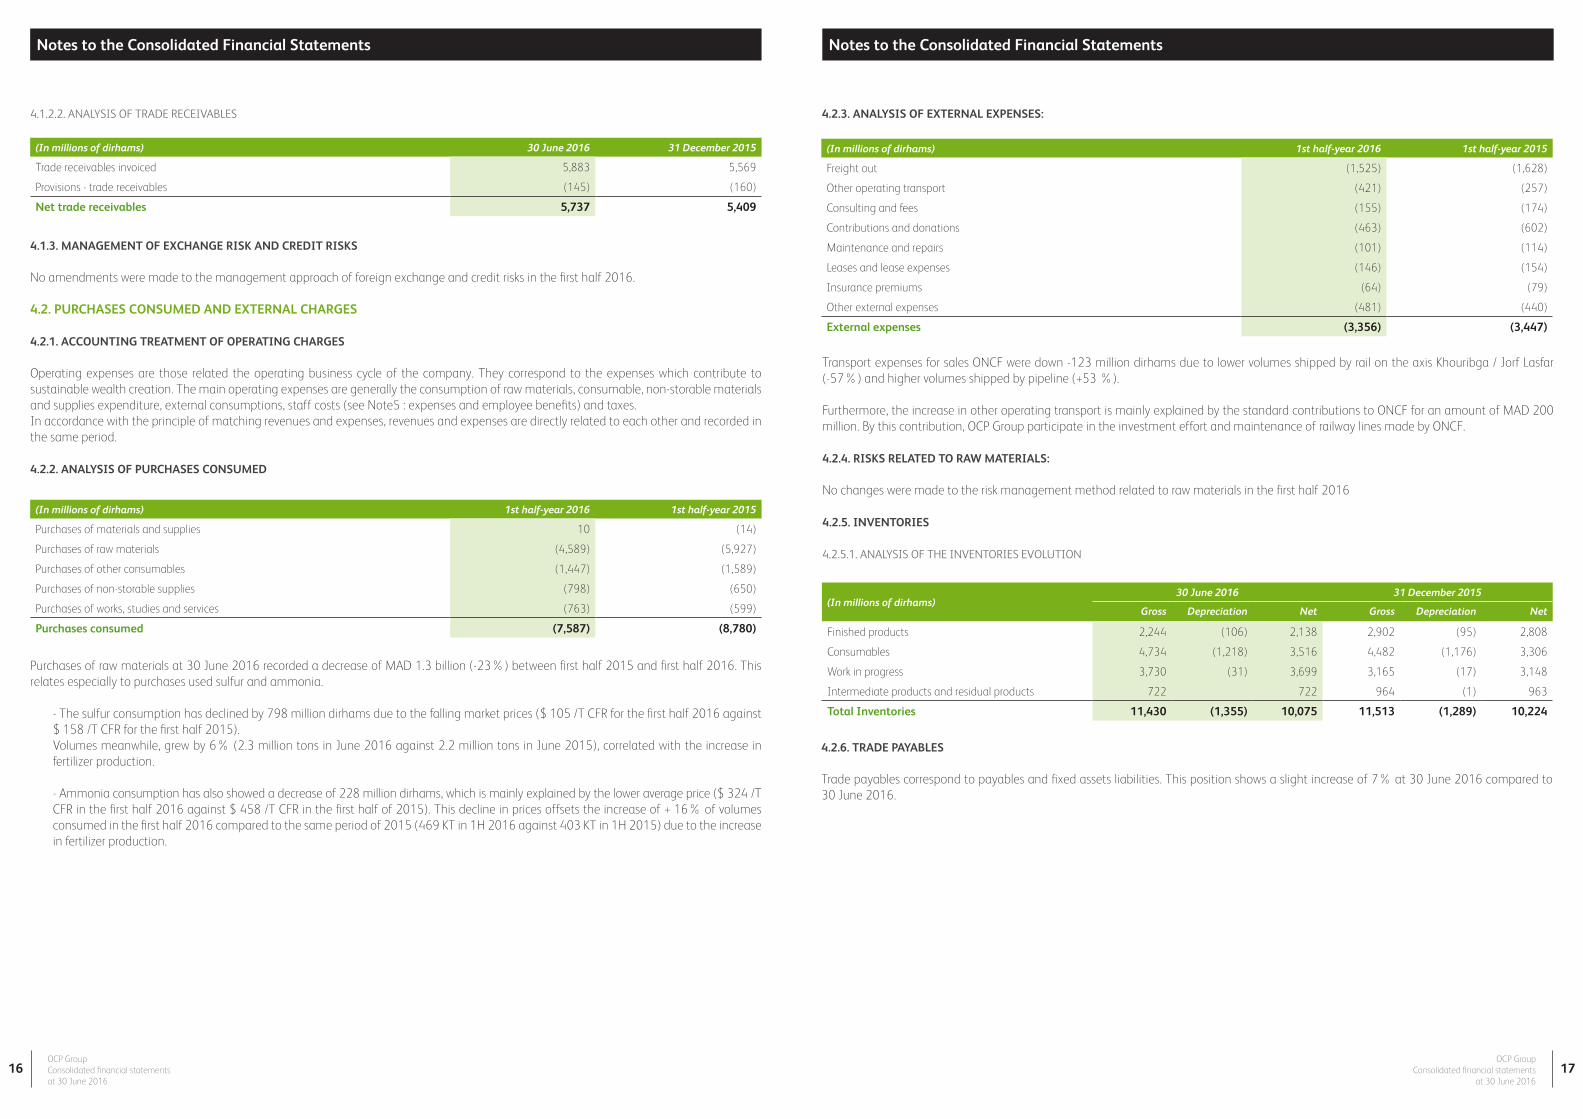
4.1.2.2. ANALYSIS OF TRADE RECEIVABLES
(In millions of dirhams) 30 June 2016 31 December 2015
Trade receivables invoiced 5,883 5,569
Provisions - trade receivables (145) (160)
Net trade receivables 5,737 5,409
(In millions of dirhams) 1st half-year 2016 1st half-year 2015
Purchases of materials and supplies 10 (14)
Purchases of raw materials (4,589) (5,927)
Purchases of other consumables (1,447) (1,589)
Purchases of non-storable supplies (798) (650)
Purchases of works, studies and services (763) (599)
Purchases consumed (7,587) (8,780)
(In millions of dirhams)30 June 2016 31 December 2015
Gross Depreciation Net Gross Depreciation Net
Finished products 2,244 (106) 2,138 2,902 (95) 2,808
Consumables 4,734 (1,218) 3,516 4,482 (1,176) 3,306
Work in progress 3,730 (31) 3,699 3,165 (17) 3,148
Intermediate products and residual products 722 722 964 (1) 963
Total Inventories 11,430 (1,355) 10,075 11,513 (1,289) 10,224
(In millions of dirhams) 1st half-year 2016 1st half-year 2015
Freight out (1,525) (1,628)
Other operating transport (421) (257)
Consulting and fees (155) (174)
Contributions and donations (463) (602)
Maintenance and repairs (101) (114)
Leases and lease expenses (146) (154)
Insurance premiums (64) (79)
Other external expenses (481) (440)
External expenses (3,356) (3,447)
4.1.3. MANAGEMENT OF EXCHANGE RISK AND CREDIT RISKS
No amendments were made to the management approach of foreign exchange and credit risks in the first half 2016.
4.2. PURCHASES CONSUMED AND EXTERNAL CHARGES
4.2.1. ACCOUNTING TREATMENT OF OPERATING CHARGES
Operating expenses are those related the operating business cycle of the company. They correspond to the expenses which contribute to sustainable wealth creation. The main operating expenses are generally the consumption of raw materials, consumable, non-storable materials and supplies expenditure, external consumptions, staff costs (see Note5 : expenses and employee benefits) and taxes.In accordance with the principle of matching revenues and expenses, revenues and expenses are directly related to each other and recorded in the same period.
4.2.2. ANALYSIS OF PURCHASES CONSUMED
Purchases of raw materials at 30 June 2016 recorded a decrease of MAD 1.3 billion (-23%) between first half 2015 and first half 2016. This relates especially to purchases used sulfur and ammonia.
- The sulfur consumption has declined by 798 million dirhams due to the falling market prices ($ 105 /T CFR for the first half 2016 against $ 158 /T CFR for the first half 2015).Volumes meanwhile, grew by 6% (2.3 million tons in June 2016 against 2.2 million tons in June 2015), correlated with the increase in fertilizer production.
- Ammonia consumption has also showed a decrease of 228 million dirhams, which is mainly explained by the lower average price ($ 324 /T CFR in the first half 2016 against $ 458 /T CFR in the first half of 2015). This decline in prices offsets the increase of + 16% of volumes consumed in the first half 2016 compared to the same period of 2015 (469 KT in 1H 2016 against 403 KT in 1H 2015) due to the increase in fertilizer production.
Transport expenses for sales ONCF were down -123 million dirhams due to lower volumes shipped by rail on the axis Khouribga / Jorf Lasfar (-57%) and higher volumes shipped by pipeline (+53 %).
Furthermore, the increase in other operating transport is mainly explained by the standard contributions to ONCF for an amount of MAD 200 million. By this contribution, OCP Group participate in the investment effort and maintenance of railway lines made by ONCF.
4.2.4. RISKS RELATED TO RAW MATERIALS:
No changes were made to the risk management method related to raw materials in the first half 2016
4.2.5. INVENTORIES
4.2.5.1. ANALYSIS OF THE INVENTORIES EVOLUTION
4.2.6. TRADE PAYABLES
Trade payables correspond to payables and fixed assets liabilities. This position shows a slight increase of 7% at 30 June 2016 compared to 30 June 2016.
4.2.3. ANALYSIS OF EXTERNAL EXPENSES:
Notes to the Consolidated Financial Statements Notes to the Consolidated Financial Statements
OCP Group Consolidated financial statements
at 30 June 2016
OCP Group Consolidated financial statementsat 30 June 2016
18 19
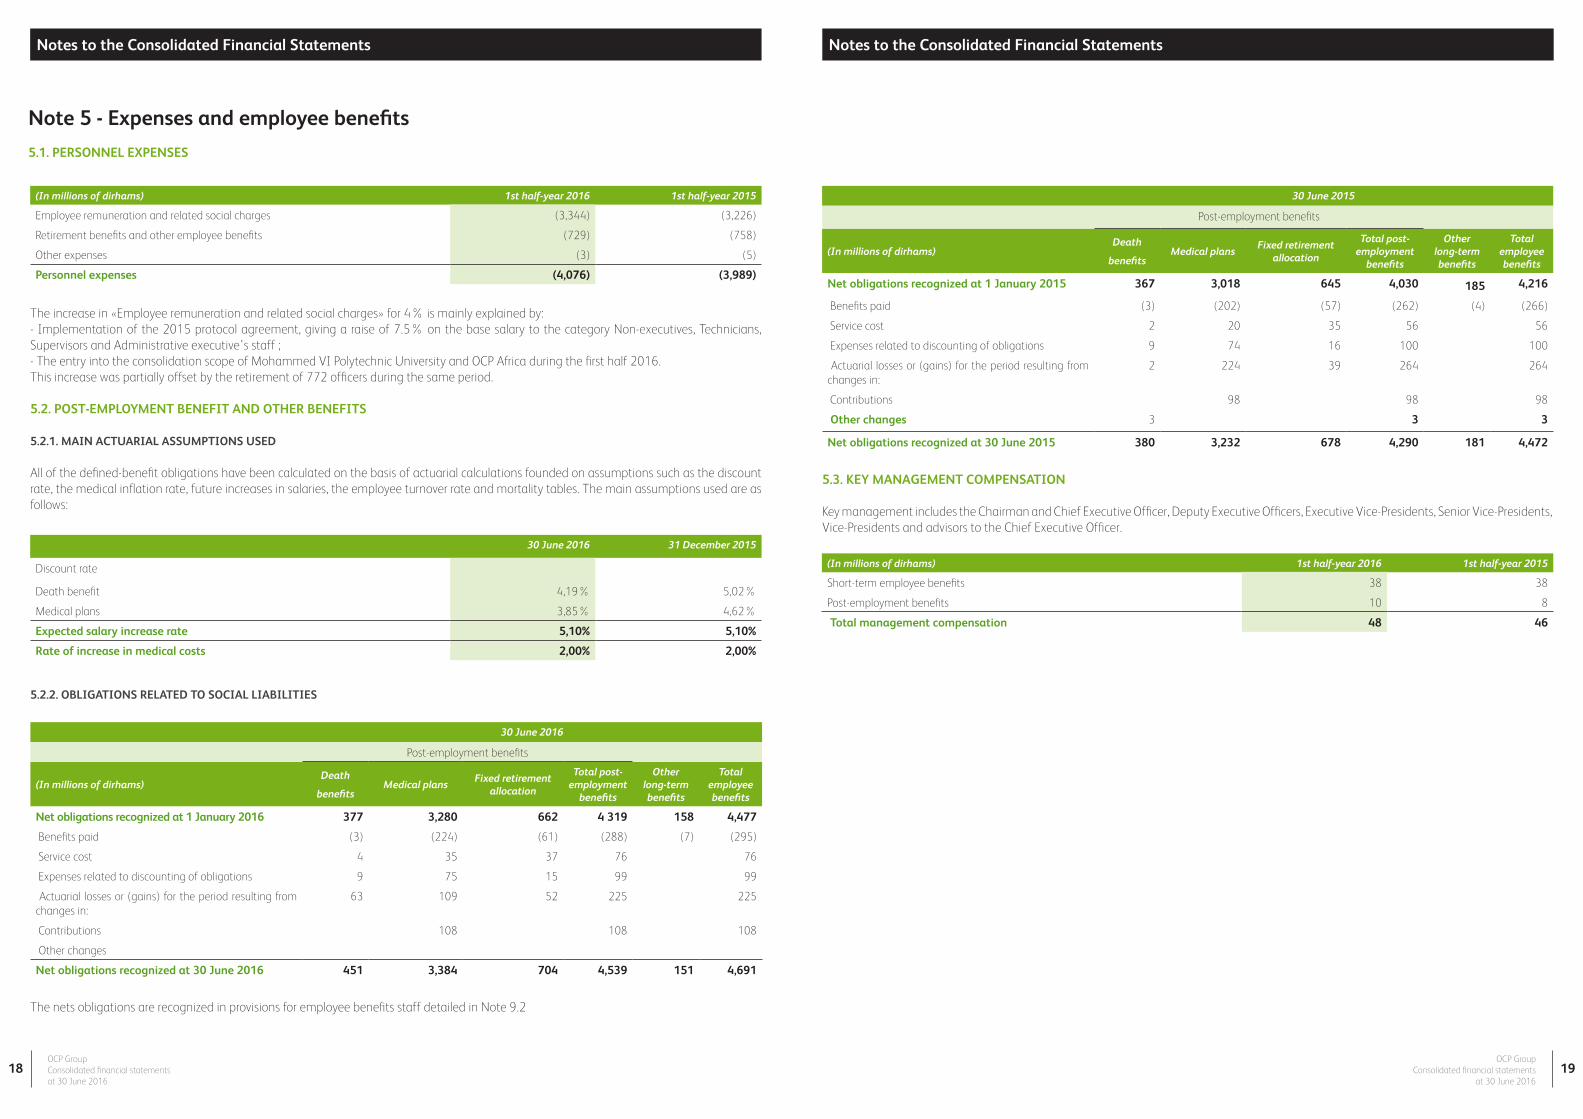
5.2.2. OBLIGATIONS RELATED TO SOCIAL LIABILITIES
30 June 2016
Post-employment benefits
(In millions of dirhams)Death
benefitsMedical plans
Fixed retirement allocation
Total post-employment
benefits
Other long-term benefits
Total employee benefits
Net obligations recognized at 1 January 2016 377 3,280 662 4 319 158 4,477
Benefits paid (3) (224) (61) (288) (7) (295)
Service cost 4 35 37 76 76
Expenses related to discounting of obligations 9 75 15 99 99
Actuarial losses or (gains) for the period resulting from changes in:
63 109 52 225 225
Contributions 108 108 108
Other changes
Net obligations recognized at 30 June 2016 451 3,384 704 4,539 151 4,691
30 June 2015
Post-employment benefits
(In millions of dirhams)Death
benefitsMedical plans
Fixed retirement allocation
Total post-employment
benefits
Other long-term benefits
Total employee benefits
Net obligations recognized at 1 January 2015 367 3,018 645 4,030 185 4,216
Benefits paid (3) (202) (57) (262) (4) (266)
Service cost 2 20 35 56 56
Expenses related to discounting of obligations 9 74 16 100 100
Actuarial losses or (gains) for the period resulting from changes in:
2 224 39 264 264
Contributions 98 98 98
Other changes 3 3 3
Net obligations recognized at 30 June 2015 380 3,232 678 4,290 181 4,472
5.3. KEY MANAGEMENT COMPENSATION
Key management includes the Chairman and Chief Executive Officer, Deputy Executive Officers, Executive Vice-Presidents, Senior Vice-Presidents, Vice-Presidents and advisors to the Chief Executive Officer.
(In millions of dirhams) 1st half-year 2016 1st half-year 2015
Short-term employee benefits 38 38
Post-employment benefits 10 8
Total management compensation 48 46
Note 5 - Expenses and employee benefits
5.1. PERSONNEL EXPENSES
(In millions of dirhams) 1st half-year 2016 1st half-year 2015
Employee remuneration and related social charges (3,344) (3,226)
Retirement benefits and other employee benefits (729) (758)
Other expenses (3) (5)
Personnel expenses (4,076) (3,989)
30 June 2016 31 December 2015
Discount rate
Death benefit 4,19% 5,02%
Medical plans 3,85% 4,62%
Expected salary increase rate 5,10% 5,10%
Rate of increase in medical costs 2,00% 2,00%
The increase in «Employee remuneration and related social charges» for 4% is mainly explained by:- Implementation of the 2015 protocol agreement, giving a raise of 7.5% on the base salary to the category Non-executives, Technicians, Supervisors and Administrative executive’s staff ;- The entry into the consolidation scope of Mohammed VI Polytechnic University and OCP Africa during the first half 2016.This increase was partially offset by the retirement of 772 officers during the same period.
5.2. POST-EMPLOYMENT BENEFIT AND OTHER BENEFITS
5.2.1. MAIN ACTUARIAL ASSUMPTIONS USED
All of the defined-benefit obligations have been calculated on the basis of actuarial calculations founded on assumptions such as the discount rate, the medical inflation rate, future increases in salaries, the employee turnover rate and mortality tables. The main assumptions used are as follows:
The nets obligations are recognized in provisions for employee benefits staff detailed in Note 9.2
Notes to the Consolidated Financial Statements Notes to the Consolidated Financial Statements
OCP Group Consolidated financial statements
at 30 June 2016
OCP Group Consolidated financial statementsat 30 June 2016
20 21
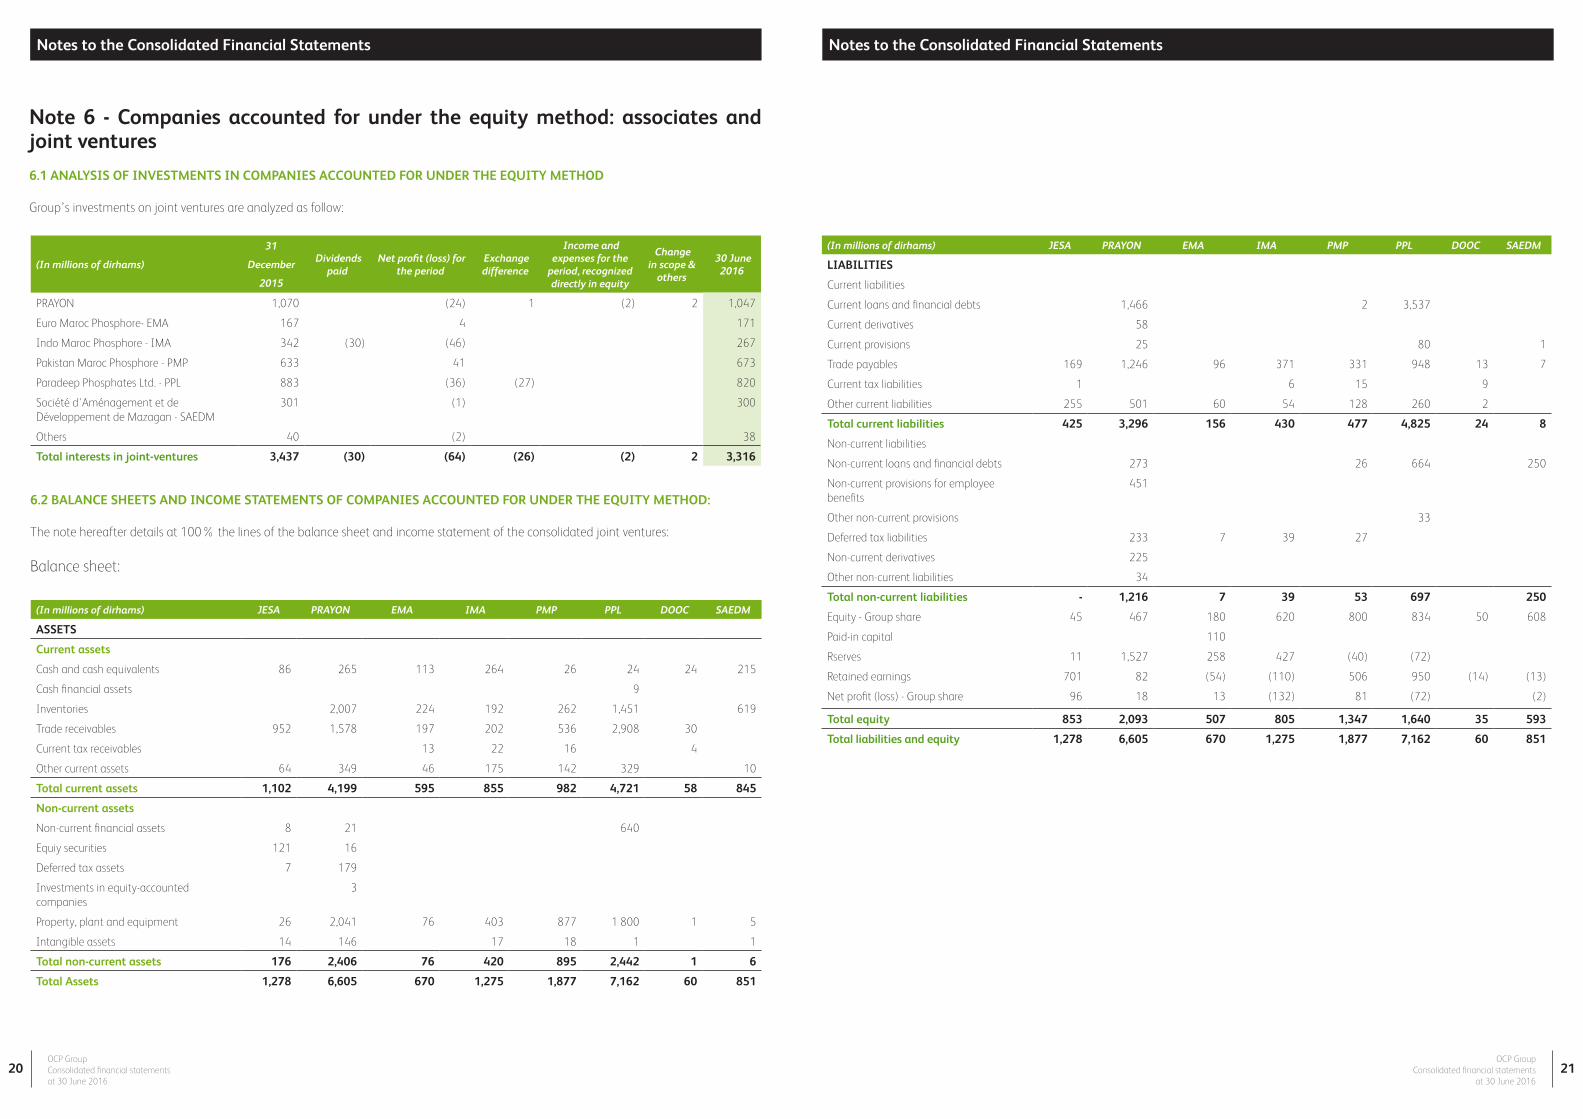
Note 6 - Companies accounted for under the equity method: associates and joint ventures
6.1 ANALYSIS OF INVESTMENTS IN COMPANIES ACCOUNTED FOR UNDER THE EQUITY METHOD
Group’s investments on joint ventures are analyzed as follow:
6.2 BALANCE SHEETS AND INCOME STATEMENTS OF COMPANIES ACCOUNTED FOR UNDER THE EQUITY METHOD:
The note hereafter details at 100% the lines of the balance sheet and income statement of the consolidated joint ventures:
Balance sheet:
(In millions of dirhams)
31
December
2015
Dividends paid
Net profit (loss) for the period
Exchange difference
Income and expenses for the
period, recognized directly in equity
Change in scope &
others
30 June 2016
PRAYON 1,070 (24) 1 (2) 2 1,047
Euro Maroc Phosphore- EMA 167 4 171
Indo Maroc Phosphore - IMA 342 (30) (46) 267
Pakistan Maroc Phosphore - PMP 633 41 673
Paradeep Phosphates Ltd. - PPL 883 (36) (27) 820
Société d'Aménagement et de Développement de Mazagan - SAEDM
301 (1) 300
Others 40 (2) 38
Total interests in joint-ventures 3,437 (30) (64) (26) (2) 2 3,316
(In millions of dirhams) JESA PRAYON EMA IMA PMP PPL DOOC SAEDM
ASSETS
Current assets
Cash and cash equivalents 86 265 113 264 26 24 24 215
Cash financial assets 9
Inventories 2,007 224 192 262 1,451 619
Trade receivables 952 1,578 197 202 536 2,908 30
Current tax receivables 13 22 16 4
Other current assets 64 349 46 175 142 329 10
Total current assets 1,102 4,199 595 855 982 4,721 58 845
Non-current assets
Non-current financial assets 8 21 640
Equiy securities 121 16
Deferred tax assets 7 179
Investments in equity-accounted companies
3
Property, plant and equipment 26 2,041 76 403 877 1 800 1 5
Intangible assets 14 146 17 18 1 1
Total non-current assets 176 2,406 76 420 895 2,442 1 6
Total Assets 1,278 6,605 670 1,275 1,877 7,162 60 851
(In millions of dirhams) JESA PRAYON EMA IMA PMP PPL DOOC SAEDM
LIABILITIES
Current liabilities
Current loans and financial debts 1,466 2 3,537
Current derivatives 58
Current provisions 25 80 1
Trade payables 169 1,246 96 371 331 948 13 7
Current tax liabilities 1 6 15 9
Other current liabilities 255 501 60 54 128 260 2
Total current liabilities 425 3,296 156 430 477 4,825 24 8
Non-current liabilities
Non-current loans and financial debts 273 26 664 250
Non-current provisions for employee benefits
451
Other non-current provisions 33
Deferred tax liabilities 233 7 39 27
Non-current derivatives 225
Other non-current liabilities 34
Total non-current liabilities - 1,216 7 39 53 697 250
Equity - Group share 45 467 180 620 800 834 50 608
Paid-in capital 110
Rserves 11 1,527 258 427 (40) (72)
Retained earnings 701 82 (54) (110) 506 950 (14) (13)
Net profit (loss) - Group share 96 18 13 (132) 81 (72) (2)
Total equity 853 2,093 507 805 1,347 1,640 35 593
Total liabilities and equity 1,278 6,605 670 1,275 1,877 7,162 60 851
Notes to the Consolidated Financial Statements Notes to the Consolidated Financial Statements
OCP Group Consolidated financial statements
at 30 June 2016
OCP Group Consolidated financial statementsat 30 June 2016
22 23
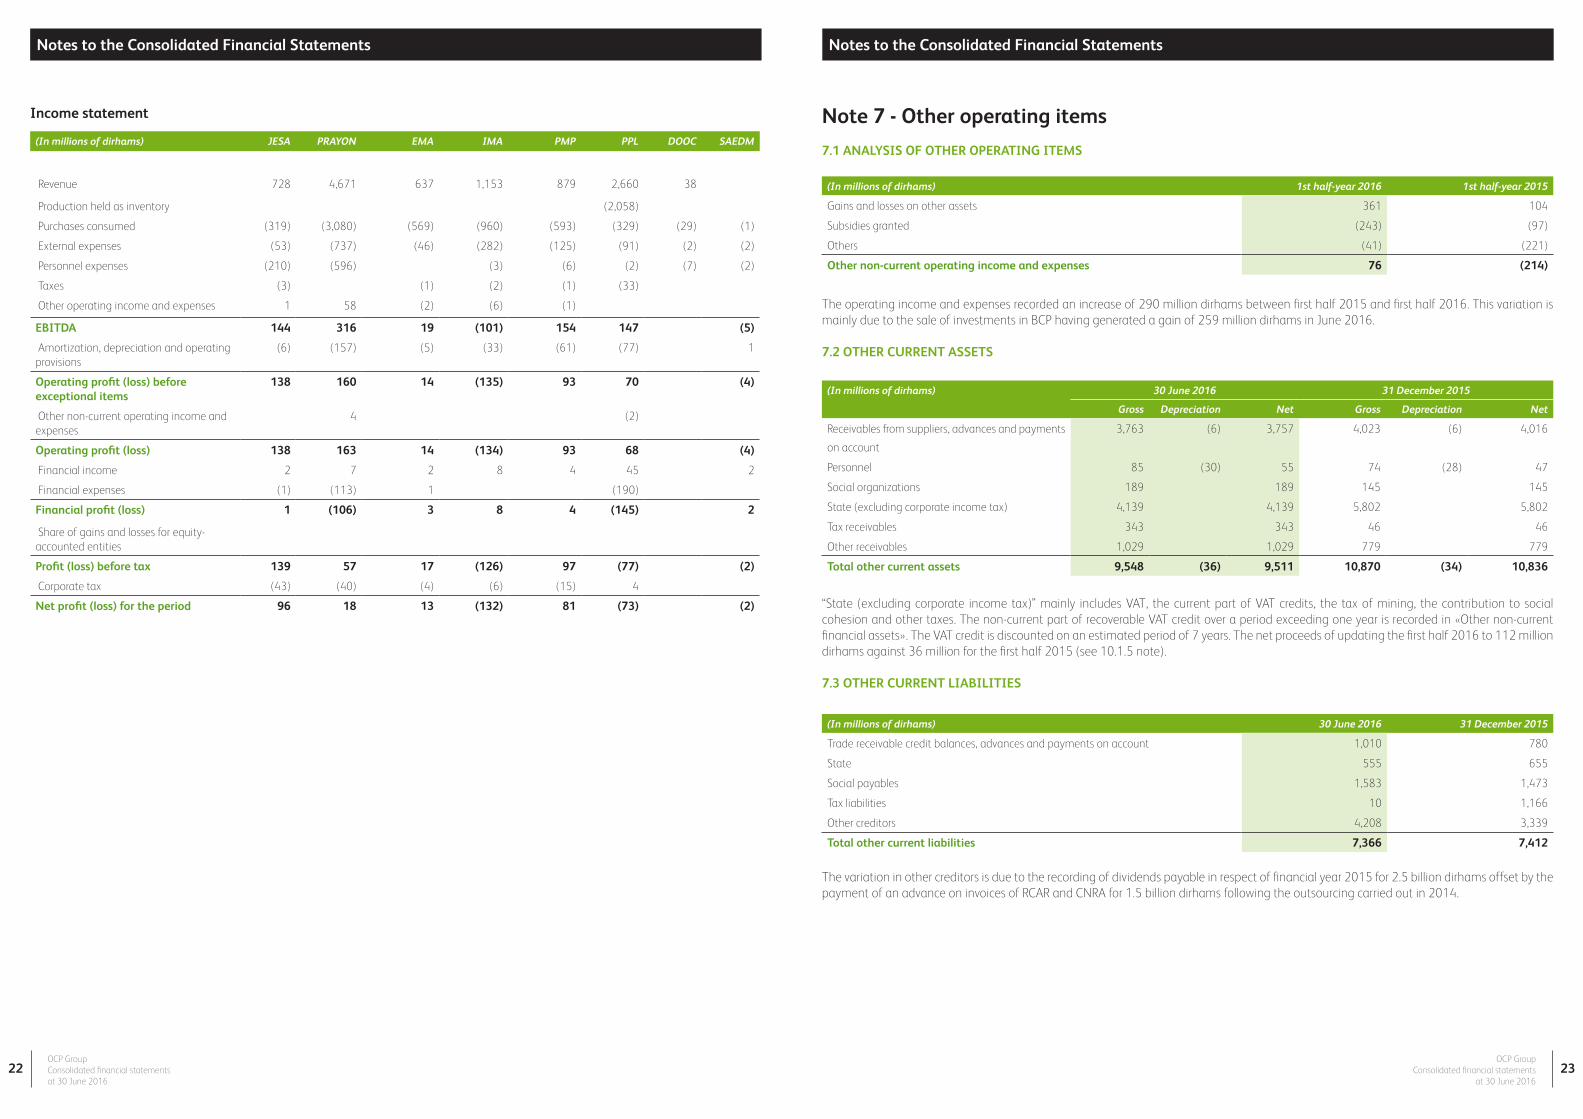
Income statement
(In millions of dirhams) JESA PRAYON EMA IMA PMP PPL DOOC SAEDM
Revenue 728 4,671 637 1,153 879 2,660 38
Production held as inventory (2,058)
Purchases consumed (319) (3,080) (569) (960) (593) (329) (29) (1)
External expenses (53) (737) (46) (282) (125) (91) (2) (2)
Personnel expenses (210) (596) (3) (6) (2) (7) (2)
Taxes (3) (1) (2) (1) (33)
Other operating income and expenses 1 58 (2) (6) (1)
EBITDA 144 316 19 (101) 154 147 (5)
Amortization, depreciation and operating provisions
(6) (157) (5) (33) (61) (77) 1
Operating profit (loss) before exceptional items
138 160 14 (135) 93 70 (4)
Other non-current operating income and expenses
4 (2)
Operating profit (loss) 138 163 14 (134) 93 68 (4)
Financial income 2 7 2 8 4 45 2
Financial expenses (1) (113) 1 (190)
Financial profit (loss) 1 (106) 3 8 4 (145) 2
Share of gains and losses for equity-accounted entities
Profit (loss) before tax 139 57 17 (126) 97 (77) (2)
Corporate tax (43) (40) (4) (6) (15) 4
Net profit (loss) for the period 96 18 13 (132) 81 (73) (2)
Note 7 - Other operating items
7.1 ANALYSIS OF OTHER OPERATING ITEMS
(In millions of dirhams) 1st half-year 2016 1st half-year 2015
Gains and losses on other assets 361 104
Subsidies granted (243) (97)
Others (41) (221)
Other non-current operating income and expenses 76 (214)
(In millions of dirhams) 30 June 2016 31 December 2015
Trade receivable credit balances, advances and payments on account 1,010 780
State 555 655
Social payables 1,583 1,473
Tax liabilities 10 1,166
Other creditors 4,208 3,339
Total other current liabilities 7,366 7,412
(In millions of dirhams) 30 June 2016 31 December 2015
Gross Depreciation Net Gross Depreciation Net
Receivables from suppliers, advances and payments
on account
3,763 (6) 3,757 4,023 (6) 4,016
Personnel 85 (30) 55 74 (28) 47
Social organizations 189 189 145 145
State (excluding corporate income tax) 4,139 4,139 5,802 5,802
Tax receivables 343 343 46 46
Other receivables 1,029 1,029 779 779
Total other current assets 9,548 (36) 9,511 10,870 (34) 10,836
The operating income and expenses recorded an increase of 290 million dirhams between first half 2015 and first half 2016. This variation is mainly due to the sale of investments in BCP having generated a gain of 259 million dirhams in June 2016.
7.2 OTHER CURRENT ASSETS
“State (excluding corporate income tax)” mainly includes VAT, the current part of VAT credits, the tax of mining, the contribution to social cohesion and other taxes. The non-current part of recoverable VAT credit over a period exceeding one year is recorded in «Other non-current financial assets». The VAT credit is discounted on an estimated period of 7 years. The net proceeds of updating the first half 2016 to 112 million dirhams against 36 million for the first half 2015 (see 10.1.5 note).
7.3 OTHER CURRENT LIABILITIES
The variation in other creditors is due to the recording of dividends payable in respect of financial year 2015 for 2.5 billion dirhams offset by the payment of an advance on invoices of RCAR and CNRA for 1.5 billion dirhams following the outsourcing carried out in 2014.
Notes to the Consolidated Financial Statements Notes to the Consolidated Financial Statements
OCP Group Consolidated financial statements
at 30 June 2016
OCP Group Consolidated financial statementsat 30 June 2016
24 25
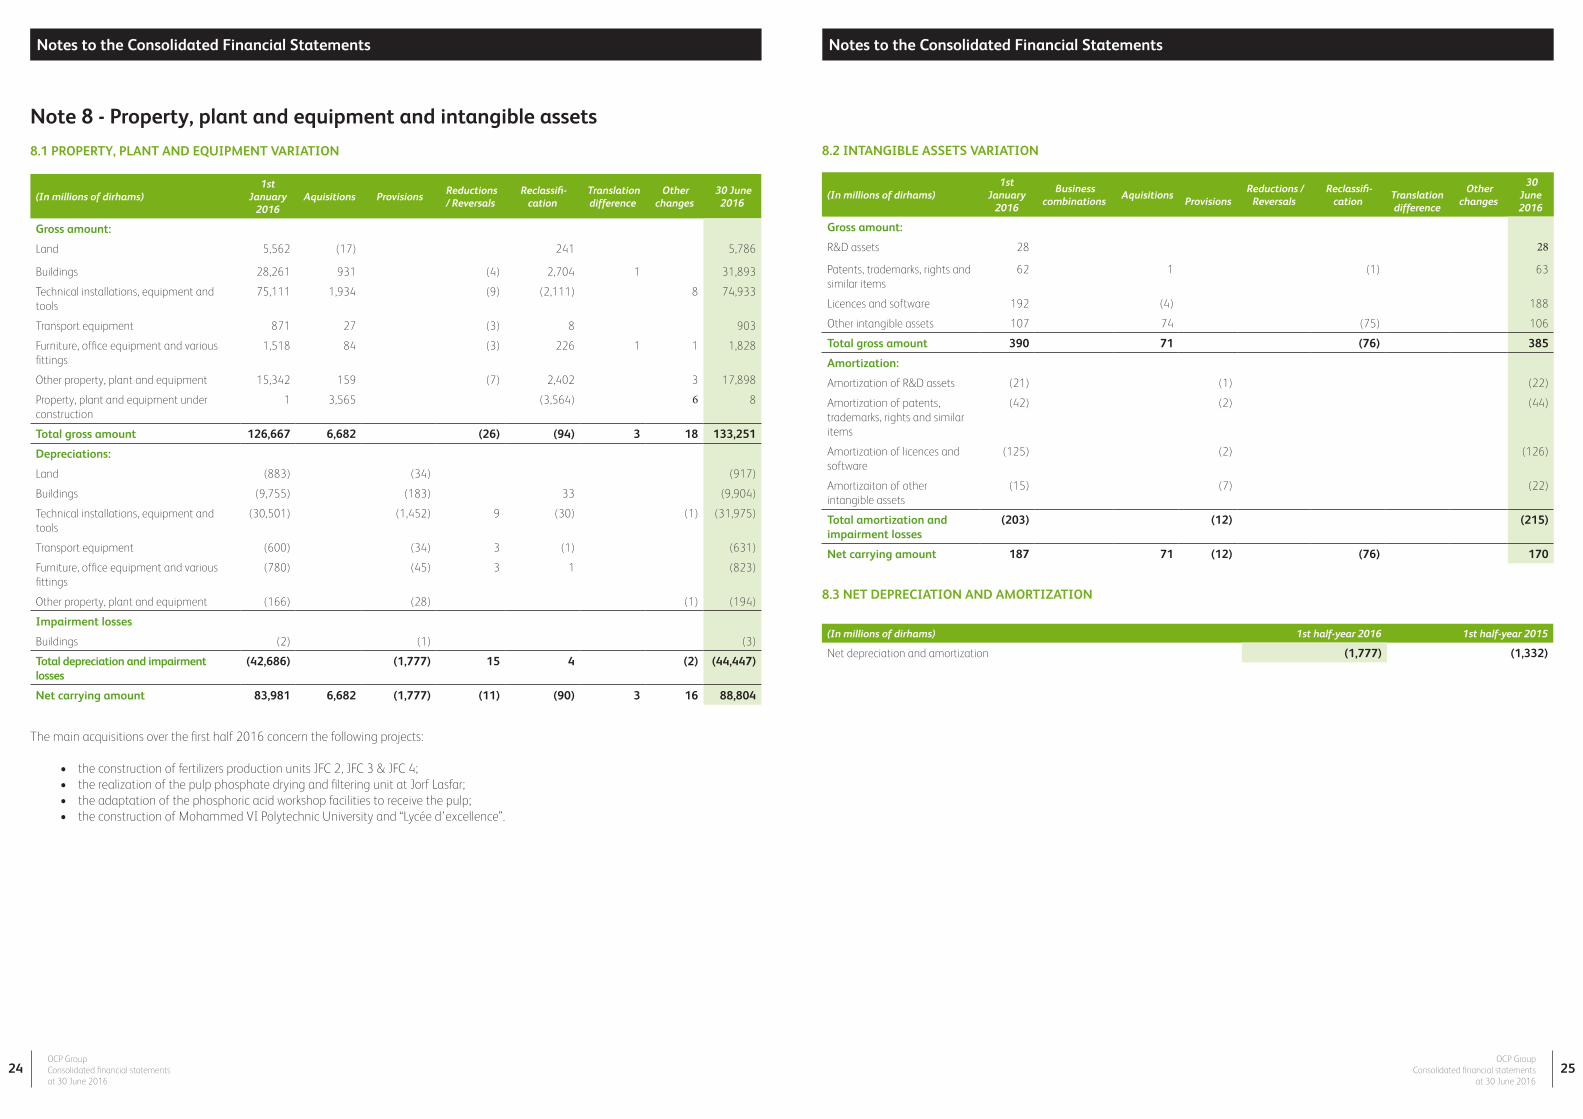
Note 8 - Property, plant and equipment and intangible assets
8.1 PROPERTY, PLANT AND EQUIPMENT VARIATION
(In millions of dirhams)1st
January 2016
Aquisitions Provisions Reductions / Reversals
Reclassifi-cation
Translation difference
Other changes
30 June 2016
Gross amount:
Land 5,562 (17) 241 5,786
Buildings 28,261 931 (4) 2,704 1 31,893
Technical installations, equipment and tools
75,111 1,934 (9) (2,111) 8 74,933
Transport equipment 871 27 (3) 8 903
Furniture, office equipment and various fittings
1,518 84 (3) 226 1 1 1,828
Other property, plant and equipment 15,342 159 (7) 2,402 3 17,898
Property, plant and equipment under construction
1 3,565 (3,564) 6 8
Total gross amount 126,667 6,682 (26) (94) 3 18 133,251
Depreciations:
Land (883) (34) (917)
Buildings (9,755) (183) 33 (9,904)
Technical installations, equipment and tools
(30,501) (1,452) 9 (30) (1) (31,975)
Transport equipment (600) (34) 3 (1) (631)
Furniture, office equipment and various fittings
(780) (45) 3 1 (823)
Other property, plant and equipment (166) (28) (1) (194)
Impairment losses
Buildings (2) (1) (3)
Total depreciation and impairment losses
(42,686) (1,777) 15 4 (2) (44,447)
Net carrying amount 83,981 6,682 (1,777) (11) (90) 3 16 88,804
(In millions of dirhams)1st
January 2016
Business combinations
Aquisitions
Provisions Reductions /
Reversals Reclassifi-
cation
Translation difference
Other changes
30 June 2016
Gross amount:
R&D assets 28 28
Patents, trademarks, rights and similar items
62 1 (1) 63
Licences and software 192 (4) 188
Other intangible assets 107 74 (75) 106
Total gross amount 390 71 (76) 385
Amortization:
Amortization of R&D assets (21) (1) (22)
Amortization of patents, trademarks, rights and similar items
(42) (2) (44)
Amortization of licences and software
(125) (2) (126)
Amortizaiton of other intangible assets
(15) (7) (22)
Total amortization and impairment losses
(203) (12) (215)
Net carrying amount 187 71 (12) (76) 170
The main acquisitions over the first half 2016 concern the following projects:
• the construction of fertilizers production units JFC 2, JFC 3 & JFC 4;• the realization of the pulp phosphate drying and filtering unit at Jorf Lasfar;• the adaptation of the phosphoric acid workshop facilities to receive the pulp;• the construction of Mohammed VI Polytechnic University and “Lycée d’excellence”.
8.2 INTANGIBLE ASSETS VARIATION
8.3 NET DEPRECIATION AND AMORTIZATION
(In millions of dirhams) 1st half-year 2016 1st half-year 2015
Net depreciation and amortization (1,777) (1,332)
Notes to the Consolidated Financial Statements Notes to the Consolidated Financial Statements
OCP Group Consolidated financial statements
at 30 June 2016
OCP Group Consolidated financial statementsat 30 June 2016
26 27
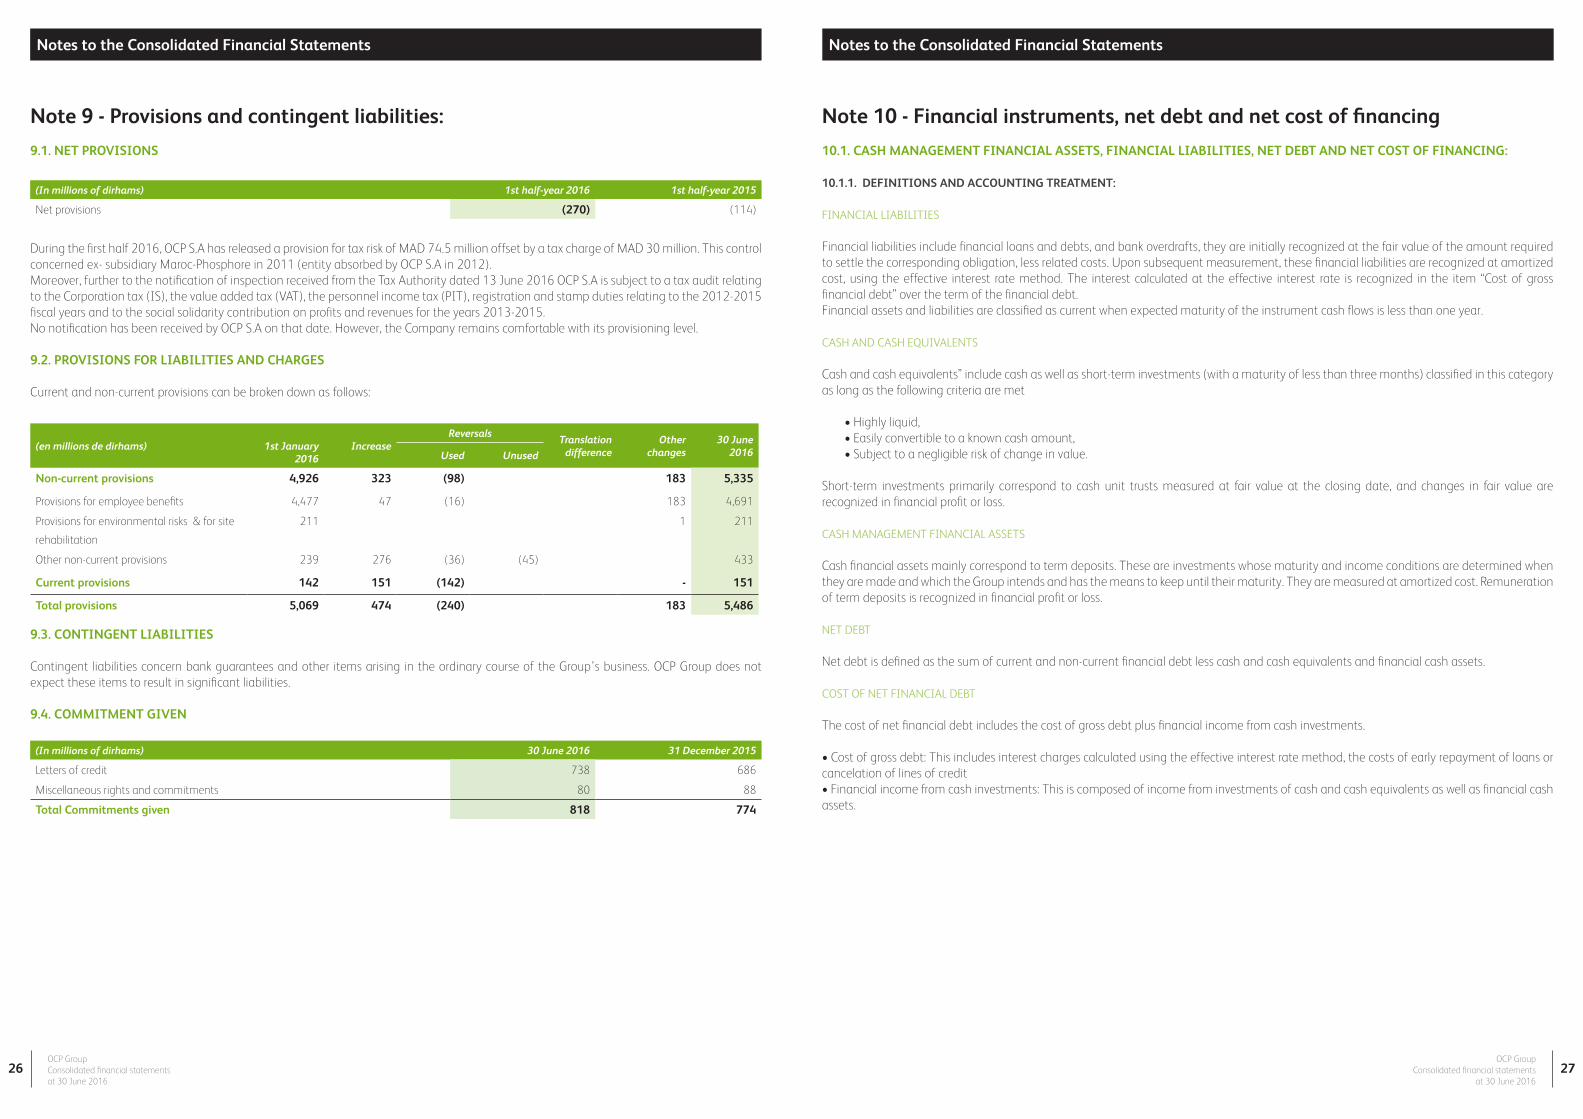
Note 9 - Provisions and contingent liabilities:
9.1. NET PROVISIONS
(In millions of dirhams) 1st half-year 2016 1st half-year 2015
Net provisions (270) (114)
(In millions of dirhams) 30 June 2016 31 December 2015
Letters of credit 738 686
Miscellaneous rights and commitments 80 88
Total Commitments given 818 774
During the first half 2016, OCP S.A has released a provision for tax risk of MAD 74.5 million offset by a tax charge of MAD 30 million. This control concerned ex- subsidiary Maroc-Phosphore in 2011 (entity absorbed by OCP S.A in 2012).Moreover, further to the notification of inspection received from the Tax Authority dated 13 June 2016 OCP S.A is subject to a tax audit relating to the Corporation tax (IS), the value added tax (VAT), the personnel income tax (PIT), registration and stamp duties relating to the 2012-2015 fiscal years and to the social solidarity contribution on profits and revenues for the years 2013-2015.No notification has been received by OCP S.A on that date. However, the Company remains comfortable with its provisioning level.
9.2. PROVISIONS FOR LIABILITIES AND CHARGES
Current and non-current provisions can be broken down as follows:
9.3. CONTINGENT LIABILITIES
Contingent liabilities concern bank guarantees and other items arising in the ordinary course of the Group’s business. OCP Group does not expect these items to result in significant liabilities.
9.4. COMMITMENT GIVEN
(en millions de dirhams)
1st January 2016
IncreaseReversals
Translationdifference
Other changes
30 June 2016Used Unused
Non-current provisions 4,926 323 (98) 183 5,335
Provisions for employee benefits 4,477 47 (16) 183 4,691
Provisions for environmental risks & for site
rehabilitation
211 1 211
Other non-current provisions 239 276 (36) (45) 433
Current provisions 142 151 (142) - 151
Total provisions 5,069 474 (240) 183 5,486
Note 10 - Financial instruments, net debt and net cost of financing
10.1. CASH MANAGEMENT FINANCIAL ASSETS, FINANCIAL LIABILITIES, NET DEBT AND NET COST OF FINANCING:
10.1.1. DEFINITIONS AND ACCOUNTING TREATMENT:
FINANCIAL LIABILITIES
Financial liabilities include financial loans and debts, and bank overdrafts, they are initially recognized at the fair value of the amount required to settle the corresponding obligation, less related costs. Upon subsequent measurement, these financial liabilities are recognized at amortized cost, using the effective interest rate method. The interest calculated at the effective interest rate is recognized in the item “Cost of gross financial debt” over the term of the financial debt.Financial assets and liabilities are classified as current when expected maturity of the instrument cash flows is less than one year.
CASH AND CASH EQUIVALENTS
Cash and cash equivalents” include cash as well as short-term investments (with a maturity of less than three months) classified in this category as long as the following criteria are met
• Highly liquid,• Easily convertible to a known cash amount,• Subject to a negligible risk of change in value.
Short-term investments primarily correspond to cash unit trusts measured at fair value at the closing date, and changes in fair value are recognized in financial profit or loss.
CASH MANAGEMENT FINANCIAL ASSETS
Cash financial assets mainly correspond to term deposits. These are investments whose maturity and income conditions are determined when they are made and which the Group intends and has the means to keep until their maturity. They are measured at amortized cost. Remuneration of term deposits is recognized in financial profit or loss.
NET DEBT
Net debt is defined as the sum of current and non-current financial debt less cash and cash equivalents and financial cash assets.
COST OF NET FINANCIAL DEBT
The cost of net financial debt includes the cost of gross debt plus financial income from cash investments.
• Cost of gross debt: This includes interest charges calculated using the effective interest rate method, the costs of early repayment of loans or cancelation of lines of credit • Financial income from cash investments: This is composed of income from investments of cash and cash equivalents as well as financial cash assets.
Notes to the Consolidated Financial Statements Notes to the Consolidated Financial Statements
OCP Group Consolidated financial statements
at 30 June 2016
OCP Group Consolidated financial statementsat 30 June 2016
28 29
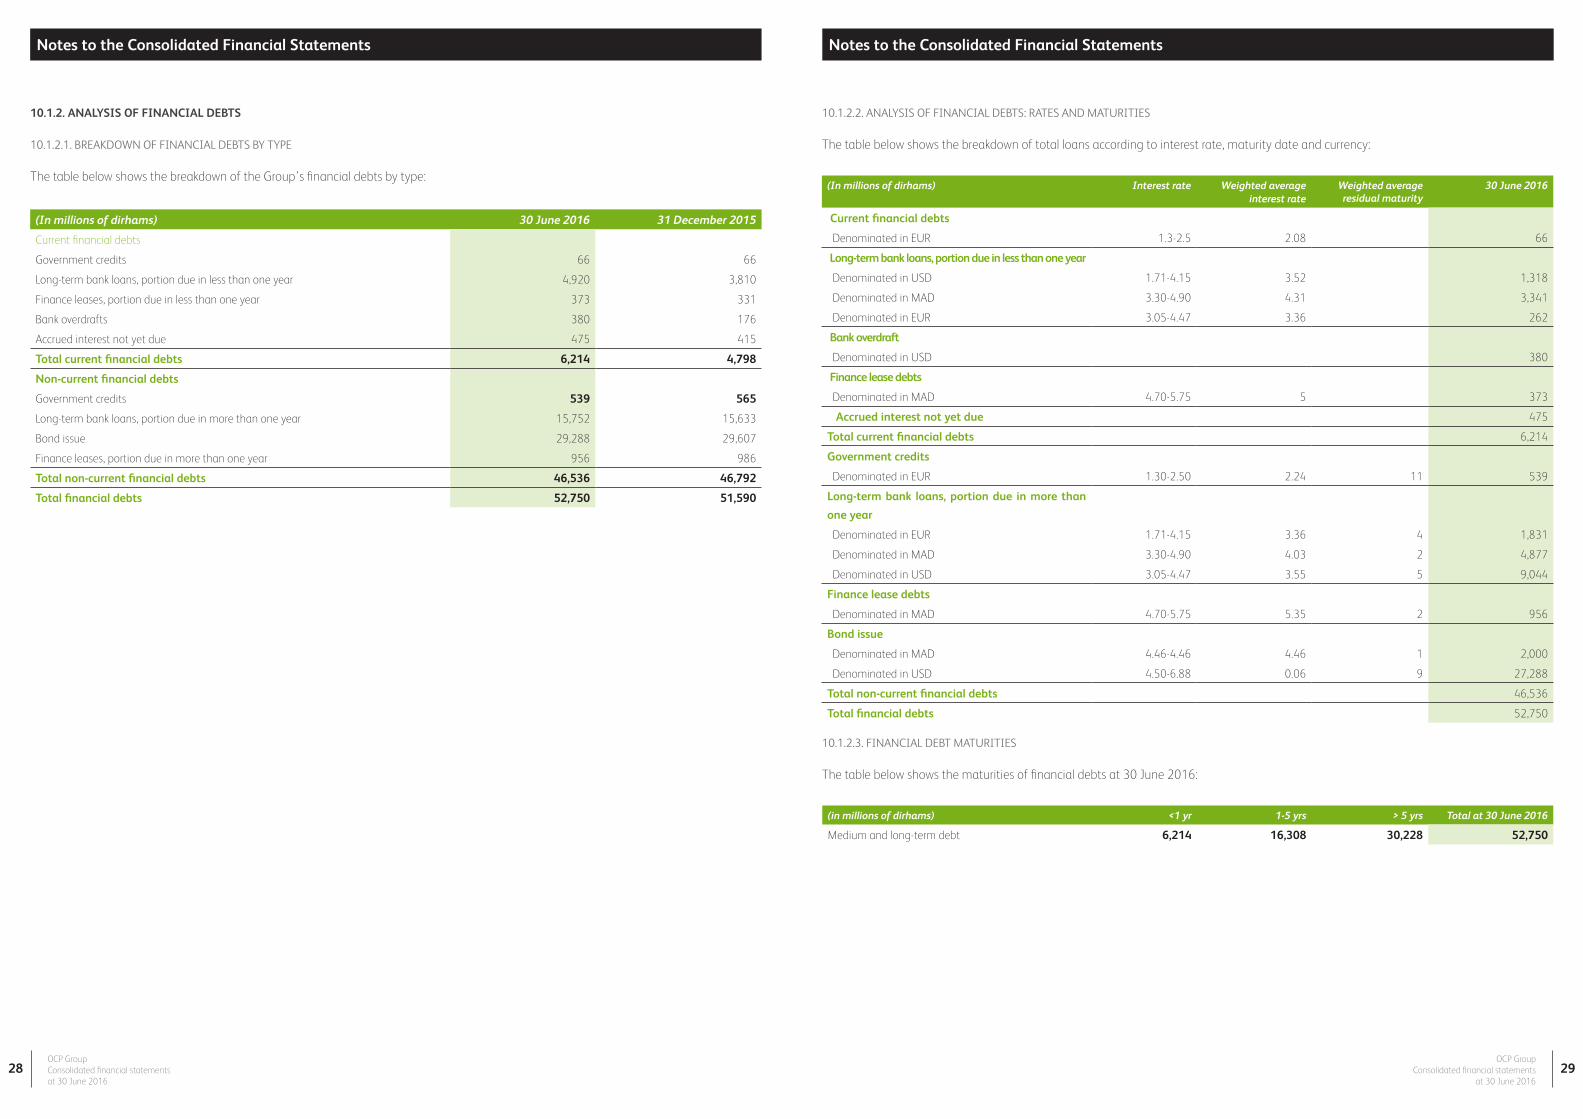
10.1.2. ANALYSIS OF FINANCIAL DEBTS
10.1.2.1. BREAKDOWN OF FINANCIAL DEBTS BY TYPE
The table below shows the breakdown of the Group’s financial debts by type:
10.1.2.2. ANALYSIS OF FINANCIAL DEBTS: RATES AND MATURITIES
The table below shows the breakdown of total loans according to interest rate, maturity date and currency:
10.1.2.3. FINANCIAL DEBT MATURITIES
The table below shows the maturities of financial debts at 30 June 2016:
(In millions of dirhams) 30 June 2016 31 December 2015
Current financial debts
Government credits 66 66
Long-term bank loans, portion due in less than one year 4,920 3,810
Finance leases, portion due in less than one year 373 331
Bank overdrafts 380 176
Accrued interest not yet due 475 415
Total current financial debts 6,214 4,798
Non-current financial debts
Government credits 539 565
Long-term bank loans, portion due in more than one year 15,752 15,633
Bond issue 29,288 29,607
Finance leases, portion due in more than one year 956 986
Total non-current financial debts 46,536 46,792
Total financial debts 52,750 51,590
(In millions of dirhams) Interest rate Weighted average interest rate
Weighted average residual maturity
30 June 2016
Current financial debts
Denominated in EUR 1.3-2.5 2.08 66
Long-term bank loans, portion due in less than one year
Denominated in USD 1.71-4.15 3.52 1,318
Denominated in MAD 3.30-4.90 4.31 3,341
Denominated in EUR 3.05-4.47 3.36 262
Bank overdraft
Denominated in USD 380
Finance lease debts
Denominated in MAD 4.70-5.75 5 373
Accrued interest not yet due 475
Total current financial debts 6,214
Government credits
Denominated in EUR 1.30-2.50 2.24 11 539
Long-term bank loans, portion due in more than
one year
Denominated in EUR 1.71-4.15 3.36 4 1,831
Denominated in MAD 3.30-4.90 4.03 2 4,877
Denominated in USD 3.05-4.47 3.55 5 9,044
Finance lease debts
Denominated in MAD 4.70-5.75 5.35 2 956
Bond issue
Denominated in MAD 4.46-4.46 4.46 1 2,000
Denominated in USD 4.50-6.88 0.06 9 27,288
Total non-current financial debts 46,536
Total financial debts 52,750
(in millions of dirhams) <1 yr 1-5 yrs > 5 yrs Total at 30 June 2016
Medium and long-term debt 6,214 16,308 30,228 52,750
Notes to the Consolidated Financial Statements Notes to the Consolidated Financial Statements
OCP Group Consolidated financial statements
at 30 June 2016
OCP Group Consolidated financial statementsat 30 June 2016
30 31
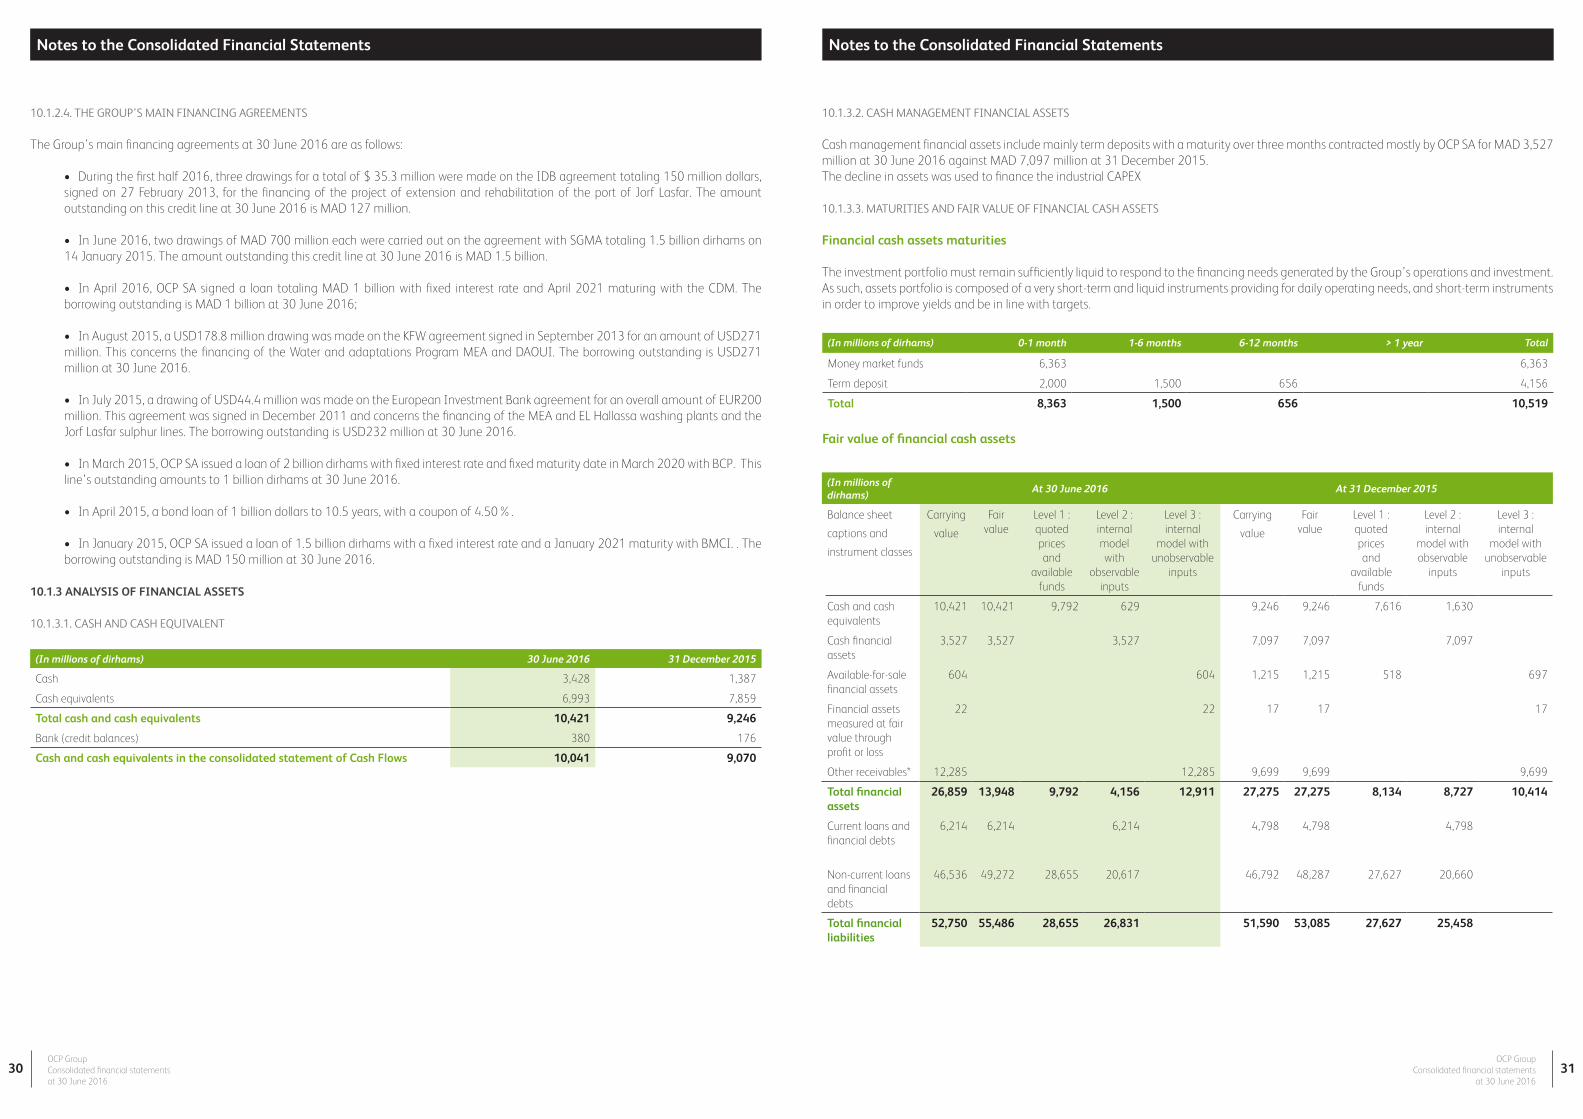
10.1.2.4. THE GROUP’S MAIN FINANCING AGREEMENTS
The Group’s main financing agreements at 30 June 2016 are as follows:
• During the first half 2016, three drawings for a total of $ 35.3 million were made on the IDB agreement totaling 150 million dollars, signed on 27 February 2013, for the financing of the project of extension and rehabilitation of the port of Jorf Lasfar. The amount outstanding on this credit line at 30 June 2016 is MAD 127 million.
• In June 2016, two drawings of MAD 700 million each were carried out on the agreement with SGMA totaling 1.5 billion dirhams on 14 January 2015. The amount outstanding this credit line at 30 June 2016 is MAD 1.5 billion.
• In April 2016, OCP SA signed a loan totaling MAD 1 billion with fixed interest rate and April 2021 maturing with the CDM. The borrowing outstanding is MAD 1 billion at 30 June 2016;
• In August 2015, a USD178.8 million drawing was made on the KFW agreement signed in September 2013 for an amount of USD271 million. This concerns the financing of the Water and adaptations Program MEA and DAOUI. The borrowing outstanding is USD271 million at 30 June 2016.
• In July 2015, a drawing of USD44.4 million was made on the European Investment Bank agreement for an overall amount of EUR200 million. This agreement was signed in December 2011 and concerns the financing of the MEA and EL Hallassa washing plants and the Jorf Lasfar sulphur lines. The borrowing outstanding is USD232 million at 30 June 2016.
• In March 2015, OCP SA issued a loan of 2 billion dirhams with fixed interest rate and fixed maturity date in March 2020 with BCP. This line’s outstanding amounts to 1 billion dirhams at 30 June 2016.
• In April 2015, a bond loan of 1 billion dollars to 10.5 years, with a coupon of 4.50%.
• In January 2015, OCP SA issued a loan of 1.5 billion dirhams with a fixed interest rate and a January 2021 maturity with BMCI. . The borrowing outstanding is MAD 150 million at 30 June 2016.
10.1.3 ANALYSIS OF FINANCIAL ASSETS
10.1.3.1. CASH AND CASH EQUIVALENT
10.1.3.2. CASH MANAGEMENT FINANCIAL ASSETS
Cash management financial assets include mainly term deposits with a maturity over three months contracted mostly by OCP SA for MAD 3,527 million at 30 June 2016 against MAD 7,097 million at 31 December 2015.The decline in assets was used to finance the industrial CAPEX
10.1.3.3. MATURITIES AND FAIR VALUE OF FINANCIAL CASH ASSETS
Financial cash assets maturities
The investment portfolio must remain sufficiently liquid to respond to the financing needs generated by the Group’s operations and investment. As such, assets portfolio is composed of a very short-term and liquid instruments providing for daily operating needs, and short-term instruments in order to improve yields and be in line with targets.
(In millions of dirhams) 30 June 2016 31 December 2015
Cash 3,428 1,387
Cash equivalents 6,993 7,859
Total cash and cash equivalents 10,421 9,246
Bank (credit balances) 380 176
Cash and cash equivalents in the consolidated statement of Cash Flows 10,041 9,070
(In millions of dirhams)
At 30 June 2016 At 31 December 2015
Balance sheet
captions and
instrument classes
Carrying
value
Fair value
Level 1 :quoted pricesand
available funds
Level 2 :internalmodel with
observableinputs
Level 3 :internal
model withunobservable
inputs
Carrying
value
Fair value
Level 1 :quoted pricesand
available funds
Level 2 :internal
model withobservable
inputs
Level 3 :internal
model withunobservable
inputs
Cash and cash equivalents
10,421 10,421 9,792 629 9,246 9,246 7,616 1,630
Cash financial assets
3,527 3,527 3,527 7,097 7,097 7,097
Available-for-sale financial assets
604 604 1,215 1,215 518 697
Financial assets measured at fair value throughprofit or loss
22 22 17 17 17
Other receivables* 12,285 12,285 9,699 9,699 9,699
Total financial assets
26,859 13,948 9,792 4,156 12,911 27,275 27,275 8,134 8,727 10,414
Current loans and financial debts
6,214 6,214 6,214 4,798 4,798 4,798
Non-current loans and financial debts
46,536 49,272 28,655 20,617 46,792 48,287 27,627 20,660
Total financial liabilities
52,750 55,486 28,655 26,831 51,590 53,085 27,627 25,458
(In millions of dirhams) 0-1 month 1-6 months 6-12 months > 1 year Total
Money market funds 6,363 6,363
Term deposit 2,000 1,500 656 4,156
Total 8,363 1,500 656 10,519
Fair value of financial cash assets
Notes to the Consolidated Financial Statements Notes to the Consolidated Financial Statements
OCP Group Consolidated financial statements
at 30 June 2016
OCP Group Consolidated financial statementsat 30 June 2016
32 33
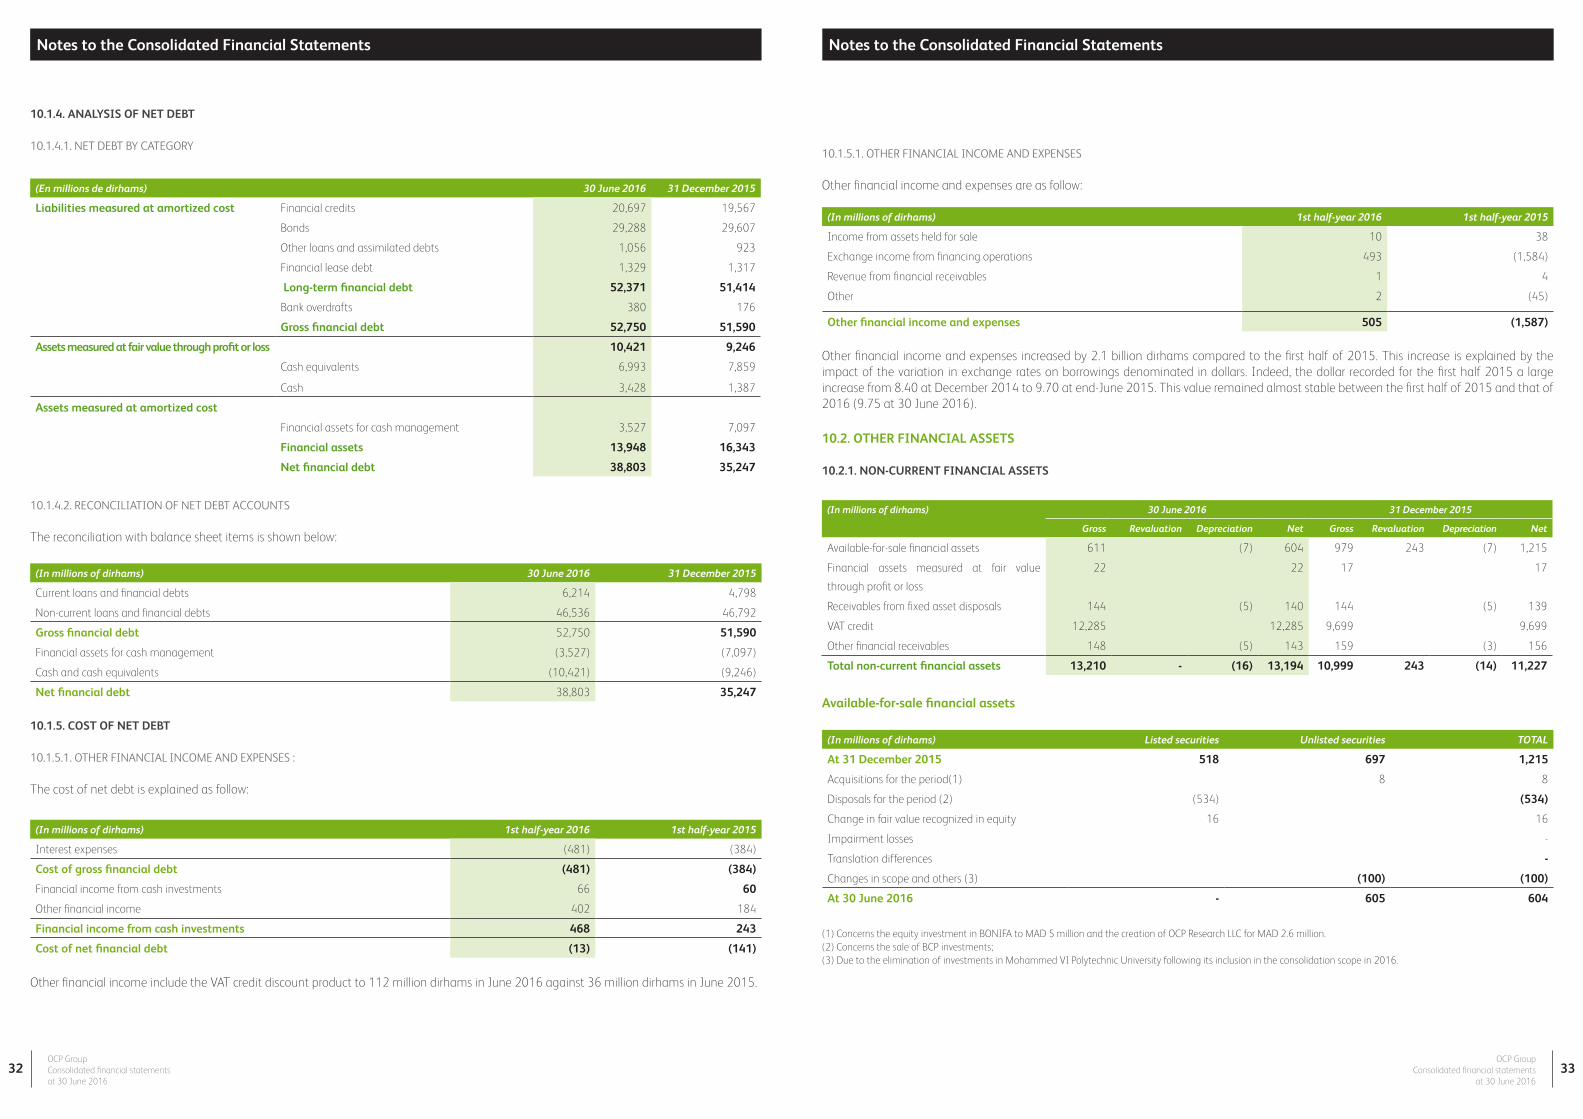
10.1.4. ANALYSIS OF NET DEBT
10.1.4.1. NET DEBT BY CATEGORY
10.1.4.2. RECONCILIATION OF NET DEBT ACCOUNTS
The reconciliation with balance sheet items is shown below:
10.1.5. COST OF NET DEBT
10.1.5.1. OTHER FINANCIAL INCOME AND EXPENSES :
The cost of net debt is explained as follow:
Other financial income include the VAT credit discount product to 112 million dirhams in June 2016 against 36 million dirhams in June 2015.
(En millions de dirhams) 30 June 2016 31 December 2015
Liabilities measured at amortized cost Financial credits 20,697 19,567
Bonds 29,288 29,607
Other loans and assimilated debts 1,056 923
Financial lease debt 1,329 1,317
Long-term financial debt 52,371 51,414
Bank overdrafts 380 176
Gross financial debt 52,750 51,590
Assets measured at fair value through profit or loss 10,421 9,246
Cash equivalents 6,993 7,859
Cash 3,428 1,387
Assets measured at amortized cost
Financial assets for cash management 3,527 7,097
Financial assets 13,948 16,343
Net financial debt 38,803 35,247
(In millions of dirhams) 30 June 2016 31 December 2015
Current loans and financial debts 6,214 4,798
Non-current loans and financial debts 46,536 46,792
Gross financial debt 52,750 51,590
Financial assets for cash management (3,527) (7,097)
Cash and cash equivalents (10,421) (9,246)
Net financial debt 38,803 35,247
(In millions of dirhams) 1st half-year 2016 1st half-year 2015
Interest expenses (481) (384)
Cost of gross financial debt (481) (384)
Financial income from cash investments 66 60
Other financial income 402 184
Financial income from cash investments 468 243
Cost of net financial debt (13) (141)
10.2. OTHER FINANCIAL ASSETS
10.2.1. NON-CURRENT FINANCIAL ASSETS
(In millions of dirhams) 1st half-year 2016 1st half-year 2015
Income from assets held for sale 10 38
Exchange income from financing operations 493 (1,584)
Revenue from financial receivables 1 4
Other 2 (45)
Other financial income and expenses 505 (1,587)
10.1.5.1. OTHER FINANCIAL INCOME AND EXPENSES
Other financial income and expenses are as follow:
Other financial income and expenses increased by 2.1 billion dirhams compared to the first half of 2015. This increase is explained by the impact of the variation in exchange rates on borrowings denominated in dollars. Indeed, the dollar recorded for the first half 2015 a large increase from 8.40 at December 2014 to 9.70 at end-June 2015. This value remained almost stable between the first half of 2015 and that of 2016 (9.75 at 30 June 2016).
Available-for-sale financial assets
(In millions of dirhams) Listed securities Unlisted securities TOTAL
At 31 December 2015 518 697 1,215
Acquisitions for the period(1) 8 8
Disposals for the period (2) (534) (534)
Change in fair value recognized in equity 16 16
Impairment losses -
Translation differences -
Changes in scope and others (3) (100) (100)
At 30 June 2016 - 605 604
(In millions of dirhams) 30 June 2016 31 December 2015
Gross Revaluation Depreciation Net Gross Revaluation Depreciation Net
Available-for-sale financial assets 611 (7) 604 979 243 (7) 1,215
Financial assets measured at fair value
through profit or loss
22 22 17 17
Receivables from fixed asset disposals 144 (5) 140 144 (5) 139
VAT credit 12,285 12,285 9,699 9,699
Other financial receivables 148 (5) 143 159 (3) 156
Total non-current financial assets 13,210 - (16) 13,194 10,999 243 (14) 11,227
(1) Concerns the equity investment in BONIFA to MAD 5 million and the creation of OCP Research LLC for MAD 2.6 million.(2) Concerns the sale of BCP investments;(3) Due to the elimination of investments in Mohammed VI Polytechnic University following its inclusion in the consolidation scope in 2016.
Notes to the Consolidated Financial Statements Notes to the Consolidated Financial Statements
OCP Group Consolidated financial statements
at 30 June 2016
OCP Group Consolidated financial statementsat 30 June 2016
34 35
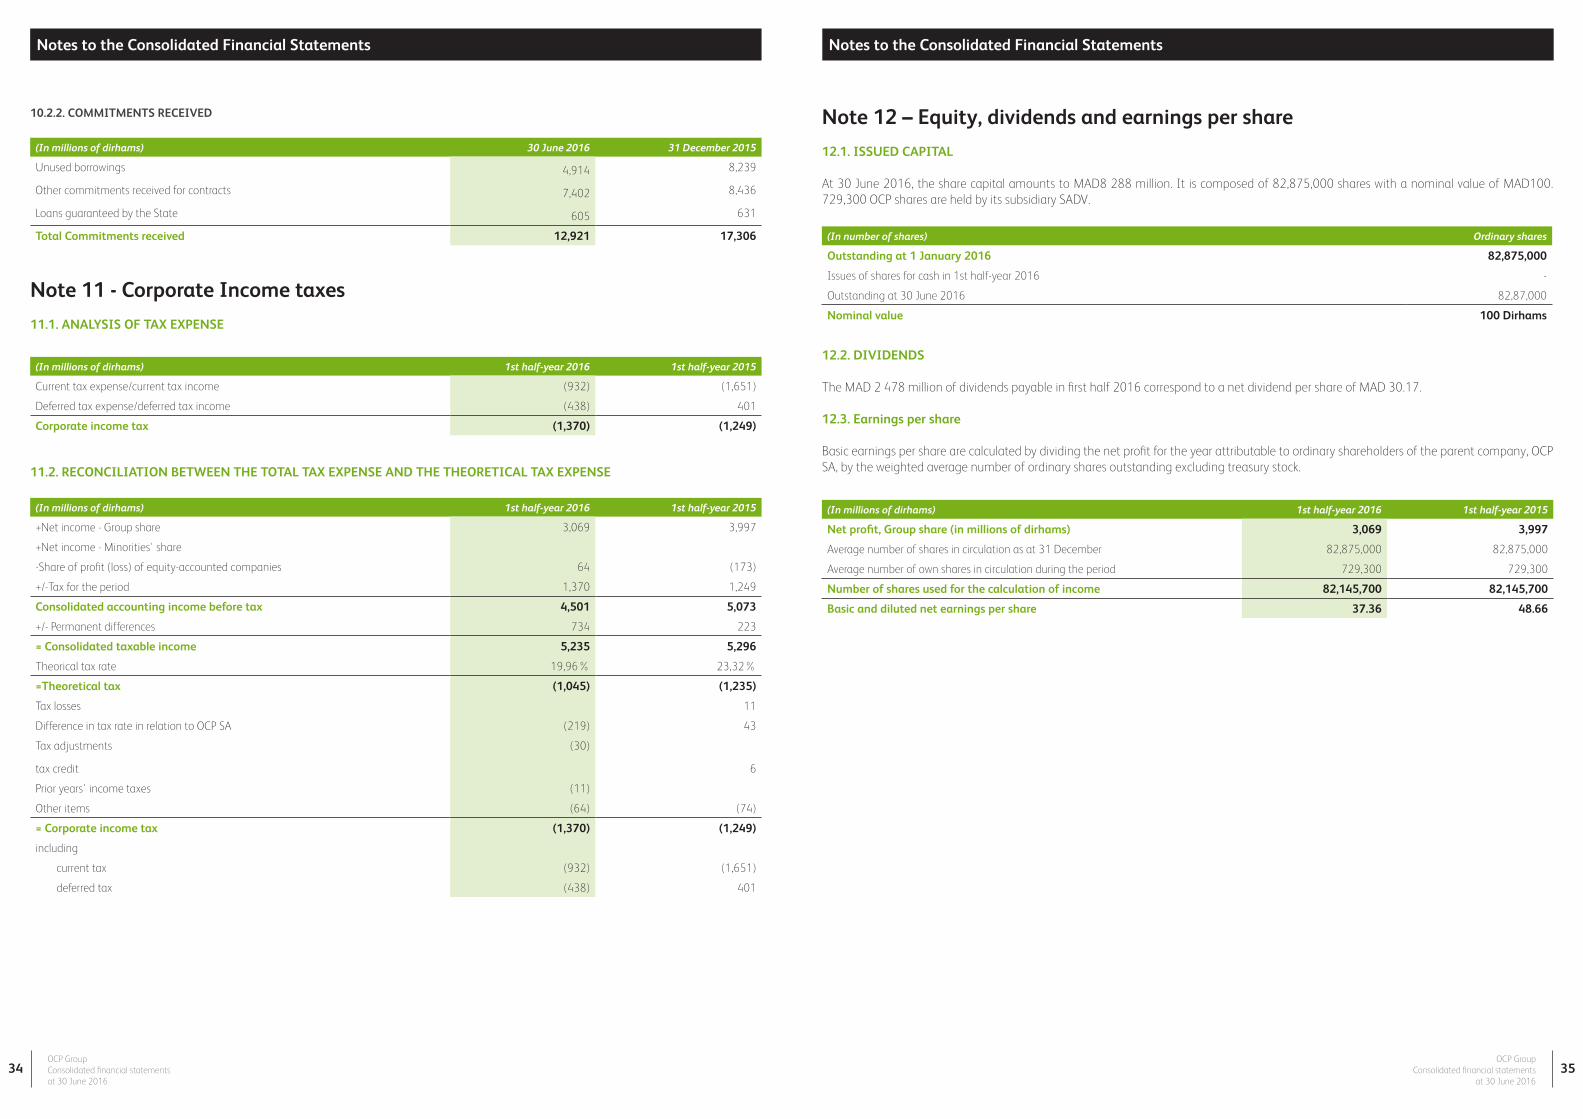
10.2.2. COMMITMENTS RECEIVED
(In millions of dirhams) 30 June 2016 31 December 2015
Unused borrowings 4,914 8,239
Other commitments received for contracts 7,402 8,436
Loans guaranteed by the State 605 631
Total Commitments received 12,921 17,306
(In millions of dirhams) 1st half-year 2016 1st half-year 2015
Current tax expense/current tax income (932) (1,651)
Deferred tax expense/deferred tax income (438) 401
Corporate income tax (1,370) (1,249)
Note 11 - Corporate Income taxes
11.1. ANALYSIS OF TAX EXPENSE
11.2. RECONCILIATION BETWEEN THE TOTAL TAX EXPENSE AND THE THEORETICAL TAX EXPENSE
(In millions of dirhams) 1st half-year 2016 1st half-year 2015
+Net income - Group share 3,069 3,997
+Net income - Minorities' share
-Share of profit (loss) of equity-accounted companies 64 (173)
+/-Tax for the period 1,370 1,249
Consolidated accounting income before tax 4,501 5,073
+/- Permanent differences 734 223
= Consolidated taxable income 5,235 5,296
Theorical tax rate 19,96% 23,32%
=Theoretical tax (1,045) (1,235)
Tax losses 11
Difference in tax rate in relation to OCP SA (219) 43
Tax adjustments (30)
tax credit 6
Prior years' income taxes (11)
Other items (64) (74)
= Corporate income tax (1,370) (1,249)
including
current tax (932) (1,651)
deferred tax (438) 401
Note 12 – Equity, dividends and earnings per share
12.1. ISSUED CAPITAL
At 30 June 2016, the share capital amounts to MAD8 288 million. It is composed of 82,875,000 shares with a nominal value of MAD100. 729,300 OCP shares are held by its subsidiary SADV.
12.2. DIVIDENDS
The MAD 2 478 million of dividends payable in first half 2016 correspond to a net dividend per share of MAD 30.17.
12.3. Earnings per share Basic earnings per share are calculated by dividing the net profit for the year attributable to ordinary shareholders of the parent company, OCP SA, by the weighted average number of ordinary shares outstanding excluding treasury stock.
(In number of shares) Ordinary shares
Outstanding at 1 January 2016 82,875,000
Issues of shares for cash in 1st half-year 2016 -
Outstanding at 30 June 2016 82,87,000
Nominal value 100 Dirhams
(In millions of dirhams) 1st half-year 2016 1st half-year 2015
Net profit, Group share (in millions of dirhams) 3,069 3,997
Average number of shares in circulation as at 31 December 82,875,000 82,875,000
Average number of own shares in circulation during the period 729,300 729,300
Number of shares used for the calculation of income 82,145,700 82,145,700
Basic and diluted net earnings per share 37.36 48.66
Notes to the Consolidated Financial Statements Notes to the Consolidated Financial Statements
OCP Group Consolidated financial statements
at 30 June 2016
OCP Group Consolidated financial statementsat 30 June 2016
36 37
Note 13 - Relations with the Moroccan State
The Moroccan State is the majority shareholder of OCP with a 94.12% stake. In this respect, the State receives annual dividends in accordance with the company’s dividend distribution policy. The dividends to be paid are proposed by the Board of Directors to the General Meeting of Shareholders. Their amount depends on several parameters, in particular the profits made, cash available and the company’s financial structure, as well as other factors that the Board of Directors may consider to be relevant.OCP has been a Société Anonyme (public limited liability company) since March 2008. Prior to that date, OCP, as a public enterprise, benefited from the State guarantee for loans taken out with foreign organizations.
In the same way as all companies that reside in Morocco, OCP is subject to the tax legislation in force, which requires the payment of duties, taxes and levies to the Moroccan State.
The following table shows the transactions performed with the State or with State-controlled enterprises for financial years 2016 and 2015:
Purpose of loan Loan currency Date of loan Amount in millions of dirhams as
at 30 June 2016
Amount in millions of dirhams as
at 31 December 2015
AFD outstanding loans consolidation EUR 2005 389 397
Sidi Chennane mining operations EUR 2002 200 215
Renewal of the sulphur unit circulation tank and supply circuit
EUR 2007 9 9
Renewal of three absorption towers EUR 2003 3 6
Acquisition of two hydraulic excavators EUR 2001 5 4
TOTAL EUR 605 631
(In millions of dirhams)
30 June 2016 31 December 2015
State and State-controlled
enterprisesBCP
State and State-controlled enterprises
BCP
Interest on investments 41 18 51 43
Utility costs 651 1,136
Other operating expenses 97 173
Interest on loans 21 40
Social charges 155 482
Transport expenses 814 1,525
Assets and inventories purchases 90 6
Dividends received 10 38
(In millions of dirhams)
30 June 2016 31 December 2015
State and State-controlled
enterprisesBCP
State and State-controlled enterprises
BCP
Trade receivables
Trade payables 596 590
Other receivables 60 39
Cash and cash equivalents 712 1,103 639 241
Investments 1,000 2,500 1,500
Loans 1,000 1,000
Statutory auditors’ report on the 2016 half year consolidated financial information
Notes to the Consolidated Financial Statements

2 - 4, rue Al Abtal - Hay Erraha - 20 200 Casablanca - Marocwww.ocpgroup.ma