Embed Size (px)
Citation preview

Press Release - Media Contacts: Seiichiro Toda/Joseph Jasper TEL: +81-3-3798-6511 ***** For immediate use January 30, 2017
Consolidated Financial Results
for the Nine Months Ended
December 31, 2016
- 1 -
1. Consolidated Business Results
The NEC Group adopted International Financial Reporting Standards (IFRS) starting with the fiscal year ending March 31, 2017. Consolidated financial statements for the previous fiscal year's third quarter, the previous fiscal year’s cumulative period through the third quarter and for the previous fiscal year are also presented in accordance with IFRS.
(1) Overview of the third quarter of the fiscal year ending March 31, 2017 (nine months ended December 31, 2016)
The worldwide economy during the nine months ended December 31, 2016 was characterized overall by a gradual pace of growth, mainly owing to the instability of financial markets from growing political uncertainty due to an economic slowdown in both developed and emerging countries, the United Kingdom's decision to withdraw from the European Union and the presidential election in the United States.
As for the Japanese economy, while international conditions were unstable, domestic demand, including personal consumption and corporate performance, remained steady.
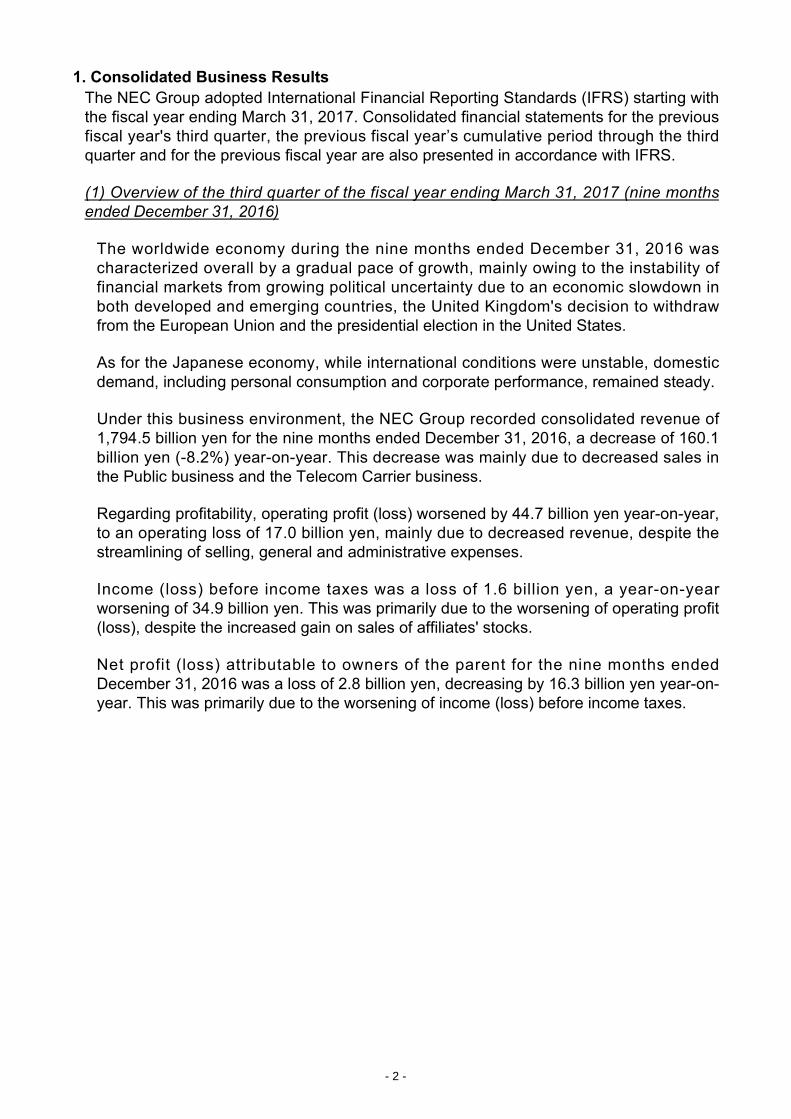
Under this business environment, the NEC Group recorded consolidated revenue of 1,794.5 billion yen for the nine months ended December 31, 2016, a decrease of 160.1 billion yen (-8.2%) year-on-year. This decrease was mainly due to decreased sales in the Public business and the Telecom Carrier business.
Regarding profitability, operating profit (loss) worsened by 44.7 billion yen year-on-year, to an operating loss of 17.0 billion yen, mainly due to decreased revenue, despite the streamlining of selling, general and administrative expenses.
Income (loss) before income taxes was a loss of 1.6 billion yen, a year-on-year worsening of 34.9 billion yen. This was primarily due to the worsening of operating profit (loss), despite the increased gain on sales of affiliates' stocks.
Net profit (loss) attributable to owners of the parent for the nine months ended December 31, 2016 was a loss of 2.8 billion yen, decreasing by 16.3 billion yen year-on-year. This was primarily due to the worsening of income (loss) before income taxes.
- 2 -
(2) Results by main business segment
Revenue by segment (revenue from customers):
Segments Nine months ended
December 31, 2015 Nine months ended
December 31, 2016 Change
In billions of yen In billions of yen %
Public 499.4 435.7 -12.8
Enterprise 218.4 225.2 3.1
Telecom Carrier 487.5 424.1 -13.0
System Platform 518.9 504.1 -2.8
Others 230.4 205.4 -10.9
Total 1,954.6 1,794.5 -8.2
Operating profit (loss) by segment:
Segments Nine months ended
December 31, 2015 Nine months ended
December 31, 2016 Change
In billions of yen In billions of yen In billions of yen
Public 24.4 14.5 -10.0
Enterprise 14.1 16.9 2.8
Telecom Carrier 21.2 2.9 -18.3
System Platform 11.7 7.6 -4.1
Others -8.0 -13.9 -6.0
Adjustment -35.9 -45.0 -9.2
Total 27.7 -17.0 -44.7
Note: Amounts in this section “(2) Results by main business segment” are rounded to 0.1 billion yen. Amounts in millions of yen are shown in section “Note 1: Business Segment” of this news release.
(Business segment figures in brackets below denote increases or decreases as compared with the corresponding period of the previous fiscal year.)
Public Business Revenue: 435.7 billion yen (-12.8%) Operating Profit (Loss): 14.5 billion yen (-10.0 billion yen)
In the Public business, revenue was 435.7 billion yen, a decrease of 63.8 billion yen (-12.8%) year-on-year, mainly due to decreased sales for government offices and public services where there were large-scale projects in the same period of the previous fiscal year, and decreased demand for the digitalization of fire and emergency radio in the public sector.
Operating profit (loss) worsened by 10.0 billion yen year-on-year, to an operating profit of 14.5 billion yen, mainly owing to decreased sales and decreased profitability of the space business.
- 3 -
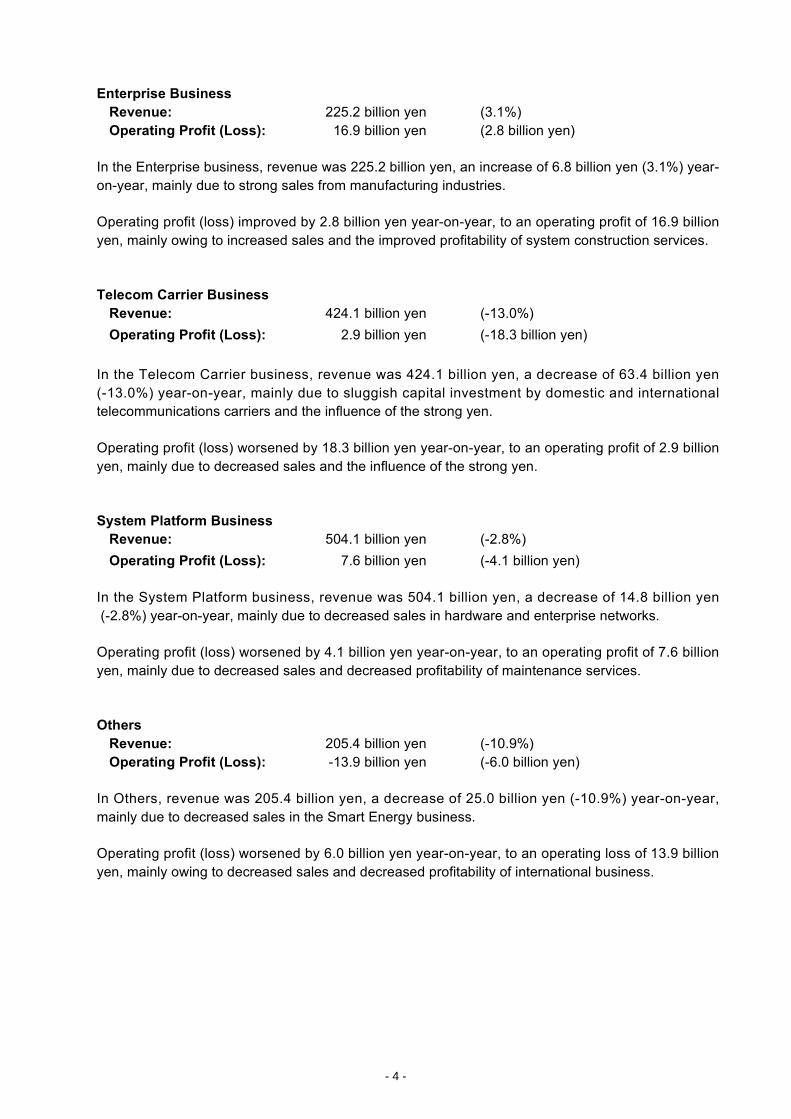
Enterprise Business Revenue: 225.2 billion yen (3.1%) Operating Profit (Loss): 16.9 billion yen (2.8 billion yen)
In the Enterprise business, revenue was 225.2 billion yen, an increase of 6.8 billion yen (3.1%) year-on-year, mainly due to strong sales from manufacturing industries.
Operating profit (loss) improved by 2.8 billion yen year-on-year, to an operating profit of 16.9 billion yen, mainly owing to increased sales and the improved profitability of system construction services.
Telecom Carrier Business Revenue: 424.1 billion yen (-13.0%) Operating Profit (Loss): 2.9 billion yen (-18.3 billion yen)
In the Telecom Carrier business, revenue was 424.1 billion yen, a decrease of 63.4 billion yen (-13.0%) year-on-year, mainly due to sluggish capital investment by domestic and international telecommunications carriers and the influence of the strong yen.
Operating profit (loss) worsened by 18.3 billion yen year-on-year, to an operating profit of 2.9 billion yen, mainly due to decreased sales and the influence of the strong yen.
System Platform Business Revenue: 504.1 billion yen (-2.8%) Operating Profit (Loss): 7.6 billion yen (-4.1 billion yen)
In the System Platform business, revenue was 504.1 billion yen, a decrease of 14.8 billion yen (-2.8%) year-on-year, mainly due to decreased sales in hardware and enterprise networks.
Operating profit (loss) worsened by 4.1 billion yen year-on-year, to an operating profit of 7.6 billion yen, mainly due to decreased sales and decreased profitability of maintenance services.
Others Revenue: 205.4 billion yen (-10.9%) Operating Profit (Loss): -13.9 billion yen (-6.0 billion yen)
In Others, revenue was 205.4 billion yen, a decrease of 25.0 billion yen (-10.9%) year-on-year, mainly due to decreased sales in the Smart Energy business.
Operating profit (loss) worsened by 6.0 billion yen year-on-year, to an operating loss of 13.9 billion yen, mainly owing to decreased sales and decreased profitability of international business.
- 4 -
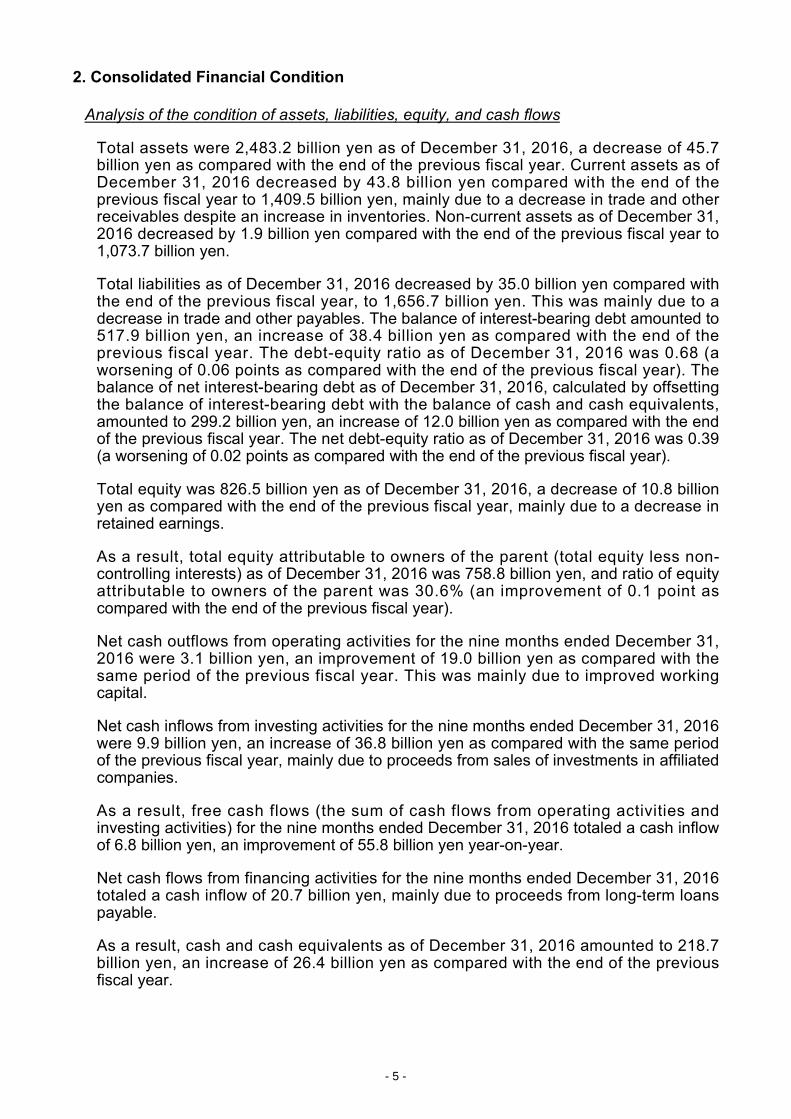
2. Consolidated Financial Condition
Analysis of the condition of assets, liabilities, equity, and cash flows
Total assets were 2,483.2 billion yen as of December 31, 2016, a decrease of 45.7 billion yen as compared with the end of the previous fiscal year. Current assets as of December 31, 2016 decreased by 43.8 billion yen compared with the end of the previous fiscal year to 1,409.5 billion yen, mainly due to a decrease in trade and other receivables despite an increase in inventories. Non-current assets as of December 31, 2016 decreased by 1.9 billion yen compared with the end of the previous fiscal year to 1,073.7 billion yen.
Total liabilities as of December 31, 2016 decreased by 35.0 billion yen compared with the end of the previous fiscal year, to 1,656.7 billion yen. This was mainly due to a decrease in trade and other payables. The balance of interest-bearing debt amounted to 517.9 billion yen, an increase of 38.4 billion yen as compared with the end of the previous fiscal year. The debt-equity ratio as of December 31, 2016 was 0.68 (a worsening of 0.06 points as compared with the end of the previous fiscal year). The balance of net interest-bearing debt as of December 31, 2016, calculated by offsetting the balance of interest-bearing debt with the balance of cash and cash equivalents, amounted to 299.2 billion yen, an increase of 12.0 billion yen as compared with the end of the previous fiscal year. The net debt-equity ratio as of December 31, 2016 was 0.39 (a worsening of 0.02 points as compared with the end of the previous fiscal year).
Total equity was 826.5 billion yen as of December 31, 2016, a decrease of 10.8 billion yen as compared with the end of the previous fiscal year, mainly due to a decrease in retained earnings.
As a result, total equity attributable to owners of the parent (total equity less non-controlling interests) as of December 31, 2016 was 758.8 billion yen, and ratio of equity attributable to owners of the parent was 30.6% (an improvement of 0.1 point as compared with the end of the previous fiscal year).
Net cash outflows from operating activities for the nine months ended December 31, 2016 were 3.1 billion yen, an improvement of 19.0 billion yen as compared with the same period of the previous fiscal year. This was mainly due to improved working capital.
Net cash inflows from investing activities for the nine months ended December 31, 2016 were 9.9 billion yen, an increase of 36.8 billion yen as compared with the same period of the previous fiscal year, mainly due to proceeds from sales of investments in affiliated companies.
As a result, free cash flows (the sum of cash flows from operating activities and investing activities) for the nine months ended December 31, 2016 totaled a cash inflow of 6.8 billion yen, an improvement of 55.8 billion yen year-on-year.
Net cash flows from financing activities for the nine months ended December 31, 2016 totaled a cash inflow of 20.7 billion yen, mainly due to proceeds from long-term loans payable.
As a result, cash and cash equivalents as of December 31, 2016 amounted to 218.7 billion yen, an increase of 26.4 billion yen as compared with the end of the previous fiscal year.
- 5 -
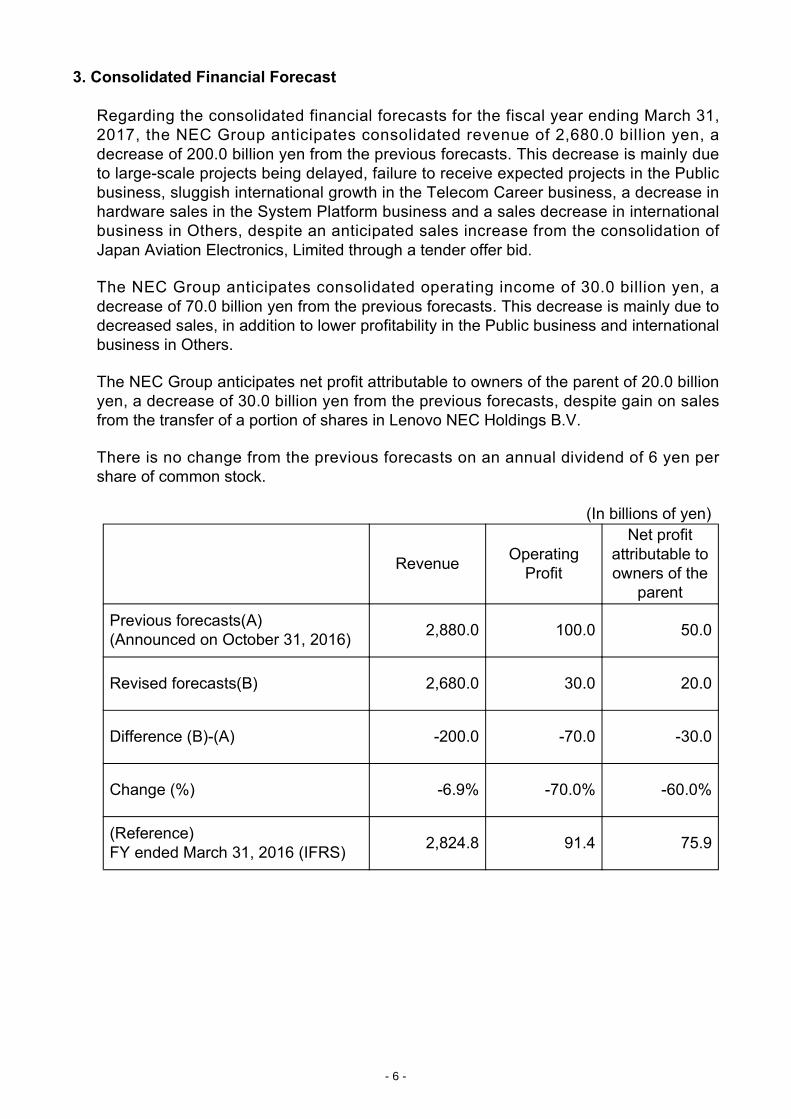
3. Consolidated Financial Forecast
Regarding the consolidated financial forecasts for the fiscal year ending March 31, 2017, the NEC Group anticipates consolidated revenue of 2,680.0 billion yen, a decrease of 200.0 billion yen from the previous forecasts. This decrease is mainly due to large-scale projects being delayed, failure to receive expected projects in the Public business, sluggish international growth in the Telecom Career business, a decrease in hardware sales in the System Platform business and a sales decrease in international business in Others, despite an anticipated sales increase from the consolidation of Japan Aviation Electronics, Limited through a tender offer bid.
The NEC Group anticipates consolidated operating income of 30.0 billion yen, a decrease of 70.0 billion yen from the previous forecasts. This decrease is mainly due to decreased sales, in addition to lower profitability in the Public business and international business in Others.
The NEC Group anticipates net profit attributable to owners of the parent of 20.0 billion yen, a decrease of 30.0 billion yen from the previous forecasts, despite gain on sales from the transfer of a portion of shares in Lenovo NEC Holdings B.V.
There is no change from the previous forecasts on an annual dividend of 6 yen per share of common stock.
(In billions of yen)
Revenue Operating
Profit
Net profit attributable to owners of the
parent
Previous forecasts(A) (Announced on October 31, 2016) 2,880.0 100.0 50.0
Revised forecasts(B) 2,680.0 30.0 20.0
Difference (B)-(A) -200.0 -70.0 -30.0
Change (%) -6.9% -70.0% -60.0%
(Reference) FY ended March 31, 2016 (IFRS) 2,824.8 91.4 75.9
- 6 -
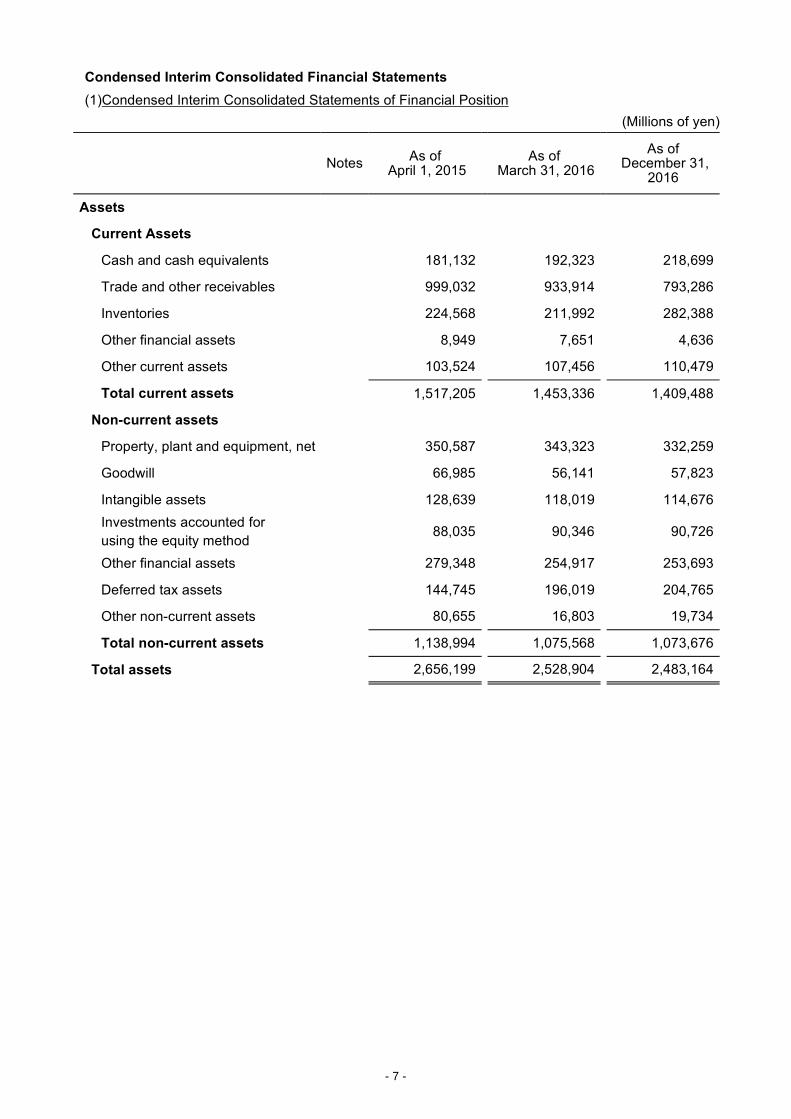
Condensed Interim Consolidated Financial Statements (1)Condensed Interim Consolidated Statements of Financial Position
(Millions of yen)
Notes As of April 1, 2015
As of March 31, 2016
As of December 31,
2016
Assets
Current Assets
Cash and cash equivalents 181,132 192,323 218,699
Trade and other receivables 999,032 933,914 793,286
Inventories 224,568 211,992 282,388
Other financial assets 8,949 7,651 4,636
Other current assets 103,524 107,456 110,479
Total current assets 1,517,205 1,453,336 1,409,488
Non-current assets
Property, plant and equipment, net 350,587 343,323 332,259
Goodwill 66,985 56,141 57,823
Intangible assets 128,639 118,019 114,676 Investments accounted for using the equity method
88,035 90,346 90,726
Other financial assets 279,348 254,917 253,693
Deferred tax assets 144,745 196,019 204,765
Other non-current assets 80,655 16,803 19,734
Total non-current assets 1,138,994 1,075,568 1,073,676
Total assets 2,656,199 2,528,904 2,483,164
- 7 -
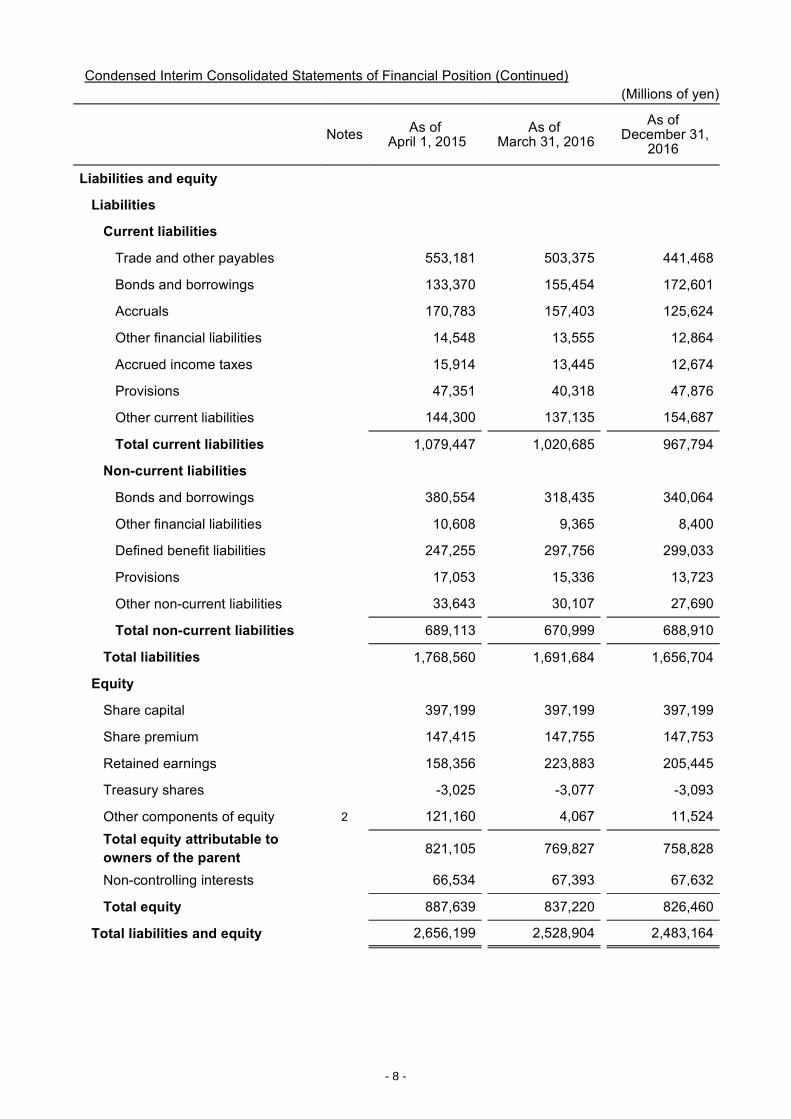
Condensed Interim Consolidated Statements of Financial Position (Continued) (Millions of yen)
Notes As of April 1, 2015
As of March 31, 2016
As of December 31,
2016
Liabilities and equity
Liabilities
Current liabilities
Trade and other payables 553,181 503,375 441,468
Bonds and borrowings 133,370 155,454 172,601
Accruals 170,783 157,403 125,624
Other financial liabilities 14,548 13,555 12,864
Accrued income taxes 15,914 13,445 12,674
Provisions 47,351 40,318 47,876
Other current liabilities 144,300 137,135 154,687
Total current liabilities 1,079,447 1,020,685 967,794
Non-current liabilities
Bonds and borrowings 380,554 318,435 340,064
Other financial liabilities 10,608 9,365 8,400
Defined benefit liabilities 247,255 297,756 299,033
Provisions 17,053 15,336 13,723
Other non-current liabilities 33,643 30,107 27,690
Total non-current liabilities 689,113 670,999 688,910
Total liabilities 1,768,560 1,691,684 1,656,704
Equity
Share capital 397,199 397,199 397,199
Share premium 147,415 147,755 147,753
Retained earnings 158,356 223,883 205,445
Treasury shares -3,025 -3,077 -3,093
Other components of equity 2 121,160 4,067 11,524 Total equity attributable to
owners of the parent 821,105 769,827 758,828
Non-controlling interests 66,534 67,393 67,632
Total equity 887,639 837,220 826,460
Total liabilities and equity 2,656,199 2,528,904 2,483,164
- 8 -
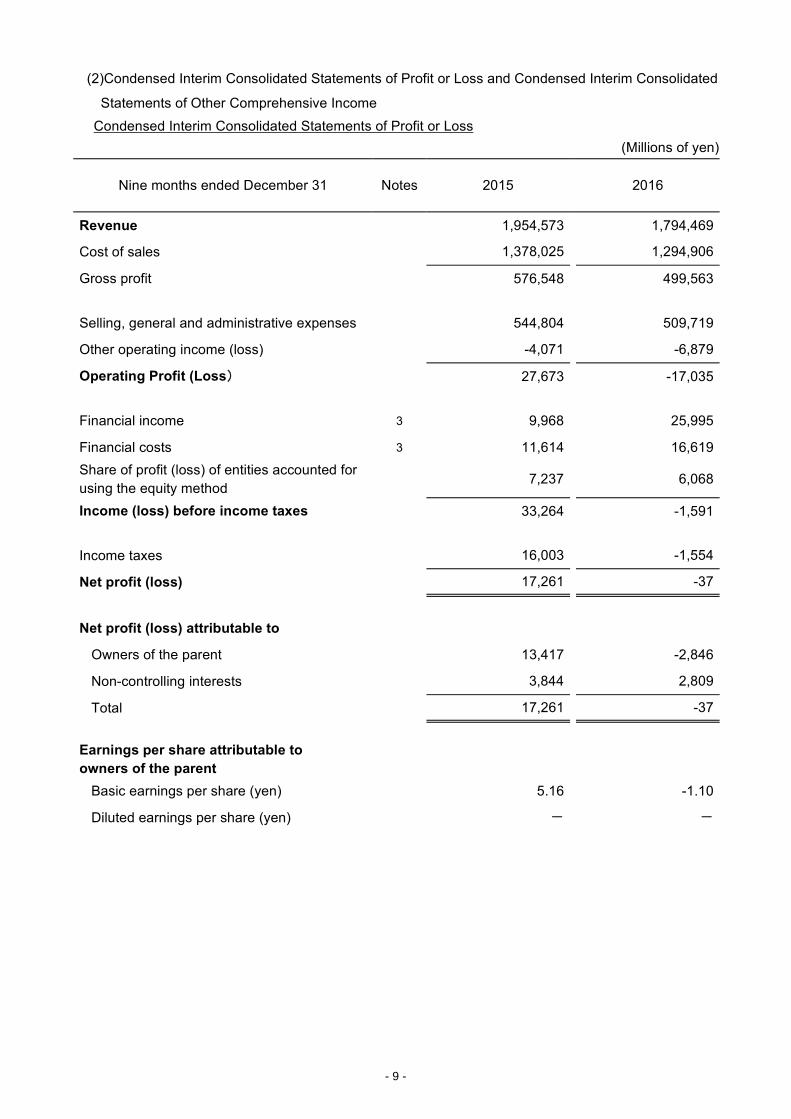
(2)Condensed Interim Consolidated Statements of Profit or Loss and Condensed Interim Consolidated
Statements of Other Comprehensive Income
Condensed Interim Consolidated Statements of Profit or Loss (Millions of yen)
Nine months ended December 31 Notes 2015 2016
Revenue 1,954,573 1,794,469
Cost of sales 1,378,025 1,294,906
Gross profit 576,548 499,563
Selling, general and administrative expenses 544,804 509,719
Other operating income (loss) -4,071 -6,879
Operating Profit (Loss) 27,673 -17,035
Financial income 3 9,968 25,995
Financial costs 3 11,614 16,619 Share of profit (loss) of entities accounted for using the equity method
7,237 6,068
Income (loss) before income taxes 33,264 -1,591
Income taxes 16,003 -1,554
Net profit (loss) 17,261 -37
Net profit (loss) attributable to
Owners of the parent 13,417 -2,846
Non-controlling interests 3,844 2,809
Total 17,261 -37
Earnings per share attributable to
owners of the parent
Basic earnings per share (yen) 5.16 -1.10
Diluted earnings per share (yen) - -
- 9 -
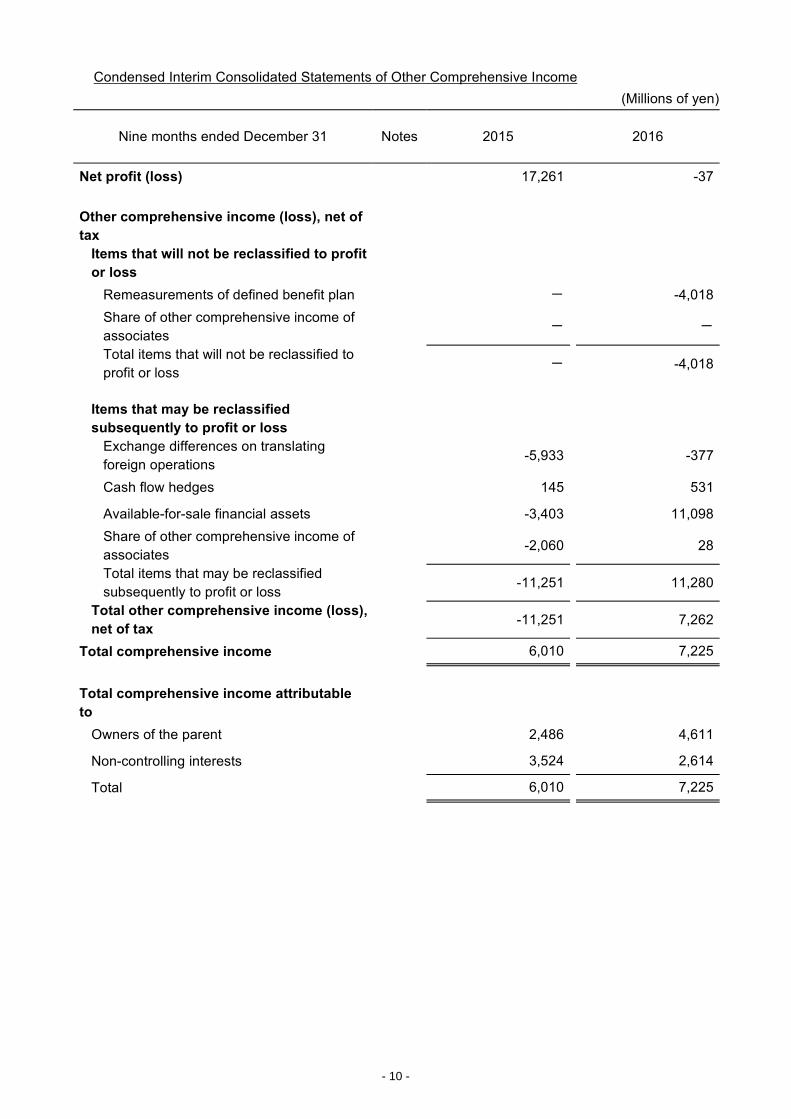
Condensed Interim Consolidated Statements of Other Comprehensive Income (Millions of yen)
Nine months ended December 31 Notes 2015 2016
Net profit (loss) 17,261 -37
Other comprehensive income (loss), net of tax
Items that will not be reclassified to profit or loss
Remeasurements of defined benefit plan - -4,018 Share of other comprehensive income of associates
- -
Total items that will not be reclassified to profit or loss
- -4,018
Items that may be reclassified subsequently to profit or loss
Exchange differences on translating foreign operations
-5,933 -377
Cash flow hedges 145 531
Available-for-sale financial assets -3,403 11,098 Share of other comprehensive income of associates
-2,060 28
Total items that may be reclassified subsequently to profit or loss
-11,251 11,280
Total other comprehensive income (loss), net of tax -11,251 7,262
Total comprehensive income 6,010 7,225
Total comprehensive income attributable to
Owners of the parent 2,486 4,611
Non-controlling interests 3,524 2,614
Total 6,010 7,225
- 10 -
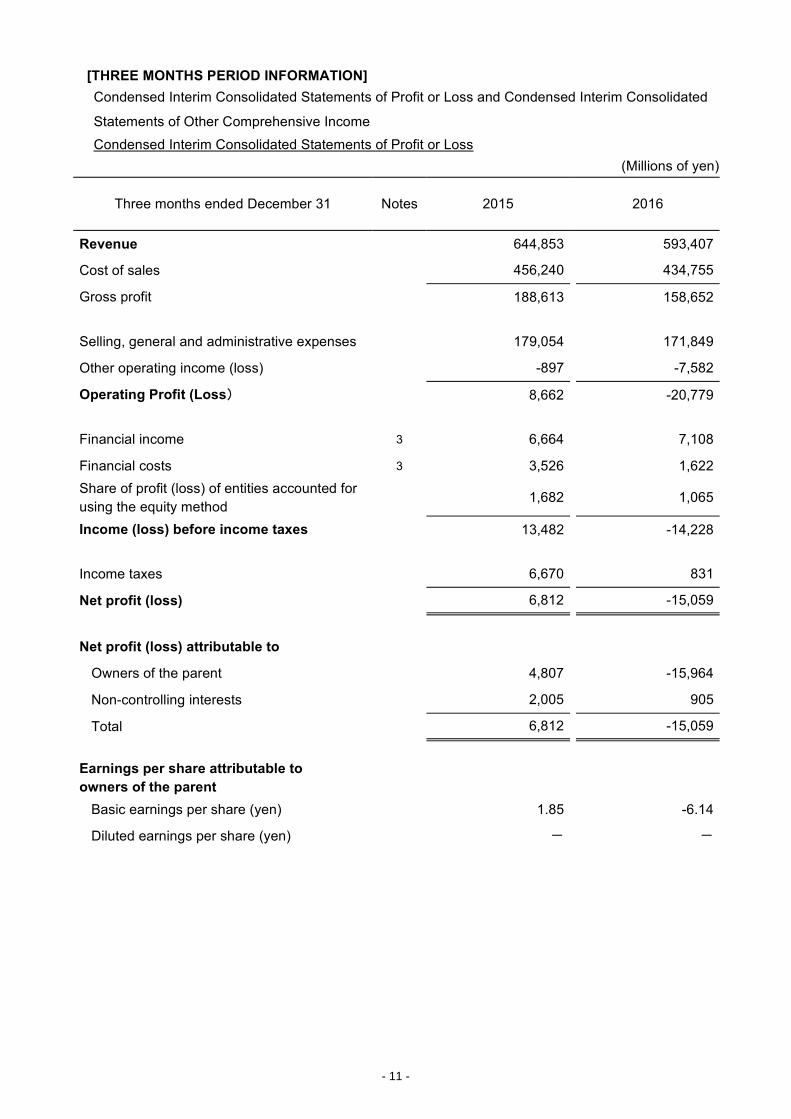
[THREE MONTHS PERIOD INFORMATION] Condensed Interim Consolidated Statements of Profit or Loss and Condensed Interim Consolidated
Statements of Other Comprehensive Income
Condensed Interim Consolidated Statements of Profit or Loss (Millions of yen)
Three months ended December 31 Notes 2015 2016
Revenue 644,853 593,407
Cost of sales 456,240 434,755
Gross profit 188,613 158,652
Selling, general and administrative expenses 179,054 171,849
Other operating income (loss) -897 -7,582
Operating Profit (Loss) 8,662 -20,779
Financial income 3 6,664 7,108
Financial costs 3 3,526 1,622 Share of profit (loss) of entities accounted for using the equity method
1,682 1,065
Income (loss) before income taxes 13,482 -14,228
Income taxes 6,670 831
Net profit (loss) 6,812 -15,059
Net profit (loss) attributable to
Owners of the parent 4,807 -15,964
Non-controlling interests 2,005 905
Total 6,812 -15,059
Earnings per share attributable to
owners of the parent
Basic earnings per share (yen) 1.85 -6.14
Diluted earnings per share (yen) - -
- 11 -
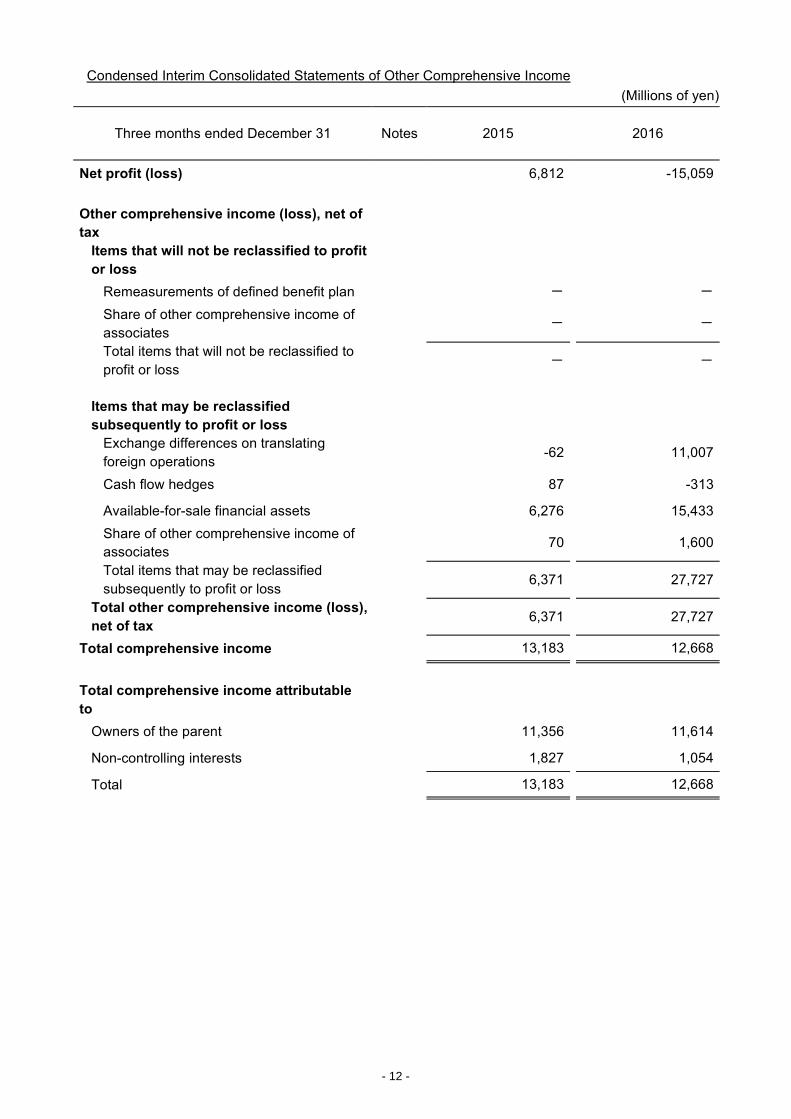
Condensed Interim Consolidated Statements of Other Comprehensive Income (Millions of yen)
Three months ended December 31 Notes 2015 2016
Net profit (loss) 6,812 -15,059
Other comprehensive income (loss), net of tax
Items that will not be reclassified to profit or loss
Remeasurements of defined benefit plan - -
Share of other comprehensive income of associates
- -
Total items that will not be reclassified to profit or loss
- -
Items that may be reclassified subsequently to profit or loss
Exchange differences on translating foreign operations
-62 11,007
Cash flow hedges 87 -313
Available-for-sale financial assets 6,276 15,433 Share of other comprehensive income of associates
70 1,600
Total items that may be reclassified subsequently to profit or loss
6,371 27,727
Total other comprehensive income (loss), net of tax 6,371 27,727
Total comprehensive income 13,183 12,668
Total comprehensive income attributable to
Owners of the parent 11,356 11,614
Non-controlling interests 1,827 1,054
Total 13,183 12,668
- 12 -
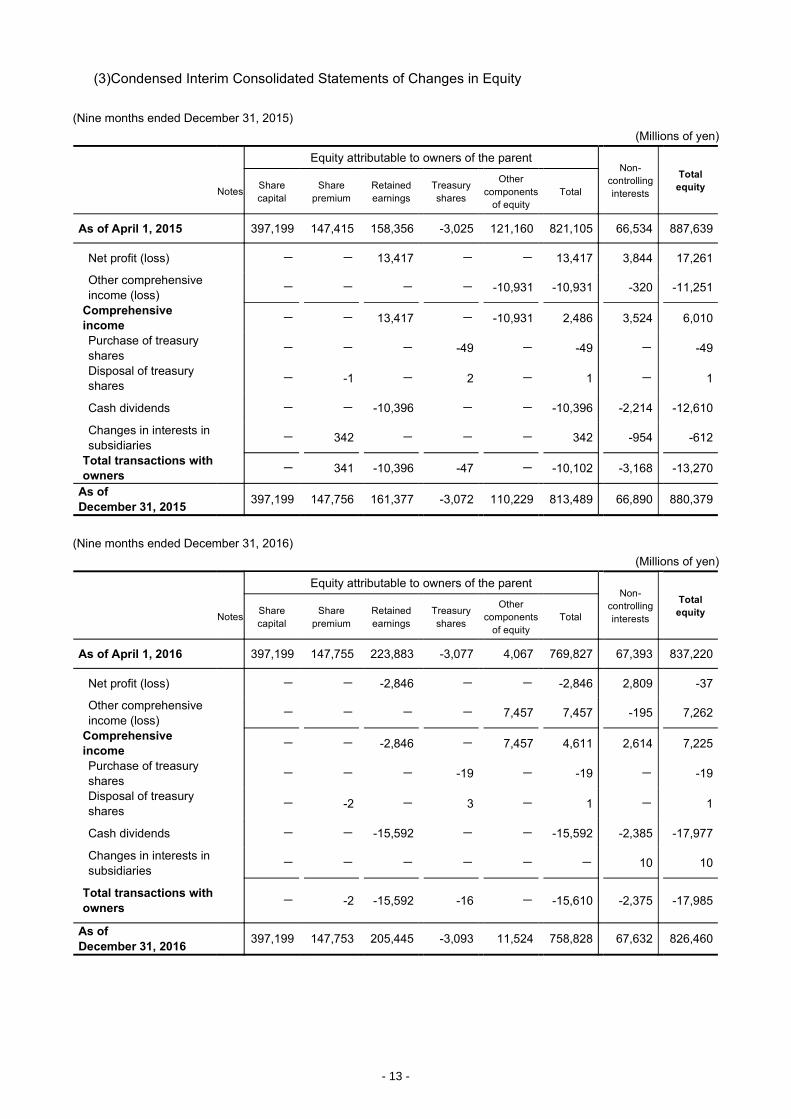
(3)Condensed Interim Consolidated Statements of Changes in Equity
(Nine months ended December 31, 2015) (Millions of yen)
Equity attributable to owners of the parent
Non-
controlling interests
Total equity Notes Share
capital Share
premium
Retained earnings
Treasury shares
Other components
of equity Total
As of April 1, 2015 397,199 147,415 158,356 -3,025 121,160 821,105 66,534 887,639
Net profit (loss) - - 13,417 - - 13,417 3,844 17,261
Other comprehensive income (loss) - - - - -10,931 -10,931 -320 -11,251
Comprehensive income - - 13,417 - -10,931 2,486 3,524 6,010
Purchase of treasury shares - - - -49 - -49 - -49
Disposal of treasury shares - -1 - 2 - 1 - 1
Cash dividends - - -10,396 - - -10,396 -2,214 -12,610
Changes in interests in subsidiaries - 342 - - - 342 -954 -612
Total transactions with owners - 341 -10,396 -47 - -10,102 -3,168 -13,270
As of December 31, 2015 397,199 147,756 161,377 -3,072 110,229 813,489 66,890 880,379
(Nine months ended December 31, 2016) (Millions of yen)
Equity attributable to owners of the parent
Non-
controlling interests
Total equity Notes Share
capital Share
premium
Retained earnings
Treasury shares
Other components
of equity Total
As of April 1, 2016 397,199 147,755 223,883 -3,077 4,067 769,827 67,393 837,220
Net profit (loss) - - -2,846 - - -2,846 2,809 -37
Other comprehensive income (loss) - - - - 7,457 7,457 -195 7,262
Comprehensive income - - -2,846 - 7,457 4,611 2,614 7,225
Purchase of treasury shares - - - -19 - -19 - -19
Disposal of treasury shares - -2 - 3 - 1 - 1
Cash dividends - - -15,592 - - -15,592 -2,385 -17,977
Changes in interests in subsidiaries - - - - - - 10 10
Total transactions with owners - -2 -15,592 -16 - -15,610 -2,375 -17,985
As of December 31, 2016 397,199 147,753 205,445 -3,093 11,524 758,828 67,632 826,460
- 13 -
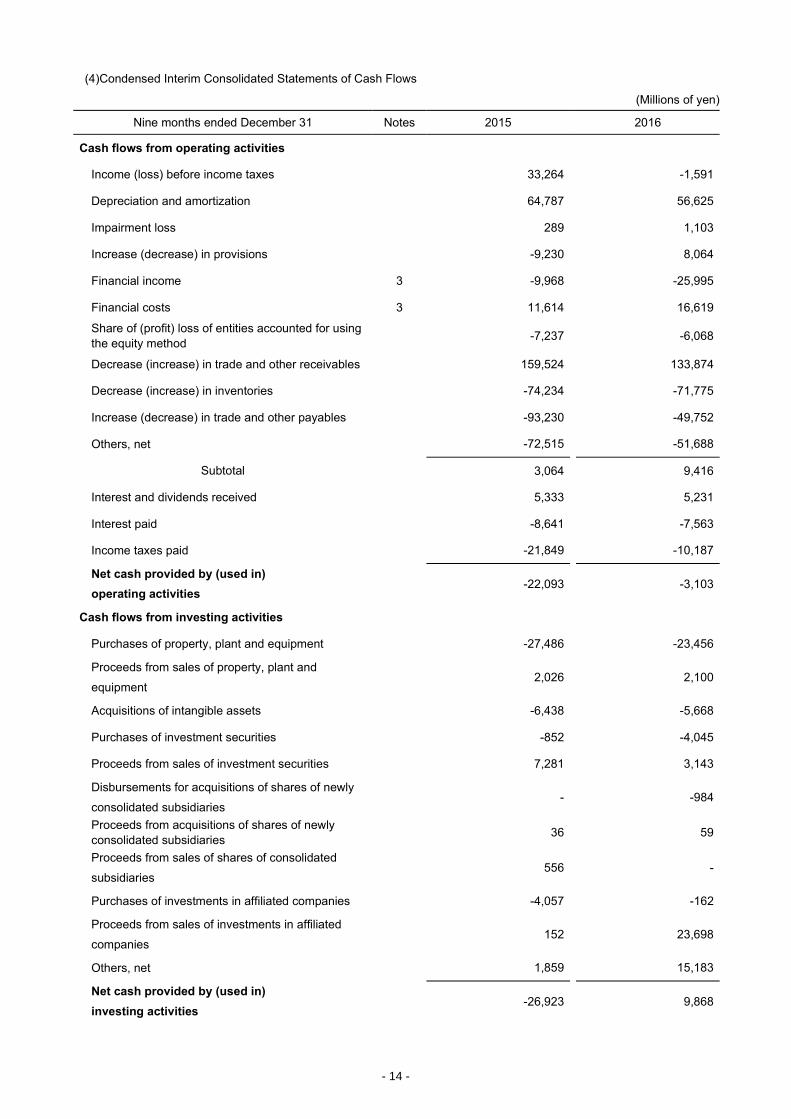
(4)Condensed Interim Consolidated Statements of Cash Flows
(Millions of yen)
Nine months ended December 31 Notes 2015 2016
Cash flows from operating activities
Income (loss) before income taxes 33,264 -1,591
Depreciation and amortization 64,787 56,625
Impairment loss 289 1,103
Increase (decrease) in provisions -9,230 8,064
Financial income 3 -9,968 -25,995
Financial costs 3 11,614 16,619
Share of (profit) loss of entities accounted for using the equity method -7,237 -6,068
Decrease (increase) in trade and other receivables 159,524 133,874
Decrease (increase) in inventories -74,234 -71,775
Increase (decrease) in trade and other payables -93,230 -49,752
Others, net -72,515 -51,688
Subtotal 3,064 9,416
Interest and dividends received 5,333 5,231
Interest paid -8,641 -7,563
Income taxes paid -21,849 -10,187
Net cash provided by (used in) operating activities
-22,093 -3,103
Cash flows from investing activities
Purchases of property, plant and equipment -27,486 -23,456
Proceeds from sales of property, plant and
equipment 2,026 2,100
Acquisitions of intangible assets -6,438 -5,668
Purchases of investment securities -852 -4,045
Proceeds from sales of investment securities 7,281 3,143
Disbursements for acquisitions of shares of newly
consolidated subsidiaries - -984
Proceeds from acquisitions of shares of newly consolidated subsidiaries 36 59
Proceeds from sales of shares of consolidated
subsidiaries 556 -
Purchases of investments in affiliated companies -4,057 -162
Proceeds from sales of investments in affiliated
companies 152 23,698
Others, net 1,859 15,183
Net cash provided by (used in) investing activities
-26,923 9,868
- 14 -
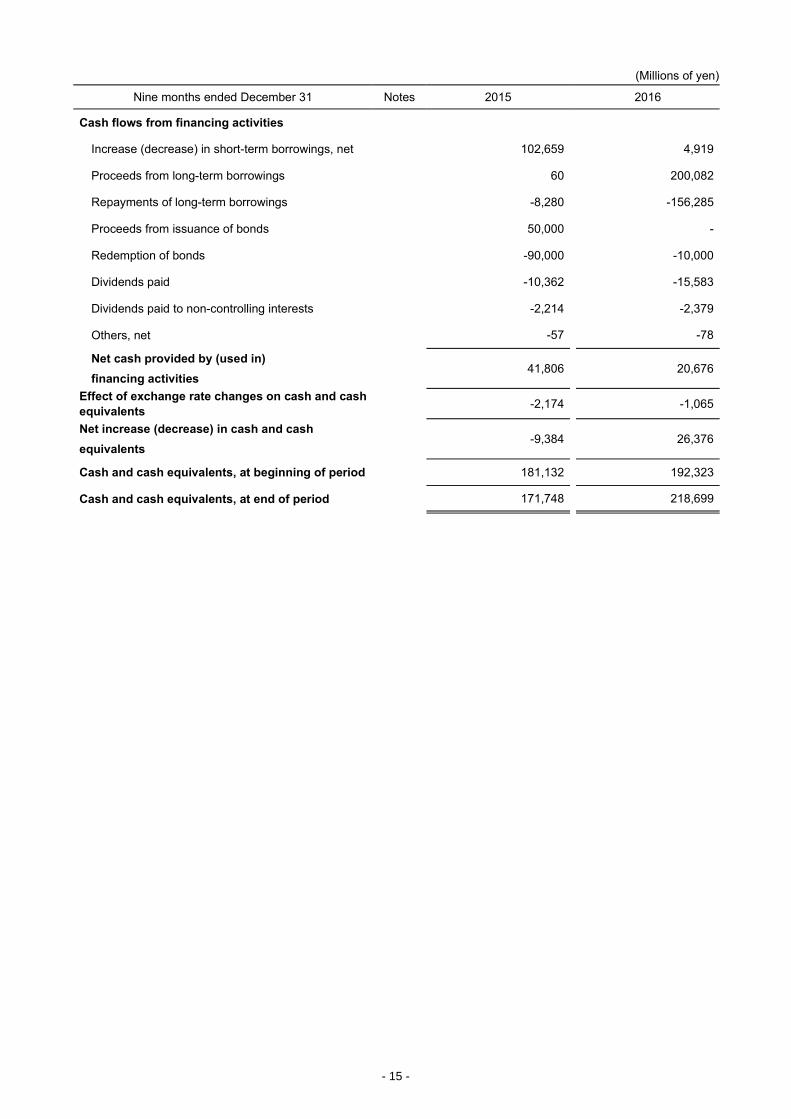
(Millions of yen)
Nine months ended December 31 Notes 2015 2016
Cash flows from financing activities
Increase (decrease) in short-term borrowings, net 102,659 4,919
Proceeds from long-term borrowings 60 200,082
Repayments of long-term borrowings -8,280 -156,285
Proceeds from issuance of bonds 50,000 -
Redemption of bonds -90,000 -10,000
Dividends paid -10,362 -15,583
Dividends paid to non-controlling interests -2,214 -2,379
Others, net -57 -78
Net cash provided by (used in) financing activities
41,806 20,676
Effect of exchange rate changes on cash and cash equivalents -2,174 -1,065
Net increase (decrease) in cash and cash equivalents
-9,384 26,376
Cash and cash equivalents, at beginning of period 181,132 192,323
Cash and cash equivalents, at end of period 171,748 218,699
- 15 -
1. Business Segment (1)General information about reportable segments
The reportable segments of NEC Corporation ( "the Company" or "NEC" ) are determined from operating segments that are identified in terms of similarity of products, services and markets based on business, and are the businesses for which the Company is able to obtain respective financial information separately, and the businesses are investigated periodically in order for the Board of Directors to conduct periodic investigation to determine distribution of management resources and evaluate their business results. The Company has four reportable segments, which are the Public, Enterprise, Telecom Carrier and System Platform businesses.
Descriptions of each reportable segment are as follows:
Public
This segment mainly renders System Integration (Systems Implementation, Consulting), Maintenance and Support,
Outsourcing / Cloud Services, and System Equipment for Government, Public, Healthcare, Finance and Media.
Enterprise
This segment mainly renders System Integration (Systems Implementation, Consulting), Maintenance and Support,
and Outsourcing / Cloud Services for Manufacturing, Retail and Services.
Telecom Carrier
This segment mainly renders Network Infrastructure (Core Network, Mobile Phone Base Stations, Submarine
Systems (Submarine Cable Systems, Ocean Observation Systems), Optical Transmission Systems, Routers /
Switches, Mobile Backhaul ("PASOLINK")), and Services & Management (Telecom Operations and Management
Solutions (TOMS), Services / Solutions) for Telecom Carriers.
System Platform
This segment mainly renders Hardware (Servers, Mainframes, Supercomputers, Storage, Business PCs, Tablet Devices, POS, ATMs, Control Equipment, Wireless LAN Routers, Displays, Projectors), Software (Integrated Operation Management, Application Servers, Security, Database Software), Enterprise Network Solutions (IP Telephony Systems, WAN / Wireless Access Equipment, LAN Products), and Services (Data Center Infrastructure, Maintenance and Support).
(2)Basis of measurement for reportable segment sales and segment income or loss Segment income (loss) is based on operating income (loss). Inter-segment revenue and transfers are based on arm's-length price. The accounting policies applied to reportable segment basically follow the "Significant Accounting Policies" disclosed in Note 3. of the "Consolidated Financial Results for the First Quarter of the Fiscal Year Ending March 31, 2017" published on July 29, 2016.
- 16 -
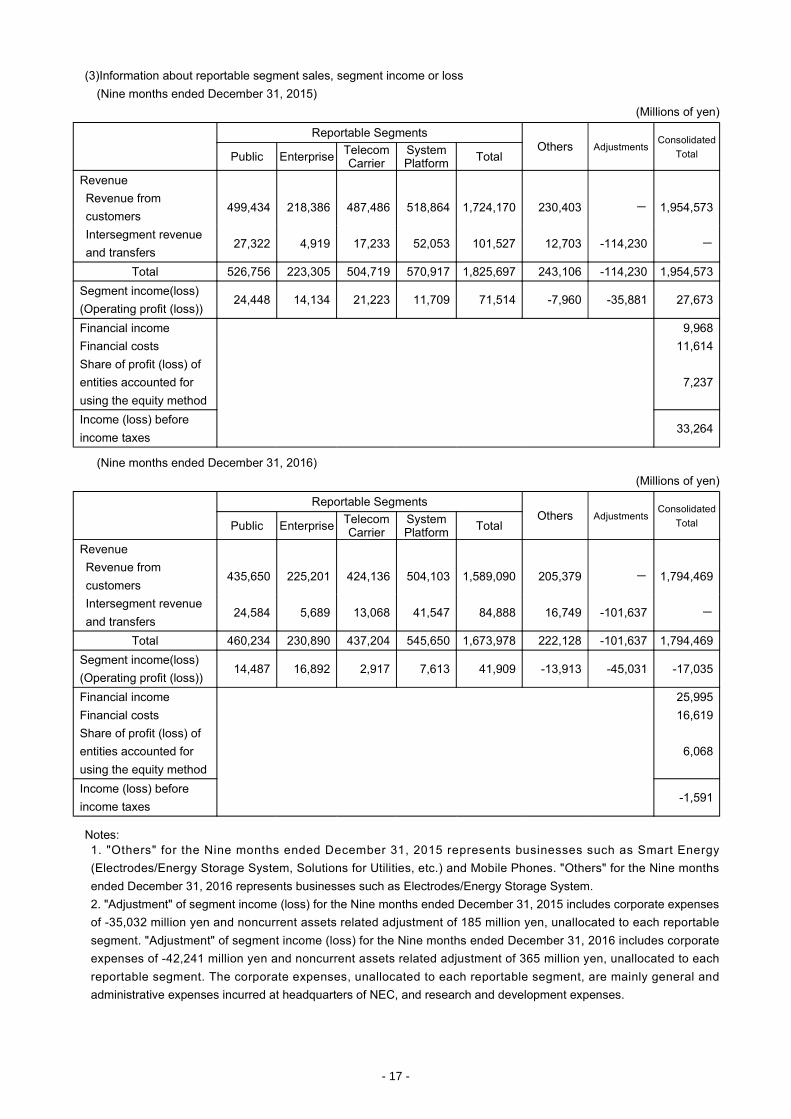
(3)Information about reportable segment sales, segment income or loss (Nine months ended December 31, 2015)
(Millions of yen)
Reportable Segments
Others Adjustments Consolidated
Total Public Enterprise Telecom Carrier
System Platform
Total
Revenue
Revenue from customers
499,434 218,386 487,486 518,864 1,724,170 230,403 - 1,954,573
Intersegment revenue and transfers
27,322 4,919 17,233 52,053 101,527 12,703 -114,230 -
Total 526,756 223,305 504,719 570,917 1,825,697 243,106 -114,230 1,954,573 Segment income(loss) (Operating profit (loss))
24,448 14,134 21,223 11,709 71,514 -7,960 -35,881 27,673
Financial income 9,968 Financial costs 11,614 Share of profit (loss) of entities accounted for using the equity method
7,237
Income (loss) before income taxes
33,264
(Nine months ended December 31, 2016)
(Millions of yen)
Reportable Segments
Others Adjustments Consolidated
Total Public Enterprise Telecom Carrier
System Platform
Total
Revenue
Revenue from customers
435,650 225,201 424,136 504,103 1,589,090 205,379 - 1,794,469
Intersegment revenue and transfers
24,584 5,689 13,068 41,547 84,888 16,749 -101,637 -
Total 460,234 230,890 437,204 545,650 1,673,978 222,128 -101,637 1,794,469 Segment income(loss) (Operating profit (loss))
14,487 16,892 2,917 7,613 41,909 -13,913 -45,031 -17,035
Financial income 25,995 Financial costs 16,619 Share of profit (loss) of entities accounted for using the equity method
6,068
Income (loss) before income taxes
-1,591
Notes: 1. "Others" for the Nine months ended December 31, 2015 represents businesses such as Smart Energy (Electrodes/Energy Storage System, Solutions for Utilities, etc.) and Mobile Phones. "Others" for the Nine months ended December 31, 2016 represents businesses such as Electrodes/Energy Storage System. 2. "Adjustment" of segment income (loss) for the Nine months ended December 31, 2015 includes corporate expenses of -35,032 million yen and noncurrent assets related adjustment of 185 million yen, unallocated to each reportable segment. "Adjustment" of segment income (loss) for the Nine months ended December 31, 2016 includes corporate expenses of -42,241 million yen and noncurrent assets related adjustment of 365 million yen, unallocated to each reportable segment. The corporate expenses, unallocated to each reportable segment, are mainly general and administrative expenses incurred at headquarters of NEC, and research and development expenses.
- 17 -

Information about reportable segment sales, segment income or loss (Three months ended December 31, 2015)
(Millions of yen)
Reportable Segments
Others Adjustments Consolidated
Total Public Enterprise Telecom Carrier
System Platform
Total
Revenue
Revenue from customers
163,735 71,737 159,377 171,044 565,893 78,960 - 644,853
Intersegment revenue and transfers
9,413 1,633 5,713 16,514 33,273 4,506 -37,779 -
Total 173,148 73,370 165,090 187,558 599,166 83,466 -37,779 644,853 Segment income(loss) (Operating profit (loss))
9,979 4,287 8,472 2,487 25,225 -5,450 -11,113 8,662
Financial income 6,664 Financial costs 3,526 Share of profit (loss) of entities accounted for using the equity method
1,682
Income (loss) before income taxes
13,482
(Three months ended December 31, 2016)
(Millions of yen)
Reportable Segments
Others Adjustments Consolidated
Total Public Enterprise Telecom Carrier
System Platform
Total
Revenue
Revenue from customers
153,527 70,049 141,273 164,274 529,123 64,284 ー 593,407
Intersegment revenue and transfers
8,790 2,690 4,255 13,993 29,728 8,045 -37,773 -
Total 162,317 72,739 145,528 178,267 558,851 72,329 -37,773 593,407 Segment income(loss) (Operating profit (loss))
1,060 3,729 -1,345 -173 3,271 -6,685 -17,365 -20,779
Financial income 7,108 Financial costs 1,622 Share of profit (loss) of entities accounted for using the equity method
1,065
Income (loss) before income taxes
-14,228
Notes: 1. "Others" for the three months ended December 31, 2015 represents businesses such as Smart Energy (Electrodes/Energy Storage System, Solutions for Utilities, etc.) and Mobile Phones. "Others" for the three months ended December 31, 2016 represents businesses such as Electrodes/Energy Storage System. 2. "Adjustment" of segment income (loss) for the three months ended December 31, 2015 includes corporate expenses of -8,973 million yen and noncurrent assets related adjustment of -123 million yen, unallocated to each reportable segment. "Adjustment" of segment income (loss) for the three months ended December 31, 2016 includes corporate expenses of -14,694 million yen and noncurrent assets related adjustment of 90 million yen, unallocated to each reportable segment. The corporate expenses, unallocated to each reportable segment, are mainly general and administrative expenses incurred at headquarters of NEC, and research and development expenses.
- 18 -
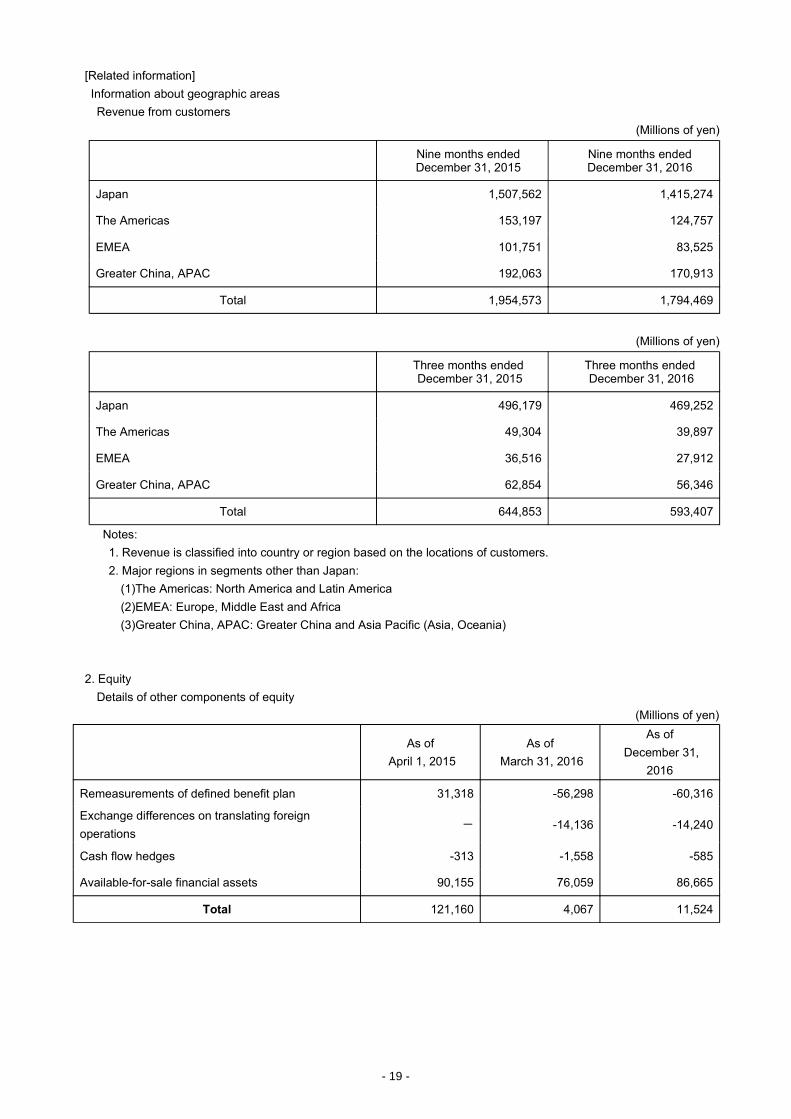
[Related information] Information about geographic areas Revenue from customers
(Millions of yen)
Nine months ended December 31, 2015
Nine months ended December 31, 2016
Japan 1,507,562 1,415,274
The Americas 153,197 124,757
EMEA 101,751 83,525
Greater China, APAC 192,063 170,913
Total 1,954,573 1,794,469
(Millions of yen)
Three months ended December 31, 2015
Three months ended December 31, 2016
Japan 496,179 469,252
The Americas 49,304 39,897
EMEA 36,516 27,912
Greater China, APAC 62,854 56,346
Total 644,853 593,407
Notes: 1. Revenue is classified into country or region based on the locations of customers. 2. Major regions in segments other than Japan:
(1)The Americas: North America and Latin America (2)EMEA: Europe, Middle East and Africa (3)Greater China, APAC: Greater China and Asia Pacific (Asia, Oceania)
2. Equity Details of other components of equity
(Millions of yen)
As of
April 1, 2015 As of
March 31, 2016
As of December 31,
2016
Remeasurements of defined benefit plan 31,318 -56,298 -60,316
Exchange differences on translating foreign operations
- -14,136 -14,240
Cash flow hedges -313 -1,558 -585
Available-for-sale financial assets 90,155 76,059 86,665
Total 121,160 4,067 11,524
- 19 -
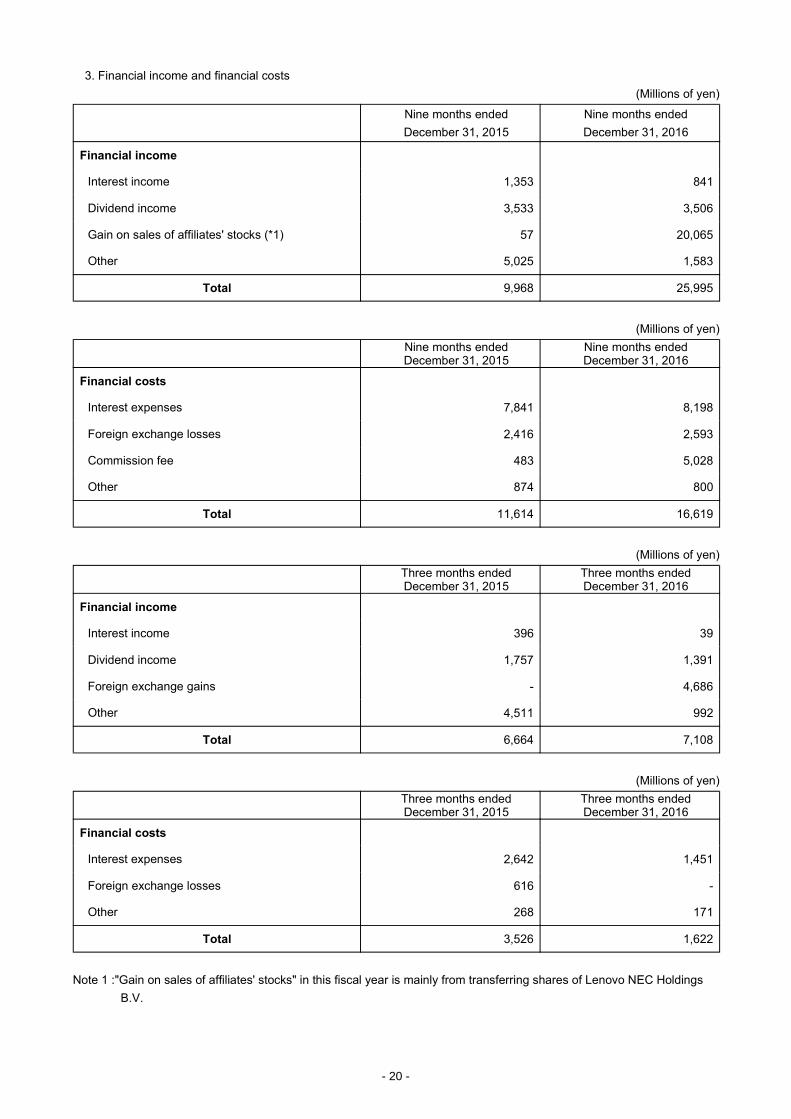
3. Financial income and financial costs (Millions of yen)
Nine months ended December 31, 2015
Nine months ended December 31, 2016
Financial income
Interest income 1,353 841
Dividend income 3,533 3,506
Gain on sales of affiliates' stocks (*1) 57 20,065
Other 5,025 1,583
Total 9,968 25,995
(Millions of yen)
Nine months ended December 31, 2015
Nine months ended December 31, 2016
Financial costs
Interest expenses 7,841 8,198
Foreign exchange losses 2,416 2,593
Commission fee 483 5,028
Other 874 800
Total 11,614 16,619
(Millions of yen)
Three months ended December 31, 2015
Three months ended December 31, 2016
Financial income
Interest income 396 39
Dividend income 1,757 1,391
Foreign exchange gains - 4,686
Other 4,511 992
Total 6,664 7,108
(Millions of yen)
Three months ended December 31, 2015
Three months ended December 31, 2016
Financial costs
Interest expenses 2,642 1,451
Foreign exchange losses 616 -
Other 268 171
Total 3,526 1,622
Note 1 :"Gain on sales of affiliates' stocks" in this fiscal year is mainly from transferring shares of Lenovo NEC Holdings B.V.
- 20 -
4.Subsequent Events
NEC commenced, pursuant to the resolution of its board of directors held on November 28, 2016, the tender offer (hereinafter the “Tender Offer”) targeting the shares of common stock of Japan Aviation Electronics Industry, Limited (hereinafter “JAE”), with the aim of making JAE a consolidated subsidiary of NEC, from November 29, 2016. The Tender Offer was completed on January 17, 2017, and NEC has acquired 10,000,000 common stock of JAE with a cash consideration of 19,200 million Japanese yen. As a result of the Tender Offer, the percentage of NEC’s voting rights to JAE has increased to 51.17% and JAE has become a consolidated subsidiary of NEC. At the timing of disclosure of this earnings release, initial accounting treatments for this business combination on the acquisition date including the fair value calculation of the acquired assets and the assumed liabilities have not been completed yet, therefore the information relating to accounting treatments of this business combination has not been disclosed.
Overview of Consolidation (1) Profile of JAE (i) Name: Japan Aviation Electronics Industry, Limited (ii) Type of Business: (a) Manufacturing and marketing of connectors, user interface solution devices and
electronics and electronic components for aviation and aerospace, and (b) purchase and sale of devices, components, etc., in connection therewith
(iii) Capital Amount 10,690 million Japanese yen
(2) Summary of the Tender Offer (i) Tender Offer Period: From November 29, 2016 thorough January 17, 2017 (ii) Tender Offer Price: 1,920 Japanese yen per share of common stock (iii) Acquired Number of Shares: 10,000,000 (shares) (iv) Total Purchase price: 19,200 million Japanese yen
(3) Purpose of Consolidation To strengthen the business foundation of NEC and JAE by assembling the management resources of both companies.
(4) Acquisition date January 23. 2017 (Settlement date)
(5) Acquired Voting Rights Before the Tender Offer: 40.12 %
Acquired by the Tender Offer: 11.05 %
After the Tender Offer: 51.17 %
- 21 -
5. First-time Adoption The NEC Group prepared the first condensed interim consolidated financial statements in accordance with IFRS from the fiscal year ending March 31, 2017. The NEC Group’s latest financial statements prepared in accordance with the Generally Accepted Accounting Principles in Japan (“Japanese accounting standards” or "Japanese GAAP") are those for the year ended March 31, 2016. The date of transition to IFRS is April 1, 2015.
(1) IFRS 1 Exemption from Retrospective Application IFRS 1 “First-time Adoption of International Financial Reporting Standards” (“IFRS 1”), requires that companies adopting IFRS for the first time apply IFRS retrospectively. However, companies may elect to use one or more of the exemptions contained in the standard, and the NEC Group has adopted the following exceptions.
・Business combinations Under IFRS 1, the first-time adopters may elect not to apply IFRS 3 “Business Combinations” retrospectively to business combinations that occurred before the date of transition to IFRS. The NEC Group elected to apply IFRS 3 only to business combinations that occurred after the date of transition to IFRS and not to those that occurred prior to the date of transition. Goodwill recognized at the date of transition to IFRS have been tested for impairment at the date of transition regardless of whether there is any indications that the goodwill may be impaired.
・Cumulative exchange differences on translating foreign operations Under IFRS 1, the first-time adopters may elect to deem the cumulative translation differences for all foreign operations as of the date of transition to IFRS to be zero. The NEC Group has reclassified the cumulative translation differences at the date of transition to IFRS from other components of equity to retained earnings.
(2) IFRS 1 Exceptions to Retrospective Application IFRS1 prohibits retrospective application of some items such as “accounting estimates” and “non-controlling interests”. The NEC Group applies these items prospectively from the date of transition to IFRS.
(3) Reconciliation from Japanese Accounting Standards to IFRS Charts of reconciliations which needs to be disclosed upon the first adoption of IFRS are as follows: In the charts of reconciliations, equity reconciliation as of December 31,2015 (prior quarter-end), items which do not have impact on retained earnings nor comprehensive income are included in “Presentation Reclassification”, whereas items which have impact on retained earnings or comprehensive income are included in “Recognition and Measurement Differences”. Charts of reconciliations for the transition date (April 1, 2015) , the previous fiscal year end (March 31, 2016) and the previous fiscal year (from April 1, 2015 to March 31, 2016) have been disclosed in the "Consolidated Financial Results for the First Quarter of the Fiscal Year Ending March 31, 2017" published on July 29, 2016.
- 22 -
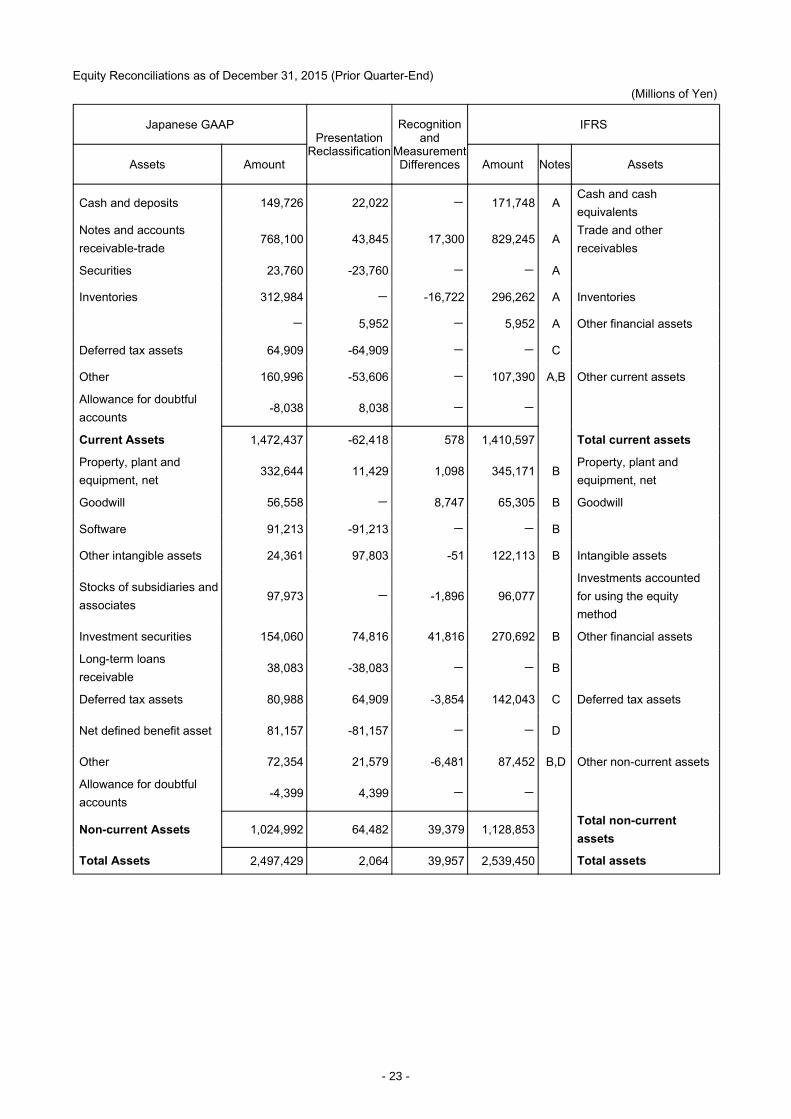
Equity Reconciliations as of December 31, 2015 (Prior Quarter-End) (Millions of Yen)
Japanese GAAP Presentation
Reclassification
Recognition and
Measurement Differences
IFRS
Assets Amount Amount Notes Assets
Cash and deposits 149,726 22,022 - 171,748 A Cash and cash equivalents
Notes and accounts receivable-trade
768,100 43,845 17,300 829,245 A Trade and other receivables
Securities 23,760 -23,760 - - A
Inventories 312,984 - -16,722 296,262 A Inventories
- 5,952 - 5,952 A Other financial assets
Deferred tax assets 64,909 -64,909 - - C
Other 160,996 -53,606 - 107,390 A,B Other current assets
Allowance for doubtful accounts
-8,038 8,038 - -
Current Assets 1,472,437 -62,418 578 1,410,597 Total current assets
Property, plant and equipment, net
332,644 11,429 1,098 345,171 B Property, plant and equipment, net
Goodwill 56,558 - 8,747 65,305 B Goodwill
Software 91,213 -91,213 - - B
Other intangible assets 24,361 97,803 -51 122,113 B Intangible assets
Stocks of subsidiaries and associates
97,973 - -1,896 96,077
Investments accounted for using the equity method
Investment securities 154,060 74,816 41,816 270,692 B Other financial assets
Long-term loans receivable
38,083 -38,083 - - B
Deferred tax assets 80,988 64,909 -3,854 142,043 C Deferred tax assets
Net defined benefit asset 81,157 -81,157 - - D
Other 72,354 21,579 -6,481 87,452 B,D Other non-current assets
Allowance for doubtful accounts
-4,399 4,399 - -
Non-current Assets 1,024,992 64,482 39,379 1,128,853 Total non-current assets
Total Assets 2,497,429 2,064 39,957 2,539,450 Total assets
- 23 -
(Millions of Yen)
Japanese GAAP Presentation
Reclassification
Recognition and
Measurement Differences
IFRS
Liabilities and equity Amount Amount Notes Liabilities and equity
Notes and accounts payable-trade
383,293 74,708 -121 457,880 E Trade and other payables
Short-term loans payable 65,156 106,834 -5 171,985 E Bonds and borrowings
Current portion of long-term loans and current portion of bonds payable
106,834 -106,834 - - E
Accrued expenses 124,766 -2,529 1,731 123,968 Accruals
Advances received 125,444 -125,444 - - E
- 12,336 648 12,984 E Other financial liabilities
- 7,344 -52 7,292 E Accrued income taxes
Provisions 33,898 2,694 143 36,735 Provisions
Other 112,258 31,632 100 143,990 E Other current liabilities
Current liabilities 951,649 741 2,444 954,834 Total current liabilities
Bonds and long-term loans payable
397,058 - -1,617 395,441 Bonds and borrowings
- 8,988 - 8,988 F Other financial liabilities
Deferred tax liabilities 2,376 -2,376 - -
Net defined benefit liability
229,308 - 22,816 252,124 D Defined benefit liability
Provisions 17,332 2,805 -4,975 15,162 F Provisions
Other 32,022 -8,094 8,594 32,522 F Other non-current liabilities
Non-current liabilities 678,096 1,323 24,818 704,237 Total non-current liabilities
Total liabilities 1,629,745 2,064 27,262 1,659,071 Total liabilities
Capital stock 397,199 - - 397,199 Share capital
Capital surplus 149,035 - -1,279 147,756 Share premium
Retained earnings 196,997 - -35,620 161,377 G Retained earnings
Treasury stock -3,072 - - -3,072 Treasury shares
Accumulated other comprehensive income
67,050 - 43,179 110,229 G Other components of equity
- - 6,280 813,489 Total equity attributable to owners of the parent
Non-controlling interests 60,475 - 6,415 66,890 G Non-controlling interests
Total net assets 867,684 - 12,695 880,379 Total equity
Total liabilities and net assets
2,497,429 2,064 39,957 2,539,450 Total liabilities and equity
- 24 -
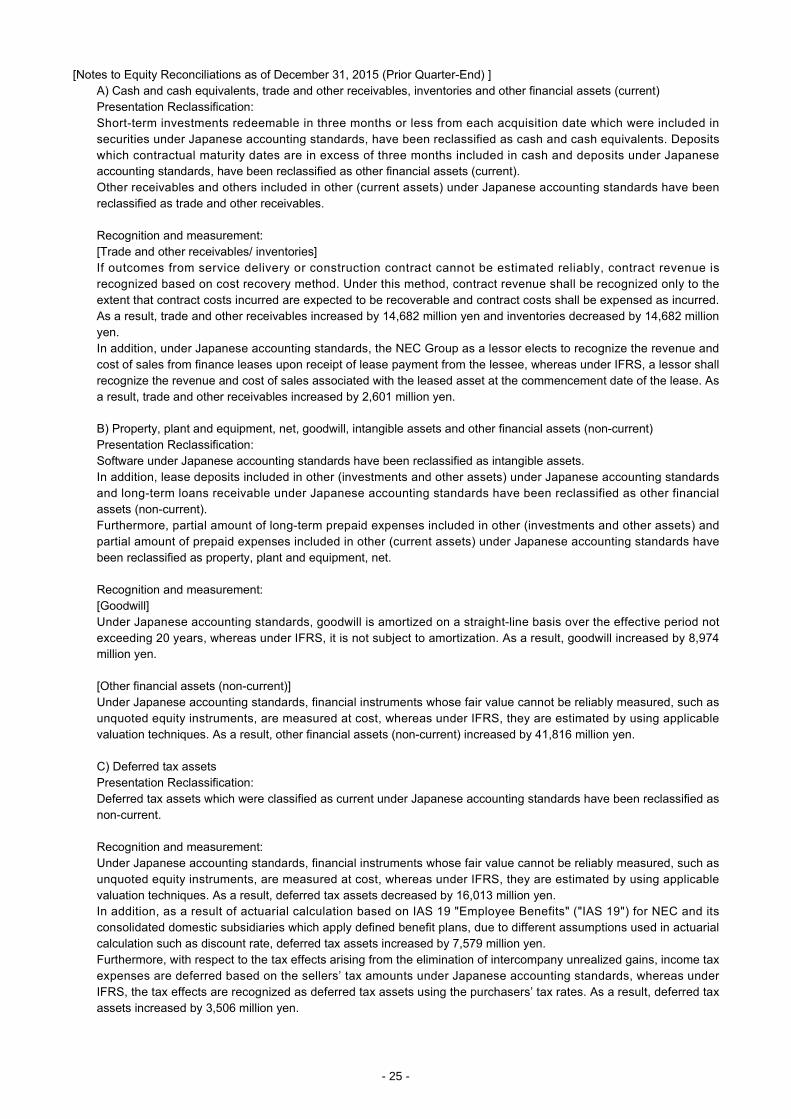
[Notes to Equity Reconciliations as of December 31, 2015 (Prior Quarter-End) ] A) Cash and cash equivalents, trade and other receivables, inventories and other financial assets (current) Presentation Reclassification: Short-term investments redeemable in three months or less from each acquisition date which were included in securities under Japanese accounting standards, have been reclassified as cash and cash equivalents. Deposits which contractual maturity dates are in excess of three months included in cash and deposits under Japanese accounting standards, have been reclassified as other financial assets (current). Other receivables and others included in other (current assets) under Japanese accounting standards have been reclassified as trade and other receivables.
Recognition and measurement: [Trade and other receivables/ inventories] If outcomes from service delivery or construction contract cannot be estimated reliably, contract revenue is recognized based on cost recovery method. Under this method, contract revenue shall be recognized only to the extent that contract costs incurred are expected to be recoverable and contract costs shall be expensed as incurred. As a result, trade and other receivables increased by 14,682 million yen and inventories decreased by 14,682 million yen. In addition, under Japanese accounting standards, the NEC Group as a lessor elects to recognize the revenue and cost of sales from finance leases upon receipt of lease payment from the lessee, whereas under IFRS, a lessor shall recognize the revenue and cost of sales associated with the leased asset at the commencement date of the lease. As a result, trade and other receivables increased by 2,601 million yen.
B) Property, plant and equipment, net, goodwill, intangible assets and other financial assets (non-current) Presentation Reclassification: Software under Japanese accounting standards have been reclassified as intangible assets. In addition, lease deposits included in other (investments and other assets) under Japanese accounting standards and long-term loans receivable under Japanese accounting standards have been reclassified as other financial assets (non-current). Furthermore, partial amount of long-term prepaid expenses included in other (investments and other assets) and partial amount of prepaid expenses included in other (current assets) under Japanese accounting standards have been reclassified as property, plant and equipment, net.
Recognition and measurement: [Goodwill] Under Japanese accounting standards, goodwill is amortized on a straight-line basis over the effective period not exceeding 20 years, whereas under IFRS, it is not subject to amortization. As a result, goodwill increased by 8,974 million yen.
[Other financial assets (non-current)] Under Japanese accounting standards, financial instruments whose fair value cannot be reliably measured, such as unquoted equity instruments, are measured at cost, whereas under IFRS, they are estimated by using applicable valuation techniques. As a result, other financial assets (non-current) increased by 41,816 million yen.
C) Deferred tax assets Presentation Reclassification: Deferred tax assets which were classified as current under Japanese accounting standards have been reclassified as non-current.
Recognition and measurement: Under Japanese accounting standards, financial instruments whose fair value cannot be reliably measured, such as unquoted equity instruments, are measured at cost, whereas under IFRS, they are estimated by using applicable valuation techniques. As a result, deferred tax assets decreased by 16,013 million yen. In addition, as a result of actuarial calculation based on IAS 19 "Employee Benefits" ("IAS 19") for NEC and its consolidated domestic subsidiaries which apply defined benefit plans, due to different assumptions used in actuarial calculation such as discount rate, deferred tax assets increased by 7,579 million yen. Furthermore, with respect to the tax effects arising from the elimination of intercompany unrealized gains, income tax expenses are deferred based on the sellers’ tax amounts under Japanese accounting standards, whereas under IFRS, the tax effects are recognized as deferred tax assets using the purchasers’ tax rates. As a result, deferred tax assets increased by 3,506 million yen.
- 25 -
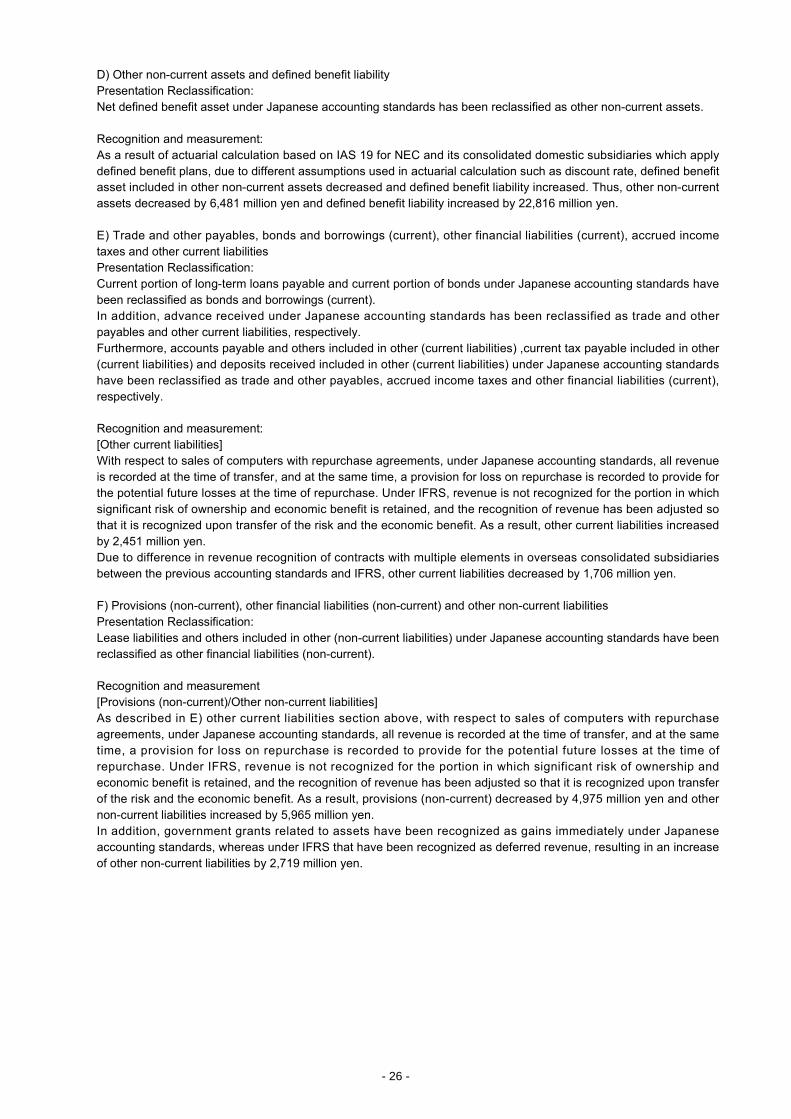
D) Other non-current assets and defined benefit liability Presentation Reclassification: Net defined benefit asset under Japanese accounting standards has been reclassified as other non-current assets.
Recognition and measurement: As a result of actuarial calculation based on IAS 19 for NEC and its consolidated domestic subsidiaries which apply defined benefit plans, due to different assumptions used in actuarial calculation such as discount rate, defined benefit asset included in other non-current assets decreased and defined benefit liability increased. Thus, other non-current assets decreased by 6,481 million yen and defined benefit liability increased by 22,816 million yen.
E) Trade and other payables, bonds and borrowings (current), other financial liabilities (current), accrued income taxes and other current liabilities Presentation Reclassification: Current portion of long-term loans payable and current portion of bonds under Japanese accounting standards have been reclassified as bonds and borrowings (current). In addition, advance received under Japanese accounting standards has been reclassified as trade and other payables and other current liabilities, respectively. Furthermore, accounts payable and others included in other (current liabilities) ,current tax payable included in other (current liabilities) and deposits received included in other (current liabilities) under Japanese accounting standards have been reclassified as trade and other payables, accrued income taxes and other financial liabilities (current), respectively.
Recognition and measurement: [Other current liabilities] With respect to sales of computers with repurchase agreements, under Japanese accounting standards, all revenue is recorded at the time of transfer, and at the same time, a provision for loss on repurchase is recorded to provide for the potential future losses at the time of repurchase. Under IFRS, revenue is not recognized for the portion in which significant risk of ownership and economic benefit is retained, and the recognition of revenue has been adjusted so that it is recognized upon transfer of the risk and the economic benefit. As a result, other current liabilities increased by 2,451 million yen. Due to difference in revenue recognition of contracts with multiple elements in overseas consolidated subsidiaries between the previous accounting standards and IFRS, other current liabilities decreased by 1,706 million yen.
F) Provisions (non-current), other financial liabilities (non-current) and other non-current liabilities Presentation Reclassification: Lease liabilities and others included in other (non-current liabilities) under Japanese accounting standards have been reclassified as other financial liabilities (non-current).
Recognition and measurement [Provisions (non-current)/Other non-current liabilities] As described in E) other current liabilities section above, with respect to sales of computers with repurchase agreements, under Japanese accounting standards, all revenue is recorded at the time of transfer, and at the same time, a provision for loss on repurchase is recorded to provide for the potential future losses at the time of repurchase. Under IFRS, revenue is not recognized for the portion in which significant risk of ownership and economic benefit is retained, and the recognition of revenue has been adjusted so that it is recognized upon transfer of the risk and the economic benefit. As a result, provisions (non-current) decreased by 4,975 million yen and other non-current liabilities increased by 5,965 million yen. In addition, government grants related to assets have been recognized as gains immediately under Japanese accounting standards, whereas under IFRS that have been recognized as deferred revenue, resulting in an increase of other non-current liabilities by 2,719 million yen.
- 26 -
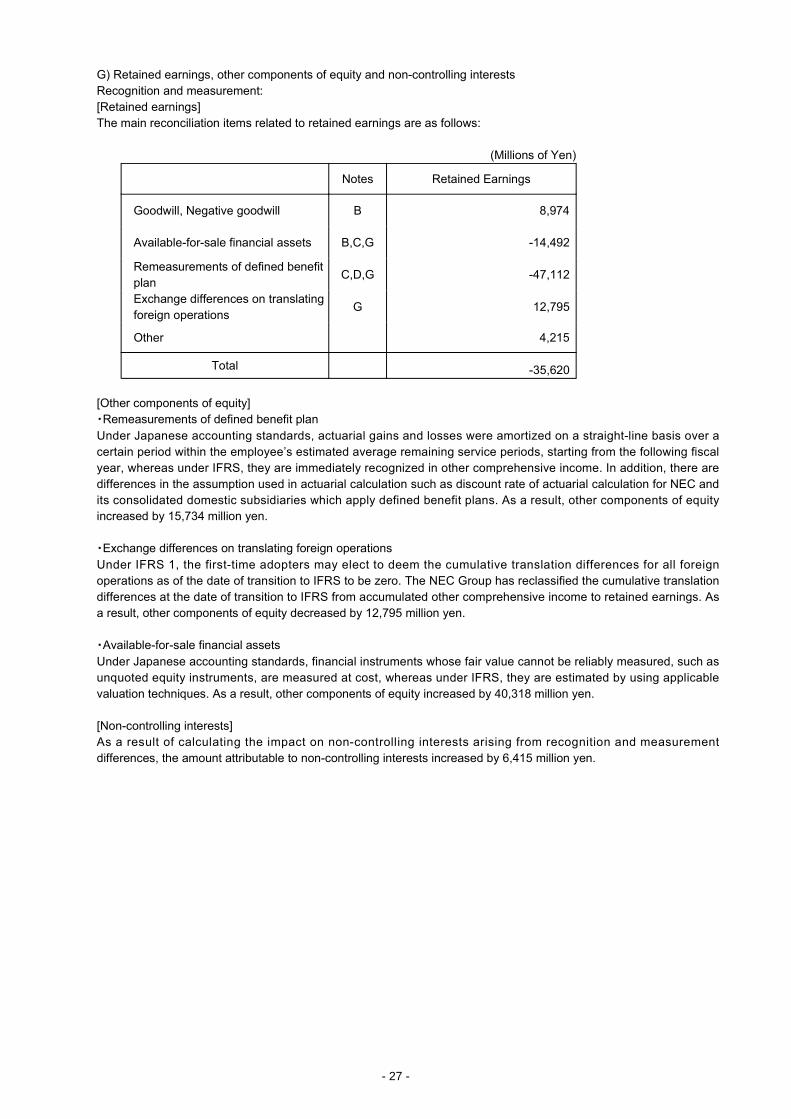
G) Retained earnings, other components of equity and non-controlling interests Recognition and measurement: [Retained earnings] The main reconciliation items related to retained earnings are as follows:
(Millions of Yen)
Notes Retained Earnings
Goodwill, Negative goodwill B 8,974
Available-for-sale financial assets B,C,G -14,492
Remeasurements of defined benefit plan
C,D,G -47,112
Exchange differences on translating foreign operations
G 12,795
Other 4,215
Total -35,620
[Other components of equity] ・Remeasurements of defined benefit plan Under Japanese accounting standards, actuarial gains and losses were amortized on a straight-line basis over a certain period within the employee’s estimated average remaining service periods, starting from the following fiscal year, whereas under IFRS, they are immediately recognized in other comprehensive income. In addition, there are differences in the assumption used in actuarial calculation such as discount rate of actuarial calculation for NEC and its consolidated domestic subsidiaries which apply defined benefit plans. As a result, other components of equity increased by 15,734 million yen.
・Exchange differences on translating foreign operations Under IFRS 1, the first-time adopters may elect to deem the cumulative translation differences for all foreign operations as of the date of transition to IFRS to be zero. The NEC Group has reclassified the cumulative translation differences at the date of transition to IFRS from accumulated other comprehensive income to retained earnings. As a result, other components of equity decreased by 12,795 million yen.
・Available-for-sale financial assets Under Japanese accounting standards, financial instruments whose fair value cannot be reliably measured, such as unquoted equity instruments, are measured at cost, whereas under IFRS, they are estimated by using applicable valuation techniques. As a result, other components of equity increased by 40,318 million yen.
[Non-controlling interests] As a result of calculating the impact on non-controlling interests arising from recognition and measurement differences, the amount attributable to non-controlling interests increased by 6,415 million yen.
- 27 -
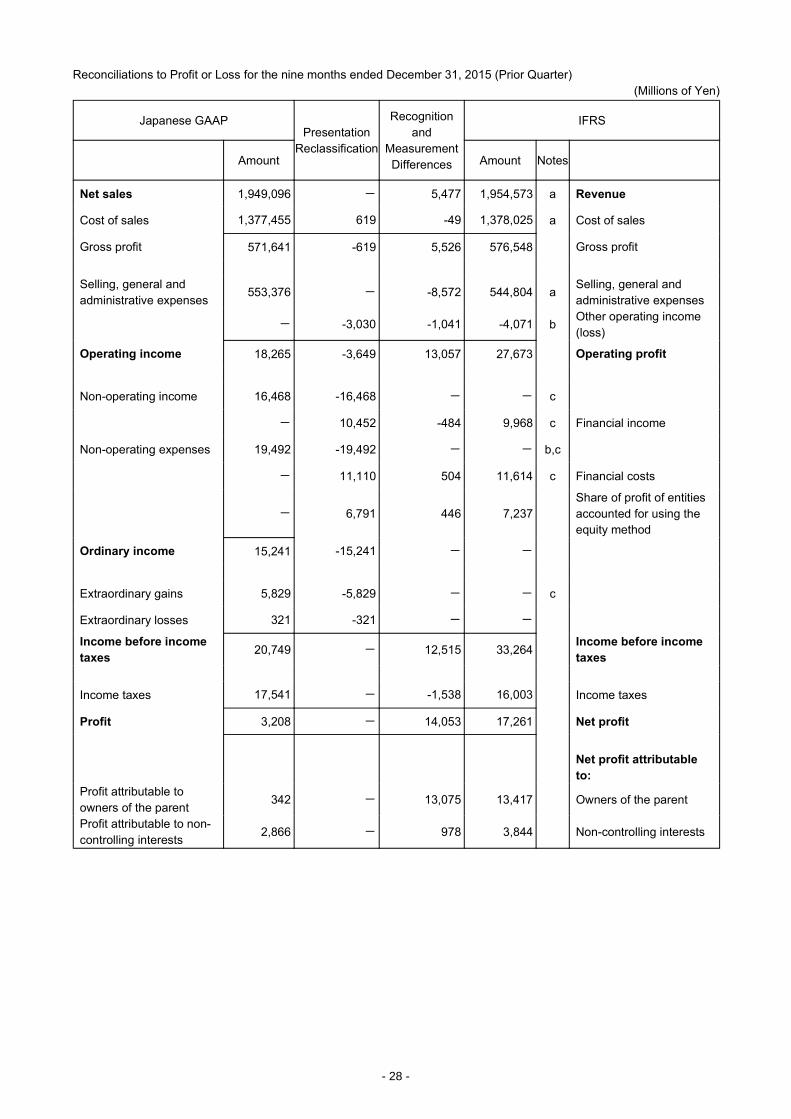
Reconciliations to Profit or Loss for the nine months ended December 31, 2015 (Prior Quarter) (Millions of Yen)
Japanese GAAP Presentation
Reclassification
Recognition and
Measurement Differences
IFRS
Amount Amount Notes
Net sales 1,949,096 - 5,477 1,954,573 a Revenue
Cost of sales 1,377,455 619 -49 1,378,025 a Cost of sales
Gross profit 571,641 -619 5,526 576,548 Gross profit
Selling, general and administrative expenses
553,376 - -8,572 544,804 a Selling, general and administrative expenses
- -3,030 -1,041 -4,071 b Other operating income (loss)
Operating income 18,265 -3,649 13,057 27,673 Operating profit
Non-operating income 16,468 -16,468 - - c
- 10,452 -484 9,968 c Financial income
Non-operating expenses 19,492 -19,492 - - b,c
- 11,110 504 11,614 c Financial costs
- 6,791 446 7,237
Share of profit of entities accounted for using the equity method
Ordinary income 15,241 -15,241 - -
Extraordinary gains 5,829 -5,829 - - c
Extraordinary losses 321 -321 - -
Income before income taxes 20,749 - 12,515 33,264
Income before income taxes
Income taxes 17,541 - -1,538 16,003 Income taxes
Profit 3,208 - 14,053 17,261 Net profit
Net profit attributable to:
Profit attributable to owners of the parent
342 - 13,075 13,417 Owners of the parent
Profit attributable to non-controlling interests
2,866 - 978 3,844 Non-controlling interests
- 28 -
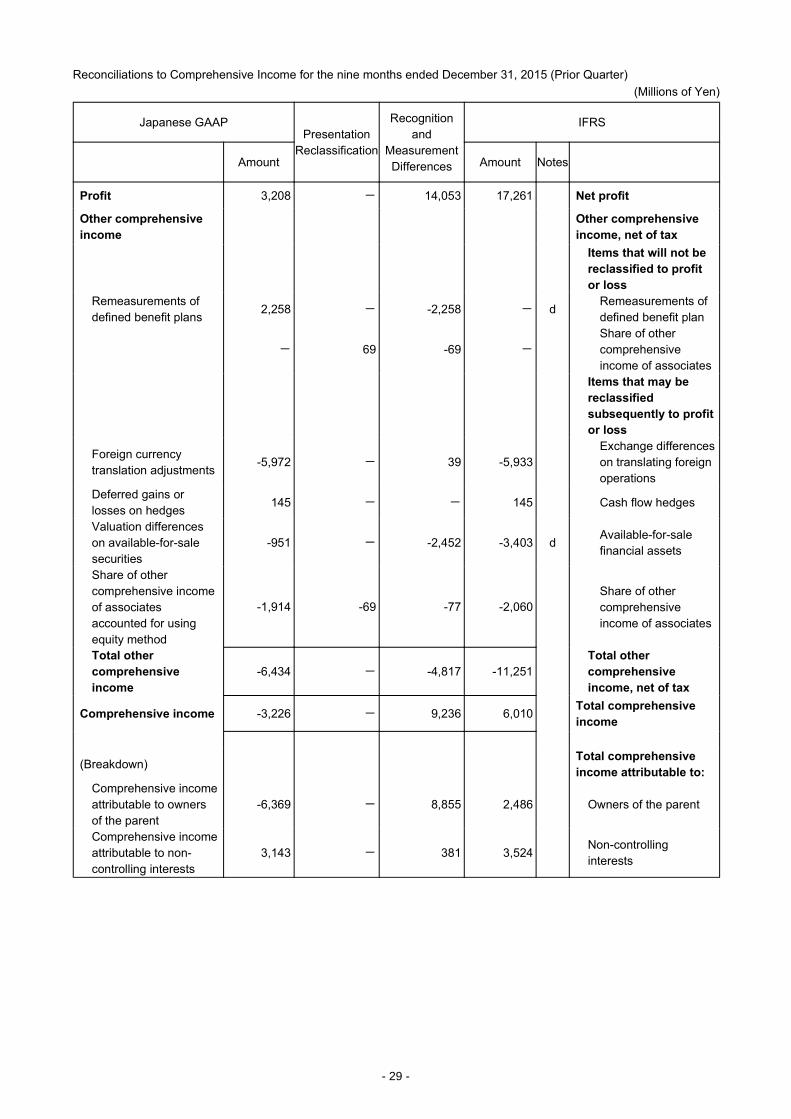
Reconciliations to Comprehensive Income for the nine months ended December 31, 2015 (Prior Quarter) (Millions of Yen)
Japanese GAAP Presentation
Reclassification
Recognition and
Measurement Differences
IFRS
Amount Amount Notes
Profit 3,208 - 14,053 17,261 Net profit
Other comprehensive income
Other comprehensive income, net of tax
Items that will not be reclassified to profit or loss
Remeasurements of defined benefit plans
2,258 - -2,258 - d Remeasurements of defined benefit plan
- 69 -69 -
Share of other comprehensive income of associates
Items that may be reclassified subsequently to profit or loss
Foreign currency translation adjustments
-5,972 - 39 -5,933
Exchange differences on translating foreign operations
Deferred gains or losses on hedges
145 - - 145 Cash flow hedges
Valuation differences on available-for-sale securities
-951 - -2,452 -3,403 d Available-for-sale financial assets
Share of other comprehensive income of associates accounted for using equity method
-1,914 -69 -77 -2,060
Share of other comprehensive income of associates
Total other comprehensive income
-6,434 - -4,817 -11,251
Total other comprehensive income, net of tax
Comprehensive income -3,226 - 9,236 6,010 Total comprehensive income
(Breakdown) Total comprehensive income attributable to:
Comprehensive income attributable to owners of the parent
-6,369 - 8,855 2,486 Owners of the parent
Comprehensive income attributable to non-controlling interests
3,143 - 381 3,524 Non-controlling interests
- 29 -
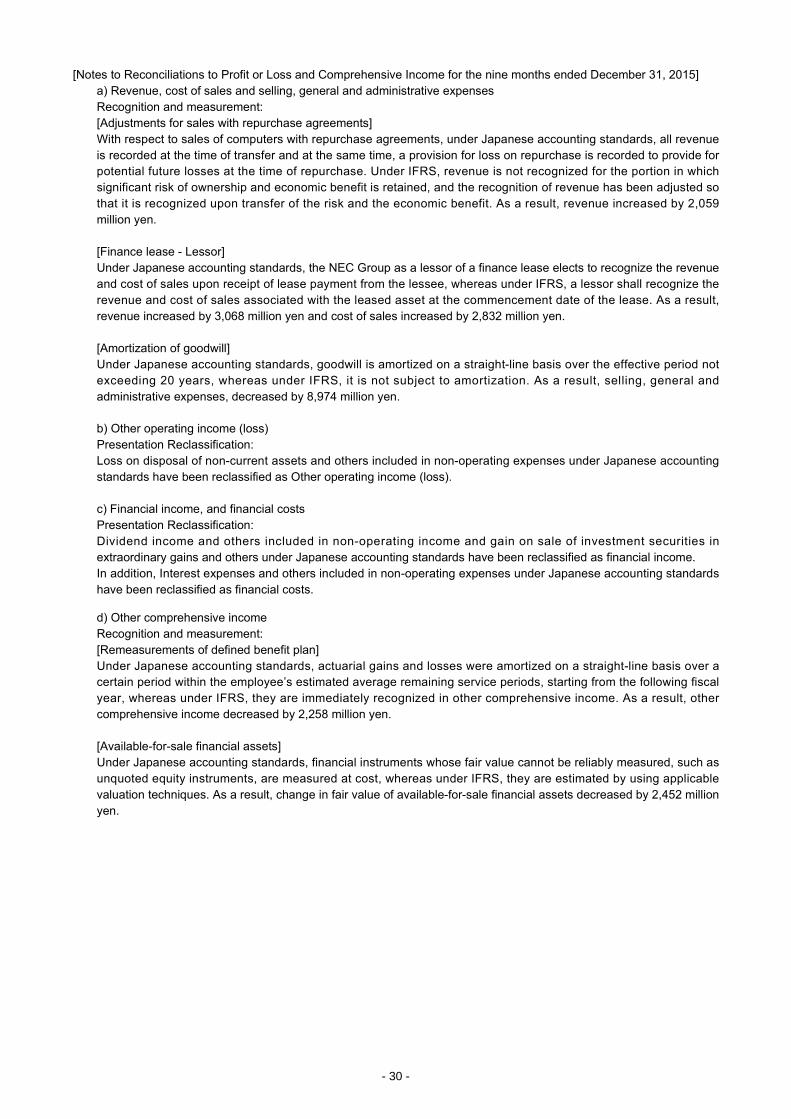
[Notes to Reconciliations to Profit or Loss and Comprehensive Income for the nine months ended December 31, 2015] a) Revenue, cost of sales and selling, general and administrative expenses Recognition and measurement: [Adjustments for sales with repurchase agreements] With respect to sales of computers with repurchase agreements, under Japanese accounting standards, all revenue is recorded at the time of transfer and at the same time, a provision for loss on repurchase is recorded to provide for potential future losses at the time of repurchase. Under IFRS, revenue is not recognized for the portion in which significant risk of ownership and economic benefit is retained, and the recognition of revenue has been adjusted so that it is recognized upon transfer of the risk and the economic benefit. As a result, revenue increased by 2,059 million yen.
[Finance lease - Lessor] Under Japanese accounting standards, the NEC Group as a lessor of a finance lease elects to recognize the revenue and cost of sales upon receipt of lease payment from the lessee, whereas under IFRS, a lessor shall recognize the revenue and cost of sales associated with the leased asset at the commencement date of the lease. As a result, revenue increased by 3,068 million yen and cost of sales increased by 2,832 million yen.
[Amortization of goodwill] Under Japanese accounting standards, goodwill is amortized on a straight-line basis over the effective period not exceeding 20 years, whereas under IFRS, it is not subject to amortization. As a result, selling, general and administrative expenses, decreased by 8,974 million yen.
b) Other operating income (loss) Presentation Reclassification: Loss on disposal of non-current assets and others included in non-operating expenses under Japanese accounting standards have been reclassified as Other operating income (loss).
c) Financial income, and financial costs Presentation Reclassification: Dividend income and others included in non-operating income and gain on sale of investment securities in extraordinary gains and others under Japanese accounting standards have been reclassified as financial income. In addition, Interest expenses and others included in non-operating expenses under Japanese accounting standards have been reclassified as financial costs.
d) Other comprehensive income Recognition and measurement: [Remeasurements of defined benefit plan] Under Japanese accounting standards, actuarial gains and losses were amortized on a straight-line basis over a certain period within the employee’s estimated average remaining service periods, starting from the following fiscal year, whereas under IFRS, they are immediately recognized in other comprehensive income. As a result, other comprehensive income decreased by 2,258 million yen.
[Available-for-sale financial assets] Under Japanese accounting standards, financial instruments whose fair value cannot be reliably measured, such as unquoted equity instruments, are measured at cost, whereas under IFRS, they are estimated by using applicable valuation techniques. As a result, change in fair value of available-for-sale financial assets decreased by 2,452 million yen.
- 30 -
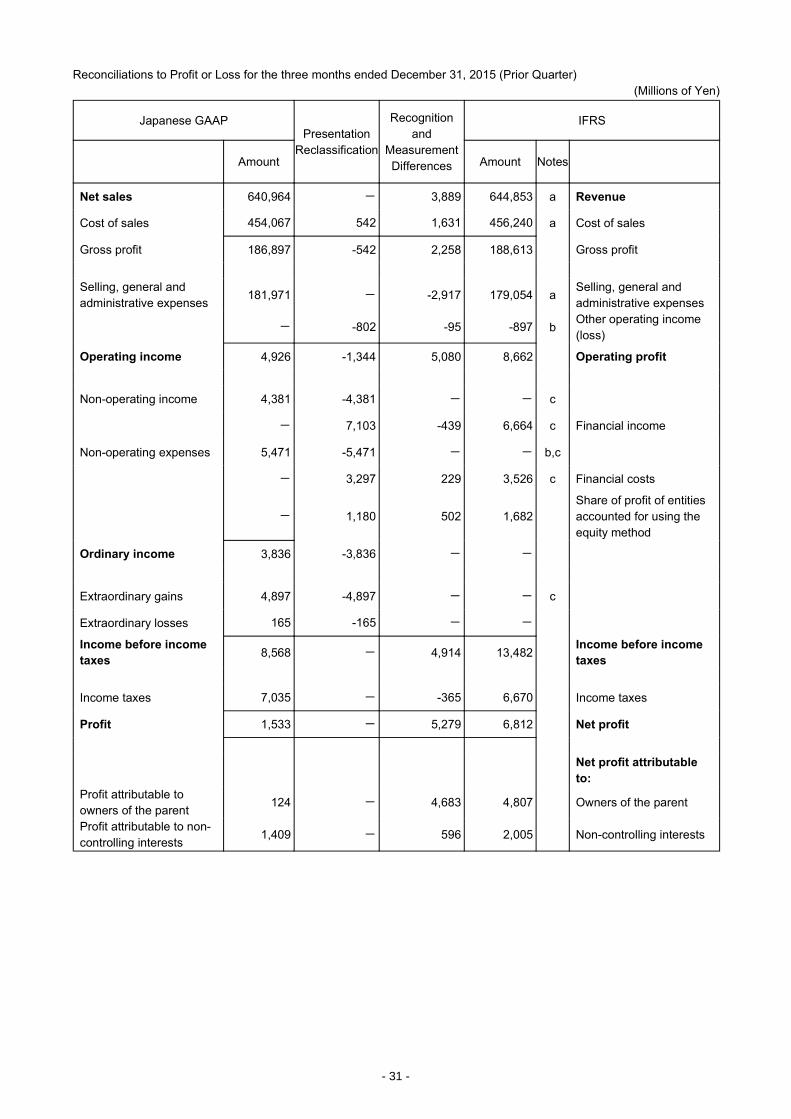
Reconciliations to Profit or Loss for the three months ended December 31, 2015 (Prior Quarter) (Millions of Yen)
Japanese GAAP Presentation
Reclassification
Recognition and
Measurement Differences
IFRS
Amount Amount Notes
Net sales 640,964 - 3,889 644,853 a Revenue
Cost of sales 454,067 542 1,631 456,240 a Cost of sales
Gross profit 186,897 -542 2,258 188,613 Gross profit
Selling, general and administrative expenses
181,971 - -2,917 179,054 a Selling, general and administrative expenses
- -802 -95 -897 b Other operating income (loss)
Operating income 4,926 -1,344 5,080 8,662 Operating profit
Non-operating income 4,381 -4,381 - - c
- 7,103 -439 6,664 c Financial income
Non-operating expenses 5,471 -5,471 - - b,c
- 3,297 229 3,526 c Financial costs
- 1,180 502 1,682
Share of profit of entities accounted for using the equity method
Ordinary income 3,836 -3,836 - -
Extraordinary gains 4,897 -4,897 - - c
Extraordinary losses 165 -165 - -
Income before income taxes 8,568 - 4,914 13,482
Income before income taxes
Income taxes 7,035 - -365 6,670 Income taxes
Profit 1,533 - 5,279 6,812 Net profit
Net profit attributable to:
Profit attributable to owners of the parent
124 - 4,683 4,807 Owners of the parent
Profit attributable to non-controlling interests
1,409 - 596 2,005 Non-controlling interests
- 31 -
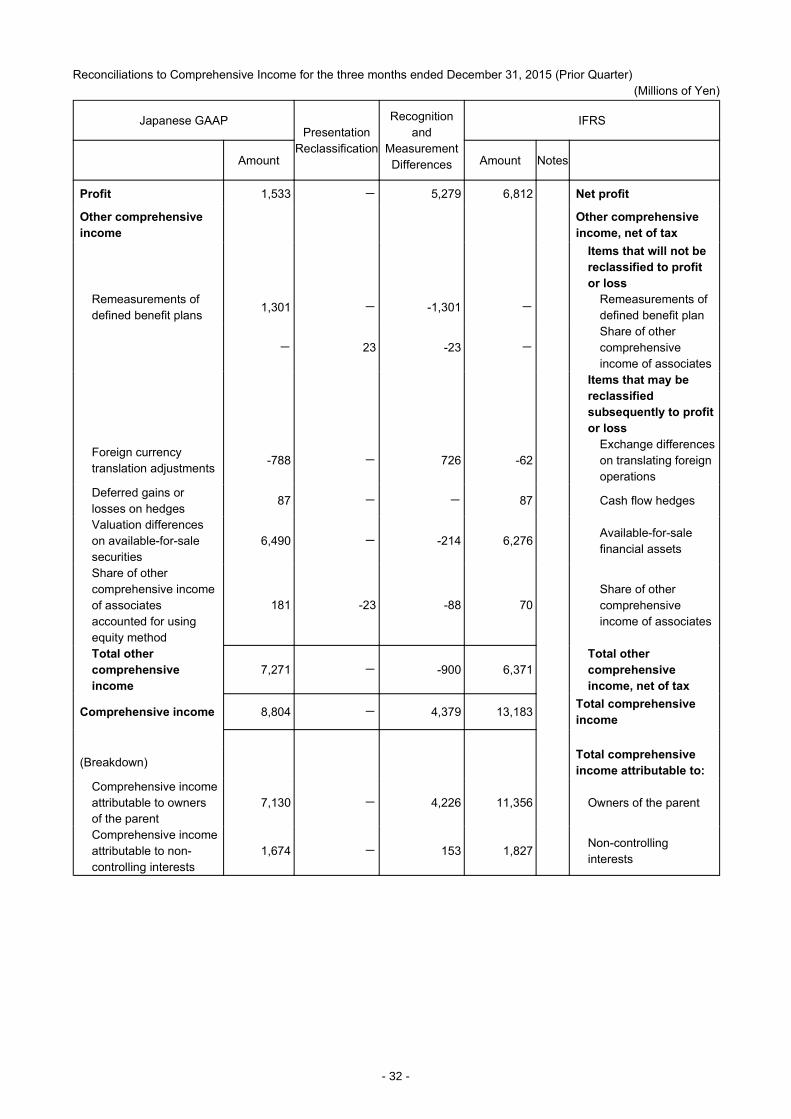
Reconciliations to Comprehensive Income for the three months ended December 31, 2015 (Prior Quarter) (Millions of Yen)
Japanese GAAP Presentation
Reclassification
Recognition and
Measurement Differences
IFRS
Amount Amount Notes
Profit 1,533 - 5,279 6,812 Net profit
Other comprehensive income
Other comprehensive income, net of tax
Items that will not be reclassified to profit or loss
Remeasurements of defined benefit plans
1,301 - -1,301 - Remeasurements of defined benefit plan
- 23 -23 -
Share of other comprehensive income of associates
Items that may be reclassified subsequently to profit or loss
Foreign currency translation adjustments
-788 - 726 -62
Exchange differences on translating foreign operations
Deferred gains or losses on hedges
87 - - 87 Cash flow hedges
Valuation differences on available-for-sale securities
6,490 - -214 6,276 Available-for-sale financial assets
Share of other comprehensive income of associates accounted for using equity method
181 -23 -88 70
Share of other comprehensive income of associates
Total other comprehensive income
7,271 - -900 6,371
Total other comprehensive income, net of tax
Comprehensive income 8,804 - 4,379 13,183 Total comprehensive income
(Breakdown) Total comprehensive income attributable to:
Comprehensive income attributable to owners of the parent
7,130 - 4,226 11,356 Owners of the parent
Comprehensive income attributable to non-controlling interests
1,674 - 153 1,827 Non-controlling interests
- 32 -
[Notes to Reconciliations to Profit or Loss and Comprehensive Income for the three months ended December 31, 2015 (Prior Quarter) ]
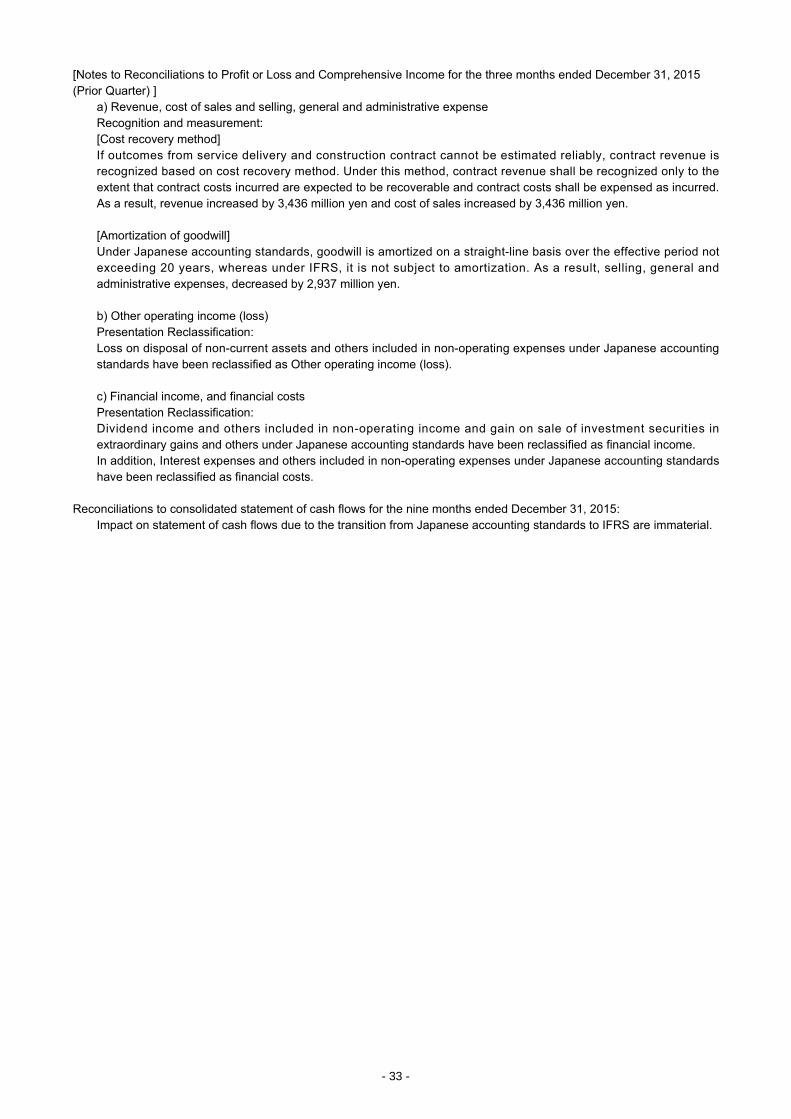
a) Revenue, cost of sales and selling, general and administrative expense Recognition and measurement: [Cost recovery method] If outcomes from service delivery and construction contract cannot be estimated reliably, contract revenue is recognized based on cost recovery method. Under this method, contract revenue shall be recognized only to the extent that contract costs incurred are expected to be recoverable and contract costs shall be expensed as incurred. As a result, revenue increased by 3,436 million yen and cost of sales increased by 3,436 million yen.
[Amortization of goodwill] Under Japanese accounting standards, goodwill is amortized on a straight-line basis over the effective period not exceeding 20 years, whereas under IFRS, it is not subject to amortization. As a result, selling, general and administrative expenses, decreased by 2,937 million yen.
b) Other operating income (loss) Presentation Reclassification: Loss on disposal of non-current assets and others included in non-operating expenses under Japanese accounting standards have been reclassified as Other operating income (loss).
c) Financial income, and financial costs Presentation Reclassification: Dividend income and others included in non-operating income and gain on sale of investment securities in extraordinary gains and others under Japanese accounting standards have been reclassified as financial income. In addition, Interest expenses and others included in non-operating expenses under Japanese accounting standards have been reclassified as financial costs.
Reconciliations to consolidated statement of cash flows for the nine months ended December 31, 2015: Impact on statement of cash flows due to the transition from Japanese accounting standards to IFRS are immaterial.
- 33 -
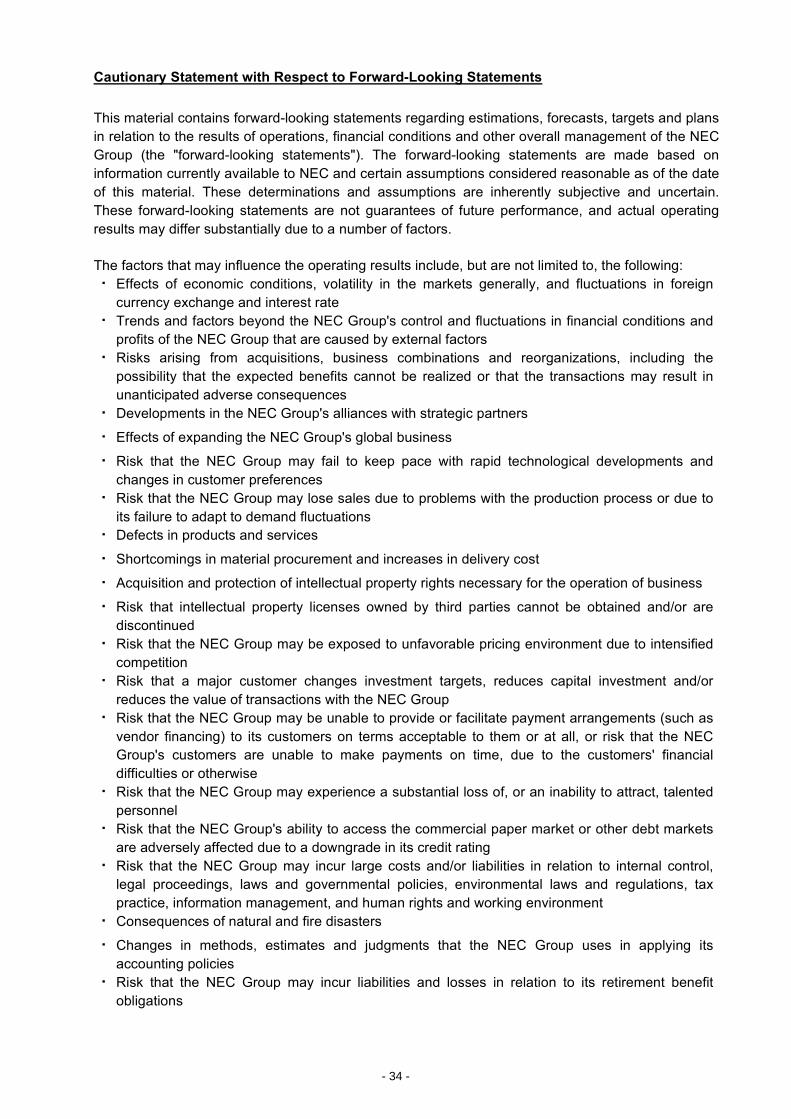
Cautionary Statement with Respect to Forward-Looking Statements
This material contains forward-looking statements regarding estimations, forecasts, targets and plans in relation to the results of operations, financial conditions and other overall management of the NEC Group (the "forward-looking statements"). The forward-looking statements are made based on information currently available to NEC and certain assumptions considered reasonable as of the date of this material. These determinations and assumptions are inherently subjective and uncertain. These forward-looking statements are not guarantees of future performance, and actual operating results may differ substantially due to a number of factors.
The factors that may influence the operating results include, but are not limited to, the following: ・ Effects of economic conditions, volatility in the markets generally, and fluctuations in foreign
currency exchange and interest rate ・ Trends and factors beyond the NEC Group's control and fluctuations in financial conditions and
profits of the NEC Group that are caused by external factors ・ Risks arising from acquisitions, business combinations and reorganizations, including the
possibility that the expected benefits cannot be realized or that the transactions may result in unanticipated adverse consequences
・ Developments in the NEC Group's alliances with strategic partners
・ Effects of expanding the NEC Group's global business
・ Risk that the NEC Group may fail to keep pace with rapid technological developments and changes in customer preferences
・ Risk that the NEC Group may lose sales due to problems with the production process or due to its failure to adapt to demand fluctuations
・ Defects in products and services
・ Shortcomings in material procurement and increases in delivery cost
・ Acquisition and protection of intellectual property rights necessary for the operation of business
・ Risk that intellectual property licenses owned by third parties cannot be obtained and/or are discontinued
・ Risk that the NEC Group may be exposed to unfavorable pricing environment due to intensified competition
・ Risk that a major customer changes investment targets, reduces capital investment and/or reduces the value of transactions with the NEC Group
・ Risk that the NEC Group may be unable to provide or facilitate payment arrangements (such as vendor financing) to its customers on terms acceptable to them or at all, or risk that the NEC Group's customers are unable to make payments on time, due to the customers' financial difficulties or otherwise
・ Risk that the NEC Group may experience a substantial loss of, or an inability to attract, talented personnel
・ Risk that the NEC Group's ability to access the commercial paper market or other debt markets are adversely affected due to a downgrade in its credit rating
・ Risk that the NEC Group may incur large costs and/or liabilities in relation to internal control, legal proceedings, laws and governmental policies, environmental laws and regulations, tax practice, information management, and human rights and working environment
・ Consequences of natural and fire disasters
・ Changes in methods, estimates and judgments that the NEC Group uses in applying its accounting policies
・ Risk that the NEC Group may incur liabilities and losses in relation to its retirement benefit obligations
- 34 -

The forward-looking statements contained in this material are based on information that NEC possesses as of the date hereof. New risks and uncertainties come up from time to time, and it is impossible for NEC to predict these events or how they may affect the NEC Group. NEC does not intend to update or revise any forward-looking statements, whether as a result of new information, future events or otherwise.
***
- 35 -


![Three months ended December 31, Year ended December 31, … · 2016-01-27 · Three months ended December 31, Year ended December 31, 2015 2014 Change ~¦u]oo]}v 2015 2014 Change](https://img.pdfslide.us/doc/110x75/5f05bacd7e708231d41469d5/three-months-ended-december-31-year-ended-december-31-2016-01-27-three-months.jpg)