Embed Size (px)
Citation preview
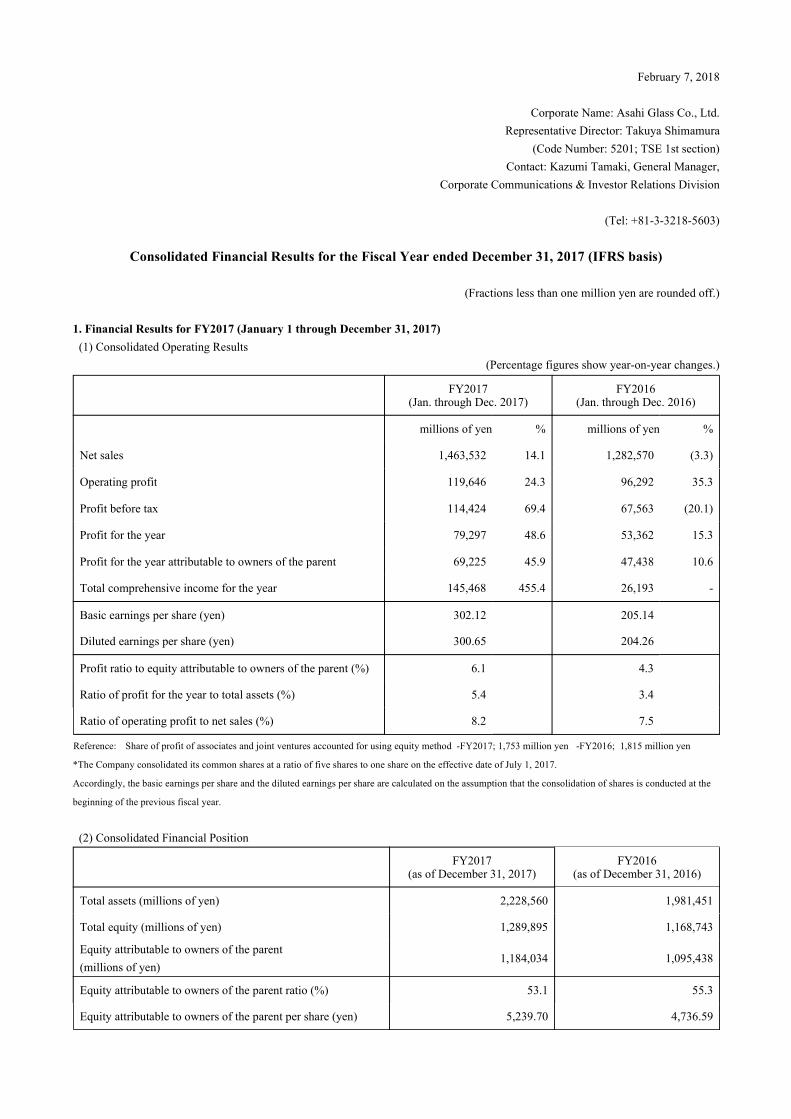
February 7, 2018
Corporate Name: Asahi Glass Co., Ltd.
Representative Director: Takuya Shimamura(Code Number: 5201; TSE 1st section)
Contact: Kazumi Tamaki, General Manager,Corporate Communications & Investor Relations Division
(Tel: +81-3-3218-5603)
Consolidated Financial Results for the Fiscal Year ended December 31, 2017 (IFRS basis)
(Fractions less than one million yen are rounded off.)
1. Financial Results for FY2017 (January 1 through December 31, 2017) (1) Consolidated Operating Results
(Percentage figures show year-on-year changes.)
FY2017 (Jan. through Dec. 2017)
FY2016 (Jan. through Dec. 2016)
millions of yen % millions of yen %
Net sales 1,463,532 14.1 1,282,570 (3.3)
Operating profit 119,646 24.3 96,292 35.3
Profit before tax 114,424 69.4 67,563 (20.1)
Profit for the year 79,297 48.6 53,362 15.3
Profit for the year attributable to owners of the parent 69,225 45.9 47,438 10.6
Total comprehensive income for the year 145,468 455.4 26,193 -
Basic earnings per share (yen) 302.12 205.14
Diluted earnings per share (yen) 300.65 204.26
Profit ratio to equity attributable to owners of the parent (%) 6.1 4.3
Ratio of profit for the year to total assets (%) 5.4 3.4
Ratio of operating profit to net sales (%) 8.2 7.5 Reference: Share of profit of associates and joint ventures accounted for using equity method -FY2017; 1,753 million yen -FY2016; 1,815 million yen *The Company consolidated its common shares at a ratio of five shares to one share on the effective date of July 1, 2017.
Accordingly, the basic earnings per share and the diluted earnings per share are calculated on the assumption that the consolidation of shares is conducted at the
beginning of the previous fiscal year. (2) Consolidated Financial Position
FY2017 (as of December 31, 2017)
FY2016 (as of December 31, 2016)
Total assets (millions of yen) 2,228,560 1,981,451
Total equity (millions of yen) 1,289,895 1,168,743
Equity attributable to owners of the parent (millions of yen)
1,184,034 1,095,438
Equity attributable to owners of the parent ratio (%) 53.1 55.3
Equity attributable to owners of the parent per share (yen) 5,239.70 4,736.59

*The Company consolidated its common shares at a ratio of five shares to one share on the effective date of July 1, 2017.
Accordingly, the Equity attributable to owners of the parent per share is calculated on the assumption that the consolidation of shares is conducted at the
beginning of the previous fiscal year. (3) Consolidated Cash Flows
FY2017 (Jan. through Dec. 2017)
FY2016 (Jan. through Dec. 2016)
Cash flows from operating activities (millions of yen) 203,504 203,637
Cash flows from investing activities (millions of yen) (209,560 ) (113,596)
Cash flows from financing activities (millions of yen) (18,720) (46,450)
Cash and cash equivalents at the end of the year (millions of yen) 126,417 147,325
2. Dividends
(Base date) FY2016 FY2017 FY2018(forecast)
Dividend per share
End of the first quarter (yen) - - -
End of the second quarter (yen) 9.00 10.00 55.00
End of the third quarter (yen) - - -
End of the fiscal year (yen) 9.00 55.00 55.00
Full fiscal year (yen) 18.00 - 110.00
Total dividend distribution (full fiscal year) (millions of yen)
20,814 23,885 -
Payout ratio (consolidated) (%) 43.9 34.8 32.3
Ratio of dividend distribution to equity attributable to owners of the parent (consolidated) (%)
1.9 2.1 -
*The Company consolidate its common shares at a ratio of five shares to one share on the effective date of July 1, 2017. Accordingly, figures for year-end dividends per share for fiscal year 2017 are amounts that take into account the consolidation of shares, and total annual dividends are shown as “-.” The scheduled year-end dividends per share for fiscal year 2017 without taking into account the consolidation of shares are 11 yen, and annual dividends per share are 21 yen. 3. Forecast for FY2018 (January 1 through December 31, 2018)
(Percentage figures show year-on-year changes.)
First half Full fiscal year
millions of yen % millions of yen %
Net sales 750,000 8.7 1,550,000 5.9
Operating profit 55,000 11.6 130,000 8.7
Profit before tax - - 118,000 3.1
Profit for the year - - 89,000 12.2
Profit for the year attributable to owners of the parent - - 77,000 11.2
Basic earnings per share (yen) 340.75
(Note) The forecast for the six months ending June 30, 2018 consists of forecast net sales and operating profit only.

*Notes (1) Changes in significant subsidiaries during the period: Yes (Company name:Vinythai Public Company Limited) (2) Changes in Accounting Policies and Changes in Accounting Estimates i. Changes in accounting policies required by IFRS: Yes ii. Changes in accounting policies other than "i" above: No iii. Changes in accounting estimates: No
(Note) For details, please refer to "(5) Notes to the Consolidated Financial Statements, 2) Changes in Accounting Policies" on page 16. (3) Number of Shares Issued (ordinary shares)
ⅰ. Number of shares issued (including treasury shares) at the end of the period -FY2017 (as of December 31, 2017): 235,177,781 -FY2016 (as of December 31, 2016): 237,341,181
ⅱ. Number of treasury shares at the end of the period -FY2017 (as of December 31, 2017): 9,204,032 -FY2016 (as of December 31, 2016): 6,069,471
ⅲ. Average number of shares issued during the period -FY2017 (Jan. through Dec. 2017): 229,134,775 -FY2016 (Jan. through Dec. 2016): 231,251,138
(Note) The Company consolidated its common shares at a ratio of five shares to one share on the effective date of July 1, 2017. Accordingly, the shares issued (including treasury stock) at the end of period, the treasury stock and the average shares outstanding during the period are calculated on the assumption that the consolidation of shares is conducted at the beginning of the previous fiscal year.

[Reference] (1) Non-Consolidated Operating Results
(Percentage figures show year-on-year changes.)
FY2017 (Jan. through Dec. 2017)
FY2016 (Jan. through Dec. 2016)
millions of yen % millions of yen %
Net sales 496,067 2.7 483,078 (2.6)
Operating income 22,214 (27.8) 30,784 90.3
Ordinary income 41,789 (15.2) 49,288 14.0
Net income 40,190 66.4 24,153 (33.9)
Net income per share -basic (yen) 175.40 104.45
Net income per share -fully diluted (yen) 174.55 104.00
(Notes) The Net income per share -basic and the Net income per share -fully diluted are calculated on the assumption that the consolidation of shares is conducted at the beginning of the preceding fiscal year. (2) Non-Consolidated Financial Position
FY2017 (as of December 31, 2017)
FY2016 (as of December 31, 2016)
Total assets (millions of yen) 1,340,163 1,272,447
Total net assets (millions of yen) 643,271 639,795
Equity ratio (%) 47.8 50.1
Equity per share (yen) 2,835.14 2,755.96 Reference: Total Shareholders' Equity at -FY2017; 640,667 million yen -FY2016; 637,375 million yen (Notes) The Equity per share is calculated on the assumption that the consolidation of shares is conducted at the beginning of the preceding fiscal year. *This consolidated financial statement is outside the scope of annual audit procedure. *Appropriate Use of Forecast and Other Information and Other Matters The above forecast is based on information available to the Company at the time of publication of this document and assumptions concerning uncertainties which might affect the AGC Group’s future financial results. It is not intended to be a guarantee of future events, and may differ from actual results for various reasons. For matters concerning the above forecast, please see page 5 and 6.
*Supplementary Materials for the Financial Results Supplementary materials are available on our website.

(Attached Documents)
INDEX
1. Operating Results 2
(1) Analysis of Operating Results 2
(2) Qualitative Information Regarding Consolidated Financial Position 3
(3) Forecast for FY2018 5
(4) Allocation and Distribution of Profits and Dividends 6
2. Basic Policy for adopting Accounting Standards 6
3. Consolidated Financial Statements (IFRS) 7
(1) Consolidated Statement of Financial Position 7
(2) Consolidated Statement of Profit or Loss and Consolidated Statement of Comprehensive Income 9
(3) Consolidated Statement of Changes in Equity 11
(4) Consolidated Statement of Cash Flows 15
(5) Notes to the Consolidated Financial Statements 16
- 1 -

Qualitative Information and Financial Statements 1. Operating Results
(1) Analysis of Operating Results Operating results for FY2017 During the fiscal year ended December 31, 2017, the global economic environment surrounding the Company and its consolidated subsidiaries (hereinafter collectively referred to as the “AGC Group” or simply as the ”Group”) was on a gradual recovery track on the whole. In Japan, the economy showed a gradual upward trend thanks to factors such as economic measures taken by the government. The European economy made a gradual recovery and the United States continued its economic recovery along with increased consumer spending and other factors. The economies of Russia, Brazil, China and other emerging countries were picking up as well. Under such a business environment, due to increased volume of shipments at each business section as well as consolidation of acquired companies, the AGC Group posted net sales of 1,463.5 billion yen, up 181.0 billion yen, or a 14.1% increase from the previous year. Operating profit increased by 23.4 billion yen, or 24.3% increase, year-on-year to 119.6 billion yen, and profit before tax was 114.4 billion yen, up 46.9 billion yen or a 69.4% increase on a year-on-year basis. Profit for the year attributable to owners of the parent was 69.2 billion yen, up 21.8 billion yen or a 45.9% increase on a year-on-year basis.
Overview by reportable segment (Unit: billions of yen)
Net sales Operating profit
FY2017 FY2016 FY2017 FY2016
Glass 735.1 680.0 27.1 31.8
Electronics 262.4 258.1 27.3 25.0
Chemicals 437.6 316.6 63.7 40.0
Ceramics/Other 75.4 70.8 1.4 (0.2)
Corporate or elimination (47.0) (42.9) 0.1 (0.3)
Total 1,463.5 1,282.6 119.6 96.3
Note: Figures are rounded to the nearest 100 million yen.
- Glass Sales of architectural glass increased on a year-on-year basis, mainly because selling prices increased in Europe as compared to the previous year and shipments of architectural glass remained favorable in North America. In the automotive glass business, shipments increased as overall auto production remained favorable despite the slowdown of auto production in North America. Consequently, the AGC Group’s sales increased from the previous fiscal year. As a result, net sales from the Glass Operations for the fiscal year were 735.1 billion yen, up 55.1 billion yen or an 8.1% increase from the previous fiscal year. Operating profit was 27.1 billion yen, down 4.8 billion or a 15.0% decrease mainly due to the increase of raw material and fuel prices, and logistic costs, as well as the impact of the previous year’s temporary gain from a revision of a pension plan at a subsidiary in the United States.
- Electronics Regarding LCD glass substrate, the selling prices decreased but shipments increased from the previous fiscal year. Shipments of specialty glass for display applications and cover glass for car-mounted displays increased from the previous fiscal year. Regarding electronic materials, shipments of optoelectronic materials and semiconductor-related products increased from the previous fiscal year. As a result, net sales from the Electronics Operations for the fiscal year, were 262.4 billion yen, up 4.3 billion yen or a 1.6% increase from the previous fiscal year, and operating profit was 27.3 billion yen, up 2.3 billion yen or a 9.4% increase from the previous fiscal year.
- 2 -

- Chemicals Sales of chlor-alkali products and urethane materials increased from the previous fiscal year mainly because of the consolidation of Vinythai Public Company Limited, the increase of shipments from the growing demand in Southeast Asia, and the rising international market prices. In the categories of fluorine products and specialty products, sales increased from the previous fiscal year resulting from the consolidation of CMC Biologics and favorable shipments of existing fluorine chemical products. As a result, net sales from the Chemicals Operations for the fiscal year, were 437.6 billion yen, up 121.0 billion yen or a 38.2% increase from the previous fiscal year. Operating profit was 63.7 billion yen, up 23.7 billion yen or a 59.2% increase from the previous fiscal year.
(2) Qualitative Information Regarding Consolidated Financial Position Overview of financial conditions (Unit: billions of yen)
FY2017 FY2016 Change
Total assets 2,228.6 1,981.5 247.1
Total liabilities 938.7 812.7 126.0
Total equity 1,289.9 1,168.7 121.2
Note: Figures are rounded to the nearest 100 million yen.
- Total assets Total assets as of the end of the fiscal year under review were 2,228.6 billion yen, up 247.1 billion yen from the end of the previous fiscal year. Total assets increased mainly because of an increase in goodwill, property, plant and equipment and intangible assets due to the acquisition of CMC Biologics and Vinythai Public Company Limited.
- Total liabilities Total liabilities as of the end of the fiscal year under review were 938.7 billion yen, up 126.0 billion yen from the end of the previous fiscal year. This increase was mainly due to the acquisition of CMC Biologics and Vinythai Public Company Limited .
- Total equity Total equity as of the end of the fiscal year under review was 1,289.9 billion yen, up 121.2 billion yen from the end of the previous fiscal year. Total equity increased mainly because of greater retained earnings resulting from net profit and an increase in non-controlling interests due to the acquisition of Vinythai Public Company Limited.
- 3 -

Overview of cash flows (Unit: billions of yen)
FY2017 FY2016 Change
Cash flows from operating activities 203.5 203.6 (0.1)
Cash flows from investing activities (209.6) (113.6) (96.0)
Cash flows from financing activities (18.7) (46.5) 27.7
Cash & cash equivalents as of end of period 126.4 147.3 (20.9)
Note: Figures are rounded to the nearest 100 million yen.
The free cash flow for the fiscal year under review, which is the sum of cash flows from operating activities and investing activities, was negative 6.1 billion yen (positive 90.0 billion yen in the previous year) mainly due to purchase of subsidiaries etc. Cash & cash equivalents as of the end of the period (net cash) decreased 20.9 billion yen or 14.2% from the end of the previous year to 126.4 billion yen mainly due to payment of dividends and acquisition of treasury shares etc. in financing activities.
- Cash flows from operating activities Net cash from operating activities was 203.5 billion yen for the fiscal year under review, down 0.1 billion yen or 0.1% from the previous year.
- Cash flows from investing activities Net cash used in investing activities increased by 96.0 billion yen or 84.5% year-on-year to 209.6 billion yen. This expenditure includes purchase of property, plant and equipment and purchase of subsidiaries etc.
- Cash flows from financing activities Net cash used in financing activities for the fiscal year under review was 18.7 billion yen, down 27.7 billion yen or 59.7% from the previous year. This expenditure is mainly due to payment of dividends and acquisition of treasury shares etc.
- Cash flow indices
FY2016 FY2017
Equity attributable to owners of the parent ratio (%)
55.3 53.1
Equity attributable to owners of the parent ratio based on market value (%)
46.5 49.5
Number of years for debt redemption 2.1 2.4
Interest coverage ratio 28.8 26.0
(Notes) Equity attributable to owners of the parent ratio (%): Total equity attributable to owners of the parent / Total Assets Equity attributable to owners of the parent ratio based on market value (%): Total market capitalization / Total Assets Number of years for debt redemption: Interest-bearing debts/operating cash flows Interest coverage ratio: Operating cash flows/interest payment
- All indices were computed using consolidated financial figures. - Total market capitalization was computed based on the closing stock price at period-end multiplied by number of outstanding shares at period-end (after
deducting treasury shares). - Operating cash flows represent cash flows from operating activities on the consolidated statements of cash flows. - Interest-bearing debts represent all debts on the consolidated financial position for which interest is paid. In addition, interest payment represents amount of
interest paid on the consolidated statements of cash flows.
- 4 -

(3) Forecast for FY2018 Operating forecast for FY2018
(Unit: billions of yen)
Net Sales Operating profit Profit before tax Profit for the year
Profit for the year attributable to owners of the
parent FY 2018
(January 1 through December 31, 2018) 1,550.0 130.0 118.0 89.0 77.0
FY 2017 (January 1 through December 31, 2017)
1,463.5 119.6 114.4 79.3 69.2
Change (%) 5.9 8.7 3.1 12.2 11.2
Note: Figures are rounded to the nearest 100 million yen.
In 2018, there is uncertainty over the world economy outlook as affected by national policies around the world and other factors, however, the world economy is expected to maintain moderate growth on the whole. Under such a business environment, the shipments of architectural glass are expected to increase moderately in many regions. In the automotive glass business, shipments are projected to remain high as a whole, supported by favorable demand. Regarding LCD glass substrates, shipments are likely to be favorable and the range of price decline is expected to shrink. Shipments of specialty glass for display applications and cover glass for car-mounted displays are expected to increase from the previous fiscal year. In the category of electronic materials, shipments of optoelectronic materials and semiconductor-related products are both expected to increase from the previous fiscal year. In the Chemicals business, shipments of chlor-alkali products are expected to continue to increase in Southeast Asia, and the construction of the power plant at an Indonesian subsidiary will also contribute to cost reduction. Shipments of fluorine products and life science products will also remain favorable. Taking into account the above factors, net sales of the AGC Group for the fiscal year ending December 31, 2018 are forecasted to be 1,550.0 billion yen, up 86.5 billion yen or a 5.9% increase from previous year, and operating profit is forecasted to be 130.0 billion yen, up 10.4 billion yen or a 8.7% increase year-on-year. Profit before tax will be 118.0 billion yen, up 3.6 billion yen or a 3.1% increase from the previous fiscal year and profit for the year attributable to owners of the parent is estimated to be 77.0 billion yen, up 7.8 billion yen or a 11.2% increase from the previous fiscal year. Average exchange rates assumed for the fiscal year ending December 31, 2018 are 110 yen to the U.S. dollar and 135 yen to the Euro.
Forecast of financial conditions for FY2018 Regarding cash flows from operating activities, profit before tax is expected to increase by 3.6 billion yen to 118.0 billion yen as compared with that for the fiscal year ended December 31, 2017. Depreciation expenses are expected to be 135.0 billion yen, up 6.8 billion yen from the previous fiscal year. Of the cash flows from investing activities, capital expenditures are expected to increase 54.9 billion yen year-on-year to 220.0 billion yen. As for financing activities, the AGC Group will repay and borrow interest-bearing debts and increase borrowings, in addition to dividend payments in accordance with the Group's dividend policy.
- 5 -

(4) Allocation and Distribution of Profits and Dividends The AGC Group continues to strive to proactively return profits to shareholders, aiming at the consolidated total shareholders return of 50% or more, including the annual dividend payment per share maintained at the current term's expected payment amount or more and the acquisition of treasury shares, while giving comprehensive consideration to the Group’s consolidated business results and future investment plans, among others. The AGC Group will also allocate retained earnings to R&D, capital investment as well as merger and acquisition activities, to strengthen its financial position and improve its corporate value. In consideration of the Group's financial results for the fiscal year under review, the current business environment and future business developments, the Group paid an interim dividend of 10 yen per share and plans to pay a year-end dividend of 55 yen for FY 2017. The Company consolidated its common shares at a ratio of five shares to one share on the effective date of July 1, 2017. The scheduled year-end dividends per share for fiscal year 2017 without taking into account the consolidation of shares is 11 yen, and annual dividends per share is 21 yen. With regard to dividend payments for the fiscal year ending December 31, 2018, the total full year dividend payout is scheduled to be 55 yen per share for interim dividend, and 55 yen per share for year-end dividend in light of the Group's financial forecasts.
[Important notes with regard to the forecast]
The above prospective results reflect the judgment of the Group's management on the basis of currently available information and, as such, contain risks and uncertainties. For this reason, investors are recommended not to base investment decisions solely on these prospective results. Please note that actual results may materially differ from the projection due to such various factors as business and market environment the Group is active in, currency exchange rate fluctuations, and others.
2. Basic Policy for adopting Accounting StandardsThe AGC Group adopted International Financial Reporting Standards (IFRS) for its consolidated financial statements, starting with the annual financial statements for the fiscal year ending December 31, 2013, with the aim of increasing international comparability of financial information, offering greater convenience for domestic or foreign investors and enhancing the efficiency of the Group's management.
- 6 -

3. Consolidated Financial Statements (IFRS)(1) Consolidated Statements of Financial Position
(Unit: millions of yen)
FY2016 (as of December 31, 2016)
FY2017 (as of December 31, 2017)
Assets
Current assets Cash and cash equivalents 147,325 126,417 Trade receivables 241,476 260,497 Inventories 227,284 261,708 Other receivables 37,972 43,774 Income tax receivables 7,201 5,570 Other current assets 12,176 24,554 Total current assets 673,436 722,522
Non-current assets Property, plant and equipment 937,869 1,060,601 Goodwill 34,859 78,757 Intangible assets 27,400 58,038 Investments accounted for using equity method 36,889 39,575 Other financial assets 232,216 234,896 Deferred tax assets 29,421 23,157 Other non-current assets 9,358 11,011 Total non-current assets 1,308,015 1,506,038
Total assets 1,981,451 2,228,560
- 7 -

(Unit: millions of yen)
FY2016 (as of December 31, 2016)
FY2017 (as of December 31, 2017)
Liabilities and equity Liabilities
Current liabilities Trade payables 137,590 159,489 Short-term interest-bearing debt 36,689 73,666 Long-term interest-bearing debt due within one year 66,669 63,629 Other payables 110,829 127,580 Income tax payables 10,173 12,210 Provisions 4,259 1,893 Other current liabilities 11,279 16,819 Total current liabilities 377,490 455,288
Non-current liabilities Long-term interest-bearing debt 330,609 351,789 Deferred tax liabilities 22,110 59,492 Post-employment benefit liabilities 66,865 50,585 Provisions 10,701 10,045 Other non-current liabilities 4,929 11,463 Total non-current liabilities 435,216 483,376 Total liabilities 812,707 938,665
Equity
Share capital 90,873 90,873 Capital surplus 101,237 101,420
Retained earnings 690,890 735,653 Treasury shares (29,259) (43,629) Other components of equity 241,696 299,716 Total equity attributable to owners of the parent 1,095,438 1,184,034 Non-controlling interests 73,305 105,860
Total equity 1,168,743 1,289,895
Total liabilities and equity 1,981,451 2,228,560
- 8 -

(2) Consolidated Statements of Profit or Loss and Consolidated Statements of Comprehensive Income(Consolidated Statements of Profit or Loss)
(Unit: millions of yen)
FY2016 (Jan. 1 through Dec. 31, 2016)
FY2017 (Jan. 1 through Dec. 31, 2017)
Net sales 1,282,570 1,463,532 Cost of sales (933,623) (1,060,587)
Gross profit 348,946 402,945 Selling, general and administrative expenses (254,469) (285,051) Share of profit (loss) of associates and joint ventures accounted for using equity method
1,815 1,753
Operating profit 96,292 119,646 Other income 4,078 6,979 Other expenses (31,534) (12,711)
Business profit 68,837 113,915 Finance income 6,127 8,262 Finance costs (7,401) (7,752)
Net finance costs (1,274) 509 Profit before tax 67,563 114,424
Income tax expenses (14,200) (35,127) Profit for the year 53,362 79,297 Attributable to: Owners of the parent 47,438 69,225 Non-controlling interests 5,923 10,071
Earnings per share Basic earnings per share (yen) 205.14 302.12 Diluted earnings per share (yen) 204.26 300.65
- 9 -

(Consolidated Statements of Comprehensive Income)(Unit: millions of yen)
FY2016 (Jan. 1 through Dec. 31, 2016)
FY2017 (Jan. 1 through Dec. 31, 2017)
Profit for the year 53,362 79,297 Other comprehensive income
Components of other comprehensive income that will not be reclassified to profit or loss, net of tax
Remeasurement of the net defined benefit liability (asset)
(10,335) 12,388
Net gain (loss) on revaluation of financial assets
measured at FVTOCI (Note) 4,996 17,207
Share of other comprehensive income of associates and joint ventures accounted for using equity method
97 (70)
Total (5,241) 29,525
Components of other comprehensive income that may be reclassified to profit or loss, net of tax
Net gain (loss) in fair value of cash flow hedges 2,757 367
Exchange differences on translation of foreign operations
(24,716) 36,301
Share of other comprehensive income of associates and joint ventures accounted for using equity method
31 (23)
Total (21,927) 36,645 Other comprehensive income, net of tax (27,169) 66,170
Total comprehensive income for the year 26,193 145,468 Attributable to: Owners of the parent 21,452 135,090 Non-controlling interests 4,740 10,377
(Note) FVTOCI: Fair Value Through Other Comprehensive Income
- 10 -

(3) Consolidated Statements of Changes in EquityFY2016 (Jan. 1 through Dec. 31, 2016)
(Unit: millions of yen)
Equity attributable to owners of the parent
Share capital Capital surplus Retained earnings Treasury shares
Other components of equity
Remeasurement of net defined benefit liability (asset)
Net gain (loss) on revaluation of financial assets measured at FVTOCI (Note)
Balance as of January 1, 2016 90,873 100,802 663,874 (29,576) (35,003) 91,408 Changes in equity Comprehensive income Profit for the year - - 47,438 - - - Other comprehensive income - - - - (10,102) 4,998
Total comprehensive income for the year - - 47,438 - (10,102) 4,998
Transactions with owners Dividends - - (20,811) - - - Acquisition of treasury shares - - - (24) - -
Disposal of treasury shares - - (126) 341 - - Changes in ownership interests in subsidiaries that do not result in loss of control
- 323 - - - -
Transfer from other components of equity to retained earnings
- - 515 - - (515)
Share-based payment transactions - 112 - - - -
Others (business combinations and others) - - - - - -
Total transactions with owners - 435 (20,422) 316 - (515) Balance as of December 31, 2016 90,873 101,237 690,890 (29,259) (45,106) 95,891
(Note) FVTOCI: Fair Value Through Other Comprehensive Income
- 11 -

FY2016 (Jan. 1 through Dec. 31, 2016) (Unit: millions of yen)
Equity attributable to owners of the parent
Non- controlling interests
Total equity
Other components of equity
Total Net gain (loss) in fair value of cash flow hedges
Exchange differences on translation of foreign operations
Total
Balance as of January 1, 2016 (2,563) 214,357 268,198 1,094,172 69,594 1,163,767 Changes in equity Comprehensive income Profit for the year - - - 47,438 5,923 53,362 Other comprehensive income 2,788 (23,671) (25,986) (25,986) (1,182) (27,169)
Total comprehensive income for the year 2,788 (23,671) (25,986) 21,452 4,740 26,193
Transactions with owners Dividends - - - (20,811) (542) (21,354) Acquisition of treasury shares - - - (24) - (24)
Disposal of treasury shares - - - 214 - 214 Changes in ownership interests in subsidiaries that do not result in loss of control
- - - 323 (620) (297)
Transfer from other components of equity to retained earnings
- - (515) - - -
Share-based payment transactions - - - 112 - 112
Others (business combinations and others) - - - - 132 132
Total transactions with owners - - (515) (20,185) (1,030) (21,216) Balance as of December 31, 2016 225 190,686 241,696 1,095,438 73,305 1,168,743
- 12 -
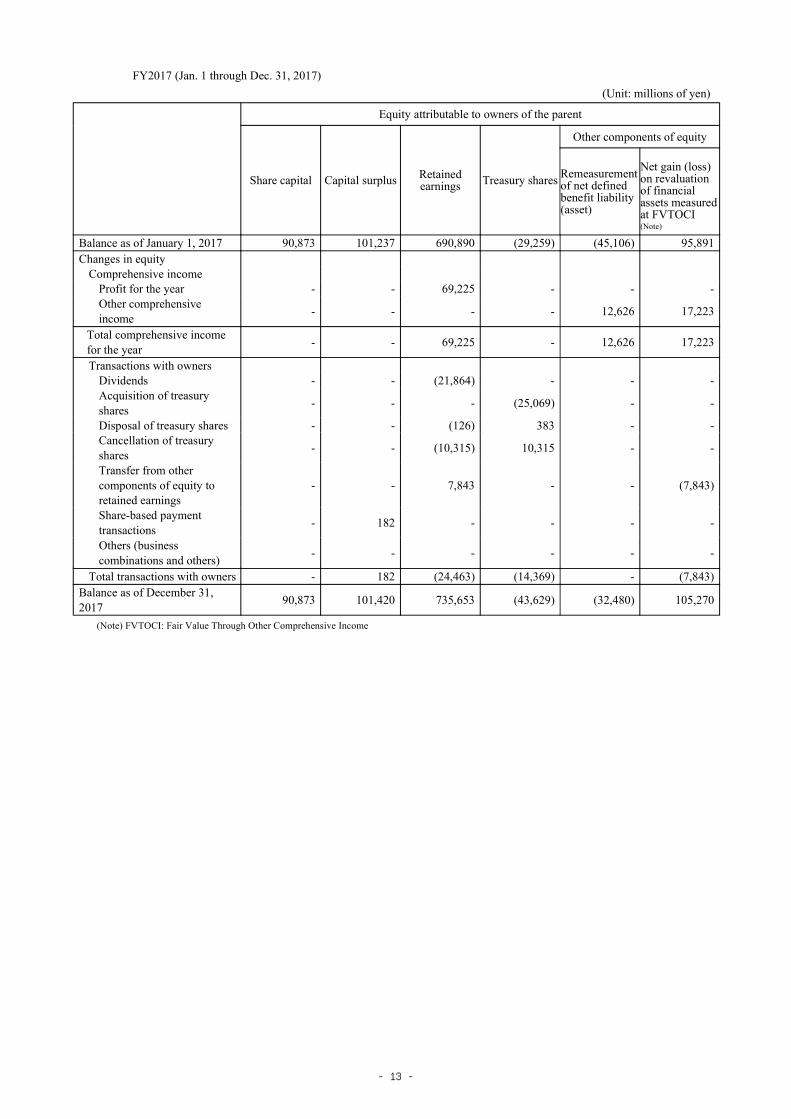
FY2017 (Jan. 1 through Dec. 31, 2017) (Unit: millions of yen)
Equity attributable to owners of the parent
Share capital Capital surplus Retained earnings Treasury shares
Other components of equity
Remeasurement of net defined benefit liability (asset)
Net gain (loss) on revaluation of financial assets measured at FVTOCI (Note)
Balance as of January 1, 2017 90,873 101,237 690,890 (29,259) (45,106) 95,891 Changes in equity Comprehensive income Profit for the year - - 69,225 - - - Other comprehensive income - - - - 12,626 17,223
Total comprehensive income for the year - - 69,225 - 12,626 17,223
Transactions with owners Dividends - - (21,864) - - - Acquisition of treasury shares - - - (25,069) - -
Disposal of treasury shares - - (126) 383 - - Cancellation of treasury shares - - (10,315) 10,315 - -
Transfer from other components of equity to retained earnings
- - 7,843 - - (7,843)
Share-based payment transactions - 182 - - - -
Others (business combinations and others) - - - - - -
Total transactions with owners - 182 (24,463) (14,369) - (7,843) Balance as of December 31, 2017 90,873 101,420 735,653 (43,629) (32,480) 105,270
(Note) FVTOCI: Fair Value Through Other Comprehensive Income
- 13 -

FY2017 (Jan. 1 through Dec. 31, 2017) (Unit: millions of yen)
Equity attributable to owners of the parent
Non- controlling interests
Total equity
Other components of equity
Total Net gain (loss) in fair value of cash flow hedges
Exchange differences on translation of foreign operations
Total
Balance as of January 1, 2017 225 190,686 241,696 1,095,438 73,305 1,168,743 Changes in equity Comprehensive income Profit for the year - - - 69,225 10,071 79,297 Other comprehensive income 323 35,691 65,864 65,864 306 66,170
Total comprehensive income for the year 323 35,691 65,864 135,090 10,377 145,468
Transactions with owners Dividends - - - (21,864) (2,802) (24,667) Acquisition of treasury shares - - - (25,069) - (25,069)
Disposal of treasury shares - - - 256 - 256 Cancellation of treasury shares - - - - - -
Transfer from other components of equity to retained earnings
- - (7,843) - - -
Share-based payment transactions - - - 182 - 182
Others (business combinations and others) - - - - 24,980 24,980
Total transactions with owners - - (7,843) (46,494) 22,177 (24,316) Balance as of December 31, 2017 548 226,377 299,716 1,184,034 105,860 1,289,895
- 14 -

(4) Consolidated Statements of Cash Flows(Unit: millions of yen)
FY2016 (Jan. 1 through Dec. 31, 2016)
FY2017 (Jan. 1 through Dec. 31, 2017)
Cash flows from operating activities Profit before tax 67,563 114,424 Depreciation and amortization 121,803 128,226 Interest and dividend income (6,039) (8,159) Interest expenses 6,400 7,228 Share of profit (loss) of associates and joint ventures accounted for using equity method
(1,815) (1,753)
Loss (gain) on sale or disposal of non-current assets 3,627 2,890 Decrease (increase) in trade receivables (5,427) (3,566) Decrease (increase) in inventories 2,457 (22,929) Increase (decrease) in trade payables 15,039 11,528 Others 19,614 (15,740)
Subtotal 223,223 212,149 Interest and dividends received 6,495 9,030 Interest paid (7,080) (7,836) Income taxes paid and refund (19,001) (9,839) Net cash from operating activities 203,637 203,504 Cash flows from investing activities Purchase of property, plant and equipment and intangible assets
(118,379) (157,227)
Proceeds from sale of property, plant and equipment 4,195 7,149 Purchase of other financial assets (3,418) (4,984) Proceeds from sale and redemption of other financial assets 7,007 27,720 Purchase of subsidiaries (2,853) (79,173) Others (148) (3,044) Net cash used in investing activities (113,596) (209,560) Cash flows from financing activities Changes in short-term interest-bearing debt 5,114 29,657 Proceeds from borrowing or issuing long-term interest-bearing debt
31,030 83,944
Repayment or redemption of long-term interest-bearing debt (59,985) (82,189) Payment from purchase of shares in subsidiaries from non-controlling interests
(402) -
Acquisition of treasury shares (24) (25,069) Dividends paid (20,811) (21,864) Dividends paid to non-controlling interests (542) (2,802) Others (829) (395) Net cash used in financing activities (46,450) (18,720) Effect of exchange rate changes on cash and cash equivalents (1,098) 3,868 Net increase (decrease) in cash and cash equivalents 42,493 (20,907) Cash and cash equivalents at beginning of year 104,831 147,325 Cash and cash equivalents at end of year 147,325 126,417
- 15 -

(5) Notes to the Consolidated Financial Statements1) Basis of Preparations The Group’s consolidated financial statements have been prepared in accordance with International Financial Reporting Standards (“IFRS”), based on the stipulations of Article 93 of the Ordinance on Consolidated Financial Statements. The Group’s consolidated financial statements satisfy all of the requirements for a “Specified Company” prescribed by Article 1-2 of the Ordinance on Consolidated Financial Statements.
2) Changes in Accounting Policies The significant accounting policies adopted for the Group's consolidated financial statements are the same as those for the consolidated financial statements for the fiscal year ended December 31, 2016, with the exception of the items described below. The following are the accounting standards applied by the Group from the fiscal year 2017, in compliance with each transitional provision. The effect of the application of these standards on the Group's consolidated financial statements is immaterial.
IFRS Title Summaries of new IFRS and amendments
IAS 7 (amended in January 2016)
Statement of Cash Flows Additional disclosure of changes in liabilities arising from financing activities
IAS 12 Income Taxes Clarification of recognition of deferred tax assets related unrealized loss
3) Significant Accounting Policies "Operating profit" in the Group's consolidated statements of profit or loss is an indicator that facilitates like-on-like comparisons and evaluation of the Group's business performance on a continuous basis. Main items of "other income" and "other expenses" are foreign exchange gain and loss, gains on sale of non-current assets, losses on disposal of non-current assets, impairment loss and expenses for restructuring programs. "Business profit" includes all income and expenses before finance income, finance costs and income tax expenses.
- 16 -

4) Segment Information The Group’s reportable segments are components of the Group for which discrete financial information is available, and whose operating results are reviewed regularly by the Group’s chief operating decision maker to make decisions about resources to be allocated to the segment and assess performance. The Group in the past had three in-house companies by product and service: Glass, Electronics and Chemicals. However, to better focus on market aspects, on January 1, 2017 the Group split Glass Company into two entities: "Building & Industrial Glass Company" and "Automotive Company." As a result, four in-house companies constitute the Group. Each in-house company operates worldwide, formulating comprehensive domestic and overseas strategies for its products and services. Building & Industrial Glass and Automotive share the same float glass manufacturing facilities (glass melting furnace) etc., which are the largest assets and situated the highest upstream in the supply chain. The two in-house companies share assets and liabilities, and ratio of utilization is influenced by fluctuations of demand and supply. Considering these situations, it is difficult to divide financial statements for the two in-house companies. Therefore, the Group prepares the financial statements of Building & Industrial Glass and Automotive as the Glass segment. In addition, decisions on assigning management resources are closely tied to the results of each business and inseparable from their performance evaluation. Therefore, with the participation of presidents of both in-house companies, the Group has established a "Glass Segment Council," which primarily functions to maintain synergies and maximize overall production in the Glass segment, and collaborates to maximize profits for the Group. Based on these circumstances, the Group continues to report the Glass segment as one. Thus, the Group has three reportable segments: Glass, Electronics, and Chemicals. The main products of each reportable segment are as follows.
Reportable segment Main products
Glass Float flat glass, Figured glass, Polished wired glass, Low-E glass, Decorative glass, Fabricated glass for architectural use (Heat Insulating/shielding glass, Disaster-resistant/Security glass, Fire-resistant glass, etc.), Automotive glass, etc.
Electronics
LCD glass substrates, Specialty glass for display applications, Cover glass for car-mounted displays, Display related materials, Glass for solar power system, Fabricated glass for industrial use, Semiconductor process materials, Optoelectronic materials, Lighting glass products, Laboratory use ware, etc.
Chemicals Polyvinyl chloride, Vinyl chloride monomer, Caustic soda, Urethane, Fluorinated resins, Water and oil repellents, Gases, Solvents, Pharmaceutical and agrochemical intermediates and active ingredients, Iodine-related products, etc.
- 17 -

FY2016 (Jan.1 through Dec.31, 2016) (Unit: millions of yen)
Reportable segments
Ceramics/ Other
Total Adjustments
Amount reported on consolidated financial statements
Glass Electronics Chemicals
Sales to external customers 679,071 257,069 314,392 32,037 1,282,570 - 1,282,570
Inter-segment sales or transfers
936 1,069 2,207 38,727 42,940 (42,940) -
Total sales 680,007 258,139 316,599 70,765 1,325,511 (42,940) 1,282,570
Segment profit (loss) (Operating profit)
31,825 24,985 39,998 (217) 96,591 (298) 96,292
Profit for the year - - - - - - 53,362
Other items
Depreciation and amortization
42,553 55,675 21,535 2,159 121,924 (120) 121,803
Capital expenditure 50,275 42,866 32,449 532 126,124 (99) 126,025
Investments accounted for using equity method
30,763 1,881 1,696 2,547 36,889 - 36,889
The amounts of inter-segment sales or transfers are primarily based on market prices and manufacturing cost. “Ceramics/Other” mainly handles ceramics products, logistics and financial services.
FY2017 (Jan.1 through Dec.31, 2017)
(Unit: millions of yen)
Reportable segments
Ceramics/ Other
Total Adjustments
Amount reported on consolidated financial statements
Glass Electronics Chemicals
Sales to external customers 733,953 260,626 435,145 33,807 1,463,532 - 1,463,532
Inter-segment sales or transfers
1,166 1,765 2,459 41,607 46,998 (46,998) -
Total sales 735,119 262,391 437,605 75,415 1,510,531 (46,998) 1,463,532
Segment profit (loss) (Operating profit)
27,064 27,334 63,671 1,428 119,499 147 119,646
Profit for the year - - - - - - 79,297
Other items
Depreciation and amortization
45,413 51,346 29,440 2,136 128,336 (110) 128,226
Capital expenditure 63,794 48,004 50,521 2,817 165,139 (43) 165,095
Investments accounted for using equity method
31,715 2,022 3,047 2,790 39,575 - 39,575
The amounts of inter-segment sales or transfers are primarily based on market prices and manufacturing cost. “Ceramics/Other” mainly handles ceramics products, logistics and financial services.
- 18 -

5) Notes to Consolidated Statements of Profit or LossOther Income
(Unit: millions of yen)
FY2016 (Jan. 1 through Dec. 31, 2016)
FY2017 (Jan. 1 through Dec. 31, 2017)
Gains on sale of non-current assets 1,251 2,773 Reversal of provisions for restructuring programs 10 917 Others 2,817 3,288
Total 4,078 6,979
Other Expenses (Unit: millions of yen)
FY2016 (Jan. 1 through Dec. 31, 2016)
FY2017 (Jan. 1 through Dec. 31, 2017)
Foreign exchange loss (196) (986) Losses on disposal of non-current assets (4,878) (5,664) Impairment loss (10,318) (2,885) Expenses for restructuring programs (11,315) (1,992) Others (4,826) (1,183)
Total (31,534) (12,711)
- 19 -

6) Earnings Per ShareBasic earnings per share Basic earnings per share and the basis for calculating basic earnings per share are as follows:
FY2016 (Jan. 1 through Dec. 31, 2016)
FY2017 (Jan. 1 through Dec. 31, 2017)
Profit for the year attributable to owners of the parent (millions of yen)
47,438 69,225
Weighted average number of ordinary shares outstanding (thousands of shares)
231,251 229,134
Basic earnings per share (yen) 205.14 302.12
Notes: Effective July 1, 2017, the Company consolidated its common shares at a ratio of five shares to one share. Basic earnings per share are calculated on the assumption that the consolidation of shares have been conducted at the beginning of the preceding fiscal year.
Diluted earnings per share Diluted earnings per share and the basis for calculating diluted earnings per share are as follows:
FY2016 (Jan. 1 through Dec. 31, 2016)
FY2017 (Jan. 1 through Dec. 31, 2017)
Profit for the year attributable to owners of the parent (millions of yen)
47,438 69,225
Adjustments to profit or loss used to calculate diluted earnings per share (millions of yen)
- -
Profit or loss used to calculate diluted earnings per share (millions of yen)
47,438 69,225
Weighted average number of ordinary shares outstanding (thousands of shares)
231,251 229,134
Effects of dilutive potential ordinary shares
Stock options based on subscription rights (thousands of shares)
991 1,117
Diluted weighted average number of ordinary shares outstanding (thousands of shares)
232,242 230,252
Diluted earnings per share (yen) 204.26 300.65
Notes: Effective July 1, 2017, the Company consolidated its common shares at a ratio of five shares to one share. Diluted earnings per share are calculated on the assumption that the consolidation of shares have been conducted at the beginning of the preceding fiscal year.
7) Notes on Significant Subsequent EventsNo items to report
8) OthersRefund for withholding tax AGC’s subsidiary in Singapore has claimed a refund for part of the withholding tax related to the dividend paid by AGC’s subsidiary in Taiwan under the Double Taxation Avoidance Agreement between Taiwan and Singapore. The withholding tax was paid to the Taiwan Government from 2014 to 2016. This claim was accepted and the AGC Group received notification of the tax refund on March 10, 2017. The amount of tax refund received was 5,947 million yen, and therefore the income tax expenses in the fiscal year 2017 has decreased.
- 20 -