Embed Size (px)
Citation preview
1
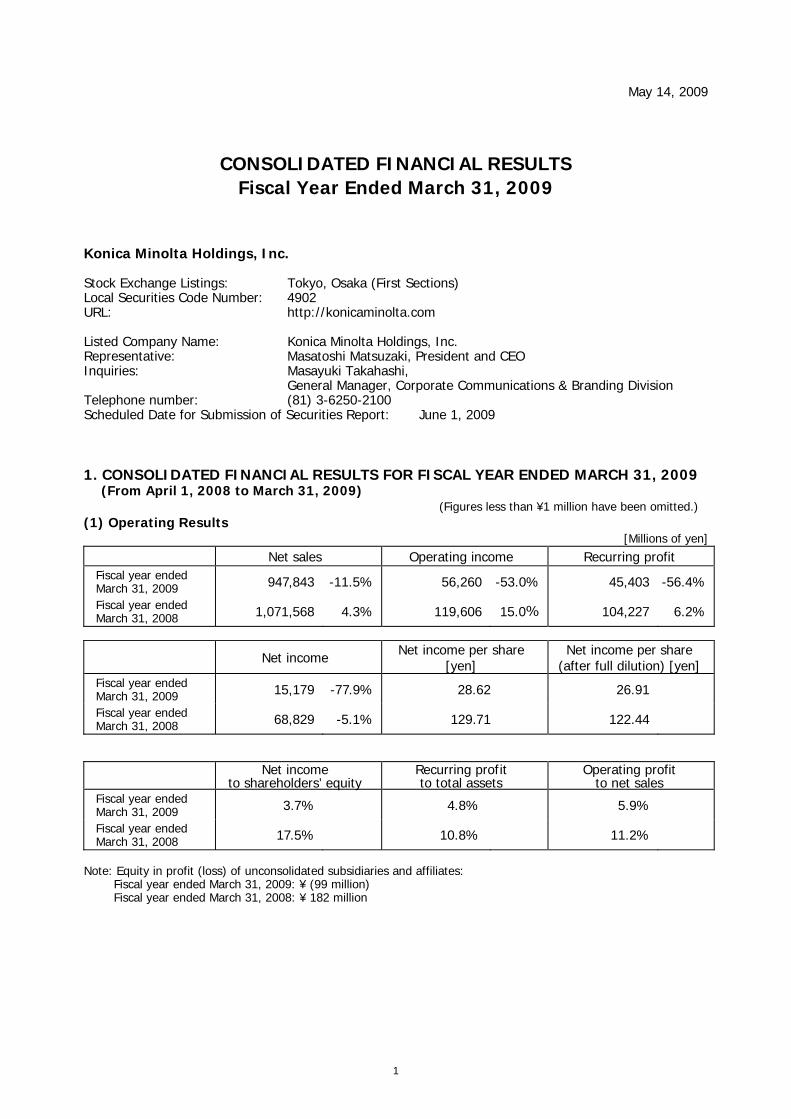
May 14, 2009
CONSOLIDATED FINANCIAL RESULTS
Fiscal Year Ended March 31, 2009
Konica Minolta Holdings, Inc. Stock Exchange Listings: Tokyo, Osaka (First Sections) Local Securities Code Number: 4902 URL: http://konicaminolta.com Listed Company Name: Konica Minolta Holdings, Inc. Representative: Masatoshi Matsuzaki, President and CEO Inquiries: Masayuki Takahashi, General Manager, Corporate Communications & Branding Division Telephone number: (81) 3-6250-2100 Scheduled Date for Submission of Securities Report: June 1, 2009 1. CONSOLIDATED FINANCIAL RESULTS FOR FISCAL YEAR ENDED MARCH 31, 2009
(From April 1, 2008 to March 31, 2009) (Figures less than ¥1 million have been omitted.)
(1) Operating Results [Millions of yen]
Net sales Operating income Recurring profit Fiscal year ended March 31, 2009 947,843 -11.5% 56,260 -53.0% 45,403 -56.4%
Fiscal year ended March 31, 2008 1,071,568 4.3% 119,606 15.0% 104,227 6.2%
Net income Net income per share [yen]
Net income per share (after full dilution) [yen]
Fiscal year ended March 31, 2009 15,179 -77.9% 28.62 26.91
Fiscal year ended March 31, 2008 68,829 -5.1% 129.71 122.44
Net income
to shareholders’ equity Recurring profit to total assets
Operating profit to net sales
Fiscal year ended March 31, 2009 3.7% 4.8% 5.9%
Fiscal year ended March 31, 2008 17.5% 10.8% 11.2%
Note: Equity in profit (loss) of unconsolidated subsidiaries and affiliates: Fiscal year ended March 31, 2009: ¥ (99 million) Fiscal year ended March 31, 2008: ¥ 182 million

2
(2) Financial Position [Millions of yen]
Total assets Net assets Equity ratio Net assets per share [yen]
Fiscal year ended March 31, 2009 918,058 414,284 45.0% 779.53
Fiscal year ended March 31, 2008 970,538 418,310 43.0% 786.20
Notes: Shareholders equity
Fiscal year ended March 31, 2009: ¥ 413,380 million Fiscal year ended March 31, 2008: ¥ 417,166 million
(3) Cash Flows
[Millions of yen]
Operating activities
Investing activities
Financing activities
Cash and cash equivalents year at
end of period Fiscal year ended March 31, 2009 107,563 (90,169) 4,959 133,727
Fiscal year ended March 31, 2008 123,014 (76,815) (10,545) 122,187
2. DIVIDENDS [yen]
Dividends per share 1st Q 2nd Q 3rd Q Year-end Total annual
Fiscal year ended March 31, 2008 -- 7.50 -- 7.50 15.00
Fiscal year ended March 31, 2009 -- 10.00 -- 10.00 20.00
Fiscal year ending March 31, 2010 (Forecasts)
-- 7.50 -- 7.50 15.00
Total dividends (annual)
Dividend pay-out ratio (consolidated)
Net asset-to-dividend ratio (consolidated)
Millions of yen % %
Fiscal year ended March 31, 2008 7,959 11.6 2.0
Fiscal year ended March 31, 2009 10,606 69.9 2.6
Fiscal year ending March 31, 2010 (Forecasts)
46.8
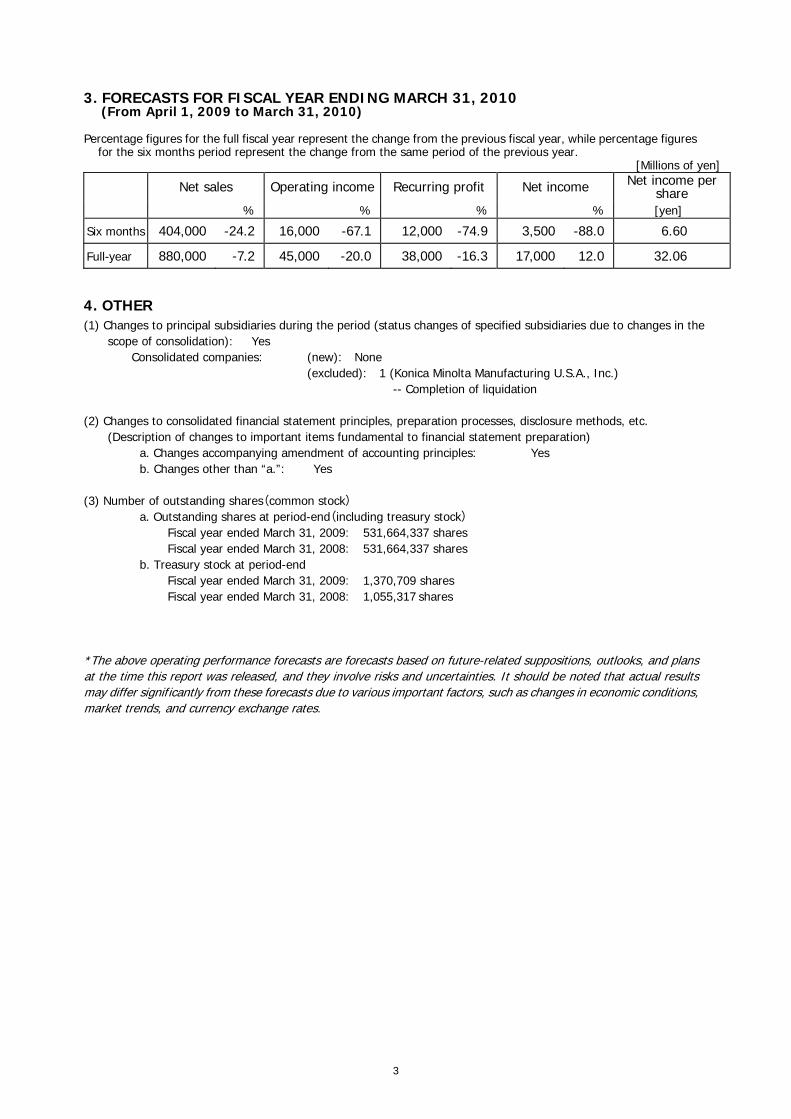
3. FORECASTS FOR FISCAL YEAR ENDING MARCH 31, 2010
(From April 1, 2009 to March 31, 2010) Percentage figures for the full fiscal year represent the change from the previous fiscal year, while percentage figures
for the six months period represent the change from the same period of the previous year. [Millions of yen]
Net sales Operating income Recurring profit Net income Net income per share
% % % % [yen]
Six months 404,000 -24.2 16,000 -67.1 12,000 -74.9 3,500 -88.0 6.60
Full-year 880,000 -7.2 45,000 -20.0 38,000 -16.3 17,000 12.0 32.06
4. OTHER (1) Changes to principal subsidiaries during the period (status changes of specified subsidiaries due to changes in the
scope of consolidation): Yes Consolidated companies: (new): None
(excluded): 1 (Konica Minolta Manufacturing U.S.A., Inc.) -- Completion of liquidation
(2) Changes to consolidated financial statement principles, preparation processes, disclosure methods, etc.
(Description of changes to important items fundamental to financial statement preparation) a. Changes accompanying amendment of accounting principles: Yes b. Changes other than “a.”: Yes (3) Number of outstanding shares(common stock) a. Outstanding shares at period-end(including treasury stock)
Fiscal year ended March 31, 2009: 531,664,337 shares Fiscal year ended March 31, 2008: 531,664,337 shares
b. Treasury stock at period-end Fiscal year ended March 31, 2009: 1,370,709 shares Fiscal year ended March 31, 2008: 1,055,317 shares
*The above operating performance forecasts are forecasts based on future-related suppositions, outlooks, and plans at the time this report was released, and they involve risks and uncertainties. It should be noted that actual results may differ significantly from these forecasts due to various important factors, such as changes in economic conditions, market trends, and currency exchange rates.
3

[Reference] NON-CONSOLIDATED FINANCIAL RESULTS 1. FINANCIAL RESULTS FOR FISCAL YEAR ENDED MARCH 31, 2009
(From April 1, 2007 to March 31, 2008) (1) Operating Results
[Millions of yen] Net sales Operating income Recurring profit
Fiscal year ended March 31, 2009 45,489 -30.6% 13,896 -59.7% 15,551 -57.2%
Fiscal year ended March 31, 2008 65,575 12.7% 34,488 16.1% 36,361 17.3%
Net income Net income per share
[yen] Net income per share
(after full dilution) [yen]
Fiscal year ended March 31, 2009 18,329 -61.8% 34.56 32.52
Fiscal year ended March 31, 2008 47,972 17.0% 90.40 85.30
(2) Financial Position
[Millions of yen]
Total assets Net assets Equity ratio Net assets
per share [yen]
Fiscal year ended March 31, 2009 490,403 268,840 54.7% 506.10
Fiscal year ended March 31, 2008 473,301 263,983 55.7% 496.97
Notes: Shareholders equity
Fiscal year ended March 31, 2009: ¥268,380 million Fiscal year ended March 31, 2008: ¥263,697 million
4

1. Operating Results
(1) Business Performance Analysis
Overview [Billions of yen]
April 1, 2008 –March 31, 2009
April 1, 2007 – March 31, 2008
Increase (Decrease)
Net Sales 947.8 1,071.5 (123.7) -11.5%
Gross profit 427.6 531.3 (103.7) -19.5%
Operating Income 56.2 119.6 (63.3) -53.0%
Recurring profit 45.4 104.2 (58.8) -56.4%
Net income before income taxes and minority interests 33.2 98.9 (65.7) -66.4%
Net income 15.1 68.8 (53.6) -77.9%
Net income per share [yen] 28.62 129.71 (101.09) -77.9%
Capital expenditure 61.1 75.2 14.1 -18.8%
Depreciation 70.1 60.4 9.7 16.1%
R&D expenses 81.7 81.2 0.5 0.6%
Number of employees [person] 36,875 31,717 5,158 16.3%
Exchange rates [yen] US dollar 100.54 114.28 (13.74) -12.0%
Euro 143.48 161.53 (18.05) -11.2%
The Konica Minolta Group has worked as one to achieve sustainable growth and maximize the corporate
value of the Group based on its three-year medium-term business plan FORWARD 08, which was created in May 2006. The Group has effectively implemented the “genre-top strategy,” which calls for concentrating resources in specified fields and growth markets to establish the top brand in those fields, consolidating its position one of the leading companies in color multifunctional peripheral (MFP) products for general-office use and production print applications in the MFP markets of Europe and North America in Business Technologies Business. It has also sought to gain a dominant market share in the markets for VA-TAC film (viewing angle expansion films) used in large LCD TVs and optical pickup lenses used with DVDs in the Optics Business. These strategic products are the drivers of the Group’s growth and in previous fiscal years the Group has achieved consistent performance improvements at a pace exceeding initial projections.
In the fiscal year under review, we continued to adhere to this strategy. In the Business Technologies Business, we launched new products such as general office-use color MFP products and high-speed MFP products for production print applications and endeavored to expand sales in these strategic fields. In addition, as part of a global strategy for further accelerating the growth of MFP business, we aggressively moved forward with collaboration with leading companies outside the Group and acquisitions to expand sales channels, signing a strategic business alliance agreement with Oce N.V., a leading business equipment manufacturer in Europe specializing in high-speed products, in April 2008, and acquiring Danka Office Imaging Company (DOIC), a leading information equipment sales company in North America in June 2008. In the Optics Business, we sought to expand sales of strategic products in which we have a clear competitive edge, energetically marketing new VA-TAC film products and expanding applications for optical pickup lenses used with Blu-Ray Discs.
In contrast, at the beginning of the third quarter, the financial crisis deepened, creating profound implications for the real economy and a sharp drop in global economic activity. The markets in which the Konica Minolta Group operates were also affected. In the Business Technologies Business the number of newly installed MFPs showed slow growth, reflecting restrained investment and cost-cutting by companies and stricter credit checks for new lease contracts due to tight credit markets. The Optics Business faced a
5
sharp drop in orders for the Company’s mainstay products because of the rapid downward adjustment of production volumes by manufacturers in response to a sudden slackening of commercial demand in the digital consumer electronics industry. This rapid worldwide economic downturn had serious repercussions for the business and the performance of the Konica Minolta Group from the third quarter. Moreover, because overseas sales account for a high share of total sales of the Company, the significant appreciation of the yen from the third quarter also dealt a severe blow to the Company’s performance.
Given this dramatic change in the business environment, the Konica Minolta Group took aggressive steps to bolster the profitability of the Group in both the fiscal years ended/ending March 2009 and 2010, seeking to lower the breakeven point through urgent action to enhance its capabilities. This action consisted primarily of steps to improve productivity, slash manufacturing costs, scale back capital investment and reduce selling, general and administrative (SG&A) expenses, and by immediately introducing more far-reaching structural reform measures including the reorganization and integration of domestic production bases in response to contraction in domestic demand, the further acceleration of overseas expansion, and the optimization of the number of offices and staff in overseas sales divisions, including acquired companies.
As a result, Konica Minolta’s consolidated net sales for the fiscal year under review amounted to ¥947.8 billion, a decrease of 11.5% year on year. Though strong during the first two quarters, sales of Konica Minolta’s strategic products such as color MFP products, VA-TAC films and optical pickup lenses used with Blu-Ray discs fell from the beginning of the third quarter due to the sudden slackening of global demand, and the effects of the rapid appreciation of the yen also reduced the Group’s sales by around ¥81.3 billion.
Gross profit fell 19.5% year on year, to ¥427.6 billion. Besides the decrease in sales and negative impact of yen appreciation described above, changes in accounting principles implemented from this fiscal year such as the accounting shift of service expenses from SG&A expenses to the cost of sales by certain of the Business Technologies Business’s sales companies as part of measures to improve the Group’s accounting measures, the accounting shift of losses on the disposal of inventory assets from non-operating expenses to the cost of sales due to the application of new inventory asset evaluation accounting standards, and a rise in depreciation expenses owing to tax system reforms reduced gross profit by around ¥41.3 billion.
SG&A expenses decreased ¥40.3 billion year on year, reflecting the above-mentioned accounting shift of service expenses to the cost of sales as well as benefits of the strengthening of imperative cost reduction measures beginning from the third quarter.
As a result, the Group’s operating income decreased 53.0% year on year, to ¥56.2 billion. Among non-operating income and expense items, foreign exchange losses due to the rapid appreciation
of the yen from the beginning of the third quarter amounted to ¥7.2 billion and as a result the net value of non-operating income and expense items was an expense of ¥10.8 billion.
Consequently, recurring profit fell 56.4% year on year, to ¥45.4 billion. Among extraordinary income and expense items, the Company recorded a gain on the sale of an
affiliate and a gain on the transfer of business in connection with the April 2008 transfer of a subsidiary in the Medical and Graphic Imaging Business Segment – Konica Minolta ID System Co., Ltd. – and related business assets. However, the impact of the downturn in stock prices led to a ¥3.8 billion loss on the valuation of investment securities and the Company recorded business restructuring expenses of ¥10 billion. As a result of this and other factors, the net value of extraordinary income and expense items was an expense of ¥12.1 billion.
Consequently, income before income taxes and minority interests declined 66.4%, to ¥33.2 billion. After deducting income taxes and minority interests, net income for the fiscal year under review decreased 77.9% year on year, to ¥15.1 billion.
6

Segment Information
[Billions of yen] Net sales to outside customers Operating income
Apr. 1, 2008 – Mar. 31, 2009
Apr. 1, 2007 –Mar. 31, 2008
Increase (Decrease)
Apr. 1, 2008 –Mar. 31, 2009
Apr. 1, 2007 – Mar. 31, 2008
Increase (Decrease)
Business Technologies
623.6 700.9 (77.2) -11.0% 52.5 90.0 (37.5) -41.7%
Optics 173.4 182.2 (8.8) -4.9% 12.5 31.2 (18.7) -59.9%
Medical & Graphic
125.8 161.1 (35.2) -21.9% 3.0 7.7 (4.6) -60.3%
Sensing 8.3 9.9 (1.5) -15.3% 0.3 1.2 (0.8) -71.4%
1. Business Technologies Business Regarding general office-use color MFPs, we renewed our bizhub series product lineup during the
previous fiscal year with the introduction of five new models, and we enhanced the line-up’s merchandise competitiveness in the low-to-medium speed market segment with the launch in August 2008 of the strategic bizhub C200 with color printing output capabilities of 20ppm. We focused on expanding sales in the European market, where we have a strong marketing base, and NIC markets in Asia and other regions where demand is expected to increase. As a result, we maintained year-on-year growth in unit sales of color MFPs.
With respect to black-and-white MFPs, we sought to strengthen product competitiveness in the high volume, medium-to-high speed segment, launching five new products.
As for high-speed MFPs for production printing applications, in August 2008 we began marketing two new high-speed color MFP models: the bizhub PRO C5501 and the bizhub PRO C6501. These models offer significantly improved image quality stability and solid mechanical durability. This was followed in February 2009 with the launch of the bizhub PRO C65hc, the industry’s first high-speed color MFP with High Chroma Toner. Moreover, based on the alliance with Oce N.V, in November 2008 we expanded our lineup of high-speed black & white MFP products to include three ultra high-speed models the bizhub PRO 1600P, the bizhub 2000P and the bizhub 2500P with black & white printing output capabilities ranging from 160ppm duplex to 250ppm duplex (duplex printing; printing simultaneously both sides of the page). We worked to leverage these new products to expand the scope of our operations in the production printing market.
In the LBP field, we are focusing on stepping up marketing of products to ordinary offices that anticipate considerable printing volumes. The Group has sought to expand and improve its product line-up, notably with the introduction in June 2008 of the bizhub C31P/magicolor 5670EN, an A4 high-speed, color printer. These high added-value color printer products have been well received by the market and in the fiscal year under review we reported year on year growth in unit sales of color printers.
Consequently, in the Business Technologies Business, the Konica Minolta Group focused on expanding sales of general office-use color MFP products and high-speed MFP products for production printing applications, especially in the markets of Europe and North America, in line with its “genre top strategy.” However, in a global recession sparked by the financial crisis, sales of MFP products were sluggish, particularly from the third quarter onwards, reflecting further reductions in investment and credit tightening. With the rapid appreciation of the yen against other currencies also having the effect of reducing the yen value of sales made by the business, sales of this business to outside customers during the period under review declined 11.0% year on year, to ¥623.6 billion. Operating income fell 41.7%, to ¥52.5 billion, because of reduced sales volume from the third quarter and the negative impact of the strong yen on gross profit, despite intensified cost-saving and cost-cutting efforts in response to the rapid changes taking place in the operating environment.
7
2. Optics Business Display materials:
The Company reported an expansion of market share driven by new VA-TAC film products for large-size LCD TVs, which have been designated a strategic field, and expanded production capacity also contributed to robust growth in sales volume during the first two quarters. Though sales were affected by the rapid downward adjustment of production volumes by LCD panel manufacturers from the third quarter, the Company maintained year-on-year growth in sales volume. Memory-related products:
Sales of mainstay optical pickup lenses were strong during the first two quarters, reflecting the full-start up of business in optical pickup lenses for Blu-ray discs, an area in which we successfully developed products ahead of rivals and have established an overwhelmingly strong market. However, from the third quarter, demand for these and other products dropped sharply and although the Company maintained sales volume comparable with the previous fiscal year for optical pickup lenses used with Blu-ray discs, the volume of sales of current-generation products such as optical lenses used with CDs and DVDs decreased significantly. Glass hard disk substrate business also entered a period of adjustment at the beginning of the fourth quarter and sales volume was unchanged from the previous fiscal year. Image input/output components:
Sales of products such as microcamera modules for camera-equipped mobile phones and zoom lens units for digital cameras were affected by the downward adjustment of production volumes by manufacturers from the third quarter, and generally sales were lackluster.
As a consequence, in the Optics Business, the Konica Minolta Group sought to expand sales of strategic products such as VA-TAC film and optical pickup lenses used with Blu-Ray discs, taking advantage of its clear competitive edge, and sales during the first two quarters remained brisk. Starting in the third quarter, however, orders for these core products fell sharply, affected by the abrupt downward adjustment of production volumes across the entire digital consumer electronics industry. Sales of this business to outside customers slipped 4.9% year on year, to ¥173.4 billion. From the third quarter, which saw an abrupt drop in sales following a strong performance in the first six months, the Group stepped up its structural reform efforts, notably with the optimization of domestic production bases in response to rapidly falling demand, and sought to reduce fixed expenses. Unfortunately, this was not enough to offset the negative impact of the sharp decrease in sales volume and a rise in depreciation expenses as a result of tax system reforms effective from the fiscal year under review. Consequently, Operating income fell 59.9%, to 12.5 billion.
3. Medical and Graphic Imaging Business Medical/healthcare:
We strengthened our marketing of digital radiography input/output equipment/systems. We concentrated on marketing the REGIUS MODEL 110, a compact computed radiography (CR) unit, and its peripheral terminal system. This product responds to the IT needs of clinics and other small medical establishments. These products have become widely accepted both in Japan and overseas. In the fiscal year under review we recorded year-on-year growth in unit sales of CR systems and, as hospitals switch to filmless radiology, these products also helped to expand our new service businesses, such as remote care contracts. Graphic imaging:
We took steps to increase sales of digital printing equipment such as the Pagemaster Pro 6500 on-demand printing system. However, as economic conditions worsened, customers tended to freeze or postpone investment decisions, severely affecting sales of such products.
Consequently, in the Medical and Graphic Imaging Business, the Konica Minolta Group aimed to expand sales of digital printing products, but in both the medical/healthcare and the graphic imaging segments, the contraction in global demand for film products became even more pronounced, and the volume of sales of film products fell sharply. Add to this the negative effect of the strong yen on the yen value of the business’s sales, and sales of this business to outside customers during the period contracted 21.9% year on year, to ¥125.8 billion.
Operating income declined 60.3%, to ¥3.0 billion, reflecting lower gross profit due to lower sales
8
volume for film products, which offset exhaustive cost-cutting efforts.
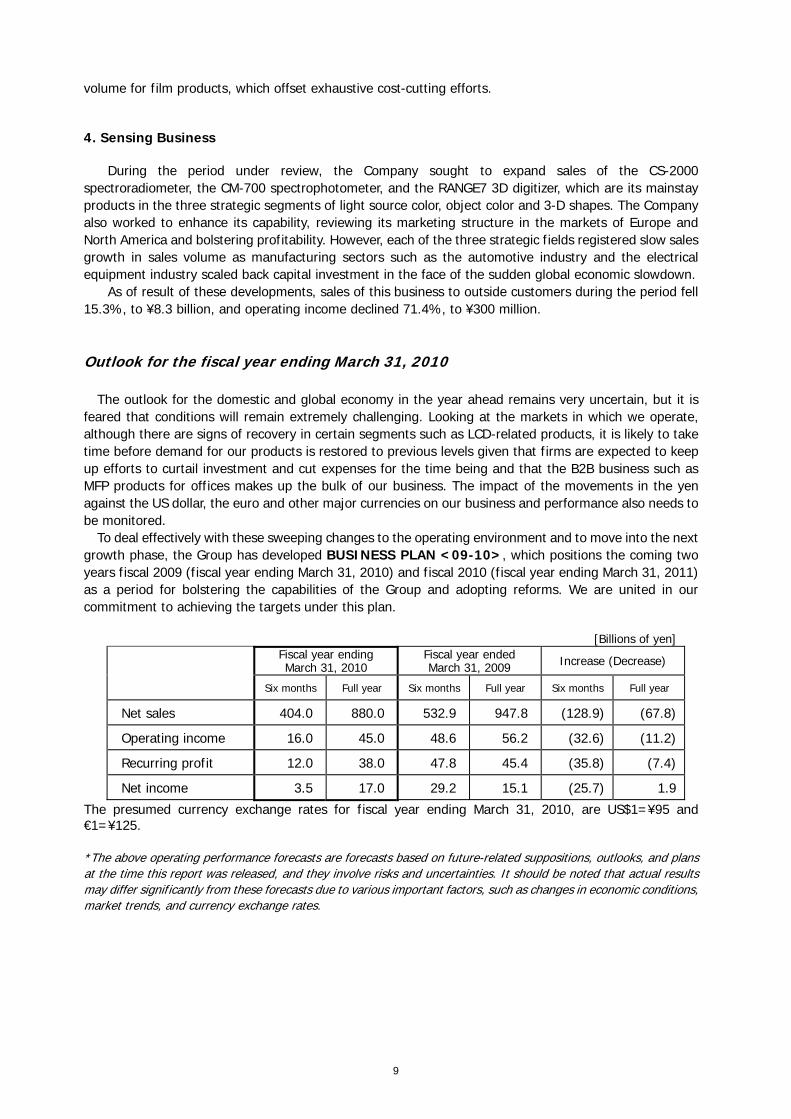
4. Sensing Business
During the period under review, the Company sought to expand sales of the CS-2000
spectroradiometer, the CM-700 spectrophotometer, and the RANGE7 3D digitizer, which are its mainstay products in the three strategic segments of light source color, object color and 3-D shapes. The Company also worked to enhance its capability, reviewing its marketing structure in the markets of Europe and North America and bolstering profitability. However, each of the three strategic fields registered slow sales growth in sales volume as manufacturing sectors such as the automotive industry and the electrical equipment industry scaled back capital investment in the face of the sudden global economic slowdown.
As of result of these developments, sales of this business to outside customers during the period fell 15.3%, to ¥8.3 billion, and operating income declined 71.4%, to ¥300 million.
Outlook for the fiscal year ending March 31, 2010 The outlook for the domestic and global economy in the year ahead remains very uncertain, but it is
feared that conditions will remain extremely challenging. Looking at the markets in which we operate, although there are signs of recovery in certain segments such as LCD-related products, it is likely to take time before demand for our products is restored to previous levels given that firms are expected to keep up efforts to curtail investment and cut expenses for the time being and that the B2B business such as MFP products for offices makes up the bulk of our business. The impact of the movements in the yen against the US dollar, the euro and other major currencies on our business and performance also needs to be monitored.
To deal effectively with these sweeping changes to the operating environment and to move into the next growth phase, the Group has developed BUSINESS PLAN <09-10>, which positions the coming two years fiscal 2009 (fiscal year ending March 31, 2010) and fiscal 2010 (fiscal year ending March 31, 2011) as a period for bolstering the capabilities of the Group and adopting reforms. We are united in our commitment to achieving the targets under this plan.
[Billions of yen]
Fiscal year ending March 31, 2010
Fiscal year ended March 31, 2009 Increase (Decrease)
Six months Full year Six months Full year Six months Full year
Net sales 404.0 880.0 532.9 947.8 (128.9) (67.8)
Operating income 16.0 45.0 48.6 56.2 (32.6) (11.2)
Recurring profit 12.0 38.0 47.8 45.4 (35.8) (7.4)
Net income 3.5 17.0 29.2 15.1 (25.7) 1.9
The presumed currency exchange rates for fiscal year ending March 31, 2010, are US$1=¥95 and €1=¥125. *The above operating performance forecasts are forecasts based on future-related suppositions, outlooks, and plans at the time this report was released, and they involve risks and uncertainties. It should be noted that actual results may differ significantly from these forecasts due to various important factors, such as changes in economic conditions, market trends, and currency exchange rates.
9

(2) Financial Position
Overview
As of
March 31, 2009 As of
March 31, 2008 Increase
(Decrease)
Total assets [Billions of yen] 918.0 970.5 (52.4)
Net assets [Billions of yen] 414.2 418.3 (4.0)
Net assets per share [yen] 779.53 786.20 (6.67)
Equity ratio [%] 45.0 43.0 2.0
At the fiscal year end, total assets amounted to ¥918.0 billion, down ¥52.4 billion compared with the
end of the previous fiscal year. Assets decreased generally, with notes and accounts receivable-trade and notes and accounts payable-trade significantly reduced due to the decline in sales caused by the sharp global economic downturn, tangible fixed assets declined because of the curtailment of capital investment, and the value of investment securities fell with the stock market. Inventory stood at ¥129.1 billion, down ¥3.7 billion from the end of the previous fiscal year, reflecting production adjustments. Interest-bearing debt amounted to ¥230.4 billion, up ¥4.3 billion compared with the end of the previous fiscal year, despite past efforts to reduce the level of debt.
Net assets stood at ¥414.2 billion, down ¥4.0 billion compared with the end of the previous fiscal year. This was partly attributable to a decrease in foreign currency translation adjustments due to yen appreciation and a decrease in net valuation and adjustments owing to stock market decline, despite an increase in retained earnings primarily due to the posting of ¥15.1 billion in net income. Net assets per share came to ¥779.53, and the shareholders’ equity ratio rose 2.0 percentage points from the end of the previous fiscal year to 45.0%. Cash Flows [Billions of yen]
Fiscal year ended March 31, 2009
Fiscal year ended March 31, 2008
Increase (Decrease)
Cash flows from operating activities 107.5 123.0 (15.4)
Cash flows from investing activities (90.1) (76.8) (13.3)
Total [Free cash flow] 17.3 46.1 (28.8)
Cash flows from financing activities 4.9 (10.5) 15.5
Cash flows from operating activities
Net cash flow provided by operating activities amounted to ¥107.5 billion, ¥15.4 billion less than the previous year. The Company reported income before income taxes and minority interests of ¥33.2 billion and depreciation of ¥70.1 billion as well as a ¥36.6 billion rise in operating capital associated with notes and accounts receivable-trade, inventories and notes and accounts payable-trade. These inflows were partially offset by ¥34.6 billion in income taxes and other factors. Cash flows from investing activities
Net cash flow used in investing activities totaled an outflow of ¥90.1 billion, -¥13.3 billion year on year. This was mainly due to expenditures of ¥27.9 billion for acquisition of shares of subsidiaries including the Business Technologies Business’s acquisition of DOIC. It also reflected expenditures of ¥61.6 billion for the acquisition of tangible fixed assets, which included principally investments to increase production capacity for glass hard disk substrates and TAC film in the strategic business field of the Optics Business.
As a result, free cash flow (the sum of operating and investment cash flows) amounted to ¥17.3 billion, ¥28.8 billion less than previous fiscal year). Cash flows from financing activities
Net cash flow provided by financing activities amounted to a net outflow of ¥4.9 billion. This was due
10
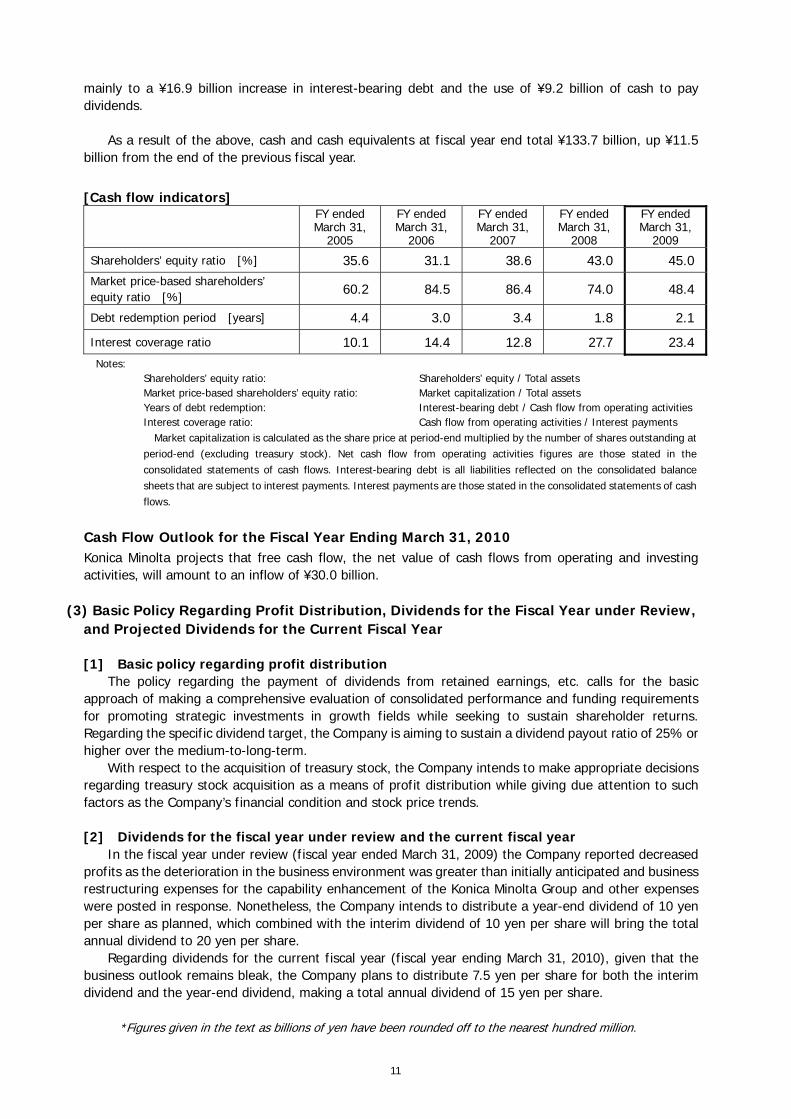
mainly to a ¥16.9 billion increase in interest-bearing debt and the use of ¥9.2 billion of cash to pay dividends.
As a result of the above, cash and cash equivalents at fiscal year end total ¥133.7 billion, up ¥11.5
billion from the end of the previous fiscal year.
[Cash flow indicators]
FY ended March 31,
2005
FY ended March 31,
2006
FY ended March 31,
2007
FY ended March 31,
2008
FY ended March 31,
2009
Shareholders’ equity ratio [%] 35.6 31.1 38.6 43.0 45.0Market price-based shareholders’ equity ratio [%] 60.2 84.5 86.4 74.0 48.4
Debt redemption period [years] 4.4 3.0 3.4 1.8 2.1
Interest coverage ratio 10.1 14.4 12.8 27.7 23.4Notes:
Shareholders’ equity ratio: Shareholders’ equity / Total assets Market price-based shareholders’ equity ratio: Market capitalization / Total assets Years of debt redemption: Interest-bearing debt / Cash flow from operating activities Interest coverage ratio: Cash flow from operating activities / Interest payments
Market capitalization is calculated as the share price at period-end multiplied by the number of shares outstanding at period-end (excluding treasury stock). Net cash flow from operating activities figures are those stated in the consolidated statements of cash flows. Interest-bearing debt is all liabilities reflected on the consolidated balance sheets that are subject to interest payments. Interest payments are those stated in the consolidated statements of cash flows.
Cash Flow Outlook for the Fiscal Year Ending March 31, 2010 Konica Minolta projects that free cash flow, the net value of cash flows from operating and investing activities, will amount to an inflow of ¥30.0 billion.
(3) Basic Policy Regarding Profit Distribution, Dividends for the Fiscal Year under Review, and Projected Dividends for the Current Fiscal Year [1] Basic policy regarding profit distribution
The policy regarding the payment of dividends from retained earnings, etc. calls for the basic approach of making a comprehensive evaluation of consolidated performance and funding requirements for promoting strategic investments in growth fields while seeking to sustain shareholder returns. Regarding the specific dividend target, the Company is aiming to sustain a dividend payout ratio of 25% or higher over the medium-to-long-term.
With respect to the acquisition of treasury stock, the Company intends to make appropriate decisions regarding treasury stock acquisition as a means of profit distribution while giving due attention to such factors as the Company’s financial condition and stock price trends.
[2] Dividends for the fiscal year under review and the current fiscal year
In the fiscal year under review (fiscal year ended March 31, 2009) the Company reported decreased profits as the deterioration in the business environment was greater than initially anticipated and business restructuring expenses for the capability enhancement of the Konica Minolta Group and other expenses were posted in response. Nonetheless, the Company intends to distribute a year-end dividend of 10 yen per share as planned, which combined with the interim dividend of 10 yen per share will bring the total annual dividend to 20 yen per share.
Regarding dividends for the current fiscal year (fiscal year ending March 31, 2010), given that the business outlook remains bleak, the Company plans to distribute 7.5 yen per share for both the interim dividend and the year-end dividend, making a total annual dividend of 15 yen per share.
*Figures given in the text as billions of yen have been rounded off to the nearest hundred million.
11

2. Group Overview The Group comprises the parent company, 105 consolidated subsidiaries, 18 non-consolidated subsidiaries, and 7 affiliates. A chart detailing the business structure follows. Konica Minolta Holdings, Inc Business Technologies Business: 81 Optics Business: 9 (Consolidated Subsidiaries: 63 Unconsolidated Subsidiaries: 14 Affiliates: 4 (Consolidated Subsidiaries: 9)
Production: 9 Production: 7 Konica Minolta Supplies Manufacturing Co., Ltd. Konica Minolta Opto Products Co., Ltd. Toyohashi Precision Products Co., Ltd. Konica Minolta Opto (DALIAN) Co., Ltd. (China) Konica Minolta Business Technologies Manufacturing (H.K.) Ltd. (Hong Kong)
Konica Minolta Optical Products (SHANGHAI) Co., Ltd. (China) Konica Minolta Glass Tech Malaysia Sdn. Bhd. (Malaysia) Konica Minolta Business Technologies (DONGGUAN)
Co., Ltd. (China) Other Companies: 3 Konica Minolta Business Technologies (WUXI) Co., Ltd ↓ (China) Konica Minolta Opto, Inc. ↓ Other Companies: 4 Sales: 1 Konica Minolta Opto (SHANGHAI) Co., Ltd. (China)
↓ Konica Minolta Business Technologies, Inc. Medical and Graphic Imaging Business: 17
↓ (Consolidated Subsidiaries: 1, Unconsolidated Subsidiaries: 3, Affiliates: 2) Sales: 71
Konica Minolta Business Solutions Japan Co., Ltd. Production: 4 Konica Minolta Business Solutions U.S.A., Inc. (U.S.A) Konica Minolta Technoproducts Co., Ltd. Konica Minolta Business Solutions Europe GmbH (Germany)
Konica Minolta Repro Co., Ltd.
Konica Minolta Business Solutions Deutschland GmbH (Germany)
Other Companies: 2
Konica Minolta Business Solutions (UK) Ltd. (U. K.) Konica Minolta Business Solutions France S.A.S. (France)
↓
Konica Minolta Business Solutions Australia Pty. Ltd. Konica Minolta Medical & Graphic , Inc. (Australia) ↓ Konica Minolta Business Solutions (CHINA) Co., Ltd. Sales: 12 (China) Konica Minolta Health Care Co., Ltd. Other Companies: 63 Konica Minolta Graphic Imaging Japan Co., Ltd
Konica Minolta Medical Imaging U.S.A., Inc. (U.S.A.) Konica Minolta Graphic Imaging U.S.A., Inc. (U.S.A.)
Sensing Business: 4 (Consolidated Subsidiaries: 4) Other Companies: 8
Konica Minolta Sensing, Inc. Sales: 3 Konica Minolta Sensing Europe B.V. (Netherlands) Konica Minolta Sensing Americas, Inc. (U.S.A) Other Businesses: 19 Konica Minolta Sensing Singapore, Pte.Ltd. (Singapore) (Consolidated Subsidiaries: 17 Unconsolidated Subsidiaries: 1 Affiliates: 1)
Konica Minolta Photo Imaging, Inc. Konica Minolta Technology Center, Inc.
Konica Minolta Business Expert, Inc. Konica Minolta IJ Technologies, Inc.
Konica Minolta Logistics Co., Ltd. Konica Minolta Sogo Service Co., Ltd. Konica Minolta Engineering Co., Ltd.
Konica Minolta Information System Co., Ltd. Konica Minolta Technosearch Co., Ltd. Konica Minolta Planetarium Co., Ltd.
Notes: Organization chart is as March 31, 2008. Only major consolidated subsidiaries are shown.
Other Companies: 9
12
3. Management Policy
(1) Basic Management Policy Management philosophy: “The creation of new value” Management visions: “An innovative corporation that continues to create inspiring products and services in the field of imaging” “A global corporation that leads the market by
advanced technologies and reliability” Corporate Message: “The essentials of imaging” (Means providing the essentials to customers and being recognized as an essential company in the imaging world.)
(2) Medium-to Long-Term Management Strategies and Pending Issues The Konica Minolta Group views the dramatic changes to the operating environmental now taking place
not as a cyclical economic slowdown but as a major turning point that is going to leave nothing unchanged. If anything, we see this time of rapid change as a chance to strengthen our position, and we are taking steps to find a new and more robust direction that will lead to growth. The Group has produced BUSINESS PLAN <09-10>, which positions the coming two years fiscal 2009 (fiscal year ending March 31, 2010) and fiscal 2010 (fiscal year ending March 31, 2011) as the period for such measures and adopts three basic strategies: (1) Improving corporate capabilities, (2) Achieving strong growth and, (3) Reforming the corporate culture. The new plan is outlined below.
Basic Strategies of the BUSINESS PLAN<09-10> 1. Enhancement of corporate capabilities
We believe that during fiscal 2009, when the economic environment is expected to remain as challenging as in the third and fourth quarters of the period under review, we must urgently improve our corporate capabilities to be capable of consistently generating free cash flow without relying on growth in sales. To achieve this we are focusing our efforts on (1) measures to reduce fixed costs, notably the implementation of structural reforms and the adoption of expense management, (2) measures to slim down the balance sheet and generate free cash flow by means such as scaling back inventories and pushing for improvements in accounts receivable/accounts payable terms, and (3) measures to improve business profitability through assessment of the existing businesses and concentrate on key businesses.
Moreover, the Group sees (4) measures to enhance environmental management as an important management issue and will aim to become a corporate group that makes the environment the focus point of competitiveness for growth. We will implement measures that place us in the top class companies in the industry, including offering products incorporating environmental technologies, production processes that apply environmental technologies and compliance with environmental programs in all our operations, and we will also work to create environmentally-conscious new businesses. 2. Achievement of strong growth
For the Konica Minolta Group to be an agile company that does not miss opportunities and can find its growth trajectory in the recovery phase that is bound to come, it must have core growth-driving businesses. To do this, it is important to further strengthen its existing businesses and at the same time to create new core businesses that will be the next growth drivers.
1) Strengthening of existing businesses
Regarding existing businesses, the Group aims to further consolidate its current position and expand business by advancing the “genre top” products through selection and concentration and further honing the Group’s current strengths to build them into an overwhelming advantage. To achieve this, in the Business Technologies Business the Group is moving forward measures to enhance its competitiveness in the field of color MFPs for offices and MFPs for production print applications. In the Optics Business we are focusing on measures such as the marketing of next-generation products and entry into new
13
14
areas in the display materials field and drastic improvement of cost competitiveness in the lens-related product field. 2) Development of new businesses
Regarding new businesses, the Group is taking steps to enable the early launch of new businesses involving the advanced application and combination of the Group’s core technologies in the material field, the optical field, the nano-fabrication field and the image processing field, and for the development of these new businesses into the pillars of profit of next-generation business. More specifically, in the areas of Environment & Energy and Health, Security & Safety, where public demand continues to rise, the Group will develop new businesses that harness its strengths and offer products unique to the Konica Minolta Group. Through these businesses the Group will not only make a considerable contribution to society but will also become a more indispensable company. To step up these actions, the Company also intends to actively exploit collaboration with companies outside the Group. In the “Environment & Energy” field, the Group is now preparing to start up organic light emitting diode (OLED) lighting business based on a strategic alliance with US-based General Electric Company (GE) during fiscal 2010 (fiscal year ending March 31, 2011).
3. Reform of corporate culture
To overcome the dramatic changes in the business environment we are now facing and to survive the global competition, the Group needs to create a vibrant corporate culture that enables it to overcome difficulties while at the same time producing constant innovations and being the driving force behind a paradigm shift. The Group has condensed its determination to achieve this into the slogan “simply BOLD” (= challenges born of courage and daring ideas) and is reforming corporate culture and awareness at all Group companies worldwide. Alongside this, the Group is reforming its personnel programs and organizational management to train and deploy global human resources with autonomy and a bold spirits. In doing so, it is creating a new Konica Minolta.
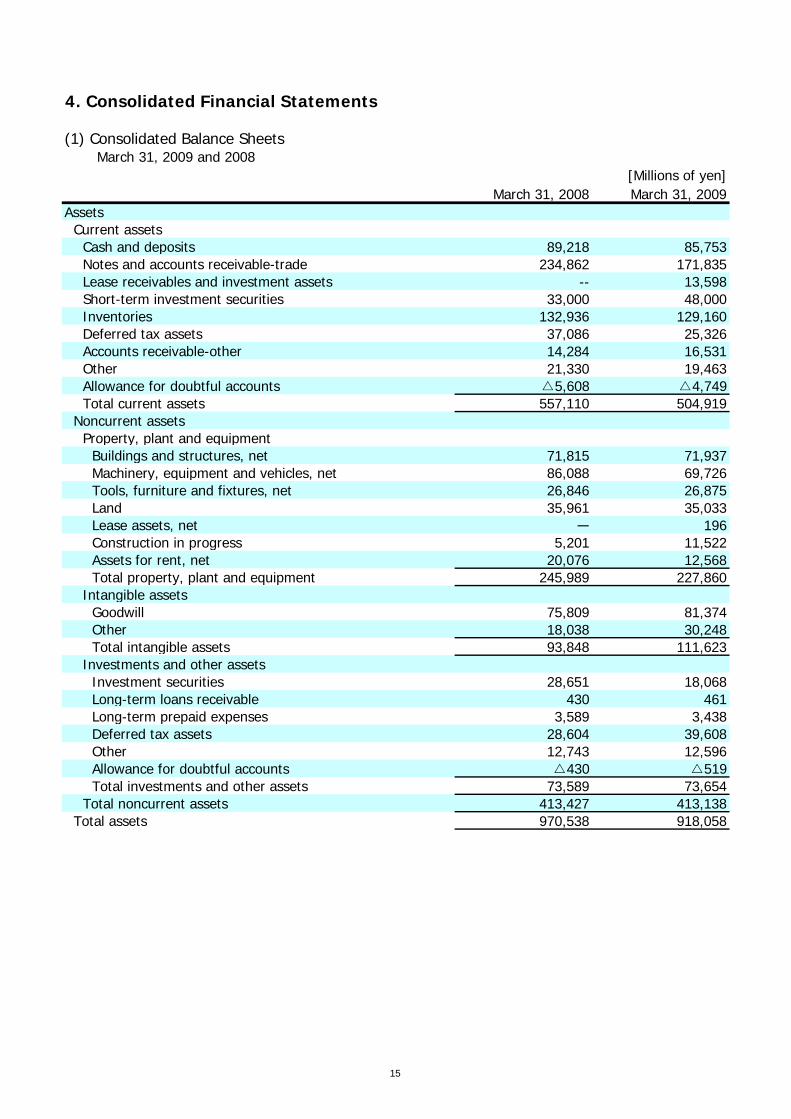
4. Consolidated Financial Statements
(1) Consolidated Balance SheetsMarch 31, 2009 and 2008
[Millions of yen]March 31, 2008 March 31, 2009
Assets Current assets Cash and deposits 89,218 85,753 Notes and accounts receivable-trade 234,862 171,835 Lease receivables and investment assets -- 13,598 Short-term investment securities 33,000 48,000 Inventories 132,936 129,160 Deferred tax assets 37,086 25,326 Accounts receivable-other 14,284 16,531 Other 21,330 19,463 Allowance for doubtful accounts △5,608 △4,749 Total current assets 557,110 504,919 Noncurrent assets Property, plant and equipment Buildings and structures, net 71,815 71,937 Machinery, equipment and vehicles, net 86,088 69,726 Tools, furniture and fixtures, net 26,846 26,875 Land 35,961 35,033 Lease assets, net ― 196 Construction in progress 5,201 11,522 Assets for rent, net 20,076 12,568 Total property, plant and equipment 245,989 227,860 Intangible assets Goodwill 75,809 81,374 Other 18,038 30,248 Total intangible assets 93,848 111,623 Investments and other assets Investment securities 28,651 18,068 Long-term loans receivable 430 461 Long-term prepaid expenses 3,589 3,438 Deferred tax assets 28,604 39,608 Other 12,743 12,596 Allowance for doubtful accounts △430 △519 Total investments and other assets 73,589 73,654 Total noncurrent assets 413,427 413,138 Total assets 970,538 918,058
15

[Millions of yen]March 31, 2008 March 31, 2009
Liabilities Current liabilities Notes and accounts payable-trade 109,413 87,105 Short-term loans payable 93,875 64,980 Current portion of long-term loans payable 6,363 12,102 Current portion of bonds 5,000 30,066 Accounts payable-other 54,286 36,443 Accrued expenses 33,355 27,770 Income taxes payable 16,449 2,534 Provision for bonuses 15,121 11,736 Provision for directors' bonuses 257 85 Provision for product warranties 4,342 2,496 Provision for loss on business liquidation 11,727 7,268 Notes payable-facilities 2,070 2,444 Other 13,307 25,853 Total current liabilities 365,570 310,889 Noncurrent liabilities Bonds payable 70,166 40,000 Long-term loans payable 50,620 83,259 Deferred tax liabilities for land revaluation 4,010 3,889 Provision for retirement benefits 53,367 57,962 Provision for directors' retirement benefits 544 534 Other 7,946 7,238 Total noncurrent liabilities 186,656 192,884 Total liabilities 552,227 503,773Net assets Shareholders' equity Capital stock 37,519 37,519 Capital surplus 204,140 204,140 Retained earnings 176,684 185,453 Treasury stock △1,340 △1,662 Total shareholders' equity 417,003 425,451 Valuation and translation adjustments Valuation difference on available-for-sale securities 2,913 △513 Deferred gains or losses on hedges △319 198 Foreign currency translation adjustment △2,431 △11,755 Total valuation and translation adjustments 162 △12,070 Subscription rights to shares 286 460 Minority interests 858 444 Total net assets 418,310 414,284Total liabilities and net assets 970,538 918,058
16

(2) Consolidated Statements of IncomeFor the fiscal years ended March 31, 2009 and 2008
[Millions of yen]March 31
2008 2009Net sales 1,071,568 947,843Cost of sales 540,225 520,206Gross profit 531,343 427,637Selling, general and administrative expenses 411,736 371,376Operating income 119,606 56,260Non-operating income Interest income 2,227 1,655 Dividends income 415 520 Equity in earnings of affiliates 182 ― Other 7,766 5,748 Total non-operating income 10,592 7,925Non-operating expenses Interest expenses 4,465 4,866 Loss on abandonment of inventories 7,065 ― Equity in losses of affiliates ― 99 Foreign exchange losses 7,637 7,272 Other 6,801 6,544 Total non-operating expenses 25,970 18,782Ordinary income 104,227 45,403Extraordinary income Gain on sales of noncurrent assets 1,308 249 Gain on sales of investment securities 20 6 Gain on sales of subsidiaries and affiliates' stocks 47 2,803 Licence Related Income 8,080 560 Gain on transfer of business ― 3,063 Reversal of provision for loss on business liquidation 590 932 Other ― 458 Total extraordinary income 10,047 8,073Extraordinary loss Loss on sales and retirement of noncurrent assets 4,533 3,115 Loss on sales of investment securities 0 0 Loss on valuation of stocks of subsidiaries and affiliates 54 ― Loss on valuation of investment securities 313 3,826 Impairment loss 5,702 1,168 Loss on litigation 625 ― Environmental expenses 1,856 ― Special extra retirement payments 460 ― Extraordinary Loss in Foreign Subsidiaries 1,731 ― Business structure improvement expenses ― 10,094 Loss on revision of retirement benefit plan ― 2,046 Total extraordinary losses 15,278 20,252Income before income taxes and minority interests 98,996 33,224Income taxes-current 29,496 13,183Income taxes-deferred 544 4,857Total income taxes 30,040 18,040Minority interests in income 126 5Net income 68,829 15,179
17

(3) Consolidated Statements of Changes in Net AssetsFor the fiscal years ended March 31, 2009 and 2008
[Millions of yen]March 31
2008 2009Shareholders' equity Capital stock Balance at the end of previous period 37,519 37,519 Changes of items during the period Total changes of items during the period ― ― Balance at the end of current period 37,519 37,519 Capital surplus Balance at the end of previous period 204,143 204,140 Changes of items during the period Disposal of treasury stock △2 ― Total changes of items during the period △2 ― Balance at the end of current period 204,140 204,140 Retained earnings Balance at the end of previous period 115,704 176,684 Effect of changes in accounting policies applied to foreign subsidiaries ― 5,210 Changes of items during the period Dividends from surplus △9,287 △9,283 Net income 68,829 15,179 Change of scope of consolidation 405 96 Disposal of treasury stock △28 △117 Amortization of net retirement benefit obligation in foreign subsidiaries 1,059 △2,316 Total changes of items during the period 60,979 3,558 Balance at the end of current period 176,684 185,453 Treasury stock Balance at the end of previous period △1,097 △1,340 Changes of items during the period Purchase of treasury stock △289 △665 Disposal of treasury stock 46 343 Total changes of items during the period △242 △321 Balance at the end of current period △1,340 △1,662 Total shareholders' equity Balance at the end of previous period 356,269 417,003 Effect of changes in accounting policies applied to foreign subsidiaries ― 5,210 Changes of items during the period Dividends from surplus △9,287 △9,283 Net income 68,829 15,179 Change of scope of consolidation 405 96 Purchase of treasury stock △289 △665 Disposal of treasury stock 16 226 Amortization of net retirement benefit obligation in foreign subsidiaries 1,059 △2,316 Total changes of items during the period 60,734 3,236 Balance at the end of current period 417,003 425,451
18

[Millions of yen]March 31
2008 2009Valuation and translation adjustments Valuation difference on available-for-sale securities Balance at the end of previous period 7,454 2,913 Changes of items during the period Net changes of items other than shareholders' equity △4,541 △3,426 Total changes of items during the period △4,541 △3,426 Balance at the end of current period 2,913 △513 Deferred gains or losses on hedges Balance at the end of previous period △90 △319 Changes of items during the period Net changes of items other than shareholders' equity △228 517 Total changes of items during the period △228 517 Balance at the end of current period △319 198 Foreign currency translation adjustment Balance at the end of previous period 3,834 △2,431 Changes of items during the period Net changes of items other than shareholders' equity △6,266 △9,323 Total changes of items during the period △6,266 △9,323 Balance at the end of current period △2,431 △11,755 Total valuation and translation adjustments Balance at the end of previous period 11,198 162 Changes of items during the period Net changes of items other than shareholders' equity △11,036 △12,232 Total changes of items during the period △11,036 △12,232 Balance at the end of current period 162 △12,070Subscription rights to shares Balance at the end of previous period 108 286 Changes of items during the period Net changes of items other than shareholders' equity 177 174 Total changes of items during the period 177 174 Balance at the end of current period 286 460Minority interests Balance at the end of previous period 1,048 858 Changes of items during the period Net changes of items other than shareholders' equity △189 △414 Total changes of items during the period △189 △414 Balance at the end of current period 858 444Total net assets Balance at the end of previous period 368,624 418,310 Effect of changes in accounting policies applied to foreign subsidiaries ― 5,210 Changes of items during the period Dividends from surplus △9,287 △9,283 Net income 68,829 15,179 Change of scope of consolidation 405 96 Purchase of treasury stock △289 △665 Disposal of treasury stock 16 226 Amortization of net retirement benefit obligation in foreign subsidiaries 1,059 △2,316 Net changes of items other than shareholders' equity △11,048 △12,473 Total changes of items during the period 49,686 △9,236 Balance at the end of current period 418,310 414,284
19

(4) Consolidated Statements of Cash FlowFor the fiscal years ended March 31, 2009 and 2008
[Millions of yen]March 31
2008 2009Net cash provided by (used in) operating activities Income before income taxes and minority interests 98,996 33,224 Depreciation and amortization 60,443 70,179 Impairment loss 5,702 1,168 Amortization of goodwill 7,171 8,909 Increase (decrease) in allowance for doubtful accounts 780 △131 Interest and dividends income △2,643 △2,176 Interest expenses 4,465 4,866 Loss (gain) on sales and retirement of noncurrent assets 3,224 2,866 Loss (gain) on sales and valuation of investment securities 293 3,820 Loss (gain) on sales and valuation of subsidiaries/affiliates' stocks 6 △2,803 Licence related income △8,080 ― Reversal of loss on business liquidation △590 ― Loss on litigation 625 ― Environmental expenses 1,856 ― Extra Retirement Payment 460 ― Extraordinary Loss In Foreign Subsidiaries 1,731 ― Loss (gain) on transfer of business ― △3,063 Increase (decrease) in provision for retirement benefits △4,462 5,708 Increase (decrease) in provision for loss on business liquidation △16,370 △4,459 Decrease (increase) in notes and accounts receivable-trade 11,157 50,596 Decrease (increase) in inventories △6,422 △3,550 Increase (decrease) in notes and accounts payable-trade △2,027 △10,372 Increase (decrease) in accrued consumption taxes 904 △919 Reversal of Accumulated impairment loss on leased assets △171 △106 Transfer of Assets for rent △11,847 △7,419 Other, net 7,468 △1,399 Subtotal 152,674 144,939 Interest and dividends income received 2,681 2,000 Interest expenses paid △4,444 △4,594 Payments for extra retirement payments △355 △105 Income taxes paid △27,543 △34,676 Net cash provided by (used in) operating activities 123,014 107,563
20
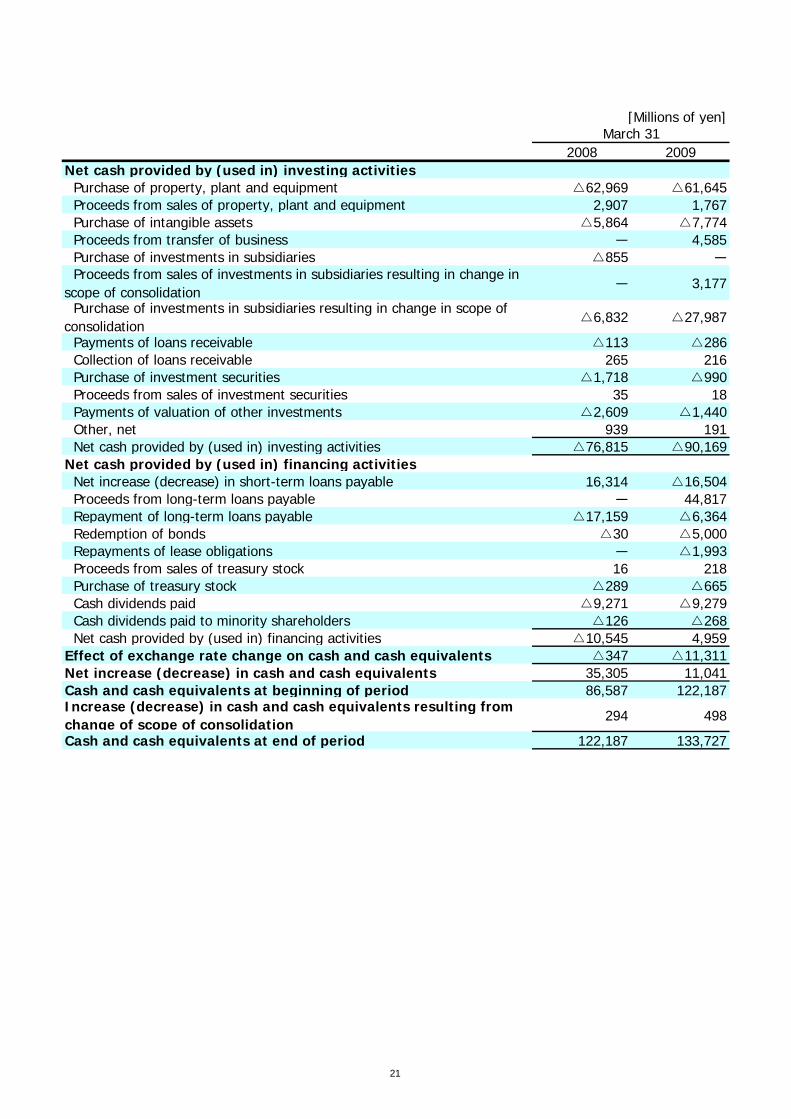
[Millions of yen]March 31
2008 2009Net cash provided by (used in) investing activities Purchase of property, plant and equipment △62,969 △61,645 Proceeds from sales of property, plant and equipment 2,907 1,767 Purchase of intangible assets △5,864 △7,774 Proceeds from transfer of business ― 4,585 Purchase of investments in subsidiaries △855 ― Proceeds from sales of investments in subsidiaries resulting in change inscope of consolidation
― 3,177
Purchase of investments in subsidiaries resulting in change in scope ofconsolidation
△6,832 △27,987
Payments of loans receivable △113 △286 Collection of loans receivable 265 216 Purchase of investment securities △1,718 △990 Proceeds from sales of investment securities 35 18 Payments of valuation of other investments △2,609 △1,440 Other, net 939 191 Net cash provided by (used in) investing activities △76,815 △90,169Net cash provided by (used in) financing activities Net increase (decrease) in short-term loans payable 16,314 △16,504 Proceeds from long-term loans payable ― 44,817 Repayment of long-term loans payable △17,159 △6,364 Redemption of bonds △30 △5,000 Repayments of lease obligations ― △1,993 Proceeds from sales of treasury stock 16 218 Purchase of treasury stock △289 △665 Cash dividends paid △9,271 △9,279 Cash dividends paid to minority shareholders △126 △268 Net cash provided by (used in) financing activities △10,545 4,959Effect of exchange rate change on cash and cash equivalents △347 △11,311Net increase (decrease) in cash and cash equivalents 35,305 11,041Cash and cash equivalents at beginning of period 86,587 122,187Increase (decrease) in cash and cash equivalents resulting fromchange of scope of consolidation
294 498
Cash and cash equivalents at end of period 122,187 133,727
21

5. Note on the Premise of Going Concern No relevant items occurred during fiscal year ended March 31, 2009
6. Basis of Presenting Consolidated Financial Statements
[1] Scope of Consolidation Number of consolidated subsidiaries: 105
Principal consolidated subsidiaries: Konica Minolta Business Technologies, Inc. Konica Minolta Opto, Inc. Konica Minolta Medical & Graphic, Inc. Konica Minolta Sensing, Inc. Konica Minolta Photo Imaging, Inc. Konica Minolta Techonology Center, Inc. Konica Minolta Business Expert, Inc. Konica Minolta IJ Technologies, Inc.
Konica Minolta Business Solutions Japan Co., Ltd. Konica Minolta Health Care Co., Ltd. Konica Minolta Supplies Manufacturing Co., Ltd. Konica Minolta Business Solutions U.S.A., Inc. Konica Minolta Business Solutions Europe GmbH Konica Minolta Business Technologies
Manufacturing (HK) Ltd.
Unconsolidated subsidiaries have not been included in consolidation because they are relatively small and their assets, sales, net income, and retained earnings (in proportion to scale of equity ownership) do not have no material influence on consolidated financial statement.
[2] Scope of the Use of Equity Accounting Number of unconsolidated subsidiaries accounted for by the equity method: 6
Principal unconsolidated subsidiaries: ECS Buero-und Datensysteme GmbH Number of affiliates accounted for by the equity method: 3
The total net income and retained earnings of equity-method non-consolidated subsidiaries and affiliates were of small scale and had negligible effect on consolidated financial statements. Therefore they have been excluded from the scope of the equity method.
[3] Changes Regarding Consolidated Subsidiaries during the Fiscal Year under Review Some consolidated subsidiaries have fiscal years ending on December 31, and consolidated financial statements are prepared using the financial statements of those companies as of that fiscal year-end date. Adjustments are made to consolidated accounts to account for important transactions involving those companies that occur between the end of those companies’ fiscal year-end date and the end of the consolidated fiscal year. (Consolidated Subsidiaries with Fiscal Years Ending on December 31) Konica Minolta Business Solutions do Brazil Ltda. Konica Minolta Business Solutions de Mexico SA de CV. Konica Minolta Business Solutions Romania s.r.l. Konica Minolta Business Solutions Russia LLC Konica Minolta Business Solutions (Shenzhen) Co., Ltd. Konica Minolta Medical Systems Russia Konica Minolta Medical & Graphic (SHANHAI) Co., Ltd. (Change to Accounting Policy) Among consolidated subsidiaries, Veenman Deutschland GmbH has fiscal year ending on December 31, and consolidated financial statements were previously prepared using the financial statements of that company as of that fiscal year-end date. Adjustments were previously made to consolidated accounts to account for important transactions involving that company that occur between the end of that company’s fiscal year-end date and the end of the consolidated fiscal year.
22

To increase the appropriateness of consolidated accounting information, however, the Company has from the fiscal year under review shifted to a new consolidated accounting method for that company. From the fiscal year under review, that company prepares provisional financial statements for hypothetical fiscal years ending March 31, and these provisional financial statements are used to prepare consolidated financial statements. Because of this change, during the fiscal year under review, which is the transitional fiscal year, the hypothetical fiscal years of this company cover the 15-month period from January 1, 2008, through March 31, 2009. Also, Konica Minolta Business Solutions Greece S.A., which had a fiscal year ending on December 31, changed its fiscal year-end date to March 31 on being made into a consolidated subsidiary. Because of this change, the results of Konica Minolta Business Solutions Greece S.A. are the results for the 15-month period from January 1, 2008, through March 31, 2009.
[4] Accounting Standards and Methods (1) Asset valuation
1. Securities
Other securities Securities with fair market value are stated using the mark-to-market method based on the market price at the balance sheet date. (Total net unrealized gains or losses after tax effect adjustments are directly recorded in shareholders' equity, and the cost of securities sold is computed based on the moving-average method.) Other securities that do not have fair market values are primarily stated at cost using the moving value average.
2. Derivatives Derivatives are stated using the mark-to-market method.
3. Inventories Domestic consolidated subsidiaries’ inventories are, in the main, recorded at cost as determined by the periodic-average method (method of reducing book value when the contribution of inventories to profitability declines). Overseas consolidated subsidiaries’ inventories are, in the main, recorded at the lower of cost or market value, with cost determined by the first-in, first-out method. [Change to Accounting Policy] Beginning with the fiscal year under review, “Accounting Standards for Measurement of Inventories” (No.9, issued by The Accounting Standards Board of Japan (ASBJ) on July 5, 2006) has been applied to domestic consolidated subsidiaries, and the main method of measurement of inventories was changed from the cost method determined by the periodic-average method to the cost method (method of reducing book value when the contribution of inventories to profitability declines), where cost is determined by the periodic-average method. As a result, compared with the previous method, the introduction of the new method had the effect of decreasing both gross profit and operating income for the fiscal year under review by ¥3,644 million and of decreasing both recurring profit and income before income taxes and minority interests by ¥865 million.
Please note that the impact of this accounting change by business segment is shown in the respective segment information sections. (2) Amortization Method for Important Depreciable Assets
1. Tangible Fixed Assets (excluding lease assets)
The depreciable assets of the Company and its domestic consolidated subsidiaries are depreciated using the declining-balance method. Overseas consolidated subsidiaries adopt the straight-line method. However, the Company and its domestic consolidated subsidiaries have used the straight-line method for their buildings (excluding annexed structures) acquired since April 1, 1998.
23

[Additional Information] Accompanying revisions in Japan's Corporate Tax Law (as contained in the Law Revising a Portion of the Income Tax Law, April 30, 2008, Law No. 23), the Company and its domestic consolidated subsidiaries reviewed the useful life and classification of depreciable assets, and, with respect to mechanical device, have shifted to the use of the post-revision method of amortizing assets over the applicable useful life and classification of those assets beginning with the fiscal year under review. As a result, compared with the method used in the previous fiscal year, the introduction of the new method had the effect of decreasing operating income, recurring profit, and net income before income taxes and minority interests by ¥6,587 million each during the fiscal year under review. Please note that the impact of this accounting change by business segment is shown in the respective segment information sections.
2. Intangible fixed assets We have adopted the straight-line method based on an estimated in-house working life of five years for the software we use.
3. Lease Assets
Lease assets arising from finance lease transactions that do not transfer of ownership Depreciation is computed using the straight-line method based on the assumption that the useful life equals the lease term and the residual value equals zero. Finance lease transactions not involving transfer of ownership commencing on or before March 31, 2008 are accounted for based on methods applicable to ordinary rental transactions.
(3) Standards for Key Allowances
1. Allowance for doubtful accounts To prepare for possible losses on uncollectable receivables, for general receivables, an amount is provided according to the historical percentage of uncollectables. For specific receivables for which there is some concern regarding collectability, an estimated amount is recorded by investigating the possibility of collection for each individual account.
2. Allowance for bonuses
To prepare for the payment of employee bonuses, an amount corresponding to the current portion of estimated bonus payments to employees is recorded.
3. Allowance for director’s bonus
To prepare for the payment of directors’ bonuses, an amount corresponding to the projected value of bonus payments to directors for the fiscal year under review is recorded.
4. Allowance for product warranty
The provisioning of free after-sales service for products is recorded based on past after-sales service expenses as a percentage of net sales.
5. Allowance for loss on withdrawal from operation
To provide for losses when the Company exits a business, provisions to this reserve are made in the amount of the estimated losses.
6. Reserve for retirement benefits and pension plans
In order to provide employee retirement benefits, the Company records an amount based on projected benefit obligations and pension assets at the end of the consolidated fiscal year under review. Prior service cost is being amortized as incurred by the straight-line method over certain periods (principally 10 years) which are shorter than the average remaining years of service of the employees at the time when the service cost is generated. Actuarial gains and losses are being
24

amortized in the fiscal year following the fiscal year in which the gains or losses are recognized, by the straight line method over periods (principally 10 years) which are shorter than the average remaining years of service of the employees at the time when they are generated.
7. Reserve for directors’ retirement benefits Consolidated subsidiaries, to provide for the payment of directors’ retirement benefits, record reserve for benefits for retired directors and auditors in an actual amount equal to the need at the end of the year period under review based on the Company’s regulations.
(4) Principal accounting methods for hedge transactions
1. Hedge accounting methods The deferred hedge method is used. Special accounting methods are used for interest rate swaps.
2. Hedge methods and hedge targets The hedge methods are forward exchange contracts, and interest rate swaps that meet certain conditions. The hedge targets are scheduled foreign currency denominated transactions, corporate bonds, and borrowings.
3. Hedge policy The Company and consolidated subsidiaries enter into forward foreign exchange contracts as hedging instruments only, not for trading purpose to make profits, within the limit of actual foreign transactions to reduce risk arising from future fluctuations of foreign exchange rates. In addition, the Company and consolidated subsidiaries enter into interest rate swaps to make interest rates on bonds and borrowings stable or reduce costs fluctuations for future capital procurement, both as hedging instruments only, not for speculation purpose, within the limit of actual financial or operating transactions.
4. Methods for evaluating the effectiveness of hedges Verification is made to ascertain a high correlation between value fluctuations of cash flows and hedging instruments.
(5) Other important items regarding the preparation of consolidated financial statements 1. Consumption tax
The tax-exclusion method is used to account for consumption taxes. In addition, asset-related consumption tax that cannot be excluded is accounted for as deferred consumption taxes, etc., in the long-term prepaid expenses item and amortized over a five-year period by the straight-line method.
2. Consolidated tax payment system
The consolidated tax payment system is applied.
[5] Valuation of consolidated subsidiary’s assets and liabilities The market value method is used to value the assets and liabilities of consolidated subsidiaries.
[6] Amortization of consolidation goodwill
Amortization of goodwill is carried out separately for each goodwill item over a rational time period of 20 years or less.
[7] Range of cash within consolidated cash flow statements Cash (cash and cash equivalents) in the consolidated cash flow statements comprises cash on hand and short-term investments that are due for redemption in three months or less and that are easily converted into cash with little risk to a change in value.
25

7. Significant Changes in the Basis of Presenting Consolidated Financial
Statements Accounting policy changes
[Current application of “Practical Solution on Unification of Accounting Policies Applied to Foreign Subsidiaries for Consolidated Financial Statements”] Beginning with the fiscal year under review, the Group has applied “Practical Solution on Unification of Accounting Policies Applied to Foreign Subsidiaries for Consolidated Financial Statements” (Practical Issues Task Force No. 18, issued by The Accounting Standards Board of Japan (ASBJ) on May 17, 2008), and the necessary revisions have been made in the consolidated statements. As a result, the effect of the change from conventional method on profit and loss for the fiscal year under review was not material. The main impact of the change on the Company’s consolidated balance sheets for the fiscal year under review is to increase lease receivables and lease investment assets by ¥13,598 million.
[Application of Accounting Standards for Lease Transactions] When the Company is the Lessee: Beginning with the fiscal year under review, the Company and its domestic consolidated subsidiaries have undertaken the application of the “Accounting Standards for Lease Transactions” (ASBJ Statement No. 13, issued by the First Subcommittee of the Business Accounting Council on June 17, 1993, and revised on March 30, 2007) and “Implementation Guidance on Accounting Standards for Lease Transactions” (ASBJ Guidance No. 16, issued by the Accounting Practice Committee of the Japan Institute of Certified Public Accountants on January 18, 1994, and revised on March 30, 2007). Under these standards, the accounting treatment for finance leases for which ownership is not transferred to the lessee has been changed from methods applicable to ordinary rental transactions to methods applicable to ordinary buying and selling transactions. This change had not effect profit and loss for the fiscal year under review. Regarding the Consolidated Statement of Cash Flows items for the fiscal year under review, of lease payments previously accounted for in the “Cash flows from operating activities” section, the portion corresponding to repayments of lease liabilities is now accounted for in the “Cash flows from financing activities section.” This change did not have a material effect on Consolidated Statement of Cash Flows items for the fiscal year under review.
[Shift of Service Expenses from SG&A Expenses to Cost of Sales] Previously, a portion of the consolidated subsidiaries accounted for service expenses (related to digital multifunction devices and other products) within SG&A expenses but, as a result of Group accounting policy adjustments undertaken in response to the introduction of internal control reporting systems from the fiscal year under review, the Group has uniformly accounted for such service expenses within cost of sales beginning with the fiscal year under review. This change had the effect of decreasing gross profit by ¥28,126 million in the fiscal year under review.
[Recording of Loss on Disposal of Inventories] With the application of the “Accounting Standards for Measurement of Inventories” (No.9, issued by The Accounting Standards Board of Japan (ASBJ) on July 5, 2006) to domestic consolidated subsidiaries beginning with the fiscal year under review, the Group reviewed its accounting principles, and, unified that loss on disposal of inventories is to be recorded under cost of sales. Consequently, certain overseas consolidated subsidiaries which recorded these expenses under non-operating expenses changed to the method of recording these expenses under cost of sales. As a result, compared with the previous method, the introduction of the new method had the effect of decreasing both gross profit and operating income for the fiscal year under review by ¥2,606 million. The impact on segment information is described in the applicable section.
26

8. Important Notes Consolidated balance sheets items, consolidated statements of income items, and consolidated statements of changes in shareholder’s equity (From April 1, 2008 to March 31, 2009) [Consolidated balance sheets items] 1. Assets used for collateral for short-term loans of ¥198 million and long-term loans of ¥146 million are
notes receivable of ¥753 million. 2. Accumulated depreciation directly deducted from tangible fixed assets: ¥426,193 million 3. Breakdown of inventories [Millions]
Merchandise and Finished Goods ¥87,796 Work in Process ¥19,003 Raw Materials and Stores ¥22,360
4. Guaranteed obligations The Company guarantees bank loans and lease obligations etc. of unconsolidated companies, etc. amounting to ¥2,012 million. In addition, the Company has made commitments of guarantee for bank loans of suppliers/customers totaling ¥63 million. [Consolidated statements of income items] 1. Main expense items and amounts of selling, general and administrative expenses are as follows. [Millions]
Selling ¥14,506 Transport and storage ¥20,266 Advertising ¥18,053 Salaries and wages ¥79,996 Provision for reserve for bonuses ¥3,978 Research and development ¥81,778 Depreciation ¥16,218 Retirement benefits ¥5,105 Provision for allowance for doubtful accounts ¥1,339
2. The cost of sales includes the cut-down of book values by ¥6,302 million, reflecting reduced profitability
of inventory held for normal sales purposes. 3. Gain on the sale of shares of affiliated companies and gain on transfer of business resulted from the
transfer of a domestic subsidiary belonging to the Medical & Graphic Imaging Business and related business assets to a company outside the Group.
4. Regarding patent-related revenue, patent royalties related to Photo Imaging Business are recorded in a
lump sum.
27

5. Reversal of allowance for loss on withdrawal from operations represents the net value of the portion of
losses accompanying the decision to withdraw from Photo Imaging Business that were covered by the drawing down of the allowance for the loss on withdrawal from operations during the previous fiscal year and the value of such losses in the fiscal year under review. The value of these figures is as follows:
Drawing down of the allowance for loss on withdrawal from operations in the previous fiscal year: ¥1,412 million Loss on withdrawal from operations in the fiscal year under review: ¥480 million
6. Other extraordinary profit represents the reduction in refund obligation, etc. in accordance with US
State laws at a U.S. sales subsidiary. 7. Impairment losses mainly represent the reduction of book values to recoverable values with respect to
the manufacturing facilities in the Optics Business, and land and manufacturing facilities in the Medical & Graphic Imaging Businesses.
8. Restructuring expenses consist mainly in retirement allowances, etc. associated with staff
allocation/optimization in the Business Technologies Business, expenses on business reorganization in the Medical and Graphic Business, and expenses on the reorganization of manufacturing facilities in the Optics Business.
9. Loss on change of employees’ retirement plan is the lump sum of the past service obligation resulting
from a change of employees’ retirement plan at a domestic subsidiary.
[Consolidated statements of changes in shareholder’s equity items] 1. Change due to revision of accounting treatment for overseas subsidiaries reflects the application of
“Practical Solution for Unification of Accounting Policies Applied to Foreign Subsidiaries for Consolidated Financial Statements” (Practical Issues Task Force No. 18, issued by The Accounting Standards Board of Japan (ASBJ) on May 17, 2006) from the fiscal year under review.
2. The figure for provision of retirement allowance debt of overseas subsidiaries stems from provisions for
the accounting treatment of retirement benefit payments that affected a portion of consolidated subsidiaries in the United States.
28

Fiscal year ended March 31, 2009 (from April 1, 2008 to March 31, 2009) [Millions of yen]
Business
Technologies Optics
Medical and
Graphic Sensing Other Total
Elimination & corporate
Consoli- dation
Sales Outside customers 623,682 173,416 125,890 8,393 16,459 947,843 -- 947,843Intersegment sales/transfers
4,128 1,052 2,419 595 58,860 67,055 (67,055) --
Total 627,810 174,469 128,309 8,989 75,319 1,104,899 (67,055) 947,843
Operating expenses 575,259 161,930 125,226 8,641 72,043 943,100 (51,517) 891,583
Operating income 52,551 12,538 3,083 348 3,276 71,798 (15,538) 56,260Assets, depreciation, and capital expenditure
Assets 440,552 156,283 89,736 8,125 56,493 751,190 166,867 918,058
Depreciation 30,074 28,141 4,335 326 2,341 65,219 4,959 70,179
Impairment losses 150 785 232 - - 1,168 - 1,168
Capital expenditure 23,918 27,591 3,151 306 2,257 57,224 3,939 61,164
Notes: 1. Business classification is based on similarity of product type and market. The Group’s operations are classified into the
five segments of Business Technologies, Optics, Medical and Graphic Imaging, Sensing, and other businesses. 2. Principal products in each business segment
3. Operating expenses not allocated but included in Elimination/corporate under review amounted to ¥31,297 million are principally R&D expenses incurred by the Company and expenses associated with head office functions.
Business Segment Principal Products
Business Technologies MFPs, printers, etc.
Optics Optical devices, electronics materials, etc.
Medical and Graphic Imaging Medical products, graphic imaging products, etc.
Sensing Industrial-use and medical-use measuring instruments, etc
Other businesses Products other than the above
4. Included within the Elimination & Corporate figure for assets are ¥202,373 million in corporate assets, which
primarily include the holding company’s surplus operating funds (cash and marketable securities) and long-term investment funds (investment securities) as well as other assets held by the holding company.
5. Accounting Changes (1) Application of “ Accounting Standards for Measurement of Inventories”
Beginning with the fiscal year under review, “ Accounting Standards for Measurement of Inventories” (No.9, issued by The Accounting Standards Board of Japan (ASBJ) on July 5, 2006) has been applied to domestic consolidated subsidiaries, and the main method of measurement of inventories was changed from the cost method determined by the periodic-average method to the cost method (method of reducing book value when the contribution of inventories to profitability declines), where cost is determined by the periodic-average method. As a result, compared with the previous method, the introduction of the new method had the effect of increasing operating expenses for each business segment as follows: for the Business Technologies business, ¥1,191 million; Optics business, ¥1,680 million; Medical and Graphic business, ¥668 million; Sensing business, ¥39 million, and other businesses, ¥64 million. Operating incomes for these businesses reduced by the respective amounts.
(2) Recording of Loss on Disposal of Inventories With the application of the “Accounting Standards for Measurement of Inventories” (No.9, issued by The Accounting Standards Board of Japan (ASBJ) on July 5, 2006) to domestic consolidated subsidiaries beginning with the fiscal year under review, the Group reviewed its accounting principles, and, effective the fiscal year under review, loss on disposal of inventories is recorded under cost of sales. Consequently, certain overseas consolidated subsidiaries which recorded these expenses under non-operating expenses changed to the method of recording these expenses under cost of sales. As a result, compared with the previous method, the introduction of the new method had the effect of increasing the operating expenses for each business segment as follows: for the Business Technologies business, ¥2,092 million; Optics business, ¥294 million; Medical and Graphic business, ¥185 million; Sensing business, ¥17 million, and other businesses, ¥16 million. Operating incomes for these businesses reduced by the respective amounts.
30

Segment Information
(1) Business Segment
Fiscal year ended March 31, 2008 (from April 1, 2007 to March 31, 2008) [Millions of yen]
Business
Technologies Optics
Medical and
Graphic Sensing Other Total
Elimination & corporate
Consoli- dation
Sales Outside customers 700,969 182,262 161,105 9,910 17,320 1,071,568 - 1,071,568Intersegment sales/transfers
5,175 1,083 3,566 768 62,798 73,392 [73,392] -
Total 706,145 183,345 164,671 10,678 80,119 1,144,961 [73,392] 1,071,568
Operating expenses 616,051 152,089 156,896 9,460 76,626 1,011,124 [59,162] 951,962
Operating income 90,093 31,255 7,775 1,218 3,493 133,836 [14,229] 119,606Assets, depreciation, and capital expenditure
Assets 445,939 181,938 113,141 9,505 73,869 824,394 146,143 970,538
Depreciation 31,286 15,968 6,048 293 1,996 55,593 4,850 60,443
Impairment losses 1,024 21 4,460 - - 5,506 195 5,702
Capital expenditure 16,588 42,012 4,595 370 2,468 66,035 9,259 75,295
Notes: 1. Business classification is based on similarity of product type and market. The Group’s operations are classified into the
five segments of Business Technologies, Optics, Medical and Graphic Imaging, Sensing, and other businesses. 2. Principal products in each business segment
3. Operating expenses not allocated but included in Elimination/corporate under review amounted to ¥30,792 million are principally R&D expenses incurred by the Company and expenses associated with head office functions.
Business Segment Principal Products Business Technologies MFPs, printers, etc. Optics Optical devices, electronics materials, etc. Medical and Graphic Imaging Medical products, graphic imaging products, etc. Sensing Industrial-use and medical-use measuring instruments, etc Other businesses Products other than the above
4. Included within the Elimination & Corporate figure for assets are ¥183,225 million in corporate assets, which primarily
include the holding company’s surplus operating funds (cash and marketable securities) and long-term investment funds (investment securities) as well as other assets held by the holding company.
5. Change in Method for Calculation of Depreciation of Tangible Fixed Assets: Beginning with the period under review, the Company and its domestic consolidated subsidiaries have changed their methods for the calculation of depreciation for tangible fixed assets purchased on or after April 1, 2007, in accordance with the revisions in Japan’s Corporation Tax Law. In addition, for assets purchased on or before March 31, 2007, which have been depreciated to the permissible limit, the remaining value of the assets on the Company’s books will be depreciated in equal amounts over the five-year period beginning with the year following the completion of depreciation to the permissible limit. As a result of these accounting changes, operating expenses increased for each business segment as follows: for the Business Technologies business, ¥1,745 million; Optics business, ¥1,315 million; Medical and Graphic business, ¥628 million; Sensing business, ¥20 million; other businesses, ¥217 million, and Elimination & Corporate, ¥207 million. Operating incomes for these businesses reduced by the respective amounts.
29

6. Change in Method for Calculation of Depreciation of Tangible Fixed Assets
The Company and its domestic consolidated subsidiaries, in response to fiscal year March 2009 corporate income tax law revisions, with respect to mechanical device, have shifted to the use of the post-revision method of amortizing assets over the applicable useful lifetimes of those assets beginning with the fiscal year under review. As a result, compared with the method used in the previous fiscal year, the introduction of the new method had the effect of increasing the operating expenses of the consolidated fiscal year under review for each business segment as follows: for the Business Technologies business, ¥379 million; Optics business ¥6,145 million; Medical and Graphic business, ¥54 million; Sensing business, ¥1 million, and other businesses, ¥5 million. Operating incomes for these businesses reduced by the respective amounts.
(2) Information by Geographical Area
Fiscal year ended March 31, 2008 (from April 1, 2007 to March 31, 2008) [Millions of yen]
Japan North America Europe Asia excluding
Japan, others Total Elimination & corporation Consolidation
Sales
Outside customers 469,989 233,834 305,687 62,056 1,071,568 - 1,071,568Intersegment sales/transfers
353,597 2,848 868 204,822 562,136 [562,136] -
Total 823,586 236,683 306,555 266,879 1,633,704 [562,136] 1,071,568
Operating expenses 702,701 235,561 296,079 261,940 1,496,282 [544,320] 951,962
Operating income 120,885 1,122 10,476 4,938 137,422 [17,815] 119,606
Total assets 722,432 108,208 162,036 91,278 1,083,956 [113,418] 970,538
Notes: 1. Countries and territories are classified based on geographical proximity. 2. Principal countries in the above areas, excluding Japan, are as follows:
(1) North America: United States, and Canada (2) Europe: Germany, France, and United Kingdom (3) Asia excluding Japan, Others: Australia, China, and Singapore
3. Operating expenses not able to be properly allocated that are included in Elimination & corporate are principally R&D expenses incurred by the Company and expenses associated with head office functions. This amount was ¥ 30,792 million.
4. Included within the Elimination & corporate figure for assets are ¥183,225 million in corporate assets, which primarily include the holding company’s surplus operating funds (cash and marketable securities) and long-term investment funds (investment securities) as well as other assets held by the holding company, etc.
Fiscal year ended March 31, 2009 (from April 1, 2008 to March 31, 2009)
[Millions of yen]
Japan North America Europe Asia excluding
Japan, others Total Elimination & corporation Consolidation
Sales
Outside customers 437,312 210,565 247,130 52,835 947,843 - 947,843
Intersegment sales/transfers
280,586 2,632 1,952 191,656 476,827 (476,827) -
Total 717,898 213,197 249,082 244,492 1,424,670 (476,827) 891,583
Operating expenses 662,001 221,571 247,096 238,702 1,369,371 (477,788) 891,583
Operating income
(loss) 55,897 (8,373) 1,985 5,789 55,299 (-961) 56,260
Total assets 618,121 123,255 133,427 86,430 961,235 (43,176) 918,058
Notes: 1. Countries and territories are classified based on geographical proximity. 2. Principal countries in the above areas, excluding Japan, are as follows:
(1) North America: United States, and Canada
31

(2) Europe: Germany, France, and United Kingdom (3) Asia excluding Japan, Others: Australia, China, and Singapore
3. Operating expenses not able to be properly allocated that are included in Elimination & corporate are principally R&D expenses incurred by the Company and expenses associated with head office functions. This amount was ¥ 31,297 million.
4. Included within the Elimination & corporate figure for assets are ¥202,373 million in corporate assets, which primarily include the holding company’s surplus operating funds (cash and marketable securities) and long-term investment funds (investment securities) as well as other assets held by the holding company, etc.
5. Accounting Changes
(1) Application of “ Accounting Standards for Measurement of Inventories” Beginning with the fiscal year under review, “ Accounting Standards for Measurement of Inventories” (No.9, issued by The Accounting Standards Board of Japan (ASBJ) on July 5, 2006) has been applied to domestic consolidated subsidiaries, and the main standard and method of measurement of inventories was changed from the cost method determined by the periodic-average method to the cost method (method of reducing book value when the contribution of inventories to profitability declines), where cost is determined by the periodic-average method. As a result, compared with the previous method, the introduction of the new method had the effect of increasing operating expenses for Japan by ¥3,644 million. Operating income for Japan reduced by the same amount.
(2) Recording of Loss on Disposal of Inventories With the application of the “Accounting Standards for Measurement of Inventories” (No.9, issued by The Accounting Standards Board of Japan (ASBJ) on July 5, 2006) to domestic consolidated subsidiaries beginning with the fiscal year under review, the Group reviewed its accounting principles, and, effective the fiscal year under review, loss on disposal of inventories is recorded under cost of sales. Consequently, certain overseas consolidated subsidiaries which recorded these expenses under non-operating expenses changed to the method of recording these expenses under cost of sales. As a result, compared with the previous method, the introduction of the new method had the effect of increasing operating expenses for each geographical segment as follows: for North America, ¥995 million; for Europe, ¥1,140 million, and for Asia, Others, ¥470 million. Operating incomes for these geographical segments reduced by the same amounts.
6. Change in Method for Calculation of Depreciation of Tangible Fixed Assets The Company and its domestic consolidated subsidiaries, in response to fiscal year March 2009 corporate income tax
legislative revisions, with respect to mechanical device, have shifted to the use of the post-revision method of amortizing assets over the applicable useful lifetimes of those assets beginning with the fiscal year under review. As a result, compared with the method used in the previous fiscal year, the introduction of the new method had the effect of increasing the operating expenses for Japan by ¥6,587 million. Operating income for Japan reduced by the same amount.
(3) Overseas Sales Fiscal year ended March 31, 2008 (from April 1, 2007 to March 31, 2008)
[Millions of yen]
North America Europe Asia excluding Japan
and Others Total
Overseas sales 245,486 312,115 225,182 782,785
Consolidated sales - - - 1,071,568
Overseas sales as a percentage of consolidated sales
22.9% 29.1% 21.0% 73.1%
Fiscal year ended March 31, 2009 (from April 1, 2008 to March 31, 2009) [Millions of yen]
North America Europe
Asia excluding Japan and Others
Total
Overseas sales 217,024 217,797 202,074 690,896
Consolidated sales - - - 947,843
Overseas sales as a percentage of consolidated sales
22.9 28.7 21.3 72.9
Notes: 1. Countries and territories are classified based on geographical proximity. 2. Principal countries in the above areas, excluding Japan, are as follows:
32

(1) North America: United States and Canada (2) Europe: Germany, France, and United Kingdom (3) Asia excluding Japan, Others: Australia, China, and Singapore
3. Overseas sales are the Company and consolidated subsidiary sales in countries or regions outside of Japan.
33

Tax-Effect Accounting (1) Deferred tax assets and deferred tax liabilities
[Millions of yen] As of March 31, 2008 As of March 31, 2009Deferred tax assets
Net operating tax loss carried forward 27,061 31,953Accrued retirement benefits over deductible limit 26,973 29,824Elimination of unrealized intercompany profit 20,131 9,064Provision for loss on discontinued operations 9,565 6,025Depreciation and amortization 5,710 5,661Write-down of assets, other 4,151 5,122Accrued bonuses 5,768 4,431Tax effects related to investments 1,721 1,717Allowance for doubtful accounts 1,169 1,039Accrued enterprise taxes 2,059 242Other 8,657 10,295
Deferred tax assets subtotal 112,970 105,378Valuation allowance (34,639) (33,335)Total deferred tax assets 78,331 72,043Deferred tax liabilities
Gain on establishment of employee pension trust (3,042) (2,973)Retained earnings of overseas subsidiaries (5,455) (2,272)Reserve for advanced depreciation, other (800) (558)Revaluation difference of marketable securities (3,265) (440)Other (377) (1,703)
Total deferred tax liabilities (12,941) (7,948)Net deferred tax assets 65,389 64,094 Deferred tax liabilities related to revaluation [Millions of yen]
Deferred tax liabilities related to revaluation of land (4,010) (3,889) Net deferred tax assets are included in the following items in the consolidated balance sheets.
[Millions of yen] As of March 31, 2008 As of March 31, 2009
Current assets – deferred tax assets 37,086 25,326Fixed assets – deferred tax assets 28,604 39,608Current liabilities – other (248) (734)Long-term liabilities – other (53) (105)
(2) Reconciliation between the statutory income tax rate and the effective income tax
rate after the adoption of tax effect accounting. [ % ]
As of March 31, 2008 As of March 31, 2009Statutory income tax rate 40.7 40.7
(Adjustments) Valuation allowance (4.9) 6.4Tax credits (R&D expenses, other) (4.3) (5.0)Non-taxable income (4.7) (0.5)Difference in statutory tax rates of foreign subsidiaries (0.0) (0.6)Expenses not deductible for tax purpose 2.6 4.5Amortization of goodwill 2.7 10.9Impact of change in the recording standard of tax effects of retained earnings in accordance with revision of Corporate Tax Laws
- (10.4)
Ineffective portion of unrealized (gain) loss - 5.5Other (1.8) 2.7
Effective income tax rate per consolidated statements of income 30.3 54.3
34

Securities
Fiscal year ended March 31, 2008 (1) Other securities with quoted market values (As of March 31, 2008)
[Millions of yen]
Type Acquisition costTotal amount on
consolidated balance Difference
(1) Stocks 9,064 16,515 7,450 (2) Bonds 3 5 1(3) Other 1 1 -
Total amount on consolidated balance sheets exceeds the acquisition cost
Sub total 9,069 16,522 7,452 (1) Stocks 9,388 6,862 (2,526)(2) Bonds 21 14 (6)(3) Other - - -
Total amount on consolidated balance sheets
does not exceed the acquisition cost Sub total 9,410 6,876 (2,533)
Total 18,479 23,399 4,919 (Note)Historical cost represents carrying value after processing the impairment losses. During the fiscal year under review the Company processed impairment losses for other available-for-sale securities with available fair market values and recorded an impairment loss on investment securities of ¥297 million.
(2) Other securities sold in fiscal year ended March 31, 2008 (April 1, 2007 - March 31, 2008)
[Millions of yen] Sales amount Total profit Total loss
Other securities 23 20 0
(3) Composition and amounts on the consolidated balance sheets of other securities without market values
[Millions of yen] Total amount on consolidated balance sheets
Negotiable deposit 33,000Unlisted stocks 863
Fiscal year ended March 31, 2009 (1) Other securities with quoted market values (As of March 31, 2009)
[Millions of yen]
Type Acquisition costTotal amount on
consolidated balance Difference
(1) Stocks 7,287 8,823 1,536(2) Bonds - - -(3) Other 8 8 0
Total amount on consolidated balance sheets exceeds the acquisition cost
Sub total 7,295 8,832 1,536(1) Stocks 8,426 6,031 (2,395)(2) Bonds -- - -(3) Other 8 6 (1)
Total amount on consolidated balance sheets
does not exceed the acquisition cost Sub total 8,435 6,037 (2,397)
Total 15,730 14,869 (861)(Note)Historical cost represents carrying value after processing the impairment losses. During the fiscal year under review the Company processed impairment losses for other available-for-sale securities with available fair market values and recorded an impairment loss on investment securities of ¥3,735 million.
35

(2) Other securities sold in fiscal year ended March 31, 2009 (April 1, 2008 - March 31, 2009)
[Millions of yen] Sales amount Total profit Total loss
Other securities 15 6 0
(3) Composition and amounts on the consolidated balance sheets of other securities without market values
[Millions of yen] Total amount on consolidated balance sheets
Negotiable deposit 48,000 Unlisted stocks 648
Retirement Benefit Plan (1) Outline of the retirement benefit system
The Company and some of domestic consolidated subsidiaries have defined benefit retirement plans (defined benefit-type corporate pension plans, tax-qualified retirement pension plans and lump-sum severance payments), and have defined contribution retirement plans (defined contribution-type corporate pension plans). Certain overseas consolidated subsidiaries have defined benefit retirement plans and defined contribution retirement plans. In some cases, retiring employees are paid an additional severance allowance. Additionally, the Company and certain domestic consolidated subsidiaries have a retirement benefit trust. (2) Items related to retirement benefit liabilities
[Millions of yen] As of March 31, 2008 As of March 31, 2009 a. Retirement benefit obligation (144,011) (140,843)b. Plan assets 91,360 74,124c. Unfunded retirement benefit obligation (a+b) (52,651) (66,718)d. Unrecognized actuarial differences 10,276 18,621e. Unrecognized prior service cost (reduction in liabilities) (8,131) (7,033)f. Net amount on consolidated balance sheets (c+d+e) (50,506) (55,130)g. Prepaid pension costs 2,861 2,831h. Accrued for retirement benefits (f-g) (53,367) (57,962)
Note:
As of March 31, 2008 As of March 31, 2009 1. Certain subsidiaries use a simplified method for the
calculation of benefit obligation 1. Certain subsidiaries use a simplified method for the
calculation of benefit obligation
(3) Items related to retirement benefit costs [Millions of yen]
April 1, 2007 – March 31, 2008 April 1, 2008 – March 31, 2009a. Service costs 5,662 5,181b. Interest costs 4,410 4,074c. Expected return on plan assets (3,095) (2,280)d. Amortization of actuarial differences 1,248 1,860e. Amortization of prior service costs (1,426) 643f. Retirement benefit costs (a+b+c+d+e) 6,799 9,479g. Contribution defined contribution pension plans 3,199 3,168Total (f+g) 9,998 12,647
36
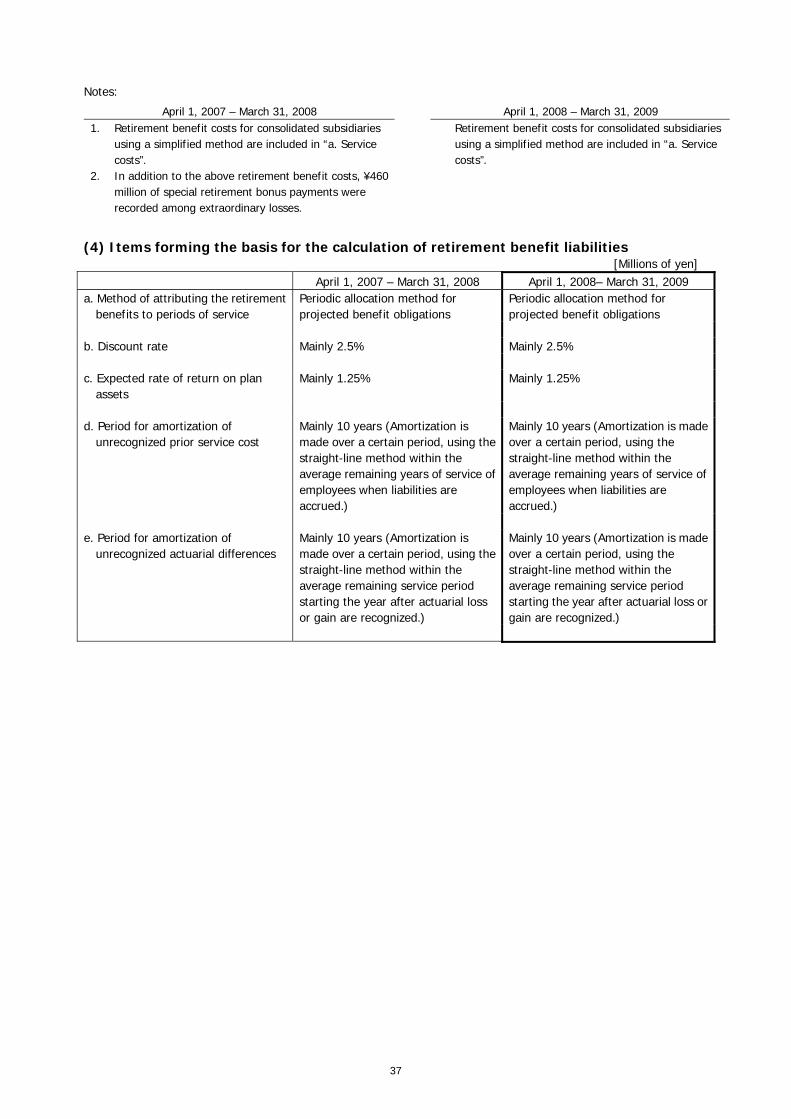
Notes:
April 1, 2007 – March 31, 2008 April 1, 2008 – March 31, 2009 1. Retirement benefit costs for consolidated subsidiaries
using a simplified method are included in “a. Service costs”.
2. In addition to the above retirement benefit costs, ¥460 million of special retirement bonus payments were recorded among extraordinary losses.
Retirement benefit costs for consolidated subsidiaries using a simplified method are included in “a. Service costs”.
(4) Items forming the basis for the calculation of retirement benefit liabilities
[Millions of yen] April 1, 2007 – March 31, 2008 April 1, 2008– March 31, 2009 a. Method of attributing the retirement
benefits to periods of service Periodic allocation method for projected benefit obligations
Periodic allocation method for projected benefit obligations
b. Discount rate Mainly 2.5% Mainly 2.5% c. Expected rate of return on plan
assets Mainly 1.25% Mainly 1.25%
d. Period for amortization of
unrecognized prior service cost Mainly 10 years (Amortization is made over a certain period, using the straight-line method within the average remaining years of service of employees when liabilities are accrued.)
Mainly 10 years (Amortization is made over a certain period, using the straight-line method within the average remaining years of service of employees when liabilities are accrued.)
e. Period for amortization of
unrecognized actuarial differences Mainly 10 years (Amortization is made over a certain period, using the straight-line method within the average remaining service period starting the year after actuarial loss or gain are recognized.)
Mainly 10 years (Amortization is made over a certain period, using the straight-line method within the average remaining service period starting the year after actuarial loss or gain are recognized.)
37
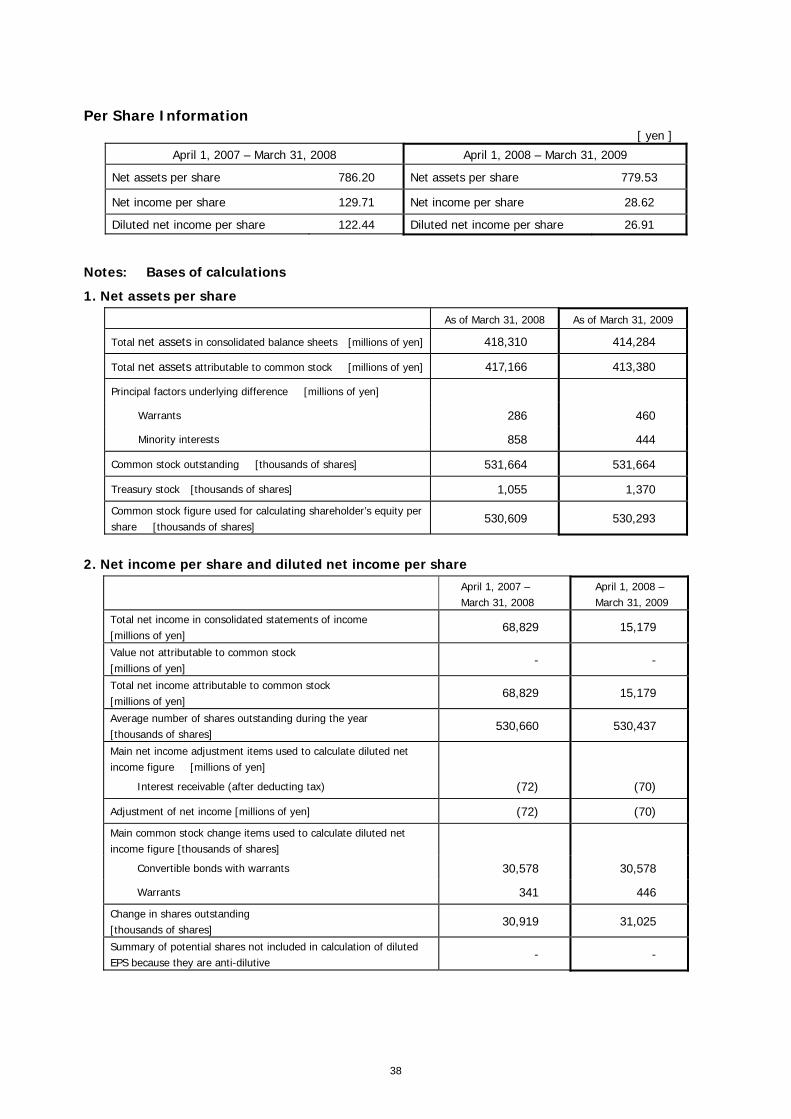
Per Share Information [ yen ]
April 1, 2007 – March 31, 2008 April 1, 2008 – March 31, 2009
Net assets per share 786.20 Net assets per share 779.53
Net income per share 129.71 Net income per share 28.62
Diluted net income per share 122.44 Diluted net income per share 26.91
Notes: Bases of calculations
1. Net assets per share
As of March 31, 2008 As of March 31, 2009
Total net assets in consolidated balance sheets [millions of yen] 418,310 414,284
Total net assets attributable to common stock [millions of yen] 417,166 413,380
Principal factors underlying difference [millions of yen]
Warrants 286 460
Minority interests 858 444
Common stock outstanding [thousands of shares] 531,664 531,664
Treasury stock [thousands of shares] 1,055 1,370
Common stock figure used for calculating shareholder’s equity per share [thousands of shares]
530,609 530,293
2. Net income per share and diluted net income per share
April 1, 2007 – March 31, 2008
April 1, 2008 – March 31, 2009
Total net income in consolidated statements of income [millions of yen]
68,829 15,179
Value not attributable to common stock [millions of yen]
- -
Total net income attributable to common stock [millions of yen]
68,829 15,179
Average number of shares outstanding during the year [thousands of shares]
530,660 530,437
Main net income adjustment items used to calculate diluted net income figure [millions of yen]
Interest receivable (after deducting tax) (72) (70)
Adjustment of net income [millions of yen] (72) (70)
Main common stock change items used to calculate diluted net income figure [thousands of shares]
Convertible bonds with warrants 30,578 30,578
Warrants 341 446
Change in shares outstanding [thousands of shares]
30,919 31,025
Summary of potential shares not included in calculation of diluted EPS because they are anti-dilutive
- -
38

39
Important Subsequent Events No relevant transactions occurred during fiscal year ended March 31, 2009.
Omission of Disclosure Disclosure of the notes on leases, related party transactions, derivative transactions, and stock options was omitted due to the minor necessity of disclosure.

5. Non-Consolidated Financial Statements
(1) Balance SheetsMarch 31, 2009 and 2008
[Millions of yen]March 31, 2009 March 31, 2008
AssetsCurrent assets
Cash and deposits 49,276 47,296Accrued income 1,327 963Short-term investment securities 33,000 48,000Prepaid expenses 422 311Deferred tax assets 245 149Short-term loans receivable 178,386 194,638Accounts receivable-other 28,840 13,096Income taxes receivable 6,973Other 1,370 4,598Allowance for doubtful accounts 50,558 51,110Total current assets 242,312 264,916
Noncurrent assetsProperty, plant and equipment
Buildings, net 40,872 39,683Structures, net 2,870 2,711Machinery and equipment, net 1,055 1,079Vehicles, net 0 0Tools, furniture and fixtures, net 484 664Land 28,722 28,247Lease assets, net 14Construction in progress 97 1Total property, plant and equipment 74,102 72,402
Intangible assetsPatent right 0 0Leasehold right 117 116Right of trademark 5 4Software 2,126 2,180Other 365 294Total intangible assets 2,614 2,596
Investments and other assetsInvestment securities 20,588 13,479Stocks of subsidiaries and affiliates 126,632 126,632Investments in capital of subsidiaries and affiliates 3,794 3,794Long-term loans receivable from employees 2 1Long-term loans receivable from subsidiaries and affiliates 84 354Claims provable in bankruptcy, claims provable in rehabilita 1 1Long-term prepaid expenses 569 513Deferred tax assets 1,127 4,182Other 1,547 1,596Allowance for doubtful accounts 75 66Total investments and other assets 154,271 150,488
Total noncurrent assets 230,988 225,487Total assets 473,301 490,403

[Millions of yen]March 31, 2009 March 31, 2008
LiabilitiesCurrent liabilities
Notes payable-trade 45 29Short-term loans payable 41,613 30,010Current portion of long-term loans payable 6,362 12,102Current portion of bonds 5,000 30,066Lease obligations 4Accounts payable-other 14,728 10,445Accrued expenses 694 822Income taxes payable 5,157 103Advances received 0 2Deposits received 44 46Provision for bonuses 347 230Provision for directors' bonuses 139 32Other 13 14Total current liabilities 74,149 83,910
Noncurrent liabilitiesBonds payable 70,166 40,000Long-term loans payable 50,618 83,016Lease obligations 10Deferred tax liabilities for land revaluation 5,534 5,390Provision for retirement benefits 8,443 8,797Other 403 436Total noncurrent liabilities 135,167 137,652
Total liabilities 209,317 221,562Net assets
Shareholders' equityCapital stock 37,519 37,519Capital surplus
Legal capital surplus 135,592 135,592Total capital surpluses 135,592 135,592
Retained earningsOther retained earnings
Reserve for special depreciation 96 93Reserve for reduction entry 60 55Retained earnings brought forward 79,568 88,713
Total earned surpluses 79,725 88,863Treasury stock 1,340 1,662Total shareholders' equity 251,497 260,313
Valuation and translation adjustmentsValuation difference on available-for-sale securities 4,388 464Revaluation reserve for land 7,812 7,603Total valuation and translation adjustments 12,200 8,067
Subscription rights to shares 286 460Total net assets 263,983 268,840
Total liabilities and net assets 473,301 490,403

(2) Statements of IncomeFor the fiscal years ended March 31, 2009 and 2008
[Millions of yen]
2008 2009Operating revenue 65,575 45,489Operating expenses 31,087 31,593Operating income 34,488 13,896Non-operating income
Interest income 2,786 2,838Interest on securities 192 272Dividends income 299 352Other 291 343Total non-operating income 3,569 3,806
Non-operating expensesInterest expenses 1,266 1,655Interest on bonds 141 61Commission for syndicate loan 153 308Other 134 126Total non-operating expenses 1,695 2,151
Ordinary income 36,361 15,551Extraordinary income
Gain on sales of noncurrent assets 135 7Reversal of allowance for doubtful accounts 8,199Total extraordinary income 8,334 7
Extraordinary lossLoss on sales and retirement of noncurrent assets 752 663Impairment loss 234Loss on valuation of investment securities 289 1,477Loss on debts waiver of subsidiaries and affiliates 97Provision of allowance for doubtful accounts 543Total extraordinary losses 1,373 2,685
Income before income taxes 43,322 12,874Income taxes-current 4,530 5,045Income taxes-deferred 119 409Total income taxes 4,649 5,455Net income 47,972 18,329
March 31

(3) Statements of Changes in Net AssetsFor the fiscal years ended March 31, 2009 and 2008
[Millions of yen]
2008 2009Shareholders' equity
Capital stockBalance at the end of previous period 37,519 37,519Changes of items during the period
Total changes of items during the periodBalance at the end of current period 37,519 37,519
Capital surplusLegal capital surplus
Balance at the end of previous period 135,592 135,592Changes of items during the period
Total changes of items during the periodBalance at the end of current period 135,592 135,592
Other capital surplusBalance at the end of previous period 2Changes of items during the period
Disposal of treasury stock 2Total changes of items during the period 2
Balance at the end of current periodTotal capital surplus
Balance at the end of previous period 135,594 135,592Changes of items during the period
Disposal of treasury stock 2Total changes of items during the period 2
Balance at the end of current period 135,592 135,592Retained earnings
Other retained earningsReserve for special depreciation
Balance at the end of previous period 96Changes of items during the period
Provision of reserve for special depreciation 96 11Reversal of reserve for special depreciation 13Total changes of items during the period 96 2
Balance at the end of current period 96 93Reserve for reduction entry
Balance at the end of previous period 33 60Changes of items during the period
Provision of reserve for reduction entry 33Reversal of reserve for reduction entry 6 4Total changes of items during the period 26 4
Balance at the end of current period 60 55
March 31

[Millions of yen]
2008 2009Retained earnings brought forward
Balance at the end of previous period 40,985 79,568Changes of items during the period
Provision of reserve for special depreciation 96 11Reversal of reserve for special depreciation 13Provision of reserve for reduction entry 33Reversal of reserve for reduction entry 6 4Dividends from surplus 9,287 9,283Net income 47,972 18,329Disposal of treasury stock 28 117Reversal of revaluation reserve for land 48 208Total changes of items during the period 38,582 9,145
Balance at the end of current period 79,568 88,713Total retained earnings
Balance at the end of previous period 41,019 79,725Changes of items during the period
Provision of reserve for special depreciationReversal of reserve for special depreciationProvision of reserve for reduction entryReversal of reserve for reduction entryDividends from surplus 9,287 9,283Net income 47,972 18,329Disposal of treasury stock 28 117Reversal of revaluation reserve for land 48 208Total changes of items during the period 38,705 9,137
Balance at the end of current period 79,725 88,863Treasury stock
Balance at the end of previous period 1,097 1,340Changes of items during the period
Purchase of treasury stock 289 665Disposal of treasury stock 46 343Total changes of items during the period 242 321
Balance at the end of current period 1,340 1,662Total shareholders' equity
Balance at the end of previous period 213,036 251,497Changes of items during the period
Dividends from surplus 9,287 9,283Net income 47,972 18,329Purchase of treasury stock 289 665Disposal of treasury stock 16 226Reversal of revaluation reserve for land 48 208Total changes of items during the period 38,461 8,815
Balance at the end of current period 251,497 260,313
March 31

[Millions of yen]
2008 2009Valuation and translation adjustments
Valuation difference on available-for-sale securitiesBalance at the end of previous period 8,366 4,388Changes of items during the period
Net changes of items other than shareholders' equity 3,978 3,924Total changes of items during the period 3,978 3,924
Balance at the end of current period 4,388 464Revaluation reserve for land
Balance at the end of previous period 7,861 7,812Changes of items during the period
Reversal of revaluation reserve for land 48 208Total changes of items during the period 48 208
Balance at the end of current period 7,812 7,603Total valuation and translation adjustments
Balance at the end of previous period 16,228 12,200Changes of items during the period
Reversal of revaluation reserve for land 48 208Net changes of items other than shareholders' equity 3,978 3,924Total changes of items during the period 4,027 4,132
Balance at the end of current period 12,200 8,067Subscription rights to shares
Balance at the end of previous period 108 286Changes of items during the period
Net changes of items other than shareholders' equity 177 174Total changes of items during the period 177 174
Balance at the end of current period 286 460Total net assets
Balance at the end of previous period 229,372 263,983Changes of items during the period
Dividends from surplus 9,287 9,283Net income 47,972 18,329Purchase of treasury stock 289 665Disposal of treasury stock 16 226Reversal of revaluation reserve for landNet changes of items other than shareholders' equity 3,800 3,749Total changes of items during the period 34,611 4,856
Balance at the end of current period 263,983 268,840
March 31

4. Note on the Premise of Going Concern No relevant items occurred during fiscal year ended March 31, 2009
5. Basis of Presenting Non-Consolidated Financial Statements
(1) Securities valuation standard and methods
1. Shares of subsidiaries and affiliates SecuritiesShares of subsidiaries and affiliates are stated at cost using the moving-average method.
2. Other securities Securities with fair market value are stated using the mark-to-market method based on the market price at the balance sheet date. (Total net unrealized gains or losses after tax effect adjustments are directly recorded in shareholders' equity, and the cost of securities sold is computed based on the moving-average method.) Other securities that do not have fair market values are primarily stated at cost using the moving value average.
(2) Derivatives Derivatives are stated using the mark-to-market method.
(3) Amortization Method for Depreciable Assets
1. Tangible fixed assets (excluding lease assets) The depreciable assets of the Company are depreciated using the declining-balance method. However, the Company has used the straight-line method for their buildings (excluding annexed structures) acquired since April 1, 1998.
[Additional Information] Accompanying revisions in Japan's Corporate Tax Law (as contained in the Law Revising a Portion of the Income Tax Law, April 30, 2008, Law No. 23), the Company reviewed the useful life and classification of depreciable assets, and, with respect to mechanical device, have shifted to the use of the post-revision method of amortizing assets over the applicable useful life and classification of those assets beginning with the fiscal year under review. As a result, compared with the method used in the previous fiscal year, the introduction of the new method had the effect of increasing operating income, recurring profit, and net income before income taxes by ¥33 million each during the fiscal year under review.
2. Intangible fixed assets We have adopted the straight-line method based on an estimated in-house working life of five years for the software we use.
3. Lease assets <Lease assets arising from finance lease transactions that do not transfer of ownership> Depreciation is computed using the straight-line method based on the assumption that the useful life equals the lease term and the residual value equals zero. Finance lease transactions not involving transfer of ownership commencing on or before March 31, 2008 are accounted for based on methods applicable to ordinary rental transactions.
46
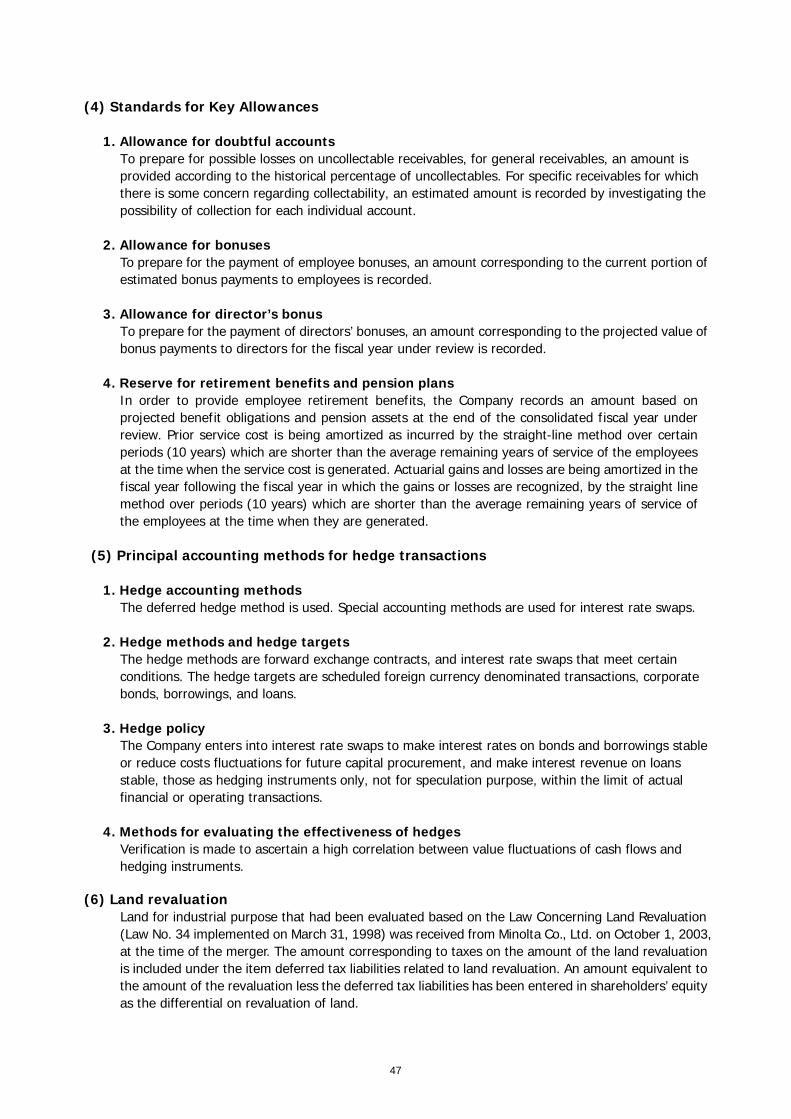
(4) Standards for Key Allowances
1. Allowance for doubtful accounts To prepare for possible losses on uncollectable receivables, for general receivables, an amount is provided according to the historical percentage of uncollectables. For specific receivables for which there is some concern regarding collectability, an estimated amount is recorded by investigating the possibility of collection for each individual account.
2. Allowance for bonuses To prepare for the payment of employee bonuses, an amount corresponding to the current portion of estimated bonus payments to employees is recorded.
3. Allowance for director’s bonus To prepare for the payment of directors’ bonuses, an amount corresponding to the projected value of bonus payments to directors for the fiscal year under review is recorded.
4. Reserve for retirement benefits and pension plans In order to provide employee retirement benefits, the Company records an amount based on projected benefit obligations and pension assets at the end of the consolidated fiscal year under review. Prior service cost is being amortized as incurred by the straight-line method over certain periods (10 years) which are shorter than the average remaining years of service of the employees at the time when the service cost is generated. Actuarial gains and losses are being amortized in the fiscal year following the fiscal year in which the gains or losses are recognized, by the straight line method over periods (10 years) which are shorter than the average remaining years of service of the employees at the time when they are generated.
(5) Principal accounting methods for hedge transactions
1. Hedge accounting methods The deferred hedge method is used. Special accounting methods are used for interest rate swaps.
2. Hedge methods and hedge targets The hedge methods are forward exchange contracts, and interest rate swaps that meet certain conditions. The hedge targets are scheduled foreign currency denominated transactions, corporate bonds, borrowings, and loans.
3. Hedge policy The Company enters into interest rate swaps to make interest rates on bonds and borrowings stable or reduce costs fluctuations for future capital procurement, and make interest revenue on loans stable, those as hedging instruments only, not for speculation purpose, within the limit of actual financial or operating transactions.
4. Methods for evaluating the effectiveness of hedges Verification is made to ascertain a high correlation between value fluctuations of cash flows and hedging instruments.
(6) Land revaluation Land for industrial purpose that had been evaluated based on the Law Concerning Land Revaluation (Law No. 34 implemented on March 31, 1998) was received from Minolta Co., Ltd. on October 1, 2003, at the time of the merger. The amount corresponding to taxes on the amount of the land revaluation is included under the item deferred tax liabilities related to land revaluation. An amount equivalent to the amount of the revaluation less the deferred tax liabilities has been entered in shareholders’ equity as the differential on revaluation of land.
47
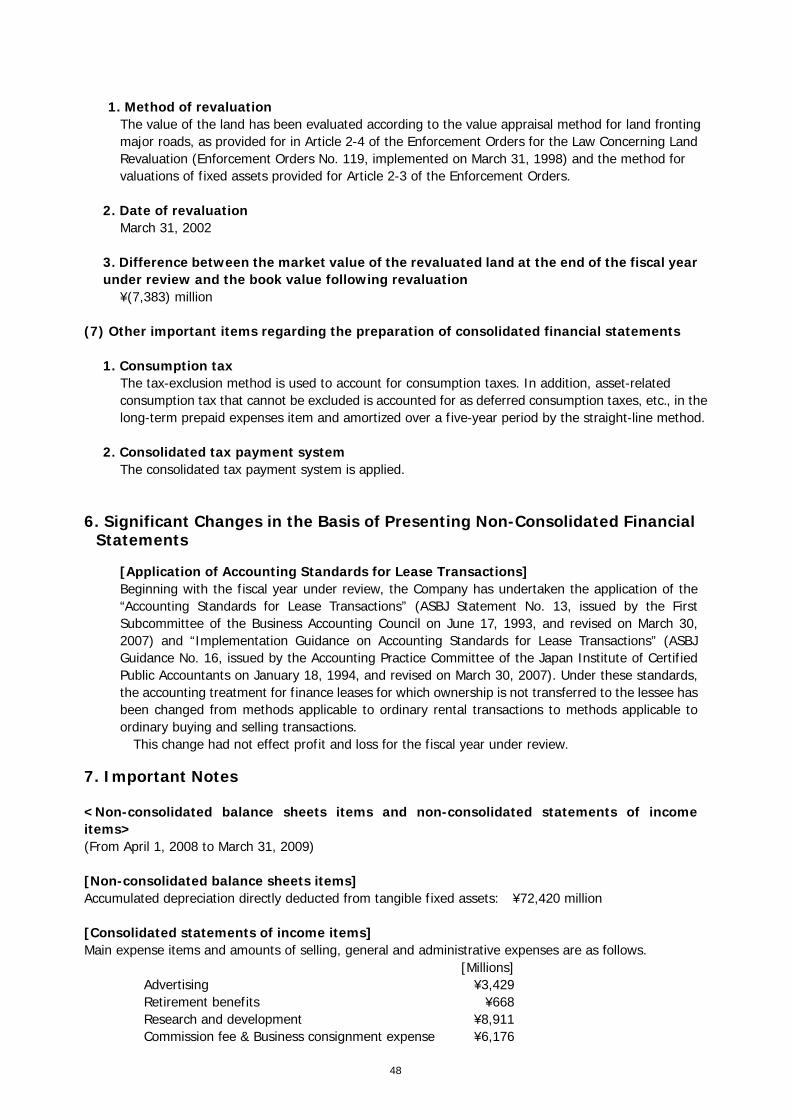
1. Method of revaluation The value of the land has been evaluated according to the value appraisal method for land fronting major roads, as provided for in Article 2-4 of the Enforcement Orders for the Law Concerning Land Revaluation (Enforcement Orders No. 119, implemented on March 31, 1998) and the method for valuations of fixed assets provided for Article 2-3 of the Enforcement Orders.
2. Date of revaluation March 31, 2002
3. Difference between the market value of the revaluated land at the end of the fiscal year under review and the book value following revaluation
¥(7,383) million
(7) Other important items regarding the preparation of consolidated financial statements
1. Consumption tax The tax-exclusion method is used to account for consumption taxes. In addition, asset-related consumption tax that cannot be excluded is accounted for as deferred consumption taxes, etc., in the long-term prepaid expenses item and amortized over a five-year period by the straight-line method.
2. Consolidated tax payment system The consolidated tax payment system is applied.
6. Significant Changes in the Basis of Presenting Non-Consolidated Financial Statements
[Application of Accounting Standards for Lease Transactions] Beginning with the fiscal year under review, the Company has undertaken the application of the “Accounting Standards for Lease Transactions” (ASBJ Statement No. 13, issued by the First Subcommittee of the Business Accounting Council on June 17, 1993, and revised on March 30, 2007) and “Implementation Guidance on Accounting Standards for Lease Transactions” (ASBJ Guidance No. 16, issued by the Accounting Practice Committee of the Japan Institute of Certified Public Accountants on January 18, 1994, and revised on March 30, 2007). Under these standards, the accounting treatment for finance leases for which ownership is not transferred to the lessee has been changed from methods applicable to ordinary rental transactions to methods applicable to ordinary buying and selling transactions.
This change had not effect profit and loss for the fiscal year under review.
7. Important Notes
<Non-consolidated balance sheets items and non-consolidated statements of income items>(From April 1, 2008 to March 31, 2009)
[Non-consolidated balance sheets items] Accumulated depreciation directly deducted from tangible fixed assets: ¥72,420 million
[Consolidated statements of income items] Main expense items and amounts of selling, general and administrative expenses are as follows.
[Millions] Advertising ¥3,429 Retirement benefits ¥668Research and development ¥8,911Commission fee & Business consignment expense ¥6,176
48

Repair expenses ¥1,539Taxes and dues ¥1,513Depreciation ¥4,455 Provision for reserves for bonuses ¥230Provision for allowance for directors’ bonuses ¥32
<Tax-effect accounting>
(1) Deferred tax assets and deferred tax liabilities [Millions of yen]
As of March 31, 2008 As of March 31, 2009Deferred tax assets
Allowance for doubtful accounts 20,602 20,823Losses on stock of affiliated companies 13,757 13,757Net operating tax loss carried forward 5,741 7,481Accrued retirement benefits over deductible limit 6,022 6,169Depreciation and amortization 796 653Accrued bonuses 141 93Other 1,602 1,594
Deferred tax assets subtotal 48,664 50,572Valuation allowance (43,181) (44,850)Total deferred tax assets 5,483 5,722Deferred tax liabilities
Gain on establishment of employee pension trust (991) (970)Revaluation difference of marketable securities (3,010) (318)Reserve for special depreciation (66) (64)Reserve for advanced depreciation (41) (38)
Total deferred tax liabilities (4,109) (1,391)Net deferred tax assets 1,373 4,331
Deferred tax liabilities related to revaluation Deferred tax liabilities related to revaluation of land (5,534) (5,390)
(2) Reconciliation between the statutory income tax rate and the effective income tax rate after the adoption of tax effect accounting.
[ % ] As of March 31, 2008 As of March 31, 2009
Statutory income tax rate 40.7 40.7(Adjustments)Valuation allowance (3.9) 12.9Exclusion from gross revenue of dividends received (46.5) (95.0)Tax credits (R&D expenses, other) (1.0) (1.5)Refunds for past fiscal year income taxes, etc. (0.7) (0.1)Other 0.7 0.6
Effective income tax rate per consolidated statements of income (10.7) (42.6)
49

<Per share information> [ yen ]
April 1, 2007 – March 31, 2008 April 1, 2008 – March 31, 2009
Net assets per share 496.97 Net assets per share 506.10
Net income per share 90.40 Net income per share 34.56
Diluted net income per share 85.30 Diluted net income per share 32.52
Notes: Bases of calculations
1. Net assets per share
As of March 31, 2008 As of March 31, 2009
Total net assets in consolidated balance sheets [millions of yen] 263.983 268,840
Total net assets attributable to common stock [millions of yen] 263.697 268,380
Principal factors underlying difference [millions of yen]
Warrants 286 460
Common stock outstanding [thousands of shares] 531,664 531,664
Treasury stock [thousands of shares] 1,055 1,370
Common stock figure used for calculating shareholder’s equity per share [thousands of shares]
530,609 530,293
2. Net income per share and diluted net income per share
April 1, 2007 – March 31, 2008
April 1, 2008 – March 31, 2009
Total net income in consolidated statements of income [millions of yen]
47,972 18,329
Value not attributable to common stock [millions of yen]
- -
Total net income attributable to common stock [millions of yen]
47,972 18,329
Average number of shares outstanding during the year [thousands of shares]
530,660 530,437
Main net income adjustment items used to calculate diluted net income figure [millions of yen]
Interest receivable (after deducting tax) (72) (70)
Adjustment of net income [millions of yen] (72) (70)
Main common stock change items used to calculate diluted net income figure [thousands of shares]
Convertible bonds with warrants 30,578 30,578
Warrants 341 446
Change in shares outstanding [thousands of shares]
30,919 31,025
Summary of potential shares not included in calculation of diluted EPS because they are anti-dilutive
- -
<Important subsequent events> No relevant transactions occurred during fiscal year ended March 31, 2009.
50