Embed Size (px)
Citation preview

1
Jan 29, 2016
Consolidated Financial Highlights
Quarterly Condensed Consolidated Statement of Comprehensive Income
Millions of yen
Change
Thousands of U.S.
dollars
Nine months ended
December 31, Nine months ended
December 31,
2015 2014 2015
Revenue 814,805 837,422 2.8% 6,943,221
Business profit (Note) 85,472 72,774 (14.9%) 603,392
Profit from operating activities 110,675 81,907 (26.0%) 679,106
Profit before tax 112,622 80,314 (28.7%) 665,898
Profit for the period 90,618 55,242 (39.0%) 458,021
Profit for the period attributable to owners of
the parent company 90,476 54,969 (39.2%) 455,766
Total comprehensive income for the period 139,359 49,479 (64.5%) 410,239
Basic earnings per share (in ¥1, $1 unit) 252.88 153.64 1.27
Diluted earnings per share (in ¥1, $1 unit) - - -
(Note) Business profit is calculated by subtracting cost of sales and selling, general and administrative
expenses from Revenue.
Quarterly Condensed Consolidated Statement of Financial Position
Millions of yen
Thousands of U.S.
dollars
March 31, 2015 December 31, 2015 December 31, 2015
Total assets 1,006,282 1,002,225 8,309,634 Total equity 497,308 521,625 4,324,890 Equity attributable to owners of the
parent company 494,325 518,622 4,299,991
Equity attributable to owners of the
parent company ratio (%) 49.1% 51.7% 51.7%
Quarterly Condensed Consolidated Statement of Cash Flows
Millions of yen
Change
Thousands of U.S.
dollars
Nine months ended
December 31, Nine months ended
December 31,
2015 2014 2015
Net cash provided by (used in) operating activities 73,540 68,413 (7.0%) 567,224
Net cash provided by (used in) investing activities (33,188) (34,743) -% (288,060)
Net cash provided by (used in) financing activities (36,209) (55,951) -% (463,900)
Cash and cash equivalents at end of period 230,311 219,129 (4.9%) 1,816,839
3-5 Owa 3-chome Suwa, Nagano
392-8502, Japan
Tel: +81-266-52-3131
http://global.epson.com/
CONSOLIDATED RESULTS FOR
THE THIRD QUARTER ENDED DECEMBER 31, 2015 (IFRS basis)

2
Notes
I. Seiko Epson Corporation (the “Company”) completed the Company’s ordinary shares split with an
effective date of April 1, 2015. As a result, each share of the Company’s ordinary shares was split into
two shares. Basic earnings per share was calculated under the assumption that the shares split took
effect at the beginning of the previous fiscal year.
II. Figures in ‘Change’ column are comparisons with the same period of the previous year.
III. Diluted earnings per share is presented only if there are dilutive factors present.
IV. Equity attributable to owners of the parent company is equity excluding non-controlling interest in
subsidiaries.
V. U.S. dollar amounts are included solely for the convenience of readers. These translations should not be
construed as representations that the yen amounts actually represent, or have been or could be
converted into U.S. dollars at that or any other rate. The rate of ¥120.61 = U.S.$1 as of December 31,
2015 has been used for the purpose of presentation.

3
Operating Performance Highlights and Financial Condition
Overview of the First Three Quarters of Fiscal 2015 (April 1 to December 31, 2015)
The global economic recovery in the first three quarters of the fiscal year lost momentum primarily due to
an economic deceleration in China and other emerging nations and plummeting resource prices. Regionally,
the U.S. economy continued to gradually expand, leading the FRB to raise interest rates in December after
seven years near zero, as job growth and an improved labor market fueled rising wages and buoyed
consumption. However, the Latin American economy slowed due to falling prices for natural resources, as
well as currency devaluations. The European economy as a whole continues to gradually recover, but
elements of uncertainty remain, such as the refugee problem and Russian recession. In Asia, China's
economy decelerated. Economic growth in ASEAN countries, which saw exports to China decrease, also
slowed. In India, however, the economy is recovering. In Japan, employment and the income environment
continued to improve partly in response to government fiscal and monetary policies, but the economy as a
whole tread water because these improvements were offset chiefly by export softness and inventory
adjustments.
The situation in the main markets of the Epson Group ("Epson") was as follows.
Inkjet printer demand was flat year on year in North America and Europe. Large-format inkjet printer
demand was firm in North America, Europe, and Japan, but demand in Latin America was subdued due to
the effects of economic deceleration. Demand for serial-impact dot-matrix (SIDM) printers continued to
contract in the Americas and Europe. Meanwhile, upgrade demand from the Chinese tax collection market
also shrank. Demand for point-of-sale (POS) system products remained stable in North America, Europe,
and Japan.
Projector demand was sluggish in the economically uncertain areas of Europe and Latin America, where
there was a backlash in demand from the surge that preceded last year's FIFA World Cup. Demand was
also subdued in Asia due to concerns about an economic downturn.
Cell phones and digital cameras are the main applications markets for Epson's electrical devices. In the cell
phone market, demand for feature phones continued to decline while demand for smart phones remained
firm. Demand in the digital camera market was subdued.
In the precision products market, demand for watches in Japan was strong, aided in part by demand from
overseas visitors. Demand was also firm in Europe, but demand in China was weak due to slack
consumption. Demand for industrial robots increased in the electronics and electrical machinery industry in
response to a growing need for automation.
At the start of the 2013 fiscal year Epson began working under an updated three-year plan called the SE15
Updated Mid-Range Business Plan (FY2013-15). We have been closely adhering to the strategic course
charted by the SE15 Long-Range Corporate Vision and, in line with the updated plan, are pursuing a basic
strategy of managing our businesses so that they create steady profit while avoiding the single-minded
pursuit of revenue growth. Our top priority has been steady profit and cash flow. To achieve this in existing
segments, we have readjusted our product mixes and adopted new business models. Meanwhile, we have
aggressively developed markets in new segments. We will continue to pursue a basic strategy of managing
our businesses so that they create steady profit and avoiding the single-minded pursuit of revenue growth
during the 2015 fiscal year, the final year of the updated mid-range business plan. The increased profits that
accompany this strategy will be used to fund strategic investments and spending for mid-term growth, with
an eye on further future growth.
The average exchange rates of the yen against the U.S. dollar and of the yen against the euro during the

4
first nine months of the fiscal year were ¥121.70 and ¥134.36, respectively. This represents a 14%
depreciation in the value of the yen against the dollar and a 4% appreciation in the value of the yen against
the euro, year on year. The yen appreciated against the currencies of some emerging countries in places
such as Latin America.
The foregoing factors are reflected in our financial results for the first three quarters. Revenue was ¥837.4
billion, up 2.8% year on year. Business profit was ¥72.7 billion, down 14.9% year on year. Profit from
operating activities was ¥81.9 billion, down 26.0% year on year. Profit before tax was ¥80.3 billion, down
28.7% year on year. Profit for the period was ¥55.2 billion, down 39.0% year on year.
Please note that profit from operating activities in the same period last year included a profit resulting from
changes in the defined-benefit plan in Japan that reduced past service costs by ¥30 billion. Note also that
profit in the same period last year included the effects of a reduction in tax expenses associated with the use
of loss carry-forwards.
A breakdown of the financial results in each reporting segment is provided below.
Note that the operations grouped within each segment changed effective in the first quarter of the current
accounting period in conjunction with a reorganization that took effect on April 1, 2015. The reorganization
was made to best position Epson for FY2016 and beyond, as well as to facilitate the achievement of the
Updated Mid-Range Business Plan. The printing systems business, which was included in the information-
related equipment segment, the label printer business, which was included in the visual communications
business of the former Information-related equipment segment, and the industrial inkjet printing systems
business, which was included in the former sensing and industrial solutions segment, were merged and are
reported under the printing solutions segment. Also, a new visual communications segment was created.
All the businesses in the former visual communications business, which was included in the former
information-related equipment segment, except the label printer business, are now reported under this
segment. In addition, the crystal devices, semiconductors, and precision products businesses, all of which
were included in the former devices and precision products segment, and the sensing systems and industrial
robots and IC handlers businesses, which were included in the former sensing and industrial solutions
segment, were merged. They are now reported under the wearable and industrial products segment.
Printing Solutions Segment
Printer business revenue increased, helped in part by foreign exchange effects.
Inkjet printer revenue increased despite a decline in ink cartridge printer shipments. Revenue jumped
because we continued to rapidly expand sales of high-capacity ink tank printers in Asia and elsewhere by
reinforcing the lineup and expanding the sales territory. Revenue from consumables also increased, the
result of an improved install base composition.
Page printer revenue decreased due to a decline in unit shipments, the result of Epson's focus on selling
high added value models.
SIDM printer revenue increased on the whole. Although unit shipments decreased due to the decline of the
total market, passbook printer sales increased in Europe and China due to replacement demand and system
upgrade demand.
Revenue in the professional printing business increased, helped in part by foreign exchange effects.
Large-format inkjet printer revenue grew despite the effects of steep currency devaluations and economic
deceleration in Latin America and China's slowing growth. This growth was driven by continued firm
demand in the large-photo and color calibration (proofing) markets and by an expanded range of
applications for inkjet textile printers, from apparel to small personal items and interior goods.
Consumables revenue also grew on increased use and demand for ink.

5
POS system product revenue grew primarily because of increased demand for compact receipt printers in
the Americas and Europe. Meanwhile, sales of label printers that enable on-demand in-house printing
increased along with a growing need for the use of color labels.
Segment profit in the printing solutions segment decreased due to a combination of factors, including ink
cartridge printer price competition in Japan and North America; the stronger U.S. dollar, which caused the
cost of products manufactured overseas to rise; and strategic investment and spending on mid-term growth.
As a result of the foregoing factors, revenue in the printing solutions segment was ¥561.5 billion, up 2.9%
year on year. Segment profit was ¥81.1 billion, down 11.4% year on year.
Visual Communications Segment
Visual communications revenue increased, owing in part to foreign exchange effects. 3LCD projector unit
shipments and revenue increased in North America, Asia, and Japan despite downward pressure caused by
the effects of a decrease in tender offers in the European and American education sector, steep currency
devaluations and economic deceleration in Latin America, and China's slowing growth.
Segment profit in the visual communications segment decreased primarily due to the decrease in education
tenders, which led to a decline in sales of high added value products, the appreciation of the dollar, which
caused manufacturing costs for products produced overseas to rise, and strategic investment and spending
on mid-term growth.
As a result of the foregoing factors, revenue in the visual communications segment was ¥141.2 billion, up
5.2% year on year. Segment profit was ¥13.1 billion, down 17.9% year on year.
Wearable and Industrial Products Segment
Revenue in the wearable products business increased due to the effect of higher average selling prices due
to an increase in sales of high-end watches and firm sales in Japan and Europe, as well as foreign exchange
effects.
Revenue in the robotic solutions business decreased after a large order for industrial robots caused sales to
jump in the same period last year, but if this order is excluded, sales grew on increased orders in China,
Japan, and Europe. IC handler revenue decreased due to a combination of slowing growth in
semiconductors for smartphones and dealer inventory adjustments.
Revenue in the microdevices business decreased despite foreign exchange effects. Sales of crystal devices
grew in the automotive sector, but revenue fell due to a combination of price erosion and a decline in unit
volume of products used in for cell phones and other personal electronics. Semiconductor revenue
decreased due to worsening market conditions.
The surface finishing business, which developed new customers, and the alloy powders business, which
reported strong sales of high-performance material powders for mobile equipment, both recorded revenue
growth.
Segment profit in the wearable and industrial products segment increased. This increase was due to revenue
growth in the surface finishing business and alloy powders business, as well as to the effect of cost
reductions in the microdevices business and the depreciation of local currencies, which lowered
manufacturing costs for goods produced overseas.
As a result of the foregoing factors, revenue in the wearable and industrial products segment was ¥134.8

6
billion, up 0.4% year on year. Segment profit was ¥11.7 billion, up 22.1% year on year.
Other
Other revenue amounted to ¥0.9 billion, up 0.4% year on year. Segment loss was ¥0.4 billion compared to a
¥0.2 billion segment loss in the same period last year.
Adjustments
Adjustments to the total profit of reporting segments amounted to negative ¥32.8 billion. (Adjustments in
the same period last year were negative ¥31.4 billion.) The loss mainly comprises selling, general and
administrative expenses for areas that do not correspond to the reporting segments, such as research and
development expenses for new businesses and basic technology, and general corporate expenses.
Qualitative Information Regarding the Consolidated Financial Position
Total assets at the end of the first three quarters were ¥1,002.2 billion, a decrease of ¥4.0 billion from the
previous fiscal year end. While trade and other receivables increased by ¥8.5 billion, inventories increased
by ¥2.4 billion, and property, plant and equipment increased by ¥9.5 billion, total assets decreased
primarily because cash and cash equivalents decreased by ¥26.0 billion due in part to the redemption of
bonds payable and the payment of dividends.
Total liabilities were ¥480.6 billion, down ¥28.3 billion compared to the end of the last fiscal year. This
decrease was mainly because of a ¥30.2 billion decrease in other financial liabilities included in current and
non-current liabilities accompanying the redemption of bonds payable.
The equity attributable to owners of the parent company totaled ¥518.6 billion, a ¥24.2 billion increase
compared to the previous fiscal year end. While we paid ¥25.0 billion in dividends, retained earnings
increased by ¥30.3 billion because we booked a ¥54.9 billion profit for the period. On the other hand, a
¥6.0 billion decrease in other components of equity, including a decrease in the exchange differences on
translation of foreign operations associated with the appreciation of the yen, caused equity attributable to
owners of the parent company to increase.
Qualitative Information Regarding the Consolidated Financial Outlook
The consolidated financial outlook for the full year has not changed since it was announced on October 29,
2015.
The assumed exchange rates for the fourth quarter are 115 yen to the U.S. dollar and 125 yen to the euro.
Consolidated Full-Year Financial Outlook
FY2014 Full-Year Previous Outlook (A) Current Outlook (B) Change (B - A)
Revenue ¥1,086.3 billion ¥1,100.0 billion ¥1,100.0 billion -
Business profit ¥101.2 billion ¥82.0 billion ¥82.0 billion -
Profit from operating
activities
¥131.3 billion ¥91.0 billion ¥91.0 billion -
Profit before tax ¥132.5 billion ¥88.0 billion ¥88.0 billion -
Profit for the period ¥112.7 billion ¥60.0 billion ¥60.0 billion -
Profit for the year
attributable to owners
of the parent company
¥112.5 billion ¥60.0 billion ¥60.0 billion -
Foreign exchange rates $1USD = ¥109.93 $1USD = ¥118.00 $1USD = ¥120.00
1 euro = ¥138.77 1 euro = ¥130.00 1 euro = ¥132.00

7
Quarterly Condensed Consolidated Statement of Financial Position
Thousands of
U.S. dollars
NotesMarch 31,
2015
December 31,
2015
December 31,
2015
Assets
Current assets
Cash and cash equivalents 9 245,330 219,288 1,818,157
Trade and other receivables 9 167,482 175,985 1,459,124
Inventories 220,426 222,839 1,847,599
Income tax receivables 1,963 4,630 38,388
Other financial assets 9 3,544 1,868 15,487
Other current assets 11,539 15,841 131,368
Subtotal 650,287 640,454 5,310,123
Non-current assets held for sale 96 - -
Total current assets 650,383 640,454 5,310,123
Non-current assets
Property, plant and equipment 227,257 236,803 1,963,377
Intangible assets 19,170 18,733 155,318
Investment property 4,758 2,339 19,393
Investments accounted for using the equity
method3,232 1,686 13,978
Net defined benefit assets 7 2 16
Other financial assets 9 25,345 26,174 217,013
Other non-current assets 5,958 5,312 44,056
Deferred tax assets 70,168 70,721 586,360
Total non-current assets 355,898 361,771 2,999,511
Total assets 1,006,282 1,002,225 8,309,634
Millions of yen

8
Thousands of
U.S. dollars
NotesMarch 31,
2015
December 31,
2015
December 31,
2015
Liabilities and equity
Liabilities
Current liabilities
Trade and other payables 9 140,047 141,352 1,171,975
Income tax payables 8,384 18,866 156,421
Other financial liabilities 6,9 75,745 75,364 624,856
Provisions 24,322 24,953 206,889
Other current liabilities 106,942 98,014 812,680
Total current liabilities 355,442 358,552 2,972,821
Non-current liabilities
Other financial liabilities 6,9 112,466 82,590 684,769
Net defined benefit liabilities 31,234 31,704 262,863
Provisions 6,141 4,278 35,469
Other non-current liabilities 2,977 2,522 20,938
Deferred tax liabilities 711 951 7,884
Total non-current liabilities 153,531 122,047 1,011,923
Total liabilities 508,973 480,600 3,984,744
Equity
Share capital 53,204 53,204 441,124
Capital surplus 84,321 84,321 699,121
Treasury shares (20,464) (20,470) (169,720)
Other components of equity 83,073 77,031 638,670
Retained earnings 294,191 324,537 2,690,796
Equity attributable to owners of the parent
company494,325 518,622 4,299,991
Non-controlling interests 2,982 3,003 24,899
Total equity 497,308 521,625 4,324,890
Total liabilities and equity 1,006,282 1,002,225 8,309,634
Millions of yen

9
Quarterly Condensed Consolidated Statement of Comprehensive Income
Nine months ended December 31, 2014 and 2015:
Thousands of U.S.
dollars
Notes 2014 2015
Revenue 5 814,805 837,422 6,943,221
Cost of sales (515,373) (532,528) (4,415,288)
Gross profit 299,431 304,894 2,527,933
Selling, general and administrative expenses (213,959) (232,119) (1,924,541)
Other operating income 33,901 13,171 109,203
Other operating expense (8,699) (4,037) (33,489)
Profit from operating activities 110,675 81,907 679,106
Finance income 3,297 1,362 11,292
Finance costs (1,531) (3,058) (25,337)
Share of profit of investments accounted for using the
equity method181 101 837
Profit before tax 112,622 80,314 665,898
Income taxes (20,958) (25,036) (207,578)
Profit from continuing operations 91,664 55,278 458,320
Loss from discontinued operations (1,045) (36) (299)
Profit for the period 90,618 55,242 458,021
Other comprehensive income
Items that will not be reclassified subsequently to profit
or loss, net of tax
Remeasurement of net defined benefit liabilities (assets) 13,271 405 3,357
Net gain (loss) on revaluation of financial assets
measured at FVTOCI (Note)1,425 630 5,224
Subtotal 14,697 1,035 8,581
Items that may be reclassified subsequently to profit
or loss, net of tax
Exchange differences on translation of foreign
operations33,869 (5,797) (48,081)
Net changes in fair value of cash flow hedges (38) (780) (6,467)
Share of other comprehensive income of investments
accounted for using the equity method213 (219) (1,815)
Subtotal 34,044 (6,798) (56,363)
Total other comprehensive income, net of tax 48,741 (5,762) (47,782)
Total comprehensive income for the period 139,359 49,479 410,239
(Note) FVTOCI: Fair Value Through Other Comprehensive Income
Millions of yen
Nine months ended
December 31,
Nine months ended
December 31,
2015

10
Thousands of U.S.
dollars
Notes 2014 2015
Profit for the period attributable to:
Owners of the parent company 90,476 54,969 455,766
Non-controlling interests 142 272 2,255
Profit for the period 90,618 55,242 458,021
Total comprehensive income for the period
attributable to:
Owners of the parent company 138,800 49,347 409,153
Non-controlling interests 559 131 1,086
Total comprehensive income for the period 139,359 49,479 410,239
U.S. dollars
Notes 2014 2015
Earnings per share for the period:
Basic earnings per share for the period 8 252.88 153.64 1.27
Earnings per share from continuing operations for the
period:
Basic earnings per share for the period 8 255.80 153.74 1.27
Earnings per share from discontinued operations for the
period:
Basic loss per share for the period 8 (2.92) (0.10) (0.00)
Millions of yen
Nine months ended
December 31,
Nine months ended
December 31,
2015
Yen
Nine months ended
December 31,
Nine months ended
December 31,
2015
11
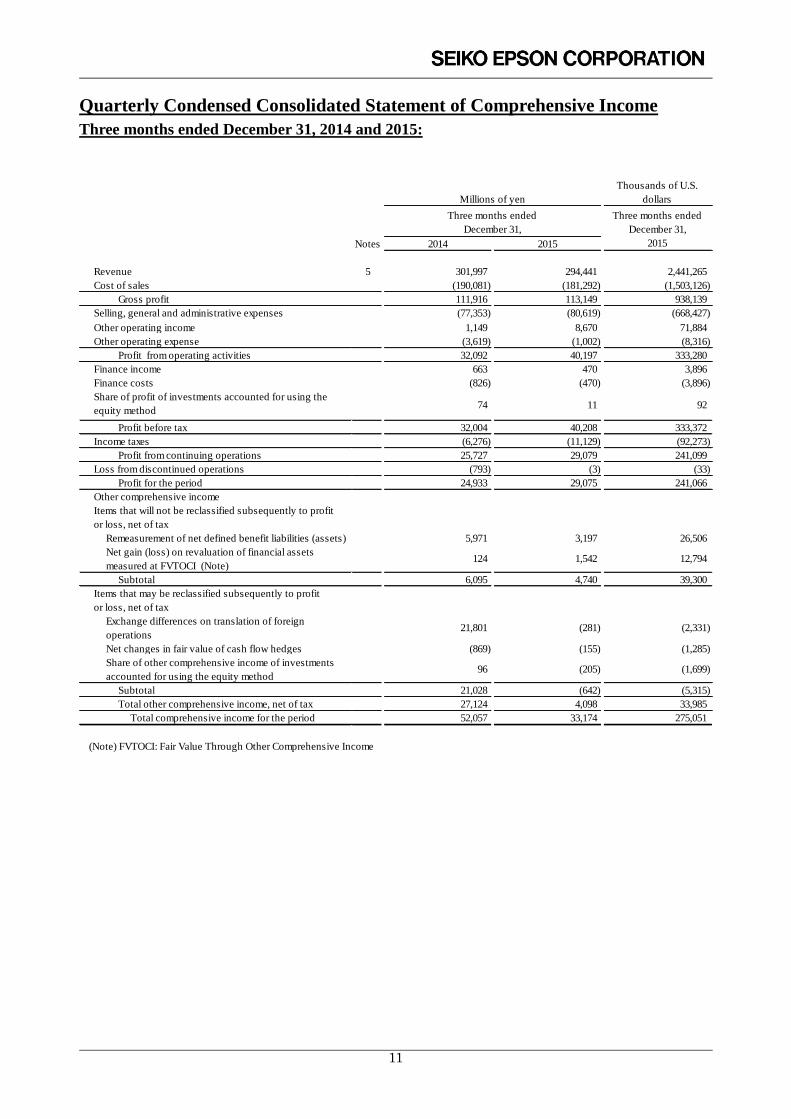
Quarterly Condensed Consolidated Statement of Comprehensive Income
Three months ended December 31, 2014 and 2015:
Thousands of U.S.
dollars
Notes 2014 2015
Revenue 5 301,997 294,441 2,441,265
Cost of sales (190,081) (181,292) (1,503,126)
Gross profit 111,916 113,149 938,139
Selling, general and administrative expenses (77,353) (80,619) (668,427)
Other operating income 1,149 8,670 71,884
Other operating expense (3,619) (1,002) (8,316)
Profit from operating activities 32,092 40,197 333,280
Finance income 663 470 3,896
Finance costs (826) (470) (3,896)
Share of profit of investments accounted for using the
equity method74 11 92
Profit before tax 32,004 40,208 333,372
Income taxes (6,276) (11,129) (92,273)
Profit from continuing operations 25,727 29,079 241,099
Loss from discontinued operations (793) (3) (33)
Profit for the period 24,933 29,075 241,066
Other comprehensive income
Items that will not be reclassified subsequently to profit
or loss, net of tax
Remeasurement of net defined benefit liabilities (assets) 5,971 3,197 26,506
Net gain (loss) on revaluation of financial assets
measured at FVTOCI (Note)124 1,542 12,794
Subtotal 6,095 4,740 39,300
Items that may be reclassified subsequently to profit
or loss, net of tax
Exchange differences on translation of foreign
operations21,801 (281) (2,331)
Net changes in fair value of cash flow hedges (869) (155) (1,285)
Share of other comprehensive income of investments
accounted for using the equity method96 (205) (1,699)
Subtotal 21,028 (642) (5,315)
Total other comprehensive income, net of tax 27,124 4,098 33,985
Total comprehensive income for the period 52,057 33,174 275,051
(Note) FVTOCI: Fair Value Through Other Comprehensive Income
Millions of yen
Three months ended
December 31,
Three months ended
December 31,
2015

12
Thousands of U.S.
dollars
Notes 2014 2015
Profit for the period attributable to:
Owners of the parent company 24,889 28,941 239,955
Non-controlling interests 44 134 1,111
Profit for the period 24,933 29,075 241,066
Total comprehensive income for the period
attributable to:
Owners of the parent company 51,762 33,117 274,587
Non-controlling interests 295 56 464
Total comprehensive income for the period 52,057 33,174 275,051
U.S. dollars
Notes 2014 2015
Earnings per share for the period:
Basic earnings per share for the period 8 69.57 80.89 0.67
Earnings per share from continuing operations for the
period:
Basic earnings per share for the period 8 71.79 80.90 0.67
Earnings per share from discontinued operations for the
period:
Basic loss per share for the period 8 (2.22) (0.01) (0.00)
Millions of yen
Three months ended
December 31,
Three months ended
December 31,
2015
Yen
Three months ended
December 31,
Three months ended
December 31,
2015

13
Quarterly Condensed Consolidated Statement of Changes in Equity
Nine months ended December 31, 2014 and 2015:
Notes
Remeasurement of net
defined benefit
liabilities (assets)
Net gain (loss) on
revaluation of financial
assets measured at
FVTOCI (Note)
Exchange differences
on translation of
foreign operations
Net changes in fair
value of cash flow
hedges
Total other
components of equity
As of April 1, 2014 53,204 84,321 (20,457) - 5,332 45,046 (662) 49,716 195,587 362,371 2,385 364,757
Profit for the period - - - - - - - - 90,476 90,476 142 90,618
Other comprehensive income - - - 13,271 1,493 33,597 (38) 48,324 - 48,324 416 48,741
Total comprehensive income for the period - - - 13,271 1,493 33,597 (38) 48,324 90,476 138,800 559 139,359
Acquisition of treasury shares - - (5) - - - - - - (5) - (5)
Dividends 7 - - - - - - - - (12,880) (12,880) (95) (12,975)
Transfer from other components of equity
to retained earnings - - - (13,271) (34) - - (13,306) 13,306 - - -
Total transactions with the owners - - (5) (13,271) (34) - - (13,306) 426 (12,885) (95) (12,981)
As of December 31, 2014 53,204 84,321 (20,463) - 6,790 78,644 (700) 84,734 286,490 488,286 2,849 491,135
(Note) FVTOCI: Fair Value Through Other Comprehensive Income
Millions of yen
Equity attributable to owners of the parent company
Non-controlling
interests
Total equity
Share capital Capital surplus Treasury shares
Other components of equity
Retained
earnings
Total equity
attributable to owners
of the parent
company

14
Notes
Remeasurement of net
defined benefit
liabilities (assets)
Net gain (loss) on
revaluation of financial
assets measured at
FVTOCI (Note)
Exchange differences
on translation of
foreign operations
Net changes in fair
value of cash flow
hedges
Total other
components of equity
As of April 1, 2015 53,204 84,321 (20,464) - 7,149 74,868 1,055 83,073 294,191 494,325 2,982 497,308
Profit for the period - - - - - - - - 54,969 54,969 272 55,242
Other comprehensive income - - - 405 642 (5,888) (780) (5,621) - (5,621) (140) (5,762)
Total comprehensive income for the period - - - 405 642 (5,888) (780) (5,621) 54,969 49,347 131 49,479
Acquisition of treasury shares - - (6) - - - - - - (6) - (6)
Dividends 7 - - - - - - - - (25,044) (25,044) (111) (25,155)
Transfer from other components of equity
to retained earnings - - - (405) (14) - - (419) 419 - - -
Total transactions with the owners - - (6) (405) (14) - - (419) (24,624) (25,050) (111) (25,162)
As of December 31, 2015 53,204 84,321 (20,470) - 7,776 68,979 274 77,031 324,537 518,622 3,003 521,625
(Note) FVTOCI: Fair Value Through Other Comprehensive Income
Notes
Remeasurement of net
defined benefit
liabilities (assets)
Net gain (loss) on
revaluation of financial
assets measured at
FVTOCI (Note)
Exchange differences
on translation of
foreign operations
Net changes in fair
value of cash flow
hedges
Total other
components of equity
As of April 1, 2015 441,124 699,121 (169,671) - 59,288 620,735 8,738 688,761 2,439,196 4,098,531 24,733 4,123,264
Profit for the period - - - - - - - - 455,766 455,766 2,255 458,021
Other comprehensive income - - - 3,357 5,315 (48,818) (6,467) (46,613) - (46,613) (1,169) (47,782)
Total comprehensive income for the period - - - 3,357 5,315 (48,818) (6,467) (46,613) 455,766 409,153 1,086 410,239
Acquisition of treasury shares - - (49) - - - - - - (49) - (49)
Dividends 7 - - - - - - - - (207,644) (207,644) (920) (208,564)
Transfer from other components of equity
to retained earnings - - - (3,357) (121) - - (3,478) 3,478 - - -
Total transactions with the owners - - (49) (3,357) (121) - - (3,478) (204,166) (207,693) (920) (208,613)
As of December 31, 2015 441,124 699,121 (169,720) - 64,482 571,917 2,271 638,670 2,690,796 4,299,991 24,899 4,324,890
(Note) FVTOCI: Fair Value Through Other Comprehensive Income
Millions of yen
Equity attributable to owners of the parent company
Non-controlling
interests
Total equity
Share capital Capital surplus Treasury shares
Other components of equity
Retained
earnings
Total equity
attributable to owners
of the parent
company
Thousands of U.S. dollars
Equity attributable to owners of the parent company
Non-controlling
interests
Total equity
Share capital Capital surplus Treasury shares
Other components of equity
Retained
earnings
Total equity
attributable to owners
of the parent
company

15
Quarterly Condensed Consolidated Statement of Cash Flows
Nine months ended December 31, 2014 and 2015:
Thousands of U.S. dollars
Nine months ended
December 31,
Notes 2014 2015 2015
Cash flows from operating activities
Profit for the period 90,618 55,242 458,021
Depreciation and amortisation 33,291 34,731 287,961
Impairment loss and reversal of impairment loss 2,906 (2,624) (21,756)
Finance (income) costs, net (1,766) 1,695 14,045
Share of (profit) loss of investments accounted for using the equity
method(181) (101) (837)
Loss (gain) on sales and disposal of property, plant and equipment,
intangible assets and investment property, net266 (7,145) (59,240)
Income taxes 20,958 25,036 207,578
Decrease (increase) in trade receivables (22,814) (8,086) (67,042)
Decrease (increase) in inventories (21,083) (3,663) (30,370)
Increase (decrease) in trade payables 13,868 3,573 29,624
Increase (decrease) in net defined benefit liabilities (26,854) 1,097 9,095
Other, net 8,199 (9,846) (81,644)
Subtotal 97,410 89,907 745,435
Interest and dividend income received 1,964 1,368 11,342
Interest expenses paid (1,163) (1,021) (8,465)
Payments for loss on litigation (859) (4,144) (34,358)
Income taxes paid (23,811) (17,696) (146,730)
Net cash provided by (used in) operating activities 73,540 68,413 567,224
Cash flows from investing activities
Proceeds from sales of investment securities 18 48 397
Purchase of property, plant and equipment (26,081) (44,530) (369,206)
Proceeds from sales of property, plant and equipment 194 343 2,843
Purchase of intangible assets (3,545) (4,987) (41,348)
Proceeds from sales of intangible assets 9 31 257
Proceeds from sales of investment property 620 13,834 114,700
Purchase of investments in subsidiaries (639) (500) (4,145)
Other, net (3,764) 1,017 8,442
Net cash provided by (used in) investing activities (33,188) (34,743) (288,060)
Cash flows from financing activities
Net increase (decrease) in current borrowings (13,004) 9,371 77,686
Repayment of non-current borrowings - (86) (713)
Proceeds from issuance of bonds issued 10,000 - -
Redemption of bonds issued (20,000) (40,000) (331,647)
Payments of lease obligations (223) (74) (613)
Dividends paid 7 (12,880) (25,044) (207,644)
Dividends paid to non-controlling interests (95) (111) (920)
Purchase of treasury shares (5) (6) (49)
Net cash provided by (used in) financing activities (36,209) (55,951) (463,900)
Effect of exchange rate changes on cash and cash equivalents 14,659 (3,919) (32,501)
Net increase (decrease) in cash and cash equivalents 18,801 (26,201) (217,237)
Cash and cash equivalents at beginning of period 211,510 245,330 2,034,076
Cash and cash equivalents at end of period 230,311 219,129 1,816,839
Millions of yen
Nine months ended
December 31,

16
Notes to Consolidated Financial Statements
1. Reporting Entity
Seiko Epson Corporation (the “Company”) is a stock corporation domiciled in Japan. The addresses of the
Company’s registered head office and principal business offices are available on the Company’s website
(http://www.epson.jp). The details of businesses and principal business activities of the Company and its affiliates
(“Epson”) are stated in “5. Segment Information”.
2. Basis of Preparation Epson’s quarterly condensed consolidated financial statements have been prepared in accordance with IAS 34
“Interim Financial Reporting”, under the provision of Article 93 of Ordinance on Terminology, Forms and
Preparation Methods of Quarterly Consolidated Financial Statements, as Epson meets the criteria of a “Specified
company” defined under Article 1-2 of Ordinance on Terminology, Forms and Preparation Methods of Quarterly
Consolidated Financial Statements.
The quarterly condensed consolidated financial statements of Epson do not contain all the information required in
annual consolidated financial statements, they should be used in combination with the consolidated financial
statements for the fiscal year ended March 31, 2015.
3. Changes in Accounting Policies and Changes in Accounting Estimates The significant accounting policies adopted for the quarterly condensed consolidated financial statements of Epson
are the same as those for the consolidated financial statements for the fiscal year ended March 31, 2015.
Epson calculated income taxes for the nine months ended December 31, 2015 based on an estimated average
annual effective income tax rate.
4. Significant Accounting Estimates and Judgments
The preparation of Epson’s quarterly condensed consolidated financial statements includes management estimates
and assumptions in order to measure income, expenses, assets and liabilities, and disclosed contingencies as of
December 31, 2015. These estimates and assumptions are based on the best judgment of management in light of
historical experience and various factors deemed to be reasonable as of December 31, 2015. Given their nature,
actual results may differ from those estimates and assumptions.
The estimates and assumptions are continuously reviewed by management. The effects of a change in estimates and
assumptions are recognised in the period of the change and its subsequent periods. Estimates and assumptions
having a significant effects on the amounts recognised in Epson’s quarterly condensed consolidated financial
statements are consistent with those for the fiscal year ended March 31, 2015.

17
5. Segment Information
(1) Outline of reportable segments The reportable segments of Epson are determined based on the operating segments that are components of Epson
about which separate financial information is available and are evaluated regularly by the Board of Directors in
deciding how to allocate resources and in assessing performance.
From the beginning of this fiscal year, Epson changed its organisational structure and the reportable segments into
three segments: “Printing Solutions”, “Visual Communications” and “Wearable & Industrial Products”.They are
determined by types of products, nature of products, and markets. Segment information for the nine months and
three months ended December 31, 2014 has been reclassified based on new reportable segments.
Epson conducts development, manufacturing and sales within its reportable segments as follows:
Reportable segments Main products
Printing Solutions Inkjet printers, serial impact dot matrix printers, page printers, color image scanners,
commercial inkjet printers, industrial inkjet printing systems, printers for use in POS
systems, label printers and related consumables, personal computers and others.
Visual Communications 3LCD projectors, HTPS-TFT panels for 3LCD projectors, smart eyewear and others.
Wearable & Industrial
Products
Watches, watch movements, sensing systems, industrial robots, IC handlers, crystal
units, crystal oscillators, quartz sensors, CMOS LSIs, Metal powders, surface
finishing and others.
(2)Revenues and performances for reportable segments
Revenues and performances for reportable segments were as follows. Transactions between the segments were
mainly based on prevailing market prices.
FY2014: Nine months ended December 31, 2014 Millions of yen Reportable segments
Other
(Note 2)
Adjustments (Note 3)
Consolidated Printing
Solutions
Visual Communi-
cations
Wearable &
Industrial
Products Subtotal
Revenue External revenue 545,520 134,065 129,787 809,373 556 4,875 814,805
Inter-segment revenue 266 170 4,460 4,897 434 (5,332) -
Total revenue 545,787 134,235 134,247 814,271 991 (456) 814,805
Segment profit (loss)
(Business profit (loss))
(Note 1)
91,578 16,036 9,613 117,228 (263) (31,492) 85,472
Other operating income (expense) 25,202
Profit from operating activities 110,675
Finance income (costs), net 1,766
Share of profit of investments accounted for using the equity method
181
Profit before tax 112,622
(Note 1) Segment profit (loss) (Business profit (loss)) is calculated by subtracting cost of sales and selling,
general and administrative expenses from revenue. (Note 2) “Other” mainly consists of the intra-group services.
(Note 3) Adjustments to Segment profit (loss) (Business profit (loss)) of (¥31,492) million comprised
“Eliminations” of ¥187 million and “Corporate expenses” of (¥31,680) million. The corporate expenses included
expenses relating to research and development for new businesses and basic technology, and general corporate
expenses which are not attributed to reportable segments.

18
FY2015: Nine months ended December 31, 2015
Millions of yen
Reportable segments
Other (Note 2)
Adjustments (Note 3)
Consolidated
Printing
Solutions
Visual Communi-
cations
Wearable &
Industrial
Products Subtotal
Revenue
External revenue 561,321 141,200 129,975 832,496 504 4,421 837,422
Inter-segment revenue 261 35 4,827 5,125 490 (5,615) -
Total revenue 561,583 141,235 134,802 837,621 994 (1,193) 837,422
Segment profit (loss) (Business profit (loss)) (Note 1)
81,180 13,166 11,737 106,084 (491) (32,818) 72,774
Other operating income (expense)
9,133
Profit from operating activities 81,907
Finance income (costs), net (1,695)
Share of profit of investments accounted for using the equity method
101
Profit before tax 80,314
(Note 1) Segment profit (loss) (Business profit (loss)) is calculated by subtracting cost of sales and selling,
general and administrative expenses from revenue. (Note 2) “Other” mainly consists of the intra-group services.
(Note 3) Adjustments to Segment profit (loss) (Business profit (loss)) of (¥32,818) million comprised
“Eliminations” of ¥356 million and “Corporate expenses” of (¥33,175) million. The corporate expenses included
expenses relating to research and development for new businesses and basic technology, and general corporate
expenses which are not attributed to reportable segments.

19
FY2015: Nine months ended December 31, 2015
Thousands of US dollars
Reportable segments
Other (Note 2)
Adjustments (Note 3)
Consolidated
Printing
Solutions
Visual Communi-
cations
Wearable &
Industrial
Products Subtotal
Revenue
External revenue 4,654,017 1,170,715 1,077,647 6,902,379 4,178 36,664 6,943,221
Inter-segment revenue 2,181 290 40,021 42,492 4,063 (46,555) -
Total revenue 4,656,198 1,171,005 1,117,668 6,944,871 8,241 (9,891) 6,943,221
Segment profit (loss) (Business profit (loss)) (Note 1)
673,088 109,161 97,313 879,562 (4,070) (272,100) 603,392
Other operating income (expense)
75,714
Profit from operating activities 679,106
Finance income (costs), net (14,045)
Share of profit of investments accounted for using the equity method
837
Profit before tax 665,898
(Note 1) Segment profit (loss) (Business profit (loss)) is calculated by subtracting cost of sales and selling,
general and administrative expenses from revenue. (Note 2) “Other” mainly consists of the intra-group services.
(Note 3) Adjustments to Segment profit (loss) (Business profit (loss)) of ($272,100) thousand comprised
“Eliminations” of $2,960 thousand and “Corporate expenses” of ($275,060) thousand. The corporate expenses
included expenses relating to research and development for new businesses and basic technology, and general
corporate expenses which are not attributed to reportable segments.

20
FY2014: Three months ended December 31, 2014 Millions of yen Reportable segments
Other
(Note 2)
Adjustments (Note 3)
Consolidated Printing
Solutions
Visual Communi-
cations
Wearable &
Industrial
Products Subtotal
Revenue External revenue 209,625 47,283 42,792 299,701 224 2,071 301,997
Inter-segment revenue 92 79 1,612 1,784 144 (1,929) -
Total revenue 209,717 47,362 44,405 301,485 369 142 301,997
Segment profit (loss)
(Business profit (loss))
(Note 1)
36,331 5,314 3,727 45,373 (66) (10,744) 34,562
Other operating income (expense) (2,469)
Profit from operating activities 32,092
Finance income (costs), net (162)
Share of profit of investments accounted for using the equity method
74
Profit before tax 32,004
(Note 1) Segment profit (loss) (Business profit (loss)) is calculated by subtracting cost of sales and selling,
general and administrative expenses from revenue. (Note 2) “Other” mainly consists of the intra-group services.
(Note 3) Adjustments to Segment profit (loss) (Business profit (loss)) of (¥10,744) million comprised
“Eliminations” of ¥109 million and “Corporate expenses” of (¥10,854) million. The corporate expenses included
expenses relating to research and development for new businesses and basic technology, and general corporate
expenses which are not attributed to reportable segments.

21
FY2015: Three months ended December 31, 2015
Millions of yen
Reportable segments
Other (Note 2)
Adjustments (Note 3)
Consolidated
Printing
Solutions
Visual Communi-
cations
Wearable &
Industrial
Products Subtotal
Revenue
External revenue 204,831 46,067 41,802 292,700 209 1,531 294,441
Inter-segment revenue 94 0 1,539 1,634 159 (1,794) -
Total revenue 204,925 46,067 43,342 294,335 368 (262) 294,441
Segment profit (loss) (Business profit (loss)) (Note 1)
37,145 4,318 2,744 44,208 (169) (11,509) 32,529
Other operating income (expense)
7,668
Profit from operating activities 40,197
Finance income (costs), net (0)
Share of profit of investments accounted for using the equity method
11
Profit before tax 40,208
(Note 1) Segment profit (loss) (Business profit (loss)) is calculated by subtracting cost of sales and selling,
general and administrative expenses from revenue. (Note 2) “Other” mainly consists of the intra-group services.
(Note 3) Adjustments to Segment profit (loss) (Business profit (loss)) of (¥11,509) million comprised
“Eliminations” of ¥118 million and “Corporate expenses” of (¥11,628) million. The corporate expenses included
expenses relating to research and development for new businesses and basic technology, and general corporate
expenses which are not attributed to reportable segments.

22
FY2015: Three months ended December 31, 2015
Thousands of US dollars
Reportable segments
Other (Note 2)
Adjustments (Note 3)
Consolidated
Printing
Solutions
Visual Communi-
cations
Wearable &
Industrial
Products Subtotal
Revenue
External revenue 1,698,293 381,950 346,596 2,426,839 1,733 12,693 2,441,265
Inter-segment revenue 787 0 12,760 13,547 1,318 (14,865) -
Total revenue 1,699,080 381,950 359,356 2,440,386 3,051 (2,172) 2,441,265
Segment profit (loss) (Business profit (loss)) (Note 1)
307,984 35,801 22,751 366,536 (1,401) (95,423) 269,712
Other operating income (expense)
63,568
Profit from operating activities 333,280
Finance income (costs), net (0)
Share of profit of investments accounted for using the equity method
92
Profit before tax 333,372
(Note 1) Segment profit (loss) (Business profit (loss)) is calculated by subtracting cost of sales and selling,
general and administrative expenses from revenue. (Note 2) “Other” mainly consists of the intra-group services.
(Note 3) Adjustments to Segment profit (loss) (Business profit (loss)) of ($95,423) thousand comprised
“Eliminations” of $986 thousand and “Corporate expenses” of ($96,409) thousand. The corporate expenses
included expenses relating to research and development for new businesses and basic technology, and general
corporate expenses which are not attributed to reportable segments.

23
6. Other Financial Liabilities
The breakdown of “Other financial liabilities” was as follows:
(Note 1) Issuance of “Bonds issued”
The bonds issued for the nine months ended December 31, 2014 were as follows:
There were not any bonds issued for the nine months ended December 31, 2015.
(Note 2) Redemption of “Bonds issued”
The bonds issued redeemed for the nine months ended December 31, 2014 were as follows:
Thousands of
U.S. dollars
March 31, 2015 December 31, 2015 December 31, 2015
Derivative financial liabilities 259 297 2,462
Current borrowings 35,380 45,008 373,169
Current portion of non-current
borrowings53 - -
Current portion of bonds issued 39,978 29,980 248,569
Non-current borrowings 50,533 50,500 418,704
Bonds issued (Note 1) (Note 2) 59,853 29,921 248,080
Other 2,153 2,248 18,641
Total 188,211 157,955 1,309,625
Current liabilities 75,745 75,364 624,856
Non-current liabilities 112,466 82,590 684,769
Total 188,211 157,955 1,309,625
Millions of yen
FY2014: Nine months ended December 31, 2014
% Millions of yen
Interest rateTotal amount of
issuance
June 13, 2014 0.35 June 13, 2019 10,000
Company Bonds name Issue date Maturity date
The CompanyThe 12th Series unsecured straight bonds
(with inter-bond pari passu clause)
FY2014: Nine months ended December 31, 2014
% Millions of yen
Interest rateTotal amount of
issuance
0.49 June 13, 2014 20,000
Company Bonds name Issue date Maturity date
The CompanyThe 6th Series unsecured straight bonds
(with inter-bond pari passu clause)June 14, 2011

24
The bonds issued redeemed for the nine months ended December 31, 2015 were as follows:
Derivative financial liabilities were classified as financial liabilities measured at fair value through profit or loss
excluding those which hedge accounting was applied to, and bonds issued and borrowings were classified as
financial liabilities measured at amortised cost. There were no financial covenants on bonds issued and
borrowings that had a significant impact on Epson's financing activities.
FY2015: Nine months ended December 31, 2015
% Millions of yen
Thousands of
U.S. dollars
Interest rateTotal amount of
issuance
Total amount of
issuance
Company Bonds name Issue date Maturity date
The CompanyThe 8th Series unsecured straight bonds
(with inter-bond pari passu clause)September 12, 2012 0.55 September 11, 2015
20,000 165,823The CompanyThe 5th Series unsecured straight bonds
(with inter-bond pari passu clause)September 3, 2010 0.58 September 3, 2015
20,000 165,823

25
7. Dividends
Dividends paid were as follows:
(Note) The Company completed the Company’s ordinary shares split with an effective date of April 1, 2015
based on the resolution by the Company’s Board of Directors on January 30, 2015. Dividends per share whose
basis date was prior to March 31, 2015 was stated by the actual dividends paid which was before the shares split.
FY2014: Nine months ended December 31, 2014
Millions of yen Yen
Total dividendsDividends
per share
FY2015: Nine months ended December 31, 2015
Millions of yen Yen
Total dividendsDividends
per share
FY2015: Nine months ended December 31, 2015
Thousands of U.S.
dollars U.S. dollars
Total dividendsDividends
per share
0.24September 30,
2015
Board of Directors
(October 29, 2015)Ordinary shares 88,989
March 31, 2015 June 26, 2015Annual Shareholders Meeting
(June 25, 2015)Ordinary shares 118,655 0.66
(Resolution) Class of shares Basis date Effective date
Effective date
Annual Shareholders Meeting
(June 25, 2015)Ordinary shares 14,311 80 March 31, 2015 June 26, 2015
September 30,
2014
(Resolution) Class of shares Basis date
June 25, 2014
(Resolution) Class of shares Basis date Effective date
Annual Shareholders Meeting
(June 24, 2014)Ordinary shares 6,618
Board of Directors
(October 31, 2014)Ordinary shares 6,261
37 March 31, 2014
December 4,
2015
December 5,
2014
Board of Directors
(October 29, 2015)Ordinary shares 10,733 30
September 30,
2015
December 4,
2015
35

26
8. Earnings per Share
Basis of calculating basic earnings per share
(1) Profit attributable to ordinary shareholders of the parent company
(2)Weighted-average number of ordinary shares outstanding during the period
Thousands of shares
Nine months ended December 31, 2014
Nine months ended December 31, 2015
Weighted-average number of
ordinary shares 357,779 357,775
(Note) The Company completed the Company’s ordinary shares split with an effective date of April 1, 2015
based on the resolution by the Company’s Board of Directors on January 30, 2015. As a result, each share of the
Company's ordinary shares was split into two shares. Basic earnings per share was calculated under the
assumption that the shares split took effect at the beginning of the previous fiscal year.
Millions of yen
Thousands of
U.S. dollars
Nine months ended
December 31, Nine months ended
December 31,
2014 2015 2015
Profit from continuing operations
attributable to owners of the parent
company
91,521 55,005 456,065
Loss from discontinued operations
attributable to owners of the parent
company
(1,045) (36) (299)
Profit used for calculation of basic
earnings per share 90,476 54,969 455,766
Millions of yen
Thousands of
U.S. dollars
Three months ended
December 31, Three months ended
December 31,
2014 2015 2015
Profit from continuing operations
attributable to owners of the parent
company
25,683 28,944 239,988
Loss from discontinued operations
attributable to owners of the parent
company
(793) (3) (33)
Profit used for calculation of basic
earnings per share 24,889 28,941 239,955

27
Thousands of shares
Three months ended December 31, 2014
Three months ended December 31, 2015
Weighted-average number of
ordinary shares 357,778 357,775
(Note) The Company completed the Company’s ordinary shares split with an effective date of April 1, 2015
based on the resolution by the Company’s Board of Directors on January 30, 2015. As a result, each share of the
Company's ordinary shares was split into two shares. Basic earnings per share was calculated under the
assumption that the shares split took effect at the beginning of the previous fiscal year.

28
9. Fair Value of Financial Instruments
(1) Fair value measurement The fair values of financial assets and liabilities are determined as follows:
(Derivatives)
The fair values are calculated based on prices obtained from financial institutions.
(Equity securities and bonds receivable)
When market values for equity securities and bonds receivable are available, such values are used as the fair
values. The fair values of the equity securities and bonds receivable whose market values are unavailable are
measured by using the discounted cash flow method, price comparison method based on the prices of similar
types of securities and bonds and other valuation methods.
(Borrowings)
As current borrowings are settled on a short-term basis, the fair values approximate their carrying amounts. For
non-current borrowings with floating rates, it is assumed that the fair value is equal to the carrying amounts,
because the rates are affected in the short term by fluctuations in market interest rates, and because Epson’s credit
status has not greatly changed since they were implemented. The fair values of non-current borrowings with
fixed rates are calculated by the total sum of the principal and interest discounted by using the interest rates that
would be applied if similar new borrowings were conducted.
(Bonds issued)
The fair values of bonds issued are determined based on market prices.
(Lease obligations)
The fair values are calculated based on the present value of the total amount discounted by the interest rate
corresponding to the period to maturity and the credit risk per each lease obligation classified per certain period.
(Other)
Other financial instruments are settled mainly on a short-term basis, and the fair values approximate the carrying
amounts.

29
(2) Fair values of financial instruments
The carrying amounts and the fair values of the financial instruments were as follows:
Carrying
amountFair value
Carrying
amountFair value
Carrying
amountFair value
Financial assets measured at
fair value
Derivative financial assets 3,181 3,181 1,491 1,491 12,362 12,362
Equity securities 19,639 19,639 20,325 20,325 168,518 168,518
Financial assets measured at
amortised cost
Cash and cash equivalents 245,330 245,330 219,288 219,288 1,818,157 1,818,157
Trade and other receivables 167,482 167,482 175,985 175,985 1,459,124 1,459,124
Bonds receivable 108 108 93 93 771 771
Other 5,960 5,960 6,132 6,132 50,849 50,849
Financial liabilities measured at
fair value
Derivative financial liabilities 259 259 297 297 2,462 2,462
Financial liabilities measured at
amortised cost
Trade and other payables 140,047 140,047 141,352 141,352 1,171,975 1,171,975
Interest-bearing debt
Borrowings 85,966 86,118 95,508 95,633 791,873 792,911
Bonds issued 99,831 100,466 59,901 60,319 496,649 500,116
Lease obligations 180 180 262 262 2,172 2,172
Other 1,973 1,973 1,985 1,985 16,469 16,469
Millions of yen Thousands of U.S. dollars
March 31, 2015 December 31, 2015 December 31, 2015

30
(3) Fair value hierarchy The fair value hierarchy of financial instruments is categorized from Level 1 to Level 3 as follows:
Level 1: Fair value measured at quoted prices in active markets for identical assets or liabilities
Level 2: Fair value calculated using inputs other than quoted prices included within Level 1 that are observable,
either directly or indirectly
Level 3: Fair value calculated using valuation techniques including unobservable inputs for the assets and
liabilities
Epson does not have any financial instruments for which there is significant measurement uncertainty and
subjectivity which needs to subdivide each level stated above for disclosure.
The transfers between levels in the fair value hierarchy are deemed to have occurred at the end of the reporting
period.
Classification by hierarchy regarding financial assets and liabilities measured at fair value
There were no transfers of financial instruments between Level 1 and Level 2 of the fair value hierarchy at the
end of each reporting period.
FY2014: As of March 31, 2015
Level 1 Level 2 Level 3 Total
Financial assets
Derivative financial assets - 3,181 - 3,181
Equity securities 17,232 - 2,406 19,639
Total 17,232 3,181 2,406 22,821
Financial liabilities
- 259 - 259
Total - 259 - 259
FY2015: As of December 31, 2015
Level 1 Level 2 Level 3 Total
Financial assets
Derivative financial assets - 1,491 - 1,491
Equity securities 18,266 - 2,059 20,325
Total 18,266 1,491 2,059 21,816
Financial liabilities
- 297 - 297
Total - 297 - 297
FY2015: As of December 31, 2015
Level 1 Level 2 Level 3 Total
Financial assets
Derivative financial assets - 12,362 - 12,362
Equity securities 151,447 - 17,071 168,518
Total 151,447 12,362 17,071 180,880
Financial liabilities
- 2,462 - 2,462
Total - 2,462 - 2,462
Millions of yen
Derivative financial liabilities
Millions of yen
Derivative financial liabilities
Thousands of U.S. dollars
Derivative financial liabilities

31
The movement of financial instruments categorized within Level 3 of the fair value hierarchy was as follows:
10. Contingencies
Material litigation
In general, litigation has uncertainties and it is difficult to make reliable judgments for the possibility of an
outflow of resources embodying economic benefits and to estimate the financial effect.
Provisions are not recognised either if an outflow of resources embodying economic benefits is not probable or to
estimate the financial effect is not practicable. Epson was contending the following material actions.
(1) The liquid crystal display price-fixing cartel The civil actions have been brought against the Company and certain of its consolidated subsidiaries by multiple
customers in the U.S, regarding allegations of involvement in a liquid crystal display price-fixing cartel.
Moreover, the Company and certain of its consolidated subsidiaries are currently under investigation by a certain
anti-monopoly-related authority.
(2) The civil action on copyright fee of ink-jet printers In June 2010, Epson Europe B.V. (“EEB”), a consolidated subsidiary of the Company, brought a civil suit
against La SCRL Reprobel (“Reprobel”), a Belgium-based group that collects copyright royalties, seeking
restitution for copyright royalties for multifunction printers. After that, Reprobel also brought a civil suit against
EEB. As a result, these two lawsuits were adjoined. EEB’s claims were rejected at the first trial, but EEB,
dissatisfied with the decision, intends to appeal.
Verwertungsgesellschaft Wort (“VG Wort"), the organization for collecting copyright fees on behalf of copyright
holders in Germany, filed a civil lawsuit in January 2004 against Epson Deutschland GmbH (“EDG”), a
consolidated subsidiary of the Company, seeking payment of copyright fees for single-function printers. While
taking the court procedures, EDG had settlement discussions with VG Wort through Bundesverband
Informationswirtschaft, Telekommunikation und neue Medien e.V. (“BITKOM”), a German business association
of IT industry. Finally, BITKOM and VG Wort reached an agreement to settle, upon which the court dismissed
the case and it was closed.
11. Subsequent Events
No material subsequent events were identified.
Millions of yen
Thousands of
U.S. dollars
Nine months ended
December 31, Nine months ended
December 31,
2014 2015 2015
Balance as of April 1 2,606 2406 19,948
Gains and losses
Other comprehensive income (13) (317) (2,629)
Sales (25) (30) (248)
Balance as of December 31 2,567 2,059 17,071

Supplementary Information
Consolidated Third Quarter ended December 31, 2015
Cautionary Statement
This report includes forward-looking statements that are based on management’s view
from the information available at the time of the announcement. These statements are
subject to various risks and uncertainties. Actual results may be materially different
from those discussed in the forward-looking statements. The factors that may affect
Epson include, but are not limited to, general economic conditions, the ability of
Epson to continue to timely introduce new products and services in markets,
consumption trends, competition, technology trends, and exchange rate fluctuations.

1. Revenue by division
s-1
(Unit: billion yen)
Note: 1.The segment information figures for FY2014 have been recalculated using the method used in FY2015.
2.The intra-group services business was categorized within “Other”.
Increase
%
2014 2015 2016 %
545.7 561.5 2.9% 742.0 1.5%
Printers 383.5 398.6 3.9% 525.0 2.7%
Professional Printing 147.1 152.3 3.5% 200.0 0.4%
Other 16.6 12.4 (25.3%) 20.0 (11.3%)
Inter-segment revenue (1.4) (1.7) -% (3.0) -%
134.2 141.2 5.2% 180.0 1.6%
134.2 134.8 0.4% 176.0 1.5%
Wearable Products 44.8 48.8 8.8% 63.0 10.4%
Robotics Solutions 12.6 11.9 (5.7%) 16.0 2.5%
Microdevices,Other 82.1 79.7 (3.0%) 104.0 (3.6%)
Inter-segment revenue (5.4) (5.6) -% (7.0) -%
0.9 0.9 0.4% 1.0 (28.1%)
(0.4) (1.1) -% 1.0 (70.7%)
814.8 837.4 2.8% 1,100.0 1.3%
Visual Communications
Nine months ended
December 31,
Forecast for the year ended
March 31,
Increase
compared to
year ended
March 31,
2015
Printing Solutions
Wearable & Industrial Products
Other
Corporate expenses & Eliminations
Consolidated revenue

2. Business segment information
s-2
Note: 1.The segment information figures for FY2014 have been recalculated using the method used in FY2015.
2.The intra-group services business was categorized within “Other”.
2014 2015 2016 %
Revenue:
External 545.5 561.3 2.9% 742.0 1.6%
Inter-segment 0.2 0.2 (1.9%) 0.0 -%
Total 545.7 561.5 2.9% 742.0 1.5%
Segment profit (loss) 91.5 81.1 (11.4%) 99.0 (11.2%)
Revenue:
External 134.0 141.2 5.3% 180.0 1.7%
Inter-segment 0.1 0.0 (79.0%) 0.0 -%
Total 134.2 141.2 5.2% 180.0 1.6%
Segment profit (loss) 16.0 13.1 (17.9%) 16.0 (17.6%)
Revenue:
External 129.7 129.9 0.1% 170.0 1.4%
Inter-segment 4.4 4.8 8.2% 6.0 1.9%
Total 134.2 134.8 0.4% 176.0 1.5%
Segment profit (loss) 9.6 11.7 22.1% 12.0 16.1%
Revenue:
External 0.5 0.5 (9.3%) 0.0 -%
Inter-segment 0.4 0.4 12.8% 1.0 71.9%
Total 0.9 0.9 0.4% 1.0 (28.1%)
Segment profit (loss) (0.2) (0.4) -% (1.0) -%
Revenue:
External 4.8 4.4 (9.3%) 8.0 (23.6%)
Inter-segment (5.3) (5.6) -% (7.0) -%
Total (0.4) (1.1) -% 1.0 (70.7%)
Segment profit (loss) (31.4) (32.8) -% (44.0) -%
Revenue 814.8 837.4 2.8% 1,100.0 1.3%
Business profit (loss) 85.4 72.7 (14.9%) 82.0 (19.0%)
Increase
%
Forecast for the year ended
March 31,
Increase
compared to
year ended
March 31,
2015
Visual Communications
Wearable & Industrial Products
Other
Corporate expenses & Eliminations
Consolidated
Printing Solutions
Nine months ended
December 31,
(Unit: billion yen)

3. Revenue to overseas customers
4. Capital expenditure / Depreciation and amortization
s-3
(Unit: billion yen)
(Unit: billion yen)
Note: 1.The segment information figures for FY2014 have been recalculated using the method used in FY2015.
2.The intra-group services business was categorized within “Other”.
Increase Increase
2014 2015 %
The Americas 218.0 243.4 25.4 11.7%
Europe 177.1 171.1 (6.0) (3.4%)
Asia/Oceania 206.7 223.3 16.5 8.0%
Total 601.9 637.9 36.0 6.0%
814.8 837.4 22.6 2.8%
Percentage of overseas revenue to
consolidated revenue (%)
The Americas 26.8 29.1
Europe 21.7 20.4
Asia/Oceania 25.4 26.7
Total 73.9 76.2
The Americas
Europe The United Kingdom, the Netherlands, Germany, France, Italy, Spain, Portugal and Russia etc.
Asia/Oceania
The United States, Canada, Brazil, Chile, Argentina, Costa Rica, Colombia, Venezuela, Mexico and Peru
etc.
China (including Hong Kong), Singapore, Malaysia, Taiwan, Thailand, the Philippines, Australia, New
Zealand, Indonesia, Korea and India etc.
The name of main countries and jurisdictions
Nine months ended
December 31,
Overseas Revenue
Consolidated revenue
Geographic Segment
Increase
2014 2015 % 2016 %
29.3 45.4 55.0% 70.0 54.1%
Printing Solutions 15.5 25.3 63.0% 39.0 75.8%
Visual Communications 4.6 6.3 35.4% 10.0 45.4%
Wearable & Industrial Products 4.2 5.9 42.0% 9.0 7.6%
Other / Coporate expenses 4.8 7.7 59.3% 12.0 50.0%
32.9 34.3 4.2% 47.0 5.7% Depreciation and amortization
Nine months ended
December 31,
Forecast for the
year ended
March 31,
Increase
compared to
year ended
March 31,
2015
Capital expenditure
Note: 1.Overseas revenue is based on the location of the customers.
Principal countries and jurisdictions in each geographic segment are as follows.
2.Exports transacted through an intermediary such as trading companies are not included in oversea revenue.

5. Research and development
6. Management indices
7. Foreign exchange fluctuation effect on revenue and business profit
s-4
(Unit: billion yen)
(Unit: %)
Note: 1.ROE=Profit for the period attributable to owners of the parent company / Beginning and ending balance average equity
attributable to owners of the parent company
2.ROA(Business profit)=Business profit / Beginning and ending balance average total assets
3.ROA(Profit from operating activities)=Profit from operating activities / Beginning and ending balance average total assets
4.ROS(Business profit)= Business profit / Revenue
5.ROS(Profit from operating activities)= Profit from operating activities / Revenue
Note: 1.Foreign exchange effect = (Foreign currency revenue or business profit for the period) x (Average exchange rate for the period
– Average exchange rate for the same prior period)
2.Transactions in Latin American currencies are calculated in those currencies from the third quarter (nine months ended
December 31, 2015). In previous supplementary information, Latin American currencies were calculated and shown as USD
transactions.
(Unit: billion yen)
Increase
2014 2015 % 2016 %
35.5 39.3 10.6% 55.0 15.0%
4.4% 4.7% 5.0%
Nine months ended
December 31,
Forecast for the
year ended
March 31,
Increase
compared to
year ended
March 31,
2015
Research and Development
R&D / revenue ratio
Increase
2014 2015 Point 2016 Point
21.3% 10.9% (10.4) 11.8% (14.5)
8.8% 7.2% (1.6) 8.2% (2.4)
11.4% 8.2% (3.2) 9.1% (4.6)
10.5% 8.7% (1.8) 7.5% (1.8)
13.6% 9.8% (3.8) 8.3% (3.8)
Forecast for the
year ended
March 31,
Increase
compared to
year ended
March 31,
2015
ROE
ROA (Business profit)
ROA (Profit from operating activities)
ROS (Business profit)
ROS (Profit from operating activities)
Nine months ended
December 31,
2014 2015
30.4
U.S. dollars 32.2
Euro (6.0)
Other 4.2
(10.8)
U.S. dollars (4.7)
Euro (4.2)
Other (1.8)
Yen / U.S. dollars 106.87 121.70
Yen / Euro 140.30 134.36
Nine months ended
December 31,
Foreign exchange effect on revenue
Foreign exchange effect on business profit
Exchange rate

8. Inventory
9. Employees
s-5
(Unit: billion yen)
Note: 1.Turnover by days = Ending (Interim) balance of inventory / Prior 9months (Prior 12 months) revenue per day
2.The intra-group services business was categorized within “Other”.
(Unit: person)
December 31, March 31, December 31, Increase compared to
2014 2015 2015 March 31, 2015
70,632 69,878 69,314 (564)
Domestic 18,194 18,627 18,670 43
Overseas 52,438 51,251 50,644 (607)
Number of employees at period end
December 31, March 31, December 31, Increase compared to
2014 2015 2015 March 31, 2015
228.6 220.4 222.8 2.4
Printing Solutions 130.0 121.6 124.2 2.5
Visual Communications 53.2 53.4 52.7 (0.7)
Wearable & Industrial Products 44.5 44.5 45.0 0.4
Other / Coporate expenses 0.6 0.6 0.7 0.0
77 74 73 (1)
Printing Solutions 66 61 61 0
Visual Communications 109 110 103 (7)
Wearable & Industrial Products 91 94 92 (2)
Other / Coporate expenses 32 21 39 18
Inventory
Turnover by days