Embed Size (px)
Citation preview

- 1 -
FY2017
Consolidated Financial Forecasts (April 1, 2016 through March 31, 2017)
May 26, 2016
AISIN SEIKI Co., Ltd. (http://www.aisin.com/)
- 2 -
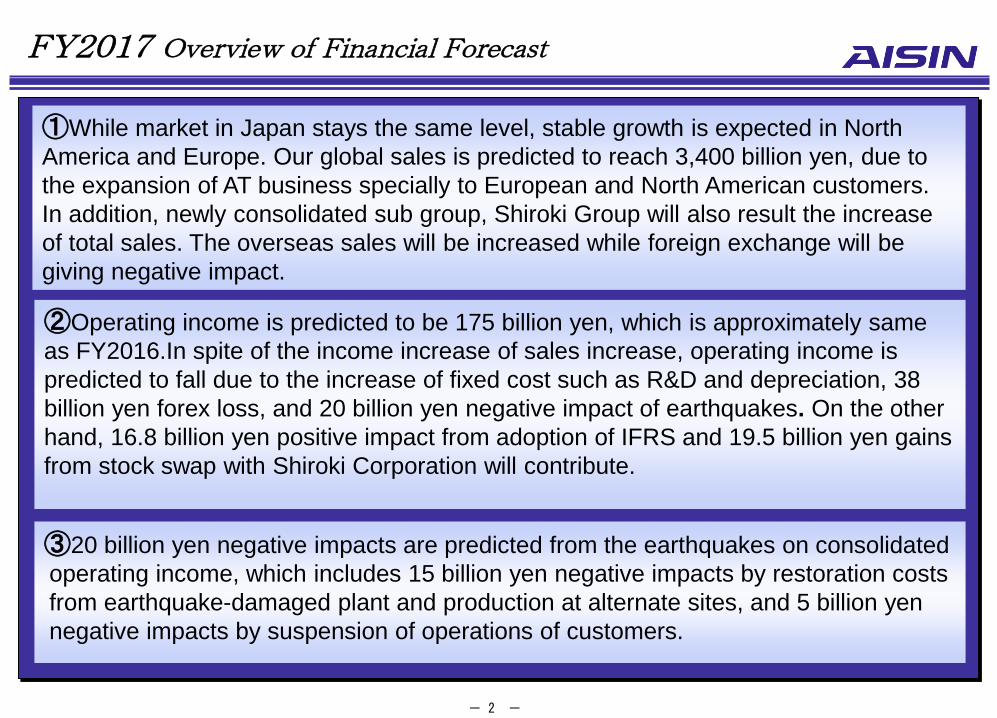
②Operating income is predicted to be 175 billion yen, which is approximately same
as FY2016.In spite of the income increase of sales increase, operating income is
predicted to fall due to the increase of fixed cost such as R&D and depreciation, 38
billion yen forex loss, and 20 billion yen negative impact of earthquakes. On the other
hand, 16.8 billion yen positive impact from adoption of IFRS and 19.5 billion yen gains
from stock swap with Shiroki Corporation will contribute.
①While market in Japan stays the same level, stable growth is expected in North
America and Europe. Our global sales is predicted to reach 3,400 billion yen, due to
the expansion of AT business specially to European and North American customers.
In addition, newly consolidated sub group, Shiroki Group will also result the increase
of total sales. The overseas sales will be increased while foreign exchange will be
giving negative impact.
③20 billion yen negative impacts are predicted from the earthquakes on consolidated
operating income, which includes 15 billion yen negative impacts by restoration costs
from earthquake-damaged plant and production at alternate sites, and 5 billion yen
negative impacts by suspension of operations of customers.
FY2017 Overview of Financial Forecast

- 3 -
+ 156.9 billion yen ( +4.8%)
3,243.1
-1.4
176.4 175.0
3,400.0
186.8 185.0
-1.8
96.9 90.0
-6.9
311.48Yen 342.67Yen
J-GAAP IFRS
Consolidated Fiscal Year Forecast ( FY2017 – 12 months)
Net Sales Operating Income Net Income
Income before income tax
Operating Income Net Sales Net Income
FY2016 FY2017 J-GAAP IFRS
FY2016 FY2017
J-GAAP IFRS
FY2016 FY2017 J-GAAP IFRS
FY2016 FY2017
J-GAAP IFRS
FY2016 FY2017
EPS
Billion yen

- 4 -
265.4 245.6
83.6 97.8
71.3 92.252.1
76.173.5
74.555.4
72.769.568.450.0
64.348.3
46.733.5
34.5315.6
319.2
0
100
200
300
400
500
600
700
800
900
1,000
1,100
FY2016 FY2017
1,192.0
GM
BMW
VW & Audi
PSA
-19.8
+24.0
+14.2
+20.9
+1.0
1,118.2
+17.3
61.3%
62.3%
Forecast of Sales by Customer ( FY2017 – 12 months)
FY2016 【 Sales 3,243.1】
FY2017 【 Sales 3,400.0】
Life & others
104.7
Other Manufacturers
1,118.2
Toyota Group
2,020.1
Life & others
124.0
Other Manufacturers
1,192.0
Toyota Group
2,084.0
Other Manufacturers sales breakdown
VOLVO
NISSAN
MITSUBISHI
SUZUKI
HONDA Changan
A/M & Others
J-GAAP IFRS
Billion yen

- 5 -
億円
0 300 600 900 1,200
Japan
North
America
Europe
China
Asia &
OthersFY2016 FY2017
0 20 40 60 80 100 120
Japan
North
America
Europe
China
Asia &
Others FY2016 FY2017
564.4
281.4
242.1
1,992.0
527.0
280.0
255.1
1,824.1
18.5
2.7
7.2
104.1
93.0
25.9
3.4
6.3 J-GAAP IFRS
330.9
345.9
J-GAAP IFRS
42.3
46.4
Forecast of Segment Information ( FY2017 – 12 months)
Billion yen Billion yen Net Sales Operating Income
Fx impact Sales variation excluding FX impact
Japan -26.8 +194.7
North America -76.0 +38.6
Europe - -1.4
China -37.7 +52.7
Asia & Others -23.8 +36.8
Fx impact Sales variation excluding FX impact
Japan -26.8 +15.7
North America -3.7 +11.1
Europe -0.3 +1.0
China -5.0 +9.1
Asia & Others -2.2 +1.3

- 6 -
Increase
+109.3
Decrease -110.7
-24.5
-1.4 Decrease
176.4→ 175.0
38.0
Impact of Kumamoto
earthquakes
5.0
30.0
-28.2
Gains from stock swap with Shiroki
corporation
16.8
-38.0
IFRS adoption
19.5
-20.0
(Based on J-GAAP)
Forecast of Fluctuations for Operating Income ( FY2017 – 12 months)
【FY2016 / FY2017】
Sales fluctuation
Cost structure improvement
Forex rate 1US$ :¥120 →¥105 1CNY :¥18.8→¥17.0
Change of material price
Depreciation
R&D others
Billion yen
Mainly effect of change of depreciation method +13.4

- 7 -
50.061.5
48.159.252.476.0
99.1
72.584.569.3
1 ,353 .61 ,195 .7
1 ,402 .5 1 ,500 .9 1 ,565 .0
0
30
60
90
120
150
180
FY2013 FY2014 FY2015 FY2016 FY2017
0
500
1,000
1,500
億円 <7,121> <6,141>
64.581.2
103.093.089.7
103.091.397.5
84.4
64.2
1 ,340 .01 ,276 .51 ,127 .2
975 .1 1 ,053 .0
0
30
60
90
120
150
FY2013 FY2014 FY2015 FY2016 FY2017
0
500
1,000
1,500
(Forecast)
※FY 2013 to FY2016 : Japanese GAAP FY 2017: IFRS
Financial Results of the Main Consolidated Companies I
AISIN SEIKI Group
AISIN AW Group
(Forecast)
Billion yen
Billion yen
Operating income
Ordinary income/ Income before income tax
Sales
Operating income
Ordinary income/ Income before income tax
Sales

- 8 -
9.5 9.311.2
9.110.411.2 12.3
8.1
11.212.5
261 .3275 .9263 .8
215 .4247 .4
0
10
20
FY2013 FY2014 FY2015 FY2016 FY2017
0
100
200
300
6.3
3.9 2.7
-0.4
2.7
-0.3
2.42.63.6
6.5
142 .0133 .9126 .4134 .9 127 .7
-3
0
3
6
9
12
FY2013 FY2014 FY2015 FY2016 FY2017
-50
0
50
100
150
200
Financial Results of the Main Consolidated Companies Ⅱ
AISIN Takaoka Group
AISIN AI Group
Billion yen
Billion yen
(Forecast)
(Forecast)
Operating income
Ordinary income/ Income before income tax
Sales
Operating income
Ordinary income/ Income before income tax
Sales

- 9 -
AISIN HOLDINGS OF AMERICA - サブ連結
億円
億円
<3,076>
<1,873>
<2,772>
<1,783>
5.4
8.89.6
14.012.8 14.1 15.3
11.6
7.94.8
543 .9551 .2527 .3447 .2
511 .5
0
10
20
30
FY2013 FY2014 FY2015 FY2016 FY2017
0
200
400
600
58
▲5 ▲31
50
▲4
49
▲16▲36
52
0
1 ,3191 ,577
1 ,3782 ,478
1 ,972
-50
0
50
100
150
07年度 08年度 09年度 10年度 11年度 -1,000
0
1,000
2,000
億円
(予想)
1Q売上
< 409 >
Financial Results of the Main Consolidated Companies Ⅲ
ADVICS Group Billion yen
(Forecast)
Operating income
Ordinary income/ Income before income tax
Sales

- 10 -
203.0188.2161.0149.0139.2
100
200
300
29.3 25.7 30.9 41.866.6 74.8 78.8
123.211.4 13.1 25.8
23.7
45.2
78.0
43.6
0
100
200
300
400
FY2013 FY2014 FY2015 FY2016 FY2017
Other Overseas
AHA-G
Other Domestic
ADVICS-G
AISIN AW-G
AISIN SEIKI
195.0 204.7 247.8
294.1 257.0
Capital Expenditure
Billion yen Depreciation
Capital Expenditure
(Forecast)

- 11 -
%
5.05.05.05.15.3
4.0
5.0
6.0
7.0
8.0
% % % % %
5 3 .5 6 0 . 6 6 3 . 7 6 5 . 5 6 7 . 7
1 9 . 0 1 9 . 3 2 0 . 35 2 . 9 5 2 . 4 5 5 . 4 6 5 . 8
1 9 . 51 9 . 3
6 9 . 5
0
50
100
150
200
250
FY2013 FY2014 FY2015 FY2016 FY2017
Others
AISIN AW-G
ADVICS
AISIN SEIKI
135.0 144.3 162.6 149.1
170.0
R & D Expenditure
R & D Expenditure / Net Sales
R & D Expenditure Billion yen
(Forecast)

- 12 -
545
331 347
352340327
385
0
250
500
750
FY2014 FY2015 FY2016 FY2017
214
135
0
65 65
63 59 60
84
0
50
100
150
FY2014 FY2015 FY2016 FY2017
77 71 78
84 73 82
0
50
100
150
FY2014 FY2015 FY2016 FY2017
687
128
161 658
124
144
上期
下期
737 160
144
800 161
165
19
30
330 34
4527
0
20
40
60
80
FY2014 FY2015 FY2016 FY2017
60
22
61
Production
AT Production MT Production
Navigation System Production Navigation Soft Production
10,000 of units
1st H
2nd H
1st H
2nd H
1st H
2nd H
1st H
2nd H
(Forecast) (Forecast)
(Forecast) (Forecast)

- 13 -
572 586 573
314 317
588
313329
0
400
800
FY2014 FY2015 FY2016 FY2017
Domestic
Production
Overseas
Production
901 899 887 905
TOYOTA Motors Production
10,000 of units TOYOTA Motors Production
(Forecast)

- 14 -
FY2014 FY2015 FY2016 FY2017 (forecast)
USD 1.46 1.46 1.27 1.35
EUR 0.13 0.14 0.13 0.14
THB※ 0.79 0.74 0.80 0.78
CNY※ 0.19 0.26 0.54 0.70
100Yen 110Yen120Yen 105Yen
138Yen135Yen 132Yen120Yen
70
95
120
145
3.2Yen 3.4Yen 3.4Yen 3.0Yen
18.0Yen16.5Yen 18.8Yen 17.0Yen
05
10152025
Foreign Currency Exchange Rate
Billion yen
※Impacts of THB and CNY are per 0.1yen.
Forex Impact on Operating Income per 1(or 0.1) yen
Impacts on Operating Income
Foreign Exchange Rate
EUR
USD
CNY
THB

- 15 -
38.8
29.335.0
41.9 43.4 41.4 38.432.0
44.950.5
33.839.7
50.6 52.245.5 44.3
6 .1%
4 .9%
6 .1% 6 .1% 5 .8%5 .4%
4 .4%
5 .9%6 .5%
6 .0% 6 .2%
5 .5% 5 .0%4 .4%
7 .0%6 .3%
0
30
60
90
120
1Q 2Q 3Q 4Q 1Q 2Q 3Q 4Q 1Q 2Q 3Q 4Q 1Q 2Q 3Q 4Q
655.5 636.3598.0
639.9699.5 687.4 714.8 720.3 707.0 727.8 756.4 773.2 771.7 788.0
843.4 839.9
224 220195
220224 224 226 227 223 231 224 232219221
215221
200
400
600
800
1 , 000
Quarterly Performance
Net Sales
Operating Income
TOYOTA Motors Production(10,000 of units)
Billion yen
Billion yen
%:Operating income rate
FY2013 FY2014 FY2015 FY2016
※FY 2013 to FY2016 : Japanese GAAP