Embed Size (px)
Citation preview

ACCESS BANK PLC
CONSOLIDATED AND SEPARATE FINANCIAL STATEMENTS FOR THEYEAR ENDED 31 DECEMBER 2020
Access Bank Plc Consolidated and separate financial statements For the year ended 31 December 2020
Corporate information
Directors
*Mosunmola Tamramat Belo-Olusoga, FCA Chairman
**Ajoritsedere Josephine Awosika, MFR Chairman
Herbert Onyewumbu Wigwe, FCA Group Managing Director/Chief Executive Officer
Roosevelt Michael Ogbonna,FCA,CFA Group Deputy Managing Director
Anthonia Olufeyikemi Ogunmefun Non-Executive Director
Paul Usoro, SAN Non-Executive Director
***Abba Mamman Tor Habib Non-Executive Director
Okey Vitalis Nwuke,FCA Non-Executive Director
*******Omosalewa Temidayo Fajobi Non-Executive Director
****Ernest Chukwuka Ndukwe, OFR Independent Non-Executive Director
Adeniyi Adedokun Adekoya Independent Non-Executive Director
Iboroma Tamunoemi Akpana Independent Non-Executive Director
Ifeyinwa Yvonne Osime Independent Non-Executive Director
*****Hassan Tanimu Musa Usman,FCA Independent Non-Executive Director
Victor Okenyenbunor Etuokwu, HCIB Executive Director
Gregory Ovie Jobome, HCIB Executive Director
Hadiza Ambursa Executive DirectorAdeolu Bajomo Executive DirectorChizoma Joy Okoli, HCIB Executive Director******Oluseyi Kolawole Kumapayi,FCA Executive Director
* Retired effective January 8, 2020
** Appointed effective January 8, 2020
*** Retired effective March 30, 2020
**** Resigned effective March 31, 2020
*****Appointed effective August 27, 2020
******Appointed effective November 10, 2020
*******Appointed effective November 13, 2020
Company Secretary
Mr Sunday Ekwochi
Corporate Head Office
Access Bank Plc
Plot 14/15, Prince Alaba Oniru Street, Oniru Estate, Victoria Island, Lagos
Victoria Island, Lagos.
(formerly Plot 999c, Danmole Street, off Adeola Odeku/Idejo Street, Victoria Island, Lagos)
Telephone: +234 (01) 4619264 - 9
+234 (01) 2773399-99
Email: [email protected]
Website: www.accessbankplc.com
Company Registration Number: RC125 384
FRC Number: FRC/2012/0000000000271
Independent Auditors
PricewaterhouseCoopers
Landmark Towers, 5b Water Corporation way, Oniru
Victoria Island, Lagos
Telephone: (01) 271 1700
Website: www.pwc.com/ng
FRC Number: FRC/2013/ICAN/00000000639
This is the list of Directors who served in the entity during the year and up to the date of this report
3

Access Bank Plc Consolidated and separate financial statements For the year ended 31 December 2020
Corporate Governance Consultant
Ernst & Young
10th Floor UBA House
57, Marina, Lagos
Telephone: +234 (01) 6314500
FRC Number: FRC/2012/ICAN00000000187
Actuaries
Alexander Forbes Consulting Actuaries Nig. Ltd
Rio Plaza, 2nd Floor , Plot 235, Muri Okunola Street
Victoria Island, Lagos
Telephone: (01) 271 1081
FRC Number: FRC/2012/0000000000504
Registrars
Coronation Registrars Limited
9, Amodu Ojikutu Street, Off Saka Tinubu
Victoria Island, Lagos
Telephone: +234 01 2272570
Investor Relations
Access Bank Plc has a dedicated investors’ portal on its corporate website which can be accessed via this link https://www.accessbankplc.com/pages/investor-relations.aspx
For further information please contact:
Access Bank Plc.
Investor Relations Team [email protected] +234 (1) 236 4365
4
Access Bank Plc Consolidated and separate financial statements For the year ended 31 December 2020
*Restated *RestatedGroup Group Bank Bank
December 2020 December 2019 December 2020 December 2019
In thousands of Naira
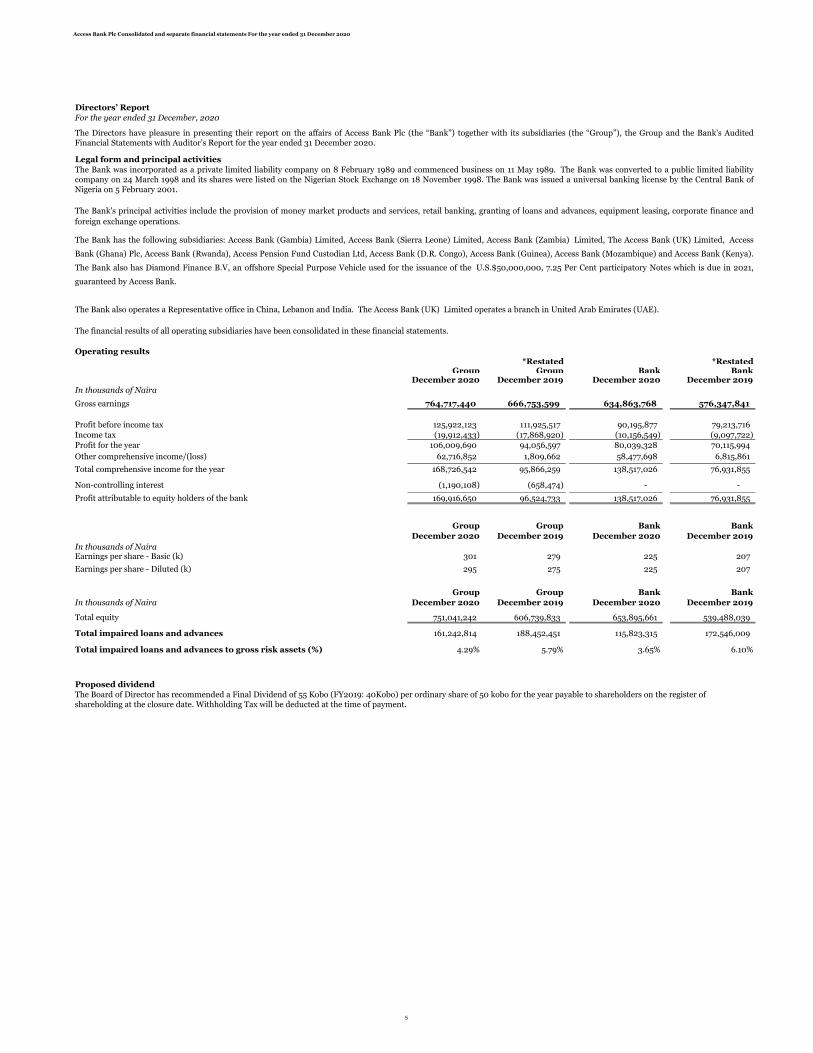
Gross earnings 764,717,440 666,753,599 634,863,768 576,347,841
Profit before income tax 125,922,123 111,925,517 90,195,877 79,213,716
Income tax (19,912,433) (17,868,920) (10,156,549) (9,097,722)
Profit for the year 106,009,690 94,056,597 80,039,328 70,115,994
Other comprehensive income/(loss) 62,716,852 1,809,662 58,477,698 6,815,861
Total comprehensive income for the year 168,726,542 95,866,259 138,517,026 76,931,855
Non-controlling interest (1,190,108) (658,474) - -
169,916,650 96,524,733 138,517,026 76,931,855
Group Group Bank Bank
December 2020 December 2019 December 2020 December 2019
In thousands of NairaEarnings per share - Basic (k) 301 279 225 207
Earnings per share - Diluted (k) 295 275 225 207
*Restated *Restated
Group Group Bank Bank
In thousands of Naira December 2020 December 2019 December 2020 December 2019
751,041,242 606,739,833 653,895,661 539,488,039
Total impaired loans and advances 161,242,814 188,452,451 115,823,315 172,546,009
Total impaired loans and advances to gross risk assets (%) 4.29% 5.79% 3.65% 6.10%
* See Note 46 - Restatement of prior year financial information
Proposed dividendThe Board of Director has recommended a Final Dividend of 55 Kobo (FY2019: 40Kobo) per ordinary share of 50 kobo for the year payable to shareholders on the register of shareholding at the closure date. Withholding Tax will be deducted at the time of payment.
The Bank's principal activities include the provision of money market products and services, retail banking, granting of loans and advances, equipment leasing, corporate finance and
foreign exchange operations.
The Bank has the following subsidiaries: Access Bank (Gambia) Limited, Access Bank (Sierra Leone) Limited, Access Bank (Zambia) Limited, The Access Bank (UK) Limited, Access
Bank (Ghana) Plc, Access Bank (Rwanda), Access Pension Fund Custodian Ltd, Access Bank (D.R. Congo), Access Bank (Guinea), Access Bank (Mozambique) and Access Bank (Kenya).
The Bank also has Diamond Finance B.V, an offshore Special Purpose Vehicle used for the issuance of the U.S.$50,000,000, 7.25 Per Cent participatory Notes which is due in 2021,
guaranteed by Access Bank.
The Bank also operates a Representative office in China, Lebanon and India. The Access Bank (UK) Limited operates a branch in United Arab Emirates (UAE).
The financial results of all operating subsidiaries have been consolidated in these financial statements.
Operating results
Directors’ Report
For the year ended 31 December, 2020
The Directors have pleasure in presenting their report on the affairs of Access Bank Plc (the “Bank”) together with its subsidiaries (the “Group”), the Group and the Bank's AuditedFinancial Statements with Auditor’s Report for the year ended 31 December 2020.
Legal form and principal activities
The Bank was incorporated as a private limited liability company on 8 February 1989 and commenced business on 11 May 1989. The Bank was converted to a public limited liabilitycompany on 24 March 1998 and its shares were listed on the Nigerian Stock Exchange on 18 November 1998. The Bank was issued a universal banking license by the Central Bank ofNigeria on 5 February 2001.
Profit attributable to equity holders of the bank
Total equity
5

Access Bank Plc Consolidated and separate financial statements For the year ended 31 December 2020
Directors and their interests
Number of Ordinary Shares of 50k each held as at 31 December 2020
Direct Indirect Direct Indirect
M. Belo-Olusoga* 4,354,838 - 4,354,838 -
H. O. Wigwe 201,231,713 1,316,619,016 201,231,713 1,240,291,197
R. C. Ogbonna 39,209,328 - 31,325,167 -
A. O. Ogunmefun 12,080 2,075,928 - 2,075,928
V.O. Etuokwu 18,836,941 - 16,851,125 -
P. Usoro 1,209,634 - 1,209,634 -
A. Awosika** - - - -
E. Ndukwe**** 4,740,630 - 4,740,630 -
A. Mamman Tor Habib*** - - - -
G. Jobome 12,862,963 - 10,168,772 -
I. T Akpana 314,996 - 314,996 -
A. A. Adekoya - - - -
H. Ambursa 12,910,471 - 10,636,094 -
A. Bajomo 477,957 - 477,957 -
C. J. Okoli - 1,434,419 656,322 -
O. Nwuke 1,739,293 - 1,739,293 -
I. Osime 10,179 - 10,179 -
H. Usman***** - - - -
O. Kumapayi****** 24,014,208 - - -
O. Fajobi******* - - - -
* Retired effective January 8, 2020
** Appointed effective January 8, 2020
*** Retired effective March 30, 2020
**** Resigned effective March 31, 2020
*****Appointed effective August 27, 2020
******Appointed effective November 10, 2020
*******Appointed effective November 13, 2020
The indirect holdings relate to the holdings of the under listed companies
December 2020 December 2019
H.O. Wigwe United Alliance Company of Nig. Ltd 537,734,218 537,734,218
Trust and Capital Limited 584,056,979 702,556,979
Coronation Trustees Tengen Mauritius 194,827,818 -
A.O. Ogunmefun L.O.C Nominees, Limited 2,075,928 2,075,928
C. J. Okoli FM & Y LIMITED 1,434,419 -
Directors’ interest in contracts
Related director Interest in entity Name of company Services to the Bank
Mrs. Anthonia Ogunmefun Director and Shareholder LOC Nominees Ltd Property Short Term Rental
Mr. Paul Usoro (SAN) Director and Shareholder Paul Usoro & Co Legal Services
Mrs. Ifeyinwa Osime Director Wapic Life Assurance Ltd Insurance
Dr. Okey Nwuke Director Coscharis Group Vehicles Sales and Maintenance
Dr. Okey Nwuke Director and Shareholder Claritus Limited Property Rentals
Mr. Herbert Wigwe Shareholder Wapic Insurance Plc Insurance
Mr. Herbert Wigwe Shareholder Coronation Securities Limited Financial Services
Mr. Herbert Wigwe Shareholder Trium Networks Limited Digital Transformation
Dr. Gregory Jobome Director CRC Credit Bureau Ltd Credit Bureau Reference Service
Mrs. Omosalewa Fajobi Director Coronation Securities Limited Financial Services
Mrs. Omosalewa Fajobi Director Coronation Insurance Plc Insurance
Mr. Ade Bajomo Director Nigerian Interbank Settlement Scheme Plc Interbank Payment Services
Mr. Victor Etuokwu Director Unified Payment Services Ltd ( UPSL) Payment services
Mr. Victor Etuokwu Director E-Tranzact Plc Payment services
Mr. Victor Etuokwu Director ACT Foundation Implementing partner for Sustainability Projects
Mr. Roosevelt Ogbonna Director Central Securities Clearing System Securities Depository Services
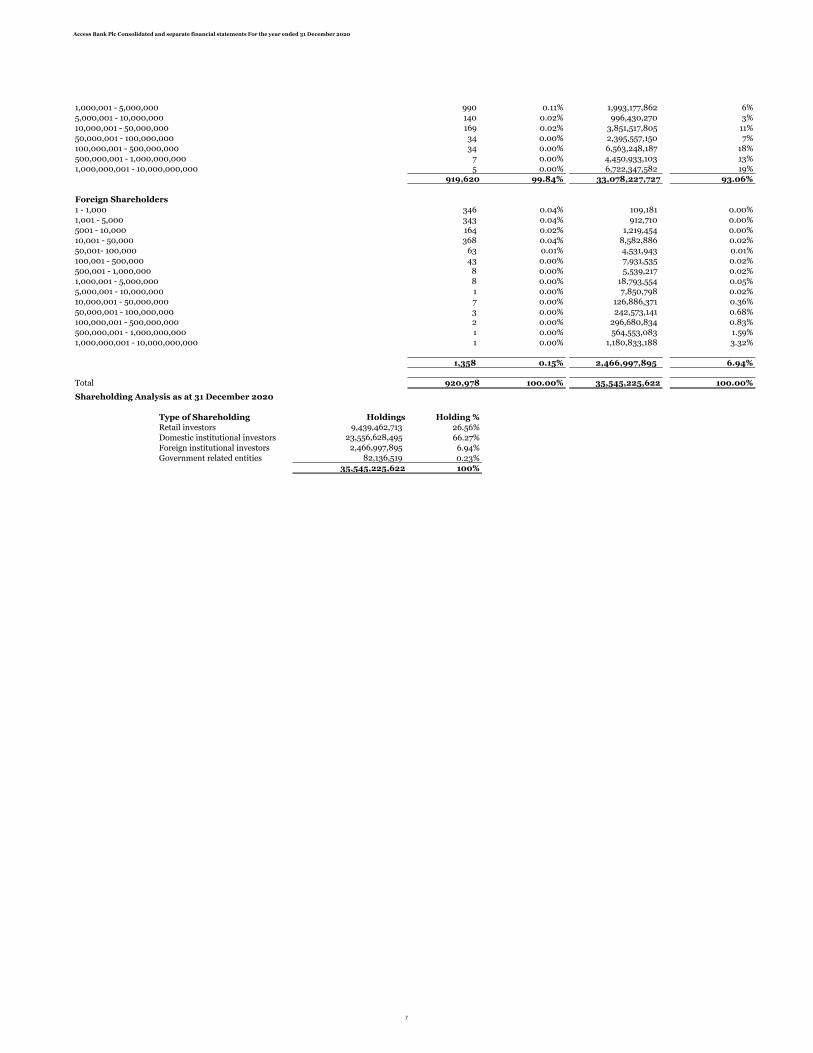
Analysis of shareholding:
The shareholding pattern of the Bank as at 31 December 2020 was as stated below:
December 2020
Range Number of Shareholders
% of Shareholders Number of shares held % of Shareholders
Domestic Shareholders
1 - 1,000 483,188 52.46% 92,202,876 0%
1,001 - 5,000 270,824 29.41% 602,921,025 2%
5001 - 10,000 68,610 7.45% 472,450,366 1%
10,001 - 50,000 74,442 8.08% 1,505,716,744 4%
50,001- 100,000 11,239 1.22% 814,599,561 2%
100,001 - 500,000 8,798 0.96% 1,792,932,868 5%
500,001 - 1,000,000 1,140 0.12% 824,192,328 2%
The Directors who served during the year, together with their direct and indirect interests in the issued share capital of the Bank as recorded in the Register of Directors' Shareholdingand as notified by the Directors for the purposes of Sections 301 and 302 of the Companies and Allied Matters Act and listing requirements of the Nigerian Stock Exchange is notedbelow:
December 2020 December 2019
In accordance with the provisions of Section 303 (1) and (3) of the Companies and Allied Matters Act of Nigeria, the Board has received a declaration of interest from the under-listed
directors in respect of the companies (vendors to the bank) set against their respective names.
6
Access Bank Plc Consolidated and separate financial statements For the year ended 31 December 2020
1,000,001 - 5,000,000 990 0.11% 1,993,177,862 6%
5,000,001 - 10,000,000 140 0.02% 996,430,270 3%
10,000,001 - 50,000,000 169 0.02% 3,851,517,805 11%
50,000,001 - 100,000,000 34 0.00% 2,395,557,150 7%
100,000,001 - 500,000,000 34 0.00% 6,563,248,187 18%
500,000,001 - 1,000,000,000 7 0.00% 4,450,933,103 13%
1,000,000,001 - 10,000,000,000 5 0.00% 6,722,347,582 19%
919,620 99.84% 33,078,227,727 93.06%
Foreign Shareholders
1 - 1,000 346 0.04% 109,181 0.00%
1,001 - 5,000 343 0.04% 912,710 0.00%
5001 - 10,000 164 0.02% 1,219,454 0.00%
10,001 - 50,000 368 0.04% 8,582,886 0.02%
50,001- 100,000 63 0.01% 4,531,943 0.01%
100,001 - 500,000 43 0.00% 7,931,535 0.02%
500,001 - 1,000,000 8 0.00% 5,539,217 0.02%
1,000,001 - 5,000,000 8 0.00% 18,793,554 0.05%
5,000,001 - 10,000,000 1 0.00% 7,850,798 0.02%
10,000,001 - 50,000,000 7 0.00% 126,886,371 0.36%
50,000,001 - 100,000,000 3 0.00% 242,573,141 0.68%
100,000,001 - 500,000,000 2 0.00% 296,680,834 0.83%
500,000,001 - 1,000,000,000 1 0.00% 564,553,083 1.59%
1,000,000,001 - 10,000,000,000 1 0.00% 1,180,833,188 3.32%
1,358 0.15% 2,466,997,895 6.94%
Total 920,978 100.00% 35,545,225,622 100.00%
Shareholding Analysis as at 31 December 2020
Type of Shareholding Holdings Holding %
Retail investors 9,439,462,713 26.56%
Domestic institutional investors 23,556,628,495 66.27%
Foreign institutional investors 2,466,997,895 6.94%
Government related entities 82,136,519 0.23%
35,545,225,622 100%
7
Access Bank Plc Consolidated and separate financial statements For the year ended 31 December 2020
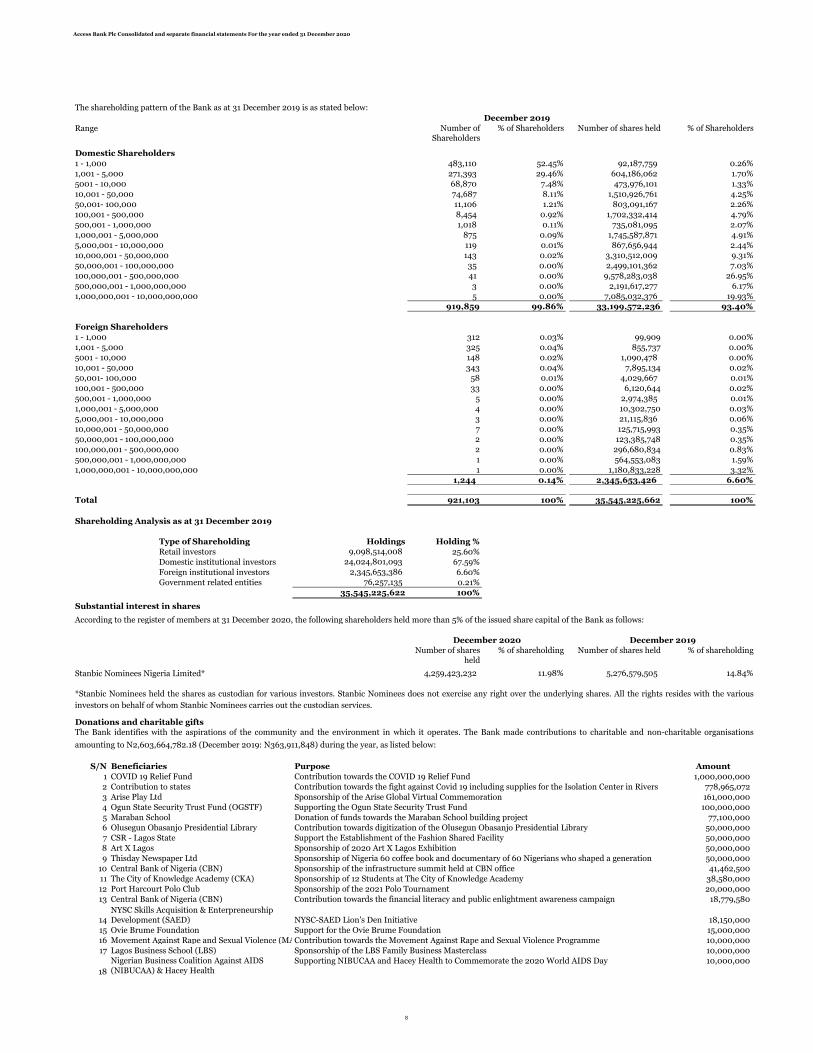
The shareholding pattern of the Bank as at 31 December 2019 is as stated below:
December 2019
Range Number of Shareholders
% of Shareholders Number of shares held % of Shareholders
Domestic Shareholders
1 - 1,000 483,110 52.45% 92,187,759 0.26%
1,001 - 5,000 271,393 29.46% 604,186,062 1.70%
5001 - 10,000 68,870 7.48% 473,976,101 1.33%
10,001 - 50,000 74,687 8.11% 1,510,926,761 4.25%
50,001- 100,000 11,106 1.21% 803,091,167 2.26%
100,001 - 500,000 8,454 0.92% 1,702,332,414 4.79%
500,001 - 1,000,000 1,018 0.11% 735,081,095 2.07%
1,000,001 - 5,000,000 875 0.09% 1,745,587,871 4.91%
5,000,001 - 10,000,000 119 0.01% 867,656,944 2.44%
10,000,001 - 50,000,000 143 0.02% 3,310,512,009 9.31%
50,000,001 - 100,000,000 35 0.00% 2,499,101,362 7.03%
100,000,001 - 500,000,000 41 0.00% 9,578,283,038 26.95%
500,000,001 - 1,000,000,000 3 0.00% 2,191,617,277 6.17%
1,000,000,001 - 10,000,000,000 5 0.00% 7,085,032,376 19.93%
919,859 99.86% 33,199,572,236 93.40%
Foreign Shareholders
1 - 1,000 312 0.03% 99,909 0.00%
1,001 - 5,000 325 0.04% 855,737 0.00%
5001 - 10,000 148 0.02% 1,090,478 0.00%
10,001 - 50,000 343 0.04% 7,895,134 0.02%
50,001- 100,000 58 0.01% 4,029,667 0.01%
100,001 - 500,000 33 0.00% 6,120,644 0.02%
500,001 - 1,000,000 5 0.00% 2,974,385 0.01%
1,000,001 - 5,000,000 4 0.00% 10,302,750 0.03%
5,000,001 - 10,000,000 3 0.00% 21,115,836 0.06%
10,000,001 - 50,000,000 7 0.00% 125,715,993 0.35%
50,000,001 - 100,000,000 2 0.00% 123,385,748 0.35%
100,000,001 - 500,000,000 2 0.00% 296,680,834 0.83%
500,000,001 - 1,000,000,000 1 0.00% 564,553,083 1.59%
1,000,000,001 - 10,000,000,000 1 0.00% 1,180,833,228 3.32%
1,244 0.14% 2,345,653,426 6.60%
Total 921,103 100% 35,545,225,662 100%
Shareholding Analysis as at 31 December 2019
Type of Shareholding Holdings Holding %
Retail investors 9,098,514,008 25.60%
Domestic institutional investors 24,024,801,093 67.59%
Foreign institutional investors 2,345,653,386 6.60%
Government related entities 76,257,135 0.21%
35,545,225,622 100%
Substantial interest in shares
Number of shares held
% of shareholding Number of shares held % of shareholding
Stanbic Nominees Nigeria Limited* 4,259,423,232 11.98% 5,276,579,505 14.84%
Donations and charitable gifts
S/N Beneficiaries Purpose Amount
1 COVID 19 Relief Fund Contribution towards the COVID 19 Relief Fund 1,000,000,000
2 Contribution to states Contribution towards the fight against Covid 19 including supplies for the Isolation Center in Rivers 778,965,072
3 Arise Play Ltd Sponsorship of the Arise Global Virtual Commemoration 161,000,000
4 Ogun State Security Trust Fund (OGSTF) Supporting the Ogun State Security Trust Fund 100,000,000
5 Maraban School Donation of funds towards the Maraban School building project 77,100,000
6 Olusegun Obasanjo Presidential Library Contribution towards digitization of the Olusegun Obasanjo Presidential Library 50,000,000
7 CSR - Lagos State Support the Establishment of the Fashion Shared Facility 50,000,000
8 Art X Lagos Sponsorship of 2020 Art X Lagos Exhibition 50,000,000
9 Thisday Newspaper Ltd Sponsorship of Nigeria 60 coffee book and documentary of 60 Nigerians who shaped a generation 50,000,000
10 Central Bank of Nigeria (CBN) Sponsorship of the infrastructure summit held at CBN office 41,462,500
11 The City of Knowledge Academy (CKA) Sponsorship of 12 Students at The City of Knowledge Academy 38,580,000
12 Port Harcourt Polo Club Sponsorship of the 2021 Polo Tournament 20,000,000
13 Central Bank of Nigeria (CBN) Contribution towards the financial literacy and public enlightment awareness campaign 18,779,580
14 NYSC-SAED Lion's Den Initiative 18,150,000
15 Ovie Brume Foundation Support for the Ovie Brume Foundation 15,000,000
16 Movement Against Rape and Sexual Violence (MARS-V)Contribution towards the Movement Against Rape and Sexual Violence Programme 10,000,000
17 Lagos Business School (LBS) Sponsorship of the LBS Family Business Masterclass 10,000,000
18
Supporting NIBUCAA and Hacey Health to Commemorate the 2020 World AIDS Day 10,000,000
NYSC Skills Acquisition & Enterpreneurship Development (SAED)
Nigerian Business Coalition Against AIDS (NIBUCAA) & Hacey Health
The Bank identifies with the aspirations of the community and the environment in which it operates. The Bank made contributions to charitable and non-charitable organisations
amounting to N2,603,664,782.18 (December 2019: N363,911,848) during the year, as listed below:
According to the register of members at 31 December 2020, the following shareholders held more than 5% of the issued share capital of the Bank as follows:
December 2020 December 2019
*Stanbic Nominees held the shares as custodian for various investors. Stanbic Nominees does not exercise any right over the underlying shares. All the rights resides with the various
investors on behalf of whom Stanbic Nominees carries out the custodian services.
8

Access Bank Plc Consolidated and separate financial statements For the year ended 31 December 2020
19 Chartered Institute of Bankers of Nigeria (CIBN) Supporting the 13th Annual Banking and Finance Conference. 10,000,000
20 Nigeria Police Force Contribution towards the remodelling of FCID Police force Head Quater Abuja 4,674,334
21Xploit Consult 4,650,000
22 Hacey Health Initiative Hacey health - Community Health Care Provider Empowement amid Covid19 4,500,000
23 Air France Sponsor distribution of 10,000 units of face masks to passengers of Air france 4,000,000
24 Kidney Foundation for Africa (KFA) 4,000,000
25 Nirvana Initiative Supporting the 2020 Nirvana Initiative Program to commemorate the World Tuberculosis Day 4,000,000
26 GBC Health & Hacey Health Supporting GBC Health and Hacey Health for the 2020 World Malaria Day Program 4,000,000
27 Support CARE Initiative Street Covid 19 Response Program 4,000,000
28 Xploit Consulting Limited Support for the Vocation Skills Acquisition Initiative (VSAI) program 3,500,000
29 Xploit Consulting Limited Supporting the Agribusiness Livelihoods Improvement Program 3,500,000
30 Glow Initiative for Economic Empowerment (GIEE)Supporting the Commemoration of the 2020 World Wildlife Day (WWLD) 3,500,000
31 Nirvana Initiative Support Nirvana Initiative Covid 19 Warrior Kit Intervention in the area of Food Supplies 3,500,000
32 Akwa Ibom State Support the supply of Scrubs amidst the Covid 19 Pandemic 3,000,000
33 Xploit Consult Supporting Xploit Consult in providing Succour for Community of Vulnerable People in Undeserved Communities3,000,000
34 Estrategico Consult Supporting the Arts of Peace and Good Governance Project 3,000,000
35 Supporting the Education Without Abuse program in Commemoration of Universal Children's Day 3,000,000
36 Chartered Institute of Bankers of Nigeria (CIBN) Contribution towards the Financial Literacy Campaign by Banker's Committee 2,399,096
37 Hacey Health Initiative Supporting Hacey Health Initiative for the End Female Genital Mutilation (FGM) Program 2,000,000
38 SMEFunds Contribution to SME Funds for the Family Clean Cooking Support program (FCCSP) 2,000,000
39 Project Enable Africa 2,000,000
40 Commemorate the International Literacy Day by supporting the Capacity Building of Literacy Educators 2,000,000
41 Hacey Health Initiative Contribution towards the 2020 International Day of the Girl Child (IDGC) Program 2,000,000
42 Project Enable Africa Support for the Commemoration of the 2020 United Nations International Day of Persons with Disabilities 2,000,000
43 The Ending Neglected Diseases (END) Fund Supporting The END Fund towards Improving Public Health, Education and Economic Growth Outcomes in Nigeria2,000,000
44 Glow Initiative for Economic Empowerment (GIEE)Contribution towards the implementation of the Soil Conservation Education Program for Sustainable Farming 2,000,000
45 Nirvana Initiative Support for High Impact National Sickle Cell Program 2,000,000
46 Hacey Health Initiative Supporting the 16Days of Activism against Gender Based Violence 2,000,000
47 Centre for Youth Studies (CYS) Sponsor the scholarship for Special Needs Students 1,650,000
48 Lorem Excellentiam 1,290,000
49 Centre for Youth Studies (CYS) Supporting CYS Program for Persons Living with Disabilities 1,000,000
50 Estrategico and Stanforte Edge Support for the Persons Living with Disabilities (PWD) Covid 19 Campaign 1,000,000
51 Centre for Youth Studies (CYS) Supporting CYS Covid 19 Relief Program for Correctional Centres 1,000,000
52 Glow Initiative for Economic Empowerment (GIEE)Supporting Glow Initiative for Rural Women Coronavirus Awareness Initiative 1,000,000
53 PSRG and Richardson Oil and Gas Limited Support the Process Safety and Reliability Group (PSRG) - Richardson HSSE Forum 1,000,000
54 CSR in Action Support the Training of Civil Society Organisations in the CSO Professionalism and Effectiveness Therapy Workshop1,000,000
55 International Federation of Compliance Associations (IFCA)Sponsorship of International Federation of Compliance Associations (IFCA) Conference 964,200
56 Golden Ladies Women Association Support Golden Ladies Women Association for the production of 500 Facial Masks amidst COVID -19 500,000
57 Chartered Institute of Taxation of Nigeria (CITN) Support for the CITN 22nd Annual Tax Conference 500,000
58 Supporting the 2020 Women in Marketing and Communications Conference/Awards WIMCA Conference 500,000
59 Care Organisation Public Enlightenment (COPE) InitiativeSupport for COPE Foundation Breast Cancer 500,000
60 The Roses Ministry Support the Roses Ministry 2020 Widows Day of Joy and Medicals for Women Program 500,000
2,603,664,782
Support Xploit Consulting Women and Girl's Participation in Mainstream Development Program to commemorate the 2020 International Women's Day (IWD)
Commemorate the World Kidney Day by supporting KFA International Conference themed "Chronic Kidney disease - Stop the Epidemic in Africa"
Childhood Advancement Response & Empowerment (CARE) Initiative
Childhood Advancement Response & Empowerment (CARE) Initiative
Supporting Digital Skill Empowerment for Caregivers and mothers of special needs children in commemoration of the 2020 Worldskills day
Childhood Advancement Response & Empowerment (CARE) Initiative
Supporting the commemoration of the 2020 Global Money Week through the support of 1,000 financial literacy activity books for children
Women in Marketing and Communications Conference/Awards
9

Access Bank Plc Consolidated and separate financial statements For the year ended 31 December 2020
Property and equipment
Human resources(i) Report on diversity in employment
(a) Composition of employees by gender
2,524
2,910
(b) Board Composition By Gender
6
11
( c) Top Management (Executive Director To CEO) Composition By Gender
2
6
(d) Top Management (AGM To GM) Composition By Gender
18 50
(ii) Employment of disabled persons
(iii) Health, safety and welfare of employees
(iv) Employee involvement and training
(v) Statement of commitment to maintain positive work environment
Credit Ratings
Long Term Local Credit Ratings
Long Term Date
Standard & Poor's BBB Oct-20
Fitch Ratings A+ May-20
Agusto & Co AA- Jun-20
Moody's A1 Dec-20
Long Term Counterparty Credit Ratings
Long Term
Standard & Poor's B- Oct-20
Fitch Ratings B May-20
Moody's B2 Dec-20
More information on the rating reports can be obtained at https://www.accessbankplc.com/credit-rating
Audit committee
1 Mr. Henry Omatsola Aragho - Shareholder Chairman 2 Mr. Olutoyin Eleoramo - Shareholder Member3 Mr. Idaere Gogo-Ogan - Shareholder Member 4 Mr. Adeniyi Adekoya - Director Member5 Mr. Iboroma Akpana - Director Member6 Dr. Okey Nwuke - Director Member
BY ORDER OF THE BOARD
No 14/15, Prince Alaba Oniru Road
Oniru, Lagos.
Sunday Ekwochi
Company Secretary
FRC/2013/NBA/00000005528
Below are the credit ratings that Access Bank has been assigned by the various credit rating agencies that have rated the Bank, in no particular order:
Pursuant to Section 404(3) of the Companies and Allied Matters Act of Nigeria, the Bank has an Audit Committee comprising three directors and three shareholders as follows:
The functions of the Audit Committee are as provided in Section 404(7) of the Companies and Allied Matters Act of Nigeria.
The auditors, PricewaterhouseCoopers have indicated their interest to continue in office and will do so pursuant to section 401(2) of the Companies and Allied Matters Act
Fire prevention and fire-fighting equipment are installed in strategic locations within the Bank’s premises.
The Bank operates a Group Personal Accident and the Workmen’s Compensation Insurance covers for the benefit of its employees. It also operates a contributory pension plan in line
with the Pension Reform Act 2014 as Amended and other benefit schemes for its employees.
The Bank encourages participation of employees in arriving at decisions in respect of matters affecting their wellbeing. Towards this end, the Bank provides opportunities whereemployees deliberate on issues affecting the Bank and its employees' interests, with a view to making inputs to decisions thereon. The Bank places a high premium on the development ofits manpower. Consequently, the Bank sponsors its employees for various training courses, both locally and overseas.
The Bank shall strive to maintain a positive work environment that is consistent with best practice to ensure that business is conducted in a positive and professional manner and to
ensure that equal opportunity is given to all qualified members of the Group's operating environment.
The revised prudential guidelines, as released by the CBN, requires that banks should have themselves credit rated by a credit rating agency on a regular basis. It is also required that thecredit rating be updated on a continuous basis from year to year.
The Bank maintains business premises designed with a view to guaranteeing the safety and healthy living conditions of its employees and customers alike. Employees are adequatelyinsured against occupational and other hazards. In addition, the Bank retains top-class hospitals where medical facilities are provided for its employees and their immediate families at
Total number of male employees
Total number of female on the Board
Total number of men on the Board
Total number of female in Executive Management position
Total number of persons in Executive Management
Total number of female in Top Management positionTotal number of men in Top Management position
In the event of any employee becoming disabled in the course of employment, the Bank will endeavour to arrange appropriate training to ensure the continuous employment of such a
person without subjecting the employee to any disadvantage in career development.
Information relating to changes in property and equipment is given in Note 28 to the financial statements. In the Directors’ opinion, the fair value of the Group’s property and
equipment is not less than the carrying value in the financial statements.
The Bank operates a non-discriminatory policy in the consideration of applications for employment. The Bank’s policy is that the most qualified and experienced persons are recruited
for appropriate job levels, irrespective of an applicant’s state of origin, ethnicity, religion, gender or physical condition.
We believe diversity and inclusiveness are powerful drivers of competitive advantage in developing and understanding of our customers' needs and creatively addressing them.
Total number of female employees
18
50
female male
6
11
female male
26
female male
2524
2910
female male
10
Access Bank Plc Consolidated and separate financial statements For the year ended 31 December 2020
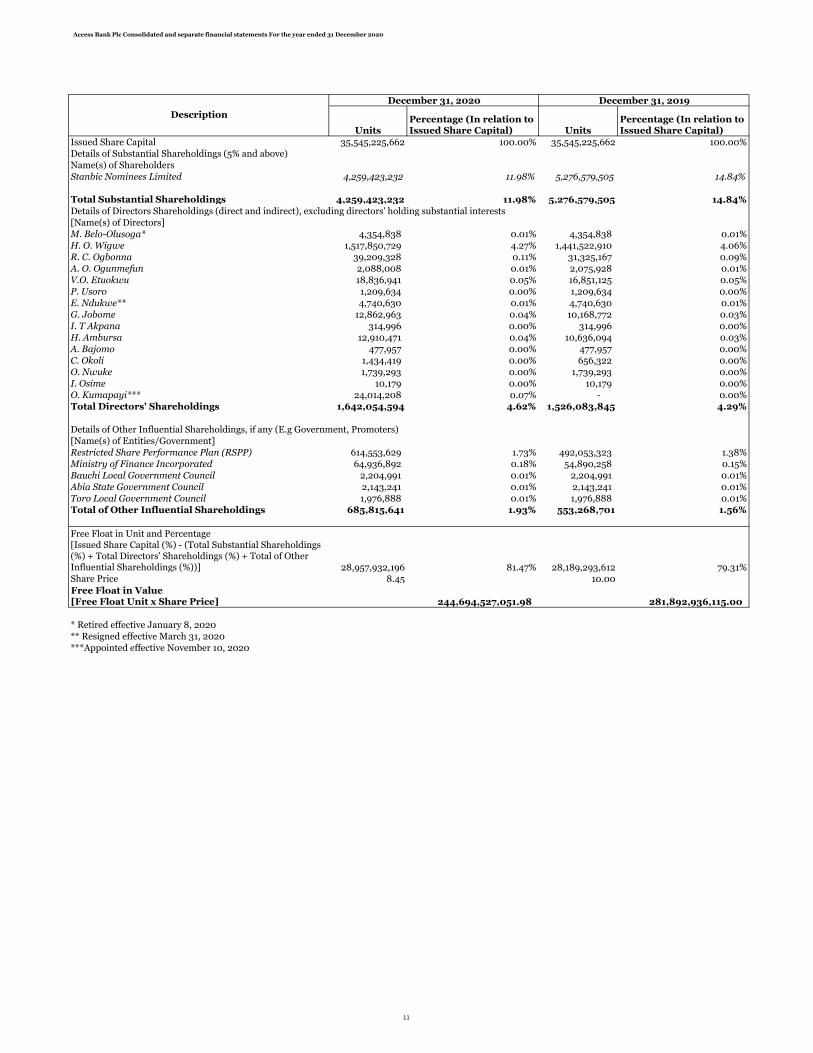
UnitsPercentage (In relation to Issued Share Capital) Units
Percentage (In relation to Issued Share Capital)
Issued Share Capital 35,545,225,662 100.00% 35,545,225,662 100.00%
Name(s) of Shareholders
Stanbic Nominees Limited 4,259,423,232 11.98% 5,276,579,505 14.84%
Total Substantial Shareholdings 4,259,423,232 11.98% 5,276,579,505 14.84%
[Name(s) of Directors]
M. Belo-Olusoga* 4,354,838 0.01% 4,354,838 0.01%
H. O. Wigwe 1,517,850,729 4.27% 1,441,522,910 4.06%
R. C. Ogbonna 39,209,328 0.11% 31,325,167 0.09%
A. O. Ogunmefun 2,088,008 0.01% 2,075,928 0.01%
V.O. Etuokwu 18,836,941 0.05% 16,851,125 0.05%
P. Usoro 1,209,634 0.00% 1,209,634 0.00%
E. Ndukwe** 4,740,630 0.01% 4,740,630 0.01%
G. Jobome 12,862,963 0.04% 10,168,772 0.03%
I. T Akpana 314,996 0.00% 314,996 0.00%
H. Ambursa 12,910,471 0.04% 10,636,094 0.03%
A. Bajomo 477,957 0.00% 477,957 0.00%
C. Okoli 1,434,419 0.00% 656,322 0.00%
O. Nwuke 1,739,293 0.00% 1,739,293 0.00%
I. Osime 10,179 0.00% 10,179 0.00%
O. Kumapayi*** 24,014,208 0.07% - 0.00%
Total Directors' Shareholdings 1,642,054,594 4.62% 1,526,083,845 4.29%
[Name(s) of Entities/Government]
Restricted Share Performance Plan (RSPP) 614,553,629 1.73% 492,053,323 1.38%
Ministry of Finance Incorporated 64,936,892 0.18% 54,890,258 0.15%
Bauchi Local Government Council 2,204,991 0.01% 2,204,991 0.01%
Abia State Government Council 2,143,241 0.01% 2,143,241 0.01%
Toro Local Government Council 1,976,888 0.01% 1,976,888 0.01%
Total of Other Influential Shareholdings 685,815,641 1.93% 553,268,701 1.56%
Free Float in Unit and Percentage[Issued Share Capital (%) - (Total Substantial Shareholdings (%) + Total Directors' Shareholdings (%) + Total of Other Influential Shareholdings (%))] 28,957,932,196 81.47% 28,189,293,612 79.31%Share Price 8.45 10.00
Free Float in Value[Free Float Unit x Share Price]
* Retired effective January 8, 2020
** Resigned effective March 31, 2020
***Appointed effective November 10, 2020
244,694,527,051.98 281,892,936,115.00
Description
December 31, 2020 December 31, 2019
Details of Substantial Shareholdings (5% and above)
Details of Directors Shareholdings (direct and indirect), excluding directors' holding substantial interests
Details of Other Influential Shareholdings, if any (E.g Government, Promoters)
11
Access Bank Plc Consolidated and separate financial statements For the year ended 31 December 2020
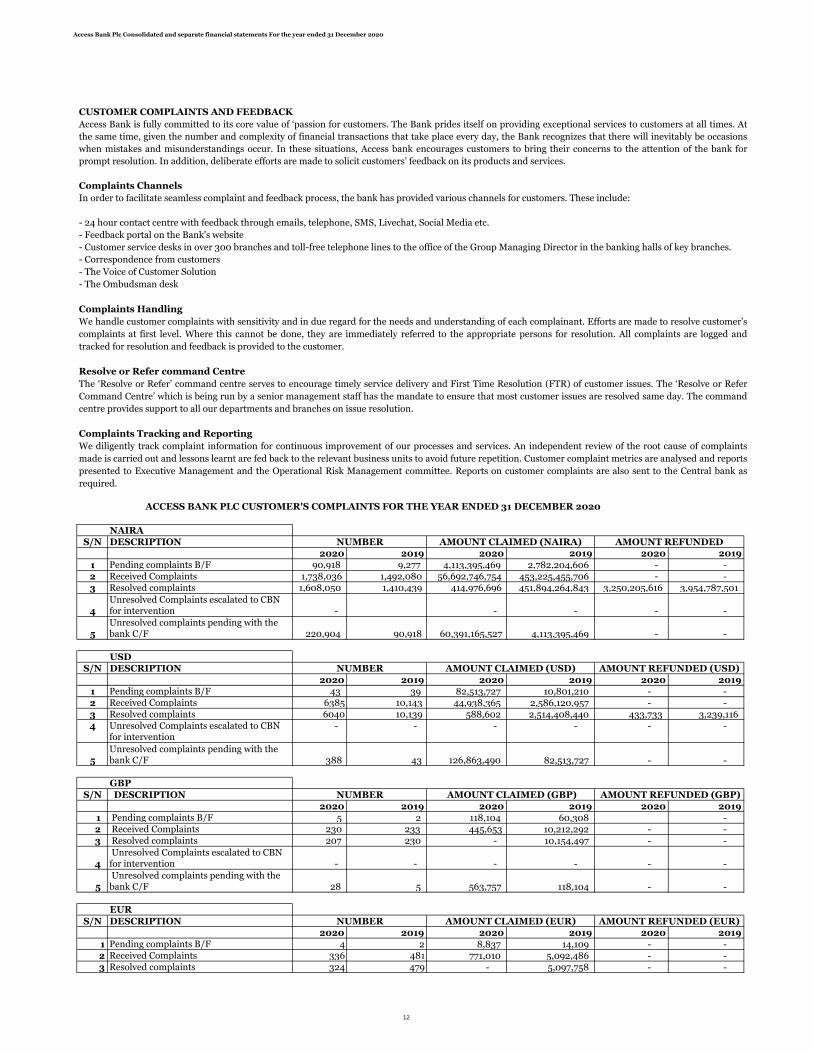
NAIRA
S/N DESCRIPTION
2020 2019 2020 2019 2020 2019
1 Pending complaints B/F 90,918 9,277 4,113,395,469 2,782,204,606 - -
2 Received Complaints 1,738,036 1,492,080 56,692,746,754 453,225,455,706 - -
3 Resolved complaints 1,608,050 1,410,439 414,976,696 451,894,264,843 3,250,205,616 3,954,787,501
4Unresolved Complaints escalated to CBN for intervention - - - - -
5Unresolved complaints pending with the bank C/F 220,904 90,918 60,391,165,527 4,113,395,469 - -
USD
S/N DESCRIPTION
2020 2019 2020 2019 2020 2019
1 Pending complaints B/F 43 39 82,513,727 10,801,210 - -
2 Received Complaints 6385 10,143 44,938,365 2,586,120,957 - -
3 Resolved complaints 6040 10,139 588,602 2,514,408,440 433,733 3,239,116
4 Unresolved Complaints escalated to CBN for intervention
- - - - - -
5Unresolved complaints pending with the bank C/F 388 43 126,863,490 82,513,727 - -
GBP
S/N DESCRIPTION
2020 2019 2020 2019 2020 2019
1 Pending complaints B/F 5 2 118,104 60,308 -
2 Received Complaints 230 233 445,653 10,212,292 - -
3 Resolved complaints 207 230 - 10,154,497 - -
4 Unresolved Complaints escalated to CBN for intervention - - - - - -
5 Unresolved complaints pending with the bank C/F 28 5 563,757 118,104 - -
EUR
S/N DESCRIPTION
2020 2019 2020 2019 2020 2019
1 Pending complaints B/F 4 2 8,837 14,109 - -
2 Received Complaints 336 481 771,010 5,092,486 - -
3 Resolved complaints 324 479 - 5,097,758 - -
NUMBER AMOUNT CLAIMED (GBP) AMOUNT REFUNDED (GBP)
NUMBER AMOUNT CLAIMED (EUR) AMOUNT REFUNDED (EUR)
NUMBER AMOUNT CLAIMED (USD) AMOUNT REFUNDED (USD)
CUSTOMER COMPLAINTS AND FEEDBACK
Access Bank is fully committed to its core value of ‘passion for customers. The Bank prides itself on providing exceptional services to customers at all times. At
the same time, given the number and complexity of financial transactions that take place every day, the Bank recognizes that there will inevitably be occasions
when mistakes and misunderstandings occur. In these situations, Access bank encourages customers to bring their concerns to the attention of the bank for
prompt resolution. In addition, deliberate efforts are made to solicit customers’ feedback on its products and services.
Complaints Channels
In order to facilitate seamless complaint and feedback process, the bank has provided various channels for customers. These include:
- 24 hour contact centre with feedback through emails, telephone, SMS, Livechat, Social Media etc.
- Feedback portal on the Bank's website
- Customer service desks in over 300 branches and toll-free telephone lines to the office of the Group Managing Director in the banking halls of key branches.
- Correspondence from customers
- The Voice of Customer Solution
- The Ombudsman desk
Complaints Handling
We handle customer complaints with sensitivity and in due regard for the needs and understanding of each complainant. Efforts are made to resolve customer’s
complaints at first level. Where this cannot be done, they are immediately referred to the appropriate persons for resolution. All complaints are logged and
tracked for resolution and feedback is provided to the customer.
Resolve or Refer command Centre
The ‘Resolve or Refer’ command centre serves to encourage timely service delivery and First Time Resolution (FTR) of customer issues. The ‘Resolve or Refer
Command Centre’ which is being run by a senior management staff has the mandate to ensure that most customer issues are resolved same day. The command
centre provides support to all our departments and branches on issue resolution.
Complaints Tracking and Reporting
We diligently track complaint information for continuous improvement of our processes and services. An independent review of the root cause of complaints
made is carried out and lessons learnt are fed back to the relevant business units to avoid future repetition. Customer complaint metrics are analysed and reports
presented to Executive Management and the Operational Risk Management committee. Reports on customer complaints are also sent to the Central bank as
required.
ACCESS BANK PLC CUSTOMER'S COMPLAINTS FOR THE YEAR ENDED 31 DECEMBER 2020
NUMBER AMOUNT CLAIMED (NAIRA) AMOUNT REFUNDED
12

Access Bank Plc Consolidated and separate financial statements For the year ended 31 December 2020
4 Unresolved Complaints escalated to CBN for intervention
- - - - - -
5Unresolved complaints pending with the bank C/F 16 4 779,847 8,837 - -
Solicited Customer Feedback
Deliberate efforts are made to solicit feedback from customers and staff on the services and products
of the bank through the following:
- Questionnaires
- Customer interviews
- Customers forum
- Quest for Excellence Sessions (for staff)
- Voice of Customer Surveys
The various feedback efforts are coordinated by our Service and innovation Group
The feedback obtained from customers are reviewed and lessons learnt are used for staff training and
service improvement across the bank.
REPORTS TO THE CBN ON FRAUD AND FORGERIES
S/N Category Frequency Actual Loss % Loss Frequency Actual Loss % Loss
1 ATM/Electronic Fraud 11,717 - 0.00% 5,715 - 0.00%
2 Cash Theft/ Suppression 40 55,933,180 40.48% 73 100,443,185 29.96%
3 Fraudulent Transfer/Withdrawals 27 82,237,064 59.52% 38 122,120,354 36.43%
4 Fraudulent Loan - - 0.00% - - 0.00%
5 Armed Robbery - - 0.00% 3 16,276,000 4.86%
6 Cyber Attack - - 0.00% 1 96,363,209 28.75%
7 Clearing - - 0.00% 1 - 0.00%
8 Presentation of Forged Instrument - - 0.00% 5 - 0.00%
TOTAL 11,784 138,170,244 100% 5,836 335,202,748 100%
December 2020 December 2019
13
Access Bank Plc Consolidated financial statements For the year ended 31 December 2020
14
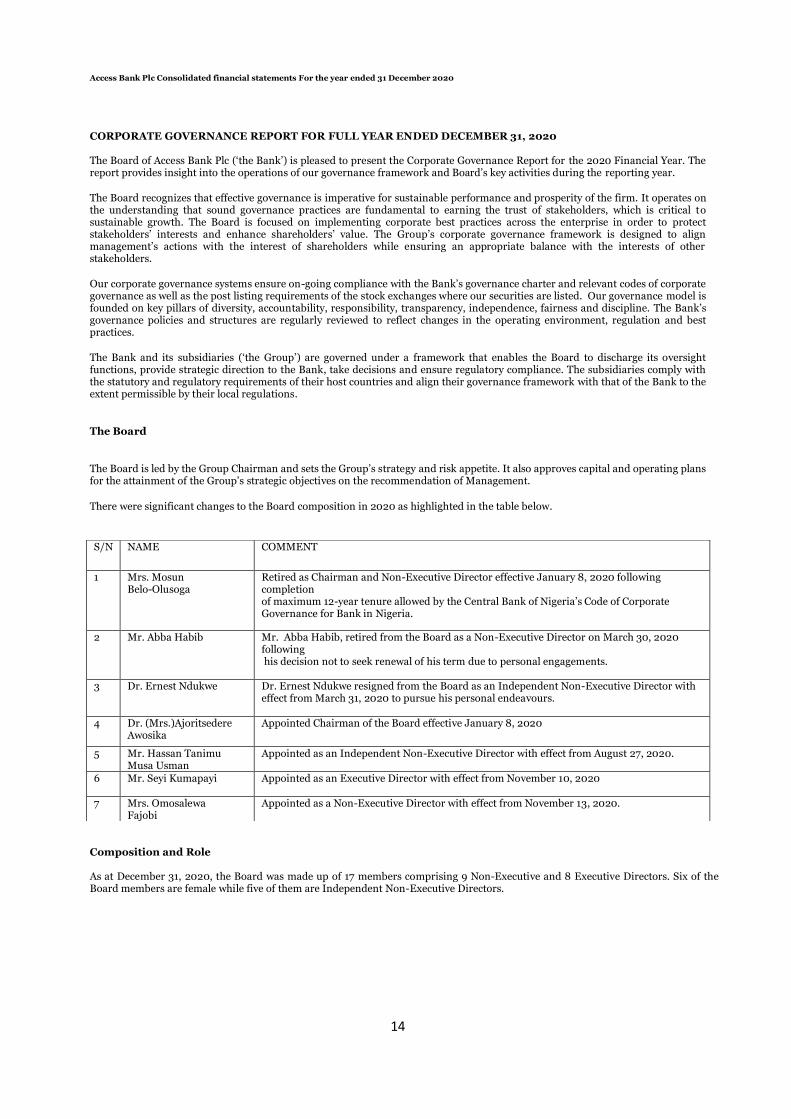
CORPORATE GOVERNANCE REPORT FOR FULL YEAR ENDED DECEMBER 31, 2020 The Board of Access Bank Plc (‘the Bank’) is pleased to present the Corporate Governance Report for the 2020 Financial Year. The report provides insight into the operations of our governance framework and Board’s key activities during the reporting year.
The Board recognizes that effective governance is imperative for sustainable performance and prosperity of the firm. It operates on the understanding that sound governance practices are fundamental to earning the trust of stakeholders, which is critical to sustainable growth. The Board is focused on implementing corporate best practices across the enterprise in order to protect stakeholders’ interests and enhance shareholders’ value. The Group’s corporate governance framework is designed to align management’s actions with the interest of shareholders while ensuring an appropriate balance with the interests of other stakeholders.
Our corporate governance systems ensure on-going compliance with the Bank’s governance charter and relevant codes of corporate governance as well as the post listing requirements of the stock exchanges where our securities are listed. Our governance model is founded on key pillars of diversity, accountability, responsibility, transparency, independence, fairness and discipline. The Bank’s governance policies and structures are regularly reviewed to reflect changes in the operating environment, regulation and best practices.
The Bank and its subsidiaries (‘the Group’) are governed under a framework that enables the Board to discharge its oversight functions, provide strategic direction to the Bank, take decisions and ensure regulatory compliance. The subsidiaries comply with the statutory and regulatory requirements of their host countries and align their governance framework with that of the Bank to the extent permissible by their local regulations.
The Board
The Board is led by the Group Chairman and sets the Group’s strategy and risk appetite. It also approves capital and operating plans for the attainment of the Group’s strategic objectives on the recommendation of Management.
There were significant changes to the Board composition in 2020 as highlighted in the table below.
Composition and Role As at December 31, 2020, the Board was made up of 17 members comprising 9 Non-Executive and 8 Executive Directors. Six of the Board members are female while five of them are Independent Non-Executive Directors.
S/N NAME COMMENT
1 Mrs. Mosun Belo-Olusoga
Retired as Chairman and Non-Executive Director effective January 8, 2020 following completion of maximum 12-year tenure allowed by the Central Bank of Nigeria’s Code of Corporate Governance for Bank in Nigeria.
2 Mr. Abba Habib Mr. Abba Habib, retired from the Board as a Non-Executive Director on March 30, 2020 following his decision not to seek renewal of his term due to personal engagements.
3 Dr. Ernest Ndukwe Dr. Ernest Ndukwe resigned from the Board as an Independent Non-Executive Director with effect from March 31, 2020 to pursue his personal endeavours.
4 Dr. (Mrs.)Ajoritsedere Awosika
Appointed Chairman of the Board effective January 8, 2020
5 Mr. Hassan Tanimu Musa Usman
Appointed as an Independent Non-Executive Director with effect from August 27, 2020.
6 Mr. Seyi Kumapayi Appointed as an Executive Director with effect from November 10, 2020
7 Mrs. Omosalewa Fajobi
Appointed as a Non-Executive Director with effect from November 13, 2020.

Access Bank Plc Consolidated financial statements For the year ended 31 December 2020
15
Board Members Profile Dr. (Mrs.) Ajoritsedere Awosika, MFR Chairman/Independent Non-Executive Director Dr. Awosika is an accomplished administrator with over three decades’ experience in public sector governance. She was at various times, the Permanent Secretary in the Federal Ministries of Internal Affairs, Science & Technology and Power. She is a Fellow of the Pharmaceutical Society of Nigeria and the West African Postgraduate College of Pharmacy. She holds a doctorate degree in Pharmaceutical Technology from the University of Bradford, United Kingdom. She was appointed to the Board of Access Bank Plc in April 2013 and served as the Vice-Chairman of the Board Audit Committee and Chairman of the Board Credit and Finance Committee prior to her appointment as the Chairman of the Board. Dr. Awosika sits on the boards of Capital Express Assurance Ltd, Josephine Consulting Limited, University of Warri, African Initiative for Governance and Nigerian Prize for Leadership. She became the Chairman of the Board on January 8, 2020 following the retirement of Mrs. Mosun Belo-Olusoga. She is 68 years old as at the date of this meeting. Mrs. Anthonia Ogunmefun Non-Executive Director Mrs. Ogunmefun is the Managing Partner of Kemi Ogunmefun Law Office, a Canadian-based private legal practice specialising in immigration law, family law, real estate and corporate law. She served as the Chairperson of Governance Committee of Kinark Child and Family Services, a major Canadian childcare trust, and is a Non-Executive Director of LOC Nominees Limited. Mrs. Ogunmefun obtained her Bachelor of Laws degree from the University of Lagos in 1974. She was called to the Nigerian Bar in 1975 and the Law Society of Upper Canada in 2004. She was appointed to the Board in April 2011 and is the Chairman of the Board Risk Management Committee and Vice Chairman of the Human Resources and Sustainability Committee. She is 69 years old as at the date of this meeting. Mr. Paul Usoro, SAN Non-Executive Director Mr. Usoro is a Senior Advocate of Nigeria, a Fellow of the Chartered Institute of Arbitrators and the founder and Senior Partner of the Law firm of Paul Usoro & Co. He has over 30 years of law practice experience and is acknowledged as a highly experienced litigator and communication law expert. He was elected President of the Nigerian Bar Association in August 2018 for a two-year term and is currently a Non-Executive Director of PZ Cussons Nigeria Plc. He is also a member of the National Judicial Council and Body of Benchers. He represented Access Bank as a Non-Executive Director on the board of the defunct Intercontinental Bank Plc. Mr. Usoro holds a Bachelor of Laws degree from the University of Ife (1981) and was called to the Nigerian Bar in 1982. He joined the Board in January 2014 and currently chairs the Board Human Resources and Sustainability Committee and Board Technical Committee on Retail Expansion. He is also the Vice-Chairman of the Board Risk Management Committee. He is 62 years old as at the date of this meeting. Mr. Adeniyi Adekoya Independent Non- Executive Director Mr. Adekoya is a highly experienced maritime and oil and gas industry expert with significant experience in investment banking. He was a one-time General Manager of Peacegate Holdings Ltd where he was responsible for setting up and developing the company’s marine operations. He was also a consultant to Maine Nigeria Ltd where he developed the framework for a private placement to raise USD 500 million start-up capital and led the company’s participation in bid rounds for oil blocks in the Republic of Equatorial Guinea. Mr. Adekoya worked with Mobil Oil Producing Nigeria Unlimited as a Budget Officer, Exploration Department and obtained financial service industry experience from AIM Fund and Trimark Investment Service, both in Ontario, Canada. Mr. Adekoya holds a Bachelor’s Degree in Business Administration from the University of Lagos. He joined the Board in March 2017 and currently chairs the Board Audit Committee and Board Digital and Information Technology Committee. He is also the Vice-Chairman of the Board Governance, Nomination and Remuneration Committee. He sits on the boards of Synerpet Ltd, Weston Integrated Services Ltd and Prime Atlantic Limited. He is 54 years old as at the date of this meeting.

Access Bank Plc Consolidated financial statements For the year ended 31 December 2020
16
Mr. Iboroma Akpana Independent Non- Executive Director Mr. Akpana is the Managing Partner of Solola & Akpana, one of the leading commercial and oil and gas law firms in Nigeria. He is a consummate corporate and commercial lawyer with a career spanning over two decades. Mr. Akpana has a proven track record of academic excellence. He graduated as a top student in Law from the University of Jos and obtained a master’s degree from Harvard Law School. He is a Notary of the Federal Republic of Nigeria. Based on his work, he was recognised in the Chambers Global 2006, 2007, 2008 and 2009 editions as a ‘Leading Individual’ in Nigeria in its Corporate and Commercial section. Similarly, the International Financial Law Review 1000 ranked him as a ‘Leading Lawyer’ in Nigeria in its 2006, 2007, 2008 and 2009 editions while the Legal 500 Europe, Middle East and Africa profiled him as a ‘Recommended Individual’. Mr. Akpana is a member of the International Bar Association, American Bar Association, New York State Bar Association, Nigerian Bar Association and the Law Society of England and Wales. He joined the Board in March 2017 and currently chairs the Board Governance, Nomination and Remuneration Committee. He is also the Vice-Chairman of the Board Audit Committee and Board Credit and Finance Committee. He sits on the Boards of AMNI International Petroleum Development Company Limited and Contracting Plus Limited. He is 56 years old as at the date of this meeting. Mrs. Ifeyinwa Osime Independent Non-Executive Director Mrs. Osime is a versatile and result oriented professional with over 30 years’ experience in the insurance industry and commercial legal practice at management and board levels. She has deep knowledge and experience in the management of administrative, legal, and company secretarial functions in financial and other related institutions. She had championed and established a special needs programme which is actively involved in the management and care of children and young people with special needs. She is currently engaged in legal practice with Macpherson Legal Practitioners, a Lagos-based law firm. Mrs. Osime is an Independent Non-Executive Director of WAPIC Life Assurance Company Limited and a Non-Executive Director of Smartbase Services, Ebudo Trust Limited and AIP Global Limited. Mrs. Osime was the former Chairperson of PHB Healthcare Limited, a former Director, Bank PHB Plc (now Keystone Bank Limited) and a former Director of Insurance PHB Limited (now KBL Insurance). She was the Company Secretary/Legal Adviser of African Development Insurance Company Limited (now NSIA Insurance) between 1989 and 1997. She holds a Master’s Degree in Law from University of London (1989) with specialization in Corporate and Commercial Law and an LLB Degree from the University of Benin (1986). She joined the Board in November 2019 and is the Vice-Chairman of the Board Digital and Information Technology Committee. She is 53 years old as at the date of this meeting. Dr. Okey Nwuke, FCA Non-Executive Director Dr. Nwuke has over 28 years’ experience in finance and corporate governance working with top corporates and leading commercial banks in Nigeria. He is a Fellow of both the Institute of Chartered Accountants of Nigeria and Chartered Institute of Taxation of Nigeria, an honorary member of Chartered Institute of Bankers of Nigeria and a member of Business Recovery and Insolvency Practitioners.
He has garnered considerable expertise in credit analysis and bank financial management through professional training as a Chartered Accountant, from relevant training programmes as well as on the job training. He was an Executive Director in Access Bank from 2004 to 2013 and served as the Chairman of the Board of Directors of the Bank’s subsidiaries in Rwanda and Burundi. Dr. Nwuke was a pioneer Non-Executive Director of Stanbic IBTC Pension Managers Limited representing Access Bank.
Dr. Nwuke’s key competencies include finance, strategy development and execution, organizational restructuring and transformation, leadership and change management. He joined the Board of Coscharis Group in August 2014 and is currently responsible for the strategic drive to position it for sustainability. He currently chairs the Shareholders’ Audit Committee of NASCON Plc and sits on the Boards of Access Pension Fund Custodian Limited, First Ally Asset Management Limited, Claritus Limited Simply Gifts and Interiors Limited and Personal Trust Micro Finance Bank Limited. He holds a B.Sc. Degree in Accountancy from University of Nigeria, Nsukka and an MBA (Distinction) in International Banking and Finance from the Birmingham Business School, United Kingdom. Dr. Nwuke holds a Doctorate Degree in Business Administration (DBA) from Walden University, Minnesota, USA with a research focus on leadership transition challenges in family businesses. He has been exposed to several leadership and professional development programmes at renowned institutions including Harvard Business School, Boston (AMP 175), Wharton Business School, Pennsylvania (both in U.S.A), INSEAD and IMD. He joined the Board in November 2019 and currently chairs the Board Credit and Finance Committee. He is also the Vice-Chairman of the Board Technical Committee on Retail Expansion.

Access Bank Plc Consolidated financial statements For the year ended 31 December 2020
17
He is 54 years old as at the date of this meeting. Mr. Hassan M.T Usman, FCA Independent Non-Executive Director Mr. Usman is the Founder/Chief Executive Officer of New Frontier Development Limited, an investment company focused on
financial advisory, hospitality, real estate and proprietary investments in start-ups and challenged companies in the SME space. He
is also the Founder/Chairman of the Board of Trustees of the Al-Qalam (Pen) Foundation, a Not-for-Profit Organisation that provides
educational opportunities to disadvantaged children.
Prior to this, he was the Managing Director/Chief Executive Officer of Aso Savings and Loans Plc and an Executive Director at Abuja
Investment and Property Development Company Limited. He was at various times the Deputy Director and Head of Petrochemicals
and Gas Unit; Transport Sector Reform Team as well as the Deputy Director Telecoms Reform, Team Lead and Head NITEL
Privatisation at the Bureau of Public Enterprises. He also worked with Central Bank of Nigeria, Arthur Andersen and CitiBank
Nigeria. Mr. Usman sits on the Boards of Abuja Leasing Company Limited, Kairos Capital Limited and Sentinel Energy and Gas
Limited.
Mr. Usman holds a Bachelor of Arts Degree in Economics from University of Sussex and a Master of Philosophy in Development Economics from University of Cambridge. He is a Fellow of the Institute of Chartered Accountants of England and Wales. Mr. Usman is also an Eisenhower Fellow and Archbishop Desmond Tutu Fellow of the African Leadership Institute.
Over the years, he has served as a member of the Board of Directors of the Nigeria Sovereign Investment Authority, Nigeria Mortgage Refinance Company and Council of the Nigeria Stock Exchange.
Mr. Usman joined the Board in August 2020.
He is 53 years old as at the date of this meeting. Mrs. Omosalewa Fajobi Non-Executive Director Mrs. Fajobi is an experienced legal counsel and governance professional with a demonstrated history of working in the financial,
investment and legal services industry. She is currently an Operating Director at Tengen Family Office Ltd.
She is a versatile solicitor with strong competencies in negotiation, business risk management and financial analysis who has
provided support in setting up companies across different sectors, creating operational bases that have proved effective and efficient.
Mrs. Fajobi worked with International Finance Corporation from May 2014 to June 2017 as Project Lead (Nigeria) Africa Corporate
Governance Programme. She also had extensive corporate counsel experience working at Standard Chartered Bank, Access Bank
and the defunct Ocean Bank Plc.
She holds an LLM Degree (Merit) from University of London (2009) with specialization in Corporate and Commercial Law and Second-Class Upper Degree from University of Lagos (1999). She is a member of the Nigerian Bar Association. She sits on the Boards of Coronation Insurance Plc, Coronation Securities Limited, One Terminals Limited and Coronation GPS Limited. Mrs. Fajobi joined the Board in November 2020. She is 43 years old as at the date of this meeting. Mr. Herbert Wigwe, FCA Group Managing Director /Chief Executive Office Mr. Wigwe started his professional career with Coopers & Lybrand Associates, an international firm of Chartered Accountants. He spent over 10 years at Guaranty Trust Bank Plc where he managed several portfolios, including financial institutions, large corporates and multinationals. He left Guaranty Trust Bank as an Executive Director to co-lead the transformation of Access Bank Plc in March 2002 as Deputy Managing Director. He was appointed Group Managing Director/CEO effective January 1, 2014. Mr Wigwe is an alumnus of the Harvard Business School Executive Management Programme. He holds a master’s degree in Banking and International Finance from the University College of North Wales, a master’s degree in Financial Economics from the University of London and a B.Sc. degree in Accounting from the University of Nigeria, Nsukka. He is also a Fellow of the Institute of Chartered Accountants of Nigeria (ICAN). Mr Wigwe is the Chairman of The Access Bank (UK) Ltd and a Non-Executive Director of Nigerian Mortgage Refinance Company Plc; FMDQ OTC Securities Exchange; Shared Agents Network Expansion Facilities Ltd and Agri-Business/ SME Enterprises Investment Scheme. He also sits on the Boards of CACOVID-19 LTD/GTE, HIV Trust Fund of Nigeria and the Nigerian Business Coalition Against Aids.

Access Bank Plc Consolidated financial statements For the year ended 31 December 2020
18
He is 54 years old as at the date of this meeting. Mr. Roosevelt Ogbonna, FCA, CFA Group Deputy Managing Director Mr Ogbonna was appointed Executive Director, Commercial Banking Division in October 2013. He became Group Deputy Managing Director on May 1, 2017. He has over 20 years’ experience in banking, cutting across Treasury, Commercial and Corporate Banking. He joined Access Bank in 2002 as a Manager from Guaranty Trust Bank Plc. He is a Fellow of the Institute of Chartered Accountants of Nigeria and holds a second-class upper degree in Banking and Finance from the University of Nigeria, Nsukka. He is also a Chartered Financial Analyst and has attended Executive Management Development Programmes in several leading institutions. Mr. Ogbonna represents the Bank on the boards of Access Bank (Zambia) Ltd, Central Securities Clearing System Plc, Africa Finance Corporation and The Access Bank (UK) Limited. He is 47 years old as at the date of this meeting. Mr. Victor Etuokwu, HCIB Executive Director Personal Banking Mr. Etuokwu’s appointment as Executive Director was renewed in January 2018 following the expiration of his initial term. He was first appointed Executive Director of the Bank in January 2012. He oversees the Personal Banking Division and has over two decades of banking experience cutting across Operations, Information Technology, and Business Development. He joined the Bank in July 2003 from Citibank Nigeria. Mr Etuokwu holds a Bachelor of Science degree and a Master’s in Business Administration from the University of Ibadan and the University of Benin respectively. He is an Honorary Senior Member of the Chartered Institute of Bankers of Nigeria and represents the Bank on the boards of E-Tranzact Plc and Unified Payments Services Limited. He also sits on the Board of ACT Foundation and Access Pension Fund Custodian Limited. He is 54 years old as at the date of this meeting. Dr. Gregory Jobome, HCIB Executive Director Chief Risk Officer Dr. Jobome is a thoroughbred banking professional with a strong academic background. He obtained a first-class degree in Economics from the University of Maiduguri in 1986 and a Distinction in Master of Business Administration degree from Obafemi Awolowo University in 1990. Dr Jobome also obtained a Master of Science Degree (1994) and a Doctorate degree (2002) both in Economics and Finance from Loughborough University, UK. He has over 26 years of working experience obtained from Guaranty Trust Bank Plc, the University of Liverpool Management School, Manchester Business School and Access Bank Plc. He joined Access Bank Plc in July 2010 as a General Manager and Chief Risk Officer. Prior to joining the Bank, he was a Risk Management Consultant to Guaranty Trust Bank Plc. Dr. Jobome has been instrumental to the many giant strides attained by the Bank in the risk management space. Dr. Jobome is a highly sought-after resource person and has held several key industry leadership positions, including; Director, CRC Credit Bureau Ltd; President, Risk Management Association of Nigeria; Member, Working Group on Regulatory Reforms of the Institute of International Finance and Member, Capacity Building Committee. He is also an Honorary Senior Member of the Chartered Institute of Bankers of Nigeria. He was appointed to the Board in January 2017. He is a Non-Executive Director on the Board of CRC Credit Bureau Ltd, an investee company of the Bank. He also sits of the Board of Access Bank Mozambique S.A He is 55 years old as at the date of this meeting. Ms. Hadiza Ambursa Executive Director Commercial Banking Ms. Ambursa was appointed Executive Director, Commercial Banking Division in November 2017. She has over two decades of banking experience from Guaranty Trust Bank and Access Bank. Her experience spans across Transaction Services, Public Sector, Commercial Banking and Corporate Finance. Prior to joining Access Bank in 2003, she was a Relationship Manager, Public Sector in Guaranty Trust Bank Plc.

Access Bank Plc Consolidated financial statements For the year ended 31 December 2020
19
Ms. Ambursa graduated with a Bachelor of Science degree in Political Science from University of Jos in 1991 and obtained a master’s degree in Law and Diplomacy in 1996 from the same university. She subsequently attended Massachusetts Institute of Technology (‘MIT’) where she obtained a Master’s in Business Administration in 2009. She has attended several Executive Management Development Programmes in leading institutions, including Harvard Business School and MIT. She sits on the Boards of Access Bank Ghana Plc and Bank Directors Association of Nigeria. She is 50 years old as at the date of this meeting. Mr. Adeolu Bajomo Executive Director Information Technology & Operations Mr. Bajomo is a globally focused financial services executive with achievements cutting across banking, insurance and capital market. Mr. Bajomo’s appointment as Executive Director, Information Technology and Operations was approved by the Central Bank of Nigeria in January 2018. Prior to joining the Bank, he was Executive Director, Market Operations and Technology at the Nigerian Stock Exchange. In that role, he delivered market-wide transformation initiatives that firmly established the Exchange as the second largest stock exchange in Africa by market capitalization with over 7 million investors. Mr. Bajomo worked as Regional Head of Transformation Programme at Barclays Bank Plc UK (2007-2011); Head of IT Strategy and Systems at Pearl Insurance Group, UK (2006-2007) and IT Director at Fortis Bank UK (1997-2006) amongst other leadership roles. He holds an MBA from CASS Business School; MSc Information Systems Engineering from South Bank University, London and a BSc in Civil Engineering from University of Ife. Mr. Bajomo is a chartered member of British Computer Society and a member of Institute of Directors, UK. He sits on the Boards of Nigerian Interbank Settlement Scheme (‘NIBSS’) Plc and Access Bank Kenya Plc. He is 55 years old as at the date of this meeting. Mrs. Chizoma Okoli, HCIB Executive Director Business Banking Division Mrs. Okoli commenced her banking career as an Executive Trainee in the Operations Unit of Diamond Bank Plc in April 1992 and served in various capacities in the bank until her appointment as an Executive Director in Diamond Bank in September 2016. She joined the Board of Access Bank Plc in March 2019 following the merger with the former Diamond Bank. She is a 1989 Law Graduate from the University of Benin and was called to the Nigerian Bar in December 1990. She holds an MBA from Warwick Business School, Coventry, UK. Mrs. Okoli has attended various courses in Nigeria and abroad including the Advanced Management Programme of Wharton Executive Education, University of Pennsylvania, and the Senior Management Programme of the Lagos Business School. She is also an Honorary Member of the Chartered Institute of Bankers of Nigeria. She represents the Bank on the Board of Aspire Nigeria Fund Trust. She is 52 years old as at the date of this meeting. Mr. Oluseyi Kumapayi, FCA Executive Director, African Subsidiaries Prior to his recent appointment, Mr. Kumapayi was the Group Chief Financial Officer of Access Bank Plc, a position he has held since 2008. He is a highly accomplished and result-driven professional. He has over 20 years of progressive banking experience spanning across Finance, Strategy, Risk Management, and Treasury. He joined Access Bank in 2002 as the Head of Financial Control and Credit Risk Management. Prior to joining Access Bank, he held controller and analyst positions with First City Monument Bank Limited and Guaranty Trust Bank Plc respectively. Since joining Access Bank, he has played a significant role in the creation of the largest retail bank in Nigeria and specific corporate actions that have supported the Bank’s growth objectives and enhanced its capacity to play in key local and international markets. Mr. Kumapayi is an alumnus of Harvard Business School. He holds a master’s degree in Mechanical Engineering from the University of Lagos, and a bachelor’s degree in Agricultural Engineering from the University of Ibadan, Nigeria. He has also attended several Executive Management Development programme in leading institutions including INSEAD, IMD and London Business School. He is a Fellow of the Institute of Chartered Accountants of Nigeria (ICAN), and a member of the Global Association of Risk Professionals (GARP), the Chartered Institute of Taxation of Nigeria (CITN) and the Chartered Institution of Bankers of Nigeria (CIBN). He is a board member of the Ogun State Security Trust Fund.
Access Bank Plc Consolidated financial statements For the year ended 31 December 2020
20
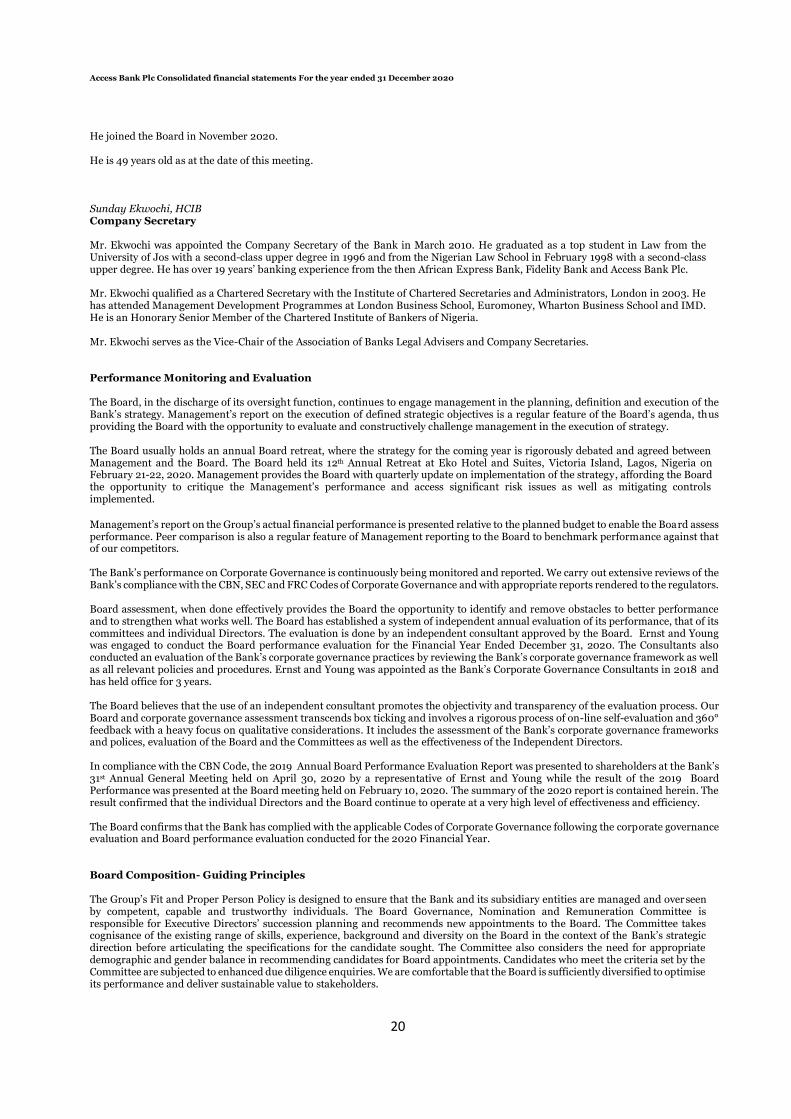
He joined the Board in November 2020. He is 49 years old as at the date of this meeting. Sunday Ekwochi, HCIB Company Secretary Mr. Ekwochi was appointed the Company Secretary of the Bank in March 2010. He graduated as a top student in Law from the University of Jos with a second-class upper degree in 1996 and from the Nigerian Law School in February 1998 with a second-class upper degree. He has over 19 years’ banking experience from the then African Express Bank, Fidelity Bank and Access Bank Plc. Mr. Ekwochi qualified as a Chartered Secretary with the Institute of Chartered Secretaries and Administrators, London in 2003. He has attended Management Development Programmes at London Business School, Euromoney, Wharton Business School and IMD. He is an Honorary Senior Member of the Chartered Institute of Bankers of Nigeria. Mr. Ekwochi serves as the Vice-Chair of the Association of Banks Legal Advisers and Company Secretaries. Performance Monitoring and Evaluation The Board, in the discharge of its oversight function, continues to engage management in the planning, definition and execution of the Bank’s strategy. Management’s report on the execution of defined strategic objectives is a regular feature of the Board’s agenda, thus providing the Board with the opportunity to evaluate and constructively challenge management in the execution of strategy. The Board usually holds an annual Board retreat, where the strategy for the coming year is rigorously debated and agreed between Management and the Board. The Board held its 12th Annual Retreat at Eko Hotel and Suites, Victoria Island, Lagos, Nigeria on February 21-22, 2020. Management provides the Board with quarterly update on implementation of the strategy, affording the Board the opportunity to critique the Management’s performance and access significant risk issues as well as mitigating controls implemented.
Management’s report on the Group’s actual financial performance is presented relative to the planned budget to enable the Board assess performance. Peer comparison is also a regular feature of Management reporting to the Board to benchmark performance against that of our competitors. The Bank’s performance on Corporate Governance is continuously being monitored and reported. We carry out extensive reviews of the Bank’s compliance with the CBN, SEC and FRC Codes of Corporate Governance and with appropriate reports rendered to the regulators. Board assessment, when done effectively provides the Board the opportunity to identify and remove obstacles to better performance and to strengthen what works well. The Board has established a system of independent annual evaluation of its performance, that of its committees and individual Directors. The evaluation is done by an independent consultant approved by the Board. Ernst and Young was engaged to conduct the Board performance evaluation for the Financial Year Ended December 31, 2020. The Consultants also conducted an evaluation of the Bank’s corporate governance practices by reviewing the Bank’s corporate governance framework as well as all relevant policies and procedures. Ernst and Young was appointed as the Bank’s Corporate Governance Consultants in 2018 and has held office for 3 years. The Board believes that the use of an independent consultant promotes the objectivity and transparency of the evaluation process. Our Board and corporate governance assessment transcends box ticking and involves a rigorous process of on-line self-evaluation and 360° feedback with a heavy focus on qualitative considerations. It includes the assessment of the Bank’s corporate governance frameworks and polices, evaluation of the Board and the Committees as well as the effectiveness of the Independent Directors. In compliance with the CBN Code, the 2019 Annual Board Performance Evaluation Report was presented to shareholders at the Bank’s 31st Annual General Meeting held on April 30, 2020 by a representative of Ernst and Young while the result of the 2019 Board Performance was presented at the Board meeting held on February 10, 2020. The summary of the 2020 report is contained herein. The result confirmed that the individual Directors and the Board continue to operate at a very high level of effectiveness and efficiency. The Board confirms that the Bank has complied with the applicable Codes of Corporate Governance following the corporate governance evaluation and Board performance evaluation conducted for the 2020 Financial Year. Board Composition- Guiding Principles The Group’s Fit and Proper Person Policy is designed to ensure that the Bank and its subsidiary entities are managed and overseen by competent, capable and trustworthy individuals. The Board Governance, Nomination and Remuneration Committee is responsible for Executive Directors’ succession planning and recommends new appointments to the Board. The Committee takes cognisance of the existing range of skills, experience, background and diversity on the Board in the context of the Bank’s strategic direction before articulating the specifications for the candidate sought. The Committee also considers the need for appropriate demographic and gender balance in recommending candidates for Board appointments. Candidates who meet the criteria set by the Committee are subjected to enhanced due diligence enquiries. We are comfortable that the Board is sufficiently diversified to optimise its performance and deliver sustainable value to stakeholders.

Access Bank Plc Consolidated financial statements For the year ended 31 December 2020
21
The Board’s composition subscribes to global best practice on the need for Non-Executive Directors to exceed Executive Directors. In 2020, the Board had more Non-Executive Directors than Executive Directors, with five of the Non-Executive Directors being independent as against two required by the CBN Code of Corporate Governance for Banks in Nigeria. Non-Executive Directors are appointed to the Board to bring independent, specialist knowledge and impartiality to strategy development and execution monitoring. The Board is committed to improving gender diversity in its composition in line with its diversity policy. 25% of the Executive Management team is composed of females while the Board had 35% female memberships as of December 31, 2020 above Nigeria’s national average of 12%. In addition, 43% of the Bank’s workforce is composed of female staff.
Retirement and Re-election of Directors
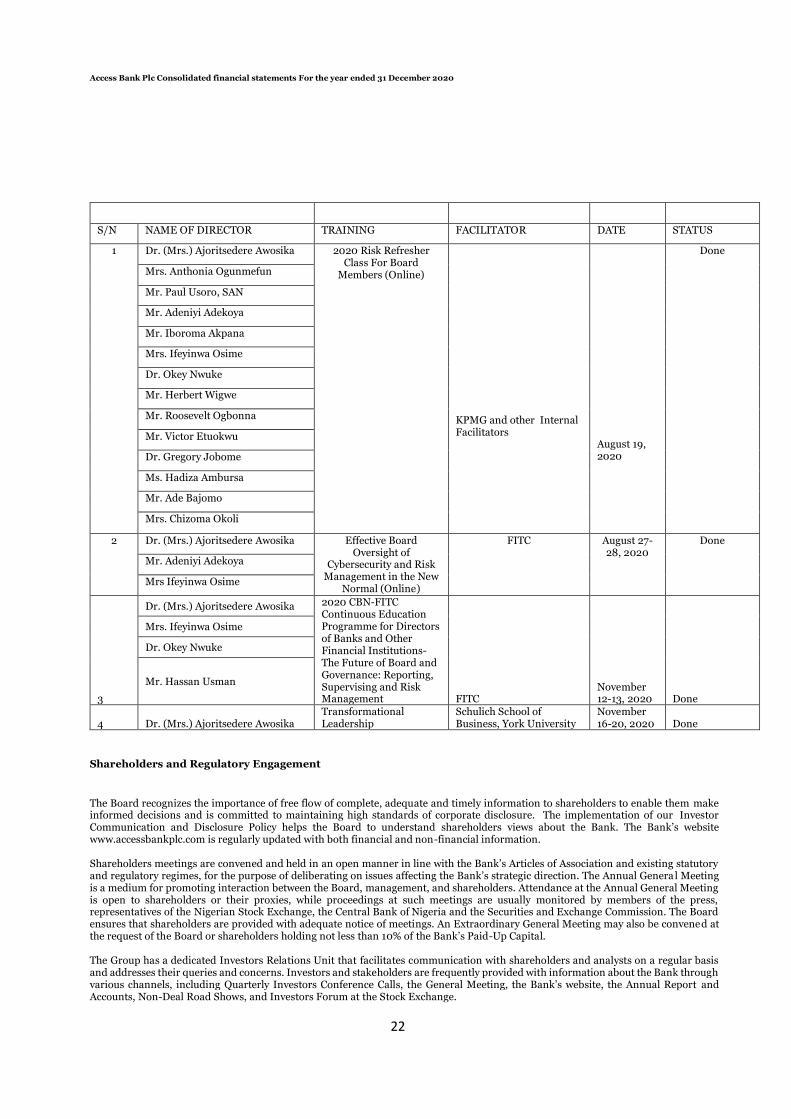
In accordance with the Bank’s Articles of Association, one third of all Non-Executive Directors (rounded down) are offered for re-election every year (depending on their tenure on the Board) together with Directors appointed by the Board since the last Annual General Meeting. Messrs Adeniyi Adekoya and Iboroma Akpana retired at the Bank’s 31st Annual General Meeting held on April 30, 2020 and being eligible for re-election were duly re-elected by shareholders. The shareholders also approved the appointment of Mrs. Ifeyinwa Osime as an Independent Non-Executive Director and Dr. Okey Nwuke as a Non-Executive Director. The appointment of the new Directors was earlier approved by the Board and the Central Bank of Nigeria. Mr. Abba Habib and Dr. Ernest Ndukwe retired and resigned respectively from the Board to pursue other personal endeavours. Mrs. Mosun Belo-Olusoga also retired from the Board following the completion of the maximum 12-year term allowed for Non-Executive Director by the Central Bank of Nigeria. Prior to their exit from the Board, Mrs. Mosun Belo-Olusoga was the Chairman of the Bank and a Non-Executive Director, Mr. Abba Habib was a Non-Executive Director while Dr. Ernest Ndukwe was an Independent Non-Executive Director. The Board commends them for their valuable contributions to the Bank and wishes them success in their future endeavours. In the course of the year, the Board appointed Mr. Hassan Tanimu Musa Usman as an Independent Non-Executive Director, Mr. Seyi Kumapayi as an Executive Director and Mrs. Omosalewa Fajobi as a Non-Executive Director. All referenced Board appointments have been approved by the Central Bank of Nigeria. In line with the provisions of the Articles of Association, the three appointees will retire at this meeting and will submit themselves for election. Pursuant to the provisions of the Bank’s Articles of Association, Mr. Paul Usoro, SAN will retire during this Annual General Meeting and being eligible for re-election, will submit himself for re-election. The Board is convinced that the Directors standing for election and re-elections will continue to add value to the Bank. The Board believes that they are required to maintain the needed balance of skill, knowledge and experience on the Board. The biographical details of the Directors standing for election and re-election are contained in this report. Board Effectiveness Today’s boards are required to be more engaged, more knowledgeable and more effective than in the past as they contend with a host of new pressures, challenges and risks. As stakeholders’ expectations from the Board continue to grow, the Board must set its strategic priorities often across diverse business segments and markets and monitor the firm’s risk profile. The Board must demonstrate that good corporate governance is not a box-ticking exercise by setting the right ethical tone from the top. The effectiveness of the Board is achieved through composition, induction, training and a rigorous evaluation process. The effectiveness of the Board derives from the diverse range of skills and competences of the Executive and Non-Executive Directors who have exceptional degrees in banking, financial and broader professional and entrepreneurial experiences. Training and Induction We recognise that being a Director is becoming increasingly more challenging, thus we ensure that Board members are provided with regular domestic and international trainings to improve their decision-making capacity, thereby contributing to the overall effectiveness of the Board. New Directors are exposed to a personalised induction programme which includes one-on-one meetings with Executive Directors and Senior Executives responsible for the Bank’s key business areas. Such sessions focus on the challenges, opportunities and risks facing the business areas. The induction programme covers an overview of the Strategic Business Units as well as Board processes and policies. A new Director is provided with an induction pack containing charters of the various Board Committees, significant reports, important statutes and policies, minutes of previous Board meetings and a calendar of Board activities. Based on the recommendation of the Governance, Nomination and Remuneration Committee, the Board approves the annual training plan and budget for Directors while the Company Secretary ensures the implementation of the plan with regular reports to the Board. During the period under review, the Directors attended the training programmes detailed below:
Access Bank Plc Consolidated financial statements For the year ended 31 December 2020
22
S/N NAME OF DIRECTOR TRAINING FACILITATOR DATE STATUS
1 Dr. (Mrs.) Ajoritsedere Awosika 2020 Risk Refresher Class For Board
Members (Online)
KPMG and other Internal Facilitators
August 19, 2020
Done
Mrs. Anthonia Ogunmefun
Mr. Paul Usoro, SAN
Mr. Adeniyi Adekoya
Mr. Iboroma Akpana
Mrs. Ifeyinwa Osime
Dr. Okey Nwuke
Mr. Herbert Wigwe
Mr. Roosevelt Ogbonna
Mr. Victor Etuokwu
Dr. Gregory Jobome
Ms. Hadiza Ambursa
Mr. Ade Bajomo
Mrs. Chizoma Okoli
2 Dr. (Mrs.) Ajoritsedere Awosika Effective Board Oversight of
Cybersecurity and Risk Management in the New
Normal (Online)
FITC August 27-28, 2020
Done
Mr. Adeniyi Adekoya
Mrs Ifeyinwa Osime
3
Dr. (Mrs.) Ajoritsedere Awosika 2020 CBN-FITC Continuous Education Programme for Directors of Banks and Other Financial Institutions-The Future of Board and Governance: Reporting, Supervising and Risk Management FITC
November 12-13, 2020 Done
Mrs. Ifeyinwa Osime
Dr. Okey Nwuke
Mr. Hassan Usman
4 Dr. (Mrs.) Ajoritsedere Awosika
Transformational Leadership
Schulich School of Business, York University
November 16-20, 2020 Done
Shareholders and Regulatory Engagement
The Board recognizes the importance of free flow of complete, adequate and timely information to shareholders to enable them make informed decisions and is committed to maintaining high standards of corporate disclosure. The implementation of our Investor Communication and Disclosure Policy helps the Board to understand shareholders views about the Bank. The Bank’s website www.accessbankplc.com is regularly updated with both financial and non-financial information. Shareholders meetings are convened and held in an open manner in line with the Bank’s Articles of Association and existing statutory and regulatory regimes, for the purpose of deliberating on issues affecting the Bank’s strategic direction. The Annual Genera l Meeting is a medium for promoting interaction between the Board, management, and shareholders. Attendance at the Annual General Meeting is open to shareholders or their proxies, while proceedings at such meetings are usually monitored by members of the press, representatives of the Nigerian Stock Exchange, the Central Bank of Nigeria and the Securities and Exchange Commission. The Board ensures that shareholders are provided with adequate notice of meetings. An Extraordinary General Meeting may also be convened at the request of the Board or shareholders holding not less than 10% of the Bank’s Paid-Up Capital. The Group has a dedicated Investors Relations Unit that facilitates communication with shareholders and analysts on a regular basis and addresses their queries and concerns. Investors and stakeholders are frequently provided with information about the Bank through various channels, including Quarterly Investors Conference Calls, the General Meeting, the Bank’s website, the Annual Report and Accounts, Non-Deal Road Shows, and Investors Forum at the Stock Exchange.
Access Bank Plc Consolidated financial statements For the year ended 31 December 2020
23
The Board ensures that communication with the investing public about the Bank and its subsidiaries is timely, factual, broadly disseminated, and accurate in accordance with all applicable legal and regulatory requirements. The Bank’s reports and communication to shareholders and other stakeholders are in plain, readable, and understandable format. The Board ensures that shareholders’ statutory and general rights are always protected, particularly their right to vote at general meetings. The Board also ensures that all shareholders are treated equally regardless of the size of their shareholding and social conditions. Our shareholders are encouraged to share in the responsibility of sustaining the Bank’s corporate values by exercising their rights as protected by law. Access to Information and Resources Management recognises the importance of ensuring the flow of complete, adequate and timely information to the Directors on an ongoing basis to enable them make informed decisions in discharge of their responsibilities. There is ongoing engagement between Executive Management and the Board, and the Heads of Strategic Business Units attend Board meetings to make presentations. The Bank’s External Auditors attend the meetings of the Group Board Audit Committee and the Group Statutory Audit Committee to make presentation on the audit of the Group’s Financial Statements. Directors have unrestricted access to Management and company information in addition to the necessary resources to carry out their responsibilities including access to external professional advice at the Bank’s expense in line with policy. Board Responsibilities The primary function of the Board is to provide effective leadership and direction to enhance the long-term value of the Group to its shareholders and other stakeholders. It has the overall responsibility for reviewing the strategic plans and performance objective, financial plans and annual budget, key operational initiatives, major funding and investment proposals, financial performance review and corporate governance practices. Term of Office The Bank’s Non-Executive Directors are appointed for an initial term of four years. Subject to the provisions of the Articles of Association on the retirement of Non-Executive Directors by rotation, they can be re-elected for a maximum of two subsequent terms of four years each, subject to satisfactory performance and shareholders’ approval. The Independent Non-Executive Directors are subject to a maximum tenure of eight years as stipulated by the Central Bank of Nigeria’s Guidelines for the Appointment of Independent Directors. Our Executive Directors are appointed for an initial term of four years and their tenure can be renewed for further terms subject to a satisfactory annual performance evaluation. Executive Directors are prohibited from holding other directorships outside the Access Bank Group or investee companies. Separation of Roles In line with best practice, the Chairman and Chief Executive Officer’s roles are assumed by different individuals; this ensures the balance of power and authority. The Board can reach impartial decisions as its Non-Executive Directors are a blend of Independent and Non-Independent Directors with no shadow or Alternate Directors, thus ensuring that their independence is brought to bear on decisions of the Board. The Role of the Board The principal responsibility of the Board is to promote the long-term success of the Group by creating and delivering sustainable shareholder value. The Board leads and provides direction for the Management by setting policy directions and strategy, and by overseeing their implementation. The Board seeks to ensure that Management delivers on both its long-term growth and short-term objectives, striking the right balance between both goals. In setting and monitoring the execution of our strategy, consideration is given to the impact that those decisions will have on the Group’s obligations to various stakeholders, such as shareholders, employees, suppliers and the community in which the Group operates. The Board is responsible for ensuring that robust systems of internal controls are maintained, and that Management maintains an effective risk management and oversight process across the Group so that growth is delivered in a controlled and sustainable way. In addition, the Board is responsible for determining and promoting the collective vision of the Group’s purpose, values, culture and behaviours. In carrying out its oversight functions, matters reserved for the Board include but are not limited to: • Defining the Bank’s business strategy and objectives.
• Formulating risk policies.
• Approval of quarterly, half yearly and full year financial statements.
• Approval of significant changes in accounting policies and practices.
• Appointment or removal of Directors and the Company Secretary.
• Approval of major acquisitions, divestments of operating companies, disposal of capital assets or capital expenditure. • Approval of charter and membership of Board Committees.
• Setting of annual Board objectives and goals.
• Approval of allotment of shares.
• Appointment and removal of Chief Audit Executive.
• Approval of the framework for determining the policy and specific remuneration of Executive Directors. • Monitoring delivery of the strategy and performance against plan.
• Reviewing and monitoring the performance of the Group Managing Director and the Executive team.

Access Bank Plc Consolidated financial statements For the year ended 31 December 2020
24
• Ensuring the maintenance of ethical standard and compliance with relevant laws.
• Performance appraisal and compensation of Board members and Senior Executives. • Ensuring effective communication with shareholders.
• Ensuring the integrity of financial reports by promoting disclosure and transparency.
• Succession planning for key positions. The Role of the Group Chairman The principal role of the Chairman is to provide leadership and direction to the Board. The Group Chairman is accountable to the Board and shareholders and liaises directly with the Board and the Management of the Company, through the Group Managing Director/Chief Executive Officer. The positions of the Group Chairman and the Group Managing Director/Chief Executive Officer are held by separate individuals. More specifically, the duties and responsibilities of the Group Chairman are as follows: • Primarily responsible for the effective operation of the Board and ensures that the Board works towards achieving the Bank’s
strategic objectives.
• Setting the agenda for Board meetings in conjunction with the Group Managing Director/Chief Executive Officer and the Company Secretary.
• Approval of the Annual Board Activities Calendar.
• Playing a leading role in ensuring that the Board and its Committees have the relevant skills, competencies for their job roles. • Ensuring that Board meetings are properly conducted and that the Board is effective and functions in a cohesive manner.
• Ensuring that the Directors receive accurate and clear information about the affairs of the Bank in a timely manner to enable them to take sound decisions.
• Acting as the main link between the Board and the Group Managing Director/Chief Executive Officer as well as advising the Group Managing Director/Chief Executive Officer on the effective discharge of his duties.
• Ensuring that all Directors focus on their key responsibilities and play constructive roles in the affairs of the Bank
• Ensuring that induction programmes are conducted for new Directors and continuing education programmes are in place for all Directors.
• Ensuring effective communication with the Bank’s institutional shareholders and strategic stakeholders.
• Taking a leading role in the assessment, improvement and development of the Board.
• Presiding over General Meetings of shareholders. The Role of Group Managing Director/Chief Executive Officer (‘GMD/CEO’) The GMD/CEO has the overall responsibility for leading the development and execution of the Bank’s long-term strategy, with a view to creating sustainable shareholder value. He manages the day-to-day operations of the Bank and ensures that operations are consistent with the policies approved by the Board. Specifically, the duties and responsibilities of the GMD/CEO include the following: • Acts as head of the Management team and is answerable to the Board. • Responsible for ensuring that a culture of integrity and legal compliance is imbibed by personnel at all levels of the Bank. • Responsible for the Bank’s consistent achievement of its financial objectives and goals. • Ensures that the Bank’s philosophy, vision, mission and values are disseminated and practised throughout the Bank. • Ensures that the allocation of capital reflects the Bank’s risk management philosophy. • Ensures that the Bank’s risks are controlled and managed effectively, optimally and in line with the Bank’s strategies and objectives. • Supervision of the Group Deputy Managing Director, Executive Directors and all subsidiaries and affiliate companies. • Serves as the Bank’s Chief Spokesman and ensures that it is properly presented to its various publics. • Ensures that the Directors are provided with enough information to support their decision making. The Role of the Group Deputy Managing Director (‘GDMD’) The GDMD provides support to the GMD/CEO towards the achievement of the corporate philosophy, business strategy, financial and other objectives of the Bank. He reports to the GMD/CEO and is responsible for the supervision of such aspects of the Bank as may be approved by the Board of Directors and exercises such powers and carry out such functions as may be delegated by the GMD/CEO. The Role of the Company Secretary Directors have separate and independent access to the Company Secretary. The Company Secretary is responsible for, among other things, ensuring that Board procedures are observed and that the Company’s Memorandum and Articles of Association, plus relevant rules and regulations, are complied with. He also assists the Chairman and the Board in implementing and strengthening corporate govern ance practices and processes, with a view to enhancing long-term shareholder value. The Company Secretary assists the Chairman in ensuring good information flow within the Board and its Committees and between Management and Non-Executive Directors.
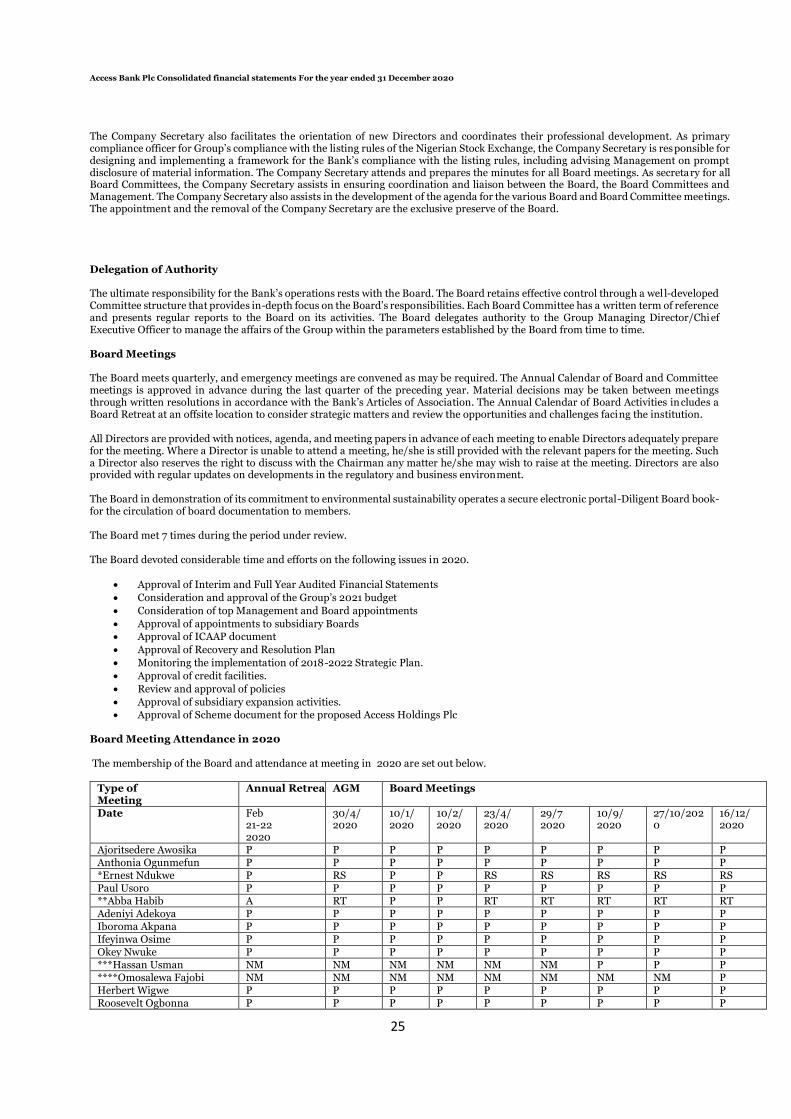
Access Bank Plc Consolidated financial statements For the year ended 31 December 2020
25
The Company Secretary also facilitates the orientation of new Directors and coordinates their professional development. As primary compliance officer for Group’s compliance with the listing rules of the Nigerian Stock Exchange, the Company Secretary is responsible for designing and implementing a framework for the Bank’s compliance with the listing rules, including advising Management on prompt disclosure of material information. The Company Secretary attends and prepares the minutes for all Board meetings. As secretary for all Board Committees, the Company Secretary assists in ensuring coordination and liaison between the Board, the Board Committees and Management. The Company Secretary also assists in the development of the agenda for the various Board and Board Committee meetings. The appointment and the removal of the Company Secretary are the exclusive preserve of the Board. Delegation of Authority The ultimate responsibility for the Bank’s operations rests with the Board. The Board retains effective control through a wel l-developed Committee structure that provides in-depth focus on the Board’s responsibilities. Each Board Committee has a written term of reference and presents regular reports to the Board on its activities. The Board delegates authority to the Group Managing Director/Chief Executive Officer to manage the affairs of the Group within the parameters established by the Board from time to time. Board Meetings The Board meets quarterly, and emergency meetings are convened as may be required. The Annual Calendar of Board and Committee meetings is approved in advance during the last quarter of the preceding year. Material decisions may be taken between meetings through written resolutions in accordance with the Bank’s Articles of Association. The Annual Calendar of Board Activities includes a Board Retreat at an offsite location to consider strategic matters and review the opportunities and challenges facing the institution. All Directors are provided with notices, agenda, and meeting papers in advance of each meeting to enable Directors adequately prepare for the meeting. Where a Director is unable to attend a meeting, he/she is still provided with the relevant papers for the meeting. Such a Director also reserves the right to discuss with the Chairman any matter he/she may wish to raise at the meeting. Directors are also provided with regular updates on developments in the regulatory and business environment. The Board in demonstration of its commitment to environmental sustainability operates a secure electronic portal-Diligent Board book- for the circulation of board documentation to members. The Board met 7 times during the period under review. The Board devoted considerable time and efforts on the following issues in 2020.
• Approval of Interim and Full Year Audited Financial Statements
• Consideration and approval of the Group’s 2021 budget
• Consideration of top Management and Board appointments
• Approval of appointments to subsidiary Boards • Approval of ICAAP document
• Approval of Recovery and Resolution Plan
• Monitoring the implementation of 2018-2022 Strategic Plan.
• Approval of credit facilities.
• Review and approval of policies
• Approval of subsidiary expansion activities. • Approval of Scheme document for the proposed Access Holdings Plc
Board Meeting Attendance in 2020 The membership of the Board and attendance at meeting in 2020 are set out below.
Type of Meeting
Annual Retreat AGM Board Meetings
Date Feb 21-22 2020
30/4/ 2020
10/1/ 2020
10/2/ 2020
23/4/ 2020
29/7 2020
10/9/ 2020
27/10/2020
16/12/ 2020
Ajoritsedere Awosika P P P P P P P P P Anthonia Ogunmefun P P P P P P P P P *Ernest Ndukwe P RS P P RS RS RS RS RS Paul Usoro P P P P P P P P P **Abba Habib A RT P P RT RT RT RT RT Adeniyi Adekoya P P P P P P P P P Iboroma Akpana P P P P P P P P P Ifeyinwa Osime P P P P P P P P P Okey Nwuke P P P P P P P P P ***Hassan Usman NM NM NM NM NM NM P P P ****Omosalewa Fajobi NM NM NM NM NM NM NM NM P Herbert Wigwe P P P P P P P P P Roosevelt Ogbonna P P P P P P P P P

Access Bank Plc Consolidated financial statements For the year ended 31 December 2020
26
Victor Etuokwu P P P P P P P P P Gregory Jobome P P P P P P P P P Hadiza Ambursa P P P P P P P P P Adeolu Bajomo P P P P P P P P P Chizoma Okoli P P P P P P P P P *****Seyi Kumapayi NM NM NM NM NM NM NM NM P
*Dr. Ernest Ndukwe resigned from the Board with effect from March 31, 2020 **Mr Abba Habib retired from the Board with effect from March 30, 2020 ***Mr. Hassan Usman was appointed as an Independent Non-Executive Director with effect from August 27, 2020 ****Mrs. Omosalewa Fajobi was appointed as a Non-Executive Director with effect from November 13, 2020 *****Mr. Seyi Kumapayi was appointed as an Executive Director with effect from November 10, 2020 Board Committees The Board exercises oversight responsibility through its standing committees, each of which has a charter that clearly defines its purpose, composition, structure, frequency of meetings, duties, tenure, and reporting lines to the Board. In line with best practice, the Chairman of the Board is not a member of any Committee. The Board has seven standing committees, namely: The Risk Management Committee, the Audit Committee, the Governance, Nomination and Remuneration Committee, the Human Resources and Sustainability Committee, Digital and Information Technology Committee, Credit and Finance Committee and Technical Committee on Retail Expansion. While the various Board committees have the authority to examine issues within their remit and report their decisions and/or recommendations to the Board, the ultimate responsibility for all matters lies with the Board. Reports of Board Committees
This section highlights the activities of the Board Committees in 2020. Board Human Resources and Sustainability Committee The membership of the Committee and attendance at the meetings in 2020 are as set out below:
Name 13/1/2020 6/4/2020 7/7/020 6/10/2020 17/10/2020
Paul Usoro P P P P P Anthonia Ogunmefun P P P P P Ernest Ndukwe P RS RS RS RS Adeniyi Adekoya NM P P P P Iboroma Akpana P P P P P Okey Nwuke P P P P P Ifeyinwa Osime P P P P P Hassan Usman NM NM NM P P Herbert Wigwe P P P P P
The Committee advises the Board on its oversight responsibilities in relation to the Bank’s human resource policies, plans, processes, and procedures as well as sustainability best practices. The key decisions of the Committee in the reporting period included recommendation of top management appointments, review and recommendation of human resources polices to the Board for approval and consideration of HR Integration report as well as quarterly reports on human resources and sustainability. The Committee met 5 times during the reporting period. Mr. Paul Usoro is the Chairman of the Committee. Board Governance, Nomination and Remuneration Committee The membership of the Committee and attendance at the meetings in 2020 are as set out below.
Name
14/01/ 2020
08/02/ 2020
17/03/ 2020
14/04/ 2020
07/10/ 2020
17/10/ 2020
Iboroma Akpana P P P P P P
Adeniyi Adekoya P P P P P P
Anthonia Ogunmefun P P P P P P
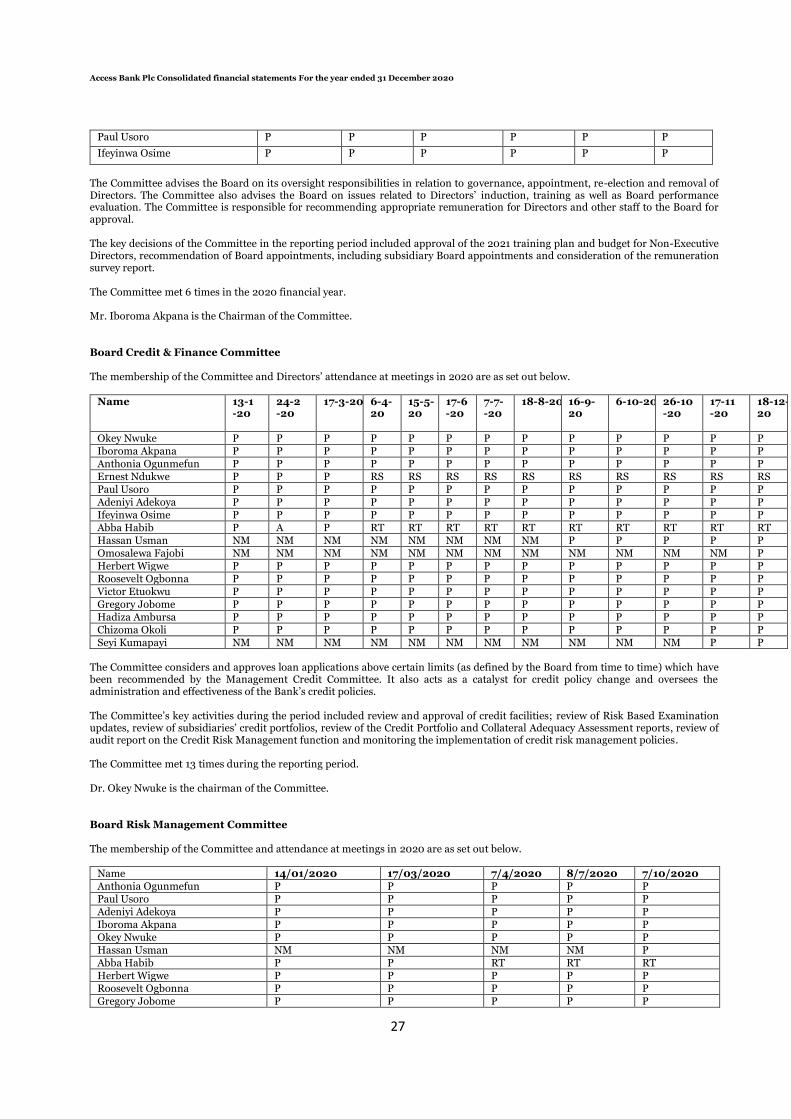
Access Bank Plc Consolidated financial statements For the year ended 31 December 2020
27
Paul Usoro P P P P P P
Ifeyinwa Osime P P P P P P
The Committee advises the Board on its oversight responsibilities in relation to governance, appointment, re-election and removal of Directors. The Committee also advises the Board on issues related to Directors’ induction, training as well as Board performance evaluation. The Committee is responsible for recommending appropriate remuneration for Directors and other staff to the Board for approval. The key decisions of the Committee in the reporting period included approval of the 2021 training plan and budget for Non-Executive Directors, recommendation of Board appointments, including subsidiary Board appointments and consideration of the remuneration survey report. The Committee met 6 times in the 2020 financial year. Mr. Iboroma Akpana is the Chairman of the Committee. Board Credit & Finance Committee The membership of the Committee and Directors’ attendance at meetings in 2020 are as set out below.
Name 13-1 -20
24-2 -20
17-3-20 6-4- 20
15-5- 20
17-6 -20
7-7- -20
18-8-20 16-9- 20
6-10-20 26-10 -20
17-11 -20
18-12- 20
Okey Nwuke P P P P P P P P P P P P P Iboroma Akpana P P P P P P P P P P P P P Anthonia Ogunmefun P P P P P P P P P P P P P Ernest Ndukwe P P P RS RS RS RS RS RS RS RS RS RS Paul Usoro P P P P P P P P P P P P P Adeniyi Adekoya P P P P P P P P P P P P P Ifeyinwa Osime P P P P P P P P P P P P P Abba Habib P A P RT RT RT RT RT RT RT RT RT RT Hassan Usman NM NM NM NM NM NM NM NM P P P P P Omosalewa Fajobi NM NM NM NM NM NM NM NM NM NM NM NM P Herbert Wigwe P P P P P P P P P P P P P Roosevelt Ogbonna P P P P P P P P P P P P P Victor Etuokwu P P P P P P P P P P P P P Gregory Jobome P P P P P P P P P P P P P Hadiza Ambursa P P P P P P P P P P P P P Chizoma Okoli P P P P P P P P P P P P P Seyi Kumapayi NM NM NM NM NM NM NM NM NM NM NM P P
The Committee considers and approves loan applications above certain limits (as defined by the Board from time to time) which have been recommended by the Management Credit Committee. It also acts as a catalyst for credit policy change and oversees the administration and effectiveness of the Bank’s credit policies. The Committee’s key activities during the period included review and approval of credit facilities; review of Risk Based Examination updates, review of subsidiaries’ credit portfolios, review of the Credit Portfolio and Collateral Adequacy Assessment reports, review of audit report on the Credit Risk Management function and monitoring the implementation of credit risk management policies. The Committee met 13 times during the reporting period. Dr. Okey Nwuke is the chairman of the Committee. Board Risk Management Committee The membership of the Committee and attendance at meetings in 2020 are as set out below.
Name 14/01/2020 17/03/2020 7/4/2020 8/7/2020 7/10/2020 Anthonia Ogunmefun P P P P P Paul Usoro P P P P P Adeniyi Adekoya P P P P P Iboroma Akpana P P P P P Okey Nwuke P P P P P Hassan Usman NM NM NM NM P Abba Habib P P RT RT RT Herbert Wigwe P P P P P Roosevelt Ogbonna P P P P P Gregory Jobome P P P P P

Access Bank Plc Consolidated financial statements For the year ended 31 December 2020
28
Adeolu Bajomo P P P P P The Committee assists the Board in fulfilling its oversight responsibility relating to the establishment of policies, standards and guidelines for non-credit risk management and compliance with legal and regulatory requirements. In addition, it oversees the establishment of a formal written policy on the overall risk management system. The Committee also ensures compliance with established policies through periodic review of management’s reports and ensures the appointment of qualified officers to manage the risk function. It evaluates the Bank’s risk policies on a periodic basis to accommodate major changes in the internal or external environment. During the period under review, the Committee considered and recommended some policies to the Board for approval, considered stress test reports on the Bank’s Balance Sheet, received risk reports from all the risk areas except credit and made relevant recommendations to the Board for approval. The Committee reviewed the Bank’s response to the COVID-19 pandemic and make appropriate recommendation to Management. The Committee met 5 times during the reporting period. Mrs. Anthonia Ogunmefun is the Chairman of the Committee. Board Audit Committee The membership of the Committee and attendance at meetings in 2020 are as set out below.
Name 15-01-2020
7-02-2020 9-04-2020 9-07-2020 28-07-2020 8-10-2020
Adeniyi Adekoya P P P P P P Paul Usoro P P P P P P Okey Nwuke P P P P P P
Ifeyinwa Osime P P P P P P Iboroma Akpana NM NM P P P P Abba Habib P P RT RT RT RT Ernest Ndukwe P P RS RS RS RS Hassan Usman NM NM NM NM NM P
The Committee supports the Board in performing its oversight responsibility relating to the integrity of the Bank’s Financial Statements and the financial reporting process, as well as the independence and performance of the Bank’s Internal and External Auditors. It oversees the Bank’s system of internal control and the mechanism for receiving complaints regarding the Bank’s accounting and operating procedures. The Bank’s Chief Audit Executive and Chief Compliance Officer have access to the Committee and make quarterly presentations to the Committee. The key issues considered by the Committee during the period included the review and recommendation of the 2019 Group Full Year Audited Financial Statements, 2020 Group Interim Audited Financial Statements as well as relevant policies to the Board for approval. The Committee also considered Whistle blowing reports as well as reports of the Group Internal Auditor and Internal Audit Consultants. The Committee met six times during the reporting period. Mr. Adeniyi Adekoya is the Chairman of the Committee. Board Digital & Information Technology Committee The membership of the Committee and attendance at meetings in 2020 are as set out below.
Name 16-01-2020 8-04-2020 10-07-2020 9-10-2020 Adeniyi Adekoya P P P P Anthonia Ogunmefun P P P P Iboroma Akpana P P P P Ifeyinwa Osime P P P P Okey Nwuke NM P P P Hassan Usman NM NM NM P Ernest Ndukwe P RS RS RS Abba Habib P RT RT RT Herbert Wigwe P P P P Roosevelt Ogbonna P P P P Victor Etuokwu NM P P P Gregory Jobome P P P P Adeolu Bajomo P P P P
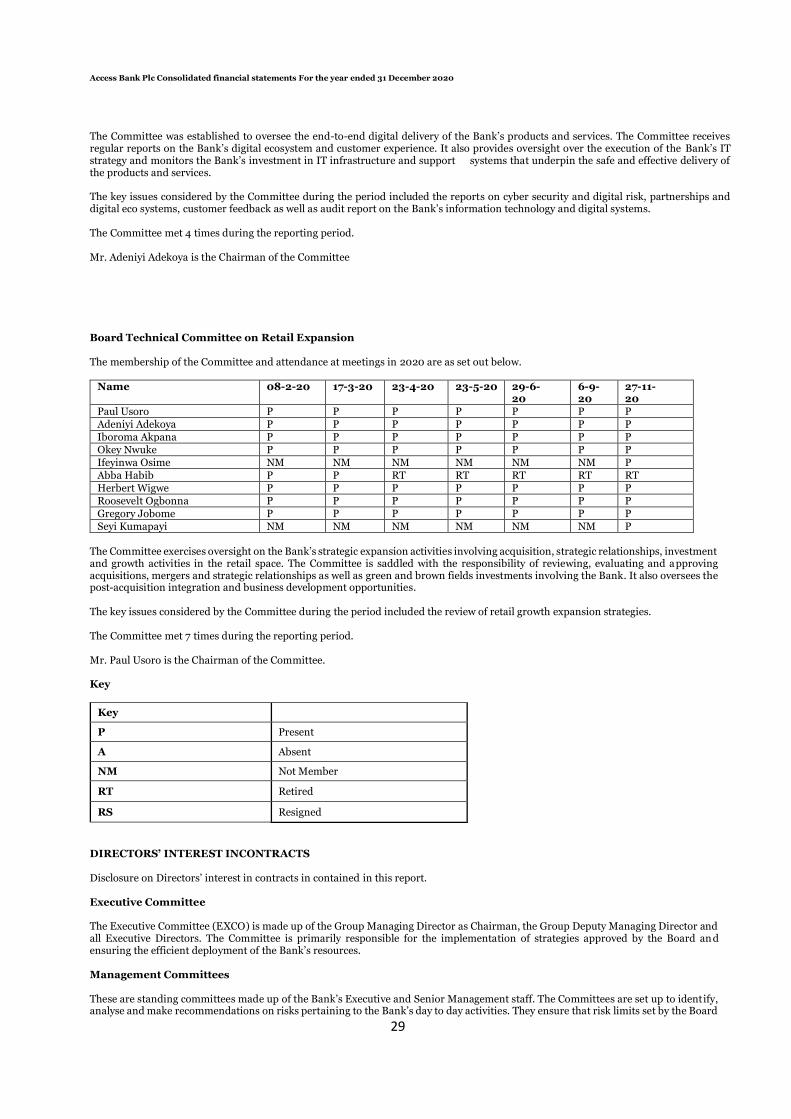
Access Bank Plc Consolidated financial statements For the year ended 31 December 2020
29
The Committee was established to oversee the end-to-end digital delivery of the Bank’s products and services. The Committee receives regular reports on the Bank’s digital ecosystem and customer experience. It also provides oversight over the execution of the Bank’s IT strategy and monitors the Bank’s investment in IT infrastructure and support systems that underpin the safe and effective delivery of the products and services. The key issues considered by the Committee during the period included the reports on cyber security and digital risk, partnerships and digital eco systems, customer feedback as well as audit report on the Bank’s information technology and digital systems. The Committee met 4 times during the reporting period. Mr. Adeniyi Adekoya is the Chairman of the Committee
Board Technical Committee on Retail Expansion The membership of the Committee and attendance at meetings in 2020 are as set out below.
Name 08-2-20 17-3-20 23-4-20 23-5-20 29-6- 20
6-9- 20
27-11- 20
Paul Usoro P P P P P P P Adeniyi Adekoya P P P P P P P Iboroma Akpana P P P P P P P Okey Nwuke P P P P P P P Ifeyinwa Osime NM NM NM NM NM NM P Abba Habib P P RT RT RT RT RT Herbert Wigwe P P P P P P P Roosevelt Ogbonna P P P P P P P Gregory Jobome P P P P P P P Seyi Kumapayi NM NM NM NM NM NM P
The Committee exercises oversight on the Bank’s strategic expansion activities involving acquisition, strategic relationships, investment and growth activities in the retail space. The Committee is saddled with the responsibility of reviewing, evaluating and approving acquisitions, mergers and strategic relationships as well as green and brown fields investments involving the Bank. It also oversees the post-acquisition integration and business development opportunities. The key issues considered by the Committee during the period included the review of retail growth expansion strategies. The Committee met 7 times during the reporting period. Mr. Paul Usoro is the Chairman of the Committee. Key
Key
P Present
A Absent
NM Not Member
RT Retired
RS Resigned
DIRECTORS’ INTEREST INCONTRACTS Disclosure on Directors’ interest in contracts in contained in this report. Executive Committee The Executive Committee (EXCO) is made up of the Group Managing Director as Chairman, the Group Deputy Managing Director and all Executive Directors. The Committee is primarily responsible for the implementation of strategies approved by the Board an d ensuring the efficient deployment of the Bank’s resources. Management Committees These are standing committees made up of the Bank’s Executive and Senior Management staff. The Committees are set up to ident ify, analyse and make recommendations on risks pertaining to the Bank’s day to day activities. They ensure that risk limits set by the Board

Access Bank Plc Consolidated financial statements For the year ended 31 December 2020
30
and the regulatory bodies are complied with and provide input to the various Board Committees in addition to ensuring the effective implementation of risk polices. These Committees meet as frequently as risk issues occur and take actions and decisions within the ambit of their powers. The Management Committees include Management Credit Committee, Asset and Liabilities Committee, Enterprise Risk Management Committee, the Operational Risk Management Committee, the Criticised Assets Committee and the IT Steering Committee. Statutory Audit Committee In compliance with Section 404 of the Companies and Allied Matters Act 2020, the Bank constituted a Standing Shareholders Audit Committee. The Committee is constituted to ensure its independence, which is fundamental to upholding stakeholders’ confidence in the reliability of the Committee’s report and the Group’s Financial Statements. There is no Executive Director sitting on the Committee. The Chairman of the Committee is an ordinary shareholder, while the shareholders’ representatives are independent and answerable to the shareholders. The duties of the Committee are as enshrined in Section 404 (3) and (4) of CAMA 2020. The Committee is responsible for ensuring that the company’s financials comply with applicable financial reporting standards. The profiles of the shareholders’ representatives in the Committee are as follows: Henry Omatsola Aragho, FCA Chairman, Statutory Audit Committee
Mr. Aragho obtained his Higher National Diploma (Accounting) from Federal Polytechnic Auchi in 1981 and a master’s degree in Business Administration from Ogun State University (1999). He qualified as a Chartered Accountant with the Institute of Chartered Accountants of Nigeria (ICAN) in 1985. He was admitted as an Associate Member of Institute of Chartered Accountants of Nigeria in March 1986 and subsequently qualified as a fellow of the Institute. He joined the Nigerian Ports Authority in 1982 and retired as General Manager Audit in 2005. He is presently the Managing Consultant of Henrose Consulting Limited and Managing Director Henrose Global Resources Limited.
He was appointed the Chairman of the Committee on July 27, 2016. Emmanuel Olutoyin Eleoramo Member, Statutory Audit Committee Mr. Eleoramo holds a First-Class degree in Insurance and a master’s degree in Business Administration (MBA), both from the University of Lagos. He is an Associate of the Chartered Insurance Institute of London and a Fellow of the Chartered Insurance Institute of Nigeria. He has over 36 years of varied experience in general insurance marketing, underwriting and employee benefits consultancy. He is a key player in the Nigerian insurance industry and a past President of the Chartered Insurance Institute of Nigeria. He was the Managing Director/Chief Executive Officer of Nigerian French Insurance Company Ltd and later Whispering Hope Insurance Company Ltd (now Sterling Assurance Nigeria Ltd) before his appointment as the Managing Director/Chief Executive Officer of Nigerian Life and Pensions Consultants Limited (now Nigerian Life and Provident Company Limited) from where he retired in 2018. Idaere Gogo-Ogan Member, Statutory Audit Committee Mr. Ogan is a 1987 graduate of Economics from the University of Port Harcourt and holds a master’s degree in International Finance from Middlesex University, London. He joined the Corporate Banking Department of Guaranty Trust Bank Plc in 1996. He left Guaranty Trust Bank to found D’ Group, incorporating Becca Petroleum Limited and Valuestream and Cordero Engineering Ltd. He is a Non-Executive Director of Coronation Merchant Bank Limited and Chairman of United Securities Limited. Record of Attendance at Statutory Audit Committee Meetings in 2020
Name 15-01-2020 07-02-2020 28/7/2020 Henry Omatsola Aragho P P P
Idaere Gogo Ogan P P P
Emmanuel O. Eleoramo P P P Adeniyi Adekoya P P P Okey Nwuke P P P Iboroma Akpana P P P
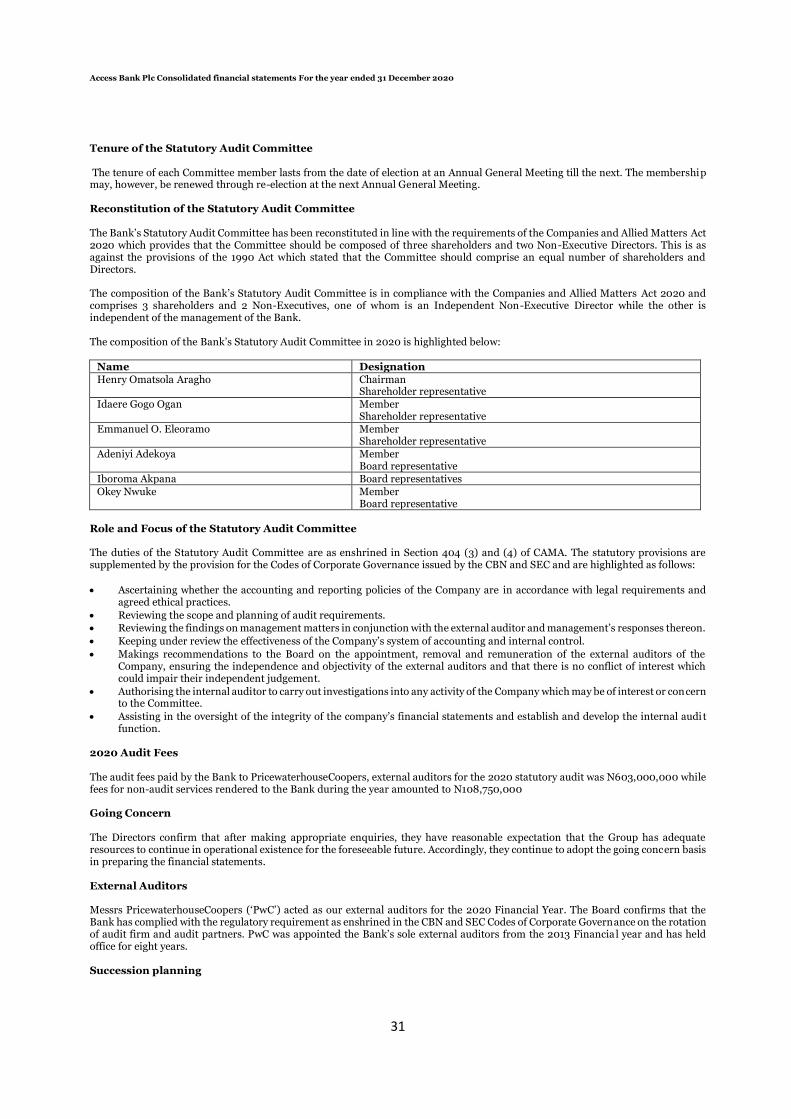
Access Bank Plc Consolidated financial statements For the year ended 31 December 2020
31
Tenure of the Statutory Audit Committee The tenure of each Committee member lasts from the date of election at an Annual General Meeting till the next. The membership may, however, be renewed through re-election at the next Annual General Meeting. Reconstitution of the Statutory Audit Committee The Bank’s Statutory Audit Committee has been reconstituted in line with the requirements of the Companies and Allied Matters Act 2020 which provides that the Committee should be composed of three shareholders and two Non-Executive Directors. This is as against the provisions of the 1990 Act which stated that the Committee should comprise an equal number of shareholders and Directors. The composition of the Bank’s Statutory Audit Committee is in compliance with the Companies and Allied Matters Act 2020 and comprises 3 shareholders and 2 Non-Executives, one of whom is an Independent Non-Executive Director while the other is independent of the management of the Bank. The composition of the Bank’s Statutory Audit Committee in 2020 is highlighted below:
Name Designation Henry Omatsola Aragho Chairman
Shareholder representative Idaere Gogo Ogan Member
Shareholder representative Emmanuel O. Eleoramo Member
Shareholder representative Adeniyi Adekoya Member
Board representative Iboroma Akpana Board representatives Okey Nwuke Member
Board representative Role and Focus of the Statutory Audit Committee The duties of the Statutory Audit Committee are as enshrined in Section 404 (3) and (4) of CAMA. The statutory provisions are supplemented by the provision for the Codes of Corporate Governance issued by the CBN and SEC and are highlighted as follows:
• Ascertaining whether the accounting and reporting policies of the Company are in accordance with legal requirements and agreed ethical practices.
• Reviewing the scope and planning of audit requirements. • Reviewing the findings on management matters in conjunction with the external auditor and management’s responses thereon.
• Keeping under review the effectiveness of the Company’s system of accounting and internal control.
• Makings recommendations to the Board on the appointment, removal and remuneration of the external auditors of the Company, ensuring the independence and objectivity of the external auditors and that there is no conflict of interest which could impair their independent judgement.
• Authorising the internal auditor to carry out investigations into any activity of the Company which may be of interest or concern to the Committee.
• Assisting in the oversight of the integrity of the company’s financial statements and establish and develop the internal audi t function.
2020 Audit Fees The audit fees paid by the Bank to PricewaterhouseCoopers, external auditors for the 2020 statutory audit was N603,000,000 while fees for non-audit services rendered to the Bank during the year amounted to N108,750,000 Going Concern The Directors confirm that after making appropriate enquiries, they have reasonable expectation that the Group has adequate resources to continue in operational existence for the foreseeable future. Accordingly, they continue to adopt the going concern basis in preparing the financial statements. External Auditors Messrs PricewaterhouseCoopers (‘PwC’) acted as our external auditors for the 2020 Financial Year. The Board confirms that the Bank has complied with the regulatory requirement as enshrined in the CBN and SEC Codes of Corporate Governance on the rotation of audit firm and audit partners. PwC was appointed the Bank’s sole external auditors from the 2013 Financia l year and has held office for eight years. Succession planning
Access Bank Plc Consolidated financial statements For the year ended 31 December 2020
32
The Board has a robust policy which is aligned to the Bank’s performance management process. The policy identifies key positions, including Country Managing Director positions for all the Group’s operating entities in respect of which there will be formal succession planning. The policy provides that potential candidates for positions shall be identified at the beginning of each financial year. Code of Ethics The Bank’s Codes of Conduct specifies expected behaviours for its employees and Directors. The Codes are designed to empower employees and Directors and enable effective decision making at all levels of the business according to defined ethical principles. New employees are required to read and sign an attestation that they understood the content. In addition, there is an annual re-affirmation exercise for all employees. There is a Compliance Manual that provides guidelines for addressing violations/breaches and ensuring enforcement of discipline amongst staff. The Bank also has a Disciplinary Guide which provides sample offences/violations and prescribes disciplinary measures to be adopted in various cases. The Head Group Human Resources is responsible for the design and implementation of the “Code of Conduct”, while the Chief Conduct and Compliance Officer is responsible for monitoring compliance. The Chief Conduct and Compliance Officer issues at the beginning of the year an Ethics and Compliance message to all employees. The message reiterates the Bank’s policy of total compliance with all applicable laws, regulations, corporate ethical standards and policies in the conduct of the Bank’s business. It enjoins staff to promote the franchise and advance its growth in a sustainable mann er while ensuring compliance with relevant policies, laws and regulations. The Directors also undertake to abide by the provisions of the Bank’s Code of Ethics for the Board. Dealing in Company Securities The Bank implements a Securities Trading Policy that prohibits Directors, members of the Audit Committee, employees and all other insiders from abusing, or placing themselves under the suspicion of abusing price sensitive information in relation to the Ba nk’s securities. In line with the policy, affected persons are prohibited from trading on the company’s security during a closed period which is usually announced by the Company Secretary. The Bank has put in place a mechanism for monitoring compliance with the policy. Remuneration Policy The Group has established a remuneration policy that seeks to attract and retain the best talent in countries that it operates. To achieve this, the Group seeks to position itself among the best performing and best employee rewarding companies in its industry in e very market that it operates. This principle will act as a general guide for the determination of compensation in each country. The objective of the policy is to ensure that salary structures, including short- and long-term incentives, motivate sustained high performance and are linked to corporate performance. It is also designed to ensure that stakeholders can make reasonable assessment of the Bank’s reward practices. The Group complies with all local tax policies in the countries of operation. Operating within the guidelines set by the principles above, compensation for country staff is based on the conditions in the local economic environment as well as the requirements of local labour laws. The Group Office usually commissions independent annual compensation surveys in the subsidiaries to obtain independent statistics the local markets pay to arrive at specific compensation structures for each country. Compensation will be determined annually at the end of the financial year. All structural changes to compensation must be approved by the Group Office. Total compensation provided to employees will typically include guaranteed and variable portions. The specific proportion of each will be defined at the country level. Guaranteed pay will include base pay and other guaranteed portions while variable pay may be both performance-based and discretionary. The Bank has put in place a performance bonus scheme which seeks to attract and retain high-performing employees. Awards to individuals are based on the job level, business unit performance and individual performance. Other determinants of the size of individual award amounts include pay levels for each skill set which may be influenced by the relative dearth of skills in an area. The Bank complies with the Pension Reform Act on the provision of retirement benefit to employees at all levels. The Bank also operates an Employee Performance Share Plan for the award of units of the Bank’s shares to its employees, subject to terms and conditions determined by the Board of Directors. The Bank’s long-term incentive programme rewards top management staff for their loyal and productive service to the Bank. This is to ensure that they share in the Bank’s success and focus on its long-term sustainability. The justification for a long-term incentive plan for top management employees is very compelling. The stability, loyalty and commitment of top management employees need to be strengthened by a long-term incentive programme. Whistle-Blowing Procedure
The Bank expects all its employees and Directors to observe the highest level of probity in their dealings with the Bank and its stakeholders. Our Whistle-Blowing Policy covers internal and external whistle-blowers and extends to the conduct of the stakeholders including employees, vendors, and customers. It provides the framework for reporting suspected breaches of the Bank’s interna l policies and laws and regulations. The Bank has retained KPMG Professional Services to provide consulting assistance in the implementation of the policy. The policy provides that suspected wrongdoing by an employee, vendor, supplier or consultant may be reported through the Bank’s or KPMG’s Ethics lines or emails, details of which are provided below.
Access Bank Plc Consolidated financial statements For the year ended 31 December 2020
33
Telephone Internal: +234-1-2712065
External: The whistle-blower is not billed for calls made within the same network. The KPMG Toll Free Lines include: MTN:
0703-000-0026 & 0703-000-0027
AIRTEL:
0708-060-1222& 0808-822-8888
9MOBILE:
0809-993-6366
GLO: 0705-889-0140
Internal: [email protected]
External: [email protected]
The Bank’s website also provides an avenue for lodging whistle-blower’s reports. Individuals interested in whistleblowing may click on the Customer Service link on the Bank’s website, scroll down to the whistle-blower column, and then register, anonymously or otherwise, any allegations they want the Bank to investigate. The Bank’s Chief Audit Executive is responsible for monitoring and reporting on whistleblowing. Quarterly reports are rendered to the Board Audit Committee. In addition to the foregoing, stakeholders may also report unethical practices to the Central Bank of Nigeria via [email protected]. Customer Complaints and Resolution The Bank complied with the provision of CBN Circular FPR/DIR/C IR/GEN/01/020 dated 16 August 2011 on handling consumer complaints. The Bank in line with the rules of the Securities and Exchange Commissions has implemented Investors Enquiries an d Complaints Management Policy. The Policy is available in the Investor portal on the Bank’s website.
Highlights of the Bank’s Clawback Policy The objective of the Clawback policy is to recover excess and undeserved rewards such as bonuses, incentives, profit sharing and other performance based compensation from current and former Executives and applicable Senior Management employees. The policy would be triggered if the Bank’s financial performance on which the reward was based is discovered to be materially false, misstated, erroneous or in instances of misdemeanour, fraud, material violation of the Bank’s policy or regulatory infractions. The Executives, Chief Financial Officer and applicable senior management employee must have served the Bank during the ‘look back period’ and incentives paid to them must have been tied to a financial parameter. The policy applies to any incentive based compensation paid during any of the three fiscal completed years immediately preceding the date the Bank is required to restate i ts financial results (look back period), meaning the earlier of:
i. The date that the Audit Committee concludes that the Bank’s previously issued financial statement contains a
material error or
ii. The date on which a court, regulator or other similarly authorized body causes the Bank to restate its financial
information to correct a material error.
Highlights of Sustainability Policies The Bank’s sustainability vision and strategy are underpinned by international principles, frameworks and standards that support the design of best-in-class local policies that enable effective mainstreaming of sustainability in the Bank for strategic growth and long-term success. The Bank’s policies and frameworks (such as Enterprise Security Risk Management [ESRM], Health, Safety, Security and Environment [HSSE], Human Rights, and employee volunteering policies), continue to facilitate the achievement of its vision. These

Access Bank Plc Consolidated financial statements For the year ended 31 December 2020
34
enable the Bank, its people and processes to address key issues such as supply chain management, human rights, environmental management, ethics, compliance and corruption, data security and privacy, diversity and equality, amongst others. The strict adherence to these policies is one of the ways to ensure Access Bank remains a responsible corporate citizen. Access Bank Plc respects the rights of all people, men, women, old, young, people living with HIV/AIDS (PLWHA). Access Bank was the first Nigerian bank to have a fully operational workplace policy on HIV/AIDS. We pioneered the HIV/ AIDS Workplace Policy Programme across all our subsidiaries. The Bank has demonstrated an unwavering commitment to sustainability, evident in its leadership role in developing the Nigerian Sustainable Banking Principles (NSBPs) in 2012 – a set of nine principles by which all banks in Nigeria are encouraged to live the sustainability ethos. The Bank has deployed several environmental protection initiatives including recycling, conservation of energy and water. A detailed report on the Bank’s sustainability activities in contained in the Annual report. Statement of Compliance We hereby confirm to the best of our knowledge the Bank has complied with the following Codes of Corporate Governance and Listing Standards 1. The Code of Corporate Governance for Public Companies in Nigeria as Issued by the Securities and Exchange Commission 2. The Code of Corporate Governance for Bank and Discount Houses in Nigeria and the Guidelines for Whistle Blowing in the
Nigerian Banking Industry 3. The Financial Reporting Council’s Nigerian Code of Corporate Governance 4. The Nigerian Stock Exchange Rules for Listing on the Premium Board 5. The Post-Listing Rules of the Nigerian Stock Exchange
Save that in the event of any conflict regarding the provisions of the respective Codes and Rules the Bank will defer to the provisions of the CBN Code as its primary regulator.
________________ _____________________ Ajoritsedere Awosika Sunday Ekwochi Chairman Company Secretary

Access Bank Plc Consolidated and separate financial statements For the year ended 31 December 2020
I.
II.
III.
-
-
-
-
-
-
Herbert Wigwe Roosevelt Ogbonna
Group Managing Director Group Deputy Managing Director
FRC/2013/ICAN/00000001998 FRC/2017/ICAN/00000016638
Statement of Directors’ Responsibilities in relation to the Consolidated and separate Financial Statements for the year ended 31 December 2020
The Companies and Allied Matters Act and the Banks and Other Financial Institutions Act, require thedirectors to prepare financial statements for each financial year that gives a true and fair view of the state offinancial affairs of the bank and Group at the end of the year and of its profit or loss. The responsibilitiesinclude ensuring that the bank and Group;
Keep proper accounting records that disclose, with reasonable accuracy, the financial position of thebank and Group and comply with the requirements of the Companies and Allied Matters Act and theBanks and Other Financial Institutions Act;
Establish adequate internal controls to safeguard its assets and to prevent and detect fraud and otherirregularities; and
Prepare financial statements using suitable accounting policies supported by reasonable and prudentjudgments and estimates that are consistently applied.
International Financial Reporting Standards
Prudential Guidelines for Licensed Banks in Nigeria;
Relevant circulars issued by the Central Bank of Nigeria;
The requirements of the Banks and Other Financial Institutions Act
The requirements of the Companies and Allied Matters Act; and
The directors accept responsibility for the annual financial statements, which have been prepared using
appropriate accounting policies supported by reasonable and prudent judgements and estimates, in
conformity with;
The Financial Reporting Council of Nigeria Act
The directors are of the opinion that the consolidated financial statements give a true and fair view of the state
of the financial affairs of the bank and Group and of the financial performance and cash-flows for the year.
The directors further accept responsibility for the maintenance of accounting records that may be relied upon
in the preparation of financial statements, as well as adequate systems of internal financial control.
Nothing has come to the directors to indicate that the bank and Group will not remain a going concern for atleast twelve months from the date of this statement.
SIGNED ON BEHALF OF THE BOARD OF DIRECTORS BY:
35

Access Bank Plc Consolidated and separate financial statements For the year ended 31 December 2020
To the members of Access Bank Plc:
FRC/2017/ICAN/00000016270
Mr. Henry Omatsola Aragho
Chairman, Audit Committee
28 January 2021
Members of the Audit Committee are:1 Mr. Henry Omatsola Aragho Shareholder Chairman 2 Mr Emmanuel Olutoyin Eleoramo Shareholder Member 3 Mr Idaere Gogo Ogan Shareholder Member 4 Mr. Adeniyi Adekoya Director Member5 Mr. Iboroma Akpana Director Member6 Dr. Okey Nwuke Director Member
In attendance:
Sunday Ekwochi – Company Secretary
We have deliberated on the findings of the external auditors who have confirmed that necessarycooperation was received from management in the course of their audit and we are satisfied withmanagement’s responses thereon and with the effectiveness of the Bank’s system of accounting and
Report of the statutory audit committee
In accordance with the provisions of Section 404(7) of the Companies and Allied Matters Act of Nigeria, themembers of the Audit Committee of Access Bank Plc hereby report on the financial statements for the yearended 31 December 2020 as follows:
We have exercised our statutory functions under section 404(7) of the Companies and Allied Matters Actof Nigeria and acknowledge the co-operation of management and staff in the conduct of theseresponsibilities.
We are of the opinion that the accounting and reporting policies of the Bank and Group are in agreementwith legal requirements and agreed ethical practices and that the scope and planning of both the externaland internal audits for the year ended 31 December 2020 were satisfactory and reinforce the Group’s
We are satisfied that the Bank has complied with the provisions of Central Bank of Nigeria CircularBSD/1/2004 dated 18 February 2004 on “Disclosure of insider related credits in the financial statementsof banks”. We hereby confirm that an aggregate amount of N242,850,328 (December 2019:N1,949,551,149) was outstanding as at 31 December 2020 which was performing as at 31 December 2020(see note 45)
36

Access Bank Plc Consolidated and separate financial statements For the year ended 31 December 2020
I.
II.
III.
IV
V
VI
VII
VIII
Oluseyi Kumapayi Herbert Wigwe
Chief Financial Officer Group Managing Director
FRC/2013/ICAN/00000000911 FRC/2013/ICAN/00000001998
We have identified in the report whether or not there were significant changes in internal controls or other factors that could significantly affect internal controls subsequent to the date of their valuation, including any corrective actions with regard to significant deficiencies and material weaknesses
29 January, 2021
Statement of Corporate Responsibity for the Consolidated and separate Financial Statements for the year ended 31 December 2020
In line with the provision of S.405 of CAMA 2020 we have reviewed the audited financial statements of the Bank for the year ended 31December, 2020 and based on our knowledge confirm as follows;
The Report does not contain any untrue statement, or material fact, or omits to state a material fact, which would make the
statement misleading under the circumstances they were made.
The financial statements and other financial information, included in the report fairly present in all material respects, the
financial condition and result of operations of Access Bank Plc as of, and for the periods presented in the report.
We are responsible for maintaining internal controls
We have designed such internal controls to ensure that material information relating to the company and its consolidated subsidiaries is made known to such officers by others within those entities particularly during the period in which the period reports are being prepared
We have evaluated the effectiveness of the company’s internal controls as of date within 90 days prior to the report
We have presented in the report our conclusions about the effectiveness of our internal controls based on our evaluation as of that date
We have disclosed to the Auditors of the company and audit committee; all significant deficiencies in the design or operation of internal controls which would adversely affect the company’s ability to record, process, summarise and report financial data and have identified for the company’s Auditors any material weakness in internal controls, and any fraud, whether or not material, that involves management or other employees who have significant roles in the company’s internal controls
37
Access Bank PLC Risk Management Framework
38
The Nigerian economy, like most nations across the world, faced turbulence in 2020 due to the novel virus, COVID-19. To
a surprise, the economy exited recession in Q4 2020, when GDP grew by 0.11% having contracted for two consecutive
quarters in Q2 and Q3 2020 with growth rates of -6.1% and -3.6%, respectively. The improvement in the Q4 GDP number
reflects the impact of significant injection of intervention funds by the Central Bank of Nigeria (CBN) into sectors worst
hit by the pandemic. The growth recovery also stemmed from the re-opening of business activities as movement
restrictions were eased and less volatile oil prices due to expectations of further production cuts by the Organisation of
Petroleum Exporting Countries (OPEC). The main sectoral drivers for growth in Q4 2020 were Agriculture,
Telecommunications, Broadcasting, Real Estate, Manufacturing and Construction. For full year 2020, the economy
contracted by -1.86% which is less than the International Monetary Fund’s (IMF) estimate of -4.3%. The real GDP growth
rate for Q1 2021 is expected to remain positive albeit very low due to lingering structural challenges. Nevertheless, fiscal
and monetary measures, commencement of AfCFTA, border reopening, higher oil prices and availability of vaccines are
expected to aid economic recovery in 2021.
Oil prices which remained volatile for much of 2020, began to creep upwards towards the end of the year due to the
optimism of the COVID-19 vaccine rollout, stimulus injection by central banks and crude oil production restrictions by
OPEC and its partners. Crude oil prices (Bonny Light) sold for $50.59 per barrel at end-2020 from $41.62 at H1 2020.
However, the devastating impact of the COVID pandemic on global economic activities and crude oil price volatility
continued to put pressure on foreign exchange stability which necessitated several exchange rate adjustments in March,
July and in August 2020 by the Central Bank of Nigeria. The official exchange rate weakened moving from N306/$ in
January 2020 to N379/$ in December 2020, indicating a naira devaluation of 23.8%. In addition, pressures from the
World Bank led to price adjustments in the exchange rate with Naira at the Exporters/Importers Window moving from
N363.75/$1 in January 2020 to N400.73/$1 in December 2020. At the start of 2020, the nation’s foreign reserves stood
at $38.5 billion but dropped to $33.4 billion due to the collapse in oil prices following the initial disagreement between
OPEC and Russia to extend crude oil production cuts. However, reserve levels ascended afterwards following the uptick in
oil prices and the disbursement of $1.3 billion by the International Monetary Fund (IMF) as emergency funding to support
the fight against COVID-19. Accretion of the foreign reserves in Q1 2021 is expected as the oil prices look northward
supported by the more widespread rollout of the COVID-19 vaccine. Other reserve drivers will include the impact of the
new diaspora remittance policy on FX inflows and inflows from approved foreign loans.
Nigeria's annual inflation rate continued to rise in 2020 reaching 15.75% in December 2020 from 12.13% in January. The
increase was attributed to supply chain disruptions from the global pandemic, food supply pressures, cost reflective rise in
electricity tariff, increase in fuel price and the passthrough effect of the currency devaluation on the general price level.
The CBN’s benchmark interest rate, the monetary policy rate (MPR), dropped from 13.5% in January 2020 to 11.5% by
December 2020. The decision to reduce the anchor lending rate stemmed from need to stimulate credit expansion to the
sectors of the economy worst hit by the pandemic and to offer impetus for output growth and economic recovery. Cash
Reserve Ratio (CRR) was increased to 27.5% from 22.5% at the start of the year. Treasury bills yields remained on low
levels throughout the year. The Federal Government’s debt grew by 8.3% from N28.6 trillion in Q1 2020 to N31 trillion in
Q2 2020. A disaggregation of the total public debt indicated that N11.4 trillion (36.77%) was external while N19.6 trillion
(63.23%) was domestic.
Given the above pandemic and macroeconomic conditions, the following actions and initiatives were deployed to ensure
robust and resilient risk outcomes:
▪ We deepened our scenario analysis and stress testing modeling activities to enhance risk identification and
mitigation steps.
▪ Our end-to-end credit automation also enabled the Bank to seamlessly embrace online and real time workflows
to support our lending processes.
▪ Adoption of automated alerts that supported proactive risk monitoring and remediation.
To limit the impact of the pandemic on the Bank’s operations, group-wide Business Continuity Plan (BCP) actions were
also taken to safeguard the workforce, our customers and vendors whilst providing key services. Some of the actions
included; strengthening of our online service platforms, implementation of Work-From-Home (WFH) and Online
Collaboration Policy, continuous health and safety awareness for staff and customers, provision of dedicated residential
facilities (safe havens) for critical service staff and enforced compliance with COVID-19 safety protocol in all our locations.
These actions helped to sustain services to our customers even at the peak of the pandemic.

Access Bank PLC Risk Management Framework
39
ENTERPRISE-WIDE RISK MANAGEMENT
WE REMAIN COMMITTED TO SUSTAINABLE ENTERPRISE-WIDE RISK MANAGEMENT PRACTICES
TO DRIVE INSTITUTIONAL GOWTH
With our promise of being more than just a bank, our Enterprise-wide Risk Management (ERM) Policy is hinged on the
establishment of a group-wide risk oversight, monitoring and reporting that fosters risk integration. This ensures that the
Bank strives for sustainable financial success while strengthening its relationship with a diverse group of stakeholders.
Helping our stakeholders achieve their ambitions lies at the heart of our processes. We apply a bespoke risk management
framework in identifying, assessing, monitoring, controlling and reporting the inherent and residual risks associated with
the pursuit of these ambitions and ensuring they are achieved the right way.
Risk strategies and policies are set by the Board of Directors of Access Bank. These policies, which define acceptable levels
of risk for day-to-day operations as well as the willingness of Access Bank to assume risk, weighed against the expected
rewards, are detailed in the Enterprise-Wide Risk Management (ERM) Policy. The ERM is a structured approach to
identifying opportunities, assessing the risk inherent in these opportunities and actively managing these risks in a cost-
effective manner. Specific policies are also in place for managing risks in the different core risk areas of credit, compliance,
market, operational, liquidity, strategic, reputational risks, Information and Cyber Security amongst others.
The Bank’s overall risk tolerance is established in the context of our earning power, capital and diversified business model.
The organisational structure and business strategy, on the other hand, are aligned with our risk management philosophy.
The Bank uses regular review of risk exposure limits and risk control and self-assessment to position itself against adverse
scenarios. This is an invaluable tool with which the Bank predicted and successfully managed both the local and global
recessions which continued to impact the macroeconomy. Market volatilities and economic uncertainties are typically
contained because the Group regularly subjects its exposures to a range of stress tests across a wide variety of products,
currencies, portfolios and customer segments.
The Risk Management Division headed by the Chief Risk Officer is part of the second line of defence and supports the
Bank’s risk policy by constantly monitoring risk, to identify and quantify significant risk exposures and acting upon such
exposures as necessary.
Access Bank approaches risk, capital and value management robustly and we believe that our initiatives and practices to-
date have positioned the Group at the leading edge of risk management.
RISK MANAGEMENT PHILOSOPHY, CULTURE, APPETITE AND OBJECTIVES
Our Risk Culture Statement:
At Access Bank, we embrace a moderate risk appetite, whilst delivering strategic objectives. We
anticipate the risks in our activities and reward behaviour that aligns with our core values, controls
and regulations. Challenges are discussed in an open environment of partnership and shared
responsibility.
Access Bank’s Risk Management philosophy and culture remain fundamental to the delivery of our strategic objectives and
are at the core of the group’s operating structure. We seek to limit adverse variations in earnings and capital by managing
risk exposures within our moderate risk appetite. Our risk management approach includes minimizing undue
concentrations of exposure, limiting potential losses from stress events and the prudent management of liquidity.
The Bank’s risk management process has continued to achieve desired results as evidenced by improved risk ratios and
independent risk ratings. In line with the bank’s core value of excellence, its Risk Management group is continuously
evolving and improving, given the context that all market developments, those of extreme nature, need to be anticipated

Access Bank PLC Risk Management Framework
40
always. Hence, the moderate risk appetite as our guide. Executive Management has remained closely involved with
important risk management initiatives, which have focused particularly on preserving appropriate levels of asset quality,
liquidity and capital as well as managing the risk portfolios.
Risk management is fundamental to the Group’s decision-making and management process. It is embedded in the role of
all employees via the organisational culture, thus enhancing the quality of strategic, capital allocation and day-to-day
business decisions.
Access Bank considers risk management philosophy and culture as the set of shared beliefs, values, attitudes and practices
that characterise how it considers risk in everything it does, from strategy development and implementation to its day-to-
day activities. In this regard, the Bank’s risk management philosophy is that a moderate and guarded risk attitude ensures
sustainable growth in shareholder value and reputation.
The Bank believes that enterprise risk management provides superior capabilities to identify and assess the full spectrum
of risks and enables staff at all levels to better understand and manage risks. This ensures that:
• Risk acceptance is done in a responsible manner;
• The Executives and the Board of the Bank have adequate risk management support;
• Uncertain outcomes are better anticipated;
• Accountability is strengthened; and
• Stewardship is enhanced.
The Bank identifies the following attributes as guiding principles for its risk culture.
a) Management and staff:
• Consider all forms of risk in decision-making;
• Create and evaluate business-unit and Bank-wide risk profiles to consider what is best for their individual
business units/department and what is best for the bank as a whole;
• Adopt a portfolio view of risk in addition to understanding individual risk elements;
• Retain ownership and accountability for risk and risk management at the business unit or other points of
influence level;
• Accept that enterprise-wide risk management is mandatory and not optional;
• Document and report all significant risks and enterprise-wide risk management deficiencies;
• Adopt a holistic and integrated approach to risk management and bring all risks together under one or a limited
number of oversight functions;
• Empower risk officers to perform their duties professionally and independently without undue interference;
• Ensure a clearly defined risk management governance structure;
• Strive to maintain a conservative balance between risk and profit considerations; and
• Continue to demonstrate appropriate standards of behaviour in the development of strategy and pursuit of
objectives.
b) Risk officers partner with other stakeholders within and outside the Bank and are guided in the exercise of their powers
by a deep sense of responsibility, professionalism and respect for other parties.
c) The Bank partners with its customers to improve their attitude to risk management and encourage them to build
corporate governance culture into their business management
d) Risk management is governed by well-defined policies, which are clearly communicated across the Bank.
e) Equal attention is paid to both quantifiable and non-quantifiable risks.
f) The Bank avoids products and businesses it does not understand.
GROUP RISK OVERSIGHT APPROACH
Managing risk is a fundamental part of banking. Access Bank manages risk as part of a long-term strategy of resilience.
Risk management is embedded in all levels of Access Bank’s organisation and is part of the daily business activities and
strategic planning to have a sustainable competitive advantage.

Access Bank PLC Risk Management Framework
41
To achieve its risk management objectives, the bank relies on a risk management framework that comprises risk policies
and procedures formulated for the assessment, measurement, monitoring and reporting of risks including limits set to
manage the exposure to quantifiable risks. The Bank recognises that effective risk management is based on a sound risk
culture, which is characterised, amongst others, by a high level of awareness concerning risk and risk management in the
organisation.
Our risk governance framework, of which risk appetite framework is a significant element, ensures the appropriate
oversight of and accountability for the effective management of risk. Our oversight starts with the strategy setting and
business planning process. These plans help us articulate our appetite for risk, which is then set as risk appetite limits for
each business unit to work within.
We actively promote a strong risk culture where employees are encouraged to take accountability for identifying and
escalating risks.
Expectations on risk culture are regularly communicated by senior management, reinforced through policies and training,
and considered in the performance assessment and compensation processes.
The Chief Risk Officer coordinates the process of monitoring and reporting risks across the Bank and subsidiaries.
Internal Audit has the responsibility of auditing the risk management and control function to ensure that all units charged
with risk management perform their roles effectively on a continuous basis. Audit also tests the adequacy of internal control
and makes appropriate recommendations where necessary.
STRATEGY AND BUSINESS PLANNING
Our risk management function is aligned with our strategy of building a sustainable gateway to the world. Consistent with
the objective of delivering long-term sustainable value for our stakeholders, we continue to pursue a prudent risk policy,
bringing balance and focus to our activities.
Underpinning that ambition is the delivery of excellent customer service through our business segments. Our business
model and strategy are built on capturing the opportunities inherent in our business by developing deep relationships with
clients in the markets and communities we serve. Each business function proactively identifies and assesses its risks and
takes ownership of the controls put in place to manage those risks.
The Bank has multiple initiatives underway to improve infrastructure for risk management, data quality, stress testing and
reporting.
Our integrated Governance, Risk and Compliance (GRC) system encapsulates the operationalization of our ERM
Framework, aids the risk management oversight of the Bank’s businesses across functions and the markets in which we
operate. The integration of key activities and synchronization of information enhances our decision-making process across
these functions. This in turn improves our business agility and competitive advantage which allows us to offer
differentiated products to our customers across all touchpoints.
We continue to focus on early identification of emerging risks so that we can manage any areas of weakness on a proactive
basis.
RISK APPETITE
Taking all relevant risks and stakeholders into consideration, Access Bank’s risk appetite, which is owned by the Board of
Directors, expresses the aggregate level of risk that we are willing to assume in the context of achieving our strategic
objectives.
Risk appetite is derived using both quantitative and qualitative criteria. Risk appetite in relation to the major risks to which
the Bank is exposed is regulated by limits and thresholds. These metrics aid in reaching our financial targets and guiding
the Bank’s profitability profile.
In accordance with the bank’s risk appetite, we are strongly committed to maintaining a moderate risk profile, which has
Access Bank PLC Risk Management Framework
42
been defined and cascaded in a measurable manner. The risk profile is managed based on an integrated risk management
framework. In this framework, all types of risks are identified to provide one integrated view on the risk profile for the
Bank as a whole.
RISK MANAGEMENT OBJECTIVES
The broad risk management objectives of the Bank are:
• To identify and manage existing and new risks in a planned and coordinated manner with minimal disruption
and cost;
• To protect against unforeseen losses and ensure stability of earnings;
• To maximize earnings potential and opportunities;
• To maximize share price and stakeholder protection;
• To enhance credit ratings, as well as depositor, analyst, investor and regulator perception; and
• To develop a risk culture that encourages all staff to identify risks and associated opportunities and to respond to
them with cost effective actions.
SCOPE OF RISKS
Within its risk management framework, Access Bank identifies the following key risk categories among others;
• Credit risk
• Operational risk
• Market and liquidity risk
• Capital Risk Management
• Legal and compliance risk
• Information and Cyber Security risk
• Environmental and Social risk
• Reputational risk
• Strategic risk
These risks and the respective framework for their management are detailed in the enterprise-wide risk management
framework.
THE BOARD AND MANAGEMENT COMMITTEES
The Board has ultimate responsibility for the Bank's risk organisation and for ensuring satisfactory internal control. It
carries out its oversight function through its standing committees. Each has a charter that clearly defines its purpose,
composition, structure, frequency of meetings, duties, tenure, and reporting lines to the Board.
In line with best practice, the Chairman of the Board does not sit on any of the Committees. The Board has six standing
committees: The Board Risk Management Committee, the Board Audit Committee, the Board Remuneration Committee,
the Board Governance and Nomination Committee, the Board Credit and Finance Committee the Board Digital and IT
Committee and the Board Technical Committee on Retail Expansion
The management committees which exist in the Bank include: The Executive Committee (EXCO), Enterprise Risk
Management Committee (ERMC), Management Credit Committee (MCC), Group Asset & Liability Committee (Group
ALCO), Digital Steering Committee (DSC), Information Security Council (ISC) and Operational Risk Management
Committee (ORMC).
Without prejudice to the roles of these committees, the full Board retains ultimate responsibility for risk management.
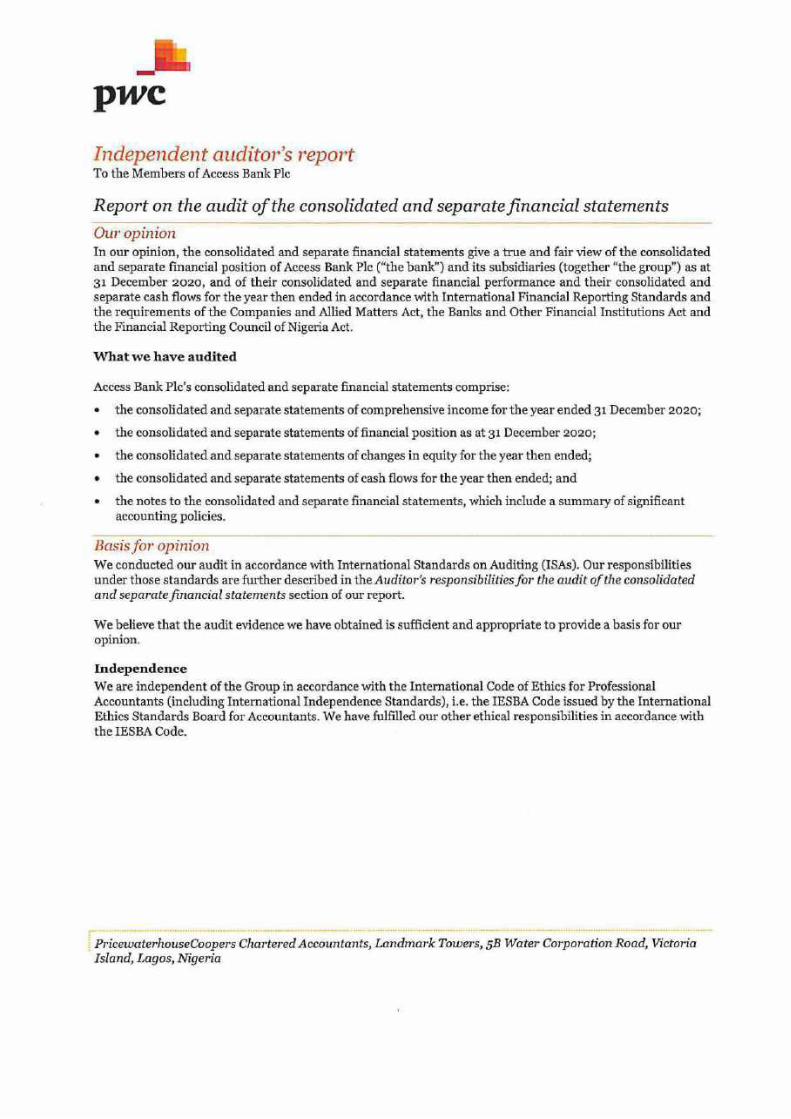
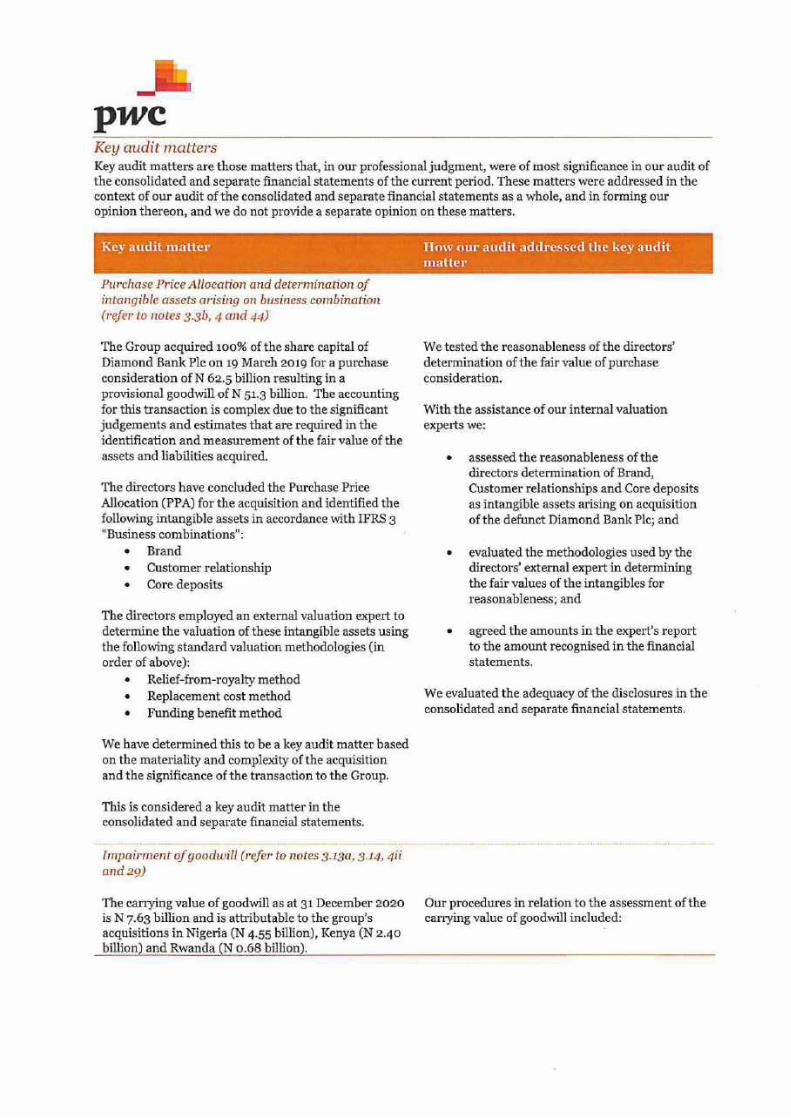


Access Bank Plc Consolidated and separate financial statements For the year ended 31 December 2020
Consolidated and separate statement of comprehensive income
*Restated *Restated
In thousands of Naira Group Group Bank Bank
Notes December 2020 December 2019 December 2020 December 2019
Interest income calculated using effective interest rate 8 425,666,037 453,550,213 342,109,524 391,459,009
Interest income on financial assets at FVTPL 8 63,550,668 83,296,576 54,568,774 80,009,759 Interest expense 8 (226,266,663) (259,617,791) (198,403,593) (238,708,396)
Net interest income 262,950,042 277,228,998 198,274,705 232,760,372
Net impairment charge 9 (62,893,120) (20,189,393) (39,650,580) (21,055,479)
Net interest income after impairment charges 200,056,922 257,039,605 158,624,125 211,704,893
Fee and commission income 10 (a) 116,700,349 91,845,402 96,679,032 75,365,239
Fee and commission expense 10 (b) (23,126,925) (17,798,050) (22,443,839) (17,115,894)
Net fee and commission income 93,573,424 74,047,352 74,235,193 58,249,345
Net gains on financial instruments at fair value 11a,b 122,689,735 66,102,273 116,168,029 64,711,601
Net foreign exchange (loss) 12 (7,568,256) (83,876,395) (16,545,920) (93,038,918)
Net (loss) on fair value hedge (Hedging ineffectiveness) 12 b (795,254) - (795,254) -
Other operating income 13 44,474,162 55,835,530 42,679,583 53,553,485
Profit on disposal of subsidiaries 48 (b) - - - 4,287,666
Personnel expenses 14 (73,173,177) (76,964,138) (54,590,721) (60,712,846)
Depreciation 28 (27,615,333) (21,232,914) (22,813,359) (17,113,619)
Amortization and impairment 29 (9,913,195) (7,927,685) (9,246,070) (7,441,118)
Other operating expenses 15 (215,806,908) (151,098,113) (197,519,728) (134,986,773)
Profit before tax 125,922,123 111,925,517 90,195,877 79,213,716
Income tax 16 (19,912,433) (17,868,920) (10,156,549) (9,097,722)
Profit for the year 106,009,690 94,056,597 80,039,328 70,115,994
Other comprehensive income (OCI) net of income tax :
Items that will not be subsequently reclassified to income statement:
Actuarial (loss)/gain on remeasurements of retirement benefit obligations (260,968) (621,039) (260,968) (621,039)
Items that may be subsequently reclassified to the income statement:
Unrealised foreign currency translation difference 4,993,614 (4,155,945) - - Changes in fair value of FVOCI financial instruments 57,683,203 6,477,225 58,444,389 7,373,186
Other comprehensive gain/(loss), net of related tax effects 62,716,852 1,809,661 58,477,698 6,815,860
Total comprehensive income for the year 168,726,542 95,866,258 138,517,026 76,931,854
Profit attributable to:
Owners of the bank 104,682,980 93,048,862 80,039,328 70,115,994
Non-controlling interest 38 1,326,710 1,007,735 - -
Profit for the year 106,009,690 94,056,597 80,039,328 70,115,994
Total comprehensive income attributable to:
Owners of the bank 169,916,650 95,207,784 138,517,026 76,931,854
Non-controlling interest 38 (1,190,108) 658,474 - -
Total comprehensive income for the year 168,726,542 95,866,258 138,517,026 76,931,854
Earnings per share attributable to ordinary shareholders
Basic (kobo) 17 301 279 225 207
Diluted (kobo) 17 295 275 225 207
The notes are an integral part of these consolidated financial statements.
* See Note 46 - Restatement of prior year financial information
63,713 Changes in allowance on FVOCI financial instruments 301,003 109,420 294,277
49
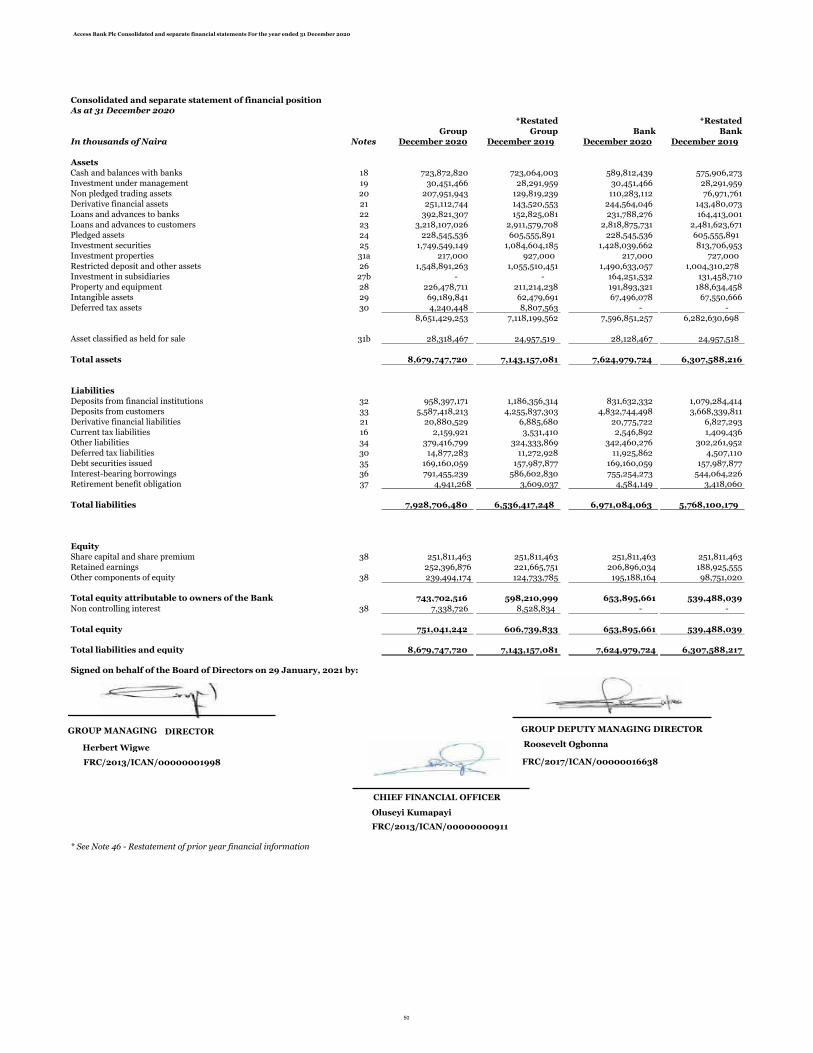
Access Bank Plc Consolidated and separate financial statements For the year ended 31 December 2020
Consolidated and separate statement of financial position
As at 31 December 2020
*Restated *Restated
Group Group Bank Bank
In thousands of Naira Notes December 2020 December 2019 December 2020 December 2019
Assets
Cash and balances with banks 18 723,872,820 723,064,003 589,812,439 575,906,273
Investment under management 19 30,451,466 28,291,959 30,451,466 28,291,959
Non pledged trading assets 20 207,951,943 129,819,239 110,283,112 76,971,761
Derivative financial assets 21 251,112,744 143,520,553 244,564,046 143,480,073
Loans and advances to banks 22 392,821,307 152,825,081 231,788,276 164,413,001
Loans and advances to customers 23 3,218,107,026 2,911,579,708 2,818,875,731 2,481,623,671
Pledged assets 24 228,545,536 605,555,891 228,545,536 605,555,891
Investment securities 25 1,749,549,149 1,084,604,185 1,428,039,662 813,706,953
Investment properties 31a 217,000 927,000 217,000 727,000
Restricted deposit and other assets 26 1,548,891,263 1,055,510,451 1,490,633,057 1,004,310,278
Investment in subsidiaries 27b - - 164,251,532 131,458,710
Property and equipment 28 226,478,711 211,214,238 191,893,321 188,634,458
Intangible assets 29 69,189,841 62,479,691 67,496,078 67,550,666
Deferred tax assets 30 4,240,448 8,807,563 - -
8,651,429,253 7,118,199,562 7,596,851,257 6,282,630,698
Asset classified as held for sale 31b 28,318,467 24,957,519 28,128,467 24,957,518
Total assets 8,679,747,720 7,143,157,081 7,624,979,724 6,307,588,216
Liabilities
Deposits from financial institutions 32 958,397,171 1,186,356,314 831,632,332 1,079,284,414
Deposits from customers 33 5,587,418,213 4,255,837,303 4,832,744,498 3,668,339,811
Derivative financial liabilities 21 20,880,529 6,885,680 20,775,722 6,827,293
Current tax liabilities 16 2,159,921 3,531,410 2,546,892 1,409,436
Other liabilities 34 379,416,799 324,333,869 342,460,276 302,261,952
Deferred tax liabilities 30 14,877,283 11,272,928 11,925,862 4,507,110
Debt securities issued 35 169,160,059 157,987,877 169,160,059 157,987,877
Interest-bearing borrowings 36 791,455,239 586,602,830 755,254,273 544,064,226
Retirement benefit obligation 37 4,941,268 3,609,037 4,584,149 3,418,060
Total liabilities 7,928,706,480 6,536,417,248 6,971,084,063 5,768,100,179
Equity
Share capital and share premium 38 251,811,463 251,811,463 251,811,463 251,811,463
Retained earnings 252,396,876 221,665,751 206,896,034 188,925,555
Other components of equity 38 239,494,174 124,733,785 195,188,164 98,751,020
Total equity attributable to owners of the Bank 743,702,516 598,210,999 653,895,661 539,488,039
Non controlling interest 38 7,338,726 8,528,834 - -
Total equity 751,041,242 606,739,833 653,895,661 539,488,039
Total liabilities and equity 8,679,747,720 7,143,157,081 7,624,979,724 6,307,588,217
Signed on behalf of the Board of Directors on 29 January, 2021 by:
* See Note 46 - Restatement of prior year financial information
Roosevelt Ogbonna
FRC/2017/ICAN/00000016638
GROUP DEPUTY MANAGING DIRECTOR
CHIEF FINANCIAL OFFICER
Oluseyi Kumapayi
FRC/2013/ICAN/00000000911
GROUP MANAGING
Herbert Wigwe
FRC/2013/ICAN/00000001998
DIRECTOR
50

Access Bank Plc Consolidated and separate financial statements For the year ended 31 December 2020
Consolidated and separate statement of changes in equity
In thousands of Naira Foreign
Group Regulatory Other Share currency Non
Share Share risk regulatory scheme Treasury Capital Fair value translation Retained Controlling Total
capital premium reserve reserves reserve Shares reserve reserve reserve earnings Total interest Equity
Balance at 1 January 2020 17,772,613 234,038,850 18,091,941 93,322,654 1,881,768 (4,795,914) 3,489,080 964,243 11,780,013 225,118,814 601,664,062 8,528,834 610,192,896
Restatement of amortization of identified intangible asset at acquisition for 2019 (See note 46) - - - - - - - - - (3,453,063) (3,453,063) - (3,453,063)
Restated Balance at 1 January, 2020 17,772,613 234,038,850 18,091,941 93,322,654 1,881,768 (4,795,914) 3,489,080 964,243 11,780,013 221,665,751 598,210,999 8,528,834 606,739,832
Total comprehensive income for the year:
Profit for the year - - - - - - - - - 104,682,980 104,682,980 1,326,710 106,009,690
Other comprehensive income, net of tax
Unrealised foreign currency translation difference - - - - - - - - 6,352,317 - 6,352,317 (1,358,703) 4,993,614
Actuarial gain on remeasurement of retirement benefit (net of tax) - - - - - - - - - (260,968) (260,968) - (260,968)
Changes in fair value of FVOCI financial instruments - - - - - - - 58,841,318 - - 58,841,318 (1,158,115) 57,683,203
Changes in allowance on FVOCI financial instruments - - - - - - - 301,003 - - 301,003 - 301,003
Total other comprehensive income/(loss) - - - - - - 59,142,321 6,352,317 (260,968) 65,233,670 (2,516,818) 62,716,852
Total comprehensive income/(loss) - - - - - - - 59,142,321 6,352,317 104,422,012 169,916,650 (1,190,108) 168,726,542
Transactions with equity holders, recorded directly in equity:
Transfers during the year - - 28,334,037 22,252,453 - - - - - (50,586,490) - -
Transfers under the scheme of merger - - - - - - - - - - - - -
Shares issued under scheme of merger - - - - - - - - - - - - -
Additional shares - - - - - - - - - - - - -
Scheme shares - - - - 818,385 (315,732) - - - - 502,653 - 502,653 Vested shares - - - - (1,823,391) - - - - - (1,823,391) - (1,823,391)
Dividend paid to equity holders - - - - - - - - - (23,104,397) (23,104,397) - (23,104,397)
Total contributions by and distributions to equity holders - - 28,334,037 22,252,453 (1,005,006) (315,732) - - - (73,690,887) (24,425,135) - (24,425,135)
Balance at 31 December 2020 17,772,613 234,038,850 46,425,978 115,575,107 876,762 (5,111,646) 3,489,080 60,106,564 18,132,330 252,396,876 743,702,514 7,338,726 751,041,240
Consolidated statement of changes in equity
In thousands of Naira Foreign
Group Regulatory Other Share currency Non
Share Share risk regulatory scheme Treasury Capital Fair value translation Retained Controlling Total
capital premium reserve reserves reserve Shares reserve reserve reserve earnings Total interest Equity
Balance at 1 January 2019 14,463,986 197,974,816 19,942,296 82,889,946 1,725,385 (3,401,302) 3,489,080 (5,622,402) 15,586,697 155,592,893 482,641,395 7,870,360 490,511,755
Total comprehensive income for the year:
Profit for the year - - - - - - - - - 93,048,862 93,048,862 1,007,735 94,056,597
Other comprehensive income, net of tax
Unrealised foreign currency translation difference - - - - - - - - (3,806,684) - (3,806,684) (349,261) (4,155,945) Actuarial gain on remeasurement of retirement benefit (net of tax) - - - - - - - - - (621,039) (621,039) - (621,039) Net changes in fair value of FVOCI financial instruments - - - - - - - 6,477,225 - - 6,477,225 - 6,477,225 Net changes in allowance on FVOCI financial instruments - - - - - - - 109,420 - - 109,420 - 109,420
Total other comprehensive income/(loss) - - - - - - - 6,586,645 (3,806,684) (621,039) 2,158,922 (349,261) 1,809,661
Total other comprehensive income/(loss) - - - - - - - 6,586,645 (3,806,684) 92,427,823 95,207,784 658,474 95,866,258
Transactions with equity holders, recorded directly in equity:
Transfers during the year - - (1,850,355) 10,432,708 - - - - (8,582,352) - - -
Transfers under the scheme of merger - - - - - - - - - - - -
Shares issued under scheme of merger 3,308,627 36,064,034 - - - - - - - - 39,372,661 - 39,372,661
Additional shares - - - - 107,000 (2,330,544) - - - - (2,223,544) - (2,223,544) Scheme shares - - - 985,315 - - - 985,315 - 985,315 Vested shares - - - - (935,932) 935,932 - - - - - - -
Dividend paid to equity holders - - - - - - - - - (17,772,613) (17,772,613) - (17,772,613)
Total contributions by and distributions to equity holders 3,308,627 36,064,034 (1,850,355) 10,432,708 156,383 (1,394,612) - - - (26,354,965) 20,361,819 - 20,361,819
Balance at 31 December 2019 17,772,613 234,038,850 18,091,941 93,322,654 1,881,768 (4,795,914) 3,489,080 964,243 11,780,013 221,665,751 598,210,998 8,528,834 586,378,013
Attributable to owners of the Bank
Attributable to owners of the Bank
51
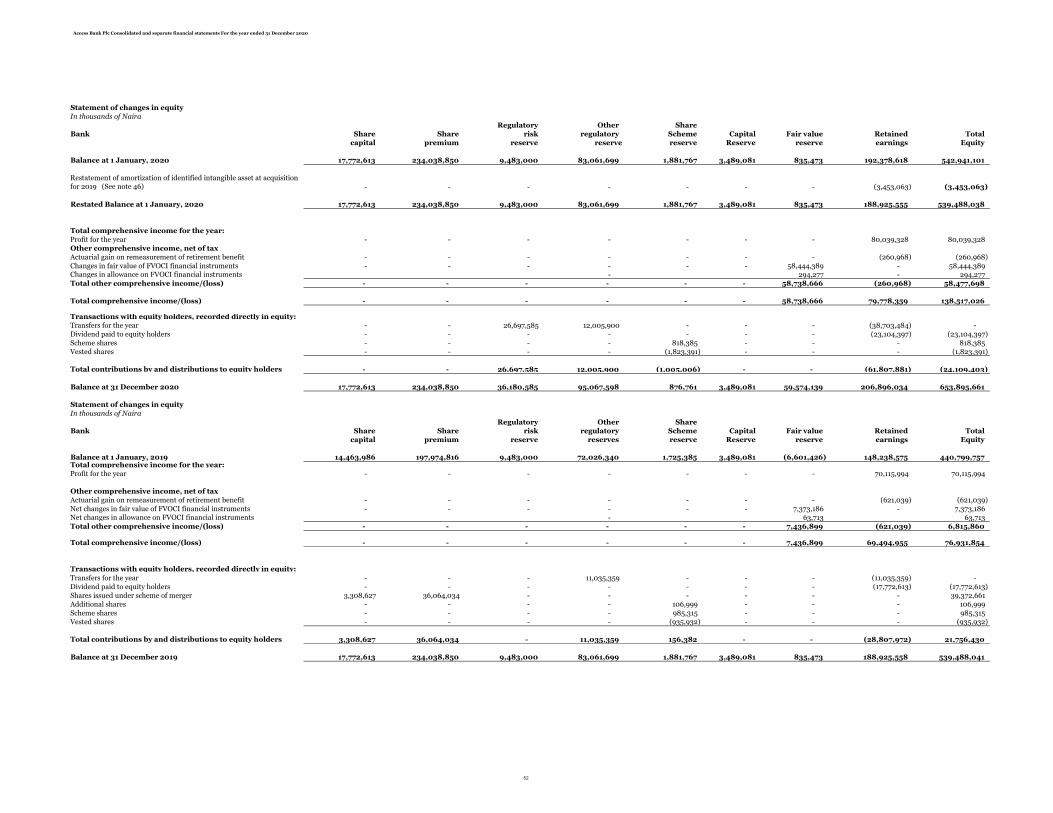
Access Bank Plc Consolidated and separate financial statements For the year ended 31 December 2020
Statement of changes in equity
In thousands of Naira
Regulatory Other Share
Bank Share Share risk regulatory Scheme Capital Fair value Retained Total
capital premium reserve reserve reserve Reserve reserve earnings Equity
Balance at 1 January, 2020 17,772,613 234,038,850 9,483,000 83,061,699 1,881,767 3,489,081 835,473 192,378,618 542,941,101
Restatement of amortization of identified intangible asset at acquisition for 2019 (See note 46) - - - - - - - (3,453,063) (3,453,063)
Restated Balance at 1 January, 2020 17,772,613 234,038,850 9,483,000 83,061,699 1,881,767 3,489,081 835,473 188,925,555 539,488,038
Total comprehensive income for the year:
Profit for the year - - - - - - - 80,039,328 80,039,328
Other comprehensive income, net of tax
Actuarial gain on remeasurement of retirement benefit - - - - - - - (260,968) (260,968)
Changes in fair value of FVOCI financial instruments - - - - - - 58,444,389 - 58,444,389 Changes in allowance on FVOCI financial instruments - 294,277 - 294,277
Total other comprehensive income/(loss) - - - - - - 58,738,666 (260,968) 58,477,698
Total comprehensive income/(loss) - - - - - - 58,738,666 79,778,359 138,517,026
Transactions with equity holders, recorded directly in equity:
Transfers for the year - - 26,697,585 12,005,900 - - - (38,703,484) -
Dividend paid to equity holders - - - - - - - (23,104,397) (23,104,397)
Scheme shares - - - - 818,385 - - - 818,385
Vested shares - - - - (1,823,391) - - - (1,823,391)
Total contributions by and distributions to equity holders - - 26,697,585 12,005,900 (1,005,006) - - (61,807,881) (24,109,403)
Balance at 31 December 2020 17,772,613 234,038,850 36,180,585 95,067,598 876,761 3,489,081 59,574,139 206,896,034 653,895,661
Statement of changes in equity
In thousands of Naira
Regulatory Other Share
Bank Share Share risk regulatory Scheme Capital Fair value Retained Total
capital premium reserve reserves reserve Reserve reserve earnings Equity
Balance at 1 January, 2019 14,463,986 197,974,816 9,483,000 72,026,340 1,725,385 3,489,081 (6,601,426) 148,238,575 440,799,757 Total comprehensive income for the year:
Profit for the year - - - - - - - 70,115,994 70,115,994
Other comprehensive income, net of tax
Actuarial gain on remeasurement of retirement benefit - - - - - - - (621,039) (621,039)
Net changes in fair value of FVOCI financial instruments - - - - - - 7,373,186 - 7,373,186 Net changes in allowance on FVOCI financial instruments - 63,713 63,713
Total other comprehensive income/(loss) - - - - - - 7,436,899 (621,039) 6,815,860
Total comprehensive income/(loss) - - - - - - 7,436,899 69,494,955 76,931,854
Transactions with equity holders, recorded directly in equity:
Transfers for the year - - - 11,035,359 - - - (11,035,359) -
Dividend paid to equity holders - - - - - - - (17,772,613) (17,772,613)
Shares issued under scheme of merger 3,308,627 36,064,034 - - - - - - 39,372,661
Additional shares - - - - 106,999 - - - 106,999
Scheme shares - - - - 985,315 - - - 985,315
Vested shares - - - - (935,932) - - - (935,932)
Total contributions by and distributions to equity holders 3,308,627 36,064,034 - 11,035,359 156,382 - - (28,807,972) 21,756,430
Balance at 31 December 2019 17,772,613 234,038,850 9,483,000 83,061,699 1,881,767 3,489,081 835,473 188,925,558 539,488,041
52

Access Bank Plc Consolidated and separate financial statements For the year ended 31 December 2020
Consolidated statement of cash flows
Restated Restated
Group Group Bank Bank
In thousands of Naira Note December 2020 December 2019 December 2020 December 2019
Cash flows from operating activities
Profit before income tax 125,922,123 111,925,517 90,195,877 79,213,716
Adjustments for:
Depreciation 28 27,615,333 21,232,914 22,813,359 17,113,619
Amortization 29 9,913,195 7,927,685 9,246,070 7,441,118
Fair value gain on investment property 13 - (25,000) - -
(Loss)/Gain on disposal of property and equipment 13 (2,780,564) (594,872) (2,018,982) (183,049)
Loss on lease modification 362,975 63,329 545,865 63,329
Write off of investments in associates - - - -
Impairment charge on discontinued operations 13 - - - -
Profit on disposal of investment securities - (2,265,686) - (2,265,686)
Impairment of FVOCI debt - - - -
Impairment on financial assets 9 62,893,120 20,164,358 39,650,582 21,055,479
Additional gratuity provision 948,453 774,562 782,312 600,060
Profit on disposal of subsidiaries - - - (4,287,666)
Restricted share performance plan expense 818,385 1,092,314 818,383 985,315
Property and equipment written off 28 116,586 167,405 46,292 103,516
Fair value loss on financial assets at FVPL (118,040,219) (11,237,409) (111,922,868) (11,237,409) Net interest income 8 (262,950,043) (278,116,647) (198,274,705) (232,760,371) Foreign Exchange Gain/Loss 12 7,568,255 19,053,227 16,545,919 17,029,703 Net gain/loss on fair value hedge (Hedging ineffectiveness) (1,321,718) - (1,321,718) - Profit/(Loss) on disposal of asset held for sale - 198,850 - 198,850
Payment to gratuity benefit holders - - Interest paid on deposits to banks and customers - -
Loss/(Profit) on disposal of of investment in subidiaries and associates - - - -
Loss on disposal of Investment property - 153,946 - 153,946
Interest received on loans and advances and non pledged trading assets - - - -
Dividend income 13 (2,319,994) (2,576,171) (2,319,994) (3,151,485)
(151,254,112) (112,061,678) (135,213,609) (109,927,014)
Changes in operating assets
Non-pledged trading assets (75,764,577) (71,289,759) (33,558,067) (20,678,371)
Fair value of derivative financial instruments - (13,082,716) - (13,387,046)
Pledged assets (56,997,669) 476,528,234 (56,997,669) 476,452,942
Restricted deposits 44,916,017 (44,514,019) 44,556,655 (5,813,506)
Loans and advances to banks and customers (665,197,053) (282,895,899) (516,719,730) (237,771,116)
Other assets (527,168,751) (62,624,567) (520,280,179) (81,739,297)
Changes in operating liabilities
Deposits from financial institutions (262,342,334) 129,334,795 (284,970,433) 409,815,330
Deposits from customers 1,309,162,928 653,011,639 1,172,865,569 570,748,593
Other liabilities 44,503,162 18,523,510 41,950,171 12,356,179 Interest paid on deposits to banks and customers (190,669,143) (226,142,999) (163,096,697) (211,969,418)
Interest received on loans and advances and non-pledged trading assets 451,103,074 331,478,781 387,197,349 313,763,495 Payment to gratuity benefit holders - (415,000) - (415,000) Lease payments (2,193,539) (1,556,558) (306,702) (1,184,674)
(81,901,996) 794,293,763 (64,573,343) 1,100,251,096
Income tax paid (12,165,887) (14,686,580) (833,942) (5,677,827)
Net cash generated from/(used in) operating activities (94,067,884) 779,607,183 (65,407,286) 1,094,573,269
Cash flows from investing activitiesAcquisition of investment securities (8,548,472,967) (6,043,119,994) (8,414,981,674) (6,014,899,148)
Interest received on investment securities 106,152,277 89,682,585 75,146,700 70,648,399
Investment under management (2,174,162) (1,362,890) (2,174,162) (1,362,890)
Dividend received 13 2,319,994 2,576,171 2,319,994 3,151,485
Acquisition of property and equipment 28 (29,211,904) (37,505,576) (21,205,368) (32,259,378)
Proceeds from the sale of property and equipment and intangible assets 9,975,539 994,122 10,824,976 661,290
Acquisition of intangible assets 29 (10,219,445) (7,792,913) (9,191,480) (7,270,576)
Proceeds from disposal of asset held for sale 2,065,000 1,746,150 2,065,000 1,746,150
Proceeds from sale of investment properties 550,000 200,000 550,000 200,000
Capital expenditure on investment property - (2,435) - (2,435)
Acquisition of asset held for sale - - - -
Proceeds from matured/disposed investment securities 957,703,955 449,279,227 903,036,382 449,279,227
Proceeds from sale of investment securities 7,060,995,041 5,212,067,179 7,015,698,837 5,212,067,179
Additional investment in subsidiaries - - (32,382,234) (17,582,261)
Proceeds from disposal of subsidiary - 10,619,124 - 12,263,926
Net cash acquired from business combinations 3,392,357 30,262,457 - 30,258,805
Proceeds from sale of equity investments - - - - - - -
Net cash generated from investing activities (446,924,314) (292,356,793) (470,293,027) (293,100,229)
Cash flows from financing activitiesInterest paid on interest bearing borrowings and debt securities issued - (44,940,125) - (43,712,811) Net proceeds from interest bearing borrowings (40,143,852) 103,231,346 (39,379,309) 85,539,189
Proceeds from interest bearing borrowings - - - -
Repayment of interest bearing borrowings 256,015,899 - 253,841,702 - Net proceeds of debt securities issued 35 (75,582,339) (216,208,000) (66,636,469) (216,208,000) Consideration paid in Shares issued on business combination - - - -
Purchase of own shares - (2,330,544) - (1,501,886)
Dividends paid to owners (2,299,483) (17,772,613) (2,233,980) (17,772,613)
Debt securities issued 35 (23,104,397) 45,000,000 (23,104,397) 45,000,000
Net cash (used in)/generated from financing activities 114,885,828 (133,019,937) 122,487,548 (148,656,120)
Net increase/(decrease) in cash and cash equivalents (426,106,370) 354,230,451 (413,212,765) 652,816,920
Cash and cash equivalents at beginning of year 40 1,226,031,018 864,564,911 1,080,005,273 424,360,569
Net increase/ (decrease) in cash and cash equivalents (426,106,370) 354,230,451 (413,212,765) 652,816,920
Effect of exchange rate fluctuations on cash held 37,921,940 7,235,657 37,685,779 2,827,789
53

Access Bank Plc Consolidated and separate financial statements For the year ended 31 December 2020
Cash and cash equivalents at end of year 40 837,846,588 1,226,031,019 704,478,286 1,080,005,278
54

Access Bank Plc Consolidated and separate financial statements For the year ended 31 December 2020
1.0 General information
2.0 Statement of compliance with International Financial Reporting Standards
3.0 Basis of preparation
3.1 Summary of significant accounting policies
(a) Functional and presentation currency
(b) Basis of measurement
•
•
•
•
•
•
•
(c) Use of estimates and judgments
3.2 Changes in accounting policy and disclosures
Amended standards adopted by the Group
• IFRS 15 Revenue from Contracts with Customers
• Classification and Measurement of Share-based Payment Transactions – Amendments to IFRS 2
• Annual Improvements 2014-2016 cycle
• Interpretation 22 Foreign Currency Transactions and Advance Consideration
(a) New standards, amendments and interpretations adopted by the Bank
share based payment at fair value or an approximation of fair value allowed by the relevant standard.
There are a number of amendments to accounting standards that become applicable for annual reporting periods commencing on or after 1 January 2020: (a) Definition of Material – amendments to IAS 1 and IAS 8; (b) Definition of a Business – amendments to IFRS 3; (c) Revised Conceptual Framework for Financial Reporting; and (d) Interest Rate Benchmark Reform – amendments to IFRS 9, IAS 39 and IFRS 7. (e) IFRS 16 covid 19 related rent concession
These amendments do not lead to a change in any of the Group's accounting policies.
These consolidated and separate financial statements have been prepared on the historical cost basis except for the following:
derivative financial instruments are measured at fair value.
non-derivative financial instruments at fair value through profit or loss are measured at fair value.
financial instruments at fair value through OCI are measured at fair value.
the liability for defined benefit obligations is recognised as the present value of the defined benefit obligation and related current service cost
non-current assets held for sale measured at lower of cost and fair value less costs to sell.
Investment properties are measured at fair value.
Access Bank Plc (“the Bank”) is a bank domiciled in Nigeria. The address of the Bank’s registered office is No 14/15, Prince Alaba Oniru Road, Oniru, Lagos(formerly Plot 999c, Danmole Street, off Adeola Odeku/Idejo Street, Victoria Island, Lagos). The consolidated and separate financial statements of the Bank for the year ended 31 December 2020 comprise the Bank and its subsidiaries (together referred to as “the Group” and separately referred to as “Group entities”). TheGroup is primarily involved in investment, corporate, commercial and retail banking. The Bank is listed on the Nigerian Stock Exchange.
These financial statements were approved and authorised for issue by the Board of Directors on 29 January 2021. The directors have the power to amend andreissue the financial statements.
The consolidated and separate financial statements of the Group and Bank respectively, have been prepared in accordance with International Financial ReportingStandards (IFRS) issued by the International Accounting Standards Board (IASB). Additional information required by national regulations are included whereappropriate.
This financial statement has been prepared in accordance with the guidelines set by International Financial Reporting Standards (IFRSs) and interpretationsissued by the IFRS Interpretations Committee (IFRIC) applicable to companies reporting under IFRS. This consolidated and separate financial statement comprisethe consolidated and separate statement of comprehensive income, the consolidated and separate statement of financial position, the consolidated and separatestatements of changes in equity, the consolidated and separate cash flow statement and the notes.
The financial statements have been prepared in accordance with the going concern principle under the historical cost convention, modified to include fair valuationof particular financial instruments: non current assets held for sale and investment properties to the extent required or permitted under IFRS as set out in therelevant accounting policies.
The principal accounting policies applied in the preparation of these consolidated and separated financial statements are set out below. These policies have beenconsistently applied to all the years presented, unless otherwise stated.
These consolidated and separate financial statements are presented in Naira, which is the Group's presentation currency; except where indicated, financialinformation presented in Naira has been rounded to the nearest thousand.
The preparation of the consolidated and separate financial statements in conformity with IFRSs requires management to make judgments, estimates andassumptions that affect the application of policies and reported amounts of assets and liabilities, income and expenses. Actual results may differ from theseestimates.
The estimates and underlying assumptions are reviewed on an ongoing basis. Revisions to accounting estimates are recognised in the year in which the estimate isrevised, if the revision affects only that year, or in the year of the revision and future years, if the revision affects both current and future years.
Information about significant areas of estimation uncertainties and critical judgments in applying accounting policies that have the most significant effect on theamounts recognised in the consolidated and separate financial statements are described in note 4.
55

Access Bank Plc Consolidated and separate financial statements For the year ended 31 December 2020
A number of new standards became applicable for the current reporting year and the Bank had to change its accounting policies and make retrospective adjustments as a result of adopting the following standards:
- Classification of Liabilities as Current or Non-current - Amendments to IAS 1 - Effective for annual periods beginning on or after 1 January 2022..- Amendments to IAS 16 Property, Plant and Equipment - Effective date for annual periods beginning on or after 1 January 2022- Reference to the Conceptual Framework – Amendments to IFRS 3 -1 Jan 2022- Amendments to IAS 37 Onerous Contracts - Costs of Fulfilling a Contract - Effective date for annual periods beginning on or after 1 January 2022
The impact of the adoption of these standards and the new accounting policies are disclosed in note (b) below. The amended standards did not have any impact on the Bank’s accounting policies and did not require retrospective adjustments.
56
Access Bank Plc Consolidated and separate financial statements For the year ended 31 December 2020
3.3 Basis of consolidation
(a) Subsidiaries
[i]
[ii]
[iii]
[i]
[ii]
[iii]
[iv] potential voting rights
(b) Business combinations
•
•
•
(c) Loss of control
the ability to use its power over the investee to affect the amount of the investor’s returns
exposure, or rights, to variable returns from its involvement with the investee; and
power over the investee;
The Group assesses existence of control where it does not have more than 50% of the voting power i.e. when it holds less than a majority of the voting rights of aninvestee. A group considers all relevant facts and circumstances in assessing whether or not it's voting rights are sufficient to give it power, including:
a contractual arrangement between the group and other vote holders
Subsidiaries are all entities (including structured entities) over which the Group exercise control.Control is achieved when the Group is exposed to, or has rights to, variable returns from its involvement with the entity and has the ability to affect those returnsthrough its power to direct the activities of the entity:
The Group reassess periodically whether it controls an investee if facts and circumstances indicate that there are changes to one or more of the three elements ofcontrol listed. The existence and effect of potential voting rights are considered when assessing whether the group controls another entity.
Upon loss of control, the Group derecognises the assets and liabilities of the subsidiary, any non-controlling interests and the other components of equity related tothe subsidiary. Any surplus or deficit arising on the loss of control is recognised in the income statement. If the Group retains any interest in the previoussubsidiary, then such interest is measured at fair value at the date that control is lost. Subsequently it is accounted for as an equity-accounted investee or inaccordance with the Group's accounting policy for financial instruments.
rights arising from other contractual arrangements
the group’s voting rights (including voting patterns at previous shareholders' meetings)
The subsidiaries are fully consolidated from the date on which control is transferred to the Group. They are de-consolidated from the date that control ceases. Thegroup has adopted the short cut approach for the sale of Diamond Bank UK acquired. Subsidiaries are measured at cost less impairment in the separate financial statement.
When this total is negative, a gain from a bargain purchase is recognised immediately in statement of comprehensive income.
The consideration transferred does not include amounts related to the settlement of pre-existing relationships. Such amounts are generally recognised in in theincome statement.
Transactions costs related to the acquisition, other than those associated with the issue of debt or equity securities, that the Group incurs in connection with abusiness combination are expensed as incurred.
Any contingent consideration payable is measured at fair value at the acquisition date. If the contingent consideration is classified as equity, then it is not re-measured and settlement is accounted for within equity. Otherwise, subsequent changes in the fair value of the contingent consideration are recognised in theincome statement.
When share-based payment awards (replacement awards) are required to be exchanged for awards held by the acquiree’s employees (acquiree’s awards) andrelate to past services, then all or a portion of the amount of the acquirer’s replacement awards is included in measuring the consideration transferred in thebusiness combination. This determination is based on the market-based value of the replacement awards compared with the market-based value of the acquiree’sawards and the extent to which the replacement awards relate to past and/or future service.
The Group elects on a transaction-by-transaction basis whether to measure non-controlling interest at its fair value, or at its proportionate share of the recognisedamount of the identifiable net assets, at the acquisition date.
The Group applies IFRS 3 Business Combinations (revised) in accounting for business combinations.
Business combinations are accounted for using the acquisition method as at the acquisition date, which is the date on which control is transferred to the Group.Control is the power to govern the financial and operating policies of an entity so as to obtain benefits from its activities. In assessing control, the Group takes intoconsideration potential voting rights.
The Group measures goodwill at the acquisition date as the total of:
the fair value of the consideration transferred; plus
the recognized amount of any non-controlling interests in the acquiree; plus if the business combination is achieved in stages, the fair value of the pre-
the net recognised amount (generally fair value) of the identifiable assets acquired and liabilities assumed.
57
Access Bank Plc Consolidated and separate financial statements For the year ended 31 December 2020
(d) Disposal of subsidiaries
(e) Changes in ownership interests in subsidiaries without change of control
(f) Transactions eliminated on consolidation
3.4 Segment reporting
3.5 Foreign currency translation
(a) Functional and presentation currency
(b) Transactions and balances
(c) Group companies
[i]
[ii]
[iii]
3.6 Operating income
The Group in the normal course of business sets up Structured Entries (SEs) for the sole purpose of raising finance in foreign jurisdictions. The SEs raises financein the currency of their jurisdictions and passes the proceeds to the group entity that set them up. All costs and interest on the borrowing are borne by thesponsoring group entity. These SEs are deemed to be extensions of the sponsoring entity, and hence, their functional currency is the same as that of the sponsoringentity.
Foreign currency transactions are translated into the functional currency using the exchange rates prevailing at the dates of the transactions or valuation whereitems are re-measured. Foreign exchange gains and losses resulting from the settlement of such transactions and from the translation at year-end exchange ratesof monetary assets and liabilities denominated in foreign currencies are recognised in the income statement. Changes in the fair value of monetary securitiesdenominated in foreign currency classified as Fair value through other comprehensive income are analysed between translation differences resulting from changesin the amortised cost of the security and other changes in the carrying amount of the security. Translation differences related to changes in amortised cost arerecognised in the income statement, and other changes in carrying amount are recognised in other comprehensive income.
When the Group ceases to have control, any retained interest in the entity is remeasured to its fair value at the date when control is lost, with the change in carryingamount recognised in income statement. The fair value is the initial carrying amount for the purposes of subsequently accounting for the retained interest as anassociate, joint venture or financial asset. In addition, any amounts previously recognised in other comprehensive income in respect of that entity are accounted foras if the group had directly disposed of the related assets or liabilities. This may mean that amounts previously recognised in other comprehensive income arereclassified to the income statement.The gain/loss arising from disposal of subsidiaries is included in the profit/loss of discontinued operations in the statement of comprehensive income, if thedisposal subsidiary meets the criteria specified in IFRS 5. Foreign currency translation differences become realised when the related subsidiary is disposed.
Transactions with non-controlling interests that do not result in loss of control are accounted for as equity transactions – that is, as transactions with the owners intheir capacity as owners. The difference between fair value of any consideration paid and the relevant share acquired of the carrying value of net assets of thesubsidiary is recorded in equity. Gains or losses on disposals to non-controlling interests are also recorded in equity.
Inter-company transactions, balances, income and expenses on transactions between group companies are eliminated. Profits and losses resulting fromintercompany transactions that are recognised in assets are also eliminated. Accounting policies of subsidiaries have been changed where necessary to ensureconsistency with the policies adopted by the group.
An operating segment is a component of the Group that engages in business activities from which it can earn revenues and incur expenses, including revenues andexpenses that relate to transactions with any of the Group’s other components, whose operating results are reviewed regularly by the Executive Committee (beingthe chief operating decision maker) to make decisions about resources allocated to each segment and assess its performance, and for which discrete financialinformation is available.
Items included in the financial statements of each of the group’s entities are measured using the currency of the primary economic environment in which the entityoperates (‘the functional currency’). The consolidated financial statements are presented in Naira’, which is the group’s presentation currency.
all resulting exchange differences are recognised in other comprehensive income.Goodwill and fair value adjustments arising on the acquisition of a foreign entity are treated as assets and liabilities of the foreign entity and translated at theclosing rate. Exchange differences arising are recognised in other comprehensive income.
The Group is an agent where its performance obligation is to arrange for another party to provide the goods and services. The Group is the agent in its arrangementwith mobile network providers, card vendors and insurance companies.
Where the group is acting as an agent, it recognises as revenue only the commission retained by the group (in other words, revenue is recognised net of theamounts paid to the principal). Where the group is the principal, it will recognise as revenue the gross amount paid and allocated to the performance obligation. Itwill also recognise an expense for the direct costs of satisfying the performance obligation.
It is the Group’s policy to recognise revenue from a contract when it has been approved by both parties, rights have been clearly identified, payment terms havebeen defined, the contract has commercial substance, and collectability has been ascertained as probable. Revenue is recognised when control of goods or services have been transferred. Control of an asset refers to the ability to direct the use of and obtain substantiallyall of the remaining benefits (potential cash inflows or savings in cash outflows) associated with the asset.
Principal versus Agency considerationsThe Group is the principal in an arrangement where it obtains control of the goods or services of another party in advance of transferring control of those goods orservices to a customer. The Group is the principal in its card arrangements.
Translation differences on non-monetary financial assets and liabilities such as equities held at fair value through profit or loss are recognised in the incomestatement as part of the fair value gain or loss. Translation differences on non-monetary financial assets, such as equities classified as fair value through othercomprehensive income, are included in other comprehensive income.
The results and financial position of all the group entities (none of which has the currency of a hyper-inflationary economy) that have a functional currencydifferent from the presentation currency are translated into the presentation currency as follows:
assets and liabilities for each balance sheet presented are translated at the closing rate at the date of that balance sheet;
income and expenses for each income statement are translated at average exchange rates (unless this average is not a reasonable approximation of thecumulative effect of the rates prevailing on the transaction dates, in which case income and expenses are translated at the rate on the dates of thetransactions); and
58
Access Bank Plc Consolidated and separate financial statements For the year ended 31 December 2020
(a) Interest income and expense
•
•
(b) Fees and commission income and expense
•
•
•
•
(c) Net loss/gains on investment securities
•
•
•
(d) Foreign exchange income
(e) Other operating income
3.7 Income tax
(a) Current tax
The Group calculates interest income by applying the EIR to the gross carrying amount of financial assets other than credit-impaired assetsWhen a financial asset becomes credit-impaired and is, therefore, regarded as ‘Stage 3’, the Group calculates interest income by applying the effective interest rateto the net amortised cost of the financial asset. If the financial assets cures and is no longer credit-impaired, the Group reverts to calculating interest income on agross basis.
Interest income on fair value through profit or loss instruments is recognised using the contractual interest rate in net gains/(loss) on investment securities.
Other fees and commission income, includes commission on letters of credit, account servicing fees, investment management and other fiduciary activityfees, sales commission, placement fees and syndication fees. These fees and commissions are recognised as the related services are performed
Net loss/gains on investment securities comprise of the following:
Fees and commissions expenses are fees charged for the provision of services to customers transacting on alternate channels platform of the Bank and on thevarious debit and credit cards issued for the purpose of these payments. They are charged to the Bank on services rendered on internet banking, mobilebanking and online purchasing platforms. The corresponding income lines for these expenses include the income on cards (both foreign and local cards),online purchases and bill payments included in fees and commissions.
Interest income and expense for all interest-bearing financial instruments are recognised within "interest income" and "interest expense" in the consolidatedincome statement using the effective interest method.
The effective interest method is a method of calculating the amortised cost of a financial asset or a financial liability and of allocating the interest income or interestexpense over the relevant year. The effective interest rate is the rate that exactly discounts the estimated future cash payments and receipts through the expectedlife of the financial asset or liability (or, where appropriate, a shorter year) to the net carrying amount of the financial asset or liability. When calculating theeffective interest rate, the Group estimates future cash flows considering all contractual terms of the financial instruments but not future credit losses.
The calculation of the effective interest rate includes contractual fees paid or received, transaction costs, and discounts or premiums that are an integral part of theeffective interest rate. Transaction costs are incremental costs that are directly attributable to the acquisition, issue or disposal of a financial asset or liability.
Interest income and expense presented in the statement of comprehensive income include:
interest on financial assets and financial liabilities measured at amortised cost calculated on an effective interest rate basis.
interest on fair value through other comprehensive income investment securities calculated on an effective interest basis.
Card maintenance fees: The Bank charges these fees to customers for maintaining their cards. The fees are earned and recognised by the Bank over thevalidity period of the card. The Bank charges the customers for this service on a monthly basis.
Fees and commission income and expenses that are integral to the effective interest rate on a financial asset or liability are included in the measurement of theeffective interest rate.
When a loan commitment is not expected to result in the draw-down of a loan, loan commitment fees are recognised on a straight-line basis over the commitmentyear.
Credit related fees: This includes advisory, penal and commitment fees. These are fees charged for administration and advisory services to the customer up tothe customer's acceptance of the offer letter. The advisory and commitment fees are earned at the point in time where the customer accepts the offer letterwhich is when the Bank recognises its income. These fees are not integral to the loan, therefore, they are not considered in determining the effective interestrate. The penal fee on default also forms part of the items warehoused in this line
The current income tax charge is calculated on the basis of the tax laws enacted or substantively enacted at the balance sheet date in the countries where the bankand its subsidiaries operate and generate taxable income. Management periodically evaluates positions taken in tax returns with respect to situations in whichapplicable tax regulation is subject to interpretation. It establishes provisions where appropriate on the basis of amounts expected to be paid to the tax authorities.
The current income tax charge is calculated on the basis of the tax laws enacted or substantively enacted at the end of the reporting period in the countries wherethe company and its subsidiaries and associates operate and generate taxable income. Management periodically evaluates positions taken in tax returns withrespect to situations in which applicable tax regulation is subject to interpretation and considers whether it is probable that a taxation authority will accept anuncertain tax treatment. The group measures its tax balances either based on the most likely amount or the expected value, depending on which method provides abetter prediction of the resolution of the uncertainty
Other operating income includes items such as dividends, gains on disposal of properties, rental income, income from asset management, brokerage and agency aswell as income from other investments.Dividend on Fair value through other comprehensive income equity securities: This is recognised when the right to receive payment is established. Dividends arereflected as a component of other operating income.
Foreign exchange income includes foreign exchange gains on revaluation and unrealised foreign exchange gains on revaluation.
Net gains on financial instruments at fair value through profit or loss: This relates to gains on disposal and changes in fair value of financial instruments
Account maintenance fees: These are fees charged to current accounts. N1 on every N1,000 in respect of all customer induced debit transactions is chargedon these accounts. These fees are earned by the Bank at the time of each transaction and the Bank recognises its income accordingly.
Fee and commission presented in the income statement includes:
Net gains/losses on financial instruments classified as held for trading: This includes the gains and losses arising both on sale of trading instruments andfrom changes in fair value of derivatives instruments.
Net gains on financial instruments held as Fair value through other comprehensive income: This relates to gains arising from the disposal of financialinstruments held as Fair value through other comprehensive income as well as fair value changes reclassified from other comprehensive income upondisposal.
Minimum lease payments made under finance leases are apportioned between the finance expense and the reduction of the outstanding liability. The finance
The tax expense for the year comprises current and deferred tax. Tax is recognised in the income statement, except to the extent that it relates to items recognisedin other comprehensive income or directly in equity. In this case, the tax is also recognised in other comprehensive income or directly in equity, respectively.
59

Access Bank Plc Consolidated and separate financial statements For the year ended 31 December 2020
The current income tax charge is calculated on the basis of the tax laws enacted or substantively enacted at the balance sheet date in the countries where the bankand its subsidiaries operate and generate taxable income. Management periodically evaluates positions taken in tax returns with respect to situations in whichapplicable tax regulation is subject to interpretation. It establishes provisions where appropriate on the basis of amounts expected to be paid to the tax authorities.
The current income tax charge is calculated on the basis of the tax laws enacted or substantively enacted at the end of the reporting period in the countries wherethe company and its subsidiaries and associates operate and generate taxable income. Management periodically evaluates positions taken in tax returns withrespect to situations in which applicable tax regulation is subject to interpretation and considers whether it is probable that a taxation authority will accept anuncertain tax treatment. The group measures its tax balances either based on the most likely amount or the expected value, depending on which method provides abetter prediction of the resolution of the uncertainty
60

Access Bank Plc Consolidated and separate financial statements For the year ended 31 December 2020
(b) Minimum Tax
(c) Deferred tax
3.8 Financial assets and liabilities
Recognition and derecognition
(a)
i Classification
Measurement
ii Debt instruments
iii Equity instruments
● Amortised cost: Assets that are held for collection of contractual cash flows where those cash flows represent solely payments of principal and interest aremeasured at amortised cost. Interest income from these financial assets is included in interest income using the effective interest rate method. Any gain or lossarising on derecognition is recognised directly in profit or loss and presented in net gains/(loss) on investment securities together with foreign exchange gains andlosses. Impairment losses are presented as separate line item in the statement of profit or loss.
● FVOCI: Assets that are held for collection of contractual cash flows and for selling the financial assets, where the assets’ cash flows represent solely payments ofprincipal and interest, are measured at FVOCI. Movements in the carrying amount are taken through OCI, except for the recognition of impairment gains or losses,interest income and foreign exchange gains and losses which are recognised in profit or loss. When the financial asset is derecognised, the cumulative gain or losspreviously recognised in OCI is reclassified from equity to profit or loss and recognised in other operating income. Interest income from these financial assets isincluded in interest income using the effective interest rate method. Foreign exchange gains and losses are presented in net gains/(loss) on investment securitiesand impairment expenses are presented as separate line item in net impairment charge on financial assets
● FVPL: Assets that do not meet the criteria for amortised cost or FVOCI are measured at FVPL. A gain or loss on a debt investment that is subsequently measuredat FVPL is recognised in profit or loss and presented net within net gains/(loss) on investment securities in the period in which it arises.
The group initially measured all equity investments at fair value through profit or loss. Where the group’s management has elected to present fair value gains andlosses on equity investments in OCI, there is no subsequent reclassification of fair value gains and losses to profit or loss following the derecognition of theinvestment. Dividends from such investments continue to be recognised in profit or loss as other income when the group’s right to receive payments is established.Changes in the fair value of financial assets at FVPL are recognised in net gains/(loss) on investment securities in the statement of profit or loss as applicable.
The Group only measures cash and balances with banks, Loans and advances to banks and customers and other financial investments at amortised cost if both ofthe following conditions are met:• The financial asset is held within a business model with the objective to hold financial assets in order to collect contractual cash flows• The contractual terms of the financial asset give rise on specified dates to cash flows that are solely payments of principal and interest (SPPI) on the principalamount outstanding.The details of these conditions are outlined below.
Deferred income tax is recognised, using the liability method, on temporary differences arising between the tax bases of assets and liabilities and their carryingamounts in the consolidated financial statements. However, deferred tax liabilities are not recognised if they arise from the initial recognition of goodwill; deferredincome tax is not accounted for if it arises from initial recognition of an asset or liability in a transaction other than a business combination that at the time of thetransaction affects neither accounting nor taxable profit or loss. Deferred income tax is determined using tax rates (and laws) that have been enacted orsubstantively enacted by the balance sheet date and are expected to apply when the related deferred income tax asset is realised or the deferred income tax liabilityis settled.
Subsequent measurement of debt instruments depends on the group’s business model for managing the asset and the contractual cash flow characteristics of theasset. There are three measurement categories into which the group classifies its debt instruments:
Deferred income tax assets and liabilities are offset when there is a legally enforceable right to offset current tax assets against current tax liabilities and when thedeferred income taxes assets and liabilities relate to income taxes levied by the same taxation authority on either the same taxable entity or different taxableentities where there is an intention to settle the balances on a net basis.
Financial assets and liabilities are initially recognised on the settlement date, i.e., the date that the Bank becomes a party to the contractual provisions of theinstrument.
Regular way purchases and sales of financial assets are recognised on trade-date, the date on which the group commits to purchase or sell the asset. Financialassets are derecognised when the rights to receive cash flows from the financial assets have expired or have been transferred and the group has transferredsubstantially all the risks and rewards of ownership.
The group classifies its financial assets in the following measurement categories:● those to be measured subsequently at fair value (either through OCI or through profit or loss), and● those to be measured subsequently at amortised cost.The classification depends on the entity’s business model for managing the financial assets and the contractual terms of the cash flows.For assets measured at fair value, gains and losses will either be recorded in profit or loss or OCI. For investments in equity instruments that are not held fortrading, this will depend on whether the group has made an irrevocable election at the time of initial recognition to account for the equity investment at fair valuethrough other comprehensive income (FVOCI). The group reclassifies debt investments when and only when its business model for managing those assets changes.
At initial recognition, the group measures a financial asset at its fair value plus, in the case of a financial asset not at fair value through profit or loss (FVPL),transaction costs that are directly attributable to the acquisition of the financial asset. Transaction costs of financial assets carried at FVPL are expensed in profit orloss.Financial assets with embedded derivatives are considered in their entirety when determining whether their cash flows are solely payment of principal andinterest.
Deferred income tax assets are recognised only to the extent that it is probable that future taxable profit will be available against which the temporary differencescan be utilised. Deferred income tax is provided on temporary differences arising on investments in subsidiaries and associates, except for deferred income taxliability where the timing of the reversal of the temporary difference is controlled by the Group and it is probable that the temporary difference will not reverse inthe foreseeable future.
Based on the provisions of The Finance Act, minimum tax will be applicable at 0.5% of gross turnover less franked investment income.
Financial assets
61

Access Bank Plc Consolidated and separate financial statements For the year ended 31 December 2020
The Group only measures cash and balances with banks, Loans and advances to banks and customers and other financial investments at amortised cost if both ofthe following conditions are met:• The financial asset is held within a business model with the objective to hold financial assets in order to collect contractual cash flows• The contractual terms of the financial asset give rise on specified dates to cash flows that are solely payments of principal and interest (SPPI) on the principalamount outstanding.The details of these conditions are outlined below.
62

Access Bank Plc Consolidated and separate financial statements For the year ended 31 December 2020
iv Business model assessment
v The SPPI test
(b) Financial Liabilities
(c)
[i] Fair value through profit or loss
•
•
•
The Group determines its business model at the level that best reflects how it manages groups of financial assets to achieve its business objective.The Group's business model is not assessed on an instrument-by-instrument basis, but at a higher level of aggregated portfolios and is based on observable factorssuch as:• How the performance of the business model and the financial assets held within that business model are evaluated and reported to the entity's key managementpersonnel.• The risks that affect the performance of the business model (and the financial assets held within that business model) and, in particular, the way those risks aremanaged.• How managers of the business are compensated (for example, whether the compensation is based on the fair value of the assets managed or on the contractualcash flows collected).• The expected frequency, value and timing of sales are also important aspects of the Group’s assessment.
The business model assessment is based on reasonably expected scenarios without taking 'worst case' or 'stress case’ scenarios into account. If cash flows afterinitial recognition are realised in a way that is different from the Group's original expectations, the Group does not change the classification of the remainingfinancial assets held in that business model, but incorporates such information when assessing newly originated or newly purchased financial assets going forward.
The asset or liability contains an embedded derivative that significantly modifies the cash flows that would otherwise be required under the contract.
As a second step of its classification process, the Group assesses the contractual terms of financial instruments to identify whether they meet the SPPI test.
‘Principal’ for the purpose of this test is defined as the fair value of the financial asset at initial recognition and may change over the life of the financial asset (forexample, if there are repayments of principal or amortisation of the premium/discount).The most significant elements of interest within a lending arrangement are typically the consideration for the time value of money and credit risk. To make theSPPI assessment, the Group applies judgement and considers relevant factors such as the currency in which the financial asset is denominated, and the year forwhich the interest rate is set.In contrast, contractual terms that introduce a more than de minimis exposure to risks or volatility in the contractual cash flows that are unrelated to a basiclending arrangement do not give rise to contractual cash flows that are solely payments of principal and interest on the amount outstanding. In such cases, thefinancial asset is required to be measured at FVPL.
Financial liabilities that are not classified at fair value through profit or loss are measured at amortised cost using the effective interest method. Amortised cost iscalculated by taking into account any discount or premium on issue funds, and costs that are an integral part of the EIR. A compound financial instrument whichcontains both a liability and an equity component is separated at the issue date. Interest expense is included in 'Interest expense' in the Statement ofcomprehensive income.
Financial liabilities that are classified at fair value through profit or loss is applied to derivatives, financial liabilities held for trading and other financial liabilitiesdesignated as such at initial recognition. Gains and losses attributable to changes in credit risk and the fair value of the liability are presented in the Statement ofcomprehensive income.
This category comprises financial assets classified as hold to sell upon initial recognition.
A financial asset is classified as fair value through profit or loss if it is acquired or incurred principally for the purpose of selling or repurchasing it in the near termor if it is part of a portfolio of identified financial instruments that are managed together and for which there is evidence of a recent actual pattern of short-termprofit-taking. Derivatives are also categorised measured at fair value through profit or loss unless they are designated and effective as hedging instruments.Financial assets held for trading consist of debt instruments, including money-market instruments, as well as financial assets with embedded derivatives. They arerecognised in the consolidated statement of financial position as ‘non-pledged trading assets ’.
Financial assets included in this category are recognised initially at fair value; transaction costs are taken directly to the consolidated income statement. Gains andlosses arising from changes in fair value are included directly in the consolidated income statement and are reported as "Net loss/gains on investment securities.Interest income and expense and dividend income on financial assets held for trading are included in ‘Interest income’, "Interest expense' or ‘Other operatingincome’, respectively. The instruments are derecognised when the rights to receive cash flows have expired or the Group has transferred substantially all the risksand rewards of ownership and the transfer qualifies for derecognising.
The Group may designate certain financial assets upon initial recognition as at fair value through profit or loss (fair value option). This designation cannotsubsequently be changed. The fair value option is only applied when the following conditions are met:
The assets or liabilities are managed, evaluated and reported internally on a fair value basis.
The designation eliminates or significantly reduces an accounting mismatch which would otherwise arise.
Classification of financial assets
63

Access Bank Plc Consolidated and separate financial statements For the year ended 31 December 2020
[ii] Amortized cost
• •
•
[iv] Fair value through other comprehensive income
(d) Classification of financial liabilities
Fair value through other comprehensive income instruments include investment securities and equity investments that are so elected.
Amortized cost financial assets are non-derivative assets with fixed or determinable payments and fixed maturity and which are not designated at fair valuethrough profit or loss, or fair value through other comprehensive income.
These are initially recognised at fair value including direct and incremental transaction costs and measured subsequently at amortised cost, using the effectiveinterest method. Any sale or reclassification of a significant amount of amortized cost investments not close to their maturity would result in a reassessment of theBank's business model for managing the assets. However, sales and reclassifications in any of the following circumstances would not trigger a reclassification:
Sales or reclassification that are so close to maturity that changes on the market rate of interest would not have a significant effect on the financial asset’s fair Sales or reclassification after the Group has collected substantially all the asset’s original principal.
Sales or reclassification attributable to non-recurring isolated events beyond the Group’s control that could not have been reasonably anticipated.
Interest on amortized cost investments is included in the consolidated income statement and reported as ‘Interest income’. In the case of an impairment, theimpairment loss is been reported as a deduction from the carrying value of the investment and recognised in the consolidated income statement as ‘net impairmentloss on financial assets’. Amortised cost investments include treasury bills and bonds.
Financial assets at fair value through other comprehensive income are non-derivative investments that are not designated as another category of financial assets.Unquoted equity securities that have been elected as fair value through other comprehensive and other fair vlaue through other comprehensive incomeinvestments are carried at fair value.
Interest income is recognised in the income statement using the effective interest method. Dividend income is recognised in the income statement when the Groupbecomes entitled to the dividend. Foreign exchange gains or losses on such investments are recognised in the income statement.
Other fair value changes are recognised directly in other comprehensive income until the investment is sold or impaired whereupon the cumulative gains and losespreviously recognised in other comprehensive income are recognised to the income statement as a reclassification adjustment.
The Group classifies its financial liabilities, other than financial guarantees and loan commitments, as measured at amortised cost or fair value through profit orloss.
Financial liabilities that are not classified as at fair value through profit or loss are measured at amortised cost using the effective interest method. Interest expenseis included in 'Interest expense' in the Statement of comprehensive income.
Deposits and debt securities issued are the Group’s sources of debt funding. When the Group sells a financial asset and simultaneously enters into a “repo” or“stock lending” agreement to repurchase the asset (or a similar asset) at a fixed price on a future date, the arrangement is accounted for as a deposit, and theunderlying asset continues to be recognised in the Group’s financial statements as pledged assets.
The Group classifies debt instruments as financial liabilities or equity in accordance with the contractual terms of the instrument.
Deposits and debt securities issued are initially measured at fair value minus incremental direct transaction costs, and subsequently measured at their amortisedcost using the effective interest method, except where the Group designates liabilities at fair value through profit or loss.
On this statement of financial position, other financial liabilities carried at amortised cost include deposit from banks, deposit from customers, interest bearingborrowings, debt securities issued and other liabilities.
The Group may enter into a variety of derivative financial instruments to manage its exposure to interest rate and foreign exchange rate risk, including foreignexchange forward contracts, interest rate swaps and foreign currency options. Further details of derivative financial instruments are disclosed in Note 21 to thefinancial statements. Derivatives are initially recognised at fair value at the date a derivative contract is entered into and are subsequently remeasured to their fair value at each balancesheet date. A derivative with a positive fair value is recognised as a financial asset whereas a derivative with a negative fair value is recognised as a financialliability. The resulting gain or loss is recognised in profit or loss immediately unless the derivative is designated and effective as a hedging instrument, in whichevent the timing of the recognition in profit or loss depends on the nature of the hedge relationship. Derivatives are presented as financial assets or financialliabilities.Derivative assets and liabilities are only offset if the transactions are with the same counterparty, a legal right of offset exists and the parties intend to settle on anet basis.
(i) Financial liabilities at amortised cost
(ii) Financial liabilities at fair value
64
Access Bank Plc Consolidated and separate financial statements For the year ended 31 December 2020
(e) Measurement of financial asset and liabilities
[i] Amortised cost measurement
[ii] Fair value measurement
(f)
Fair value is the price that would be received to sell an asset or paid to transfer a liability in an orderly transaction between market participants at themeasurement date.
When available, the Group measures the fair value of an instrument using quoted prices in an active market for that instrument. A market is regarded as active if quoted prices are readily available and represent actual and regularly occurring market transactions on an arm’s length basis.
If a market for a financial instrument is not active, the Group establishes fair value using valuation techniques. Valuation techniques include using recent arm’slength transactions between knowledgeable, willing parties (if available), reference to the current fair value of other instruments that are substantially the same,and discounted cash flow analysis. The chosen valuation technique makes maximum use of market inputs, relies as little as possible on estimates specific to theGroup, incorporates all factors that market participants would consider in setting a price, and is consistent with accepted economic methodologies for pricingfinancial instruments. Inputs to valuation techniques reasonably represent market expectations and measures of the risk-return factors inherent in the financialinstrument. The Group calibrates valuation techniques and tests them for validity using prices from observable current market transactions in the same instrumentor based on other available observable market data.
The best evidence of the fair value of a financial instrument at initial recognition is the transaction price – i.e. the fair value of the consideration given or received.However, in some cases, the fair value of a financial instrument on initial recognition may be different to its transaction price. If such fair value is evidenced bycomparison with other observable current market transactions in the same instrument (without modification or repackaging) or based on a valuation techniquewhose variables include only data from observable markets, then the difference is recognised in the income statement on initial recognition of the instrument.
The Bank may choose to reclassify a non-derivative financial asset carried at fair value through profit or loss out of the fair value through profit or loss category ifthe financial asset is no longer held for the purpose of selling it in the near-term. Financial assets other than loans and receivables are permitted to be reclassifiedout of the held for trading category only in rare circumstances arising from a single event that is unusual and highly unlikely to recur in the near-term. In addition,the Bank may choose to reclassify financial assets that would meet the definition of loans and receivables out of the fair value through profit or loss or fair valuethrough other comprehensive income categories if the Bank has the intention and ability to hold these financial assets for the foreseeable future or until maturity atthe date of reclassification.
Reclassifications are made at fair value as of the reclassification date. Fair value becomes the new cost or amortised cost as applicable, and no reversals of fairvalue gains or losses recorded before reclassification date are subsequently made. Effective interest rates for financial assets reclassified to loans and receivablesand amortised cost categories are determined at the reclassification date. Further increases in estimates of cash flows adjust effective interest rates prospectively.
In other cases the difference is not recognised in the income statement immediately but is recognised over the life of the instrument on an appropriate basis orwhen the instrument is redeemed, transferred or sold, or the fair value becomes observable.
Assets and long positions are measured at a bid price; liabilities and short positions are measured at an asking price. Where the Group has positions with offsettingrisks, mid-market prices are used to measure the offsetting risk positions and a bid or asking price adjustment is applied only to the net open position asappropriate. Fair values reflect the credit risk of the instrument and include adjustments to take account of the credit risk of the Group entity and the counterpartywhere appropriate. Fair value estimates obtained from models are adjusted for any other factors, such as liquidity risk or model uncertainties, to the extent thatthe Group believes a third-party market participant would take them into account in pricing a transaction.
Reclassification of financial assets
The Group does not reclassify its financial assets subsequent to their initial recognition, apart from the exceptional circumstances in which Group changes itsbusiness model for managing a financial assets, the Group acquires, disposes of, or terminates a business line. Financial liabilities are never reclassified.
The following are not changes in business model;
a. change in intention related to particular financial assets (even in circumstances of significant changes in market conditions).b. the temporary disappearance of a particular market for financial assets.c. a transfer of financial assets between parts of the entity with different business models.
Reclassification dateThe first day of the first reporting year following the change in business model that results in an entity reclassifying financial assets.
A change in the objective of the Group’s business model must be effected before the reclassification date. For example, if Group decides on 15 February to shutdown its Corporate & investment Banking business and hence must reclassify all affected financial assets on 1 April (i.e. the first day of the Group’s next reportingyear), the Group must not accept new Corporate & investment Banking business or otherwise engage in activities consistent with its former business model after 15February.
All reclassifications are applied prospectively from the reclassification date. When the Group reclassifies a financial asset between the amortised cost measurement category and the fair value through other comprehensive incomemeasurement category, the recognition of interest income is not changed and it continues to use the same effective interest rate. However, when the Group reclassifies a financial asset out of the fair value through profit or loss measurement category, the effective interest rate is determined onthe basis of the fair value of the asset at the reclassification date.
The amortised cost of a financial asset or liability is the amount at which the financial asset or liability is measured at initial recognition, minus principalrepayments, plus or minus the cumulative amortisation using the effective interest method of any difference between the initial amount recognised and thematurity amount, minus any reduction for impairment.
65
Access Bank Plc Consolidated and separate financial statements For the year ended 31 December 2020
(g) Derecognition of financial assets and liabilities
(h) Offsetting
(i)(i) Cash and balances with banks
(i) Derecognition other than for substantial modification - Financial assets
A financial asset (or, where applicable, a part of a financial asset or part of a group of similar financial assets) is derecognised when the rights to receive cash flowsfrom the financial asset have expired. The Group also derecognises the financial asset if it has both transferred the financial asset and the transfer qualifies forderecognition.The Group has transferred the financial asset if, and only if, either:• The Group has transferred its contractual rights to receive cash flows from the financial asset or• It retains the rights to the cash flows, but has assumed an obligation to pay the received cash flows in full without material delay to a third party under a‘pass–through’ arrangement
Pass-through arrangements are transactions whereby the Group retains the contractual rights to receive the cash flows of a financial asset (the 'original asset'), butassumes a contractual obligation to pay those cash flows to one or more entities (the 'eventual recipients'), when all of the following three conditions are met:• The Group has no obligation to pay amounts to the eventual recipients unless it has collected equivalent amounts from the original asset, excluding short-termadvances with the right to full recovery of the amount lent plus accrued interest at market rates• The Group cannot sell or pledge the original asset other than as security to the eventual recipients • The Group has to remit any cash flows it collects on behalf of the eventual recipients without material delay.In addition, the Group is not entitled to reinvest such cash flows, except for investments in cash or cash equivalents including interest earned, during the yearbetween the collection date and the date of required remittance to the eventual recipients.
A transfer only qualifies for derecognition if either:• The Group has transferred substantially all the risks and rewards of the asset or• The Group has neither transferred nor retained substantially all the risks and rewards of the asset, but has transferred control of the assetThe Group considers control to be transferred if and only if, the transferee has the practical ability to sell the asset in its entirety to an unrelated third party and isable to exercise that ability unilaterally and without imposing additional restrictions on the transfer.When the Group has neither transferred nor retained substantially all the risks and rewards and has retained control of the asset, the asset continues to berecognised only to the extent of the Group’s continuing involvement, in which case, the Group also recognises an associated liability. The transferred asset and theassociated liability are measured on a basis that reflects the rights and obligations that the Group has retained.Continuing involvement that takes the form of a guarantee over the transferred asset is measured at the lower of the original carrying amount of the asset and themaximum amount of consideration the Group could be required to pay.If continuing involvement takes the form of a written or purchased option (or both) on the transferred asset, the continuing involvement is measured at the valuethe Bank would be required to pay upon repurchase. In the case of a written put option on an asset that is measured at fair value, the extent of the entity'scontinuing involvement is limited to the lower of the fair value of the transferred asset and the option exercise price.
(ii) Derecognition other than for substantial modification - Financial LiabilitiesA financial liability is derecognised when the obligation under the liability is discharged, cancelled or expires. Where an existing financial liability is replaced byanother from the same lender on substantially different terms, or the terms of an existing liability are substantially modified, such an exchange or modification istreated as a derecognition of the original liability and the recognition of a new liability. The difference between the carrying value of the original financial liabilityand the consideration paid is recognised in profit or loss.
If the modification does not result in cash flows that are substantially different, the modification does not result in derecognition. Based on the change in cashflows discounted at the original EIR, the Group records a modification gain or loss, to the extent that an impairment loss has not already been recorded.
Financial assets and liabilities are set off and the net amount presented in the statement of financial position when, and only when, the Group has a legalenforceable right to set off the amounts and intends either to settle on a net basis or to realise the asset and settle the liability simultaneously.
Income and expenses are presented on a net basis only when permitted under IFRSs, or for gains and losses arising from a group of similar transactions such as inthe Group’s trading activity.
Securities sold subject to repurchase agreements (‘repos’) remain on the statement of financial position; the counterparty liability is included in amounts due toother banks, deposits from banks, other deposits or deposits due to customers, as appropriate. Securities purchased under agreements to resell (reverse repos’) arerecorded as money market placement. The difference between sale and repurchase price is treated as interest and accrued over the life of the agreements using theeffective interest method.
Securities lent to counterparties are also retained in the financial statements. Securities borrowed are not recognised in the financial statements, unless these aresold to third parties, in which case the purchase and sale are recorded with the gain or loss included in Net gains/(loss) on investment securities.
Measurement of specific financial assets
Cash and balances with banks include notes and coins on hand, balances held with central banks and highly liquid financial assets with original maturities of lessthan three months, which are subject to insignificant risk of changes in their fair value, and are used by the Group in the management of its short-termcommitments.
In the consolidated statement of cash flows, cash and cash equivalents includes cash in hand, unrestricted balances with foreign and central banks, money marketplacements and other short-term highly liquid investments with original maturities of three months or less.
Derecognition due to substantial modification of terms and conditionsThe Group derecognises a financial asset or liability, such as a loan to a customer, when the terms and conditions have been renegotiated to the extent that,substantially, it becomes a new loan, with the difference recognised as a derecognition gain or loss, to the extent that an impairment loss has not already beenrecorded. The newly recognised loans are classified as Stage 1 for ECL measurement purposes, unless the new loan is deemed to be POCI.When assessing whether or not to derecognise a loan to a customer, amongst others, the Group considers the following factors:• Change in currency of the loan• Introduction of an equity feature• Change in counterparty• If the modification is such that the instrument would no longer meet the SPPI criterion
66
Access Bank Plc Consolidated and separate financial statements For the year ended 31 December 2020
(ii) Repossessed collateral
(iii) Derivative financial instruments
(iv) Pledged assets
[v] Investment under management
3.9 Impairment of financial assets
Overview of the ECL principles
Financial assets transferred to external parties that do not qualify for de-recognition are reclassified in the statement of financial position from financial assetscarried at fair value through profit or loss or investment securities to assets pledged as collateral, if the transferee has received the right to sell or re-pledge them inthe event of default from agreed terms.Initial recognition of assets pledged as collateral is at fair value, whilst subsequent measurement is based on the classification of the financial asset. Assets pledgedas collateral are either designated as fair value through profit or loss, Fair value through other comprehensive income or Amortized cost. Where the assets pledgedas collateral are designated as fair value through profit or loss, subsequent measurement is at fair value through profit and loss, whilst assets pledged as collateraldesignated as Fair value through other comprehensive income are measured at fair-value through equity. Assets pledged as collateral designated as Amortized costare measured at amortized cost.
Investment under management are funds entrusted to Asset management firms who acts as agents to the bank for safe keeping and management for investmentpurpose with returns on the underlying investments accruable to the Bank, who is the principal.
The investment decision made by the Asset management within an agreed portfolio of high quality Nigerian fixed income and money market instruments which areusually short tenured.
The investments are carried at fair value through OCI.
The Group assesses on a forward-looking basis the expected credit losses (‘ECL’) associated with its debt instrument assets carried at amortised cost and FVOCIand with the exposure arising from loan commitments and financial guarantee contracts. The Group recognises a loss allowance for such losses at each reportingdate. The measurement of ECL reflects:
• An unbiased and probability-weighted amount that is determined by evaluating a range of possible outcomes;• The time value of money; and• Reasonable and supportable information that is available without undue cost or effort at the reporting date about past events, current conditions and forecasts offuture economic conditions.
Staging Assessment
The Group has established a policy to perform an assessment, at the end of each reporting year, of whether a financial instrument’s credit risk has increasedsignificantly since initial recognition, by considering the change in the risk of default occurring over the remaining life of the financial instrument. Based on the above process, the Group categorises its financial instruments into Stage 1, Stage 2,Stage 3 and POCI (Purchased or originated credit impaired), asdescribed below:
• Stage 1: When a financial instrument is first recognised, the Group recognises an allowance based on 12m Expected credit Loss. Stage 1 also include financialinstruments where the credit risk has improved (after review over a year of 90 days) and the financial instruments has been reclassified from Stage 2.
• Stage 2: When a financial instrument has shown a significant increase in credit risk since origination, the Group records an allowance for the Lifetime ECLs. Stage2 financial instruments also include instances, where the credit risk has improved (after review over a year of 90 days) and the financial instrument has beenreclassified from Stage 3.
• Stage 3: Financial instruments considered credit-impaired.The Group records an allowance for the Lifetime ECLs.
• POCI: Purchased or originated credit impaired (POCI) assets are financial assets that are credit impaired on initial recognition. POCI assets are recorded at fairvalue at original recognition and interest income is subsequently recognised based on a credit-adjusted EIR. ECLs are only recognised or released to the extent thatthere is a subsequent change in the expected credit losses.
Repossessed collateral are equities, investment properties or other investments repossessed from a customer and used to settle his outstanding obligation. Suchinvestments are classified in accordance with the intention of the Group in the asset class which they belong and are also separately disclosed in the financialstatement.When collaterals are repossessed in satisfaction of a loan, the receivable is written down against the allowance for losses. Repossessed collaterals are included inthe financial statement based on how the Bank intends to realize benefit from such collateral such as "Non current assets held for sale" and carried at the lower ofcost or estimated fair value less costs to sell, if the Group intends to sell or cost less accumulated depreciation, if for use in the normal course of business.
Derivatives are initially recognised at fair value on the date on which a derivative contract is entered into and are subsequently remeasured at their fair value. Fairvalues are obtained from quoted market prices in active markets (for example, for exchange-traded options), including recent market transactions, and valuationtechniques (for example for swaps and currency transactions), including discounted cash flow models and options pricing models, as appropriate. All derivativesare carried as assets when fair value is positive and as liabilities when fair value is negative.The Group mitigates the credit risk of derivatives by holding collateral in the form of cash.
67

Access Bank Plc Consolidated and separate financial statements For the year ended 31 December 2020
Stage 1 Stage 3
(Initial Recognition) (Credit-impaired assets)12-months expected credit losses
Lifetime expected credit losses
Measuring the Expected Credit Loss
The 12-month and lifetime EADs are determined based on the expected payment profile, which varies by product type.
• For amortising products and bullet repayment loans, this is based on the contractual repayments owed by the borrower over a 12month or lifetime basis. This willalso be adjusted for any expected overpayments made by a borrower. Early repayment/refinance assumptions are also incorporated into the calculation.
• For revolving products, the exposure at default is predicted by taking current drawn balance and adding a credit conversion factor which allows for the expecteddrawdown of the remaining limit by the time of default. These assumptions vary by product type and current limit utilisation band, based on analysis of theGroup’s recent default data.
When estimating the ECLs, the Group considers three scenarios (optimistic, best-estimate and downturn) and each of these is associated with different PDs, EADsand LGDs. When relevant, the assessment of multiple scenarios also incorporates how defaulted loans are expected to be recovered, including the probability thatthe loans will cure and the value of collateral or the amount that might be received for selling the asset.The 12-month and lifetime LGDs are determined based on the factors which impact the recoveries made post default. These vary by product type.
• For secured products, this is primarily based on collateral type and projected collateral values, historical discounts to market/book values due to forced sales,time to repossession and recovery costs observed.
• For unsecured products, LGDs are typically set at product level due to the limitation in recoveries achieved across different borrower. These LGDs are influencedby collection strategies, including contracted debt sales and price.
• POCI: Purchase or Originated Credit Impaired (POCI) assets are financial assets that are credit impaired on initial recognition. The Group only recognises thecumulative changes in lifetime ECLs since initial recognition, based on a probability-weighting of the four scenarios, discounted by the credit adjusted EIR.
• Loan commitments and letters of credit: When estimating Lifetime ECLs for undrawn loan commitments, the Group estimates the expected portion of the loan
The mechanics of the ECL method are summarised below:
• Stage 1: The 12 month ECL is calculated as the portion of Lifetime ECLs that represent the ECLs that result from default events on a financial instrument that arepossible within the 12 months after the reporting date. The Group calculates the 12 month ECL allowance based on the expectation of a default occurring in the 12months following the reporting date.These expected 12-month default probabilities are applied to a forecast 12 month EAD and multiplied by the expected 12 month LGD and discounted by anapproximation to the original EIR. This calculation is made for each of the three scenarios, as explained above.
• Stage 2: When a loan has shown a significant increase in credit risk since origination, the Group records an allowance for the Lifetime ECLs. The mechanics aresimilar to those explained above, including the use of multiple scenarios, but PDs and LGDs are estimated over the lifetime of the instrument. The expected cashshortfalls are discounted by an approximation to the original EIR.
• Stage 3: For loans considered credit-impaired, the Group recognises the lifetime expected credit losses for these loans. The method is similar to that for Stage 2assets, with the PD set at 100%.
• Stage 1: When a financial instrument is first recognised, the Group recognises an allowance based on 12m Expected credit Loss. Stage 1 also include financialinstruments where the credit risk has improved (after review over a year of 90 days) and the financial instruments has been reclassified from Stage 2.
• Stage 2: When a financial instrument has shown a significant increase in credit risk since origination, the Group records an allowance for the Lifetime ECLs. Stage2 financial instruments also include instances, where the credit risk has improved (after review over a year of 90 days) and the financial instrument has beenreclassified from Stage 3.
• Stage 3: Financial instruments considered credit-impaired.The Group records an allowance for the Lifetime ECLs.
• POCI: Purchased or originated credit impaired (POCI) assets are financial assets that are credit impaired on initial recognition. POCI assets are recorded at fairvalue at original recognition and interest income is subsequently recognised based on a credit-adjusted EIR. ECLs are only recognised or released to the extent thatthere is a subsequent change in the expected credit losses.
Change in credit quality since initial recognition
The Expected Credit Loss (ECL) is measured on either a 12-month (12M) or Lifetime basis depending on whether a significant increase in credit risk has occurredsince initial recognition or whether an asset is considered to be credit-impaired. Expected credit losses are the discounted product of the Probability of Default(PD), Exposure at Default (EAD), and Loss Given Default (LGD), defined as follows:
• The PD represents the likelihood of a borrower defaulting on its financial obligation (as per Definition of default and credit-impaired above), either over the next12 months (12M PD), or over the remaining lifetime (Lifetime PD) of the obligation.
• EAD is based on the amounts the Group expects to be owed at the time of default, over the next 12 months (12M EAD) or over the remaining lifetime (LifetimeEAD). For example, for a revolving commitment, the Group includes the current drawn balance plus any further amount that is expected to be drawn up to thecurrent contractual limit by the time of default, should it occur.
• Loss Given Default represents the Group’s expectation of the extent of loss on a defaulted exposure. LGD varies by type of counterparty, type and seniority ofclaim and availability of collateral or other credit support. LGD is expressed as a percentage loss per unit of exposure at the time of default (EAD). LGD iscalculated on a 12-month or lifetime basis, where 12-month LGD is the percentage of loss expected to be made if the default occurs in the next 12 months andLifetime LGD is the percentage of loss expected to be made if the default occurs over the remaining expected lifetime of the loan.
The Lifetime PD is developed by applying a maturity profile to the current 12M PD. The maturity profile looks at how defaults develop on a portfolio from the pointof initial recognition throughout the lifetime of the loans. The maturity profile is based on historical observed data and is assumed to be the same across all assetswithin a portfolio and credit grade band. This is supported by historical analysis.
68

Access Bank Plc Consolidated and separate financial statements For the year ended 31 December 2020
• Financial guarantee contracts: The Group’s liability under each guarantee is measured at the higher of the amount initially recognised less cumulativeamortisation recognised in the income statement, and the ECL provision. For this purpose, the Group estimates ECLs based on the present value of the expectedpayments to reimburse the holder for a credit loss that it incurs The shortfalls are discounted by the risk-adjusted interest rate relevant to the exposure. Thecalculation is made using a probability-weighting of the three scenarios. The ECLs related to financial guarantee contracts are recognised within net impairmentcharge on financial assets
69

Access Bank Plc Consolidated and separate financial statements For the year ended 31 December 2020
The assessment of SICR incorporates forward-looking information and is performed on a quarterly basis at a portfolio level for all Retail financial instruments heldby the Group. In relation to Wholesale and Treasury financial instruments, where a Watchlist is used to monitor credit risk, this assessment is performed at thecounterparty level and on a periodic basis. The criteria used to identify SICR are monitored and reviewed periodically for appropriateness by the independentCredit Risk team.
BackstopA backstop indicator is applied and the financial instrument considered to have experienced a significant increase in credit risk if the borrower is more than 30days past due and 90 days past due on its contractual payments for both stage 2 and stage 3 respectively.
Definition of default and credit-impaired assetsThe Group defines a financial instrument as in default, which is fully aligned with the definition of credit-impaired, when it meets one or more of the followingcriteria:
Quantitative criteriaThe borrower is more than 90 days past due on its contractual payments.
Qualitative criteria
The borrower meets unlikeliness to pay criteria, which indicates the borrower is in significant financial difficulty. These are instances where:
• The borrower is in long-term forbearance• The borrower is deceased• The borrower is insolvent• The borrower is in breach of financial covenant(s)• An active market for that financial asset has disappeared because of financial difficulties• Concessions have been made by the lender relating to the borrower’s financial difficulty• It is becoming probable that the borrower will enter bankruptcy• Financial assets are purchased or originated at a deep discount that reflects the incurred credit losses.
Significant increase in credit risk (SICR)
The Group considers a financial instrument to have experienced a significant increase in credit risk when one or more of the following quantitative, qualitative orbackstop criteria have been met:
Quantitative criteria:The remaining Lifetime PD at the reporting date has increased, compared to the residual Lifetime PD expected at the reporting date when the exposure was firstrecognised.
Deterioration in the credit rating of an obligor either based on the Bank’s internal rating system or an international credit rating. However, the downgradeconsiders movement from a grade band to another e.g. Investment grade to Standard. The Group also considers accounts that meet the criteria to be put on the watchlist bucket in line with CBN prudential guidelines since they have significantlyincreased in credit risk.
Qualitative criteria:
For Retail loans, if the borrower meets one or more of the following criteria:• In short-term forbearance• Direct debit cancellation• Extension to the terms granted• Previous arrears within the last [12] months
For Corporate portfolio, if the borrower is on the watchlist and/or the instrument meets one or more of the following criteria: • Significant increase in credit spread• Significant adverse changes in business, financial and/or economic conditions in which the borrower operates• Actual or expected forbearance or restructuring• Actual or expected significant adverse change in operating results of the borrower• Significant change in collateral value (secured facilities only) which is expected to increase risk of default• Early signs of cash flow/liquidity problems such as delay in servicing of trade creditors/loans
The criteria above have been applied to all financial instruments held by the Group and are consistent with the definition of default used for internal credit riskmanagement purposes. The default definition has been applied consistently to model the Probability of Default (PD), Exposure at Default (EAD) and Loss givenDefault (LGD) throughout the Group’s expected loss calculations.
70

Access Bank Plc Consolidated and separate financial statements For the year ended 31 December 2020
Expected credit loss on loans and receivables
The model produced best-estimate, optimistic and downturn forecasts of the selected macro-economic indicators, based on trends in the indicators and macro-economic commentary. This was done through stressing the indicator GDP, which in turn stressed the other indicators based on their assumed historicalcorrelation with GDP. The regression formula obtained was applied to the forecasted macro-economic indicators in order to predict the target variable. The targetvariable were projected, for each quarter, over the year July 2016 to December 2019 and assumed constant thereafter.
The best-estimate, optimistic and downturn scalars of predicted target variables were determined. In order to remove the impact of any historical trends includedin the data, the scalar denominator was adjusted based on the estimation year used to derive the PDs. The scalars calculated were applied to the lifetime PDs. Thisprocess results in forward-looking best-estimate, optimistic and downturn lifetime PD curves, which are used in the ECL calculations.
The Group’s policy is to determine whether a repossessed asset can be best used for its internal operations or should be sold. Assets determined to be useful forthe internal operations are transferred to their relevant asset category at the lower of their repossessed value or the carrying value of the original secured asset.Assets for which selling is determined to be a better option are transferred to assets held for sale at their fair value (if financial assets) and fair value less cost to sellfor non-financial assets at the repossession date in, line with the Group’s policy.
Write-offs
Financial assets are written off either partially or in their entirety only when the Group has exhausted all practical recovery efforts and has concluded there is noreasonable expectation of recovery. Either the counterparty can no longer pay the obligation or proceeds from the collateral will not be sufficient to pay back theexposure. As directed by CBN guideline on write-off, board approval is required before any write-off can occur. For insider-related loans, CBN approval isrequired. If the amount to be written off is greater than the accumulated loss allowance, the difference is first treated as an addition to the allowance that is thenapplied against the gross carrying amount to derecognize the asset. The recovery department continues with recovery efforts and any subsequent recoveries arecredited to credit loss expense
In assessing expected credit loss, the Group uses statistical modeling of historical trends of the probability of default, timing of recoveries and the amount of lossincurred, adjusted for management’s judgment as to whether current and forecasted economic and credit conditions are such that the actual losses are likely to begreater or less than suggested by historical modeling. Default rates, loss rates and the expected timing of future recoveries are regularly benchmarked againstactual outcomes to ensure that they remain appropriate. The ECL on restricted deposits and other assets is calculated using the simplified model approach.
Impairment losses on assets carried at amortised cost are measured as the difference between the carrying amount of the financial assets and the present value ofestimated cash flows discounted at the assets’ original effective interest rate. Losses are recognised in the income statement and reflected in an allowance accountagainst loans and advances. Interest on the impaired asset continues to be recognised through the unwinding of the discount. When a subsequent event causes theamount of impairment loss to decrease, the impairment loss is reversed through profit or loss.
The Group considers all loans and advances, financial assets at FVOCI and amortized cost investments at specific level for expected credit loss assessment.
To mitigate its credit risks on financial assets, the Group seeks to use collateral, where possible. The collateral comes in various forms, such as cash, securities,letters of credit/guarantees, real estate, receivables, inventories, other non-financial assets and credit enhancements such as netting agreements. Collateral, unlessrepossessed, is not recorded on the Bank’s statement of financial position. However, the fair value of collateral affects the calculation of ECLs. It is generallyassessed, at a minimum, at inception and re-assessed on a periodic basis. To the extent possible, the Bank uses active market data for valuing financial assets held as collateral. Other financial assets which do not have readilydeterminable market values are valued using models. Non-financial collateral, such as real estate, is valued based on data provided by third parties such asexternal valuers.
The ECLs include forward-looking information which translates into an allowance for changes in macro-economic conditions and forecasts when estimatinglifetime ECLs. It is important to understand the effect of forecasted changes in the macro-economic environment on ECLs, so that an appropriate level ofprovisions can be raised.
A regression model was built to explain and predict the impact of macro-economic indicators on default rates. Such regression models are usually built on a historyof default rates and macro-economic variables covering at least one economic cycle, but preferable more.
Historical data on macro-economic indicators from a host of reliable sources, including the International Monetary Fund was gathered. As a proxy for defaultrates, the Group provided their non-performing loans as a percentage of gross loans ("NPL%") metric. The time series data extended from the first quarter of 2007to the second quarter of 2016. Quarterly data was used to increase granularity.
The macro-economic model regressed historical NPL% (the target variable) on a list of candidate macro-economic indicators. The Bank's Economic Intelligencecurrently monitors and forecasts certain macro-economic indicators. These indicators are GDP growth rate, inflation rate, crude oil prices and the foreignexchange rate.The most predictive variables that were selected in the regression model (the most predictive indicators) were determined. The logic of therelationships between the indicators and the target variable was considered and assessed to ensure indicators are not highly correlated with one another.
In its ECL models, the Group relies on a broad range of forward looking information as economic inputs. The macroeconomic variables considered for theadjustment of the probabilities of default are listed below: - Crude oil prices,- Inflation,- Interest rates,- Exchange rates (USD/NGN), and - Monetary Policy rate
The inputs and models used for calculating ECLs may not always capture all characteristics of the market at the date of the financial statements. To reflect this,qualitative adjustments or overlays are occasionally made as temporary adjustments when such differences are significantly material.
Collateral valuation
Incorporation of forward looking information and macroeconomic factors
71

Access Bank Plc Consolidated and separate financial statements For the year ended 31 December 2020
Expected credit loss on fair value through other comprehensive income securities
3.10 Investment properties
An investment property is an investment in land or buildings held primarily for generating income or capital appreciation and not occupied substantially for use inthe operations of the Group. An occupation of more than 15% of the property is considered substantial. Investment properties is measured initially at cost including transaction cost and subsequently carried in the statement of financial position at their fair value and revalued yearly on a systematic basis. Investment propertiesare not subject to periodic charge for depreciation. Gains or losses arising from changes in the fair value of investment properties are included in the consolidatedincome statement in the year which it arises as: "Fair value gain on investment property"
Any gain or loss on disposal of an investment property (calculated as the difference between the net proceeds from disposal and the carrying amount of the item) isrecognised in income statement inside other operating income or other operating expenses dependent on whether a loss or gain is recognized after themeasurement
When the use of a property changes such that it is reclassified as property and equipment, its fair value at the date of reclassification becomes its cost forsubsequent accounting.
Impairment losses on fair value through other comprehensive income investment securities are recognised in profit or loss and the impairment provision is notused to reduce the carrying amount of the investment but recognised in other comprehensive income.For debt securities, the group uses the criteria referred to in (i) above to assess impairment.
For equity, a prolonged decline in the fair value of the security below its cost is also evidence that the asset is impaired. Impairment losses recognised in theconsolidated income statement on equity instruments are not reversed through the consolidated income statement. If, in a subsequent year, the fair value of animpaired fair value through other comprehensive income debt security increases and the increase can be related objectively to an event occurring after theimpairment loss was recognised, then the impairment loss is reversed through the income statement; otherwise, any increase in fair value is recognised throughOCI. Any subsequent recovery in the fair value of an impaired fair value through other comprehensive income equity security is always recognised in OCI.
The Group writes off previously impaired loans and advances (and investment securities) when they are determined not to be recoverable. The Group writes offloans or investment debt securities that are impaired (either partially or in full and any related allowance for impairment losses) when the Group credit teamdetermines that there is no realistic prospect of recovery.
72

Access Bank Plc Consolidated and separate financial statements For the year ended 31 December 2020
3.11 Property and equipment
(a) Recognition and measurement
(b) Subsequent costs
(c) Depreciation
Not depreciatedOver the shorter of the useful life of the item or lease term
60 years4.5 years6 years5 years
(d) De-recognition
3.12 Leases
Buildings
At commencement date of a lease, the Bank recognises lease liabilities measured at the present value of lease payments to be made over the lease term. Lease liabilities include thenet present value of the following lease payments:
- fixed payments (including in-substance fixed payments), less any lease incentives receivable- variable lease payment that are based on an index or a rate- amounts expected to be payable by the Bank under residual value guarantees- the exercise price of a purchase option if the lessee is reasonably certain to exercise that option, and- payments of penalties for terminating the lease, if the lease term reflects the Bank exercising that option.
Lease payments to be made under reasonably certain extension options are also included in the measurement of the liability. The variable lease payments that do not depend on anindex or a rate are recognised as expense in the year in which the event or condition that triggers the payment occurs.
The lease payments are discounted using the interest rate implicit in the lease. If that rate cannot be readily determined, the Bank’s incremental borrowing rate is used, being therate that the Bank would have to pay to borrow the funds necessary to obtain an asset of similar value to the right of use asset in a similar economic environment with similarterms, security and conditions. The weighted average lessee’s incremental borrowing rate applied to the lease liabilities as at 31 December 2020 was 15.65%
Lease payments are allocated between principal and finance cost. The finance cost is charged to profit or loss over the lease year so as to produce a constant periodic rate of intereston the remaining balance of the liability for each year.After the commencement date, the amount of lease liabilities is increased to reflect the accretion of interest and reduced forthe lease payments made. In addition, the carrying amount of lease liabilities is remeasured if there is a modification, a change in the lease term, a change in the in-substance fixedlease payments or a change in the assessment to purchase the underlying asset. The lease term refers to the contractual year of a lease.
Depreciation begins when an asset is available for use and ceases at the earlier of the date that the asset is derecognised or classified as held for sale in accordance with IFRS 5. Anon-current asset or disposal group is not depreciated while it is classified as held for sale.
The estimated useful lives for the current and comparative years of significant items of property and equipment are as follows:
An item of property and equipment is derecognised on disposal or when no future economic benefits are expected from its use or disposal. Any gain or loss arising on de-recognition of the asset (calculated as the difference between the net disposal proceeds and the carrying amount of the asset) is included within other operating income in theincome statement in the year the asset is derecognised.
Capital work in progress is not depreciated. Upon completion it is transferred to the relevant asset category. Depreciation methods, useful lives and residual values are reassessedat each reporting date and adjusted if appropriate.
The asset's residual values and useful lives are reviewed, and adjusted if appropriate, at each date of the statement of financial position. Assets are reviewed for impairmentwhenever events or changes in circumstances indicate that the carrying amount may not be recoverable. An asset’s carrying amount is written down immediately to its recoverableamount if the asset’s carrying amount is greater than its estimated recoverable amount. The recoverable amount is the higher of the asset’s fair value less costs to sell and value inuse.
Leasehold landLeasehold improvements and building
Items of property and equipment are measured at cost less accumulated depreciation and accumulated impairment losses. Cost includes expenditures that are directly attributableto the acquisition of the asset.
When significant parts of an item of property or equipment have different useful lives, they are accounted for as separate items (major components) of property and equipment.
The gain or loss on disposal of an item of property and equipment is determined by comparing the proceeds from disposal with the carrying amount of property and equipment,and are recognised net within other income in the Income statement.
Subsequent costs are included in the asset's carrying amount or recognized as a separate asset, as appropriate, only when it is probable that the future economic benefitsassociated with the item will flow to the Group and its cost can be measured reliably. The costs of the day-to-day repairs and maintenance of property and equipment arerecognised in Income statement as incurred.
Depreciation is recognised in the income statement on a straight-line basis to write down the cost of items of property and equipment, to their residual values over the estimateduseful lives.
Computer hardwareFurniture and fittings
Lease liabilities
The Bank leases several assets including buildings and land. Lease terms are negotiated on an individual basis and contain different terms and conditions, including extensionoptions as described in (ii) below. The lease year ranges from 1 year to 40 years. The lease agreements do not impose any covenants, however, leased assets may not be used assecurity for borrowing purposes.
Contracts may contain both lease and non-lease components. The Bank has elected not to separate lease and non-lease components and instead accounts for these as a single leasecomponent.
Leases are recognised as a right-of-use asset and a corresponding liability at the date at which the leased asset is available for use by the Bank. Assets and liabilities arising from alease are initially measured on a present value basis.
Motor vehicles
73

Access Bank Plc Consolidated and separate financial statements For the year ended 31 December 2020At commencement date of a lease, the Bank recognises lease liabilities measured at the present value of lease payments to be made over the lease term. Lease liabilities include thenet present value of the following lease payments:
- fixed payments (including in-substance fixed payments), less any lease incentives receivable- variable lease payment that are based on an index or a rate- amounts expected to be payable by the Bank under residual value guarantees- the exercise price of a purchase option if the lessee is reasonably certain to exercise that option, and- payments of penalties for terminating the lease, if the lease term reflects the Bank exercising that option.
Lease payments to be made under reasonably certain extension options are also included in the measurement of the liability. The variable lease payments that do not depend on anindex or a rate are recognised as expense in the year in which the event or condition that triggers the payment occurs.
The lease payments are discounted using the interest rate implicit in the lease. If that rate cannot be readily determined, the Bank’s incremental borrowing rate is used, being therate that the Bank would have to pay to borrow the funds necessary to obtain an asset of similar value to the right of use asset in a similar economic environment with similarterms, security and conditions. The weighted average lessee’s incremental borrowing rate applied to the lease liabilities as at 31 December 2020 was 15.65%
Lease payments are allocated between principal and finance cost. The finance cost is charged to profit or loss over the lease year so as to produce a constant periodic rate of intereston the remaining balance of the liability for each year.After the commencement date, the amount of lease liabilities is increased to reflect the accretion of interest and reduced forthe lease payments made. In addition, the carrying amount of lease liabilities is remeasured if there is a modification, a change in the lease term, a change in the in-substance fixedlease payments or a change in the assessment to purchase the underlying asset. The lease term refers to the contractual year of a lease.
74

Access Bank Plc Consolidated and separate financial statements For the year ended 31 December 2020
Right of use assets
Extension and termination options
•
Extension and termination options - Determining the lease term
3.13 Intangible assets
(a) Goodwill
Amendments to IFRS 16: COVID-19-related rent concessions
The amendment is effective for annual reporting periods beginning on or after 1 June 2020. Earlier application is permitted. The amendment is also available for interim reports.The changes in Covid-19-Related Rent Concessions (Amendment to IFRS 16) amend IFRS 16 to
1) provide lessees with an exemption from assessing whether a COVID-19-related rent concession is a lease modification;
2) require lessees that apply the exemption to account for COVID-19-related rent concessions as if they were not lease modifications;
3) require lessees that apply the exemption to disclose that fact; and require lessees to apply the exemption retrospectively in accordance with IAS 8, but not require them torestate prior period figures.
The main change from the proposal in the exposure draft is that the IASB had proposed that the practical expedient should only be available for lease payments originally due in2020. However, after having considered the feedback to the exposure draft, the IASB decided to extend this period to June 2021 to also capture rent concessions granted now andlasting for 12 months.
However, the Group did not receive rent concessions in the 2020 financial year
Goodwill has an indefinite useful life and is tested annually as well as whenever a trigger event has been observed for impairment by comparing the present value of the expectedfuture cash flows from a cash generating unit with the carrying value of its net assets, including attributable goodwill and carried at cost less accumulated impairment losses.Impairment losses on goodwill are not reversed. Gains and losses on the disposal of an entity include the carrying amount of goodwill relating to the entity sold.
Right-of-use assets are measured at cost comprising the following:
- the amount of the initial measurement of lease liability- any lease payments made at or before the commencement date less any lease incentives received- any initial direct costs, and- restoration costs.
Right-of-use assets are generally depreciated over the shorter of the asset's useful life and the lease term on a straight-line basis. If the Bank is reasonably certain to exercise apurchase option, the right-of-use asset is depreciated over the underlying asset’s useful life.
Goodwill is allocated to cash-generating units or groups of cash-generating units for the purpose of impairment testing. The allocation is made to those cash-generating units orgroups of cash-generating units that are expected to benefit from the business combination in which the goodwill arose identified in accordance with IFRS 8.
Goodwill that arises upon the acquisition of subsidiaries is included in intangible assets. Subsequent to initial recognition, goodwill is measured at cost less accumulatedimpairment losses. Goodwill has an indefinite useful life and it is tested annually for impairment.
Short-term leases and leases of low value
Extension and termination options are included in a number of property leases. These are used to maximise operational flexibility in terms of managing the assets used in theBank’s operations. The majority of extension and termination options held are exercisable only by the Bank.
In determining the lease term, management considers all facts and circumstances that create an economic incentive to exercise an extension option, or not exercise a terminationoption. Extension options (or periods after termination options) are only included in the lease term if the lease is reasonably certain to be extended (or not terminated).
For leases of properties, the following factors are normally the most relevant:
- If there are significant penalties to terminate (or not extend), the Bank is typically reasonably certain to extend (or not terminate). - If any leasehold improvements are expected to have a significant remaining value, the Bank is typically reasonably certain to extend (or not terminate). - Otherwise, the Bank considers other factors including historical lease durations and the costs and business disruption required to replace the leased asset.
The lease term is reassessed if an option is actually exercised (or not exercised) or the Bank becomes obliged to exercise (or not exercise) it. The assessment of reasonable certaintyis only revised if a significant event or a significant change in circumstances occurs, which affects this assessment, and that is within the control of the lessee. During the currentfinancial year, the financial effect of revising lease terms to reflect the effect of exercising extension and termination options was a decrease in recognised lease liabilities and right-of-use assets of N146.89 million.
Critical judgements
The Bank applies the short-term lease recognition exemption to its short-term leases (i.e., those leases that have a lease term of 12 months or less from the commencement dateand do not contain a purchase option). It also applies the lease of low-value assets recognition exemption to leases that are considered of low value (i.e. low value assets). Low-value assets are assets with lease amount of less than $5,000 when new. Lease payments on short-term leases and leases of low-value assets are recognised as expense in profit orloss on a straight-line basis over the lease term.
75
Access Bank Plc Consolidated and separate financial statements For the year ended 31 December 2020
(b) Software
(c) Brand, Customer Relationships and Core Deposits
3.14 Impairment of non-financial assets
3.15 Discontinued operations
An impairment loss in respect of goodwill is not reversed. In respect of other assets, impairment losses recognised in prior years are assessed at each reporting date for anyindications that the loss has decreased or no longer exists. An impairment loss is reversed if there has been a change in the estimates used to determine the recoverable amount.An impairment loss is reversed only to the extent that the asset’s carrying amount does not exceed the carrying amount that would have been determined, net of depreciation oramortisation, if no impairment loss had been recognised.
This is an intangible assets related to acquisitions. At acquisition date, they are initially recorded at their fair value and subsequently at cost less accumulated amortization.Amortization expense is recorded in amortization of intangible assets in the Consolidated Statement of Profit or Loss. Intangible assets are amortized over the period during whichthe Bank derives economic benefits from the assets, on either a straight-line, over a period of 10 years.
The useful lives of the assets are reviewed annually for any changes in circumstances. The assets are tested annually for impairment or at such time where there is an impairmenttrigger, or changes in circumstances indicate that their carrying value may not be recoverable.
The carrying amounts of the Group’s non-financial assets other than goodwill and deferred tax assets, are reviewed at each reporting date to determine whether there is anyindication of impairment. If any such indication exists then the asset’s recoverable amount is estimated. For goodwill and intangible assets that have indefinite useful lives or thatare not yet available for use, the recoverable amount is estimated each year at the same time.
The recoverable amount of goodwill is estimated at each reporting date. An impairment loss is recognised if the carrying amount of an asset or its cash-generating unit exceeds itsrecoverable amount. In assessing value in use, the estimated future cash flows are discounted to their present value using a pre-tax discount rate that reflects current marketassessments of the time value of money and the risks specific to the asset.
For the purpose of impairment testing, assets that cannot be tested individually are grouped together into the smallest group of assets that generates cash inflows from continuinguse that are largely independent of cash inflows of other assets or groups of assets (the "cash-generating unit" or CGU). Subject to an operating segment ceiling test, for thepurposes of goodwill impairment testing, CGUs to which goodwill has been allocated are aggregated so that the level at which impairment is tested reflects the lowest level atwhich goodwill is monitored for internal reporting purposes. Goodwill acquired in a business combination is allocated to the groups of CGUs that are expected to benefit from thesynergies of the combination.
Software acquired by the Group is stated at cost less accumulated amortisation and accumulated impairment losses. Expenditure on internally developed software is recognised asan asset when the Group is able to demonstrate its intention and ability to complete the development and use the software in a manner that will generate future economic benefits,and can reliably measure the costs to complete the development. The capitalised costs of internally developed software include all costs directly attributable to developing thesoftware, and are amortised over its useful life. Internally developed software is stated at capitalised cost less accumulated amortisation and impairment.
Subsequent expenditure on software assets is capitalised only when it increases the future economic benefits embodied in the specific asset to which it relates. All otherexpenditure is expensed as incurred.
Amortisation is recognised in the income statement on a straight-line basis over the estimated useful life of the software, from the date that it is available for use since this mostclosely reflects the expected pattern of consumption of future economic benefits embodied in the asset. Software has a finite useful life, the estimated useful life of software is fourand half years (4.5). Amortisation methods, useful lives and residual values are reviewed at each financial year-end and adjusted if appropriate.
The Group presents discontinued operations in a separate line in the consolidated income statement if an entity or a component of an entity has been disposed of or is classified asheld for sale and: (a) Represents a separate major line of business or geographical area of operations;(b) Is part of a single coordinated plan to dispose of a separate major line of business or geographical area of operations; or(c) Is a subsidiary acquired exclusively with a view to resale (for example, certain private equity investments).
Net profit from discontinued operations includes the net total of operating profit and loss before tax from operations, including net gain or loss on sale before tax or measurementto fair value less costs to sell and discontinued operations tax expense. A component of an entity comprises operations and cash flows that can be clearly distinguished,operationally and for financial reporting purposes, from the rest of the Group´s operations and cash flows. If an entity or a component of an entity is classified as a discontinuedoperation, the Group restates prior years in the consolidated income statement.
Non-current assets, or disposal groups comprising assets and liabilities, that are expected to be recovered primarily through sale or distribution rather than through continuinguse, are classified as held for sale or distribution. Immediately before classification as held for sale or distribution, the assets, or components of a disposal group, are re-measuredin accordance with the Group’s accounting policies. Thereafter generally the assets, or disposal group, are measured at the lower of their carrying amount and fair value less coststo sell. Any impairment loss on a disposal group is allocated first to goodwill, and then to the remaining assets and liabilities on pro rata basis, except that no loss is allocated toinventories, financial assets, deferred tax assets, employee benefit assets, investment property or biological assets, which continue to be measured in accordance with the Group’saccounting policies.
Impairment losses on initial classification as held for sale or distribution and subsequent gains and losses on re-measurement are recognised in the income statement. Gains arenot recognised in excess of any cumulative impairment loss.
Once classified as held for sale or distribution, intangible assets and property, plant and equipment are no longer amortised or depreciated, and any equity-accounted investee isno longer equity accounted.
76

Access Bank Plc Consolidated and separate financial statements For the year ended 31 December 2020
3.16 Non-current assets (or disposal groups) held for sale
Repossessed collateral
3.17 Provisions
(a) Restructuring
3.18 Financial guarantees
3.19 Employee benefits
(a) Defined contribution plans
(b) Termination benefits
(c) Post employment defined benefit plan
(d) Short-term employee benefits
(e) Share-based payment remuneration scheme
A defined contribution plan is a post employment benefit plan under which an entity pays fixed contributions into a separate entity and will have no legal or constructive obligationto pay further amounts. Obligations for contributions to defined contribution pension plans are recognised as an expense in the income statement when they are due in respect ofservice rendered before the end of the reporting year.
Prepaid contributions are recognised as an asset to the extent that a cash refund or a reduction in future payments is available. Contributions to a defined contribution plan thatare due more than 12 months after the end of the reporting year in which the employees render the service are discounted to their present value at the reporting date.
The Group applies IFRS 2 Share Based Payments in accounting for employee remuneration in the form of shares.Employee incentives include awards in the form of shares . The cost of the employee services received in respect of the shares or share granted is recognised in the incomestatement over the year that employees provide services, generally the year between the date the award is granted or notified and the vesting date of the shares. The overall cost ofthe award is calculated using the number of shares and options expected to vest and the fair value of the shares or options at the date of grant.The number of shares expected to vest takes into account the likelihood that performance and service conditions included in the terms of the awards will be met. Failure to meetthe non-vesting condition is treated as a forfeiture, resulting in an acceleration of recognition of the cost of the employee services.The fair value of shares is the market price ruling on the grant date, in some cases adjusted to reflect restrictions on transferability. The cost recognised as a result of sharesgranted in the year has been expensed within Personnel expenses, with a corresponding increase in the Share scheme reserve
The Bank has a non-contributory, un-funded lump sum defined benefit plan for top executive management of the Bank from General Manager and above based on the number ofyears spent in these positions.
Short-term employee benefit obligations are measured on an undiscounted basis and are expensed as the related service is provided.
A liability is recognised for the amount expected to be paid under short-term cash bonus or profit-sharing plans if the Group has a present legal or constructive obligation to paythis amount as a result of past service provided by the employee and the obligation can be estimated reliably.
Depending on their grade, executive staff of the Bank upon retirement are entitled to certain benefits based on their length of stay on that grade. The Bank's net obligation inrespect of the long term incentive scheme is calculated by estimating the amount of future benefits that eligible employees have earned in return for service in the current andprior years. That benefit is discounted to determine its present value. The rate used to discount the post employment benefit obligation is determined by reference to the yield onNigerian Government Bonds, that have maturity dates approximating the terms of the Bank's obligations.
The calculation is performed annually by a qualified actuary using the projected unit credit method. When the benefits of a plan are improved, the portion of the increased benefitrelating to past service by employees is immediately recognized in the income statement. The Bank recognizes all actuarial gains or losses and all expenses arising from definedbenefit plan immediately in the balance sheet, with a charge or credit to other comprehensive income (OCI) in the years in which they occur. They are not recycled subsequently inthe income statement.
Termination benefits are payable when employment is terminated by the group before the normal retirement date, or whenever an employee accepts voluntary redundancy inexchange for these benefits. The group recognises termination benefits at the earlier of the following dates: (a) when the group can no longer withdraw the offer of those benefits;and (b) when the entity recognises costs for a restructuring that is within the scope of IAS 37 and involves the payment of termination benefits. In the case of an offer made toencourage voluntary redundancy, the termination benefits are measured based on the number of employees expected to accept the offer. Benefits falling due more than 12 monthsafter the end of the reporting year are discounted to their present value.
Repossessed collateral are equities, investment properties or other investments repossessed from a customer and used to settle his outstanding obligation. Such investments areclassified in accordance with the intention of the Group in the asset class which they belong and are also separately disclosed in the financial statement.When collaterals are repossessed in satisfaction of a loan, the receivable is written down against the allowance for losses. Repossessed collaterals are included in the financialstatement based on how the Bank intends to realize benefit from such collateral such as "Non current assets held for sale" and carried at the lower of cost or estimated fair valueless costs to sell, if the Group intends to sell or cost less accumulated depreciation, if for use in the normal course of business.
Non-current assets (or disposal groups) are classified as assets held for sale when their carrying amount is to be recovered principally through a sale transaction and a sale isconsidered highly probable. They are stated at the lower of carrying amount and fair value less costs to sell. Investment property classified as non-current asset held for sale are measured at fair value, gain or loss arising from a change in the fair value of investment property is recognisedin income statement for the year in which it arise.
A provision is recognised if, as a result of a past event, the Group has a present legal or constructive obligation that can be estimated reliably, and it is probable that an outflow ofeconomic benefits will be required to settle the obligation. Provisions are determined by discounting the expected future cash flows at a pre-tax rate that reflects current marketassessments of the time value of money and, where appropriate, the risks specific to the liability. The increase in the provision due to passage of time is recognised as interestexpenses.
A provision for restructuring is recognised when the Group has approved a detailed and formal restructuring plan, and the restructuring either has commenced or has beenannounced publicly. Future operating costs are not provided for.
Financial guarantees which includes Letters of credit are contracts that require the Group to make specified payments to reimburse the holder for a loss it incurs because aspecified debtor fails to make payment when due in accordance with the terms of a debt instrument. Financial guarantee liabilities are initially recognised at their fair value, andthe initial fair value is amortised over the life of the financial guarantee. The guarantee liability is subsequently carried at the higher of this amortised amount and the presentvalue of any expected payment (when a payment under the guarantee has become probable).Letters of credits which have been guaranteed by Access bank but funded by the customer is included in other liabilities while those guaranteed and funded by the Bank is includedin deposit from financial institutions.
The Bank operates a funded, defined contribution pension scheme for employees. Employees and the Bank contribute 8% and 10% respectively of the qualifying staff salary in linewith the provisions of the Pension Reforms Act 2014.
77

Access Bank Plc Consolidated and separate financial statements For the year ended 31 December 2020
The Group applies IFRS 2 Share Based Payments in accounting for employee remuneration in the form of shares.Employee incentives include awards in the form of shares . The cost of the employee services received in respect of the shares or share granted is recognised in the incomestatement over the year that employees provide services, generally the year between the date the award is granted or notified and the vesting date of the shares. The overall cost ofthe award is calculated using the number of shares and options expected to vest and the fair value of the shares or options at the date of grant.The number of shares expected to vest takes into account the likelihood that performance and service conditions included in the terms of the awards will be met. Failure to meetthe non-vesting condition is treated as a forfeiture, resulting in an acceleration of recognition of the cost of the employee services.The fair value of shares is the market price ruling on the grant date, in some cases adjusted to reflect restrictions on transferability. The cost recognised as a result of sharesgranted in the year has been expensed within Personnel expenses, with a corresponding increase in the Share scheme reserve
78

Access Bank Plc Consolidated and separate financial statements For the year ended 31 December 2020
3.20 Share capital and reserves
(a) Share issue costs
(b) Dividend on the Bank’s ordinary shares
(c) Treasury shares
(d) Earnings per share
(e) Regulatory risk reserve
Percentage10%50%100%
(f) Capital reserve
(g) Fair value reserve
(h) Foreign currency translation reserve
(i) Retained earnings
3.21 Levies
3.22 Derivatives and hedging activities
The Group recognizes liability to pay levies progressively if the obligating event occurs over a period of time. However, if the obligation is triggered on reaching a minimumthreshold, the liability is recognised when that minimum threshold is reached. The Group recognizes an asset if it has paid a levy before the obligating event but does not yet have apresent obligation to pay that levy. The obligating event that gives rise to a liability to pay a levy is the event identified by the legislation that triggers the obligation to pay the levy.
Lost Interest and/or principal overdue by more than 365 days
A more accelerated provision may be done using the subjective criteria. A 2% provision is taken on all risk assets that are not specifically provisioned.
The results of the application of Prudential Guidelines and the expected credit loss determined for these assets under IFRS 9 are compared. The IFRS 9 determined impairmentcharge is always included in the income statement.
Where the Prudential Guidelines provision is greater, the difference is appropriated from retained earnings and included in a non - distributable 'Statutory credit reserve'. Wherethe IFRS 9 exected credit loss is greater, no appropriation is made and the amount of IFRS 9 expected credit loss is recognised in the income statement.
Following an examination, the regulator may also require more amounts to be set aside on risk and other assets. Such additional amounts are recognised as an appropriation fromretained earnings to regulatory risk reserve.
This balance represents the surplus nominal value of the reconstructed shares of the Bank which was transferred from the share capital account to the capital reserve account afterthe share capital reconstruction in October 2006. The Shareholders approved the reconstruction of 13,956,321,723 ordinary shares of 50 kobo each of the Bank in issue to6,978,160,860 ordinary shares of 50 kobo each by the creation of 1 ordinary shares previously held.
The fair value reserve comprises the net cumulative change in the fair value of available-for-sale investments until the investment is derecognised or impaired.
This balance appears only in the Group accounts and represents the foreign currency exchange difference arising from translating the results and financial position of all the groupentities (none of which has the currency of a hyper-inflationary economy) that have a functional currency different from the presentation currency.
Retained earnings are the carried forward recognised income net of expenses plus current year profit attributable to shareholders.
Substandard Interest and/or principal overdue by 90 days but less than 180 daysDoubtful Interest and/or principal overdue by 180 days but less than 365 days
Incremental costs directly attributable to the issue of an equity instrument are deducted from the initial measurement of the equity instruments.
Dividends on ordinary shares are recognised in equity in the year when approved by the Bank’s shareholders. Dividends for the year that are declared after the end of the reportingyear are dealt with in the subsequent events note.
Where the Bank or any member of the Group purchases the Bank’s share capital, the consideration paid is deducted from the shareholders’ equity as treasury shares until they arecancelled or disposed. Where such shares are subsequently sold or reissued, any consideration received is included in shareholders’ equity.
The Group presents basic and diluted earnings per share (EPS) for its ordinary shares. Basic EPS is calculated by dividing the profit and loss attributable to ordinary shareholdersof the Bank by the weighted average number of ordinary shares outstanding during the year. Diluted EPS is determined by adjusting the profit or loss attributable to ordinaryshareholders and the weighted average number of ordinary shares outstanding for the effects of all dilutive potential ordinary shares.
In compliance with the Prudential Guidelines for Licensed Banks, the Group assesses qualifying financial assets using the guidance under the Prudential Guidelines. Theguidelines apply objective and subjective criteria towards providing losses in risk assets. Assets are classified as performing or non- performing. Non performing assets are furtherclassed as substandard, doubtful or lost with attendant provisions.
Classification Basis
Access Bank Plc applies hedge accounting to manage its foreign exchange risk
79

Access Bank Plc Consolidated and separate financial statements For the year ended 31 December 2020
Derivatives are initially recognised at fair value on the date a derivative contract is entered into, and they are subsequently remeasured to their fair value at the end of eachreporting period. The accounting for subsequent changes in fair value depends on whether the derivative is designated as a hedging instrument and, if so, the nature of the itembeing hedged. The Bank designates certain derivatives as hedges of the fair value of recognised liabilities (fair value hedges).
At inception of the hedge relationship, the Bank documents the economic relationship between hedging instruments and hedged items, including whether changes in thefairvalue of the hedging instruments are expected to offset changes in the fair value of hedged items. The Bank documents its risk management objective and strategy forundertaking its hedge transactions. The Bank uses the actual ratio between the hedged item and hedging instruments to determine its hedge ratio.
The fair values of derivative financial instruments designated in hedge relationships are disclosed in note 12. The full fair value of a hedging derivative is classified as a non-current asset or liability when the remaining maturity is more than 12 months; it is classified as a current asset or liability when the remaining maturity is less than 12 months.Trading derivatives are classified as a current asset or liability.
Changes in the fair value of derivatives that are designated and qualify as fair value hedges are recorded in profit or loss, together with any changes in the fair value of thehedged asset or liability that are attributable to the hedged risk.The Bank uses forward contracts to hedge the fair value changes attributable to foreign exchange risk on thehedged item. The Bank generally designates only the change in fair value of the forward contract related to the spot component as the hedging instrument. The change in theforward element of the forward contract is not part of the hedging relationship and is recognised separately in the statement of profit or loss within Net gain on financialinstruments at fair value through profit or loss. Gains or losses relating to the effective portion of the change in the spot component of the forward contracts are recognised inthe profit or loss within Net Foreign Exchange Gain/(Loss) together with the changes in the fair value of the hedged liabilities attributable to foreign exchange risk while thegains or losses relating to the ineffective portion are recognised within Net loss on fair value hedge (Hedging ineffectiveness) in the profit or loss.
Hedge effectiveness
The Bank determines hedge effectiveness is at the inception of the hedge relationship, and through periodic prospective effectiveness assessments, to ensure that an economicrelationship exists between the hedged item and hedging instrument
Derivatives that do not qualify for hedge accounting
Certain derivative instruments do not qualify for hedge accounting. Changes in the fair value of any derivative instrument that does not qualify for hedge accounting arerecognised immediately in profit or loss and are included in Net gain on financial instruments at fair value through profit or loss.
80

Access Bank Plc Consolidated and separate financial statements For the year ended 31 December 2020
81

Access Bank Plc Consolidated and separate financial statements For the year ended 31 December 2020
4.0 Use of estimates and judgements
Key sources of estimation uncertainty
(i) Allowances for credit losses
xii) Determination of intangible assets arising on business combination
ix) Impairment of intangible assets
i) Allowance for credit losses
ii) Assessment of impairment on goodwill on acquired subsidiaries
iii) Defined benefit plan
iv) Valuation of unquoted equities
These disclosures supplement the commentary on financial risk management (see note 5). Estimates where management has applied judgements are:
v) Valuation of derivatives
vi) Depreciation of property and equipment
vii) Amortisation of intangible assets
viii) Impairment of property and equipment
x) Litigations claims provisions
xi) Equity settled share-based payment
Management has assessed the first four estimates as having the key sources of estimation certainty, and are explained in further detail below. The other estimates have been assessed in theirindividual accounting policies.
The measurement of impairment losses both under IFRS 9 across all categories of financial assets requires judgement, in particular, the estimation of the amount and timing of future cashflows and collateral values when determining impairment losses and the assessment of a significant increase in credit risk. These estimates are driven by a number of factors, changes in whichcan result in different levels of allowances.The Group’s ECL calculations are outputs of complex models with a number of underlying assumptions regarding the choice of variable inputs and their interdependencies. Elements of theECL models that are considered accounting judgements and estimates include:• The Group’s internal credit grading model, which assigns PDs to the individual grades• The Group’s criteria for assessing if there has been a significant increase in credit risk and so allowances for financial assets should be measured on a LTECL basis and the qualitativeassessment• The segmentation of financial assets when their ECL is assessed on a collective basis• Development of ECL models, including the various formulas and the choice of inputs• Determination of associations between macroeconomic scenarios and, economic inputs, such as unemployment levels, exchange rates, crude oil prices, GDP and collateral values, and theeffect on PDs, EADs and LGDs • Selection of forward-looking macroeconomic scenarios and their probability weightings, to derive the economic inputs into the ECL models.It has been the Group’s policy to regularly review its models in the context of actual loss experience and adjust when necessary.
The standard requires recognition of an impairment allowance on financial instruments, based on 12 months or lifetime expected credit losses. The ECL calculations are based on thecomponents discussed in the previous sections. IFRS 9 requires the calculation of probability-weighted ECL impairments. Three ECL figures were therefore calculated for each account (optimistic, best-estimate and downturn ECLs) andprobability-weighted to arrive at a single ECL impairment for each account. The likelihood of the best-estimate, downturn and optimistic scenarios were assumed to be 75%, 13.9% and 11%respectively. The EIR, as provided by the Bank, is used to discount all ECLs to the reporting date. For accounts with no EIR information, the balance-weighted average EIR across all accounts, split byportfolio, is used as a proxy. The method followed for accounts classified as Stage 1, Stage 2 or Stage 3 are set out below; Stage 1Account-level ECL figures are calculated projecting monthly expected losses for the next 12-months of each account. The forward, macro-adjusted monthly PDs are applied to the applicableLGD estimate and EAD or the collateral adjusted EAD (if secured) at the start of each month.
Loans and advances to banks and customers are accounted for at amortised cost and are evaluated for impairment on a basis described in accounting policy (see note 3.9)
The Bank reviews its loan portfolios to assess impairment at least on a half yearly basis. In determining whether an impairment loss should be recorded in the income statement, the Bankmakes judgements as to whether there is any observable data indicating a significant increase in credit risk followed by measurable decrease in the estimated future cash flows from a portfolioof loans before the decrease can be identified with that portfolio. This evidence may include observable data indicating that there has been an adverse change in the payment status ofborrowers in a bank, or national or local economic conditions that correlate with defaults on assets in the Bank.
The Bank makes use of estimates based on historical loss experience for assets with credit risk characteristics and objective evidence of impairment similar to those in the portfolio whenscheduling future cash flows. The methodology and assumptions used for estimating both the amount and timing of future cash flows are reviewed regularly to reduce any differences betweenloss estimates and actual loss experience.
The specific component of the total allowances for impairment applies to financial assets evaluated individually for impairment and is based upon management’s best estimate of the presentvalue of the cash flows that are expected to be received. In estimating these cash flows, management makes judgements about a debtor’s financial situation and the net realisable value of anyunderlying collateral. Each impaired asset is assessed on its merits, and the workout strategy and estimate of cash flows considered recoverable are independently reviewed by the Credit RiskManagement Department (CRMD).
Stage 2Account-level ECL figures are calculated projecting monthly expected losses for the remaining lifetime of each account. The forward, macro-adjusted monthly PDs are applied to theapplicable LGD estimate and the EAD or collateral adjusted EAD (if secured) at the start of each month. Stage 3For the purposes of this model, account-level ECL figures are calculated by applying the applicable LGD estimate to the balance as at the reporting date The final ECL impairment is calculated as the probability-weighted average of the ECLs produced for the three macro-economic scenarios.
82

Access Bank Plc Consolidated and separate financial statements For the year ended 31 December 2020
The specific component of the total allowances for impairment applies to financial assets evaluated individually for impairment and is based upon management’s best estimate of the presentvalue of the cash flows that are expected to be received. In estimating these cash flows, management makes judgements about a debtor’s financial situation and the net realisable value of anyunderlying collateral. Each impaired asset is assessed on its merits, and the workout strategy and estimate of cash flows considered recoverable are independently reviewed by the Credit RiskManagement Department (CRMD).
A collective component of the total allowance is established for:• Groups of homogeneous loans that are not considered individually significant and• Groups of assets that are individually significant but were not found to be individually impaired
Collective allowance for groups of homogeneous loans is established using statistical modelling of historical trends of the probability of default, timing of recoveries and the amount of lossincurred, adjusted for management’s judgement as to whether current economic and credit conditions are such that the actual losses are likely to be greater or less than suggested by historical modelling. Default rates, loss rates and the expected timing of future recoveries are regularly benchmarked against actual outcomes to ensure that they remain appropriate.
83

Access Bank Plc Consolidated and separate financial statements For the year ended 31 December 2020
(ia) Sensitivity of Exposure at default - Probability of Default (PD) & Loss Given Default (LGD)
Loans and Advances To Customers
On balance Sheet Exposure
-10% +10%
-5,173,106 4,670,521
-10% +10%
29% -2.12%
Off balance Sheet Exposure
-10% +10%
-552,406 466,307
P & L Impact of change in
Macroeconomic variables
The table below outlines the total ECL for wholesale off balance sheet exposures as at 31 December 2020, if the assumptions used to measure ECL remain as expected (amount as presented inthe statement of financial position), as well as if each of the key assumptions used change by plus or minus 10%. The responsiveness of the ECL estimates to variation in macroeconomicvariables have been presented below while putting in perspective, interdependencies between the various economic inputs.
The table below outlines the total ECL for wholesale portfolios as at 31 December 2020, if each of the key assumptions used change by plus or minus 10%. The responsiveness of the ECLestimates to variation in macroeconomic variables have been presented below while putting in perspective, interdependencies between the various economic inputs. An increase in Oil Price by10% resulting in GDP increase and decrease in both inflation rate and exchange rate will lead to an improvement in asset quality by 2.12% and a reduction in impairment by 4.21%. While adrop in Oil Price by 10% leads to a drop in GDP and an increase in inflation and Exchange rate, this will result in a deterioration in asset quality by 29% and an increase in impairment by4.48%.
In establishing sensitivity to ECL estimates for corporate loans, four variables (GDP growth rate, Crude Oil Price, Inflation and US exchange rate were considered). Of this variables, the bank'scorporate loans reflects greater responsiveness to GDP growth rate and crude oil price
P & L Impact of change in
Macroeconomic variables
A collective component of the total allowance is established for:• Groups of homogeneous loans that are not considered individually significant and• Groups of assets that are individually significant but were not found to be individually impaired
Collective allowance for groups of homogeneous loans is established using statistical modelling of historical trends of the probability of default, timing of recoveries and the amount of lossincurred, adjusted for management’s judgement as to whether current economic and credit conditions are such that the actual losses are likely to be greater or less than suggested by historical modelling. Default rates, loss rates and the expected timing of future recoveries are regularly benchmarked against actual outcomes to ensure that they remain appropriate.
Collective allowance for group of assets that are individually significant but that were not found to be individually impaired cover credit losses inherent in portfolios of loans and advances andheld to maturity investment securities with similar credit characteristics when there is objective evidence to suggest that they contain impaired loans and advances and held to maturityinvestment securities, but the individual impaired items cannot yet be identified. In assessing the need for collective loan loss allowances, management considers factors such as credit quality,portfolio size, concentrations, and economic factors. In order to estimate the required allowance, assumptions are made to define the way inherent losses are modelled and to determine therequired input parameters, based on historical experience and current economic conditions. The accuracy of the allowances depends on estimates of future cash flows for specific counterpartyallowances and the model assumptions and parameters used in determining collective allowances are estimated.
GDP growth rate : Given the signficant impact on companies performance and collateral valuations
Oil price : Given it impacts on purchasing power, demand as well as overall health of the economy
GDP growth rate : Given the signficant impact on companies performance and collateral valuations
Oil price : Given it impacts on purchasing power, demand as well as overall health of the economy
Asset Quality Impact of change
in Macroeconomic
variables
84

Access Bank Plc Consolidated and separate financial statements For the year ended 31 December 2020
Group Group Group Group
December 2020 December 2019 December 2020 December 2019
Impact on Profit before tax
Increase in LGD and PD by 2% (2,181,426) (4,538,702) (1,885,958) (3,814,035)
Decrease in LGDs and PD by 2% 1,977,806 2,571,839 1,868,260 2,296,284
Increase in LGDs and PD by 10% (9,979,092) (9,906,466) (9,603,982) (8,743,571)
Decrease in LGDs and PD by 10% 10,237,216 17,737,650 9,161,408 14,247,109
-10% +10%
-5,173,106 4,670,521
Statement of prudential adjustments
a)
b)
Statement of prudential adjustments December 2020 December 2019
In thousands of Naira
Bank Note
Loans & advances:
Expected credit loss (ECL) on loans to customers and banks
- Loans to banks 22 298,622 1,361,987
- Loans to individuals 23(b) 2,831,595 4,776,944
- Loans to corporate 23(b) 116,210,945 176,222,475
Total impairment allowances on loans per IFRS 119,341,162 182,361,406
Total regulatory impairment based on prudential guidelines 155,521,746 191,844,406
Balance, beginning of the year 9,483,000 9,483,000
Additional transfers to/(from) regulatory risk reserve 26,697,585 -
Balance, end of the year 36,180,585 9,483,000
(ii)
Loans and advances to individuals
The Central Bank of Nigeria (CBN) via its circular BSD/DIR/GEN/LAB/08/052 issued on 11 November 2015, directed banks in Nigeria to increase the general provision on performing loansfrom 1 percent to 2 percent for prudential review of credit portfolios in order to ensure adequate buffer against unexpected loan losses.
P & L Impact of change in
Macroeconomic variables
• Prudential Provisions is less than IFRS provisions; IFRS determined provision is charged to the statement of comprehensive income. The cumulative balance in the regulatory riskreserve is thereafter reversed to the general reserve account
• Prudential Provisions is greater than IFRS provisions; the excess provision resulting should be transferred from the general reserve account to a "regulatory risk reserve".
The non-distributable reserve should be classified under Tier 1 as part of the core capital.
The Bank has complied with the requirements of the guidelines as follows:
Assessment of impairment of goodwill on acquired subsidiariesGoodwill on acquired subsidiaries was tested for impairment using discounted cash flow valuation method. Projected cash flows were discounted to present value using a discount rate of23.3% (Dec. 2019: 23.3%) and a cash flow growth rate of 7.095% (Dec. 2019: 7.095%) over a period of ten years. The Group determined the appropriate discount rate at the end of the yearusing the adjusted weighted average cost of capital method. See note 29b for further details.
If the PDs and LGDs were increased by 2%, impairment charge would have further increased by N2.18BN but if the PDs and LGDs were decreased by 2%, there would have been a write backof impairment of N1.98BN.
Provisions under prudential guidelines are determined using the time based provisioning regime prescribed by the Revised Central Bank of Nigeria (CBN) Prudential Guidelines. This is atvariance with the expected credit loss model required by IFRS 9. As a result of the differences in the methodology/provision regime, there will be variances in the impairments allowancesrequired under the two methodologies.
Paragraph 12.4 of the revised Prudential Guidelines for Deposit Money Banks in Nigeria stipulates that Banks would be required to make provisions for loans as prescribed in the relevantIFRS Standards when IFRS is adopted. However, Banks would be required to comply with the following:
Provisions for loans recognised in the profit and loss account should be determined based on the requirements of IFRS. However, the IFRS provision should be compared withprovisions determined under prudential guidelines and the expected impact/changes in general reserves should be treated as follows:
Loans and advances to corporates
85

Access Bank Plc Consolidated and separate financial statements For the year ended 31 December 2020
(iii) Defined benefit plan
(iv) Valuation technique unquoted equity:
Description of valuation methodology and inputs:
a. Enterprise Value (EV):
b. Earnings Before Interest ,Tax Depreciation and Tax (EBITDA ):
c. Price to Book (P/B Ratio):
b. Price to Earning (P/E Ratio):
Valuation Assumptions :
Basis of valuation:
Method of Valuation
4.1 Valuation of financial instruments
The table below analyses financial and non-financial instruments measured at fair value at the end of the financial year, by the level in the fair value hierarchy into which the fair valuemeasurement is categorised:
Step 3: Derive the average or median of EV/EBITDA or the P/B or P/E ratios of these identified quoted companies
The comparative method of valuation is used in the valuation of the asset. This method involves the analysis of recent transaction in such asset within the same asset type and the size of thesubject asset after due allowance have been made for peculiar attributes of the various asset concerned.
The assets is being valued on a fair open market value approach. This implies that the value is based on the conservative estimates of the reasonable price that can be obtained if and when thesubject asset is offered for sale under the present market conditions.
The sources of the observable inputs used for comparable technique were gotten from Reuters, Bloomberg and the Nigeria Stock Exchange
Enterprise value measures the value of the ongoing operations of a company. It is calculated as the market capitalization plus debt, minority interest and preferred shares, minus total cashand cash equivalents of the company.
Step 2: Obtain the EV/EBITDA or the P/B or P/E ratios of these quoted companies identified from Bloomberg, Reuters or Nigeria Stock Exchange
The present value of the long term incentive plan depends on a number of factors that are determined in an actuarial basis using a number of assumptions. Any changes in these assumptionswill impact the carrying amount of obligations. The assumptions used in determining the net cost (income) for pensions include the discount rate. The Group determines the appropriatediscount rate at the end of the year. In determining the appropriate discount rate, reference is made to the yield on Nigerian Government Bonds that have maturity dates approximating theterms of the related pension liability. Other key assumptions for pension obligations are based in part on current market conditions. See note 37 for the sensitivity analysis.
The investment valuation policy (IVP) of the Group provides the framework for accounting for the Group’s investment in unquoted equity securities while also providing a broad valuationguideline to be adopted in valuing them. Furthermore, the IVP details how the group decides its valuation policies and procedures and analysis of changes in fair value measurements fromyear to year.
The key elements of the control framework for the valuation of financial instruments include model validation and independent price verification. These functions are carried out by anappropriately skilled Finance team, independent of the business area responsible for the products. The result of the valuation are reviewed quarterly by senior management.
ii. EPS Hair cut "emerging market" discount of 40% to take care of inflation and exchange rate impact being that the comparable companies are in foreign countries
Step 6: Multiply the adjusted equity value by the present exchange rate for foreign currency investment
Step 7: Compare the Adjusted Equity value with the carrying value of the investment company to arrive at a net gain or loss
Step 5: Discount the derived value of the investment company by applying an Illiquidity discount and size adjustment/haircut to obtain the Adjusted Equity Value
Step 4: Apply the lower of average (mean) or median of the identified quoted companies ratios on the Book Value or Earnings of the investment company to get the value of the investment company
EBITDA = Operating Profit + Depreciation Expense + Amortization Expense
EBITDA is earnings before interest, taxes, depreciation and amortization. EBITDA is one of the indicator's of a company's financial performance and is used as a proxy for the earning potential of a business.
The price-to-book ratio (P/B Ratio) is used to compare a stock's market value to its book value. It is calculated by dividing the current closing price of the stock by the latest company book value per share or by dividing the company's market capitalization by the company's total book value from its balance sheet.
The price-earnings ratio (P/E Ratio) values a company using the current share price relative to its per-share earnings.
i. Illiquidity discount of 25% is used to discount the value of the investments that are not tradable
Step 1:Identify quoted companies with similar line of business ,structure and size
In accordance with IFRS 13 fair value measurement, which outlines three approaches for valuing unquoted equity instruments; market approach, the income approach and the cost approach.The Group estimated the fair value of its investment in each of the unquoted equity securities at the end of the financial year using the market approach.
The adjusted fair value comparison approach of EV/EBITDA, P/E ratios and P/Bv ratios was adopted in valuing each of these equity investments taken into cognizance the suitability of themodel to each equity investment and the availability of financial information while minimizing the use of unobservable data.
The fair value of the other unquoted equity securities were derived using the Adjusted fair value comparison technique. Adjusted fair value comparison approach of EV/EBITDA, P/E ratiosand P/B ratios are used as input data .
The steps involved in estimating the fair value of the Group’s investment in each of the investees (i.e. unquoted equity securities) are as follows:
86

Access Bank Plc Consolidated and separate financial statements For the year ended 31 December 2020
4.1.1 Recurring fair value measurements
In thousands of Naira
Group
December 2020
Level 1 Level 2 Level 3 Total
Assets
Investment under management
Government bonds 3,882,771 - - 3,882,771
Placements - - 6,386,464 6,386,464
Commercial paper - 4,132,806 - 4,132,806
Treasury bills 6,156,666 - - 6,156,666
Mutual funds - 7,109,072 - 7,109,072
Eurobonds - 2,783,687 - 2,783,687
Non pledged trading assets
Treasury bills 116,036,126 - - 116,036,126
Government Bonds 91,841,202 - - 91,841,202
Eurobonds - 74,615 - 74,615
Equity - - - -
Derivative financial instrument - 251,112,744 - 251,112,744
Pledged assets
-Financial instruments at FVOCI
Treasury bills 999,521 - - 999,521
Government Bonds 2,617,080 - - 2,617,080
-Financial instruments at FVPL
Treasury bills 85,006,604 - - 85,006,604
Government Bonds - - - -
Investment securities
-Financial assets at FVOCI
Treasury bills 748,230,225 - - 748,230,225
Government Bonds 150,094,494 - - 150,094,494
State government bonds - 31,741,795 - 31,741,795
Corporate bonds - 15,745,714 - 15,745,714
Eurobonds - 22,032,870 - 22,032,870
Promissory notes - 80,033,790 - 80,033,790
-Financial assets at FVPL -
Equity 534,682 3,656,260 137,574,634 141,765,576
Assets held for sale - - 28,318,467 28,318,467
1,205,399,371 418,423,354 172,279,565 1,796,102,291
Liabilities
Derivative financial instrument - 20,880,529 - 20,880,529
- 20,880,529 - 20,880,529
87

Access Bank Plc Consolidated and separate financial statements For the year ended 31 December 2020
Group
December 2019
Level 1 Level 2 Level 3 Total
Assets
Investment under management
Government bonds 2,054,650 - - 2,054,650
Placements - - 9,779,427 9,779,427
Commercial paper - 6,849,720 - 6,849,720
Nigerian Treasury bills 4,280,814 - - 4,280,814
Mutual funds - 2,889,702 - 2,889,702
Eurobonds - 2,437,646 - 2,437,646
Non pledged trading assets
Treasury bills 89,797,961 - - 89,797,961
Government Bonds 40,021,277 - - 40,021,277
Eurobonds - - - -
Equity - - - -
Derivative financial instrument - 143,520,553 - 143,520,553
Pledged assets
-Financial instruments at FVOCI
Treasury bills 30,388,532 - - 30,388,532
Government Bonds - - - -
-Financial instruments at FVPL
Treasury bills 39,881,494 - - 39,881,494
Government Bonds - - - -
Investment securities
-Financial assets at FVOCI
Treasury bills 232,813,374 - - 232,813,374
Government Bonds 64,989,934 - - 64,989,934
State government bonds - 6,311,454 - 6,311,454
Corporate bonds - 7,815,595 - 7,815,595
Eurobonds - 2,860,694 - 2,860,694
Promissory notes - 807,619 - 807,619
-Financial assets at FVPL
Equity 598,936 990,127 111,569,257 113,158,320
Assets held for sale - - 24,957,519 24,957,519
504,826,972 174,483,110 146,306,203 825,616,285
Liabilities
Derivative financial instrument - 6,885,680 - 6,885,680
- 6,885,680 - 6,885,680
Bank
December 2020
In thousands of Naira
Level 1 Level 2 Level 3 Total
Assets
Investment under management
Government bonds 3,882,771 - - 3,882,771
Placements - - 6,386,464 6,386,464
Commercial paper - 4,132,806 - 4,132,806
Nigerian Treasury bills 6,156,666 - - 6,156,666
Mutual funds - 7,109,072 - 7,109,072
Eurobonds - 2,783,687 - 2,783,687
Non pledged trading assets
Treasury bills 97,719,848 - - 97,719,848
Government Bonds 12,488,649 - - 12,488,649
Eurobonds - 74,615 74,615
Equity - - - -
Derivative financial instrument - 244,564,046 - 244,564,046
Pledged assets
-Financial instruments at FVOCI
Treasury bills 999,521 - - 999,521
Government Bonds 2,617,080 - - 2,617,080
-Financial instruments at FVPL
Treasury bills 85,006,603 - - 85,006,603
Government Bonds - - - -
Investment securities
-Financial assets at FVOCI
Treasury bills 608,866,687 - - 608,866,687
Government Bonds 44,296,019 - - 44,296,019
State government bonds - 31,741,795 - 31,741,794
Corporate bonds - 15,745,714 - 15,745,714
Eurobonds - 15,141,127 - 15,141,127
Promissory notes - 80,033,790 - 80,033,790
-Financial assets at FVPL
Equity 534,682 3,656,260 137,544,111 141,735,053
Asset held for sale - - 28,128,467 28,128,467
862,568,526 404,982,913 172,059,042 1,439,610,480
Liabilities
Derivative financial instrument - 20,775,722 - 20,775,722
- 20,775,722 - 20,775,722
88
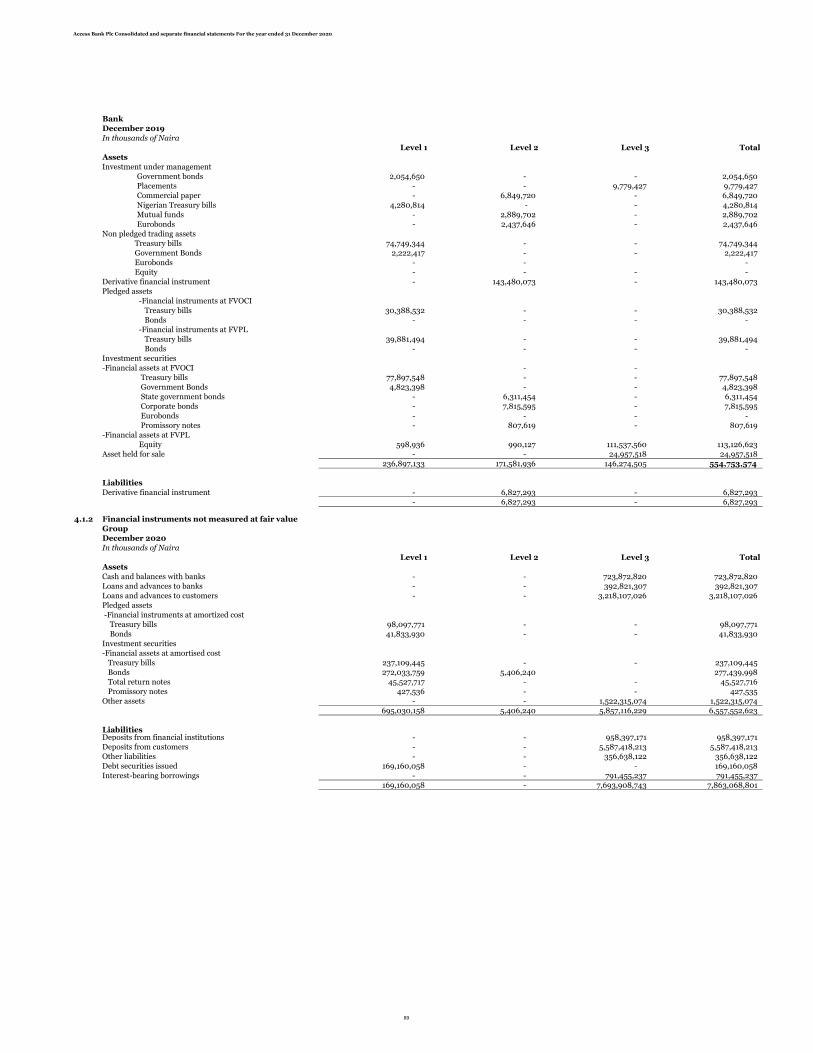
Access Bank Plc Consolidated and separate financial statements For the year ended 31 December 2020
Bank
December 2019
In thousands of Naira
Level 1 Level 2 Level 3 Total
Assets
Investment under management
Government bonds 2,054,650 - - 2,054,650
Placements - - 9,779,427 9,779,427
Commercial paper - 6,849,720 - 6,849,720
Nigerian Treasury bills 4,280,814 - - 4,280,814
Mutual funds - 2,889,702 - 2,889,702
Eurobonds - 2,437,646 - 2,437,646
Non pledged trading assets
Treasury bills 74,749,344 - - 74,749,344
Government Bonds 2,222,417 - - 2,222,417
Eurobonds - - -
Equity - - - -
Derivative financial instrument - 143,480,073 - 143,480,073
Pledged assets
-Financial instruments at FVOCI
Treasury bills 30,388,532 - - 30,388,532
Bonds - - - -
-Financial instruments at FVPL
Treasury bills 39,881,494 - - 39,881,494
Bonds - - - -
Investment securities
-Financial assets at FVOCI - -
Treasury bills 77,897,548 - - 77,897,548
Government Bonds 4,823,398 - - 4,823,398
State government bonds - 6,311,454 - 6,311,454
Corporate bonds - 7,815,595 - 7,815,595
Eurobonds - - - -
Promissory notes - 807,619 - 807,619
-Financial assets at FVPL
Equity 598,936 990,127 111,537,560 113,126,623
Asset held for sale - - 24,957,518 24,957,518
236,897,133 171,581,936 146,274,505 554,753,574
Liabilities
Derivative financial instrument - 6,827,293 - 6,827,293
- 6,827,293 - 6,827,293
4.1.2 Financial instruments not measured at fair value
Group
December 2020
In thousands of Naira
Level 1 Level 2 Level 3 Total
Assets
Cash and balances with banks - - 723,872,820 723,872,820
Loans and advances to banks - - 392,821,307 392,821,307
- - 3,218,107,026 3,218,107,026
Pledged assets
-Financial instruments at amortized cost
Treasury bills 98,097,771 - - 98,097,771
Bonds 41,833,930 - - 41,833,930
Investment securities
-Financial assets at amortised cost
Treasury bills 237,109,445 - - 237,109,445
Bonds 272,033,759 5,406,240 277,439,998
Total return notes 45,527,717 - - 45,527,716
Promissory notes 427,536 - - 427,535
Other assets - - 1,522,315,074 1,522,315,074
695,030,158 5,406,240 5,857,116,229 6,557,552,623
LiabilitiesDeposits from financial institutions - - 958,397,171 958,397,171
Deposits from customers - - 5,587,418,213 5,587,418,213
Other liabilities - - 356,638,122 356,638,122
Debt securities issued 169,160,058 - - 169,160,058
Interest-bearing borrowings - - 791,455,237 791,455,237
169,160,058 - 7,693,908,743 7,863,068,801
Loans and advances to customers
89

Access Bank Plc Consolidated and separate financial statements For the year ended 31 December 2020
Group
December 2019
In thousands of Naira
Level 1 Level 2 Level 3 Total
Assets
Cash and balances with banks - - 723,064,003 723,064,003
Loans and advances to banks - - 152,825,081 152,825,081
- - 2,911,579,708 2,911,579,708
Pledged assets
-Financial instruments at amortized cost
Treasury bills 452,686,283 - - 452,686,283
Bonds 82,599,583 - - 82,599,583
Investment securities -
-Financial assets at amortised cost
Treasury bills 379,283,381 - - 379,283,381
Bonds 256,532,576 9,746,421 266,278,996
Other assets - - 1,016,582,843 1,016,582,843
1,171,101,823 9,746,421 4,804,051,635 5,984,899,876
Level 1 Level 2 Level 3 Total
Liabilities
Deposits from financial institutions - - 1,186,356,312 1,186,356,312
Deposits from customers - - 4,255,837,303 4,255,837,303
Other liabilities - - 315,626,032 315,626,032
Debt securities issued 126,360,001 - - 126,360,001
Interest-bearing borrowings - - 586,602,830 586,602,830
126,360,001 - 6,344,422,477 6,470,782,478
Bank
December 2020
In thousands of Naira
Level 1 Level 2 Level 3 Total
Assets
Cash and balances with banks - - 589,812,439 589,812,439
Loans and advances to banks - - 231,788,276 231,788,276
- - 2,818,875,731 2,818,875,731
Pledged assets
-Financial instruments at amortized cost
Treasury bills 98,097,771 - - 98,097,771
Bonds 41,833,930 - - 41,833,930
Investment securities
Financial assets at amortised cost
Treasury bills 194,302,056 - - 194,302,056
Bonds 244,815,922 5,406,240 - 250,222,163
Total return notes 45,527,717 - - 45,527,717
Promissory notes 427,537 - - 427,537
Other Assets - - 1,471,481,476 1,471,481,476
625,004,936 5,406,240 5,111,957,922 5,742,369,097
Liabilities
Deposits from financial institutions - - - -
Deposits from customers - - - -
Other liabilities - - 322,955,917 322,955,917
Debt securities issued 169,160,058 - 169,160,058
Interest-bearing borrowings - - 755,254,273 755,254,273
169,160,058 - 1,078,210,190 1,247,370,247
Bank
December 2019
In thousands of Naira
Level 1 Level 2 Level 3 Total
Assets
Cash and balances with banks - - 575,906,273 575,906,273
Loans and advances to banks - - 164,413,001 164,413,001
- - 2,481,623,671 2,481,623,671
Pledged assets
-Financial instruments at amortized cost
Treasury bills 452,686,282 - - 452,686,282
Bonds 82,599,583 - - 82,599,583
Investment securities
Financial assets at amortised cost
Treasury bills 341,786,029 - - 341,786,029
Bonds 241,082,412 9,746,421 - 250,828,832
Other Assets - - 968,698,629 968,698,629
1,118,154,307 9,746,421 4,190,641,574 5,318,542,301
Liabilities
Deposits from financial institutions - - 1,079,284,414 1,079,284,414
Deposits from customers - - 3,668,339,811 3,668,339,811
Other liabilities - - 295,184,124 295,184,124
Debt securities issued 126,360,001 - 126,360,001
Interest-bearing borrowings - - 544,064,226 544,064,226
126,360,001 - 5,586,872,575 5,713,232,576
Loans and advances to customers
Loans and advances to customers
Loans and advances to customers
90

Access Bank Plc Consolidated and separate financial statements For the year ended 31 December 2020
Financial instrument measured at fair value
(a) Financial instruments in level 1
(b) Financial instruments in level 2
(c) Financial instruments in level 3
For level 2 assets, fair value was obtained using a recent market transaction during the year under review. Fair values of unquoted debt securities were derived by interpolating prices ofquoted debt securities with similar maturity profile and characteristics. There were transfers between levels 1 and 2 during the year on investment under management because theinstruments involved are government securities with readily determinable price and they are risk free.
The Group uses widely recognised valuation models for determining the fair value of its financial assets. Valuation techniques include net present value and discounted cash flow models,comparison with similar instruments for which market observable prices exist and other valuation models. Assumptions and inputs used in valuation techniques include risk-free andbenchmark interest rates, credit spreads and other premia used in estimating discount rates, bond and equity prices, foreign currency exchange rates, equity and equity index prices andexpected price volatilities and correlations. The objective of valuation techniques is to arrive at a fair value measurement that reflects the price that would be received to sell the asset or paidto transfer the liability in an orderly transaction between market participants at the measurement date.
The fair value of financial instruments traded in active markets is based on quoted market prices at the balance sheet date. A market is regarded as active if quoted prices are readily andregularly available from an exchange, dealer, broker, industry group, pricing service, or regulatory agency, and those prices represent actual and regularly occurring market transactions on anarm’s length basis. The quoted market price used for financial assets held by the group is the current bid price. These instruments are included in Level 1. Instruments included in Level 1comprise primarily government bonds, corporate bonds, treasury bills and equity investments classified as trading securities or available for sale investments.
The fair value of financial instruments that are not traded in an active market are determined by using valuation techniques. These valuation techniques maximise the use of observablemarket data where it is available and rely as little as possible on entity specific estimates. If all significant inputs required to fair value an instrument are observable, the instrument is includedin level 2.
If one or more of the significant inputs is not based on observable market data, the instrument is included in Level 3. Specific valuation techniques used to value financial instruments include:(i) Quoted market prices or dealer quotes for similar instruments;(ii) The fair value of forward foreign exchange contracts is determined using forward exchange rates at the balance sheet date, with the resulting value discounted back to present value;(iii) Other techniques, such as discounted cash flow analysis, are used to determine fair value for the remaining financial instruments.
For more complex instruments, the Group uses proprietary valuation models, which are usually developed from recognised valuation models. Some or all of the significant inputs into thesemodels may not be observable in the market, and are derived from market prices or rates or are estimated based on assumptions. Examples of instruments involving significant unobservableinputs include certain Investment securities for which there is no active market. Valuation models that employ significant unobservable inputs require a higher degree of managementjudgement and estimation in the determination of fair value. Management judgement and estimation are usually required for selection of the appropriate valuation model to be used,determination of expected future cash flows on the financial instrument being valued, determination of the probability of counterparty default and prepayments and selection of appropriatediscount rates. Fair value estimates obtained from models are adjusted for any other factors, such as liquidity risk or model uncertainties, to the extent that the Group believes that a thirdparty market participant would take them into account in pricing a transaction. Fair values reflect the credit risk of the instrument and include adjustments to take account of the credit risk ofthe Group entity and the counterparty where appropriate.
91

Access Bank Plc Consolidated and separate financial statements For the year ended 31 December 2020
4.1.3Valuation techniques used to derive Level 2 fair values
Description Fair value at 31 December 2020
Fair value if inputs increased by 5%
Fair value if inputs decreased by 5%
Relationship of observable inputs to fair value
Derivative financial assets
244,564,046
Derivative financial liabilities
20,775,722
Investment in CSCS 5,643,750 5,925,938 5,361,563 The higher the share price, the higher the fair value
Nigerian Mortgage Refinance Company
323,333 337,052 304,952 The higher the share price, the higher the fair value
4.1.4Valuation techniques used to derive Level 3 fair values
Description Fair value at 31 December 2020
Valuation Technique
Observable Inputs
Fair value if inputs
increased by 5%
Fair value if inputs decreased by 5%
Fair value if unobservable
inputs increased by 5%
Fair value if unobservable inputs
decreased by 5%
Relationship of unobservable inputs
to fair value
Investment in Africa Finance Corporation
114,520,852 Adjusted fair value comparison approach
Median P/B multiples of comparable companies
120,246,390 108,794,353 110,948,008 110,302,174 The higher the illiquidity ratio, the control premium and the size adjustment/haircut, the higher the fair value
Investment in Unified Payment System Limited
4,058,931 Adjusted fair value comparison approach
Median PE ratios of comparable companies
4,261,878 3,855,985 3,969,341 4,149,516 The higher the illiquidity ratio and the size adjustment/haircut, the lower the fair value
Investment in NIBSS 7,802,112 Adjusted fair value comparison approach
Median P/B multiples of comparable companies
8,192,217 7,412,006 7,629,901 7,976,234 The higher the illiquidity ratio and the size adjustment/haircut, the lower the fair value
Investment in Afrexim
49,851 Adjusted fair value comparison approach
Median P/B multiples of comparable companies
52,343 47,358 18,988 19,445 The higher the illiquidity ratio and the size adjustment/haircut, the lower the fair value
Investment in FMDQ 3,332,927 Adjusted fair value comparison approach
Average P/B multiples of comparable companies
3,499,573 3,166,280 3,301,691 3,451,560 The higher the illiquidity ratio and the earnings per share haircut adjustment the higher the fair value
Investment in CRC Bureau
792,743 Adjusted fair value comparison approach
Median P/B multiples of comparable companies
832,380 753,105 775,245 810,435 The higher the illiquidity ratio and the size adjustment/haircut, the lower the fair value
CAPITAL ALLIANCE EQUITY FUND
4,412,649 Adjusted fair value comparison approach
Median P/B multiples of comparable companies
4,633,282 4,192,017 4,633,282 4,192,017 The higher the illiquidity ratio and the size adjustment/haircut, the lower the fair value
NG Clearing 213,223 Adjusted fair value comparison approach
Median P/B multiples of comparable companies
223,884 202,562 196,487 198,537 The higher the illiquidity ratio and the size adjustment/haircut, the lower the fair value
SANEF 50,000 Adjusted fair value comparison approach
Fair value of transactions at settlement date
52,500 47,500 52,500 47,500 The higher the illiquidity ratio and the size adjustment/haircut, the lower the fair value
(20,706) (20,707) The higher the marketrate, the higher the fairvalue of the derivativefinancial instrument
Observable Inputs
The market value is obtained from the National Assosciation Of
Securities Dealers (NASD) as at the reporting period
Share price from NASD
The market value is obtained from the National Assosciation Of
Securities Dealers (NASD) as at the reporting period
Share price from NASD
Level 2 fair values of investments have been generally derived using the market approach. Below is a table showing sensitivity analysis of material unquoted investments categorised as Level 2 fair values.
Level 3 fair values of investments have been generally derived using the adjusted fair value comparison approach. Quoted price per earning or price per book value, enterprise value to EBITDA ratios of comparableentities in a similar industry were obtained and adjusted for key factors to reflect estimated ratios of the investment being valued. Adjusting factors used are the Illiquidity Discount which assumes a reducedearning on a private entity in comparison to a publicly quoted entity and the Haircut adjustment which assumes a reduced earning for an entity located in Nigeria contributed by lower transaction levels incomparison to an entity in a developed or emerging market.
Valuation Technique
Forward and swap: Fair value through market rate from a quoted marketFutures: Fair value through reference market rate
Market rates from quoted market
92
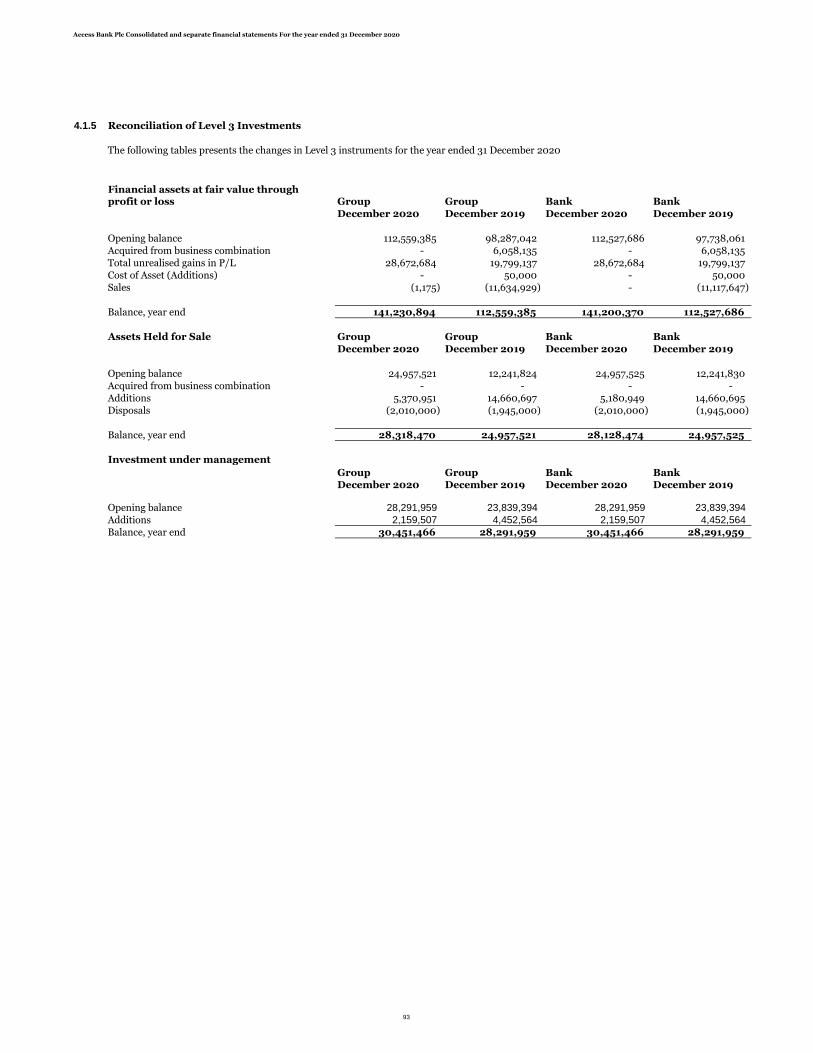
Access Bank Plc Consolidated and separate financial statements For the year ended 31 December 2020
4.1.5 Reconciliation of Level 3 Investments
The following tables presents the changes in Level 3 instruments for the year ended 31 December 2020
Group Group Bank Bank
December 2020 December 2019 December 2020 December 2019
Opening balance 112,559,385 98,287,042 112,527,686 97,738,061
Acquired from business combination - 6,058,135 - 6,058,135
Total unrealised gains in P/L 28,672,684 19,799,137 28,672,684 19,799,137
Cost of Asset (Additions) - 50,000 - 50,000
Sales (1,175) (11,634,929) - (11,117,647)
Balance, year end 141,230,894 112,559,385 141,200,370 112,527,686
Assets Held for Sale Group Group Bank Bank
December 2020 December 2019 December 2020 December 2019
Opening balance 24,957,521 12,241,824 24,957,525 12,241,830
Acquired from business combination - - - -
Additions 5,370,951 14,660,697 5,180,949 14,660,695
Disposals (2,010,000) (1,945,000) (2,010,000) (1,945,000)
Balance, year end 28,318,470 24,957,521 28,128,474 24,957,525
Investment under management
Group Group Bank BankDecember 2020 December 2019 December 2020 December 2019
Opening balance 28,291,959 23,839,394 28,291,959 23,839,394
Additions 2,159,507 4,452,564 2,159,507 4,452,564
Balance, year end 30,451,466 28,291,959 30,451,466 28,291,959
Financial assets at fair value through profit or loss
93

Access Bank Plc Consolidated and separate financial statements For the year ended 31 December 2020
(b) Fair value of financial assets and liabilities not carried at fair value
(i) Cash
(ii) Loans and advances to banks and customers
(iii) Investment securities and pledged assets
(iv) Other assets
(v) Deposits from banks and customers
(vi) Other liabilities
(vii) Interest bearing borrowings
(viii) Debt securities issued
The estimated fair value of floating interest rate debt securities quoted in an active market is basedon the quoted market rates as listed on the irish stock exchange for these debts over their remainingmaturity.
The estimated fair value of deposits with no stated maturity, which includes non-interest bearingdeposits, is the amount repayable on demand. The estimated fair value of fixed interest-bearingdeposits not quoted in an active market is based on discounted cash flows using interest rates fornew debts with similar remaining maturity.
The estimated fair value of fixed interest-bearing borrowings not quoted in an active market is basedon the market rates for similar instruments for these debts over their remaining maturity.
The fair value for financial assets and liabilities that are not carried at fair value were determinedrespectively as follows:
The carrying amount of cash and balances with banks is a reasonable approximation of fair value.
Loans and advances are net of charges for impairment. The estimated fair value of loans andadvances represents the discounted amount of estimated future cash flows expected to be received.Expected cash flows are discounted at current market rates to determine fair value.
The fair values are based on market prices from financial market dealer price quotations. Where thisinformation is not available, fair value is estimated using quoted market prices for securities withsimilar credit, maturity and yield characteristics.
The fair value comprises equity securities and debt instruments. The fair value for these assets arebased on estimations using market prices and earning multiples of quoted securities with similarcharacteristics.
The bulk of these financial assets have short maturities with their amounts of financial assets in is areasonable approximation of fair value.
The carrying amount of financial liabilities in other liabilities is a reasonable approximation of fairvalue. They comprise of short term liabilities which are available on demand to creditors with nocontractual rates attached to them.
94
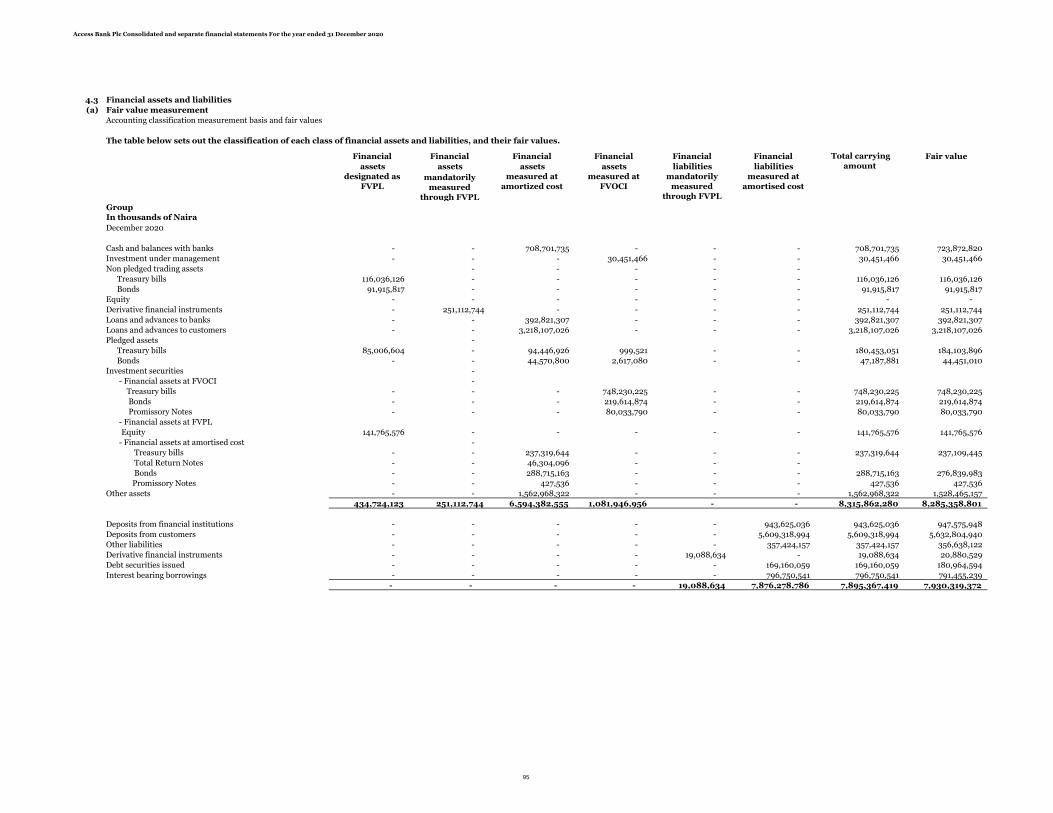
Access Bank Plc Consolidated and separate financial statements For the year ended 31 December 2020
4.3 Financial assets and liabilities
(a) Fair value measurement
Accounting classification measurement basis and fair values
The table below sets out the classification of each class of financial assets and liabilities, and their fair values.
Financial Financial Financial Financial Financial Financial Fair value
assets assets assets assets liabilities liabilitiesdesignated as
FVPLmandatorily
measured through FVPL
measured at amortized cost
measured at FVOCI
mandatorily measured
through FVPL
measured at amortised cost
GroupIn thousands of Naira
December 2020
Cash and balances with banks - - 708,701,735 - - - 708,701,735 723,872,820
Investment under management - - - 30,451,466 - - 30,451,466 30,451,466
Non pledged trading assets - - - - -
Treasury bills 116,036,126 - - - - - 116,036,126 116,036,126
Bonds 91,915,817 - - - - - 91,915,817 91,915,817
Equity - - - - - - - -
Derivative financial instruments - 251,112,744 - - - - 251,112,744 251,112,744
Loans and advances to banks - - 392,821,307 - - - 392,821,307 392,821,307
Loans and advances to customers - - 3,218,107,026 - - - 3,218,107,026 3,218,107,026
Pledged assets -
Treasury bills 85,006,604 - 94,446,926 999,521 - - 180,453,051 184,103,896
Bonds - - 44,570,800 2,617,080 - - 47,187,881 44,451,010
Investment securities -
- Financial assets at FVOCI -
Treasury bills - - - 748,230,225 - - 748,230,225 748,230,225
Bonds - - - 219,614,874 - - 219,614,874 219,614,874
Promissory Notes - - - 80,033,790 - - 80,033,790 80,033,790
- Financial assets at FVPL
Equity 141,765,576 - - - - - 141,765,576 141,765,576
- Financial assets at amortised cost -
Treasury bills - - 237,319,644 - - - 237,319,644 237,109,445
Total Return Notes - - 46,304,096 - - -
Bonds - - 288,715,163 - - - 288,715,163 276,839,983
Promissory Notes - - 427,536 - - - 427,536 427,536
Other assets - - 1,562,968,322 - - - 1,562,968,322 1,528,465,157
434,724,123 251,112,744 6,594,382,555 1,081,946,956 - - 8,315,862,280 8,285,358,801
Deposits from financial institutions - - - - - 943,625,036 943,625,036 947,575,948
Deposits from customers - - - - - 5,609,318,994 5,609,318,994 5,632,804,940
Other liabilities - - - - - 357,424,157 357,424,157 356,638,122
Derivative financial instruments - - - - 19,088,634 - 19,088,634 20,880,529
Debt securities issued - - - - - 169,160,059 169,160,059 180,964,594
Interest bearing borrowings - - - - - 796,750,541 796,750,541 791,455,239
- - - - 19,088,634 7,876,278,786 7,895,367,419 7,930,319,372
Total carrying amount
95
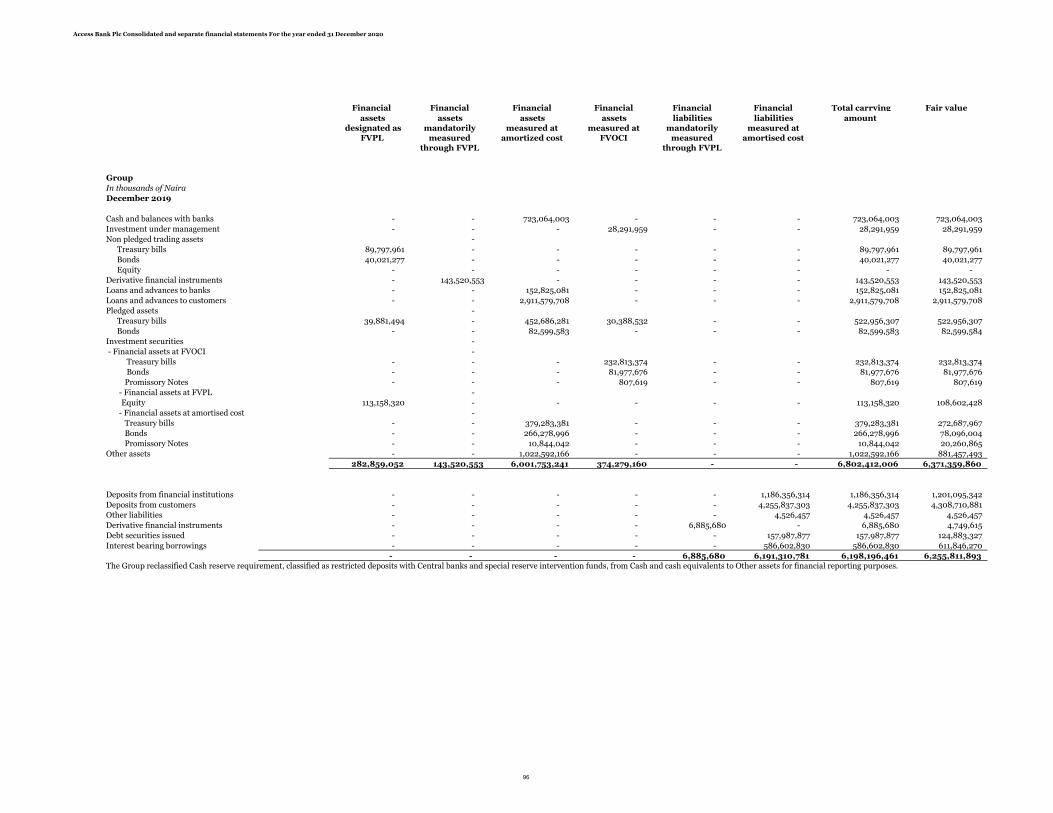
Access Bank Plc Consolidated and separate financial statements For the year ended 31 December 2020
Financial Financial Financial Financial Financial Financial Total carrying Fair value
assets assets assets assets liabilities liabilities amount designated as
FVPL mandatorily
measured through FVPL
measured at amortized cost
measured at FVOCI
mandatorily measured
through FVPL
measured at amortised cost
Group
In thousands of Naira
December 2019
Cash and balances with banks - - 723,064,003 - - - 723,064,003 723,064,003
Investment under management - - - 28,291,959 - - 28,291,959 28,291,959
Non pledged trading assets -
Treasury bills 89,797,961 - - - - - 89,797,961 89,797,961
Bonds 40,021,277 - - - - - 40,021,277 40,021,277
Equity - - - - - - - -
Derivative financial instruments - 143,520,553 - - - - 143,520,553 143,520,553
Loans and advances to banks - - 152,825,081 - - - 152,825,081 152,825,081
Loans and advances to customers - - 2,911,579,708 - - - 2,911,579,708 2,911,579,708
Pledged assets -
Treasury bills 39,881,494 - 452,686,281 30,388,532 - - 522,956,307 522,956,307
Bonds - - 82,599,583 - - - 82,599,583 82,599,584
Investment securities -
- Financial assets at FVOCI -
Treasury bills - - - 232,813,374 - - 232,813,374 232,813,374
Bonds - - - 81,977,676 - - 81,977,676 81,977,676
Promissory Notes - - - 807,619 - - 807,619 807,619
- Financial assets at FVPL -
Equity 113,158,320 - - - - - 113,158,320 108,602,428
- Financial assets at amortised cost -
Treasury bills - - 379,283,381 - - - 379,283,381 272,687,967
Bonds - - 266,278,996 - - - 266,278,996 78,096,004
Promissory Notes - - 10,844,042 - - - 10,844,042 20,260,865
Other assets - - 1,022,592,166 - - - 1,022,592,166 881,457,493
282,859,052 143,520,553 6,001,753,241 374,279,160 - - 6,802,412,006 6,371,359,860
Deposits from financial institutions - - - - - 1,186,356,314 1,186,356,314 1,201,095,342
Deposits from customers - - - - - 4,255,837,303 4,255,837,303 4,308,710,881
Other liabilities - - - - - 4,526,457 4,526,457 4,526,457
Derivative financial instruments - - - - 6,885,680 - 6,885,680 4,749,615
Debt securities issued - - - - - 157,987,877 157,987,877 124,883,327
Interest bearing borrowings - - - - - 586,602,830 586,602,830 611,846,270
- - - - 6,885,680 6,191,310,781 6,198,196,461 6,255,811,893 The Group reclassified Cash reserve requirement, classified as restricted deposits with Central banks and special reserve intervention funds, from Cash and cash equivalents to Other assets for financial reporting purposes.
96
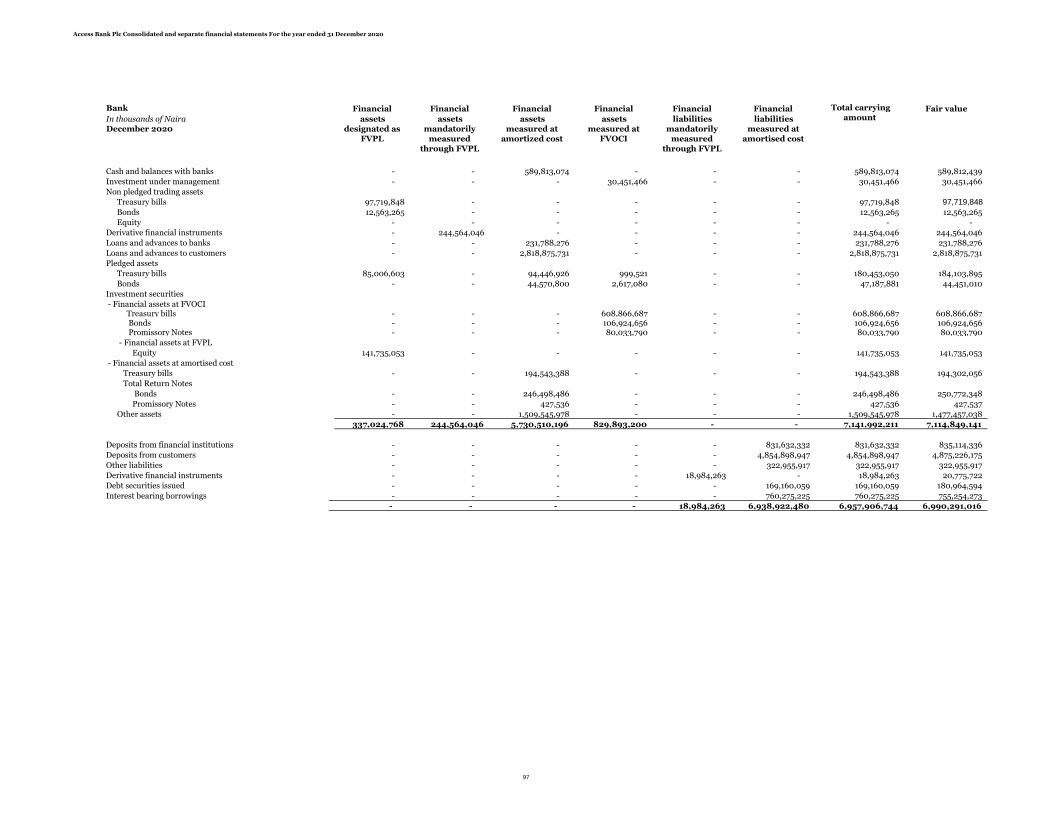
Access Bank Plc Consolidated and separate financial statements For the year ended 31 December 2020
Bank Financial Financial Financial Financial Financial Financial Fair value
In thousands of Naira assets assets assets assets liabilities liabilitiesDecember 2020 designated as
FVPLmandatorily
measured through FVPL
measured at amortized cost
measured at FVOCI
mandatorily measured
through FVPL
measured at amortised cost
Cash and balances with banks - - 589,813,074 - - - 589,813,074 589,812,439
Investment under management - - - 30,451,466 - - 30,451,466 30,451,466
Non pledged trading assets
Treasury bills 97,719,848 - - - - - 97,719,848 97,719,848
Bonds 12,563,265 - - - - - 12,563,265 12,563,265
Equity - - - - - - - -
Derivative financial instruments - 244,564,046 - - - - 244,564,046 244,564,046
Loans and advances to banks - - 231,788,276 - - - 231,788,276 231,788,276
Loans and advances to customers - - 2,818,875,731 - - - 2,818,875,731 2,818,875,731
Pledged assets
Treasury bills 85,006,603 - 94,446,926 999,521 - - 180,453,050 184,103,895
Bonds - - 44,570,800 2,617,080 - - 47,187,881 44,451,010
Investment securities
- Financial assets at FVOCI Treasury bills - - - 608,866,687 - - 608,866,687 608,866,687 Bonds - - - 106,924,656 - - 106,924,656 106,924,656 Promissory Notes - - - 80,033,790 - - 80,033,790 80,033,790
- Financial assets at FVPL
Equity 141,735,053 - - - - - 141,735,053 141,735,053
- Financial assets at amortised cost
Treasury bills - - 194,543,388 - - - 194,543,388 194,302,056
Total Return Notes
Bonds - - 246,498,486 - - - 246,498,486 250,772,348
Promissory Notes - - 427,536 - - - 427,536 427,537
Other assets - - 1,509,545,978 - - - 1,509,545,978 1,477,457,038
337,024,768 244,564,046 5,730,510,196 829,893,200 - - 7,141,992,211 7,114,849,141
Deposits from financial institutions - - - - - 831,632,332 831,632,332 835,114,336
Deposits from customers - - - - - 4,854,898,947 4,854,898,947 4,875,226,175
Other liabilities - - - - - 322,955,917 322,955,917 322,955,917
Derivative financial instruments - - - - 18,984,263 - 18,984,263 20,775,722
Debt securities issued - - - - - 169,160,059 169,160,059 180,964,594
Interest bearing borrowings - - - - - 760,275,225 760,275,225 755,254,273
- - - - 18,984,263 6,938,922,480 6,957,906,744 6,990,291,016
Total carrying amount
97

Access Bank Plc Consolidated and separate financial statements For the year ended 31 December 2020
Bank Financial Financial Financial Financial Financial Financial Fair value
In thousands of Naira assets assets assets assets liabilities liabilitiesDecember 2019 designated as
FVPLmandatorily
measured through FVPL
measured at amortized cost
measured at FVOCI
mandatorily measured
through FVPL
measured at amortised cost
Cash and balances with banks - - 575,906,273 - - - 575,906,273 575,906,273
Investment under management - - - 28,291,959 - - 28,291,959 28,291,959
Non pledged trading assets -
Treasury bills 74,749,344 - - - - - 74,749,344 74,749,344
Bonds 2,222,417 - - - - - 2,222,417 2,222,417
Equity - - - - - - - -
Derivative financial instruments - 143,480,073 - - - - 143,480,073 143,480,073
Loans and advances to banks - - 164,413,001 - - - 164,413,001 164,413,001
Loans and advances to customers - - 2,481,623,671 - - - 2,481,623,671 2,481,623,671 Pledged assets -
Treasury bills 39,881,494 - 452,686,281 30,388,532 - - 522,956,307 522,956,307
Bonds - - 82,599,583 - - - 82,599,583 82,599,583
Investment securities -
- Financial assets at FVOCI -
Treasury bills - - - 77,897,548 - - 77,897,548 77,897,548
Bonds - - - 18,950,446 - - 18,950,446 18,950,446
Promissory Notes - - - 807,619 - - 807,619 807,619
- Financial assets at FVPL -
Equity - - - - 113,126,623 - 113,126,623 113,126,623
- Financial assets at amortised cost -
Treasury bills - - 341,786,029 - - - 341,786,029 341,786,029
Bonds - - 250,828,832 - - - 250,828,832 250,828,832
Promissory Notes - - 10,844,043 - - - 10,844,043 10,844,043
Other assets - - 974,543,393 - - - 974,543,393 974,543,393
116,853,255 143,480,073 5,335,231,106 156,336,104 113,126,623 - 5,865,027,162 5,865,027,162
Deposits from financial institutions - - - - - 1,079,284,418 1,079,284,418 1,092,693,207
Deposits from customers - - - - - 3,668,339,811 3,668,339,811 3,713,914,452
Other liabilities - - - - - 4,353,070 4,353,070 4,353,070
Derivative financial instruments - - - - 6,827,293 - 6,827,293 5,206,001
Debt securities issued - - - - - 157,987,877 157,987,877 251,251,383
Interest bearing borrowings - - - - - 544,064,226 544,064,226 388,416,734
- - - - 6,827,293 5,454,029,402 5,460,856,694 5,455,834,848
Interest bearing borrowingsThe Group reclassified Cash reserve requirement, classified as restricted deposits with Central banks and special reserve intervention funds, from Cash and cash equivalents to Other assets for financial reporting purposes.
Total carrying amount
2
98

99
CREDIT RISK MANAGEMENT
In Access Bank everyone is involved in Risk Management with ultimate responsibility residing with the Board. We
operate the 3 line of defence model which enhances the understanding of risk management and control by clarifying
roles and duties. The risk management process of the bank is well fortified to mitigate the threats imposed by impact
of covid 19 or any other risk event on the bank’s business.
The management of the bank took a proactive approach to protect its loan book from the impact of Covid 19 on the
bank’s books by analyzing the extent of the pandemic on different sectors and sub sectors of the economy. This enabled
us to understand our customer’s challenges and potential outlook. We took steps to lessen the burden of loan
repayment on our borrowers and preserve the risk assets quality of the bank, working within regulatory guidance.
The Risk Management Division has continued to take advantage of advancement and innovation in the technology
space to automate the management of risk. Credit and analytics tools were deployed recently to enhance the credit
decision making and monitoring process in the bank.
PRINCIPAL CREDIT POLICIES
The following are some of the principal credit policies of the Bank:
Credit Risk Management Policy: The core objective is to enable maximisation of returns on a risk adjusted basis
from banking book credit risk exposures that are brought under the ambit of Credit Risk Management Policy. This is
done by putting in place robust credit risk management systems consisting of risk identification, risk measurement,
setting of exposure and risk limits, risk monitoring and control as well as reporting of credit risk in the banking book.
Credit Risk Rating Policy: The objective of this policy is to ensure reliable and consistent Obligor Risk Ratings
(ORRs) and Facility Risk Ratings (FRRs) and to provide guidelines for risk rating for retail and non-retail exposures
in the banking book covering credit and investment books of the Bank.
RESPONSIBILITIES OF BUSINESS UNITS AND INDEPENDENT CREDIT RISK
MANAGEMENT
In Access Bank, Business Units and independent credit risk management have a joint responsibility for the overall
accuracy of risk ratings assigned to obligors and facilities. Business Relationship Managers are responsible for deriving
the Obligor Risk Rating (‘ORR’) and Facility Risk Rating (‘FRR’) using approved methodologies. However,
independent credit risk management validates such ratings.
Notwithstanding who derives the risk rating, Credit Risk Management is responsible for reviewing and ensuring the
correctness of the ORR and FRR assigned to borrowers and facilities. This review includes ensuring the ongoing
consistency of the business’ Risk Rating Process with the Bank’s Risk Rating Policy; ongoing appropriate application
of the risk rating process and tools; review of judgmental and qualitative inputs into the risk rating process; ensuring
the timeliness and thoroughness of risk rating reviews; and ensuring that the documentation of the risk rating process
is complete and current.
Credit Risk Management has the final authority if there is a question about a specific rating.
CREDIT PROCESS
The Bank’s credit process starts with portfolio planning and target market identification. Within identified target
markets, credits are initiated by relationship managers. The proposed credits are subjected to review and approvals
by applicable credit approval authorities. Further to appropriate approvals, loans are disbursed to beneficiaries.
Ongoing management of loans is undertaken by both relationship management teams and our Credit Risk
Management Group. The process is applied across the Bank and in the subsidiaries.
If a preliminary analysis of a loan request by the account manager indicates that it merits further scrutiny, it is then
analysed in greater detail by the account manager, with further detailed review by Credit Risk Management. The
concurrence of Credit Risk Management must be obtained for any credit extension. If the loan application passes the
detailed analysis, it is submitted to the appropriate approval authority based on the size and risk rating of facilities.

100
The standard credit evaluation process is based both on quantitative figures from the Financial Statements and on an
array of qualitative factors. Information on the borrower is collected as well as pertinent macroeconomic data, such as
an outlook for the relevant sector. These factors are assessed by the analyst and all individuals involved in the credit
approval process, relying not only on quantitative factors but also on extensive knowledge of the company in question
and its management.
Risk Rating Scale and external rating equivalence
Access Bank operates a 12-grade numeric risk rating scale. The risk rating scale runs from 1 to 8. Rating 1 represents the
best obligors and facilities, while rating 8 represents the worst obligors and facilities. The risk rating scale incorporates sub-
grades and full grades reflective of realistic credit migration patterns.
The risk rating scale and the external rating equivalent is detailed below:
Access Bank risk Rating External Rating Equivalent Grade
1 AAA
Investment Grade 2+ AA
2 A
2- BBB
3+ BB+
Standard Grade 3 BB
3- BB-
4 B
Non-Investment Grade
5 B-
6 CCC
7 C
8 D
TRAINING / CERTIFICATION
In line with the CBN’s competency framework, members of the Group have consistently upgraded their competency
level by passing necessary certification examinations like Certified Risk Manager (Risk Management Association of
Nigeria), ACIB (CIBN), ICAN, ACCA, CFA and other relevant professional certifications.
The Bank has also entered partnerships with renowned international firms like Dun and Bradstreet, KPMG and
Moody’s Analytics for training in Credit Risk Analysis and Financial Risk Management for the first and second lines
of defence. These are outside regular training conducted within the Group to enhance staff capacity in handling
transactions in the dynamic business environment and ever-evolving banking industry.
CREDIT OFFICER RISK RATING
To reshape the understanding of risk, the bank developed a Credit Officer Risk Rating model which assigns rating to
credit officers based on the quality and performance of risk asset portfolio managed by the individual officer. This puts
the bank in a more disciplined position in the credit appraisal and approval processes.
CREDIT RISK CONTROL AND MITIGATION
AUTHORITY LIMITS ON CREDIT
The highest credit approval authority is the Board of Directors, supported by the Board Credit and Finance Committee
and followed by the Management Credit Committee. Individuals are also assigned credit approval authorities in line
with the Bank’s criteria for such delegation set out in its Credit Risk and Portfolio Management Plan. The principle of
central management of risk and decision authority is maintained by the Bank, subject to local regulatory and market
requirements in each country.
The credit approval limits of the principal officers of the Group are shown in the table below:
In addition, approval and exposure limits based on internal Obligor Risk Ratings have been approved by the Board for
the relevant approving authorities and credit committees as shown in the second table below:

101
APPROVING AUTHORITY APPROVED LIMIT (New
Requests) (NgN)
APPROVED LIMIT
(Renewals of Existing Credits)
(NgN)
Executive Director 150 million 200 million
Group Deputy Managing Director 400 million 500 million
Group Managing Director/CEO 500 million 600 million
Access Bank Risk
Rating
Exposure Limit (ORR-
based LLL) (NGN)
Management Credit
Committee Approval
Limit (NGN)
Board Credit &
Finance Committee
Approval Limit
(NGN)
Board of
Directors Limit
1 41 billion 20 billion 40 billion Legal lending
limit 2+ 33 billion 15 billion 30 billion
2 25 billion 5 billion 15 billion
2- 16 billion 2 billion 10 billion
3+ 3 billion 1 billion 10 billion
3 1.7 billion 0.8 billion 10 billion
3- 0.8 billion 0.5 billion 2 billion
4 Above 0.1 billion
COLLATERAL POLICIES
It is the Group’s policy that all credit exposures are adequately collateralised. Credit risk mitigation is an activity of
reducing credit risk in an exposure or transferring it to counterparty, at facility level, by a safety net of tangible and
realisable securities including approved third-party guarantees/ insurance.
However, the primary consideration for approving credits is hinged largely on the obligor’s financial strength and
debt-servicing capacity. The guidelines relating to risk mitigants as incorporated in the guidance note of Basel
Committee on Banking Supervision (‘BCBS’) on “Principles for the Management of Credit Risk” are to be taken into
consideration while using a credit risk mitigant to control credit risk.
The Bank utilizes transaction structure, collateral and guarantees to help mitigate risks (both identified and inherent)
in individual credits but transactions should be entered into primarily on the strength of the borrower’s repayment
capacity. Collateral cannot be a substitute for a comprehensive assessment of the borrower or the counterparty, nor
can it compensate for insufficient information. It is recognised that any credit enforcement actions (e.g. foreclosure
proceedings) can eliminate the profit margin on the transaction. In addition, we are mindful that the value of collateral
may well be impaired by the same factors that have led to the diminished recoverability of the credit.

102
The range of collaterals acceptable to the Bank include:
• Mortgage on landed property (Legal Mortgage/Mortgage Debenture)
• Debenture/Charge on assets (Fixed and/or Floating)
• Cash/Money Market Investment (Letter of lien and Set-Off over fixed deposits/money market investments)
• Treasury bills and other government securities.
• Chattel/vessel Mortgage.
• Legal ownership of financed assets.
OPERATIONAL RISK MANAGEMENT
Operational risk is the risk of loss resulting from inadequate or failed internal processes, people, or systems, or from
external events. Our definition of operational risk excludes regulatory risks, strategic risks and potential losses related
solely to judgments about taking credit, market, interest rate, liquidity, or insurance risks.
It also includes the reputation and franchise risk associated with business practices or market conduct in which the
Bank is involved. Operational risk is inherent in Access Bank’s global business activities and, as with other risk types,
is managed through an overall framework designed to balance strong corporate oversight with well-defined
independent risk management.
This framework includes:
• Recognised ownership of the risk by the businesses;
• Oversight by independent risk management; and
• Independent review by Internal Audit.
We seek to minimise exposure to operational risk, subject to cost trade-offs. Operational risk exposures are managed
through a consistent set of management processes that drive risk identification, assessment, control and monitoring.
Our operational risk strategy seeks to minimise the impact that operational risk can have on shareholders’ value. The
Bank’s strategy is to:
• Reduce the likelihood of occurrence of expected events and related cost by managing the risk factors and
implementing loss prevention or reduction techniques to reduce variation to earnings;
• Minimise the impact of unexpected and catastrophic events and related costs through risk financing
strategies that would support the Bank’s long-term growth, cash flow management and balance sheet
protection;
• Eliminate inefficiencies, improve productivity, optimise capital requirements and improve overall
performance through the institution of well designed and implemented internal controls.
In order to create and promote a culture that emphasizes effective operational management and adherence to
operating controls, there are three distinct levels of operational risk governance structure in Access Bank Plc.
Level 1 refers to the oversight function carried out by the Board of Directors, Board Risk Management Committee and
the Executive Management. Responsibilities at this level include ensuring effective management of operational risk
and adherence to the approved operational risk policies.
Level 2 refers to the management function carried out by the operational risk management group. It has direct
responsibility for formulating and implementing the Bank’s operational risk management framework including
methodologies, policies and procedures approved by the Board.
Level 3 refers to the operational function carried out by all business units and support functions in the Bank. These
units/functions are fully responsible and accountable for the management of operational risk in their units. They work
in liaison with operational risk management to define and review controls to mitigate identified risks. Internal Audit
provides independent assessment and evaluation of the Bank’s operational risk management framework. This periodic
confirmation of the existence and utilisation of controls in compliance with approved policies and procedures,
103
provides assurance as to the effectiveness of the Bank’s operational risk management framework. Some of the tools
being used to assess, measure and monitor operational risks in the Bank include; a loss database of operational risk
events; an effective risk and control self-assessment process that helps to analyse business activities and identify
operational risks that could affect the achievement of business objectives; and key risk indicators which are used to
monitor operational risks on an ongoing basis.
ALLOCATING CAPITAL TO BUSINESS UNITS
An allocation methodology is applied for allocating capital to business units. For each business unit, the allocation
takes into consideration not only the size of the business unit, but also measures the business unit’s control
environment, namely; open audit findings, RCSA results, and loss experience. This translates to a risk-sensitive
allocation with the opportunity afforded to business units to identify actions to positively impact on their respective
allocated operational risk capital.
INSURANCE MITIGATION
Insurance policies are used to mitigate operational risks. These policies are current and remain applicable at the Bank
and Group Level. Insurance coverage is purchased at Group or cluster level to discharge statutory and regulatory
duties, or to meet counterparty commitments and stakeholder expectations. The primary insurance policies managed
by the Group are:
o Comprehensive crime and electronic crime;
o Directors’ and officers’ liability; and
o Professional indemnity.
MARKET RISK MANAGEMENT
The Bank’s capital and earnings are exposed to risk due to adverse changes in market prices. As a result a robust
market risk management framework is in place to reduce exposure to changes in interest rate, foreign exchange, equity
prices and commodity prices.
The objective is not to completely avoid these risks but to ensure exposure to these risks through our trading and
banking book positions are kept within the Bank’s defined risk appetite and tolerance.
MARKET RISK POLICY MANAGEMENT AND CONTROL
Over the years, the Nigerian financial market has witnessed a dramatic expansion in the array of financial services and
products. This tremendous growth in scale and scope has also generated new risks with global consequences, especially
market risk, necessitating an assessment of exposures to the volatility of the underlying risk drivers. This has prompted
the upgrading of the Market Risk Policy; Asset and Liability Management Policy; Liquidity Policy; Stress Testing
Policy, and so on, to ensure the risks faced across business activities and on an aggregate basis are within the stipulated
risk appetite of the Bank. These policies have been benchmarked with industry and international best practices and
CBN regulations.
The Bank runs an integrated and straight through processing treasury system for enabling efficient monitoring and
management of interest rate and foreign exchange risks in the Bank.
Liquidity, Exchange Rate, and Interest Rate risks are managed through various approaches, viz. Liquidity Gap
Analysis, Dynamic Cash Flow Analysis, Liquidity Ratios, Value at Risk (VaR), Earnings at Risk (EaR) and Sensitivity
Analysis. The primary aim of these processes is risk forecasting and impact mitigation through management action
and portfolio rebalancing.
The Bank regularly conducts stress testing to monitor its vulnerability to unfavorable shocks. It monitors and controls
its risk, using various internal and regulatory risk limits for trading book and banking book which are set according to
several criteria including economic scenario, business strategy, management experience, peer analysis and the Bank’s
risk appetite.
104
BANKING BOOK
Market risk management actively manages the Banking book to optimise its income potential. This risk arises from
the mismatch between the future yield on assets and their funding cost, due to interest rate changes. The Bank uses a
variety of tools to track and manage this risk:
• Re-pricing gap analysis
• Liquidity gap analysis
• Earnings-at-Risk (EAR) using various interest rate forecasts
• Sensitivity Analysis
INTEREST RATE RISK
Interest rate risk is the exposure of the Bank’s financial condition to adverse movements in interest rates, yield curves
and credit spreads. The Bank is exposed to interest rate risk through the interest-bearing assets and liabilities in its
trading and banking books.
i. RE-PRICING AND LIQUIDITY GAP ANALYSIS
Access Bank’s objective for management of interest rate risk in the banking book is to manage interest rate mismatch
and lower interest rate risk over an interest rate cycle. This is achieved by hedging material exposures with the external
market.
The Bank’s operations are subject to the risk of interest rate fluctuations to the extent that interest-earning assets and
interest-bearing liabilities mature or re-price at different times or in differing amounts. In the case of floating rated
assets and liabilities, the Bank is exposed to basis risk, which is the difference in re-pricing characteristics of the
various floating rate indices, such as the savings rate and 90-day NIBOR and different types of interest.
Non-traded interest rate risk arises in the banking book from the provision of retail and wholesale (non-traded)
banking products and services, as well as from certain structural exposures within the Groups balance sheet, mainly
due to re-pricing timing differences between assets, liabilities and equities. These risks impact both the earnings and
the economic value of the Group. Overall, non-trading interest rate risk positions are managed by Treasury, which
uses investment securities, advances to banks and deposits from banks to manage the overall position arising from the
Group’s non-trading activities.
ii. EARNINGS-AT-RISK APPROACH
Earnings at risk is the potential change in net income due to adverse movements in interest rates over a defined period.
It guides the Bank to understand the impact that a change in interest rates can make on our position and projected
cash flow.
The Bank has limits drawn for this risk measure. They are designed to monitor and control the risk to our projected
earnings using various rate scenarios and assumptions. The limit is expressed as a change in projected earnings over
a specified time horizon and rate scenario. Scenarios adopted by the Bank include parallel and non-parallel shifts in
yield.
iii. SENSITIVITY ANALYSIS
The Bank employs the use of scenario and sensitivity analysis in evaluating its exposures per time. Scenario analysis
is the process of predicting the possible balance sheet impact to changes that may occur to existing variables whilst
sensitivity analysis is the study of how the outcome of a decision changes due to variations in input.

105
TRADING PORTFOLIO
The measurement and control techniques used to measure, and control traded market risk (interest rate and foreign
exchange risk) include daily valuation of positions, limit monitoring, gap analysis, sensitivity analysis, Value at Risk,
stress testing, etc.
LIMITS
The Bank uses risk limits to restrict the size of investments that their traders can take for proprietary and non-
proprietary purposes. Limiting the size of investments is one of the primary ways the Bank controls risk and capital
consumption. The following limits currently exist;
Fixed income and FX Open Position Limits (NOPL): The Bank, in keeping with the prudence
concept, sets its policy limit for Open Position at a level lower than the maximum NOPL approved by the
regulatory authority. In setting the internal NOPL, the following considerations are imperative:
• The Regulatory NOPL;
• The Bank’s tolerance and appetite for FX risk;
• The size and depth of the FX market in Nigeria;
• The degree of volatility of traded currencies; and
• The Bank’s desired positioning in the relevant FX market with requirements for international business
support.
Inter-bank placement and takings Limit: In line with the Bank’s drive to be a top liquidity provider
in the financial market, stringent controls have been set to ensure that any takings from interbank are
preceded by proper authorization, to reduce the risks that come with huge interbank borrowing.
Management Action Trigger (MAT): This establishes decision points to confirm the Board of Directors’
tolerance for accepting trading risk losses on a cumulative basis. MAT therefore, considers actual
cumulative profit/loss as well as potential losses and the loss tolerance is defined as a percentage of Gross
Earnings.
VaR
Sensitivity/ Scenario Analysis
Limits Stress Test
Measuring and
Monitoring Market Risk
Mark-to-Market
106
Stop Loss Limit: This limit sets a maximum tolerable unrealised profit/loss to date which will trigger the
closing or reduction of a position to avoid any further loss based on existing exposures.
Dealer Limits: This limit sets a maximum transaction limit by a dealer. It is based on experience and
knowledge of the dealer.
Value-at-Risk Limit: The VaR limit is based on 99% confidence level over a 1 day holding period on the
trading book. In line with the Bank’s risk appetite, treasury losses are not expected to exceed 1% of total
portfolio.
Duration Limit
The Bank utilizes duration to measure the sensitivity of the price of assets in its portfolio to changes in
interest rate. The Bank has duration limits for the varying asset classes in its investment/trading portfolio.
MARK TO MARKET (MTM)
The marking-to-market technique establishes the potential profit and loss by revaluing money market exposures
to prevailing market prices. When no market prices are available for a specific contract period, mark-to-model is
used to derive the relevant market prices. It is the Bank’s policy to revalue all exposures categorised under the
securities trading portfolio daily. As a general guide, marking to market is performed independently of the trading
unit i.e. prices/rates are obtained from external sources.
STRESS TESTING
A consistent stress testing methodology is applied to trading and non-trading books. The stress testing methodology
assumes that the scope for management action would be limited during a stress event, reflecting the decrease in
market liquidity that often occurs.
Losses beyond the confidence interval are not captured by a VaR calculation, which therefore gives no indication
of the size of unexpected losses in these situations. Market Risk complements the VaR measurement by regular
stress testing of market risk exposures to highlight the potential risk that may arise from extreme market events
that are rare but plausible.
Stress testing is an integral part of the market risk management framework and considers both historical market
events and forward-looking scenarios. Stress testing provides an indication of the potential size of losses that could
arise in extreme conditions. It helps to identify risk concentrations across business lines and assist senior
management in capital planning decisions.
Liquidity Risk Management
Liquidity risk is the potential that the Bank may be unable to meet expected or unexpected current or future cash
flows and collateral needs without affecting its daily operations or its financial condition. The Bank is managed to
preserve a high degree of liquidity so that it can meet the requirements of its customers always, including during
periods of financial stress.
The Bank has developed a liquidity management framework based on a statistical model underpinned by
conservative assumptions about cash inflows and the liquidity of liabilities. In addition, liquidity stress tests
assuming extreme withdrawal scenarios are performed. These stress tests specify additional liquidity requirements
to be met by holdings of liquid assets.
The Bank’s liquidity has consistently been materially above the minimum liquidity ratio and the requirements of
its stress tests. The Group ALCO, in conjunction with the Board and its committees, monitors our liquidity position
and reviews the impact of strategic decisions on our liquidity. Liquidity positions are measured by calculating the
Bank’s net liquidity gap and by comparing selected ratios with targets as specified in the Liquidity Risk
Management Manual.
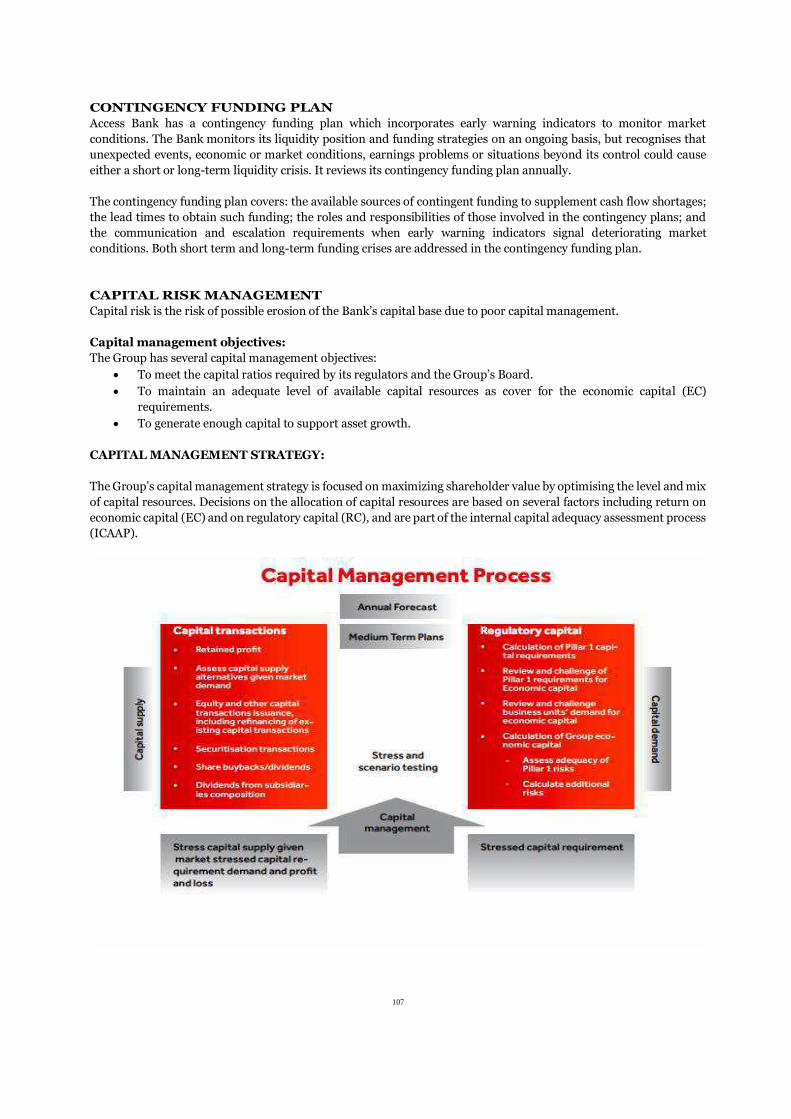
107
CONTINGENCY FUNDING PLAN
Access Bank has a contingency funding plan which incorporates early warning indicators to monitor market
conditions. The Bank monitors its liquidity position and funding strategies on an ongoing basis, but recognises that
unexpected events, economic or market conditions, earnings problems or situations beyond its control could cause
either a short or long-term liquidity crisis. It reviews its contingency funding plan annually.
The contingency funding plan covers: the available sources of contingent funding to supplement cash flow shortages;
the lead times to obtain such funding; the roles and responsibilities of those involved in the contingency plans; and
the communication and escalation requirements when early warning indicators signal deteriorating market
conditions. Both short term and long-term funding crises are addressed in the contingency funding plan.
CAPITAL RISK MANAGEMENT
Capital risk is the risk of possible erosion of the Bank’s capital base due to poor capital management.
Capital management objectives:
The Group has several capital management objectives:
• To meet the capital ratios required by its regulators and the Group’s Board.
• To maintain an adequate level of available capital resources as cover for the economic capital (EC)
requirements.
• To generate enough capital to support asset growth.
CAPITAL MANAGEMENT STRATEGY:
The Group’s capital management strategy is focused on maximizing shareholder value by optimising the level and mix
of capital resources. Decisions on the allocation of capital resources are based on several factors including return on
economic capital (EC) and on regulatory capital (RC), and are part of the internal capital adequacy assessment process
(ICAAP).

108
IMPORTANCE OF CAPITAL MANAGEMENT
Capital management is critical to the Bank’s survival. Hence, capital is managed as a Board level priority in the Group.
The Board is responsible for assessing and approving the Group’s capital management policy, capital target levels and
capital strategy. A capital management framework provides effective capital planning, capital issuance, alignment to
Basel accord, EC utilisation and economic profit (EP) performance measurement criteria. The diagram above
illustrates the process the Group follows to ensure end-to-end integration of the Group’s strategy, risk management
and financial processes into the capital management process. The purpose is to ensure that capital consumption in the
business divisions is planned for and reflected in their performance measurement, which in turn translates into
management performance assessment, product pricing requirements and achievement of the overall strategy within
the Group’s risk appetite.
ENTERPRISE-WIDE SCENARIO AND STRESS TESTING
Access Bank uses robust and appropriate scenario stress testing to assess the potential impact on the Group’s capital
adequacy and strategic plans. Our stress testing and scenario analysis programme are central to the monitoring of
strategic and potential risks. It highlights the vulnerabilities of our business and capital plans to the adverse effect of
extreme but plausible events. As a part of our core risk management practices, the Bank conducts enterprise-wide
stress tests on a periodic basis to better understand earnings, capital and liquidity sensitivities to certain economic
scenarios, including economic conditions that are more severe than anticipated. We leveraged the Bank’s ICAAP in
the selection of our scenarios and improved on them to ensure they are representative of the recent macroeconomic
developments. The outcome of the testing and analysis is also used to assess the potential impact of the relevant
scenarios on the demand for regulatory capital compared with its supply. These enterprise-wide stress tests provide
an understanding of the potential impacts on our risk profile, capital and liquidity. It generates and considers pertinent
and plausible scenarios that have the potential to adversely affect our business. Stress testing and scenario analysis
are used to assess the financial and management capability of Access Bank to continue operating effectively under
extreme but plausible trading conditions. Such conditions may arise from economic, legal, political, environmental
and social factors. Scenarios are carefully selected by a group drawn from senior business development, risk and
finance executives. Impacts on each line of business from each scenario are then analysed and determined, primarily
leveraging the models and processes utilised in everyday management routines. Impacts are assessed along with
potential mitigating actions that may be taken in each scenario. Analyses from such stress scenarios are compiled and
reviewed through our Group Asset and Liability Committee, and the Enterprise Risk Management Committee. These
are then incorporated alongside other core business processes into decision making by management and the Board.
These scenario and stress testing procedures were significantly enhanced during the recent pandemic and its
macroeconomic fallouts, and the management actions that arose from them were pivotal in enabling the Bank to
mitigate and optimise risk outcomes and capital.
COMPLIANCE RISK MANAGEMENT
The Bank’s compliance function organizes and sets priorities for the management of its compliance risk in a way that
is consistent with risk management strategy and structures.
The compliance function recently had its Compliance Maturity Assessment done by Messrs. PWC by benchmarking
against ISO 19600 principles. The integrated compliance function working closely with Internal Audit and Risk
Management to achieve risk convergence provided backbone for integrated assurance and higher visibility of risk
management and control consciousness across the Group.
The compliance function has continued to redefine and fine-tune its approach and continued to improve on its
advisory role with intense focus on regulatory intelligence gathering, compliance monitoring, compliance testing and
closer cooperation with business units within the Bank. The Group on the other hand acts as a contact point for
compliance inquiries from staff members and recently introduced the Business Unit Compliance Officers to strengthen
and deepen the cooperation with the first line of defense and the implantation of Quality Assurance in all applicable
Groups within the bank
We enhanced the monitoring to online real time to catch up with the current digital banking environment. We receive
alerts of transactions on a risk-based approach by focusing on the high-risk areas thereby spotting non-conformities
on time and have also enhanced our Compliance management standard.

109
MEASUREMENT, MONITORING AND MANAGEMENT OF COMPLIANCE RISK
In Access Bank, compliance risk is continually:
• Measured by reference to identified metrics, incident assessments (whether affecting Access Bank or the wider
industry), regulatory feedback, Compliance Testing and the judgment of our external assessors as it relates to
AML/CFT and other compliance vulnerabilities;
• Monitored against our compliance risk assessments and metrics, the results of the continuous monitoring and
reporting activities of the compliance function and the results of internal and external audits and regulatory
inspections; and
• Managed by establishing and communicating appropriate policies and procedures, training employees on them,
and monitoring activity to assure their observance.
The Bank continues to recognize its accountability to all its stakeholders under the legal and regulatory requirements
applicable to its business. The Conduct and Compliance function, including all staff of Access Bank Plc and its
subsidiaries are committed to high standards of integrity and fair dealing in the conduct of business. The Bank’s
compliance risk management philosophy is deepened by the effective convergence of risk management through the
‘Three Lines of Defence’ model.
Effective Compliance Risk Management in Access Bank and its subsidiaries will continuously be coordinated in the
following manner:
• Where a business unit is subject to regulatory requirements, it will comply with those requirements. The business
unit will further establish and maintain systems of internal control to monitor and report the extent of compliance
with those requirements with the support of the Conduct and Compliance function.
In the absence of regulatory requirements for all or part of a business unit, certain minimum standards of conduct is
established and maintained by that business unit to the extent required as determined by the management of that
business unit and in line with global best compliance practice.
INFORMATION AND CYBERSECURITY RISK MANAGEMENT
In response to the increased cyber security threat to businesses globally, we have a Cyber Security Framework and
adopted an in-depth layered approach to cover Cyber security practices, information security processes and
infrastructure which includes: Cyber Security Governance, Operations, and Infrastructure across the enterprise.
The year 2020 has been unusual in many ways due to the Corona Virus Pandemic. IT and Cybersecurity has not been
spared and this has left many organizations scampering to safety. Access Bank, like other Global institutions,
embraced new practices such as social distancing and remote working. As expected, cyber criminals worldwide have
capitalized on the health crisis and it is no surprise that the main targets are financial institutions, their
customers/clients.
We are aware of our position as the number one retail Bank in Nigeria with an ever-growing digital platforms portfolio,
hence we cannot afford to let our guard down.
We have a holistic view of all the major risks facing the Bank and we remain vigilant regarding both known and
emerging global risks. We also ensure that we are strong enough to withstand any exogenous shocks by putting in
place a 24/7 monitoring and external intelligence for the Bank’s information and technology assets, through our
security operations center (SOC).
The continuous advancement and innovations in technology and the endless need to improve services have made
digital banking a direction that the Bank must tap into with adequate mitigating approach to handle the inherent risks
involved in the business. In response to the digitization needs, we have a Digital Banking Framework that enables the
Bank to maintain an overall cyber risk appetite of “moderate risk” while adopting digitization processes in meeting the
needs of our customers.
110
ENVIRONMENTAL AND SOCIAL RISK MANAGEMENT
The Bank has long recognized the requirement to transition to a more structured and conscientious approach to
environmental and social concerns, and the increasing role that they play in the future direction of the
institution. Fundamental changes to the way decisions are made across the bank coupled with Executive
Management support to underpin this development has been crucial. Appreciating and recognizing the requirements
of both our regulatory and investment partners has been critical in our decision making.
ENVIRONMENTAL AND SOCIAL RISK STRATEGY
We understand the need to achieve the goals of the Paris Agreement on Co2 emissions reductions coupled with our
wider environmental ambitions and appreciate that environmental issues represent a risk for Access Bank.
Recognizing such, we have refined our strategy further to accommodate climate change challenges. We have achieved
this with a robust governance framework of policies and procedures and the incorporation of environmental concerns
into our automated credit review process. The Bank also has a dedicated team of professionals focused solely on
delivering both environmental and social risk management for the bank.
The continuous evolution of our Environmental Social and Governance (ESG) systems has ensured that we incessantly
push towards attaining a more sophisticated risk management structure.
The issuance of the first climate certified corporate green bond in Sub Saharan Africa last year, which has also been
listed as a non-traded instrument on the Luxembourg Stock Exchange in the first quarter of 2020, is evident of the
Bank's continuous push in the direction of sustainability.
Access Bank has also attracted increased international and domestic investment partnerships with Development
Financial Institutions for ESG targeted lending. Our subsidiaries have also benefited from these partnerships, these
projects have a strong emphasis on social and environmental impact.
With the increasing awareness around financed fossil fuel emissions and impact of climate change potential
within our portfolio, we have made strides towards understanding these potential exposures, their implications and
any mitigating measures which can be incorporated by the bank.
Recognizing these challenges has also led the Bank to become core participating member of internationally recognized
climate groups. They include:
1. UNEP FI’s Taskforce on Climate related Financial Disclosures (TCFD) which is globally adopted
by Banks, Insurance companies, etc. is aimed at identifying and manage the impact of climate risks in the
portfolio of Financial Institutions. Access Bank became a member of the working group in 2019.
2. Partnership for Carbon Accounting Financials (PCAF) is a global partnership aimed at harmonizing
the approach in accessing and disclosing greenhouse gas (GHG) emissions associated with loans and
investment. Access Bank became a member of the steering group in June 2020.
REPUTATIONAL RISK MANAGEMENT
Reputational risk arises when the Bank’s reputation is damaged by one or more reputational events from negative
publicity about the organisation’s business practices, conduct or financial condition. The Bank’s Reputational Risk
Management is mandated to protect the Bank from potential threats to its reputation. The team continuously uses
proactive means in minimizing the effects of reputational events, thereby averting the likelihood of major reputational
crises with the view of ultimately ensuring the survival of the organisation. The Bank has put in place a framework to
properly articulate, analyze and manage reputational risk factors.
Access Bank takes the management of reputational risks seriously because of its far-reaching implications, which are
buttressed by the fact that the Bank operates under:
• A highly regulated financial services industry with high visibility and vulnerability to regulatory actions that
may adversely impact its reputation. (e.g. corporate governance crises);
• Keen competition and largely homogeneous products and services have led customers not to perceive
significant differences between financial service providers; and
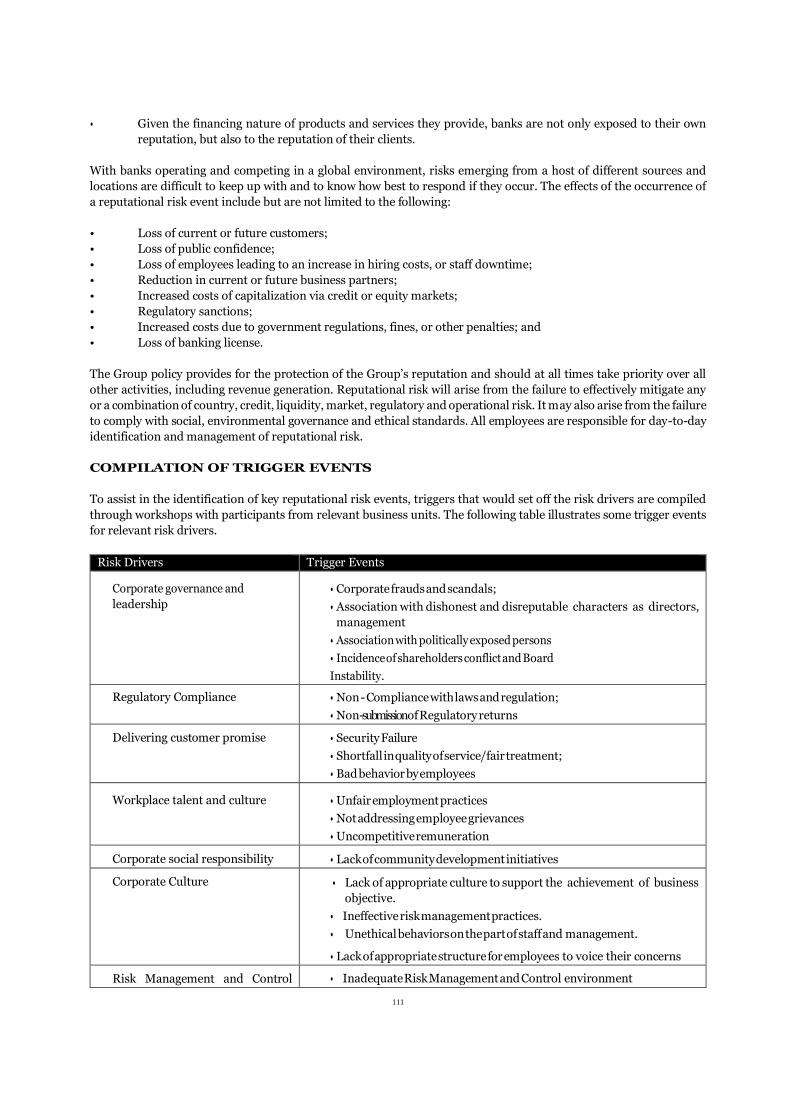
111
• Given the financing nature of products and services they provide, banks are not only exposed to their own
reputation, but also to the reputation of their clients.
With banks operating and competing in a global environment, risks emerging from a host of different sources and
locations are difficult to keep up with and to know how best to respond if they occur. The effects of the occurrence of
a reputational risk event include but are not limited to the following:
• Loss of current or future customers;
• Loss of public confidence;
• Loss of employees leading to an increase in hiring costs, or staff downtime;
• Reduction in current or future business partners;
• Increased costs of capitalization via credit or equity markets;
• Regulatory sanctions;
• Increased costs due to government regulations, fines, or other penalties; and
• Loss of banking license.
The Group policy provides for the protection of the Group’s reputation and should at all times take priority over all
other activities, including revenue generation. Reputational risk will arise from the failure to effectively mitigate any
or a combination of country, credit, liquidity, market, regulatory and operational risk. It may also arise from the failure
to comply with social, environmental governance and ethical standards. All employees are responsible for day-to-day
identification and management of reputational risk.
COMPILATION OF TRIGGER EVENTS
To assist in the identification of key reputational risk events, triggers that would set off the risk drivers are compiled
through workshops with participants from relevant business units. The following table illustrates some trigger events
for relevant risk drivers.
Risk Drivers Trigger Events
Corporate governance and
leadership
• Corporate frauds and scandals;
• Association with dishonest and disreputable characters as directors,
management
• Association with politically exposed persons
• Incidence of shareholders conflict and Board
Instability.
Regulatory Compliance • Non - Compliance with laws and regulation;
• Non-submission of Regulatory returns
Delivering customer promise • Security Failure
• Shortfall in quality of service/fair treatment;
• Bad behavior by employees
Workplace talent and culture • Unfair employment practices
• Not addressing employee grievances
• Uncompetitive remuneration
Corporate social responsibility • Lack of community development initiatives
Corporate Culture • Lack of appropriate culture to support the achievement of business
objective.
• Ineffective risk management practices.
• Unethical behaviors on the part of staff and management.
• Lack of appropriate structure for employees to voice their concerns
Risk Management and Control • Inadequate Risk Management and Control environment

112
Environment • Continuous violations of existing policies and procedures
Financial Soundness and Business
viability
• Consistent poor financial performance
• Substantial losses from unsuccessful
• Investment
Crisis Management • Inadequate response to a crisis or even a minor incident
APPROACH TO MANAGING REPUTATION RISK EVENTS
The Bank’s approach to managing reputation events, including any relevant strategy and policies, is approved by the
Board or its delegated committee and subject to periodic review and update by senior management to ensure that it
remains appropriate over time. In addition, the approach is well documented and communicated to all relevant
personnel.
POST REPUTATION EVENT REVIEWS
After a reputation event, the post-event review is conducted by Internal Audit and Risk Management Division to
identify any lessons learnt, or problems and weaknesses revealed, from the event. Such reviews are useful for providing
feedback and recommendations for enhancing the Bank’s reputation risk management process and should at least be
conducted on any major event affecting Access Bank. The Board and senior management are informed of the results
of any such review conducted in order to take appropriate actions to improve their capacity to manage reputational
risk.
STRATEGIC RISK MANAGEMENT
In Access Bank, we define Strategic Risk Management as the process for identifying, assessing and managing risks and
uncertainties affected by internal and external events or scenarios that could inhibit the Bank’s ability to achieve its
strategy and strategic objectives with the ultimate goal of creating and protecting shareholder and stakeholder value.
It is a primary component and necessary foundation of our Enterprise Risk Management.
Strategic risk management, therefore, is the current or prospective risk to earnings and capital arising from adverse
business decisions, improper implementation of decisions or lack of responsiveness to changes in the business
environment. It can also be defined as the risk associated with future business plans and strategies, including plans
for entering new business lines, expanding existing services through mergers and acquisitions, and enhancing
infrastructure.
The following principles govern the Bank’s strategic risk management:
The Board and Senior Management are responsible for Strategic Risk Management and oversee the effective
functioning of the strategic risk management framework.
The functional units (i.e. the units which carry out business or operational functions) assist the Board and Senior
management in formulating and implementing strategies, providing input to the strategic planning and management
processes; and as well as implementing the strategic risk management framework.
The strategic risk management function supports the Board and senior management in managing strategic risks and
other related processes in the Bank.
The measures and controls it has put in place include the following:
• Strategic plans are approved and monitored by the Board.
• Regular environmental scan, business strategy session and workshops are set up to discuss business
decisions and exposure to strategic risk triggers.
• Close monitoring to ensure that strategic plans are properly aligned with the business model.
• Regular performance review by Executive Management and business plans that are approved by the
Board.

113
The Bank also maintains a well-defined succession plan, proper monitoring and well-defined structures to align its
activities to international best practices.
ECONOMIC INTELLIGENCE
Economic Intelligence (EI) is in the business of positioning economic, business and financial information as tools for
helping the Bank achieve its long-term strategic objectives. Its value propositions include supporting the Bank in
achieving its moderate risk appetite, price competitiveness, improvement to business intelligence and brand
enhancement.
Some of the Unit’s Roles and Responsibilities include:
• Monitoring and interpreting current economic developments/trends globally and wherever the Bank has
presence and preparing economic outlook to aid decision making.
• Proactively providing industry analysis, identifying investment trends and opportunities for the Bank;
monitoring, interpreting, and conducting policy-relevant research.
• Developing contact and collaborative economic/business and financial information with research institutes/
bodies within the country and outside.
The peculiarities of 2020 saw the Bank’s strategic intent to drive sustainable growth through technology and
expansion. In line with this need, the Economic Intelligence Unit, during the year, also broadened its role with the
upgrade of the macro-economic model.
• Macroeconomic and Satellite Model: An extensive macro model to forecast future macroeconomic outcomes,
simulate scenarios and conduct both bank specific and macroeconomic stress test
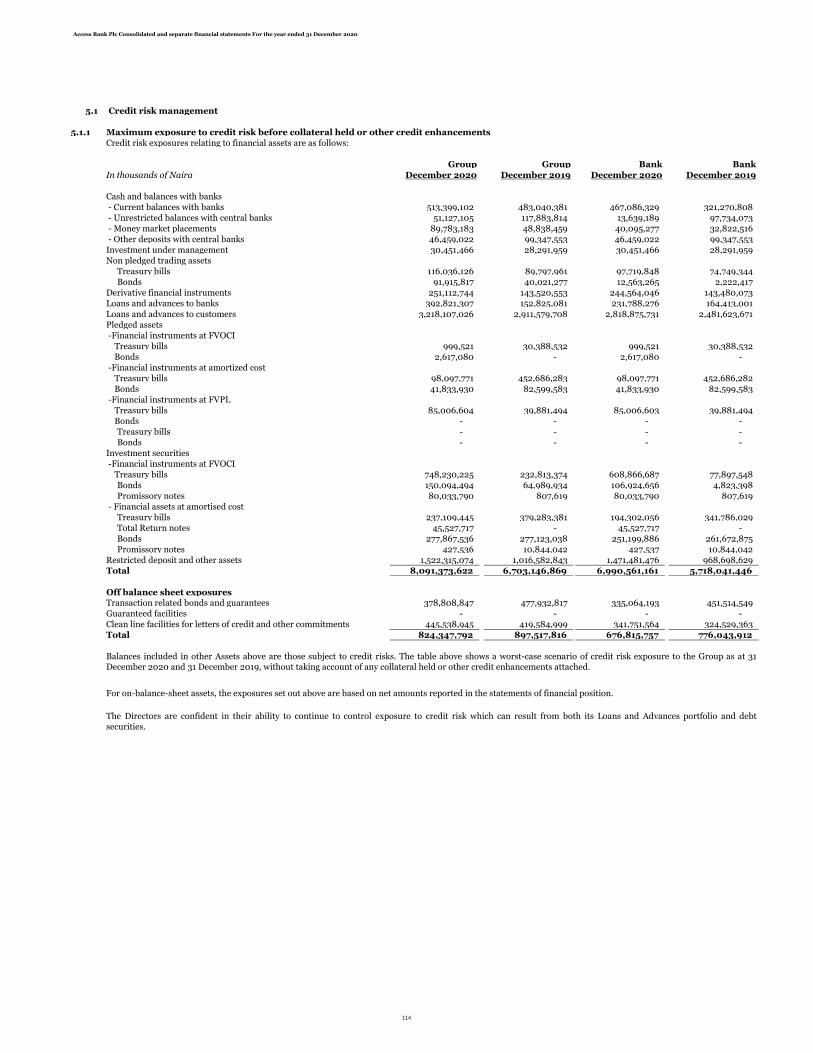
Access Bank Plc Consolidated and separate financial statements For the year ended 31 December 2020
5.1 Credit risk management
5.1.1 Maximum exposure to credit risk before collateral held or other credit enhancements
Credit risk exposures relating to financial assets are as follows:
Group Group Bank Bank
In thousands of Naira December 2020 December 2019 December 2020 December 2019
Cash and balances with banks
- Current balances with banks 513,399,102 483,040,381 467,086,329 321,270,808
- Unrestricted balances with central banks 51,127,105 117,883,814 13,639,189 97,734,073
- Money market placements 89,783,183 48,838,459 40,095,277 32,822,516
- Other deposits with central banks 46,459,022 99,347,553 46,459,022 99,347,553
Investment under management 30,451,466 28,291,959 30,451,466 28,291,959
Non pledged trading assets
Treasury bills 116,036,126 89,797,961 97,719,848 74,749,344
Bonds 91,915,817 40,021,277 12,563,265 2,222,417
Derivative financial instruments 251,112,744 143,520,553 244,564,046 143,480,073
Loans and advances to banks 392,821,307 152,825,081 231,788,276 164,413,001
Loans and advances to customers 3,218,107,026 2,911,579,708 2,818,875,731 2,481,623,671
Pledged assets
-Financial instruments at FVOCI
Treasury bills 999,521 30,388,532 999,521 30,388,532
Bonds 2,617,080 - 2,617,080 -
-Financial instruments at amortized cost
Treasury bills 98,097,771 452,686,283 98,097,771 452,686,282
Bonds 41,833,930 82,599,583 41,833,930 82,599,583
-Financial instruments at FVPL
Treasury bills 85,006,604 39,881,494 85,006,603 39,881,494
Bonds - - - -
Treasury bills - - - -
Bonds - - - -
Investment securities
-Financial instruments at FVOCI
Treasury bills 748,230,225 232,813,374 608,866,687 77,897,548
Bonds 150,094,494 64,989,934 106,924,656 4,823,398
Promissory notes 80,033,790 807,619 80,033,790 807,619
- Financial assets at amortised cost
Treasury bills 237,109,445 379,283,381 194,302,056 341,786,029
Total Return notes 45,527,717 - 45,527,717 -
Bonds 277,867,536 277,123,038 251,199,886 261,672,875
Promissory notes 427,536 10,844,042 427,537 10,844,042
Restricted deposit and other assets 1,522,315,074 1,016,582,843 1,471,481,476 968,698,629
Total 8,091,373,622 6,703,146,869 6,990,561,161 5,718,041,446
Off balance sheet exposuresTransaction related bonds and guarantees 378,808,847 477,932,817 335,064,193 451,514,549
Guaranteed facilities - - - -
Clean line facilities for letters of credit and other commitments 445,538,945 419,584,999 341,751,564 324,529,363
Total 824,347,792 897,517,816 676,815,757 776,043,912
Balances included in other Assets above are those subject to credit risks. The table above shows a worst-case scenario of credit risk exposure to the Group as at 31December 2020 and 31 December 2019, without taking account of any collateral held or other credit enhancements attached.
The Directors are confident in their ability to continue to control exposure to credit risk which can result from both its Loans and Advances portfolio and debtsecurities.
For on-balance-sheet assets, the exposures set out above are based on net amounts reported in the statements of financial position.
114
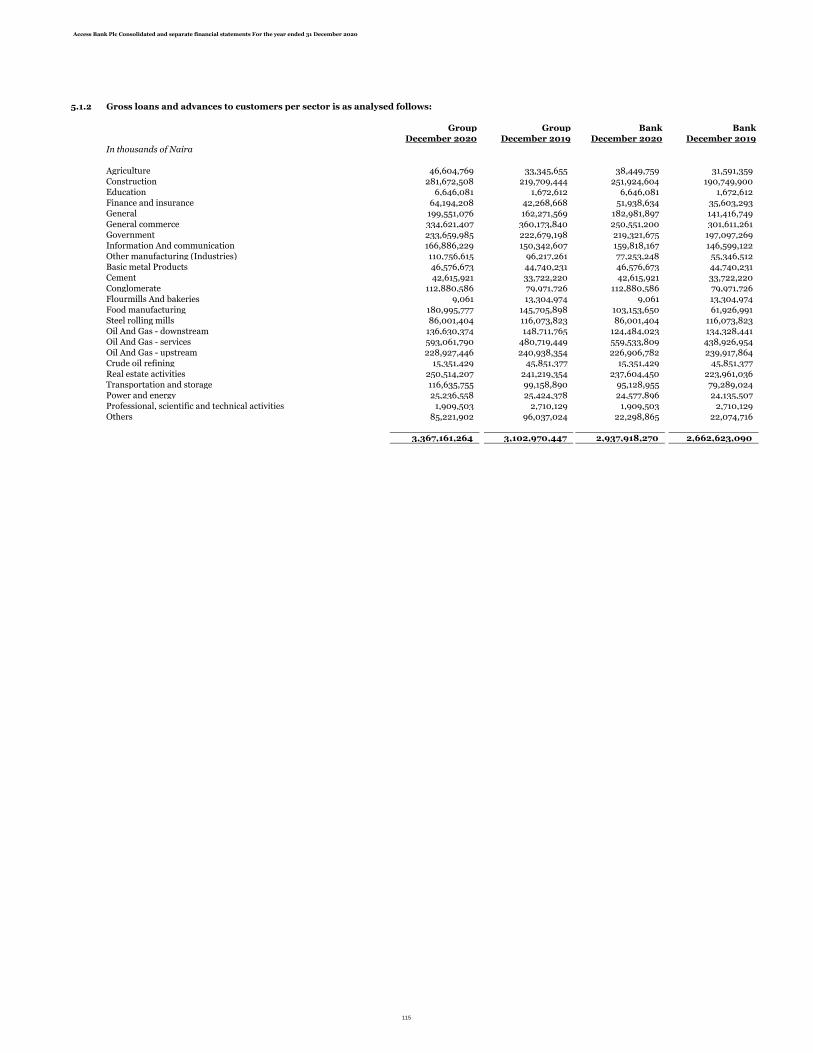
Access Bank Plc Consolidated and separate financial statements For the year ended 31 December 2020
5.1.2
Group Group Bank Bank
December 2020 December 2019 December 2020 December 2019
In thousands of Naira
Agriculture 46,604,769 33,345,655 38,449,759 31,591,359
Construction 281,672,508 219,709,444 251,924,604 190,749,900
Education 6,646,081 1,672,612 6,646,081 1,672,612
Finance and insurance 64,194,208 42,268,668 51,938,634 35,603,293
General 199,551,076 162,271,569 182,981,897 141,416,749
General commerce 334,621,407 360,173,840 250,551,200 301,611,261
Government 233,659,985 222,679,198 219,321,675 197,097,269
Information And communication 166,886,229 150,342,607 159,818,167 146,599,122
Other manufacturing (Industries) 110,756,615 96,217,261 77,253,248 55,346,512
Basic metal Products 46,576,673 44,740,231 46,576,673 44,740,231
Cement 42,615,921 33,722,220 42,615,921 33,722,220
Conglomerate 112,880,586 79,971,726 112,880,586 79,971,726
Flourmills And bakeries 9,061 13,304,974 9,061 13,304,974
Food manufacturing 180,995,777 145,705,898 103,153,650 61,926,991
Steel rolling mills 86,001,404 116,073,823 86,001,404 116,073,823
Oil And Gas - downstream 136,630,374 148,711,765 124,484,023 134,328,441
Oil And Gas - services 593,061,790 480,719,449 559,533,809 438,926,954
Oil And Gas - upstream 228,927,446 240,938,354 226,906,782 239,917,864
Crude oil refining 15,351,429 45,851,377 15,351,429 45,851,377
Real estate activities 250,514,207 241,219,354 237,604,450 223,961,036
Transportation and storage 116,635,755 99,158,890 95,128,955 79,289,024
Power and energy 25,236,558 25,424,378 24,577,896 24,135,507
Professional, scientific and technical activities 1,909,503 2,710,129 1,909,503 2,710,129
Others 85,221,902 96,037,024 22,298,865 22,074,716
3,367,161,264 3,102,970,447 2,937,918,270 2,662,623,090
Gross loans and advances to customers per sector is as analysed follows:
115

Access Bank Plc Consolidated and separate financial statements For the year ended 31 December 2020
5.1.3(a) GroupDecember 2020Credit quality by class
Loans to retail customersIn thousands of Naira Stage 1 Stage 2 Stage 3 Total Stage 1 Stage 2 Stage 3 Total Carrying
Gross amount Gross amount Gross amount Gross amount ECL ECL ECL ECL amountInternal rating gradeInvestment - - - - - - - - - Standard grade 186,055,014 12,890,519 - 198,945,533 629,734 431,507 - 1,061,241 197,884,292 Non-Investment - 400,171 9,958,273 10,358,444 - 329,538 2,621,276 2,950,813 7,407,631
Loans to corporate customersIn thousands of Naira Stage 1 Stage 2 Stage 3 Total Stage 1 Stage 2 Stage 3 Total Carrying
Gross amount Gross amount Gross amount Gross amount ECL ECL ECL ECL amountInternal rating gradeInvestment 1,521,827,027 69,704,614 - 1,591,531,641 15,886,487 4,326,734 - 20,213,222 1,571,318,419 Standard grade 1,024,263,227 380,763,903 - 1,405,027,131 16,103,406 45,509,751 - 61,613,156 1,343,413,975 Non-Investment - 10,154,033 151,144,481 161,298,514 - 8,394,219 54,821,587 63,215,805 98,082,709
Loans and advances to banksIn thousands of Naira Stage 1 Stage 2 Stage 3 Total Stage 1 Stage 2 Stage 3 Total Carrying
Gross amount Gross amount Gross amount Gross amount ECL ECL ECL ECL amountInternal rating gradeInvestment 393,326,719 - - 393,326,719 599,195 - - 599,195 392,727,523 Standard grade 6,411 - - 6,411 188 - - 188 6,224 Non-Investment - - 140,061 140,061 - - 52,501 52,501 87,560
Off balance sheetIn thousands of Naira Stage 1 Stage 2 Stage 3 Total Stage 1 Stage 2 Stage 3 Total Carrying
Gross amount Gross amount Gross amount Gross amount ECL ECL ECL ECL amountInternal rating gradeInvestment 392,519,731 - - 392,519,731 245,291 - - 245,291 392,274,441 Standard grade 413,915,207 16,631,872 - 430,547,079 2,409,584 43,489 - 2,453,073 428,094,007 Non-Investment 40,832 1,240,150 - 1,280,983 705 40,966 - 41,671 1,239,312
Investment securitiesIn thousands of Naira Stage 1 Stage 2 Stage 3 Total Stage 1 Stage 2 Stage 3 Total Carrying
Gross amount Gross amount Gross amount Gross amount ECL ECL ECL ECL amountInternal rating gradeInvestment 370,970,748 - - 370,970,748 55,878 - - 55,878 370,914,870 Standard grade 1,229,097,842 - 472,288 1,229,570,130 344,654 - 472,288 816,941 1,228,753,188 Non-Investment 6,068,075 - - 6,068,075 89,873 - - 89,873 5,978,202
Money market placementsIn thousands of Naira Stage 1 Stage 2 Stage 3 Total Stage 1 Stage 2 Stage 3 Total Carrying
Gross amount Gross amount Gross amount Gross amount ECL ECL ECL ECL amountInternal rating gradeInvestment 73,757,529 - - 73,757,529 171,203 - - 171,203 73,586,325 Standard grade 8,019,055 - - 8,019,055 31,955 - - 31,955 7,987,100 Non-Investment 8,006,600 - - 8,006,600 1,700 - - 1,700 8,004,900
116
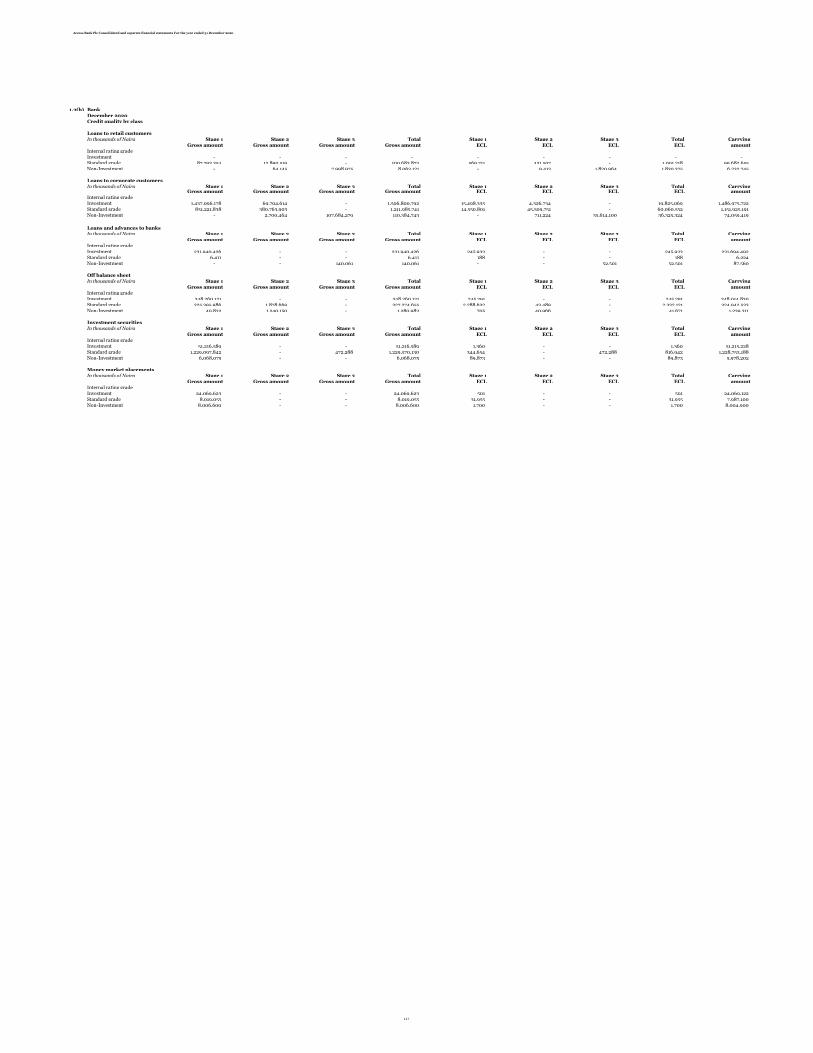
Access Bank Plc Consolidated and separate financial statements For the year ended 31 December 2020
5.1.3(b) BankDecember 2020Credit quality by class
Loans to retail customersIn thousands of Naira Stage 1 Stage 2 Stage 3 Total Stage 1 Stage 2 Stage 3 Total Carrying
Gross amount Gross amount Gross amount Gross amount ECL ECL ECL ECL amountInternal rating gradeInvestment - - - - - - - - - Standard grade 87,793,354 12,890,519 - 100,683,873 569,711 431,507 - 1,001,218 99,682,655 Non-Investment - 64,145 7,998,975 8,063,121 - 9,413 1,820,964 1,830,375 6,232,745
Loans to corporate customersIn thousands of Naira Stage 1 Stage 2 Stage 3 Total Stage 1 Stage 2 Stage 3 Total Carrying
Gross amount Gross amount Gross amount Gross amount ECL ECL ECL ECL amountInternal rating gradeInvestment 1,437,096,178 69,704,614 - 1,506,800,792 15,498,335 4,326,734 - 19,825,069 1,486,975,722 Standard grade 831,221,838 380,763,903 - 1,211,985,741 14,550,801 45,509,751 - 60,060,552 1,151,925,191 Non-Investment - 2,700,464 107,684,279 110,384,743 - 711,224 35,614,100 36,325,324 74,059,419 Stage 1 Stage 2 Stage 3 -
Loans and advances to banksIn thousands of Naira Stage 1 Stage 2 Stage 3 Total Stage 1 Stage 2 Stage 3 Total Carrying
Gross amount Gross amount Gross amount Gross amount ECL ECL ECL ECL amountInternal rating gradeInvestment 231,940,426 - - 231,940,426 245,933 - - 245,933 231,694,492 Standard grade 6,411 - - 6,411 188 - - 188 6,224 Non-Investment - - 140,061 140,061 - - 52,501 52,501 87,560
Off balance sheetIn thousands of Naira Stage 1 Stage 2 Stage 3 Total Stage 1 Stage 2 Stage 3 Total Carrying
Gross amount Gross amount Gross amount Gross amount ECL ECL ECL ECL amountInternal rating gradeInvestment 348,260,121 - - 348,260,121 245,291 - - 245,291 348,014,830 Standard grade 325,395,986 1,878,669 - 327,274,655 2,288,632 43,489 - 2,332,121 324,942,533 Non-Investment 40,832 1,240,150 - 1,280,983 705 40,966 - 41,671 1,239,311
Investment securitiesIn thousands of Naira Stage 1 Stage 2 Stage 3 Total Stage 1 Stage 2 Stage 3 Total Carrying
Gross amount Gross amount Gross amount Gross amount ECL ECL ECL ECL amountInternal rating gradeInvestment 51,216,589 - - 51,216,589 1,360 - - 1,360 51,215,228 Standard grade 1,229,097,842 - 472,288 1,229,570,130 344,654 - 472,288 816,942 1,228,753,188 Non-Investment 6,068,075 - - 6,068,075 89,873 - - 89,873 5,978,202
Money market placementsIn thousands of Naira Stage 1 Stage 2 Stage 3 Total Stage 1 Stage 2 Stage 3 Total Carrying
Gross amount Gross amount Gross amount Gross amount ECL ECL ECL ECL amountInternal rating gradeInvestment 24,069,623 - - 24,069,623 501 - - 501 24,069,122 Standard grade 8,019,055 - - 8,019,055 31,955 - - 31,955 7,987,100 Non-Investment 8,006,600 - - 8,006,600 1,700 - - 1,700 8,004,900
117
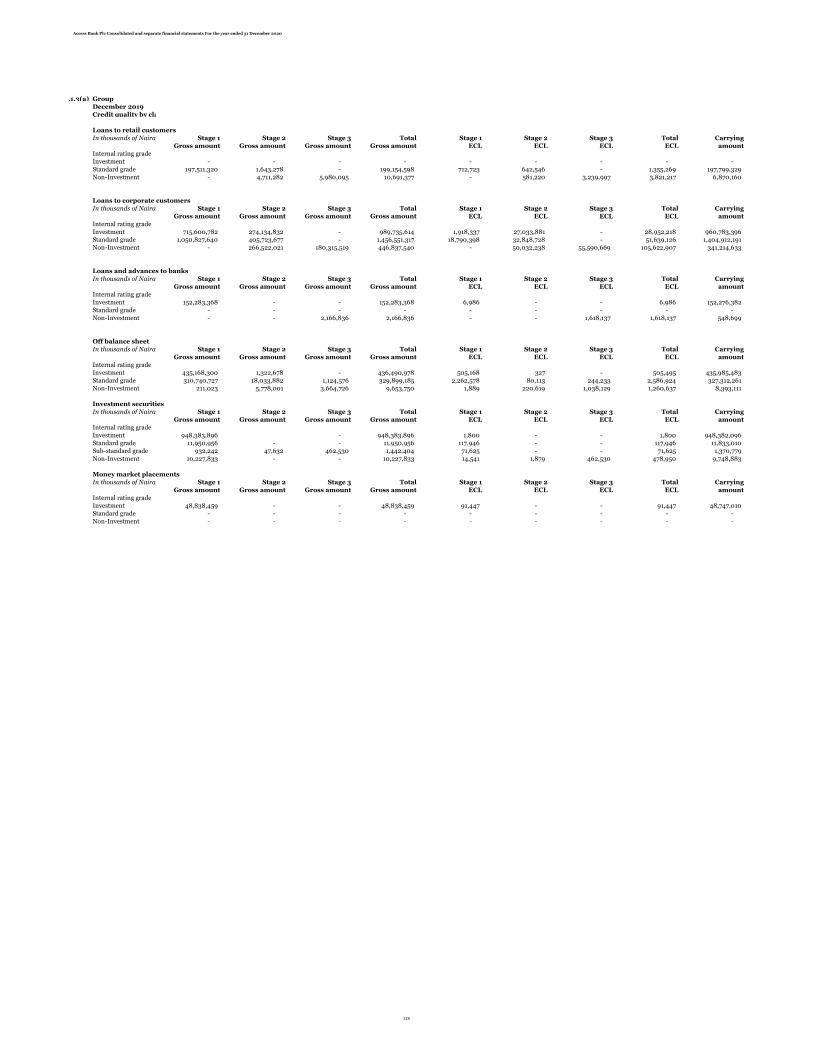
Access Bank Plc Consolidated and separate financial statements For the year ended 31 December 2020
5.1.3(a) Group
December 2019
Credit quality by class
Loans to retail customers
In thousands of Naira Stage 1 Stage 2 Stage 3 Total Stage 1 Stage 2 Stage 3 Total Carrying
Gross amount Gross amount Gross amount Gross amount ECL ECL ECL ECL amount
Internal rating grade
Investment - - - - - - - - -
Standard grade 197,511,320 1,643,278 - 199,154,598 712,723 642,546 - 1,355,269 197,799,329
Non-Investment - 4,711,282 5,980,095 10,691,377 - 581,220 3,239,997 3,821,217 6,870,160
Loans to corporate customers
In thousands of Naira Stage 1 Stage 2 Stage 3 Total Stage 1 Stage 2 Stage 3 Total Carrying
Gross amount Gross amount Gross amount Gross amount ECL ECL ECL ECL amount
Internal rating grade
Investment 715,600,782 274,134,832 - 989,735,614 1,918,337 27,033,881 - 28,952,218 960,783,396
Standard grade 1,050,827,640 405,723,677 - 1,456,551,317 18,790,398 32,848,728 - 51,639,126 1,404,912,191
Non-Investment - 266,522,021 180,315,519 446,837,540 - 50,032,238 55,590,669 105,622,907 341,214,633
Loans and advances to banks
In thousands of Naira Stage 1 Stage 2 Stage 3 Total Stage 1 Stage 2 Stage 3 Total Carrying
Gross amount Gross amount Gross amount Gross amount ECL ECL ECL ECL amount
Internal rating grade
Investment 152,283,368 - - 152,283,368 6,986 - - 6,986 152,276,382
Standard grade - - - - - - - - -
Non-Investment - - 2,166,836 2,166,836 - - 1,618,137 1,618,137 548,699
Off balance sheet
In thousands of Naira Stage 1 Stage 2 Stage 3 Total Stage 1 Stage 2 Stage 3 Total Carrying
Gross amount Gross amount Gross amount Gross amount ECL ECL ECL ECL amount
Internal rating grade
Investment 435,168,300 1,322,678 - 436,490,978 505,168 327 - 505,495 435,985,483
Standard grade 310,740,727 18,033,882 1,124,576 329,899,185 2,262,578 80,113 244,233 2,586,924 327,312,261
Non-Investment 211,023 5,778,001 3,664,726 9,653,750 1,889 220,619 1,038,129 1,260,637 8,393,111
Investment securities
In thousands of Naira Stage 1 Stage 2 Stage 3 Total Stage 1 Stage 2 Stage 3 Total Carrying
Gross amount Gross amount Gross amount Gross amount ECL ECL ECL ECL amount
Internal rating grade
Investment 948,383,896 - 948,383,896 1,800 - - 1,800 948,382,096
Standard grade 11,950,956 - - 11,950,956 117,946 - - 117,946 11,833,010
Sub-standard grade 932,242 47,632 462,530 1,442,404 71,625 - - 71,625 1,370,779
Non-Investment 10,227,833 - - 10,227,833 14,541 1,879 462,530 478,950 9,748,883
Money market placements
In thousands of Naira Stage 1 Stage 2 Stage 3 Total Stage 1 Stage 2 Stage 3 Total Carrying
Gross amount Gross amount Gross amount Gross amount ECL ECL ECL ECL amount
Internal rating grade
Investment 48,838,459 - - 48,838,459 91,447 - - 91,447 48,747,010
Standard grade - - - - - - - - -
Non-Investment - - - - - - - - -
118
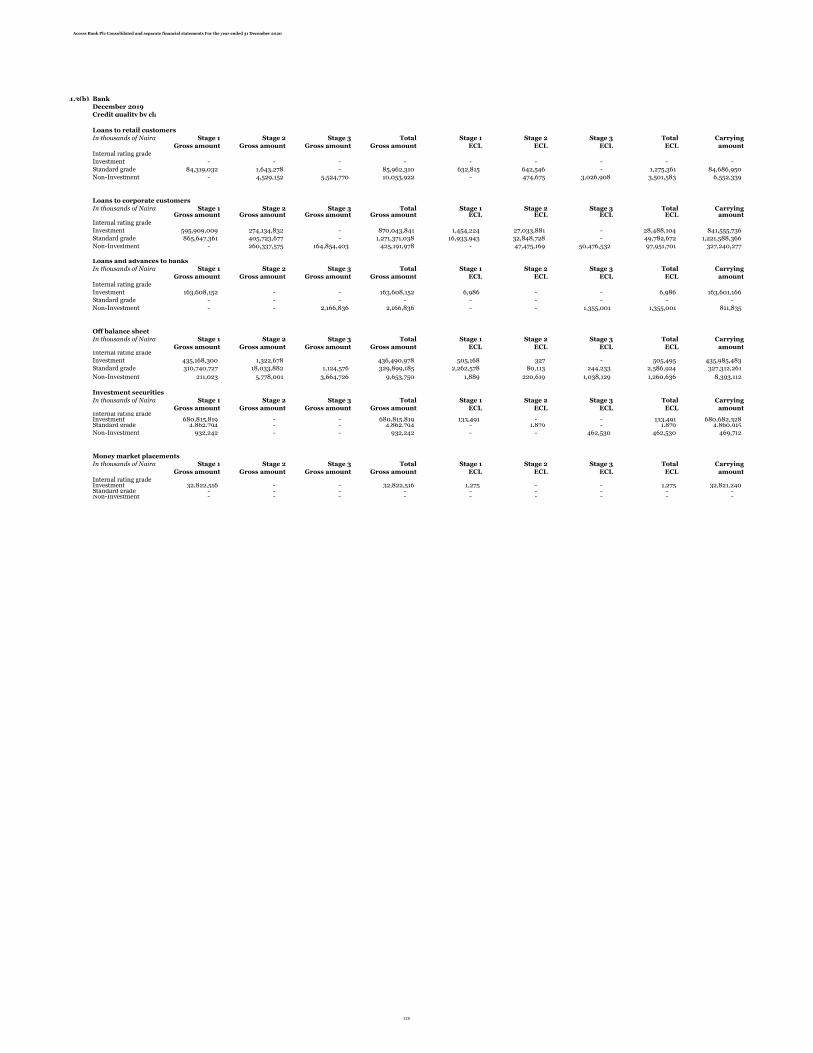
Access Bank Plc Consolidated and separate financial statements For the year ended 31 December 2020
5.1.3(b) Bank
December 2019
Credit quality by class
Loans to retail customers
In thousands of Naira Stage 1 Stage 2 Stage 3 Total Stage 1 Stage 2 Stage 3 Total Carrying
Gross amount Gross amount Gross amount Gross amount ECL ECL ECL ECL amount
Internal rating grade
Investment - - - - - - - - -
Standard grade 84,319,032 1,643,278 - 85,962,310 632,815 642,546 - 1,275,361 84,686,950
Non-Investment - 4,529,152 5,524,770 10,053,922 - 474,675 3,026,908 3,501,583 6,552,339
Loans to corporate customers
In thousands of Naira Stage 1 Stage 2 Stage 3 Total Stage 1 Stage 2 Stage 3 Total CarryingGross amount Gross amount Gross amount Gross amount ECL ECL ECL ECL amount
Internal rating grade
Investment 595,909,009 274,134,832 - 870,043,841 1,454,224 27,033,881 - 28,488,104 841,555,736
Standard grade 865,647,361 405,723,677 - 1,271,371,038 16,933,943 32,848,728 - 49,782,672 1,221,588,366
Non-Investment - 260,337,575 164,854,403 425,191,978 - 47,475,169 50,476,532 97,951,701 327,240,277 -
Loans and advances to banks
In thousands of Naira Stage 1 Stage 2 Stage 3 Total Stage 1 Stage 2 Stage 3 Total Carrying
Gross amount Gross amount Gross amount Gross amount ECL ECL ECL ECL amount
Internal rating grade
Investment 163,608,152 - - 163,608,152 6,986 - - 6,986 163,601,166
Standard grade - - - - - - - - -
Non-Investment - - 2,166,836 2,166,836 - - 1,355,001 1,355,001 811,835
Off balance sheet
In thousands of Naira Stage 1 Stage 2 Stage 3 Total Stage 1 Stage 2 Stage 3 Total Carrying
Gross amount Gross amount Gross amount Gross amount ECL ECL ECL ECL amountInternal rating grade
Investment 435,168,300 1,322,678 - 436,490,978 505,168 327 - 505,495 435,985,483
Standard grade 310,740,727 18,033,882 1,124,576 329,899,185 2,262,578 80,113 244,233 2,586,924 327,312,261
Non-Investment 211,023 5,778,001 3,664,726 9,653,750 1,889 220,619 1,038,129 1,260,636 8,393,112
Investment securities
In thousands of Naira Stage 1 Stage 2 Stage 3 Total Stage 1 Stage 2 Stage 3 Total Carrying
Gross amount Gross amount Gross amount Gross amount ECL ECL ECL ECL amountInternal rating gradeInvestment 680,815,819 - - 680,815,819 133,491 - - 133,491 680,682,328 Standard grade 4,862,794 - - 4,862,794 - 1,879 - 1,879 4,860,915
Non-Investment 932,242 - - 932,242 - - 462,530 462,530 469,712
Money market placements
In thousands of Naira Stage 1 Stage 2 Stage 3 Total Stage 1 Stage 2 Stage 3 Total Carrying
Gross amount Gross amount Gross amount Gross amount ECL ECL ECL ECL amount
Internal rating gradeInvestment 32,822,516 - - 32,822,516 1,275 - - 1,275 32,821,240 Standard grade - - - - - - - - - Non-Investment - - - - - - - - -
119

Access Bank Plc Consolidated and separate financial statements For the year ended 31 December 2020
5.1.3 Credit quality
(c) Credit quality by risk rating class
Group
In thousands of Naira
December 2020
Loans and advances to retail customers
Stage 1 Stage 2 Stage 3 Total Stage 1 Stage 2 Stage 3 Total Carrying
External Rating Equivalent Grade Risk Rating Gross amount Gross amount Gross amount Gross amount ECL ECL ECL ECL amount
BB+ Standard 3+ 475,341 13,094 - 488,434 1,522 98 - 1,620 486,814
BB Standard 3 181,334,482 12,460,551 - 193,795,032 493,605 424,015 - 917,619 192,877,413
BB- Standard 3- 4,245,191 416,875 - 4,662,066 134,607 7,394 - 142,001 4,520,065
B Non-Investment 4 - 54,324 - 54,324 - 9,381 - 9,381 44,943
B- Non-Investment 5 - 345,847 - 345,847 - 320,157 - 320,157 25,693
CCC Non-Investment 6 - - 6,888,825 6,888,825 - - 2,012,556 2,012,556 4,876,270
C Non-Investment 7 - - 471,346 471,346 - - 96,965 96,965 374,381
D Non-Investment 8 - - 2,598,102 2,598,102 - - 511,755 511,755 2,086,348
Carrying amount 186,055,014 13,290,692 9,958,274 209,303,978 629,734 761,045 2,621,276 4,012,054 205,291,927
Loans and advances to corporate customers
Stage 1 Stage 2 Stage 3 Total Stage 1 Stage 2 Stage 3 Total Carrying
External Rating Equivalent Grade Risk Rating Gross amount Gross amount Gross amount Gross amount ECL ECL ECL ECL amount
AAA Investment 1 143,495,419 - - 143,495,419 214,971 - - 214,971 143,280,448
AA Investment 2+ 280,976,157 43,530,087 - 324,506,243 455,065 3,606,001 - 4,061,066 320,445,177
A Investment 2 346,719,174 24,810,840 - 371,530,013 2,785,685 646,770 - 3,432,455 368,097,558
BBB Investment 2- 750,636,277 1,363,688 - 751,999,964 13,595,219 73,963 - 13,669,182 738,330,782
BB+ Standard 3+ 290,256,529 12,174,547 - 302,431,076 1,889,266 2,082,846 - 3,972,112 298,458,964
BB Standard 3 631,194,806 307,585,837 - 938,780,644 7,404,751 37,547,266 - 44,952,018 893,828,626
BB- Standard 3- 102,811,892 61,003,519 - 163,815,410 5,644,935 5,879,639 - 11,524,573 152,290,838
B Non-Investment 4 - 1,426,987 - 1,426,987 - 395,965 - 395,965 1,031,022
B- Non-Investment 5 - 8,727,046 - 8,727,046 - 7,998,254 - 7,998,254 728,793
CCC Non-Investment 6 - - 60,471,259 60,471,259 - - 22,785,822 22,785,822 37,685,437
C Non-Investment 7 - - 81,073,585 81,073,585 - - 29,945,749 29,945,749 51,127,837
D Non-Investment 8 - - 9,599,636 9,599,636 - - 2,090,016 2,090,016 7,509,620
2,546,090,254 460,622,552 151,144,481 3,157,857,284 31,989,892 58,230,704 54,821,586 145,042,182 3,012,815,101
Loans and advances to banks
Stage 1 Stage 2 Stage 3 Total Stage 1 Stage 2 Stage 3 Total Carrying
External Rating Equivalent Grade Risk Rating Gross amount Gross amount Gross amount Gross amount ECL ECL ECL ECL amount
AAA Investment 1 393,326,719 - - 393,326,719 599,195 - - 599,195 392,727,523
AA Investment 2+ - - - - - - - - -
A Investment 2 - - - - - - - - -
BBB Investment 2- - - - - - - - - -
BB+ Standard 3+ - - - - - - - - -
BB Standard 3 6,411 - - 6,411 188 - - 188 6,224
BB- Standard 3- - - - - - - - - -
B Non-Investment 4 - - - - - - - - -
B- Non-Investment 5 - - - - - - - - -
CCC Non-Investment 6 - - - - - - - - -
C Non-Investment 7 - - - - - - - - -
D Non-Investment 8 - - 140,061 140,061 - - 52,501 52,501 87,560
393,333,130 - 140,061 393,473,191 599,383 - 52,501 651,884 392,821,308
120
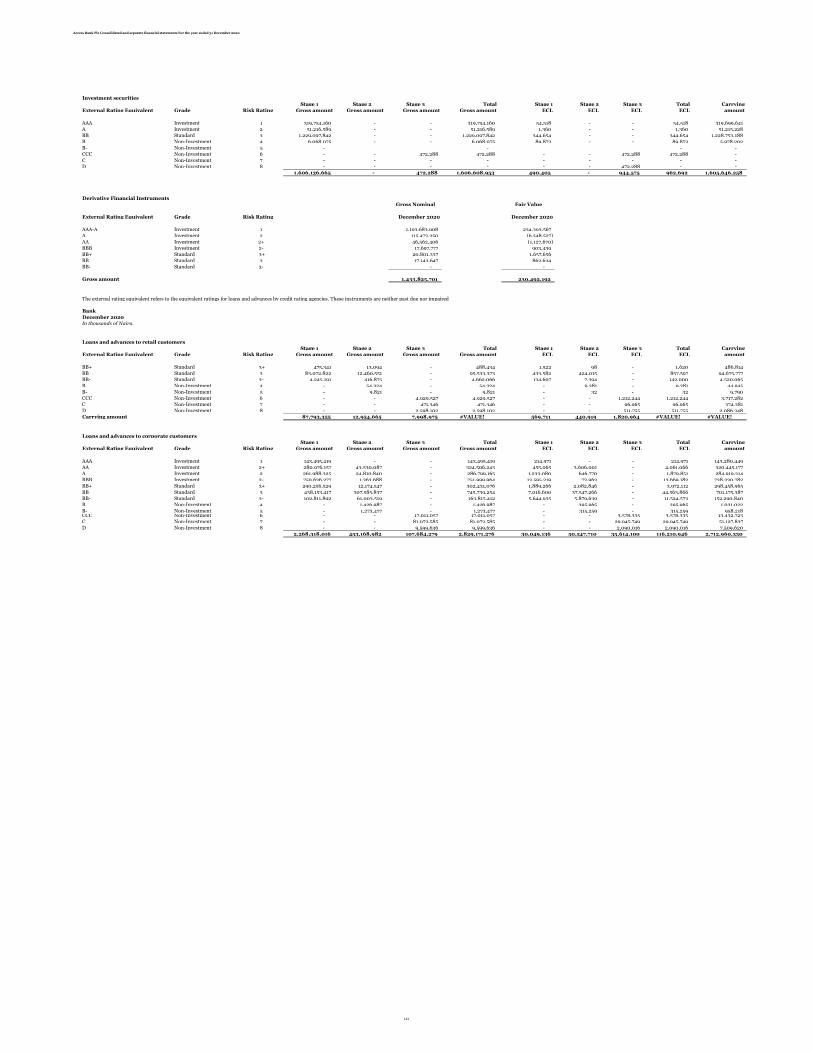
Access Bank Plc Consolidated and separate financial statements For the year ended 31 December 2020
Investment securities
Stage 1 Stage 2 Stage 3 Total Stage 1 Stage 2 Stage 3 Total Carrying
External Rating Equivalent Grade Risk Rating Gross amount Gross amount Gross amount Gross amount ECL ECL ECL ECL amount
AAA Investment 1 319,754,160 - - 319,754,160 54,518 - - 54,518 319,699,641
A Investment 2 51,216,589 - - 51,216,589 1,360 - - 1,360 51,215,228
BB Standard 3 1,229,097,842 - - 1,229,097,842 344,654 - - 344,654 1,228,753,188
B Non-Investment 4 6,068,075 - - 6,068,075 89,873 - - 89,873 5,978,202
B- Non-Investment 5 - - - -
CCC Non-Investment 6 - - 472,288 472,288 - - 472,288 472,288 -
C Non-Investment 7 - - - - - - - - -
D Non-Investment 8 - - - - - - 472,288 - -
1,606,136,665 - 472,288 1,606,608,953 490,405 - 944,575 962,692 1,605,646,258
Derivative Financial Instruments
Gross Nominal Fair Value
External Rating Equivalent Grade Risk Rating December 2020 December 2020
AAA-A Investment 1 1,193,683,908 234,393,567
A Investment 2 115,473,350 (6,548,527)
AA Investment 2+ 46,562,406 (1,127,670)
BBB Investment 2- 17,697,777 903,439
BB+ Standard 3+ 20,801,337 1,657,656
BB Standard 3 17,143,647 863,634
BB- Standard 3- - -
Gross amount 1,433,825,701 230,492,192
Bank
December 2020
In thousands of Naira
Loans and advances to retail customers
Stage 1 Stage 2 Stage 3 Total Stage 1 Stage 2 Stage 3 Total Carrying
External Rating Equivalent Grade Risk Rating Gross amount Gross amount Gross amount Gross amount ECL ECL ECL ECL amount
BB+ Standard 3+ 475,341 13,094 - 488,434 1,522 98 - 1,620 486,814
BB Standard 3 83,072,822 12,460,551 - 95,533,373 433,582 424,015 - 857,597 94,675,777
BB- Standard 3- 4,245,191 416,875 - 4,662,066 134,607 7,394 - 142,000 4,520,065
B Non-Investment 4 - 54,324 - 54,324 - 9,381 - 9,381 44,945
B- Non-Investment 5 - 9,821 - 9,821 - 32 - 32 9,790
CCC Non-Investment 6 - - 4,929,527 4,929,527 - - 1,212,244 1,212,244 3,717,282
C Non-Investment 7 - - 471,346 471,346 - - 96,965 96,965 374,381
D Non-Investment 8 - - 2,598,102 2,598,102 - - 511,755 511,755 2,086,348
Carrying amount 87,793,355 12,954,665 7,998,975 #VALUE! 569,711 440,919 1,820,964 #VALUE! #VALUE!
1,337,633.72€ 33,451,819.25€
#VALUE! #VALUE!
Loans and advances to corporate customers
Stage 1 Stage 2 Stage 3 Total Stage 1 Stage 2 Stage 3 Total Carrying
External Rating Equivalent Grade Risk Rating Gross amount Gross amount Gross amount Gross amount ECL ECL ECL ECL amount
AAA Investment 1 143,495,419 - - 143,495,419 214,971 - - 214,971 143,280,449
AA Investment 2+ 280,976,157 43,530,087 - 324,506,243 455,065 3,606,001 - 4,061,066 320,445,177
A Investment 2 261,988,325 24,810,840 - 286,799,165 1,233,080 646,770 - 1,879,851 284,919,314
BBB Investment 2- 750,636,277 1,363,688 - 751,999,964 13,595,219 73,963 - 13,669,182 738,330,782
BB+ Standard 3+ 290,256,529 12,174,547 - 302,431,076 1,889,266 2,082,846 - 3,972,112 298,458,965
BB Standard 3 438,153,417 307,585,837 - 745,739,254 7,016,600 37,547,266 - 44,563,866 701,175,387
BB- Standard 3- 102,811,892 61,003,519 - 163,815,412 5,644,935 5,879,639 - 11,524,573 152,290,840
B Non-Investment 4 - 1,426,987 - 1,426,987 - 395,965 - 395,965 1,031,022
B- Non-Investment 5 - 1,273,477 - 1,273,477 - 315,259 - 315,259 958,218 CCC Non-Investment 6 - - 17,011,057 17,011,057 - - 3,578,335 3,578,335 13,432,723
C Non-Investment 7 - - 81,073,585 81,073,585 - - 29,945,749 29,945,749 51,127,837
D Non-Investment 8 - - 9,599,636 9,599,636 - - 2,090,016 2,090,016 7,509,620
2,268,318,016 453,168,982 107,684,279 2,829,171,276 30,049,136 50,547,710 35,614,100 116,210,946 2,712,960,330
The external rating equivalent refers to the equivalent ratings for loans and advances by credit rating agencies. These instruments are neither past due nor impaired
121
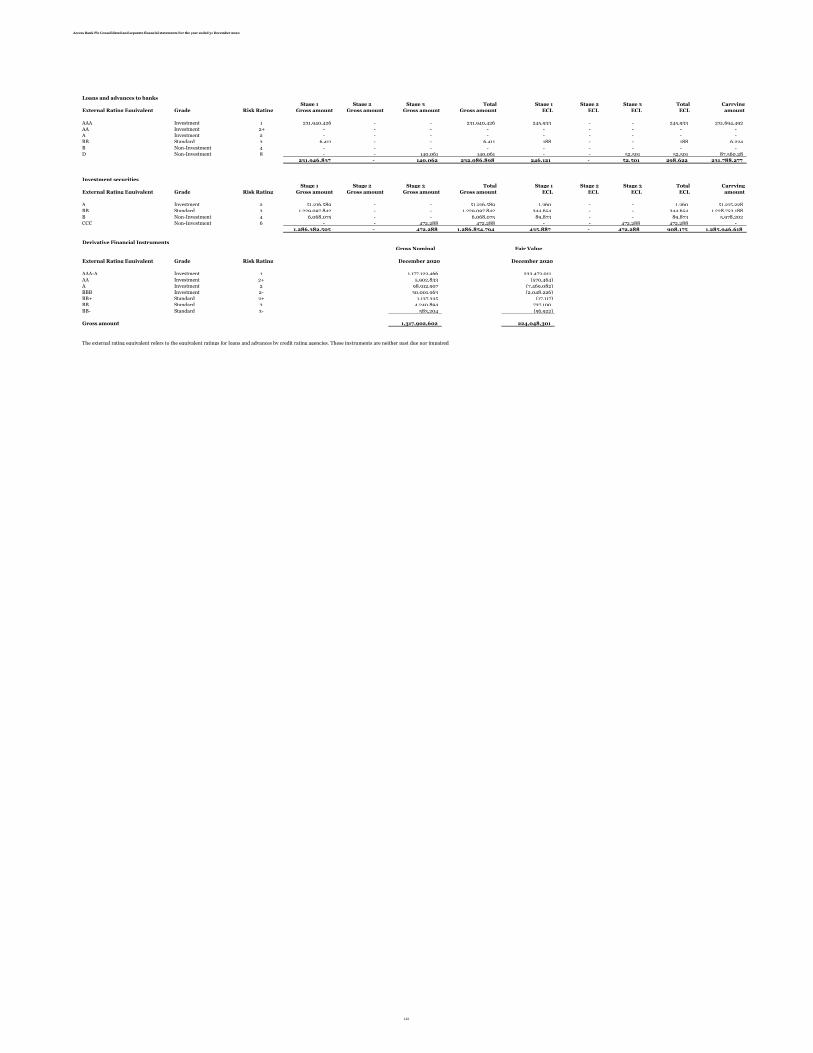
Access Bank Plc Consolidated and separate financial statements For the year ended 31 December 2020
Loans and advances to banks
Stage 1 Stage 2 Stage 3 Total Stage 1 Stage 2 Stage 3 Total Carrying
External Rating Equivalent Grade Risk Rating Gross amount Gross amount Gross amount Gross amount ECL ECL ECL ECL amount
AAA Investment 1 231,940,426 - - 231,940,426 245,933 - - 245,933 231,694,492
AA Investment 2+ - - - - - - - - -
A Investment 2 - - - - - - - - -
BB Standard 3 6,411 - - 6,411 188 - - 188 6,224
B Non-Investment 4 - - - - - - - - -
D Non-Investment 8 - - 140,061 140,061 - - 52,501 52,501 87,560.28
231,946,837 - 140,062 232,086,898 246,121 - 52,501 298,622 231,788,277
Investment securities
Stage 1 Stage 2 Stage 3 Total Stage 1 Stage 2 Stage 3 Total Carrying
External Rating Equivalent Grade Risk Rating Gross amount Gross amount Gross amount Gross amount ECL ECL ECL ECL amount
A Investment 2 51,216,589 - - 51,216,589 1,360 - - 1,360 51,215,228
BB Standard 3 1,229,097,842 - - 1,229,097,842 344,654 - - 344,654 1,228,753,188
B Non-Investment 4 6,068,075 - - 6,068,075 89,873 - - 89,873 5,978,202
CCC Non-Investment 6 - - 472,288 472,288 - - 472,288 472,288 -
1,286,382,505 - 472,288 1,286,854,794 435,887 - 472,288 908,175 1,285,946,618
Derivative Financial Instruments
Gross Nominal Fair Value
External Rating Equivalent Grade Risk Rating December 2020 December 2020
AAA-A Investment 1 1,177,123,466 233,473,011
AA Investment 2+ 5,902,833 (570,464)
A Investment 2 98,912,907 (7,469,082)
BBB Investment 2- 30,001,963 (2,048,226)
BB+ Standard 3+ 1,137,335 (17,117)
BB Standard 3 4,240,894 737,100
BB- Standard 3- 583,204 (56,922)
Gross amount 1,317,902,602 224,048,301
The external rating equivalent refers to the equivalent ratings for loans and advances by credit rating agencies. These instruments are neither past due nor impaired
122

Access Bank Plc Consolidated and separate financial statements For the year ended 31 December 2020
5.1.3 Credit quality(c) Credit quality by risk rating class
Group
In thousands of NairaDecember 2019
Loans and advances to retail customersStage 1 Stage 2 Stage 3 Total Stage 1 Stage 2 Stage 3 Total Carrying
External Rating Equivalent Grade Risk Rating Gross amount Gross amount Gross amount Gross amount ECL ECL ECL ECL amount
BB+ Standard 3+ 971,147 - - 971,147 5,395 - - 5,395 965,752 BB Standard 3 194,644,869 1,343,585 - 195,988,454 640,016 479,342 - 1,119,358 194,869,095 BB- Standard 3- 1,895,304 299,693 - 2,194,997 67,312 163,204 - 230,516 1,964,482 B Non-Investment 4 - 3,861,882 - 3,861,882 - 234,704 - 234,704 3,627,179 B- Non-Investment 5 - 849,401 455,325 1,304,726 - 346,516 - 346,515 958,211 CCC Non-Investment 6 - - 3,364,354 3,364,354 - - 2,040,908 2,040,908 1,323,446 C Non-Investment 7 - - 907,961 907,961 - - 487,296 487,296 420,665 D Non-Investment 8 - - 1,252,455 1,252,455 - - 711,793 711,793 540,662 Carrying amount 197,511,320 6,354,561 5,980,095 209,845,976 712,723 1,223,766 3,239,997 5,176,485 204,669,491
Loans and advances to corporate customersStage 1 Stage 2 Stage 3 Total Stage 1 Stage 2 Stage 3 Total Carrying
External Rating Equivalent Grade Risk Rating Gross amount Gross amount Gross amount Gross amount ECL ECL ECL ECL amount
AAA Investment 1 141,904,070 - - 141,904,070 18,603 - - 18,603 141,885,467 AA Investment 2+ 283,074,454 37,790,380 - 320,864,834 1,181,275 1,932,467 - 3,113,742 317,751,092 A Investment 2 245,094,727 38,680,332 - 283,775,059 1,917,123 1,464,687 - 3,381,810 280,393,250 BBB Investment 2- 45,527,531 197,664,120 - 243,191,651 193,679 23,636,727 - 23,830,406 219,361,246 BB+ Standard 3+ 250,663,351 63,236,897 - 313,900,248 1,215,134 2,543,566 - 3,758,700 310,141,548 BB Standard 3 716,020,141 236,380,353 - 952,400,494 14,462,844 15,952,726 - 30,415,570 921,984,924 BB- Standard 3- 84,144,148 106,106,427 - 190,250,575 1,720,078 14,352,436 - 16,072,514 174,178,060 B Non-Investment 4 - 168,487,181 - 168,487,181 - 23,151,499 - 23,151,499 145,335,682 B- Non-Investment 5 - 98,034,841 15,461,116 113,495,957 - 26,880,739 - 26,880,739 86,615,220 CCC Non-Investment 6 - - 33,482,272 33,482,272 - - 16,906,199 16,906,199 16,576,072 C Non-Investment 7 - - 106,052,309 106,052,309 - - 28,891,972 28,891,972 77,160,337 D Non-Investment 8 - - 25,319,822 25,319,822 - - 9,792,498 9,792,498 15,527,324
1,766,428,422 946,380,531 180,315,519 2,893,124,469 20,708,736 109,914,847 55,590,669 186,214,251 2,706,910,222
Loans and advances to banksStage 1 Stage 2 Stage 3 Total Stage 1 Stage 2 Stage 3 Total Carrying
External Rating Equivalent Grade Risk Rating Gross amount Gross amount Gross amount Gross amount ECL ECL ECL ECL amount
AAA Investment 1 151,461,374 - - 151,461,374 269,668 - - 269,668 151,191,706 A Investment 2 821,994 - - 821,994 454 - - 454 821,540 BB Standard 3 - - - - - - - - - BB- Standard 3- - - - - - - - - - CCC Non-Investment 6 - - 2,062,143 2,062,143 - - 1,309,460 1,309,460 752,683 D Non-Investment 8 - - 104,694 104,694 - - 45,541 45,541 59,153
152,283,368 - 2,166,837 154,450,205 270,122 - 1,355,001 1,625,123 152,825,082
Investment securitiesStage 1 Stage 2 Stage 3 Total Stage 1 Stage 2 Stage 3 Total Carrying
External Rating Equivalent Grade Risk Rating Gross amount Gross amount Gross amount Gross amount ECL ECL ECL ECL amount
AAA Investment 1 943,876,884 - - 943,876,884 - - - - 943,876,884 A Investment 2 4,507,012 - - 4,507,012 1,800 - - 1,800 4,505,212 BB Standard 3 11,950,956 - - 11,950,956 117,945 - - 117,945 11,833,011 B Non-Investment 4 10,227,833 - - 10,227,833 71,625 - - 71,625 10,156,208 CCC Non-Investment 6 932,242 47,632 462,530 1,442,404 14,541 1,879 462,530 478,950 963,454
971,494,927 47,632 462,530 972,005,089 205,911 1,879 462,530 670,320 971,334,769
123

Access Bank Plc Consolidated and separate financial statements For the year ended 31 December 2020
Derivative Financial InstrumentsGross Nominal Fair Value
External Rating Equivalent Grade Risk Rating December 2019 December 2019
AAA Investment 1 1,086,591,425 142,234,073 AA Investment 2+ 99,268,238 (708,705) A Investment 2 19,997,458 (440,107) BBB Investment 2- 44,251,600 (2,559,453) BB+ Standard 3+ 12,453,222 (210,513) BB Standard 3 19,386,411 (1,611,405) BB- Standard 3- 1,133,245 (67,118) B Non-Investment 4 25,529 (1,901)
Gross amount 1,283,107,128 136,634,871
BankDecember 2019In thousands of Naira
Loans and advances to retail customersStage 1 Stage 2 Stage 3 Total Stage 1 Stage 2 Stage 3 Total Carrying
External Rating Equivalent Grade Risk Rating Gross amount Gross amount Gross amount Gross amount ECL ECL ECL ECL amount
BB+ Standard 3+ 971,147 - - 971,147 5,395 - - 5,395 965,752 BB Standard 3 81,452,581 1,343,585 - 82,796,166 560,107 479,342 - 1,039,449 81,756,716 BB- Standard 3- 1,895,304 299,693 - 2,194,997 67,312 163,204 - 230,516 1,964,481 B Non-Investment 4 - 3,861,882 - 3,861,882 - 128,159 - 128,157 3,733,725 B- Non-Investment 5 - 667,271 - 667,271 - 346,516 - 346,516 320,755 CCC Non-Investment 6 - - 3,364,354 3,364,354 - - 1,827,819 1,827,819 1,536,535 C Non-Investment 7 - - 907,961 907,961 - - 487,296 487,296 420,665 D Non-Investment 8 - - 1,252,455 1,252,455 - - 711,793 711,793 540,662 Carrying amount 84,319,032 6,172,431 5,524,770 96,016,233 632,814 1,117,221 3,026,908 4,776,941 91,239,291
Loans and advances to corporate customersStage 1 Stage 2 Stage 3 Total Stage 1 Stage 2 Stage 3 Total Carrying
External Rating Equivalent Grade Risk Rating Gross amount Gross amount Gross amount Gross amount ECL ECL ECL ECL amount
AAA Investment 1 141,904,070 - - 141,904,070 18,603 - - 18,603 141,885,467 AA Investment 2+ 283,074,454 37,790,380 - 320,864,834 1,181,275 1,932,467 - 3,113,742 317,751,090 A Investment 2 125,402,954 38,680,332 - 164,083,286 60,667 1,464,687 - 1,525,354 162,557,932 BBB Investment 2- 45,527,531 197,664,120 - 243,191,651 193,679 23,636,727 - 23,830,406 219,361,246 BB+ Standard 3+ 250,663,351 63,236,897 - 313,900,248 1,215,134 2,543,566 - 3,758,700 310,141,548 BB Standard 3 530,839,862 236,380,353 - 767,220,215 13,998,730 15,952,726 - 29,951,456 737,268,760 BB- Standard 3- 84,144,148 106,106,427 - 190,250,575 1,720,078 14,352,436 - 16,072,514 174,178,059 B Non-Investment 4 - 168,487,181 - 168,487,181 - 20,594,430 - 20,594,430 147,892,751 B- Non-Investment 5 - 91,850,394 - 91,850,394 - 26,880,739 - 26,880,739 64,969,655 CCC Non-Investment 6 - - 33,482,272 33,482,272 - - 11,792,061 11,792,061 21,690,210 C Non-Investment 7 - - 106,052,309 106,052,309 - - 28,891,972 28,891,972 77,160,337 D Non-Investment 8 - - 25,319,822 25,319,822 - - 9,792,498 9,792,498 15,527,324
1,461,556,370 940,196,084 164,854,403 2,566,606,857 18,388,168 107,357,778 50,476,531 176,222,477 2,390,384,380
Loans and advances to banksStage 1 Stage 2 Stage 3 Total Stage 1 Stage 2 Stage 3 Total Carrying
External Rating Equivalent Grade Risk Rating Gross amount Gross amount Gross amount Gross amount ECL ECL ECL ECL amount
AAA Investment 1 162,786,158 - - 162,786,158 6,532 - - 6,532 162,779,626 A Investment 2 821,994 - - 821,994 454 - - 454 821,540 CCC Non-Investment 6 - - 2,062,143 2,062,143 - - 1,309,460 1,309,460 752,683 D Non-Investment 8 - - 104,694 104,694 - - 45,541 45,541 59,152.89
163,608,152 - 2,166,837 165,774,989 6,986 - 1,355,001 1,361,987 164,413,001
Investment securitiesStage 1 Stage 2 Stage 3 Total Stage 1 Stage 2 Stage 3 Total Carrying
External Rating Equivalent Grade Risk Rating Gross amount Gross amount Gross amount Gross amount ECL ECL ECL ECL amount
AAA Investment 1 676,308,807 - - 676,308,807 - - 676,308,807 A Investment 2 4,507,012 - - 4,507,012 1,800 - 1,800 4,505,212 BB Standard 3 8,628,462 - - 8,628,462 45,525 - - 45,525 8,582,937 B Non-Investment 4 10,227,833 - - 10,227,833 71,625 - - 71,625 10,156,208 CCC Non-Investment 6 932,242 47,632 462,530 1,442,404 14,541 1,879 462,530 478,950 963,453.24
700,604,356 47,632 462,530 701,114,518 133,491 1,879 462,530 597,900 700,516,618
Derivative Financial InstrumentsGross Nominal Fair Value
External Rating Equivalent Grade Risk Rating December 2019 December 2019
AAA-A Investment 1 986,475,815 123,561,874 A Investment 2 133,011,795 (548,924) AA Investment 2+ 58,724,417 (349,160) BBB Investment 2- 31,367,334 (1,987,313) BBB-B Non-Investment 5 - -
Gross amount 1,209,579,361 120,676,477
The external rating equivalent refers to the equivalent ratings for loans and advances by credit rating agencies. These instruments are neither past due nor impaired
The external rating equivalent refers to the equivalent ratings for loans and advances by credit rating agencies. These instruments are neither past due nor impaired
124

Access Bank Plc Consolidated and separate financial statements For the year ended 31 December 2020
5.1.3 The table below summarises the risk rating for other financial assets:
(d)
Group
In thousands of Naira
Total Grade 1-3 Grade 4-5 Grade 6 Grade 7 Grade 8
Cash and balances with banks
Current balances with banks 513,399,102 513,399,102 - - - -
Unrestricted balances with central banks 51,127,105 51,127,105 - - - -
Money market placements 76,658,240 68,639,186 8,019,055
Other deposits with central banks 46,459,022 46,459,022
Investment under management 30,451,466 30,451,466 - - - -
Non-pledged trading assets
Treasury bills 116,036,126 116,036,126 - - - -
Bonds 91,915,817 91,915,817 - - - -
Derivative financial instruments 251,112,744 251,112,744 - - - -
Pledged assets
-Financial instruments at FVOCI - - - -
Treasury bills 999,521 999,521 - - - -
Bonds 2,617,080 2,617,080
-Financial instruments at amortized cost
Treasury bills 98,097,771 98,097,771 - - - -
Bonds 41,833,930 41,833,930 - - - -
-Financial instruments at FVPL
Treasury bills 85,006,604 85,006,604 - - - -
Bonds - - - - - -
Investment securities
-Financial instruments at FVOCI
Treasury bills 748,230,225 748,230,225 - - - -
Bonds 218,849,603 213,854,602 4,995,001 - - -
Promissory Notes 80,033,790 80,033,790 - - - -
- Financial assets at amortised cost
Treasury bills 237,078,312 237,078,312 - - - -
Bonds 276,469,444 274,924,083 1,073,074 472,288 - -
Total return notes 45,527,717 45,527,717 - - - -
Promissory Notes 427,536 427,536 - - - -
Restricted deposit and other assets 1,522,315,074 1,522,315,074 - - - -
4,534,646,229 4,520,086,815 14,087,129 472,288 - -
The rating here represents the staging for the loans. These are the internal ratings of the bank. The stages are as categorized below;
Grade 1-3: Stage 1
Grade 4-5: Stage 2
Grade 6-7: Stage 3
All the financial assets as categorized above are all grouped into stage 1
Group
In thousands of Naira
December 2019
Total Grade 1-3 Grade 4-5 Grade 6 Grade 7 Grade 8
Cash and balances with banks
Current balances with banks 483,040,381 483,040,381 - - - -
Restricted deposits with central banks - - - - - -
Unrestricted balances with central banks 117,883,814 117,883,814 - - - -
Money market placements 48,838,459 48,838,459
Other deposits with central banks 99,347,553 99,347,553
Investment under management 28,291,959 28,291,959 - - - -
Non-pledged trading assets
Treasury bills 89,797,961 89,797,961 - - - -
Bonds 40,021,277 40,021,277 - - - -
Derivative financial instruments 143,520,553 143,520,553 - - - -
Pledged assets
-Financial instruments at FVOCI - - - -
Treasury bills 30,388,532 30,388,532 - - - -
Bonds - -
-Financial instruments at amortized cost
Treasury bills 452,686,283 452,686,283 - - - -
Bonds 82,599,583 82,599,583 - - - -
-Financial instruments at FVPL
Treasury bills 39,881,494 39,881,494 - - - -
Bonds - - - - - -
Investment securities
-Financial assets at FVOCI
Treasury bills 232,813,374 232,813,374 - - - -
Bonds 81,977,676 76,123,308 5,854,368 - - -
Promissory Notes 807,619 807,619
- Financial assets at amortised cost
Treasury bills 2,727,258 2,727,258 - - - -
Bonds 6,240,386 6,240,386 - - - -
Promissory Notes 10,844,042 10,844,042
Restricted deposit and other assets 1,016,582,843 1,016,582,843 - - - -
3,008,291,046 3,002,436,678 5,854,368 - - -
December 2020
125

Access Bank Plc Consolidated and separate financial statements For the year ended 31 December 2020
The table below summarises the risk rating for other financial assets:
Bank
In thousands of Naira
Total Grade 1-3 Grade 4-5 Grade 6 Grade 7 Grade 8
Cash and balances with banks
Current balances with banks 467,086,329 467,086,329 - - - -
Unrestricted balances with central banks 13,639,189 13,639,189 - - - -
Money market placements 40,095,277 32,076,223 8,019,055 - - -
Other deposits with central banks 46,459,022 46,459,022 - - - -
Investment under management 30,451,466 30,451,466 - - - -
Non-pledged trading assets
Treasury bills 97,719,848 97,719,848 - - - -
Bonds 12,563,265 12,563,265 - - - -
Derivative financial instruments 244,564,046 244,564,046 - - - -
Pledged assets
-Financial instruments at FVOCI - - - -
Treasury bills 999,521 999,521 - - - -
Bonds 2,617,080 2,617,080
-Financial instruments at amortized cost
Treasury bills 98,097,771 98,097,771 - - - -
Bonds 41,833,930 41,833,930 - - - -
-Financial instruments at FVPL
Treasury bills 85,006,603 85,006,603 - - - -
Bonds - - - - - -
Investment securities
-Financial assets at FVOCI
Treasury bills 608,866,687 608,866,687 - - - -
Bonds 106,924,656 101,929,655 4,995,001 - - -
Promissory Notes 80,033,790 80,033,790 - - - -
- Financial assets at amortised cost
Treasury bills 194,302,056 194,302,056 - - - -
Bonds 250,772,348 249,226,987 1,073,074 472,288 - -
Total return notes 45,527,717 45,527,717 - - - -
Promissory Notes 427,537 427,537 - - - -
Restricted deposit and other assets 1,471,481,476 1,471,481,476 - - - -
3,939,469,613 3,924,910,198 14,087,129 472,288 - -
The rating here represents the staging for the loans. These are the internal ratings of the bank. The stages are as categorized below;
Grade 1-3: Stage 1
Grade 4-5: Stage 2
Grade 6-7: Stage 3
All the financial assets as categorized above are all grouped into stage 1
Bank
In thousands of Naira
Total Grade 1-3 Grade 4-5 Grade 6 Grade 7 Grade 8
Cash and balances with banks
Current balances with banks 321,270,808 321,270,808 - - - -
Unrestricted balances with central banks 97,734,073 97,734,073 - - - -
Money market placements 32,822,516 32,822,516 - - - -
Other deposits with central banks 99,347,553 99,347,553 - - - -
Investment under management 28,291,959 28,291,959 - - - -
Non-pledged trading assets
Treasury bills 74,749,344 74,749,344 - - - -
Bonds 2,222,417 2,222,417 - - - -
Derivative financial instruments 143,480,073 143,480,073 - - - -
Pledged assets
-Financial instruments at FVOCI - - - -
Treasury bills 30,388,532 30,388,532 - - - -
Bonds - -
-Financial instruments at amortized cost
Treasury bills 452,686,282 452,686,282 - - - -
Bonds 82,599,583 82,599,583 - - - -
-Financial instruments at FVPL
Treasury bills 39,881,494 39,881,494 - - - -
Bonds - - - - - -
Investment securities
-Financial assets at FVOCI
Treasury bills 77,897,548 77,897,548 - - - -
Bonds 18,950,446 18,950,446 - - - -
Promissory Notes 807,619 807,619
- Financial assets at amortised cost
Treasury bills 341,786,029 341,786,029 - - - -
Bonds 250,828,832 250,828,832 - - - -
Promissory Notes 10,844,042 10,844,042
Restricted deposit and other assets 968,698,629 968,698,629 - - - -
3,075,287,778 3,075,287,778 - - - -
December 2020
December 2019
126

Access Bank Plc Consolidated and separate financial statements For the year ended 31 December 2020
5.1.3 Credit quality
(e ) Credit quality by staging
Group
In thousands of Naira
December 2020
Loans and advances to retail customers
Stage 1 Stage 2 Stage 3 Total Stage 1 Stage 2 Stage 3 Total Carrying
Gross amount Gross amount Gross amount Gross amount ECL ECL ECL ECL amount
Auto Loan 11,915,759 145,912 69,602 12,131,274 14,642 1,534 17,738 33,914 12,097,359
Credit Card 19,646,977 3,770,508 391,463 23,808,948 33,798 287,593 107,570 428,961 23,379,987
Finance Lease 1,109,055 328,230 144,451 1,581,736 6,040 3,889 37,098 47,028 1,534,708
Mortgage Loan 71,150,409 426,442 364,098 71,940,949 51,007 20,260 92,406 163,672 71,777,278
Overdraft 5,608,133 3,823,805 3,171,125 12,603,063 320,922 44,057 609,495 974,474 11,628,590
Personal Loan 26,417,040 1,648,218 1,825,121 29,890,377 54,815 32,956 459,480 547,250 29,343,127
Term Loan 46,460,377 2,643,668 1,726,158 50,830,203 114,179 66,592 436,912 617,683 50,212,520
Time Loan 3,747,264 503,907 2,266,254 6,517,424 34,332 304,163 860,577 1,199,071 5,318,353 186,055,013 13,290,691 9,958,273 209,303,975 629,735 761,044 2,621,276 4,012,055 205,291,921
Loans and advances to corporate customers
Stage 1 Stage 2 Stage 3 Total Stage 1 Stage 2 Stage 3 Total Carrying
Gross amount Gross amount Gross amount Gross amount ECL ECL ECL ECL amount
Auto Loan 1,750,272 96,060 156,301 2,002,632 14,980 564 19,605 35,150 1,967,482
Credit Card 279,414 610 11,317 291,342 2,724 19 3,064 5,808 285,532
Finance Lease 2,081,872 302,550 281,316 2,665,738 22,682 24,727 98,333 145,741 2,519,999
Mortgage Loan 55,554,448 29,814 173,841 55,758,103 388,151 30,732 76,830 495,713 55,262,391
Overdraft 173,439,650 81,849,095 86,325,238 341,613,983 3,931,269 18,981,311 29,612,290 52,524,869 289,089,112
Personal Loan - - - - - - - - -
Term Loan 1,983,535,802 327,088,424 59,469,674 2,370,093,901 26,533,535 33,979,455 23,388,994 83,901,984 2,286,191,917
Time Loan 329,448,797 51,255,997 4,726,795 385,431,590 1,096,552 5,213,896 1,622,470 7,932,919 377,498,670 2,546,090,254 460,622,552 151,144,481 3,157,857,287 31,989,894 58,230,704 54,821,588 145,042,184 3,012,815,100
Loans and advances to banks
Stage 1 Stage 2 Stage 3 Total Stage 1 Stage 2 Stage 3 Total Carrying
Gross amount Gross amount Gross amount Gross amount ECL ECL ECL ECL amount
Auto Loan - - - - - - - - -
Credit Card - - - - - - - - -
Finance Lease - - - - - - - - -
Mortgage Loan - - - - - - - - -
Overdraft - - - - - - - - -
Personal Loan - - - - - - - - -
Term Loan - - - - - - - - -
Time Loan 393,333,130 - 140,061 393,473,192 599,383 - 52,501 651,884 392,821,307 393,333,130 - 140,062 393,473,191 599,383 - 52,501 651,884 392,821,307
There is no stage 3 exposure that has nill impairment for the year for the Group (Dec 2019: N3.02Bn). The impairment is nil for these category of loans because of the adequate coverage offered by the collateral.
127
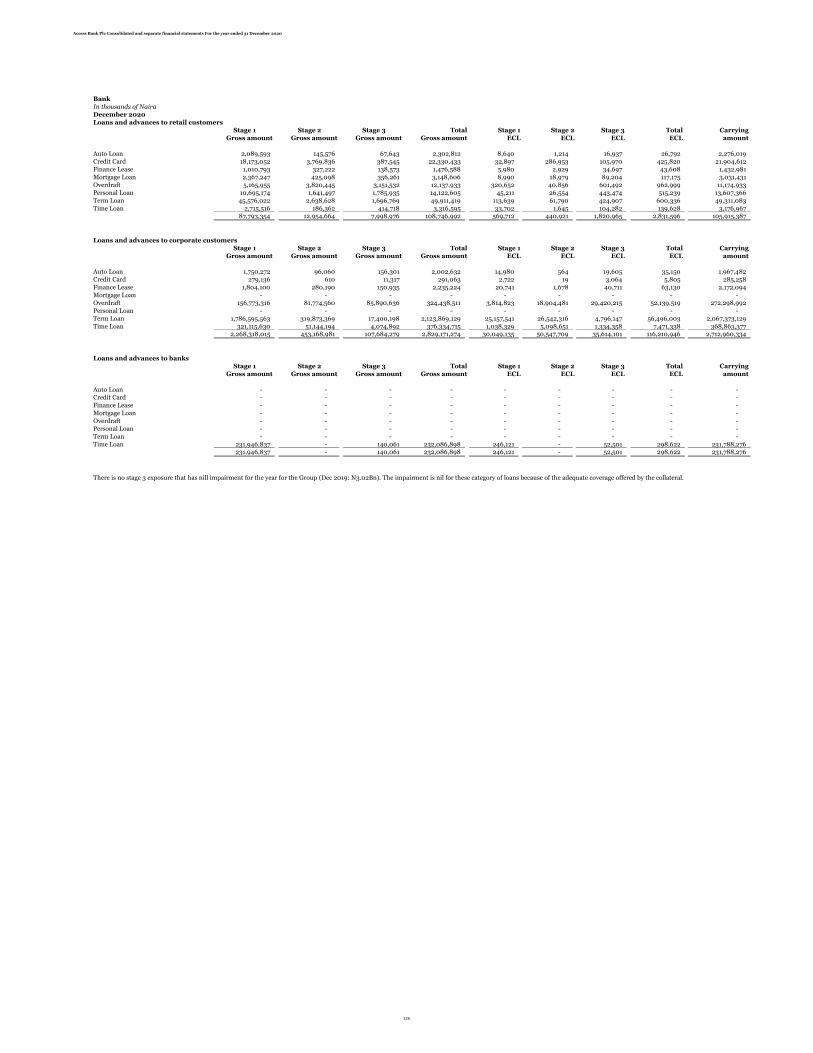
Access Bank Plc Consolidated and separate financial statements For the year ended 31 December 2020
Bank
In thousands of Naira
December 2020
Loans and advances to retail customers
Stage 1 Stage 2 Stage 3 Total Stage 1 Stage 2 Stage 3 Total Carrying
Gross amount Gross amount Gross amount Gross amount ECL ECL ECL ECL amount
Auto Loan 2,089,593 145,576 67,643 2,302,812 8,640 1,214 16,937 26,792 2,276,019
Credit Card 18,173,052 3,769,836 387,545 22,330,433 32,897 286,953 105,970 425,820 21,904,612
Finance Lease 1,010,793 327,222 138,573 1,476,588 5,980 2,929 34,697 43,608 1,432,981
Mortgage Loan 2,367,247 425,098 356,261 3,148,606 8,990 18,979 89,204 117,175 3,031,431
Overdraft 5,165,955 3,820,445 3,151,532 12,137,933 320,652 40,856 601,492 962,999 11,174,933
Personal Loan 10,695,174 1,641,497 1,785,935 14,122,605 45,211 26,554 443,474 515,239 13,607,366
Term Loan 45,576,022 2,638,628 1,696,769 49,911,419 113,639 61,790 424,907 600,336 49,311,083
Time Loan 2,715,516 186,362 414,718 3,316,595 33,702 1,645 104,282 139,628 3,176,967 87,793,354 12,954,664 7,998,976 108,746,992 569,712 440,921 1,820,965 2,831,596 105,915,387
Loans and advances to corporate customers
Stage 1 Stage 2 Stage 3 Total Stage 1 Stage 2 Stage 3 Total Carrying
Gross amount Gross amount Gross amount Gross amount ECL ECL ECL ECL amount
Auto Loan 1,750,272 96,060 156,301 2,002,632 14,980 564 19,605 35,150 1,967,482
Credit Card 279,136 610 11,317 291,063 2,722 19 3,064 5,805 285,258
Finance Lease 1,804,100 280,190 150,935 2,235,224 20,741 1,678 40,711 63,130 2,172,094
Mortgage Loan - - - - - - - - -
Overdraft 156,773,316 81,774,560 85,890,636 324,438,511 3,814,823 18,904,481 29,420,215 52,139,519 272,298,992
Personal Loan - - - - - - - - -
Term Loan 1,786,595,563 319,873,369 17,400,198 2,123,869,129 25,157,541 26,542,316 4,796,147 56,496,003 2,067,373,129
Time Loan 321,115,630 51,144,194 4,074,892 376,334,715 1,038,329 5,098,651 1,334,358 7,471,338 368,863,377 2,268,318,015 453,168,981 107,684,279 2,829,171,274 30,049,135 50,547,709 35,614,101 116,210,946 2,712,960,334
Loans and advances to banks
Stage 1 Stage 2 Stage 3 Total Stage 1 Stage 2 Stage 3 Total Carrying
Gross amount Gross amount Gross amount Gross amount ECL ECL ECL ECL amount
Auto Loan - - - - - - - - -
Credit Card - - - - - - - - -
Finance Lease - - - - - - - - -
Mortgage Loan - - - - - - - - -
Overdraft - - - - - - - - -
Personal Loan - - - - - - - - -
Term Loan - - - - - - - - -
Time Loan 231,946,837 - 140,061 232,086,898 246,121 - 52,501 298,622 231,788,276 231,946,837 - 140,061 232,086,898 246,121 - 52,501 298,622 231,788,276
There is no stage 3 exposure that has nill impairment for the year for the Group (Dec 2019: N3.02Bn). The impairment is nil for these category of loans because of the adequate coverage offered by the collateral.
128

Access Bank Plc Consolidated and separate financial statements For the year ended 31 December 2020
5.1.3 Credit quality
(e ) Credit quality by staging
Group
In thousands of Naira
December 2019
Loans and advances to retail customers
Stage 1 Stage 2 Stage 3 Total Stage 1 Stage 2 Stage 3 Total Carrying
Gross amount Gross amount Gross amount Gross amount ECL ECL ECL ECL amount
Auto Loan 14,316,084 312,659 24,650 14,653,393 12,890 12,595 12,928 38,413 14,614,980
Credit Card 18,246,614 616,290 151,645 19,014,549 40,847 77,582 82,505 200,934 18,813,613
Finance Lease 173,316 12,214 1,366 186,896 202 399 639 1,240 185,656
Mortgage Loan 80,814,481 619,210 380,590 81,814,281 68,299 222,505 207,101 497,905 81,316,376
Overdraft 14,442,712 519,356 3,683,640 18,645,708 266,115 241,065 1,990,087 2,497,267 16,148,441
Personal Loan 51,880,685 153,300 906,662 52,940,647 140,312 28,017 499,391 667,720 52,272,927
Term Loan 12,777,477 2,719,316 239,994 15,736,787 135,264 502,383 190,850 828,497 14,908,290
Time Loan 4,859,951 1,402,215 591,548 6,853,714 48,794 139,221 256,496 444,511 6,409,203
197,511,320 6,354,560 5,980,095 209,845,975 712,723 1,223,767 3,239,997 5,176,486 204,669,485
Loans and advances to corporate customers
Stage 1 Stage 2 Stage 3 Total Stage 1 Stage 2 Stage 3 Total Carrying
Gross amount Gross amount Gross amount Gross amount ECL ECL ECL ECL amount
Auto Loan 2,896,828 250,665 55,512 3,203,005 26,672 4,766 7,040 38,478 3,164,527
Credit Card 238,656 24,731 61,807 325,194 2,459 1,568 23,792 27,819 297,376
Finance Lease 4,357,320 340,259 262,405 4,959,984 79,685 13,288 108,492 201,465 4,758,519
Mortgage Loan 60,974,410 24,738 61,844 61,060,992 464,114 10,228 20,457 494,799 60,566,193
Overdraft 121,894,817 87,449,620 71,738,703 281,083,140 1,888,438 5,194,640 25,574,903 32,657,981 248,425,159
Personal Loan - - - - - - - - -
Term Loan 1,253,280,533 822,442,191 93,801,086 2,169,523,810 9,136,899 102,028,690 27,294,139 138,459,728 2,031,064,082
Time Loan 322,785,856 35,848,324 14,334,162 372,968,342 9,110,469 2,661,667 2,561,847 14,333,983 358,634,359
1,766,428,420 946,380,528 180,315,519 2,893,124,467 20,708,736 109,914,847 55,590,670 186,214,253 2,706,910,215
Loans and advances to banks
Stage 1 Stage 2 Stage 3 Total Stage 1 Stage 2 Stage 3 Total Carrying
Gross amount Gross amount Gross amount Gross amount ECL ECL ECL ECL amount
Auto Loan - - - - - - - - -
Credit Card - - - - - - - - -
Finance Lease - - - - - - - - -
Mortgage Loan - - - - - - - - -
Overdraft 821,994 - 104,694 926,688 454 - 45,541 45,995 880,693
Personal Loan - - - - - - - - -
Term Loan - - - - - - - - -
Time Loan 151,461,374 - 2,062,142 153,523,516 269,668 - 1,309,460 1,579,128 151,944,388
152,283,368 - 2,166,836 154,450,204 270,122 - 1,355,001 1,625,123 152,825,081
129

Access Bank Plc Consolidated and separate financial statements For the year ended 31 December 2020
Bank
In thousands of Naira
December 2019
Loans and advances to retail customers
Stage 1 Stage 2 Stage 3 Total Stage 1 Stage 2 Stage 3 Total Carrying
Gross amount Gross amount Gross amount Gross amount ECL ECL ECL ECL amount
Auto Loan 2,996,855 312,477 24,195 3,333,527 4,900 12,488 12,715 30,103 3,303,424
Credit Card 16,548,729 615,926 150,734 17,315,389 39,649 77,369 82,078 199,096 17,116,293
Finance Lease 60,124 11,667 - 71,791 122 79 - 201 71,590
Mortgage Loan 1,579,880 618,482 378,768 2,577,130 12,363 222,078 206,249 440,690 2,136,440
Overdraft 13,933,346 517,535 3,679,087 18,129,968 265,755 240,000 1,987,956 2,493,711 15,636,257
Personal Loan 33,769,919 149,658 897,555 34,817,132 127,527 25,886 495,129 648,542 34,168,590
Term Loan 11,758,747 2,716,584 233,165 14,708,496 134,544 500,785 187,654 822,983 13,885,513
Time Loan 3,671,432 1,230,102 161,265 5,062,799 47,955 38,536 55,127 141,618 4,921,181
84,319,032 6,172,431 5,524,769 96,016,231 632,815 1,117,221 3,026,908 4,776,944 91,239,289
Loans and advances to corporate customers
Stage 1 Stage 2 Stage 3 Total Stage 1 Stage 2 Stage 3 Total Carrying
Gross amount Gross amount Gross amount Gross amount ECL ECL ECL ECL amount
Auto Loan 2,896,828 250,665 55,512 3,203,005 26,672 4,766 7,040 38,478 3,164,527
Credit Card 238,351 24,731 61,807 324,889 2,457 1,568 23,792 27,817 297,072
Finance Lease 4,052,448 321,706 216,022 4,590,176 77,365 5,617 93,149 176,131 4,414,046
Mortgage Loan - - - - - - - - -
Overdraft 103,602,494 87,387,776 71,584,092 262,574,362 1,749,204 5,169,070 25,523,762 32,442,036 230,132,326
Personal Loan - - - - - - - - -
Term Loan 1,037,126,554 816,455,647 78,834,725 1,932,416,926 7,491,618 99,553,447 22,343,654 129,388,719 1,803,028,207
Time Loan 313,639,695 35,755,557 14,102,245 363,497,497 9,040,852 2,623,311 2,485,135 14,149,298 349,348,200
1,461,556,370 940,196,085 164,854,403 2,566,606,855 18,388,168 107,357,779 50,476,532 176,222,479 2,390,384,377
Loans and advances to banks
Stage 1 Stage 2 Stage 3 Total Stage 1 Stage 2 Stage 3 Total Carrying
Gross amount Gross amount Gross amount Gross amount ECL ECL ECL ECL amount
Auto Loan - - - - - - - - -
Credit Card - - - - - - - - -
Finance Lease - - - - - - - - -
Mortgage Loan - - - - - - - - -
Overdraft 821,994 - 104,694 926,688 454 - 45,541 45,995 880,693
Personal Loan - - - - - - - - -
Term Loan - - - - - - - - -
Time Loan 162,786,158 - 2,062,143 164,848,301 6,532 - 1,309,460 1,315,992 163,532,309
163,608,152 - 2,166,837 165,774,989 6,986 - 1,355,001 1,361,987 164,413,002
130

Access Bank Plc Consolidated and separate financial statements For the year ended 31 December 2020
5.1.3 (g) Disclosure of Collateral held against loans and advances to customers by fair value hierarchy
Group
In thousands of Naira December 2020
Loans to retail customers
Stage 1 Stage 2 Stage 3
Gross amount 186,055,014 13,290,691 9,958,273
ECL (629,734) (761,045) (2,621,276)
Collateral held at fair value
Property 14,131,647 16,199,436 4,633,141
Equities 158,970 - -
Cash 1,935,687 433,924 -
Pledged goods/receivables 93,604,918 17,992,936 9,265,868
Others 79,869,809 27,681,391 40,111,815
Total 189,701,030 62,307,686 54,010,824
Loans to corporate Customers
Stage 1 Stage 2 Stage 3
Gross amount 2,546,090,254 460,622,551 151,144,481
ECL (31,989,893) (58,230,704) (54,821,587)
Collateral held at fair value
Property 1,159,627,977 290,282,773 58,561,393
Equities 173,439,663 26,557,611 323,693
Cash 183,493,313 3,780,514 -
Pledged goods/receivables 2,696,212,541 424,208,613 130,768,719
Others 5,318,056,898 637,593,544 228,108,573
Total 9,530,830,392 1,382,423,056 417,762,378
Total collateral held at fair value 9,720,531,422 1,444,730,742 471,773,202
Bank
In thousands of Naira December 2020
Loans to retail customers
Stage 1 Stage 2 Stage 3
Gross amount 87,793,354 12,954,665 7,998,975
ECL (569,711) (440,920) (1,820,964)
Collateral held at fair value
Property 10,094,033 11,738,721 4,211,946
Equities 132,475 - -
Cash 1,290,458 361,603 -
Pledged goods/receivables 49,265,747 14,056,981 8,824,636
Others 36,304,459 16,283,171 33,426,513
Total 97,087,171 42,440,477 46,463,095
Loans to corporate Customers
Stage 1 Stage 2 Stage 3
Gross amount 2,268,318,016 453,168,982 107,684,279
ECL (30,049,136) (50,547,709) (35,614,100)
Collateral held at fair value
Property 623,455,902 167,793,511 48,801,161
Equities 144,533,052 19,672,305 239,772
Cash 110,538,140 2,681,216 -
Pledged goods/receivables 1,997,194,475 279,084,614 108,973,933
Others 2,954,476,055 535,792,894 168,969,314
Total 5,830,197,624 1,005,024,539 326,984,179
Total 5,927,284,795 1,047,465,016 373,447,274
131

Access Bank Plc Consolidated and separate financial statements For the year ended 31 December 2020
1
Collateral held and other credit enhancements, and their financial effect
The general creditworthiness of a customer tends to be the most relevant indicator of credit quality of a loan extended to it. However, collateral providesadditional consideration in the credit process and the Group generally requests that corporate borrowers provide collateral. The Group may takecollateral in the form of a first charge over real estate, floating charges over all corporate assets and other liens and guarantees. The Bank will sell orrepossess a pledged collateral only in the event of a default and after exploring other means of repayment. In addition to the Group's focus oncreditworthiness, the Group aligns with its Credit Policy Guide to periodically review the valuations of collaterals held against all loans to customers.This is done in line with the approved Framework for valuing various categories of collateral accepted by the Bank.
The fair values of collaterals are based upon last annual valuation undertaken by independent valuers on behalf of the bank. The valuation techniqueadopted for properties are based on fair values of similar properties in the neighborhood.The fair values of non-property collaterals (such as equities, bond, treasury bills, etc.) are determined with reference to market quoted prices or marketvalues of similar instruments.
Collateral types included in others are All Asset debentures, Domiciliation, Counter Indemnity, Authority to collect,Irrevocable standing payment order, Guarantees
132
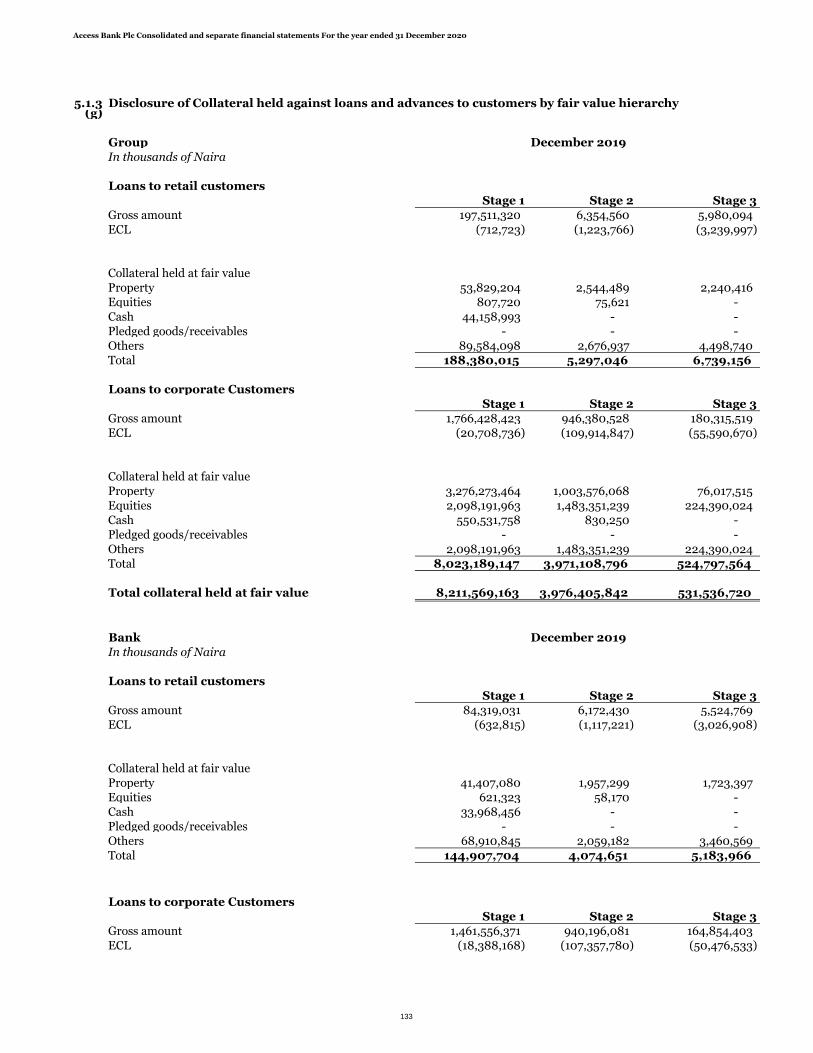
Access Bank Plc Consolidated and separate financial statements For the year ended 31 December 2020
5.1.3 Disclosure of Collateral held against loans and advances to customers by fair value hierarchy(g)
Group December 2019In thousands of Naira
Loans to retail customersStage 1 Stage 2 Stage 3
Gross amount 197,511,320 6,354,560 5,980,094 ECL (712,723) (1,223,766) (3,239,997)
Collateral held at fair valueProperty 53,829,204 2,544,489 2,240,416 Equities 807,720 75,621 -
Cash 44,158,993 - - Pledged goods/receivables - - - Others 89,584,098 2,676,937 4,498,740 Total 188,380,015 5,297,046 6,739,156
Loans to corporate CustomersStage 1 Stage 2 Stage 3
Gross amount 1,766,428,423 946,380,528 180,315,519 ECL (20,708,736) (109,914,847) (55,590,670)
Collateral held at fair valueProperty 3,276,273,464 1,003,576,068 76,017,515 Equities 2,098,191,963 1,483,351,239 224,390,024 Cash 550,531,758 830,250 - Pledged goods/receivables - - - Others 2,098,191,963 1,483,351,239 224,390,024 Total 8,023,189,147 3,971,108,796 524,797,564
Total collateral held at fair value 8,211,569,163 3,976,405,842 531,536,720
Bank December 2019In thousands of Naira
Loans to retail customersStage 1 Stage 2 Stage 3
Gross amount 84,319,031 6,172,430 5,524,769 ECL (632,815) (1,117,221) (3,026,908)
Collateral held at fair valueProperty 41,407,080 1,957,299 1,723,397 Equities 621,323 58,170 - Cash 33,968,456 - - Pledged goods/receivables - - - Others 68,910,845 2,059,182 3,460,569 Total 144,907,704 4,074,651 5,183,966
Loans to corporate CustomersStage 1 Stage 2 Stage 3
Gross amount 1,461,556,371 940,196,081 164,854,403 ECL (18,388,168) (107,357,780) (50,476,533)
133

Access Bank Plc Consolidated and separate financial statements For the year ended 31 December 2020
Collateral held at fair valueProperty 2,891,680,021 885,768,816 67,094,012 Equities 1,851,890,523 1,309,224,394 198,049,448
Cash 485,906,230 732,789 -
Pledged goods/receivables - - - Others 1,851,890,523 1,309,224,394 198,049,448
Total 7,081,367,297 3,504,950,394 463,192,907
Total collateral held at fair value 7,226,275,001 3,509,025,045 468,376,873
There are no collaterals held against other financial assets. The Group obtained a property during the year by taking possession of collateral held as security against a loan. The value of the collateral repossessed during the year was N9.4bn (2018: Nil). The Group's policy is to pursue timely realisation of the collateral in an orderly manner. The Group does not generally use the non-cash collateral for its own operations. Hence, the repossessed collateral has been included in assets classified as held for sale (Note 31).
134

Access Bank Plc Consolidated and separate financial statements For the year ended 31 December 2020
Collateral held and other credit enhancements, and their financial effect
The general creditworthiness of a customer tends to be the most relevant indicator of credit quality of a loan extended to it.However, collateral provides additional consideration in the credit process and the Group generally requests that corporateborrowers provide collateral. The Group may take collateral in the form of a first charge over real estate, floating chargesover all corporate assets and other liens and guarantees. The Bank will sell or repossess a pledged collateral only in theevent of a default and after exploring other means of repayment. In addition to the Group's focus on creditworthiness, theGroup aligns with its Credit Policy Guide to yearically review the valuations of collaterals held against all loans tocustomers. This is done in line with the approved Framework for valuing various categories of collateral accepted by theBank.
The fair values of collaterals are based upon last annual valuation undertaken by independent valuers on behalf of thebank. The valuation technique adopted for properties are based on fair values of similar properties in the neighborhood.The fair values of non-property collaterals (such as equities, bond, treasury bills, etc.) are determined with reference tomarket quoted prices or market values of similar instruments.
135

Access Bank Plc Consolidated and separate financial statements For the year ended 31 December 2020
5.1.4Offsetting financial assets and financial liabilities
As at December 2020
In thousands of Naira
The following financial assets/liabilities are subject to offsetting
Gross amounts of recognised financial assets
Grossamounts ofrecognisedfinancialliabilitiesoffset in thestatementof financial
Net amountsof financialassets/Liabilities presented in the statementof financialposition
Financial assets
Loans and advances to banks - - -
Total - - -
As at December 2020
Financial liabilities
Interest bearing borrowing - - -
Total - - -
As at December 2019
In thousands of Naira
The following financial assets/liabilities are subject to offsetting
Gross amounts of recognised financial assets
Grossamounts ofrecognisedfinancialliabilitiesoffset in thestatementof financialposition
Net amountsof financialassets/Liabilities presented in the statementof financialposition
Financial assets
Loans and advances to banks 152,825,081 - 152,825,081
Total 152,825,081 - 152,825,081
As at December 2019
Financial liabilities
Interest bearing borrowing - 586,602,830 586,602,830
Total - 586,602,830 586,602,830
136
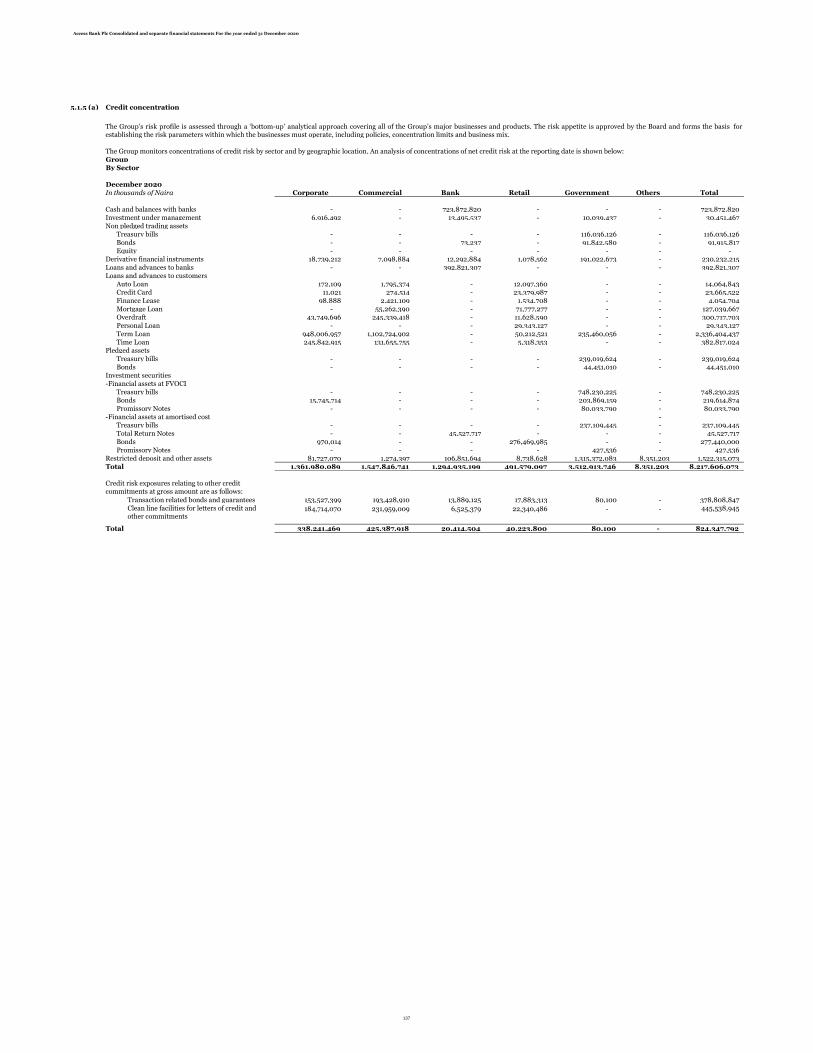
Access Bank Plc Consolidated and separate financial statements For the year ended 31 December 2020
5.1.5 (a) Credit concentration
GroupBy Sector
December 2020In thousands of Naira Corporate Commercial Bank Retail Government Others Total
Cash and balances with banks - - 723,872,820 - - - 723,872,820 Investment under management 6,916,492 - 13,495,537 - 10,039,437 - 30,451,467 Non pledged trading assets
Treasury bills - - - - 116,036,126 - 116,036,126 Bonds - - 73,237 - 91,842,580 - 91,915,817 Equity - - - - - - -
Derivative financial instruments 18,739,212 7,098,884 12,292,884 1,078,562 191,022,673 - 230,232,215 Loans and advances to banks - - 392,821,307 - - - 392,821,307 Loans and advances to customers
Auto Loan 172,109 1,795,374 - 12,097,360 - - 14,064,843 Credit Card 11,021 274,514 - 23,379,987 - - 23,665,522 Finance Lease 98,888 2,421,109 - 1,534,708 - - 4,054,704 Mortgage Loan - 55,262,390 - 71,777,277 - - 127,039,667 Overdraft 43,749,696 245,339,418 - 11,628,590 - - 300,717,703 Personal Loan - - - 29,343,127 - - 29,343,127 Term Loan 948,006,957 1,102,724,902 - 50,212,521 235,460,056 - 2,336,404,437 Time Loan 245,842,915 131,655,755 - 5,318,353 - - 382,817,024
Pledged assetsTreasury bills - - - - 239,019,624 - 239,019,624 Bonds - - - - 44,451,010 - 44,451,010
Investment securities-Financial assets at FVOCI
Treasury bills - - - - 748,230,225 - 748,230,225 Bonds 15,745,714 - - - 203,869,159 - 219,614,874 Promissory Notes - - - - 80,033,790 - 80,033,790
-Financial assets at amortised cost - Treasury bills - - - - 237,109,445 - 237,109,445 Total Return Notes - - 45,527,717 - - - 45,527,717 Bonds 970,014 - - 276,469,985 - - 277,440,000 Promissory Notes - - - - 427,536 - 427,536
Restricted deposit and other assets 81,727,070 1,274,397 106,851,694 8,738,628 1,315,372,083 8,351,203 1,522,315,073 Total 1,361,980,089 1,547,846,741 1,294,935,199 491,579,097 3,512,913,746 8,351,203 8,217,606,073
Transaction related bonds and guarantees 153,527,399 193,428,910 13,889,125 17,883,313 80,100 - 378,808,847
184,714,070 231,959,009 6,525,379 22,340,486 - - 445,538,945
Total 338,241,469 425,387,918 20,414,504 40,223,800 80,100 - 824,347,792
The Group’s risk profile is assessed through a ‘bottom-up’ analytical approach covering all of the Group’s major businesses and products. The risk appetite is approved by the Board and forms the basis forestablishing the risk parameters within which the businesses must operate, including policies, concentration limits and business mix.
Clean line facilities for letters of credit and other commitments
The Group monitors concentrations of credit risk by sector and by geographic location. An analysis of concentrations of net credit risk at the reporting date is shown below:
Credit risk exposures relating to other credit commitments at gross amount are as follows:
137
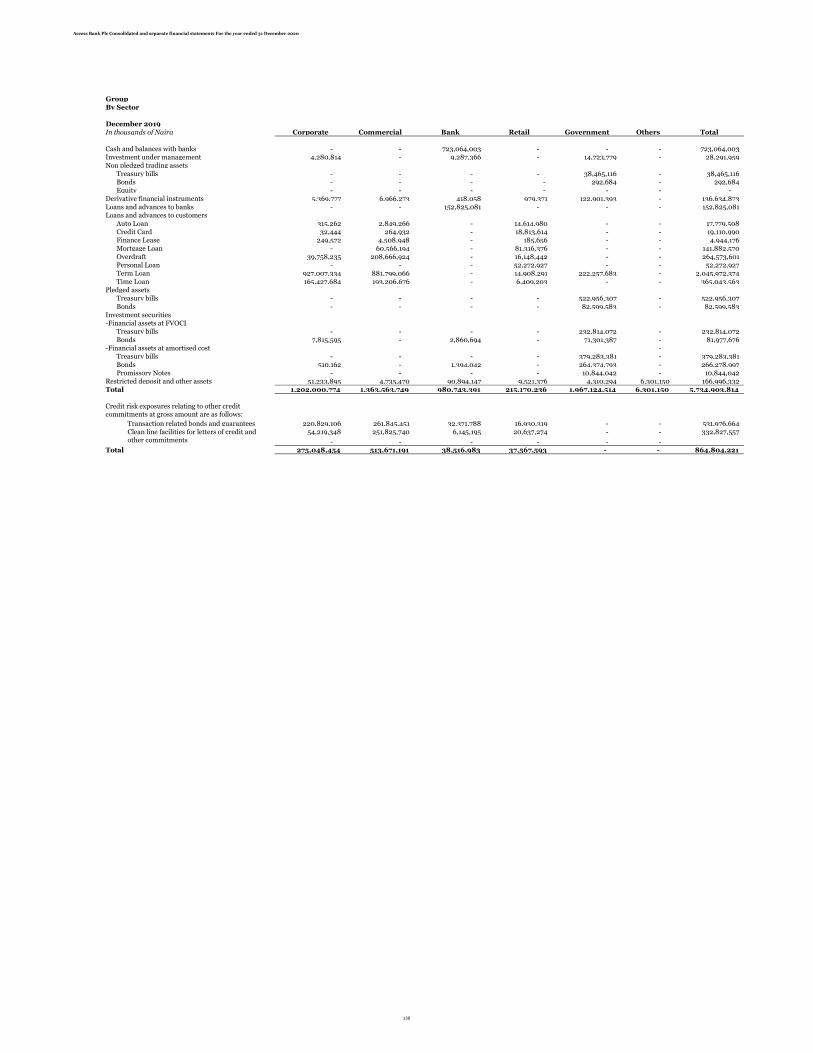
Access Bank Plc Consolidated and separate financial statements For the year ended 31 December 2020
GroupBy Sector
December 2019In thousands of Naira Corporate Commercial Bank Retail Government Others Total
Cash and balances with banks - - 723,064,003 - - - 723,064,003 Investment under management 4,280,814 - 9,287,366 - 14,723,779 - 28,291,959 Non pledged trading assets
Treasury bills - - - - 38,465,116 - 38,465,116 Bonds - - - - 292,684 - 292,684 Equity - - - - - - -
Derivative financial instruments 5,369,777 6,966,273 418,058 979,371 122,901,393 - 136,634,873 Loans and advances to banks - - 152,825,081 - - - 152,825,081 Loans and advances to customers
Auto Loan 315,262 2,849,266 - 14,614,980 - - 17,779,508 Credit Card 32,444 264,932 - 18,813,614 - - 19,110,990 Finance Lease 249,572 4,508,948 - 185,656 - - 4,944,176 Mortgage Loan - 60,566,194 - 81,316,376 - - 141,882,570 Overdraft 39,758,235 208,666,924 - 16,148,442 - - 264,573,601 Personal Loan - - - 52,272,927 - - 52,272,927 Term Loan 927,007,334 881,799,066 - 14,908,291 222,257,683 - 2,045,972,374 Time Loan 165,427,684 193,206,676 - 6,409,203 - - 365,043,563
Pledged assetsTreasury bills - - - - 522,956,307 - 522,956,307 Bonds - - - - 82,599,583 - 82,599,583
Investment securities-Financial assets at FVOCI
Treasury bills - - - - 232,814,072 - 232,814,072 Bonds 7,815,595 - 2,860,694 - 71,301,387 - 81,977,676
-Financial assets at amortised cost - Treasury bills - - - - 379,283,381 - 379,283,381 Bonds 510,162 - 1,394,042 - 264,374,793 - 266,278,997 Promissory Notes - - - - 10,844,042 - 10,844,042
Restricted deposit and other assets 51,233,895 4,735,470 90,894,147 9,521,376 4,310,294 6,301,150 166,996,332 Total 1,202,000,774 1,363,563,749 980,743,391 215,170,236 1,967,124,514 6,301,150 5,734,903,814
Transaction related bonds and guarantees 220,829,106 261,845,451 32,371,788 16,930,319 - - 531,976,664 54,219,348 251,825,740 6,145,195 20,637,274 - - 332,827,557
- - - - - - Total 275,048,454 513,671,191 38,516,983 37,567,593 - - 864,804,221
Credit risk exposures relating to other credit commitments at gross amount are as follows:
Clean line facilities for letters of credit and other commitments
138
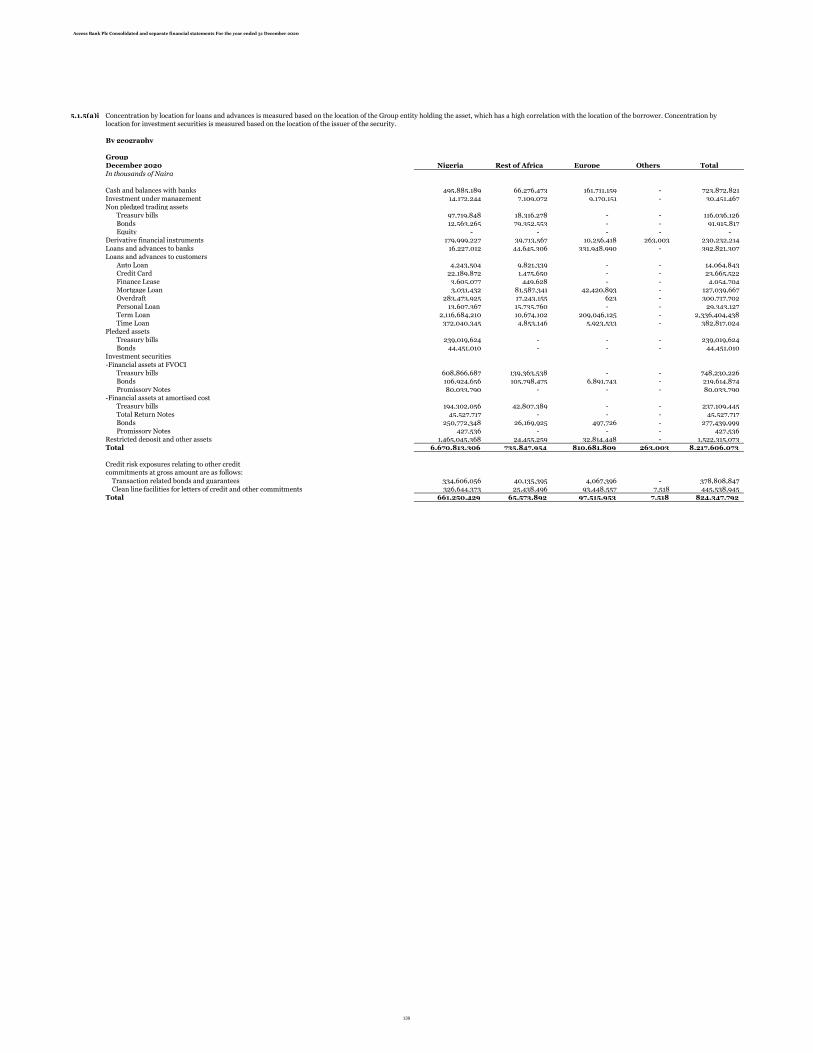
Access Bank Plc Consolidated and separate financial statements For the year ended 31 December 2020
5.1.5(a)i
By geography
GroupDecember 2020 Nigeria Rest of Africa Europe Others TotalIn thousands of Naira
Cash and balances with banks 495,885,189 66,276,473 161,711,159 - 723,872,821 Investment under management 14,172,244 7,109,072 9,170,151 - 30,451,467 Non pledged trading assets
Treasury bills 97,719,848 18,316,278 - - 116,036,126 Bonds 12,563,265 79,352,553 - - 91,915,817 Equity - - - - -
Derivative financial instruments 179,999,227 39,713,567 10,256,418 263,003 230,232,214 Loans and advances to banks 16,227,012 44,645,306 331,948,990 - 392,821,307 Loans and advances to customers
Auto Loan 4,243,504 9,821,339 - - 14,064,843 Credit Card 22,189,872 1,475,650 - - 23,665,522 Finance Lease 3,605,077 449,628 - - 4,054,704 Mortgage Loan 3,031,432 81,587,341 42,420,893 - 127,039,667 Overdraft 283,473,925 17,243,155 623 - 300,717,702 Personal Loan 13,607,367 15,735,760 - - 29,343,127 Term Loan 2,116,684,210 10,674,102 209,046,125 - 2,336,404,438 Time Loan 372,040,345 4,853,146 5,923,533 - 382,817,024
Pledged assetsTreasury bills 239,019,624 - - - 239,019,624 Bonds 44,451,010 - - - 44,451,010
Investment securities-Financial assets at FVOCI
Treasury bills 608,866,687 139,363,538 - - 748,230,226 Bonds 106,924,656 105,798,475 6,891,743 - 219,614,874 Promissory Notes 80,033,790 - - - 80,033,790
-Financial assets at amortised costTreasury bills 194,302,056 42,807,389 - - 237,109,445 Total Return Notes 45,527,717 - - - 45,527,717 Bonds 250,772,348 26,169,925 497,726 - 277,439,999 Promissory Notes 427,536 - - - 427,536
Restricted deposit and other assets 1,465,045,368 24,455,259 32,814,448 - 1,522,315,073 Total 6,670,813,306 735,847,954 810,681,809 263,003 8,217,606,073
Transaction related bonds and guarantees 334,606,056 40,135,395 4,067,396 - 378,808,847 Clean line facilities for letters of credit and other commitments 326,644,373 25,438,496 93,448,557 7,518 445,538,945 Total 661,250,429 65,573,892 97,515,953 7,518 824,347,792
Credit risk exposures relating to other credit commitments at gross amount are as follows:
Concentration by location for loans and advances is measured based on the location of the Group entity holding the asset, which has a high correlation with the location of the borrower. Concentration by location for investment securities is measured based on the location of the issuer of the security.
139

Access Bank Plc Consolidated and separate financial statements For the year ended 31 December 2020
By geography
GroupDecember 2019 Nigeria Rest of Africa Europe Others TotalIn thousands of Naira
Cash and balances with banks 373,524,816 94,581,401 255,049,233 - 723,155,450 Investment under management 9,225,166 6,849,720 12,217,073 - 28,291,959 Non pledged trading assets
Treasury bills 74,749,344 15,048,617 - - 89,797,961 Bonds 2,222,417 37,798,860 - - 40,021,277 Equity - - - - -
Derivative financial instruments 126,909,010 1,585,977 6,826,720 1,313,164 136,634,871 Loans and advances to banks 695,095 - 152,129,985 - 152,825,081 Loans and advances to customers
Auto Loan 6,467,952 11,311,556 - - 17,779,508 Credit Card 17,413,366 1,697,624 - - 19,110,990 Finance Lease 4,485,635 458,540 - - 4,944,175 Mortgage Loan 2,136,440 118,972,854 20,773,276 - 141,882,570 Overdraft 245,768,584 7,217,096 - - 252,985,680 Personal Loan 34,168,590 18,104,337 - - 52,272,927 Term Loan 1,816,913,719 221,989,758 7,068,897 - 2,045,972,374 Time Loan 354,269,381 22,362,102 - - 376,631,483
Pledged assetsTreasury bills 522,956,307 - - - 522,956,307 Bonds 82,599,583 - - - 82,599,583
Investment securities-Financial assets at FVOCI
Treasury bills 77,898,247 154,915,826 - - 232,814,073 Bonds 11,134,851 67,982,131 2,860,694 - 81,977,676 Promissory Notes 807,619 - - - 807,619
-Financial assets at amortised costTreasury bills 341,786,029 37,497,352 - - 379,283,381 Bonds 249,386,429 15,498,526 1,394,042 - 266,278,997 Promissory Notes 10,844,042 - - - 10,844,042
Restricted deposit and other assets 140,893,166 22,911,937 2,205,151 986,078 166,996,332 Total 4,507,255,788 856,784,214 460,525,071 2,299,242 5,826,864,316
Transaction related bonds and guarantees 451,514,549 80,462,115 - - 531,976,664 Clean line facilities for letters of credit and other commitments 324,529,363 8,298,194 - - 332,827,557
Total 776,043,912 88,760,309 - - 864,804,221
Credit risk exposures relating to other credit commitments at gross amount are as follows:
140
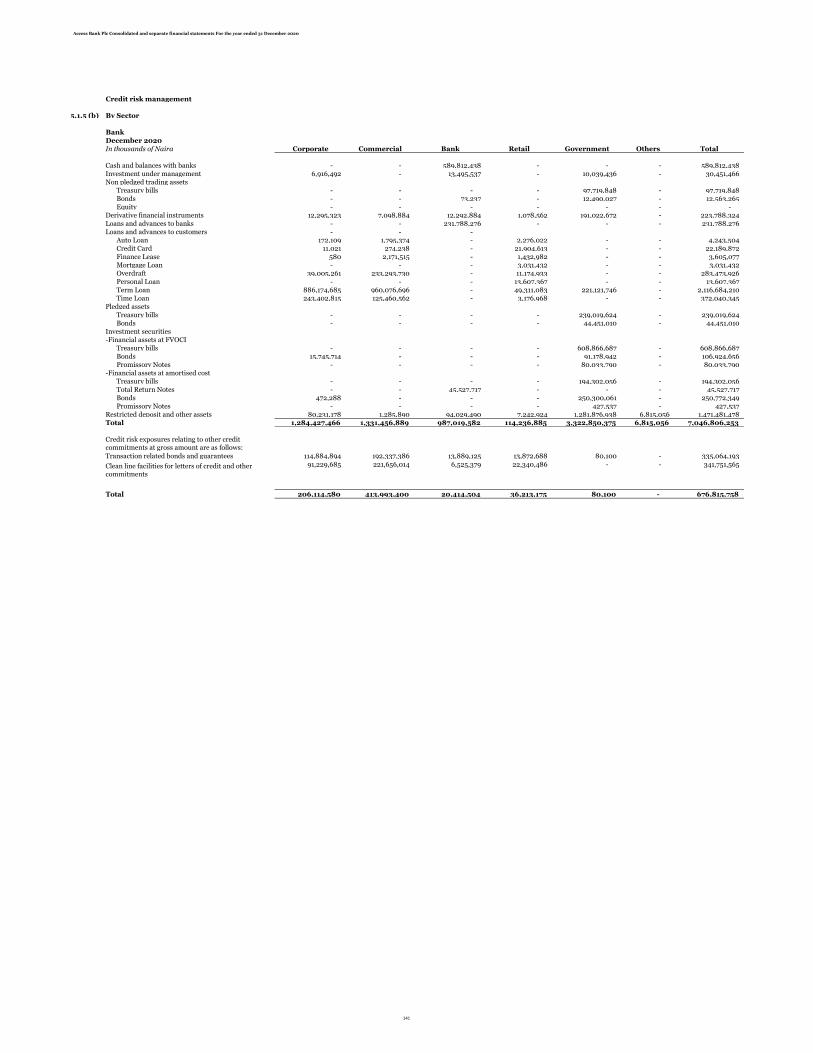
Access Bank Plc Consolidated and separate financial statements For the year ended 31 December 2020
Credit risk management
5.1.5 (b) By Sector
BankDecember 2020In thousands of Naira Corporate Commercial Bank Retail Government Others Total
Cash and balances with banks - - 589,812,438 - - - 589,812,438 Investment under management 6,916,492 - 13,495,537 - 10,039,436 - 30,451,466 Non pledged trading assets
Treasury bills - - - - 97,719,848 - 97,719,848 Bonds - - 73,237 - 12,490,027 - 12,563,265 Equity - - - - - - -
Derivative financial instruments 12,295,323 7,098,884 12,292,884 1,078,562 191,022,672 - 223,788,324 Loans and advances to banks - - 231,788,276 - - - 231,788,276 Loans and advances to customers - - -
Auto Loan 172,109 1,795,374 - 2,276,022 - - 4,243,504 Credit Card 11,021 274,238 - 21,904,613 - - 22,189,872 Finance Lease 580 2,171,515 - 1,432,982 - - 3,605,077 Mortgage Loan - - - 3,031,432 - - 3,031,432 Overdraft 39,005,261 233,293,730 - 11,174,933 - - 283,473,926 Personal Loan - - - 13,607,367 - - 13,607,367 Term Loan 886,174,685 960,076,696 - 49,311,083 221,121,746 - 2,116,684,210 Time Loan 243,402,815 125,460,562 - 3,176,968 - - 372,040,345
Pledged assetsTreasury bills - - - - 239,019,624 - 239,019,624 Bonds - - - - 44,451,010 - 44,451,010
Investment securities-Financial assets at FVOCI
Treasury bills - - - - 608,866,687 - 608,866,687 Bonds 15,745,714 - - - 91,178,942 - 106,924,656 Promissory Notes - - - - 80,033,790 - 80,033,790
-Financial assets at amortised costTreasury bills - - - - 194,302,056 - 194,302,056 Total Return Notes - - 45,527,717 - - - 45,527,717 Bonds 472,288 - - - 250,300,061 - 250,772,349 Promissory Notes - - - - 427,537 - 427,537
Restricted deposit and other assets 80,231,178 1,285,890 94,029,490 7,242,924 1,281,876,938 6,815,056 1,471,481,478 Total 1,284,427,466 1,331,456,889 987,019,582 114,236,885 3,322,850,375 6,815,056 7,046,806,253
Transaction related bonds and guarantees 114,884,894 192,337,386 13,889,125 13,872,688 80,100 - 335,064,193
91,229,685 221,656,014 6,525,379 22,340,486 - - 341,751,565
Total 206,114,580 413,993,400 20,414,504 36,213,175 80,100 - 676,815,758
Credit risk exposures relating to other credit commitments at gross amount are as follows:
Clean line facilities for letters of credit and other commitments
141
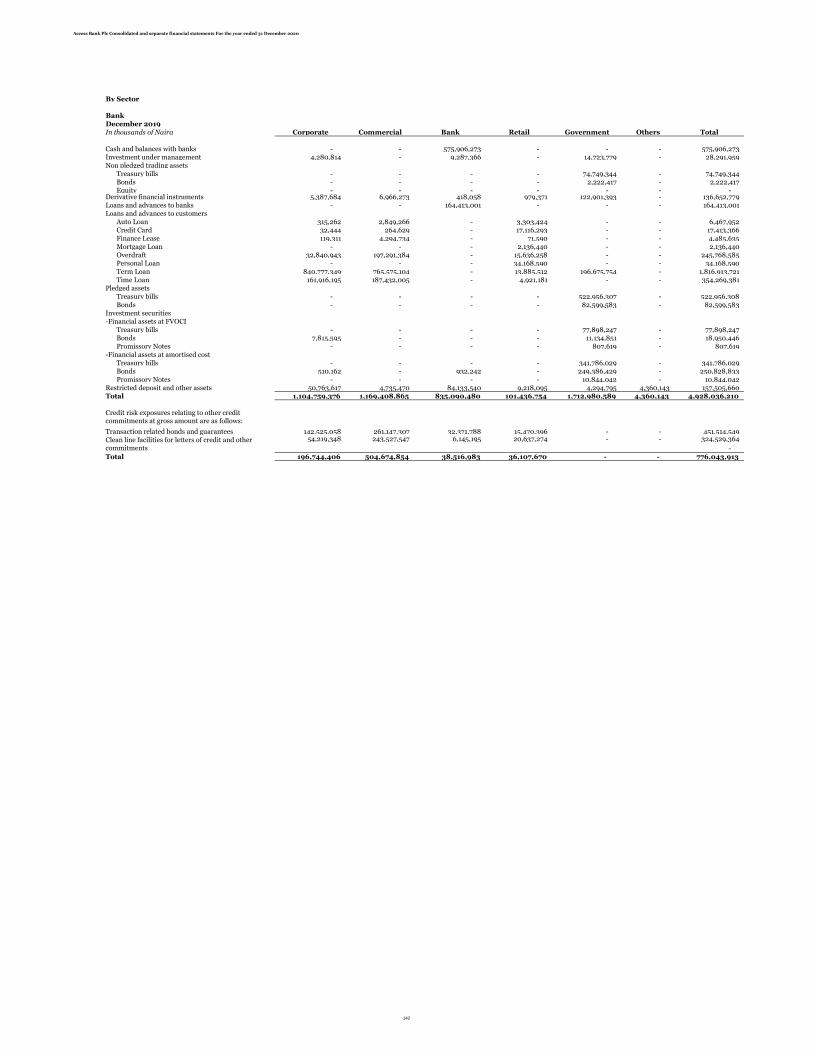
Access Bank Plc Consolidated and separate financial statements For the year ended 31 December 2020
By Sector
BankDecember 2019In thousands of Naira Corporate Commercial Bank Retail Government Others Total
Cash and balances with banks - - 575,906,273 - - - 575,906,273 Investment under management 4,280,814 - 9,287,366 - 14,723,779 - 28,291,959 Non pledged trading assets
Treasury bills - - - - 74,749,344 - 74,749,344 Bonds - - - - 2,222,417 - 2,222,417 Equity - - - - - - -
Derivative financial instruments 5,387,684 6,966,273 418,058 979,371 122,901,393 - 136,652,779 Loans and advances to banks - - 164,413,001 - - - 164,413,001 Loans and advances to customers
Auto Loan 315,262 2,849,266 - 3,303,424 - - 6,467,952 Credit Card 32,444 264,629 - 17,116,293 - - 17,413,366 Finance Lease 119,311 4,294,734 - 71,590 - - 4,485,635 Mortgage Loan - - - 2,136,440 - - 2,136,440 Overdraft 32,840,943 197,291,384 - 15,636,258 - - 245,768,585 Personal Loan - - - 34,168,590 - - 34,168,590 Term Loan 840,777,349 765,575,104 - 13,885,512 196,675,754 - 1,816,913,721 Time Loan 161,916,195 187,432,005 - 4,921,181 - - 354,269,381
Pledged assetsTreasury bills - - - - 522,956,307 - 522,956,308 Bonds - - - - 82,599,583 - 82,599,583
Investment securities-Financial assets at FVOCI
Treasury bills - - - - 77,898,247 - 77,898,247 Bonds 7,815,595 - - - 11,134,851 - 18,950,446 Promissory Notes - - - - 807,619 - 807,619
-Financial assets at amortised costTreasury bills - - - - 341,786,029 - 341,786,029 Bonds 510,162 - 932,242 - 249,386,429 - 250,828,833 Promissory Notes - - - - 10,844,042 - 10,844,042
Restricted deposit and other assets 50,763,617 4,735,470 84,133,540 9,218,095 4,294,795 4,360,143 157,505,660 Total 1,104,759,376 1,169,408,865 835,090,480 101,436,754 1,712,980,589 4,360,143 4,928,036,210
142,525,058 261,147,307 32,371,788 15,470,396 - - 451,514,549 54,219,348 243,527,547 6,145,195 20,637,274 - - 324,529,364
- Total 196,744,406 504,674,854 38,516,983 36,107,670 - - 776,043,913
Clean line facilities for letters of credit and other commitments
Credit risk exposures relating to other credit commitments at gross amount are as follows:
Transaction related bonds and guarantees
142

Access Bank Plc Consolidated and separate financial statements For the year ended 31 December 2020
5.1.5 (b)i By geography
Bank Nigeria Rest of Africa Europe Others TotalDecember 2020In thousands of Naira
Cash and balances with banks 474,375,779 60,654 115,376,006 - 589,812,438 Investment under management 14,172,243 7,109,072 9,170,151 - 30,451,466 Non pledged trading assets
Treasury bills 97,719,848 - - - 97,719,848 Bonds 12,563,265 - - - 12,563,265 Equity - - - - -
Derivative financial instruments 194,165,901 30,627,212 14,362,722 171,531 239,327,366 Loans and advances to banks 4,962,693 44,645,306 182,180,278 - 231,788,276 Loans and advances to customers
Auto Loan 4,243,504 - - - 4,243,504 Credit Card 22,189,872 - - - 22,189,872 Finance Lease 3,605,077 - - - 3,605,077 Mortgage Loan 3,031,432 - - - 3,031,432 Overdraft 283,473,925 - - - 283,473,925 Personal Loan 13,607,367 - - - 13,607,367 Term Loan 2,116,684,210 - - - 2,116,684,210 Time Loan 372,040,345 - - - 372,040,345
Pledged assetsTreasury bills 239,019,624 - - - 239,019,624 Bonds 44,451,010 - - - 44,451,010
Investment securities-Financial assets at FVOCI
Treasury bills 608,866,687 - - - 608,866,687 Bonds 106,924,656 - - - 106,924,656 Promissory Notes 80,033,790 - - - 80,033,790
-Financial assets at amortised costTreasury bills 194,302,056 - - - 194,302,056 Total Return Notes 45,527,717 - - - 45,527,717 Bonds 250,772,348 - - - 250,772,349 Promissory Notes 427,537 - - - 427,537
Restricted deposit and other assets 1,462,627,145 8,854,332 - - 1,471,481,478 Total 6,649,788,031 91,296,575 321,089,157 171,531 7,062,345,294
334,606,056 - 458,137 - 335,064,193
326,644,373 13,740,492 1,359,181 7,518 341,751,564 Total 661,250,429 13,740,492 1,817,318 7,518 676,815,757
Clean line facilities for letters of credit and other commitments
Credit risk exposures relating to other credit commitments at gross amount are as follows:
Transaction related bonds and guarantees
143

Access Bank Plc Consolidated and separate financial statements For the year ended 31 December 2020
By geography
Bank Nigeria Rest of Africa Europe Others TotalDecember 2019In thousands of Naira
Cash and balances with banks 352,972,318 20,610 186,426,517 - 539,419,445 Investment under management 9,225,166 6,849,720 12,217,073 - 28,291,959 Non pledged trading assets
Treasury bills 74,749,344 - - - 74,749,344 Bonds 2,222,417 - - - 2,222,417 Equity - - - - -
Derivative financial instruments 126,909,010 1,585,977 6,844,628 1,313,164 136,652,779 Loans and advances to banks 13,381,720 752,682 150,278,599 - 164,413,000 Loans and advances to customers
Auto Loan 6,467,952 - - - 6,467,952 Credit Card 17,413,366 - - - 17,413,366 Finance Lease 4,485,635 - - - 4,485,635 Mortgage Loan 2,136,440 - - - 2,136,440 Overdraft 245,768,584 - - - 245,768,584 Personal Loan 34,168,590 - - - 34,168,590 Term Loan 1,816,913,719 - - - 1,816,913,719 Time Loan 354,269,381 - - - 354,269,381
Pledged assetsTreasury bills 522,956,307 - - - 522,956,307 Bonds 82,599,583 - - - 82,599,583
Investment securities-Financial assets at FVOCI
Treasury bills 77,898,247 - - - 77,898,247 Bonds 11,134,851 7,815,595 - - 18,950,446 Promissory Notes 807,619 - - - 807,619
-Financial assets at amortised costTreasury bills 341,786,029 - - - 341,786,029 Bonds 249,386,429 510,162 932,242 - 250,828,833 Promissory Notes 10,844,042 - - - 10,844,042
Restricted deposit and other assets 139,214,206 17,935,193 - 356,261 157,505,660 Total 4,497,710,956 35,469,939 356,699,058 1,669,425 4,891,549,377
451,514,549 - - - 451,514,549 324,529,363 - - - 324,529,363
Total 776,043,912 - - - 776,043,912
Credit risk exposures relating to other credit commitments at gross amount are as follows:
Clean line facilities for letters of credit and other Transaction related bonds and guarantees
144

Access Bank Plc Consolidated and separate financial statements For the year ended 31 December 2020
Market risk management
5.2.1Interest rate gap position
A summary of the Group’s interest rate gap position on financial instruments is as follows:Group
In thousands of Naira Less than 3 4 - 6 months 7 - 12 months 1 - 5 years More than Non-Interest TotalDecember 2020 months 5 years bearing
Non-derivative assetsCash and balances with banks 89,783,183 - - - - 634,089,637 723,872,820 Investment under management 23,785,009 - - - 6,666,457 - 30,451,466 Non pledged trading assets
Treasury bills 15,425,251 6,502,706 94,108,169 - - - 116,036,126 Bonds - - 1,696,330 13,623,889 76,595,599 - 91,915,817
Loans and advances to banks 120,523,350 71,295,446 201,002,512 - - - 392,821,307 Loans and advances to customers
Auto Loan 1,191,994 2,448,986 2,114,765 8,309,097 - - 14,064,843 Credit Card 10,819,861 - 1,475,650 11,370,011 - - 23,665,522 Finance Lease 542,161 364,061 1,571,916 1,576,566 - - 4,054,704 Mortgage Loan 12,514,876 18,602,034 6,362,619 25,224,744 64,335,393 - 127,039,667 Overdraft 203,083,470 53,607,113 44,027,120 - - - 300,717,703 Personal Loan 3,699,315 5,648,917 6,820,810 10,102,240 3,071,844 - 29,343,127 Term Loan 80,129,846 34,852,785 119,754,388 883,377,166 1,218,290,251 - 2,336,404,437 Time Loan 254,399,725 64,553,042 63,864,257 - - - 382,817,024
Pledged assets - Treasury bills 101,874,873 73,955,530 8,273,493 - - - 184,103,896 Bonds - - - 2,418,944 42,032,066 - 44,451,010
Investment securities-Financial assets at FVOCI
Treasury bills 97,978,763 41,304,160 608,947,303 - - - 748,230,225 Bonds - - 3,947,114 34,202,910 181,464,849 - 219,614,874 Promissory notes - - - 80,033,790 - - 80,033,790
-Financial assets at amortised costTreasury bills 31,463,203 13,263,703 192,382,539 - - - 237,109,445 Bonds - - 5,029,820 43,584,869 228,825,310 - 277,439,999 Promissory notes - - - 427,536 - - 427,536 Total return notes - - 45,527,717 - - - 45,527,717
Restricted deposit and other assets - - - - - 1,522,315,074 1,522,315,074 1,047,214,877 386,398,482 1,406,906,524 1,114,251,762 1,821,281,773 2,156,404,712 7,932,458,130
Non-derivative liabilitiesDeposits from financial institutions 584,821,197 242,404,257 131,171,717 - - - 958,397,171 Deposits from customers 3,036,562,629 214,090,929 33,271,788 1,515,952 2,785 2,301,974,129 5,587,418,213 Other liabilities - - - - - 356,638,122 356,638,122 Debt securities issued - 122,195,240 - 15,423,330 31,541,488 - 169,160,058 Interest bearing borrowings 5,951,608 23,125,817 168,782,396 164,893,495 428,701,922 - 791,455,237
3,627,335,434 601,816,243 333,225,901 181,832,776 460,246,195 2,658,612,251 7,863,068,801 Total interest re-pricing gap (2,580,120,557) (215,417,760) 1,073,680,622 932,418,986 1,361,035,578 (502,207,539) 69,389,329
Group
In thousands of Naira Less than 3 4 - 6 months 7 - 12 months 1 - 5 years More than Non-Interest TotalDecember 2019 months 5 years bearing
Non-derivative assetsCash and balances with banks 48,838,459 - - - - 674,316,991 723,155,450 Investment under management 23,799,663 - - - 4,492,296 - 28,291,959 Non pledged trading assets
Treasury bills 322,930 - - 88,784 89,386,247 - 89,797,961 Bonds 6,119,728 18,240,051 15,661,498 - - - 40,021,277
Loans and advances to banks 1,574,222 - 151,250,859 - - - 152,825,081 Loans and advances to customers
Auto Loan 1,367,433 2,723,298 2,250,439 11,438,338 - - 17,779,508 Credit Card 5,224,010 4,005,074 4,832,030 5,049,876 - - 19,110,990 Finance Lease 185,166 281,973 995,208 3,481,829 - - 4,944,175 Mortgage Loan 14,083,082 20,961,920 7,042,857 28,829,594 70,965,117 - 141,882,570 Overdraft 191,136,170 28,721,932 33,127,579 - - - 252,985,681 Personal Loan 22,390,356 6,891,505 7,762,223 11,855,183 3,373,662 - 52,272,927 Term Loan 135,048,813 46,399,740 103,043,879 883,206,154 878,273,788 - 2,045,972,373 Time Loan 229,826,017 24,874,616 121,930,850 - - - 376,631,483
Pledged assetsTreasury bills 356,959,312 58,032,025 107,964,970 - - - 522,956,307 Bonds 4,195,563 - - 16,962,424 61,441,596 - 82,599,583
Investment securities-Financial assets at FVOCI
Treasury bills 203,505,343 5,506,455 23,801,576 - - - 232,813,374 Bonds - - - 16,917,821 65,059,856 - 81,977,676 Promissory notes - - 18 807,601 - - 807,619
-Financial assets at amortised costTreasury bills 180,212,376 44,050,341 155,020,664 - - - 379,283,381 Bonds 12,916,561 987,141 2,145,796 60,395,511 189,833,987 - 266,278,996 Promissory notes 10,357,841 58,664 - 427,536 - - 10,844,042
Restricted deposit and other assets - - - - - 1,016,582,843 1,016,582,843 1,448,063,042 261,734,735 736,830,446 1,039,460,651 1,362,826,549 1,690,899,834 6,539,815,256
Non-derivative liabilitiesDeposits from financial institutions 726,033,482 333,020,413 127,302,419 - - - 1,186,356,314 Deposits from customers 3,958,730,179 185,329,362 110,055,505 1,720,003 2,254 - 4,255,837,303 Other liabilities - - - - - 315,626,032 315,626,032 Debt securities issued 14,691 157,931 1,046,358 44,090,302 112,678,596 - 157,987,877 Interest bearing borrowings 54,051 581,074 3,849,869 162,221,574 419,896,262 - 586,602,830
4,684,832,403 519,088,779 242,254,151 208,031,878 532,577,112 315,626,032 6,502,410,356 Total interest re-pricing gap (3,236,769,361) (257,354,044) 494,576,294 831,428,773 830,249,437 1,375,273,802 37,404,900
Repricing gap measures the difference between the Bank’s interest sensitive assets and liabilities within certain maturity ranges. Differences between these assets and liabilities pose as potential losses from unexpectedchanges in interest rate. Negative Gaps represent situations when assets are less than liabilities and the Bank is exposed to an increase in interest rates. Where assets are more than liabilities this can be described aspositive gap and the Bank is exposed to decline in interest rates.
The results above shows a negative gap of N2.9 trillion in the ‘less than 3 months’ time bucket, however this is as a result of the contractual nature of Non Maturity deposits. A significant portion of this gap is as a resultof the contractual nature of Non Maturing Deposits.
Re-pricing year
Re-pricing year
145

Access Bank Plc Consolidated and separate financial statements For the year ended 31 December 2020
5.2.1A summary of the Bank’s interest rate gap position on securitty portfolios is as follows:Bank
In thousands of Naira Less than 3 4 - 6 months 7 - 12 months 1 - 5 years More than Non-Interest TotalDecember 2020 months 5 years bearing
Non-derivative assetsCash and balances with banks 40,095,276 - - - - 549,717,160 589,812,438 Investment under management 23,785,009 - - - 6,666,457 - 30,451,466 Non- pledged trading assets
Treasury bills 12,990,379 5,476,255 79,253,214 - - - 97,719,848 Bonds - - 225,507 1,954,087 10,383,670 - 12,563,265
Loans and advances to banks 120,523,350 71,295,446 39,969,481 - - - 231,788,276 Loans and advances to customers
Auto Loan 209,860 190,078 445,138 3,398,428 - - 4,243,503 Credit Card 10,819,861 - - 11,370,011 - - 22,189,872 Finance Lease 497,198 206,692 1,387,569 1,513,618 - - 3,605,077 Mortgage Loan 114,053 798 162,208 423,097 2,331,276 - 3,031,432 Overdraft 203,083,470 53,607,113 26,783,342 - - - 283,473,925 Personal Loan 1,338,951 141,401 841,221 8,213,949 3,071,844 - 13,607,367 Term Loan 58,157,824 6,289,155 71,415,939 773,517,053 1,207,304,240 - 2,116,684,210 Time Loan 249,011,385 62,074,406 60,954,554 - - - 372,040,345
Pledged assetsTreasury bills 101,874,873 73,955,530 8,273,493 - - - 184,103,896 Bonds - - - 2,418,944 42,032,066 - 44,451,010
Investment securities-Financial assets at FVOCI
Treasury bills 79,453,504 33,494,608 495,918,575 - - - 608,866,687 Bonds - - 1,912,888 16,575,739 88,436,029 - 106,924,656 Promissory note - - 1,912,888 16,575,739 88,436,029 - 106,924,656
-Financial assets at amortised costTreasury bills 25,835,013 10,891,070 157,575,973 - - - 194,302,056 Bonds - - 4,561,362 39,525,545 207,112,979 - 251,199,886 Promissory note - - - 427,537 - - 427,537 Total return notes - - 45,527,717 - - - 45,527,717
Restricted deposit and other assets - - - - - 1,471,481,477 1,471,481,477 927,790,005 317,622,553 997,121,069 875,913,748 1,655,774,593 2,021,198,637 6,795,420,605
Non-derivative liabilitiesDeposits from financial institutions 514,323,447 213,573,720 103,735,165 - - - 831,632,332 Deposits from customers 2,640,757,810 172,047,852 26,737,890 1,218,250 2,238 1,991,980,453 4,832,744,493 Other liabilities - - - - - 322,955,917 322,955,917 Debt securities - 122,195,240 - 15,423,330 31,541,488 - 169,160,058 Interest bearing borrowings 5,675,830 22,054,242 160,961,567 157,252,865 409,309,769 - 755,254,273
3,160,757,087 529,871,053 291,434,622 173,894,446 440,853,496 2,314,936,370 6,911,747,076 Total interest re-pricing gap (2,232,967,078) (212,248,496) 705,686,446 702,019,303 1,214,921,096 (293,737,732) (116,326,469)
Bank
In thousands of Naira Less than 3 4 - 6 months 7 - 12 months 1 - 5 years More than Non-Interest TotalDecember 2019 months 5 years bearing
Non-derivative assetsCash and balances with banks 32,822,515 - - - - 543,085,032 575,907,548 Investment under management 23,799,663 - - - 4,492,296 - 28,291,959 Non- pledged trading assets
Treasury bills 25,811,643 15,183,327 33,754,374 - - - 74,749,344 Bonds 17,933 - - 4,930 2,199,554 - 2,222,417
Loans and advances to banks 1,574,222 - 162,838,779 - - - 164,413,001 Loans and advances to customers
Auto Loan 236,278 121,640 327,474 5,782,560 - - 6,467,951 Credit Card 5,224,010 4,005,074 3,134,406 5,049,876 - - 17,413,366 Finance Lease 139,312 121,485 807,207 3,417,633 - - 4,485,637 Mortgage Loan 108,469 - 55,551 880,368 1,092,051 - 2,136,440 Overdraft 191,136,170 28,721,932 25,910,483 - - - 245,768,584 Personal Loan 19,674,705 554,987 882,575 9,682,662 3,373,662 - 34,168,590 Term Loan 112,142,947 16,622,115 52,650,975 768,676,826 866,820,855 - 1,816,913,719 Time Loan 224,438,927 22,396,554 107,433,900 - - - 354,269,381
Pledged assetsTreasury bills 356,736,955 57,603,524 108,615,828 - - - 522,956,307 Bonds - - - 5,370,235 77,229,349 - 82,599,584
Investment securities-Financial assets at FVOCI
Treasury bills 67,587,702 1,820,486 8,490,265 - - - 77,898,453 Bonds - - - 3,904,247 15,046,199 - 18,950,446 Promissory note - - 18 807,602 - - 807,620
-Financial assets at amortised costTreasury bills 162,585,507 39,741,705 139,458,818 - - - 341,786,029 Bonds 21,854,573 - 2,026,459 37,693,507 200,098,335 - 261,672,874 Promissory note 10,357,841 58,664 - 427,536 - - 10,844,042
Restricted deposit and other assets - - - - - 968,698,629 968,698,629 1,256,249,369 186,951,496 646,387,111 841,697,986 1,170,352,303 1,511,783,661 5,613,421,926
Non-derivative liabilitiesDeposits from financial institutions 660,027,871 302,744,652 116,511,894 - - - 1,079,284,418 Deposits from customers 3,410,734,852 159,764,671 82,433,687 1,482,742 1,943 - 3,654,417,894 Other liabilities - - - - - 295,184,124 295,184,124 Debt securities - - - 142,561,644 15,426,233 - 157,987,877 Interest bearing borrowings - 758,553 1,693,928 187,349,953 350,851,336 3,410,456 544,064,226
4,070,762,723 463,267,876 200,639,509 331,394,340 366,279,512 298,594,580 5,730,938,542 Total interest re-pricing gap (2,814,513,350) (276,316,376) 445,747,602 510,303,645 804,072,790 1,213,189,081 (117,516,616)
Re-pricing year
Re-pricing year
146

Access Bank Plc Consolidated and separate financial statements For the year ended 31 December 2020
5.2.3The table below summarises the Group’s financial instruments at carrying amount, categorised by currency:
Financial instruments by currency
Group
In thousands of Naira
December 2020 Total Naira US GBP Euro Others
Cash and balances with banks 723,872,820 183,524,466 318,479,238 74,495,360 92,618,620 54,755,134
Investment under management 30,451,466 27,667,779 2,783,687 - - -
Non-pledged trading assets
Treasury bills 116,036,126 97,719,848 - - - 18,316,278
Bonds 91,915,817 12,488,649 74,615 - - 79,352,552
Equity - - - - - -
Derivative financial instruments 251,112,744 244,564,046 - 4,732,073 8,129 1,808,496
Loans and advances to banks 392,821,307 843,088 391,978,220 - - -
Loans and advances to customers
Auto Loan 14,064,843 4,243,504 2,022,781 - - 7,798,557
Credit Card 23,665,522 19,036,608 3,456,928 257 - 1,171,729
Finance Lease 4,054,704 3,605,077 92,604 - - 357,023
Mortgage Loan 127,039,667 3,031,432 25,540,461 33,683,980 - 64,783,793
Overdraft 300,717,702 260,286,030 26,739,240 639 2 13,691,793
Personal Loan 29,343,127 13,480,722 3,367,547 - - 12,494,857
Term Loan 2,336,404,437 1,858,808,474 303,086,333 165,991,449 42,493 8,475,687
Time Loan 382,817,024 113,032,794 249,821,168 6,520,373 9,557,270 3,885,418
Pledged assets
-Financial assets at FVOCI
Treasury bills 999,521 999,521 - - - -
Bonds 2,617,080 2,617,080 - - - -
-Financial assets at amortised cost
Treasury bills 98,097,771 98,097,771 - - - -
Bonds 41,833,930 41,833,930 - - - -
-Financial assets at FVPL
Treasury bills 85,006,604 85,006,604 - - - -
Bonds - - - - - -
Investment securities
-Financial assets at FVOCI
Treasury bills 748,230,225 608,866,687 134,875,103 - - 4,488,434
Bonds 219,614,874 91,783,529 22,032,870 - - 105,798,475
Promissory notes 80,033,790 80,033,790 - - - -
-Financial assets at FVPL
Equity 141,765,576 22,751,701 118,983,352 30,523 - -
-Financial assets at amortised cost
Treasury bills 237,109,445 194,302,056 - - - 42,807,389
Total return notes 45,527,717 - 45,527,717 - - -
Bonds 277,439,999 250,772,348 6,891,743 - - 19,775,908
Promissory notes 427,536 427,536 - - - -
Restricted deposit and other assets 1,522,315,074 1,380,851,224 91,807,963 783,023 1,430,290 47,442,574
8,325,336,447 5,700,676,296 1,747,561,571 286,237,677 103,656,805 487,204,098
Deposits from financial institutions 958,397,171 12,284,842 930,447,908 4,514,659 6,976,833 4,172,929
Deposits from customers 5,587,418,213 3,915,294,407 1,069,396,893 235,709,852 29,251,452 337,765,609
Derivative financial instruments 20,880,529 20,775,722 85,133 - 19,549 125
Other liabilities 356,638,122 273,817,262 55,914,256 6,627,680 2,395,628 17,883,295
Debt securities issued 169,160,059 46,964,818 122,195,241 - - -
Interest bearing borrowings 791,455,237 419,322,836 361,202,412 - 2,112,886 8,817,103
7,883,949,332 4,688,459,886 2,539,241,844 246,852,190 40,756,348 368,639,062
Off balance sheet exposures:
Transaction related bonds and guarantees 378,808,847 209,738,623 74,052,168 33,019 59,643,055 35,341,982
Clean line facilities for letters of credit and other commitments 445,538,945 0 412,339,777 9,295,470 23,782,623 121,075
919,365,848 209,738,623 486,391,946 9,361,508 143,068,734 70,805,039
*Included in Others are balances the group has in other currencies which includes South Africa Rand, Japanese Yen, Ghanaian Cedis, Dirham, Australian dollars, Canadian dollars, Swiss franc, Chinese Yuan etc.
147

Access Bank Plc Consolidated and separate financial statements For the year ended 31 December 2020
Financial instruments by currency
Group
In thousands of Naira
December 2019 Total Naira US GBP Euro Others
Cash and balances with banks 723,063,304 453,932,614 133,256,184 81,538,667 53,428,679 907,159
Investment under management 28,291,959 25,854,313 2,437,646 - - -
Non-pledged trading assets
Treasury bills 71,810,176 71,810,176 - - - -
Bonds 2,105,312 2,105,312 - - - -
Equity - - - - - -
Derivative financial instruments 143,520,554 143,480,074 31,765 4,274 4,441 -
Loans and advances to banks 125,646,471 125,388,045 233,140 23,287 1,315 684
Loans and advances to customers
Auto Loan 17,779,508 6,467,952 - - - 11,311,556
Credit Card 19,110,990 13,193,895 5,259,311 224 - 657,560
Finance Lease 4,944,175 4,485,635 - - - 458,540
Mortgage Loan 141,882,570 2,136,440 - - - 139,746,130
Overdraft 252,985,680 211,698,524 34,070,060 - - 7,217,096
Personal Loan 52,272,927 34,109,700 58,890 - - 18,104,337
Term Loan 2,045,972,373 1,250,302,404 734,773,011 - 28,938 60,868,021
Time Loan 376,631,483 66,600,412 300,932,717 570,300 4,488,266 4,039,788
Pledged assets
-Financial assets at FVOCI
Treasury bills 30,388,532 30,388,532 - - - -
Bonds - - - - - -
-Financial assets at amortised cost
Treasury bills 452,686,281 452,686,281 - - - -
Bonds 82,599,583 82,599,583 - - - -
-Financial assets at FVPL
Treasury bills 39,881,494 39,881,494 - - - -
Bonds - - - - - -
Investment securities
-Financial assets at FVOCI
Treasury bills 232,814,072 77,898,247 149,464,151 - - 5,451,674
Bonds 81,977,677 18,950,446 - - - 63,027,231
Promissory notes 807,619 807,619 - - - -
-Financial assets at FVPL
Equity 113,158,320 113,126,623 - 31,697 - -
-Financial assets at amortised cost
Treasury bills 379,283,381 341,786,029 - - - 37,497,352
Bonds 265,856,916 249,896,592 510,162 - - 15,450,162
Promissory notes 10,844,042 10,844,042 - - - -
Restricted deposit and other assets 1,028,044,587 924,333,084 44,882,326 1,616,300 476,590 56,736,288
6,724,359,985 4,754,764,069 1,405,909,364 83,784,748 58,428,229 421,473,579
Deposits from financial institutions 1,186,356,314 11,466,226 1,154,893,153 7,543,859 11,517,210 935,866
Deposits from customers 4,255,837,303 2,885,124,586 889,539,662 198,600,481 40,860,263 241,712,310
Derivative financial instruments 6,885,680 6,827,293 21,657 735 35,738 257
Other liabilities 315,593,152 247,375,844 41,266,317 6,392,838 8,451,784 12,106,370
Debt securities issued 157,987,877 47,054,109 110,933,768 - - -
Interest bearing borrowings 585,666,012 287,901,717 279,547,909 - 2,048,811 16,167,574
6,508,326,339 3,485,749,774 2,476,202,469 212,537,912 62,913,806 270,922,378
Off balance sheet exposures
Transaction related bonds and guarantees 531,976,664 297,939,670 116,354,693 190,686 47,297,755 70,193,860
Clean line facilities for letters of credit and other commitments 332,827,557 - 314,986,446 3,495,160 13,539,804 806,147
864,804,221 297,939,670 431,341,141 3,685,845 60,837,560 71,000,006
148

Access Bank Plc Consolidated and separate financial statements For the year ended 31 December 2020
5.2.3The table below summaries the Bank’s financial instruments at carrying amount, categorised by currency:
Financial instruments by currency
Bank
In thousands of Naira
December 2020 Total Naira US GBP Euro Others
Cash and balances with banks 589,812,439 183,524,466 295,629,872 24,688,883 82,650,611 3,318,608
Investment under management 30,451,466 27,667,779 2,783,687 - - -
Non-pledged trading assets
Treasury bills 97,719,848 97,719,848 - - - -
Bonds 12,563,265 12,488,649 74,615 - - -
Equity - - - - - -
Derivative financial instruments 244,564,046 244,564,046 - - - -
Loans and advances to banks 231,788,276 843,088 230,945,189 - - -
Loans and advances to customers
Auto Loan 4,243,504 4,243,504 - - - -
Credit Card 22,189,872 19,036,608 3,153,007 257 - -
Finance Lease 3,605,077 3,605,077 - - - -
Mortgage Loan 3,031,432 3,031,432 - - - -
Overdraft 283,473,925 260,286,030 23,187,750 144 2 -
Personal Loan 13,607,367 13,480,722 126,645 - - -
Term Loan 2,116,684,210 1,858,808,474 257,833,242 - 42,493 -
Time Loan 372,040,345 113,032,794 247,601,627 1,816,838 9,557,270 31,814
Pledged assets
-Financial assets at FVOCI
Treasury bills 999,521 999,521 - - - -
Bonds 2,617,080 2,617,080 - - - -
-Financial assets at amortised cost
Treasury bills 98,097,771 98,097,771 - - - -
Bonds 41,833,930 41,833,930 - - - -
-Financial assets at FVPL
Treasury bills 85,006,603 85,006,603 - - - -
Bonds - - - - - -
Investment securities
-Financial assets at FVOCI
Treasury bills 608,866,687 608,866,687 - - - -
Bonds 106,924,656 91,783,529 15,141,127 - - -
Promissory notes 80,033,790 80,033,790 - - - -
-Financial assets at FVPL
Equity 141,735,053 22,751,701 118,983,352 - - -
-Financial assets at amortised cost
Treasury bills 194,302,056 194,302,056 - - - -
Total return notes 45,527,717 - 45,527,717 - - -
Bonds 250,772,348 250,772,348 - - - -
Promissory notes 427,537 427,537 - - - -
Restricted deposit and other assets 1,471,481,476 1,380,851,224 89,200,647 - 1,429,606 -
7,154,401,296 5,700,676,296 1,330,188,476 26,506,121 93,679,980 3,350,422
Deposits from financial institutions 831,632,332 12,284,842 816,255,696 60,925 3,017,007 13,863
Deposits from customers 4,832,744,493 3,915,294,407 883,994,671 16,898,928 16,556,059 427
Derivative financial instruments 20,775,722 20,775,722 - - - -
Other liabilities 322,955,917 273,817,262 46,643,918 64,085 2,386,350 44,302
Debt securities issued 169,160,059 46,964,818 122,195,241 - - -
Interest bearing borrowings 755,254,273 419,322,836 335,931,437 - - -
6,932,522,796 4,688,459,886 2,205,020,965 17,023,938 21,959,418 58,592
Off balance sheet exposures:
Transaction related bonds and guarantees 335,064,193 209,738,623 66,277,024 15,244 59,033,301 -
Clean line facilities for letters of credit and other commitments 341,751,564 0 328,287,614 224,396 13,237,822 1,732
2,881,836,721 209,738,623 2,599,585,602 239,641 72,271,123 1,732
149

Access Bank Plc Consolidated and separate financial statements For the year ended 31 December 2020
Financial instruments by currency
Bank
In thousands of Naira
December 2019 Total Naira US GBP Euro Others
Cash and balances with banks 575,905,574 453,932,614 60,998,522 16,118,142 43,016,317 1,839,979
Investment under management 28,291,959 25,854,313 2,437,646 - - -
Non-pledged trading assets
Treasury bills 71,810,176 71,810,176 - - - -
Bonds 2,105,312 2,105,312 - - - -
Equity - - - - - -
Derivative financial instruments 143,480,074 143,480,074 - - - -
Loans and advances to banks 164,413,001 880,686 162,779,633 - 752,682 -
Loans and advances to customers
Auto Loan 6,467,952 6,467,952 - - - -
Credit Card 17,413,366 13,193,895 4,219,247 224 - -
Finance Lease 4,485,635 4,485,635 - - - -
Mortgage Loan 2,136,440 2,136,440 - - - -
Overdraft 245,768,584 211,698,524 34,070,060 - - -
Personal Loan 34,168,590 34,109,700 58,890 - - -
Term Loan 1,816,913,719 1,250,302,404 566,582,377 - 28,938 -
Time Loan 354,269,381 66,600,412 282,293,518 570,300 4,488,266 316,886
Pledged assets
-Financial assets at FVOCI
Treasury bills 30,388,532 30,388,532 - - - -
Bonds - - - - - -
-Financial assets at amortised cost
Treasury bills 452,686,281 452,686,281 - - - -
Bonds 82,599,583 82,599,583 - - - -
-Financial assets at FVPL
Treasury bills 39,881,494 39,881,494 - - - -
Bonds - - - - - -
Investment securities
-Financial assets at FVOCI
Treasury bills 77,898,247 77,898,247 - - - -
Bonds 18,950,446 18,950,446 - - - -
Promissory notes 807,619 807,619 - - - -
-Financial assets at FVPL
Equity 113,126,623 113,126,623 - - - -
-Financial assets at amortised cost
Treasury bills 341,786,029 341,786,029 - - - -
Bonds 250,406,754 249,896,592 510,162 - - -
Promissory notes 10,844,042 10,844,042 - - - -
Restricted deposit and other assets 968,141,727 924,333,084 43,332,809 - 475,833 -
5,855,147,139 4,630,256,711 1,157,282,864 16,688,664 48,762,035 2,156,864
Deposits from financial institutions 1,079,284,418 11,466,226 1,064,743,979 234,864 2,523,963 315,387
Deposits from customers 3,668,339,811 2,885,124,586 750,073,110 15,112,528 18,029,210 376
Derivative financial instruments 6,827,293 6,827,293 - - - -
Other liabilities 295,184,124 247,375,844 38,647,749 477,852 8,441,521 241,159
Debt securities issued 157,987,877 47,054,109 110,933,768 - - -
Interest bearing borrowings 544,064,226 287,901,717 256,162,509 - - -
5,751,687,749 3,485,749,774 2,220,561,116 15,825,244 28,994,696 556,922 Off balance sheet exposures
Transaction related bonds and guarantees 451,514,549 297,939,670 106,863,384 - 46,711,494 -
Clean line facilities for letters of credit and other commitments 324,529,363 - 314,795,394 884,561 8,104,976 744,432
776,043,912 297,939,670 421,658,778 884,561 54,816,471 744,432
1
150
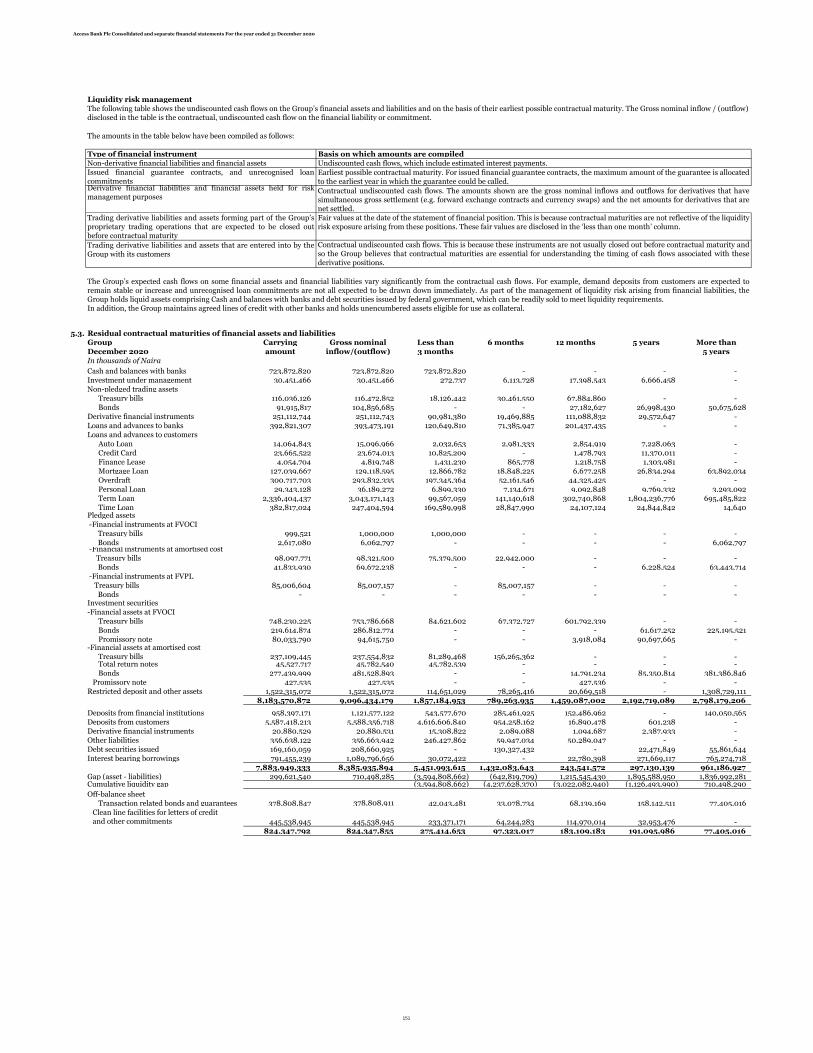
Access Bank Plc Consolidated and separate financial statements For the year ended 31 December 2020
Liquidity risk management
The amounts in the table below have been compiled as follows:
Type of financial instrument Basis on which amounts are compiledNon-derivative financial liabilities and financial assets
5.3.1Residual contractual maturities of financial assets and liabilitiesGroup Carrying Gross nominal Less than 6 months 12 months 5 years More thanDecember 2020 amount inflow/(outflow) 3 months 5 yearsIn thousands of Naira
Cash and balances with banks 723,872,820 723,872,820 723,872,820 - - - - Investment under management 30,451,466 30,451,466 272,737 6,113,728 17,398,543 6,666,458 - Non-pledged trading assets
Treasury bills 116,036,126 116,472,852 18,126,442 30,461,550 67,884,860 - - Bonds 91,915,817 104,856,685 - - 27,182,627 26,998,430 50,675,628
Derivative financial instruments 251,112,744 251,112,743 90,981,380 19,469,885 111,088,832 29,572,647 - Loans and advances to banks 392,821,307 393,473,191 120,649,810 71,385,947 201,437,435 - - Loans and advances to customers
Auto Loan 14,064,843 15,096,966 2,032,653 2,981,333 2,854,919 7,228,063 - Credit Card 23,665,522 23,674,013 10,825,209 - 1,478,793 11,370,011 - Finance Lease 4,054,704 4,819,748 1,431,230 865,778 1,218,758 1,303,981 - Mortgage Loan 127,039,667 129,118,595 12,866,782 18,848,225 6,677,258 26,834,294 63,892,034 Overdraft 300,717,703 293,832,335 197,345,364 52,161,546 44,325,425 - - Personal Loan 29,343,128 36,189,272 6,899,330 7,134,671 9,092,848 9,769,332 3,293,092 Term Loan 2,336,404,437 3,043,171,143 99,567,059 141,140,618 302,740,868 1,804,236,776 695,485,822 Time Loan 382,817,024 247,404,594 169,589,998 28,847,990 24,107,124 24,844,842 14,640
Pledged assets -Financial instruments at FVOCI Treasury bills 999,521 1,000,000 1,000,000 - - - - Bonds 2,617,080 6,062,797 - - - - 6,062,797 -Financial instruments at amortised cost Treasury bills 98,097,771 98,321,500 75,379,500 22,942,000 - - - Bonds 41,833,930 69,672,238 - - - 6,228,524 63,443,714 -Financial instruments at FVPL Treasury bills 85,006,604 85,007,157 - 85,007,157 - - - Bonds - - - - - - - Investment securities-Financial assets at FVOCI
Treasury bills 748,230,225 753,786,668 84,621,602 67,372,727 601,792,339 - - Bonds 219,614,874 286,812,774 - - - 61,617,252 225,195,521 Promissory note 80,033,790 94,615,750 - - 3,918,084 90,697,665 -
-Financial assets at amortised costTreasury bills 237,109,445 237,554,832 81,289,468 156,265,362 - - - Total return notes 45,527,717 45,782,540 45,782,539 - - - -
Bonds 277,439,999 481,528,893 - - 14,791,234 85,350,814 381,386,846 Promissory note 427,535 427,535 - - 427,536 - - Restricted deposit and other assets 1,522,315,072 1,522,315,072 114,651,029 78,265,416 20,669,518 - 1,308,729,111
8,183,570,872 9,096,434,179 1,857,184,953 789,263,935 1,459,087,002 2,192,719,089 2,798,179,206
Deposits from financial institutions 958,397,171 1,121,577,122 543,577,670 285,461,925 152,486,962 - 140,050,565 Deposits from customers 5,587,418,213 5,588,356,718 4,616,606,840 954,258,162 16,890,478 601,238 - Derivative financial instruments 20,880,529 20,880,531 15,308,822 2,089,088 1,094,687 2,387,933 - Other liabilities 356,638,122 356,663,942 246,427,862 59,947,034 50,289,047 - - Debt securities issued 169,160,059 208,660,925 - 130,327,432 - 22,471,849 55,861,644 Interest bearing borrowings 791,455,239 1,089,796,656 30,072,422 - 22,780,398 271,669,117 765,274,718
7,883,949,333 8,385,935,894 5,451,993,615 1,432,083,643 243,541,572 297,130,139 961,186,927 Gap (asset - liabilities) 299,621,540 710,498,285 (3,594,808,662) (642,819,709) 1,215,545,430 1,895,588,950 1,836,992,281 Cumulative liquidity gap (3,594,808,662) (4,237,628,370) (3,022,082,940) (1,126,493,990) 710,498,290
Off-balance sheetTransaction related bonds and guarantees 378,808,847 378,808,911 42,043,481 33,078,734 68,139,169 158,142,511 77,405,016
Clean line facilities for letters of credit and other commitments 445,538,945 445,538,945 233,371,171 64,244,283 114,970,014 32,953,476 -
824,347,792 824,347,855 275,414,653 97,323,017 183,109,183 191,095,986 77,405,016
Trading derivative liabilities and assets forming part of the Group’sproprietary trading operations that are expected to be closed outbefore contractual maturity
Fair values at the date of the statement of financial position. This is because contractual maturities are not reflective of the liquidityrisk exposure arising from these positions. These fair values are disclosed in the ‘less than one month’ column.
Trading derivative liabilities and assets that are entered into by theGroup with its customers
Contractual undiscounted cash flows. This is because these instruments are not usually closed out before contractual maturity andso the Group believes that contractual maturities are essential for understanding the timing of cash flows associated with thesederivative positions.
The Group’s expected cash flows on some financial assets and financial liabilities vary significantly from the contractual cash flows. For example, demand deposits from customers are expected toremain stable or increase and unrecognised loan commitments are not all expected to be drawn down immediately. As part of the management of liquidity risk arising from financial liabilities, theGroup holds liquid assets comprising Cash and balances with banks and debt securities issued by federal government, which can be readily sold to meet liquidity requirements. In addition, the Group maintains agreed lines of credit with other banks and holds unencumbered assets eligible for use as collateral.
The following table shows the undiscounted cash flows on the Group’s financial assets and liabilities and on the basis of their earliest possible contractual maturity. The Gross nominal inflow / (outflow) disclosed in the table is the contractual, undiscounted cash flow on the financial liability or commitment.
Undiscounted cash flows, which include estimated interest payments.Issued financial guarantee contracts, and unrecognised loancommitments
Earliest possible contractual maturity. For issued financial guarantee contracts, the maximum amount of the guarantee is allocatedto the earliest year in which the guarantee could be called.
Derivative financial liabilities and financial assets held for riskmanagement purposes
Contractual undiscounted cash flows. The amounts shown are the gross nominal inflows and outflows for derivatives that havesimultaneous gross settlement (e.g. forward exchange contracts and currency swaps) and the net amounts for derivatives that arenet settled.
151

Access Bank Plc Consolidated and separate financial statements For the year ended 31 December 2020
Group Carrying Gross nominal Less than 6 months 12 months 5 years More thanDecember 2019 amount inflow/(outflow) 3 months 5 years
In thousands of Naira
Cash and balances with banks 723,064,003 688,914,193 688,914,193 - - - - Investment under management 28,291,959 28,291,959 767,313 9,012,114 14,020,236 4,492,296 - Non-pledged trading assets - - - - -
Treasury bills 89,797,961 94,861,781 31,063,592 20,455,361 43,342,828 - - Bonds 40,021,277 42,952,256 12,617,789 - - 12,606,930 17,727,537
Derivative financial instruments 143,520,553 143,520,552 49,561,122 11,860,583 82,098,847 - - Loans and advances to banks 152,825,081 154,450,204 2,884,137 - 151,566,067 - - Loans and advances to customers
Auto Loan 17,779,508 17,856,398 1,419,559 3,511,085 2,800,066 10,125,688 - Credit Card 19,110,990 19,339,743 5,292,084 4,057,264 4,874,714 5,115,681 - Finance Lease 4,944,175 5,146,881 439,934 1,003,556 1,594,991 2,108,400 - Mortgage Loan 141,882,570 142,875,275 14,630,993 21,223,787 7,422,974 28,751,374 70,846,147 Overdraft 252,985,681 299,728,849 221,191,091 31,384,466 47,153,292 - - Personal Loan 52,272,928 52,940,647 19,939,124 8,196,350 9,510,897 11,401,910 3,892,366 Term Loan 2,045,972,373 2,185,260,598 318,195,947 162,727,687 262,350,776 796,327,128 645,659,060 Time Loan 376,631,483 379,822,056 137,932,385 187,158,574 54,731,097 - -
Pledged assets -Financial instruments at FVOCI
Treasury bills 30,388,532 32,424,722 5,500,000 8,124,722 18,800,000 - - Bonds - - - - - - -
-Financial instruments at amortised cost Treasury bills 452,686,283 453,872,748 129,026,743 242,100,648 82,745,357 - - Bonds 82,599,583 123,975,255 - - - 5,618,298 118,356,957 -Financial instruments at FVPL Treasury bills 39,881,494 41,886,245 - 31,221,245 10,665,000 - - Bonds - - - - - - - Investment securities-Financial assets at FVOCI
Treasury bills 232,813,374 233,605,789 203,904,571 10,907,341 18,793,877 - - Bonds 81,977,676 103,693,091 - - 65,466,231 38,226,860 - Promissory note 807,619 1,055,468 - 20 - 1,055,448 -
-Financial assets at amortised costTreasury bills 379,283,381 380,408,695 175,122,124 52,224,901 153,061,670 - - Bonds 266,278,996 416,671,728 19,737,979 3,862,541 6,117,451 42,467,781 344,485,976 Promissory note 10,844,041 10,844,041 10,357,841 58,664 - 427,536 -
Restricted deposit and other assets 1,016,582,841 1,016,582,841 141,177,839 26,558,428 - - 848,846,574 6,683,244,362 7,070,982,010 2,189,676,361 835,649,337 1,037,116,372 958,725,329 2,049,814,617
Deposits from financial institutions 1,186,356,314 1,211,552,503 906,219,476 227,258,349 78,074,678 - - Deposits from customers 4,255,837,303 4,977,071,222 4,444,035,379 281,016,620 155,768,045 96,251,178 - Derivative financial instruments 6,885,680 6,885,681 4,030,595 2,370,236 484,849 - - Other liabilities 315,626,032 272,530,808 140,126,903 - 95,816,466 36,587,439 - Debt securities issued 157,987,877 208,325,732 - - - 208,325,732 - Interest bearing borrowings 586,602,830 768,264,849 71,437 767,986 5,088,240 214,402,709 547,934,477
6,509,296,036 7,444,630,795 5,494,483,790 511,413,194 335,232,278 555,567,059 547,934,477 Gap (asset - liabilities) 173,948,327 (373,648,786) (3,304,807,429) 604,128,855 701,884,094 123,265,559 1,501,880,142 Cumulative liquidity gap (3,304,807,429) (2,700,678,574) (1,998,794,480) (1,875,528,921) (373,648,779)
Off-balance sheetTransaction related bonds and guarantees 477,932,817 531,976,664 86,095,559 49,298,749 234,207,639 85,238,843 77,135,874
Clean line facilities for letters of credit and other commitments
419,584,999 332,827,556 118,727,744 67,565,811 133,275,180 13,258,822 -
897,517,816 864,804,220 204,823,304 116,864,560 367,482,818 98,497,664 77,135,874
152

Access Bank Plc Consolidated and separate financial statements For the year ended 31 December 2020
5.3.1Residual contractual maturities of financial assets and liabilitiesBank Carrying Gross nominal Less than 6 months 12 months 5 years More thanDecember 2020 amount inflow/(outflow) 3 months 5 years
In thousands of Naira
Cash and balances with banks 589,812,439 589,812,438 589,812,438 - - - - Investment under management 30,451,466 30,451,466 272,737 6,113,728 17,398,543 6,666,458 - Non-pledged trading assets
Treasury bills 97,719,848 98,156,574 12,021,016 24,356,124 61,779,434 - - Bonds 12,563,265 24,175,206 - - 288,801 104,604 23,781,802
Derivative financial instruments 244,564,046 244,564,046 89,344,205 17,832,711 109,451,658 27,935,472 - Loans and advances to banks 231,788,276 232,086,899 120,649,810 71,385,947 40,051,141 - - Loans and advances to customers
Auto Loan 4,243,504 5,268,507 1,049,807 720,787 1,184,080 2,313,833 - Credit Card 22,189,872 22,195,220 10,825,209 - - 11,370,011 - Finance Lease 3,605,077 4,284,085 1,377,664 678,297 999,137 1,228,988 - Mortgage Loan 3,031,432 4,568,148 411,738 165,658 449,736 1,924,205 1,616,811 Overdraft 283,473,925 276,191,732 197,345,364 52,161,546 26,684,822 - - Personal Loan 13,607,367 20,421,501 4,534,164 1,615,951 3,101,095 7,877,199 3,293,092 Term Loan 2,116,684,210 2,796,027,590 74,852,704 109,011,956 248,369,286 1,680,664,999 683,128,644 Time Loan 372,040,345 235,106,894 163,441,147 26,019,519 20,786,745 24,844,842 14,640
Pledged assets -Financial instruments at FVOCI
Treasury bills 999,521 1,000,000 1,000,000 - - - - Bonds 2,617,080 6,062,797 - - - - 6,062,797 -Financial instruments at amortised cost Treasury bills 98,097,771 98,321,500 75,379,500 22,942,000 - - - Bonds 41,833,930 69,672,238 - - - 6,228,524 63,443,714 -Financial instruments at FVPL Treasury bills 85,006,603 85,007,157 - 85,007,157 - - - Bonds - - - - - - - Investment securities-Financial assets at FVOCI
Treasury bills 608,866,687 614,430,806 38,169,648 20,920,773 555,340,385 - - Bonds 106,924,656 182,117,703 - - - 9,269,717 172,847,986
Promissory note 80,033,790 94,615,750 - - 3,918,084 90,697,665 - -Financial assets at amortised cost
Treasury bills 194,302,056 195,216,894 60,120,500 135,096,394 - - - Credit linked notes 45,527,717 45,782,539 45,782,539 - - - - Bonds 250,772,348 456,329,524 - - 6,391,444 76,951,025 372,987,056
Promissory note 427,537 427,535 - - 427,536 - - Restricted deposit and other assets 1,471,481,476 1,471,481,478 98,235,305 77,297,389 20,669,518 - 1,275,279,265
7,012,666,244 7,903,776,227 1,584,625,495 651,325,935 1,117,291,445 1,948,077,543 2,602,455,808
Deposits from financial institutions 831,632,332 979,472,473 496,209,453 238,093,709 105,118,746 - 140,050,565 Deposits from customers 4,832,744,498 4,833,662,104 4,212,466,466 603,703,923 16,890,478 601,238 - Derivative financial instruments 20,775,722 20,775,722 15,273,886 2,054,152 1,059,751 2,387,933 - Other liabilities 322,955,917 322,955,917 243,520,501 58,857,861 20,577,556 - - Debt securities issued 169,160,059 208,660,925 - 130,327,432 - 22,471,849 55,861,644 Interest bearing borrowings 755,254,273 1,083,739,867 24,015,633 - 22,780,398 271,669,117 765,274,718
6,932,522,802 7,449,267,008 4,991,485,938 1,033,037,076 166,426,929 297,130,138 961,186,927 Gap (asset - liabilities) 80,143,442 454,509,219 (3,406,860,444) (381,711,141) 950,864,517 1,650,947,405 1,641,268,881 Cumulative liquidity gap (3,406,860,444) (3,788,571,585) (2,837,707,068) (1,186,759,663) 454,509,218 Off balance-sheet
Transaction related bonds and guarantees 335,064,193 335,064,193 33,294,537 24,329,790 59,390,225 149,393,568 68,656,073 Clean line facilities for letters of credit and other commitments
341,751,564 341,751,565 207,424,326 38,297,438 89,023,169 7,006,631 - 676,815,757 676,815,759 240,718,863 62,627,229 148,413,394 156,400,199 68,656,073
153

Access Bank Plc Consolidated and separate financial statements For the year ended 31 December 2020
Bank Carrying Gross nominal Less than 6 months 12 months 5 years More thanDecember 2019 amount inflow/(outflow) 3 months 5 years
In thousands of Naira
Cash and balances with banks 575,906,273 539,508,104 539,508,104 - - - - Investment under management 28,291,959 28,291,959 767,313 9,012,114 14,020,236 4,492,296 - Non-pledged trading assets
Treasury bills 74,749,344 79,813,164 26,047,386 15,439,156 38,326,622 - - Bonds 2,222,417 5,153,396 18,169 - - 7,310 5,127,917
Derivative financial instruments 143,480,073 143,480,073 49,520,643 11,860,583 82,098,847 - - Loans and advances to banks 164,413,001 165,774,989 2,884,137 - 162,890,852 - - Loans and advances to customers
Auto Loan 6,467,952 6,536,533 287,573 907,516 875,689 4,465,755 - Credit Card 17,413,366 17,640,279 5,292,084 4,057,264 3,175,250 5,115,681 - Finance Lease 4,485,635 4,661,966 391,442 833,836 1,396,176 2,040,512 - Mortgage Loan 2,136,440 2,577,131 601,179 179,065 408,067 691,745 697,075 Overdraft 245,768,584 280,704,330 221,191,091 31,384,466 28,128,773 - - Personal Loan 34,168,590 34,817,133 17,220,597 1,853,120 2,623,962 9,227,088 3,892,366 Term Loan 1,816,913,719 1,947,125,422 294,382,430 131,770,114 209,961,037 677,259,540 633,752,301 Time Loan 354,269,381 368,560,297 132,301,506 184,568,369 51,690,422 - -
Pledged assets -Financial instruments at FVOCI
Treasury bills 30,388,532 32,424,722 5,500,000 8,124,722 18,800,000 - - Bonds - - - - - - -
-Financial instruments at amortised cost Treasury bills 452,686,282 453,872,748 129,026,743 242,100,648 82,745,357 - - Bonds 82,599,583 123,975,255 - - - 5,618,298 118,356,957 -Financial instruments at FVPL Treasury bills 39,881,494 41,886,245 - 31,221,245 10,665,000 - - Bonds - - - - - - - Investment securities-Financial assets at FVOCI
Treasury bills 77,897,548 78,427,845 68,640,956 1,870,533 7,916,356 - - Bonds 18,950,446 40,527,773 - - 5,161,606 35,366,167 -
Promissory note 2,041,859 1,055,468 - 20 - 1,055,448 - -Financial assets at amortised cost
Treasury bills 341,786,029 343,353,622 162,770,433 39,873,210 140,709,979 - - Bonds 250,828,832 401,221,564 15,875,438 - 2,254,910 38,605,240 344,485,976
Promissory note 20,260,865 10,844,041 10,357,841 58,664 - 427,536 - Restricted deposit and other assets 968,698,629 968,698,630 131,504,135 26,558,428 - - 810,636,067
5,756,706,836 6,120,932,686 1,814,089,197 741,673,072 863,849,141 784,372,616 1,916,948,659
Deposits from financial institutions 1,079,284,418 1,102,172,881 677,224,322 307,522,023 117,426,536 - - Deposits from customers 3,668,339,811 4,384,094,475 4,174,991,396 188,375,203 20,330,139 397,737 - Derivative financial instruments 6,827,293 6,827,293 3,972,208 2,370,236 484,849 - - Other liabilities 295,184,124 290,798,173 137,525,038 153,273,135 - - - Debt securities issued 157,987,877 208,325,732 - - - 208,325,732 - Interest bearing borrowings 544,064,226 768,264,849 71,437 767,986 5,088,240 214,402,709 547,934,477
5,751,687,750 6,760,483,403 4,993,784,401 652,308,584 143,329,764 423,126,178 547,934,477 Gap (asset - liabilities) 5,019,085 (639,550,717) (3,179,695,204) 89,364,488 720,519,377 361,246,439 1,369,014,182 Cumulative liquidity gap (3,179,695,204) (3,090,330,716) (2,369,811,339) (2,008,564,900) (639,550,718) Off balance-sheet
Transaction related bonds and guarantees 451,514,549 451,514,549 31,273,900 24,799,672 233,066,260 85,238,843 77,135,874 Clean line facilities for letters of credit and other commitments
324,529,363 324,529,364 110,429,551 67,565,811 133,275,180 13,258,822 -
776,043,912 776,043,914 141,703,451 92,365,483 366,341,440 98,497,665 77,135,874
154

Access Bank Plc Consolidated and separate financial statements For the year ended 31 December 2020
5.3.2 Financial instruments below and above 1 year's maturity
GroupWithin 12
months After 12 months TotalWithin 12
months After 12 months TotalIn thousands of Naira
Cash and balances with banks 723,872,820 - 723,872,820 723,064,003 - 723,064,003 Investments under management 23,785,009 6,666,457 30,451,466 23,799,663 4,492,296 28,291,959 Non pledged trading assets
Treasury bills 116,036,126 - 116,036,126 322,930 - 322,930 Bonds 1,696,330 90,219,488 91,915,817 40,021,277 - 40,021,277
Derivative financial instruments 173,942,133 77,170,611 251,112,744 41,649,342 102,051,110 143,700,452 Loans and advances to banks 392,821,307 - 392,821,307 152,825,081 - 152,825,081 Loans and advances to customers
Auto Loan 5,755,745 8,309,097 14,064,843 6,341,170 11,438,338 17,779,508 Credit Card 12,295,511 11,370,011 23,665,522 6,682,170 12,428,820 19,110,990 Finance Lease 2,478,138 1,576,566 4,054,704 1,462,346 3,481,829 4,944,175 Mortgage Loan 37,479,529 89,560,137 127,039,667 42,087,859 99,794,711 141,882,570
Overdraft 300,717,703 - 300,717,703 252,985,681 - 252,985,681 Personal Loan 16,169,042 13,174,085 29,343,128 37,044,083 15,228,844 52,272,927 Term Loan 234,737,019 2,101,667,417 2,336,404,437 284,492,432 1,761,479,941 2,045,972,373 Time Loan 382,817,024 - 382,817,024 376,631,483 - 376,631,483
Pledged assetsTreasury bills 184,103,896 - 184,103,896 522,956,307 - 522,956,307 Bonds - 44,451,010 44,451,010 4,195,563 78,404,020 82,599,583
Investment securities-Financial assets at FVOCI
Treasury bills 748,230,225 - 748,230,225 232,813,374 - 232,813,374 Bonds 3,947,114 215,667,759 219,614,874 - 81,977,676 81,977,676 Promissory note - 80,033,790 80,033,790 18 - 18
-Financial assets at amortised costTreasury bills 237,109,445 - 237,109,445 379,283,381 - 379,283,381 Bonds 5,029,820 272,410,180 277,439,999 16,049,498 250,229,498 266,278,996 Promissory note - 427,536 427,536 - - - Total return notes 45,527,717 - 45,527,717 - - -
Restricted deposit and other assets 154,047,953 1,368,267,121 1,522,315,074 - 1,016,582,843 1,016,582,843 4,031,154,514 4,380,971,268 8,183,570,874 3,750,263,553 3,437,589,929 6,582,297,588
Deposits from financial institutions 958,397,171 - 958,397,171 1,186,356,314 - 1,186,356,314 Deposits from customers 3,283,925,347 2,303,492,866 5,587,418,213 4,254,115,046 1,724,510 4,255,839,556 Derivative financial instruments 12,374,376 8,506,153 20,880,529 6,673,932 153,361 6,827,294 Debt securities issued 122,195,240 46,964,818 169,160,058 1,218,979 156,768,898 157,987,877 Other liabilities 356,638,122 - 356,638,122 - 315,626,032 315,626,032 Interest-bearing borrowings 197,859,821 593,595,417 791,455,237 4,484,994 582,117,836 586,602,830
4,931,390,076 2,952,559,253 7,883,949,330 5,452,849,265 1,056,390,637 6,509,239,903
December 2020 December 2019
155

Access Bank Plc Consolidated and separate financial statements For the year ended 31 December 2020
BankWithin 12
months After 12 months TotalWithin 12
months After 12 months Total
In thousands of Naira
Cash and balances with banks 589,812,439 - 589,812,439 575,906,273 - 575,906,273 Investment under management 23,785,009 6,666,457 30,451,466 23,799,663 4,492,296 28,291,959 Non pledged trading assets
Treasury bills 97,719,848 - 97,719,848 74,749,344 - 74,749,344 Bonds 225,507 12,337,757 12,563,265 17,933 2,204,485 2,222,417
Derivative financial instruments 167,393,435 77,170,611 244,564,046 41,428,962 102,051,110 143,480,073 Loans and advances to banks 231,788,276 - 231,788,276 164,413,001 - 164,413,001 Loans and advances to customers
Auto Loan 845,076 3,398,428 4,243,504 685,393 5,782,560 6,467,952 Credit Card 10,819,861 11,370,011 22,189,872 4,984,546 12,428,820 17,413,366 Finance Lease 2,091,459 1,513,618 3,605,077 1,068,002 3,417,633 4,485,635 Mortgage Loan 277,059 2,754,373 3,031,432 164,020 1,972,420 2,136,440
Overdraft 283,473,925 - 283,473,925 245,768,584 - 245,768,584 Personal Loan 2,321,574 11,285,793 13,607,367 21,112,266 13,056,324 34,168,590 Term Loan 135,862,917 1,980,821,292 2,116,684,210 181,416,038 1,635,497,681 1,816,913,719 Time Loan 372,040,345 - 372,040,345 354,269,381 - 354,269,381
Pledged assetsTreasury bills 184,103,896 - 184,103,896 522,956,307 - 522,956,307 Bonds - 44,451,010 44,451,010 - 82,599,584 82,599,584
Investment securities-Financial assets at FVOCI
Treasury bills 608,866,687 - 608,866,687 77,898,453 - 77,898,453 Bonds 1,912,888 105,011,768 106,924,656 - 18,950,446 18,950,446 Promissory note 16,575,739 88,436,029 105,011,768 807,602 - 807,602
-Financial assets at amortised costTreasury bills 194,302,056 - 194,302,056 341,786,029 - 341,786,029 Bonds 4,561,362 246,638,524 251,199,886 23,881,032 237,791,842 261,672,874 Promissory note - 427,537 427,537 58,664 - 58,664 Total return notes 45,527,717 - 45,527,717
Restricted deposit and other assets 138,891,681 1,332,589,796 1,471,481,477 - 968,698,629 968,698,629 3,341,753,658 3,924,873,008 7,038,071,760 3,262,727,383 3,088,943,832 5,746,115,323
Deposits from financial institutions 831,632,332 - 831,632,332 1,079,284,418 - 1,079,284,418 Deposits from customers 4,831,524,005 1,220,488 4,832,744,493 3,652,933,209 1,484,685 3,654,417,894 Derivative financial instruments 12,269,570 8,506,153 20,775,723 6,673,932 153,361 6,827,294 Debt securities issued 122,195,240 46,964,818 169,160,058 - 157,987,877 157,987,877 Other liabilities 322,955,918 - 322,955,918 290,798,174 - 290,798,174 Interest-bearing borrowings 2,452,481 538,201,289 540,653,770 2,452,481 538,201,289 540,653,770
6,123,029,548 594,892,747 6,717,922,296 5,032,142,216 697,827,212 5,729,969,429
December 2020 December 2019
156
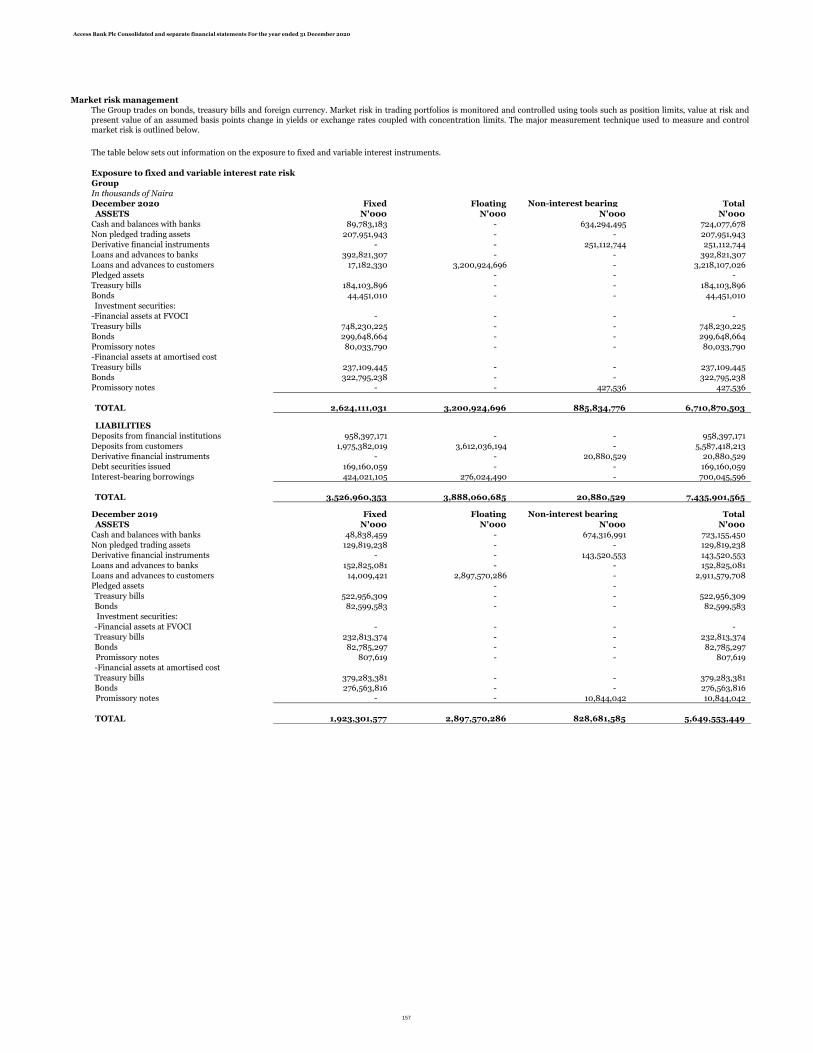
Access Bank Plc Consolidated and separate financial statements For the year ended 31 December 2020
Market risk management
The table below sets out information on the exposure to fixed and variable interest instruments.
Exposure to fixed and variable interest rate risk
Group
In thousands of Naira
December 2020 Fixed Floating Non-interest bearing Total
ASSETS N'000 N'000 N'000 N'000
Cash and balances with banks 89,783,183 - 634,294,495 724,077,678
Non pledged trading assets 207,951,943 - - 207,951,943
Derivative financial instruments - - 251,112,744 251,112,744
Loans and advances to banks 392,821,307 - - 392,821,307
Loans and advances to customers 17,182,330 3,200,924,696 - 3,218,107,026
Pledged assets - - -
Treasury bills 184,103,896 - - 184,103,896
Bonds 44,451,010 - - 44,451,010
Investment securities:
-Financial assets at FVOCI - - - -
Treasury bills 748,230,225 - - 748,230,225
Bonds 299,648,664 - - 299,648,664
Promissory notes 80,033,790 - - 80,033,790
-Financial assets at amortised cost
Treasury bills 237,109,445 - - 237,109,445
Bonds 322,795,238 - - 322,795,238
Promissory notes - - 427,536 427,536
TOTAL 2,624,111,031 3,200,924,696 885,834,776 6,710,870,503
LIABILITIES
Deposits from financial institutions 958,397,171 - - 958,397,171
Deposits from customers 1,975,382,019 3,612,036,194 - 5,587,418,213
Derivative financial instruments - - 20,880,529 20,880,529
Debt securities issued 169,160,059 - - 169,160,059
Interest-bearing borrowings 424,021,105 276,024,490 - 700,045,596
TOTAL 3,526,960,353 3,888,060,685 20,880,529 7,435,901,565
December 2019 Fixed Floating Non-interest bearing Total
ASSETS N'000 N'000 N'000 N'000
Cash and balances with banks 48,838,459 - 674,316,991 723,155,450
Non pledged trading assets 129,819,238 - - 129,819,238
Derivative financial instruments - - 143,520,553 143,520,553
Loans and advances to banks 152,825,081 - - 152,825,081
Loans and advances to customers 14,009,421 2,897,570,286 - 2,911,579,708
Pledged assets - -
Treasury bills 522,956,309 - - 522,956,309
Bonds 82,599,583 - - 82,599,583
Investment securities:
-Financial assets at FVOCI - - - -
Treasury bills 232,813,374 - - 232,813,374
Bonds 82,785,297 - - 82,785,297
Promissory notes 807,619 - - 807,619
-Financial assets at amortised cost
Treasury bills 379,283,381 - - 379,283,381
Bonds 276,563,816 - - 276,563,816
Promissory notes - - 10,844,042 10,844,042
TOTAL 1,923,301,577 2,897,570,286 828,681,585 5,649,553,449
The Group trades on bonds, treasury bills and foreign currency. Market risk in trading portfolios is monitored and controlled using tools such as position limits, value at risk andpresent value of an assumed basis points change in yields or exchange rates coupled with concentration limits. The major measurement technique used to measure and controlmarket risk is outlined below.
157

Access Bank Plc Consolidated and separate financial statements For the year ended 31 December 2020
LIABILITIES
Deposits from financial institutions 1,186,356,314 - - 1,186,356,314
Deposits from customers 1,784,924,350 2,470,912,954 - 4,255,837,305
Derivative financial instruments - - 6,885,680 6,885,680
Debt securities issued 157,987,877 - - 157,987,877
Interest-bearing borrowings 308,692,956 277,909,874 - 586,602,830
TOTAL 3,437,961,497 2,748,822,829 6,885,680 6,193,670,004
Bank
December 2020 Fixed Floating Non-interest bearing Total
ASSETS N'000 N'000 N'000 N'000
Cash and balances with banks 40,095,277 - 549,751,317 589,846,594
Non pledged trading assets 110,283,111 - - 110,283,111
Derivative financial instruments - - 244,564,046 244,564,046
Loans and advances to banks 231,788,276 - - 231,788,276
Loans and advances to customers 15,031,149 2,803,844,582 - 2,818,875,731
Pledged assets
Treasury bills 184,103,895 - - 184,103,895
Bonds 44,451,010 - - 44,451,010
Investment securities:
-Financial assets at FVOCI - - - -
Treasury bills 608,866,687 - - 608,866,687
Bonds 186,958,446 - - 186,958,446
-Financial assets at amortised cost
Treasury bills 194,302,056 - - 194,302,056
Bonds 296,177,417 - - 296,177,417
TOTAL 1,912,057,326 2,803,844,582 794,315,363 5,510,217,271
LIABILITIES
Deposits from financial institutions 831,632,332 - - 831,632,332
Deposits from customers 1,586,352,293 3,246,392,200 - 4,832,744,493
Derivative financial instruments - - 20,775,722 20,775,722
Debt securities issued 169,160,059 - - 169,160,059
Interest-bearing borrowings 284,491,261 256,162,509 3,410,456 544,064,226
TOTAL 2,871,635,945 3,502,554,708 24,186,178 6,398,376,831
December 2019 Fixed Floating Non-interest bearing Total
ASSETS N'000 N'000 N'000 N'000
Cash and balances with banks 32,822,516 - 543,085,033 575,907,549
Non pledged trading assets 76,971,760 - - 76,971,760
Derivative financial instruments - - 143,480,073 143,480,073
Loans and advances to banks 164,413,001 - - 164,413,001
Loans and advances to customers 13,346,263 2,468,277,408 - 2,481,623,671
Pledged assets
Treasury bills 522,956,308 - - 522,956,308
Bonds 82,599,583 - - 82,599,583
Investment securities: -
-Financial assets at FVOCI - - - -
Treasury bills 77,897,548 - - 77,897,548
Bonds 19,758,066 - - 19,758,066
-Financial assets at amortised cost
Treasury bills 341,786,029 - - 341,786,029
Bonds 261,138,688 - - 261,138,688
TOTAL 1,593,689,762 2,468,277,408 686,565,106 4,748,532,276
LIABILITIES
Deposits from financial institutions 1,079,284,418 - - 1,079,284,418
Deposits from customers 1,463,431,594 2,204,908,217 - 3,668,339,811
Derivative financial instruments - - 6,827,293 6,827,293 Debt securities issued 157,987,877 - - 157,987,877 Interest-bearing borrowings 284,491,261 256,162,509 3,410,456 544,064,226
TOTAL 2,985,195,150 2,461,070,726 10,237,748 5,456,503,624
Derivative financial instruments include elements of interest rate differential between the applicable underlying currencies. Further details on the fair value of derivatives havebeen discussed in Note 21 of the financial statement.
158

Access Bank Plc Consolidated and separate financial statements For the year ended 31 December 2020
Interest rate risk
Cash flow and fair value interest rate risk
Group
Interest sensitivity analysis- December 2020
Impact on net interest income of +/-1oo basis points changes in rates over a one year (N'000)
Time Band100 basis points decline in rates
100 basis points increase in rates
Less than 3 months 22,491,997 (22,491,997) 6 months 1,332,975 (1,332,975)
12 months (2,662,588) 2,662,588
21,162,385 (21,162,385)
Interest sensitivity analysis- December 2019
Impact on net interest income of +/-1oo basis points changes in rates over a one year (N'000)
Time Band100 basis points decline in rates
100 basis points increase in rates
Less than 3 months 25,416,897 (25,416,897) 6 months 1,502,426 (1,502,426)
12 months (1,366,377) 1,366,377
25,552,946 (25,552,946)
Bank
Interest sensitivity analysis - December 2020
Impact on net interest income of +/-1oo basis points changes in rates over a one year (N'000)
Time Band
100 basis points decline in rates
100 basis points increase in rates
Less than 3 months 19,471,323 (19,471,323) 6 months 1,330,360 (1,330,360)
12 months (1,772,323) 1,772,323
19,029,360 (19,029,360)
Interest sensitivity analysis - December 2019
Impact on net interest income of +/-1oo basis points changes in rates over a one year (N'000)
Time Band100 basis points decline in rates
100 basis points increase in rates
Less than 3 months 22,197,970 (22,197,970) 6 months 1,596,005 (1,596,005)
12 months (1,122,211) 1,122,211
22,671,765 (22,671,765)
Cash flow interest rate risk
Cash flow interest rate risk
Cash flow interest rate risk
Cash flow interest rate risk
(i) Retained earnings arising from increase or decrease in net interest income and the fair value changes reported in profit or loss.
(ii) Fair value reserves arising from increases or decreases in fair value of available-for-sale financial instruments reported directly in other comprehensive income.
The group’s interest rate risk arises from risk assets, long-term borrowings, deposits from banks and customers. Borrowings issued at variable rates expose the group to cash flowinterest rate risk.
The management of interest rate risk against interest rate gap limits is supplemented with monitoring the sensitivity of the Group’s financial assets and liabilities to variousscenarios.
Interest rate movement have both cash flow and fair value effect depending on whether interest rate is fixed or floating. The impact resulting from adverse or favourable movementflows from either retained earnings or OCI and ultimately ends in equity in the following manner:
Cash flow interest rate risk is the risk that the future cash flows of a financial instrument will fluctuate because of changes in market interest rates. Fair value interest rate risk is therisk that the value of a financial instrument will fluctuate because of changes in market interest rates. The Group takes on exposure to the effects of fluctuations in the prevailinglevels of market interest rates on both its fair value and cash flow risks. Interest margins may increase as a result of such changes but may reduce losses in the event thatunexpected movements arise. The Board sets limits on the level of mismatch of interest rate repricing (note 5.2.1) that may be undertaken, which is monitored daily by GroupTreasury.
159

Access Bank Plc Consolidated and separate financial statements For the year ended 31 December 2020
Price sensitivity analysis on bonds and treasury bills
Group
Carrying Value Impact of 50 basis points
increase in yields Impact of 100 basis points
increase in yields
Impact on Statement of Comprehensive income
Investment under management T-Bills
Fair value through profit or loss: Bonds 91,883,585 (1,275,093) (2,513,415)
Fair value through profit or loss: T-bills 116,036,126 (340,287) (680,574)
Fair value through profit or loss: Bonds - Pledged - - -
Fair value through profit or loss: T-bills - Pledged 85,006,604 (202,401) (404,802) 292,926,315 (1,817,780) (3,598,791)
Impact on Other Comprehensive Income
-Financial assets at FVOCI-Bonds 149,329,224 (2,047,060) (3,990,249)
-Financial assets at FVOCI-Tbills 748,222,549 (2,792,500) (5,585,000)
Financial assets at FVOCI - Bonds - Pledged 2,617,080 (97,230) (189,434)
Financial assets at FVOCI - T-Bills - Pledged 999,521 (548) (1,096)
901,168,375 (4,937,338) (9,765,779)
TOTAL 1,194,094,690 (6,755,119) (13,364,569)
Carrying Value Impact of 50 basis points
increase in yields Impact of 100 basis points
increase in yields
Impact on Statement of Comprehensive
Investment under management T-Bills
Fair value through profit or loss: Bonds 40,021,277 (231,021) (458,263)
Fair value through profit or loss: T-bills 89,797,961 (207,869) (415,738)
Fair value through profit or loss: Bonds - Pledged - - -
Fair value through profit or loss: T-bills - Pledged 39,881,494 (79,008) (158,017) 169,700,732 (517,898) (1,032,018)
Impact on Other Comprehensive Income
-Financial assets at FVOCI-Bonds 2,222,417 (60,034) (117,469)
-Financial assets at FVOCI-Tbills 74,749,344 (199,479) (398,958)
Financial assets at FVOCI - Bonds - Pledged - - -
Financial assets at FVOCI - T-Bills - Pledged 39,881,494 (79,008) (158,017)
116,853,256 (338,522) (674,444)
TOTAL 286,553,988 (856,420) (1,706,462)
Carrying Value Impact of 50 basis points
increase in yields Impact of 100 basis points
increase in yields
Impact on Statement of Comprehensive Income
Fair value through profit or loss: Bonds 12,488,649 (376,059) (734,637)
Fair value through profit or loss: T-bills 97,719,848 (307,073) (614,145)
Fair value through profit or loss: Bonds - Pledged - - -
Fair value through profit or loss: T-bills - Pledged 85,006,604 (202,401) (404,802) 195,215,101 (885,532) (1,753,584)
Impact on Other Comprehensive Income
-Financial assets at FVOCI-Bonds 44,296,019 (1,706,329) (3,312,000)
-Financial assets at FVOCI-Tbills 608,866,687 (2,770,975) (5,541,949)
Financial assets at FVOCI - Bonds - Pledged 2,617,080 (97,230) (189,434)
Financial assets at FVOCI - T-Bills - Pledged 999,521 (548) (1,096)
December 2020
The table above sets out the impact on net interest income of a 100 basis points parallel fall or rise in all yields. A parallel increase in yields by 100 basis points would lead to anincrease in net interest income while a parallel fall in yields by 100 basis points would lead to a decline in net interest income. The interest rate sensitivities are based on simplifiedscenarios and assumptions, including that all positions will be retained and rolled over upon maturity. The figures represent the effect of movements in net interest income basedon the 100 basis point shift in interest rate and subject to the current interest rate exposures. However, the effect has not taken into account the possible risk managementmeasures undertaken by the Bank to mitigate interest rate risk. In practice, the Assets and Liability Committee, ALCO seeks proactively to change the interest rate risk profile tominimize losses and optimise net revenues. The projections also assume that interest rates on various maturities will move within similar ranges, and therefore do not reflect anypotential effect on net interest income in the event that some interest rates may change and others remain unchanged.
The table below shows the impact of likely movement in yields on the value of bonds and treasury bills. This relates to the positions held for trade and fair value through othercomprehensive income. Since an increase in yields would lead to decline in market values of bonds and treasury bills, the analysis was carried out to show the likely impact of 50and 100 basis points increase in market yields. The impact of held for trading investments is on the income statement while the impact of available for sale instruments is on thestatement of other comprehensive income.
December 2020
December 2019
Bank
160

Access Bank Plc Consolidated and separate financial statements For the year ended 31 December 2020
656,779,307 (4,575,083) (9,044,480)
TOTAL 851,994,408 (5,460,615) (10,798,065)
161

Access Bank Plc Consolidated and separate financial statements For the year ended 31 December 2020
Carrying Value Impact of 50 basis points
increase in yields Impact of 100 basis points
increase in yields
Impact on Statement of Comprehensive Income
Fair value through profit or loss: Bonds 2,222,417 (60,034) (117,469)
Fair value through profit or loss: T-bills 74,749,344 (199,479) (398,958)
Fair value through profit or loss: Bonds - Pledged - - -
Fair value through profit or loss: T-bills - Pledged 39,881,494 (79,008) (158,017) 116,853,255 (338,521) (674,444)
Impact on Other Comprehensive Income
-Financial assets at FVOCI-Bonds 4,823,398 (165,587) (322,441)
-Financial assets at FVOCI-Tbills 77,898,247 (43,018) (86,035)
Financial assets at FVOCI - Bonds - Pledged - - -
Financial assets at FVOCI - T-Bills - Pledged 30,388,532 (78,701) (157,402)
113,110,177 (287,306) (565,878)
TOTAL 229,963,432 (625,827) (1,240,322)
Foreign currency sensitivity analysis
Group
Impact on statement of comprehensive income
In thousands of naira December 2020
Naira weakens by 5% 7,655,043
Impact on statement of comprehensive income
In thousands of naira December 2019
Naira weakens by 5% 16,335,612
Bank
Impact on statement of comprehensive income
In thousands of naira December 2020
Naira weakens by 5% 4,342,160
Impact on statement of comprehensive income
December 2019
Naira weakens by 5% 2,566,064
December 2020
Market Risk for Hedging instruments
Total exposure to foreign exchange risk N'000
Derivative assets (fair value hedge) 232,534,048
Interest bearing loans and borrowings (333,353,150)
Deposits from other financial institutions
(823,296,615)
December 2019
The Group's principal foreign currency exposure is to US Dollars, as it constitutes a significant portion of the Group's foreign currency exposure as at 31 December 2020. The tablebelow illustrates the hypothetical sensitivity of the Group and Bank's reported profit to a 5% increase in the US Dollar/Naira exchange rates at the year end, assuming all othervariables remain unchanged. The sensitivity rate of 5% increase represents the directors' assessment of a reasonable possible change based on historic volatility.
The NGN/USD exchange rate applied in the conversion of balances as at year end is N400.33/USD1 (2019: N364.70/USD1). The strengthening or weakening of Naira may notproduce symmetrical results depending on the proportion and nature of balance sheet and the impact of derivatives.
The analysis assumes that exchange rate fluctuations on currency derivatives that form part of an effective cash flow hedge affect the fair value reserve in equity and the fair valueof the hedging derivatives. For foreign exchange derivatives which are not designated hedges, movements in exchange rates impact the income statement.
162

Access Bank Plc Consolidated and separate financial statements For the year ended 31 December 2020
Capital management
IFRS 9 Regulatory Transition Arrangement
Year Provisions to be written back
Year 0 (January 1, 2018) 4/5 of Adjusted Day One Impact
Year 1 ( December 31, 2018) 3/5 of Adjusted Day One Impact
Year 2 (December 31, 2019) 2/5 of Adjusted Day One Impact
Year 3 (December 31, 2020) 1/5 of Adjusted Day One Impact
Year 4 (December 31, 2021) NIL
Group Group Bank Bank
December 2020 December 2019 December 2020 December 2019
In thousands of Naira
Tier 1 capital with adjusted ECL impact
Ordinary share capital 17,772,613 17,772,613 17,772,613 17,772,613
Share premium 234,038,850 234,038,850 234,038,850 234,038,850
Retained earnings 252,396,876 225,118,811 206,896,034 192,378,618
Add back IFRS impact(adjusted day one impact) 39,626,943 79,253,886 39,626,943 79,253,886
Other reserves 239,494,174 124,733,788 195,188,164 98,751,022
Non-controlling interests 7,338,726 8,528,833 - -
790,668,183 689,446,782 693,522,605 622,194,988
Add/(Less):
Fair value reserve for available-for-sale (60,106,564) (964,243) (59,574,139) (835,472)
Foreign currency translation reserves (18,132,330) (11,780,013) - -
Other reserves (876,762) (1,881,768) (876,761) (1,881,767)
Total Tier 1 711,552,525 674,820,757 633,071,703 619,477,748
Add/(Less):
Deferred tax assets (4,240,448) (8,807,563) - -
Regulatory risk reserve (46,425,978) (18,091,941) (36,180,585) (9,483,000)
Intangible assets (69,189,841) (65,932,754) (67,496,078) (71,003,729)
Adjusted Tier 1 591,696,258 581,988,499 529,395,040 538,991,020
50% Investments in subsidiaries - - (82,125,766) (65,729,355)
Eligible Tier 1 591,696,258 581,988,499 447,269,274 473,261,665
Tier 2 capital
Debt securities issued 237,633,454 128,469,000 237,633,454 128,469,000
Fair value reserve for available-for-sale
securities
Foreign currency translation reserves 18,132,330 11,780,013 - -
Other reserves 876,762 1,881,768 876,761 1,881,767
Total Tier 2 316,749,110 143,095,024 298,084,355 131,186,239
The Central Bank of Nigeria, in its circular on transitional arrangements on treatment of IFRS 9 expected credit loss for regulatory purposes by banks inNigeria dated 18 October 2018, has recommended transitional arrangements to cushion the impact of IFRS 9 implementation on tier 1 regulatory capital.The Bank advised that the balance in regulatory risk reserve should be applied to retained earnings to reduce the additional ECL provisions on openingretained earnings. Where the additional ECL provision is higher than the regulatory risk reserve transfer, the excess shall be amortised in line with thetransitional arrangements. The regulatory arrangement for amortization of the impact is as detailed in the table below:
The Bank’s objectives when managing capital, which is a broader concept than the ‘equity’ on the face of the statement of financial position, are:i) To comply with the capital requirements set by the Central Bank; ii) To safeguard the Bank’s ability to continue as a going concern so that it can continue to provide returns for shareholders and benefits for otherstakeholders; andiii) To maintain a strong capital base to support the development of its business.
The capital adequacy ratio is the quotient of the capital base of the Bank and the Bank's risk weighted asset base. In accordance with Central Bank of Nigeriaregulations, a minimum ratio of 16% (15% + additional 1%) is to be maintained for deposit money banks designated as significant financial institutions.Following the CBN guideline on regulatory capital computation, the Regulatory Risk Reserve has been excluded from the capital computation. Standardisedapproach has been adopted in computing the risk weighted assets for Credit, Operational, and Market Risk. The following table provides an overview of thedevelopment of the capital ratios and risk-weighted assets (RWA):
The regulatory capital requirements are strictly observed when managing capital. The Bank’s regulatory capital is managed by the Bank's Risk Managementand Financial Control. Regulatory capital comprises two tiers:- Tier 1 capital: This includes ordinary share capital, share premium, retained earnings and other reserves excluding regulatory reserves. Intangible assets,
deferred tax assets and investment in subsidiaries were also deducted from Tier I capital for capital adequacy purposes; and - Tier 2 capital: This includes fair value reserves, foreign currency translation reserves with adjustments for investments in subsidiaries.
60,106,564 964,243 59,574,139 835,472
Therefore, the bank has computed Capital Adequacy Ratio based on the full impact of IFRS 9 and in line with regulatory provision described above
163
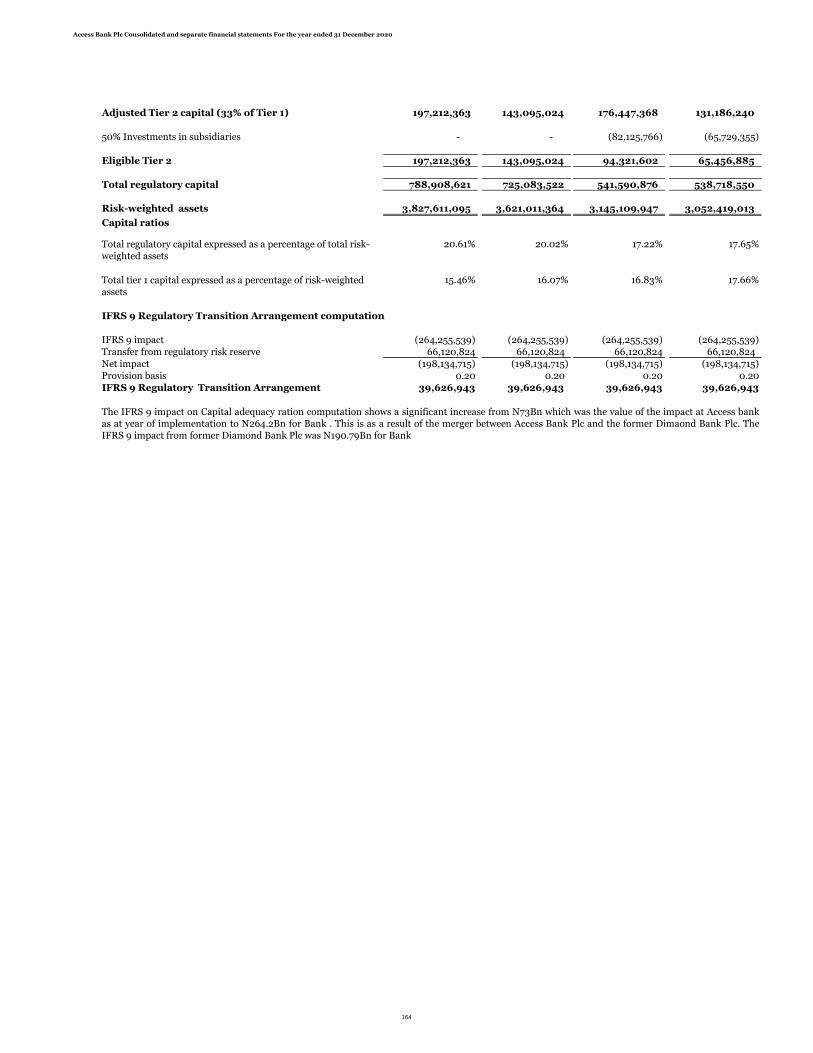
Access Bank Plc Consolidated and separate financial statements For the year ended 31 December 2020
Adjusted Tier 2 capital (33% of Tier 1) 197,212,363 143,095,024 176,447,368 131,186,240
50% Investments in subsidiaries - - (82,125,766) (65,729,355)
Eligible Tier 2 197,212,363 143,095,024 94,321,602 65,456,885
Total regulatory capital 788,908,621 725,083,522 541,590,876 538,718,550
Risk-weighted assets 3,827,611,095 3,621,011,364 3,145,109,947 3,052,419,013
Capital ratios
20.61% 20.02% 17.22% 17.65%
15.46% 16.07% 16.83% 17.66%
IFRS 9 Regulatory Transition Arrangement computation
IFRS 9 impact (264,255,539) (264,255,539) (264,255,539) (264,255,539)
Transfer from regulatory risk reserve 66,120,824 66,120,824 66,120,824 66,120,824
Net impact (198,134,715) (198,134,715) (198,134,715) (198,134,715)
Provision basis 0.20 0.20 0.20 0.20
IFRS 9 Regulatory Transition Arrangement 39,626,943 39,626,943 39,626,943 39,626,943
The IFRS 9 impact on Capital adequacy ration computation shows a significant increase from N73Bn which was the value of the impact at Access bankas at year of implementation to N264.2Bn for Bank . This is as a result of the merger between Access Bank Plc and the former Dimaond Bank Plc. TheIFRS 9 impact from former Diamond Bank Plc was N190.79Bn for Bank
Total regulatory capital expressed as a percentage of total risk-weighted assets
Total tier 1 capital expressed as a percentage of risk-weighted assets
164
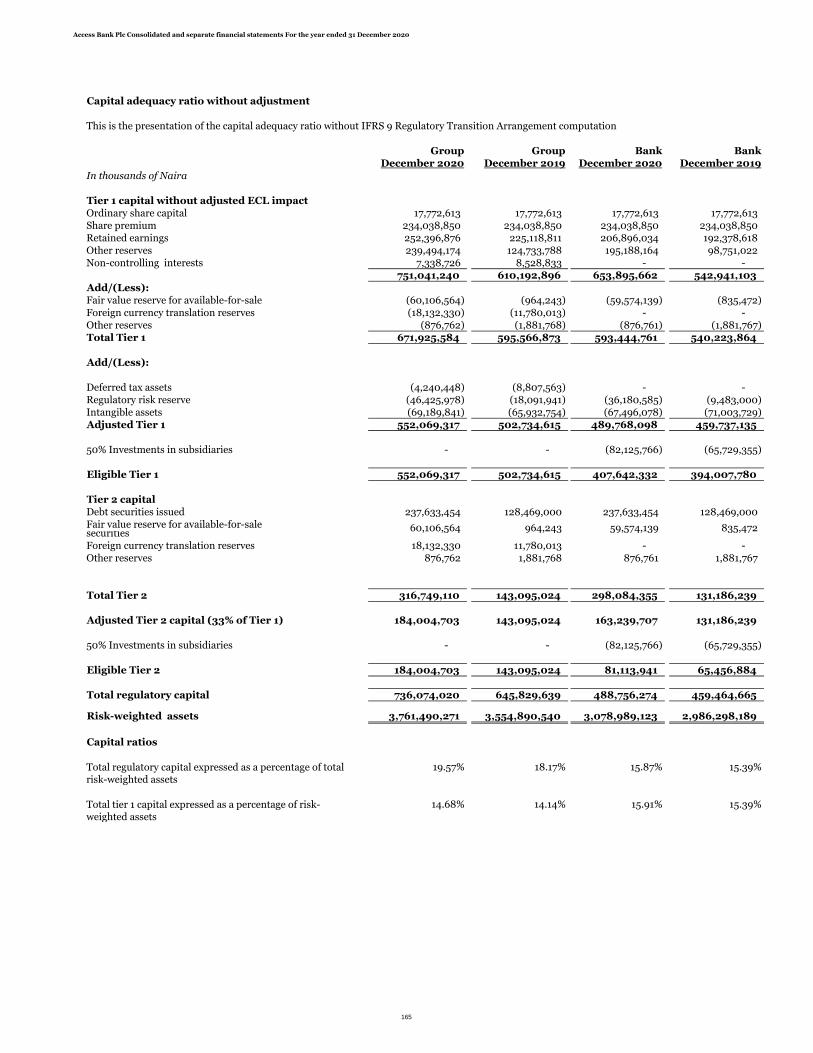
Access Bank Plc Consolidated and separate financial statements For the year ended 31 December 2020
Capital adequacy ratio without adjustment
This is the presentation of the capital adequacy ratio without IFRS 9 Regulatory Transition Arrangement computation
Group Group Bank Bank
December 2020 December 2019 December 2020 December 2019
In thousands of Naira
Tier 1 capital without adjusted ECL impact
Ordinary share capital 17,772,613 17,772,613 17,772,613 17,772,613
Share premium 234,038,850 234,038,850 234,038,850 234,038,850
Retained earnings 252,396,876 225,118,811 206,896,034 192,378,618
Other reserves 239,494,174 124,733,788 195,188,164 98,751,022
Non-controlling interests 7,338,726 8,528,833 - -
751,041,240 610,192,896 653,895,662 542,941,103
Add/(Less):
Fair value reserve for available-for-sale (60,106,564) (964,243) (59,574,139) (835,472)
Foreign currency translation reserves (18,132,330) (11,780,013) - -
Other reserves (876,762) (1,881,768) (876,761) (1,881,767)
Total Tier 1 671,925,584 595,566,873 593,444,761 540,223,864
Add/(Less):
Deferred tax assets (4,240,448) (8,807,563) - -
Regulatory risk reserve (46,425,978) (18,091,941) (36,180,585) (9,483,000)
Intangible assets (69,189,841) (65,932,754) (67,496,078) (71,003,729)
Adjusted Tier 1 552,069,317 502,734,615 489,768,098 459,737,135
50% Investments in subsidiaries - - (82,125,766) (65,729,355)
Eligible Tier 1 552,069,317 502,734,615 407,642,332 394,007,780
Tier 2 capital
Debt securities issued 237,633,454 128,469,000 237,633,454 128,469,000
Fair value reserve for available-for-salesecurities
Foreign currency translation reserves 18,132,330 11,780,013 - -
Other reserves 876,762 1,881,768 876,761 1,881,767
Total Tier 2 316,749,110 143,095,024 298,084,355 131,186,239
Adjusted Tier 2 capital (33% of Tier 1) 184,004,703 143,095,024 163,239,707 131,186,239
50% Investments in subsidiaries - - (82,125,766) (65,729,355)
Eligible Tier 2 184,004,703 143,095,024 81,113,941 65,456,884
Total regulatory capital 736,074,020 645,829,639 488,756,274 459,464,665
Risk-weighted assets 3,761,490,271 3,554,890,540 3,078,989,123 2,986,298,189
Capital ratios
19.57% 18.17% 15.87% 15.39%
14.68% 14.14% 15.91% 15.39%Total tier 1 capital expressed as a percentage of risk-weighted assets
Total regulatory capital expressed as a percentage of total risk-weighted assets
60,106,564 964,243 59,574,139 835,472
165
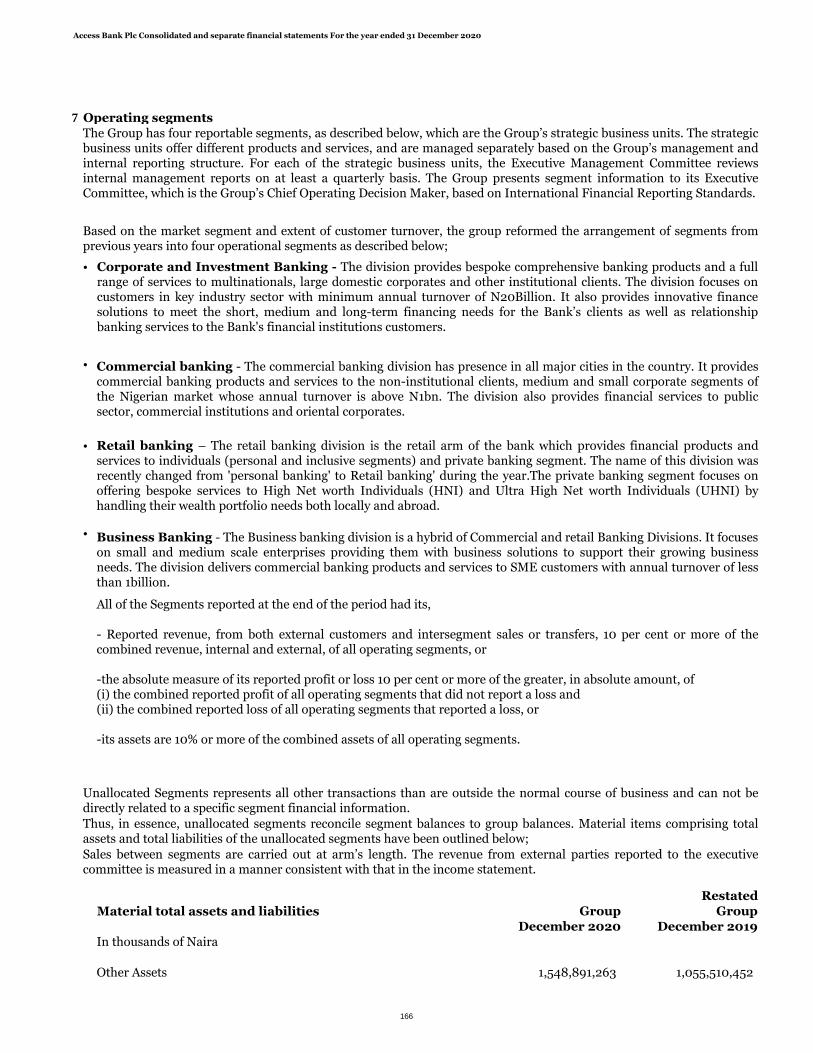
Access Bank Plc Consolidated and separate financial statements For the year ended 31 December 2020
7 Operating segments
•
•
•
•
Restated
Material total assets and liabilities Group GroupDecember 2020 December 2019
In thousands of Naira
Other Assets 1,548,891,263 1,055,510,452
Sales between segments are carried out at arm’s length. The revenue from external parties reported to the executivecommittee is measured in a manner consistent with that in the income statement.
Unallocated Segments represents all other transactions than are outside the normal course of business and can not bedirectly related to a specific segment financial information.
Thus, in essence, unallocated segments reconcile segment balances to group balances. Material items comprising totalassets and total liabilities of the unallocated segments have been outlined below;
All of the Segments reported at the end of the period had its,
- Reported revenue, from both external customers and intersegment sales or transfers, 10 per cent or more of thecombined revenue, internal and external, of all operating segments, or
-the absolute measure of its reported profit or loss 10 per cent or more of the greater, in absolute amount, of (i) the combined reported profit of all operating segments that did not report a loss and (ii) the combined reported loss of all operating segments that reported a loss, or
-its assets are 10% or more of the combined assets of all operating segments.
Business Banking - The Business banking division is a hybrid of Commercial and retail Banking Divisions. It focuses on small and medium scale enterprises providing them with business solutions to support their growing businessneeds. The division delivers commercial banking products and services to SME customers with annual turnover of lessthan 1billion.
The Group has four reportable segments, as described below, which are the Group’s strategic business units. The strategicbusiness units offer different products and services, and are managed separately based on the Group’s management andinternal reporting structure. For each of the strategic business units, the Executive Management Committee reviewsinternal management reports on at least a quarterly basis. The Group presents segment information to its ExecutiveCommittee, which is the Group’s Chief Operating Decision Maker, based on International Financial Reporting Standards.
Based on the market segment and extent of customer turnover, the group reformed the arrangement of segments fromprevious years into four operational segments as described below;
Corporate and Investment Banking - The division provides bespoke comprehensive banking products and a fullrange of services to multinationals, large domestic corporates and other institutional clients. The division focuses oncustomers in key industry sector with minimum annual turnover of N20Billion. It also provides innovative financesolutions to meet the short, medium and long-term financing needs for the Bank’s clients as well as relationshipbanking services to the Bank's financial institutions customers.
Commercial banking - The commercial banking division has presence in all major cities in the country. It providescommercial banking products and services to the non-institutional clients, medium and small corporate segments ofthe Nigerian market whose annual turnover is above N1bn. The division also provides financial services to publicsector, commercial institutions and oriental corporates.
Retail banking – The retail banking division is the retail arm of the bank which provides financial products andservices to individuals (personal and inclusive segments) and private banking segment. The name of this division wasrecently changed from 'personal banking' to Retail banking' during the year.The private banking segment focuses onoffering bespoke services to High Net worth Individuals (HNI) and Ultra High Net worth Individuals (UHNI) byhandling their wealth portfolio needs both locally and abroad.
166
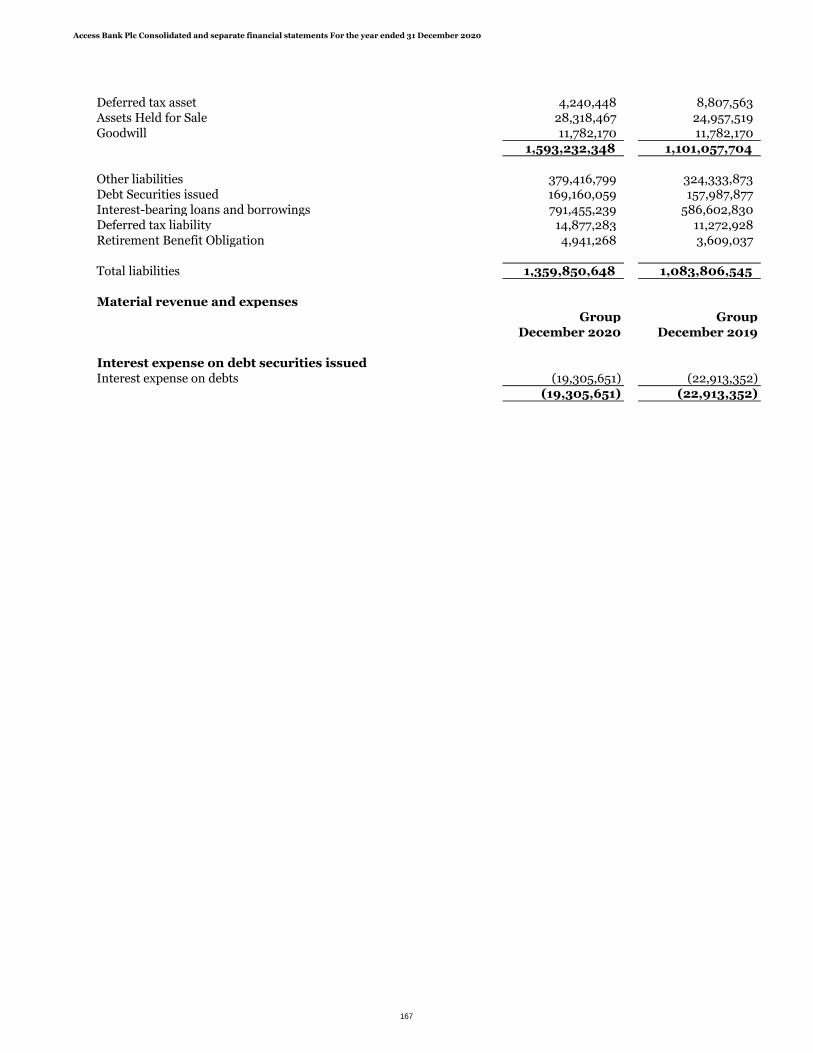
Access Bank Plc Consolidated and separate financial statements For the year ended 31 December 2020
Deferred tax asset 4,240,448 8,807,563 Assets Held for Sale 28,318,467 24,957,519
Goodwill 11,782,170 11,782,170 1,593,232,348 1,101,057,704
Other liabilities 379,416,799 324,333,873 Debt Securities issued 169,160,059 157,987,877 Interest-bearing loans and borrowings 791,455,239 586,602,830 Deferred tax liability 14,877,283 11,272,928 Retirement Benefit Obligation 4,941,268 3,609,037
Total liabilities 1,359,850,648 1,083,806,545
Material revenue and expensesGroup Group
December 2020 December 2019
Interest expense on debt securities issuedInterest expense on debts (19,305,651) (22,913,352)
(19,305,651) (22,913,352)
167
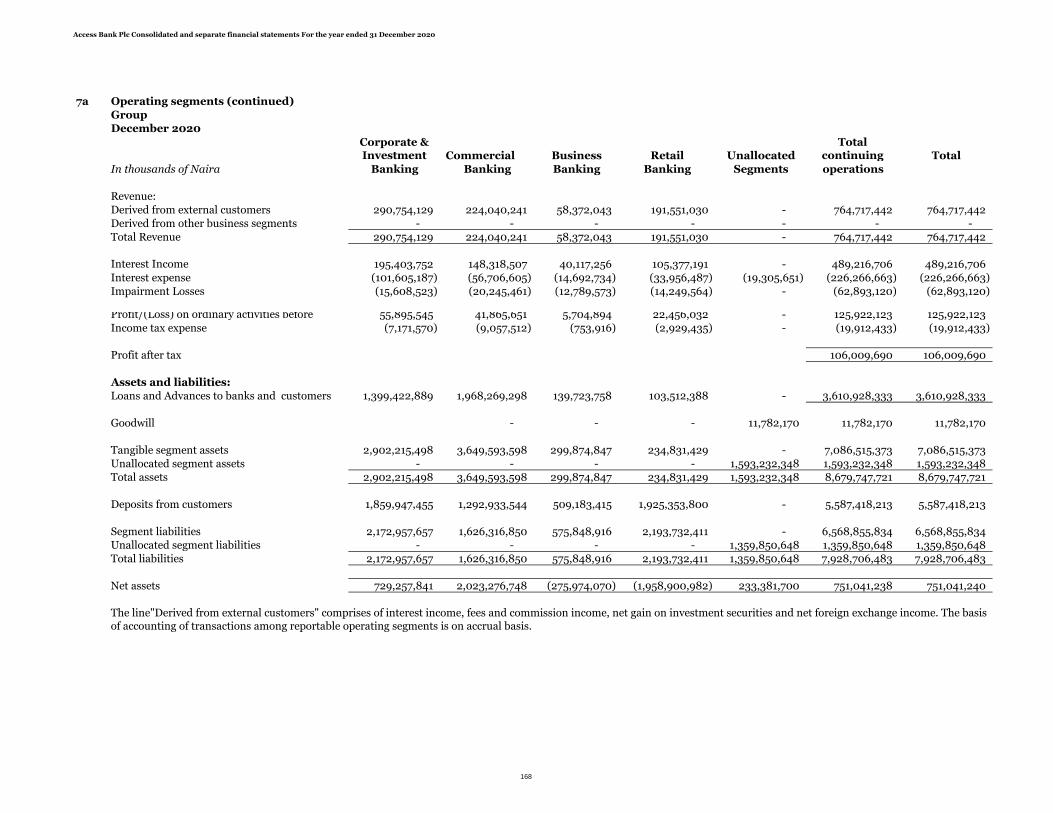
Access Bank Plc Consolidated and separate financial statements For the year ended 31 December 2020
7a Operating segments (continued)
Group
December 2020
Corporate & Investment Commercial Business Retail Unallocated
Total continuing Total
In thousands of Naira Banking Banking Banking Banking Segments operations
Revenue:
Derived from external customers 290,754,129 224,040,241 58,372,043 191,551,030 - 764,717,442 764,717,442
Derived from other business segments - - - - - - -
Total Revenue 290,754,129 224,040,241 58,372,043 191,551,030 - 764,717,442 764,717,442
Interest Income 195,403,752 148,318,507 40,117,256 105,377,191 - 489,216,706 489,216,706
Interest expense (101,605,187) (56,706,605) (14,692,734) (33,956,487) (19,305,651) (226,266,663) (226,266,663)
Impairment Losses (15,608,523) (20,245,461) (12,789,573) (14,249,564) - (62,893,120) (62,893,120)
Profit/(Loss) on ordinary activities before 55,895,545 41,865,651 5,704,894 22,456,032 - 125,922,123 125,922,123
Income tax expense (7,171,570) (9,057,512) (753,916) (2,929,435) - (19,912,433) (19,912,433)
Profit after tax 106,009,690 106,009,690
Assets and liabilities:
Loans and Advances to banks and customers 1,399,422,889 1,968,269,298 139,723,758 103,512,388 - 3,610,928,333 3,610,928,333
Goodwill - - - 11,782,170 11,782,170 11,782,170
Tangible segment assets 2,902,215,498 3,649,593,598 299,874,847 234,831,429 - 7,086,515,373 7,086,515,373
Unallocated segment assets - - - - 1,593,232,348 1,593,232,348 1,593,232,348
Total assets 2,902,215,498 3,649,593,598 299,874,847 234,831,429 1,593,232,348 8,679,747,721 8,679,747,721
Deposits from customers 1,859,947,455 1,292,933,544 509,183,415 1,925,353,800 - 5,587,418,213 5,587,418,213
Segment liabilities 2,172,957,657 1,626,316,850 575,848,916 2,193,732,411 - 6,568,855,834 6,568,855,834
Unallocated segment liabilities - - - - 1,359,850,648 1,359,850,648 1,359,850,648
Total liabilities 2,172,957,657 1,626,316,850 575,848,916 2,193,732,411 1,359,850,648 7,928,706,483 7,928,706,483
Net assets 729,257,841 2,023,276,748 (275,974,070) (1,958,900,982) 233,381,700 751,041,238 751,041,240
The line"Derived from external customers" comprises of interest income, fees and commission income, net gain on investment securities and net foreign exchange income. The basis of accounting of transactions among reportable operating segments is on accrual basis.
168

Access Bank Plc Consolidated and separate financial statements For the year ended 31 December 2020
December 2019
Operating segments (continued)
Corporate & Investment Commercial Business Personal Unallocated
Total continuing Total
In thousands of Naira Banking Banking Banking Banking Segments operations
Revenue:
Derived from external customers 254,417,337 148,861,002 40,344,338 223,130,923 - 666,753,600 666,753,600
Derived from other business segments - - - - - - -
Total Revenue 264,530,075 139,044,168 30,646,235 79,435,182 - 513,655,660 513,655,660
Interest Income 209,609,587 167,865,932 33,936,015 125,435,254 - 536,846,788 536,846,788
Interest expense (105,512,905) (77,720,734) (14,243,479) (39,227,323) (22,913,352) (259,617,791) (259,617,791)
Impairment Losses (8,963,226) (9,585,092) 2,040,554 (3,681,629) - (20,189,393) (20,189,393)
Profit/(Loss) on ordinary activities before 76,773,700 19,416,879 1,084,898 18,103,102 - 115,378,579 115,378,579
Income tax expense (4,777,999) (5,899,391) (750,595) (6,440,934) (17,868,920) (17,868,920)
Profit after tax 97,509,659 97,509,659
December 2019
Assets and liabilities:
Loans and Advances to banks and customers 1,370,155,157 1,283,314,337 143,528,577 267,406,717 - 3,064,404,788 3,064,404,788
Goodwill - - - - 11,782,170 11,782,170 11,782,170
Tangible segment assets 2,789,878,313 2,576,723,412 352,297,683 281,246,050 - 6,000,145,458 6,000,145,458
Unallocated segment assets - - - - 1,146,464,687 1,146,464,687 1,146,464,687
Total assets 2,789,878,313 2,576,723,412 352,297,683 281,246,050 1,146,464,687 7,146,610,145 7,146,610,145
Deposits from customers 1,238,932,440 880,391,040 315,565,547 1,820,948,275 - 4,255,837,303 4,255,837,303
Segment liabilities 1,360,937,180 1,352,167,101 484,667,984 2,254,838,443 - 5,452,610,707 5,452,610,707
Unallocated segment liabilities - - - - 1,083,806,545 1,083,806,545 1,083,806,545
Total liabilities 1,360,937,180 1,352,167,101 484,667,984 2,254,838,443 1,083,806,545 6,536,417,252 6,536,417,252
Net assets 1,428,941,133 1,224,556,311 (132,370,301) (1,973,592,393) 62,658,142 610,192,893 610,192,895
The line"Derived from external customers" comprises of interest income, fees and commission income, net gain on investment securities and net foreign exchange income. The basis of accounting of transactions among reportable operating segments is on accrual basis.
169

Access Bank Plc Consolidated and separate financial statements For the year ended 31 December 2020
7b Geographical segments
The Group operates in three geographic regions, being:
• Nigeria
• Rest of Africa
• Europe
December 2020
In thousands of Naira Nigeria
Rest of Africa Europe
TotalContinuingOperations
DiscontinuedOperations
Intercompany elimination Total
Derived from external customers 635,659,022 89,016,497 49,309,812 773,985,332 - (8,472,637) 765,512,695
Derived from other segments - - - - - - -
Total revenue 635,659,022 89,016,497 49,309,812 773,985,332 - (8,472,637) 765,512,695
Interest income 396,678,298 62,344,622 38,508,141 497,531,062 - (8,314,357) 489,216,704
Impairment losses (39,650,580) (2,032,882) (21,209,659) (62,893,120) - - (62,893,120)
Interest expense (198,403,593) (25,408,814) (10,768,614) (234,581,021) - 8,314,357 (226,266,663)
Net fee and commission income 74,235,193 39,866,505 (20,528,273) 93,573,424 - - 93,573,424
Operating income 437,255,430 63,607,684 38,541,198 539,404,311 - (158,280) 539,246,031
Profit before income tax 90,195,877 28,456,442 7,269,804 125,922,123 - - 125,922,123
Assets and liabilities:Loans and advances to customers and banks 3,050,664,007 121,469,257 718,027,311 3,890,160,575 - (279,232,242) 3,610,928,333
Total assets 7,624,979,724 642,141,021 937,200,529 9,204,321,274 - (524,573,550) 8,679,747,721
Deposit from customers 4,832,744,498 421,675,525 332,998,195 5,587,418,217 - - 5,587,418,216
Total liabilities 6,971,084,063 512,458,350 802,014,849 8,285,557,262 - (356,850,777) 7,928,706,487
Net assets 653,895,661 129,682,671 135,185,680 918,764,012 - (167,722,777) 751,041,235
170

Access Bank Plc Consolidated and separate financial statements For the year ended 31 December 2020
December 2019 Nigeria
Rest of Africa Europe
TotalContinuingOperations
DiscontinuedOperations
Intercompany elimination Total
Derived from external customers 572,060,173 61,714,004 42,156,707 675,930,884 402,718 (9,580,005) 666,753,597
Derived from other segments - - - - - - -
Total revenue 572,060,173 61,714,004 42,156,707 675,930,884 - (9,580,005) 666,753,597
Interest income 471,468,768 41,355,942 33,602,081 546,426,791 - (9,580,005) 536,846,786
Impairment losses (21,055,479) 1,214,628 (348,543) (20,189,395) - - (20,189,395)
Interest expense (238,708,397) (19,162,924) (11,326,476) (269,197,796) - 9,580,005 (259,617,791)
Net fee and commission income 58,249,344 15,592,086 205,923 74,047,353 - 74,047,353
Operating income 333,351,777 42,551,080 30,830,231 406,733,087 402,718 - 407,135,806
Profit before income tax 79,213,716 12,166,977 20,544,826 115,378,579 - - 111,925,519
December 2019
Assets and liabilities:
Loans and advances to customers and banks 2,646,036,672 109,740,491 575,848,422 3,331,625,585 - (267,220,794) 3,064,404,791
Total assets 6,311,041,282 463,255,864 923,193,664 7,697,490,810 - (550,880,666) 7,146,610,143
Deposit from customers 3,668,339,811 306,476,348 281,021,142 4,255,837,302 - - 4,255,837,302
Total liabilities 5,768,100,182 398,118,129 782,025,377 6,948,243,684 - (411,814,937) 6,536,428,751
Net assets 542,941,104 65,137,735 141,168,287 749,247,131 - (139,065,728) 610,181,397
No revenue from transaction with a single external customer or a group of connected economic entities or counterparty amounted to 10% or more of the Group's total revenue in the year ended 31December 2020 and for the year ended 31 December 2019. Information on revenue from external customers for each product and service had not been disclosed as the information is not readilyavailable to the chief operating decision maker and the cost to develop is considered excessive.
171

Access Bank Plc Consolidated and separate financial statements For the year ended 31 December 2020
8 Interest incomeGroup Group Bank Bank
In thousands of Naira December 2020 December 2019 December 2020 December 2019
Interest incomeCash and balances with banks 11,955,018 9,210,581 8,786,852 6,089,179 Loans and advances to banks 13,088,360 5,574,597 8,860,342 2,585,672 Loans and advances to customers 309,535,992 328,635,871 262,227,517 289,543,542 Investment securities
-Available for sale-Financial assets at FVOCI 54,950,536 69,903,209 32,119,688 58,416,243 -Held to maturity-Financial assets at amortised cost 36,136,132 40,225,955 30,115,126 34,824,373
425,666,037 453,550,213 342,109,524 391,459,009
-Held for trading-Financial assets at FVPL 63,550,668 83,296,576 54,568,774 80,009,759 489,216,705 536,846,789 396,678,297 471,468,769
Interest expenseDeposit from financial institutions 58,238,619 44,108,564 59,054,574 45,307,058 Deposit from customers 118,437,140 168,565,047 94,931,205 147,879,993 Debt securities issued 19,305,651 22,913,352 19,305,651 22,913,352 Lease liabilities 4,524,454 1,122,276 549,938 742,970 Interest bearing borrowings and other borrowed funds 25,760,799 22,908,552 24,562,225 21,865,024
226,266,663 259,617,791 198,403,593 238,708,397
Net interest income 262,950,042 277,228,998 198,274,704 232,760,371
9 Net impairment charge on financial assetsGroup Group Bank Bank
In thousands of Naira December 2020 December 2019 December 2020 December 2019
(21,412,497)
3,200,712 3,220,284
Allowance for impairment on off balance sheet items (note 34c) 1,733,988 (1,266,048) 1,733,988 (1,190,751)
Allowance for impairment on money market placement (note 18b) (113,411) (91,339) (32,880) (534)
(Allowance)/write back of impairment on investment securities (341,797) (462,619) (310,276) (390,201)
Allowance write back of impairment on pledged assets (9,801) - (9,801) -
(62,893,122) (20,189,392) (39,650,583) (21,055,481)
10 (a) Fee and commission incomeGroup Group Bank Bank
In thousands of Naira December 2020 December 2019 December 2020 December 2019
Credit related fees and commissions 32,535,663 26,561,530 21,948,207 17,683,528Account maintenance charge and handling commission 15,112,706 14,006,591 14,540,673 13,094,190Commission on bills and letters of credit 2,186,289 2,997,936 1,982,436 2,795,349Commissions on collections 650,733 317,824 516,078 217,392Commission on other financial services 6,750,542 7,870,500 4,006,997 5,502,930Commission on foreign currency denominated transactions 2,711,097 2,413,190 1,036,431 1,626,951Channels and other E-business income 56,092,578 36,040,864 52,204,077 32,979,392Retail account charges 660,741 1,636,968 444,133 1,465,506
116,700,349 91,845,403 96,679,032 75,365,238
Group Group Bank Bank
December 2020 December 2019 December 2020 December 2019
Point in Time 108,633,355 84,745,586 94,688,344 72,038,314
Over Time 8,066,994 7,099,817 1,990,688 3,326,924
116,700,349 91,845,403 96,679,031 75,365,238
Channels and other E-business income include income from electronic channels, card products and related services.
10 (b) Fee and commission expenseIn thousands of Naira December 2020 December 2019 December 2020 December 2019
Bank and electronic transfer charges 3,651,408 2,231,967 2,940,445 1,549,919 E-banking expense 19,475,517 15,566,083 19,503,394 15,565,975
23,126,925 17,798,050 22,443,839 17,115,894
(1,537,520)
Credit related fees and commissions are fees charged to corporate customers other than fees included in determining the effective interest rates relating to loans and advances carried at amortized cost. These fees are accounted for inaccordance with the Group's revenue accounting policy. The representation of all fees and commission recognised in the year and prior year at a point in time and over a period of time is as shown below.
Interest income for the year ended 31 December 2020 includes interest accrued on impaired financial assets of Group: N4.67Bn (31 December 2019: N3.21Bn) and Bank: N4.47Bn (31 December 2019: N408.46Mn).
Allowance for impairment on loans and advance to banks (note 22)
(2,634,937)
(1,098,823) (1,188,950)
Write back/(allowance) on impairment on financial assets in other assets (note 26)
(37,501,273) (60,338,213)
The Group experienced significant reduction in interest expense attributable to the drop in interest payout for savings accounts based on the decision to reduce interest on savings to 10% of monetary policy rate (MPR) from 12%. Thisalso stems from the fact that the deposit mix contains a significant portion of savings account category as can be seen from Note 33. The decrease in interest income is attributable to drop in yield of securities and decreased level oftrading activities during the year.
(2,431,517)
Allowance for impairment on loans and advance to customers (20,032,578)
(1,281,782)
Fees and commissions expenses are fees charged for the provision of services to customers transacting on alternate channels platform of the Bank and on the various debit and credit cards issued for the purpose of these payments. Theyare charged to the Bank on services rendered on internet banking, mobile banking and online purchasing platforms. The corresponding income lines for these expenses include the income on cards (both foreign and local cards), onlinepurchases and bill payments included in fees and commissions. Fees and commissions expense includes the cost incurred to the bank for providing alternate platforms for the purposes of internet banking, mobile banking and onlinepurchases. It also includes expenses incurred by the Bank on the various debit and credit cards issued.
172
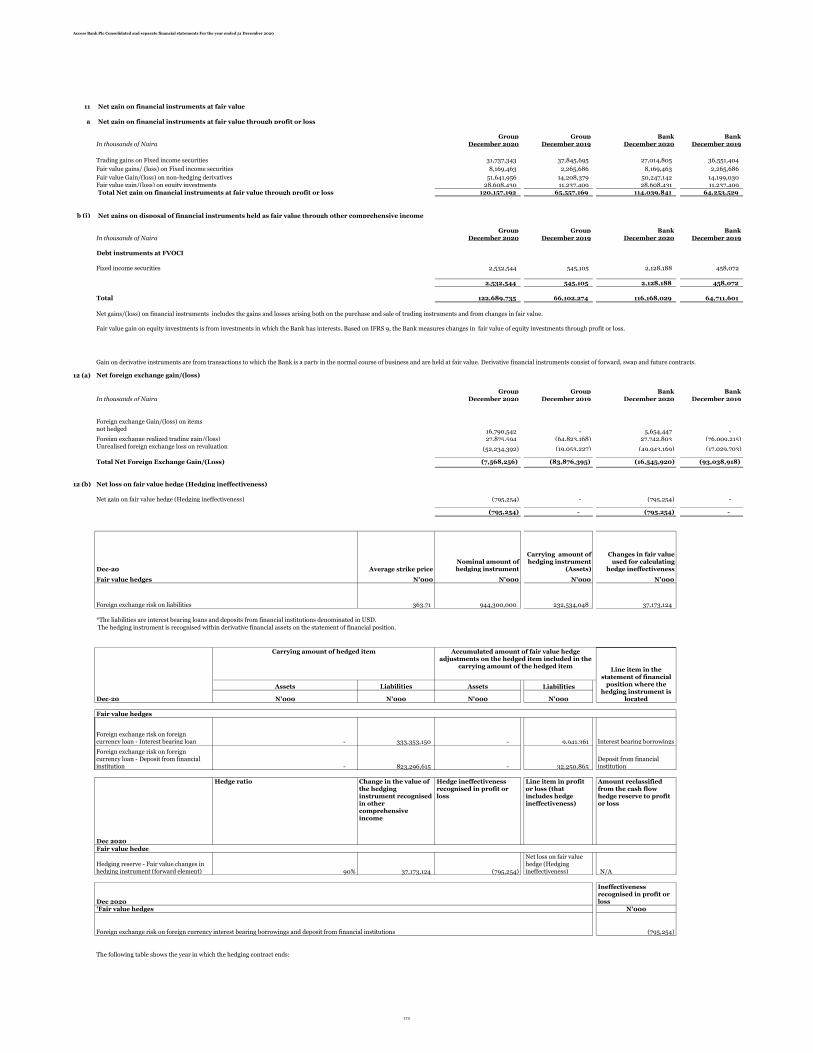
Access Bank Plc Consolidated and separate financial statements For the year ended 31 December 2020
11 Net gain on financial instruments at fair value
a Net gain on financial instruments at fair value through profit or loss
Group Group Bank BankIn thousands of Naira December 2020 December 2019 December 2020 December 2019
Fixed income securitiesTrading gains on Fixed income securities 31,737,343 37,845,695 27,014,805 36,551,404
Fair value gains/ (loss) on Fixed income securities 8,169,463 2,265,686 8,169,463 2,265,686
Fair value Gain/(loss) on non-hedging derivatives 51,641,956 14,208,379 50,247,142 14,199,030 Income on equity investmentsFair value gain/(loss) on equity investments 28,608,430 11,237,409 28,608,431 11,237,409
Total Net gain on financial instruments at fair value through profit or loss 120,157,192 65,557,169 114,039,841 64,253,529
b (i) Net gains on disposal of financial instruments held as fair value through other comprehensive income
Group Group Bank BankIn thousands of Naira December 2020 December 2019 December 2020 December 2019
Debt instruments at FVOCI
Fixed income securities 2,532,544 545,105 2,128,188 458,072
2,532,544 545,105 2,128,188 458,072
Total 122,689,735 66,102,274 116,168,029 64,711,601
12 (a)
Group Group Bank BankIn thousands of Naira December 2020 December 2019 December 2020 December 2019
Foreign exchange Gain/(loss) on items not hedged 16,790,542 - 5,654,447 - Foreign exchange realized trading gain/(loss) 27,875,594 (64,823,168) 27,742,803 (76,009,215)
(52,234,392) (19,053,227) (49,943,169) (17,029,703)
Total Net Foreign Exchange Gain/(Loss) (7,568,256) (83,876,395) (16,545,920) (93,038,918)
12 (b) Net loss on fair value hedge (Hedging ineffectiveness)
Net gain on fair value hedge (Hedging ineffectiveness) (795,254) - (795,254) -
(795,254) - (795,254) -
Dec-20 Average strike priceNominal amount of hedging instrument
Carrying amount of hedging instrument
(Assets)
Changes in fair value used for calculating
hedge ineffectiveness
Fair value hedges N'000 N'000 N'000 N'000
Foreign exchange risk on liabilities 363.71 944,300,000 232,534,048 37,173,124
Assets Liabilities Assets Liabilities
Foreign exchange risk on foreign currency loan - Interest bearing loan - 333,353,150 - 9,941,361 Interest bearing borrowings
Foreign exchange risk on foreign currency loan - Deposit from financial institution - 823,296,615 - 32,250,865
Deposit from financial institution
Dec 2020
Hedge ratio Change in the value of the hedging instrument recognised in other comprehensive income
Hedge ineffectiveness recognised in profit or loss
Line item in profit or loss (that includes hedge ineffectiveness)
Amount reclassified from the cash flow hedge reserve to profit or loss
Fair value hedge
Hedging reserve - Fair value changes in hedging instrument (forward element) 90% 37,173,124 (795,254)
Net loss on fair value hedge (Hedging ineffectiveness) N/A
Ineffectiveness recognised in profit or loss
'Fair value hedges N'000
(795,254)
The following table shows the year in which the hedging contract ends:
The hedging instrument is recognised within derivative financial assets on the statement of financial position.
Net foreign exchange gain/(loss)
Gain on derivative instruments are from transactions to which the Bank is a party in the normal course of business and are held at fair value. Derivative financial instruments consist of forward, swap and future contracts.
Net gains/(loss) on financial instruments includes the gains and losses arising both on the purchase and sale of trading instruments and from changes in fair value.
Fair value gain on equity investments is from investments in which the Bank has interests. Based on IFRS 9, the Bank measures changes in fair value of equity investments through profit or loss.
Unrealised foreign exchange loss on revaluation
*The liabilities are interest bearing loans and deposits from financial institutions denominated in USD.
N'000 N'000Dec-20
Line item in the statement of financial
position where the hedging instrument is
locatedN'000 N'000
Carrying amount of hedged item Accumulated amount of fair value hedge adjustments on the hedged item included in the
carrying amount of the hedged item
Dec 2020
Foreign exchange risk on foreign currency interest bearing borrowings and deposit from financial institutions
Fair value hedges
173
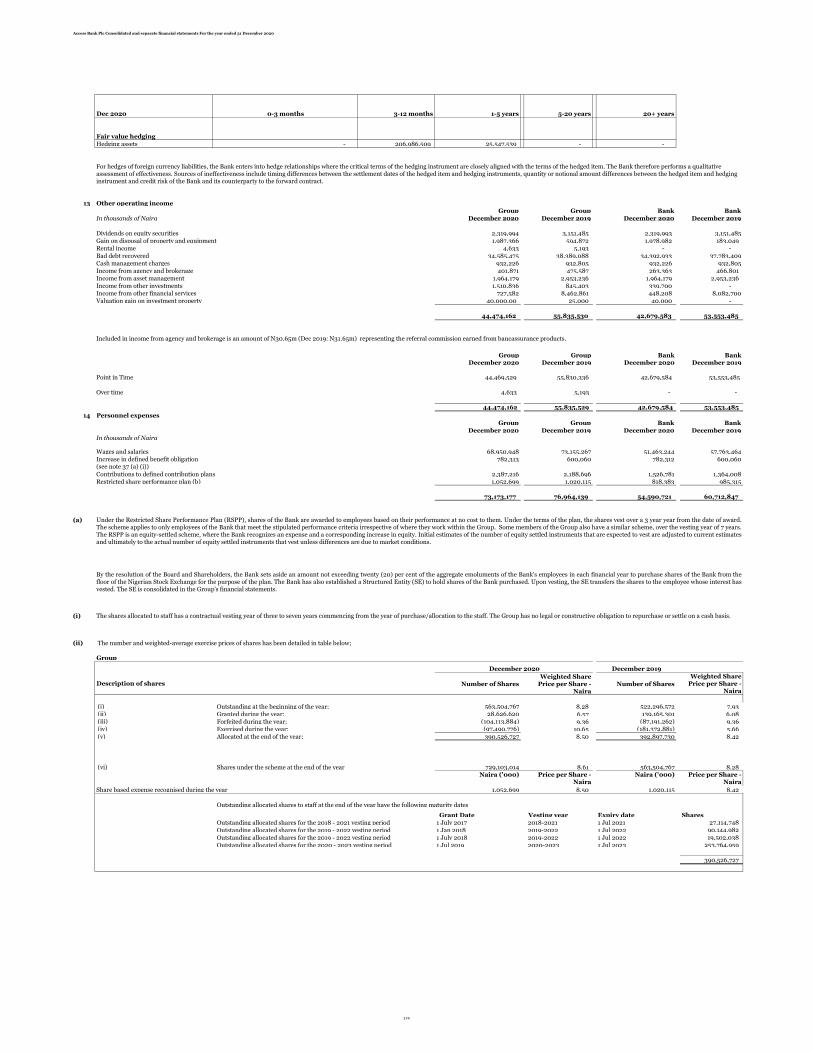
Access Bank Plc Consolidated and separate financial statements For the year ended 31 December 2020
Dec 2020 0-3 months 3-12 months 1-5 years 5-20 years 20+ years
Fair value hedgingHedging assets - 206,986,509 25,547,539 - -
13 Other operating incomeGroup Group Bank Bank
In thousands of Naira December 2020 December 2019 December 2020 December 2019
Dividends on available for sale equity securitiesDividends on equity securities 2,319,994 3,151,485 2,319,993 3,151,485Gain on disposal of property and equipment 1,987,366 594,872 1,978,982 183,049 Rental income 4,633 5,193 - - Bad debt recovered 34,585,475 38,389,088 34,392,933 37,783,409Cash management charges 932,226 932,805 932,226 932,805Income from agency and brokerage 401,871 475,587 263,363 466,801 Income from asset management 1,964,179 2,953,236 1,964,179 2,953,236 Income from other investments 1,510,836 845,403 339,700 - Income from other financial services 727,582 8,462,861 448,208 8,082,700Valuation gain on investment property 40,000.00 25,000 40,000 -
44,474,162 55,835,530 42,679,583 53,553,485
Included in income from agency and brokerage is an amount of N30.65m (Dec 2019: N31.65m) representing the referral commission earned from bancassurance products.
Group Group Bank Bank December 2020 December 2019 December 2020 December 2019
Point in Time 44,469,529 55,830,336 42,679,584 53,553,485
Over time 4,633 5,193 - -
44,474,162 55,835,529 42,679,584 53,553,485
14 Personnel expensesGroup Group Bank Bank
December 2020 December 2019 December 2020 December 2019In thousands of Naira
Wages and salaries 68,950,948 73,155,267 51,463,244 57,763,464Increase in liability for long term incentive plan (see note 37 (a) (i)) 782,313 600,060 782,312 600,060
Contributions to defined contribution plans 2,387,216 2,188,696 1,526,781 1,364,008Restricted share performance plan (b) 1,052,699 1,020,115 818,383 985,315
73,173,177 76,964,139 54,590,721 60,712,847
(a)
(i)
(ii) The number and weighted-average exercise prices of shares has been detailed in table below;
Group
December 2019
Description of shares Number of SharesWeighted Share
Price per Share - Naira
Number of Shares
Weighted Share Price per Share -
Naira
(i) Outstanding at the beginning of the year; 563,504,767 8.28 522,296,572 7.93 (ii) Granted during the year; 28,626,620 6.57 139,165,301 6.08 (iii) Forfeited during the year; (104,113,884) 9.36 (87,191,262) 9.36 (iv) Exercised during the year; (97,490,776) 10.65 (181,372,881) 5.66 (v) Allocated at the end of the year; 390,526,727 8.50 392,897,730 8.42
(vi) Shares under the scheme at the end of the year 729,103,014 8.61 563,504,767 8.28 Naira ('000) Price per Share -
NairaNaira ('000) Price per Share -
Naira
Share based expense recognised during the year 1,052,699 8.50 1,020,115 8.42
Outstanding allocated shares to staff at the end of the year have the following maturity dates
Grant Date Vesting year Expiry date SharesOutstanding allocated shares for the 2018 - 2021 vesting period 1 July 2017 2018-2021 1 Jul 2021 27,114,748
Outstanding allocated shares for the 2019 - 2022 vesting period 1 Jan 2018 2019-2022 1 Jul 2022 90,144,982
Outstanding allocated shares for the 2019 - 2022 vesting period 1 July 2018 2019-2022 1 Jul 2022 19,502,038
Outstanding allocated shares for the 2020 - 2023 vesting period 1 Jul 2019 2020-2023 1 Jul 2023 253,764,959
390,526,727
For hedges of foreign currency liabilities, the Bank enters into hedge relationships where the critical terms of the hedging instrument are closely aligned with the terms of the hedged item. The Bank therefore performs a qualitative assessment of effectiveness. Sources of ineffectiveness include timing differences between the settlement dates of the hedged item and hedging instruments, quantity or notional amount differences between the hedged item and hedging instrument and credit risk of the Bank and its counterparty to the forward contract.
December 2020
Increase in defined benefit obligation(see note 37 (a) (i))
Under the Restricted Share Performance Plan (RSPP), shares of the Bank are awarded to employees based on their performance at no cost to them. Under the terms of the plan, the shares vest over a 3 year year from the date of award.The scheme applies to only employees of the Bank that meet the stipulated performance criteria irrespective of where they work within the Group. Some members of the Group also have a similar scheme, over the vesting year of 7 years.The RSPP is an equity-settled scheme, where the Bank recognizes an expense and a corresponding increase in equity. Initial estimates of the number of equity settled instruments that are expected to vest are adjusted to current estimatesand ultimately to the actual number of equity settled instruments that vest unless differences are due to market conditions.
By the resolution of the Board and Shareholders, the Bank sets aside an amount not exceeding twenty (20) per cent of the aggregate emoluments of the Bank's employees in each financial year to purchase shares of the Bank from thefloor of the Nigerian Stock Exchange for the purpose of the plan. The Bank has also established a Structured Entity (SE) to hold shares of the Bank purchased. Upon vesting, the SE transfers the shares to the employee whose interest hasvested. The SE is consolidated in the Group's financial statements.
The shares allocated to staff has a contractual vesting year of three to seven years commencing from the year of purchase/allocation to the staff. The Group has no legal or constructive obligation to repurchase or settle on a cash basis.
174
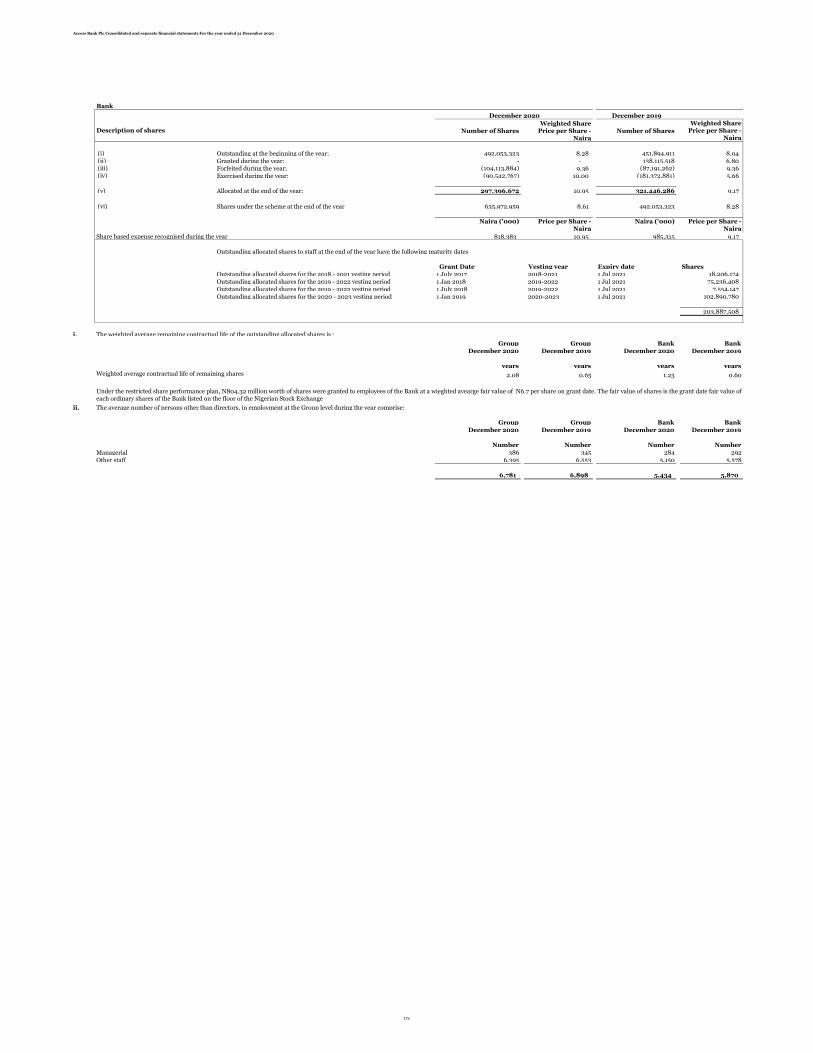
Access Bank Plc Consolidated and separate financial statements For the year ended 31 December 2020
Bank
December 2019
Description of shares Number of SharesWeighted Share
Price per Share - Naira
Number of Shares
Weighted Share Price per Share -
Naira
(i) Outstanding at the beginning of the year; 492,053,323 8.28 451,894,911 8.04 (ii) Granted during the year; - - 138,115,518 6.80 (iii) Forfeited during the year; (104,113,884) 9.36 (87,191,262) 9.36 (iv) Exercised during the year; (90,542,767) 10.00 (181,372,881) 5.66
(v) Allocated at the end of the year; 297,396,672 10.95 321,446,286 9.17
(vi) Shares under the scheme at the end of the year 635,972,959 8.61 492,053,323 8.28
Naira ('000) Price per Share - Naira
Naira ('000) Price per Share - Naira
Share based expense recognised during the year 818,383 10.95 985,315 9.17
Outstanding allocated shares to staff at the end of the year have the following maturity dates
Grant Date Vesting year Expiry date SharesOutstanding allocated shares for the 2018 - 2021 vesting period 1 July 2017 2018-2021 1 Jul 2021 18,206,174
Outstanding allocated shares for the 2019 - 2022 vesting period 1 Jan 2018 2019-2022 1 Jul 2021 75,236,408
Outstanding allocated shares for the 2019 - 2022 vesting period 1 July 2018 2019-2022 1 Jul 2021 7,554,147
Outstanding allocated shares for the 2020 - 2023 vesting period 1 Jan 2019 2020-2023 1 Jul 2021 102,890,780
203,887,508
i.
Group Group Bank BankDecember 2020 December 2019 December 2020 December 2019
years years years years
Weighted average contractual life of remaining shares 2.08 0.65 1.23 0.60
ii. The average number of persons other than directors, in employment at the Group level during the year comprise:
Group Group Bank BankDecember 2020 December 2019 December 2020 December 2019
Number Number Number Number
Managerial 386 345 284 292
Other staff 6,395 6,553 5,150 5,578
6,781 6,898 5,434 5,870
December 2020
The weighted average remaining contractual life of the outstanding allocated shares is :
Under the restricted share performance plan, N804.32 million worth of shares were granted to employees of the Bank at a wieghted avearge fair value of N6.7 per share on grant date. The fair value of shares is the grant date fair value ofeach ordinary shares of the Bank listed on the floor of the Nigerian Stock Exchange
175

Access Bank Plc Consolidated and separate financial statements For the year ended 31 December 2020
iii.
Group Group Bank BankDecember 2020 December 2019 December 2020 December 2019
Number Number Number Number
Below N900,000 - - - -
N900,001 - N1,990,000 - - - -
N1,990,001 - N2,990,000 836 612 836 612
N2,990,001 - N3,910,000 3 3 3 3
N3,910,001 - N4,740,000 1,081 1,404 743 1,135
N4,740,001 - N5,740,000 8 6 4 6
N5,740,001 - N6,760,000 1,857 1,894 1,580 1,677
N6,760,001 - N7,489,000 - - - -
N7,489,001 - N8,760,000 1,079 1,093 831 882
N8,760,001 - N9,190,000 882 877 655 714
N9,190,001 - N11,360,000 - - - -
N11,360,001 - N14,950,000 649 652 498 547
N14,950,001 - N17,950,000 - - - -
N17,950,001 - N21,940,000 158 157 131 136
N21,940,001 - N26,250,000 132 97 85 85
N26,250,001 - N30,260,000 - - - -
N30,261,001 - N45,329,000 75 79 56 58 Above N45,329,000 21 24 12 15
6,781 6,898 5,434 5,870
15 Other operating expensesGroup Group Bank Bank
In thousands of Naira December 2020 December 2019 December 2020 December 2019
Premises and equipment costs 15,584,830 13,362,597 13,587,535 11,632,172 Professional fees 9,246,562 6,593,943 7,066,566 5,398,715 Insurance 1,093,099 1,178,801 637,594 922,740 Business travel expenses 7,148,515 10,497,508 6,697,072 9,663,527
Asset Management Corporation of Nigeria (AMCON) surcharge (see note (a) below) 35,435,426 22,664,874 35,435,426 22,664,874 Bank charges 8,652,574 5,943,323 6,942,684 4,702,183 Deposit insurance premium 15,483,399 13,091,170 15,137,261 13,003,914 Auditor's remuneration 1,017,383 819,940 603,000 603,000 Administrative expenses 15,532,919 11,387,154 14,704,381 8,200,832 Merger expense - 6,589,718 - 6,589,718 Board expenses 1,101,914 1,063,681 760,644 732,361 Communication expenses 7,528,371 3,326,899 6,147,800 2,202,869 IT and e-business expenses 18,739,108 9,772,169 15,466,830 8,107,826 Outsourcing costs 25,070,011 16,668,063 23,866,650 15,666,157 Advertisements and marketing expenses 11,323,254 6,273,743 10,607,889 5,686,650 Recruitment and training 5,015,579 2,207,379 4,753,818 1,828,270 Events, charities and sponsorship 8,780,654 5,688,399 8,541,672 5,437,900 Periodicals and Subscriptions 567,422 722,989 219,211 455,743 Security expenses 7,872,464 4,295,939 7,082,899 3,790,966 Loss on disposal of non current asset held for sale - 198,850 - 198,850 Loss on disposal of investment property - 153,946 - 153,946 Loss on lease modification 63,329 63,329 Cash processing and management cost 9,935,636 3,656,564 9,627,717 3,509,930 Stationeries, postage and printing 5,890,667 1,937,080 5,511,435 1,599,097 Office provisions and entertainment 2,455,287 720,634 2,250,092 472,112 Rent expenses 2,331,832 2,219,415 1,871,553 1,699,092
215,806,908 151,098,110 197,519,728 134,986,773
Asset Management Corporation of Nigeria (AMCON) surcharge
Employees, other than directors, earning more than N900,000 per annum, whose duties were wholly or mainly discharged in Nigeria, received remuneration (excluding pension contributions and certain benefits) in the followingranges:
In line with the provision of S.238 of CAMA 2020, the Remuneration of the managers of the company for the year ended Dec 2020 amounted to N3.73Bn (Dec 2019: N3.88Bn).
176

Access Bank Plc Consolidated and separate financial statements For the year ended 31 December 2020
16 Income tax
Group Group Bank Bank
December 2020 December 2019 December 2020 December 2019
In thousands of Naira
Current tax expense
Corporate income tax 8,766,873 10,103,420 - -
Minimum tax 1,581,359 2,981,861 1,581,359 2,981,861
IT tax 903,761 831,693 901,959 826,668
Education tax 4,512 9,895 - -
Capital gains tax 127,162 7,274 127,162 7,274
Police fund tax levy 4,510 4,151 4,510 4,133
Prior year’s under provision - 88 - -
11,388,176 13,938,382 2,614,989 3,819,936
Deferred tax expense
Origination of temporary differences 8,524,257 3,930,538 7,541,560 5,277,786
Income tax expense 19,912,433 17,868,919 10,156,549 9,097,722
Items included in OCI (122,809) 145,140 (122,809) 145,140 Total income tax expense 19,789,625 18,014,059 10,033,741 9,242,862
The movement in the current income tax liability is as follows:
Group Group Bank Bank
December 2020 December 2019 December 2020 December 2019
Balance at the beginning of the year 3,531,410 4,057,861 1,409,435 2,939,801
Acquired from business combination - 472,844 - 327,525
Tax paid (12,165,887) (14,686,580) (833,942) (5,677,826)
Income tax charge 11,388,177 13,938,382 2,614,990 3,819,936
Prior year’s under/excess provision - - - -
Withholding tax utilization (643,591) - (643,591) -
Translation adjustments 49,812 (251,097) - -
Balance at the end of the year 2,159,921 3,531,410 2,546,892 1,409,435
Income tax liability is to be settled within one year
Income tax for the Bank has been assessed under the minimum tax regulation.
Group Group Group Group
In thousands of Naira December 2020 December 2020 December 2019 December 2019
Profit before income tax 125,922,123 111,925,517
Income tax using the domestic tax rate 30% 37,773,637 30% 33,577,655
Effect of tax rates in foreign jurisdictions -2% (1,995,637) -5% (5,724,659)
Information technology tax 1% 905,477 1% 830,185
Capital allowance utilised for the year 0% - 0% -
Non-deductible expenses 42% 53,426,666 23% 25,885,701
Tax exempt income -46% (58,542,813) -41% (45,917,989)
Tax losses unutilised 0% - 0% -
Education tax levy 0% 9,895 0% 9,895
Capital gain tax 0% 127,162 0% 6,281
Capital allowance -9% (11,791,953) 8% 9,201,850
Under provided in prior years 0% - 0% -
Minimum tax effect 0% - 0% -
Effective tax rate 16% 19,912,435 16% 17,868,919
The new Finance Act 2019 was introduced to amend some of the existing tax laws in Nigeria and to further reduce ambiguity that might or might not have existed. An assessment was carried out on Access Bank Plc for the year ended December 31, 2019 to identify areas of uncertainty in tax treatment in accordance with IFRIC 23. There has been some changes to the Company Income tax brought about by the New Finance Act. this addresses the areas of losses of a capital nature, expenses incurred for the purpose of deriving tax-exempt income, taxes or penalties borne on
The computation of the Bank’s income tax expense and deferred tax was carried out in accordance with the new 2019 Finance Act, CITA and other relevant tax laws. The changes made by the new act was incorporated in the Bank tax computation and it is believed by the management of the Bank that there is no uncertainty over its Income and Deferred tax treatment that relevant tax authorities may disagree with.
177
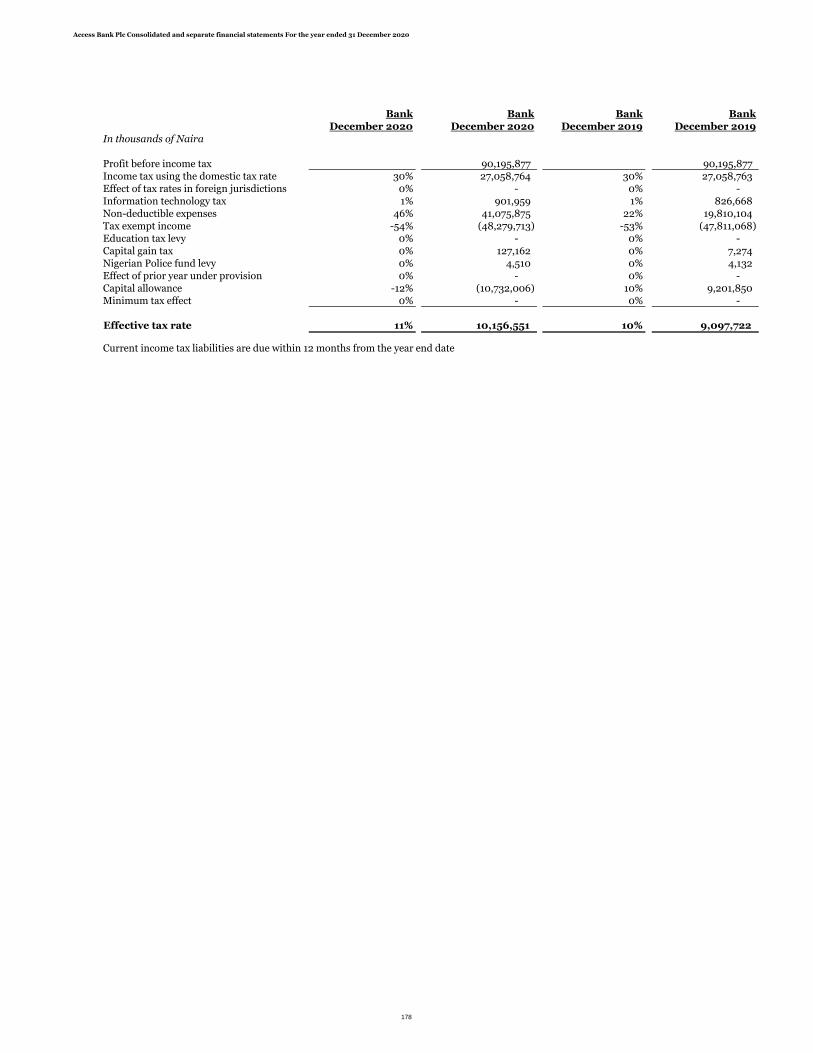
Access Bank Plc Consolidated and separate financial statements For the year ended 31 December 2020
Bank Bank Bank Bank
December 2020 December 2020 December 2019 December 2019
In thousands of Naira
Profit before income tax 90,195,877 90,195,877
Income tax using the domestic tax rate 30% 27,058,764 30% 27,058,763
Effect of tax rates in foreign jurisdictions 0% - 0% -
Information technology tax 1% 901,959 1% 826,668
Non-deductible expenses 46% 41,075,875 22% 19,810,104
Tax exempt income -54% (48,279,713) -53% (47,811,068)
Education tax levy 0% - 0% -
Capital gain tax 0% 127,162 0% 7,274
Nigerian Police fund levy 0% 4,510 0% 4,132
Effect of prior year under provision 0% - 0% -
Capital allowance -12% (10,732,006) 10% 9,201,850
Minimum tax effect 0% - 0% -
Effective tax rate 11% 10,156,551 10% 9,097,722
Current income tax liabilities are due within 12 months from the year end date
178

Access Bank Plc Consolidated and separate financial statements For the year ended 31 December 2020
17 Earnings per share
(a) Basic from continuing operations
Restated Restated
Group Group Bank Bank
In thousands of Naira December 2020 December 2019 December 2020 December 2019
Profit for the year from continuing operations 104,682,980 93,048,862 80,039,328 70,115,994
Weighted average number of ordinary shares in issue 35,545,226 33,890,912 35,545,226 33,890,912
Weighted average number of treasury Shares 729,103 563,505 - -
34,816,123 33,327,408 35,545,226 33,890,912
In kobo per share
Basic earnings per share from continuing operations 301 279 225 207
Diluted EPS
Restated Restated
Group Group Bank Bank
In thousands of Naira December 2020 December 2019 December 2020 December 2019
Profit for the year from continuing operations 104,682,980 93,048,862 80,039,328 70,115,994
Weighted average number of ordinary shares in issue 35,545,226 33,890,912 35,545,226 33,890,912
In kobo per share
Diluted earnings per share from continuing operations 295 275 225 207
18 Cash and balances with banks
Group Group Bank Bank
In thousands of Naira December 2020 December 2019 December 2020 December 2019
Cash on hand and balances with banks (see note (i)) 536,708,368 457,085,624 489,653,105 346,003,407
Unrestricted balances with central banks 51,127,105 117,883,814 13,639,189 97,734,073
Money market placements 89,783,183 48,838,459 40,095,277 32,822,516
Other deposits with central banks (see note (iii))Other deposits with central banks (see note (ii) 46,459,022 99,347,553 46,459,022 99,347,552
724,077,678 723,155,450 589,846,594 575,907,548
ECL on Placements (204,858) (91,447) (34,156) (1,275)
723,872,820 723,064,003 589,812,439 575,906,273
(i)
(ii)
Movement in ECL on Placements
Group Group Bank Bank
December 2020 December 2019 December 2020 December 2019
Opening balance at beginning of the year 91,446 3,206 1,275 742
Acquired from business combination - 4,064 - 4,063
-Charge for the year 113,411 91,338 32,880 534
Write off - (7,161) - (4,064)
Write back - - -
Closing balance 204,856 91,447 34,156 1,275
Basic earnings per share is calculated by dividing the profit attributable to equity holders of the company by the weighted average number of ordinary sharesin issue during the year excluding ordinary shares purchased by the company and held as treasury shares.
Included in cash on hand and balances with banks is an amount of N33.93Bn (31 Dec 2019: N25.97Bn) representing the Naira value of foreign currenciesheld on behalf of customers to cover letter of credit transactions. The corresponding liability is included in customer's deposit for foreign trade reported underother liabilities (see Note 34). This has been excluded for cash flow purposes.
The balance of N89.3bn represents the nominal value of outstanding forward contracts entered on behalf of customers, with the Central Bank of Nigeria.
Diluted earnings per share is calculated by considering the impact of the treasury shares in weighted average number of ordinary shares outstanding
179

Access Bank Plc Consolidated and separate financial statements For the year ended 31 December 2020
19 Investment under management
Group Group Bank Bank
In thousands of Naira December 2020 December 2019 December 2020 December 2019
Relating to unclaimed dividends:
Government bonds 3,882,771 2,054,650 3,882,771 2,054,650
Placements 6,386,464 9,779,427 6,386,464 9,779,427
Commercial paper 4,132,806 6,849,720 4,132,806 6,849,720
Nigerian treasury bills 6,156,666 4,280,814 6,156,666 4,280,814
Mutual funds 7,109,072 2,889,702 7,109,072 2,889,702
Eurobonds 2,783,687 2,437,646 2,783,687 2,437,646
30,451,466 28,291,959 30,451,466 28,291,959
20 Non pledged trading assets
Group Group Bank Bank
In thousands of Naira December 2020 December 2019 December 2020 December 2019
Government bonds 91,841,202 40,021,277 12,488,649 2,222,417
Eurobonds 74,615 - 74,615 -
Treasury bills 116,036,126 89,797,962 97,719,848 74,749,344
207,951,943 129,819,239 110,283,112 76,971,761
The Bank entrusted the sum transferred to it by the Registrars in respect of unclaimed dividends with select Asset Managers who will ensure safekeeping andmanage the funds for the benefit of the Bank. The investments by the Asset Managers are as listed above (the corresponding liability which is due to theRegistrar is reported as "unclaimed dividend" in other liabilities.
180

Access Bank Plc Consolidated and separate financial statements For the year ended 31 December 2020
21 Derivative financial instruments
In thousands of Naira
Group
Foreign exchange derivatives
Total derivative assets 1,132,096,948 251,112,744 1,200,294,464 143,520,553
- 9,126,853 - 1,073,677
1,132,096,948 241,985,892 1,215,811,042 142,446,876
301,693,689 (20,880,529) 82,812,664 (6,885,680)
- (9,126,851) - (1,027,272)
301,693,689 (11,753,678) 82,812,664 (5,858,408)
Bank
Foreign exchange derivatives1,089,971,280 244,564,046 1,150,759,629 143,480,073
- 9,126,853 - 1,073,677
1,089,971,280 235,437,193 1,150,759,629 142,406,396
227,896,259 (20,775,722) 78,393,273 (6,827,293)
- (9,126,852) - (1,027,272)
227,896,259 (11,648,870) 78,393,273 (5,800,021)
Group Bank
Current (Hedging Instruments) 207,172,300 206,986,509
Non- Current (Hedging Instruments) 25,567,644 25,547,539
Current (Non-Hedging Instruments) (2,507,729) (8,745,723)
Non- Current (Non-Hedging Instruments) - -
22 Loans and advances to banks
Group Group Bank Bank
December 2020 December 2019 December 2020 December 2019
In thousands of Naira
Loans and advances to banks 393,473,191 154,450,204 232,086,898 165,774,988
Less allowance for impairment losses (651,884) (1,625,123) (298,622) (1,361,987)
392,821,307 152,825,081 231,788,276 164,413,001
Group
Impairment allowance for loans and advances to banks
In thousands of Naira
Stage 1 Stage 2 Stage 3 Total
Internal rating grade:
Investment 599,195 - - 599,195
Standard grade 188 - - 188
Non Investment - - 52,501 52,501 Total 599,383 - 52,501 651,884
Stage 1 Stage 2 Stage 3 Total ECL
ECL allowance as at 1 January 2020 270,188 - 1,354,935 1,625,122
-Charge for the year:
Transfers to Stage 1 - - - -
Transfers to Stage 2 - - - -
Transfers to Stage 3 (358) - 358 -
Total net P&L charge during the year 329,619 - 859,330 1,188,950
Amounts written off - - (2,162,189) (2,162,189) At 31 December 2020 599,449 - 52,435 651,884
December 2020
December 2020
Non-deliverable future contracts
Forward and swap contracts
Total derivative liabilitiesNon-deliverable future contracts
Forward and swap contracts
Derivative financial instruments consist of forward, swap and future contracts. These are held for day to day cash management rather than for trading purposes and are held at fairvalue. The contracts have intended settlement dates of between 30 days and a year. All derivative contracts are considered to be valued with reference to data obtained from theFinancial Market Dealer Quotation (FMDQ).
The movement in fair value is as a result of a depreciation of the functional currency of the Group (Naira) within the year and an increase in the volume of transactions.
Fair ValueAssets/ (Liabilities)
Notional amountFair Value
Assets/ (Liabilities)
December 2020 December 2019
Total derivative assets
Notional amount
Non-deliverable future contracts
Forward and swap contracts
Total derivative liabilitiesNon-deliverable future contracts
Forward and swap contracts
Fair Value
December 2020
Notional amountFair Value
Assets/ (Liabilities)Notional amount
Fair ValueAssets/
(Liabilities)December 2020 December 2019
181
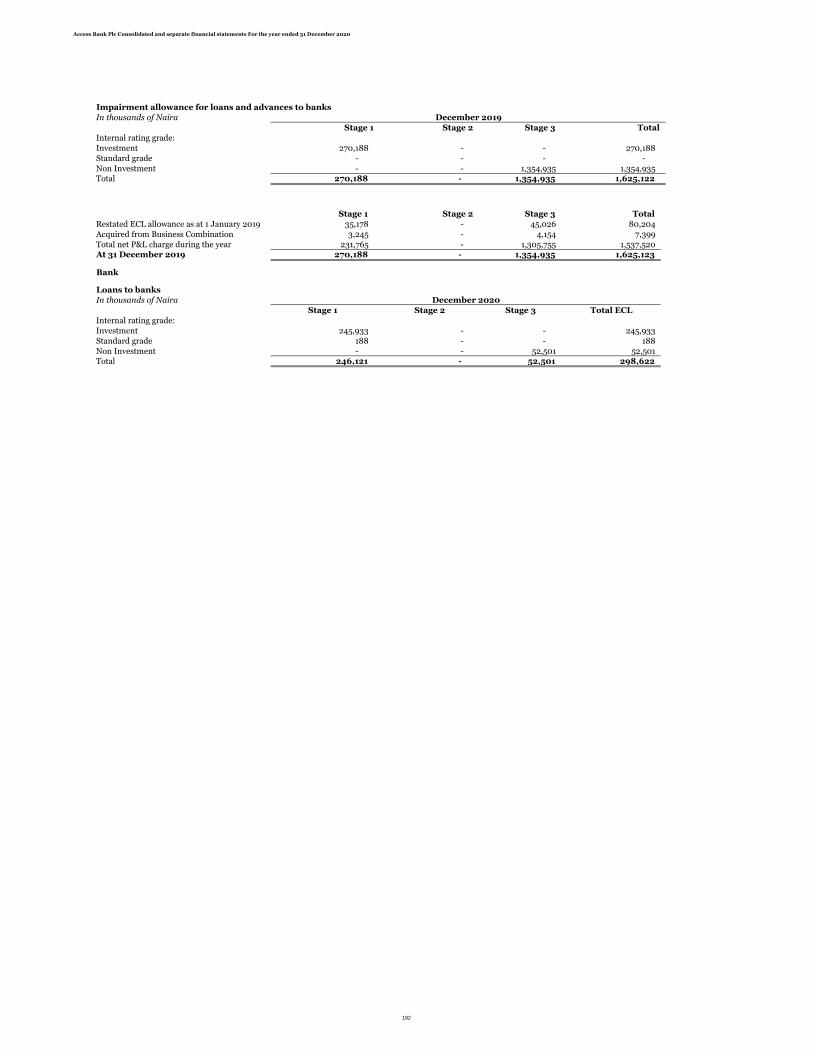
Access Bank Plc Consolidated and separate financial statements For the year ended 31 December 2020
Impairment allowance for loans and advances to banks
In thousands of Naira
Stage 1 Stage 2 Stage 3 Total
Internal rating grade:
Investment 270,188 - - 270,188
Standard grade - - - -
Non Investment - - 1,354,935 1,354,935 Total 270,188 - 1,354,935 1,625,122
Stage 1 Stage 2 Stage 3 Total
Restated ECL allowance as at 1 January 2019 35,178 - 45,026 80,204
Acquired from Business Combination 3,245 - 4,154 7,399
Total net P&L charge during the year 231,765 - 1,305,755 1,537,520 At 31 December 2019 270,188 - 1,354,935 1,625,123
Bank
Loans to banks
In thousands of Naira
Stage 1 Stage 2 Stage 3 Total ECL
Internal rating grade:
Investment 245,933 - - 245,933
Standard grade 188 - - 188
Non Investment - - 52,501 52,501 Total 246,121 - 52,501 298,622
December 2020
December 2019
182

Access Bank Plc Consolidated and separate financial statements For the year ended 31 December 2020
Stage 1 Stage 2 Stage 3 Total ECL
ECL allowance as at 1 January 2020 7,053 - 1,354,935 1,361,987
-Charge for the year: -
Transfers to Stage 1 - - - -
Transfers to Stage 2 - - - - Transfers to Stage 3 (358) - 358 -
Total net P&L charge during the year 239,426 - 859,396 1,098,823
Amounts written off - - (2,162,189) (2,162,189) At 31 December 2020 246,121 - 52,501 298,622
Impairment allowance for loans and advances to banks
In thousands of Naira
Stage 1 Stage 2 Stage 3 Total
Internal rating grade:
Investment 7,053 - - 7,053
Standard grade - - - -
Non Investment - - 1,354,935 1,354,935
Total 7,053 - 1,354,935 1,361,987
Stage 1 Stage 2 Stage 3 Total ECL
ECL allowance as at 1 January 2019 35,178 - 45,027 80,205
Total net P&L charge during the year (28,125) - 1,309,908 1,281,782
At 31 December 2019 7,053 - 1,354,935 1,361,987
23 Loans and advances to customers
a Group
December 2020
In thousands of Naira
Loans to individuals
Retail Exposures
Auto Loan 12,131,274
Credit Card 23,808,948
Finance Lease (note 23c) 1,581,736
Mortgage Loan 71,940,949
Overdraft 12,603,063
Personal Loan 29,890,378
Term Loan 50,830,204
Time Loan 6,517,424
209,303,977
Less allowance for expected credit loss (4,012,055) 205,291,922
Loans to corporate entities and other organizations
Non-Retail Exposures
Auto Loan (note 23c) 2,002,632
Credit Card 291,342
Finance Lease (note 23c) 2,665,738
Mortgage Loan 55,758,103
Overdraft 341,613,983
Personal Loan -
Term Loan 2,370,093,900
Time Loan 385,431,589
3,157,857,286
Less allowance for expected credit loss (145,042,183) 3,012,815,103
Loans and advances to customers (Individual and corporate entities and other organizations) 3,367,161,263
Less allowance for expected credit loss (149,054,237)
3,218,107,026
December 2020
December 2019
December 2019
Management overlays are made to the impairment models to factor in additional facts that are not fully reflected in the impairment model at year end. These overlays are incorporated into the future model developments where applicable.
As at 31 December 2020, management overlay to the impairment allowance was N2.74bn which represents 1.95% of the total impairment
183
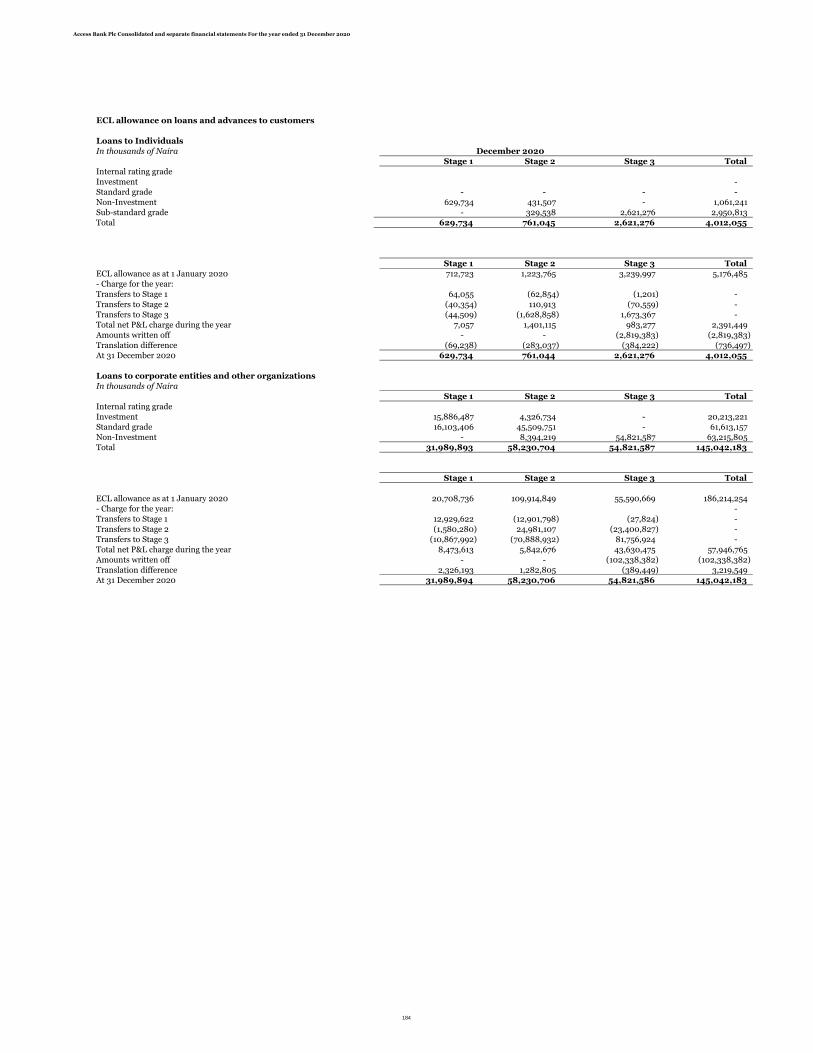
Access Bank Plc Consolidated and separate financial statements For the year ended 31 December 2020
ECL allowance on loans and advances to customers
Loans to Individuals
In thousands of Naira
Stage 1 Stage 2 Stage 3 Total
Internal rating grade
Investment -
Standard grade - - - -
Non-Investment 629,734 431,507 - 1,061,241
Sub-standard grade - 329,538 2,621,276 2,950,813
Total 629,734 761,045 2,621,276 4,012,055
Stage 1 Stage 2 Stage 3 Total
ECL allowance as at 1 January 2020 712,723 1,223,765 3,239,997 5,176,485
- Charge for the year:
Transfers to Stage 1 64,055 (62,854) (1,201) -
Transfers to Stage 2 (40,354) 110,913 (70,559) -
Transfers to Stage 3 (44,509) (1,628,858) 1,673,367 -
Total net P&L charge during the year 7,057 1,401,115 983,277 2,391,449
Amounts written off - - (2,819,383) (2,819,383)
Translation difference (69,238) (283,037) (384,222) (736,497)
At 31 December 2020 629,734 761,044 2,621,276 4,012,055
Loans to corporate entities and other organizations
In thousands of Naira
Stage 1 Stage 2 Stage 3 Total
Internal rating grade
Investment 15,886,487 4,326,734 - 20,213,221
Standard grade 16,103,406 45,509,751 - 61,613,157
Non-Investment - 8,394,219 54,821,587 63,215,805
Total 31,989,893 58,230,704 54,821,587 145,042,183
Stage 1 Stage 2 Stage 3 Total
ECL allowance as at 1 January 2020 20,708,736 109,914,849 55,590,669 186,214,254
- Charge for the year: -
Transfers to Stage 1 12,929,622 (12,901,798) (27,824) -
Transfers to Stage 2 (1,580,280) 24,981,107 (23,400,827) -
Transfers to Stage 3 (10,867,992) (70,888,932) 81,756,924 -
Total net P&L charge during the year 8,473,613 5,842,676 43,630,475 57,946,765
Amounts written off - - (102,338,382) (102,338,382)
Translation difference 2,326,193 1,282,805 (389,449) 3,219,549
At 31 December 2020 31,989,894 58,230,706 54,821,586 145,042,183
December 2020
184
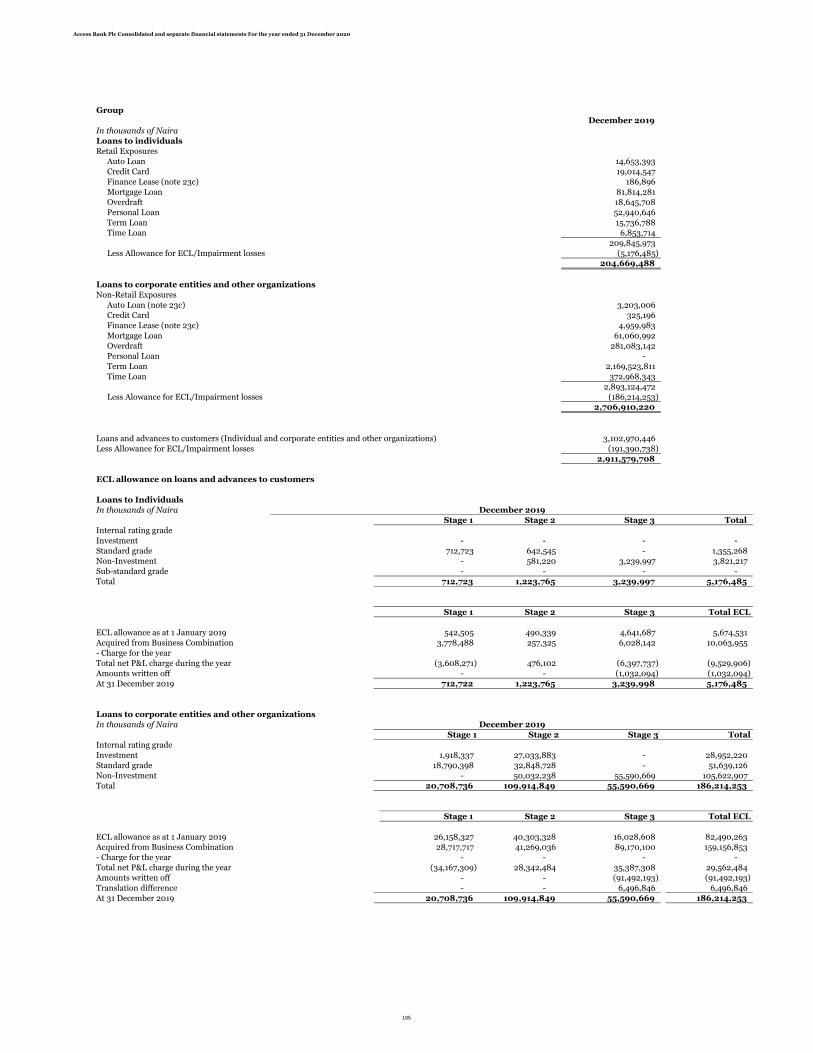
Access Bank Plc Consolidated and separate financial statements For the year ended 31 December 2020
Group
December 2019
In thousands of Naira
Loans to individuals
Retail Exposures
Auto Loan 14,653,393
Credit Card 19,014,547
Finance Lease (note 23c) 186,896
Mortgage Loan 81,814,281
Overdraft 18,645,708
Personal Loan 52,940,646
Term Loan 15,736,788
Time Loan 6,853,714
209,845,973
Less Allowance for ECL/Impairment losses (5,176,485) 204,669,488
Loans to corporate entities and other organizations
Non-Retail Exposures
Auto Loan (note 23c) 3,203,006
Credit Card 325,196
Finance Lease (note 23c) 4,959,983
Mortgage Loan 61,060,992
Overdraft 281,083,142
Personal Loan -
Term Loan 2,169,523,811
Time Loan 372,968,343
2,893,124,472
Less Alowance for ECL/Impairment losses (186,214,253) 2,706,910,220
Loans and advances to customers (Individual and corporate entities and other organizations) 3,102,970,446
Less Allowance for ECL/Impairment losses (191,390,738)
2,911,579,708
ECL allowance on loans and advances to customers
Loans to Individuals
In thousands of Naira
Stage 1 Stage 2 Stage 3 Total
Internal rating grade
Investment - - - -
Standard grade 712,723 642,545 - 1,355,268
Non-Investment - 581,220 3,239,997 3,821,217
Sub-standard grade - - - -
Total 712,723 1,223,765 3,239,997 5,176,485
Stage 1 Stage 2 Stage 3 Total ECL
ECL allowance as at 1 January 2019 542,505 490,339 4,641,687 5,674,531
Acquired from Business Combination 3,778,488 257,325 6,028,142 10,063,955
- Charge for the year
Total net P&L charge during the year (3,608,271) 476,102 (6,397,737) (9,529,906)
Amounts written off - - (1,032,094) (1,032,094)
At 31 December 2019 712,722 1,223,765 3,239,998 5,176,485
Loans to corporate entities and other organizations
In thousands of Naira
Stage 1 Stage 2 Stage 3 Total
Internal rating grade
Investment 1,918,337 27,033,883 - 28,952,220
Standard grade 18,790,398 32,848,728 - 51,639,126
Non-Investment - 50,032,238 55,590,669 105,622,907
Total 20,708,736 109,914,849 55,590,669 186,214,253
Stage 1 Stage 2 Stage 3 Total ECL
ECL allowance as at 1 January 2019 26,158,327 40,303,328 16,028,608 82,490,263
Acquired from Business Combination 28,717,717 41,269,036 89,170,100 159,156,853
- Charge for the year - - - -
Total net P&L charge during the year (34,167,309) 28,342,484 35,387,308 29,562,484
Amounts written off - - (91,492,193) (91,492,193)
Translation difference - - 6,496,846 6,496,846
At 31 December 2019 20,708,736 109,914,849 55,590,669 186,214,253
December 2019
December 2019
185
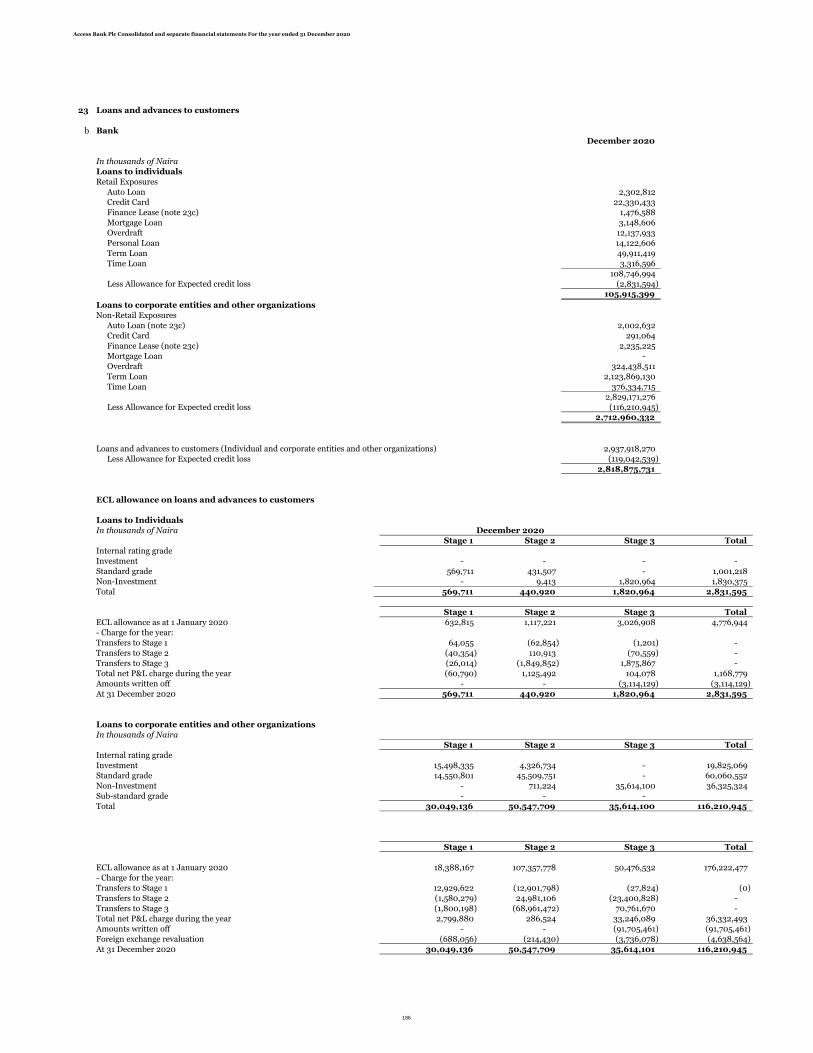
Access Bank Plc Consolidated and separate financial statements For the year ended 31 December 2020
23 Loans and advances to customers
b Bank
December 2020
In thousands of Naira
Loans to individuals
Retail Exposures
Auto Loan 2,302,812
Credit Card 22,330,433
Finance Lease (note 23c) 1,476,588
Mortgage Loan 3,148,606
Overdraft 12,137,933
Personal Loan 14,122,606
Term Loan 49,911,419
Time Loan 3,316,596
108,746,994
Less Allowance for Expected credit loss (2,831,594) 105,915,399
Loans to corporate entities and other organizations
Non-Retail Exposures
Auto Loan (note 23c) 2,002,632
Credit Card 291,064
Finance Lease (note 23c) 2,235,225
Mortgage Loan -
Overdraft 324,438,511
Term Loan 2,123,869,130
Time Loan 376,334,715
2,829,171,276
Less Allowance for Expected credit loss (116,210,945) 2,712,960,332
Loans and advances to customers (Individual and corporate entities and other organizations) 2,937,918,270
Less Allowance for Expected credit loss (119,042,539)
2,818,875,731
ECL allowance on loans and advances to customers
Loans to Individuals
In thousands of Naira
Stage 1 Stage 2 Stage 3 Total
Internal rating grade
Investment - - - -
Standard grade 569,711 431,507 - 1,001,218
Non-Investment - 9,413 1,820,964 1,830,375
Total 569,711 440,920 1,820,964 2,831,595
Stage 1 Stage 2 Stage 3 Total
ECL allowance as at 1 January 2020 632,815 1,117,221 3,026,908 4,776,944
- Charge for the year:
Transfers to Stage 1 64,055 (62,854) (1,201) -
Transfers to Stage 2 (40,354) 110,913 (70,559) -
Transfers to Stage 3 (26,014) (1,849,852) 1,875,867 -
Total net P&L charge during the year (60,790) 1,125,492 104,078 1,168,779
Amounts written off - - (3,114,129) (3,114,129)
At 31 December 2020 569,711 440,920 1,820,964 2,831,595
Loans to corporate entities and other organizations
In thousands of Naira
Stage 1 Stage 2 Stage 3 Total
Internal rating grade
Investment 15,498,335 4,326,734 - 19,825,069
Standard grade 14,550,801 45,509,751 - 60,060,552
Non-Investment - 711,224 35,614,100 36,325,324
Sub-standard grade - - -
Total 30,049,136 50,547,709 35,614,100 116,210,945
Stage 1 Stage 2 Stage 3 Total
ECL allowance as at 1 January 2020 18,388,167 107,357,778 50,476,532 176,222,477
- Charge for the year:
Transfers to Stage 1 12,929,622 (12,901,798) (27,824) (0)
Transfers to Stage 2 (1,580,279) 24,981,106 (23,400,828) -
Transfers to Stage 3 (1,800,198) (68,961,472) 70,761,670 -
Total net P&L charge during the year 2,799,880 286,524 33,246,089 36,332,493
Amounts written off - - (91,705,461) (91,705,461)
Foreign exchange revaluation (688,056) (214,430) (3,736,078) (4,638,564)
At 31 December 2020 30,049,136 50,547,709 35,614,101 116,210,945
December 2020
186
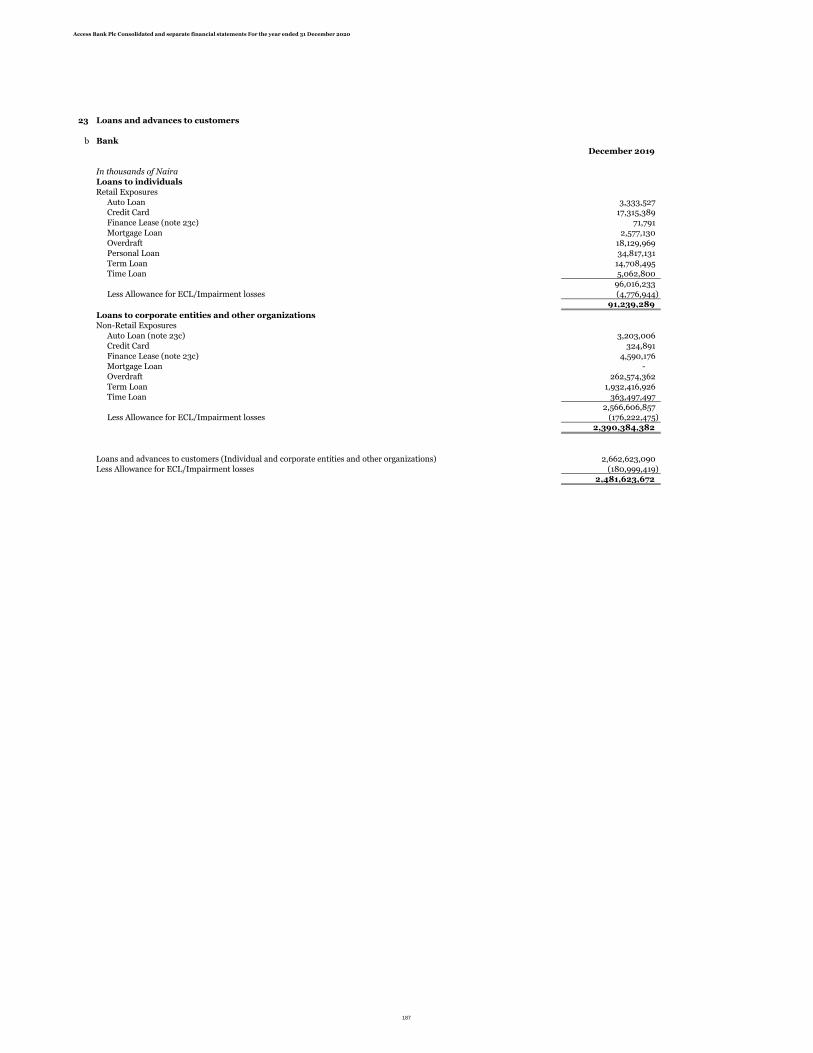
Access Bank Plc Consolidated and separate financial statements For the year ended 31 December 2020
23 Loans and advances to customers
b Bank
December 2019
In thousands of Naira
Loans to individuals
Retail Exposures
Auto Loan 3,333,527
Credit Card 17,315,389
Finance Lease (note 23c) 71,791
Mortgage Loan 2,577,130
Overdraft 18,129,969
Personal Loan 34,817,131
Term Loan 14,708,495
Time Loan 5,062,800
96,016,233
Less Allowance for ECL/Impairment losses (4,776,944)
91,239,289
Loans to corporate entities and other organizations
Non-Retail Exposures
Auto Loan (note 23c) 3,203,006
Credit Card 324,891
Finance Lease (note 23c) 4,590,176
Mortgage Loan -
Overdraft 262,574,362
Term Loan 1,932,416,926
Time Loan 363,497,497
2,566,606,857
Less Allowance for ECL/Impairment losses (176,222,475) 2,390,384,382
Loans and advances to customers (Individual and corporate entities and other organizations) 2,662,623,090
Less Allowance for ECL/Impairment losses (180,999,419) 2,481,623,672
187

Access Bank Plc Consolidated and separate financial statements For the year ended 31 December 2020
Impairment allowance on loans and advances to customers
Loans to Individuals
In thousands of Naira
Stage 1 Stage 2 Stage 3 Total
Internal rating grade
Investment - - - -
Standard grade 632,815 642,546 - 1,275,361
Non-Investment - 474,675 3,026,908 3,501,583
Total 632,815 1,117,221 3,026,908 4,776,944
Stage 1 Stage 2 Stage 3 Total
ECL allowance as at 1 January 2019 460,839 381,451 4,425,360 5,267,650
Write offs) 3,778,488 257,324 6,028,142 10,063,954
- Charge for the year - - -
Total net P&L charge during the year (3,606,512) 478,445 (6,394,499) (9,522,566)
Amounts written off - - (1,032,094) (1,032,094)
At 31 December 2019 632,815 1,117,220 3,026,909 4,776,944
Loans to corporate entities and other organizations
In thousands of Naira
Stage 1 Stage 2 Stage 3 Total
Internal rating grade
Investment 1,454,222 27,033,881 - 28,488,103
Standard grade 16,933,943 32,848,728 - 49,782,671
Non-Investment - 47,475,169 50,476,532 97,951,701
Sub-standard grade - - - -
Total 18,388,167 107,357,778 50,476,532 176,222,475
Stage 1 Stage 2 Stage 3 Total ECL
ECL allowance as at 1 January 2019 23,517,781 37,690,005 10,800,514 72,008,300
Acquired from Business Combination 28,717,717 41,263,043 89,170,101 159,150,861
- Charge for the year
Total net P&L charge during the year (33,847,332) 28,404,728 36,377,667 30,935,063
Amounts written off - - (91,392,193) (91,392,193)
Foreign exchange revaluation - - 5,520,444 5,520,444
At 31 December 2019 18,388,167 107,357,778 50,476,532 176,222,475
December 2019
December 2019
188

Access Bank Plc Consolidated and separate financial statements For the year ended 31 December 2020
23(c) Advances under finance leases
Group Group Bank Bank
In thousands of Naira December 2020 December 2019 December 2020 December 2019
Gross investment in finance lease, receivable 4,732,127 24,543,646 4,167,001 13,735,198
Unearned finance income on finance leases (728,818) (7,515,554) (548,919) (1,853,986)
Net investment in finance leases 4,003,309 17,028,092 3,618,082 11,881,212
Gross investment in finance leases, receivable:
Less than one year 3,336,464 12,696,773 2,938,013 7,292,549
Between one and five years 1,395,662 11,846,874 1,228,988 6,442,649
Later than five years - - - -
4,732,127 24,543,647 4,167,001 13,735,198
Unearned finance income on finance leases (728,818) (7,515,554) (548,919) (1,853,986)
Present value of minimum lease payments 4,003,309 17,028,093 3,618,082 11,881,212
- Less than one year 2,802,316 7,866,303 2,532,657 5,292,863
- Between one and five years 1,200,993 9,161,789 1,085,425 6,588,349
- Later than five years - - - -
24 Pledged assets
Group Group Bank Bank
In thousands of Naira December 2020 December 2019 December 2020 December 2019
-Financial instruments at FVOCI
Treasury bills 999,521 30,388,532 999,521 30,388,532
Government bonds 2,617,080 - 2,617,080 -
3,616,601 30,388,532 3,616,601 30,388,532
-Financial instruments at amortised cost
Treasury bills 98,097,771 452,686,283 98,097,771 452,686,283
Government bonds 41,833,930 82,599,583 41,833,930 82,599,583
139,931,702 535,285,866 139,931,702 535,285,866
ECL on financial assets at amortized cost (9,370) - (9,370) -
139,922,332 535,285,866 139,922,332 535,285,866
-Financial instruments at FVPL
Treasury bills 85,006,604 39,881,493 85,006,603 39,881,494
Government bonds - - - -
85,006,604 39,881,493 85,006,603 39,881,494
228,545,536 605,555,891 228,545,536 605,555,892
ECL allowance on pledged assets at fair value through other comprehensive income
Group Group Bank Bank
In thousands of Naira December 2020 December 2019 December 2020 December 2019
Opening balance - - - -
Additional allowance 431 - 431 -
Allowance written back - - - - Balance, end of year 431 - 431 -
ECL on financial assets at fair value through OCI are presented in statement of changes in equity.
ECL allowance on pledged assets at amortized cost
Group Group Bank Bank
In thousands of Naira December 2020 December 2019 December 2020 December 2019
Opening balance - - - -
Additional allowance 9,370 - 9,370 -
Allowance written back - - - - Balance, end of year 9,370 - 9,370 -
Loans and advances to customers at amortised cost include the following finance lease receivables for leases of certain property,automobile/vehicle and equipment where the group is the lessor:
Present value of minimum lease payments may be
189

Access Bank Plc Consolidated and separate financial statements For the year ended 31 December 2020
Central Bank of Nigeria (CBN) 265,728,206 251,051,432 265,728,206 251,051,432
Bank of Industry (BOI) 43,116,940 22,191,400 43,116,940 22,191,400 308,845,146 273,242,832 308,845,146 273,242,832
(i)
The related liability for assets pledged as collateral include:
The assets pledged as collateral include assets pledged to third parties under secured borrowing with the related liability disclosed above.Pledged assets includes pledges to counterparties for total return swap of N 759.31mn (31 December 2019: N117.97bn). The pledges have beenmade in the normal course of business of the Bank. In the event of default, the pledgee has the right to realise the pledged assets. Thisdisclosure in 24(i) is inclusive of only liabilities that actual cash has been received for.
The other counterparties included in this category of pledged assets include FIRS, Valu card, Interswitch, NIBSS and others.
190
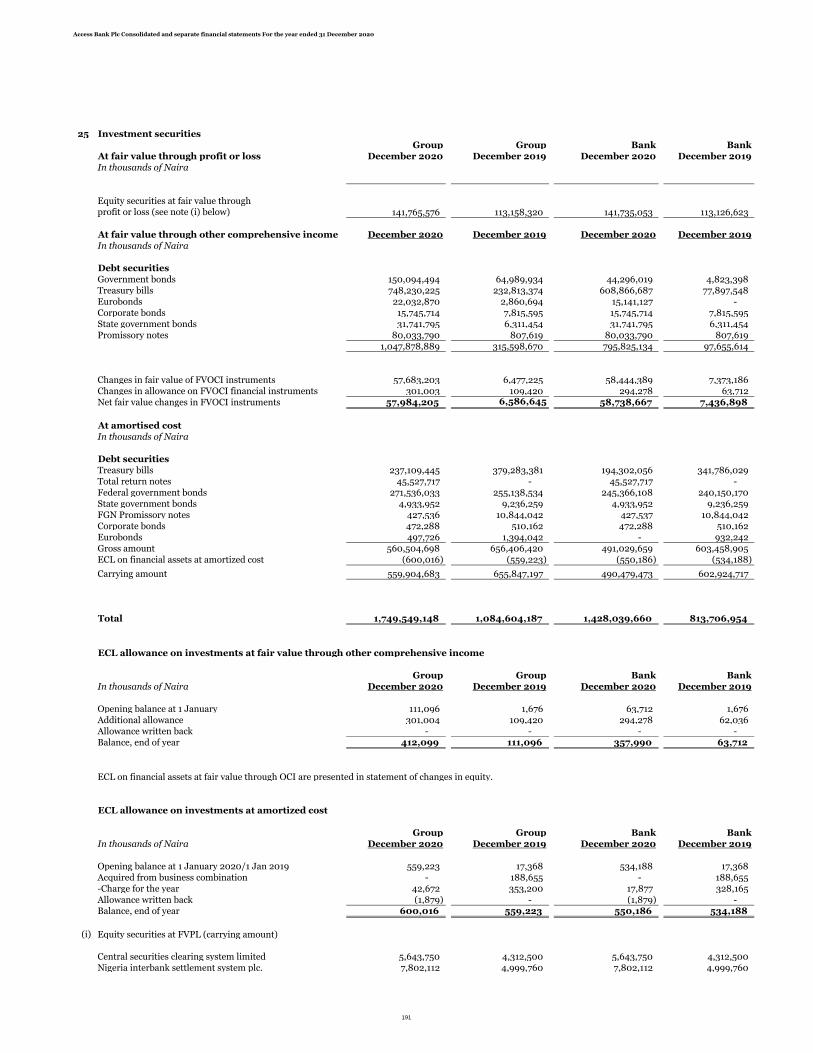
Access Bank Plc Consolidated and separate financial statements For the year ended 31 December 2020
25 Investment securitiesGroup Group Bank Bank
At fair value through profit or loss December 2020 December 2019 December 2020 December 2019In thousands of Naira
Equity securities at fair value through profit or loss (see note (i) below) 141,765,576 113,158,320 141,735,053 113,126,623
At fair value through other comprehensive income December 2020 December 2019 December 2020 December 2019In thousands of Naira
Debt securitiesGovernment bonds 150,094,494 64,989,934 44,296,019 4,823,398 Treasury bills 748,230,225 232,813,374 608,866,687 77,897,548 Eurobonds 22,032,870 2,860,694 15,141,127 - Corporate bonds 15,745,714 7,815,595 15,745,714 7,815,595 State government bonds 31,741,795 6,311,454 31,741,795 6,311,454 Promissory notes 80,033,790 807,619 80,033,790 807,619
1,047,878,889 315,598,670 795,825,134 97,655,614
Changes in fair value of FVOCI instruments 57,683,203 6,477,225 58,444,389 7,373,186 Changes in allowance on FVOCI financial instruments 301,003 109,420 294,278 63,712 Net fair value changes in FVOCI instruments 57,984,205 6,586,645 58,738,667 7,436,898
At amortised costIn thousands of Naira
Debt securitiesTreasury bills 237,109,445 379,283,381 194,302,056 341,786,029 Total return notes 45,527,717 - 45,527,717 - Federal government bonds 271,536,033 255,138,534 245,366,108 240,150,170 State government bonds 4,933,952 9,236,259 4,933,952 9,236,259 FGN Promissory notes 427,536 10,844,042 427,537 10,844,042 Corporate bonds 472,288 510,162 472,288 510,162 Eurobonds 497,726 1,394,042 - 932,242 Gross amount 560,504,698 656,406,420 491,029,659 603,458,905 ECL on financial assets at amortized cost (600,016) (559,223) (550,186) (534,188)
Carrying amount 559,904,683 655,847,197 490,479,473 602,924,717
Total 1,749,549,148 1,084,604,187 1,428,039,660 813,706,954
ECL allowance on investments at fair value through other comprehensive income
Group Group Bank BankIn thousands of Naira December 2020 December 2019 December 2020 December 2019
Opening balance at 1 January 111,096 1,676 63,712 1,676 Additional allowance 301,004 109,420 294,278 62,036 Allowance written back - - - - Balance, end of year 412,099 111,096 357,990 63,712
ECL on financial assets at fair value through OCI are presented in statement of changes in equity.
ECL allowance on investments at amortized cost
Group Group Bank BankIn thousands of Naira December 2020 December 2019 December 2020 December 2019
Opening balance at 1 January 2020/1 Jan 2019 559,223 17,368 534,188 17,368 Acquired from business combination - 188,655 - 188,655 -Charge for the year 42,672 353,200 17,877 328,165 Allowance written back (1,879) - (1,879) - Balance, end of year 600,016 559,223 550,186 534,188
(i) Equity securities at FVPL (carrying amount)
Central securities clearing system limited 5,643,750 4,312,500 5,643,750 4,312,500 Nigeria interbank settlement system plc. 7,802,112 4,999,760 7,802,112 4,999,760
191

Access Bank Plc Consolidated and separate financial statements For the year ended 31 December 2020
Unified payment services limited 4,058,931 6,732,958 4,058,931 6,732,958 Africa finance corporation 114,520,852 89,805,806 114,520,852 89,805,806 E-Tranzact 534,682 598,936 534,682 598,936 African export-import bank 49,851 34,396 49,851 34,396
3,332,927 684,900 3,332,927 684,900 Nigerian mortage refinance company plc. 323,333 305,227 323,333 305,227 Credit reference company 792,743 391,854 792,743 391,854 NG Clearing Limited 213,223 227,491 213,223 227,491 Capital Alliance Equity Fund 4,412,649 4,982,794 4,412,649 4,982,794 Shared agent network expansion facility 50,000 50,000 50,000 50,000 Others 30,523 31,698 - -
141,765,576 113,158,320 141,735,053 113,126,622
FMDQ Holdings
192

Access Bank Plc Consolidated and separate financial statements For the year ended 31 December 2020
25 (b) Debt instruments other than those designated at fair value through profit or loss
Group
At fair value through other comprehensive income
In thousands of Naira
Fair value ECL
Debt securities
Government bonds 150,094,494 24,749
Treasury bills 748,230,225 117,544
Eurobonds 22,032,870 91,325
Corporate bonds 15,745,714 25,719
State government bonds 31,741,795 138,517
Promissory notes 80,033,790 14,247 Total 1,047,878,889 412,100
At amortised cost
In thousands of Naira Carrying
Amortized cost ECL Amount
Debt securities
Government bonds 271,536,033 40,107 271,495,925
Treasury bills 237,109,445 13,999 237,095,447
Total return notes 45,527,717 - 45,527,718
Eurobonds 497,724 49,831 447,894
Corporate bonds 472,288 472,288 -
State government bonds 4,933,952 23,756 4,910,196
FGN Promissory notes 427,536 35 427,501 Total 560,504,696 600,016 559,904,679
Bank
At fair value through other comprehensive income
In thousands of Naira
Fair value ECL
Debt securities
Government bonds 44,296,019 24,749
Treasury bills 608,866,687 117,544
Eurobonds 15,141,127 37,215
Corporate bonds 15,745,714 25,719
State government bonds 31,741,795 138,517
Promissory notes 80,033,790 14,247 Total 795,825,134 357,989
At amortised cost
In thousands of Naira Carrying
Amortized cost ECL Amount
Debt securities
Government bonds 245,366,108 40,107 245,326,000
Treasury bills 194,302,056 13,999 194,288,057
Total return notes 45,527,717 - 45,527,717
Eurobonds - - -
Corporate bonds 472,288 472,288 -
State government bonds 4,933,952 23,756 4,910,196
Promissory notes 427,537 35 427,501 Total 491,029,659 550,186 490,479,472
Group
Financial instruments at fair value through other comprehensive income
In thousands of Naira
stage 1 Stage 2 Stage 3 Total
Internal rating grade
Investment 257,742,627 - - 257,742,627
Standard grade 785,141,261 - - 785,141,261
Non-Investment 4,995,001 - - 4,995,001 Total 1,047,878,889 - - 1,047,878,889
The table below shows the analysis of the Bank's debt instruments measured at FVOCI and amortized cost by credit risk, based on the Bank's internalcredit rating system and year end- stage classificaton.
December 2020
December 2020
193
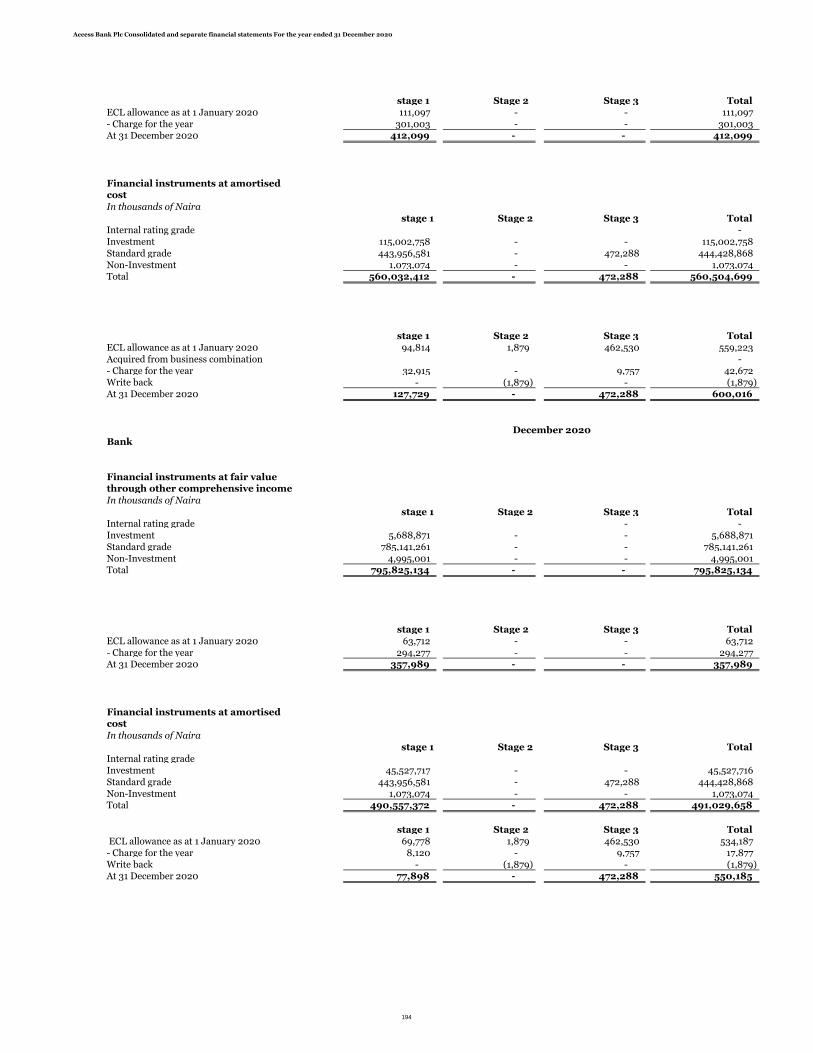
Access Bank Plc Consolidated and separate financial statements For the year ended 31 December 2020
stage 1 Stage 2 Stage 3 Total
ECL allowance as at 1 January 2020 111,097 - - 111,097
- Charge for the year 301,003 - - 301,003 At 31 December 2020 412,099 - - 412,099
Financial instruments at amortised cost
In thousands of Naira
stage 1 Stage 2 Stage 3 Total
Internal rating grade -
Investment 115,002,758 - - 115,002,758
Standard grade 443,956,581 - 472,288 444,428,868
Non-Investment 1,073,074 - - 1,073,074 Total 560,032,412 - 472,288 560,504,699
stage 1 Stage 2 Stage 3 Total
ECL allowance as at 1 January 2020 94,814 1,879 462,530 559,223
Acquired from business combination -
- Charge for the year 32,915 - 9,757 42,672 Write back - (1,879) - (1,879) At 31 December 2020 127,729 - 472,288 600,016
Bank
Financial instruments at fair value through other comprehensive income
In thousands of Naira
stage 1 Stage 2 Stage 3 Total
Internal rating grade - -
Investment 5,688,871 - - 5,688,871
Standard grade 785,141,261 - - 785,141,261
Non-Investment 4,995,001 - - 4,995,001 Total 795,825,134 - - 795,825,134
stage 1 Stage 2 Stage 3 Total
ECL allowance as at 1 January 2020 63,712 - - 63,712
- Charge for the year 294,277 - - 294,277 At 31 December 2020 357,989 - - 357,989
Financial instruments at amortised cost
In thousands of Naira
stage 1 Stage 2 Stage 3 Total
Internal rating grade
Investment 45,527,717 - - 45,527,716
Standard grade 443,956,581 - 472,288 444,428,868
Non-Investment 1,073,074 - - 1,073,074 Total 490,557,372 - 472,288 491,029,658
stage 1 Stage 2 Stage 3 Total
ECL allowance as at 1 January 2020 69,778 1,879 462,530 534,187
- Charge for the year 8,120 - 9,757 17,877 Write back - (1,879) - (1,879) At 31 December 2020 77,898 - 472,288 550,185
December 2020
194
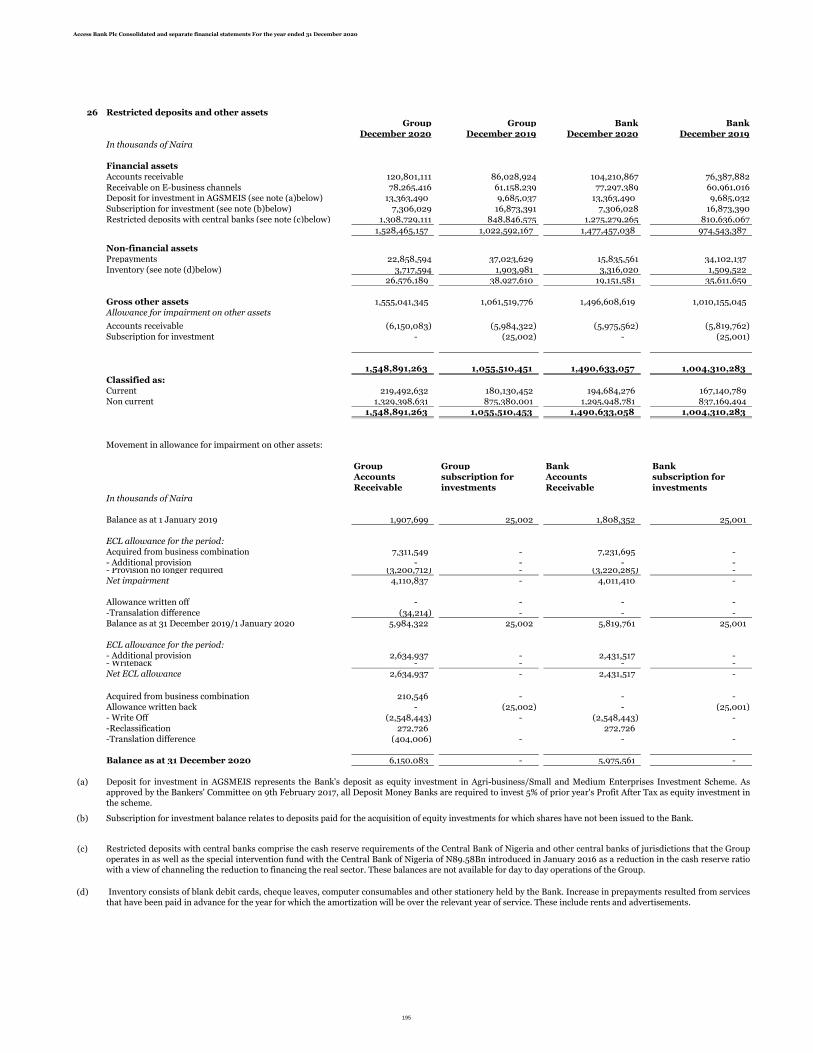
Access Bank Plc Consolidated and separate financial statements For the year ended 31 December 2020
26 Restricted deposits and other assets
Group Group Bank Bank
December 2020 December 2019 December 2020 December 2019
In thousands of Naira
Financial assets
Accounts receivable 120,801,111 86,028,924 104,210,867 76,387,882
Receivable on E-business channels 78,265,416 61,158,239 77,297,389 60,961,016
Deposit for investment in AGSMEIS (see note (a)below) 13,363,490 9,685,037 13,363,490 9,685,032
Subscription for investmentSubscription for investment (see note (b)below) 7,306,029 16,873,391 7,306,028 16,873,390
Restricted deposits with central banksRestricted deposits with central banks (see note (c)below) 1,308,729,111 848,846,575 1,275,279,265 810,636,067
1,528,465,157 1,022,592,167 1,477,457,038 974,543,387
Non-financial assets
Prepayments 22,858,594 37,023,629 15,835,561 34,102,137
InventoryInventory (see note (d)below) 3,717,594 1,903,981 3,316,020 1,509,522
26,576,189 38,927,610 19,151,581 35,611,659
Gross other assets 1,555,041,345 1,061,519,776 1,496,608,619 1,010,155,045
Allowance for impairment on other assets
Accounts receivable (6,150,083) (5,984,322) (5,975,562) (5,819,762)
Subscription for investment - (25,002) - (25,001)
1,548,891,263 1,055,510,451 1,490,633,057 1,004,310,283
Classified as:
Current 219,492,632 180,130,452 194,684,276 167,140,789
Non current 1,329,398,631 875,380,001 1,295,948,781 837,169,494 1,548,891,263 1,055,510,453 1,490,633,058 1,004,310,283
Movement in allowance for impairment on other assets:
Group Group Bank Bank
Accounts subscription for Accounts subscription for
Receivable investments Receivable investments
In thousands of Naira
Balance as at 1 January 2019 1,907,699 25,002 1,808,352 25,001
ECL allowance for the period:
Acquired from business combination 7,311,549 - 7,231,695 -
- Additional provision - - - - - Provision no longer required (3,200,712) - (3,220,285) -
Net impairment 4,110,837 - 4,011,410 -
Allowance written off - - - -
-Transalation difference (34,214) - - -
Balance as at 31 December 2019/1 January 2020 5,984,322 25,002 5,819,761 25,001
ECL allowance for the period:
- Additional provision 2,634,937 - 2,431,517 - - Writeback - - - -
Net ECL allowance 2,634,937 - 2,431,517 -
Acquired from business combination 210,546 - - -
Allowance written back - (25,002) - (25,001)
- Write Off (2,548,443) - (2,548,443) -
-Reclassification 272,726 272,726
-Translation difference (404,006) - - -
Balance as at 31 December 2020 6,150,083 - 5,975,561 -
(a)
(b)
(c)
(d)
Subscription for investment balance relates to deposits paid for the acquisition of equity investments for which shares have not been issued to the Bank.
Deposit for investment in AGSMEIS represents the Bank's deposit as equity investment in Agri-business/Small and Medium Enterprises Investment Scheme. Asapproved by the Bankers' Committee on 9th February 2017, all Deposit Money Banks are required to invest 5% of prior year's Profit After Tax as equity investment inthe scheme.
Restricted deposits with central banks comprise the cash reserve requirements of the Central Bank of Nigeria and other central banks of jurisdictions that the Groupoperates in as well as the special intervention fund with the Central Bank of Nigeria of N89.58Bn introduced in January 2016 as a reduction in the cash reserve ratiowith a view of channeling the reduction to financing the real sector. These balances are not available for day to day operations of the Group.
Inventory consists of blank debit cards, cheque leaves, computer consumables and other stationery held by the Bank. Increase in prepayments resulted from servicesthat have been paid in advance for the year for which the amortization will be over the relevant year of service. These include rents and advertisements.
195

Access Bank Plc Consolidated and separate financial statements For the year ended 31 December 2020
27(a) Subsidiaries (with continuing operations)
(i) Group entities
Access Bank Gambia Limited Banking Gambia 88.00% 88%
Access Bank Sierra Leone Limited Banking Sierra Leone 99.19% 97%
Access Bank Rwanda Limited Banking Rwanda 91.22% 75%
Access Bank Zambia Banking Zambia 70.00% 70%
The Access Bank UK Banking United Kingdom 100.00% 100%
Access Bank R.D. Congo Banking Congo 99.98% 100%
Access Bank Ghana Banking Ghana 93.40% 93%
Access Pension Fund Custodian Custody Nigeria 100.00% 100%
Access Bank Guinea S.A Banking Guinea 100.00% 100%
Access Bank Mozambique Banking Mozambique 99.98% 0%
Access Bank Kenya Banking Kenya 99.98% 0%
(ii) Structured entities:
Nature of business
Country of incorporation
December 2020 December 2019
Restricted Share Performance Plan (RSPP)
Financial services Nigeria 100% 100%
Diamond Finance BV Banking Netherlands 100% 100%
Ownership interest
During the year, the bank branched out to two other countries to further expand its international presence. The Bank obtained theCentral Bank of Mozambique’s approval to setup a subsidiary in the country. The approval was granted on 11th September, 2020 afterprior approval by the Central Bank of Nigeria. The Bank has 99.98% ownership in the subsidiary.
The Bank also acquired Transnational Bank of Kenya during the year now (Access Bank Kenya). The central Bank of Kenya grantedapproval for the acquisition on the 20th July, 2020. The Bank has 99.98% ownership in the subsidiary.
Diamond Finance B.V. is a structured entity, incorporated on former Diamond Bank's behalf by intertrust (a Netherlands corporatefinance company) for the sole purpose of issuing loan participatory notes to interested parties for the purpose of funding asubordinated facility to former Diamond Bank. Access Bank (hereafter known as “The Bank”) has determined that it has control overthe entity due to the power it has to direct relevant activities of the entity. The Bank has no direct holdings in the entity. The formerDiamond Bank issued dollar denominated notes of $50 million (N9.95 billion) through a structured entity, Diamond Finance BV,Netherlands, on 27 March 2014, which is due on 27 March 2021. The principal amount is payable at the end of the tenor which is 7years while interest on the notes is payable semi-annually at 7% per annum. The net proceeds from the issue of the loan participatoryNotes was used by the issuer (Diamond Finance BV) for the sole purpose of providing a loan to former Diamond Bank, which wasused by the erstwhile Diamond Bank to support its business expansion and development. The bank unconditionally and irrevocablyguaranteed the due payment of all sums by the issuer (Diamond Finance BV) in respect of the Notes. This obligation has beentransferred to Access Bank upon the successful completion of the merger between both entities
Set out below are the group's subsidiaries as at 31 December 2020. Unless otherwise stated, the subsidiaries listed below have sharecapital consisting solely of ordinary shares, which are held directly by the group and the proportion of ownership interests held equalsto the voting rights held by the group. The country of incorporation is also their principal place of business.
There are no significant restrictions on the Group’s ability to access or use the assets and settle the liabilities of any member of theGroup to the extent that regulation does not inhibit the group from having access, and in liquidation scenario, this restriction islimited to its level of investment in the entity.There are no significant restrictions on the ability of subsidiaries to transfer funds to the Group in the form of cash dividends orrepayment of loans and advances
Ownership interestNature of business
Country of incorporation
December 2020 December 2019
196

Access Bank Plc Consolidated and separate financial statements For the year ended 31 December 2020
27(b)(i)Investment in subsidiaries
Bank Bank
December 2020 December 2019
In thousands of Naira
Subsidiaries with continuing operations
60,044,822 60,044,822
32,195,607 32,195,607
5,220,925 1,578,825
13,205,190 13,205,190
4,274,925 4,274,923
7,061,501 7,061,501
3,398,136 1,582,486
Access Bank, Guinea 5,441,100 5,441,100
Access Bank, Mozambique 15,309,709 -
Access Bank, Kenya 11,614,775 -
Investment in RSPP scheme 4,484,842 4,074,255
2,000,000 2,000,000
Balance, end of year 164,251,532 131,458,709
Access Bank, Gambia
Access Bank, UK
Access Bank, Ghana
Access Bank Rwanda
Access Bank, Congo
Access Bank, Zambia
Based on the contractual arrangements between the Bank and the shareholders in each of the entities, the Bank has the power toappoint and remove the majority of the board of Directors of each entity.
The relevant activities of each of the listed subsidiaries are determined by the Board of Directors of each entity based on simple majorityshares. Therefore, the directors of the Bank concluded that the Bank has control over each of the above listed entities and wereconsolidated in the Bank financial statements.
Access Bank, Sierra Leone
Access Bank Pension Fund Custodian
All investment in subsidiaries have been classified as non current with a closing balance of N164.25Bn
197
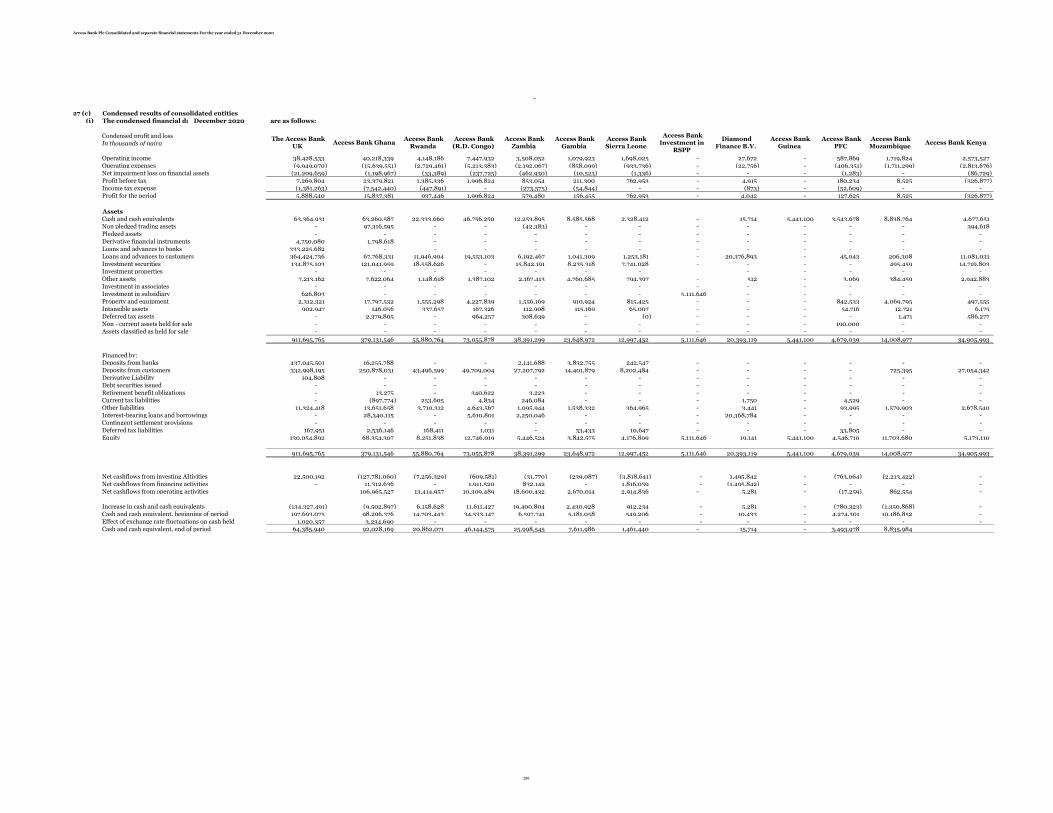
Access Bank Plc Consolidated and separate financial statements For the year ended 31 December 2020
-
27 (c) Condensed results of consolidated entities(i) The condensed financial data of the consolidated entities as at December 2020 are as follows:
Condensed profit and lossIn thousands of naira
Operating income 38,428,533 40,218,339 4,148,186 7,447,932 3,508,052 1,079,923 1,698,025 - 27,672 - 587,869 1,719,824 2,573,527 Operating expenses (9,949,070) (15,639,551) (2,729,461) (5,213,383) (2,192,067) (858,099) (933,736) - (22,756) - (406,351) (1,711,299) (2,813,676) Net impairment loss on financial assets (21,209,659) (1,198,967) (33,389) (237,725) (462,930) (10,523) (1,336) - - - (1,283) - (86,729) Profit before tax 7,269,804 23,379,821 1,385,336 1,996,824 853,054 211,300 762,953 - 4,915 - 180,234 8,525 (326,877) Income tax expense (1,381,263) (7,542,440) (447,891) - (273,575) (54,844) - - (873) - (52,609) - - Profit for the period 5,888,540 15,837,381 937,446 1,996,824 579,480 156,455 762,953 - 4,042 - 127,625 8,525 (326,877)
AssetsCash and cash equivalents 63,364,931 63,260,587 22,333,660 46,756,250 12,253,895 8,585,568 2,328,412 - 15,714 5,441,100 3,543,678 8,838,764 4,677,651 Non pledged trading assets - 97,316,595 - - (42,383) - - - - - - - 394,618 Pledged assets - - - - - - - - - - - - - Derivative financial instruments 4,750,080 1,798,618 - - - - - - - - - - - Loans and advances to banks 333,225,682 - - - - - - - - - - - - Loans and advances to customers 364,424,736 67,768,331 11,946,904 19,553,103 6,192,467 1,041,309 1,253,181 - 20,376,893 - 45,043 206,308 11,081,031 Investment securities 134,875,103 121,041,959 18,558,626 - 15,842,191 8,235,318 7,741,028 - - - - 495,459 14,719,803 Investment properties - - - - - - - - - - - - Other assets 7,213,162 7,622,064 1,148,618 1,387,102 2,167,413 4,760,685 794,397 - 512 - 3,069 384,459 2,942,883 Investment in associates - - - - - - - - - - - - - Investment in subsidiary 626,803 - - - - - - 5,111,646 - - - - - Property and equipment 2,312,321 17,797,532 1,555,298 4,227,839 1,556,169 910,924 815,425 - - - 842,533 4,069,795 497,555 Intangible assets 902,947 146,056 337,657 167,326 112,908 115,169 65,007 - - - 54,716 12,721 6,175 Deferred tax assets - 2,379,805 - 964,257 308,639 - (0) - - - - 1,471 586,277 Non - current assets held for sale - - - - - - - - - - 190,000 - - Assets classified as held for sale - - - - - - - - - - - - -
911,695,765 379,131,546 55,880,764 73,055,878 38,391,299 23,648,972 12,997,452 5,111,646 20,393,119 5,441,100 4,679,039 14,008,977 34,905,993
Financed by:Deposits from banks 437,045,501 16,255,788 - - 2,141,688 3,832,755 242,547 - - - - - - Deposits from customers 332,998,195 250,878,031 43,496,599 49,709,004 27,207,792 14,401,879 8,202,484 - - - - 725,395 27,054,342 Derivative Liability 104,808 - - - - - - - - - - - - Debt securities issued - - - - - - - - - - - - - Retirement benefit obligations - 13,275 - 340,622 3,223 - - - - - - - - Current tax liabilities - (897,774) 253,605 4,834 246,084 - - - 1,750 - 4,529 - - Other liabilities 11,324,418 13,651,658 3,710,312 4,643,567 1,095,944 1,538,332 364,965 - 3,441 - 93,995 1,579,903 2,678,540 Interest-bearing loans and borrowings - 28,340,115 - 5,610,801 2,250,046 - - - 20,368,784 - - - - Contingent settlement provisions - - - - - - - - - - - - - Deferred tax liabilities 167,951 2,536,146 168,411 1,031 - 33,433 10,647 - - - 33,805 - - Equity 130,054,892 68,354,307 8,251,838 12,746,019 5,446,524 3,842,575 4,176,809 5,111,646 19,141 5,441,100 4,546,710 11,703,680 5,173,110
911,695,765 379,131,546 55,880,764 73,055,878 38,391,299 23,648,972 12,997,452 5,111,646 20,393,119 5,441,100 4,679,039 14,008,977 34,905,993
Net cashflows from investing AItivities 22,500,192 (127,781,060) (7,256,329) (609,581) (31,770) (239,087) (3,818,641) - 1,495,842 - (763,064) (2,213,422) - Net cashflows from financing activities - 11,312,636 - 1,911,520 832,142 - 1,816,039 - (1,495,842) - - - - Net cashflows from operating activities 106,965,527 13,414,957 10,309,489 18,600,432 2,670,014 2,914,836 - 5,281 - (17,259) 862,554 -
Increase in cash and cash equivalents (134,327,491) (9,502,897) 6,158,628 11,611,427 19,400,804 2,430,928 912,234 - 5,281 - (780,323) (1,350,868) - Cash and cash equivalent, beginning of period 197,693,075 98,296,376 14,703,443 34,533,147 6,597,741 5,181,058 549,206 - 10,433 - 4,274,301 10,186,852 - Effect of exchange rate fluctuations on cash held 1,020,357 3,234,690 - - - - - - - - - - - Cash and cash equivalent, end of period 64,385,940 92,028,169 20,862,071 46,144,575 25,998,545 7,611,986 1,461,440 - 15,714 - 3,493,978 8,835,984
Access Bank Sierra Leone
Access Bank Investment in
RSPP
Diamond Finance B.V.
Access Bank Gambia
The Access Bank UK
Access Bank Ghana Access Bank
Rwanda Access Bank (R.D. Congo)
Access Bank Zambia
Access Bank PFC
Access Bank Guinea
Access Bank Mozambique
Access Bank Kenya
198
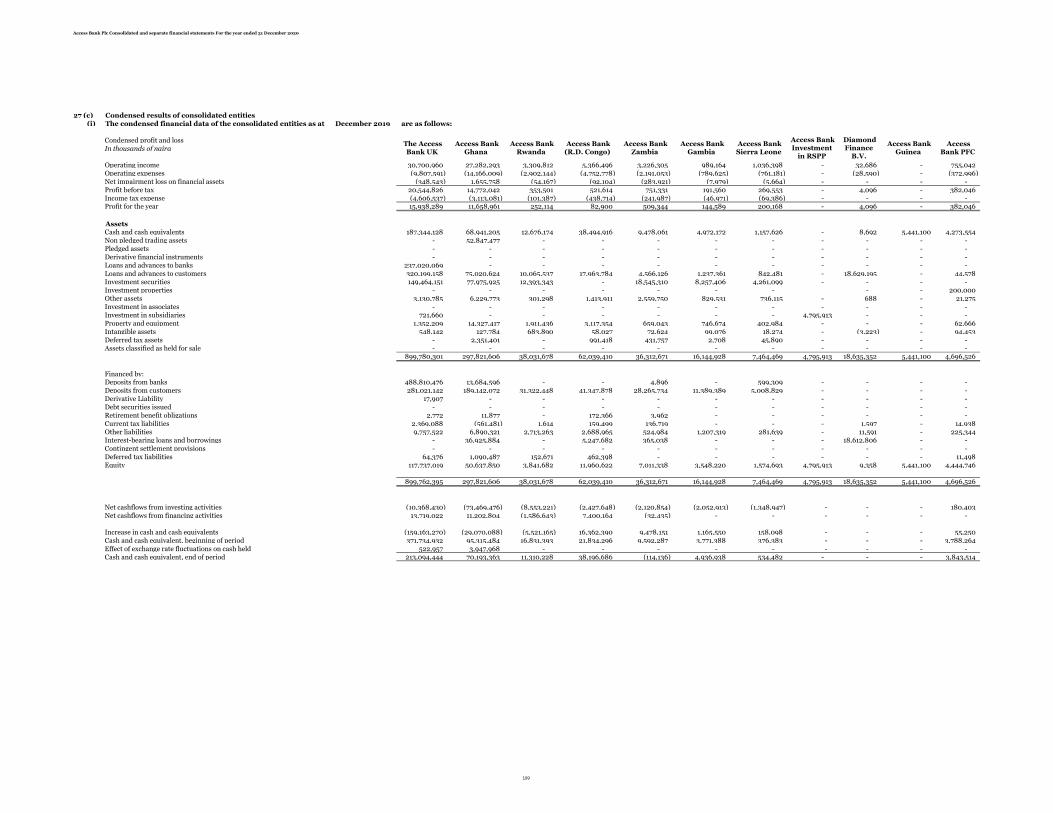
Access Bank Plc Consolidated and separate financial statements For the year ended 31 December 2020
27 (c) Condensed results of consolidated entities(i) The condensed financial data of the consolidated entities as at December 2019 are as follows:
Condensed profit and lossIn thousands of naira
Operating income 30,700,960 27,282,293 3,309,812 5,366,496 3,226,305 989,164 1,036,398 - 32,686 - 755,042 Operating expenses (9,807,591) (14,166,009) (2,902,144) (4,752,778) (2,191,053) (789,625) (761,181) - (28,590) - (372,996) Net impairment loss on financial assets (348,543) 1,655,758 (54,167) (92,104) (283,921) (7,979) (5,664) - - - - Profit before tax 20,544,826 14,772,042 353,501 521,614 751,331 191,560 269,553 - 4,096 - 382,046 Income tax expense (4,606,537) (3,113,081) (101,387) (438,714) (241,987) (46,971) (69,386) - - - - Profit for the year 15,938,289 11,658,961 252,114 82,900 509,344 144,589 200,168 - 4,096 - 382,046
AssetsCash and cash equivalents 187,344,128 68,941,205 12,676,174 38,494,916 9,478,061 4,972,172 1,157,626 - 8,692 5,441,100 4,273,554 Non pledged trading assets - 52,847,477 - - - - - - - - - Pledged assets - - - - - - - - - - - Derivative financial instruments - - - - - - - - - - - Loans and advances to banks 237,020,069 - - - - - - - - - - Loans and advances to customers 320,199,158 75,020,624 10,065,537 17,963,784 4,566,126 1,237,361 842,481 - 18,629,195 - 44,578 Investment securities 149,464,151 77,975,925 12,393,343 - 18,545,310 8,257,406 4,261,099 - - - - Investment properties - - - - - - - - - 200,000 Other assets 3,130,785 6,229,773 301,298 1,413,911 2,559,750 829,531 736,115 - 688 - 21,275 Investment in associates - - - - - - - - - - - Investment in subsidiaries 721,660 - - - - - - 4,795,913 - - - Property and equipment 1,352,209 14,327,417 1,911,436 3,117,354 659,043 746,674 402,984 - - - 62,666 Intangible assets 548,142 127,784 683,890 58,027 72,624 99,076 18,274 - (3,223) - 94,453 Deferred tax assets - 2,351,401 - 991,418 431,757 2,708 45,890 - - - - Assets classified as held for sale - - - - - - - - - - -
899,780,301 297,821,606 38,031,678 62,039,410 36,312,671 16,144,928 7,464,469 4,795,913 18,635,352 5,441,100 4,696,526
Financed by:Deposits from banks 488,810,476 13,684,596 - - 4,896 - 599,309 - - - - Deposits from customers 281,021,142 189,142,072 31,322,448 41,347,878 28,265,734 11,389,389 5,008,829 - - - - Derivative Liability 17,907 - - - - - - - - - - Debt securities issued - - - - - - - - - - - Retirement benefit obligations 2,772 11,877 - 172,366 3,962 - - - - - - Current tax liabilities 2,369,088 (561,481) 1,614 159,499 136,719 - - - 1,597 - 14,938 Other liabilities 9,757,522 6,890,321 2,713,263 2,688,965 524,984 1,207,319 281,639 - 11,591 - 225,344 Interest-bearing loans and borrowings - 36,925,884 - 5,247,682 365,038 - - - 18,612,806 - - Contingent settlement provisions - - - - - - - - - - - Deferred tax liabilities 64,376 1,090,487 152,671 462,398 - - - - - - 11,498 Equity 117,737,019 50,637,850 3,841,682 11,960,622 7,011,338 3,548,220 1,574,693 4,795,913 9,358 5,441,100 4,444,746
899,762,395 297,821,606 38,031,678 62,039,410 36,312,671 16,144,928 7,464,469 4,795,913 18,635,352 5,441,100 4,696,526
Net cashflows from investing activities (10,368,430) (73,469,476) (8,553,221) (2,427,648) (2,120,854) (2,052,913) (1,348,947) - - - 180,403 Net cashflows from financing activities 13,719,022 11,202,804 (1,586,643) 7,400,164 (32,435) - - - - - -
Increase in cash and cash equivalents (159,163,270) (29,070,088) (5,521,165) 16,362,390 9,478,151 1,165,550 158,098 - - - 55,250 Cash and cash equivalent, beginning of period 371,734,932 95,315,484 16,831,393 21,834,296 9,592,287 3,771,388 376,383 - - - 3,788,264 Effect of exchange rate fluctuations on cash held 522,957 3,947,968 - - - - - - - - - Cash and cash equivalent, end of period 213,094,444 70,193,363 11,310,228 38,196,686 (114,136) 4,936,938 534,482 - - - 3,843,514
The Access Bank UK
Access Bank Ghana
Access Bank Rwanda
Access Bank (R.D. Congo)
Access Bank Zambia
Access Bank Guinea
Access Bank PFC
Access Bank Gambia
Access Bank Sierra Leone
Access Bank Investment
in RSPP
Diamond Finance
B.V.
199
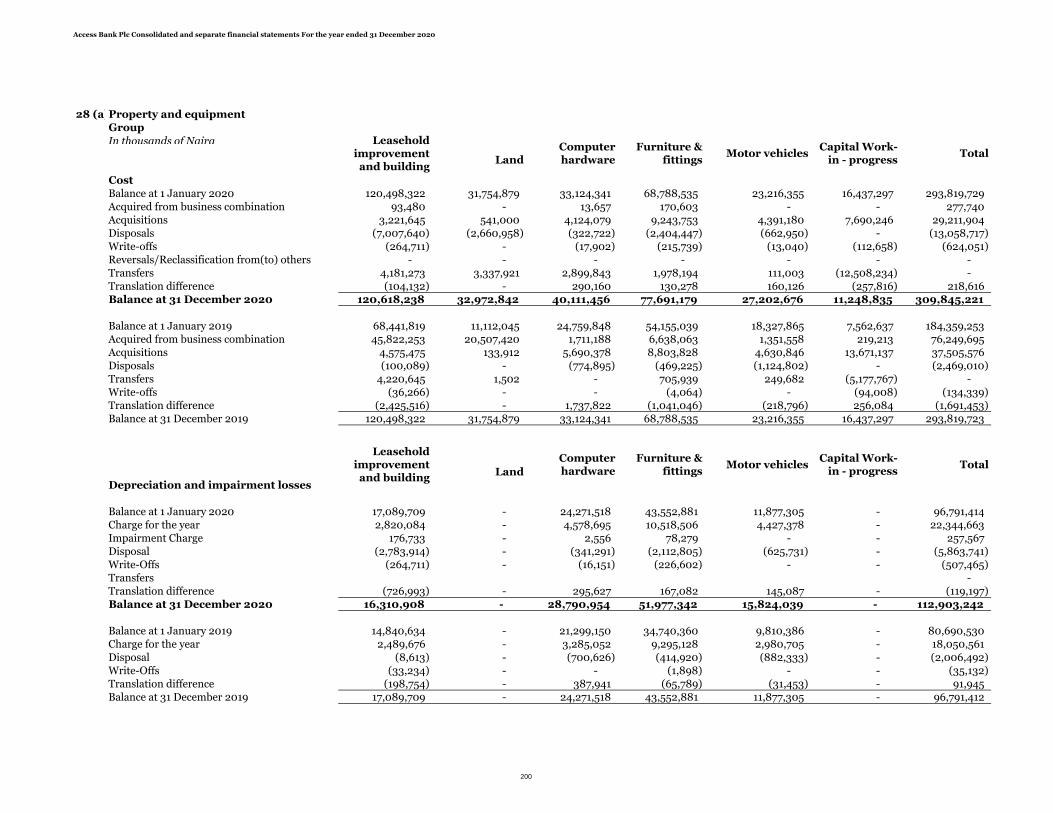
Access Bank Plc Consolidated and separate financial statements For the year ended 31 December 2020
28 (a)Property and equipment
Group
In thousands of Naira
Cost
Balance at 1 January 2020 120,498,322 31,754,879 33,124,341 68,788,535 23,216,355 16,437,297 293,819,729
Acquired from business combination 93,480 - 13,657 170,603 - - 277,740
Acquisitions 3,221,645 541,000 4,124,079 9,243,753 4,391,180 7,690,246 29,211,904
Disposals (7,007,640) (2,660,958) (322,722) (2,404,447) (662,950) - (13,058,717)
Write-offs (264,711) - (17,902) (215,739) (13,040) (112,658) (624,051)
Reversals/Reclassification from(to) others - - - - - - -
Transfers 4,181,273 3,337,921 2,899,843 1,978,194 111,003 (12,508,234) -
Translation difference (104,132) - 290,160 130,278 160,126 (257,816) 218,616
Balance at 31 December 2020 120,618,238 32,972,842 40,111,456 77,691,179 27,202,676 11,248,835 309,845,221
Balance at 1 January 2019 68,441,819 11,112,045 24,759,848 54,155,039 18,327,865 7,562,637 184,359,253
Acquired from business combination 45,822,253 20,507,420 1,711,188 6,638,063 1,351,558 219,213 76,249,695
Acquisitions 4,575,475 133,912 5,690,378 8,803,828 4,630,846 13,671,137 37,505,576
Disposals (100,089) - (774,895) (469,225) (1,124,802) - (2,469,010)
Transfers 4,220,645 1,502 - 705,939 249,682 (5,177,767) -
Write-offs (36,266) - - (4,064) - (94,008) (134,339)
Translation difference (2,425,516) - 1,737,822 (1,041,046) (218,796) 256,084 (1,691,453)
Balance at 31 December 2019 120,498,322 31,754,879 33,124,341 68,788,535 23,216,355 16,437,297 293,819,723
Land
Depreciation and impairment losses
Balance at 1 January 2020 17,089,709 - 24,271,518 43,552,881 11,877,305 - 96,791,414
Charge for the year 2,820,084 - 4,578,695 10,518,506 4,427,378 - 22,344,663
Impairment Charge 176,733 - 2,556 78,279 - - 257,567
Disposal (2,783,914) - (341,291) (2,112,805) (625,731) - (5,863,741)
Write-Offs (264,711) - (16,151) (226,602) - - (507,465)
Transfers -
Translation difference (726,993) - 295,627 167,082 145,087 - (119,197)
Balance at 31 December 2020 16,310,908 - 28,790,954 51,977,342 15,824,039 - 112,903,242
Balance at 1 January 2019 14,840,634 - 21,299,150 34,740,360 9,810,386 - 80,690,530
Charge for the year 2,489,676 - 3,285,052 9,295,128 2,980,705 - 18,050,561
Disposal (8,613) - (700,626) (414,920) (882,333) - (2,006,492)
Write-Offs (33,234) - - (1,898) - - (35,132)
Translation difference (198,754) - 387,941 (65,789) (31,453) - 91,945
Balance at 31 December 2019 17,089,709 - 24,271,518 43,552,881 11,877,305 - 96,791,412
Total
Leasehold improvement and building
Computer hardware
Furniture & fittings
Motor vehiclesCapital Work-
in - progressTotal
Leasehold improvement and building
Computer hardware
Furniture & fittings
Motor vehiclesCapital Work-
in - progress
Land
200
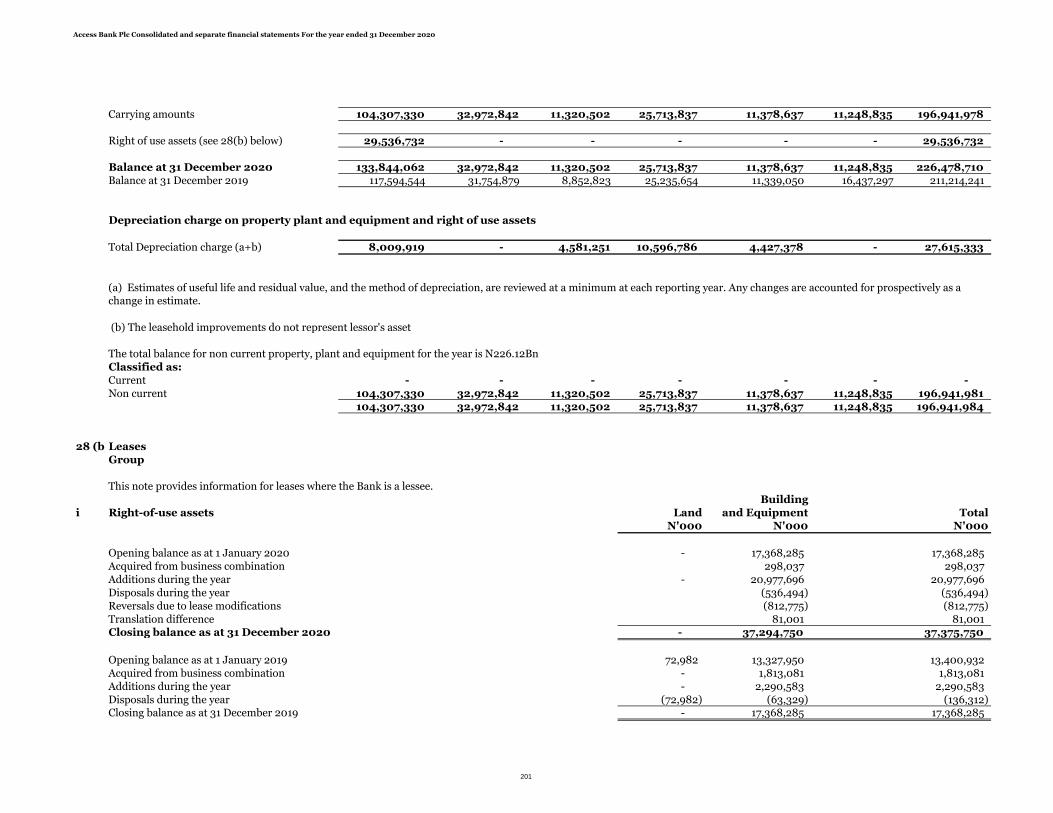
Access Bank Plc Consolidated and separate financial statements For the year ended 31 December 2020
Carrying amounts 104,307,330 32,972,842 11,320,502 25,713,837 11,378,637 11,248,835 196,941,978
Right of use assets (see 28(b) below) 29,536,732 - - - - - 29,536,732
Balance at 31 December 2020 133,844,062 32,972,842 11,320,502 25,713,837 11,378,637 11,248,835 226,478,710
Balance at 31 December 2019 117,594,544 31,754,879 8,852,823 25,235,654 11,339,050 16,437,297 211,214,241
Depreciation charge on property plant and equipment and right of use assets
Total Depreciation charge (a+b) 8,009,919 - 4,581,251 10,596,786 4,427,378 - 27,615,333
The total balance for non current property, plant and equipment for the year is N226.12Bn
Classified as:
Current - - - - - - -
Non current 104,307,330 32,972,842 11,320,502 25,713,837 11,378,637 11,248,835 196,941,981
104,307,330 32,972,842 11,320,502 25,713,837 11,378,637 11,248,835 196,941,984
28 (b)Leases
Group
This note provides information for leases where the Bank is a lessee.
Building
i Right-of-use assets Land and Equipment TotalN'000 N'000 N'000
Opening balance as at 1 January 2020 - 17,368,285 17,368,285
Acquired from business combination 298,037 298,037
Additions during the year - 20,977,696 20,977,696
Disposals during the year (536,494) (536,494)
Reversals due to lease modifications (812,775) (812,775)
Translation difference 81,001 81,001 Closing balance as at 31 December 2020 - 37,294,750 37,375,750
Opening balance as at 1 January 2019 72,982 13,327,950 13,400,932
Acquired from business combination - 1,813,081 1,813,081
Additions during the year - 2,290,583 2,290,583
Disposals during the year (72,982) (63,329) (136,312) Closing balance as at 31 December 2019 - 17,368,285 17,368,285
(a) Estimates of useful life and residual value, and the method of depreciation, are reviewed at a minimum at each reporting year. Any changes are accounted for prospectively as a change in estimate.
(b) The leasehold improvements do not represent lessor's asset
201

Access Bank Plc Consolidated and separate financial statements For the year ended 31 December 2020
Depreciation
Opening balance as at 1 January 2020 - 3,182,353 3,182,353
Charge for the year - 5,013,103 5,013,103
Disposals during the year - (173,519) (173,519)
Reversals due to lease modifications - (290,336) (290,336)
Translation difference 107,416 107,416
Closing balance as at 31 December 2020 - 7,839,017 7,839,017
Net book value as at 31 December 2020- 29,455,733 29,536,732
Opening balance as at 1 January 2019 - - -
Charge for the year - 3,182,353 3,182,353
Closing balance as at 31 December 2019 - 3,182,353 3,182,353
Net book value as at 31 December 2019 - 14,185,932 14,185,932
ii Amounts recognised in the statement of profit or loss
N'000Depreciation charge of right-of-use assets 5,013,103
Interest expense (included in finance cost) 922,385
Expense relating to short-term leases (included in administrative expenses) 586,791
Expense relating to leases of low-value assets (included in administrative expenses) -
933,650,433 The total cash outflow for leases as at December 2020 was N933 million
202

Access Bank Plc Consolidated and separate financial statements For the year ended 31 December 2020
28 (c) Property and equipment
BankLand
Cost
Balance at 1 January 2020 107,059,493 31,754,881 27,882,783 62,718,894 20,731,505 13,779,249 263,926,805
Acquisitions 766,703 - 3,090,823 8,589,782 4,029,803 4,728,258 21,205,368
Disposals (6,988,740) (2,660,958) (307,876) (2,390,296) (596,542) - (12,944,412)
Reclassification 4,022,131 3,337,921 2,615,233 1,646,969 111,003 (11,733,257) 0
Reversals/Reclassification from(to) others - - - - - - -
Write-Offs (201,103) - (7,429) (210,635) - (46,292) (465,460)
Balance at 31 December 2020 104,658,484 32,431,843 33,273,534 70,354,715 24,275,769 6,727,957 271,722,299
Balance at 1 January 2019 55,008,145 11,112,047 22,322,764 47,436,345 15,853,637 6,119,044 157,851,983
Acquired from business combination 45,822,154 20,507,420 1,679,978 6,628,694 1,322,361 219,213 76,179,821
Acquisitions 3,529,489 133,912 4,572,215 8,480,739 4,361,880 11,181,145 32,259,378
Disposals (98,889) - (692,174) (437,712) (1,041,595) - (2,270,370)
Transfers 2,798,592 1,502 - 610,828 235,222 (3,646,145) -
Write-Offs - - - - - (94,008) (94,008)
Balance at 31 December 2019 107,059,493 31,754,881 27,882,783 62,718,894 20,731,505 13,779,249 263,926,802
Leasehold Capital
improvement Land Computer Furniture & Motor work-in Total
Depreciation and impairment losses and buildings hardware fittings vehicles - progress
Balance at 1 January 2020 13,975,776 - 19,838,724 38,999,208 10,507,905 - 83,321,614
Charge for the year (a) 2,147,377 - 3,790,037 9,717,062 4,099,496 - 19,753,972
Impairment charge 176,733 - 2,556 78,279 - - 257,567
Disposal (1,119,837) - (307,239) (2,098,804) (517,539) - (4,043,418)
Reclassifications - -
Write Off (201,103) - (7,429) (210,635) - - (419,168)
Balance at 31 December 2020 14,978,946 - 23,316,649 46,485,110 14,089,862 - 98,870,568
Balance at 1 January 2019 12,223,170 - 17,890,242 30,766,704 8,579,321 - 69,459,438
Charge for the year 1,761,219 - 2,637,675 8,642,337 2,636,135 - 15,677,366
Disposal (8,613) - (689,192) (409,833) (707,551) - (1,815,189)
Balance at 31 December 2019 13,975,776 - 19,838,724 38,999,208 10,507,905 - 83,321,614
Carrying amounts 89,679,539 32,431,843 9,956,885 23,869,605 10,185,907 6,727,957 172,851,736
Right of use assets (see 28(d) below) 19,041,585 - - - - - 19,041,585
Balance at 31 December 2020 89,679,539 32,431,843 9,956,885 23,869,605 10,185,907 6,727,957 191,893,321
Balance at 31 December 2019 93,083,717 31,754,881 8,044,058 23,719,687 10,223,601 13,779,249 188,634,458
Total
In thousands of Naira
Leasehold improvement and buildings
Computer hardware Furniture & fittings Motor vehicles Capital work-in - progress
203
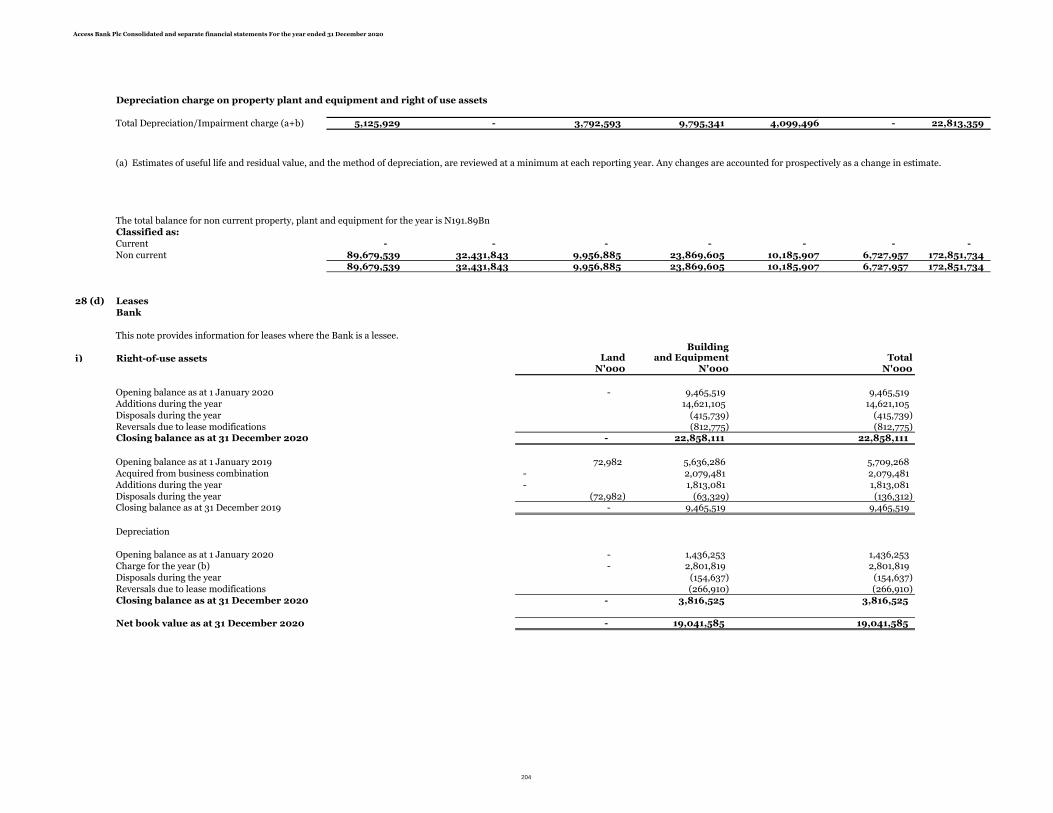
Access Bank Plc Consolidated and separate financial statements For the year ended 31 December 2020
Depreciation charge on property plant and equipment and right of use assets
Total Depreciation/Impairment charge (a+b) 5,125,929 - 3,792,593 9,795,341 4,099,496 - 22,813,359
The total balance for non current property, plant and equipment for the year is N191.89Bn
Classified as:
Current - - - - - - -
Non current 89,679,539 32,431,843 9,956,885 23,869,605 10,185,907 6,727,957 172,851,734
89,679,539 32,431,843 9,956,885 23,869,605 10,185,907 6,727,957 172,851,734
28 (d) Leases
Bank
This note provides information for leases where the Bank is a lessee.
Building
i) Right-of-use assets Land and Equipment TotalN'000 N'000 N'000
Opening balance as at 1 January 2020 - 9,465,519 9,465,519
Additions during the year 14,621,105 14,621,105
Disposals during the year (415,739) (415,739)
Reversals due to lease modifications (812,775) (812,775) Closing balance as at 31 December 2020 - 22,858,111 22,858,111
Opening balance as at 1 January 2019 72,982 5,636,286 5,709,268
Acquired from business combination - 2,079,481 2,079,481
Additions during the year - 1,813,081 1,813,081
Disposals during the year (72,982) (63,329) (136,312) Closing balance as at 31 December 2019 - 9,465,519 9,465,519
Depreciation
Opening balance as at 1 January 2020 - 1,436,253 1,436,253
Charge for the year (b) - 2,801,819 2,801,819
Disposals during the year (154,637) (154,637)
Reversals due to lease modifications (266,910) (266,910)
Closing balance as at 31 December 2020 - 3,816,525 3,816,525
Net book value as at 31 December 2020 - 19,041,585 19,041,585
(a) Estimates of useful life and residual value, and the method of depreciation, are reviewed at a minimum at each reporting year. Any changes are accounted for prospectively as a change in estimate.
204

Access Bank Plc Consolidated and separate financial statements For the year ended 31 December 2020
Opening balance as at 1 January 2019 - - -
Charge for the year (b) - 1,436,253 1,436,253
Closing balance as at 31 December 2019 - 1,436,253 1,436,253
Net book value as at 31 December 2019 - 8,029,266 8,029,266
ii) Amounts recognised in the statement of profit or loss
N'000
Depreciation charge of right-of-use assets (buildings) 2,801,819
Interest expense (included in finance cost) 851,155
Expense relating to short-term leases (included in administrative expenses) 586,791
Expense relating to leases of low-value assets (included in administrative expenses) -
926,934,619 The total cash outflow for leases as at December 2020 was N927 million.
205
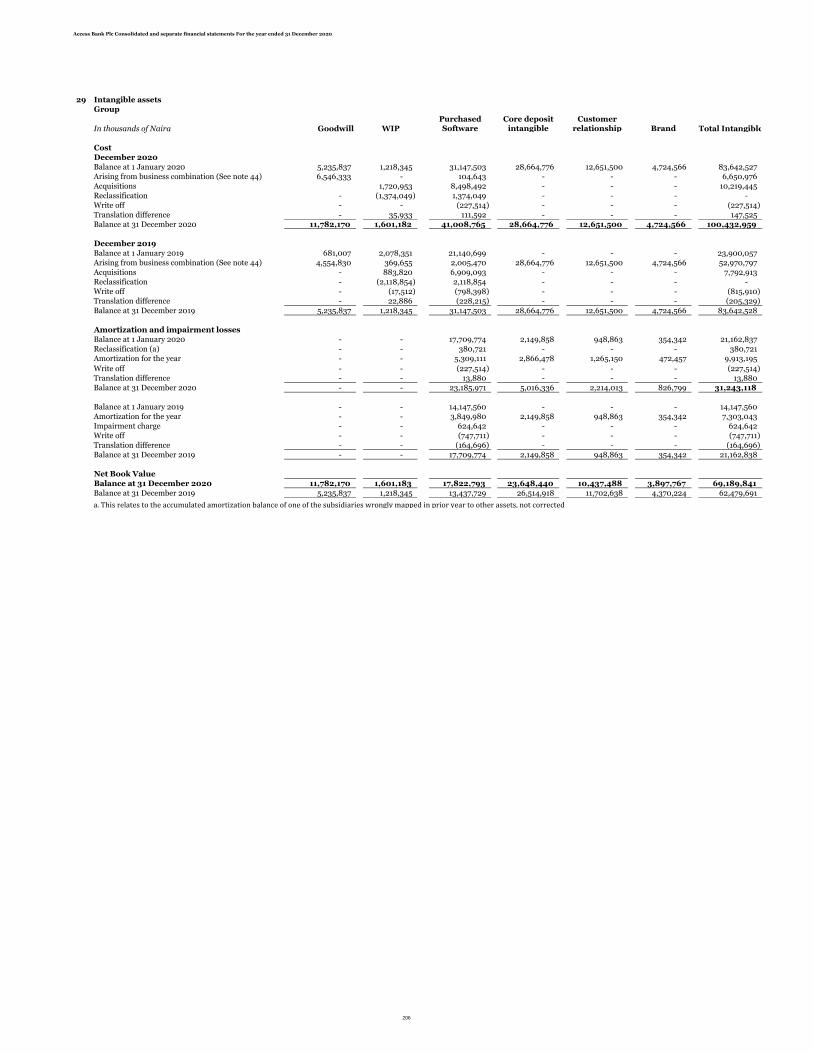
Access Bank Plc Consolidated and separate financial statements For the year ended 31 December 2020
29 Intangible assets
Group
In thousands of Naira Goodwill WIP
Purchased Software
Core deposit intangible
Customer relationship Brand Total Intangible
Cost
December 2020
Balance at 1 January 2020 5,235,837 1,218,345 31,147,503 28,664,776 12,651,500 4,724,566 83,642,527
Arising from business combination (See note 44) 6,546,333 - 104,643 - - - 6,650,976
Acquisitions 1,720,953 8,498,492 - - - 10,219,445
Reclassification - (1,374,049) 1,374,049 - - - -
Write off - - (227,514) - - - (227,514)
Translation difference - 35,933 111,592 - - - 147,525
Balance at 31 December 2020 11,782,170 1,601,182 41,008,765 28,664,776 12,651,500 4,724,566 100,432,959
December 2019
Balance at 1 January 2019 681,007 2,078,351 21,140,699 - - - 23,900,057
Arising from business combination (See note 44) 4,554,830 369,655 2,005,470 28,664,776 12,651,500 4,724,566 52,970,797
Acquisitions - 883,820 6,909,093 - - - 7,792,913
Reclassification - (2,118,854) 2,118,854 - - - -
Write off - (17,512) (798,398) - - - (815,910)
Translation difference - 22,886 (228,215) - - - (205,329)
Balance at 31 December 2019 5,235,837 1,218,345 31,147,503 28,664,776 12,651,500 4,724,566 83,642,528
Amortization and impairment losses
Balance at 1 January 2020 - - 17,709,774 2,149,858 948,863 354,342 21,162,837
Reclassification (a) - - 380,721 - - - 380,721
Amortization for the year - - 5,309,111 2,866,478 1,265,150 472,457 9,913,195
Write off - - (227,514) - - - (227,514)
Translation difference - - 13,880 - - - 13,880
Balance at 31 December 2020 - - 23,185,971 5,016,336 2,214,013 826,799 31,243,118
Balance at 1 January 2019 - - 14,147,560 - - - 14,147,560
Amortization for the year - - 3,849,980 2,149,858 948,863 354,342 7,303,043
Impairment charge - - 624,642 - - - 624,642
Write off - - (747,711) - - - (747,711)
Translation difference - - (164,696) - - - (164,696)
Balance at 31 December 2019 - - 17,709,774 2,149,858 948,863 354,342 21,162,838
Net Book Value
Balance at 31 December 2020 11,782,170 1,601,183 17,822,793 23,648,440 10,437,488 3,897,767 69,189,841
Balance at 31 December 2019 5,235,837 1,218,345 13,437,729 26,514,918 11,702,638 4,370,224 62,479,691
a. This relates to the accumulated amortization balance of one of the subsidiaries wrongly mapped in prior year to other assets, not corrected
206

Access Bank Plc Consolidated and separate financial statements For the year ended 31 December 2020
Intangible assets
Bank
Goodwill WIP
Purchased Software
Core deposit intangible
Customer relationship Brand Total
In thousands of Naira
Cost
December 2020
Balance at 1 January 2020 11,148,311 1,201,540 27,324,333 28,664,776 12,651,500 4,724,566 85,715,026
Acquisitions - 1,285,545 7,905,935 - - - 9,191,480 Reclassification - (1,374,049) 1,374,049 -
Balance at 31 December 2020 11,148,311 1,113,037 36,604,318 28,664,776 12,651,500 4,724,566 94,906,506
December 2019
Balance at 1 January 2019 - 2,269,477 17,391,856 - - - 19,661,334
Arising from business combination (See note 44) 11,148,311 369,655 1,940,710 28,664,776 12,651,500 4,724,566 59,499,518
Acquisitions - 669,088 6,601,488 - - - 7,270,576
Reclassification - (2,106,680) 2,106,680 - - - -
Write off - - (716,401) - - - (716,401)
Balance at 31 December 2019 11,148,311 1,201,540 27,324,333 28,664,776 12,651,500 4,724,566 85,715,027
Amortization and impairment losses
Balance at 1 January 2020 - - 14,711,295 2,149,858 948,863 354,342 18,164,359
Amortization for the year - - 4,641,986 2,866,478 1,265,150 472,457 9,246,070
Balance at 31 December 2020 - - 19,353,280 5,016,336 2,214,013 826,798 27,410,428
Balance at 1 January 2019 - - 11,430,134 - - - 11,430,134
Amortization for the year - - 3,363,413 2,149,858 948,863 354,342 6,816,476
Write off - - (706,893) - - - (706,893)
Impairment charge - - 624,642 - - - 624,642
Balance at 31 December 2019 - - 14,711,295 2,149,858 948,863 354,342 18,164,359
Carrying amounts
Balance at 31 December 2020 11,148,311 1,113,037 17,251,036 23,648,440 10,437,487 3,897,768 67,496,078
Balance at 31 December 2019 11,148,311 1,201,540 12,613,038 26,514,918 11,702,637 4,370,224 67,550,668
Amortization method used is straight line.
Group Group Bank Bank
December 2020 December 2019 December 2020 December 2019
Classified as:
Current - - - -
Non current 69,189,841 62,479,691 67,496,078 67,550,668
207

Access Bank Plc Consolidated and separate financial statements For the year ended 31 December 2020
29(b) Intangible assets
(i) Goodwill is attributable to the acquisition of Diamond Bank Plc and the following subsidiaries:
Group Group Bank Bank
December 2020 December 2019 December 2020 December 2019
In thousands of Naira
Diamond Bank Plc (see (a) below) 4,554,830 4,554,830 11,148,311 11,148,311
Access Bank Rwanda (see (b) below) 681,007 681,007 - -
Access Bank Kenya (see (c) below) 6,546,333 - - - 11,782,170 5,235,837 11,148,311 11,148,311
(a) Diamond bank:
The key assumption used in computing the value-in-use for goodwill in during the year are as follows:
Compound annual volume growth (i) 2.00%
Long term growth rate (ii) 1.07%
Discount rate (ii) 13.65%
(i) Compound annual volume growth rate in the initial five-year period.
(ii) Weighted average growth rate used to extrapolate cash flows beyond the budget year.
(iii) Pre-tax discount rate applied to the cash flow projections.
Cash Flow Forecast
Discount Rate
Long-term growth rate
Sensitivity analysis of key assumptions used10% 10%
increase decrease
Impact of change in discount rate on value-in-use computation (27,057,279) 33,643,882
Impact of change in growth rate on value-in-use computation 2,062,804 (2,049,618)
(b) Access Bank Rwanda:
The key assumption used in computing the value-in-use for goodwill in during the year are as follows:
December 2020
Compound annual volume growth (i) 2.47%
Long term growth rate (ii) 2.47%
Discount rate (iii) 24.8%
(i) Compound annual volume growth rate in the initial four-year period.
(ii) Weighted average growth rate used to extrapolate cash flows beyond the budget year.
(iii) Pre-tax discount rate applied to the cash flow projections.
The recoverable amount of Goodwill as at 31 December 2020 is greater than its carrying amount and is thus not impaired. The recoverable amount wasdetermined using a value-in-use computation as N777bn
Cash flows were projected based on past experience, actual operating results and the 5-year business plan. These cashflows are based on the expectedrevenue growth for the entity over this 5-year period.
Pre-tax discount rate of 13.65% was applied in determining the recoverable amounts for Diamond Bank Plc. This discount rate was estimated using the risk-free rate and the country risk premium for Nigeria.
The long term growth rate applied was based on the long term growth rate in GDP of Nigeria.
The key assumptions described above may change as economic and market conditions change. The Group estimates that reasonably possible changes inthese assumptions are not expected to cause the recoverable amount of the entity (from which the goodwill arose) to decline below their carrying amount.
Goodwill is monitored by the Group on cash generating units (CGU) basis. The CGU's are Corporate & Investment Banking, Commercial Banking, BusinessBanking and Personal Banking.
Goodwill is reviewed annually for impairment, or more frequently when there are indications that impairment may have occurred. Impairment assessmenthas been performed for the year and no losses on goodwill were recognized as at 31 December 2020 (31 December 2019: Nil)
Goodwill impairment test was done by comparing the value-in-use for each group of CGUs to the carrying amount of the goodwill based on discounted cashflow projections. Cash flows were projected for the first 5 years based on operating results, expected future financial performance and past experience.Beyond 5 years, cash flows were assumed to grow at terminal growth rate of of 1.07%. A discount rate of 13.65% was applied based on estimate of cost ofcapital. This was estimated using the Capital Asset Pricing Model. There were no write-downs of goodwill due to impairment during the period. Allassumptions are subject to market and economic conditions. However, we do not see possible changes in these assumptions adversely causing therecoverable amounts of the CGU’s declining below their carrying amounts.
There were no write-downs of goodwill due to impairment during the year
208

Access Bank Plc Consolidated and separate financial statements For the year ended 31 December 2020
Cash Flow Forecast
Discount Rate
Long-term growth rate
Sensitivity analysis of key assumptions used10% 10%
increase decrease
Impact of change in discount rate on value-in-use computation 2,243,960 2,488,694
Impact of change in growth rate on value-in-use computation 837,343 818,279
(c) Access bank Kenya:
Discount Rate for Deferred consideration
The goodwill is reviewed annually for impairment, or more frequently when there are indications that impairment may have occurred. The Goodwill as at 31 December 2020 has only recently been acquired with acquisition date of 20 July 2020 hence is not due for impairment until after a period of a year hence no impairment assessment has been performed on the acquired goodwill for the year. The deferred consideration amount has been recognized at its present value using a discount rate of 4.24%.
The goodwill N6.5Bn arising from the acquisition of Transnational Bank Kenya (now Access Bank Kenya) is provisional
The deferred consideration considered in the goodwill computation has been carried at its present value using a discount rate of 4.24% . This discount rate was estimated using a financial instrument close to cash in liquidity and the country risk premium for Kenya.
Cash flows were projected based on past experience, actual operating results and the 4-year business plan. These cashflows are based on the expectedrevenue growth for the entity over this 4-year period.
Pre-tax discount rate of 24.80% was applied in determining the recoverable amounts for the only entity with goodwill (Access Bank Rwanda). This discountrate was estimated using the risk-free rate and the country risk premium for Rwanda.
The long term growth rate applied was based on the long term growth rate in GDP of Rwanda
The key assumptions described above may change as economic and market conditions change. The Group estimates that reasonably possible changes inthese assumptions are not expected to cause the recoverable amount of the subsidiaries (from which the goodwill arose) to decline below their carryingamount.
209
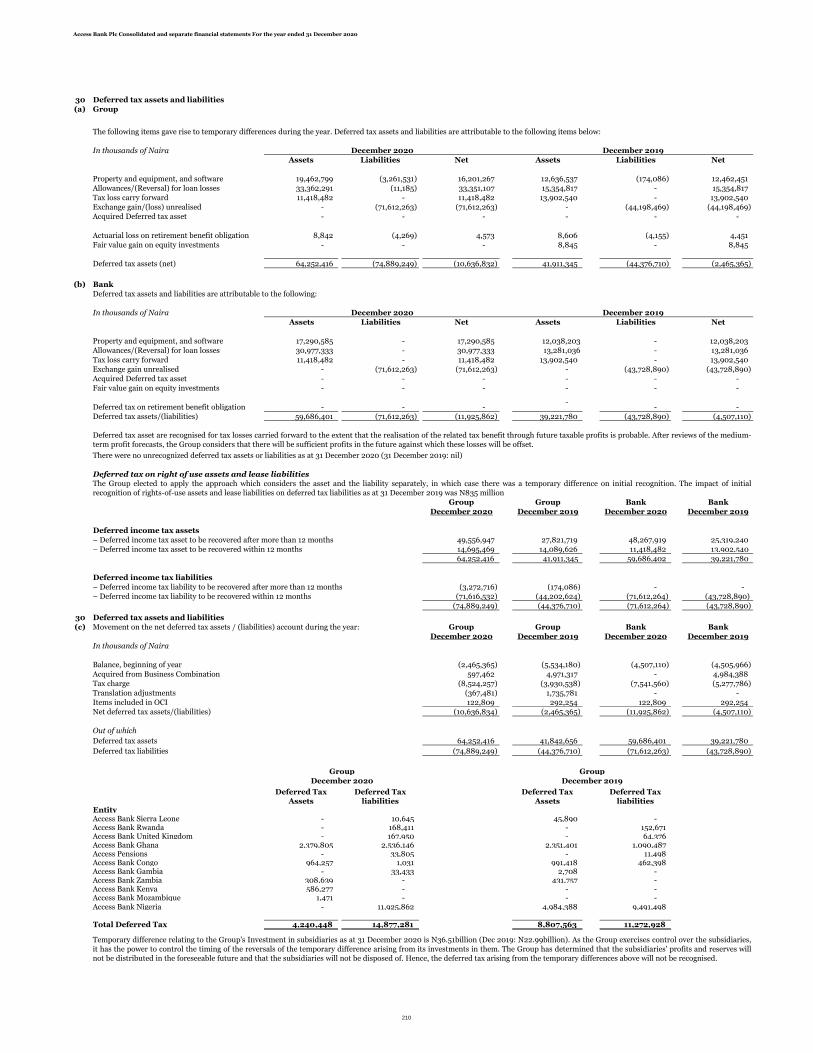
Access Bank Plc Consolidated and separate financial statements For the year ended 31 December 2020
30 Deferred tax assets and liabilities
(a) Group
In thousands of Naira
Assets Liabilities Net Assets Liabilities Net
Property and equipment, and software 19,462,799 (3,261,531) 16,201,267 12,636,537 (174,086) 12,462,451
Allowances/(Reversal) for loan losses 33,362,291 (11,185) 33,351,107 15,354,817 - 15,354,817
Tax loss carry forward 11,418,482 - 11,418,482 13,902,540 - 13,902,540
Exchange gain/(loss) unrealised - (71,612,263) (71,612,263) - (44,198,469) (44,198,469)
Acquired Deferred tax asset - - - - - -
Actuarial loss on retirement benefit obligation 8,842 (4,269) 4,573 8,606 (4,155) 4,451
Fair value gain on equity investments - - - 8,845 - 8,845
Deferred tax assets (net) 64,252,416 (74,889,249) (10,636,832) 41,911,345 (44,376,710) (2,465,365)
(b) Bank
Deferred tax assets and liabilities are attributable to the following:
In thousands of Naira
Assets Liabilities Net Assets Liabilities Net
Property and equipment, and software 17,290,585 - 17,290,585 12,038,203 - 12,038,203
Allowances/(Reversal) for loan losses 30,977,333 - 30,977,333 13,281,036 - 13,281,036
Tax loss carry forward 11,418,482 - 11,418,482 13,902,540 - 13,902,540
Exchange gain unrealised - (71,612,263) (71,612,263) - (43,728,890) (43,728,890)
Acquired Deferred tax asset - - - - - -
Fair value gain on equity investments - - - - - -
- - - -
- -
Deferred tax assets/(liabilities) 59,686,401 (71,612,263) (11,925,862) 39,221,780 (43,728,890) (4,507,110)
There were no unrecognized deferred tax assets or liabilities as at 31 December 2020 (31 December 2019: nil)
Deferred tax on right of use assets and lease liabilities
Group Group Bank Bank
December 2020 December 2019 December 2020 December 2019
Deferred income tax assets
– Deferred income tax asset to be recovered after more than 12 months 49,556,947 27,821,719 48,267,919 25,319,240
– Deferred income tax asset to be recovered within 12 months 14,695,469 14,089,626 11,418,482 13,902,540
64,252,416 41,911,345 59,686,402 39,221,780
Deferred income tax liabilities
– Deferred income tax liability to be recovered after more than 12 months (3,272,716) (174,086) - -
– Deferred income tax liability to be recovered within 12 months (71,616,532) (44,202,624) (71,612,264) (43,728,890)
(74,889,249) (44,376,710) (71,612,264) (43,728,890)
30 Deferred tax assets and liabilities
(c) Movement on the net deferred tax assets / (liabilities) account during the year: Group Group Bank Bank
December 2020 December 2019 December 2020 December 2019
In thousands of Naira
Balance, beginning of year (2,465,365) (5,534,180) (4,507,110) (4,505,966)
Acquired from Business Combination 597,462 4,971,317 - 4,984,388
Tax charge (8,524,257) (3,930,538) (7,541,560) (5,277,786)
Translation adjustments (367,481) 1,735,781 - -
Items included in OCI 122,809 292,254 122,809 292,254
Net deferred tax assets/(liabilities) (10,636,834) (2,465,365) (11,925,862) (4,507,110)
Out of which
Deferred tax assets 64,252,416 41,842,656 59,686,401 39,221,780
Deferred tax liabilities (74,889,249) (44,376,710) (71,612,263) (43,728,890)
Deferred Tax Assets
Deferred Tax liabilities
Deferred Tax Assets
Deferred Tax liabilities
EntityAccess Bank Sierra Leone - 10,645 45,890 - Access Bank Rwanda - 168,411 - 152,671 Access Bank United Kingdom - 167,950 - 64,376 Access Bank Ghana 2,379,805 2,536,146 2,351,401 1,090,487 Access Pensions - 33,805 - 11,498 Access Bank Congo 964,257 1,031 991,418 462,398 Access Bank Gambia - 33,433 2,708 - Access Bank Zambia 308,639 - 431,757 - Access Bank Kenya 586,277 - - - Access Bank Mozambique 1,471 - - - Access Bank Nigeria - 11,925,862 4,984,388 9,491,498
Total Deferred Tax 4,240,448 14,877,281 8,807,563 11,272,928
The following items gave rise to temporary differences during the year. Deferred tax assets and liabilities are attributable to the following items below:
Temporary difference relating to the Group's Investment in subsidiaries as at 31 December 2020 is N36.51billion (Dec 2019: N22.99billion). As the Group exercises control over the subsidiaries,it has the power to control the timing of the reversals of the temporary difference arising from its investments in them. The Group has determined that the subsidiaries' profits and reserves willnot be distributed in the foreseeable future and that the subsidiaries will not be disposed of. Hence, the deferred tax arising from the temporary differences above will not be recognised.
December 2020 December 2019
December 2020 December 2019
Deferred tax on retirement benefit obligation
Deferred tax asset are recognised for tax losses carried forward to the extent that the realisation of the related tax benefit through future taxable profits is probable. After reviews of the medium-term profit forecasts, the Group considers that there will be sufficient profits in the future against which these losses will be offset.
The Group elected to apply the approach which considers the asset and the liability separately, in which case there was a temporary difference on initial recognition. The impact of initialrecognition of rights-of-use assets and lease liabilities on deferred tax liabilities as at 31 December 2019 was N835 million
Group
December 2020
Group
December 2019
210

Access Bank Plc Consolidated and separate financial statements For the year ended 31 December 2020
Items included in Other Comprehensive Income
Group Group Bank Bank
In thousands of Naira December 2020 December 2019 December 2020 December 2019
Actuarial gain/loss on retirement benefit obligation
Gross loss on retirement benefit obligation 383,777 913,293 383,777 913,293
Deferred tax @ 30% (122,809) (292,254) (122,809) (292,254)
Net balance loss after tax 260,968 621,039 260,968 621,039
Deferred Tax asset
Group Group Bank Bank
December 2020 December 2019 December 2020 December 2019
Classified as:
Current 14,695,469 14,089,626 11,418,482 13,902,540
Non current 49,556,947 27,821,719 48,267,919 25,319,240
Deferred Tax liability
Group Group Bank Bank
December 2020 December 2019 December 2020 December 2019
Classified as:
Current (71,616,532) (44,202,624) (71,612,264) (43,728,890)
Non current (3,272,716) (174,086) - -
211

Access Bank Plc Consolidated and separate financial statements For the year ended 31 December 2020
31a Investment properties Group Group Bank Bank
December 2020 December 2019 December 2020 December 2019
Balance at 1 January 927,000 - 727,000 -
Acquired from business combination - 4,053,511 - 3,878,511
Additions for the year - 2,435 - 2,435
Disposals during the year (710,000) (3,153,946) (510,000) (3,153,946)
Valuation gain/(loss) - 25,000 - - Balance, end of year 217,000 927,000 217,000 727,000
31b Assets classified as held for sale
Assets held for sale
Group Group Bank Bank
In thousands of Naira December 2020 December 2019 December 2020 December 2019
Balance at 1 January 24,957,518 12,241,824 24,957,518 12,241,823
Acquired from business combination - 7,976,260 - -
Additions 5,370,949 14,660,695 5,180,949 14,660,695
Disposals (2,010,000) (9,921,260) (2,010,000) (1,945,000)
28,318,467 24,957,519 28,128,467 24,957,518
The total balance for non current financial assets held for sale for the year is N28.32Bn for Group and N28.13Bn for Bank
Classified as:
Current - - - -
Non current 28,318,467 24,957,519 28,128,467 24,957,518
32 Deposits from financial institutions
Group Group Bank Bank
December 2020 December 2019 December 2020 December 2019
In thousands of Naira
Money market deposits 501,831,841 974,352,271 271,700,559 863,988,212
Trade related obligations to foreign banks 456,565,330 212,004,041 559,931,775 215,296,202
958,397,171 1,186,356,312 831,632,332 1,079,284,414
Current 885,853,455 759,088,617
Non-current 72,543,716 72,543,716
33 Deposits from customers
Group Group Bank Bank
December 2020 December 2019 December 2020 December 2019
In thousands of Naira
Term deposits 1,975,382,019 1,784,924,350 1,586,352,293 1,463,431,594
Demand deposits 2,301,974,129 1,681,564,464 1,991,980,453 1,453,307,535
Saving deposits 1,310,062,064 789,348,489 1,254,411,747 751,600,682
5,587,418,212 4,255,837,302 4,832,744,493 3,668,339,811
Investment property of N217 million for the Group, represents the value of landed properties which are carried and measured at fair value. There was norental income from such properties during the year and no restrictions on the realisability of the property.
Valuation technique used for fair valuation of investment propertiesInvestment properties are stated at fair value, which has been determined based on valuations performed by various Estate Surveyors and Valuers . Thevaluers are industry specialists in valuing these types of investment properties. The fair value is supported by market evidence and represents the amountthat would be received to sell the properties in an orderly transaction between market participants at the measurement date in the principal market to whichthe Group has access at the date of valuation, in accordance with standard issued by the International Valuation Standards Committee. Valuations areperformed on an annual basis and the fair value gains and losses are reported in valuation gain on investment properties under other operating income (seenote 13) . The profits or losses on disposal are also reported in the profit or loss as they occur.
The professional valuers engaged for the preparation of the valuation reports is Paul Osaji and Company (FRC/2013/00000000001098)
The Bank obtains properties by taking possession of collaterals held as security against loans. The value of the collaterals repossessed during the year wasN300Mn (2019: N8.82bn). The Group's policy is to pursue timely realisation of the collateral in an orderly manner. The Group does not generally use thenon-cash collateral for its own operations.This amount has been included in Note 7 as unallocated segment in accordance with IFRS 8.
All investment properties have been classified as non current with a carrying amount of N217 million for Group and N217 million for Bank
The professional valuers engaged for the preparation of the valuation reports are: Ubosi Eleh and Company (FRC/2014/00000003997), Odudu and Company (FRC/2012/NIESV/00000000198), Paul Osaji and Company (FRC/2013/00000000001098), Banjo Adeleke and Company (FRC/2013/NIESV/00000003314); and Osas and Oseji (FRC/2012/000000000522)
212

Access Bank Plc Consolidated and separate financial statements For the year ended 31 December 2020
Current 5,133,490,210 3,770,912,953 4,767,846,216 3,504,908,217
Non-current 453,928,002 484,924,350 64,898,276 163,431,594
213
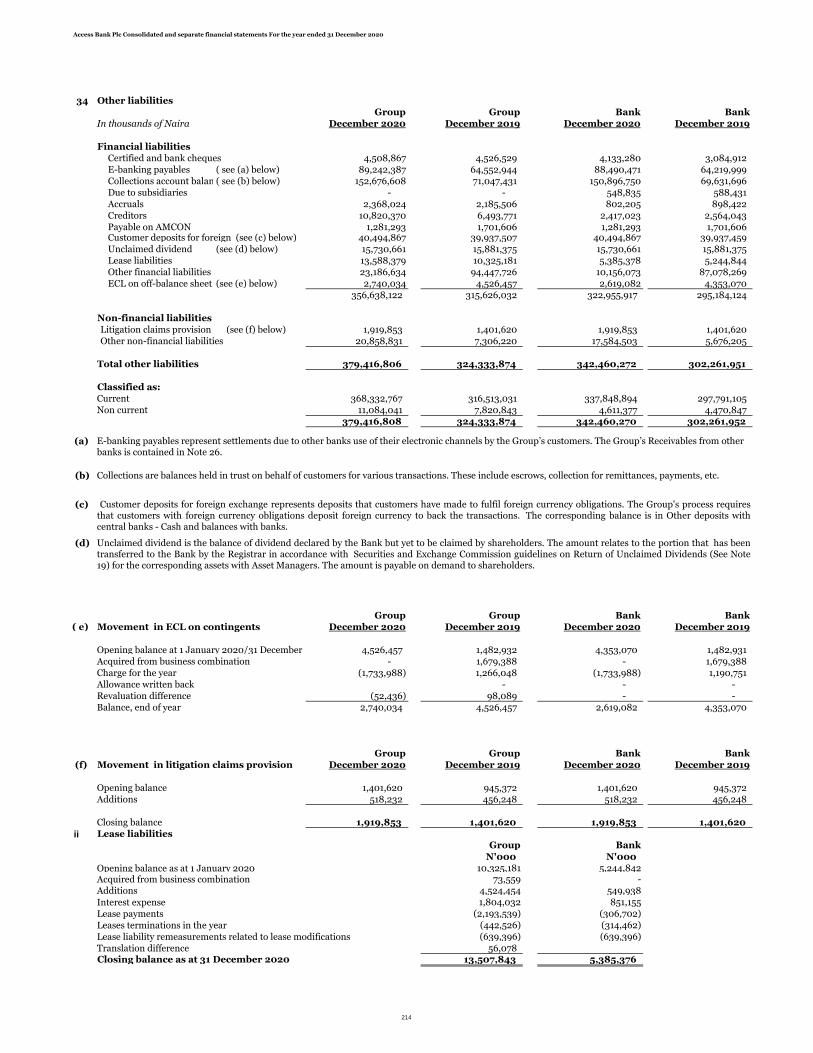
Access Bank Plc Consolidated and separate financial statements For the year ended 31 December 2020
34 Other liabilities
Group Group Bank Bank
In thousands of Naira December 2020 December 2019 December 2020 December 2019
Financial liabilities
Certified and bank cheques 4,508,867 4,526,529 4,133,280 3,084,912
E-banking payables ( see (a) below) 89,242,387 64,552,944 88,490,471 64,219,999
Collections account balances 152,676,608 71,047,431 150,896,750 69,631,696
Due to subsidiaries - - 548,835 588,431
Accruals 2,368,024 2,185,506 802,205 898,422
Creditors 10,820,370 6,493,771 2,417,023 2,564,043
Payable on AMCON 1,281,293 1,701,606 1,281,293 1,701,606 Customer deposits for foreign exchange(see (c) below) 40,494,867 39,937,507 40,494,867 39,937,459
Unclaimed dividend (see (d) below) 15,730,661 15,881,375 15,730,661 15,881,375
Lease liabilities 13,588,379 10,325,181 5,385,378 5,244,844
Other financial liabilities 23,186,634 94,447,726 10,156,073 87,078,269
ECL on contingentsECL on off-balance sheet (see (e) below) 2,740,034 4,526,457 2,619,082 4,353,070
356,638,122 315,626,032 322,955,917 295,184,124
Non-financial liabilities
Litigation claims provision2Litigation claims provision (see (f) below) 1,919,853 1,401,620 1,919,853 1,401,620
Other non-financial liabilities 20,858,831 7,306,220 17,584,503 5,676,205
Total other liabilities 379,416,806 324,333,874 342,460,272 302,261,951
Classified as:
Current 368,332,767 316,513,031 337,848,894 297,791,105
Non current 11,084,041 7,820,843 4,611,377 4,470,847
379,416,808 324,333,874 342,460,270 302,261,952
(a)
(b)
(c)
(d)
Group Group Bank Bank
( e) Movement in ECL on contingents December 2020 December 2019 December 2020 December 2019
Opening balance at 1 January 2020/31 December 2019 4,526,457 1,482,932 4,353,070 1,482,931
Acquired from business combination - 1,679,388 - 1,679,388
Charge for the year (1,733,988) 1,266,048 (1,733,988) 1,190,751
Allowance written back - - -
Revaluation difference (52,436) 98,089 - -
Balance, end of year 2,740,034 4,526,457 2,619,082 4,353,070
Group Group Bank Bank
(f) Movement in litigation claims provision December 2020 December 2019 December 2020 December 2019
Opening balance 1,401,620 945,372 1,401,620 945,372
Additions 518,232 456,248 518,232 456,248
Closing balance 1,919,853 1,401,620 1,919,853 1,401,620
ii Lease liabilitiesGroup Bank
N'000 N'000
Opening balance as at 1 January 2020 10,325,181 5,244,842 Acquired from business combination 73,559 -
Additions 4,524,454 549,938
Interest expense 1,804,032 851,155
Lease payments (2,193,539) (306,702)
Leases terminations in the year (442,526) (314,462)
Lease liability remeasurements related to lease modifications (639,396) (639,396)
Translation difference 56,078 Closing balance as at 31 December 2020 13,507,843 5,385,376
E-banking payables represent settlements due to other banks use of their electronic channels by the Group’s customers. The Group’s Receivables from other banks is contained in Note 26.
Collections are balances held in trust on behalf of customers for various transactions. These include escrows, collection for remittances, payments, etc.
Customer deposits for foreign exchange represents deposits that customers have made to fulfil foreign currency obligations. The Group's process requiresthat customers with foreign currency obligations deposit foreign currency to back the transactions. The corresponding balance is in Other deposits withcentral banks - Cash and balances with banks.
Unclaimed dividend is the balance of dividend declared by the Bank but yet to be claimed by shareholders. The amount relates to the portion that has beentransferred to the Bank by the Registrar in accordance with Securities and Exchange Commission guidelines on Return of Unclaimed Dividends (See Note19) for the corresponding assets with Asset Managers. The amount is payable on demand to shareholders.
( see (b) below)
214

Access Bank Plc Consolidated and separate financial statements For the year ended 31 December 2020
Current lease liabilities 3,378,658 505,899
Non-current lease liabilities 10,129,185 4,879,478
13,507,843 5,385,377
ii Lease liabilitiesGroup Bank
N'000 N'000Opening balance as at 1 January 2019
7,246,007 2,312,629
Additions 2,635,212 2,495,673
Acquired from business combination 878,244 878,244
Interest expense 1,122,276 742,971
Payments made during the year (1,556,558) (1,184,674)Closing balance as at 31 December 2019 10,325,181 5,244,842
Current lease liabilities 2,504,339 773,997
Non-current lease liabilities 7,820,842 4,470,846
10,325,181 5,244,843
iii) Liquidity risk (maturity analysis of undiscounted lease liabilities)
Less than 6 months 1,248,776 477,832 6-12 months 1,758,239 681,531 Between 1 and 2 years 3,206,456 1,244,763 Between 2 and 5 years 5,950,451 4,146,251 Above 5 years 1,802,415 593,591
13,966,337 7,143,968
Carrying amount 13,588,379 5,385,378
35 Debt securities issued Group Group Bank Bank
December 2020 December 2019 December 2020 December 2019
In thousands of Naira
Debt securities at amortized cost:
Eurobond debt security (see (i) below) 122,195,240 110,933,768 122,195,240 110,933,768
Green BondGreen Bond (see (ii) below) 15,423,330 15,426,233 15,423,330 15,426,233
Local BondLocal Bond (see (iii) below) 31,541,488 31,627,876 31,541,488 31,627,876
169,160,059 157,987,877 169,160,059 157,987,877
Movement in Debt securities issued:
Group Bank
In thousands of Naira December 2020 December 2020
Net debt as at 1 January 2020 157,987,877 157,987,877
Debt securities issued - -
Repayment of debt securities issued - -
Total changes from financing cash flows 157,987,876 157,987,876
The effect of changes in foreign exchange rates 11,102,708 11,102,708
Other changes
Interest expense 19,305,691 19,305,691
Interest paid (19,236,218) (19,236,218) Balance as at 31 December 2020 169,160,058 169,160,058
Group Bank
In thousands of Naira December 2019 December 2019
Net debt as at 1 January 2019 251,251,383 251,251,383
Arising from business combination 74,270,686 74,270,686
Debt securities issued 45,000,000 45,000,000
Repayment of debt securities issued (216,208,000) (216,208,000)
Total changes from financing cash flows 154,314,068 154,314,068
The effect of changes in foreign exchange rates 3,124,782 3,124,782
Other changes
Interest expense 22,913,352 22,913,352
Interest paid (22,364,327) (22,364,327) Balance as at 31 December 2019 157,987,877 157,987,877
215

Access Bank Plc Consolidated and separate financial statements For the year ended 31 December 2020
(i) This refers to US$300,000,000 notes of 10.5% interest issued on 19 October 2016 with a maturity date of 19 October 2021. It represents an amortizedcost of N124.88bn.
(ii)The Bank issued an unsecured green bond on March, 18, 2019 with a coupon rate of 15.5% payable semi-annually. The bond has a tenor of 5 years and isdue on March, 2024.
(iii) The Bank issued a local bond on July, 4, 2019 with a coupon rate of 15.5% payable semi-annually. The bond has a tenor of 7 years and is due on July,2026.The principal amount on the notes are payable at maturity, whilst interest is payable on a semi-annual basis at their respective interest rates.
216
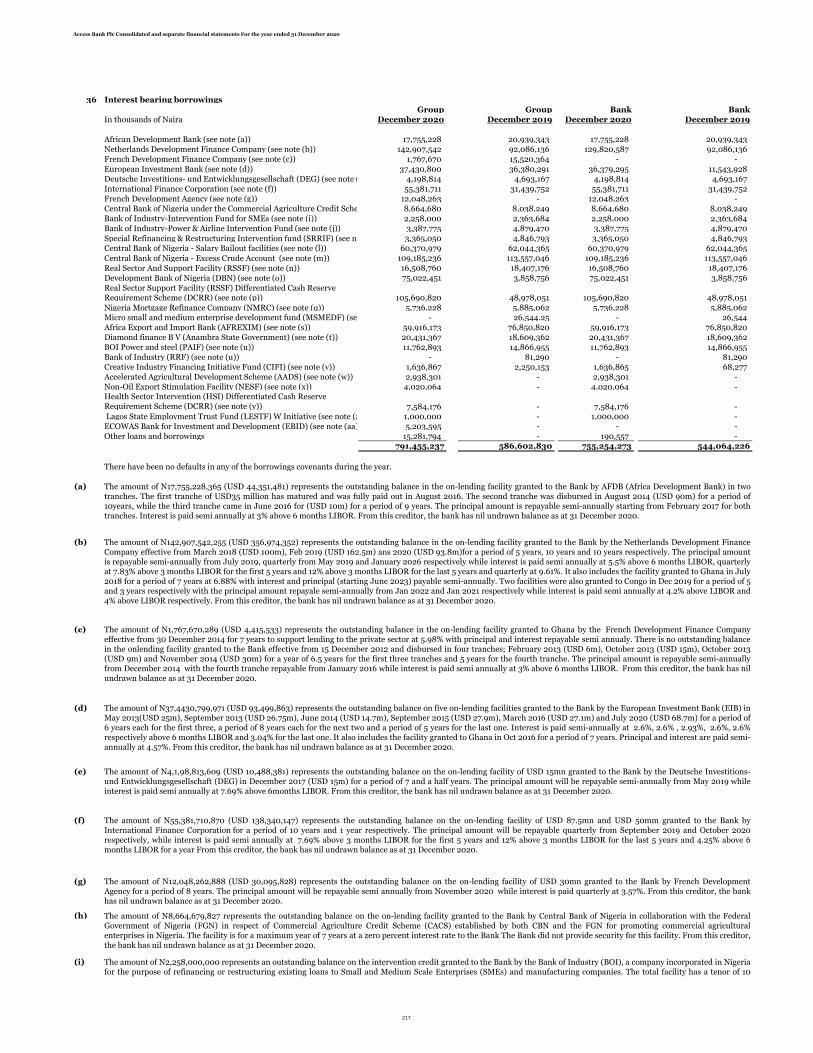
Access Bank Plc Consolidated and separate financial statements For the year ended 31 December 2020
36 Interest bearing borrowingsGroup Group Bank Bank
In thousands of Naira December 2020 December 2019 December 2020 December 2019
African Development Bank (see note (a)) 17,755,228 20,939,343 17,755,228 20,939,343 Netherlands Development Finance Company (see note (b)) 142,907,542 92,086,136 129,820,587 92,086,136 French Development Finance Company (see note (c)) 1,767,670 15,520,364 - - European Investment Bank (see note (d)) 37,430,800 36,380,291 36,379,295 11,543,928 Deutsche Investitions- und Entwicklungsgesellschaft (DEG) (see note (e)) 4,198,814 4,693,167 4,198,814 4,693,167 International Finance Corporation (see note (f)) 55,381,711 31,439,752 55,381,711 31,439,752 French Development Agency (see note (g)) 12,048,263 - 12,048,263 - Central Bank of Nigeria under the Commercial Agriculture Credit Scheme (see note (h))8,664,680 8,038,249 8,664,680 8,038,249 Bank of Industry-Intervention Fund for SMEs (see note (i)) 2,258,000 2,363,684 2,258,000 2,363,684 Bank of Industry-Power & Airline Intervention Fund (see note (j)) 3,387,775 4,879,470 3,387,775 4,879,470
Special Refinancing & Restructuring Intervention fund (SRRIF) (see note (k)) 3,365,050 4,846,793 3,365,050 4,846,793 Central Bank of Nigeria - Salary Bailout facilities (see note (l)) 60,370,979 62,044,365 60,370,979 62,044,365
Central Bank of Nigeria - Excess Crude Account (see note (m)) 109,185,236 113,557,046 109,185,236 113,557,046
Real Sector And Support Facility (RSSF) (see note (n)) 16,508,760 18,407,176 16,508,760 18,407,176
Development Bank of Nigeria (DBN) (see note (o)) 75,022,451 3,858,756 75,022,451 3,858,756
Real Sector Support Facility (RSSF) Differentiated Cash Reserve Requirement Scheme (DCRR) (see note (p)) 105,690,820 48,978,051 105,690,820 48,978,051
Nigeria Mortgage Refinance Company (NMRC) (see note (q)) 5,736,228 5,885,062 5,736,228 5,885,062 Micro small and medium enterprise development fund (MSMEDF) (see note (r)) - 26,544.25 - 26,544 Africa Export and Import Bank (AFREXIM) (see note (s)) 59,916,173 76,850,820 59,916,173 76,850,820 Diamond finance B V (Anambra State Government) (see note (t)) 20,431,367 18,609,362 20,431,367 18,609,362 BOI Power and steel (PAIF) (see note (u)) 11,762,893 14,866,955 11,762,893 14,866,955 Bank of Industry (RRF) (see note (u)) - 81,290 - 81,290 Creative Industry Financing Initiative Fund (CIFI) (see note (v)) 1,636,867 2,250,153 1,636,865 68,277 Accelerated Agricultural Development Scheme (AADS) (see note (w)) 2,938,301 - 2,938,301 - Non-Oil Export Stimulation Facility (NESF) (see note (x)) 4,020,064 - 4,020,064 - Health Sector Intervention (HSI) Differentiated Cash Reserve Requirement Scheme (DCRR) (see note (y)) 7,584,176 - 7,584,176 - Lagos State Employment Trust Fund (LESTF) W Initiative (see note (z)) 1,000,000 - 1,000,000 - ECOWAS Bank for Investment and Development (EBID) (see note (aa)) 5,203,595 - - - Other loans and borrowings 15,281,794 - 190,557 -
791,455,237 586,602,830 755,254,273 544,064,226
(a)
(b)
(c)
(d)
(e)
(f)
(g)
(h)
(i)
The amount of N8,664,679,827 represents the outstanding balance on the on-lending facility granted to the Bank by Central Bank of Nigeria in collaboration with the FederalGovernment of Nigeria (FGN) in respect of Commercial Agriculture Credit Scheme (CACS) established by both CBN and the FGN for promoting commercial agriculturalenterprises in Nigeria. The facility is for a maximum year of 7 years at a zero percent interest rate to the Bank The Bank did not provide security for this facility. From this creditor,the bank has nil undrawn balance as at 31 December 2020.
The amount of N37,4430,799,971 (USD 93,499,863) represents the outstanding balance on five on-lending facilities granted to the Bank by the European Investment Bank (EIB) inMay 2013(USD 25m), September 2013 (USD 26.75m), June 2014 (USD 14.7m), September 2015 (USD 27.9m), March 2016 (USD 27.1m) and July 2020 (USD 68.7m) for a period of6 years each for the first three, a period of 8 years each for the next two and a period of 5 years for the last one. Interest is paid semi-annually at 2.6%, 2.6% , 2.93%, 2.6%, 2.6%respectively above 6 months LIBOR and 3.04% for the last one. It also includes the facility granted to Ghana in Oct 2016 for a period of 7 years. Principal and interest are paid semi-annually at 4.57%. From this creditor, the bank has nil undrawn balance as at 31 December 2020.
The amount of N4,1,98,813,609 (USD 10,488,381) represents the outstanding balance on the on-lending facility of USD 15mn granted to the Bank by the Deutsche Investitions-und Entwicklungsgesellschaft (DEG) in December 2017 (USD 15m) for a period of 7 and a half years. The principal amount will be repayable semi-annually from May 2019 whileinterest is paid semi annually at 7.69% above 6months LIBOR. From this creditor, the bank has nil undrawn balance as at 31 December 2020.
The amount of N12,048,262,888 (USD 30,095,828) represents the outstanding balance on the on-lending facility of USD 30mn granted to the Bank by French DevelopmentAgency for a period of 8 years. The principal amount will be repayable semi annually from November 2020 while interest is paid quarterly at 3.57%. From this creditor, the bankhas nil undrawn balance as at 31 December 2020.
The amount of N2,258,000,000 represents an outstanding balance on the intervention credit granted to the Bank by the Bank of Industry (BOI), a company incorporated in Nigeriafor the purpose of refinancing or restructuring existing loans to Small and Medium Scale Enterprises (SMEs) and manufacturing companies. The total facility has a tenor of 10years. A management fee of 1% deductible at source is paid by the Bank under the on-lending agreement and the Bank is under obligation to on-lend to customers at an all-ininterest rate of 7% per annum. Though the facility is meant for on-lending to borrowers in specified sectors, the Bank remains the primary obligor to the BOI and therefore assumesthe risk of default of customers. From this creditor, the bank has nil undrawn balance as at 31 December 2020.
There have been no defaults in any of the borrowings covenants during the year.
The amount of N17,755,228,365 (USD 44,351,481) represents the outstanding balance in the on-lending facility granted to the Bank by AFDB (Africa Development Bank) in twotranches. The first tranche of USD35 million has matured and was fully paid out in August 2016. The second tranche was disbursed in August 2014 (USD 90m) for a period of10years, while the third tranche came in June 2016 for (USD 10m) for a period of 9 years. The principal amount is repayable semi-annually starting from February 2017 for bothtranches. Interest is paid semi annually at 3% above 6 months LIBOR. From this creditor, the bank has nil undrawn balance as at 31 December 2020.
The amount of N1,767,670,289 (USD 4,415,533) represents the outstanding balance in the on-lending facility granted to Ghana by the French Development Finance Companyeffective from 30 December 2014 for 7 years to support lending to the private sector at 5.98% with principal and interest repayable semi annualy. There is no outstanding balancein the onlending facility granted to the Bank effective from 15 December 2012 and disbursed in four tranches; February 2013 (USD 6m), October 2013 (USD 15m), October 2013(USD 9m) and November 2014 (USD 30m) for a year of 6.5 years for the first three tranches and 5 years for the fourth tranche. The principal amount is repayable semi-annuallyfrom December 2014 with the fourth tranche repayable from January 2016 while interest is paid semi annually at 3% above 6 months LIBOR. From this creditor, the bank has nilundrawn balance as at 31 December 2020.
The amount of N142,907,542,255 (USD 356,974,352) represents the outstanding balance in the on-lending facility granted to the Bank by the Netherlands Development FinanceCompany effective from March 2018 (USD 100m), Feb 2019 (USD 162.5m) ans 2020 (USD 93.8m)for a period of 5 years, 10 years and 10 years respectively. The principal amountis repayable semi-annually from July 2019, quarterly from May 2019 and January 2026 respectively while interest is paid semi annually at 5.5% above 6 months LIBOR, quarterlyat 7.83% above 3 months LIBOR for the first 5 years and 12% above 3 months LIBOR for the last 5 years and quarterly at 9.61%. It also includes the facility granted to Ghana in July2018 for a period of 7 years at 6.88% with interest and principal (starting June 2023) payable semi-annually. Two facilities were also granted to Congo in Dec 2019 for a period of 5and 3 years respectively with the principal amount repayale semi-annually from Jan 2022 and Jan 2021 respectively while interest is paid semi annually at 4.2% above LIBOR and4% above LIBOR respectively. From this creditor, the bank has nil undrawn balance as at 31 December 2020.
The amount of N55,381,710,870 (USD 138,340,147) represents the outstanding balance on the on-lending facility of USD 87.5mn and USD 50mm granted to the Bank byInternational Finance Corporation for a period of 10 years and 1 year respectively. The principal amount will be repayable quarterly from September 2019 and October 2020respectively, while interest is paid semi annually at 7.69% above 3 months LIBOR for the first 5 years and 12% above 3 months LIBOR for the last 5 years and 4.25% above 6months LIBOR for a year From this creditor, the bank has nil undrawn balance as at 31 December 2020.
217
Access Bank Plc Consolidated and separate financial statements For the year ended 31 December 2020
(j)
(k)
(l)
(m)
(n)
(o)
(p)
(q)
(r)
(s)
(t)
(u)
(v)
(w)
(x)
(y)
The amount of N75,022,450,705 represents the outstanding balance on four on-lending facilities granted to the Bank by the Development Bank of Nigeria in two series in respect ofthe Micro, Small and Medium Scale Enterprises (MSMEs) and Small Corporates. The facilities are for a maximum of 3 years at a 9.6% interest rate to the Bank. A third series ofabout 1.68bn was disbursed for a period of 10 years. The fourth facility of about 70bn was disbursed for a period of 10 years at an interest rate of 10%. From this creditor, the bankhas nil undrawn balance as at 31 December 2020.
The amount of N2,258,000,000 represents an outstanding balance on the intervention credit granted to the Bank by the Bank of Industry (BOI), a company incorporated in Nigeriafor the purpose of refinancing or restructuring existing loans to Small and Medium Scale Enterprises (SMEs) and manufacturing companies. The total facility has a tenor of 10years. A management fee of 1% deductible at source is paid by the Bank under the on-lending agreement and the Bank is under obligation to on-lend to customers at an all-ininterest rate of 7% per annum. Though the facility is meant for on-lending to borrowers in specified sectors, the Bank remains the primary obligor to the BOI and therefore assumesthe risk of default of customers. From this creditor, the bank has nil undrawn balance as at 31 December 2020.
The amount of N3,387,775,315 represents the outstanding balance on intervention credit granted to the Bank by the Bank of Industry (BOI), a company incorporated in Nigeria, tobe applied to eligible power and airline projects. The total facility has a maximum tenor of 13.5 years. A management fee of 1% deductible at source is paid by the Bank under the on-lending agreement and the Bank is under obligation to on-lend to customers at an all-in interest rate of 7% per annum. Though the facility is meant for on-lending to borrowerswithin the power and aviation sectors, the Bank remains the primary obligor to the BOI and therefore assumes the risk of default of customers. From this creditor, the bank has nilundrawn balance as at 31 December 2020.
The amount of N3,365,050,022 represents the outstanding balance on intervention credit granted to the bank by the Bank of Industry (BOI) under the Special refinancing andRestructuring intervention fund, with a 10 year tenor which is due on the 31 August 2024. The bank has a 36 months moratorium on the facility after which principal repaymentwill be charged quarterly. Though the facility is meant for on-lending to borrowers in specified sectors, the Bank remains the primary obligor to the BOI and therefore assumes therisk of default of customers. From this creditor, the bank has nil undrawn balance as at 31 December 2020.
The amount of N60,370,978,502 represents the outstanding balance on the state salary bailout facilities granted to the bank by the Central Bank of Nigeria for onwarddisbursements to state governments for payments of salary of workers of the states. The facility has a tenor of 20 years with a 2% interest payable to the CBN. The Bank is underobligation to on-lend to the states at an all-in interest rate of 9% per annum. From this creditor, the bank has nil undrawn balance as at 31 December 2020.
The amount of N109,185,235,757 represents the outstanding balance on the excess crude account loans granted to the bank by the Central Bank of Nigeria for onwarddisbursements to state governments. The facility has a tenor of 20 years with a 2% interest payable to the CBN. The Bank is under obligation to on-lend to the states at an all-ininterest rate of 9% per annum. From this creditor, the bank has nil undrawn balance as at 31 December 2020.
The amount of N16,508,760,313 represents the outstanding balance on the on-lending facility granted to the Bank by Central Bank of Nigeria in respect of the Real Sector SupportFacility (RSSF) established by CBN. The facility tenor is for a range of 7 to 10 years inclusive of 24 months moratorium at a 3% interest rate to the Bank. An additional facility ofNGN2bn was disbursed under the scheme for a period of 7 years inclusive of 1 year moratorium at a 3% interest rate to the Bank. From this creditor, the bank has nil undrawnbalance as at 31 December 2020.
The amount of N105,690,819,749 represents the outstanding balance on the on-lending facility granted to the Bank by Central Bank of Nigeria in respect of the Real Sector SupportFacility (RSSF) Differentiated Cash Reserve Requirement scheme (DCCR) established by CBN supporting Reddington Multi-specialist Hospital, Dana Motors, Lafarge Africa PLC.The facility is for a maximum period of 7 years inclusive of 12 months moratorium for Reddington and Dana and a 24 months moratorium for Lafarge at a 0% interest rate to theBank. Additional amounts were disbursed between July 2019 and November 2019 in favor of 5 other beneficiaries amounting to 34.58bn for a period of 7 years with 2 yearsmoratorium at 2% interest rate on a quarterly basis for the first 4 counterparties and 10 years with no moratorium at 1% interest rate on a quarterly basis for the last counterparty.There were additional facilities disbursed in 2020 in favor of 16 other beneficiaries amounting to about N59bn for a period of 4 to 10 years inclusive of 6 months to 2 yearsmoratorium at 2% interest rate on a quarterly basis. From this creditor, the bank has nil undrawn balance as at 31 December 2020.
The amount of N7,584,175,739 represents the outstanding balance on the on-lending facility granted to the Bank by Central Bank of Nigeria through the Health Sector InterventionFacility (HSIF) window of the Real Sector Support Facility (RSSF) Differentiated Cash Reserve Requirement scheme (DCCR) supporting 8 beneficiaries (N7.6bn). The tenor of thefacility ranges from 4 to 10 years inclusive of maximum moratorium of 12 months. The interest is set at 1% repayable on a quarterly basis which will increase to 2% effective March2021. From this creditor, the bank has nil undrawn balance as at 31 December 2020.
The amount of N2,938,300,788 represents the outstanding balance on the on-lending facility granted to the Bank by Central Bank of Nigeria in respect of the AcceleratedAgricultural Development Scheme (AADS) on behalf of Bayelsa State Government. The facility is for a period of 3 years inclusive of 24 months moratorium at a 4% interest raterepayable on a monthly basis. From this creditor, the bank has nil undrawn balance as at 31 December 2020.
The amount of N4,020,064,265 represents the outstanding balance on the on-lending facility granted to the Bank by Central Bank of Nigeria in respect of the Non-Oil ExportStimulation Facility (NESF) supporting Leaf Tobacco and Commodities Nigeria Limited in acquiring additional machinery for expansion of their facilities. The facility is for aperiod of 6 years inclusive of 12 months moratorium at a 1% interest rate repayable on a quarterly basis which will increase to 2% effective March 1, 2021. From this creditor, thebank has nil undrawn balance as at 31 December 2020.
The amount of N59,916,173,054 (USD 149,666,957) represents the outstanding balance on the on-lending facility of USD 25mn granted to the Bank by Africa Export and ImportBank (AFREXIM) in May 2018 for a period of 3 years. The principal amount will be repayable semi-annually from November 2018 while interest is paid quaterly at 7% above 3months LIBOR. In December 2019, AFREXIM disbursed a USD200mn for a period of 3 years to be paid quarterly with a 6 months moratorium with Interest also paid quarterly at3.64% and LIBOR. From this creditor, the bank has nil undrawn balance as at 31 December 2020.
The amount N20,431,367,123 (USD 51,036,313) represents the outstanding balance on the Group's issued dollar denominated loan particpatory notes of $50 million (N9.95 billion)through a structured entity, Diamond Finance BV, Netherlands, on 27 March 2014, which is due on 27 March 2021. The principal amount is payable at the end of the tenor whileinterest on the notes is payable semi-annually at 7% per annum. The net proceeds from the issue of the Loan Participatory Notes, was used by the Issuer (Diamond Finance BV) forthe sole purpose of providing a loan to Diamond Bank, which was in turn used by the Bank to support its business expansion and development. Diamond Bank (now Access BankPlc), unconditionally and irrevocably guaranteed the due payment of all sums by the Issuer (Diamond Finance BV) in respect of the Notes. The Group has not had any defaults ofprincipal or interest with respect to its subordinated liabilities during the period ended 30 June 2020. From this creditor, the bank has nil undrawn balance as at 31 December2020.
The amount of N11,762,893,086 represents the outstanding balance on intervention credit granted to the Bank by the Bank of Industry (BOI), a company incorporated in Nigeria.The total facility has a maximum tenor of 15 years. A management fee of 1% deductible at source is paid by the Bank under the on-lending agreement and the Bank is underobligation to on-lend to customers at an all-in interest rate of 7%. Though the facility is meant for on-lending to borrowers in specified sectors, the Bank remains the primaryobligor to the BOI and therefore assumes the risk of default of customers. From this creditor, the bank has nil undrawn balance as at 31 December 2020
The amount of N1,636,867,019 represents the outstanding balance on the on-lending facility granted to the Bank by the Central Bank of Nigeria under the Creative IndustryFinancing Initiative established by the CBN. The initiative is on a request by request basis. The tenor of the facilities granted ranges from 3 to 10 years inclusive of a maximum of 24 months moratorium. There are currently 14 beneficiaries under the initiative. The Bank is under obligation to on-lend to customers at an all-in interest rate of 9% with 2% remittedto CBN. The Bank remains the primary obligor to CBN and therefore assumes the risk of default of customers. From this creditor, the bank has nil undrawn balance as at 31December 2020.
The amount of N5,736,227,740 represents the outstanding balance on the on-lending facility granted to the Bank by Nigeria Mortgage Refinance Company. The facility is for amaximum period of 15 years commencing from the date of execution of this agreement at a 14.5% interest rate to the Bank. From this creditor, the bank has nil undrawn balance asat 31 December 2020.
This on-lending facility granted to the Bank under the Central Bank of Nigeria scheme Micro, Small and medium Enterprise Development Fund (MSMEDF). The on-lending facilityis for a maximum tenor of 5 years where the Bank is under obligation to on-lend to customers at an all-in interest rate of 7% to 9% per annum depending on the beneficiary. Theprincipal amount of the on-lending facility is repayable on a monthly basis over the tenor of the borrowing which will expire in August 2020. From this creditor, the bank has nilundrawn balance as at 31 December 2020.
218

Access Bank Plc Consolidated and separate financial statements For the year ended 31 December 2020
(z)
(aa)
In thousands of Naira Group BankDecember 2020 December 2020
Balance as at 1 January 2020 586,602,830 544,064,226 Proceeds from interest bearing borrowings 256,015,899 253,841,702 Repayment of interest bearing borrowings (75,582,339) (66,636,469)
Total changes from financing cash flows 767,036,390 731,269,459
The effect of changes in foreign exchange rates 19,565,682 19,565,680 Other changesInterest expense 25,760,799 24,562,225 Interest paid (20,907,634) (20,143,091) Balance as at 31 December 2020 791,455,238 755,254,273
Group BankDecember 2019 December 2019
Balance as at 1 January 2019 388,416,734 363,682,441 Proceeds from interest bearing borrowings 245,332,824 223,834,913 Arising from business combination 92,240,671 92,240,672 Repayment of interest bearing borrowings (142,101,478) (138,295,724) Total changes from financing cash flows 583,888,751 541,462,302
The effect of changes in foreign exchange rates 2,080,813 2,085,384
Other changesInterest expense 22,908,552 21,865,024 Interest paid (22,275,286) (21,348,484) Balance as at 31 December 2019 586,602,830 544,064,226
The amount of N1,000,000,000 represents the outstanding balance on the on-lending facility granted to the Bank by Lagos State Employment Trust Fund (LESTF) The tenor ofthe facility is 2 years. The interest is set at 5% repayable on a monthly basis. From this creditor, the bank has nil undrawn balance as at 31 December 2020.
As a result of the COVID-19 outbreak, CBN has decided to do the do the following for all CBN intervention facilities;1.Extend the moratorium by granting a further moratorium of one year on all principal repayments, effective March 1, 2020 for all CBN intervention facilities.2.Reduce Interest rate on all applicable CBN intervention facilities from 9 to 5% per annum for 1 year effective March 1, 2020.
The amount of f N5,203,595,207 (USD 12,998,264) represents the outstanding balance on the on-lending facility granted to the Group's Subsidiary in Ghana by ECOWAS Bank forInvestment and Development (EBID) which attracts an interest rate of 2.75% for 60 days with four different facilities disbursed between October and December (2 Oct 2020, 3 Nov2020, 5 Dec 2020 and 6 Dec 2020) all with principal and interest payable at maturity. From this creditor, the bank has nil undrawn balance as at 31 December 2020.
219
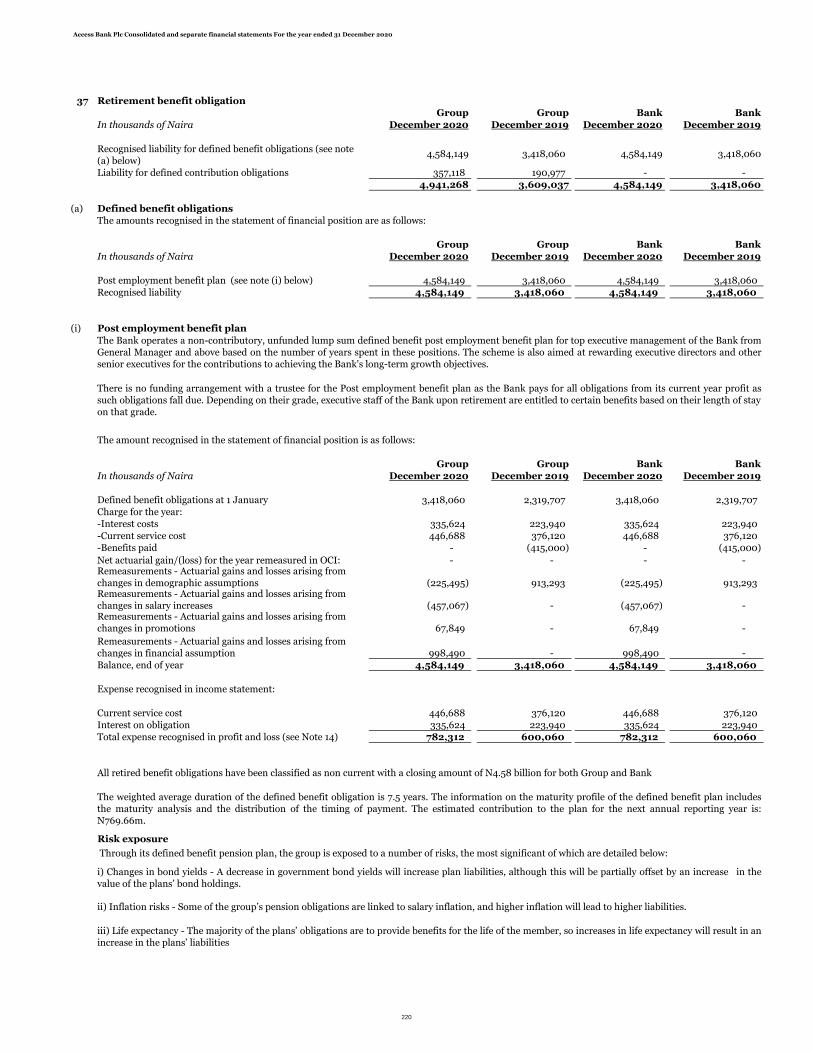
Access Bank Plc Consolidated and separate financial statements For the year ended 31 December 2020
37 Retirement benefit obligation
Group Group Bank Bank
In thousands of Naira December 2020 December 2019 December 2020 December 2019
Liability for defined contribution obligations 357,118 190,977 - -
4,941,268 3,609,037 4,584,149 3,418,060
(a) Defined benefit obligations
The amounts recognised in the statement of financial position are as follows:
Group Group Bank Bank
In thousands of Naira December 2020 December 2019 December 2020 December 2019
Post employment benefit plan (see note (i) below) 4,584,149 3,418,060 4,584,149 3,418,060
Recognised liability 4,584,149 3,418,060 4,584,149 3,418,060
(i) Post employment benefit plan
Group Group Bank Bank
In thousands of Naira December 2020 December 2019 December 2020 December 2019
Defined benefit obligations at 1 January 3,418,060 2,319,707 3,418,060 2,319,707
Charge for the year:
-Interest costs 335,624 223,940 335,624 223,940
-Current service cost 446,688 376,120 446,688 376,120
-Benefits paid - (415,000) - (415,000)
Net actuarial gain/(loss) for the year remeasured in OCI: - - - -
(225,495) 913,293 (225,495) 913,293
(457,067) - (457,067) -
67,849 - 67,849 -
998,490 - 998,490 -
Balance, end of year 4,584,149 3,418,060 4,584,149 3,418,060
Expense recognised in income statement:
Current service cost 446,688 376,120 446,688 376,120
Interest on obligation 335,624 223,940 335,624 223,940
Total expense recognised in profit and loss (see Note 14) 782,312 600,060 782,312 600,060
All retired benefit obligations have been classified as non current with a closing amount of N4.58 billion for both Group and Bank
The Bank operates a non-contributory, unfunded lump sum defined benefit post employment benefit plan for top executive management of the Bank fromGeneral Manager and above based on the number of years spent in these positions. The scheme is also aimed at rewarding executive directors and othersenior executives for the contributions to achieving the Bank's long-term growth objectives.
There is no funding arrangement with a trustee for the Post employment benefit plan as the Bank pays for all obligations from its current year profit assuch obligations fall due. Depending on their grade, executive staff of the Bank upon retirement are entitled to certain benefits based on their length of stay on that grade.
Recognised liability for defined benefit obligations (see note (a) below)
3,418,060 3,418,0604,584,149 4,584,149
The amount recognised in the statement of financial position is as follows:
Remeasurements - Actuarial gains and losses arising from changes in demographic assumptions
Remeasurements - Actuarial gains and losses arising from changes in financial assumption
Risk exposure
Through its defined benefit pension plan, the group is exposed to a number of risks, the most significant of which are detailed below:
i) Changes in bond yields - A decrease in government bond yields will increase plan liabilities, although this will be partially offset by an increase in thevalue of the plans’ bond holdings.
ii) Inflation risks - Some of the group’s pension obligations are linked to salary inflation, and higher inflation will lead to higher liabilities.
iii) Life expectancy - The majority of the plans’ obligations are to provide benefits for the life of the member, so increases in life expectancy will result in anincrease in the plans’ liabilities
Remeasurements - Actuarial gains and losses arising from changes in salary increasesRemeasurements - Actuarial gains and losses arising from changes in promotions
The weighted average duration of the defined benefit obligation is 7.5 years. The information on the maturity profile of the defined benefit plan includesthe maturity analysis and the distribution of the timing of payment. The estimated contribution to the plan for the next annual reporting year is:N769.66m.
220
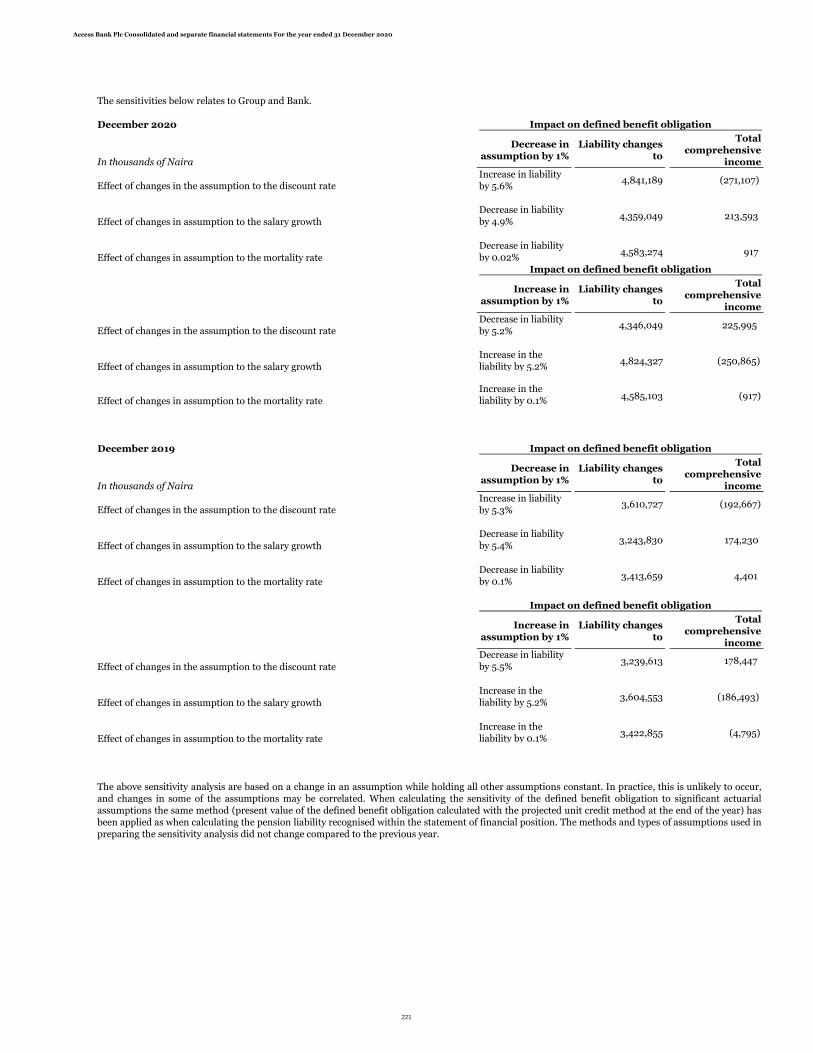
Access Bank Plc Consolidated and separate financial statements For the year ended 31 December 2020
December 2020
In thousands of Naira
Decrease inassumption by 1%
Liability changes to
Total comprehensive
income
Effect of changes in the assumption to the discount rateIncrease in liability by 5.6%
4,841,189 (271,107)
Effect of changes in assumption to the salary growth
Decrease in liability by 4.9%
4,359,049 213,593
Effect of changes in assumption to the mortality rate
Decrease in liability by 0.02%
4,583,274 917
Increase in assumption by 1%
Liability changes to
Total comprehensive
income
Effect of changes in the assumption to the discount rateDecrease in liability by 5.2%
4,346,049 225,995
Effect of changes in assumption to the salary growth
Increase in the liability by 5.2%
4,824,327 (250,865)
Effect of changes in assumption to the mortality rate
Increase in the liability by 0.1% 4,585,103 (917)
December 2019
In thousands of Naira
Decrease inassumption by 1%
Liability changes to
Total comprehensive
income
Effect of changes in the assumption to the discount rateIncrease in liability by 5.3%
3,610,727 (192,667)
Effect of changes in assumption to the salary growth
Decrease in liability by 5.4%
3,243,830 174,230
Effect of changes in assumption to the mortality rate
Decrease in liability by 0.1%
3,413,659 4,401
Increase in assumption by 1%
Liability changes to
Total comprehensive
income
Effect of changes in the assumption to the discount rate
Decrease in liability by 5.5%
3,239,613 178,447
Effect of changes in assumption to the salary growth
Increase in the liability by 5.2%
3,604,553 (186,493)
Effect of changes in assumption to the mortality rate
Increase in the liability by 0.1%
3,422,855 (4,795)
Impact on defined benefit obligation
Impact on defined benefit obligation
Impact on defined benefit obligation
Impact on defined benefit obligation
The sensitivities below relates to Group and Bank.
The above sensitivity analysis are based on a change in an assumption while holding all other assumptions constant. In practice, this is unlikely to occur,and changes in some of the assumptions may be correlated. When calculating the sensitivity of the defined benefit obligation to significant actuarialassumptions the same method (present value of the defined benefit obligation calculated with the projected unit credit method at the end of the year) hasbeen applied as when calculating the pension liability recognised within the statement of financial position. The methods and types of assumptions used inpreparing the sensitivity analysis did not change compared to the previous year.
221
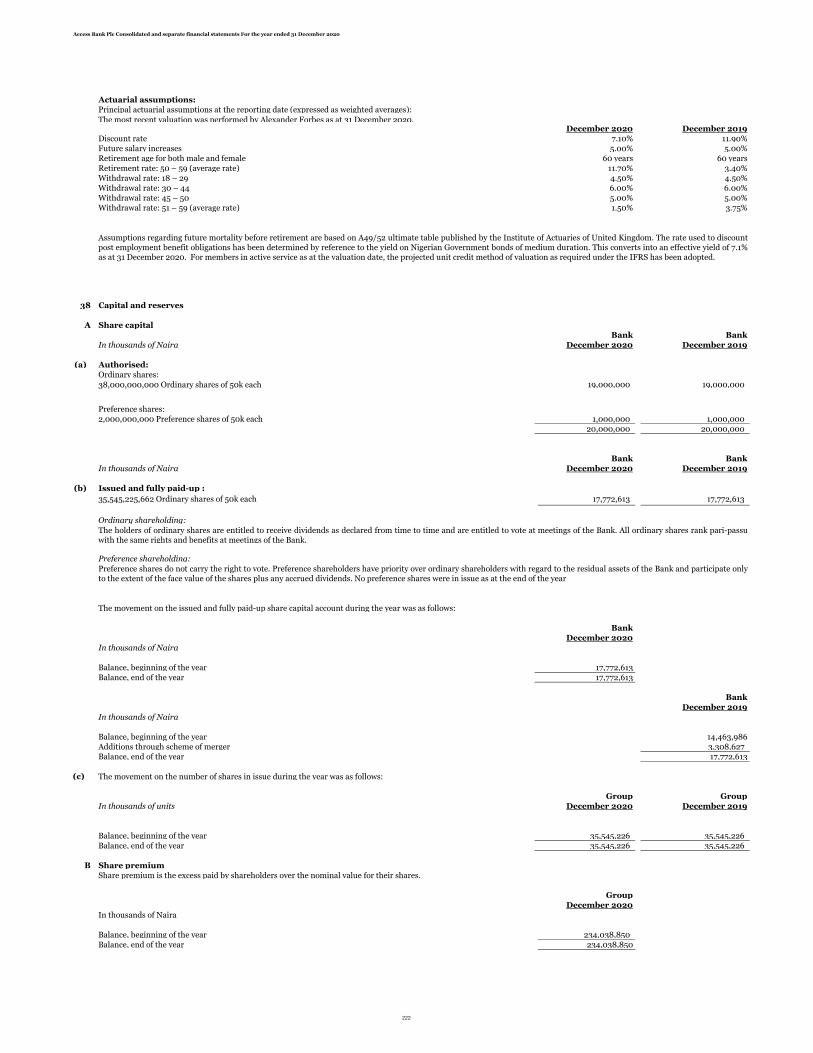
Access Bank Plc Consolidated and separate financial statements For the year ended 31 December 2020
Actuarial assumptions:Principal actuarial assumptions at the reporting date (expressed as weighted averages):
The most recent valuation was performed by Alexander Forbes as at 31 December 2020.December 2020 December 2019
Discount rate 7.10% 11.90%Future salary increases 5.00% 5.00%Retirement age for both male and female 60 years 60 yearsRetirement rate: 50 – 59 (average rate) 11.70% 3.40%Withdrawal rate: 18 – 29 4.50% 4.50%Withdrawal rate: 30 – 44 6.00% 6.00%Withdrawal rate: 45 – 50 5.00% 5.00%Withdrawal rate: 51 – 59 (average rate) 1.50% 3.75%
38 Capital and reserves
A Share capitalBank Bank
In thousands of Naira December 2020 December 2019
(a) Authorised:Ordinary shares:
19,000,000 19,000,000
Preference shares:2,000,000,000 Preference shares of 50k each 1,000,000 1,000,000
20,000,000 20,000,000
Bank BankIn thousands of Naira December 2020 December 2019
(b) Issued and fully paid-up :
35,545,225,662 Ordinary shares of 50k each 17,772,613 17,772,613
Ordinary shareholding:
Preference shareholding:
The movement on the issued and fully paid-up share capital account during the year was as follows:
BankDecember 2020
In thousands of Naira
Balance, beginning of the year 17,772,613
Balance, end of the year 17,772,613
BankDecember 2019
In thousands of Naira
Balance, beginning of the year 14,463,986Additions through scheme of merger 3,308,627 Balance, end of the year 17,772,613
(c) The movement on the number of shares in issue during the year was as follows:
Group GroupIn thousands of units December 2020 December 2019
Balance, beginning of the year 35,545,226 35,545,226 Balance, end of the year 35,545,226 35,545,226
B Share premiumShare premium is the excess paid by shareholders over the nominal value for their shares.
GroupDecember 2020
In thousands of Naira
Balance, beginning of the year 234,038,850 Balance, end of the year 234,038,850
Assumptions regarding future mortality before retirement are based on A49/52 ultimate table published by the Institute of Actuaries of United Kingdom. The rate used to discountpost employment benefit obligations has been determined by reference to the yield on Nigerian Government bonds of medium duration. This converts into an effective yield of 7.1%as at 31 December 2020. For members in active service as at the valuation date, the projected unit credit method of valuation as required under the IFRS has been adopted.
The holders of ordinary shares are entitled to receive dividends as declared from time to time and are entitled to vote at meetings of the Bank. All ordinary shares rank pari-passuwith the same rights and benefits at meetings of the Bank.
Preference shares do not carry the right to vote. Preference shareholders have priority over ordinary shareholders with regard to the residual assets of the Bank and participate onlyto the extent of the face value of the shares plus any accrued dividends. No preference shares were in issue as at the end of the year
38,000,000,000 Ordinary shares of 50k each
222

Access Bank Plc Consolidated and separate financial statements For the year ended 31 December 2020
GroupDecember 2019
In thousands of Naira
Balance, beginning of the year 197,974,816 Additions through scheme of merger 36,064,034 Balance, end of the year 234,038,850
C Retained earnings Restated RestatedGroup Group Bank Bank
December 2020 December 2019 December 2020 December 2019
Retained earnings 252,396,876 221,665,747 206,896,034 188,925,555
D Other components of equityGroup Group Bank Bank
December 2020 December 2019 December 2020 December 2019
Other regulatory reserves (see i(a) below) 115,575,107 93,322,654 95,067,598 83,061,699
Share Scheme reserve 876,762 1,881,768 876,761 1,881,767
Treasury Shares (5,111,646) (4,795,914) - -
Capital Reserve 3,489,080 3,489,080 3,489,081 3,489,081
Fair value reserve 60,106,564 964,243 59,574,139 835,473
Foreign currency translation reserve 18,132,330 11,780,013 - -
Regulatory risk reserve 46,425,978 18,091,941 36,180,585 9,483,000 239,494,174 124,733,785 195,188,164 98,751,020
(i) Other reserves
Other regulatory reserves
Statutory reserves
SMEEIS Reserves
i(a)December 2020 December 2019 December 2020 December 2019 December 2020 December 2019
GroupIn thousand of Naira
Opening 82,063,378 82,063,378 826,568 826,568 82,889,946 82,889,946 Transfers during the year 22,252,453 10,432,708 - - 22,252,453 10,432,708 Closing 104,315,831 92,496,086 826,568 826,568 105,142,399 93,322,654
BankIn thousand of Naira
Opening 71,199,773 71,199,773 826,568 826,568 72,026,341 72,026,341 Transfers during the year 12,005,900 11,035,359 - - 12,005,900 11,035,359 Closing 83,205,672 82,235,132 826,568 826,568 84,032,240 83,061,700
(ii) Share scheme reserveThis represents the total expenses incurred in providing the Bank's shares to its qualifying staff members under the RSPP scheme.
(iii) Treasury shares
(iv) Capital reserve
The Small and Medium Enterprises Equity Investment Scheme (SMEEIS) reserve is maintained to comply with the Central Bank of Nigeria (CBN)/ Banker's committee'srequirement that all licensed deposit money banks in Nigeria set aside a portion of the profit after tax in a fund to be sued to finance equity investment in qualifying small andmedium scale enterprises. Under the terms of the guideline (amended by a CBN letter dated 11 July 2006), the contributions will be 10% of profit after tax and shall continue afterthe first 5 years but banks' contribution shall thereafter reduce to 5% of profit after tax
However, this is no longer mandatory. Therefore, no additional appropriation has been done during the year.
The small and medium scale industries equity investment scheme reserves are non-distributable.
Statutory reserves
Nigerian banking regulations require the Bank to make an annual appropriation to a statutory reserve. As stipulated by S.16(1) of the Banks and Other Financial Institution Act ofNigeria, an appropriation of 30% of profit after tax is made if the statutory reserve is less than paid-up share capital and 15% of profit after tax if the statutory reserve is greater thanthe paid up share capital.
This represents the shares held by the new RSPP scheme which have not yet been allocated to staff based on the pre-determined vesting conditions.
This balance represents the surplus nominal value of the reconstructed shares of the Bank which was transferred from the share capital account to the capital reserve account afterthe share capital reconstruction in October 2006. The Shareholders approved the reconstruction of 13,956,321,723 ordinary shares of 50 kobo each of the Bank in issue to6,978,160,860 ordinary shares of 50 kobo each by the creation of 1 ordinary shares previously held.
TotalSMEEIS Reserves
223
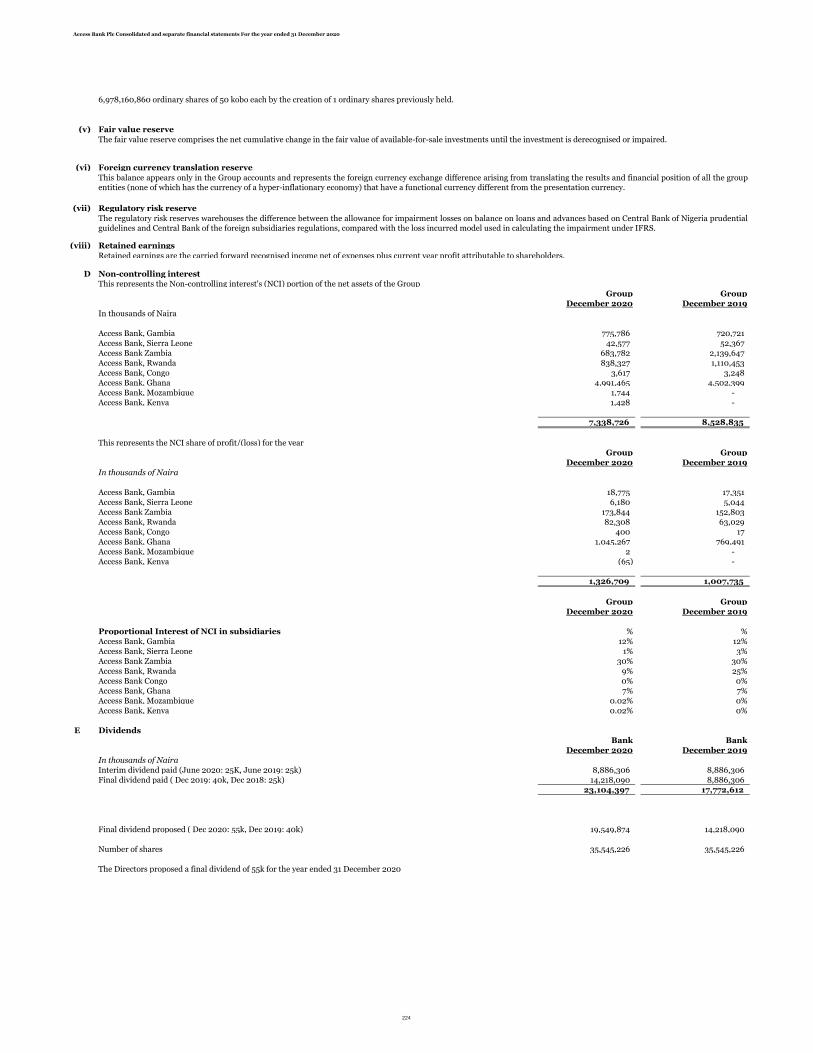
Access Bank Plc Consolidated and separate financial statements For the year ended 31 December 2020
(v) Fair value reserve
(vi) Foreign currency translation reserve
(vii) Regulatory risk reserve
(viii) Retained earnings
D Non-controlling interestThis represents the Non-controlling interest's (NCI) portion of the net assets of the Group
Group GroupDecember 2020 December 2019
In thousands of Naira
Access Bank, Gambia 775,786 720,721 Access Bank, Sierra Leone 42,577 52,367 Access Bank Zambia 683,782 2,139,647 Access Bank, Rwanda 838,327 1,110,453 Access Bank, Congo 3,617 3,248 Access Bank, Ghana 4,991,465 4,502,399 Access Bank, Mozambique 1,744 - Access Bank, Kenya 1,428 -
7,338,726 8,528,835
This represents the NCI share of profit/(loss) for the yearGroup Group
December 2020 December 2019In thousands of Naira
Access Bank, Gambia 18,775 17,351 Access Bank, Sierra Leone 6,180 5,044 Access Bank Zambia 173,844 152,803 Access Bank, Rwanda 82,308 63,029 Access Bank, Congo 400 17 Access Bank, Ghana 1,045,267 769,491 Access Bank, Mozambique 2 - Access Bank, Kenya (65) -
1,326,709 1,007,735
Group GroupDecember 2020 December 2019
Proportional Interest of NCI in subsidiaries % %Access Bank, Gambia 12% 12%Access Bank, Sierra Leone 1% 3%Access Bank Zambia 30% 30%
Access Bank, Rwanda 9% 25%Access Bank Congo 0% 0%Access Bank, Ghana 7% 7%Access Bank, Mozambique 0.02% 0%Access Bank, Kenya 0.02% 0%
E DividendsBank Bank
December 2020 December 2019In thousands of NairaInterim dividend paid (June 2020: 25K, June 2019: 25k) 8,886,306 8,886,306 Final dividend paid ( Dec 2019: 40k, Dec 2018: 25k) 14,218,090 8,886,306
23,104,397 17,772,612
Final dividend proposed ( Dec 2020: 55k, Dec 2019: 40k) 19,549,874 14,218,090
Number of shares 35,545,226 35,545,226
The Directors proposed a final dividend of 55k for the year ended 31 December 2020
This balance appears only in the Group accounts and represents the foreign currency exchange difference arising from translating the results and financial position of all the groupentities (none of which has the currency of a hyper-inflationary economy) that have a functional currency different from the presentation currency.
The regulatory risk reserves warehouses the difference between the allowance for impairment losses on balance on loans and advances based on Central Bank of Nigeria prudentialguidelines and Central Bank of the foreign subsidiaries regulations, compared with the loss incurred model used in calculating the impairment under IFRS.
Retained earnings are the carried forward recognised income net of expenses plus current year profit attributable to shareholders.
This balance represents the surplus nominal value of the reconstructed shares of the Bank which was transferred from the share capital account to the capital reserve account afterthe share capital reconstruction in October 2006. The Shareholders approved the reconstruction of 13,956,321,723 ordinary shares of 50 kobo each of the Bank in issue to6,978,160,860 ordinary shares of 50 kobo each by the creation of 1 ordinary shares previously held.
The fair value reserve comprises the net cumulative change in the fair value of available-for-sale investments until the investment is derecognised or impaired.
224

Access Bank Plc Consolidated and separate financial statements For the year ended 31 December 2020
39 Contingencies
Claims and litigation
Contingent liability and commitments
Nature of instruments
Acceptances, bonds, guarantees and other obligations for the account of customers:
a. These comprise:
Group Group Bank Bank
December 2020 December 2019 December 2020 December 2019
In thousands of Naira
Contingent liabilities:
Transaction related bonds and guarantees 378,808,847 477,932,817 335,064,193 451,514,549
Commitments:
419,584,999
824,347,792 897,517,816 676,815,757 776,043,912
Other contingent liabilities include transaction related custom and performance bonds and are generally short term commitments tothird parties which are not directly dependent on the customer's credit worthiness. Commitments to lend are agreements to lend to acustomer in the future, subject to certain conditions. Such commitments are either made for a fixed year, or have no specific maturitydates but are cancellable by the lender subject to notice requirements. Documentary credits commit the Group to make payments tothird parties, on production of documents, which are usually reimbursed immediately by customers.
The table below summarises the fair value amount of contingent liabilities and commitments off-financial position risk:
Clean line facilities for letters of credit, unconfirmed letters of credit and other commitments
445,538,945 341,751,564 324,529,363
The Group is a party to numerous legal actions arising out of its normal business operations. The Directors believe that, based oncurrently available information and advice of counsel, none of the outcomes that result from such proceedings will have a materialadverse effect on the financial position of the Group, either individually or in the aggregate. N1.9Bn provision has been made as at 31December 2020.
In common with other banks, Group conducts business involving acceptances, performance bonds and indemnities. The majority ofthese facilities are offset by corresponding obligations of third parties. Contingent liabilities and commitments comprise acceptances,endorsements, guarantees and letters of credit.
An acceptance is undertaken by a bank to pay a bill of exchange drawn on a customer. The Group expects most acceptances to bepresented, but reimbursement by the customer is normally immediate. Endorsements are residual liabilities of the Group in respectof bills of exchange, which have been paid and subsequently rediscounted.
Guarantees and letters of credit are given as security to support the performance of a customer to third parties. As the Group willonly be required to meet these obligations in the event of the customer's default, the cash requirements of these instruments areexpected to be considerably below their nominal amounts.
The Bank granted clean line facilities for letters of credit during the year to guarantee the performance of customers to third parties.Contractual capital commitments undertaken by the Bank during the year amounted to N2.011Bn(31 Dec 2019: N311.92Mn)
225

Access Bank Plc Consolidated and separate financial statements For the year ended 31 December 2020
40 Cash and cash equivalents
(a) Cash and cash equivalents include the following for the purposes of the statement of cash flows:
Group Group Bank BankDecember 2020 December 2019 December 2020 December 2019
In thousands of Naira
Cash on hand and balances with banks 502,781,098 431,130,867 456,588,630 321,270,808 Unrestricted balances with central banks 51,127,104 117,883,813 13,639,189 97,734,073 Money market placements 89,783,184 48,838,460 40,095,276 32,822,515 Investment under management 23,785,009 23,799,663 23,785,009 23,799,663 Treasury bills with original maturity of less than 90days 170,370,193 604,378,216 170,370,193 604,378,216
837,846,588 1,226,031,019 704,478,296 1,080,005,274
(b) Reconciliation of movements of liabilities to cash flows arising from financing activities
Group Bank Group BankDecember 2020 December 2020 December 2020 December 2020
Net debt 157,987,877 157,987,877 586,602,830 544,064,226 Proceeds from interest bearing borrowings - - 256,015,899 253,841,702 Repayment of interest bearing borrowings - - (75,582,339) (66,636,469) Debt securities issued - - - - Repayment of debt securities issued - - - - Total changes from financing cash flows 157,987,877 157,987,877 767,036,390 731,269,458
The effect of changes in foreign exchange rates 11,102,708 11,102,708 19,565,682 19,565,680
Other changesInterest expense 19,305,691 19,305,691 25,760,799 24,562,225 Interest paid (19,236,218) (19,236,218) (20,907,634) (20,143,091) Balance 169,160,059 169,160,059 791,455,238 755,254,273
Group Bank Group BankDecember 2019 December 2019 December 2019 December 2019
Net debt 251,251,383 251,251,383 388,416,734 363,682,441 Proceeds from interest bearing borrowings - - 245,332,824 223,834,913 Arising from business combination 74,270,686 74,270,687 92,240,672 92,240,672 Repayment of interest bearing borrowings - - (142,101,478) (138,295,724) Debt securities issued 45,000,000 45,000,000 - - Repayment of debt securities issued (216,208,000) (216,208,000) - - Total changes from financing cash flows 154,314,070 154,314,070 583,888,753 541,462,303
The effect of changes in foreign exchange rates 3,124,782 3,124,782 2,080,812 2,085,384
Other changesInterest expense 22,913,352 22,913,352 22,908,552 21,865,024 Interest paid (22,364,327) (22,364,327) (22,275,286) (21,348,484) Balance 157,987,877 157,987,877 586,602,830 544,064,227
(C) Non-cash investing activities and financing activities:The following activities as listed below are the items that have been identified as non cash investing and financing activities arising from the merger
Acquisition of Right of use assets-(see note 28 (b)
Partial settlement of a business combination through the issuance of shares (see note 44(a)i
41 Contraventions of the Banks and Other Financial Institutions Act of Nigeria and CBN circulars
S/N Regulatory Body Infraction Date
(I) Central Bank of Nigeria 28 Feb 2020
(II) Central Bank of Nigeria 2 Mar 2020
(III) Central Bank of Nigeria 5 Feb 2020
(IV)
The Nigerian stock exchange 27 Jan 2020
(V) Central Bank of Nigeria 21 July 2020
(VI) Central Bank of Nigeria 25 Aug 2020
(VII) Central Bank of Nigeria 23 Sep 2020
42 Events after reporting date
43 Related party transactions
Transactions with key management personnel
Parent
Sum of N220 million in respect of sourcing for FX from the Nigerian FXmarket for the importation of Textile
Sum of N57 million in respect of failure to comply with the CBNsAML/CFT review for the period of April 2018-March 2019
Sum of N42.8million in respect of failure to comply with the CBNsAML/CFT regulations and KYC policies in a transaction
Sum of N2.2 million in respect of failure to obtain Exchange's (NSE)approval prior to announcement of Notice of Meeting of Board ofDirectors of the Bank
Sum of N1million in respect of operating a Tier 3 account without validmeans of ID
Sum of N10million in respect of inadequate KYC and KYCB and filingSTR relating to IBSmartify Nigeria
The parent company, which is also the ultimate parent company, is Access Bank Plc.
Sum of N131.23million in respect of contravention of CBN FOREXmanual and TED ACT
Subsequent to the end of the financial year, the Board of Directors proposed a final dividend of 55k each payable to shareholders on register of shareholding at the closure date.
Parties are considered to be related if one party has the ability to control the other party or exercise influence over the other party in making financial and operational decisions, or one other party controls both. The definition includes subsidiaries, associates, joint ventures and the Group’s pension schemes, as well as key management personnel.
The Group’s key management personnel, and persons connected with them, are also considered to be related parties. The definition of key management includes the close members of family of key personnel and any entity over which key management exercise control.The key management personnel have been identified as the executive and non-executive directors of the Group. Close members of family are those family members who may be expected to influence, or be influenced by that individual in their dealings with Access BankPlc and its subsidiaries.
Cash and cash equivalent for the purpose of the preparation of the statement of cash flows excludes cash collaterals held for letters of credit and the mandatory cash deposit held with the Central Bank of Nigeria.
Debt securities issued Interest bearing borrowings
Debt securities issued Interest bearing borrowings
226
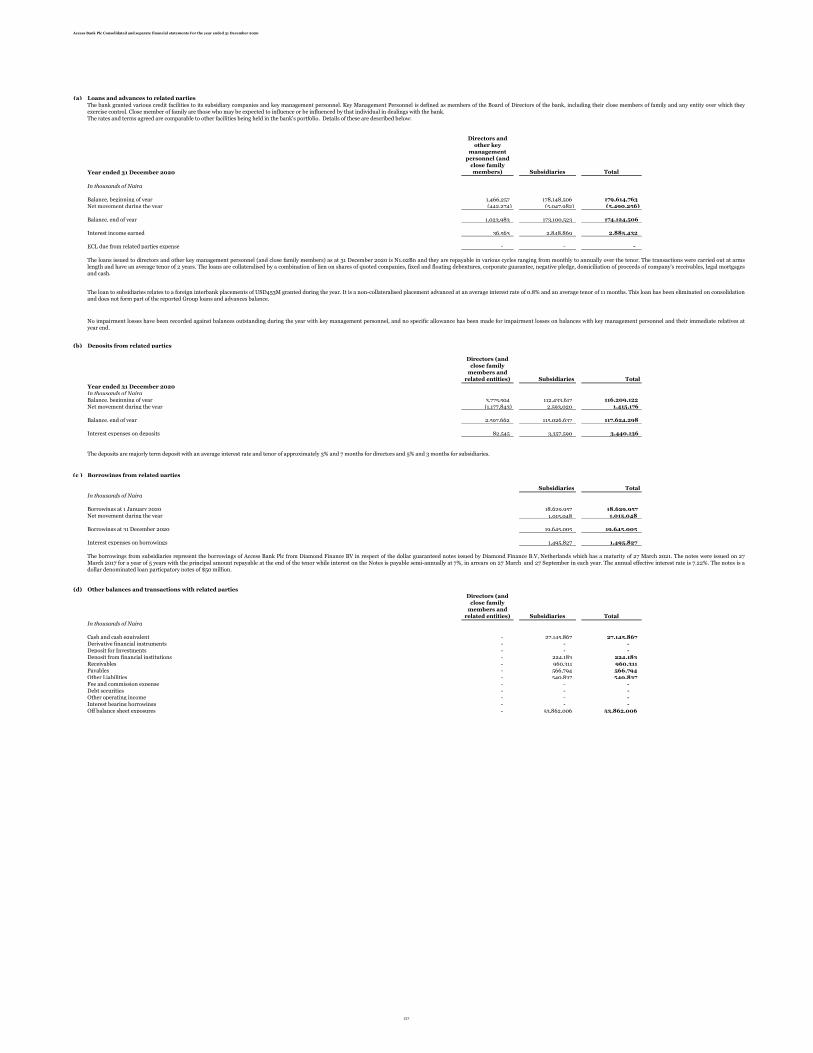
Access Bank Plc Consolidated and separate financial statements For the year ended 31 December 2020
(a) Loans and advances to related parties
Year ended 31 December 2020
Directors and other key
management personnel (and
close family members) Subsidiaries Total
In thousands of Naira
Balance, beginning of year 1,466,257 178,148,506 179,614,763
Net movement during the year (442,274) (5,047,982) (5,490,256)
Balance, end of year 1,023,983 173,100,523 174,124,506
Interest income earned 36,563 2,848,869 2,885,432
ECL due from related parties expense - - -
(b) Deposits from related parties
Directors (and close family
members and related entities) Subsidiaries Total
Year ended 31 December 2020In thousands of NairaBalance, beginning of year 3,775,504 112,433,617 116,209,122
Net movement during the year (1,177,843) 2,593,020 1,415,176
Balance, end of year 2,597,662 115,026,637 117,624,298
Interest expenses on deposits 82,545 3,357,590 3,440,136
(c ) Borrowings from related parties
Subsidiaries Total
In thousands of Naira
Borrowings at 1 January 2020 18,629,957 18,629,957 Net movement during the year 1,015,048 1,015,048
Borrowings at 31 December 2020 19,645,005 19,645,005
Interest expenses on borrowings 1,495,827 1,495,827
(d) Other balances and transactions with related partiesDirectors (and
close family members and
related entities) Subsidiaries Total
In thousands of Naira
Cash and cash equivalent - 27,145,867 27,145,867 Derivative financial instruments - - - Deposit for Investments - - - Deposit from financial institutions - 224,183 224,183 Receivables - 960,311 960,311 Payables - 566,794 566,794 Other Liabilities - 540,837 540,837 Fee and commission expense - - - Debt securities - - - Other operating income - - - Interest bearing borrowings - - - Off balance sheet exposures - 53,862,006 53,862,006
The deposits are majorly term deposit with an average interest rate and tenor of approximately 3% and 7 months for directors and 5% and 3 months for subsidiaries.
The loan to subsidiaries relates to a foreign interbank placements of USD453M granted during the year. It is a non-collateralised placement advanced at an average interest rate of 0.8% and an average tenor of 11 months. This loan has been eliminated on consolidationand does not form part of the reported Group loans and advances balance.
No impairment losses have been recorded against balances outstanding during the year with key management personnel, and no specific allowance has been made for impairment losses on balances with key management personnel and their immediate relatives atyear end.
The borrowings from subsidiaries represent the borrowings of Access Bank Plc from Diamond Finance BV in respect of the dollar guaranteed notes issued by Diamond Finance B.V, Netherlands which has a maturity of 27 March 2021. The notes were issued on 27March 2017 for a year of 5 years with the principal amount repayable at the end of the tenor while interest on the Notes is payable semi-annually at 7%, in arrears on 27 March and 27 September in each year. The annual effective interest rate is 7.22%. The notes is adollar denominated loan particpatory notes of $50 million.
The loans issued to directors and other key management personnel (and close family members) as at 31 December 2020 is N1.02Bn and they are repayable in various cycles ranging from monthly to annually over the tenor. The transactions were carried out at armslength and have an average tenor of 2 years. The loans are collateralised by a combination of lien on shares of quoted companies, fixed and floating debentures, corporate guarantee, negative pledge, domiciliation of proceeds of company's receivables, legal mortgagesand cash.
The bank granted various credit facilities to its subsidiary companies and key management personnel. Key Management Personnel is defined as members of the Board of Directors of the bank, including their close members of family and any entity over which theyexercise control. Close member of family are those who may be expected to influence or be influenced by that individual in dealings with the bank.The rates and terms agreed are comparable to other facilities being held in the bank's portfolio. Details of these are described below:
227

Access Bank Plc Consolidated and separate financial statements For the year ended 31 December 2020
(e) Key management personnel compensation for the year comprises:
Directors’ remunerationDecember 2020 December 2019
In thousands of Naira
Non-executive DirectorsFees 54,820 51,875 Other emoluments:Allowances 550,804 421,955
605,624 473,830
December 2020 December 2019Executive directorsShort term employee's benefit 332,500 266,420 Defined contribution plan 31,615 27,840 Share based payment 45,923 68,628 Retirement benefits paid - 415,000
410,038 777,888
(f) Directors remuneration:
Remuneration paid to directors of the Bank (excluding pension contributions and other benefits) was as follows:
December 2020 December 2019In thousands of Naira
Fees as Directors 54,820 51,875 Other emoluments 381,916 286,330 Wages and salaries 332,500 266,420 Allowances 168,889 135,625
The Directors remuneration shown above includesDecember 2020 December 2019
Chairman 65,630 52,208 Highest paid director 120,000 85,160
The emoluments of all other directors fell within the following ranges:December 2020 December 2019
N13,000,001-N20,000,000 - - N20,000,001-N37,000,000 7 6 AboveN37,000,000 10 9
17 15
228

Access Bank Plc Consolidated and separate financial statements For the year ended 31 December 2020
44 Business Combination
(a)
Intangible Useful life
Core deposits intangible DefiniteCustomer relationship DefiniteBrand DefiniteGoodwill Indefinite Goodwill Indefinite
The residual Goodwill of N4.6bn has been allocated to the Bank's business segements as shown below:
In thousands of NairaGroup Bank
September 2020 September 2020Corporate and Investment Banking 1,568,579 3,790,426 Commercial Banking 865,857 1,672,247 Business Banking 1,459,238 2,118,179 Personal Banking 661,156 3,567,460
4,554,830 11,148,311
Measurement of fair values
Assets acquired
Property, plant and equipment
Intangible assets
Investment securities
In thousands of Naira Group BankDecember 2019 December 2019
Considerations:Cash payment 23,160,389 23,160,389 Access Bank's shares issued to Diamond Bank'sshareholders (see (i) below) 39,372,661 39,372,661
Total Consideration 62,533,050 62,533,050
2,962,303 (3,631,175)
Fair value adjustment 55,015,915 55,015,916
57,978,218 51,384,741
Goodwill 4,554,832 11,148,311
(i)
The fair value of the net assets/ (liabilities) acquired include:
(b) Fair value Total Fair value Total
Group adjustment Fair value Bank adjustment Fair value
March 2019 March 2019 March 2019 March 2019 March 2019 March 2019
AssetsCash and balances with banks 311,585,028 - 311,585,028 311,581,376 - 311,581,376 Non pledged trading assets 20,811,592 - 20,811,592 20,811,592 - 20,811,592 Derivative financial assets 336,110 - 336,110 336,110 - 336,110 Pledged assets 107,279,524 - 107,279,524 107,204,232 - 107,204,232 Loans to banks 82,959,460 - 82,959,460 107,224,889 - 107,224,889 Loans and advances to customers 510,828,965 - 510,828,965 510,813,249 - 510,813,249 Investment securities 155,918,073 (3,568,189) 152,349,884 155,812,009 (3,568,189) 152,243,819 Investment properties 4,053,511 - 4,053,511 3,878,511 - 3,878,511 Other assets 36,519,653 - 36,519,653 36,417,649 - 36,417,649 Investment in subsidiaries - - - 2,000,000 - 2,000,000 Investment in associates 98,915 - 98,915 98,915 - 98,915 Property and equipment 63,706,493 12,543,263 76,249,756 63,636,623 12,543,265 76,179,887 Intangible assets 48,415,967 46,040,842 94,456,809 48,351,207 46,040,842 94,392,050 Deferred tax assets 4,984,388 - 4,984,388 4,984,389 - 4,984,389
1,347,497,679 55,015,915 1,402,513,594 1,373,150,750 55,015,916 1,428,166,668 Asset classified as held for sale and discontinued operations 48,965,253 - 48,965,253 7,976,260 - 7,976,260 Total assets 1,396,462,932 55,015,915 1,451,478,847 1,381,127,010 55,015,916 1,436,142,928
LiabilitiesDeposits from financial institutions 51,430,800 - 51,430,800 51,430,800 - 51,430,800 Deposits from customers 1,101,188,191 - 1,101,188,191 1,105,069,175 - 1,105,069,175 Derivative Liabilities 18,294 - 18,294 18,294 - 18,294 Current tax liabilities 472,844 - 472,844 327,525 - 327,525 Other liabilities 54,182,450 - 54,182,450 61,401,034 - 61,401,034 Deferred tax liabilities 13,071 - 13,071 - - - Debt securities issued 74,270,686 - 74,270,686 74,270,686 - 74,270,686 Interest-bearing borrowings 92,240,671 - 92,240,671 92,240,671 - 92,240,671
1,373,817,007 - 1,373,817,007 1,384,758,185 - 1,384,758,185 Liabilities classified as held for sale and discontinued operations 19,683,622 19,683,622 - - - Total liabilities 1,393,500,629 - 1,393,500,629 1,384,758,185 - 1,384,758,185
Net assets/ (liabilities) 2,962,303 55,015,915 57,978,218 (3,631,175) 55,015,916 51,384,743
Access Bank Plc completed the merger with former Diamond Bank Plc with effect from 19 March 2019. The merger involved Access Bank acquiring the entire issued share capital of Diamond Bank in exchange for a combination of cash consideration and shares inAccess Bank via a Scheme of Merger. The Bank also completed an acquisition of Transnational Bank Kenya with details in note (c) below
In fulfilment of the consideration for the acquisition, Diamond Bank’s shareholders received a consideration comprising (i) a cash consideration of N1.00 (one Naira) per Diamond Bank Share representing a total cash amount of N23,160,388,968 (twenty-three billion,one hundred and sixty million, three hundred and eighty-eight thousand, nine hundred and sixty-eight Naira) (ii) the allotment of 6,617,253,991 (six billion, six hundred and seventeen million two hundred and fifty-three thousand, nine hundred and ninety-one) newAccess Bank ordinary shares, representing the 2 new Access Bank ordinary shares for every 7 Diamond Bank shares. The acquisition was accounted for as a business combination which resulted in acquired intangible assets of N50.60bn (Bank, N57.19bn).
Net assets/(liabilities) acquired from business combination prior to fair value adjustment (see note 44 (b) below)
Core deposits, brand and customer relationship intangible assets are amortized over 10 years. Intangible assets with indefinite useful life are tested for impairment annually or whenever there is an impairment trigger.
The valuation techniques used for measuring the fair value of material assets acquired were as follows.
Reference to quoted observable market prices of the instruments or similar instruments
Adjusted Net assets/(liabilities) acquired from business combination (see note 44 (b) below)
The purchase price allocation for the acquired intangibles from Diamond Bank was not completed as at the last reporting date but has now been completed in this financial statement. These comprise Core deposits intangible of N28.7bn, Customer relationship ofN12.7bn, Brand of N4.7bn and Goodwill of N4.6bn for group (Bank: Core deposits intangible of N28.7bn, Customer relationship of N12.7bn, Brand of N4.7bn and Goodwill of N11.14bn). The intangible assets have been categorized into those with definite and indefiniteuseful life as follows
The methods employed for the measurement of fair values for identifiable intangible assets are: Relief-from-royalty method , Replacement Cost and the Funding Benefit Method
The relief-from-royalty method considers (The Rfr method) values the brand by reference to the amount of royalty the acquirer would pay in an arm’s length transaction i.e. itestimates the value for an asset based on the cost savings realised through ownership compared to paying licencing fees. The multi-period excess earnings method; The multi-period excess earnings method considers the present value of net cash flows expected to be generated by the customerrelationships, by excluding any cash flows related to contributory assets.
The replacement cost value: The replacement cost method is used to determine the value of customer relationship and is calculated as the estimated cost of acquiring new customersmultiplied by the number of unique customers acquired from the Transaction.
The Funding Benefit Method: The Funding Benefit Method is calculated based on the after-tax present values of the net cost of funding, defined as the difference between theinterest expense on acquired deposit and the cost of alternative funding over the useful life of the deposit; and net service fees earned on the deposits (net income earned as apercentage of deposit.
Business Combination with Diamond Bank
6,617,253,991 (six billion, six hundred and seventeen million two hundred and fifty-three thousand, nine hundred and ninety-one) new Access Bank ordinary shares, representing the 2 new Access Bank ordinary shares were alloted for every 7 Diamond Bank shares.
The fair value of the shares alloted was derived at Access Bank's market price of N5.95 as at the effective date of the merger i.e 19th March 2019. The total acquisition-related costs are within merger costs within other operating expenses. Issue costs amount to201.95Mn, and the remaining amount of N6.39Bn relates to all other non-issuance related transaction costs.
Market comparison technique and cost technique: The valuation model considers quoted market prices for similar items when they are available, and depreciated replacement costwhen appropriate. Depreciated replacement cost reflects adjustments for physical deterioration as well as functional and economic obsolescence.
Valuation technique
229

Access Bank Plc Consolidated and separate financial statements For the year ended 31 December 2020
(c)
In thousands of Naira BankJuly 2020
Considerations:Cash payment 4,225,808 Consideration deferred 1,291,620
Total Consideration 5,517,428
(1,028,905) Goodwill 6,546,333
The fair value of the net assets/(liabilities) acquired include:
(d)Group
July 2020AssetsCash and balances with banks 7,618,165 Non pledged trading assets - Derivative financial assets - Pledged assets - Loans to banks - Loans and advances to customers 17,416,132 Investment securities 12,143,738 Investment properties - Other assets 1,915,647 Investment in subsidiaries - Investment in associates - Property and equipment 575,777 Intangible assets 104,643 Deferred tax assets 597,462
40,371,563 Asset classified as held for sale and discontinued operations -
Total assets 40,371,563
LiabilitiesDeposits from financial institutions - Deposits from customers 32,906,716 Derivative Liabilities - Current tax liabilities - Other liabilities 8,493,018 Deferred tax liabilities - Debt securities issued - Interest-bearing borrowings -
41,399,734 Liabilities classified as held for sale and discontinued operations - Total liabilities 41,399,734
Net assets/ (liabilities) (1,028,171)
Non controlling interest 734
Owners of the Bank equity (1,028,905)
Net assets/ (liabilities) acquired from business combination (see note 44 (d) below)
Business Combination with Transnational Bank Kenya
The Bank recently acquired Transnational Bank in Kenya with effect from 20 July 2020. The acquisition involved the Bank acquiring the 99.98% issued share capital of Transnational Bank in exchange for cash consideration of N5,517,428,970 (Five billion, fivehundred and seventeen thousand, four hundred and twenty eight thousand, nine hundred and seventy naira)
In fulfilment of the consideration for the acquisition, Transnational Bank’s shareholders received a total cash consideration offer of N5,634,410,000 comprising of (i) a cash consideration payment of N4,225,807,500 (Four billion, two hundred and twenty five million,eight hundred and seven thousand, five hundred Naira) (ii) a deferred payment of N1,408,602,500 (one billion, four hundred and eight million six hundred and two thousand, five hundred naira) to be made to shareholders at the expiration of 2 years. For the purposeof the goodwill computation , this deferred consideration has been carried at its present value of N1,291,620, 470 using a discount rate of 4.24% . This discount rate was estimated using a financial instrument close to cash in liquidity and the country risk premium forKenya. The goodwill computation is provisional at the time of this report.
230

Access Bank Plc Consolidated and separate financial statements For the year ended 31 December 2020
45
1 Paul Usoro & Company Non-executive director Mr Paul Usoro Overdraft 200,599,868 Performing Cash collateralCredit Card 21,807,961 Performing Cash collateral
2 Okey Nwuke Non-executive director Mr Okey Nwuke Term Loan 15,000,000 Performing Cash collateralOverdraft 3,802,259 Performing Cash collateralCredit Card 1,640,240 Performing Cash collateral
Balance, end of year 242,850,328
Below is a schedule showing the details of the Bank’s director-related lending:
The Bank’s principal exposure to all its directors as at 31 December 2020 is N242.85Mn. However, the relevant obligors under this category also have credit balances and deposits maintained in their bank accounts which mitigate the risks to the bank.
Facility type Outstanding Principal
Status Nature of security
Director-related exposures
Access Bank has some exposures that are related to its Directors. The Bank however follows a strict process before granting such credits to its Directors. The requirements for creating and managing this category of risk assets include the following amongst others:
b. Full compliance with the relevant CBN policies on insider-related lending.c. All affected Directors are precluded from taking part in the approval process of credit request wherein they have interest.
a. Complete adherence to the requirements for granting insider-related exposure as stated in the Bank’s Credit Policy Guidelines, the Insider-related Policy as well as the Bank’s duly approved Standard Operating Procedure for managing insider-related exposures.
S/N Name of borrower Relationship to reporting institution Name of related
d. The related Director is required to execute a document authorizing the Bank to use their accruable dividends to defray any related-obligor's delinquent exposures.
e. The Directors are required to execute documents for the transfer of their shares to the Bank’s nominated broker to ensure effective control as required by the CBN policy to enhance the bank’s Corporate Governance structure.
f. Section 89 of the Bank’s Article of Association also reiterated that “a related Director shall vacate office or cease to be a Director, if the Director directly or indirectly enjoys a facility from the Bank that remains non-performing for a year of more than 12months.”
231

Access Bank Plc Consolidated and separate financial statements For the year ended 31 December 2020
46 (a) Restatement of prior year financial information
(i) Changes to statement of changes in equity
In thousands of Naira
Reported Restatements Restated Reported Restatements Restated
Group Group Bank Bank
December 2019 December 2019 December 2019 December 2019
Retained earnings 225,118,812 - 225,118,812 192,378,618 - 192,378,618
Restatement of identified intangible asset at acquisition amortization for Dec 2019 - (3,453,063) (3,453,063) - (3,453,063) (3,453,063)
Restated balance as at 31 Dec 2019 225,118,812 (3,453,063) 221,665,749 192,378,618 (3,453,063) 188,925,555
Reported Restatements Restated Reported Restatements Restated
Group Group Bank Bank
December 2019 December 2019 December 2019 December 2019
(ii) Changes to statement of financial position
Intangibles 14,656,075 - 14,656,075 13,814,576 - 13,814,576
Restatement of identified intangible asset at acquisition amortization charge for Dec 2019 - 42,587,779 42,587,779 - 42,587,779 42,587,778
Restatement of goodwill 51,276,679 (46,040,842) 5,235,837 57,189,153 (46,040,842) 11,148,310
Restated balance 65,932,754 (3,453,063) 62,479,691 71,003,729 (3,453,063) 67,550,665
Reported Restatements Restated Reported Restatements Restated
Group Group Bank Bank
December 2019 December 2019 December 2019 December 2019 December 2019 December 2019
(iii) Changes to statement of comprehensive income
Interest income on financial assets not at FVTPL 349,199,671 - 349,199,671 300,510,653 - 300,510,653
Interest income on financial assets at FVTPL 55,825,762 - 55,825,762 54,417,303 - 54,417,303
Interest expense (194,807,420) (194,807,420) (179,072,242) (179,072,242)
Net interest income 210,218,012 - 210,218,012 175,855,715 - 175,855,715
Net impairment charge (10,610,692) - (10,610,692) (9,505,859) - (9,505,859)
Net interest income after impairment charges 199,607,321 - 199,607,321 166,349,856 - 166,349,856
Fee and commission income 66,895,896 54,098,695 54,098,696
Fee and commission expense (10,885,463) - (10,885,463) (10,381,363) - (10,381,363)
Net fee and commission income 56,010,432 - (10,885,463) 43,717,332 - 43,717,333
Net gains/(loss) on investment securities 3,326,374 - 3,326,374 2,178,114 - 2,178,114
Net foreign exchange (loss)/income 5,150,845 - 5,150,845 (2,019,002) - (2,019,002)
Other operating income 33,257,112 - 33,257,112 32,037,829 - 32,037,829
Profit on disposal of subsidiaries - - 4,287,666 - 4,287,666
Personnel expenses (54,699,489) - (54,699,489) (42,551,164) - (42,551,164)
Rent expenses (1,366,945) - (1,366,945) (88,682) - (88,682)
Depreciation (14,210,518) - (14,210,518) (12,352,652) - (12,352,652)
Amortization (3,101,310) - (3,101,310) (2,761,187) - (2,761,187)
Restatement of amortization of identified intangible asset at acquisition for 2019 - (3,453,063) (3,453,063) - (3,453,063) (3,453,063)
Other operating expenses (120,869,750) - (120,869,750) (110,980,459) - (110,980,459)
Profit before tax 103,104,073 (3,453,063) 99,651,011 77,817,652 (3,453,063) 74,364,587
Income tax (12,364,485) - (12,364,485) (8,562,487) - (8,562,484)
Profit for the period 90,739,588 (3,453,063) 87,286,525 69,255,165 (3,453,063) 65,802,102
Other comprehensive income (OCI) net of income tax :
Remeasurements of post-employment benefit obligations - - - - - -
Items that may be subsequently reclassified to the income statement:
Foreign currency translation differences for foreign subsidiaries
- Realised gains during the period - - - - - -
- Unrealised gains /(losses) during the period (1,232,498) - (1,232,498) - - -
Net changes in fair value of AFS financial instruments
-Fair value changes during the period 4,534,141 - 4,534,141 4,474,174 - 4,474,174 Fair value changes on AFS financial instruments from associates 10,043 - 10,043 10,043 - 10,043
Other comprehensive gain, net of related tax effects 3,311,686 (3,453,063) (141,377) 4,484,217 (3,453,063) 1,031,154
Total comprehensive income for the period 94,051,273 (3,453,063) 90,598,210 73,739,381 (3,453,063) 70,286,318
Profit attributable to:
Owners of the bank 89,749,759 (3,453,063) 86,296,696 69,255,165 (3,453,063) 65,802,101
Non-controlling interest 989,829 - 989,829 - - -
Profit for the period 90,739,588 (3,453,063) 87,286,524 69,255,165 (3,453,063) 65,802,101
Total comprehensive income attributable to:
Owners of the bank 93,830,404 (3,453,063) 90,377,341 73,739,381 (3,453,063) 70,286,318
Non-controlling interest 220,870 - 220,870 - - -
Total comprehensive income for the period 94,051,273 (3,453,063) 90,598,210 73,739,381 (3,453,063) 70,286,318
Earnings per share attributable to ordinary shareholders
Restated Basic (kobo) 290 (31) 259 217 (23) 194
Restated Diluted (kobo) 285 (31) 255 217 (23) 194
Amortization of identified intangible asset at acquisition for 2019
(a) Effect of reduction of N3.45bn amortization charge in retained earnings on statement of changes in equity
(b) Effect of N3.45bn amortization charge recognised in intangibles as a result of amortization of goodwill from merger of former Diamond Bank on statement of financial position
(c)
The purchase price allocation for the acquired intangibles have now been concluded. These comprise Core deposits intangible of N28.7bn, Customer relationship of N12.7bn, Brand of N4.7bn and Goodwill ofN4.6bn.
Effect of N3.45bn additional amortization charge recognised as a result of amortization of identifiable intnagible asset from merger of former Diamond Bank on statement of comprehensive income
1
1
232
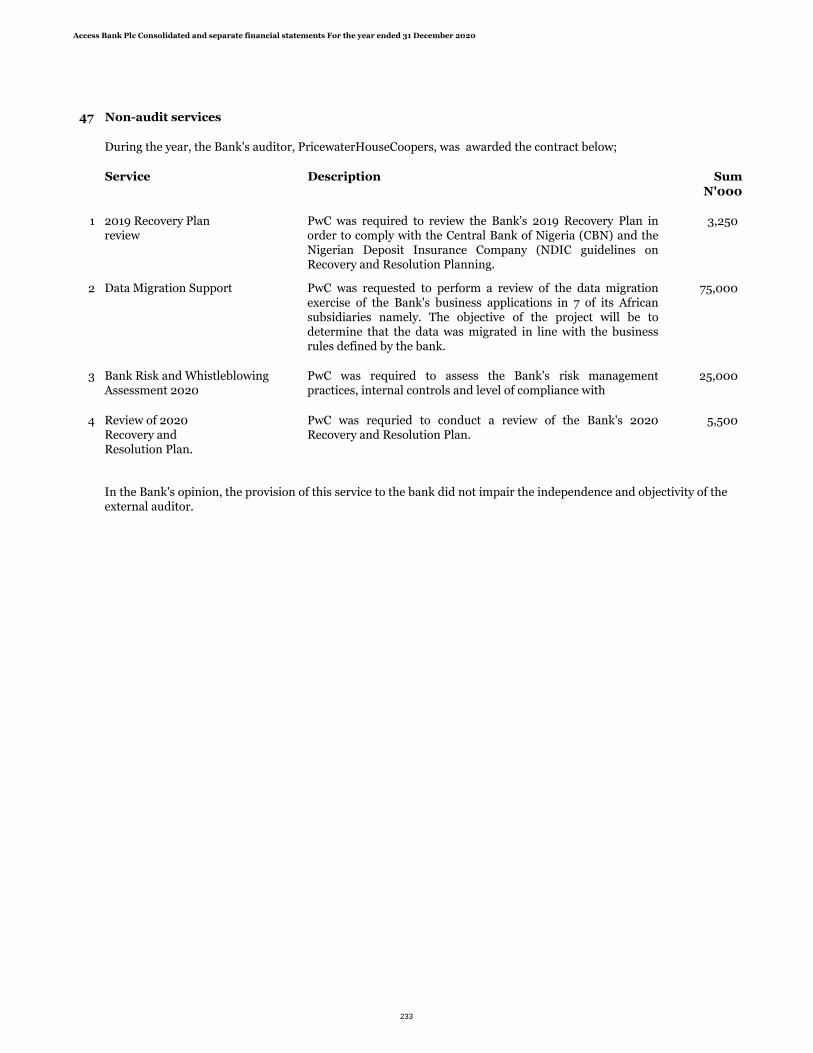
Access Bank Plc Consolidated and separate financial statements For the year ended 31 December 2020
47 Non-audit services
Service Description Sum
N'000
1 2019 Recovery Plan review
2
3
4 Review of 2020 Recovery and Resolution Plan.
5,500
Bank Risk and Whistleblowing Assessment 2020
PwC was required to assess the Bank's risk managementpractices, internal controls and level of compliance with
25,000
PwC was requried to conduct a review of the Bank's 2020Recovery and Resolution Plan.
In the Bank's opinion, the provision of this service to the bank did not impair the independence and objectivity of the external auditor.
During the year, the Bank's auditor, PricewaterHouseCoopers, was awarded the contract below;
PwC was required to review the Bank's 2019 Recovery Plan inorder to comply with the Central Bank of Nigeria (CBN) and theNigerian Deposit Insurance Company (NDIC guidelines onRecovery and Resolution Planning.
3,250
Data Migration Support PwC was requested to perform a review of the data migrationexercise of the Bank's business applications in 7 of its Africansubsidiaries namely. The objective of the project will be todetermine that the data was migrated in line with the businessrules defined by the bank.
75,000
233
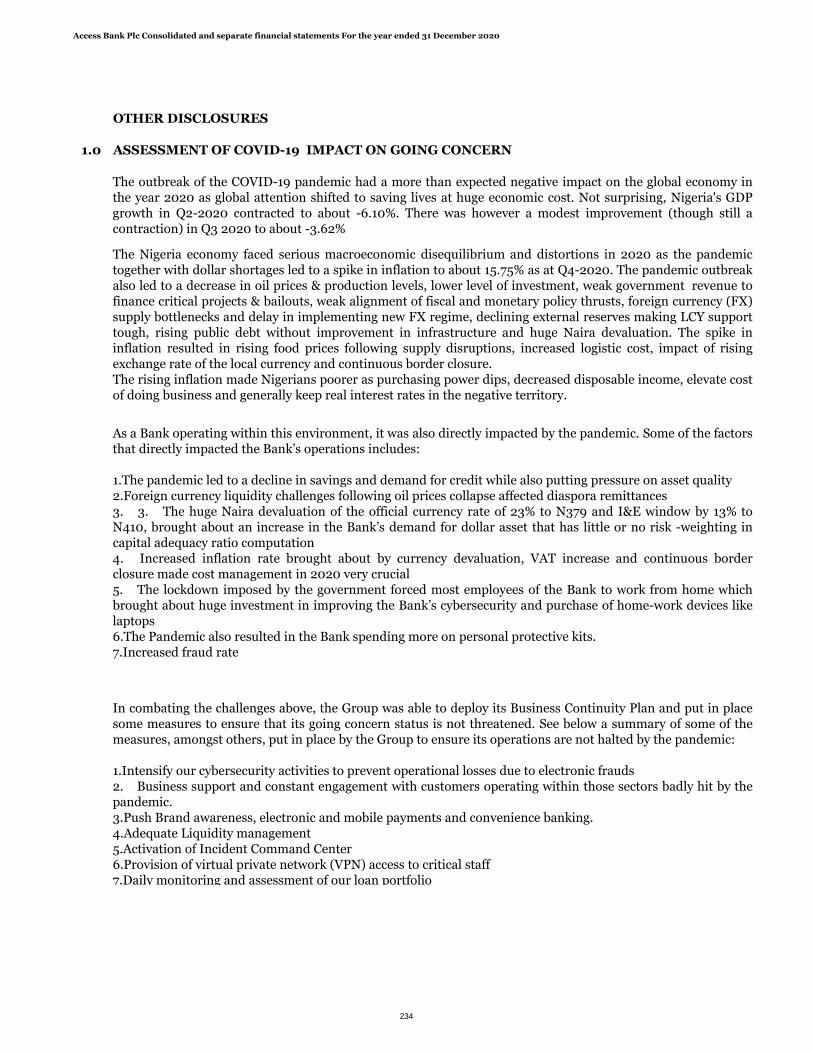
Access Bank Plc Consolidated and separate financial statements For the year ended 31 December 2020
OTHER DISCLOSURES
1.0 ASSESSMENT OF COVID-19 IMPACT ON GOING CONCERN
The outbreak of the COVID-19 pandemic had a more than expected negative impact on the global economy inthe year 2020 as global attention shifted to saving lives at huge economic cost. Not surprising, Nigeria's GDPgrowth in Q2-2020 contracted to about -6.10%. There was however a modest improvement (though still acontraction) in Q3 2020 to about -3.62%
The Nigeria economy faced serious macroeconomic disequilibrium and distortions in 2020 as the pandemictogether with dollar shortages led to a spike in inflation to about 15.75% as at Q4-2020. The pandemic outbreakalso led to a decrease in oil prices & production levels, lower level of investment, weak government revenue tofinance critical projects & bailouts, weak alignment of fiscal and monetary policy thrusts, foreign currency (FX)supply bottlenecks and delay in implementing new FX regime, declining external reserves making LCY supporttough, rising public debt without improvement in infrastructure and huge Naira devaluation. The spike ininflation resulted in rising food prices following supply disruptions, increased logistic cost, impact of risingexchange rate of the local currency and continuous border closure.The rising inflation made Nigerians poorer as purchasing power dips, decreased disposable income, elevate costof doing business and generally keep real interest rates in the negative territory.
As a Bank operating within this environment, it was also directly impacted by the pandemic. Some of the factorsthat directly impacted the Bank’s operations includes:
1.The pandemic led to a decline in savings and demand for credit while also putting pressure on asset quality2.Foreign currency liquidity challenges following oil prices collapse affected diaspora remittances3. 3. The huge Naira devaluation of the official currency rate of 23% to N379 and I&E window by 13% toN410, brought about an increase in the Bank’s demand for dollar asset that has little or no risk -weighting incapital adequacy ratio computation4. Increased inflation rate brought about by currency devaluation, VAT increase and continuous borderclosure made cost management in 2020 very crucial5. The lockdown imposed by the government forced most employees of the Bank to work from home whichbrought about huge investment in improving the Bank’s cybersecurity and purchase of home-work devices likelaptops6.The Pandemic also resulted in the Bank spending more on personal protective kits.7.Increased fraud rate
In combating the challenges above, the Group was able to deploy its Business Continuity Plan and put in placesome measures to ensure that its going concern status is not threatened. See below a summary of some of themeasures, amongst others, put in place by the Group to ensure its operations are not halted by the pandemic:
1.Intensify our cybersecurity activities to prevent operational losses due to electronic frauds2. Business support and constant engagement with customers operating within those sectors badly hit by thepandemic.3.Push Brand awareness, electronic and mobile payments and convenience banking.4.Adequate Liquidity management5.Activation of Incident Command Center6.Provision of virtual private network (VPN) access to critical staff7.Daily monitoring and assessment of our loan portfolio8.Continuous communications and customer engagements throughout this period.9. Constant monitoring of sectors severely affected by the pandemic and proactively ascertaining the liquidityof secured collateral to exposure in the sector10. To manage increased operating cost brought about by the pandemic, several cost cutting initiatives wereintroduced within the Bank11. Constant monitoring of staff working from Home to ensure that the Bank’s productivity level does notrelapse.
234

Access Bank Plc Consolidated and separate financial statements For the year ended 31 December 2020
As the global economy is currently recovering from the first wave of the pandemic and with the fear of a looming second wave, the possible quantitative impact to the Group is constantly being monitored and reviewed.
At this point however, the impact on our business and results has not been significant and based on ourexperience to date we expect this to remain the case. We will continue to follow various government policies and advice, and we will do our utmost to continue our operations in the best and safest way possible withoutjeopardising the health of our people. The Group is confident that, based on the risk management processes inplace, the going concern status of the institution is not threatened and the Group will continue to operate intothe foreseeable future
In combating the challenges above, the Group was able to deploy its Business Continuity Plan and put in placesome measures to ensure that its going concern status is not threatened. See below a summary of some of themeasures, amongst others, put in place by the Group to ensure its operations are not halted by the pandemic:
1.Intensify our cybersecurity activities to prevent operational losses due to electronic frauds2. Business support and constant engagement with customers operating within those sectors badly hit by thepandemic.3.Push Brand awareness, electronic and mobile payments and convenience banking.4.Adequate Liquidity management5.Activation of Incident Command Center6.Provision of virtual private network (VPN) access to critical staff7.Daily monitoring and assessment of our loan portfolio8.Continuous communications and customer engagements throughout this period.9. Constant monitoring of sectors severely affected by the pandemic and proactively ascertaining the liquidityof secured collateral to exposure in the sector10. To manage increased operating cost brought about by the pandemic, several cost cutting initiatives wereintroduced within the Bank11. Constant monitoring of staff working from Home to ensure that the Bank’s productivity level does notrelapse.
In addition to the above, a forecast of macroeconomic indicators under different scenarios using key macro indicators that drive the Nigerian economy such as Government spending, revenue from Oil & Non-oil exports, Exchange rate, GDP, Interest Rate, Inflation, Capital and money market was also done.
235
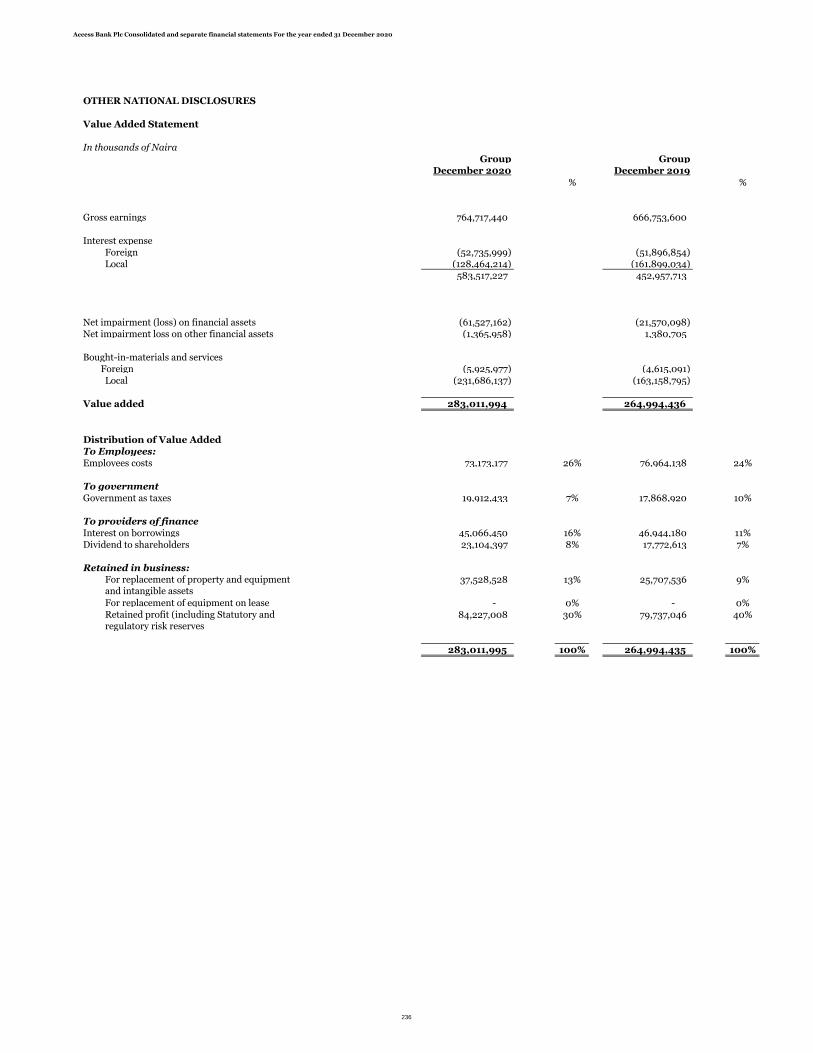
Access Bank Plc Consolidated and separate financial statements For the year ended 31 December 2020
OTHER NATIONAL DISCLOSURES
Value Added Statement
In thousands of Naira
Group Group
December 2020 December 2019
% %
Gross earnings 764,717,440 666,753,600
Interest expense
Foreign (52,735,999) (51,896,854)
Local (128,464,214) (161,899,034)
583,517,227 452,957,713
Net impairment (loss) on financial assets (61,527,162) (21,570,098)
Net impairment loss on other financial assets (1,365,958) 1,380,705
Bought-in-materials and services
Foreign (5,925,977) (4,615,091)
Local (231,686,137) (163,158,795)
Value added 283,011,994 264,994,436
Distribution of Value Added
To Employees:
Employees costs 73,173,177 26% 76,964,138 24%
To government
Government as taxes 19,912,433 7% 17,868,920 10%
To providers of finance
Interest on borrowings 45,066,450 16% 46,944,180 11%
Dividend to shareholders 23,104,397 8% 17,772,613 7%
Retained in business:For replacement of property and equipment and intangible assets
37,528,528 13% 25,707,536 9%
For replacement of equipment on lease - 0% - 0%Retained profit (including Statutory and regulatory risk reserves
84,227,008 30% 79,737,046 40%
283,011,995 100% 264,994,435 100%
236

Access Bank Plc Consolidated and separate financial statements For the year ended 31 December 2020
OTHER NATIONAL DISCLOSURES
Value Added StatementBank Bank
In thousands of Naira December 2020 December 2019
% %
Gross earnings 634,863,768 576,347,839
Interest expense
Foreign (54,293,516) (54,084,352)
Local (100,242,201) (139,845,670)
480,328,052 382,417,819
Net impairment (loss) on financial assets (39,650,580) (22,694,279)
Net impairment loss on other financial assets - 1,638,801
Bought-in-materials and services
Foreign (6,340,427) (4,615,091)
Local (212,301,421) (146,744,603)
Value added 222,035,623 210,002,647
Distribution of Value Added
To Employees:
Employees costs 54,590,721 25% 60,712,847 20%
To government
Government as taxes 10,156,549 5% 9,097,722 8%
To providers of finance
Interest on borrowings 43,867,876 20% 45,521,346 19%
Dividend to shareholders 23,104,397 10% 17,772,613 8%
Retained in business:For replacement of property and equipment 32,059,429 14% 21,101,674 9%For replacement of equipment on lease - 0% - 0%
Retained profit (including Statutory and regulatory risk reserves
58,256,650 26% 55,796,442 35%
222,035,623 100% 210,002,644 100%
237
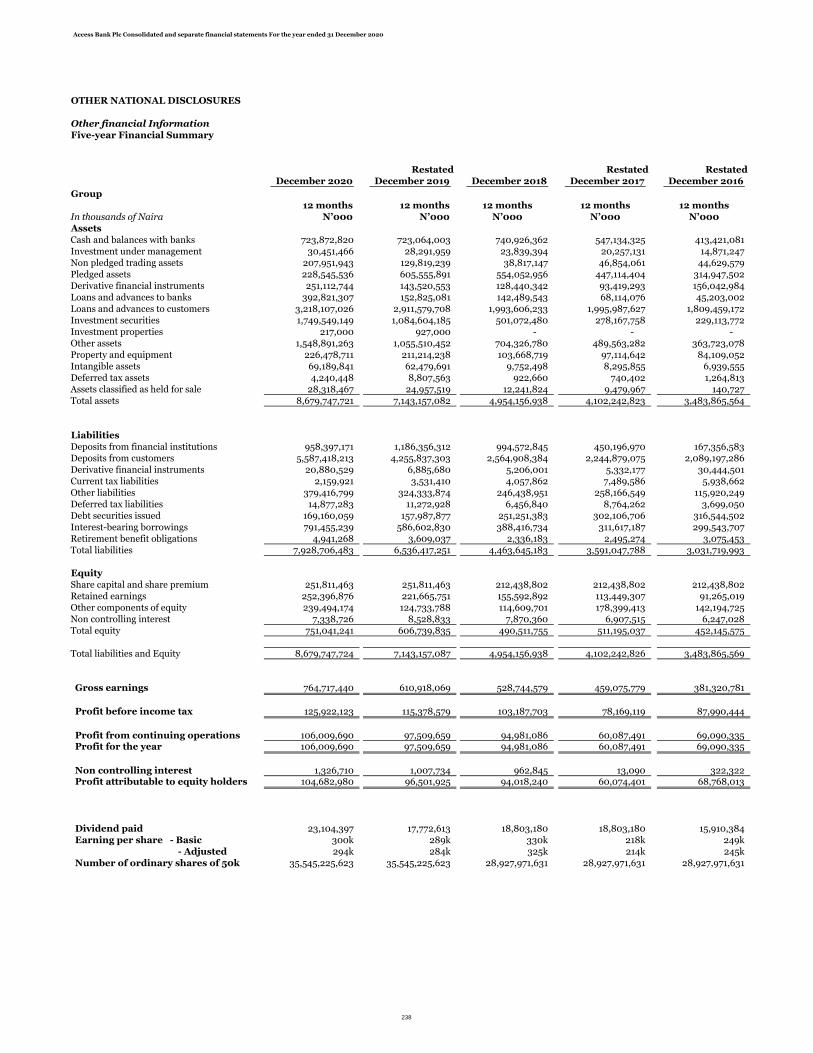
Access Bank Plc Consolidated and separate financial statements For the year ended 31 December 2020
OTHER NATIONAL DISCLOSURES
Other financial Information
Five-year Financial Summary
Restated Restated Restated
December 2020 December 2019 December 2018 December 2017 December 2016
Group
12 months 12 months 12 months 12 months 12 months
In thousands of Naira N’000 N’000 N’000 N’000 N’000
Assets
Cash and balances with banks 723,872,820 723,064,003 740,926,362 547,134,325 413,421,081
Investment under management 30,451,466 28,291,959 23,839,394 20,257,131 14,871,247
Non pledged trading assets 207,951,943 129,819,239 38,817,147 46,854,061 44,629,579
Pledged assets 228,545,536 605,555,891 554,052,956 447,114,404 314,947,502
Derivative financial instruments 251,112,744 143,520,553 128,440,342 93,419,293 156,042,984
Loans and advances to banks 392,821,307 152,825,081 142,489,543 68,114,076 45,203,002
Loans and advances to customers 3,218,107,026 2,911,579,708 1,993,606,233 1,995,987,627 1,809,459,172
Investment securities 1,749,549,149 1,084,604,185 501,072,480 278,167,758 229,113,772
Investment properties 217,000 927,000 - - -
Other assets 1,548,891,263 1,055,510,452 704,326,780 489,563,282 363,723,078
Property and equipment 226,478,711 211,214,238 103,668,719 97,114,642 84,109,052
Intangible assets 69,189,841 62,479,691 9,752,498 8,295,855 6,939,555
Deferred tax assets 4,240,448 8,807,563 922,660 740,402 1,264,813
Assets classified as held for sale 28,318,467 24,957,519 12,241,824 9,479,967 140,727
Total assets 8,679,747,721 7,143,157,082 4,954,156,938 4,102,242,823 3,483,865,564
Liabilities
Deposits from financial institutions 958,397,171 1,186,356,312 994,572,845 450,196,970 167,356,583
Deposits from customers 5,587,418,213 4,255,837,303 2,564,908,384 2,244,879,075 2,089,197,286
Derivative financial instruments 20,880,529 6,885,680 5,206,001 5,332,177 30,444,501
Current tax liabilities 2,159,921 3,531,410 4,057,862 7,489,586 5,938,662
Other liabilities 379,416,799 324,333,874 246,438,951 258,166,549 115,920,249
Deferred tax liabilities 14,877,283 11,272,928 6,456,840 8,764,262 3,699,050
Debt securities issued 169,160,059 157,987,877 251,251,383 302,106,706 316,544,502
Interest-bearing borrowings 791,455,239 586,602,830 388,416,734 311,617,187 299,543,707
Retirement benefit obligations 4,941,268 3,609,037 2,336,183 2,495,274 3,075,453
Total liabilities 7,928,706,483 6,536,417,251 4,463,645,183 3,591,047,788 3,031,719,993
Equity
Share capital and share premium 251,811,463 251,811,463 212,438,802 212,438,802 212,438,802
Retained earnings 252,396,876 221,665,751 155,592,892 113,449,307 91,265,019
Other components of equity 239,494,174 124,733,788 114,609,701 178,399,413 142,194,725
Non controlling interest 7,338,726 8,528,833 7,870,360 6,907,515 6,247,028
Total equity 751,041,241 606,739,835 490,511,755 511,195,037 452,145,575
Total liabilities and Equity 8,679,747,724 7,143,157,087 4,954,156,938 4,102,242,826 3,483,865,569
Gross earnings 764,717,440 610,918,069 528,744,579 459,075,779 381,320,781
Profit before income tax 125,922,123 115,378,579 103,187,703 78,169,119 87,990,444
Profit from continuing operations 106,009,690 97,509,659 94,981,086 60,087,491 69,090,335 Profit for the year 106,009,690 97,509,659 94,981,086 60,087,491 69,090,335
Non controlling interest 1,326,710 1,007,734 962,845 13,090 322,322 Profit attributable to equity holders 104,682,980 96,501,925 94,018,240 60,074,401 68,768,013
Dividend paid 23,104,397 17,772,613 18,803,180 18,803,180 15,910,384
Earning per share - Basic 300k 289k 330k 218k 249k
- Adjusted 294k 284k 325k 214k 245k
Number of ordinary shares of 50k 35,545,225,623 35,545,225,623 28,927,971,631 28,927,971,631 28,927,971,631
238

Access Bank Plc Consolidated and separate financial statements For the year ended 31 December 2020
OTHER NATIONAL DISCLOSURES
Other financial InformationFive-year Financial Summary
Restated Restated Restated
December 2020 December 2019 December 2018 December 2017 December 2016
Bank
12 months 12 months 12 months 12 months 12 months
In thousands of Naira N’000 N’000 N’000 N’000 N’000
Assets
Cash and balances with banks 589,812,439 575,906,273 338,289,912 252,521,543 219,813,090
Investment under management 30,451,466 28,291,959 23,839,394 20,257,131 14,871,247
Non pledged trading assets 110,283,112 76,971,761 36,581,058 43,016,990 44,629,579
Pledged assets 228,545,536 605,555,892 554,052,956 440,503,327 314,947,502
Derivative financial instruments 244,564,046 143,480,073 128,133,789 92,390,219 155,772,662
Loans and advances to banks 231,788,276 164,413,001 100,993,116 101,429,001 104,006,574
Loans and advances to customers 2,818,875,731 2,481,623,671 1,681,761,862 1,771,282,739 1,594,562,345
Investment securities 1,428,039,662 813,706,953 258,580,286 121,537,302 161,200,642
Other assets 1,490,633,057 1,004,310,288 625,813,176 469,812,502 348,778,639
Investment properties 217,000 727,000 - - -
Investment in subsidiary 164,251,532 131,458,709 111,203,496 87,794,631 59,239,252
Property and equipment 191,893,321 188,634,460 88,392,543 83,676,723 71,824,472
Intangible assets 67,496,078 67,550,666 8,231,197 5,981,905 5,173,784
Deferred tax assets - - - - -
Assets classified as held for sale 28,128,467 24,957,518 12,241,824 9,479,967 140,727
Total assets 7,624,979,723 6,307,588,224 3,968,114,608 3,499,683,981 3,094,960,515
Liabilities
Deposits from banks 831,632,332 1,079,284,414 616,644,611 276,140,835 95,122,188
Deposits from customers 4,832,744,498 3,668,339,811 2,058,738,930 1,910,773,713 1,813,042,872
Derivative financial instruments 20,775,722 6,827,293 5,185,870 5,306,450 30,275,181
Debt securities issued 169,160,059 157,987,877 251,251,383 302,106,706 243,952,418
Current tax liabilities 2,546,892 1,409,436 2,939,801 4,547,920 5,004,160
Other liabilities 342,460,276 302,261,962 222,046,143 242,948,060 109,887,952
Retirement benefit obligations 4,584,149 3,418,060 2,319,707 2,481,916 3,064,597
Interest-bearing borrowings 755,254,273 544,064,226 363,682,441 282,291,141 372,179,785
Deferred tax liabilities 11,925,862 4,507,110 4,505,966 7,848,515 3,101,753
Total liabilities 6,971,084,063 5,768,100,189 3,527,314,852 3,034,445,256 2,675,630,906
Equity
Share capital and share premium 251,811,463 251,811,463 212,438,802 212,438,802 212,438,802
Retained earnings 206,896,034 188,925,555 148,238,575 115,966,230 90,980,177
Other components of equity 195,188,164 98,751,019 80,122,380 136,833,692 115,910,630
Total equity 653,895,662 539,488,037 440,799,756 465,238,725 419,329,609
Total liabilities and Equity 7,624,979,725 6,307,588,226 3,968,114,609 3,499,683,982 3,094,960,514
Gross earnings 634,863,768 576,347,841 435,743,037 398,161,576 331,000,972
Profit before income tax 90,195,877 79,213,716 75,248,146 65,140,136 78,230,565
Profit for the year 80,039,326 70,115,994 73,596,295 51,335,460 61,677,124
Dividend paid 23,104,397 18,803,180 18,803,180 15,910,384 13,729,777
Earning per share - Basic 225k 207 177k 221k 174k
- Adjusted 225k 207 184k 221k 174k
Number of ordinary shares of 50k 28,927,971,631 28,927,971,631 28,927,971,631 28,927,971,631 22,882,918,908
239


![REGULATIONS - IAS Plus — IFRS, global financial ...statements or separate financial statements, as defined in IAS 27 Consolidated and separate financial statements. 4 [Deleted] 5](https://img.pdfslide.us/doc/110x75/5f0e79fb7e708231d43f6eed/regulations-ias-plus-a-ifrs-global-financial-statements-or-separate-financial.jpg)