Embed Size (px)
Citation preview
Consolidated 2013 Annual and Fourth Quarter Results
Conference Call
March 25, 2014 Investor Relations
2
Disclaimer
Banco de Bogotá and its respective Colombian financial subsidiaries, including Porvenir and Corficolombiana, are subject to inspection and surveillance as financial institutions by the Colombian Superintendency of Finance . The financial information presented in this report is expressed in Colombian pesos, hereby identified as COP, and is derived from the consolidated financial statements of Banco de Bogotá and its subsidiaries in which it holds directly or indirectly 50% or more of the outstanding voting shares, or in which it exercises effective control through an agreement with shareholders. These subsidiaries include: Leasing Bogotá S.A. Panamá, BAC Credomatic, Corporación Financiera Colombiana S.A. and its subsidiaries, Porvenir S.A., Banco de Bogotá S.A. Panamá and its subsidiaries, Fiduciaria Bogotá S.A., Almaviva S.A. and its subsidiaries, Casa de Bolsa S.A., Megalínea S.A., Ficentro, Bogotá Finance Corp. Leasing Bogotá Panamá owns 100% of BAC Credomatic. Such consolidated financial statements were prepared in accordance with the regulations of the Superintendency of Finance and, on issues not addressed by these regulations, generally accepted accounting principles prescribed by the Superintendency of Finance for banks licensed to operate in Colombia, consistently applied, together with such regulations, “Colombian Banking GAAP.” The financial statements of foreign subsidiaries have been adjusted in order to adopt uniform accounting policies as required by Colombian Banking GAAP. For the purpose of this report, annual variations refer to variations compared to the same quarter of the previous year and quarterly variations refer to variations compared to the immediately previous quarter. In this report we refer to billions as thousands of millions and to trillions as millions of millions (Colombian Pesos). Recipients of this document are responsible for the assessment and use they make of the information provided herein. Banco de Bogotá shall not be responsible for any decision taken by investors in connection with this document. The content of this document is not intended to provide full disclosure on Banco de Bogotá or its affiliates.
3
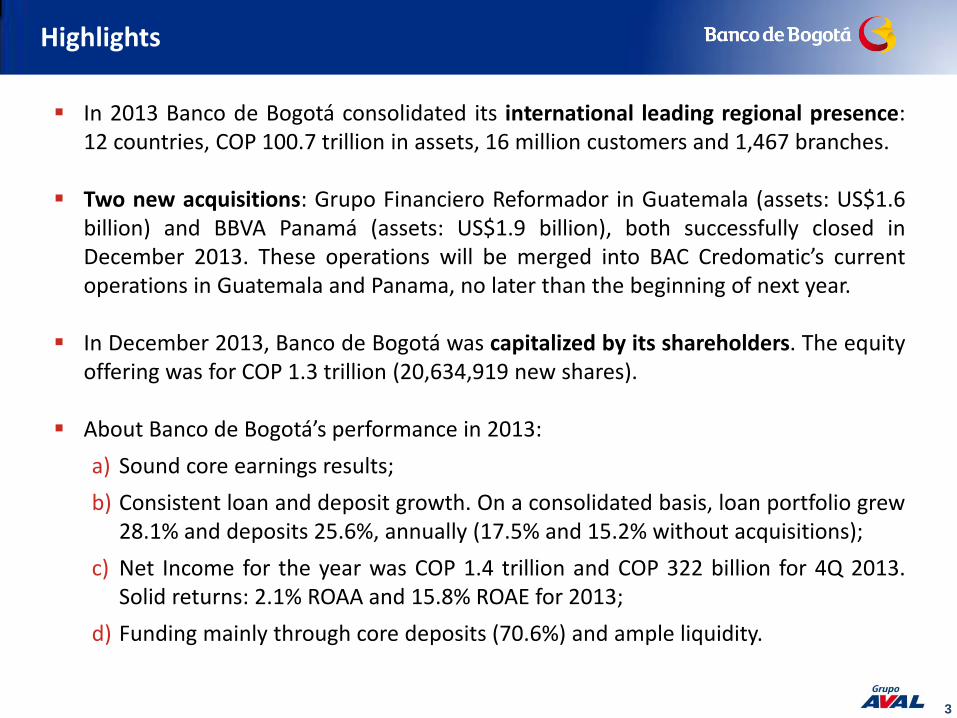
Highlights
In 2013 Banco de Bogotá consolidated its international leading regional presence: 12 countries, COP 100.7 trillion in assets, 16 million customers and 1,467 branches.
Two new acquisitions: Grupo Financiero Reformador in Guatemala (assets: US$1.6 billion) and BBVA Panamá (assets: US$1.9 billion), both successfully closed in December 2013. These operations will be merged into BAC Credomatic’s current operations in Guatemala and Panama, no later than the beginning of next year.
In December 2013, Banco de Bogotá was capitalized by its shareholders. The equity offering was for COP 1.3 trillion (20,634,919 new shares).
About Banco de Bogotá’s performance in 2013:
a) Sound core earnings results;
b) Consistent loan and deposit growth. On a consolidated basis, loan portfolio grew 28.1% and deposits 25.6%, annually (17.5% and 15.2% without acquisitions);
c) Net Income for the year was COP 1.4 trillion and COP 322 billion for 4Q 2013. Solid returns: 2.1% ROAA and 15.8% ROAE for 2013;
d) Funding mainly through core deposits (70.6%) and ample liquidity.
4
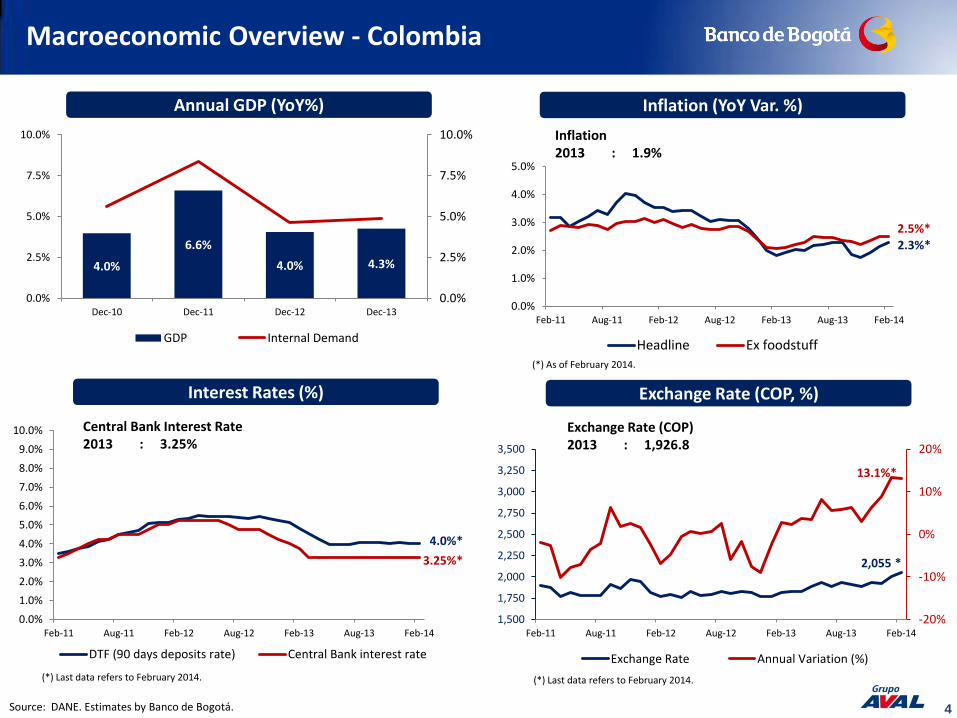
Macroeconomic Overview - Colombia
Source: DANE. Estimates by Banco de Bogotá.
Annual GDP (YoY%) Inflation (YoY Var. %)
Interest Rates (%) Exchange Rate (COP, %)
2.5%* 2.3%*
4.0%*
3.25%*
4.0%
6.6%
4.0% 4.3%
0.0%
2.5%
5.0%
7.5%
10.0%
0.0%
2.5%
5.0%
7.5%
10.0%
Dec-10 Dec-11 Dec-12 Dec-13
GDP Internal Demand
0.0%
1.0%
2.0%
3.0%
4.0%
5.0%
Feb-11 Aug-11 Feb-12 Aug-12 Feb-13 Aug-13 Feb-14
Headline Ex foodstuff
(*) Last data refers to February 2014.
0.0%
1.0%
2.0%
3.0%
4.0%
5.0%
6.0%
7.0%
8.0%
9.0%
10.0%
Feb-11 Aug-11 Feb-12 Aug-12 Feb-13 Aug-13 Feb-14
DTF (90 days deposits rate) Central Bank interest rate
(*) As of February 2014.
-20%
-10%
0%
10%
20%
1,500
1,750
2,000
2,250
2,500
2,750
3,000
3,250
3,500
Feb-11 Aug-11 Feb-12 Aug-12 Feb-13 Aug-13 Feb-14
Exchange Rate Annual Variation (%)
(*) Last data refers to February 2014.
13.1%*
2,055 *
Inflation 2013 : 1.9%
Central Bank Interest Rate 2013 : 3.25%
Exchange Rate (COP) 2013 : 1,926.8
5
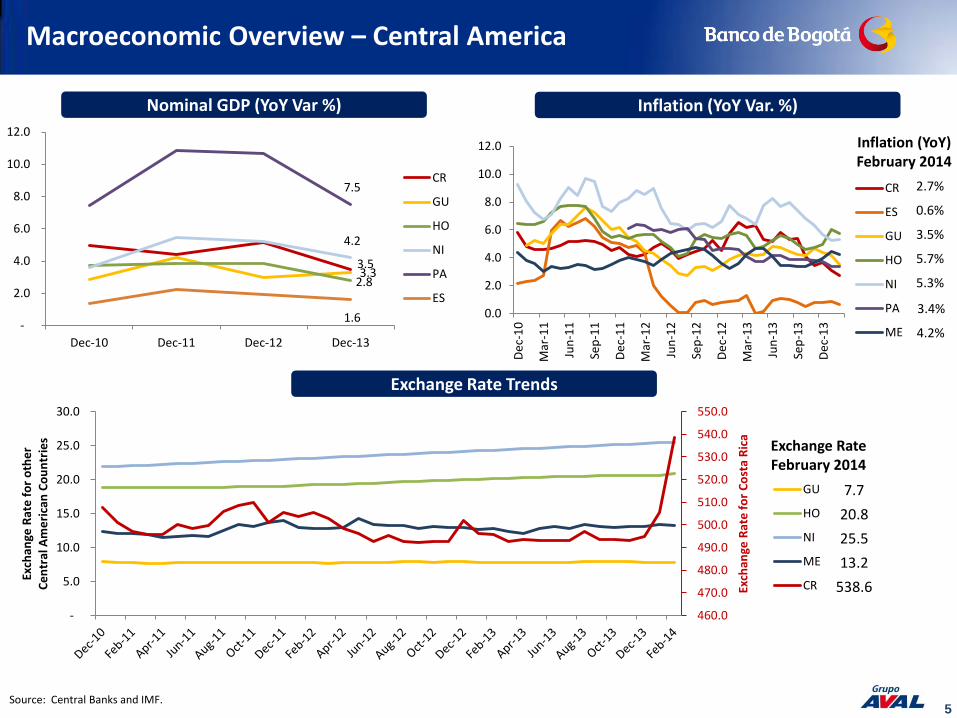
Macroeconomic Overview – Central America
Source: Central Banks and IMF.
Nominal GDP (YoY Var %) Inflation (YoY Var. %)
Exchange Rate Trends
460.0
470.0
480.0
490.0
500.0
510.0
520.0
530.0
540.0
550.0
-
5.0
10.0
15.0
20.0
25.0
30.0
Exch
ange
Rat
e f
or
Co
sta
Ric
a
Exch
ange
Rat
e f
or
oth
er
C
en
tral
Am
eri
can
Co
un
trie
s
GU
HO
NI
ME
CR
7.7
20.8
25.5
13.2
538.6
Exchange Rate February 2014
3.5 3.3
2.8
4.2
7.5
1.6 -
2.0
4.0
6.0
8.0
10.0
12.0
Dec-10 Dec-11 Dec-12 Dec-13
CR
GU
HO
NI
PA
ES0.0
2.0
4.0
6.0
8.0
10.0
12.0
De
c-1
0
Mar
-11
Jun
-11
Sep
-11
De
c-1
1
Mar
-12
Jun
-12
Sep
-12
De
c-1
2
Mar
-13
Jun
-13
Sep
-13
De
c-1
3
CR
ES
GU
HO
NI
PA
ME
2.7%
0.6%
3.5%
5.7%
5.3%
3.4%
4.2%
Inflation (YoY) February 2014

6
54.9% 56.7% 56.2%
16.4% 15.8%
14.6% 4.6%
4.6% 3.6%
12.0% 9.4%
12.2% 12.1%
13.5%
13.4%
Q4-2012 Q3-2013 Q4-2013
Loans and Financial Leases, Net Fixed Investments Equity Investments Cash and Interbank Fund Other Assets
Source: Banco de Bogotá. Consolidated Figures. 1/ Other Assets include: Net accrued interest receivable, Customers' acceptances and derivatives, Net accounts receivable, Net property, plant and equipment, Net operating leases, Net foreclosed assets, Prepaid expenses and deferred charges, Goodwill, Reappraisal of assets and Net other assets. 2/ Other Liabilities include: Acceptances and derivatives, Accounts payable, Accrued interest payable, Other liabilities, Bonds, Estimated Liabilities and Non-controlling interest.
Ass
ets
Balance Sheet Structure (Trillion COP) 4Q13/4Q12: 25.0% 4Q13/3Q13: 13.9%
Balance Sheet Structure
Liab
iliti
es a
nd
Eq
uit
y 100.7
88.4 80.5
63.4% 61.1% 63.7%
5.0% 6.2%
4.1% 11.1%
10.2%
11.2% 10.8%
13.1%
11.2% 9.7%
9.4%
9.8%
Q4-2012 Q3-2013 Q4-2013
Deposits Interbank and Overnight Borrowings Other Liabilities Equity
100.7
88.4 80.5
1/
2/
7
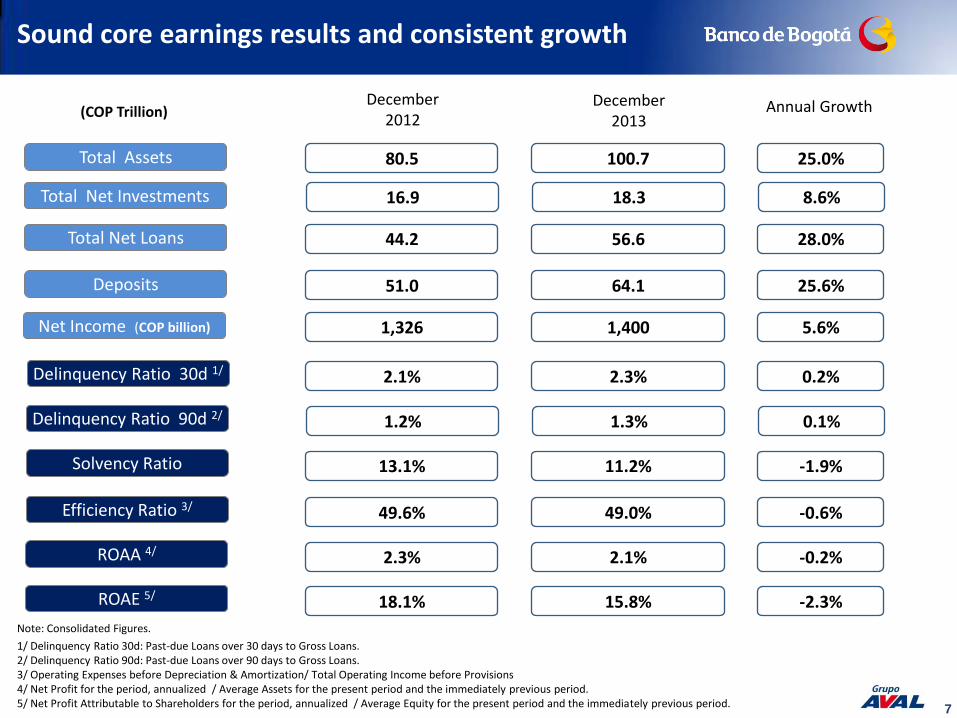
Note: Consolidated Figures.
1/ Delinquency Ratio 30d: Past-due Loans over 30 days to Gross Loans. 2/ Delinquency Ratio 90d: Past-due Loans over 90 days to Gross Loans. 3/ Operating Expenses before Depreciation & Amortization/ Total Operating Income before Provisions 4/ Net Profit for the period, annualized / Average Assets for the present period and the immediately previous period. 5/ Net Profit Attributable to Shareholders for the period, annualized / Average Equity for the present period and the immediately previous period.
Total Assets
(COP Trillion)
Delinquency Ratio 90d 2/
Solvency Ratio
Total Net Loans
Deposits
Efficiency Ratio 3/
Net Income (COP billion)
ROAA 4/
ROAE 5/
Sound core earnings results and consistent growth
Delinquency Ratio 30d 1/
Total Net Investments
100.7
56.6
64.1
December 2013
2.3%
11.2%
25.0%
28.0%
25.6%
Annual Growth
0.2%
-1.9%
49.0% -0.6%
1,400 5.6%
80.5
44.2
51.0
December 2012
2.1%
13.1%
49.6%
1,326
2.1% -0.2% 2.3%
15.8% -2.3% 18.1%
1.3% 0.1% 1.2%
18.3 8.6% 16.9

8
Loan Portfolio Breakdown by Business Segment (COP Trillion)
Source: Banco de Bogotá. Consolidated Figures. 1/ Since 4Q 2013 it also includes Grupo Financiero Reformador and BBVA Panamá operations
Q4-2012 Q1-2013 Q2-2013 Q3-2013 Q4-2013
Colombia
Q4-2012 Q1-2013 Q2-2013 Q3-2013 Q4-2013
Leasing
Mortgage
Microcredit
Consumer
Commercial
46.5 45.5 49.5 51.5
Loan Portfolio Breakdown by Business Segment (COP Trillion)
58.2
62.2%
23.9%
9.3% 0.5%
4.1%
4Q13/3Q13: 13.0%
4Q13/4Q12.: 28.1%
63.0%
23.7%
8.3% 0.6%
4.5%
63.2%
23.9%
7.6% 4.8%
62.4%
24.3%
8.0% 4.7%
62.8%
23.9%
8.2% 4.5%
0.5%
31.3 31.5 33.5
35.0 35.8
74.9%
19.5%
4.2%
74.2%
19.8%
4.2%
75.1%
18.9%
4.0% 1.2%
74.8%
18.7%
4.0% 1.6%
74.0%
19.0%
4.1% 2.1%
4Q13/3Q13: 2.3% 4Q13/4Q12: 14.3%
Q4-2012 Q1-2013 Q2-2013 Q3-2013 Q4-2013
Central America 1/
12.6 13.4 14.5
14.9
20.7
34.1%
37.7%
26.0%
34.3%
37.8%
25.6%
34.3%
37.9%
25.4%
2.3%
34.7%
37.9%
25.0%
41.2%
34.5%
22.5%
1.8%
4Q13/3Q13: 38.9% 4Q13/4Q12: 64.2%
2.2% 2.3% 2.3%
26.1
28.3
23.1
56.3
8.6
Growth (%) 4Q 12 vs 4Q 13
9
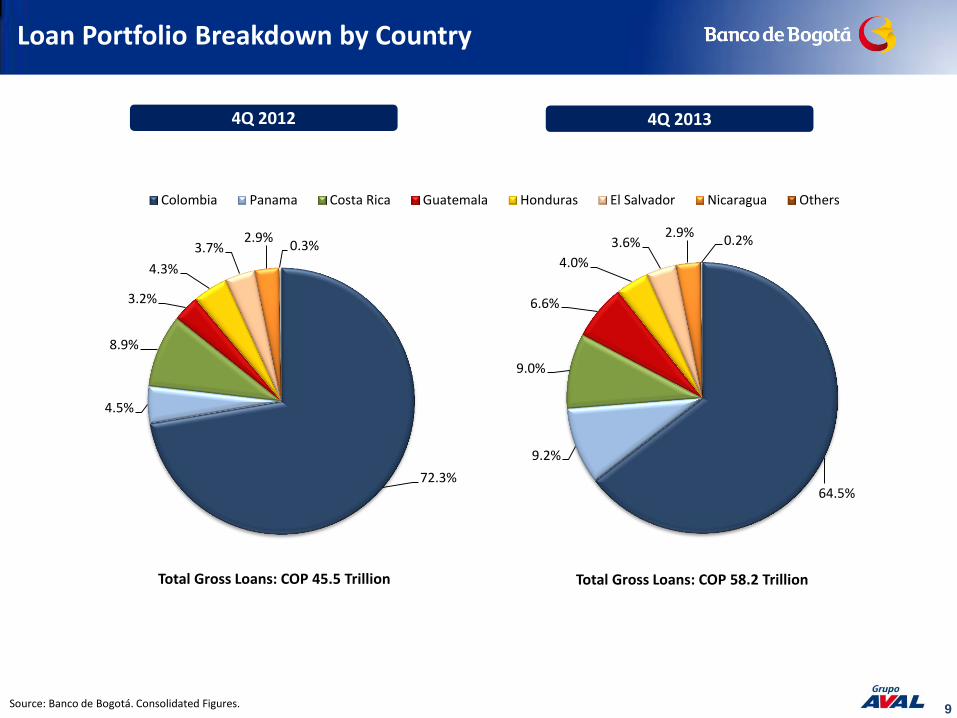
Loan Portfolio Breakdown by Country
Source: Banco de Bogotá. Consolidated Figures.
4Q 2012
64.5%
9.2%
9.0%
6.6%
4.0%
3.6% 2.9%
0.2%
Colombia Panama Costa Rica Guatemala Honduras El Salvador Nicaragua Others
Total Gross Loans: COP 58.2 Trillion
72.3%
4.5%
8.9%
3.2%
4.3%
3.7% 2.9%
0.3%
Total Gross Loans: COP 45.5 Trillion
4Q 2013

10
Loan Portfolio Quality (1/2)
Past Due Loans over 90 days vs. Gross Loans and Coverage Ratio
Source: Banco de Bogotá. Figures in Colombian GAAP. PDL: Past Due Loans Note: Coverage: Allowance/PDL over 30d and Allowance/PDL over 90d.
1.2% 1.3% 1.2% 1.3% 1.3%
224.6% 218.5% 229.3% 221.7%
212.9%
Q4-2012 Q1-2013 Q2-2013 Q3-2013 Q4-2013
PDL Over 90d/Gross Loans Coverage
Commercial, Consumer and Mortgage Past Due Loans Over 90 days vs. Gross Loans
1.0% 1.1% 0.9% 1.0%
1.0%
1.8% 2.0%
2.2% 2.3% 2.2%
1.0% 0.8% 0.7%
0.6%
1.2%
1.2% 1.3% 1.2% 1.3% 1.3%
Q4-2012 Q1-2013 Q2-2013 Q3-2013 Q4-2013
Commercial Consumer Mortgage Total
Past Due Loans over 30 days vs. Gross Loans and Coverage Ratio
2.1% 2.3% 2.2% 2.3% 2.3%
132.2% 122.3%
127.9% 123.6% 123.3%
Q4-2012 Q1-2013 Q2-2013 Q3-2013 Q4-2013
PDL Over 30d/Gross Loans Coverage

11
Credit Quality Trends
Non Performing Loans vs. Gross Loans and Charge-offs to Average Non Performing Loans
1.5% 1.6% 1.6% 1.6% 1.7%
55.1% 54.2% 61.3% 62.9% 63.7%
Q4-2012 Q1-2013 Q2-2013 Q3-2013 Q4-2013
NPL/Gross Loans Charge Offs/Average NPLs
Loan Portfolio Quality (2/2)
Figures in Billion COP Q4-2012 Q1-2013 Q2-2013 Q3-2013 Q4-2013
Initial Past Due Loans 904.2 947.5 1,079.5 1,096.3 1,177.0
New Past Due Loans 142.1 231.3 150.3 216.5 300.7
Charge-offs -98.8 -99.3 -133.5 -135.8 -148.8
Total Past Due Loans 947.5 1,079.5 1,096.3 1,177.0 1,329.0
Source: Banco de Bogotá. Consolidated figures. NPL: Non Performing Loans
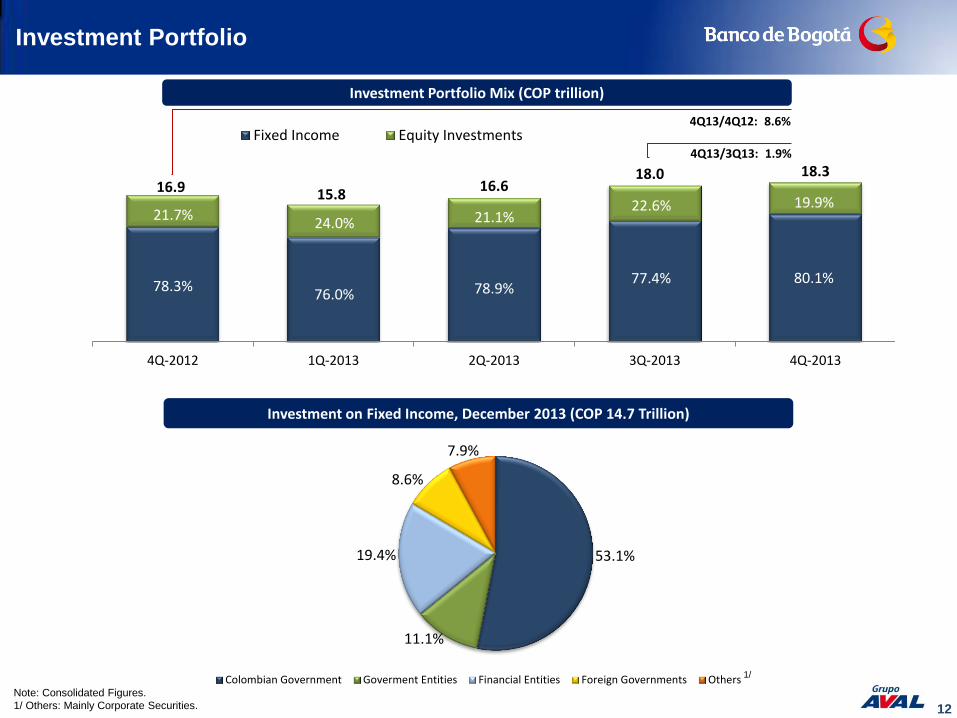
4Q-2012 1Q-2013 2Q-2013 3Q-2013 4Q-2013
Fixed Income Equity Investments
16.6 18.0
15.8 16.9
Investment Portfolio
18.3
Note: Consolidated Figures.
1/ Others: Mainly Corporate Securities.
53.1%
11.1%
19.4%
8.6%
7.9%
Colombian Government Goverment Entities Financial Entities Foreign Governments Others
12
Investment Portfolio Mix (COP trillion)
80.1%
19.9%
77.4%
22.6%
78.9%
21.1%
76.0%
24.0%
78.3%
21.7%
4Q13/3Q13: 1.9%
4Q13/4Q12: 8.6%
Investment on Fixed Income, December 2013 (COP 14.7 Trillion)
1/
13
Funding
Q4-2012 Q1-2013 Q2-2013 Q3-2013 Q4-2013
Checking Accounts Time Deposits Saving Accounts Others
Source: Banco de Bogotá. Consolidated figures. 1/ Other Liabilities include: Acceptances and derivatives, Accounts payable, Accrued interest payable, Other liabilities, Estimated Liabilities and Non-controlling interest. 2/ Other Deposits include: Deposits from other Banks and Correspondent Accounts, Banking Services Liabilities and Collection Banking Services and Other Deposits.
50.0 51.0
89.1% 92.9%
89.9%
95.4% 90.8%
Q4-2012 Q1-2013 Q2-2013 Q3-2013 Q4-2013
55.1
Deposit Base Trends (COP Trillion) Funding Mix, 4Q2013
Gross Loans to Deposits (%)
4Q-2013: COP 90.8 Trillion
Deposits 70.6%
Financial Obligations
12.5%
Interbank Funds & Overnight
4.6%
Bonds 3.5%
Other 8.9%
64.1
54.0
4Q13/4Q12: 24.9% 4Q13/3Q13: 13.3%
25.9%
38.5%
34.6%
1.0%
25.5%
38.7%
34.9%
0.9%
25.3%
38.9%
34.8%
0.9%
26.1%
39.3%
33.6%
0.9%
25.7%
36.4%
36.8%
1.1%
4Q13/4Q12: 25.6%
4Q13/3Q13: 18.6%
2/
1/
14
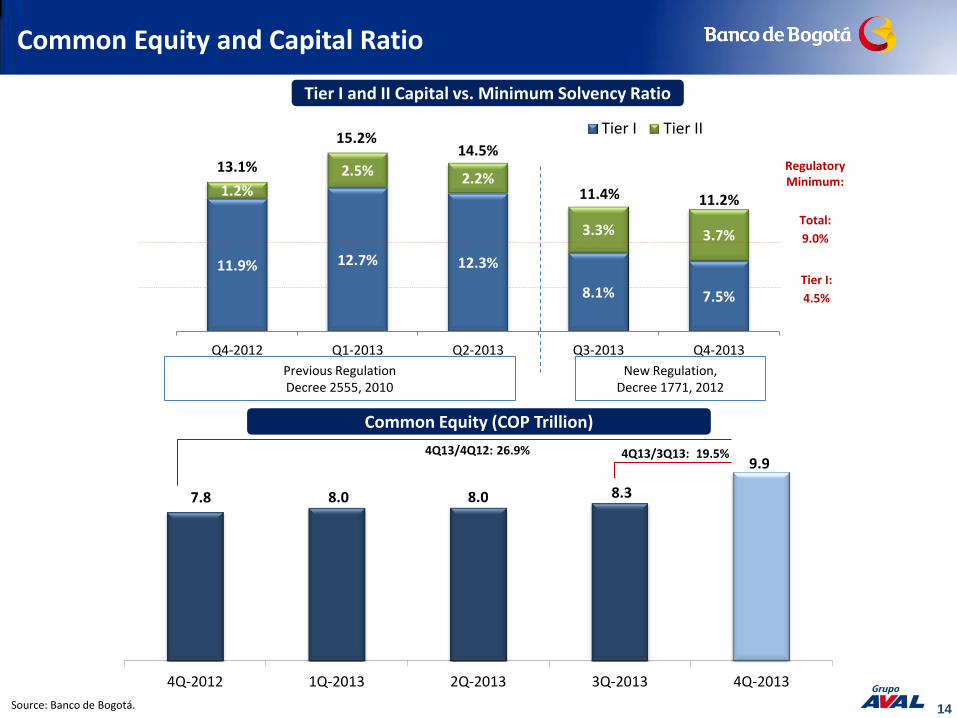
Common Equity and Capital Ratio
11.9% 12.7% 12.3%
8.1% 7.5%
1.2%
2.5% 2.2%
3.3% 3.7%
Q4-2012 Q1-2013 Q2-2013 Q3-2013 Q4-2013
Tier I Tier II
13.1% 14.5%
15.2%
Tier I and II Capital vs. Minimum Solvency Ratio
11.4%
Source: Banco de Bogotá.
Regulatory Minimum:
11.2% Total:
9.0%
Tier I:
4.5%
7.8 8.0 8.0 8.3
9.9
4Q-2012 1Q-2013 2Q-2013 3Q-2013 4Q-2013
Previous Regulation Decree 2555, 2010
New Regulation, Decree 1771, 2012
Common Equity (COP Trillion)
4Q13/4Q12: 26.9% 4Q13/3Q13: 19.5%

15
Net Income from diversified operating revenues
Q4-2012 Q3-2013 Q4-2013 Jan-Dec 2012 Jan-Dec 2013
Net Interest Income (1) Fee and Service Income, Net Other
Total 4Q2013: COP 693 Billion
1,551
Operating Revenues (COP Billion)
Fee Income Breakdown, 4Q2013
33.6%
26.4%
23.7%
5.5%
5.2%
3.4% 1.3% 1.0% Credit and debit card fees
Pension plan administration
Commissions from banking services
Warehouse services
Fiduciary activities
Others
Checking fees
Branch network services
1,641 251.7
409.5 322.2
322.4
1,326.0 1,400.0
Q3-2012 Q4-2012 Q3-2013 Q4-2013 Jan-Dec2012
Jan-Dec2013
Net Income (COP Billion)
5,555
6,502
Source: Banco de Bogotá. Consolidated figures. 1/ After net provisions. Other operating income includes: Net foreign exchange gains (expenses), Gain (Losses) on derivative operations, Gains (losses) on sales of investments on equity securities, Dividend income, Income from non-financial sector, net, and others.
4Q13/4Q12: 17.1% 4Q13/3Q13: 7.3%
1,591
4Q13/4Q12: -21.3%
2013/2012: 5.6%
2013/2012: 17.1%
4Q13/4Q12: 2.6%
4Q13/3Q13: -3.1%
49.3%
34.6%
16.1%
53.5%
33.9%
12.6%
16
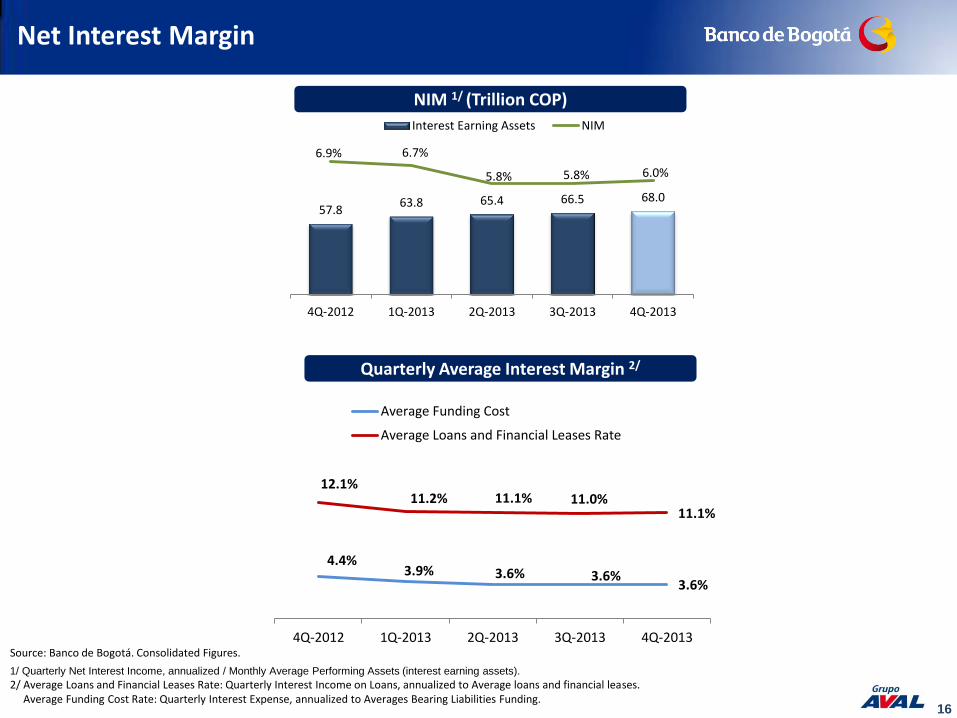
Net Interest Margin
Source: Banco de Bogotá. Consolidated Figures.
1/ Quarterly Net Interest Income, annualized / Monthly Average Performing Assets (interest earning assets).
2/ Average Loans and Financial Leases Rate: Quarterly Interest Income on Loans, annualized to Average loans and financial leases. Average Funding Cost Rate: Quarterly Interest Expense, annualized to Averages Bearing Liabilities Funding.
Quarterly Average Interest Margin 2/
NIM 1/ (Trillion COP)
4.4% 3.9% 3.6% 3.6%
3.6%
12.1% 11.2% 11.1% 11.0%
11.1%
4Q-2012 1Q-2013 2Q-2013 3Q-2013 4Q-2013
Average Funding Cost
Average Loans and Financial Leases Rate
57.8 63.8 65.4 66.5 68.0
6.9% 6.7%
5.8% 5.8% 6.0%
4Q-2012 1Q-2013 2Q-2013 3Q-2013 4Q-2013
Interest Earning Assets NIM
17
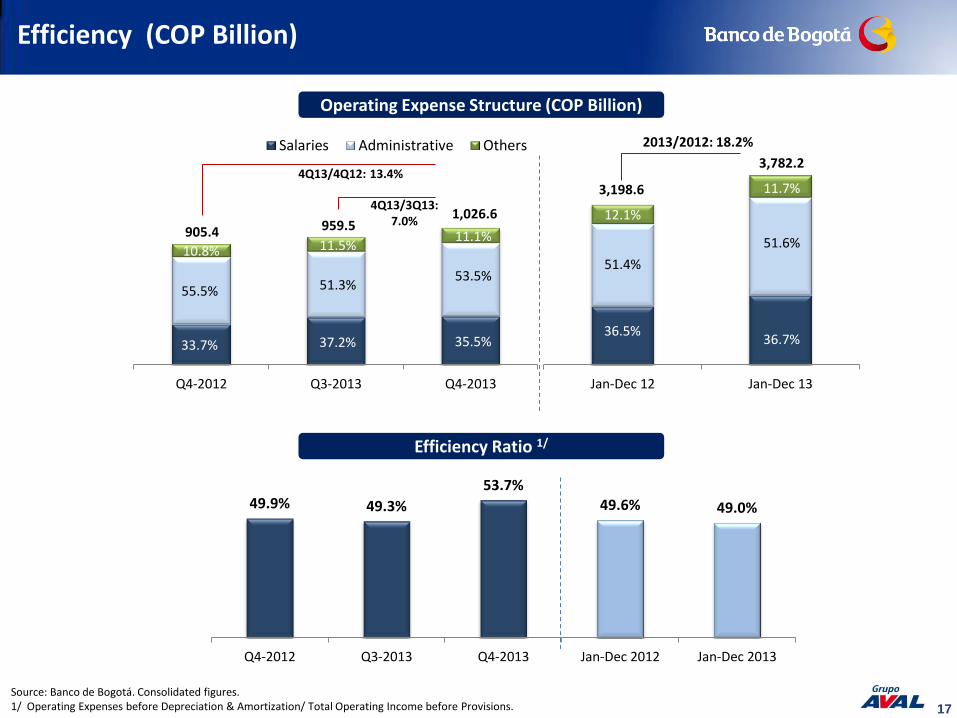
49.9% 49.3%
53.7% 49.6% 49.0%
Q4-2012 Q3-2013 Q4-2013 Jan-Dec 2012 Jan-Dec 2013
Efficiency (COP Billion)
Source: Banco de Bogotá. Consolidated figures. 1/ Operating Expenses before Depreciation & Amortization/ Total Operating Income before Provisions.
Efficiency Ratio 1/
Q4-2012 Q3-2013 Q4-2013
Salaries Administrative Others
Jan-Dec 12 Jan-Dec 13
Operating Expense Structure (COP Billion)
905.4 959.5 1,026.6
3,782.2
3,198.6
33.7%
55.5%
10.8%
37.2%
51.3%
11.5%
35.5%
53.5%
11.1%
36.5%
51.4%
12.1%
36.7%
51.6%
11.7% 4Q13/3Q13:
7.0%
4Q13/4Q12: 13.4%
2013/2012: 18.2%
18
Contact Information
www.bancodebogota.com
María Luisa Rojas Giraldo CFO Tel.: (571) 338 3415 [email protected]
Martha Inés Caballero Leclercq Investor Relations Manager Tel.: (571) 332 0032 Ext. 1467 [email protected]
Julián Andrés Rodríguez Casas Investor Relations Analyst Tel.: (571) 332 0032 Ext. 1973 [email protected]


![Announces Q4 & FY16 Results (Standalone & Consolidated), & Auditors Report (Standalone & Consolidated) for the period ended March 31, 2016 [Result]](https://img.pdfslide.us/doc/110x75/577c7ab01a28abe05495dc56/announces-q4-fy16-results-standalone-consolidated-auditors-report.jpg)


![Announces Q4 & FY16 Results (Standalone & Consolidated) & Auditors Report (Standalone & Consolidated) for the period ended March 31, 2016 [Result]](https://img.pdfslide.us/doc/110x75/577c7c281a28abe0549984bb/announces-q4-fy16-results-standalone-consolidated-auditors-report-standalone.jpg)