Embed Size (px)
Citation preview

PLEASE NOTE: The transcription of the 2016 Analyst Day and Investor Day webcast has been prepared
by an independent third party. Readers are cautioned that we have not reviewed the transcript for
accuracy and disclaim any obligation to review and make corrections to it for any mistakes contained in
it.
CONSOL Energy, Inc.
2016 Analyst Day
December 13, 2016 at 8:30 a.m. Eastern

1
CONSOL Energy, Inc. December 13, 2016 at 8:30 a.m. Eastern
CORPORATE PARTICIPANTS
Nick Deluliis – President and Chief Executive Officer
Tim Dugan – Chief Operating Officer
Andrea Passman – VP - E&P Development
Don Rush – VP, E&P Marketing
Steve Johnson – EVP, DBU
Rodney Wilson – Dir. Bus Development
Marshall Roberts – Dir. CONVEY Water Systems
Katharine Fredriksen – SVP,DBU & Environmental Affairs
Dave Khani – Chief Financial Officer
Chuck Hardoby – VP, Finance
Tommy Johnson – VP, Government & Public Relations
Mitesh Thakkar – Director of Finance and Investor Relations, CNNX Coal
Jimmy Brock – Chief Executive Officer, CNNX Coal
Lori Ritter – Chief Financial Officer and Chief Accounting Officer, CNNX Coal
Jim McCaffrey – Senior Vice President of Marketing and Sales, CNNX Coal
Steve Milbourne –Head of Investor Relations, CONE Midstream Partners
Joe Fink – Chief Operating Officer, CONE Midstream Partners
Steve Malyuk – Head of Business Development, CONE Midstream Partners
Everett Good – Head of Finance, CONE Midstream Partners
Tyler Lewis – VP, Investor Relations

2
CONSOL Energy, Inc. December 13, 2016 at 8:30 a.m. Eastern
PRESENTATION Tyler Lewis Alright. Good morning, everyone. Welcome to CONSOL Energy’s 2016 Analyst and Investor Day. Thank you for joining us here today at CONSOL’s headquarters in Pittsburgh, PA and for those who are also joining via our Webcast. Before I turn it over to Nick for his opening remarks, some brief housekeeping items. In keeping with our first core value of safety I’d like to point out that in the case of emergency we will exit this room through the back doors and proceed to the stairs, which are located immediately outside. We will then take the stairs down to the first floor and follow the signs to exit the building through the lobby. There are two restrooms that are located on this floor directly across from this room by the elevators where everyone arrived. For attendees joining us here today, in front of each sheet there should be a printed copy of the presentation, Wi-Fi log-in instructions, a notebook with the CONSOL logo, which is a small memento for everyone to take with them, and a thumb drive, which has a digital file of the presentation and an Excel file with our asset regions with corresponding type curve data and modeling inputs. This Excel file and presentation are both located on the IR portion of CONSOL’s website. I’ll remind you that any forward-looking statements we make or comments about future expectations are subject to business risks, which are laid out in our Securities and Exchange Commission filings. Throughout the presentation we will discuss EBITDA expectations across our business segments and in total across future years. In these instances CONSOL Energy is unable to provide a reconciliation of projected EBITDA to projected operating income, the most comparable financial measure calculated in accordance with GAAP, due to the unknown effect, timing, and potential significance of certain Income Statement items. Our cautionary language can be found on Slide 2, which you are free to reference in more detail. Shifting now to the agenda, we expect CONSOL’s presentation to be approximately two hours this morning before opening up to Q&A. The presentation will start with our President and CEO, Nick Deluliis, followed by presentations discussing E&P operations, marketing, our diversified business unit section, and then end with finance. Before Nick closes out the presentation, Tommy Johnson, Head of our Government Affairs and Public Relations department, will also provide a brief regulatory update. We ask that everyone holds all questions until the end, when the formal portion of the presentation is complete. Following CONSOL’s Q&A, which we have allotted to be approximately one hour, we will take a short break and give everyone a chance to get some food to bring back to their seats. CNXC will then make a short presentation and then open it up to Q&A for the remainder of their hour. Following CNXC, CONE Midstream Partners will do the same thing. We have a breadth of people from CONSOL, CNXC and CONE available to give you many different perspectives of the businesses, as well as answer any questions that anyone may have. Lastly, a reminder that we have three airport shuttles departing CNX Center at 11:45, 12:45 and 1:45 p.m. The shuttle will depart outside the main entrance. With that let, let me turn it over to Nick Deluliis, our President and CEO. Nick Deluliis Good morning, everybody and welcome to our Investor and Analyst Day. This region has been transformed by the shale revolution that’s occurring literally right below our feet, and it’s been transformed in every way imaginable, economically, socially, as well as even strategically. And just like the region, CONSOL Energy’s also been transformed by the shale revolution, and the magnitude of the change that

3
CONSOL Energy, Inc. December 13, 2016 at 8:30 a.m. Eastern
we’ve seen within this company and the rate of change from as little as two and a half years ago when we held our last Investor and Analyst Day, they’ve been astounding. And it’s that change and that rate of change that really has compelled our team and driven our team to tell the story which brings us here today. So, yes, our stock is 160+% year-to-date, so maybe some of that transformation’s getting reflected in the current share price valuation, but I’ll also tell you that our team believes strongly that there’s a significant gap that exists today when you look at where our share price is at and what the implied valuation of the company is moving forward. So, it’s our job as a management team to lay out that story for you. That’s what we’re going to do today, we’ve got a team assembled, we’ve got the presentations and the slides that have been constructed, and as Tyler said, we’ve got a cheat sheet, I’ll call it, at the end of the day to leave you with that lays out, again, what our expectations are with performance today as well as maybe more importantly what we expect that to do and where that will go into the future. What’s our ask? Our ask in return is that you process this information and then you consider updating or building a new view, new model for CONSOL Energy, one that’s built for 2017 and beyond. Now, I’m going to start with where we’ve come from, and that’s not by accident, because it wasn’t too long ago that CONSOL Energy was as much of an event driven story as we were an execution story if we wanted to position ourselves as a premier E&P. And the events that needed to happen were many, they were big events, there was risk that was assigned to them, and there was uncertainty that was attached to a lot of them. And, oh, by the way, we were trying to get those all accomplished and pulled off in hindsight in what was the most volatile period that the energy space has seen in generations. Well, despite all those things we’re happy to report that when we’re standing here in December of 2016 we strategically delivered on all of those events. And if you look at the cumulative impact of those events, they’re summarized on a slide, it goes back to 2010 with the acquisition of Dominion’s Upstream Appalachian E&P business, we’ve got the sale of our West Virginia coal mines in there back in 2013, a pair of IPOs that created two awesome, transparent standalone pure play entities, one for our Pennsylvania mining complex in the form of CNX Coal Resources, and the other one for our Marcellus Gathering assets in the form of CONE. And this was a busy year as well, 2016 saw the sale of our metallurgical coal businesses, including the Buchanan Coal Mine, as well as the exiting of our Central Appalachian Surface Mining segment. Cumulatively, since 2012 those events total over $5 billion in asset monetizations, and the most important event on that slide is the one on the far right, which is the closing a couple weeks ago of the dissolution of our Marcellus joint venture. I can’t emphasize enough how important, how strategic, and how critical of a driver that’s going to be for our valuation prospects moving forward. We’re going to have a lot more to say about the Marcellus dissolution JV and what that means throughout the morning. Now, with this transformation, a 152-year-old company, a 152-year-old institution, when we went through this transformation how would we describe what we are today, what are some of the descriptors we would attach to ourselves? Well, one of them would be startup mentality. And what we mean by that is it doesn’t mean that we’ve got a rock climbing wall in the lobby and we’re throwing Nerf footballs across the cubicle farms, what we mean by startup mentality is we’ve completely changed, we’ve completely scrapped and rebuilt our mindset and our business philosophy. We’re going to talk about what that philosophy is in a minute. We describe ourselves as agile, we move quickly, we’re data driven, obsessively data driven, that’s not a bad thing from our perspective at all, and of course we consider ourselves a premier E&P. Our number one job, when it’s all said and done, as a management team is pretty straightforward: we are here to grow the long term intrinsic NAV per share of this company. And maybe saying that a little
4
CONSOL Energy, Inc. December 13, 2016 at 8:30 a.m. Eastern
bit differently, we think we add the most value for the investor base as a management team when we are astute allocators of capital, we’re allocating capital at the right places and at the right times. That’s how we add the most value. We feel so strongly about that number one job that we don’t consider ourselves as much of an E&P company as we do a capital allocation firm that’s operating within an E&P opportunity set. That’s a subtle difference, but I think that’s an important difference to keep in mind. The math that we’re doing on NAV per share, it is division, it’s not just addition, so we’re not just looking at how we grow the NAV, we’re paying attention to and assessing opportunities with what’s going on in the denominator because share count, as we all know, is a big driver of NAV per share. We differentiate ourselves compared to the peer group, and we want to talk about where that differentiation shows up in the biggest areas or biggest places. There are three pillars that we see as clearly differentiating ourselves from the pack and, by the way, all three of these somehow, some way go back to either optimizing the employee base so that they can be turned loose, or optimizing the position of the investor base. The first one of course, and I’ve talked about how everything has changed within this company over the past couple of years with all the things that we’ve accomplished, the first area, the first pillar talks about the one thing that hasn’t changed during that time and will never change, which is our core values, being safety and compliance. Now, when you look at what our expectations are, what our drive is to be, what our outcome needs to occur as, it’s to be best in class when it comes to safety and environment. And it’s not just best in class for the basin, it’s best in class for all of E&P. We feel that being best in class under these two values, it definitely drives NAV per share, and it drives it in the short term as well as in the long term. So, we can give you many examples of how best in class, safety and environmental performance in the short term increases efficiencies, reduces cost, improves margins, all drivers of NAV per share. If you look at the long game and you look at things out over years, best in class, safety, and environment performance, it lowers the aggregated risk of the corporation. That lower risk results in a lower cost of capital, lower cost of capital is lower discount rate, and we all know how important discount rate is when you look at NAV per share. Another pillar of differentiation, our business philosophy, we talked about that drive of NAV per share being the focus. And one of the interesting or neat things that comes out of that philosophy that’s a differentiator is that production and production growth for us is more of a byproduct of our process and our philosophy, it’s not the starting and the ending objective, the end all, get all, so to speak. And when you’re looking at NAV per share and you’re driving off of that, a lot of things that maybe traditionally we would have been caught up in with activities or investing of resources, they don’t make it through under this new philosophy what I’ll call the capital allocation filters. And just to give you an example of that, I want to jump ahead to the slide that’s shown here that really sums up an example of that in a good way and in a big way. This is how zero-based budgeting used as a capital allocation tool can be quite powerful and really shows you how it changes the mindset of a team and a company. We are a big fan at CONSOL Energy of zero-based budgeting, and the reason we’re a big fan is that we have seen when it’s applied consistently and methodically it can take a bunch of individual smaller moves that maybe by themselves don’t move the needle on valuation and NAV per share, but in the aggregate before you know it they cumulatively add up to big step change improvements that do drive NAV per share. So, this example that you’re looking at here is what you would typically call G&A, overhead, miscellaneous spend. And on the left side of the chart you’ve got some of those smaller moves that we made under the zero-based budgeting mindset. And on the right side you’ve got an aggregate cumulatively what they’ve resulted in on spend.

5
CONSOL Energy, Inc. December 13, 2016 at 8:30 a.m. Eastern
So, what were some of those smaller moves that we made? Well, for example, executive perks. Under the zero-based budgeting and capital allocation filters we simply eliminated them, corporate jets are a thing of the past, even the naming rights to the Pittsburgh Penguins hockey arena. We were able to monetize those, so we took the resources that we were investing into that activity and now we’ve got the opportunity set to redeploy that into things that drive NAV per share quicker, bigger, sooner, etc. I think the most important example on there is executive compensation. Our board of directors, working with us, has revamped that program over the last couple of years, and it’s been designed today consciously to go towards rewarding how the NAV per share, the total shareholder return of the company occurs and unfolds over the course of a year, two years, three years, even five years out into the future. So, it’s there to do two things. One, to ensure the investor base that this management team is in the same shoes and in the same seat of the investors themselves, and we’re going to make the right decisions to drive that NAV per share. And of course the other thing is to motivate and really focus the management team to make those decisions and seize those opportunities. I’ll also point out there are really two advantages to this type of a tool of zero-based budgeting. One, is the right side of this slide, which shows the aggregate savings. But the second one is even bigger, that’s that incremental savings that you see there now being able to redeploy that into things to do drive NAV per share, whether it’s plowing back into the drill bit because we’ve got high rate of return opportunity sets that grow the NAV per share, or reducing debt, reducing share count wherever the optimal opportunity currently resides. So, there’s a secondary benefit there that’s just as important, if not more so, than the savings themselves. I want to jump back to the three pillars and cover that third one for just a minute, it’s important, it’s our asset base. We’ve got the largest opportunity set of stacked pays in the basin. More importantly, we have it in the sweetest spot of the Appalachian Basin. And, oh, by the way, that only got more true, only stronger with the dissolution of the Marcellus joint venture. We’re going to walk through E&P today and we’re going to walk through it by talking about what I’ll call three building blocks of the NAV per share in that effort. The first one’s going to be the key performance indicators, or the KPIs. So, these are the things that are the going concerns, so to speak, that really drive the NAV per share with our activity set and our efforts. You’re going to hear all kinds of detail coming up from the team on those, but I’ll give you the Cliff Notes version right now. EURs are way up, LOE is way down, our capital intensity has been significantly decreased and our capital efficiency has been substantially increased, all those of course drivers of NAV per share. And when you take those KPIs and you couple them with our activity set for 2017/2018, which we’re going to lay out, you get that, what I’ll call base case driver of NAV per share within E&P. But then we’re going to talk about a second and third building block in the E&P segment. The second one is what our views are, what our thoughts, processes, and, frankly, expectations are for converting what we’ll call our non-core acreage positions in the Marcellus, in the Utica into core positions. That’s going to be a significant driver of NAV per share, there’s a big opportunity set there. Our team will go through that in detail. We’re also going to talk about the third building block which is stacked pays, as I mentioned earlier. And the way we think of stacked pays, we think of them in some ways similar to DUCs but also different. So, we all know that DUCs have some incremental IRR opportunity sets that are second to none because of the sunk capital component, but we also know that DUCs are finite, there’s only so many of them and at some point and some point soon you exhaust those locations. Stacked pays are maybe a step behind DUCs when you look at the incremental IRR opportunity set. And we’ll show you here’s what the capital, the costs, and the rate of returns look like for Marcellus by itself, Utica by itself and then here’s what they

6
CONSOL Energy, Inc. December 13, 2016 at 8:30 a.m. Eastern
look like with stacked pays, where we’ve got the core over core opportunity set. And unlike DUCs, when you look at the future locations and opportunity set of stacked pays, they are sustainable, they are the type of opportunity set that stretch years into the future, so more to come on that. Also, you’ll see on the slide, don’t forget about our held by production position. We are 90% HBP, we are developed only 4% across our acreage footprint, 8% in the Marcellus, 1% in the Utica, those different data sets, they’re cumulatively a big differentiator compared to the peer group. We also, by the way, have the biggest data set, the most extensive data set in this basin, especially for the dry Utica, which is important for how efficiently quickly we can delineate the dry Utica. And the reason we’ve got the largest data set is it really accrues from the footprint in two different directions. One, is our own drill bit activity, our organic activity, where we’re accruing that data, an example would be the Gaut well up in Westmoreland County, which we’ll talk about. But the second contributor to that data set is our participation in non-operated third party wells, because again of that extensive acreage footprint. So, having the largest and most extensive data set in that region, that’s really important to things like converting non-core to core. So, you take those key performance metrics, the KPIs that I spoke about, you take the data set that’s second to none, stacked pay opportunities along with converting non-core to core, you take those altogether, that’s an unrivaled position when it comes to asset base. Now, let’s jump ahead to talking about our three step plan over the next two years that really will drive the execution focus and what we expect to see from the execution. The first step is pretty straightforward, we’re going to grow the E&P production and the EBITDA that comes from it, we’re going to do that by investing in very high IRR opportunity sets within our asset base, and that’s going to lead to the second step. The second step is taking that EBITDA and the free cash flow that the asset base will generate, and by the way while we’re growing E&P production and we’re growing the EBITDA from it we do expect, just like we did in 2016, to generate positive free cash flow and along with some asset sales we are going to use that to reduce debt, and we’re going to get our leverage ratio down to 2.5x or lower. Now, getting that leverage ratio to under 2.5x, that’s going to create a strong balance sheet, which is going to create some optionality, and we expect, by the way, to reach that less than 2.5x in 2017. So, this is a here and now opportunity, objective, etc., it’s not something that we expect to occur over the course of a number of years. On the asset sale front that I mentioned, we expect and target $400 million to $600 million of asset sales in 2017. We’ve done much higher levels of asset monetizations in the past, Steve Johnson’s going to talk about why we’re comfortable with that, what the opportunity set is, and how we’re going to perform off of that coming up this morning. And by getting to less than 2.5x leverage ratio, that also creates some optionality when it comes to splitting the coal and E&P segments. And if the market cooperates, and it’s been looking more and more like the market wants to cooperate out there when it comes to coal markets, our view, our objective is to try to get that split done in 2017. The projections that you see today do not assume that that happens, so it’s again our intention to try to beat what effectively our base case is. Dave Khani’s going to talk more about what are the different avenues that we have at our disposal to get that done, and what our thoughts are on each of those. The third step is really the most exciting of the three. This is when we really get to be the best in class capital allocators to demonstrate that on a day in and day out basis. So, step three is we take that strong balance sheet, we take the free cash flow generation of the corporation, and now we start to pivot between our opportunity sets. Do we go to incremental activity set within a drill bit because it’s got really high rate of returns and there’s a great NAV per share proposition there, or instead do we look at things

7
CONSOL Energy, Inc. December 13, 2016 at 8:30 a.m. Eastern
like share count reduction because of its rate of return opportunities and what it means for NAV per share. And that again is the key to capital allocation. At some point, I’ll tell you today as we sit here the management team feels strongly that there is a great NAV per share opportunity set when it comes to share count reduction, because again going back to where our shares are trading at versus what we think the NAV per share of CONSOL Energy is. At some point that gap closes, we’re going to assume success, and our equity becomes more of a traditional tool within our balance sheet, just like debt, free cash flow generation and the like, and then we start considering our equity for things like M&A, etc. But it’s under the same philosophy, the same process, the same capital allocation filters that we talked about currently that we’re using today. We talked a lot about all the things that we have done, and one of the things we should spend a minute on is the thing that we haven’t done, and that is not issue equity. We are the only Appalachian E&P peer that has not issued equity since the downturn. If you look at all seven of our peers, since 2014 they issued cumulatively about $10.6 billion in equity. This is the best example, I think the biggest illustration that we can give you, that our actions are consistent with the philosophy that we’ve laid out in our works. So, we’re relentlessly driving towards things that drive long term value creation, we’re not going to get shortsighted or short circuited with short term objectives like production growth. Now, the team’s going to cover all of this in much more detail this morning, and they’re going to put it in context for you. And they’re going to walk you through E&P, they’re going to talk about the other value contributors within the company like CNXC, CONE, our water business CONVEY, what our thoughts are on asset monetizations, all of those things. We’re confident that when the day concludes you’re going to have a much clearer picture of CONSOL Energy, our opportunity set that we have at our disposal, and the long term value proposition that we see moving ahead. So, with that I’m going to turn it over to Tim Dugan, and Tim is going to jump into the E&P side of our business. Tim Dugan Thanks, Nick, and good morning. I’m sure some of you may have attended or Analyst Day back in 2014. Back then I was new to the company and I spent the first few months observing and learning the culture and the people, and I could see the potential, I could see what we needed to change, and I could see what we could become. We set some goals back then to reduce our drilling and completions capital and our operating expense by 15% over the next 18 months. Our team embraced the challenge and met it head-on, and far exceeded the goals that we set, and that was a great accomplishment, and we’ll talk more about that in a bit. But probably the most significant accomplishment that came out of that period was that the CONSOL team came to realize how good we are and what we could accomplish with the right people, the right technology, and the proper objectives. We now have a team that truly believes in themselves and the company, so I’m here to tell you that what we have done is significant. But it pales in comparison to what we’ll do in the next few years. The accomplishments are impressive, but in reality we really are just beginning. So, our hope is that at the end of the day you can see the path forward as clearly as we do. Now, before I get started I want to introduce a couple of my co-workers that will also be presenting. First, Andrea Passman. Andrea is our VP of E&P Development. Andrea started with the company just a week before I did, and she brought with her a wealth of experience from different basins across the country. When we talk about technology, science and process improvement, Andrea has been the catalyst behind many of the advancements in those areas. She has been a true differentiator.

8
CONSOL Energy, Inc. December 13, 2016 at 8:30 a.m. Eastern
And then we have Don Rush. Don is our VP of Business Development and Marketing. And back on Slide 4 Nick spoke about some of the major events that have been significant in our transformation to an E&P company. Several of those watershed events were led by Don Rush, the 2013 sale of our West Virginia mines, the sale of our Buchanan mine earlier this year, and most recently the dissolution of our Marcellus JV with Noble, all of these deals were completed because Don Rush was driving them. Now, when you see Don, if you didn’t see him you’d think I was talking about a weathered, 55-year-old bald guy. So, don’t be taken by his boyish looks, he’s got the experience of someone twice his age and the accomplishments to match. So, let’s start by discussing what we’ve done since 2014, when we held our last Analyst Day. Operationally, we’re a much different company than we were in 2014. Our improvements in drilling, completions, production, and cycle times have been driven by efficiency gains that resulted in lower cost, improved well profiles, and increased rates of return. We’ve looked at every aspect of our operations, focused on continuous improvement, and now two and a half years later we require significantly fewer wells to generate production growth than we did in 2014. The results have been tremendous and have helped drive NAV per share to this point. Now, as we look forward, the improvements will be ongoing. We’ll continue to push efficiencies, but future improvements will be driven by technology and innovation through our stacked pay opportunities. The true value of stacked pays is still not widely recognized. Stacked pay development allows us to realize value quicker, with lower capital, less risk, and it improves our rates of returns by 10% to 20%. As we continue to delineate the dry Utica, our stacked pay opportunities will grow. Currently, 65% of our core acreage has some stacked pay potential, and 45% of our core acreage has Marcellus and Utica core stacked pay opportunities. That’s a 22-year inventory of stacked core development in the Marcellus and Utica as we view it today. The dissolution of the Marcellus JV provides us with the operational flexibility and control to take advantage of these stacked pay opportunities. It’s also important to understand that we maintain Utica rights under much of the Noble operated Marcellus, and some of that acreage has Utica, Upper Devonian stacked pay possibilities. Now, Nick mentioned earlier the focus on moving non-core acreage to core, continued delineation of the dry Utica will move more and more acreage from non-core to core, expanding our inventory, increasing our stacked pay possibilities, as well as increasing our acreage monetization opportunities. Over the next three years we expect to convert 250,000 acres from non-core to core through both operated and non-operated delineation opportunities as well as data trades. There will be ongoing efforts to analyze and understand our non-core acreage and move it to the core acreage category. Our vast acreage position of over 1.2 million acres will be the catalyst for NAV growth in the years to come through development and asset monetization opportunities. Now, Slide 13 shows how far we’ve come with respect to capital efficiency. This metric measures capital efficiency by looking at the total capital spent on each well, as well as the actual decline curve in EUR based on a $2.50 gas price. It shows how CONSOL has generated value over the last two and a half years by improving well quality and decreasing capital. In 2014, for each dollar we spent we were only getting 1.24 Mcf at a rate of return of less than 10%. Now, fast forward two and a half years to today and we’ve more than doubled that metric to 2.78 Mcf at a 40% rate of return. Our rate of change has been significant, and it will continue as we enter into stacked pay development mode. Another metric to show our improvement that you might be more familiar with is finding and development costs. If you look at our F&D costs compared to the industry, our five year average is $0.80 per Mcf. It’s top three amongst seven of our peers. Our current F&D cost is $0.55 an Mcf, and it will continue to improve with further delineation, which Andrea will talk about in more detail in a few minutes.

9
CONSOL Energy, Inc. December 13, 2016 at 8:30 a.m. Eastern
Now, these last two slides reinforce Nick’s point from earlier, we are a best in class capital allocator with great E&P assets. Our operational evolution, coupled with technical advancements, is driving growth at CONSOL. A huge part of being able to improve performance while lowering costs is our advancement of technology, we’ve brought in a lot of E&P talent, new modeling applications, and training programs to accelerate our NAV growth. We start with an earth model, which helps us better evaluate and understand the rock and its variations so that we know where to drill the best wells. Once we know where to drill the best wells, we model our completions through frack modeling to optimize them to get the biggest bang for the buck, which really equates to maximizing our production and minimizing our completions capital. Then we use reservoir simulators and rate transient analysis to understand how to produce the wells to gain the most economic benefit. But it’s not just about the best wells, it’s about managing our risk as a company, so we had to change our thinking and start living in a probabilistic world with multiple outcomes to balance. We had to manage all of these opportunities in an optimized portfolio. All of this started growing our NAV per share and resulted in increasing our EURs by 100% in two years, improving our capital costs by 38%, reducing our operating costs by 61%, and improving our Utica acreage position by 40%. Now, if you remember I referenced earlier the goals we set in 2014, reducing costs by 15%, this shows you how far we’ve come and how committed our team is to really driving our costs down and improving our well quality. Our technical advances, coupled with lean manufacturing, zero-based budgeting, and an intense focus on supply chain management have helped CONSOL move from a lagger compared to our peers in 2014 to an industry leader in 2016. So, how did we do it? We reviewed our operations segment by segment, looking at each phase of every process to assess what we were doing, how we were doing it, the tools, equipment and vendors being used, we asked whether it was necessary and most importantly we asked did it add value. This led to things such as improved construction design using soil cementation, building more stable locations with less rock, a smaller containment footprint, we eliminated the top hole rig and went to top down drilling, we improved our fluid systems, our bottom hole assemblies and our bit selection to reduce the number of trips per well. We optimized our field compression and reduced our horsepower, while also reducing our field pressures. We customized our completions, resulting in improved sand loading and stage spacing. We standardized our production equipment and automation. These are just a few examples, there are many, many more. Now, public data is generally lagging so it’s taking time for our improvements to be recognized. But now our improvements are being acknowledged through public data, as can be seen here, with information published by IHS Interdeck via Credit Suisse. This chart can be a little confusing, so I’d ask you to ignore the bar on the far right as we talk through this, but what this shows is the first three months and six months of production for wells that were turned inline in 2014 and early 2015. The bar on the far left is CONSOL and it compares the same data for five of our peers for the same time period. And as you can see, we not only exceed the average but we’re top amongst our peers. And then to show the magnitude of our improvement, the bar on the far right is CONSOL data, similar data for the first three months and six months of production for wells that were turned inline in 2014 and early 2015, so the rate of change, again, has been significant. Now when you look at how we stack up against our peers, we’re now one of the top Appalachian players and the changes we’ve made have put us in a unique position to excel further and grow NAV per share. We have one of the largest Marcellus Utica footprints in the Appalachian Basin, and as Nick said, 90% of our acreage is HBP, while only 4% of our Marcellus and Utica has been developed, and it carries with it an 89% NRI across both developed and undeveloped acreage. This is well above the industry averages and yet another differentiator that makes us unique when compared to our peers. We’ve inherited a position from our legacy coal operations and acquired a high NRI acreage position from Dominion in 2010 that give us a significant advantage. We have nowhere to go but up as we move towards stacked

10
CONSOL Energy, Inc. December 13, 2016 at 8:30 a.m. Eastern
pay development and continue to grow organically. Now, this slide highlights our acreage position pre- and post-dissolution of the Marcellus JV. You’ll see that our total acreage position decreased through this transaction, but the majority of the acreage decrease came from non-core areas that did not account for substantial value. When you look at the quality of acreage we received, we increased our overall fee position, we increased core acreage in our current development fields with high quality reservoir, we added to stacked pay opportunity set, and improved the value of the overall asset. The dissolution of the Marcellus JV was an NAV accretive deal for CONSOL. We were able to capture value in the form of cash, PDPs that added 85 million cubic feet a day of production, we received a significant inventory of drilled, uncompleted wells, and we received acreage that improved our core position by 64% in exchange for carry that was considered unpredictable and uncertain at best. In doing so, we gained significant operational control and flexibility that will allow us to take full advantage of stacked pays and asset monetization opportunities. With that, I’m going to turn it over to Andrea Passman, and she’s going to talk about some of our type curves and development processes in more detail. Andrea Passman Thank you, Tim. So, when I joined Tim three years ago we knew we had to take a drastic approach to our engineering methodologies to make rapid changes in terms of our well performance. So, having worked with Halliburton for a number of years and about 80% of the shale basins, I was used to a workflow that we then adapted for CONSOL, and really tying that workflow to drive NAV per share. The base of that workflow and that engineering methodology starts in our Geology group with our earth model. The earth model pulls together all of our seismic information, including 3D and 2D, fiber data, logs, production performance to correlate across the basin and our acreage position in order to understand where the sweet spots are and where those hot spots are that we want to drill. Once we have that we can then move into our frack modeling world, because it’s not about just where we drill the well, it’s really about how we complete that to really take advantage of the rock properties in that region and get the most production from it. Once we have our frack model, then we can develop our production model, which really tells us what that performance is ultimately going to look like and forecast the well out to understand the economics for that development cycle. Then we move into our rate transient analysis to not only continue optimizing the frack, but also have a strong understanding of how we want to produce the well in terms of managed pressure drawdown or any constraints. Finally, we move into development optimization, because it’s not just about drilling the best wells, it’s really about taking advantage of that development cycle. This is really where we understand what is the capacity of our pipelines, which markets are we going to, where do we have constraints, what additional build-outs do we need to put into the system in order to move that, and then we look at that on a portfolio basis with a probabilistic model to understand the risk associated to that. All of this is driving our decisions on capital allocation across the entire portfolio to ultimately drive the highest NAV per share. Now, where this differs from past issues and past operators is that really we’re starting to look at this in ways that we can bring NPV forward and really accelerate the development. Too many operators wait too long to pump more prop, drill longer laterals, and work into stacked pay. We’re doing that earlier so we can take advantage of all of that NAV. If we use that optimization workflow now we can really get into how did that drive specific performance in each one of our major regions. The first region I want to talk about is Southwest Pennsylvania, which

11
CONSOL Energy, Inc. December 13, 2016 at 8:30 a.m. Eastern
does dip down just a little bit into West Virginia, which we call our SWPA region. In the last year we’ve moved from a 2.1 to a 2.7 Bcf per 1000 type curve. This is really across an acreage position that has an 89% NRI. We’re going to continue to focus in this area because we figured out the recipe, we’re optimized, and we have impressive performance improvements in the last two years. Over the next two years we’ll have a sizable capital expenditure in this area, with two rigs running in 2017, and three rigs in 2018. We’re also excited about the Utica in this region as well. With a 3.2 Bcf per 1000 type curve we’re going to continue to delineate this region through participation and future wells and drilling in this area as well. Let’s not forget about our third stacked pay in the Upper Devonian, which is the Rhinestreet and the Burkett. We have three wells that are expected to turn inline in 2017 that we’re going to continue to monitor performance on and see where the progress takes us. If we drill down into the modeling input, which you’ll also find in the Excel files, a little bit more detail. The capital within here is fully burdened and the rates of return are based on realized pricing. The undrilled locations are based on the core type curve area guidance. So, if we look at the Marcellus, you can see a number of things here we should point out. Notice how long the average laterals are, that’s 8,500, with some laterals in our position going from 10,000 and 12,000 feet. Also, the low capital, $7.1 million per well, the EUR 22.6 per well, very high, as well as the high rates of return, which is why we continue to focus on this area. With 188 wells already online, we have a very strong understanding of this region and the performance that can drive forward. If we move into the Utica area, you can also see that there’s one well within this region, but we do have low LOE at $0.05 per Mcf and gathering at $0.23 per Mcf, once again, very high EUR and strong economics. We’re looking forward to continued improvement as we watch performance in this region through our participation wells in our own with a lot of upside. If we move on to our second region, which is West Virginia, what we feel is really the best to come in the future for West Virginia, as this is an area that changed dramatically for us for the dissolution of the JV, there’s a lot of optionality in this region with the liquids, it’s a contiguous area, with a lot of capital investment in water and midstream infrastructure. As you can see, we have a number of DUCs in this area, with the sunk capital really helping push up the IRR. The Utica is an area of interest for us, as we’re continuing to look at this huge opportunity as it moves forward with delineation in a number of participation opportunities that we’ll talk about shortly. You’ll notice there’s some light blue acreage defined as Utica Resource Potential, this is where our Geology team has currently drawn the line. We’re looking to move that line and further define it with additional data. This is where we believe either the Utica may be overcooked, contain no gas, possibly pinching out slightly, and at the southernmost point may not even be present. This is 220,000 acres that is not currently represented in the cumulative numbers. If we break this down further into the modeling inputs, you’ll notice that we provided an NGL and condensate curve for all of that optionality within the liquids again, once again, very long laterals, very low capital of $6.6 million per well, and continued improvement looking forward in the future in this area as well. When we look at the Utica type curve, we’re definitely looking to prove this up this year, but a 2.8 Bcf per 1000 foot type curve with a number of future locations out there and capital of $12.7 million for a 6,500 ft. lateral. Our third asset region is CPA, or Central Pennsylvania. This is an area we’re extremely excited about. We have a lot of running room in this region, with very little competition, and we’re most excited of course because this is where we have the Utica, where we have the Gaut. We’ll start with the Marcellus. This is an area in development of the Marcellus where we’ll get a nice uplift in terms of stacked pay and the help from the Utica.

12
CONSOL Energy, Inc. December 13, 2016 at 8:30 a.m. Eastern
When we look at the Utica and the Gaut, the Gaut actually outperformed even our own internal type curve by 17% from our original prediction. And I remember the day that I got a text with the pressure off the casing, and it was very high and I thought to myself, I’ve never even seen a well this big when I worked offshore, so, needless to say, we’re extremely excited about the Utica in this region. We’re going to continue to drill in 2017 and 2018, so, yes, it’s official, we’re going back to drill again at the Gaut with two wells in 2017 and one well in 2018. Furthermore, we have a number of non-op participation opportunities in this region for continued delineation so that we can really figure out where we want to be and how far we want to go in this region. When we start to break down the modeling inputs, as you can see from the Marcellus, very long laterals, 9,000 ft. on average, very low capital of $6.2 million. We look at the Utica, and a large number of locations, 1,177, shooting for capital of 12.6 on a 7,000 ft. lateral, and really when we look at the LOE and gathering, once again with the dry system we have very low LOE at $0.05 per Mcf and gathering at $0.23 per Mcf. Moving on to the Ohio region, this is an area we really love, as once again we’ve taken that optimization workflow and we’ve applied it to this region, and we feel we’ve figured out the recipe on the Utica acreage in our Monroe County development as well. We’re fracking with ceramic, we’re in manufacturing mode, and we’re drilling very smoothly, in fact, we’re drilling today, and the fracks are going really well for us. The wet area is another area of optionality for us in the future, depending on liquids pricing, it’s where we have our Hess JV that we’ve still maintained, and we’re continuing to watch this region. If we break that down further, you can see that we have the liquids curves up top again, once again long laterals, that seems to be a common theme among us here at CONSOL, we don’t have a problem putting together land positions and really we’re going to continue to watch this area based on pricing. The dry is really some of our best opportunity in the entire company, we love this area, very high EURs, as you’ll notice, 25 EURs per well in the recovery, long laterals again, low capital, 9.4, in fact we keep beating our capital projections out there for drilling and completions, everything is drilling extremely fast in this region now for us. In fact, in Q3 of this year was our highest cumulative production in Ohio for all of our wells in this region, so we’re very happy with the performance that we’re seeing and continued focus in this area going forward. One area I want to highlight as well is our Virginia Coalbed Methane. I was talking to somebody earlier about how CBM was really the beginning of the unconventionals, and so I want to say that we’ve taken that same optimization workflow, especially when it’s applied to the reservoir understanding and the completions, to drive improvements in this area. Capex has come down by about $85,000, opex has also come down, and cycle times have improved dramatically. This has improved rates of return by nearly 10%. We like this area because we’re now testing refracs, we’re expecting to see about an additional $200 million in NPV from that program. Really now that we’re in manufacturing mode we’ve really gotten into a place where we can just run forward with this. It’s a cash cow with access to southern markets and an advantage basis. Let’s shift gears a little bit and talk about how that engineering workflow fits within our overall development methodology. Really, with the development methodology we had to start looking at our world in terms of the life cycle analysis. Too many times we get stuck in just a world of trying to drill our best wells first. It’s not about drilling the perfect well, it’s about taking advantage of the life cycle and getting it done faster and accelerating that cash flow. So, we had to take geology and our understanding of where the sweet spots were at in combination with how we would lay out the laterals, what was the land cost, how soon could we get title done, was there any joint asset development with other operators in that region into

13
CONSOL Energy, Inc. December 13, 2016 at 8:30 a.m. Eastern
consideration. The market, which market was it going to, where did we have FT, midstream, what would be the midstream build-out, is it a dry on dry system, is it a blended system with wet, how to understand our water infrastructure, and availability for water and reuse of water. And then finally getting to the piece that gets us into the ground, drilling and completions, the costs associated with that, the techniques applied to that, and ultimately how we would produce those wells. By understanding that full life cycle for each of our regions, and not just our regions but the 20 areas of interest we have within those regions, gave us detailed information about how we wanted to drive forward on development, and to answer specific questions. Questions that used to take us months to answer now take us hours to answer. Do we buy more FT? Do we swap land? Do we change out our acreage? Which pipeline projects should we build-out, and water as well. Even a few months ago when we picked up two additional rigs this is the workflow that drove that decision, and when we complete our DUCs we look at that in a risk-based world because we all know there is no one answer when it comes to shales, and we really tried to understand which assets do we keep, which ones do we divest, and then in turn, how do we sequence those moving forward to drive NAV per share for the company. This is the workflow, that is all of the decisions that we make that drive that NAV. Now, when we take this workflow and we apply it to our stacked pays opportunity, this is when it gets really interesting. Having worked in the Permian for a number of years, I saw an interesting phenomenon happening out there, and I’m sure all of you have seen this too. First, we went and developed the Wolf Camp, and then we picked up the rigs and the frack crews and we left. And then we came back, and then we developed the Kline with the same rigs, and the same frack crews, and then we left. And then we came back, and then we developed the Sprayberry with the same rigs and the same frack crews, deploying the same infrastructure over and over again three times. Think about if we could do all of that right out of the gate, what a difference that would be in terms of stacked pay development. So, really the great thing about CONSOL is because we’re only 4% developed today we have all the running room to get it right out of the gate at the beginning. So, when you look at stacked pay and what that looks like, it’s really 40 years of drilling inventory for the company. The JV separation allows us to take control of all of those opportunities across the three horizons to develop those in sequence when we want. And that optimization workflow is critical in understanding that sequencing. Do we develop Utica and Marcellus simultaneously? Do we develop Marcellus first and come back and get Utica later, or vice versa, and when do we throw Upper Devonian in there? That NAV mentality is critical for understanding that and driving that sequencing and timing of development, and it’s very area dependent. This also creates a huge opportunity for CONE within our company. We have a dry system that we’ve built out that we can take advantage of to really get those Utica volumes pulled in with the Marcellus volumes that are out there. Other operators cannot recreate this opportunity, it’s a core over core stacked pay footprint with an opportunity to move that through a dry system and really take advantage of data, both through our own drill bit and through participation due to that footprint. We’re going to learn quicker and faster and get to optimization much quicker. Let’s take a specific example and break it down on a Pad level in Southwest PA. When you look at the unstacked versus stacked Marcellus you can see that there’s about half a million dollars on a per well capital basis, LOE comes down in a stacked world, as well as that gathering rate. A lot of that is getting the benefit from the Utica. When we look at the Utica, we have about a million dollars of difference in that overall well capital, and that, again, pulling down LOE and gathering for having that full combination of gas. Marginal horizons, we see that our typically lower economics can often an uplift when we see in

14
CONSOL Energy, Inc. December 13, 2016 at 8:30 a.m. Eastern
combination of stacked pay development. Furthermore, we have a very small footprint on site, so this way we can develop multiple horizons with the same Pad, the same personnel, where they’re managing the multiple horizons, and therefore actually reducing our risk associated with environmental and safety. All of this in combination gets us that 10% to 20% uplift in rates of return that we’re seeing across each of our regions. So, let’s go back and revisit that metric that Tim talked about earlier, capital efficiency. If you look at where we are at today, we are at that 2.78 Mcf per dollar. Now, when you move into a stacked pay environment with that, our potential for that is a 3.02 Mcf per dollar and an additional increase of 15 percentage points in that rate of return, a 60+% rate of return for these opportunities. This is a game changer. This is why we’re so excited about it. It takes our capital efficiency and even continues to improve on that going forward with our plans. Let’s break this down into a specific example that actually came to us with the JV dissolution. This is our RIchhill Field, which is located in Greene County. It’s the best of the best when it comes to Marcellus and Utica. When we started to look at development opportunities and how we were going to take a look at this field, we had an issue. We had wet gas when it comes to Marcellus, and dry gas when it comes to Utica, two different systems for most operators. In this case, because we can blend in this region we can still hit tariff, dramatically reduce our operational costs in this region, and get all of this area developed. When you look at the capital, it comes down for each of the specific plays in a stacked world and our net present value rises dramatically, in fact, at about 33%, over $200 million, and as Dave Khani likes to tell me that’s a buck a share. So, we’re very excited about the future of our stacked pay development. Let’s not forget about the third stacked pay, the Upper Devonian, including the Rhinestreet and the Burkett. We continue to watch performance of the Upper Devonian with a number of wells coming on this year. Currently we have 16 operated Upper Devonian wells. Our Ninevah 39F well continues to be one of our strongest Burkett performers we have at 1.62 Bcf per 1000 ft. We like to frack the Upper Devonian with the Marcellus because it provides stress shadowing that really helps us contain the Marcellus. If you want to geek out for a minute, it’s a lot like directional frack propagation, so we get a nice containment and it often bumps up the performance of the Marcellus that we’re seeing when we do these in combination. So, we’re going to continue to watch performance and figure out how this plays into our future development plans. The third piece that we talked about with performance and with the stacked pays is our ability to move our non-core acreage to core and how we’re going to go about that. Our non-op program is really a big part of what’s driving the future NAV of this opportunity, it’s our ability to delineate and monetize opportunities within the non-core and moving to core. Our legacy coal position has really allowed us to participate with many of the operators that are surrounding us, not only are they coming to us because of our performance in the Utica and the amazing changes that they’ve seen in the company, but our non-op group is actually going to other operators now and suggesting wells for participation in programs in order to acquire data. With over 130 wells in the Utica earth model today, in two years we’ll have over another 30 wells that will add data to that model to further refine it and really understand the delineation of the Utica. This is a target of about 250,000 acres that we’ll delineate through non-op and operated opportunities in the next two years. We will be the company to delineate the Utica because it is a huge opportunity for us, it is a massive NAV driver for the company that we strongly believe in and we’ll continue to focus on. So, why do we love the Utica so much? Besides the incredible performance that we’ve seen in the Ohio side, we’ve also seen strong performance in the Pennsylvania side, specifically the Gaut well. I always love saying the Gaut well, it’s very exciting to me. The Gaut is very exciting because really when we look

15
CONSOL Energy, Inc. December 13, 2016 at 8:30 a.m. Eastern
at it it’s all about strong performance and continued strong performance that hasn’t even begun to decline yet. We’re at 8 Bcf coming up on the end of the year, which is pretty impressive in itself, and has held fairly flat. A lot of people thought the Gaut was a fluke, that was a lot of the rumors out there. I don’t think they quite understood the science that was going on here at CONSOL. Really, where this came from was we had a well, the Nellie Martin, it was drilled in 1970 by Peoples. It went down to 15,500 ft. That well was drilled on a seismically defined high side fault closure within the roam trough, and when they got to the Utica they hit gas. So, we re-processed the log and it told us that the Utica was here and that it was prolific and that there would be tons of pressure. And we were very, very excited about that. And that’s where the Gaut came from. And now our earth model is telling us that the Utica is here and it is prolific, and that’s why we’re going back to continue drilling in this region and really take advantage of the running room that we have here and the lack of competition in this area. So, when all of this works out, when the performance continues to improve, when we work on stacked pays, when we delineate the Utica, what does this mean for CONSOL? Well, it means the size of the prize is very, very large, 360,000 additional acres, 180,000 of those acres are core today with double pay stacked opportunity, 20 Tcf. Let me just say that again because in my world as a reservoir engineer that is a massive, huge number, 20 Tcf. That’s if an when we delineate over the next two years, 5,000 triple stacked locations that’s concentrated across the Upper Devonian, including Rhinestreet and Burkett, the Marcellus and the Utica. Each data point we get in accelerates our future opportunity for bringing forward development of stacked pays. Every data point we get in changes our thinking, and because we’ve built a portfolio with optionality in it we can move very quickly in multiple directions. Finally, 40 years of drilling inventory, that’s with four rigs if we wanted to go drill all of that out. To date, we’ve drilled 14 dry Utica wells, we’ve participated in 18 wells, and we have another 30 coming over the next two years, to really understand what we have here. So, in the next two years, as Tim mentioned, CONSOL looks like a very different company. So, now to get there we’ve got to execute so here’s the two year plan. We’re going to continue to delineate the Utica in our stacked pay opportunity. We’ll adjust our plans as we go along depending on the results that we get, we’re going to focus on our best areas, like Monroe County, Ohio, and the Southwest PA region for the Marcellus. We will consistently complete our DUCs from December of ’16 through ’18. Looking at that when we get into capital and production guidance, you can see that capital is relatively low compared to other years, specifically due to our dramatic improvement in efficiency. We’re spending a lot of capital on our high rate of return areas now and really focusing in. Once again, as Nick said, production is no longer a target. Growth is a byproduct of our capital efficiency and our capital allocation methodology. So, if you look at 2016, we’re ending the year at $205 million in total E&P in midstream capital, that gets us 395 Bcf, this was during a downturn, that’s 20% growth year-over-year. Moving into ’17, we’re expected to spend $555 million in E&P and midstream capital. That will get us 415 Bcf at a 5% growth. Moving into ’18, approximately $600 million for 485 Bcf and 17% growth. If you’ll also notice, to hold our production flat maintenance capital would be approximately $250 million to $300 million. You’ll also notice that’s a very similar number to past years. Notice that this is the same number for way more production, so we’ve become much more efficient in that number as well. If there’s anything that you take away from this section it’s that we’ve done a lot in the last two years to improve our performance, we have room to get even better than that, and we’re doing far more with far less. We have a path in the future to continually improve our stacked pay development, especially when it comes to the Utica and ultimately drive up NAV per share. So, with that, we need someone to sell all this gas, and I’m going to turn it over to my friend and colleague, Don Rush.
16
CONSOL Energy, Inc. December 13, 2016 at 8:30 a.m. Eastern
Don Rush Thank you, Andrea. And it’s truly impressive what the team has done and the upside we have is really exciting. Before I start, I want to say I have a lot of material and only a short amount of time to tell it, so don’t worry about trying to read the slides, I’ll hit the highlights and more importantly focus on how we think and why it is we think that way. So you’ve heard from Nick, we have a unique philosophy here at CONSOL, and you’ve heard from Tim and Andrea that we have a high caliber team and a very unique asset base. I’m here to talk about how we build a custom marketing strategy to take advantage of all that. So, the first thing that’s important to know about our marketing strategy is that it’s holistic, and it really only makes sense with all the pieces working together in concert and coupled with our unique asset base and business philosophy. Second, it acknowledges that the market is different now, the dynamics have changed, shale gas changed the game, and the Appalachian Basin really flipped it on its head, and our strategy acknowledges that the old strategies don’t quite fit it anymore and some new views are needed. Third, it’s a strategy that stays humble, for we don’t think and we really don’t think anyone can continually accurately out-predict the market, so we don’t try to. With that we’ve created a very flexible, agile plan that allows us to incrementally increase our risk/reward ratios over time, support our production plans, and avoid taking on very large one-time risks. Now, some of these philosophies are different, and I think we got to them with a pretty unique team. We’ve brought in a lot of outside talent and expertise, and coupled it with fresh, open, highly data driven minds, and this led us to a different view on how we should operate in these new market dynamics. The next few slides I’ll walk you through how we work to create value with our team through our low cost, nimble FT strategy, our hedging philosophy and how we navigate the uncertain new market to not only support our production plans and create NAV per share, but manage our risk while also creating value along the way. This slide is just to really help you see how our team functions and how we categorize activities on a day to day basis. We tentatively call it our barbell approach. So, on the left you’ll see the current near term items, the normal stuff E&P marketing teams do on a day to day basis, trading gas around, scheduling our production, working to optimize the flexible system that we created. And not only do we do that on our own gas streams, we are now doing that on our peer gas streams as well, creating over a $1 million of incremental value per month doing so. In the middle is our programmatic hedge, which I’ll get into later, but it keeps a stable foundation for us to execute and run our business off of, and on the right are the larger, big decisions. As you’ve heard from Andrea, we’re very much tied in across the whole company on these decisions, and we spend a lot of time and energy and effort there, working really hard to increase the probabilities for success while also actively managing our risk profile. And I do want to make it clear, just because we actively manage our risk profile does not mean we’re risk averse. In fact, it’s the opposite, we’re set up and we spend the time and energy there, as we should, so when we see opportunities we like and the risk/reward is there and attractive to us, we jump on them immediately. And the other side of the spectrum is also true, when we see decisions and activities that don’t make sense for us, as you’ll see in the FT slide later, we don’t pursue them as an active choice. So, to spend a few minutes here on the market, not too much but a couple, obviously the market is volatile, it has been and it’s going to continue to be. Some of the new things, it’s different now, obviously the gas supply and demand centers are changing, pipes flowing different directions than they used to, both gas and supply being 50% bigger and more volatile than they used to be, and ultimately the working inventory necessary to keep all this in balance staying about the same. If you really break it down and

17
CONSOL Energy, Inc. December 13, 2016 at 8:30 a.m. Eastern
look at it, you really only need a 2 Bcf per day annual change on the supply or the demand side to really create an extremely high inventory situation coming out of the winter, or an extremely low one. Basically, the system as it exists right now has very little slack in it and with that it’s hard to continue to be accurate and predict it as you go. So, while the forward curve looks flat and stable, it’s our opinion that’s that case just because no one really knows what’s going to happen next. Volatility is not bad, though. We build our strategy for it, so going forward we’ll thrive and be fine as a company in both good and bad markets. And ultimately right now there are a lot of positive indicators out there. Now, I’m not going to spend time going through, you guys all know what they are, but one that’s of particular importance to us in our basin are the pipelines. The pipelines are coming, they’ve been delayed, everyone would have liked them here sooner, but the important part is they will be here. And as you can see from the chart on the slide it will more than be able to allow this basin to grow at a 3 Bcf per year average growth pace. We feel very good about the fundamentals of this basin for the foreseeable future. So, jumping into how we took all this and built our strategies around it, I’d like to start off first with our approach on FT and how it’s a bit different. So, looking back, we could have taken on a full book of 20 year high fixed cost FT and hoped that the cost was worth it every year for the next 20 years. In fact, that approach probably could have been easier, but it doesn’t really fit this uncertain, highly volatile market that we’ve already been talking about. So, we choose to do it differently and went with a surgical, more flexible approach. As you can see from the chart on the slide, it’s working. Year-to-date 2016 we’ve been able to achieve around a peer average NYMEX netback basis differentia, but the important part here is we’ve been able to do it with only about one-eighth of the average peer take or pay obligations, which is a really great ratio and fits what it is we want to do. And for those that are curious, the 2015 numbers and the 2014 numbers look very similar as well, if not better, and one of the years we were really actually better than the peers with significant less take or pay obligations. So, not only is FT long in term and very expensive, as you can see from the real world examples on this slide the current forward strips are projecting most of them to get to be a net neutral and then ultimately a net negative when you look at the netback price differential, taking your cost to get there versus the uplift in price that you get on the other end of the pipe. So, in our opinion it didn’t really seem prudent to take the production risk to take the netback differential risk and put a lot of fixed costs on the company for many years to come when you can do it in a different way. And another important thing to note is, as we talked, the market’s different and our basin is very different as well. We’re a very large export center now, we have very large, very liquid trading pools with middle marketers and everyone else trading gas and moving around FT on a daily basis, so any price arbitrage is getting flushed out of the system pretty quickly. And the way the pools work, everyone on the pool gets the same price that day, whether you got the FT that afternoon or you’ve held it for a decade. So, as our basin has changed, the benefits of having a huge, full book of FT have changed as well. I’ll start off this slide with asking a question that we asked ourselves when we started on this journey to build a strategy. What is the difference between a 50,000 a day basis hedge in 2021, or signing up for an FT project for 50,000 a day? Well, the answer’s pretty simple, it’s about 19 years and a couple hundred million dollars’ worth of take or pay obligations. So, looking at this, the right choice for us was obvious, especially in light that the pipelines are already coming and on their way. This strategy that we picked is a more portfolio approach. We start and we keep a pretty large, significant healthy foundation of low cost FT, we supplement that with a very active basis hedging program, we use fixed firm sales that utilize the FT of our customers, we utilize unused FT of our peers, we have great relationships with the middle marketers and other creative solutions that we go after, and we do still
18
CONSOL Energy, Inc. December 13, 2016 at 8:30 a.m. Eastern
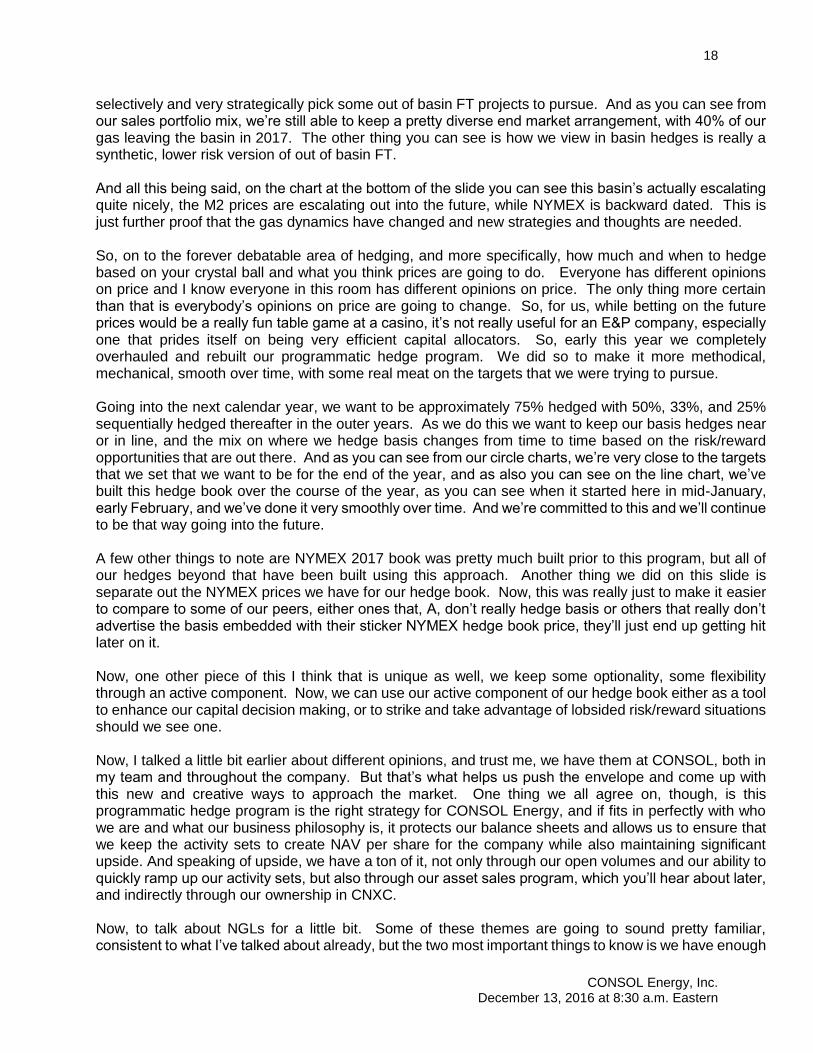
selectively and very strategically pick some out of basin FT projects to pursue. And as you can see from our sales portfolio mix, we’re still able to keep a pretty diverse end market arrangement, with 40% of our gas leaving the basin in 2017. The other thing you can see is how we view in basin hedges is really a synthetic, lower risk version of out of basin FT. And all this being said, on the chart at the bottom of the slide you can see this basin’s actually escalating quite nicely, the M2 prices are escalating out into the future, while NYMEX is backward dated. This is just further proof that the gas dynamics have changed and new strategies and thoughts are needed. So, on to the forever debatable area of hedging, and more specifically, how much and when to hedge based on your crystal ball and what you think prices are going to do. Everyone has different opinions on price and I know everyone in this room has different opinions on price. The only thing more certain than that is everybody’s opinions on price are going to change. So, for us, while betting on the future prices would be a really fun table game at a casino, it’s not really useful for an E&P company, especially one that prides itself on being very efficient capital allocators. So, early this year we completely overhauled and rebuilt our programmatic hedge program. We did so to make it more methodical, mechanical, smooth over time, with some real meat on the targets that we were trying to pursue. Going into the next calendar year, we want to be approximately 75% hedged with 50%, 33%, and 25% sequentially hedged thereafter in the outer years. As we do this we want to keep our basis hedges near or in line, and the mix on where we hedge basis changes from time to time based on the risk/reward opportunities that are out there. And as you can see from our circle charts, we’re very close to the targets that we set that we want to be for the end of the year, and as also you can see on the line chart, we’ve built this hedge book over the course of the year, as you can see when it started here in mid-January, early February, and we’ve done it very smoothly over time. And we’re committed to this and we’ll continue to be that way going into the future. A few other things to note are NYMEX 2017 book was pretty much built prior to this program, but all of our hedges beyond that have been built using this approach. Another thing we did on this slide is separate out the NYMEX prices we have for our hedge book. Now, this was really just to make it easier to compare to some of our peers, either ones that, A, don’t really hedge basis or others that really don’t advertise the basis embedded with their sticker NYMEX hedge book price, they’ll just end up getting hit later on it. Now, one other piece of this I think that is unique as well, we keep some optionality, some flexibility through an active component. Now, we can use our active component of our hedge book either as a tool to enhance our capital decision making, or to strike and take advantage of lobsided risk/reward situations should we see one. Now, I talked a little bit earlier about different opinions, and trust me, we have them at CONSOL, both in my team and throughout the company. But that’s what helps us push the envelope and come up with this new and creative ways to approach the market. One thing we all agree on, though, is this programmatic hedge program is the right strategy for CONSOL Energy, and if fits in perfectly with who we are and what our business philosophy is, it protects our balance sheets and allows us to ensure that we keep the activity sets to create NAV per share for the company while also maintaining significant upside. And speaking of upside, we have a ton of it, not only through our open volumes and our ability to quickly ramp up our activity sets, but also through our asset sales program, which you’ll hear about later, and indirectly through our ownership in CNXC. Now, to talk about NGLs for a little bit. Some of these themes are going to sound pretty familiar, consistent to what I’ve talked about already, but the two most important things to know is we have enough

19
CONSOL Energy, Inc. December 13, 2016 at 8:30 a.m. Eastern
capacity to meet our current business plans, and we can increase and grow if that is what we want to do. The system we built is highly flexible, with minimal fixed costs and obligations. This flexibility allows us to drive down our costs and optimize our prices, not only on a daily and monthly basis, but also on a seasonally and yearly basis as well. The seasonality is fairly unique to us, across the system we’re able to blend about half of our wet gas streams into dry gas, or back to liquids as we see fit, and a lot of times we’ll go ahead and sell it as dry gas in the summer and then when the prices are better in the winter months, which they typically are, we’ll extract it and sell it as liquids then. This optionality allows us to save about $10 million a year in fees if we sell all that wet gas as dry, while also adding on top of that the incremental value we get from selling it as dry, or flip it back into the liquid streams when appropriate. Now, in order for this to all work you need a flexible sales book associated with it as well. And we have that, and the important thing to note is we have that without sacrificing price. As you can see, on this slide are 2017 ethane sales estimates are coming in to be approximately Mt. Belvieu-like. And what’s unique about that is we’re not paying for the FT to get it there, and we’re not committed in the future to pay for FT to get it there. The rest of our sales portfolio is equally attractive and flexible as well, about 40% of our C3+ is expected to go internationally in 2017 and 2018, we’ll get great exposure to great price points, and again we don’t have to pay for the FT to get it there. And as you’ve heard from Angela earlier, our activity sets and optionality allow us to continue to have this really great opportunity to blend or to extract liquids as the market dictates. Here are some additional numbers for you to look at at your convenience, but I’d like to close by saying, at CONSOL gas marketing is vital and looked at holistically and in concert with our business strategy. And because companies can’t go back in time and undo big decisions already made, or un-drill acres already drilled, our approach is not easily replicated. You would either need to start a company from scratch and build it the way we have, and that could take 150 years, or you have to have the assets that we have, one of the largest Appalachian acreage footprints that is also 90% held by production yet only 4% drilled, giving you a lot of flexibility of when, where and how fast you develop the acres. You need to have a lot of stacked pay opportunities and a lot of wet and dry optionality built into the system on the acre side. You need to have an FT processing and sales book that is low in fixed cost and very flexible, a significant NYMEX and basis hedge book with a plan to keep it strong, and a holistic strategy and business philosophy to tie it all together. The market will be volatile going forward, but at CONSOL we have the assets, we have the team, and we have the strategy to thrive in it. Now, we have a lot of great things going on outside of E&P as well, and for that I’d like to introduce Steve Johnson. Steve Johnson Thanks, Don. You just heard what the E&P team is doing to drive the NAV of this company, and our E&P business is undoubtedly the main reason you’re here today. But don’t tune out when you hear that we’re now going to talk about Diversified Business Units, or DBU, as we call it, because you’ll see that we have multiple opportunities to grow EBITDA and reduce legacy liabilities. DBU consists of anything that is not E&P within our E&P business, or within our Pennsylvania mining complex, so that includes things like our Baltimore Terminal, CONVEY Water Systems, our coal reserves, our surface acreage, our Buchanan Generation Peaker Plant, and the like. DBU also includes our legacy liabilities. These are the assets and liabilities that are in the Other segment in our financial statements. These assets and liabilities are sometimes overlooked or glossed over by our shareholders as value drivers for CONSOL. We formed DBU earlier this year to make sure these assets and liabilities are getting the management attention they deserve in order to capture their value potential. We’re going to spend the next few minutes telling you in more detail about some of these value drivers.

20
CONSOL Energy, Inc. December 13, 2016 at 8:30 a.m. Eastern
First, I’m going to ask Rodney Wilson, Director of Business Development, to talk about asset sales. Asset sales are an important part of where we want to get to as a company, specifically the leverage ratio target that Dave Khani is going to talk to you about in a few minutes. And as Nick mentioned earlier, we are targeting asset sales of $400 million to $600 million in 2017. How confident are we in those numbers? I’ll tell you this, at our Analyst Day on June 12, 2014 I stood up here and said we expected to sell $1 billion of assets in the next five years. In the two and half years since then we have sold $1.5 billion of assets. So, we know how to sell assets and we do what we say we’re going to do. With that, I’ll turn it over to Rodney. Rodney Wilson Thank you, Steve. Rodney Wilson, Director of Business Development for CONSOL. What an exciting time to be part of the team here at CONSOL. And as Steve explained, we have different teams working on different asset monetization programs and efforts, and my focus is on the E&P assets. When you look at the map that you see in front of you now, you see quite an extensive opportunity of assets covering most of the key operating areas. We talk about those differences that we have versus our peers and it’s clear to see that the asset position, the acreage position that we have is one of those differentiating factors. This asset position has been established over a 150-year period of time, from co-deeds 100 years ago that just happened to contain the oil and gas interest to the most recent near term E&P transactions, we’ve created the ultimate treasure chest of A&D and asset bases for this company. And it’s because of this inventory I can stand here today and tell you we have more than $1 billion worth of assets on the E&P side that we can use for monetization efforts. You’ve heard a lot about our non-core to core initiative that’s going on, part of our monetization efforts will be lock-step with that opportunity to take non-core assets to core assets. And how that works is many people think of monetization efforts as a cash sale, we think of different types of currency when we think of monetization efforts, whether it’s swaps or trades that we’ll do with peer companies, farm outs, lease outs, non-operation opportunities with peer companies, and ultimately there will be some cash sales as well. But it’s these more nimble, smaller opportunities that will help us move assets from non-core to core, and you won’t necessarily hear headline numbers for every single monetization effort that we have, but it’s the more nimble, strategic approaches that will get us there very quickly. One of the other overlooked asset features that we have is the amount of fee position that we have, the fee acreage and mineral ownership. Different than our peers, we have a “royalty” interest, which is a considerable attribute to the value of these assets. Many peer companies may be looking for improved NRI situations, which we can help them with those opportunities, as well as when we’re selling this we won’t dilute our internal rate of return versus our peers for the same and similar type wells, given our fee position. And given all this flexibility, I have these peer A&D group leaders from different companies on my speed dial and we’re regularly in conversation about opportunities to swap and trade and do the work that will help both CONSOL and those companies maximize development of their assets. The next question is, what assets do we plan to sell? Well, to be clear, we don’t have to sell any assets. But we do realize we have an amazing opportunity to divest of some of the core and non-core assets that we have within this company, and we’ll take very strategic approaches to these opportunities. During that period of time we have the ultimate ability of being more aggressive and operating from a position of strength in these negotiations, which will ultimately help us yield the most NAV per share accretive opportunity that we can do. So, we have a plan for monetization, and we will be collectively working with Steve’s team on over $1 billion worth of asset opportunities in order to achieve the $400 million to $600 million that is our goal. DBU will be working on a large portion of that and there will be a significant portion of that that will come from the E&P space as well.

21
CONSOL Energy, Inc. December 13, 2016 at 8:30 a.m. Eastern
And to hear more about the DBU other opportunities, I’ll turn it back over to Steve for those projects. Steve Johnson Thanks, Rodney. Beyond our E&P acreage DBU has a number of other assets in its portfolio that we can monetize, everything from our Baltimore Terminal to over 300,000 surface acres. Over 200,000 of those surface acres are in the Marcellus Shale and Utica Shale fairways. Those surface acres give us a strategic advantage when it comes to right of ways, and it also creates a monetization opportunity because other operators need us for their right of ways. We sell almost $1 million a month in right of ways to third parties. Next, I want to introduce to you Marshall Roberts, who is the Director of CONVEY Water Systems. He’ll tell you about the exciting potential of this business, which is really hidden within CONSOL Energy. CONVEY is one of the biggest drivers of the performance improvements you see on this slide from ’16 to ’17. CONVEY is a rapidly growing business, and I suspect that no one outside the company has even heard of it. Marshall? Marshall Roberts Thanks, Steve. As Steve said, I’m Marshall Roberts. I’m Director of CONVEY Water Systems, LLC. My intent today is to highlight why CONVEY Water Systems is one of the fastest growing and fastest moving entities within these walls, and I want to explain that CONVEY’s primary mission right now is to actually manage all the water for CONSOL’s E&P business, I want to highlight how exciting the potential is for our water business and explain how it’s being currently incubated within the DBU group. But I need you to think of CONVEY the way that I do. First off, think of it as a standalone, separate business entity, that’s really the way we’ve built it, and that’s the way that we’re growing it. Our business model is that CONVEY provides a full spectrum of water services for its customers, fresh water delivery, produced water storage, the reuse of produced fluids, as well as managing underground injection well disposal services. Currently, CONSOL is CONVEY’s largest customer. In addition, we also sell services to other E&P operators within our basins, and I want to emphasize that we provide all of these services safely and compliantly. As the slide outlines, our assets are comprised of an extensive in-ground permanent pipeline system, significant right of ways, multiple fresh water sources, multiple centralized water impoundments and storage facilities, as well as our underground water disposal wells, and they’re all spread out throughout the Marcellus and the Utica fairways. CONVEY is different from its MLP water peers in the basin because we can provide all of these services across the entire life cycle of water. We’ve also considered ourselves a cradle-to-grave operator, and can really check everything from source all the way to disposal, and make sure that we can account for every gallon of water that’s moved through our system. And then at the same time we really go after large scale third party sales opportunities that bring high rates of return in for the company. None of the other peers in the water business can say the same thing. Here’s how CONVEY gets paid, we’re actually a volumetrics service provider, we charge per barrel rates for our water delivery services for fresh water and reused water, and then also as well as for our produced water at the disposal wells. When we focus on produced water reuse, we typically charge the operator our cost to taking the water and then we resell it to a third party. And also when we’re going after third parties, all of our investments are high rate of return projects and that’s how we manage our capital to maintain that growth. Our customers capitalize a large portion of what we charge them, and in the case of what we charge

22
CONSOL Energy, Inc. December 13, 2016 at 8:30 a.m. Eastern
CONSOL, our results are eliminated through consolidation. But if you look at CONVEY as a standalone company we have a forecasted EBITDA of $50 million for 2017. That also includes $6 million of EBITDA coming from third party customers. Over the past two years we’ve signed contracts with and already provided ten different E&P customers in this basin water-related services. When you look at the number of E&Ps that are in this basin, you’ll see that our marketing efforts have been extremely fruitful. And we believe that through networking and maintaining these relationships with these third parties that that is what is going to help us prepare for very large style execution water projects in the future. When you look at the comparable water company peers in the Appalachian Basin, CONVEY Water Systems stands out as a top tier water company in terms of its size and the location of its asset base, as well as its scope and focus on third party business. Our growth currently is driven by CONSOL, and they are our number one anchor customer. But when you look at our proximity you see that we operate very, very close to major third party players within the industry, and those sales opportunities have years and years to come. The customer diversification that we’ll show you will help eliminate all the volatility that are within the cash flows of CONVEY Water Systems. All that being said, we are positioned to go in any direction with CONVEY. We can operate it as we currently do as a subsidiary under CONSOL and just focus on growing the third party sales. We can sell it if we want to. We also can continue to look and realize that CONSOL can focus on the higher multiples that are gained through an MLP drop and we can look at either putting part or whole of CONVEY Water Systems into our midstream entity of CONE. We’re going to keep continuing to evaluate the business and watch the markets and we’re really going to let that dictate the next moves that we make with this entity. But until then, myself and my CONVEY team are 100% focused on providing a full range of water services to our customers at a competitive price, all while doing this safely and compliantly. Thanks for letting me update you on the CONVEY story. We do have an exciting future ahead of us. Steve Johnson Thank you, Marshall. Now, I’m going to ask Katharine Fredriksen to talk to you about our Baltimore Terminal. Katharine is a Senior Vice President who is charged with managing that terminal. Many of you are probably familiar with the terminal, but Katharine’s going to tell us about how we’re now operating that terminal in a new way. Katharine? Katharine Fredriksen Good morning. Thank you, Steve. My responsibilities here at CONSOL include management and oversight of our legacy operations for reclamation and water treatment, as well as environmental and regulatory fares for the company. But this morning I’m here to talk to you specifically about the Baltimore Terminal coal export facility. And to use a phrase that you’ve heard a lot this morning, it’s an exciting opportunity it presents for us. For those of you that may be less familiar with our terminal, I want to go over just a few statistics. It has a throughput capacity of 15 million tons a year and a coal storage yard of 1.1 million tons. It has blending capabilities like none of its peers, we utilize dual stacker reclaimers. It is a deep draft terminal, it can load Panamax and Capesize vessels. It is also the only coal export terminal that is serviced by two railroads, Norfolk Southern and CSX. But most importantly, it’s operated by a team of seasoned professionals who are union-free and know how to move tons through that terminal safely and compliantly. Hands down, it’s the best coal terminal on the east coast. Up until this year, it pretty much has always functioned as a captive service provider to CONSOL owned mines or partnered mines. In order to unlock its full potential we needed to separate it out as a standalone business and really focus management attention to grow EBITDA. And we’re doing that in two ways.

23
CONSOL Energy, Inc. December 13, 2016 at 8:30 a.m. Eastern
The first is pretty obvious. If you can increase your throughput you can increase your revenue, but to do that we opened it to third party business for the first time. The other way we’re looking at growing EBITDA is to reduce our costs, and we’re doing that through a zero-based budgeting approach and looking at process optimization. And I’m standing before you to tell you we’ve already had success this year. We signed our first fully third part external contract in the third quarter, and we have inked two additional ones. These are contracts with market-based incentives that really drive value, things like reserve minimum shortfalls that are take or pay, blending fees and stockpiling fees, and we’re working with our legacy contracts to incorporate market-based terms there as well. On the cost side we took a look at our biggest drivers, and as you might expect, labor is one of the biggest. And so we’ve changed our shift schedules to significantly reduce or even eliminate overtime, and we’re also implementing changes to our supply chain process. These two things alone next year will save us over $1 million in cash costs. At the start of this year it looked pretty bleak, in fact, it was one of the bleakest outlooks for our terminal in our recent history. We forecasted to move 6.5 million tons through that terminal, but thanks to third party contracts and an uptick in the market in the fourth quarter, we’re going to move over 8.5 million tons this year, with an EBITDA of over $15 million. So, how about for next year and beyond that? Well, the coal benchmarks for thermal and met coal have ticked upwards sharply in the fourth quarter. We actually think that will stay strong through the first quarter and in fact pretty firm for the first half of the year, and we are poised to take full advantage of that. In fact, we believe we’ll exceed 9 million tons this year of throughput, and we could see upwards of 10 million tons, especially as we sign new customers and firm up our existing ones. But more importantly, if you’ll take a look at that EBITDA number of 19-22 million for 2017, that’s the highest EBITDA the terminal has ever delivered back. In fact, higher than even the highest record throughput years in 2011 and 2012 when met coal was over $300. So, all of this positions the terminal with significant upside potential. We can keep it to accrete revenue to CONSOL, we can sell it, or we can spin it out. But we are very excited about 2017, and we are welcoming new business into the terminal. Thank you. Steve Johnson Thank you, Katharine. I won’t spend a lot of time on Slide 59, except to say the sale of our Miller Creek and Fola mining complexes earlier this year was the sale of non-core assets that significantly reduced the risk profile of this company. And that’s exactly what DBU works to do. As for the sale of our Buchanan Mine earlier this year, the point of this slide is to remind you that in negotiating that deal not only did we receive good value, we preserved an upside in the form of an overriding royalty just in case the met market turned, and of course it has turned. And our EBITDA forecast that you’ll hear about in a few minutes, anticipates that we will realize $10 million to $20 million of EBITDA in 2017 from this override. But if the met markets hold up for the entire year, we could see EBITDA in excess of $30 million in 2017 from this override. Turning to Slide 60, you can view our legacy liabilities as a burden or as an opportunity. We view them as an opportunity to add value to the company. You can see that we’ve had significant success in reducing our legacy liabilities over the last several years, but we’re not done. For example, by changing the way we deliver healthcare benefits that we’re obligated to deliver to our union retirees, we expect to reduce our legacy liabilities by almost $30 million in 2017, and we’re going to do that without reducing the level of benefits we provide to those retirees. We’re also working on several other initiatives to reduce legacy liabilities even more. So, that’s DBU. There’s a lot there obviously, we have a great team, and

24
CONSOL Energy, Inc. December 13, 2016 at 8:30 a.m. Eastern
we see a lot of opportunities to create value in 2017 and beyond. With that, I’m going to turn it over to Dave Khani, our Chief Financial Officer. Dave? Dave Khani Thanks, Steve. Alright, we’re rounding third and heading home here. So, today’s focus by all the presenters was to give you the NAV modeling tools to help build out your models, we’re providing two years’ worth of forecasts, as well as our thought process and how we plan on growing our NAV per share. Now, we believe this is the proper way to value our company as we have long duration assets and processes to help accelerate the recognition of this value. We’ll use these values in how we allocate capital and how we value our stock. Now, Tim and his team provided a view on the assets and the learning curve, and the type curves will continue to improve and the dry Utica and stacked pays will only accelerate the value impact. Again, the big driver of non-core to core assessment on the large acreage position that sits relatively unassessed will drive another value uplift. And as Steve and his team have highlighted, DBU and the Business Development team will grow water, shrink liabilities, and monetize assets ahead of their development. So, from a financial perspective we see three major ways in which the Finance team here drives NAV per share. First, is our capital allocation process that helps us decide on the appropriate spending levels, debt repayments, M&A, and stock buybacks. We have an integrated model that helps us model to the capital allocation decisions. We compare rates of return across all our spending, and as you can see, our teams are very well versed on the main drivers to improve NAV per share that essentially they’re going to drive cash flows up and shrink liabilities. Now we developed this approach over the past two years and we believe this will translate into higher rates of return and faster NAV per share growth. Now, Chuck Hardoby, my VP of Finance, will come up later and provide some details on this. Now, the second area that we drive NAV is our forecasting capability and transparency. We’ve dramatically improved our understanding of our operational capability and we’ve taken a big step to delineate the value of our large acreage position. This has and will continue to drive high confidence forecasting to the future. Our team will take these forecasts and pass it out to all our financial constituents. And in this section we’re providing two years’ worth of financial guidance. Now, management is incented to beat these forecasts that we set at the beginning of the year, and that is essentially what you’re getting, our beginning of the year forecast. Now, if you take a step back and you look at 2015 and where we stand year-to-date 2016, we will beat our annual free cash flow plan by about 15% in each of the years. Now, think about this, in what was mostly a down market we have significantly beat our plan. Now, the third area which we’ll cover in this section is how we manage our balance sheet, our liquidity and our cost of capital. Now much of the focus of the team earlier here was to think about the cash flows or what I would call the undiscounted value. What I want to talk about is our cost of capital and what we use in our NAV for shared calculation. Now, most analysts and Street investors will use a straight 10% WACC and we will argue that there should be a big differentiator between companies based on asset quality, capital structure, operating values, as well as management’s credibility of achieving forecasts. Now, we have proven that we can navigate through this crazy commodity price environment and be contrarian and avoiding issuing dilutive equity at inopportune times. We will continue to be contrarian because we will take the excess cash that we will generate in a rising market and we’ll use that to shrink our WACC and shrink our share count instead of putting it all into the drill bit. Now, after the presentation we will have two MLPs to provide more details on what we think is our underlying NAV, and we think one of the upsides in our calculation of NAV are these two MLPs of CONE and CNXC resources.

25
CONSOL Energy, Inc. December 13, 2016 at 8:30 a.m. Eastern
Now, let me just highlight some key takeaways that we’ve done over the last couple years before I hand it over to Chuck. I wanted to highlight these things, even though you’ve probably seen pieces of it, to really highlight the magnitude and the velocity of the changes that we’ve made over the last two years. I want you to understand this so that you can think about the magnitude and velocity of the things that will come. Now, if you look across E&P, coal, DBU, and CONE, we’ve taken out approximately $1.5 billion of annual spend between capital, operating costs, and G&A, and we’ve done this while we’ve actually increased overall production. When you put this together, we were on a spending pace on 2014 to spend about $3 per MMBtu and for 2016 we estimate that number will be down to about $1.30. Now, there were many areas that were ripe for change, and this management team seized the opportunity to make those changes, and we will continue to do so. Now, looking forward, we expect each of our teams to find ways to grow that top line NAV per share, but as our leverage ratio improves into next year and we continue to generate free cash flow, we’ll have the increasing flexibility to shrink our WACC, shrink our share count, and attack the NAV per share from a an additional angle. Now, let me pass it over to Chuck Hardoby, that’s going to provide some more details. Chuck Hardoby Thank you, Dave. So, first let me step back and review the three main drivers that we’re laying out here from a financial perspective, and that would be the capital allocation, the forecasting and transparency, and lowering the cost of capital. I’ll cover those first two sections and then hand it back over to Dave to wrap up. This slide here depicts a few of the many different levers that we have internally that we use to drive NAV per share growth. But it’s just not the interconnectivity between these levers that we focus on, we also look at the external forces and study those and understand business cycles to try to understand the impact of that. And as Don Rush mentioned earlier, we don’t do this just to be perfect predictors of the market, but really to understand risk so that we can better allocate our capital. Dave mentioned the use of an integrated model, and this model basically combines the cash flows we get from our operational development plans, it combines those with the cash flows from the other business segments that we have and enables us to analyze the financial and credit metrics on a consolidated basis. We use this model to help decide how we spend our dollars. We rank all of our spending by rates of return and we also look at the strategicals that we have in place as well, so we’ll take a look at different things like capital structure, we’ll take a look at transactional structures, a lot like we’ll take a look at separating our E&P and coal businesses. Included in this ranking is the retirement of debt and buying back shares. We expect that this will translate into higher NAV per share today and more so into the future. We show you here a pyramid or a hierarchy of our objectives, and I just want to point out to remember the production is not our primary target here, it’s really trying to drive NAV per share the fastest over the long term. So, Tim and Andrea laid out earlier a very rigorous assessment process that they used to optimize our development plan. And this process basically translates into a stack of opportunities that we use to decide how much capital we allocate to different levels of activity. On this chart here, the Y-axis shows the different rates of return, and the bubbles show the relative size of capital that we’re going to spend to each of our different areas of interest over the next two years. As you can see, we also compare sunk capital returns associated with our DUCs to fully loaded well costs. As new information comes in, this is the chart we go back to. We constantly use that information to update our type curves, update costs, and ultimately update our expected rate of returns. And then we alter our plans accordingly.

26
CONSOL Energy, Inc. December 13, 2016 at 8:30 a.m. Eastern
So, we covered NAV per share, we covered rates of return, those are the metrics that we use to make our decisions on how we allocate capital. We also take a look at different metrics to see how we perform, to measure our performance. Capital yield on this slide is an example of one of those metrics, it measures capital efficiency and is derived by taking our cash margin, dividing by our capital intensity. The top portion of the slide shows our capital yield relative to our E&P peer set. As you can see, we have experienced a dramatic improvement when you compare against our prior performance, and when you compare on a relative basis versus our peers. We expect to see continued improvement in capital yield in 2017 despite the rise in our capital spending. However, in ’18 we do expect our yield to tighten as our capital intensity outpaces the growth we expect to see on our cash margins. We believe that other operators will also experience this trend, as we see capital budgets expand. We will continue to monitor this and other metrics to identify gaps between our prior history as well as those between our peers. Another area that we feel can be categorized into this capital allocation sub-topic is how we manage our overhead spending. We’re very proud of the work that we have done to reduce our G&A costs, especially when viewed with the level of organizational activity. We’ve created two additional public companies, we’ve refinanced over $5 billion of debt, sold assets, and most recently dissolved our major Marcellus joint venture. Our teams have performed extremely well throughout all these changes. We also point out on this slide that these changes have started at the tone at the top. As Nick mentioned in his opening remarks, senior management has demonstrated outside of our core values of safety and compliance that nothing is sacred within the organization and that has permeated throughout. On this slide here we show you our E&P guidance for 2016 through 2018. Starting with the production volumes, starting where Andrea left off, you can see that for 2016 we anticipate finishing this year averaging just shy of 1.1 Bcf per day. That’s a 20% increase over the 329 B’s that we produced in 2015. In 2017 we expect 5% production growth. Looking at the spending of 2016 with just $200 million of capital, in 2017 you can see very efficient capital and still being able to grow in 2017. In ’18, as our capital expenditures pick up this year we’ll see that translate into a 17% growth rate in 2018. We also show you our liquids cut, the percentage of our production associated with the liquids. You can see that going down over time. In part that’s due to the dissolution of the JV, however, we do have the ability to ramp that back up if the opportunity exists by utilizing our wet Utica and Marcellus positions. We show you on the pricing side the open basis differential that we’re using in our model. That’s based off of an 11-3 NYMEX pricing that was just the last date that we used for our last roll up. Capex, Andrea went over the capex in detail there, so I’ll skip down to the cost. In ’17 you can see the improvements that we’re expecting on the cost side, LOE, down 12%, Gathering down 17%. Gathering is down mostly due to that decrease in liquids production that we’re expecting. And both categories are down due to the increase that we see of the contribution from the Utica production. We expect to turn on line 44 wells in Utica in 2017. Looking at the PA mining complex, as Dave mentioned, we’re going to have a breakout session later, and the CNXC team will go over these assumptions in much greater detail later, but I would like to point out a couple things here. In 2017 and 2018 we expect more normal market conditions and production levels in 2017 and 2018, 2016, we had a lower amount of production basically due to market conditions coming off of the warmer than normal winter we experienced at the end of 2015. Finally, on the capex front, on the coal side we see a similar situation that we saw on the E&P side. The coal team was able to pull back some capital in 2016, was very efficient with their capex, and as we see the market conditions improve over to next year we see the capex reverting to the $5 per ton level. We’re providing EBITDA guidance here for 2017 for the first time for the whole enterprise, and we

27
CONSOL Energy, Inc. December 13, 2016 at 8:30 a.m. Eastern
anticipate that the strengthening markets along with the increased production volumes will lead to a healthy increase in EBITDA next year. These estimates are based on a November 3rd strip, again, which is lower than the current strip, and also probably lower than most expectations we see out there right now. So, there is some conservatism built into this forecast. And while we provide a sensitivity table to the open commodity prices on the bottom of the slide, we are showing a single point estimate here for our forecast, and if you think about the normal and log normal type of distributions around our assumptions, our expected case here is very similar to our 50% probability case, which means that we see equal chances to the upside and downside around our estimates. With that being said, this management team is always working on ways to improve the plan, so we naturally feel that there’s upside to our numbers beyond the benefits of rising commodity prices. Finally, on the reserve guidance, this chart here shows that we expect to nearly double our proved reserves by year-end 2018. There are a couple of interesting things to point out here, and we’ve provided a table below the chart to highlight them. First, we show you the NYMEX pricing assumptions that are used. The reserve mode is most sensitive to the pricing assumptions here, and you can see that we expect 2016 to be the low point in the past three years. The next line shows the PUD count, which is impacted by pricing in both direct and indirect ways. Directly, when using the backward-looking 12 month average determine the economic limit, and indirectly when using a more forward-looking sense of pricing when thinking about liquidity and balance sheet and ultimately determining activity levels within our five year plan. So, while we see the pricing assumptions hitting their lows in 2016, you actually see that we see our PUD count is the lowest in 2015, and that is because we’re in a much different situation at the end of this year compared to the end of 2015, when we didn’t have any rigs running. After our key asset sales and generation of nearly a billion dollars of free cash flow this year we’re sitting at a comfortable liquidity level, and a clear path to deleveraging. Looking forward, you can see that we expect to grow proved reserves between 17% and 25% on a compounded annual basis from the low point of 2015 through 2018. Driven by a rather modest increase in pricing, increased Utica activity, and overall rising productivity we will continue to convert our 2P, 3P resource base into 1P proved reserves. Now, back to Dave. Dave Khani Thanks, Chuck. So, let’s turn our attention to the balance sheet and cost of capital. In our 2014 Analyst Day we highlighted our focus of reducing our cost of capital. Now, this exercise proved to be one of the most challenging things to do as commodity prices fell hard from December 2014 into March of 2016. This is where we truly differentiate ourselves, the stress of low relative liquidity and high leverage ratios didn’t cause us to falter. We highlight and proved points as having many levers to pull to sustain liquidity and leverage ratios during this downturn. So, the lesson that we all learned was the very cyclical nature of the business and how important leverage ratios and liquidity are in setting the cost of capital. The bottom right chart highlights that leverage ratios are tied to equity cost of capital at around 90% in the first half of the downturn. So, as a result we’re going to be setting our leverage ratio targets from 2x to 2.5x and this we believe will give us the ability to grow our NAV per share at the fastest rate from both an offensive and a defensive nature. This will give us the firepower and the flexibility to allocate capital to more things including stock buybacks. We anticipate being in the range in 2017 and in sync with what our Appalachian peers look like, which is the bottom left table. Now, this next slide, there are really key takeaways. First, is we expect to generate $1 billion of free cash flow from 2017 into 2018 from both organic as well as asset sales, and that is the bottom right pie chart. Second, is that we expect our leverage ratio to come down into our target zone into 2017 and continue lower into 2018. And this is both from a combination of rising EBITDA and lower net debt. And then third

28
CONSOL Energy, Inc. December 13, 2016 at 8:30 a.m. Eastern
is we anticipate our liquidity to end this year around $1.7 billion and growing to about $2.7 billion into 2018, again, just taking the $1 billion of free cash flow and parking it on our balance sheet. Now, I want to remind you that at the beginning of this year we were sitting at $865 million of liquidity, and we did that as we started to take some long term debt and park it on our revolver in anticipation of splitting our E&P and coal business. And as Chuck mentioned, we generated almost $1 billion of free cash flow this year and paid of the revolver, and that’s why our liquidity essentially has doubled in one year. Now how is this translated into cost of capital? As you can see in the top left chart, our E&P cost of capital has come down nicely from the end of last year into July of this year. This improvement along with rising rates of return gave us the confidence to add back two rigs in the second half of this year. And as you can see, our E&P weighted average cost of capital has come down nicely from 2014 into 2016. This is driven by a combination of taking high cost debt offline as well as avoiding issuing equity. Now, we believe we can grow our NAV per share at a more differentiated pace than our peers for three main reasons, and that’s, one, we avoided issuing equity in the recent past’ two, is we’re going to generate free cash flow and we anticipate lowering our weighted average cost of capital going forward; and third is we’re going to shrink our share count and reduce the denominator in the NAV per share calculation. Now, the next three slides I’m going to talk about are tied to our MLP entities, which we value today at around $4.50 per share, which represents about 20% of the CNX equity out there. Now, for CONE midstream we see four main drivers of value net to CONSOL. First is the retained EBITDA. Second is the LP and the GP value. Third is the cash distributions we received. And then fourth is the anticipated dropdowns that we will do over time. Now, CONE is very important to CONSOL. We built it, we help manage it, and we do all the back office work for it. It also helps us lower our cost of capital. Now, as you can see in the bottom right chart, we value CONE today at around $3 per share net to CONSOL, and with the growing distributions we believe that it will grow to about $5 per share by year-end 2018. Now, since CONE is a 50/50 owned entity here, we use the equity method to account for it in our financial statements. So, you see it buried in several one-line items and so it’s important that we break this information out for you to help you understand the value of CONE. This next slide here gives you some scenario analysis on distribution growth. And we did this in order to give you the sense of the impact of the annual cash inflows net to CONSOL. Now, CONE has been growing its distribution growth at a top tier level at around 15% for the last six quarters. And so if you look out over time, if it just continues to do that growth you’ll see that the annual cash flows grow and essentially the value of CONE continues to grow and becomes more and more meaningful net to CONSOL. So, let’s talk about CNXC. In similar fashion CNXC has the same four main drivers. CNXC was also created as a vehicle to split the E&P and the coal businesses, and it also is to help drive NAV per share for the company. Right now we believe that CNXC net to CONSOL is worth about $1.50 per share, again, net to CONSOL. Now, the PA complex is 100% consolidated on to CONSOL’s balance sheet because we own 100% of the GP interest. And so as a result we have all the EBITDA and we have all the debt of CNXC on our balance sheet, and you need to pull that off because the debt effectively is non-recourse to CONSOL. So, Nick had mentioned earlier and several of our team members had mentioned that our goal is to split our E&P businesses. And it has been our base plan here to continue to drop the remaining 75% of the PA complex into CNXC. But the way we have it modeled now, and to be conservative, we anticipate starting the drops in 2018. However, as you meet with the CNXC team afterwards, you’ll hear really three

29
CONSOL Energy, Inc. December 13, 2016 at 8:30 a.m. Eastern
main themes. You’ll hear rising coal pricing, improving financial metrics, and rising appetite for coal investments by investors. And we believe this will create the opportunity and the optionality for us to be able to complete the separation potentially in 2017, again not in our base plan. There are also other things that we can do if we wanted to to accelerate the split. We could spin off. We could IPO as a C Corp the remaining 75%. So there are other options and we’ll be very market driven in how we think about the complete separation of coal and E&P. So, let me wrap up the financial section into three key points. One is, we expect to grow and generate free cash flow. We will do this by being best in class capital allocators. We think this will drive rates return higher and our NAV per share growth faster. We will continue to improve the predictability and the transparency of this business. Over the past two and half years we have improved that. It started with our Analyst Day in June of 2014, then we provided line item guidance in September of 2015, and today we’re extending out our forecast into two years. And then third is we see our base financial metrics improving. We are ahead of our goal of having liquidity of $1.5 billion. We anticipate our leverage ratio is getting down into our target zone next year, and we can anticipate generating the $1 billion of free cash flow using conservative commodity prices and we’ll take that cash flow and we’ll drive our weighted average cost of capital down and our share count, and prove our NAV per share. And then last, if the markets are there, we will split our E&P and coal businesses in 2014. Let me pass it over to Tommy Johnson, who is going to give an overview on regulatory environment. Tommy Johnson Good morning, crew. Thank you, David. As you’ve seen and heard, a tremendous opportunity set here at CONSOL Energy, unrivaled assets, an able team coupled with an NAV driven strategy and philosophy. Before Nick brings this forum to a close and we open up the floor for questions and answers, let me speak to another key that unlocks the value of the company and those are the overarching policy frameworks and regulations that govern our operational objectives. The regulatory assault on the American economy is really unprecedented. More troubling perhaps is the philosophical bent in which much of this has been employed here in recent years. Fossil fuel has been the tip of the spear, and as it relates to this administration’s energy strategy, and that philosophical bent has really intersected and influenced many, many of the activities from drilling and operations to midstream to our downstream users. And while we’re optimistic that the demand destruction that’s occurred here in recent years will rebound, we’ve placed unnecessary burden on American energy. It’s just nonsensical given the economic, environmental and geopolitical benefits that come with it. So, needless to say we’re very excited to see a new governing philosophy from the incoming administration that embraces what we do. We saw the second term of this administration embrace rule making as the singular means to impose an agenda. Today the vast majority of laws that are governing the United States are not passed by Congress, they are issued as regulations. And the worst offender when it comes to this excessive over regulation is the EPA. That gradual shift in rule making power is perhaps the single greatest change in our system of government since our country’s founding. The EPA has drastically expanded its regulatory authority and is doing so without Congressional consent. Now, we’re expecting that to change in short order with this 115th Congress that’s coming in and they have high hopes of passing some significant regulatory reform measure while also nullifying these midnight regulations that are going to be issued by the Obama here in the closing days. In an effort to restore this Congressional authority there’s a bill that’s called the REINS Act, just by way of example, that will restore Congressional approval on any rule making that has $100 million or greater cost, and just desperately needed. We don’t have co-equal branches of government any longer and this will help rein in, if you will, the regulatory overreach and restore that traditional balance of power.

30
CONSOL Energy, Inc. December 13, 2016 at 8:30 a.m. Eastern
That being said, much of what drives the culture and philosophy of these agencies and really sets this tone for legislative priorities is 1600 Pennsylvania Avenue and the promise of a new administration that routinely championed an interest to unleash American energy on the campaign trail will be on full display once President-elect Trump is sworn in here in January. And as I mentioned earlier, we are expecting swift action in the early days from Capitol Hill. This is going to provide some really meaningful change from the aggressive regulatory agenda that has characterized the last several years of the current administration. Equally important, and expect to see policy initiatives that are going to grow demand and grow NAV for companies like CONSOL Energy, from tax reform, that will focus on capital formation, that’s going to be a central issue, to streamlining permanent processes for all energy infrastructure projects here at home, and to those that open up lanes of commerce in the seaborne markets. Broadly speaking, I think the general consensus view is we have an energy policy of missed opportunity, and we’re anticipating a wave of activity that will occur in our nation’s capital that will have high potential to encourage E&P activity here domestically and undoubtedly unlock value. So, in sum here are the key takeaways. We are emerging from a period of extensive executive action that’s been designed to impede domestic energy production and utilization. This onslaught of rule makings and policy initiatives by the current administration are expected to be rescinded or weakly defended before the courts. Two, this new administration is going to usher in a new political environment, there will be new priorities and energy will be a key driver for growing this American economy. And lastly and importantly, we will see the traditional balance of power between the executive and legislative branches restored, replacing a philosophy centered on blunting energy production, demand, utilization and it’s going to be replaced with a philosophy centered on unleashing these forces. That’s going to be a key NAV per share driver for CONSOL Energy. I look forward to answering any questions you may have during the Q&A session. At this time I’ll yield the balance of my time to our President and CEO, Nick Deluliis for closing remarks. Nick Deluliis Thanks, Tommy. We hit you with a lot of information and just to sum up, if you think about what we’ve just looked at, and we’ve walked through the different, I’ll call them building blocks, of our valuation and our NAV per share, within E&P we walked through all those KPIs, and just a step change in performance that we’ve seen across the board, which redefines the going concern, the base case. We’ve talked about also and provided some color on how and where and to what extent we see those KPIs improving through 2017, 2018 and beyond. We talked about the stacked pay opportunity set and how when you look at that on an incremental IRR basis coupled with the magnitude of that opportunity set in our footprint, a definite significant contributor to NAV per share in the near term, as well as in the long term. And then we talked about the process we’re going to employ to convert a significant portion of our non-core acreage footprint into core, and how we think about that in particular with the dry Utica, why we’re excited about that, why we’re confident and what those implications could be when you look at NAV per share and how they affect things like asset monetizations which are going to be a key part of our strategy here and execution plan over the next year. We also walked through our marketing strategy. I think you got the message that this is a little bit of a different approach when you look at the peers, but very consistent approach when you look at the philosophy that we’ve laid out and why we approach it in that way.

31
CONSOL Energy, Inc. December 13, 2016 at 8:30 a.m. Eastern
The diversified business units, there’s a lot going on there and individually and in aggregate big contributors to what our performance is going to be. They’re entities that are growing leaps and bounds like CONVEY, the water business, they’re entities that are big EBITDA contributors and important parts of our both strategy as well as execution plan, like the Baltimore terminal, and then there are areas there that we’re managing aggressively to minimize their impact on our NAV per share and our balance sheet like liabilities, all of them obviously being done in concert. We talked about those other contributors of CONE and CNXC and how important they are. And again the teams are here today to walk through those entities in more detail, when you hear what they have to say, you add it all up it’s a pretty compelling picture. But I go back to an even bigger story and when you think about what you saw today this was designed to really articulate three things. One is the asset base, which is second to none through the peer group and throughout the industry. It all starts there. Two is the team. We have the best team in the Appalachian Basin when it comes to E&P opportunity set. I hope you saw that today which is the subset of this team that was up here and able to discuss their plans with you. And third we’ve got the right philosophy. We’re applying the right mindset, the right philosophy of NAV per share, wanting to be astute best in class capital allocators. You take those three things and we’re really welcome the opportunity to work with you and partner with you as investors moving forward into 2017 and beyond. I’m going to turn things back over to Tyler, and I think he’s going to open up our Q&A session. QUESTIONS AND ANSWERS Tyler Lewis Thanks, Nick. So, we’re a few minutes past the allotted time for the presentation, so what we’ll do, obviously feel free to grab a cup of coffee or take a short break, but we are going to move right into a Q&A session. So, what I’d like to do is invite the executive management team, if you would, please, come up to the table. The rest of the presenters, if you wouldn’t mind just shifting down and make yourselves available. If anyone does have a question, I would just ask that you raise your hand. We do have some wireless microphones floating around. We’ll give you a microphone and you can please state your question accordingly. We’ve got Jeff back here. Jeff Campbell Thank you. Jeff Campbell, Touhy Brothers. First of all, I wanted to congratulate you on the presentation. It was really thorough and it’s going to be very helpful I’m sure. I just wanted to ask a couple of questions about Slide 40. First of all, I think it’s probably obvious that, just to confirm, are the commodity assumptions that underlie the forecasting there, are they the same as Slide 69? Nick Deluliis The 11-3 forecast of 299 NYMEX. Yes. Jeff Campbell Right. Nick Deluliis The only slide that uses a little bit updated information is the basis slide that Don Rush provided, but

32
CONSOL Energy, Inc. December 13, 2016 at 8:30 a.m. Eastern
beyond that all the rate returns, EBITDA assumptions, are all based off the 11-3 forecast. Jeff Campbell Okay. Perfect. Thank you. A quick question I wanted to ask, I noticed that the third party Utica in 2018 were forecasting less wells but more cap ex spend. I just wondered what the color was behind that. Andrea Passman I’d be happy to take that. There’s a number of science projects that we have within that capital so we’re actually still continuing to delineate, spending more money on logs. We moved beyond the triple combo log and we moved into sonic logs, and FMI, and image logs, as well as heavy duty coring program. Core is key to us understanding and really getting that optimization model down earlier so that we can correlate our facies across the entire earth model. So, that’s where a larger portion of the dollars are going. Jeff Campbell Thank you. And if I could just finish with a quick higher level question. I’m just wondering how set in stone is the 2018 program for the Utica and the Upper Devonian. Is there flexibility for any increase in activity in that year, and if so what will the drivers be? Thank you. Tim Dugan There is flexibility built in there. We’ve got our portfolio optimization plan that we continually update and work and set to be able to adjust as the markets adjust, or our progress adjusts, or results change. So, we’ve got flexibility built in there, but that is our plan for now. As we update, as information changes, the market changes, we are prepared to adapt accordingly. Neil Digman Neil Digman with SunTrust. David, a quick higher level question. You mentioned today a lot of, I guess I would say levers that you can pull, a lot of issues, anything from MLPs, you mentioned I think, David, 450+ in value you were calculating there, all the way to the CONVEY Water standalone system. Could you talk about levers, Nick, as you think about that you could pull near term, or are these going to be longer term things that you can pull? Nick Deluliis Well, with this opportunity set on the asset base side coupled with where we’re at in the development plans, the delineation plans, this goes back to the prior question on a bigger context, information is coming in real time and some of that’s externally driven, with where market dynamics play out. Some of it will be internally driven when you look at things like a delineation program across the dry Utica, among many other examples. And that also goes back to the descriptors we tried to line out with our new business philosophy being nimble and data driven, is that data comes in, let’s get a hold of it, let’s process it as quickly as possible and let’s be agile enough, nimble enough to adjust accordingly under that filter of NAV per share. So, the way I think of what we laid out today through ’16 and ’17, I think you’ve got a good feel for what the big levers are going to be and the rough magnitude or contribution of each and every one of those to come up with the financial metrics and results that we’ve shown. But also keep in mind that we will move and will adjust accordingly, and you will see that in many different examples. If you take something like asset monetizations that Rodney Wilson talked about, as delineation in dry Utica comes in and evolves over time within specific areas of interest across that footprint, or as we post an asset monetization early on depending on to what extent or as commodity changes and the rate of returns tied to our internal development plans change, all those things will impact the tactical decisions that Rodney will be making on a day in and day out basis on the different levers we’re going to pull and to what extent. That’s just one example, We can cut that across our development plans that Tim just talked about, what we’re doing

33
CONSOL Energy, Inc. December 13, 2016 at 8:30 a.m. Eastern
with the diversified business units, the timing of things like drops into the CONE and the CNXC’s of the world, etc. I think this gives you a good snapshot based on what we know today, what we think the levers are, what their contributions are going to be over the next two years and how that rolls up to a CONSOL Energy aggregated basis. Neil Digman Got it. And then looking at Slide 47 or 40 where you talked about your firm transportation, are you limited in any way, I guess maybe for Tim or his team, when you look at your takeaway, Tim, does that limit you in any areas where you would prefer to be drilling or operating right now as far as takeaway, does that sway your decision or does that not come into factor right now? Tim Dugan No. I’ll let Don follow up. But really when we look at our opportunities, when we look at our entire portfolio, FT, capacity, marketing, pipeline compression is all taken into consideration, and we’re planning out far enough that if adjustments have to be made, if they’ve got to go out and find more FT or make some changes they’ve got time to do that. But, Don, anything you want to add to that? Don Rush Yes, that’s exactly the approach we take, Tim. We have plenty to support our current plans and significant growth on top of them, but we always have a significant pipeline, a different pass we’re working, whether it’s FT, whether it’s firm sales with customers to use their FT, or whether it’s other types of creative contracts that we’ve built and done over the years. So, since we’re so ingrained in the planning process of this and we have an active log of activity sets that we’re ready to pull the trigger on on the drilling side, I have to have at least that, if not more on the marketing side to couple with it and execute them very quickly. So, we’re always ready to jump on the next opportunity and FT will not be an impediment for CONSOL going forward. Neil Digman Then, just lastly, maybe in a broad view, Tim, it looked like most of the type curves you were able to increase at least your estimates for most recently today versus what you had. Is there one thing that’s pushed that, or is it just the amount of results that you now have under the belt? I’m wondering what really is the big driver there. Thank you. Tim Dugan Well, it’s the results, it’s the science and the technology that we have deployed, the modeling has allowed us to make decisions quicker, getting information in. Rather than us having to wait 12 to 24 months for production results, we’re now able to model what our completions will do, what the production results will be and make decisions quicker. And we’re able to, with less production able to model that and predict out what the results will be. So, it’s really changed. The modeling has changed our decision process, so it’s all data based, none of it is really pie in the sky, hopeful numbers, it’s what we’ve modeled, what we know we can get, and what we know is there. Andrea Passman And I’ll add to that. We have raised type curves by 20% in general across all of the regions, much of that being driven by the performance that we’ve seen, even, for example, the latest Greenhill wells that we brought on in Southwest PA, they’re performing in a 3.6 to 3.8 Bcf per 1000 type curve, and we even some unbounded laterals that are now performing at 5 Bcf per 1000, some pretty huge numbers in terms of significant change that’s been brought about. So, when you look at it across the board it is a 20% increase in general terms across all of the regions in the last really year to two years.

34
CONSOL Energy, Inc. December 13, 2016 at 8:30 a.m. Eastern
Jeremy Sussman Hi. Jeremy Sussman from Clarkson’s. Dave, you and Nick both mentioned reducing the share count in terms of potential buybacks. How should we think about that in terms of potential timing, order of magnitude, and since your forecast obviously gas prices have cooperated and so how do you weigh the potential for buybacks versus potentially increasing capex to take advantage of the higher prices. Thanks. Nick Deluliis I’ll start with the philosophy on how we would assess those opportunities and then Dave can give you some follow up color on specifics. The process will be very much consistent with what we’ve lined out on how we approach all of our other decisions, including the capital budgeting and development plans. So, what we’ll do, if we’re very clinical, we’re looking at share buybacks as effectively a rate of return opportunity. The rate of return that we’re looking at is where we think the NAV per share of the company is versus where the shares are trading at. And there we calculate a rate of return just like we would for a stacked pay opportunity set within the asset base, or just like we would look at a whole range of other allocation decisions that we have at our disposal. And that obviously changes over time, that changes, as we discussed earlier, from external factors as well as internal factors. Another reason yet where we need to be data driven and also agile and nimble enough to react as opportunities present themselves. So, the way I would describe it, it’s the same process and methodology that we discussed. The prerequisite situation is to have an IRR opportunity there that beats our other IRR opportunities within this asset base. We want to do that where we’re less than 2.5x leverage ratio, which is the prerequisite, and we want to be opportunistic. There’s going to be times where it makes all the sense in the world under that rate or return, capital allocation methodology and there’s going to be times where it doesn’t, which means we’ve closed the gap, and I guess that’s a form of success. Jeremy Sussman Thank you. Don Rush I think you hit most of it. The only thing I would add is we do that with the comfort of a good hedge book so that we make sure that our cash flows are in the right zone so that we really, truly understand what the arbitrage is looking out. And we also wanted to make sure that we generate free cash flow so we can use the free cash flow on top of that, to be able to take stock out. And so when there are days like yesterday, when the stock was very volatile, we’ll use that for the opportunity to take some stock out, assuming we know exactly what our NAV per share within the zone and we’ll be opportunistic. Jeremy Sussman What you’re basically saying is that your simple cash flow [indiscernible] there would be a scenario where you lever it all [indiscernible]. Don Rush We will not lever unless we’re sitting well below 2x and then we have the flexibility to lever a little bit. That would be the only reason. Jeremy Sussman That’s helpful.

35
CONSOL Energy, Inc. December 13, 2016 at 8:30 a.m. Eastern
M Was there anything that precluded you from deciding to spend more in 2017/2018, for example, just do you have the system in place, the people in place to actually bring on more rigs, bring on more frack crews, or was that actually something that prohibits you from spending more? Tim Dugan Well, when we looked at our entire portfolio, we looked at our activity levels, we’ve also looked a lot at efficiencies and we can increase our activity but we also look at if we increase our activity where do we start to lose efficiencies. Right now to us frack crews are probably the limiting factor there. We can bring on more frack crews but it does reach a point where you start to sacrifice some efficiencies and impact your returns. So, we’re looking at it from a rate of return standpoint and living within our cash flows. Nick Deluliis And just to add on to that too, if you look at the ’17 and ’18 activity set it did not bump into those limits that Tim’s describing. The second comment, so there’s more running room there if we see the rate of return opportunity sets with the incremental activity. The other comment is, stacked pays are going to have a big impact on that, so because of all these benefits we talked about with stacked pays, we really don’t need an increased spread of an operating team within a field or necessarily even additional pads. As I said, those times have been shrunk and also the economies of scale that you get via a rig, via a completions crew, an operating team, those efficiencies go up. M The mechanism that you guys talked about, accelerating the mechanism of dropdowns to separate the two businesses, you talked about that maybe being ’17 event. Can you talk a little bit about that road map. Would you need to domicile the entire 75% of those assets in that subsidiary to split? And the other follow on to that tax leakage implications of this process. Dave Khani The tax situation, that will be very specific on the way we do it. But I think if we continue to do a drop I think there will be very limited tax implications from a cash perspective. We have plenty of coverage from an NOL perspective if we do it at an accretive nature. And the first part of your question? M David, the mechanism to do that, 75% of those assets still are domiciled upstream, so are you talking about chunks of 25% dropdowns? And then also your financial reporting starts to be altered potentially too at certain thresholds. So, I’m thinking about the mechanics of that process. Dave Khani We’ve started the process, we separated a lot of the personnel. So, from an organizational standpoint we’re already way ahead and prepared for a split. We’ve separated the cost perspective, so we need to have sharing, we know what we’re sharing and where they need to take over. And we’ve actually moved them into a separate part of the building. So, everything has actually been in place to be able to do it now. There are probably a few mechanical things that we need to do, they’ll need to take over certain functions, but we’ve got them isolated out, so we could effectuate a split if we want to, and there might be a six to maybe nine month of sharing of processes. But beyond that we’re in good shape. M So, you would go ahead and drop down those assets, what would be the mechanics of that? Those assets, it sounds like, would get dropped down as part of that separation.
36
CONSOL Energy, Inc. December 13, 2016 at 8:30 a.m. Eastern
Dave Khani One of the options would be to accelerate the drops. Right now the way the base plan works is it drops in stages. So, we could drop it all if we wanted to, assuming the capital markets were there. M That’s the question. The concern the market has is at the CNXC level in terms of the adequate financial capacity to be able to absorb potentially in a cash transactional context that drop. Dave Khani That’s right. If the market’s there, we can do it. If the market’s there we’ll just continue down the path of staging it. M Thank you, David. If I may ask one other question. The Gaut well, obviously terribly important. What’s the technical sense and when you hit line what are you thinking the role is then, the hyperbolic role is going to be, say, for the first year once you hit line on the Gaut? What’s your internal assessment there? Andrea Passman We’re still holding pretty flat on the Gaut in terms of overall production. We’ve watched a number of other operators actually hit line pressure at this point in time and we do see a bit more of an exponential decline from their data. So we’re going to continue to watch out for it. We haven’t actually put a projection out yet at this point in time and we should have something coming up this year. M What’s your broad property sense of why that’s such a fairly exaggerated role? Andrea Passman Actually, we think a lot of it has to do with how the walls were actually managed in the early time. We’re a big believer in managed pressure drawdown here, especially when we’re talking about the high end ceramics that we’re pumping into these wells, if you pull on those wells really hard the system hates dramatic change like that. The reservoir’s a sponge, you’re collapsing the sponge, you’re embedding the problem and you’re bringing a lot of that sand back. When we look at all of the other operators out there that have aggressively pulled on their wells very hard in the early time, you see that dramatic decline later and you see a lowering of that productivity index. When we do managed pressure drawdown, we typically see a 30% increase in EUR in the lifetime of the well, and a much lower decline once it hits that line pressure in terms of non-Utica wells, and we’re waiting to see what happens on the Utica side. M Thank you for your response. Thank you for the effort today, folks. Thanks. Greg Rooney Hi. Greg Rooney, Bank of America. Just in terms of your other coal-ish assets, the Baltimore Terminal and the royalties, I recognize that the market can bear funding those but where do you foresee those assets going? Do you think they’d move into the coal entity, or do you keep them, or do you sell them? Rodney Wilson Yes, if you’re talking about the Baltimore Terminal in particular, as I mentioned, that is an asset in the portfolio that we could sell. Right now our focus is operating that as a standalone business, increasing the EBITDA, and increasing the value of that asset before we would consider whether to sell it or not. If there is a separation of the two businesses the terminal naturally belongs with the coal side of the business.

37
CONSOL Energy, Inc. December 13, 2016 at 8:30 a.m. Eastern
Greg Rooney And the royalties from the met sale? Rodney Wilson I’m sorry, which? Greg Rooney The royalties that you’re receiving on the sale from earlier this year. Rodney Wilson Oh yes, the Buchanan royalty. Again, we’re keeping that and I think that that’s not so naturally part of the separation but that has yet to be determined. Greg Rooney And then just on Page 60 where you lay out the legacy liabilities, I’m a debt guy so I’m going to ask about it. You show the cost going down in ’17 and ’18, is that mostly from the Miller Creek, Fola transaction, or what’s driving the big change in the EBITDA? Rodney Wilson Yes, two drivers. First, as I mentioned, we’re making some changes to the way we deliver some of our retiree healthcare benefits, and the other big driver, as you suggested, is the full year impact of the sale of Fola and Miller Creek. Greg Rooney And then you mentioned buying back shares, it’s already in drilling, obviously this is part of the equation too, how do you think about potentially reducing this aspect of analyst analysis and maybe removing it from the balance sheet, pre-paying early, and eliminating further anything, maybe you can give me some color there, please. M It will go under the same filters of NAV per share, the rate or return, the proposition that it reflects. It will have to compete with the next opportunity set in our development plan on the E&P side, or a share count reduction. We looked at those things in the past when the liabilities were much larger in magnitude, back to the bar chart that shows the 2013 level and how that’s changed over time. The issue we’ve run into, at least historically, and that doesn’t mean we don’t need a refresh, is that they’re not fixed in some ways, they’re not determinable that would lend themselves well to what I’ll call a monetization. But they are great tools for financing. So, one of the questions we had about timing and the ability to finance drops, say, into CNXC, that is financing ready to go in many ways. So, we’ll look at it, it will be under the same filters and processes and philosophy that all the other opportunity sets get for allocating, I’ll call it resources or capital. And if there’s a way that it competes with our best alternatives, we’ll take it. But I think the key point is, to Steve’s statement, we’ve got a plan in place that will manage those down materially in the near term and we’re going to apply the same philosophy to it like we do with everything else Dave Khani Yes. And so Steve’s job and his team is to shrink the annual cash flows. The other thing I would just point out is with rising interest rates the discount rate for those liabilities is going up and essentially the natural balance sheet value is going to shrink over time. So, that’s another thing to think about, what is the right discount rate for those liabilities.

38
CONSOL Energy, Inc. December 13, 2016 at 8:30 a.m. Eastern
Greg Rooney And the last one from me. Just on the M&A side you talked a lot about divestitures, what acquisitions make sense but maybe even stepping outside of Appalachia. Nick Deluliis The equity is at some point in time we’re assuming that’s going from what I’ll call a rate or return opportunity set by reducing share count to something that becomes more of a conventional tool like the debt, like our free cash flow generation, to go assess things like M&A. So, the opportunity set may be changing over time as we’re successful in closing that valuation gap, philosophy, process stays exactly the same. And within M&A, we think through it, at least strategically this basin, you can see the footprint that we’ve got and the opportunity set that’s there for us, it’s probably a safe bet to say that that might be where the initial opportunity set may lay down the road for M&A. And where that sits and how we think about things outside of basin, to be determined, but the same philosophy, the same filters. So, M&A’s not a focus right now. We’ve got plenty to get at here with what you’ve seen, and at some point equity does become a tool that we can use to drive NAV per share, and I would guess that the first place we would look if there’s M&A opportunities would be in basin. Then we start to look out of basin. Greg Rooney Thanks. M Hi. [Indiscernible], Susquehanna. Central PA Utica well cost, is that what you expect now, or is that a target with a few more wells under your belt? Andrea Passman It’s a target, but we’re confident we’re going to get there on the next well. During the first well certainly we’ve had our challenges in drilling the vertical section on Utica, as many other operators have through the salt. We’ve changed up our bit and trip programs, we’ve changed up our fluid programs, and we’ve seen a lot of success recently, especially with what we’ve recommended with other operators that we’re now participating with, so we’re pretty confident we’re going to get there, it’s modeled out, and we’re expecting it in the next. M [Indiscernible]. Andrea Passman We love it. M One more follow up on that. When I look at the 2018 activities there, are there specific data points you’re looking for? What could make that program be a larger part of the activities in ’18? Andrea Passman Certainly returning to the Gaut region, which we call the Akins, and hitting all those numbers will definitely change our thinking in that region, especially with the land position that we have up there, we like that region. We also have other data points that are coming in simultaneously with that region to further delineate. There is a major structure just north of us that we want to further define as well, so that will help us out. Certainly West Virginia is a big question mark and we’re waiting for data to come in on the West Virginia side on Utica. There’s a number of operators that have permitted in that region. We all know there’s one well down there, but it seems to be a little bit of a head scratcher. We think there may

39
CONSOL Energy, Inc. December 13, 2016 at 8:30 a.m. Eastern
have been some issues, so we’re waiting to see another data point in that region to really confirm that. And then the other big piece of it for us is really the Utica and Point Pleasant have an overlapping position in the middle of the basin, where you get proliferation of performance out of really both formations. And we’re looking for a data point really within that center to define what is the extent of that in that overlap and that really may be the sweeter of the sweet spots in the entire basin when it comes to Utica. So, that’s the general regions where we’re looking. It’s also further defined with seven specific data points that we’re looking for in the moving non-core to core slide. M You characterized your well level returns as fully burdened. Can you clarify exactly what that means? Katharine Fredriksen So, it’s kitchen sink. It’s really everything from construction costs to production equipment, D&C, so, everything that we would include. M Overhead? Katharine Fredriksen Yes, I believe so. I’ll have to verify that. M Yes, we have overhead built in. M And then on the potential coal separation, the GP interest and legacy liabilities, they go to the coal side or not necessarily? Dave Khani The legacy liabilities, to be determined because we might be able to shrink them down to zero, that would be our goal. And then as far as what else goes with it, I think it will be determined. I think you just have to stay tuned. We’re going to be very flexible and we’re going to be very NAV per share driven. Lucas Pipes Lucas Pipes, FBR. I wanted to follow up on the 400 million to 600 million of asset sales for 2017. That’s still over 10% of your market. Does that include EBITDA generating assets or is that mostly non-EBITDA generating assets, on the gas side are infrastructure assets included? Thank you. M Sure. I’m going to ask Rodney to supplement this. But it would include primarily non-EBITDA generating assets. To the extent that there were EBITDA generating assets included, they would be very nominal amount of EBITDA associated with them. But, Rodney, do you have anything to add to that? Rodney Wilson No, that’s very accurate. Opportunities come, I explained we have an opportunity to be aggressive in a position of more strength in our negotiations, so a lot of these opportunities will drive the day on which assets we’re actually going to sell. Lucas Pipes So, that would be presumably mostly on the gas side, correct?

40
CONSOL Energy, Inc. December 13, 2016 at 8:30 a.m. Eastern
M When we’re talking about the gas assets, true. If we’re talking about as well a drop of CONVEY Water Systems, you heard the internal EBITDA associated with that is $50 million. A lot of that is eliminated in consolidation so you don’t see a lot of EBITDA associated with that if you’re talking about the drop of CONVEY. And then it depends. Rodney suggested it depends on what assets we actually sell, but looking at the gas side no EBITDA associated with that and some of the others minimal EBITDA associated with that. Lucas Pipes Thank you. David Amos Hi. David Amos with Hykonen Energy. Just a real quick one to follow up on the water side. Will you guys give us a split between the frack water business EBITDA and the produced water business EBITDA, or some kind of benchmark that we can use to think about those two segments separately? Steve Johnson I don’t have that at hand. Marshall, do you know that split? Marshall Roberts I know the split in the price per barrels. So, if you want to sit down and talk about that, David, absolutely. We make sure that we account for fresh water at one price, produced for the other, and disposals, and they’re all clear cut price per barrel. David Amos Great. Thanks. M In terms of your maintenance capex of $250 million to $300 million per year, is that from the current level of production, or is that an average of 2016? Nick Deluliis Current, average of ’16. We’ve talked about maintenance capital being in that $250 million to $300 million range for the last year or so, but now as our production base increases that number is staying flat, so in reality our maintenance capital has decreased. M And just a follow up on Tim’s question. So, when you talk about your well costs, so really it truly is kitchen sink, all in from well site preparation, and does it include gathering in the capex, the capital portion of that? And there was a question about G&A, is that in the capital portion of the returns calculation or in the operating cost portion? Nick Deluliis The midstream costs are covered in the gathering fee, but it’s soup to nuts, everything from pad construction, permitting, through drilling, completion, production equipment, turn in line, flow back. M Okay. And then a question on the overhead, do you think you’re including that in the capital portion of costs or do you think you’re including it in the operating portion?

41
CONSOL Energy, Inc. December 13, 2016 at 8:30 a.m. Eastern
M I’m going to speak in the accounting world, which is very dangerous for me to do. I believe that we allocate our G&A and a portion of that goes towards capital, that we deem to be working on those capital programs, so that would be reflected in the numbers that we show. And then the other portion of G&A is treated as basically expense. So, what you see on capital numbers matches the G&A outlook allocation that we use for the portion going to capital. M And just one follow up. A different question. In terms of improving productivity on a per well basis, we’ve seen a nice improvement, especially in the Marcellus probably since early ’15. So, from here how do you improve productivity per well, what are the key factors that will improve productivity for a well? Don Rush I think I’ll let Andrea follow up. But I think the biggest drive when the modeling has certainly helped us with our well selection, making sure that we’re drilling our best wells first so we’ve got the good rock. Our completion design, and completion modeling is really what’s driving our well quality now. We’re going to get the rate of return benefits from the stacked pay potential, but EUR per 1000 ft. of lateral, the improvement we see there is further refining our completion designs and our modeling. A year and a half, two years ago when we had our Analyst Day we talked about reduced cluster space and shorter stage lengths, and we were doing 150 ft. spacing everywhere. We did the same prop loading everywhere. Now, we’re looking more at customizing our completions by designing. We’re not just looking at our prop loading, we’re looking at our prop types, our stage spacing varies from area to area, the fluid systems we’re using varies from area to area, the chemicals, the additives we’re using. So, our completion designs have become much more customized and we still have more to do there as we refine it area by area. But that’s where the biggest difference is coming from right now. Andrea? Andrea Passman I would say going forward another area to focus on is production, so we’ve changed quite a bit in how we produce our wells, both in the early time and as they get into the matrix flow. So, in early time we do want to control pressures as much as possible so we don’t get that sandbag so we keep the stimulated reservoir volume intact and keep that propped. Also, when we bring artificial lift into play to really enhance productivity of the wells, is a very specific timing and our ability to understand well bore hydraulics. And then I think the third piece of it is we’re moving to automation in an extreme way. In fact, all of our Marcellus and Utica wells are controlled here at the center from our production control room. In fact, many of our new hires are actually data scientists instead of engineers as of recently, because we’re moving into a predictive analytics world where we’re actually getting out ahead before the wells go down, we’re actually getting in front of them to prevent that, whether they’re loading, whether we need to rent soap sticks, so on and so forth so that we can maintain the highest productivity possible for all of the wells that make up those numbers. So, you see enhanced productivity not only through the completion design but also through maximizing production and really managing the well bore hydraulics through the early time of the well and as they start to move into the matrix flow. M You highlighted in West Virginia 61,000 net acres in a box. The box, what is the acreage inside of that core box in West Virginia? What’s the subset of that 61,000? Andrea Passman It’s actually on the modeling slide and I believe it’s, what is it 17? M Yes, it’s 17,000 undeveloped acres, all within the type curve regions or located within the modeling inputs

42
CONSOL Energy, Inc. December 13, 2016 at 8:30 a.m. Eastern
on the Excel drive. M So, of the 61,000 acres, 17,000 are in the core box? In other words, the total acreage, it’s 17? M 17,000 undeveloped acres. M So, the rest of that acreage is outside the box. How much production is associated with that box? M That, I don’t know. We have the producing wells, and obviously some of that are with— M West Virginia in general, how much production do you have for West Virginia? Andrea Passman We have to pull those numbers and get back to you. M Thank you. TJ Schultz TJ Schultz with RBC. My question is mainly on distribution growth at CONE. So you lay out the scenarios for different levels of distribution growth, and I know you’ve been growing 15% per year and you have more visibility with that from the most recent drop. But as we think ahead I guess the question is what scenarios would you consider to accelerate that growth that has a pretty meaningful impact on the GP, or value obviously if we consider drops of water, or just what scenarios would accelerate growth? M I think what we have said for CONE is with the drop we feel comfortable now that we have the capability of growing the distribution growth out into 2018 at that 15% level. One of the things we do at CONE is we stress the distributions before we put them out there we look out over a point in time and assume that we do not connect any more wells and we essentially stress the cash flows to make sure that we can continue to pay out that distribution out in the future. And I say that because before we would ever say we’re going to go out so far into the future we would want to stress test that capability. So, what can we do to extend out that growth? Well, first of all, you’re going to see in the CONE presentation you’re going to see turning lines start to pick back up again as the drilling starts to go. We have third party and then obviously we have drops. We have drops of either water, the other two devcos, and our devco three is probably a more mature system to be able to drop in and so again if all that works out we can see very far in line of sight to be able to grow that distribution. What level do we want to do it at? Again, we want to make sure that we can pay that distribution out and not jerk it around. We want to be very consistent. So, right now the 15% level is where we feel comfortable. TJ Schultz Thanks. Brian Gart Brian Gart, Stiffel. I’m just curious, have you guys locked in your rigs in completion crews through 2017?

43
CONSOL Energy, Inc. December 13, 2016 at 8:30 a.m. Eastern
M We’ve got our drilling rigs tied up and we’ve got one frack crew on a term, I believe for six months with the ability to renew, and we’re working on a second crew. Brian Gart And to follow up on that, any sensitivity that you can provide on the two year development plan that you guys have on Slide 40 for escalating of D&C costs? M Well, we certainly realize that with market changes we may see some increases in service cost but we’re very confident that with the continued efficiencies that we’re pushing that we can offset increases in service costs with increased efficiencies. M Nick, I know an important part of compensation for management this year was free cash flow. Can you talk about what metrics you’re going to be using for 2017 and how they’ll differ from 2016? Nick Deluliis The compensation really consists of two components, the short term incentive plan for the year in front of you which is the free cash flow plan this year that you mentioned, and then the long term incentive plan which is more pay for performance of course but equity-based, looking at a longer period of time and what the total shareholder return and NAV per share proposition has done over that time. So, when you look at 17, and again this is all to be determined, this is working with our board of directors and how we want to tweak these, I think when you look at 2017 you will still see some component of free cash flow being a metric in the short term plan, but you’ll probably also see something that ties to the themes that you heard of here today of capital intensity and setting the stage for the growth that we’ve seen in ’17 and ’18, so making sure that we’re being astute, stingy allocators of capital but at the same time getting the rate of returns that we see being accrued through the production that will benefit through ’17 and ’18. So, that’s the ’17 view. On the long term plan, I think the name of the game is still going to be NAV per share, total shareholder return, how are we going to place ourselves in the same shoes as the investor base. And that’s really where the bulk of the percentage contribution of the compensation plan is coming, at least for the executive officers. M And how much capital is employed in the water business? M Marshall, do you have that number? Marshall Roberts Yes, I do. It’s 27.5 million for 2017. M Thank you. M [Indiscernible].

44
CONSOL Energy, Inc. December 13, 2016 at 8:30 a.m. Eastern
M I’ll get you that answer immediately. M Okay. Paul Ford Paul Ford with Stifel. Just thinking about this decision that you’ll be making over the next couple of years on separating the coal and the gas business, how important is it to you as you consider a multi-year dropdown or just a clean break in 2017, how important is it for the investing story for CNX to become a simpler company to evaluate, or is it really something that you don’t necessarily see simplifying the investment case between coal and gas as more important than just simply creating the maximum value for shareholders? Nick Deluliis I think that’s an intangible and it’s very difficult to know for sure and certainly to quantify. But looking at it, it probably would be a benefit to get to, I’ll call it a simpler story at least on CONSOL Energy side. And there’s obvious benefits to it on the CNXC side when you look at float, etc. but it’s an intangible, so to the extent that we can capture that and [indiscernible] then we’ll account for it. And maybe it becomes a tiebreaker, all things being equal, but we really want to stay true to the valuation drivers and making sure that there’s an NAV per share proposition there. It’s also self-correcting, to a large extent, as you see the E&P segment continuing to grow, as you see these margins continuing to increase the percentage of the company’s financial performance is what I will call E&P driven continues to rise. So, there’s a steady state improvement continuation and evolution of that, and there’s also the intangible benefit that you’re bringing up for both CNXC and CONSOL. Paul Ford Just as a follow up. Post election you ran through some of the regulatory changes that you had anticipated from a new administration. Does the election change the outlook or let’s say does CONSOL as a diversified energy producer have you changed the internal valuation of the coal business in a post Obama administration political environment, or do you think that that’s not, let’s say it’s not crucial for making decisions about the future split? Nick Deluliis The last number of years we looked out over the demand space for the customers, the markets that we serve from both E&P and coal and we saw a permanent significant shift occurring on the mix between E&P and coal and things like the electricity grid, and where the demand was going for each. Some of that was driven by the shale revolution, natural gas becoming more plentiful, lower cost, call it market. Some of it was driven by policy, the executive orders and the various things that Tommy Johnson mentioned. Nobody really knew which one was the main driver and which one was just the catalyst that sped it up. But when you look at 2017 now moving forward I think we’ve removed at least the heavy hand or the impact of the policy via executive orders, regulation. And now we go to basically, okay, which one of these opportunities or options makes the most sense for the electricity grid, or other demand sources moving forward. And we still come out looking that there’s going to be a significant resetting of that market share become coal and E&P but now it will be dictated more and more by what the price of natural gas is versus what the power cost of coal is. And that’s an area that we’re very comfortable and the CNXC team is very comfortable operating within because we feel that we’ve got the best positions in these basins and these markets that we operate in and we’re the most efficient at the lowest cost. So, that’s where we want to be. And we’ll let the market speak. It might take some twists and turns. But

45
CONSOL Energy, Inc. December 13, 2016 at 8:30 a.m. Eastern
those percentages may change between coal and E&P market share over time. We still see a permanent reset there where E&P has captured a lot of that moving forward. M Thanks. CONCLUSION Tyler Lewis So, with that, we’re a few minutes beyond 11:30. For the sake of keeping things on time, I know people have flights and such, we’re going to wrap up the CONSOL Q&A portion. I would like to invite everyone out to the back here where you entered the elevators to grab some lunch. Please bring it back to your seats. We’ll plan to be back here at around 11:40 and we’ll hand it off to CNXC at that time. Thank you all. PRESENTATION Mitesh Thakkar If everybody could just get settled down a little bit, we can start with CNNXC, just to be cautious about everybody’s time here. Good morning, everyone. I’m Mitesh Thakkar, director of finance and investor relations for CNNX Coal Resources. Thank you very much for joining us this morning and the CNNXC breakout session. We have several members of the CNNXC management team here with us to give you a brief overview of the company and discuss the business outlook. For the presentation session, will have Jimmy Brock, our Chief Executive Officer and Lori Ritter, our Chief Financial and Accounting Officer. We’ll go through the slides. Jim McCaffrey, Senior Vice President Marketing and Sales will join us for the Q&A session. We also have in this room today a full breadth of CNNXC management team, Martha Wiegand, General Counsel; Chuck Shaynak, Senior Vice President of Pennsylvania Operations; Barry Miller, our VP of Strategy and Engineering; Dan Connell, Director of Strategy and Analysis; and Bobby Braithwaite, Manager of Energy, Sales and Transportation. They are all here if you want to get some one-on-one time with them. Without further delay, I’ll now open the floor up for Jimmy. Jimmy Brock Thank you, Mitesh, and good morning, everyone. I think it’s still morning. It’s late morning, but it is still morning. So, really excited to talk to you about CNNX Coal Resources, the assets we have, the management team we have, and how we see our plan moving forward and our strategy. The cover slide up here is one of my favorite ones. When we’re out on the road or any place, I really like to have that slide up there. This is where everything comes together. That’s our Bailey Central Preparation Plant where all the processing is done, and it’s an incredible sight when you’re out there, but we’ll get into those here in a little bit. CNNX Coal Resources is a growth-oriented master lender partnership that was formed by CONSOL Energy mid-2015 to manage and further develop 100% of the Pennsylvania mining complex. Currently today, when we went to IPO, it was $15 unit price at the time of IPO. We had a 20% undivided interest in the Pennsylvania mining complex. Since that time, we did an additional drop, which was completed on September 30th of this year, which is another 5%.

46
CONSOL Energy, Inc. December 13, 2016 at 8:30 a.m. Eastern
So, currently today, we sit at 25% undivided ownership of the Pennsylvania mining complex, which I think is really unique in itself when you look at the investment proposition we have there. First of all, if you look at the safety, our incident rate is 42% better than the national average when you look at the underground operations in the US. So, we’re really proud of that. Every decision we make, everything we do is based upon safety and compliance. Number one, it’s morally the right thing to do. We want to protect all of our employees, but we don’t want to cause any embarrassment to any of our investor holders, our communities, or our employees themselves. If you look at our sponsor, we have a very strong sponsor in CONSOL Energy who has great assets for us. They’ve worked with us. We know the Pennsylvania mining complex very well. They have a high percentage of the company in the form of IDRs and LP units, which Lori will kind of get into that structure a little bit later. The other unique thing about this is we have a very senior management team that’s operating and running these coal mines, which I’ll talk about when we get to the operational slide. But, we have our youngest superintendent that’s with us now has probably been with us for 31 years of experience. The rest of the superintendents are very similar or more years of experience. Now, what’s more important, right behind those guys we have a very deep bench of people that are qualified and ready to step in. So, I don’t like to talk about it and say it, but if one of our superintendents got hit by a bus tomorrow, we’d have people that are ready to walk right in and take their place as we move forward. You look at the reserve base, I’ll talk about that when I get into the operations slide, but I can tell you that this asset base is very unique, and I’ll go over that when I get into the assets slide itself. So, the Pennsylvania mining complex consists of our Enlow Fork Mine, which is two-longwall coal mine, our Bailey Mine, which is a two-longwall coal mine, and our recently developed Harvey Mine, which is a one-longwall coal mine. We have average reserve life there of about 28 to 30 years, 790 million tons. It’s high-quality, high Btu. The average sulfur content of the coal for the life of reserves is about 2.37%. So, if you look at the workforces at the mine, you heard me talk about the management side, the workforce is a union-free operation there. We have a lot of flexibility of what we do with them. We don’t have to deal with a third party, and we’ve been able to get significant [indiscernible] of scale by working with this team. We have a train loadout there that we brought on line early in 2014. It’s, I’ll guarantee you, the best of the East Coast and possibly the US. It’s a vatchway [ph] system. We can load two unit cars at the same time, up to 9,000 tons per hour, and we also have blending capabilities right there at the train loadout. Now, we don’t have to do anything special to blend it. We just have to pull a higher percentage out of one silo versus another of the product that came from one of our three coal mines there. If you look at the blending capabilities, we can do it right there. We’re serviced by both rails. We’re serviced by the NS as well as the CSX, and also we have the Baltimore Terminal as part of the asset that you heard the team talk about earlier this morning. We have a throughput agreement. No take or pay for seven years that we can take coal through the Baltimore Terminal, so it gives us a great advantage when you look at it.
47
CONSOL Energy, Inc. December 13, 2016 at 8:30 a.m. Eastern
The other thing I’d like you to look at on the slide here is you’ll see a later slide I’ll talk about some cost improvements. One of the ways that we were able to get that accomplished is when you look at the lower, right-hand picture there, the gray shaded area you see is a sealed area of the mine. Those reserves have already been mined out, so other than having to maintain that, send people in there and expose our employees to it, we made a conscious decision to allocate capital, seal that section of the coal mine off with 120 psi seals. That requires no monitoring or no one to be in that area. So, what we have left is the green area, which is the reserves. It’s the 890 million tons that we talked about earlier that we have to mine. So, you can look and you can see we put a new slope belt in our Enlow Fork Mine along with overlaying belt conveyors that take that coal to the prep plant. We did the same thing at Bailey. We put a new slope in overlaying conveyors to take it to the preparation plant, and just by sealing those coal mines, we reduced that footprint that we have to maintain and monitor by 92%. So, we like to say even though these coal mines started in 1982, they are like new coal mines because of the seal and the much smaller footprint that we operate. If you look at our Harvey Mine, it’s the newest mine, less than ten square miles that we maintain and operate there. So, very unique set of assets. We have invested over $2 billion in the last decade in these assets here. Going forward, you’ll hear Lori talk a little bit about it. We think that these coal mines, the way we have them developed to look at, are pretty much going to operate on a $5 per ton capital looking forward. Now, there will be some lumpiness in that. One quarter may be a little higher than another, but the overall average is going to be around $5 a ton for those reserves. We started taking a look at what was happening in mid-2015. Many of you may remember we made a conscious decision to run to what tons we had contracted in 2015, which was about 23.5 million tons. So, we had to look at these longwalls, look at the coalmines of complex, and see how we could provide those tons to the customers at the most efficient way we could mine those. So, when I’m talking about the complex, those five longwalls, we like to think about it as just one complex with all of the optionality and flexibility that we have to operate one of those five longwalls or all five of those longwalls depending upon what market situation we’re in. So, we saw the commodity prices fall in mid-2015. We saw the coal prices continue to decline, and we decided at that time that price or realization of coal was no longer going to carry the ship for us. What could we do to make sure that we could not only compete, but we could thrive and stay in this downturn? So, we took a look at our cost structure, and you can see that there in 2015, Q2 we were around $44.15 in cost, and now at the end of our third quarter earnings call that we’re $35.79 in total cost. So, we had a 19% reduction in cost in those 15 months. How did we do that? The first thing we did was we called all of our suppliers in, vendors in, the people that provide labor for us as well as the material to mine the coal, and said 20% margins are not there anymore. You guys are going to have to come back to the table. We’re going to bid all of the ancillary work out. We’re going to make it as competitive as we can. We’re going to go down to companies. We may have had three or four providing the same mining equipment to us or the same tool that we need to mine. So, we said we would narrow that down. We’ll have one. It’ll all be bid out. The low-cost bidder will do it providing they can do the job safely and compliantly. So, I will tell you that resulted in about 20%. The second thing we did is we took a look, Chuck Shaynak and team and myself, to a look at how we’re actually operating these reserves. Are we doing it the most efficient way that meets the market demands today? Do we have improvements we can make? Let’s look at this from a zero-base budgeting plan.

48
CONSOL Energy, Inc. December 13, 2016 at 8:30 a.m. Eastern
In other words, we don’t want to improve 10% over what we had last year, but absolutely what does it take today to mine one ton of coal safely and compliantly. I will tell you that that exercise resulted in a 10% man count reduction across the board: production and maintenance workers, supervisors, as well as corporate workers. The third thing we did was we just took a look at how we were actually mining those reserves. Are we mining 24 hours a day at one mine versus another? Should we look at that differently? We went to two shifts a day at our Harvey mine, the one-longwall coal mine with all the new infrastructure in it and got cost reductions there. So, the big question is, can we maintain those costs moving forward? You heard me talk about our capital is pretty much maintenance and production capital moving forward. The way we see this and what we think we got it in ’17 that our costs are going to be flat to small increases up to single digits. So, what we think we can do is all the low-hanging fruit, the big buckets are gone. We’ve already gone through those, but we think that we will gain small, incremental amounts from multiple buckets going forward. I like to think about when we look at inflation, we normally put 1.5% to 3% just for inflation going forward, so if we can get those small, incremental improvements, we may be able to hold our costs to that flat number that we talked about. If you look at the scale to the right, as we were making all these cost reductions, Chuck Shaynak and team doing a good job making sure we had the right people left there with the right attitudes, and you can see that our tons per employee man hour actually increased during this exercise. We’ll get into the marketing section a little bit. You can see our market strategy, you’ve heard us talk about it before, was different; it’s unique. We targeted those core must-run power plants that are in close proximity to our operation. What we mean by that is we wanted to go to the power plants that have already made investments in the environmental things they need as far as the MATS regulation, which we know came into effect in April of 2016 of this year. Also, they had scrubber technologies and things, and not only are they going to run, they’re going to run at a higher capacity factor than the other Northern App plants. So, that was our market strategy. We started that five or six years ago. It has worked very well for us, and I’ll have a slide that shows that here shortly. You can look here and see that we have some credit-worthy customers there. The main four being on the slide to the right. So, if you look at our contracted position, while everyone else was losing market share, for 2016 we are 100% contracted. These numbers I’m giving you are on the 26 million-ton base case at 100% number. So, if you look at 2017, we’re 94% contracted, and 2018 we’re 60% contracted. So, our marketing team has gone out and executed a plan. They’ve done what we need to do to stay in the marketplace. Now, ironically, the makeup of these if you look at the total portfolio, about 65% of those tons are fixed price, 15% to 20% of them are the netback deals, whereas we have a floor price in that covers the all-in cost of mining, and then we share in the power prices with those utilities. The other 5% to 10% is indices or floor and ceiling prices that are in the mix of these numbers. So, if we look at 2017, we have 6% open position there. We are very, very selective about how we fill that. The goal for the remaining 6% of those tons will be to increase the overall realization of the portfolio. We can be selective with that. Bailey Mine, we also have a product there that we sell out into the high-vol crossover markets, the metallurgical market.

49
CONSOL Energy, Inc. December 13, 2016 at 8:30 a.m. Eastern
Now, it doesn’t meet a grade-A metallurgical coal. It doesn’t meet a grade-B high-vol metallurgical coal, but customers, when you start seeing the benchmark approach $200 a metric ton, we start getting inquiries about the Bailey coal. They liked to use it in the blend process. They like it for the low reflectance, they like it for the fluidity of the coal, and it helps their overall cost structure when they do that. So, we start moving that coal over. It helps us in that marketplace. So, where will we take that? If the met market stays stronger, we’ll take it to the met markets. We have the optionality to do that through the Baltimore Terminal, however, if our thermal domestic prices are higher, we would take it there. So, we have a lot of optionality of where we get it, but the overall goal is for the marketing team to raise the price. This slide here is actually our strategy in action. You heard me talk about those core, must-run power plants. You can see there that in the shorter months of April, May, and June, the generation was down around 36% or so, and you can see that the core customers that we had were still dispatching on an average there of 8% higher, and you can track across and see where the summer burn this year started getting strong again. The generation went back up in the 60th percentile, and you see over there that our strategy is working, that we still remain 5% higher those plants that we went to as far as capacity. This slide here, one thing we’ve had to learn for sure is that gas prices have an effect on coal prices. We like to say that $3 Mcf gas prices equate to a $50 coal price, high $40s to $50; $4 is high $50s to $60. When you look at the price, you can see here that as those gas prices started to rally, coal lagged a little bit as far as price coming back, and that was because of the inventory numbers. So, as that inventory started to work down in those hot, summer months when run started to increase, you can see that that gap again was beginning to close there when you look at the [indiscernible] coal versus the gas prices coming across. So, it’s critically important to us. We think that fuel buyers, when they buy fuel, whether it be coal, gas, whatever they buy that they buy it on a million Btu basis, and we think we can compete very favorably when natural gas is above $2.50 in Mcf. This slide here is one that we use just talking about generation, which is important. I believe that coal is today a viable part of the energy mix; I think it will be for some time in the future. If you look at where we are today, we’re currently around 31% of the coal fire generation for electricity, and when you look at when gas is trading between $2 and $2.50, we’re somewhere around that 32%, about where we sit today, and then as those numbers increase, you see the percent of coal-fired generation increasing. When you get up to $4.50, we could be back to 38%, 39%, or 40% coal-fired generation again when those get out there. Now, I think the important thing to look at here, a 1% increase in coal-fired generation represents 22 million tons of production. So, you can do real quick math. If we had a 5% increase, it could be 110 million tons. If it’s a 10% increase, it could be 220 million tons. So, it has a direct reflect on the production that we do going forward. This slide here just talks a little bit about our export. We have the opportunity to go into those stronger export markets, and you can see the price rally that’s been out there as far as the metallurgical side being up 115%. I think if you look at the API 2, those numbers are up in price, so it’s the rally we were talking about this morning and gas prices. There’s a lot of significant tailwinds that we’re seeing now that we’re really liking when you start looking at the optimism in the marketplace now. But, if you look at our core customers that we talked about this morning, those 15 top core, they make up 84% of our thermal business that we have.

50
CONSOL Energy, Inc. December 13, 2016 at 8:30 a.m. Eastern
Recent market signals, you heard me talk about the API1, API2 being up, so if you look at the metallurgical benchmark rising, we have successfully on a 25% basis executed sales of 340,000 tons into that export market, and Jimmy and team continue to work on that. If you look at the API, prices are up 20% between June and November, and they continue to go up. The good thing is the [indiscernible] data, which lags behind a little bit shows that if you just look at the production, Northern App production is down about 16% year-on-year. Total coal production is down about 23% year-on-year. So, that balance is starting to work in there. You can see that the forward gas prices there of $3.13 during June through November, kind of hovering where we were when we took a little bit of beating yesterday, but we watch those very closely, and our market team is continuing to improve the portfolio by looking at places to take the coal into the market that brings the best realized price back to us. At this time, I’m going to turn it over to Lori to walk through the financial section. Lori Ritter Thanks, Jimmy. Okay, first let’s just do a brief review of our ownership structure. Again, we’re the CNNXC management team. CNNXC currently owns 25% undivided interests in the PA mining complex that Jimmy described. So, how did we get here? What our IPO, we owned 20% of that complex. So, how we got that is we issued 11.6 million of common units. About half were privately placed with Greenlight, a million of the common units were issued to CONSOL, and the rest were sold on the public markets. At that time, we also borrowed $200 million on our $400 million revolving credit facility. So, then from there, at September 30th of this year, we purchased another 5% of that PA mining complex, and we accomplished that by borrowing $21.5 million on the revolving credit facility, and we issued preferred units just shy of about 4 million of preferred units to CONSOL Energy, which equated to a total value of $88.8 million for that 5%. Now, those preferred units have priority, and they pay about $1.87 annually in distributions. What’s important to note on all that is at September 30th, we had $208 million outstanding on that revolving credit facility, so if you think about the $200 million that we borrowed at IPO and the $21.5 million for the 5%, you can see inarguably the worst coal markets ever, we were able to pay down some debt, manage that leverage ratio a bit, which turned out to be 2.7 times at September 30th. Now, as far as the common and the subordinated units, a couple things are important to understand. First, they all pay $2.05 annually, but common have priority over the subordinated units. What does that mean? That means that those subordinated units, on a quarter, would have to be driven to zero before any common unit holders’ distribution could be impacted. Now, the common units also accrue arrearages, so if they were to be short-paid, they would have to be made up. That payment would be made up before payments on the subordinated units would continue. I mention this because it’s important to note that both the preferred units, which also have a pick feature, and the subordinated distribution are two good levers to have in these very volatile markets that we’ve seen in the past 15 to 16 months. So, again our intent is to pay all those distributions, but again, nice levers to have in the event we experience additional volatility. Now, on this slide, you can see this is our guidance, which we issued this morning on a press release, and these are the results for the 25% results of the business. So, we own again the 25%. CONSOL Energy owns the other 75% of the EBITDA in the PA mining complex.

51
CONSOL Energy, Inc. December 13, 2016 at 8:30 a.m. Eastern
A couple of things that are noteworthy on this guidance. You see, if you look at the midpoint of the volume range, on 100% basis, it equates to about 26 million tons. That compares to this year midpoint, again, is about 24 million tons. So, you can see we expect in the next year our volumes to “normalize” back to a base case of about the $26 million again at midpoint. Now, we’ve provided the EBITDA guidance here, which again, you can see driving up. How that’s achieved, like Jimmy said, and what we’ve talked about at our last earnings call, we expect to see our realizations increase 5% to 10% off of 2016. For the third quarter of ’16, our realizations were $44.30. We mentioned that we expect those to stay relatively flat in the fourth quarter. So, as those realizations drive up the 5% to 10%, we’re also expecting our costs to remain flat to only increase by low single-digits. Again, as Jimmy mentioned, we’re watching that very closely and continue to optimize that cost structure. So, with expanding volumes and also expanding margins, our EBITDA is driving up. Obviously, as that EBITDA increases, without doing anything else, the leverage ratio, again that was 2.7 times at September 30th is expected to go down over the course of the year. Now, keep in mind on this guidance, this is our base case plan. We do have room for upside, and some of those things you heard Jimmy mention. One, again our capacity is 28.5 million tons, so we’ll produce to the level that the market allows us to do. Also, although we are 94% sold for next year, which provides a very nice, stable cash flow stream coming in, there’s also room for upside on there. We have the additional volumes, as I’ve mentioned. We also have exposure to upside pricing through our netback deals, so if power prices drive up, we get to participate in that as well. We get to place those additional tons, or the 6% that’s not sold even, into the highest-priced market that we can. So, our high-vol crossover tonnage that we have can be placed in the markets that command the highest price to give us additional uplift there. So, again, although this is our guidance, and this is our base case plan, we are working toward achieving additional upside. Here’s some of our data compared to some of our peer groups. Noteworthy is our contracted position. Again, nice, steady cash flow stream with some exposure to upside pricing. I’d also note the 2.7 leverage demonstrates that our balance sheet is in a good position, and again, improving as EBITDA drives up. The other noteworthy item on this slide is the yield that we’re paying on our $2.05 distributions. So, what’s all this mean? On the operational front, we continue to optimize the cost structure, achieve production that the markets allow, and we’re in a good position to do that. On the marketing front, we have that 94% sold, which provides the nice, steady cash flow stream, again with upside on pricing that we’re excited about. On the financial front, as that EBITDA drives up, you’ll see our financial metrics continue to improve. We also have a lot of room for organic growth with additional volumes and then additional growth through additional drop-downs. Again, that’s 75% of the PA mining complex is our obvious target, so we have that as well as other assets that we’re looking at. So, with that, I’ll turn it back over to Mitesh. Mitesh Thakkar Thank you very much, Lori. We’ll just now gather for the Q&A session. I’ll request Jimmy and Lori and Jim to join us for the Q&A session. The rest of the team will be available here on standby if they are

52
CONSOL Energy, Inc. December 13, 2016 at 8:30 a.m. Eastern
called upon. Thank you. QUESTIONS AND ANSWERS Lucas Pipes Thank you. This is Lucas Pipes from FBR, and I have a question on the broader coal markets. I wondered if you had a view in terms of the Clean Power Plan. How many tons would it shave off the total coal demand? With that potentially off the table, I know that we’ll see how that works itself out in January and further along, but let’s say there’s no Clean Power Plan, where would coal demand go over the next five years or so, ten years? What would that mean for CNNXC? Thank you. Jimmy Brock I’ll take the first part of that, Lucas. I think the Clean Power Plan, if it goes through it all, it’s going to look materially different than it does when it was initially proposed. I think there is some work to do there if it comes out at all. I think the regulation of the Clean Power Plan under the Trump Administration is going to be beneficial to coal in general, and I think that Jimmy can explain a little bit about the ties that we think may or may not come off the market, but keep in mind I think it will look materially different if it develops at all. Jim McCaffrey Is this on? Lucas, I’m not sure I have a specific number, but since we were at the peak of the market, we’ve seen 250 million tons come off of the US marketplace, so we’re sitting around 755 million, 760 million this year, production and demands, probably approximately the same. I think that we’ll see that production and demand get back up to about the 800 million ton level. I don’t think that other 2.5 million tons will be coming back, but I think the good news about the Clean Power Plan is it’s not how much more coal would be in the marketplace; it’s how much less will be removed from the marketplace. Joe Almworth Joe Almworth [ph], FBR. What is your willingness and ability to purchase assets away from CONSOL? Jimmy Brock We stay very open-minded. We will look at any things out there, but what’s critically important for us right now is to protect our balance sheet. So, first and foremost, we would do that. We would look at the asset, particularly if it’s outside of the Pennsylvania mining complex and make sure number one, it’s accretive to all our unit holders, we get a fair deal with it, and we would be very astute in our due diligence because one of the things that we worry about, Joe, there’s been a lot of distress in the coal markets period and the coal space in the last two and a half years. I don’t think there’s been a whole lot of capital money that’s been spent on those coal mines, and the last thing we’d want to do is pick up an asset that we think we’re getting X number of EBITDA from and then find out we have to infuse $50 million or $100 million to get that EBITDA and capital into it. So, we’re very open-ended. We’re looking at all of them, and as long as they don’t stress our balance sheet and they meet the accretive duties that we’re looking for, we certainly would look at them. Joe Almworth Could you give us some idea of the pace at which you actually look at external transaction? Is it five a month or five every six months? Jimmy Brock I’ll let Lori answer the second part of that. I think we don’t have a specific number, but I can tell you we’ve looked at over a dozen deals in the last probably year.

53
CONSOL Energy, Inc. December 13, 2016 at 8:30 a.m. Eastern
Lori Ritter I would think that’s [audio disruption]. Joe Almworth Just one more question. In terms of your forward guidance, what kind of drop-downs are you assuming in your guidance if any at all? Lori Ritter In this guidance, there’s no drop-downs assumed, but as David mentioned, we’re working toward that every day. Joe Almworth Okay. Got you. Any qualitative guidance in terms of how many you expect, when they start, etc.? Lori Ritter No, what we’ve said is we can time and size those as need be, and more importantly right now, the timing and sizing will depend on what the market allows us to do. Jeremy Sussman Jeremy Sussman with Clarksons. I guess first on the cost front, with volumes up in 2017 and 2018, would you be surprised if unit costs actually declined? Then, second question just in terms of how much, especially in 2018 when you have a higher open position, if the market is there, I guess how much could we see move into the high-vol market? Jimmy Brock The first part, on the cost side of it, I like to think that increased volumes certainly help unit cost. There’s no doubt about that. As you bring up more volumes, those costs come in line, so I would not be surprised to see increase in volumes and the costs go down. As far as the crossover met, typically today we have about 15% to 20% of our total portfolio that goes into the export market. I think you can consider that crossover high-vol met to be about 50% of that. Now, keep in mind that Lori touched on this briefly on the upside. We can have the flexibility to take that coal into whichever marketplace provides the most realization for us. For example, a year and a half or so ago, the export markets were really bad. We didn’t want to do anything in the export markets; we were doing most of it domestically here in the US, and that changes. It’s all market-driven on the price that we get, actually. It’s all market-driven on where we would take it, but we do have the optionality at no extra cost to us. That crossover met coal that we’re talking about doesn’t cost anything to clean it extra. It doesn’t do anything but just bring it out of the silos, so we would take that to wherever we assume the best price in the market. Jim McCaffrey Specifically, Jeremy, I think at our peak we were about 3.1 million tons of crossover. That’s the most we shipped in a year. As you know, the product is a product, like Jimmy had said earlier in his presentation, that goes into a blend so it has to be developed. We have had some additional development, both domestically and internationally, primarily in Japan. So, the portfolio had basically been to Korea, China, and Brazil, Europe, and the US. Now, we have a Japanese customer, too. So, we are expanding the product line. I think it is possible to get beyond that

54
CONSOL Energy, Inc. December 13, 2016 at 8:30 a.m. Eastern
3.1 million level if the price holds for the met market. Jeremy Sussman Thank you very much. Paul Ford Paul Ford with Stiefel. Just earlier I think Dave Khani had talked a little bit about the potential for an acceleration of the separation between the coal and the gas business. He made mention that the structure could be, I guess, it could be a spin, it could be accelerated drop-downs, but he did mention that a C-corp to house the coal assets would be contemplated rather than the current structure of the MLP. I was just wondering how you go about making that decision about how you structure things going forward, and would there be some, I guess I would say how difficult would that be in order to convert the firm to a C-corp, Lori? Lori Ritter Sure. Paul, that’s a really good question. There’s a lot of things to consider with that. Depending on the structure that would reside as some of the answers to that, which is driven by CONSOL’s ownership in the 75%, what they want to do with that. As far as how difficult would it be to convert from an MLP to a C-corp, I think there’s a lot of legal things that we’d have to take a look at and also a lot of consideration for our unit holders that we’d have to take a look at, so it’d be complicated. Not impossible, but complicated. Paul Ford It doesn’t sound like [audio disruption] convert to C-Corp. Lori Ritter Again, it’s a possibility. To say it’s front burner, I think we’re pursuing an awful lot of options to handle the split of the companies. Paul Ford I guess just to make it more complicated, I think he had also talked about potentially moving some of the legacy liabilities into CNNXC from the parent company. Can you talk a little bit about your ability to take on some of those liabilities? What do you think your capacity would be? Lori Ritter Sure. Again, the legacy liabilities as far as CNNXC’s concern is, we can look at those as currency. So, the amount of those is directly corresponding to the cash flows of which the amount of assets your purchasing with those. So, I think the capability is there. The question is when is the right time and how to effectuate that transaction. Paul Ford Okay. Thanks. Part of your guidance over the next couple years is a return to $5 per ton maintenance CapEx, and you’ve been able to operate well below that, certainly through the downturn. Is it possible to keep operating below that $5 per ton for a significant period of time, or is there some deferred maintenance or some catch-up spending that really gives you visibility that in fact $5 is the right number for next year? Lori Ritter I wouldn’t say there’s catch-up spending in there, but we have adjusted some of our maintenance of equipment, some of our rebuilds and things like that based on our lower run rates that we’ve had the last couple of years. So, we foresee that returning more to a normalized level. Keep in mind, we’ve talked

55
CONSOL Energy, Inc. December 13, 2016 at 8:30 a.m. Eastern
about in the past what’s driving a lot of those numbers is the coarse refuse area that we need to do some spending on as well. Paul Ford Great. Thanks. CONCLUSION Mitesh Thakkar If there are no further questions, I’d like to turn the podium over to the coal management team. We’ll be around if you have any follow-up questions. We can address those. Thank you very much for joining us today for CNNX Coal Resources. Thank you. PRESENTATION M You want to do this? [Audio disruption]. We’re going to start up at 12:30. This is just another reminder, 12:45 shuttles departing for the airport for whatever groups signed up for that. So, five minutes well start CONE’s presentation. Thanks. Steve Milbourne Alright. If you want to make your way to your seats, we’re going to try to get started now, and we appreciate you all coming in, but we want to stay on schedule. With that, Dave Khani is going to kick it off for CONE Midstream Partners. David Khani Good afternoon, everyone. My name is David Khani, and I’m also the CFO of CONE Midstream. John, Lewis, the chairman and CEO of CONE, could not be here today. He actually had some minor surgery yesterday. So, let me run through the agenda. First, I want to discuss three things. I’ll discuss the Noble JV upstream split and the impact to come. Second will be the timing and rationale for the drop, and third, I’m going to connect the dots from the CNNX Analyst Day and really what does it mean to CONE. Steve Milbourne, who is the head of our investor relations, is going to discuss our progress and prospective over the last two years. Joe Fink is going to come up, who is our COO. He will provide a preview of both sponsors’ activity sets, development areas, and turn-lines by DevCo by 2019. Steve Malyuk, head of business development, will give you an update on our third-party business. Last, but not least, will be Everett Good, our head of finance. He will provide you some preliminary forecasts for 2017. First, let me just give you a quick disclaimer. You know we have business risks that are described in our 10-Q and 10-K, and I would advise you to go read them. First, here on slide 5, post-dissolution of the upstream JV, you’ll see that CONSOL operates about 58% of the production, controls about 79% of the DUCs, and that Noble is actually controlling about 54% of the acreage. Now, what does this JV dissolution on the upstream side mean to CONE? First, we think that will allow both sponsors to drill at the pace, and in the end, the activity set is going to be greater apart as opposed to together. We think also that you’ll get greater decision making, and you’ll also get the ability to have longer-term visibility for estimates. Today is a perfect example. CONSOL

56
CONSOL Energy, Inc. December 13, 2016 at 8:30 a.m. Eastern
provided longer-term estimates, and so has CONE. Now, second, I wanted to talk about the drop. We’ve gotten many questions about why did we do a drop when the numbers looked so good. The answer is that we actually were working on the drop earlier this year. The dissolution came up, and then we picked it back up. Then, we finished it off. You can see from a timing standpoint, we had hoped to do a drop this year, and the goal really was to give visibility for 2018 distribution growth, to continue out that 15% growth path and lease the visibility or capacity to do so. So, we wanted to do that while the sponsors were starting to ramp up activity and give everybody comfort that we could continue that distribution growth. Now, last I wanted to connect the dots on what did CONSOL say today, and what does it mean for CONE Midstream? There’s five key points. First is CONSOL is providing two years’ worth of activity set. Second is they’ve raised their type curves about 20% across many of their areas of interest, and as a result be careful to make the judgment of looking at well counts and turn-in lines is a perfect corollary to throughput. Third is they’re increasing their positive views on the dry Utica and stack pays, most of which sits in and around the dry system, so it’s a natural fit to connect into CONE. Joe Fink will actually give you some data and talk about how many wells are located in and around the existing infrastructure. Fourth, CONSOL talked about how much non-core acres they will convert into core. Now, CONE has one of the largest, if not the largest, dedicated acreage area sitting around the CONE system and dedicated acreage overall. As you all know, it really has to be all about core and what’s going to be drilled up. CONSOL talked about 22 years of core drilling inventory running at four rigs. If they convert another 250,000 acres, effectively they’ve doubled the core acres and essentially created almost another whole company underneath the CONE system. Then last, they talked about CONVEY Water System, and that is obviously a nice opportunity that could get dropped down into CONE. So, wrapping this all up, CONSOL talked about the importance of CONE to CONSOL, but also provided a valuation exercise of what they think CONE is worth today net to CONSOL as well as what it’s worth in 2018. So, with that, let me go pass it over to Steve Milbourne, the head of investor relations. Steve Milbourne Good afternoon. Before I start, I just want to spend one second here and recognize and express our appreciation to CONSOL for organizing and hosting today’s events. The IR team and the PR team and the entire CONSOL staff did a great job putting this event together and also setting the stage for what we have to say today. I also want to thank all of you who have taken the time to attend today who are joining us by webcast. Pittsburgh is a great city, but it’s not always easy for travel, and December weather is certainly not one of our attractions. I’m watching the snow fly out the window as we speak here. The third thing I want to do is remind you that we’re going to talk about some projections and forecasts of future business activity today. These forward looks reflect the activity that’s been announced by our sponsors, Noble during their investor day event on November 16th and CONSOL this morning. These forecasts are current best estimates of how the future activity sets announced by the sponsors

57
CONSOL Energy, Inc. December 13, 2016 at 8:30 a.m. Eastern
translates into corresponding activity sets here at CONE. We know sponsors’ activity plans may change, and the numbers that we’re providing today are similarly subject to change in refinement. We anticipate providing more definitive 2017 guidance when we report full-year ’16 results early next year. The purpose of the presentation or this portion of the presentation is to try to give some perspective to help frame our understanding and a discussion of future expectations. Two key takeaways here. First, CONE has turned in a very strong performance track record over the past two years despite an unexpected and difficult environment since our IPO. We have an established history of exceeding expectations. So, the subtext here is that we’re giving a fairly cautious and conservative view. We will talk about some upside opportunities, but most of this afternoon’s discussion and the forecast being presented are centered on the plans that have been laid out by our sponsors. The second takeaway: CONE has high-quality, substantial sponsors, companies long on experience, expertise, and resources. These deeply invested sponsors collectively own almost 70% of CNNX, so they have great incentive to support our success. The equity consideration and the Anchor drop signals sponsors’ positive view of the prospects for CNNX. A CONE investor is investing alongside our sponsors. Turning now to the slides. Activity on our footprint really started over five years ago with the formation of the sponsors’ upstream JV. CONE Midstream was formed at that time to support their E&P activity, and our IPO occurred just over two years ago. This year, on November 16th, we announced and closed our first drop, the remaining 25% interest in the Anchor Systems. On October 31st, the sponsors announced plans to separate their upstream JV, and the deal was closed the first of this month. Dave commented already about how the split for the JV improves our ability to provide forward visibility. Today’s sessions are a tangible demonstration of realizing that expectation. We’re no longer constrained by the one-year horizon of approved JDC budgets. As the IR guy, I like to focus investor attention on what I believe are distinctives that set CONE apart from others. First, the fundamental value of CONE rests on our acreage dedications. We have approximately a half million acreage dedication in the prolific, economically attractive Marcellus shale. There is an incredible amount of gas on our footprint that is going to move through our pipes. Not only have the estimates of the resource in the growth dramatically over the past few years, but he producers’ ability in extracting it have also improved markedly as well. While we do not have a diversified base in exposure, if you’re only going to be in one US gas play, we are in the right one. Importantly for investors, development of this very large position will not be exhausted in a few short years. We expect, and you heard this morning from CONSOL, E&P activity here is a multi-decade proposition. And, there are multiple horizons beyond the Marcellus to be tapped. You heard CONSOL’s comments this morning, and Joe will have more to say about the potential drilling inventory and the multi-horizon development opportunity in a minute. Secondly, our DevCo structure was designed for growth. The combination of organic growth in drop-downs is intended to provide sustained growth. We sometimes refer to the design as providing multiple levers for growth. The recent Anchor Systems drop is a demonstration that the structure is working as designed. Third, our management team is conservative. It’s important for us to have a high degree of confidence in the expectations we set for business performance. The chart in the upper right-hand corner shows we beat the midpoint of our initial 2015 guidance by more than 20%, and we expect to materially outperform
58
CONSOL Energy, Inc. December 13, 2016 at 8:30 a.m. Eastern
initial guidance for this year as well. The table at the bottom of the slide documents our growth, and I think the numbers speak for themselves. We think that these are very good results, particularly given the period’s challenges: a severe down cycle and commodity prices and the pause in drilling activity. Fourth, the CONE board and management team is also conservative in running the business. Everett will have more to say about leverage and coverage, but we believe our more cautious approach positioned CONE very well through this recent energy cycle. Last, I’ve already said a few words about sponsor quality. We benefit from their long experience, deep technical expertise, and substantial resources. I also personally appreciate their total unwavering commitments to safety and environmental responsibility. They, and we at CONE, are guided by best practices, not the mere minimums to meet regulatory compliance. I had several calls following Pennsylvania’s recent enactment of tougher environmental standards for producers and a reactionary industry statement that new laws would substantially raise drilling costs and disadvantage production in the state. It was nice to be able to reassure callers that our sponsors already do almost everything required by the new regulations, and the resulting economic impact of the new regulations on them would be negligible. Looking next to performance, CNNX has provided the best year-to-date total return of all the names in what we believe is our GNP peer group. We recognize that the strong year-to-date performance of CNNX and many other names in the group reflect the weak valuations at the start of the year, so a longer perspective is also informative. Since our IPO, we’ve also substantially outperformed MLPs as a group indicated here by the relative performance of the Alerian Index, and while some for the names in our G&P peer group are not included in the index shown because they went public after we did, we’ve also materially outperformed the average of our G&P peers. Next slide shows a comparative leverage in coverage. When we first started providing this chart, CONE occupied a lonely position in the far upper right of the chart. Distribution cuts and/or improved business prospects at some of the other names have moved some of the other dots to the right. CONE’s leverage, while still best-in-class, has increased modestly following the Anchor Systems drop. But, the bottom line is that our coverage and distribution, our low leverage combined with high coverage continued to be an important CNNX distinctive. The last slide in this set is a post-drop organization chart. In the interest of clarity, this is a somewhat simplified view and omits some intermediate holding companies. But, the takeaway here is that the sponsors collectively own a 69% interest in CNNX. This is a lot more than just a bit of skin in the game. Beyond the respective Appalachian base in E&P operations, the sponsors have a very strong financial interest in the continued growth of CONE Midstream Partners. As I said earlier, CNNX investors are coming in alongside the sponsors who are highly incented in making CONE a success. Next, Joe is going to provide an outlook on organic business activity and capital. Joe Fink Thanks, Steve. Good afternoon. Today, I’ll be reviewing our two-year capital and three-year turn-in-line projections. My goal is to bring to life the detail behind these projects and how they further enhance the value of what we believe to be best-in-class assets in two best-in-class shale plays.

59
CONSOL Energy, Inc. December 13, 2016 at 8:30 a.m. Eastern
Typically, we spend the bulk of our time talking about DevCo 1, and for good reason. It makes up about 80% of our EBITDA. While we’re going to talk about DevCo 1, today we’re going to spend the bulk of our time talking about DevCo 3. Finally, we’ll take a look at how our acreage fits with our existing infrastructure and how much is left to be developed. First, for those of you that are not familiar with our DevCo structure, the map on page 13 shows the location of our DevCo 1 system in green, Washington and Westmoreland Counties, Pennsylvania and Marshall County, West Virginia. Next DevCo 2 in central West Virginia that includes 220,000 acres and spans seven counties. Lastly, DevCo 3, which is everything within the dedicated area that’s not DevCo 1 or DevCo 2. Turning our attention to capital, and keep in mind that these figures do not include third-party or Utica activity so this is very much what we believe to be our base capital view. Our gross capital forecast for 2017 is $82 million with a net to the MLP of $66 million. This compares to approximately $50 million gross and $30 million net in 2016. You’ll also notice a fairly low capital spend in DevCo 3 relative to the number of turn-in-lines. That’s because much of the infrastructure is built and simply waiting for these DUCs to be completed. Dropping down to our 2018 capital projections, we begin to see a shift in spending from DevCo 1 to DevCo 3. That’s not because the number of turn-in-lines in DevCo 1 begins to diminish. In fact, from ’17 on, we see year-over-year growth. It’s really a reflection of DevCo 1 maturing and trending towards more simple, well connections and away from trunk lines and stage and expansion capital. That’s not to say that Utica or third-part or other value-driven expansion projects can’t deflect that trend. Also, there is a jump in 2018 DevCo 3 capital as the existing DUCs are being exhausted and new build-out is required for the growing number of turn-in-lines in 2019. Looking at these systems one by one, and we’ll start with Mamont, the home of the [indiscernible] well, next year CONSOL will be drilling two additional wells on the [indiscernible]. This will require very short pipeline to be built, it connects to a line that bypasses compression within our system. This allows legacy Marcellus wells to continue to produce without being impacted by these new volumes. Jumping over to McQuay and Majorsville’s gathering system, we see continued extensions to new pads and modest system expansions. These include an additional market outlet on Leach Express, additional dehydration at McQuay, and compression to be installed at the junction of North Nineveh and [indiscernible], a line that connects our Majorsville and McQuay systems. This will create a low and high-pressure system in North Nineveh letting older wells enjoy lower pressures and newer wells to continue to flow at current line pressures. I would also like to note one unique aspect of this gathering system: the ability to shift gas from direct cells to Spectra to processing at MarkWest. This past year, as we saw pressure and liquids pricing, gas was shifted to McQuay to avoid processing fees. That trend could certainly reverse, and we could see more gas in this damp region being processed incurring the higher wet gathering rate. This becomes more important as there is significant development remaining in the damp window between Majorsville and McQuay. Moving into DevCo 3 and starting with the airport property, we see an upward trend in turn-in-lines sequentially year-over-year. Next, in the Moundsville field, seven DUCs are scheduled to be turn-in-line. These Marcellus wells are on the same pad as Noble’s Moundsville’s six Utica well and will require very little capital.

60
CONSOL Energy, Inc. December 13, 2016 at 8:30 a.m. Eastern
Looking at the Pennsboro and Shirley, this is the largest facility within DevCo 1 and makes up about 40% of the volume at about $100 million a day. We see the largest number of turn-in-lines with 20 wet DUCs next year. The capital again will be modest as the infrastructure has been built in advance. Finally, our Oxford area, which is comprised of two separate rig gathering systems, a smaller system that connects to Dominion Transmission and a larger nine and a half-mile 20-inch line that transports gas from Oxford to ultimate delivery to MarkWest, Sherwood. This gathering system was sized for growth as it butts up against our 80,000-acre storage field. As I mentioned in the beginning, I wanted to provide a look at the vast potential that remains in our dedicated area. In particular, draw your attention to the number of laterals in close proximity to our existing systems. Like you would expect, these wells will require significantly less capital compared to a greenfield build-out. You’ll note, we’ve reduced our total potential laterals, and this is really because the average well unit has grown from 86 acres to 120, an increase of about 40%. So, while the total well count is down, as you heard clearly this morning, a well today produces significantly more than a well drilled two years ago. In fact, it’s doubled. As a result, our capital has trended down as fewer pipeline miles render greater throughput. Couple this with new life that Utica brings to legacy gathering systems and continued DNC advancements by our sponsors, there’s no question that the downward trend of capital intensity will continue. This slide also details the number of remaining wells. The stated values were calculated by dividing the undeveloped acreage within and beyond one mile of our existing gathering system. The item that stands out to me the most is not so much that we have 3,700 remaining wells, it’s really just how many wells or undeveloped property is in such close proximity to our pipelines. In particular, our most mature system DevCo 1, where we’re just shy of the halfway mark in terms of the wells that are online and the wells that are within the one-mile boundary. Using this same methodology, adjusting only the spacing to 180 acres for the Utica, we wanted to offer you a look at the well counts and what our sponsors consider to be core. Finally, while it’s fantastic to have great potential, it’s even better to be ahead of it. As you can see in our available interconnect capacity, our systems were built for growth. Thank you. With that, I’ll turn it over to Steve for a third-party update. Steve Malyuk Thank you, Joe. The opportunity set for a third-party business has grown since the beginning of 2016 as gas prices have begun to rebound. We have built strategic relationships with the upstream and midstream companies across the basin and have marketed CONE based on our track record as being one of the safest, compliant, customer-focused, gathering service providers in the play. We categorize the opportunities for potential third-party business into three main categories: opportunities that require the expansion of existing infrastructure, opportunities that would result in shared infrastructure, and opportunities that are considered greenfield projects. Each of these categories have varying amounts of incremental volumes, capital spend, probability of success, and ultimately risk. Generally speaking, there are more opportunities and a higher probability of success for projects that can be accommodated through the expansion of existing infrastructure as compared to greenfield projects where there are fewer opportunities and a lower probability of success of landing that particular business. Sharing infrastructure with another midstream provider such as JVing a pipeline or segment of pipeline

61
CONSOL Energy, Inc. December 13, 2016 at 8:30 a.m. Eastern
generally falls somewhere in the middle. Slide 20 is an overview of our DevCo 1 McQuay/Majorsville infrastructure along with upstream acreage control and permitted, non-producing wells in the area. We have also drawn a two and five-mile buffer around our gathering system infrastructure to help facilitate the assessment of various opportunities. This is a technique that we utilize to assess near-term, third-party opportunities, as it would relate to the expansion of existing infrastructures that would typically include a lower number of pads. But, in our minds, these volumes are still very meaningful, and the risk is typically low given the low capital requirements that are generally associated with the expansion of infrastructure. As I mentioned earlier, the opportunity set for third-party business has grown since the beginning for the year, and we wanted to give you a sense of the magnitude as we forecasted today over the 2018 through 2021 time period. We are currently working ten serious opportunities that doesn’t include the occasional call or inquiry that occurs from time to time. Five of these opportunities would be considered to be a high probability of success, three to be medium, and two to be a low probability of occurring. I would caution you that this is just a snapshot in time as we understand it today. The opportunity set is very dynamic, and the development cycle for projects is very long. On a risked annual average basis, over the four-year 2018 through 2021 time period, potential EBITDA and capital spend for the current opportunities are both coincidentally in the $40 million to $50 million per year range. For the five opportunities that we consider as high probability of success for the same four-year period, again on a risked average annual basis, EBITDA ranges from $10 million to $18 million per year, and capital spend average ranges between $10 million and $20 million per year. In short, this third-party potential EBITDA uplift would be considered very impactful to CONE. Thank you. Everett Good Thank you, Steve. We’re going to cover several items within the financial outlook section. We’re going to start with how we evaluate our growth drivers, the implications of the recent Anchor Systems drop-down, and we’re going to conclude with recent financial performance and select 2017 and 2018 estimates under our baseline plan. I’d like to start by reiterating that our overriding business principle at CONE is sustainable distribution growth through disciplined capital investment and a conservative financial profile. This really materializes itself into two key financial targets at CONE, which is keeping leverage under 3 times and maintaining distribution coverage above 1.15 times. We’ll cover how CONE has been able to outperform relative to these metrics on the next slide. Moving down to our growth drivers, we consider the organic build-out and the associated volume growth from our sponsors, Marcellus and Utica activity, to be our core growth capability. We hold this view for a couple of reasons. The gathering on our dedicated acres largely involves connecting incremental pads to our existing trunk lines and centralized compressor station facilities, and the return on incremental capital here is very high since we’re capturing economies of scale on the capital and operating expense side. We view this organize build-out at low capital turns as our preferred growth method as compared to making acquisitions at relatively higher multiples. This investment opportunity set around utilizing existing infrastructure is available to CONE in part due to the sponsors’ half-billion dollar investment in the CONE assets prior to its IPO. On a forward-looking basis, as Joe mentioned, we’ve identified at least 600 of these drilling locations on

62
CONSOL Energy, Inc. December 13, 2016 at 8:30 a.m. Eastern
our dedicated Marcellus acres. We’ve also laid out our supplemental growth drivers, which are drop-downs from our sponsors and third-party projects. Although we classify these as supplemental, we know that they have the potential to be significant to CONE as evidenced by the Anchor Systems drop-down. I’d also note that drop-downs can take the form of acquiring additional equity interest in the DevCos, like our recent Anchor Systems drop-down, or acquiring individual systems carved out from the DevCos. I’d also like to spend some time describing our criteria for drop-downs. We look for the assets to reach an investment and cash flow maturity level to minimize acquisition risk. We want the acquisition to be immediately accretive to our LP unit holders, and we want to ensure that we do not stress our balance sheet. In terms of drop-down timing, we look to extend or raise our distribution growth runway rather than relying on the drop-down for near-term distributions. We also currently classify third-party projects as supplemental since we do not depend on those for our long-term growth prospects, but we still recognize the value potential. I also wanted to spend some time on our Anchor Systems drop-down and what that means for CONE. In 2016, the assets held within the Anchor Systems reached an ideal cash flow profile for acquisition. There were free cash flow positive, and we had a line of sight on customer drilling activity and system expansion projects. What the drop-down allows the MLP to do is capture the organic growth from our sponsors’ activity in the core of the Marcellus along with the upside of the majority of the potential third-party projects. The financial results are an immediate and substantial increase for accretion to our LP unit holders, the visibility to confirm 15% annual distribution growth through at least 2018, all while remaining in the top quartile of leverage among our peers. Moving onto the financial outlook slides, I’d like to start by highlighting that this is a base view for 2017 and only includes baseline sponsor Marcellus activity, meaning it excludes the upside items of third-party projects, Utica wells that are currently undedicated to CONE, drop-downs, and additional prospective capital projects that re under economic review. Looking to adjusted EBITDA, our latest estimate is approximately $110 million in 2016 and $133 million in 2017. This includes approximately a month and a half of drop-down EBITDA in 2016 and a full year in 2017. We’ve also noted our recent actual EBITDA performance compared to the beginning of year guidance that provided in 2015 and 2016 to give you an indication of the conservatism that carries forward our forecasting process. The capital expenditure chart below helps explain two key themes in the CONE story. The first is how CONE has preserved its balance sheet through rapid growth periods, and the second is the efficiency of the capital spend moving forward. You see the large investment in CONE assets prior to the IPO in late 2014. You see the build-up of the drop-down inventory, and the 2016 to 2018 capital spend gives an indication of the concentrated development around our established systems. Twenty-sixteen has been a free cash flow positive year for CONE. We’ve grown net throughput 35% year-over-year with minimal capital spend, we cut our debt in half prior to executing the Anchor drop-down transaction, and we’ve demonstrated the sustainability of CONE’s growth in down commodity and development cycles. Moving to the balance sheet and coverage charts, these are really the output from the items that we just

63
CONSOL Energy, Inc. December 13, 2016 at 8:30 a.m. Eastern
discussed. You’ll note that 2017 leverage captures the full year of drop-down EBITDA, and we’re still comfortably within our target range. Distribution coverage, we’ve provided an estimate of 1.37 times in 2017 at a continued 15% distribution CAGR. For reference, the coverage is 1.29 times at a 20% distribution CAGR. I’d like to close out the finance section by reiterating that the long-term visibility and certainty provided by the upstream sponsor dissolution and our recent Anchor System drop-down provides comfortable line of sight to CONE’s continued long-term distribution growth. With that, I’ll hand it back over to Steve Milbourne to open up for Q&A. Steven Milbourne Thank you, Everett. Okay, we’re going to go to Q&A now. We have people with mics, and since we are being webcast, we would like to make sure that you have the mic when you ask the question, and we’ll give our panel here a second to get in place. Then, we’ll start with the Q&A. QUESTIONS AND ANSWERS Theresa Choke Hi, Theresa Choke [ph] from Barclays. Question on the potential drop-down of the water asset. Just to put some context around it, can you help us think about what that asset might look like at the MLP level in terms of cash flow stability? Would it be, for example, 100% fee-based, or would the buy/resell portion of the business still exist there? Will it still have the volumetric exposure, or would the volumetric exposure be more insulated at the parent level? David Khani It’s a good question. I think I want to hire you to be my negotiator. I think you’ll just have to stay tuned. I think it’ll be a negotiation process. It’ll have some volumetric aspect to it, but I think before we would disclose, I think we just need to work through the mechanics. Water has been a big part of the hidden growth story within CONE, and we spent the last year and a half putting away those assets from our coal side of our business to be able to isolate them to actually start to give you the first look of what CONVEY looks like. So, I think you’ll just have to stay tuned. Theresa Choke Got it, and I’m asking in the context of the range provided that 9 to 12 times multiple range. Just thinking in terms of the disparity there, can I assume that if it were to be more at the higher end of the range that the cash flows would be of higher quality, or is that range just a market-dependent multiple? David Khani The way we do drops, we’ll look at the long-term cash flow stream, and we’ll discount it back to come up with a valuation. The multiple is only just really a byproduct of that calculation, so if the cash flow stream is actually growing and it is more secure, that would lend itself effectively to a higher valuation and hence a higher one-year multiple. Theresa Choke Got it. In terms of timing and just order of priorities, are you more inclined to do this first versus additional interests of the other DevCos or the other way around? David Khani

64
CONSOL Energy, Inc. December 13, 2016 at 8:30 a.m. Eastern
I think if you look at our drop-down list right now, you’d put water as well as DevCo 3 drops next to each other, but it will also compete with third-party business and other sponsor capital opportunities. So, we’ll put them all together. We have certain balance sheet that we can fund certain things, and we’ll make sure they all compete and generate at least a mid-teens rate of return. Theresa Choke Thank you very much. David Khani You’re welcome. M Thank you. I have a question on slide 17. Just that top table there. Are those wells solely Noble and the CONSOL wells? Joe Fink That’s correct. M Okay. Then, how about the second table. Joe Fink So, that is primarily CONSOL’s with a small spillover of Noble, which has Utica control in the Moundsville field. M Got you. Any kind of estimate for third-party wells in the area that potentially could go into your system? Steve Malyuk Well, I believe on slide 20, again this is our Anchor/McQuay/Majorsville infrastructure that is built, shown in green, and the red dots are permanent non-producing wells. So, those are wells that we typically go after. In certain situations, some of those are already dedicated to another midstream provider, and in other cases they are not. But, this is just one technique that we use to look at opportunities very near our existing infrastructure where the probability of success on getting that business is typically high, and again the risk is typically low because of very little capital requirements to get it connected into our system. M Okay, so if I look at the number of red dots on that slide 20, it’s much less than the numbers I’m seeing in the tables on slide 17. Joe Fink So, those are pads. There could be as many as a dozen laterals on each one of those dots. M Okay. Overwhelmingly the potential is with Nobel and CONSOL. Steve Milbourne I think we have to be careful not to confuse permanent wells with opportunities because as you look at the map, you can see where our green existing lines transit acreage controlled by others, and while there aren’t any other permanent wells on those positions at this point, that may be development in the future. So, when you look at the number of wells that we provided or well sites that we’re talking about for
65
CONSOL Energy, Inc. December 13, 2016 at 8:30 a.m. Eastern
sponsor-controlled acreage, and you see the significant numbers there, that’s just sponsor. We have a lot of places where we’re exposed to other acreage positions that can be developed. So, it’s more than just the orange dots. We’re also exposed to acreage over and above that where there’s opportunity. David Khani Again, this is DevCo 1. We have DevCo 2 and DevCo 3, and there’s other acreage beyond that. M Got it. Could you repeat that second table on slide 17? It’s overwhelmingly— David Khani It’s 100% sponsor. M Right, but it’s more CONSOL-weighted than Noble-weighted? Joe Fink That’s correct. M Okay. Got you. Thank you. Perneeth Hi. Perneeth [ph], Wells Fargo. Just a quick question on the guidance on page 23. So, I’m just trying to reconcile here if you look at the adjusted EBITDA on a holistic basis, it’s basically flat year-over-year, ’16 to ’17, and recognizing that CONSOL is growing gas production by around 8% in ’17. Is that conservatism? Is that on the Noble side where there’s some weakness? Just put some takes behind that. David Khani If you look at Noble’s projections, they actually have within the Marcellus declining production, even when you adjust for the re-cutting of production. So, ’17 absorbs some of Noble’s decline in the Marcellus, and then CONSOL with its 5%, that’s an overall production mix. If you think about Marcellus, Utica is growing probably faster. CBM Conventional has actually been declining, so the overall mix is probably growing, and factor that in there. What’s not in these calculations is dry Utica, and remember a dry Utica well could be three times the average Marcellus well. Steven Milbourne Okay, David. David I wanted to follow up on the water side. When we think about modelling the water business, should we assume that the volumes on the frack water side are the same as the volumes on the water takeaway side first? David Khani That’s a good question. I think you need to have Marshall here to answer that question. We’ll have Tyler or Steve Milbourne provide access to Marshall, and we’ll be able to provide more information.
66
CONSOL Energy, Inc. December 13, 2016 at 8:30 a.m. Eastern
David Okay. Then, when you consider an acquisition or an asset that’s getting dropped to you like this water business, what discount rate would you assume when you discount your cash flows back? David Khani We generally will use our cost to capital at CONE, and that cost to capital varies over time periods. It depends on where we are in that GP split. Right now we’re very early on in the GP split, so I’m not going to give you the exact number, but just know that we will ratchet it up over time to account for the capital structure that we have and where we are in the GP split. David Alright. Thanks, Dave. Steve Milbourne The other thing I would add to that is that the discount rate or the expected return on any project that we undertake is going to look at the specific risks and the stability of the cash flows that are generated from the project that we’re undertaking. So, obviously, let’s consider doing a pad connection for an investment-grade E&P company, obviously the anticipated return from a project like that where you’re piggybacking off an existing infrastructure, the amount invested is low, and the quality of the customer is very high, the discount rate for a project like that is going to be very different from a more speculative project for a less creditworthy customer. So, we look at all of those metrics in trying to decide how we price projects or pay for opportunities. Lane French This is Lane French from Baird here. On the water business side, would you guys be anticipating a full 100% drop-down of the water business to CONE or would it be in potentially 25% increments there? David Khani I think we’ll be very flexible. What we see from both sides, it’ll be an arm’s length transaction. How much we want to do and how much we can afford and what it does to our profile in conjunction with everything else that we’re doing. Lane French Great. Then, looking at your balance sheet, you guys have a $250 million credit facility there, so with the potential for drop-downs on both the gathering side and the water side, are you guys looking to issue any potential long return debt or potentially upsizing your credit facility with the banks? Any thoughts around that would be great. David Khani We’ll probably expand our revolver. That’ll be one of the first things we do, and then we’ll look and think about the other alternatives if we want to term out our debt or anything else depending upon third-party business and/or the drops, but we’ll make sure that we keep our balance sheet with good liquidity and good leverage ratio to be able to handle anything out the next two to three years. Lane French Okay. Then, lastly here, there’s been some other companies that are in the gathering business here in the Marcellus that have expressed interest to possibly expand into processing and/or fractionation here. So, is that something that you guys are interested in seeing on the CONE side potentially in 2018? Any thoughts around that would be great as well. David Khani

67
CONSOL Energy, Inc. December 13, 2016 at 8:30 a.m. Eastern
We do very low processing, and Joe, you can talk a little bit about what we do. As far as getting into big fractionation, that’s right now beyond our skill set. It doesn’t mean we can’t get there, but I think for our body right now today, it’s probably not in the near term. Joe Fink I think, as I mentioned in my talk, we have a unique gathering system in DevCo 1 where we can arbitrage between wet and dry systems. As it relates to third parties, it’s important. In a lot of cases you either sign on for dry or you sign on for wet, but we recognize that there is a value gap that potentially CONE can take advantage of. Lane French One last one, if I could. So, you expect 35 wells to be turned-in-line on DevCo 3 in 2017, and you guys have spoken that you want to derisk the volumes before you potentially drop them into CNNX here. So, would that 35 wells total be enough from a derisking standpoint to potentially drop a part of that gas system in 2017, or is that more of a 2018, 2019 item? David Khani I think the areas in where they’re drilling, the reservoir probably is already going to be derisked, and I think what we’re really talking about is spending capital way in advance of actually seeing the cash flow, so I think DevCo 3 has been building up now, and we’re seeing a good path for it to build up more. So, there will not be much of a disconnect between spending capital and getting cash flow, so it’ll be a good candidate in the next year or two for a drop. Brian Brungardt Brian Brungardt from Stiefel. As you guys talk about the water business, what’s the projected EBITDA for 2016 here? David Khani We did not give a projection for ’16. I would just say 2016 was a lot of pulling out the assets, assigning the costs and volumes to it, so it would be less because the volumes were probably less. The third party was less, but I don’t have a number to say if we were to take the same rates and just apply it to ’16, this is what the number would be. So, ’17 really was a lot of activity to sort of account for it and put a rate on it. Now, we’re giving it to you for the first time. Brian Brungardt Got you. Then, just ballpark, can you provide some color as far as what that mix of EBITDA is as far as freshwater delivery? What’s that mix that you’re thinking of? David Khani That was a question that was asked earlier to Marshall, and I think we’ll have to just do some follow-up questions to Marshall. Brian Brungardt Okay. Then lastly, you guys have talked about the potential from CNNX coring up acreage. Is that already dedicated to the partnership, or is there incremental costs that would be associated to that dedication? David Khani As far as coring up? No, a lot of that acreage is already dedicated. There is an additional 200,000 acres

68
CONSOL Energy, Inc. December 13, 2016 at 8:30 a.m. Eastern
that are right at first offer that could be dedicated, so some of that might be part of that coring up, but probably the majority of it sits within the dedication. Brian Brungardt That’s all I have. Thank you. David Khani You’re welcome. Steve Milbourne Okay, are there any other questions? M [Audio disruption], Bank of America. Can you just remind me just as you do drops from CONSOL or down to the midstream business, how does Noble play into that? Do they have an option to provide equity if they want to to increase their ownership? How does that play out? What I’m really getting at is it seems like you could potentially contribute more value than them. Do they have an obligation to do anything? What are their rights? David Khani Noble also has a water business, so it could very simply be that we co-drop in together, and we both would reap the same benefits and avoid the one’s getting a benefit while the other isn’t. Noble and CONSOL each own DevCos 2 and 3 at the same proportion as well, so if we were to do a drop, again, both sponsors would get the benefit. M Is there an actual agreement or more just an understanding? David Khani Well, with the water and with DevCos 2 and 3, it is a straight ownership. M Thank you. David Khani You’re welcome. Steve Milbourne Okay, we have another question. David. David Is Noble’s water business included in that $50 million of EBITDA estimate, and if not, how much do you think or how big do you think it is? David Khani That is not included in the numbers. They effectively have been building up water side-by-side, so that number would get materially bigger. David
69
CONSOL Energy, Inc. December 13, 2016 at 8:30 a.m. Eastern
Thanks. David Khani You’re welcome. CONCLUSION Steve Milbourne One last shot here, and we need to wind down. Okay. Alright, I don’t see any other questions. I want to express my appreciation to all of you for coming today and to those of you that have joined by webcast, we appreciate the time that you’ve spent, and we hope that you’ve gotten a good vision. Certainly after hearing what CONSOL had to say this morning, I think there’s a lot of optimism about the space and the opportunity set, and we’re anxious to see how we move forward through time here. So, thanks for coming, and stay tuned. M Hi, Theresa. I’m glad to meet you in person. Theresa Choke Thank you. I’m so very happy to meet you. M Glad you could make it.


![Idc Storage Consol[1]](https://img.pdfslide.us/doc/110x75/577d35b51a28ab3a6b9130f5/idc-storage-consol1.jpg)