Embed Size (px)
Citation preview
Brit. J. industr. Med., 1956, 13, 131.
CONSISTENCY AND CAR DRIVING SKILLBY
R. E. F. LEWISFrom the Medical Research Council, Applied Psychology Research Unit, Cambridge
(RECEIVED FOR PUBLICATION JULY 29, 1955)
It seems likely that when a man is learning a newskill he tends to correct for mistakes by going toofar in the opposite direction. Lashley (1951)mentions for example that after an inexperiencedtypist has made an error he may even over-com-pensate to the extent of repeating the letter previouslyomitted. The learner proceeds by a series of oscilla-tions about the ideal which may itself vary with theindividual when skilled manual behaviour is underconsideration. Improvement in skill may be accom-panied by a reduction in the size of these oscilla-tions. For instance, in learning to ride a bicycle,the wild wobble is gradually replaced by almostinvisible movements. Bartlett (1951) has remarkedthat " notable irregularities in a pattern of controlmovements are the surest sign of awkwardnessin skill ". Again, with reference to the skilledoperator, " What is impressive is the absence of anyappearance of hurry. There is no jerkiness or snatch-ing, no obvious racing to catch up in one part andforced sauntering to make up in another " (Bartlett,1947).Ashby (1952) has shown how a homeostatic
machine when disturbed will oscillate in decreasingrhythms until it has established a new equilibriumwith the stimulus, when its response will be minimal;"; under constant stimulation the response hasdiminished ". It is probable that there are someresemblances between the mechanisms of the humanlearning process and such machines.
If we can examine the performance of skilled andunskilled people on a given task the most noticeabledifference might be that the skilled performanceis sufficiently regular to be reproduced on anotheroccasion provided that extraneous random factorscan be kept at a minimum. When dealing with anactivity such as driving a car, it is difficult to obtainany absolute criterion of errors, but any lack ofconsistency within the work from a given man canbe directly studied. The following experimentsconsider the performance of groups of drivers,classified as skilled or unskilled, during a standard
driving task. This involved taking corners in theabsence of any other traffic. Records were keptof the performance of these 30 men over the courseon two different occasions separated by six weeks.Particular attention was paid to the accelerationrecords. While there can be no ideal method oftaking such a course, it seems likely that the skilleddriver will have a pattern of behaviour for a givensituation which experience has taught him is the best.Thus the skilled driver may show a smoother curveof acceleration and deceleration and a furtherattempt may lead to a pattern of activity whichresembles the previous curve.
Procedure
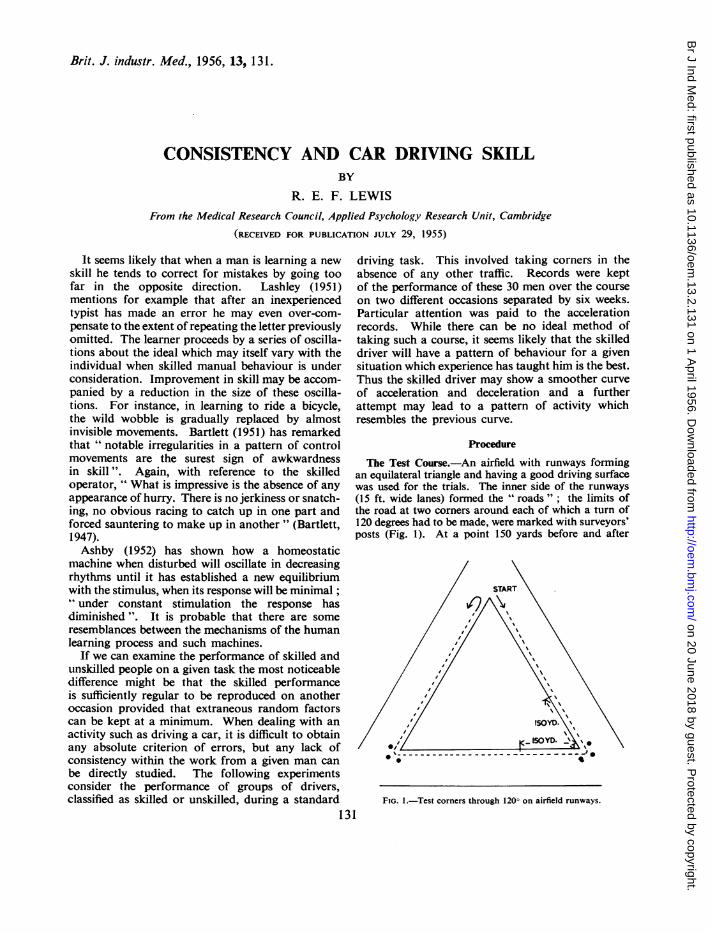
The Test Course.-An airfield with runways formingan equilateral triangle and having a good driving surfacewas used for the trials. The inner side of the runways(15 ft. wide lanes) formed the " roads "; the limits ofthe road at two corners around each of which a turn of120 degrees had to be made, were marked with surveyors'posts (Fig. 1). At a point 150 yards before and after
FIG. 1.-Test corners through 1200 on airfield runways.
131
on 20 June 2018 by guest. Protected by copyright.
http://oem.bm
j.com/
Br J Ind M
ed: first published as 10.1136/oem.13.2.131 on 1 A
pril 1956. Dow
nloaded from
BRITISH JOURNAL OF INDUSTRIAL MEDICINEeach corner a mark, recognizable by the passing observer,was painted on the runway edge.Apparatus.-The experimental car was a series E, 1947
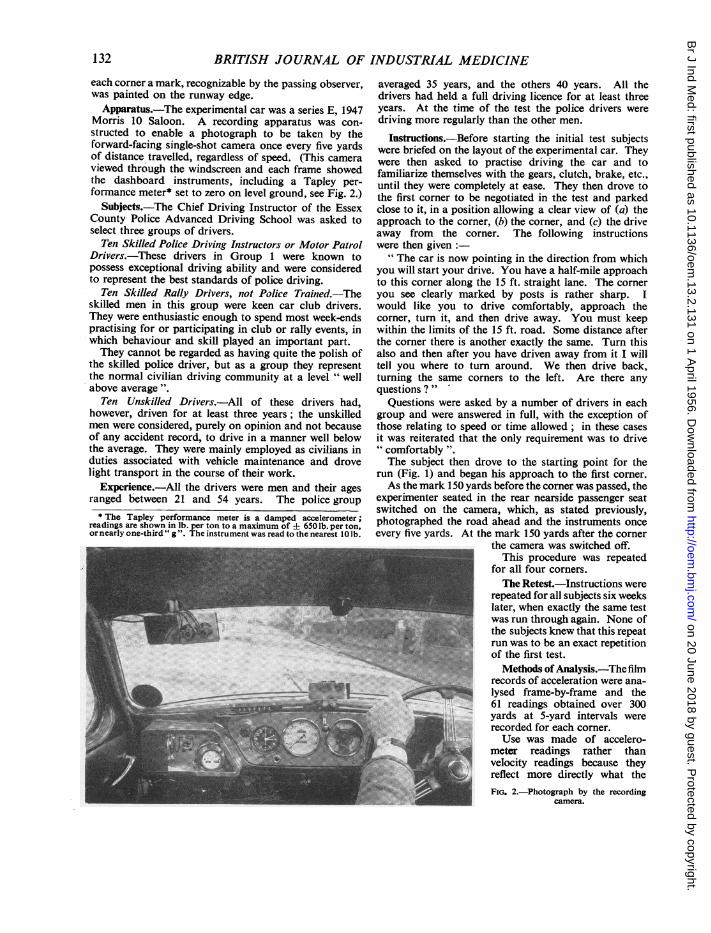
Morris 10 Saloon. A recording apparatus was con-structed to enable a photograph to be taken by theforward-facing single-shot camera once every five yardsof distance travelled, regardless of speed. (This cameraviewed through the windscreen and each frame showedthe dashboard instruments, including a Tapley per-formance meter* set to zero on level ground, see Fig. 2.)Subjects.-The Chief Driving Instructor of the Essex
County Police Advanced Driving School was asked toselect three groups of drivers.
Ten Skilled Police Driving Instructors or Motor PatrolDrivers.-These drivers in Group 1 were known topossess exceptional driving ability and were consideredto represent the best standards of police driving.
Ten Skilled Rally Drivers, not Police Trained.-Theskilled men in this group were keen car club drivers.They were enthusiastic enough to spend most week-endspractising for or participating in club or rally events, inwhich behaviour and skill played an important part.They cannot be regarded as having quite the polish of
the skilled police driver, but as a group they representthe normal civilian driving community at a level " wellabove average".
Ten Unskilled Drivers.-All of these drivers had,however, driven for at least three years; the unskilledmen were considered, purely on opinion and not becauseof any accident record, to drive in a manner well belowthe average. They were mainly employed as civilians induties associated with vehicle maintenance and drovelight transport in the course of their work.
Experience.-All the drivers were men and their agesranged between 21 and 54 years. The police group
* The Tapley performance meter is a damped accelerometer;readings are shown in lb. per ton to a maximum of ± 650 lb. per ton,or nearly one-third " g ". The instrument was read to the nearest 10 lb.
averaged 35 years, and the others 40 years. All thedrivers had held a full driving licence for at least threeyears. At the time of the test the police drivers weredriving more regularly than the other men.
Instructions.-Before starting the initial test subjectswere briefed on the layout of the experimental car. Theywere then asked to practise driving the car and tofamiliarize themselves with the gears, clutch, brake, etc.,until they were completely at ease. They then drove tothe first corner to be negotiated in the test and parkedclose to it, in a position allowing a clear view of (a) theapproach to the corner, (b) the corner, and (c) the driveaway from the corner. The following instructionswere then given:
" The car is now pointing in the direction from whichyou will start your drive. You have a half-mile approachto this corner along the 15 ft. straight lane. The corneryou see clearly marked by posts is rather sharp. Iwould like you to drive comfortably, approach thecorner, turn it, and then drive away. You must keepwithin the limits of the 15 ft. road. Some distance afterthe corner there is another exactly the same. Turn thisalso and then after you have driven away from it I willtell you where to tum around. We then drive back,turning the same corners to the left. Are there anyquestions ? "
Questions were asked by a number of drivers in eachgroup and were answered in full, with the exception ofthose relating to speed or time allowed; in these casesit was reiterated that the only requirement was to drive"comfortablyThe subject then drove to the starting point for the
run (Fig. 1) and began his approach to the first comer.As the mark 150 yards before the corner was passed, the
experimenter seated in the rear nearside passenger seatswitched on the camera, which, as stated previously,photographed the road ahead and the instruments onceevery five yards. At the mark 150 yards after the corner
the camera was switched off.This procedure was repeated
for all four corners.The Retest.-Instructions were
repeated for all subjects six weekslater, when exactly the same testwasrun through again. None ofthe subjects knew that this repeatrun was to be an exact repetition
X . | |Nofthe first test.Methods ofAnalysis.-Thefilm
records of acceleration were ana-lysed frame-by-frame and the61 readings obtained over 300yards at 5-yard intervals wererecorded for each corner.Use was made of accelero-
meter readings rather thanvelocity readings because theyreflect more directly what theFIG. 2.-Photograph by the recording
camera.
132
on 20 June 2018 by guest. Protected by copyright.
http://oem.bm
j.com/
Br J Ind M
ed: first published as 10.1136/oem.13.2.131 on 1 A
pril 1956. Dow
nloaded from
CONSISTENCY AND CAR DRIVING SKILL
subject is doing with the controls, which are accelera-tion controls rather than direct velocity controls.Therefore these acceleration readings have been adoptedalthough at first sight it might seem that they could havebeen calculated from the simple velocity-time record.For each subject it was possible to plot a performance
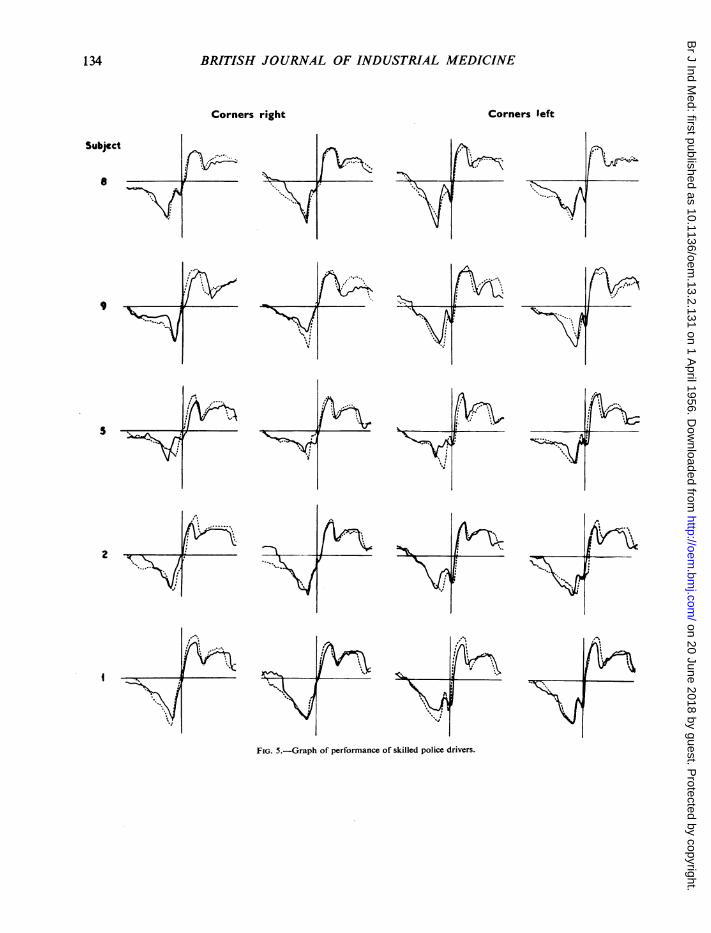
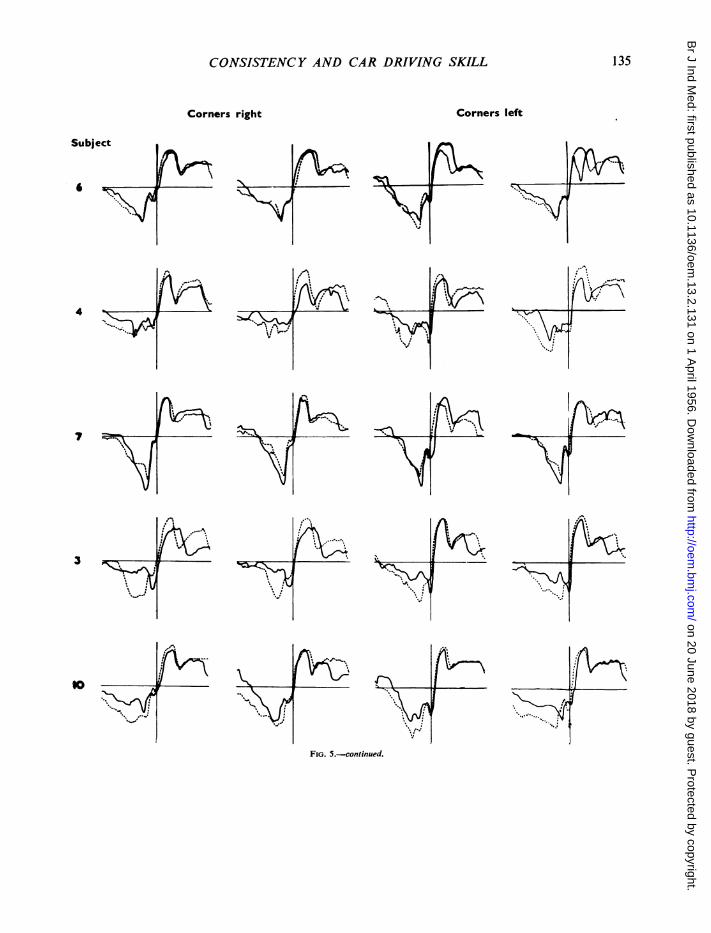
graph for each of four corners for the first occasion ofthe test; over this was superimposed the perfonnancegraph for the same corner negotiated six weeks later(Fig. 3).The area difference between these curves was obtained
by calculating the sum of the differences between corre-
sponding "5-yard" acceleration scores for the test andretest curves. This sum was taken as the index of lackof consistency. Separate tctals were calculated for theapproach half and departure half of each corner. Inthis way eight inconsistency scores over the six-weekperiod were calculated for each subject. Same-dayinconsistency scores were also obtained for both thetest and the retest days by comparing the two con-
secutive curves for the right hand corners and the twoconsecutive curves for the left hand corners.
ResultsConsistency with the Six-Week Interval.-The
performance graphs of all trials made in the course
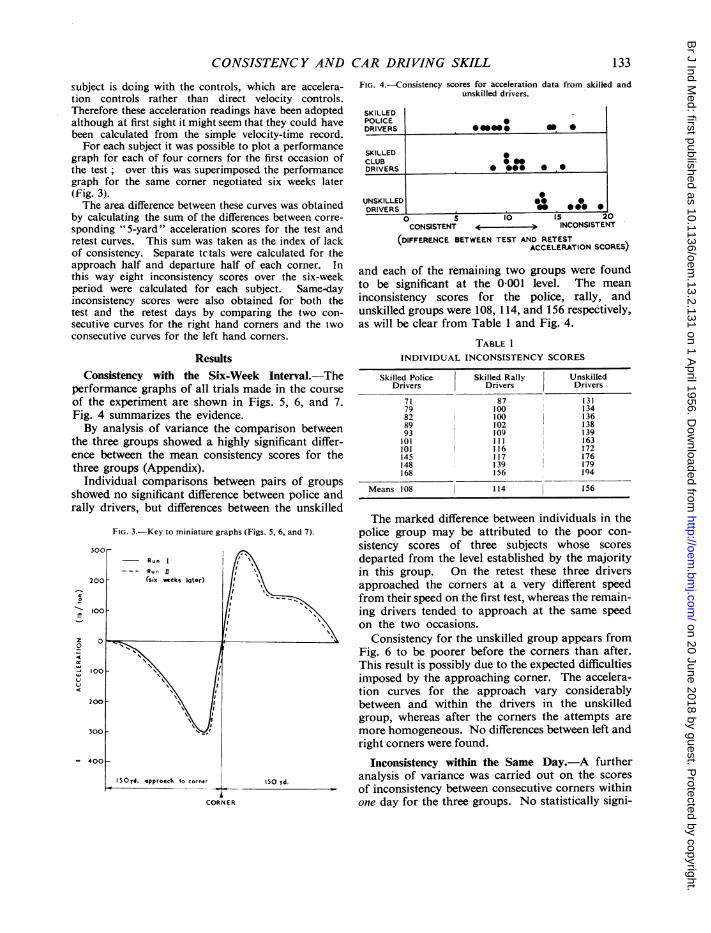
of the experiment are shown in Figs. 5, 6, and 7.Fig. 4 summarizes the evidence.By analysis of variance the comparison between
the three groups showed a highly significant differ-ence between the mean consistency scores for thethree groups (Appendix).
Individual comparisons between pairs of groups
showed no significant difference between police andrally drivers, but differences between the unskilled
FIG. 3.-Key to miniature graphs (Figs. 5, 6, and 7).
30cr
200k
c2
or
ul
o
Run I--- Run 1I
(sx weeks later)
100[
200O
300 F
I
- 400k
SOyd. approach to corner 150 yd.
CORNER
FIG. 4-Consistency scores for acceleration data from skilled andunskilled drivers.
SKILLEDPOLICE iDRIVERS *
SKILLEDCLUBDRIVERS S*-- * .
UNSKILLED @* SDRIVERS . . **
0 S to IS 20CONSISTENT 3 INCONSISTENT
(DIFFERENCE BETWEEN TEST AND RETESTACCELERATION SCORES)
and each of the remaining two groups were foundto be significant at the 0-001 level. The meaninconsistency scores for the police, rally, andunskilled groups were 108, 114, and 156 respectively,as will be clear from Table 1 and Fig. 4.
TABLE 1INDIVIDUAL INCONSISTENCY SCORES
Skilled Police Skilled Rally UnskilledDrivers Drivers Drivers
71 87 13179 100 13482 100 13689 102 13893 109 139101 111 163101 116 I 172145 117 176148 139 179168 156 194
Means 108 114 1 56
The marked difference between individuals in thepolice group may be attributed to the poor con-sistency scores of three subjects whose scoresdeparted from the level established by the majorityin this group. On the retest these three driversapproached the corners at a very different speedfrom their speed on the first test, whereas the remain-ing drivers tended to approach at the same speedon the two occasions.
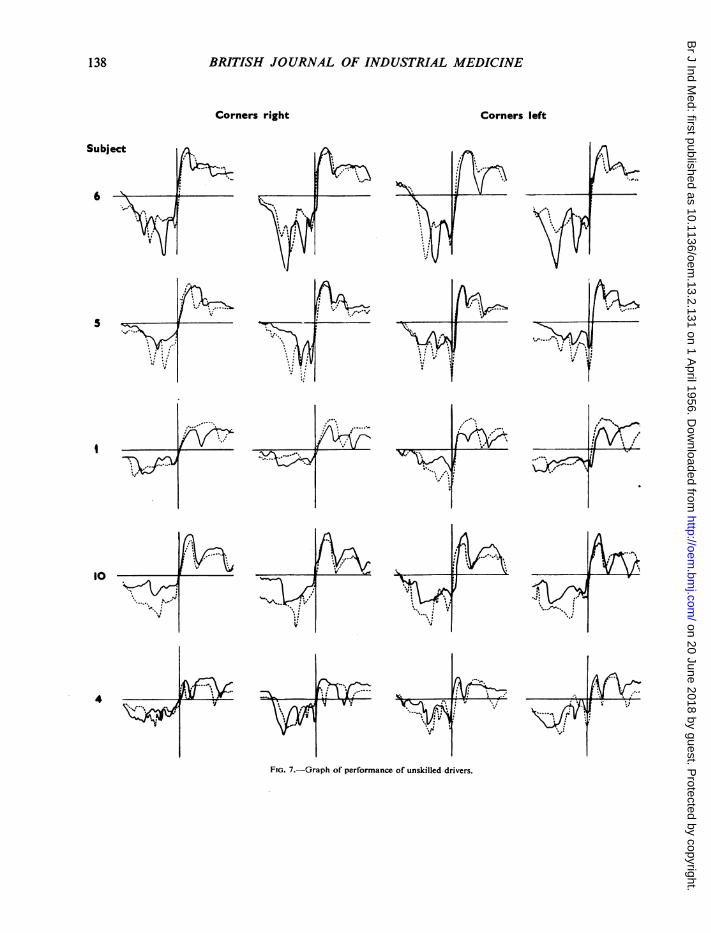
Consistency for the unskilled group appears fromFig. 6 to be poorer before the corners than after.This result is possibly due to the expected difficultiesimposed by the approaching corner. The accelera-tion curves for the approach vary considerablybetween and within the drivers in the unskilledgroup, whereas after the corners the attempts aremore homogeneous. No differences between left andright corners were found.
Inconsistency within the Same Day.-A furtheranalysis of variance was carried out on the scoresof inconsistency between consecutive corners withinone day for the three groups. No statistically signi-
133
I
II
on 20 June 2018 by guest. Protected by copyright.
http://oem.bm
j.com/
Br J Ind M
ed: first published as 10.1136/oem.13.2.131 on 1 A
pril 1956. Dow
nloaded from
BRITISH JOURNAL OF INDUSTRIAL MEDICINE
Corners right
x1f
Corners left
FIG. 5.-Graph of performance of skilled police drivers.
Subject
a
S
2
mb,AC I
134
I
f.e
on 20 June 2018 by guest. Protected by copyright.
http://oem.bm
j.com/
Br J Ind M
ed: first published as 10.1136/oem.13.2.131 on 1 A
pril 1956. Dow
nloaded from
CONSISTENCY AND CAR DRIVING SKILL
Corners right
OW.1%
rl-.l1. ; iI'VI
Corners left
fYc^e
':,
1.
'.fI
FIG. 5.-continued.
Subject
in>.'...
4
7
3
135
I
IL-
I
1.1.
on 20 June 2018 by guest. Protected by copyright.
http://oem.bm
j.com/
Br J Ind M
ed: first published as 10.1136/oem.13.2.131 on 1 A
pril 1956. Dow
nloaded from
BRITISH JOURNAL OF INDUSTRIAL MEDICINE
Corners right
1
pm
Corners left
:V%~.
(N-
n92YVe
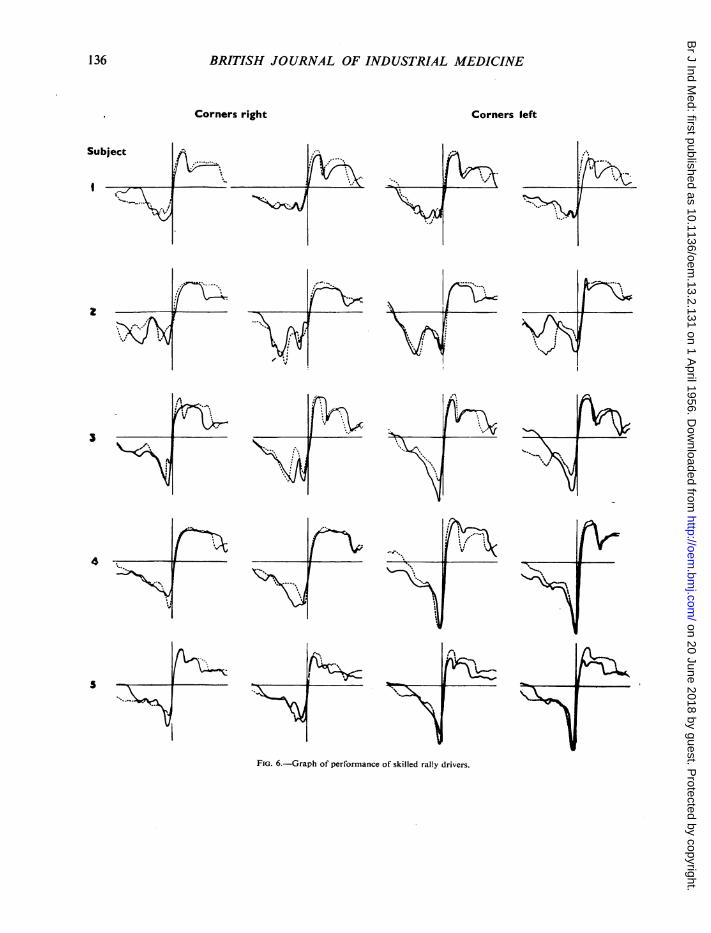
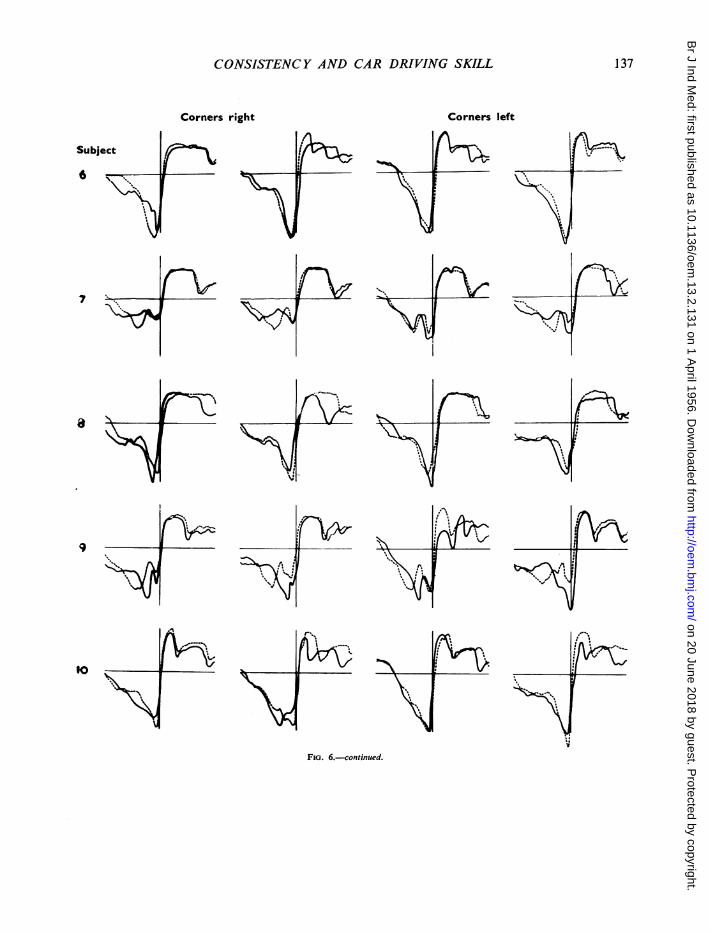
FIG. 6.-Graph of performance of skilled rally drivers.
Subject
IIII_.v
z
4
5
rvy
136
I
aJI..
2
on 20 June 2018 by guest. Protected by copyright.
http://oem.bm
j.com/
Br J Ind M
ed: first published as 10.1136/oem.13.2.131 on 1 A
pril 1956. Dow
nloaded from
CONSISTENCY AND CAR DRIVING SKILL 137
Corners right Corners left
Subject i:
toet~~~~~~~~~~~~~~~~~. 1
FIG. 6.-continued.
on 20 June 2018 by guest. Protected by copyright.
http://oem.bm
j.com/
Br J Ind M
ed: first published as 10.1136/oem.13.2.131 on 1 A
pril 1956. Dow
nloaded from
BRITISH JOURNAL OF INDUSTRIAL MEDICINE
Corners right
p4XA- -
v.
Corners left
JI
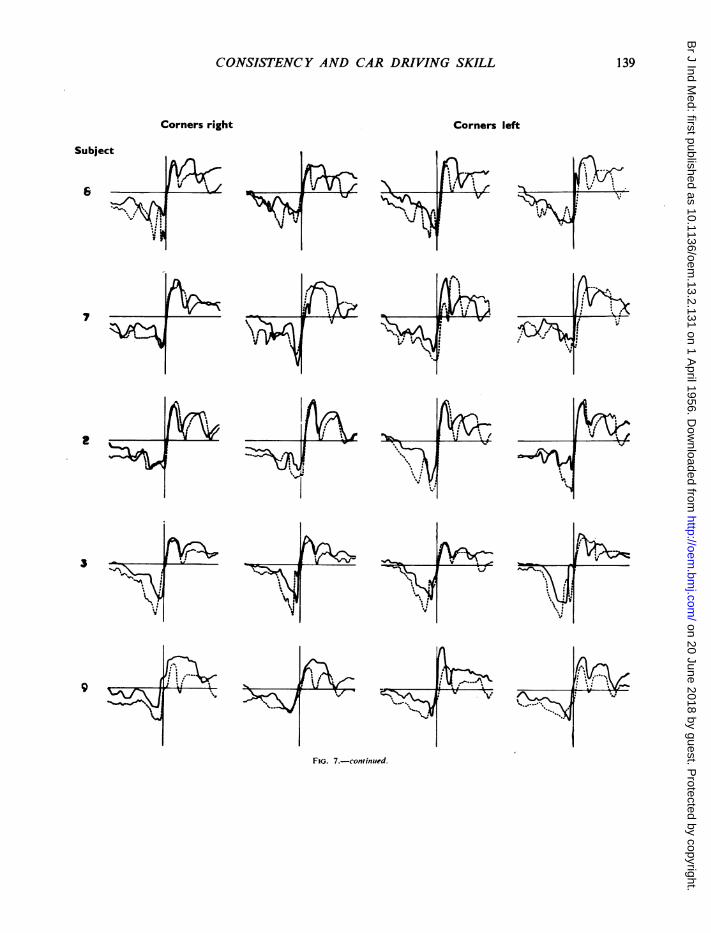
FIG. 7.-Graph of performance of unskilled drivers.
Subject
5 -
I
I0
4
xr
.....
11-1-I.-.1.V
to-.-I
\-j %/
f-IllI
I..
la
S.. . z
138
.......
on 20 June 2018 by guest. Protected by copyright.
http://oem.bm
j.com/
Br J Ind M
ed: first published as 10.1136/oem.13.2.131 on 1 A
pril 1956. Dow
nloaded from
CONSISTENCY AND CAR DRIVING SKILL
Corners right Corners left
N
t.
jl
r\
FIG. 7.-continued.
Subject
- - t~~~~~~~~-0
I
~4 I
'I
I fc P%- I. --I
6
7
2
3
9
l.4
.0 I . .1
*F
139
1.4
j
on 20 June 2018 by guest. Protected by copyright.
http://oem.bm
j.com/
Br J Ind M
ed: first published as 10.1136/oem.13.2.131 on 1 A
pril 1956. Dow
nloaded from
BRITISH JOURNAL OF INDUSTRIAL MEDICINE
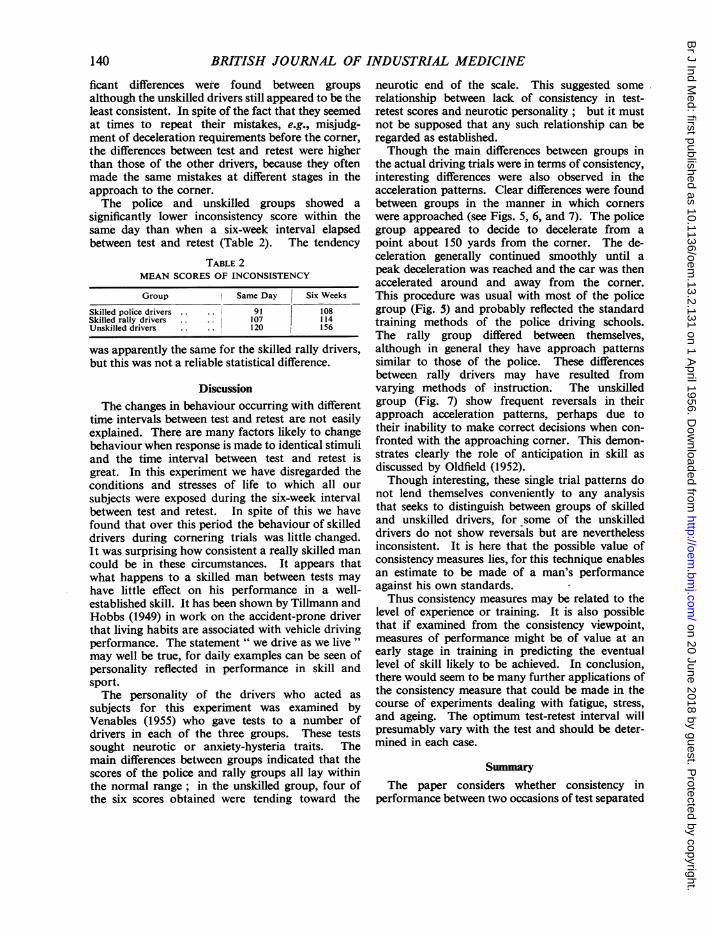
ficant differences were found between groupsalthough the unskilled drivers still appeared to be theleast consistent. In spite of the fact that they seemedat times to repeat their mistakes, e.g., misjudg-ment of deceleration requirements before the corner,the differences between test and retest were higherthan those of the other drivers, because they oftenmade the same mistakes at different stages in theapproach to the corner.The police and unskilled groups showed a
significantly lower inconsistency score within thesame day than when a six-week interval elapsedbetween test and retest (Table 2). The tendency
TABLE 2MEAN SCORES OF INCONSISTENCY
Group Same Day Six Weeks
Skilled police drivers 91 108Skilled rally drivers 107 114Unskilled drivers 120 156
was apparently the same for the skilled rally drivers,but this was not a reliable statistical difference.
DiscussionThe changes in behaviour occurring with different
time intervals between test and retest are not easilyexplained. There are many factors likely to changebehaviour when response is made to identical stimuliand the time interval between test and retest isgreat. In this experiment we have disregarded theconditions and stresses of life to which all oursubjects were exposed during the six-week intervalbetween test and retest. In spite of this we havefound that over this period the behaviour of skilleddrivers during cornering trials was little changed.It was surprising how consistent a really skilled mancould be in these circumstances. It appears thatwhat happens to a skilled man between tests mayhave little effect on his performance in a well-established skill. It has been shown by Tillmann andHobbs (1949) in work on the accident-prone driverthat living habits are associated with vehicle drivingperformance. The statement " we drive as we live "may well be true, for daily examples can be seen ofpersonality reflected in performance in skill andsport.The personality of the drivers who acted as
subjects for this experiment was examined byVenables (1955) who gave tests to a number ofdrivers in each of the three groups. These testssought neurotic or anxiety-hysteria traits. Themain differences between groups indicated that thescores of the police and rally groups all lay withinthe normal range; in the unskilled group, four ofthe six scores obtained were tending toward the
neurotic end of the scale. This suggested somerelationship between lack of consistency in test-retest scores and neurotic personality; but it mustnot be supposed that any such relationship can beregarded as established.Though the main differences between groups in
the actual driving trials were in terms of consistency,interesting differences were also observed in theacceleration patterns. Clear differences were foundbetween groups in the manner in which cornerswere approached (see Figs. 5, 6, and 7). The policegroup appeared to decide to decelerate from apoint about 150 yards from the corner. The de-celeration generally continued smoothly until apeak deceleration was reached and the car was thenaccelerated around and away from the corner.This procedure was usual with most of the policegroup (Fig. 5) and probably reflected the standardtraining methods of the police driving schools.The rally group differed between themselves,although in general they have approach patternssimilar to those of the police. These differencesbetween rally drivers may have resulted fromvarying methods of instruction. The unskilledgroup (Fig. 7) show frequent reversals in theirapproach acceleration patterns, perhaps due totheir inability to make correct decisions when con-fronted with the approaching corner. This demon-strates clearly the role of anticipation in skill asdiscussed by Oldfield (1952).Though interesting, these single trial patterns do
not lend themselves conveniently to any analysisthat seeks to distinguish between groups of skilledand unskilled drivers, for some of the unskilleddrivers do not show reversals but are neverthelessinconsistent. It is here that the possible value ofconsistency measures lies, for this technique enablesan estimate to be made of a man's performanceagainst his own standards.Thus consistency measures may be related to the
level of experience or training. It is also possiblethat if examined from the consistency viewpoint,measures of performance might be of value at anearly stage in training in predicting the eventuallevel of skill likely to be achieved. In conclusion,there would seem to be many further applications ofthe consistency measure that could be made in thecourse of experiments dealing with fatigue, stress,and ageing. The optimum test-retest interval willpresumably vary with the test and should be deter-mined in each case.
SummaryThe paper considers whether consistency in
performance between two occasions of test separated
140
on 20 June 2018 by guest. Protected by copyright.
http://oem.bm
j.com/
Br J Ind M
ed: first published as 10.1136/oem.13.2.131 on 1 A
pril 1956. Dow
nloaded from
CONSISTENCY AND CAR DRIVING SKILL
by a six-week interval is related to skill in driving.Evidence is presented which suggests the value ofthis approach to measuring skill; the generalimportance of the finding is that this method ofassessment can be used even in cases where thereare many different ways of doing the given task.
Cornering trials were performed by three groupsof drivers on an aerodrome without any traffic. Thecomparisons were between (a) skilled police drivers,(b) skilled rally drivers who had been given nostandard training, and (c) unskilled drivers. Theskill of these 30 drivers was assessed by the samechief police driving instructor and the three groupswere made up for study according to his views.
After a great deal of trial and error it was foundthat the most promising measure was that ofvehicle acceleration and deceleration. Readings ofacceleration/deceleration were therefore recordedphotographically every 5 yards over a distance of150 yards before and after each of the four cornersin the test run. An exactly similar run was givensix weeks later to the same 30 drivers.
Scores of consistency were calculated for eachsubject over the six-week interval and it was foundthat those in both skilled groups, police-trained andself-trained, were significantly more consistent thanwere the unskilled drivers.
Although test-retest consistency gave differencesbetween the three groups when test and retest wereseparated by an interval of six weeks, the samegroup differences in consistency did not show when
consistency between consecutive corners was con-sidered within the same day. The optimum test-retest interval to reveal the differences betweengood and bad drivers clearly needs further detailedconsideration.
This work was carried out under the direction andguidance of Sir Frederic Bartlett, F.R.S., and Dr. N. HJ.Mackworth. Mr. Eric Farmer initiated this series ofexperiments whilst Chairman ofthe Road User Committee.The staff of the Road Research Laboratory has alsogiven assistanca.
Miss Violet Cane advised on statistical problems anddirected Mr. Goodhardt in his work on the completestatistical analysis.
It is a pleasure to thank Captain Peel, Chief Constableof the Essex County Constabulary, for the facilities heprovided, and Inspector F. R. Priestley, the ChiefDriving Instructor of the Essex County Police AdvancedDriving School, who spared no effort in ensuring thatthe experiment proceeded smoothly.
Messrs. Co-Partnership Farms Limited, Boreham,were kind enough to allow us to use their airfield.
Finally, I wish to thank the 30 drivers, police andcivilian, who drove so keenly as subjects and made theexperiment possible.
REFERENCESAshby, W. Ross (1952). Design for a Brain, p. 148. Chapman &
Hall, London.Bartlett, F. C. (1947). Brit. med. J., 1, 835.
(1951). Research, 4, 217.Lashley, K. S. (1951). In Cerebral Mechanisms in Behaviour, p. 118.
The Hixon Symposium, ed. L. A. Jeffress. Wilev, New York.Oldfield, R. C. (1952). New Biology, 13, 49.Tillmann, W. A., and Hobbs, G. E. (1949). Amer. J. Psychiat., 106,
321.Venables, P. (1956). J. appl. Psychol. To be published.
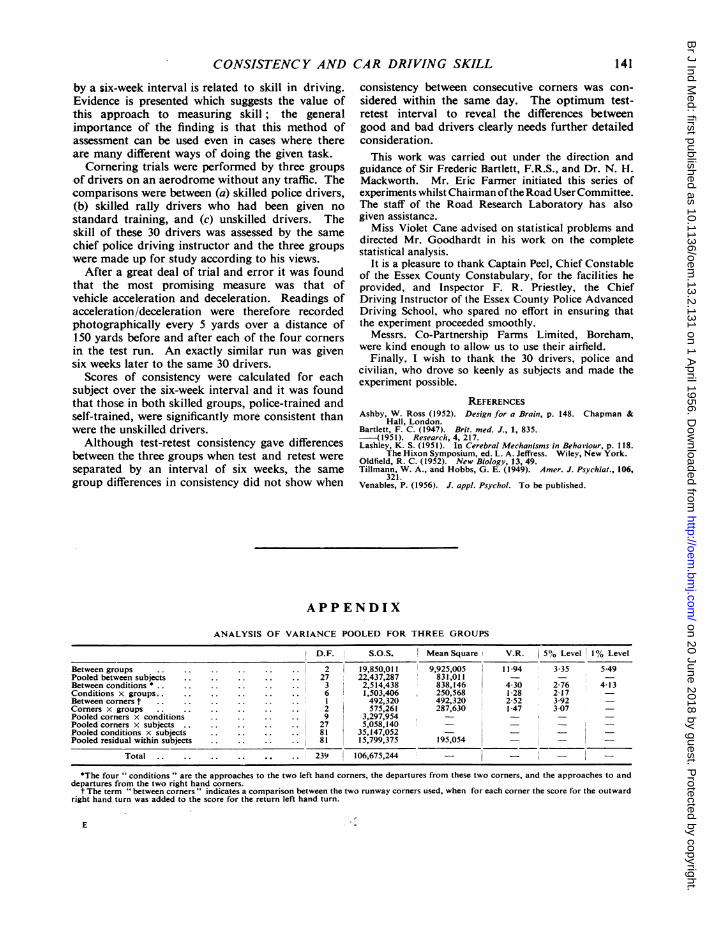
APPENDIX
ANALYSIS OF VARIANCE POOLED FOR THREE GROUPS
D.F. S.O.S. Mean Square V.R. |5% Level 1% Level
Between groups 2 19,850,011 9,925,005 11-94 335 5-49Pooled between subjects.27 22,437,287 831,011 - - -
Between conditions *.. 3 2,514,438 838,146 4-30 2-76 4-13Conditions x groups.. 6 1,503,406 250,568 1-28 2-17 -
Between corners t. 492,320 492,320 2-52 3-92Corners x groups.2 575,261 287,630 1-47 3 07 -Pooled corners x conditions 9 3,297,954 - - -Pooled corners x subjects.27 5,058,140 -Pooled conditions x subjects. 81 35,147,052 - - -Pooled residual withinsubjects. 81 15,799,375 195,054 _ _-
Total.239 106,675,244 - -
*The four " conditions " are the approaches to the two left hand corners, the departures from these two corners, and the approaches to anddepartures from the two right hand corners.
t The term " between corners " indicates a comparison between the two runway corners used, when for each corner the score for the outwardright hand turn was added to the score for the return left hand turn.
E
141
on 20 June 2018 by guest. Protected by copyright.
http://oem.bm
j.com/
Br J Ind M
ed: first published as 10.1136/oem.13.2.131 on 1 A
pril 1956. Dow
nloaded from