Embed Size (px)
Citation preview

CONSIDERING CULTURAL ASPECTS IN USER INTERFACE DESIGN
A Case Study of the Effects of Culture on User
Experience When Localizing a Product from Europe to Japan
Elisa Karpoff
Bachelor’s Thesis August 2013
Degree Programme in Wellness Technology School of Technology

DESCRIPTION
Author(s) KARPOFF, Elisa
Type of publication Bachelor´s Thesis
Date 12082013
Pages 190
Language English
Permission for web publication ( x )
Title CONSIDERING CULTURAL ASPECTS IN USER INTERFACE DESIGN: A Case Study of the Effects of Culture on User Experience When Localizing a Product from Europe to Japan Degree Programme Wellness Technology, School of Technology
Tutor(s) SIISTONEN, Matti
Assigned by ETAS K.K., Dr. Wolfgang Sienel, President of ETAS K.K.
Abstract In the globalized world the importance of providing a user interface that is suitable for all users from different cultures has been recognized. As the companies become more international, also the amount of offering that is available becomes larger. It is no longer enough to provide a user interface that is designed for international use, but also recognizing the customer specific needs becomes important. Here user experience and localization become the key terms. The goal of the thesis work was to investigate if there is a need to provide a localized user interface design for the Japanese ETAS INCA users, as the product is mainly designed in Germany for the global use. The approach taken in the thesis work was to do a three phase study. The first phase consisted of cultural studies, to recognize the similarities and differences in the two cultures and how these might affect the user interface design. In the second phase a user interface inspection was done by using Japanese cultural heuristics (created as a result of the first phase of the study). The third phase, user research, was done by using three different user research methods: user survey, user interview and user observation. As a result of the thesis work the Japanese cultural heuristics were noticed to provide useful information about the cultural preferences of the Japanese users for the user interface design. However, these heuristics were also recognized to be useful when designing for other cultures (not just for Japan) and could be used as more of a general guideline. Although cultural issues were noticed in the design of ETAS INCA, were most of the usability issues still general, not Japan specific. Therefore, before providing a localized user interface for Japan, it would be still more beneficial to focus on the general issues.
Keywords User experience, usability, cultural effects, user study, Japan, user Interfaces, localization, internationalization, cross cultural research. Miscellaneous Appendices include multiple documents created as a part of the thesis work (e.g. heuristic evaluation and user research findings, guidelines for conducting the user research), 87 pages.
OPINNÄYTETYÖN KUVAILULEHTI
Tekijä(t) KARPOFF, Elisa
Julkaisun laji Opinnäytetyö
Päivämäärä 12.08.2013
Sivumäärä 190
Julkaisun kieli Englanti
Verkkojulkaisulupa myönnetty ( x )
Työn nimi CONSIDERING CULTURAL ASPECTS IN USER INTERFACE DESIGN: A Case Study of the Effects of Culture on User Experience When Localizing a Product from Europe to Japan Koulutusohjelma Hyvinvointiteknologian koulutusohjelma, Teknologiayksikkö
Työn ohjaaja(t) SIISTONEN, Matti
Toimeksiantaja(t) ETAS K.K., Dr. Wolfgang Sienel, Toimitusjohtaja Tiivistelmä Globalisaation myötä yritykset ovat tiedostaneet kansainvälisten käyttöliittymien suunnittelun tärkeyden, kun käyttöliittymän käyttäjät eivät enää olekkaan vain yhdestä tai kahdesta kulttuurista. Tämä tarjoaa myös asiakkaille laajemmat markkinat mistä valita, jolloin käyttäjäkohtaisten tarpeiden huomioon ottaminen tulee tärkeämmäksi. Tällöin käyttäjäkokemus ja lokalisointi ovat oleellisia käsitteitä. Opinnäytetyön tavoitetteena oli selvittää lokalisoidun ETAS INCA käyttöliittymän suunnittelun tarpeen sen japanilaisille käyttäjille. Tuote on alkujaan lähtöisin Saksasta. Työn toteutus oli kolme vaiheinen ja se koostui kulttuurienvälisestä tutkimuksesta, käyttöliittymän kulttuurisesta asiantuntija tarkastuksesta ja käyttäjätutkimuksesta. Ensimmäisen vaiheen aikana tutkittiin Eurooppalaisen ja Japanilaisen kulttuurin eroavaisuuksia käyttöliittymän suunnittelulle tärkeistä näkökulmista. Ensimmäisen vaiheen tuotoksena olivat ns. Japanilaiset kulttuuriheuristiikat. Toisessa vaiheessa suoritettiin käyttöliittymän arviointi käyttäen ensimmäisessä vaiheessa luotuja kulttuuriheuristiikkoja. Työn kolmas vaihe suoritettiin käyttäen kolmea eri käyttäjätutkimusmenetelmää: käyttäjäkysely, käyttäjähaastattelu ja käyttäjähavainnointi. Opinnäytetyön tuloksena luotujen kulttuuriheuristiikkojan todettiin olevan hyvä menetelmä tunnistaa japanilaisille käyttäjille tärkeitä aihealueita ja että niiden käyttö olisi myöskin hyödyllistä muille käyttäjille suunniteltaessa (kulttuurista riippumatta). ETAS INCA tuotteen kohdalla kuitenkin tultiin siihen johtopäätökseen, että ennenkuin suunniteltaisiin lokalisoitua käyttöliittymää olisi hyvä paneutua yleiseen käytettäyvvteen. Tutkimuksessa huomattiin, että suurin osa havaituista ongelmista eivät olleet kulttuurisidonnaisia, vaikka myös kulttuuriin liittyviä käytettäyvyys ongelmia havaittiin. Avainsanat (asiasanat) Käyttäjäkokemus, käytettävyys, käyttäjätutkimus, kulttuurivaikutukset, Japani, kulttuurienvälinen tutkimus, käyttöliittymät, lokalisointi, kansainvälistyminen. Muut tiedot Liitteenä useita opinnäytetyöhön tehtyjä dokumentteja (mm. Heuristisen analyysin löydökset, käyttäjätutkimuksen löydökset, ohjeita käyttäjätutkimuksen suorittamiseen), 87 sivua.
1
CONTENTS
1 INTEREST FOR LOCALIZATION ......................................................................... 7
1.1 From Global to Local ........................................................................................ 7
1.1.1 User Experience ......................................................................................... 7
1.1.2 Localization ................................................................................................ 8
1.2 Approach of the Thesis ..................................................................................... 9
1.3 ETAS Group ..................................................................................................... 10
1.3.1 INCA ......................................................................................................... 11
1.3.2 Interest for Japanese User Experience .................................................... 12
2 CULTURAL STUDIES ....................................................................................... 14
2.1 Culture ............................................................................................................ 14
2.1.1 Metamodels of Culture ........................................................................... 15
2.2 Dimensions of Culture for User Interface Design .......................................... 16
2.2.1 Context .................................................................................................... 17
2.2.2 Environment and Technology ................................................................. 18
2.2.3 Uncertainty Avoidance ............................................................................ 19
2.2.4 Technological Development .................................................................... 19
2.2.5 Time Perception ...................................................................................... 20
2.2.6 Authority Conception .............................................................................. 20
2.3 Japanese and European Models of Culture ................................................... 21
2.3.1 High vs. Low Context ............................................................................... 22
2.3.2 Harmonization vs. Control-Orientation .................................................. 26
2.3.3 High vs. Low Uncertainty Avoidance ....................................................... 28
2.3.4 Leaders in the Technological Development ............................................ 32
2.3.5 Differences in the Time Perception......................................................... 37
2.3.6 Authority Conception and Power Distance ............................................. 40
2.4 Differences and Similarities in the Cultural Models ....................................... 43

2
2.5 Japanese Cultural Heuristics .......................................................................... 46
2.5.1 High Context Elements (Context) ............................................................ 47
2.5.2 Intuitive Ways of Interaction (Environment and Technology) ................ 47
2.5.3 Certainty of Results of One’s Actions (Uncertainty Avoidance) ............. 48
2.5.4 Clear Order and Progress of Tasks (Time Perception) ............................ 49
2.5.5 Flexibility of the Time Consumption (Time Perception) ......................... 49
2.5.6 Hierarchical Structure (Power Distance) ................................................. 50
2.6 Objective Dimensions of Japanese Culture .................................................... 50
2.6.1 Language ................................................................................................. 51
2.6.2 Date and Time Formatting and Calendar ................................................ 51
2.6.3 Text Formatting ....................................................................................... 52
2.6.4 Number Formatting ................................................................................. 53
2.6.5 Currency .................................................................................................. 54
3 USER INTERFACE INSPECTION ....................................................................... 55
3.1 Heuristic Evaluation ....................................................................................... 55
3.1.1 Phases of Heuristic Evaluation ................................................................ 57
3.2 Heuristic Evaluation of INCA V7.0.0 ............................................................... 57
3.2.1 Phases of the Heuristic Evaluation of INCA V7.0.0 ................................. 58
3.3 Results of Heuristic Evaluation of INCA V7.0.0 .............................................. 62
3.3.1 Heuristic Evaluation Findings .................................................................. 63
3.3.2 Cultural Heuristics vs. Dialog Principles .................................................. 71
4 USER RESEARCH............................................................................................ 74
4.1 User Survey..................................................................................................... 74
4.1.1 INCA User Survey ..................................................................................... 75
4.2 User Interviews .............................................................................................. 77
4.2.1 Goals of the INCA User Interview ............................................................ 78
4.2.2 Guidelines to the INCA User Interviews .................................................. 78
4.2.3 Conducting the INCA User Interviews ..................................................... 80
3
4.3 User Observation ............................................................................................ 81
4.3.1 Goals of the INCA User Observations ...................................................... 82
4.3.2 Guidelines to the INCA User Observations ............................................. 82
4.3.3 Conducting the INCA User Observations ................................................ 83
4.3.4 Analyzing the Results of the INCA User Observation .............................. 84
4.4 Analysis of the Results of the User Research ................................................. 85
4.4.1 [Text deleted due to confidentiality] ...................................................... 86
4.4.2 [Text deleted due to condifentiality] ...................................................... 87
4.4.3 [Text deleted due to confidentiality] ...................................................... 89
4.4.4 [Text deleted due to confidentiality] ...................................................... 90
4.4.5 [Text deleted due to confidentiality] ...................................................... 91
4.4.6 [Text deleted due to confidentiality] ...................................................... 92
5 CONCLUSIONS .............................................................................................. 93
5.1 Which Culture? ............................................................................................... 94
5.2 Usability of the Japanese Cultural Heuristics ................................................. 95
5.3 Cultural Model for Everybody ........................................................................ 95
5.4 Need for Localized User Interface of INCA for the Japanese Users? ............. 96
5.5 Benefits for ETAS ............................................................................................ 97
5.6 Suggested Follow up Studies .......................................................................... 98
REFERENCES ......................................................................................................... 99
APPENDICES ....................................................................................................... 103
Appendix 1. Uncertainty Avoidance and Power Distance scores. ......................... 103
Appendix 2. Conversion table for cultural dimension values. ............................... 104
Appendix 3. Dialog Principles ................................................................................. 106
Appendix 4. Japanese Cultural Heuristics. ............................................................. 109
Appendix 5. Japanese and English numerals. ........................................................ 112
Appendix 6. Checklist of Objective Matters of Japanese Culture. ......................... 113
Appendix 7. Task Flow Used in Heuristic Evaluation. ............................................ 114
4
Appendix 8. Heuristic Evaluation Findings. ............................................................ 115
Appendix 9. Paper INCA User Survey (English) ...................................................... 135
Appendix 10. Electronic INCA User Survey (Japanese) .......................................... 138
Appendix 11. Connections between the survey questions and cultural
heuristics. ............................................................................................................... 141
Appendix 12. INCA User Survey Responses. .......................................................... 143
Appendix 13. INCA User Interview Guidelines. ...................................................... 151
Appendix 14. Presentation of the Purposes and Style of the User Interviews and
Observations. ......................................................................................................... 164
Appendix 15. INCA User Interview Results. ........................................................... 168
Appendix 16. INCA User Observation Guidelines. ................................................. 175
Appendix 17. Affinity Diagrams of the INCA User Observation Notes. ................. 181
FIGURES
Figure 1. Levels of user interface localization ........................................................ 9
Figure 2. Phases of the thesis work. ....................................................................... 9
Figure 3. Typical calibration setup ....................................................................... 11
Figure 4. Hall’s Context Square combined with Victor’s diagram of high- and low-
context cultures. ........................................................................................... 17
Figure 5. Semantic differential scales of characteristics of low- and high-context
cultures. ........................................................................................................ 23
Figure 6. Culture’s perceiving of environment and technology –chart. .............. 27
Figure 7. Categories of uncertainty avoidance .................................................... 29
Figure 8. Distribution of level of uncertainty avoidance in different regions in
Europe. ......................................................................................................... 31
Figure 9. Categories of technological capabilities on the scale from
backwardness to advancement. .................................................................. 33
Figure 10. Technological capabilities. .................................................................. 34
Figure 11. Changes in the top places of country rankings in technological
development. ............................................................................................... 35
5
Figure 12. Time perception .................................................................................. 37
Figure 13. Differences between mono- and polychornic people ........................ 38
Figure 14. Categories of power distances. ........................................................... 40
Figure 15. Distribution of scores of different regions of Europe in the categories
of power distance ......................................................................................... 42
Figure 16. Japanese and European cultural models ............................................ 43
Figure 17. Examples of date and time formatting in Japan. ................................ 52
Figure 18. Examples of Japanese calendars ......................................................... 52
Figure 19. Example of Japanese website. ............................................................ 53
Figure 20. Example of Japanese user interface of a laundry machine................. 53
Figure 21. Japanese numerals .............................................................................. 53
Figure 22. Examples of Japanese receipts ............................................................ 54
Figure 23. Problems found and benefits of costs as function to number of
evaluators in heuristic evaluation ................................................................ 56
Figure 24.Example of the heuristic evaluation finding’s documentation ............ 60
Figure 25. Pie chart of heuristic evaluation findings ............................................ 62
Figure 26. [Text deleted due to confidentiality] .................................................. 63
Figure 27. [Text deleted due to confidentiality] .................................................. 64
Figure 28. [Text deleted due to confidentiality] .................................................. 65
Figure 29. [Text deleted due to confidentiality] .................................................. 66
Figure 30. [Text deleted due to confidentiality] .................................................. 70
Figure 31. Division of the usability findings from the heuristic evaluation to the
different sets of heuristics used ................................................................... 71
Figure 32. Companies included in the user survey .............................................. 77
Figure 33. [Text deleted due to confidentiality] .................................................. 80
Figure 34. [Text deleted due to confidentiality] .................................................. 85
Figure 35. [Text deleted due to confidentiality] .................................................. 86
Figure 36. [Text deleted due to confidentiality] .................................................. 88
Figure 37. [Text deleted due to confidentiality] .................................................. 88
Figure 38. [Text deleted due to confidentiality] .................................................. 90
Figure 39. [Text deleted due to confidentiality] .................................................. 91
6
TABLES
Table 1. ETAS severity rating scale ....................................................................... 61

7
1 INTEREST FOR LOCALIZATION
1.1 From Global to Local
The world that we live in keeps on getting smaller and smaller as the technology
develops. Boarders of the countries are starting to dim and most of the people have
become used to interacting daily in an international environment –The Internet.
The business world has also realized these possibilities that exist in foreign countries.
As each of the countries, cultures and regions differ greatly from each other in the
matters of language, as well as other cultural aspects, the importance of designing
products that are suitable for multiple cultures has become necessity. In the world of
software development, this most commonly means offering the user interface in
English, which is seen as a language that is most widely used in the cross-cultural
communication.
However, as the amount of offering that is available becomes greater the ability to
satisfy the customer specific needs for the user interfaces becomes the measure in
which the investment decisions are based on. Here is where user experience and
localization become the key terms.
1.1.1 User Experience
One of the factors affecting a product’s success is the end-user experience of it.
Although good user experience cannot guarantee the success of a product, a bad one
can surely cause a failure of it. As each person experience the world differently, the
factors that create a good experience depend on the people, product and task.
(Kuniavsky 2003, 18)
8
Different definitions of what the user experience consist of exist. Kuniavsky (2003,
18) defines user experience by what is “usable”. The definition of “usable” is
described to consist of the functionality of the product, the efficiency in which the
tasks can be conducted and the desirability factor that the product has (Kuniavsky
2003, 19-20). Siistonen (2012a, 2) gives more detailed explanation by defining that
user experience consists of design, fashion, technology, price, brand and usability of
the product.
At ETAS the definition of user experience is provided from Bosch. It includes “all
aspects of the user’s perception regarding an offering, including the product itself, its
functionalities and HMI, as well as related products, services and business eco-
systems.” Five target states have been stated for product’s user experience:
usefulness, ease-of-use, joy-of-use, aesthetics and image-of-use. (Schick 2013)
1.1.2 Localization
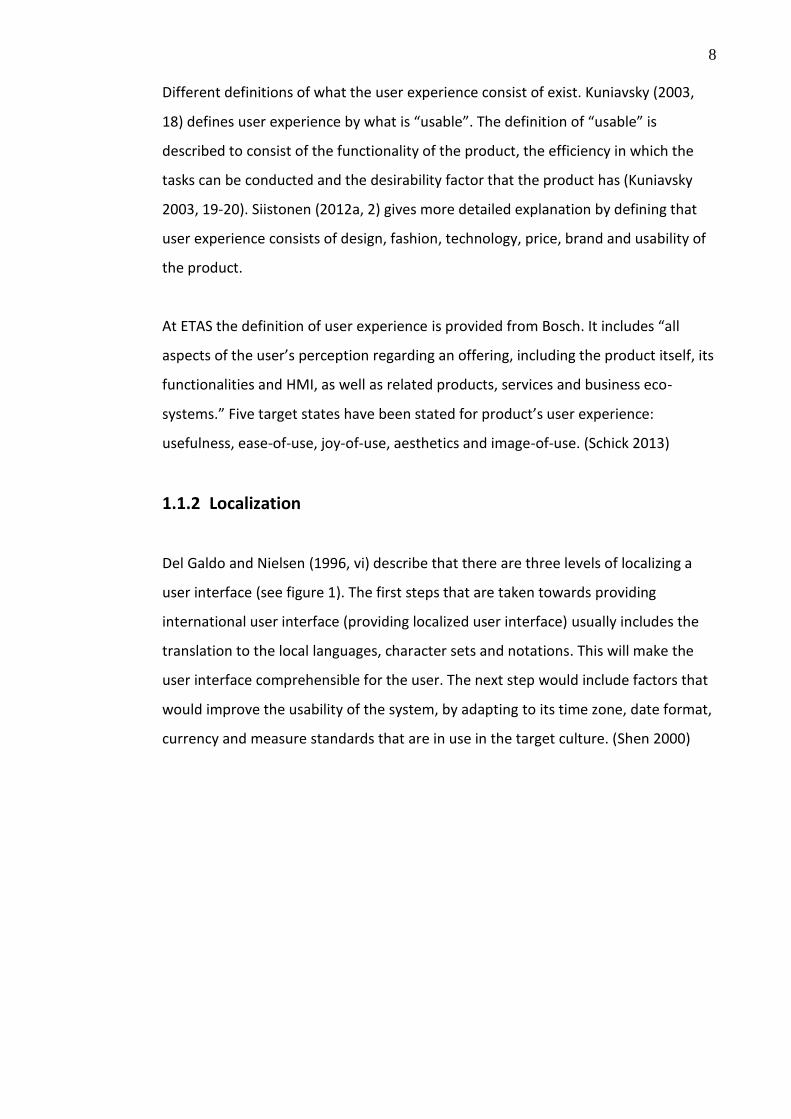
Del Galdo and Nielsen (1996, vi) describe that there are three levels of localizing a
user interface (see figure 1). The first steps that are taken towards providing
international user interface (providing localized user interface) usually includes the
translation to the local languages, character sets and notations. This will make the
user interface comprehensible for the user. The next step would include factors that
would improve the usability of the system, by adapting to its time zone, date format,
currency and measure standards that are in use in the target culture. (Shen 2000)
9
The focus of the thesis work is in the third level of localization: desirability. Providing
a user interface that is desirable includes the adaptation of it to the users’ cultural
characteristics (Shen 2000).
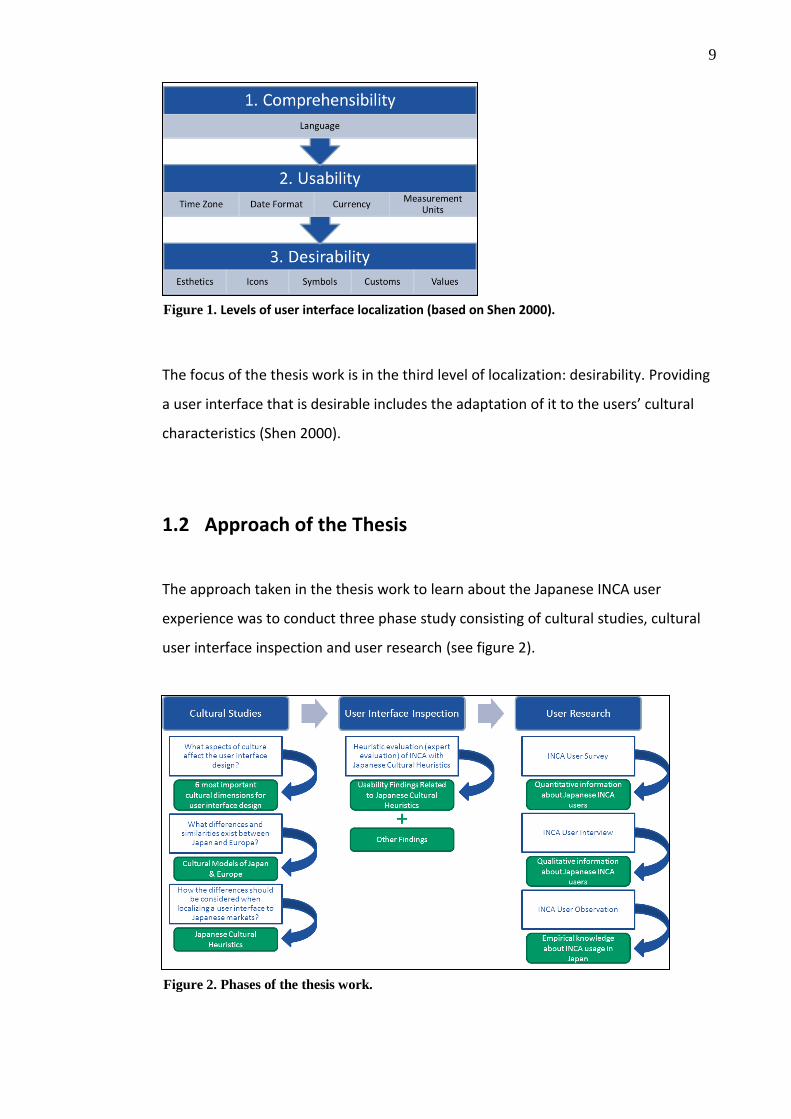
1.2 Approach of the Thesis
The approach taken in the thesis work to learn about the Japanese INCA user
experience was to conduct three phase study consisting of cultural studies, cultural
user interface inspection and user research (see figure 2).
Figure 1. Levels of user interface localization (based on Shen 2000).
Figure 2. Phases of the thesis work.

10
First step was to study about the cultural differences between Japan and Europe
through six dimensions of culture that were found to be the most important ones for
user interface design in Baumgartner’s (2003) thesis work. Based on the research
hypotheses were made about the topics that influence the user interface design for
Japanese users (later referred to as Japanese Cultural Heuristics).
The representation of these topics in INCA was evaluated through heuristic
evaluation. The heuristic evaluation also served as a way to evaluate the additional
value that using the Japanese Cultural Heuristics could provide.
The final phase was to do a user research with the actual Japanese INCA users to
identify issues that were not noticed in the expert evaluation, as well as to gain both
quantitative and qualitative data about the users; and empirical knowledge about
the working environment and tasks of the users. The user research enabled to check
the feasibility of the hypotheses created in the first phase of the study.
1.3 ETAS Group
ETAS GmbH was found in 1994, when Advanced Engineering department at Robert
Bosch Embedded Control group recognized the possibilities of using their tools (with
few minor modifications) in almost any type of embedded control units (ECUs) (INCA
User Training Manual 2010, v). ETAS GmbH is a subsidiary of Bosch Group (ETAS
Group n.d.).
Although the origins of the company are in Stuttgart, Germany; the company has
expanded with international subsidiaries and sales offices to 12 other countries
including Brazil, China, France, India, Italy, Japan, Korea, Russia, Thailand, United
Kingdom, United States of America and Sweden. (ETAS Group n.d.)
11
1.3.1 INCA
The system studied in the thesis work is ETAS INCA that is targeted for the calibration
and measuring tasks of electronic control units (ECU).
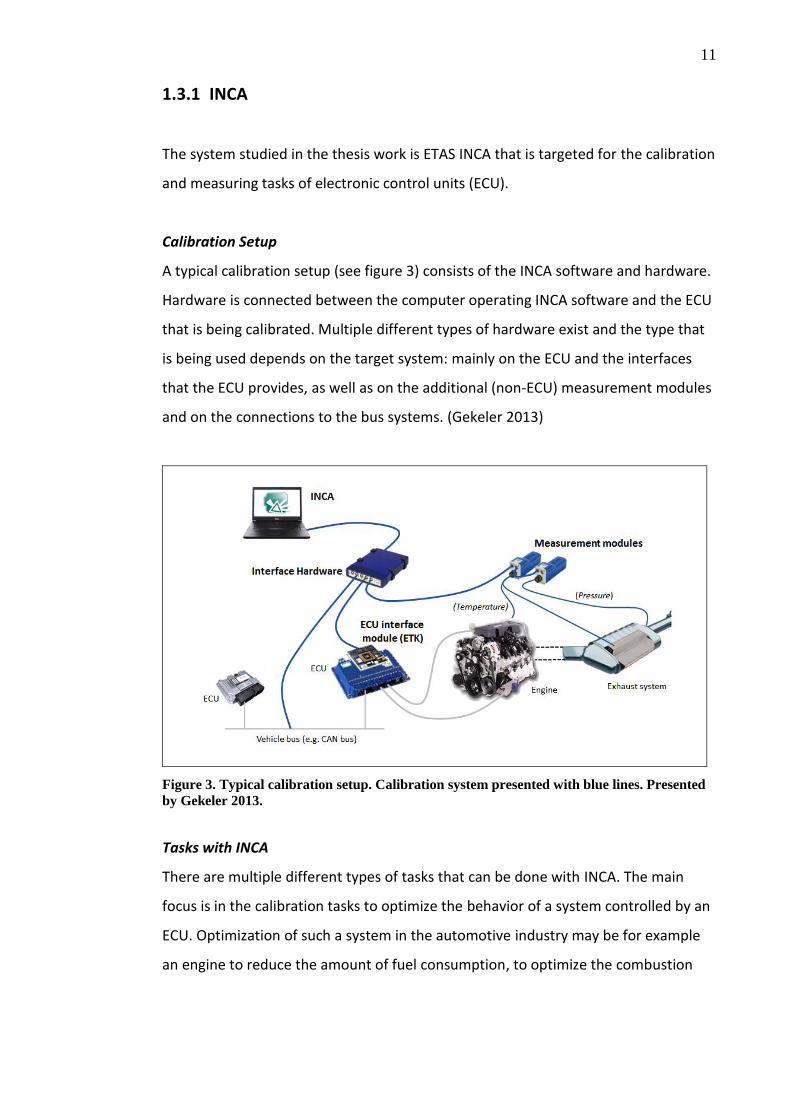
Calibration Setup
A typical calibration setup (see figure 3) consists of the INCA software and hardware.
Hardware is connected between the computer operating INCA software and the ECU
that is being calibrated. Multiple different types of hardware exist and the type that
is being used depends on the target system: mainly on the ECU and the interfaces
that the ECU provides, as well as on the additional (non-ECU) measurement modules
and on the connections to the bus systems. (Gekeler 2013)
Figure 3. Typical calibration setup. Calibration system presented with blue lines. Presented
by Gekeler 2013.
Tasks with INCA
There are multiple different types of tasks that can be done with INCA. The main
focus is in the calibration tasks to optimize the behavior of a system controlled by an
ECU. Optimization of such a system in the automotive industry may be for example
an engine to reduce the amount of fuel consumption, to optimize the combustion
12
process to reduce exhaust gases or to enable smooth start of the engine in cold
temperatures. (Gekeler 2013)
To perform calibration, the user of INCA observes the behavior of the system
controlled by the ECU (for example an engine) by doing acquisition of relevant
measurement values. These values are depending on the data which is stored in the
ECU and used by the ECU program code. By changing the calibration data the user
can change the behavior of the engine system. (Gekeler 2013)
Main Functionality of INCA
INCA enables the recording of the measurement samples acquired from the ECU,
measurement modules and vehicle busses; and then the analysis of the recorded
data. Besides the measurement samples INCA shows datasets internally in a
database. These datasets contain either the original unchanged data or the data
changed by the INCA user. (Gekeler 2013)
Calibration Process
Usually several calibration engineers work individually on different tasks which are
divided by different calibration parameters within the ECU. Combining these
individual working results into one dataset and repeating another (or several)
iterations of optimization eventually results in an optimized dataset, which is actually
used for the serial production of engines for respective vehicles. (Gekeler 2013)
1.3.2 Interest for Japanese User Experience
There are multiple reasons for the special interest of the Japanese user experience.
For one, Japan is one of the top car manufacturers in the world. According to the
International Organization of Motor Vehicle Manufacturers (OICA) in 2012 Japan
produced the third most cars in the world, increasing the amount by 18.4 percent
from the previous year (2012 Production Statistics). As the main customers of ETAS
13
products are in the automotive industry, it seems reasonable to focus on the
increasing markets.
Another reason is the difference in the culture of the Japanese automotive industry
to other Asian markets. As the other important markets in Asia (such as Korea and
India) rely greatly on the development done in Europe (Koreans adapting to
European tools and Indians modifying the European tools to be simplified for their
own purposes) is Japan different compared to them. The Japanese automotive
industry has been known to develop its own methods, rather than using the already
existing ones. Therefore it was seen as important to recognize the special needs of
this market. (Sienel 2013a)

14
2 CULTURAL STUDIES
To limit the extent of the study, it is important to define which aspects of culture are
being studied. In the following chapters the definition and structure of culture is first
examined, followed by descriptions of aspects (or “dimensions of culture”) that have
been found to be the most important ones for user interface design in previous
studies (cf. Baumgartner 2003).
Japanese and European cultures are studied through the cultural dimensions to
discover the aspects that are similar and different in the two cultures. Based on the
differences found descriptions of “Japanese Cultural Heuristics” are given to show
the aspects that should be recognized when creating a user interface for Japanese
markets.
2.1 Culture
In her article Hoft describes culture accordingly: ”Culture is, after all, learned
behavior consisting of thoughts, feelings and actions”. Even after providing that
description Hoft states the complexity of giving exact definition of culture. Hoft
describes that Kroeber and Kluckhohn (1954) have reported more than 300
definitions of culture. (Hoft 1996, 41 & 71)
Expanding from Hoft’s description of culture Merriam-Webster Online Dictionary
(Culture n.d.) defines more specifically the nature of culture:
Integrated pattern of human knowledge, belief, and behaviour that is both
a result of and integral to the human capacity for learning and transmitting
knowledge to succeeding generations. Culture thus consists of language,
ideas, beliefs, customs, taboos, codes, institutions, tools, techniques, works
15
of art, rituals, ceremonies, and symbols. It has played a crucial role in
human evolution, allowing human beings to adapt the environment to their
own purposes rather than depend solely on natural selection to achieve
adaptive success.
This description includes the consistent development of culture, which allows it to
adapt to the existing environment that it is in. The development of culture can be
seen to be crucial to the human evolution as the environment is constantly changing.
Culture has to develop in order to survive.
2.1.1 Metamodels of Culture
While investigating culture it is important to be able to state what exactly in the
culture is being investigated. Hoft (1996, 43-48) presents four well known
metamodels of culture that can help to identify the different layers of culture:
1. objective and subjective culture
2. iceberg model
3. pyramid model
4. onion model.
The clearest model of culture when thinking about the aspects of culture that are
included in the third level of user interface localization, provide the model of
objective and subjective culture.
Objective and Subjective Culture
According to Hoft; Stewart and Bennet (1991) have introduced a model of two layers
of culture: objective and subjective culture. By their definition objective culture
includes variables that are visible in the culture, thus easy to discover. These include
tangible dimensions such as ”social customs, political structures and processes, arts,
crafts and literature”. Subjective culture on the hand is seen as something that

16
is ”outside the conscious awareness” of the person. This would include dimensions
such as assumptions, values, and patterns of thinking, which are psychological
features of culture. Despite the fact that the subjective and objective culture seem to
be the opposite sides of a coin, they are closely related to each other according to
Stewart and Bennet. They explain subjective to be what is real and concrete and the
objective to be the externalization of the subjective culture, hence abstract. (Hoft
1996, 43)
2.2 Dimensions of Culture for User Interface Design
Dimensions of culture (sometimes referred to as international variables) are used to
organize cultural data in categories in which they can be compared to other cultures
(Hoft 1996, 49 & 69). Different authors have created their own dimensions to
categorize the cultural data, which sometimes can be compared to other author’s
dimensions or are even based on other author’s dimensions. Authors of these
dimensions include such as Edward T. Hall (anthropologist), Geert Hofstede (diploma
in mechanical engineering and Doctor of Social Science), Fons Trompenaars
(Economics and Ph.D. in a dissertation on differences in conceptions of
organizational structure in various cultures), David A. Victor (Professor of
Management) and Quincy Wright (author of ‘The Study of International Relations’).
(Baumgartner 2003, 18-19)
Baumgartner studied in her thesis work the importance of 29 different dimensions of
culture (collected from nine authors) to user interface design. In her thesis work she
conducted qualitative research to over 50 user interface design experts to discover
the most important cultural dimensions for user interface design. Based on the
results of the survey she created a ranking of the most important cultural dimensions
for user interface design. The six most important cultural dimensions were (in this
order): context, environment and technology; uncertainty avoidance, technical
development, time perception and authority conception. In the following are
17
described these dimensions of culture and their influence to user interface design.
(Baumgartner 2003, 39-46)
2.2.1 Context
Context is a cultural dimension created by Edward T. Hall, an anthropologist and
intercultural communication consultant whose work is based on years of observation
and extensive interviewing worldwide. (Hoft 1996, 50)
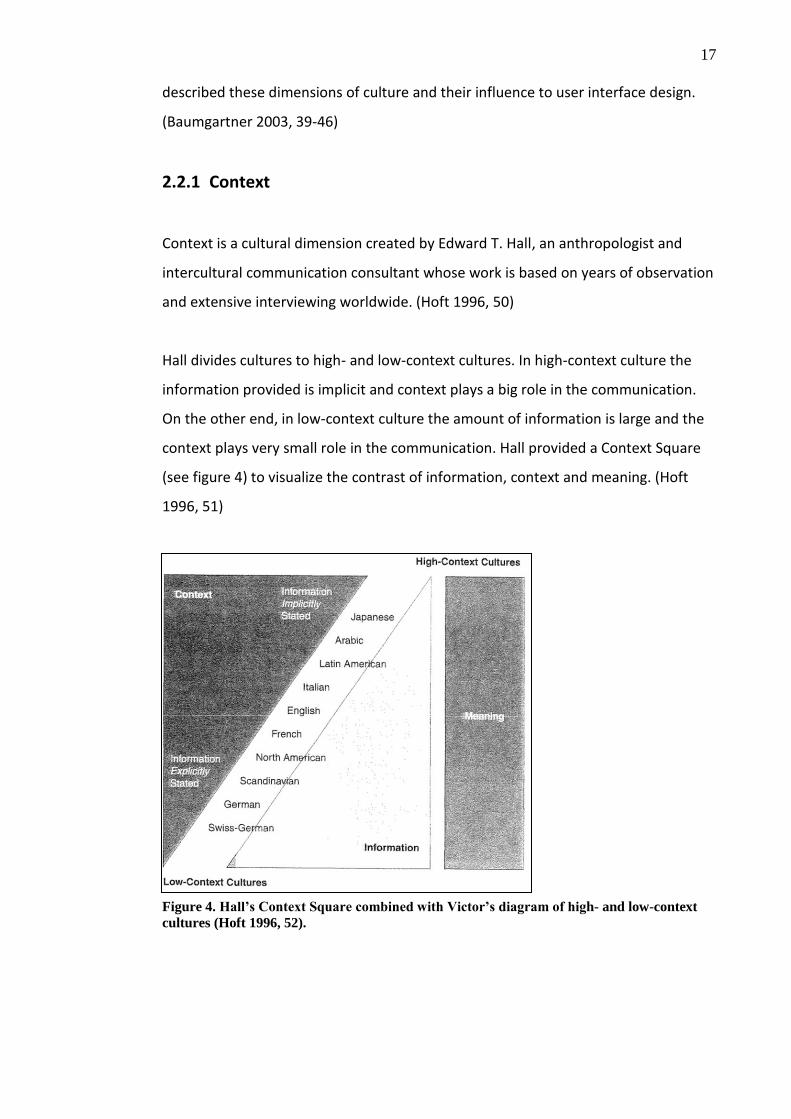
Hall divides cultures to high- and low-context cultures. In high-context culture the
information provided is implicit and context plays a big role in the communication.
On the other end, in low-context culture the amount of information is large and the
context plays very small role in the communication. Hall provided a Context Square
(see figure 4) to visualize the contrast of information, context and meaning. (Hoft
1996, 51)
Figure 4. Hall’s Context Square combined with Victor’s diagram of high- and low-context
cultures (Hoft 1996, 52).
18
User interface design professionals that participated in Baumgartner’s survey
describe: ”navigation and interaction can be supported positively with high-context
graphic, but only in cultures where high-context communication is common and can
be understood”. Another participant describes the effect of context by giving an
example of hospital information system, where the user’s professional knowledge
from 3 to 15 years of training covers 98% of the communication and the user
interface only 2%. (Baumgartner 2003, 24)
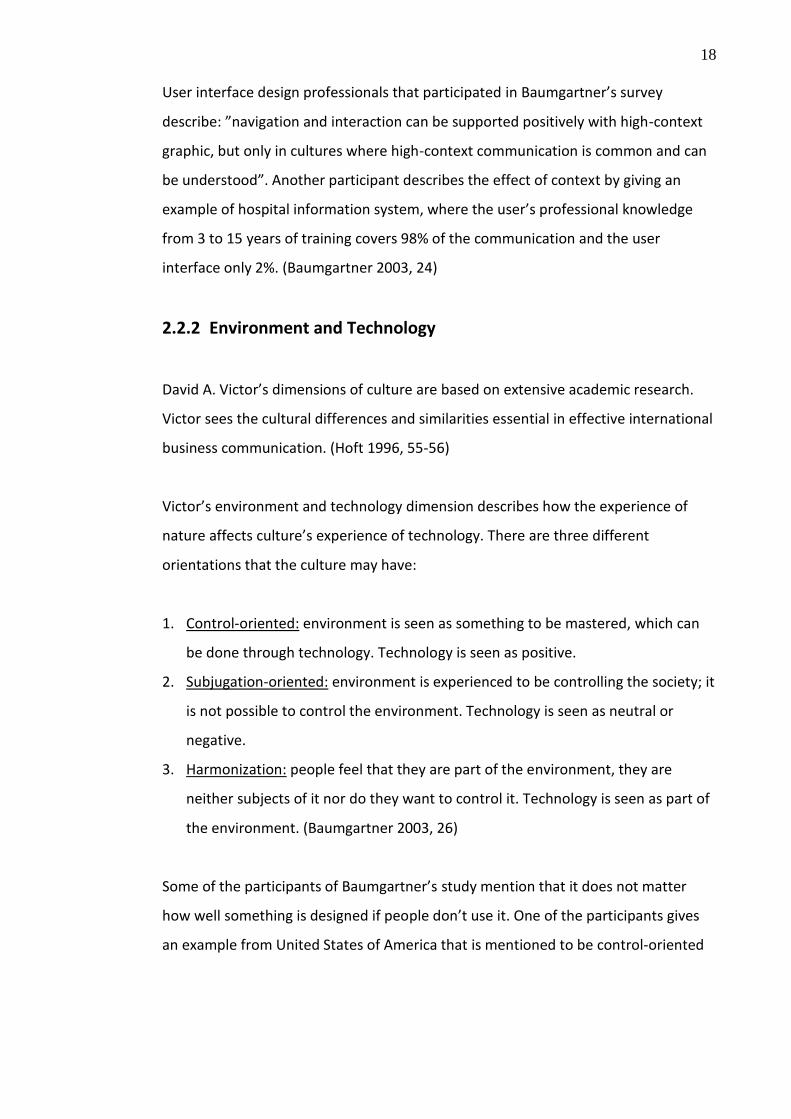
2.2.2 Environment and Technology
David A. Victor’s dimensions of culture are based on extensive academic research.
Victor sees the cultural differences and similarities essential in effective international
business communication. (Hoft 1996, 55-56)
Victor’s environment and technology dimension describes how the experience of
nature affects culture’s experience of technology. There are three different
orientations that the culture may have:
1. Control-oriented: environment is seen as something to be mastered, which can
be done through technology. Technology is seen as positive.
2. Subjugation-oriented: environment is experienced to be controlling the society; it
is not possible to control the environment. Technology is seen as neutral or
negative.
3. Harmonization: people feel that they are part of the environment, they are
neither subjects of it nor do they want to control it. Technology is seen as part of
the environment. (Baumgartner 2003, 26)
Some of the participants of Baumgartner’s study mention that it does not matter
how well something is designed if people don’t use it. One of the participants gives
an example from United States of America that is mentioned to be control-oriented
19
culture: technology is seen as ”smart” and ”good”, if the users do not know how to
use something they feel that they are not smart enough. (Baumgartner 2003, 26)
2.2.3 Uncertainty Avoidance
Geert Hofstede did an extensive research with IBM employees during years between
1968 and 1972. He bases his cultural dimensions in that research. (Hoft 1996, 57-58)
Uncertainty avoidance dimension is meant to discover the culture’s ”extent to which
people feel threatened by uncertain or unknown situations”. He measures the level
of uncertainty avoidance from high to low:
1. High uncertainty avoidance: uncertain situations are seen dangerous, people
tend to avoid them. The culture has suppression of deviant ideas and behavior,
different is dangerous.
2. Low uncertainty avoidance: less threatened by unknown situations. Uncertainty
is part of life. The culture sees different as curious and there is tolerance of
deviant and innovative ideas. (Hoft 1996, 60-61)
For user interface design Baumgartner links uncertainty avoidance to the design of
navigation and interaction. ”Satisfying the need of certainty will affect the
satisfaction that the user experiences on the interface and hence determine
the ”stickiness” for a particular population”. (Baumgartner 2003, 38)
2.2.4 Technological Development
Quincy Wright’s technological development dimension is used to describe the rate of
the culture’s technological development. He uses scale from advancement to
backwardness. (Baumgartner 2003, 35)
20
Baumgartner’s study connects technological development to mental models,
navigation and interaction in user interface design. Not only may the technological
development level affect the availability of hardware, software and bandwidth, but
also the experience level that the users may have with technological products. This
affects the design of the user interface critically. (Baumgartner 2003, 36)
2.2.5 Time Perception
Cultural dimension of time perception is described by Hall, Trompenaars and Victor.
It is used to describe how the time is used within a culture:
1. Monochronic (sequentially) time: preference in the use of schedules, promptness,
compartmentalization and isolation of actions. Things are done one at a time and
it is important to stay in schedule.
2. Polychronic (synchronically) time: prefer doing multiple tasks at once, plans are
changed easily, schedules are not followed rigidly. (Baumgartner 2003, 37)
Baumgartner links time perception to navigation, interaction and appearance in user
interface design. It may affect the way in which the user browses for information:
monochronic would prefer precise query whereas polychronic would like to browse
for the information freely. The age of the user may affect this factor more greatly
than the ethnic or regional cultural background. (Baumgartner 2003, 37)
2.2.6 Authority Conception
According to Baumgartner the authority conception dimension presented by Victor
and Condon & Yousef describes culture’s conception of organizational power.
Cultures can be divided into three categories: democratic, authority-centered and
authoritarian. In democratic cultures young people are thought that they have the
right to question the authority. In authoritarian cultures this is not allowed.
(Baumgartner 2003, 23)
21
When thinking about user interface design authority conception of the culture
should be considered when thinking about the metaphors, mental models and
interaction that is used. The user may want to know that the usage of the software is
done under surveillance of an authority. Phrasing the commands and text in the
software needs to be carefully thought; and the style of the text should match the
cultural and social profile of the user. The interaction approach should be thought
carefully – if it is seen by others, the user should not be put into uncomfortable or
embarrassing situations. The presentation of the feedback should be carefully
thought. (Baumgartner 2003, 23)
2.3 Japanese and European Models of Culture
Using cultural models was evaluated to be the most feasible method to collect
information about the cultural differences between Japanese and European cultures
that might affect the user experience.
The Japanese subjective dimensions of culture were created by collecting data from
existing literature (cf. the Hofstede Centre) on Japanese culture and by empirical
observations that the author did while living in Japan during the thesis work (from
December 2012 till June 2013). The European dimensions of culture were also
defined by using already existing knowledge (cf. the Hofstede Centre).
Because of the wide range of different cultures in Europe, it was not feasible to
conduct more thorough research within extent of the thesis work. Therefore, most of
the European cultural dimensions were based on the empirical observations that the
author had done about the European cultures while studying a year in Spain, doing
an internship in Germany for six months and having grown up in Finland. During
these times spent abroad as well as during her studies in Finland she had been living,
22
studying and working in international environments, during which recognizing the
cultural differences was part of daily life.
In the following chapters are presented they ways in which the differences in the
different cultures can be shown and how Japanese and European cultures measure in
them.
2.3.1 High vs. Low Context
Hoft presented in her article a figure (see figure 4) that included Hall’s Context
Square combined with Victor’s diagram of high- and low-context cultures. In this
diagram Japanese culture is ranked as high-context culture whereas German,
Scandinavian and North American cultures are ranked to low-context. Italian, English
and French cultures rank in the middle of the diagram. (Hoft 1996, 52)
Würtz (2005) brings up the differences of communication in high- and low-context
cultures originally identified by Gudykunst et al. (1996). In the following figure 5
these characteristics are being used together with non-verbal/less physically
animated communication strategies presented by Hall (1976) according to Würtz
(2005) to create a semantic differential scales to evaluate the differences in the
cultures. Japanese and European cultures are placed in these scales by presenting
Japanese culture with green balloon and European with blue balloon. The ratings are
explained in the following paragraphs.

23
Figure 5. Semantic differential scales of characteristics of low- and high-context cultures.
Direct vs. Indirect
Japanese value harmony which extends also to communication. The listener should
be able to understand from other signs what the speaker’s real intentions are.
Norbury describes actions such as pause in the speech, body language and not
responding to be perceived as negative replies instead of using direct “no”.
(Norbury 2011, 41 & 149)
Nishimura, Nevgi and Tella studied the cultural features of high- and low-context
cultures in Finland, Japan and India. In their study they present a diagram by Lewis
(2005), showing the differences in communication styles in USA/West Europeans –
Finns – Asians. In this diagram USA/West Europeans and Finns have in common the
“truth before diplomacy” factor, whereas Asians have the tendency for “diplomacy
before truth”. (Nishimura, Nevgi and Tella 2008, 788) This factor presents well the
directness of the European culture – the truth is being told directly, even when it
24
might not be beneficial to the participant that is in hierarchy higher than the speaker.
Truth and directness is valued over the diplomacy of the situation.
Precise vs. Ambiguous
Nishimura et al. offer an example how the ambiguity of the Japanese culture is
presented within the language by providing the following sentence: “KISHA no KISHA
ga KISHA de KISHA shimashita”(貴社の記者が汽車で帰社しました). This means: “a
reporter of your company returned to the office by train”. In each case “KISHA” has a
different meaning that can be only understood based on the context while speaking.
In written language they are separated by using different kanji characters for each
meaning (貴社, 記者, 汽車 and 帰社). (Nishimura et al. 2008, 790)
In Europe ambiguous answer to a question could be understood as dishonesty or
that the person does not know the answer. Things are expected to be stated
precisely and in a case of uncertainty it is more than desirable to seek for an answer,
rather than to be unsure.
Dramatic vs. Maintaining of Harmony
While discussing with a Japanese person you cannot hear them disagreeing or saying
“no” in any situation. For Japanese saying “no” is considered to be harsh and even
rude. The person may say that it might be difficult to do something or that they
would need to considerate the answer a bit more, which could be understood as
negative response. (Norbury 2011, 149-150)
On the contrary in Europe the people are expected to express their real feelings and
opinions about the topic openly. Exaggerating can be seen as a way to express the
seriousness of one’s opinion. The dramatic manner may be also used when people
want to put pressure on a topic. Though, dramatic communication is less used by
Northern Europeans compared to the more temperamental Southern Europeans.
25
Open vs. Reserved
Europeans are more individualist than Japanese. Showing one’s opinions and feelings
is seen as each individual’s right in the society. On the contrary, in Japan the
individuals have the obligation to the society to reserve their feelings and opinions
from the public to obtain harmony in the society. This is supported by the strong
“face” culture that exist in Japan – actions should be carefully thought to prevent
losing face (Norbury 2011, 43).
Interestingly the loss of face do not only limit to the person that is acting
exceptionally, as the following story shows.
During my stay in Japan I joined a gym with my Korean housemate. The gym offered
different types of dancing classes in which we also joined. In one of the times that we
joined these classes I was wearing a top instead of the usual t-shirt. As the lesson
started my housemate, who had already been living in Japan for a while, told me that
my revealing outfit was causing embarrassment to everyone in the class. It was
difficult for me to understand why the others would be embarrassed because of
something that I was wearing. In Finland that may have caused some curious looks
from the fellow gym goers, but definitely not embarrassment for them.
Based on Feelings vs. Understated
Like mentioned before, Japanese live in “face” culture. Maintaining one’s face is
important, which is why the culture has developed so many different customs and
protocols for both business and daily life to prevent losing face. There are two
aspects of Japanese person: tatemai (public face) and honne (private face). Tatemai
is what can be seen from the person in public, when the true intentions are hidden.
Honne includes the honest intentions of a person that are not shown in public.
(Norbury 2011, 41-44)
The European cultures are more open and prompt the openness and each
individual’s right to show their real feelings and opinions in public. In Spain you can
26
experience the people’s openness as they openly express their delight of meeting
friends and family by greeting them loudly with rich expression, accompanied by
multiple cheek kisses and taps on the shoulder. Whereas in Germany and Finland the
openness is shown as the people are expected to express their real opinions and
feelings truthfully with courtesy. This may cause tension between the people with
different opinions, but everybody’s opinion is heard and hopefully a way that would
satisfy both parties can be sought.
Less Physically Animated vs. Non-verbal Strategies
In Japan unspoken things, gestures and body language play a big role in the
communication. Manners, such as bowing and pauses in the speech are important
part of the communication. Understanding the non-verbal strategies is a required
when communicating in Japan. (Japanese Communication Style n.d.)
The importance of body language is recognized in Europe too, though the main
pressure in the communication remains in the verbal communication. Something
that is not said or written cannot be expected to be understood.
2.3.2 Harmonization vs. Control-Orientation
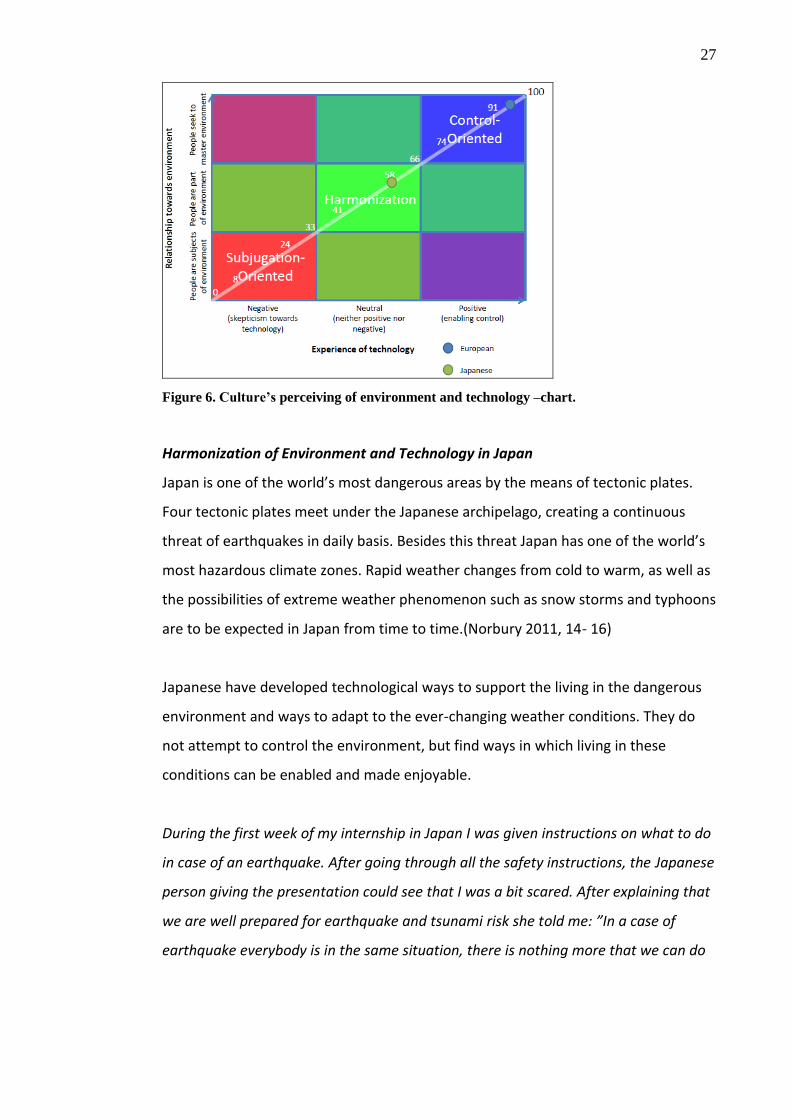
As described before (see chapter 2.2.2), culture may have one of the three
orientations towards environment and technology: control-oriented, subjugation-
oriented or harmonization.
Figure 6 is an attempt to demonstrate how these categories are defined by the
perception that each of them have towards environment and technology. The table
is created based on the definitions of each of the orientations in Baumgartner (2003,
26).
27
Figure 6. Culture’s perceiving of environment and technology –chart.
Harmonization of Environment and Technology in Japan
Japan is one of the world’s most dangerous areas by the means of tectonic plates.
Four tectonic plates meet under the Japanese archipelago, creating a continuous
threat of earthquakes in daily basis. Besides this threat Japan has one of the world’s
most hazardous climate zones. Rapid weather changes from cold to warm, as well as
the possibilities of extreme weather phenomenon such as snow storms and typhoons
are to be expected in Japan from time to time.(Norbury 2011, 14- 16)
Japanese have developed technological ways to support the living in the dangerous
environment and ways to adapt to the ever-changing weather conditions. They do
not attempt to control the environment, but find ways in which living in these
conditions can be enabled and made enjoyable.
During the first week of my internship in Japan I was given instructions on what to do
in case of an earthquake. After going through all the safety instructions, the Japanese
person giving the presentation could see that I was a bit scared. After explaining that
we are well prepared for earthquake and tsunami risk she told me: ”In a case of
earthquake everybody is in the same situation, there is nothing more that we can do
28
than what I have already explained to you”. That sums up well the mentality of
Japanese towards environment – it is neither desirable nor possible to change the
environment, you just need to find a way to survive and adapt to it.
The relationship towards nature is also part of the Shinto religion that is the
dominant religion in Japan. As Nurbury (2011, 52) puts it: ”seeking of harmonious
relationship with nature lies at the heart of Shinto”.
European Control-Oriented Culture
Similar to Japan, technology is widely used in daily living in Europe. It is experienced
positively and the interest in new technology is tremendous. The biggest difference
between Japan and Europe may be the perceiving of technology: in Europe it is
separated from the environment.
A good example of this could be my father, whose mission seems to be to fill up my
parents’ house with multiple different kinds of technological gadgets for any kind of
task that you could imagine to have in a house or daily living. It is not that these
gadgets are necessity or embedded part of the living environment, but more the
feeling of control that they create to my father. May it be the mechanic snow
remover or remote control to turn on the coffee maker without having to stand up
from the kitchen table for it. As he usually prefers doing the snow work anyways the
old-fashioned way or will turn on the coffee maker while preparing the breakfast; are
these gadgets there only to provide the feeling of control that he has with them over
his living environment.
2.3.3 High vs. Low Uncertainty Avoidance
The Hofstede Center’s website offers collected survey data about the five cultural
dimensions created by Hofstede about different nations. The website provides each
country’s score of each of the dimensions and a description of the score. The scores
29
presented in the website are meaningless unless comparisons between different
countries are done. (The Hofstede Centre n.d.)
The data from the Hofstede Centre’s website was used to evaluate the uncertainty
avoidance levels of European and Japanese cultures.
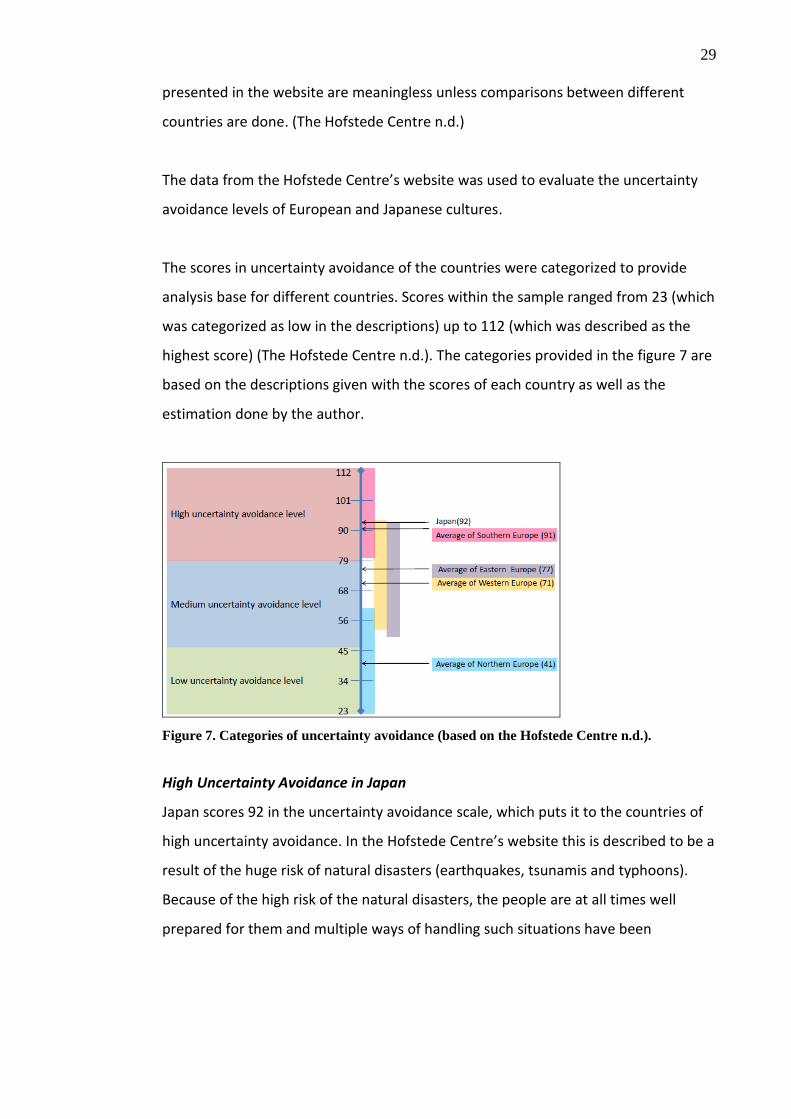
The scores in uncertainty avoidance of the countries were categorized to provide
analysis base for different countries. Scores within the sample ranged from 23 (which
was categorized as low in the descriptions) up to 112 (which was described as the
highest score) (The Hofstede Centre n.d.). The categories provided in the figure 7 are
based on the descriptions given with the scores of each country as well as the
estimation done by the author.
Figure 7. Categories of uncertainty avoidance (based on the Hofstede Centre n.d.).
High Uncertainty Avoidance in Japan
Japan scores 92 in the uncertainty avoidance scale, which puts it to the countries of
high uncertainty avoidance. In the Hofstede Centre’s website this is described to be a
result of the huge risk of natural disasters (earthquakes, tsunamis and typhoons).
Because of the high risk of the natural disasters, the people are at all times well
prepared for them and multiple ways of handling such situations have been
30
developed (such as emergency protocols and preparations of the houses for the
catastrophes). (The Hofstede Centre n.d.)
The high preference for uncertainty avoidance is every presence in the daily living
and multiple different traditions have been developed to avoid uncertain situations,
such as the manners of communication and interacting with others to avoid
situations that are not familiar.
Another example of the uncertainty avoidance is the high preference of knowing
what topics will be discussed in a meeting before the meeting and if some sort of
input is required during the meeting.
One time during my stay in Japan I got a chance to take part in one of the team
meetings in the company, to provide information about user experience and the
topics of the thesis work for the Japanese colleagues. After my presentation the
German team leader wanted to have a bit of discussion with the team about user
experience, to see if they had understood the concept. He was asking them to give an
example of good or bad user experience that they had experienced recently. The
silence in the group continued for a good while, until one of the team members asked
in disbelief: “Are you asking us to give an example NOW?” Although the matter was
not about any bigger topic, were the Japanese in discomfort about providing an
answer to a question without having the time to prepare so that they could be sure
that it is the correct kind of answer.
Uncertainty Avoidance in Europe
Europe constructs of multiple different cultures, which each have their own and
quite radically different score for uncertainty avoidance. European Union consists of
27 countries (Countries n.d.). From these 27 countries the data of 21 countries was
collected, excluding Cyprus, Latvia, Lithuania, Luxembourg, Malta and Romania.
Besides these countries the data from Norway, Switzerland and Croatia was also
collected, as their location in the European area was evaluated to entitle them to be
31
included in the range of this thesis. In total information of 24 countries was used (see
appendix 1).
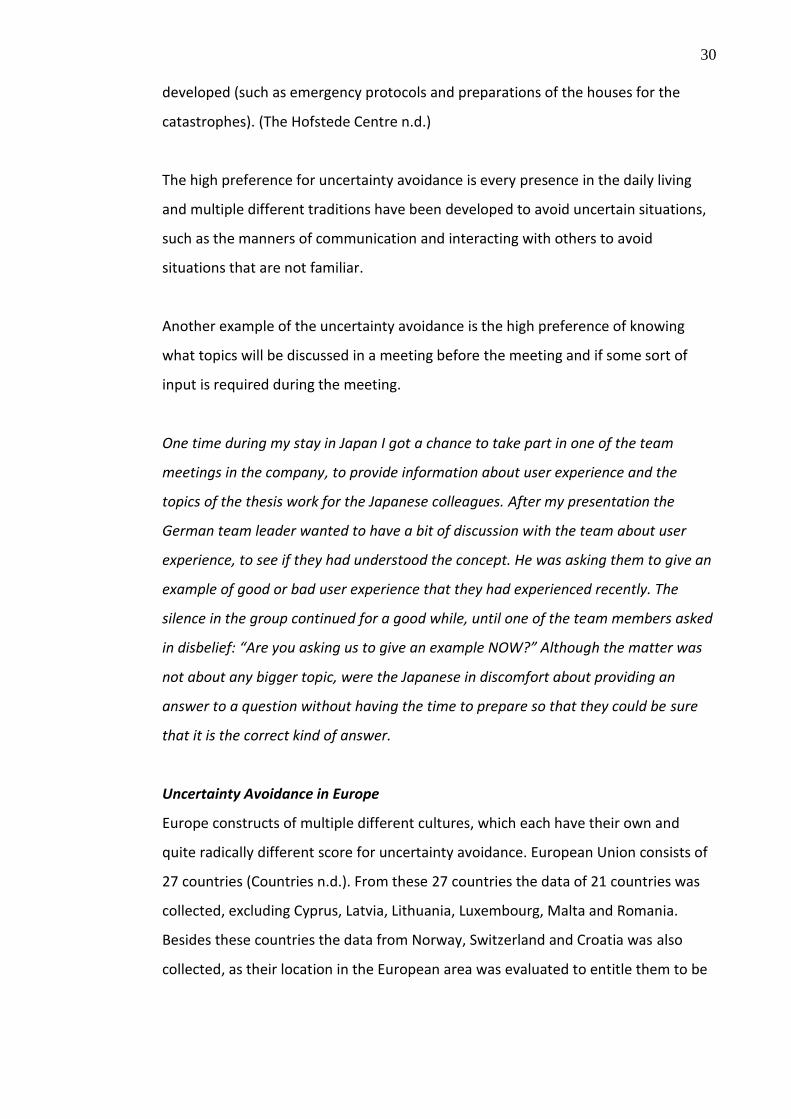
The average score of uncertainty avoidance in European countries is about 69, which
would put Europe in the medium uncertainty avoidance level –category. Since there
are great differences, it is preferable to have a closer analysis of these scores.
As can be read from figure 8 the distribution of level of uncertainty avoidance in
different regions of Europe differ quite a bit. Northern Europe has lower scores in the
uncertainty avoidance, whereas Southern European countries have almost solely
high uncertainty avoidance levels.
Southern European countries are described to have a lot of rules and regulations to
support the daily living and to avoid uncertainty, although these rules may be obeyed
only when it is feasible. People express their feelings strongly, since the uncertainty
in situations raises strong feelings of not being in control of the situation and the fear
of unknown. ”Countries exhibiting high uncertainty avoidance maintain rigid codes of
belief and behaviour and are intolerant of unorthodox behaviour and ideas”. (The
Hofstede Centre n.d.)
Figure 8. Distribution of level of uncertainty avoidance in different regions in Europe.

32
The strength of the Catholic Church in Southern Europe can be seen as one result of
the high uncertainty avoidance level. The church offers rules and answers to
different aspects of people’s lives, thereby reducing the uncertainty.
Four out of the seven Northern European countries that were researched had low
uncertainty avoidance level. None of the countries had high uncertainty avoidance
level and the three with medium level of uncertainty avoidance all had scores lower
than 60. What is described to be common in these countries is that the laws and
rules that exist (not so many of them) are the ones that are really necessary and will
be followed precisely. New and different is seen positive and innovative ideas are
valued. (The Hofstede Centre n.d.)
As can be read from figure 8, Eastern and Western countries of Europe are divided
almost equally to medium and high uncertainty avoidance. It can be described that
the cultures in the medium category prefer to have structure and predictability in
their lives, security is also important. In some countries the certainty is reach through
education and concepts that provide detail, context and background (e.g. France and
Germany). (The Hofstede Centre n.d.)
2.3.4 Leaders in the Technological Development
The cultural dimension of technological development shows how developed the
culture is in the sense of technology. Baumgartner (2003, 35) describes technological
development to have a scale from ”backwardness” to ”advancement”.
Archibugi and Coco (2004) studied the culture’s technological capabilities. Nations
were ranked from ”leaders” to ”marginalized” depending on their technological
capabilities (Archibugi et al. 2004). The technological capabilities that a culture has
can be reflected to its technological development. A culture that has not developed
technologically does not hold technological capabilities either. These two scales are
combined in the figure 9.

33
Figure 9. Categories of technological capabilities on the scale from backwardness to
advancement (categories from Archibugi et al. 2004).
In the following chapters are described the method in which the countries were
ranked for their technological capabilities in Archibugi et al. (2004) with ArCo index
and why this ranking is still valid, even approximately a decade after its development.
ArCo Index
Archibugi et al. present a way of evaluating different countries’ technological
capabilities through ArCo index. ArCo index uses three dimensions that are
constructed from sub-indexes to evaluate the technological capabilities of a country
(see figure 10). An equal value is given for each of these dimensions in creation of
the technological capability index. The data for the sub-indexes was collected from
multiple sources, such as US Patent and Trademark Office, the World Bank’s
database, US National Science Foundation and CSRS. The bigger index number the
higher country’s ranking is on the list of technological capabilities (the highest score
that could be achieved is 1,000). The 162 countries that are ranked are categorized
into four categories: leaders, potential leaders, latecomers and marginalized (see
figure 9). (Archibugi et al. 2004, 630 & 632)
34
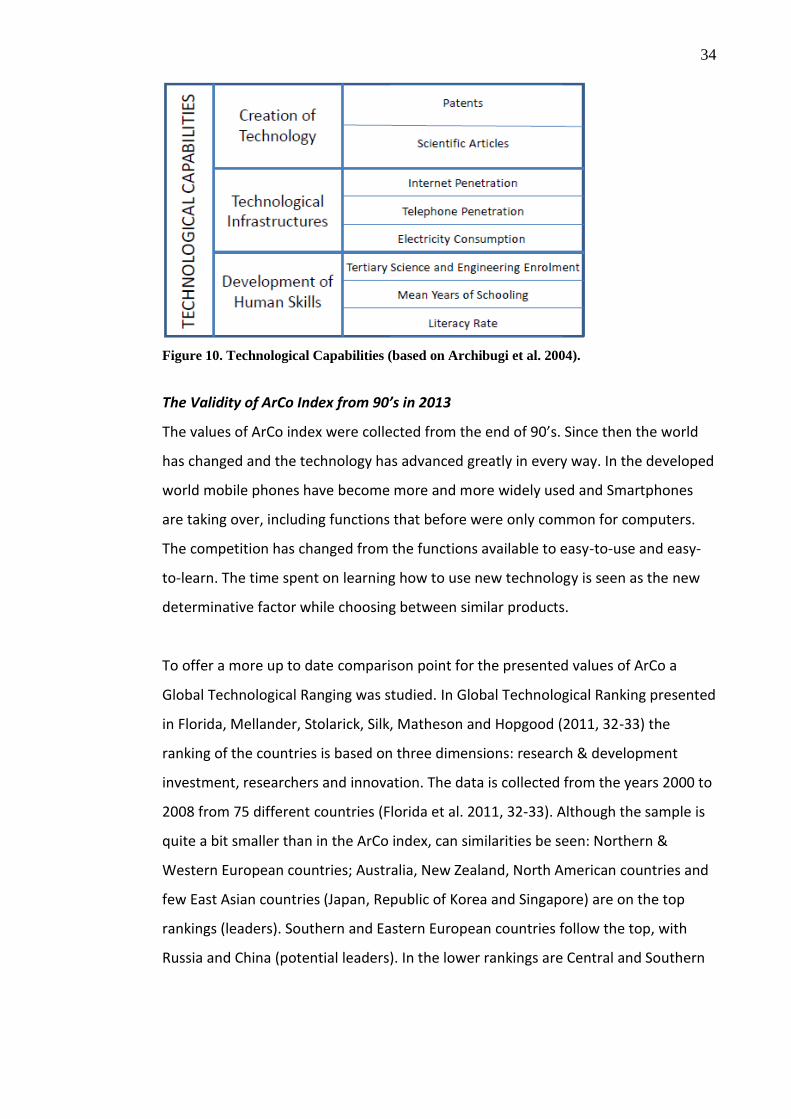
Figure 10. Technological Capabilities (based on Archibugi et al. 2004).
The Validity of ArCo Index from 90’s in 2013
The values of ArCo index were collected from the end of 90’s. Since then the world
has changed and the technology has advanced greatly in every way. In the developed
world mobile phones have become more and more widely used and Smartphones
are taking over, including functions that before were only common for computers.
The competition has changed from the functions available to easy-to-use and easy-
to-learn. The time spent on learning how to use new technology is seen as the new
determinative factor while choosing between similar products.
To offer a more up to date comparison point for the presented values of ArCo a
Global Technological Ranging was studied. In Global Technological Ranking presented
in Florida, Mellander, Stolarick, Silk, Matheson and Hopgood (2011, 32-33) the
ranking of the countries is based on three dimensions: research & development
investment, researchers and innovation. The data is collected from the years 2000 to
2008 from 75 different countries (Florida et al. 2011, 32-33). Although the sample is
quite a bit smaller than in the ArCo index, can similarities be seen: Northern &
Western European countries; Australia, New Zealand, North American countries and
few East Asian countries (Japan, Republic of Korea and Singapore) are on the top
rankings (leaders). Southern and Eastern European countries follow the top, with
Russia and China (potential leaders). In the lower rankings are Central and Southern

35
American countries as well as Asian countries. Since almost none of the marginalized
countries are included in the ranking, it can be inferred that the lower rankings are
comparable with the latecomers of the ArCo index.
Therefore, even with the great changes and development that has happened during
the last decade, most of the regions can be said to be in almost the same positions in
the technological development as in ArCo in 2004. The same countries are in the
leading positions, even though the places may have slightly changed (see figure 11).
ArCo Ranking2004
Global TechnologyRanking 2011
Change inRanking
1. Sweden Finland +12. Finland Japan +63. Switzerland United States +24. Israel Israel 05. United States Sweden -46. Canada Switzerland -37. Norway Denmark +28. Japan Republic of Korea +11 (19.)9. Denmark Germany +3 (12.)10. Australia Singapore +11 (21.)
Figure 11. Changes in the top places of country rankings in technological development. Data
extracted for ArCo Ranking from Archibugi et al. (2004, 637) and Global Technology
Ranking from Florida et al. (2011, 32).
European Technological Development Level
The European countries differ from each other in this dimension slightly. Northern
and Western European countries rank higher than Southern and Eastern European
countries, albeit staying in “potential leaders” category. While looking on to the
countries that were used to evaluate the uncertainty avoidance level (see page 28),
the average of these countries ArCo index is 0.588, which would place them in the
leaders category.
When thinking about the factors that were used to create the ArCo and Global
Technology rankings, it can be said that most European countries do well in them.
Internet and telephones (already moved more to mobile phones) are things that

36
people are expected to know and use (except of the older generations). Electricity
consumption has gone even so high that people are seeking of ways to use less
electricity after realizing the environmental harms that are caused by the use of
electricity. New more environmentally friendly ways are developed to generate
electricity to cherish the nature.
Since European countries are listed as developed (Developed and developing regions
n.d.) the basic education level is quite high compared to the developing countries.
Countries such as Germany and Finland are famous of their engineering skills
(Germany of mechanical engineering (e.g. Audi, Bosch, Daimler, and Porsche) and
Finland of the information technology (e.g. Linux, Nokia)).
Japanese Technological Development Level
In ArCo index Japan scores 0.721, which is higher than the average of Europe and
therefore places Japan in the leaders category (Archibugi et al. 2004, 637). Like the
European countries, Japan is counted as developed country (Developed and
developing regions n.d.). The literacy rate is high 99% (Literacy 2002) and the amount
of years of schooling (from primary to tertiary) is high, 15 years (School life
expectancy (primary to tertiary education) 2008). According to CIA’s World Factbook,
Japan has the 3rd highest energy consumption amount in the world (Country
Comparison :: Electricity – Consumption 2011).
When it comes to technology, Japan is well known for technology industry. Japan
hosts such companies as Sony, Fuji, Panasonic, Canon, Toshiba, Honda, Toyota,
Nintendo and Mitsubishi.
37
2.3.5 Differences in the Time Perception
When it comes to time perception, sometimes it is difficult to define to which
(monochronic or polychronic) time perception a national culture belongs to.
Although Hall and Hall (1990, 13) state that “Like oil and water, the two systems do
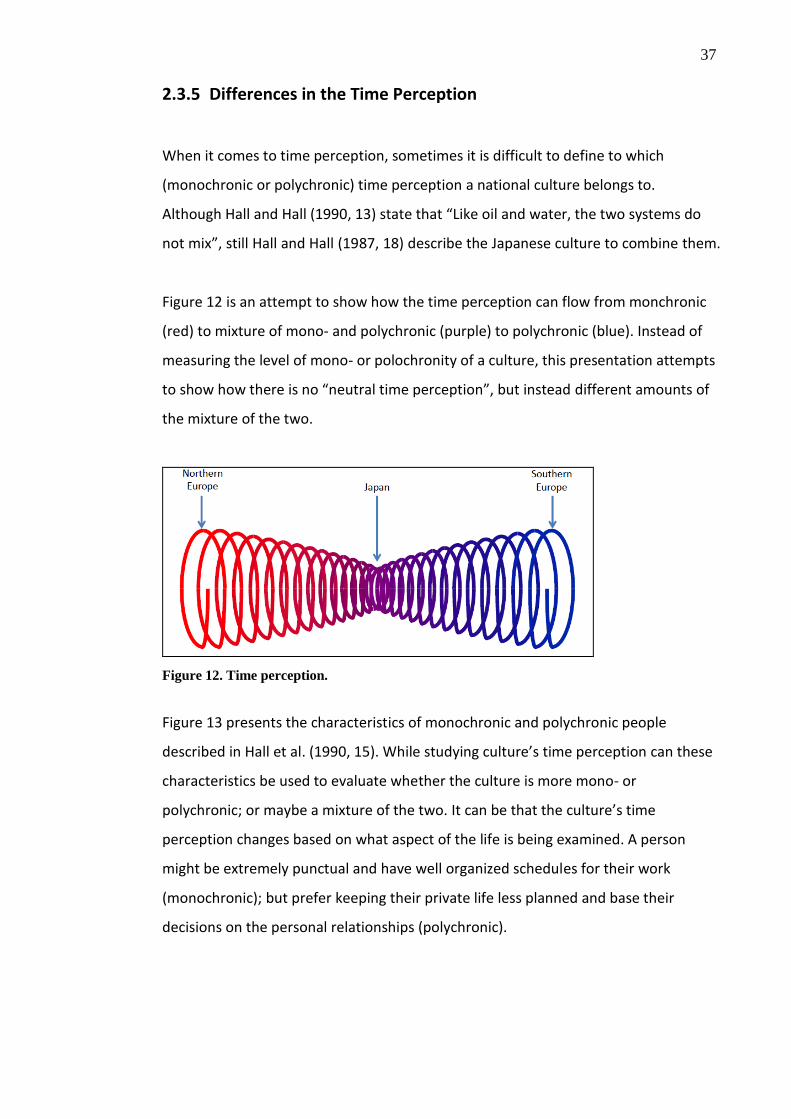
not mix”, still Hall and Hall (1987, 18) describe the Japanese culture to combine them.
Figure 12 is an attempt to show how the time perception can flow from monchronic
(red) to mixture of mono- and polychronic (purple) to polychronic (blue). Instead of
measuring the level of mono- or polochronity of a culture, this presentation attempts
to show how there is no “neutral time perception”, but instead different amounts of
the mixture of the two.
Figure 12. Time perception.
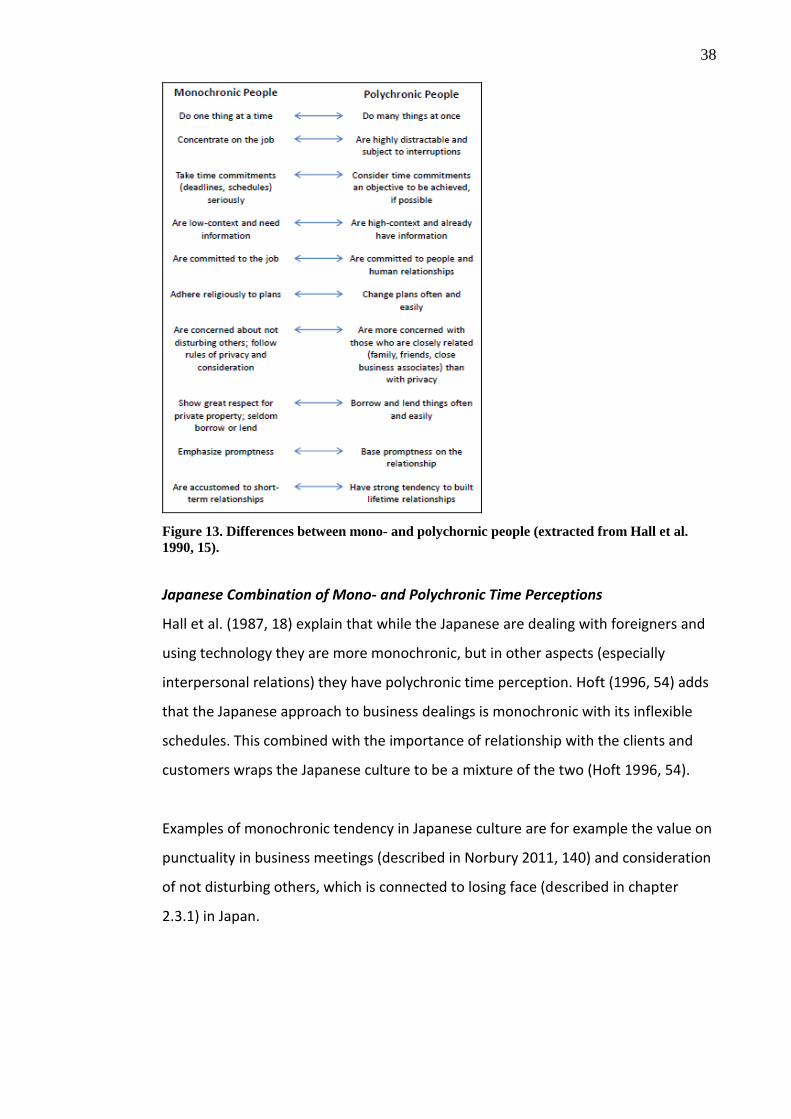
Figure 13 presents the characteristics of monochronic and polychronic people
described in Hall et al. (1990, 15). While studying culture’s time perception can these
characteristics be used to evaluate whether the culture is more mono- or
polychronic; or maybe a mixture of the two. It can be that the culture’s time
perception changes based on what aspect of the life is being examined. A person
might be extremely punctual and have well organized schedules for their work
(monochronic); but prefer keeping their private life less planned and base their
decisions on the personal relationships (polychronic).
38
Figure 13. Differences between mono- and polychornic people (extracted from Hall et al.
1990, 15).
Japanese Combination of Mono- and Polychronic Time Perceptions
Hall et al. (1987, 18) explain that while the Japanese are dealing with foreigners and
using technology they are more monochronic, but in other aspects (especially
interpersonal relations) they have polychronic time perception. Hoft (1996, 54) adds
that the Japanese approach to business dealings is monochronic with its inflexible
schedules. This combined with the importance of relationship with the clients and
customers wraps the Japanese culture to be a mixture of the two (Hoft 1996, 54).
Examples of monochronic tendency in Japanese culture are for example the value on
punctuality in business meetings (described in Norbury 2011, 140) and consideration
of not disturbing others, which is connected to losing face (described in chapter
2.3.1) in Japan.
39
In the other hand examples of the polychronic tendencies of Japanese culture are
high-context nature of it (see chapter 2.3.1), the commitment to people and
therefore basing the promptness on the relationship. Norbury(2011, 140) describes
that while doing business in Japan what is important is “who you know” rather than
“what you know”.
The Opposites in the Time Perception within Europe
The time perception within different European countries differs quite a bit. Southern
European countries are more polychronic with their flexible understanding of time
and schedules, whereas Northern European countries are monochronic with their
prompt schedules and valuing work over relationships.
While studying in Spain (2010-2011) I experienced the different understandings of
time between different nationalities in Europe, when arriving to a scheduled meeting
few minutes earlier. The only other ones who had arrived on time were the Germans.
The next ones to arrive were the Belgium and French. And finally, usually way pass
the scheduled meeting time Spanish, Turks, Romanians and Italians arrived to the
meeting point.
Even better known for their promptness than Finns are the Germans. As described in
GlobalEDGE website that offers global business knowledge, the Germans do not
accept being late from a meeting. Being late would be considered as a huge etiquette
mistake and a bad start for business. (GlobalEDGE n.d.)
The same separation between Southern and Northern Europe continues when
thinking about the context level of the cultures that is one of the aspects included in
the characteristics of time perception (see chapter 2.3.1). Northern countries are
low-context whereas Southern European countries are more high-context. The
Southern Europeans can also be described to be more oriented and committed to
the human relationships, whereas the Northern and Western Europeans are
committed to the job. The same goes to privacy: Northern European people usually
40
value their privacy more, whereas Southern Europeans are more accustomed to
sharing things with their closely related family, friends and business associates.
2.3.6 Authority Conception and Power Distance
Baumgartner states that Hoft (n.d.) describes authority conception and power
distance dimensions closely related to each other. Hofstede’s power distance is more
concentrated in the boss-employee relationship as well as the hierarchy in the
society and its acceptance; and how it affects the communication between members
of the culture. Whereas the authority conception dimension by Condon & Yousef is
used to describe the leadership in different cultures. (Baumgartner 2003, 49)
For this thesis work it was decided that power distance provides more valuable
information on the case that is being handled. That is why power distance was used
to describe the authority conception dimension in the cultural models.
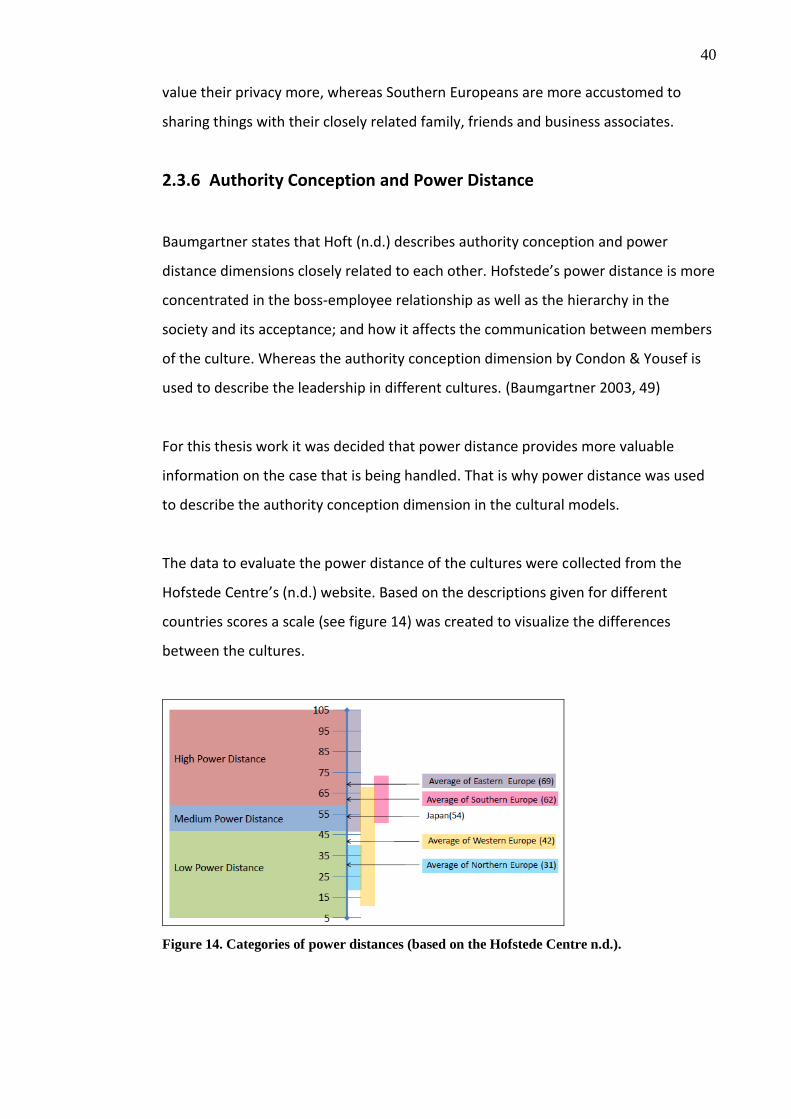
The data to evaluate the power distance of the cultures were collected from the
Hofstede Centre’s (n.d.) website. Based on the descriptions given for different
countries scores a scale (see figure 14) was created to visualize the differences
between the cultures.
Figure 14. Categories of power distances (based on the Hofstede Centre n.d.).
41
Medium Power Distance in Japan
Japan is given the score of 54 in the power distance dimension. Japan is described to
be mildly hierarchical culture. This is a result of the hierarchical decision making
process, where the process goes through all the hierarchical levels before the result
is confirmed. This also means that the one on the highest level of hierarchy cannot
either make the decisions by himself and thus the complete power is not centralized
to one person. Another reason for the higher ranking is the fact that the power is not
inherited but gotten by proving one’s skills. (The Hofstede Centre n.d.)
Hall et al. compare the hierarchical structure in Japan to the one existing in army.
There is a chain of command that needs to be followed, the different hierarchical
statuses of people are acknowledged daily and loyalty is important. They also state
that the emphasis of the performance is more on the group rather than in individuals,
similar to army. (Hall et al. 1987, 42-43)
An aspect of the low power distance is the distribution on knowledge. The high-
context communication in Japan requires that all the parties have the same level of
knowledge about the topic. Therefore open offices are common, where sharing
information is easy. (Hall et al. 1987, 75) Therefore it can be said that even though in
multiple aspects Japanese culture has high power distance, it has also qualities that
can be described to be characteristics of low power distance.
Manners such as bowing (the depth of the bow depending on the status of the
person and the person to whom the bowing is done) and avoiding direct eye contact
are used to show the respect to the superiors.
Low and High Power Distance within Europe
To examine the differences in the power distance within Europe, the data of the
same 24 countries as examined in the uncertainty avoidance dimension were
collected from The Hofstede Centre’s (n.d.) website. In the appendix 1 is a collection
of these values. A separation between Western, Eastern, Northern and Southern
42
European countries is done to enable comparison between different regions of
Europe. The average value of each region is shown under the group.
Northern and Western European countries are ranked to be low power distance
cultures; whereas Southern and Eastern European countries are complete opposite
to that with their high rankings. Exceptions in this pattern are Belgium and France
that unlike the rest of the Western European countries are ranked to have high
power distance.
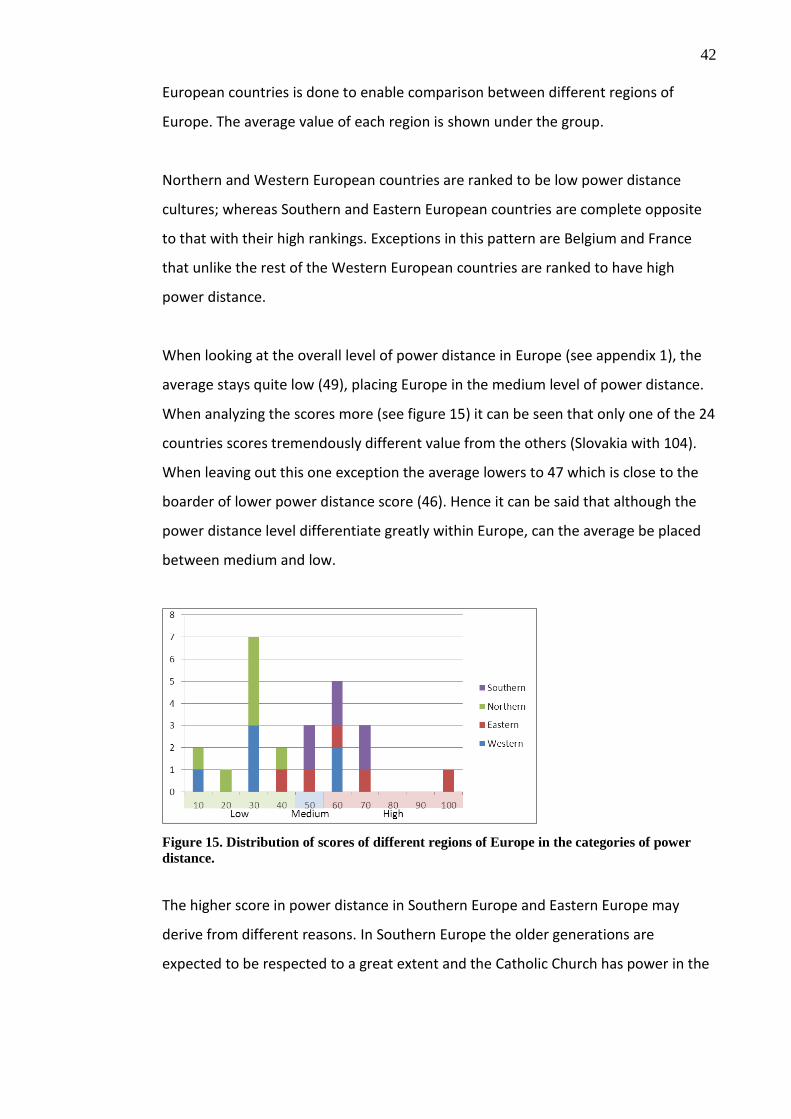
When looking at the overall level of power distance in Europe (see appendix 1), the
average stays quite low (49), placing Europe in the medium level of power distance.
When analyzing the scores more (see figure 15) it can be seen that only one of the 24
countries scores tremendously different value from the others (Slovakia with 104).
When leaving out this one exception the average lowers to 47 which is close to the
boarder of lower power distance score (46). Hence it can be said that although the
power distance level differentiate greatly within Europe, can the average be placed
between medium and low.
Figure 15. Distribution of scores of different regions of Europe in the categories of power
distance.
The higher score in power distance in Southern Europe and Eastern Europe may
derive from different reasons. In Southern Europe the older generations are
expected to be respected to a great extent and the Catholic Church has power in the
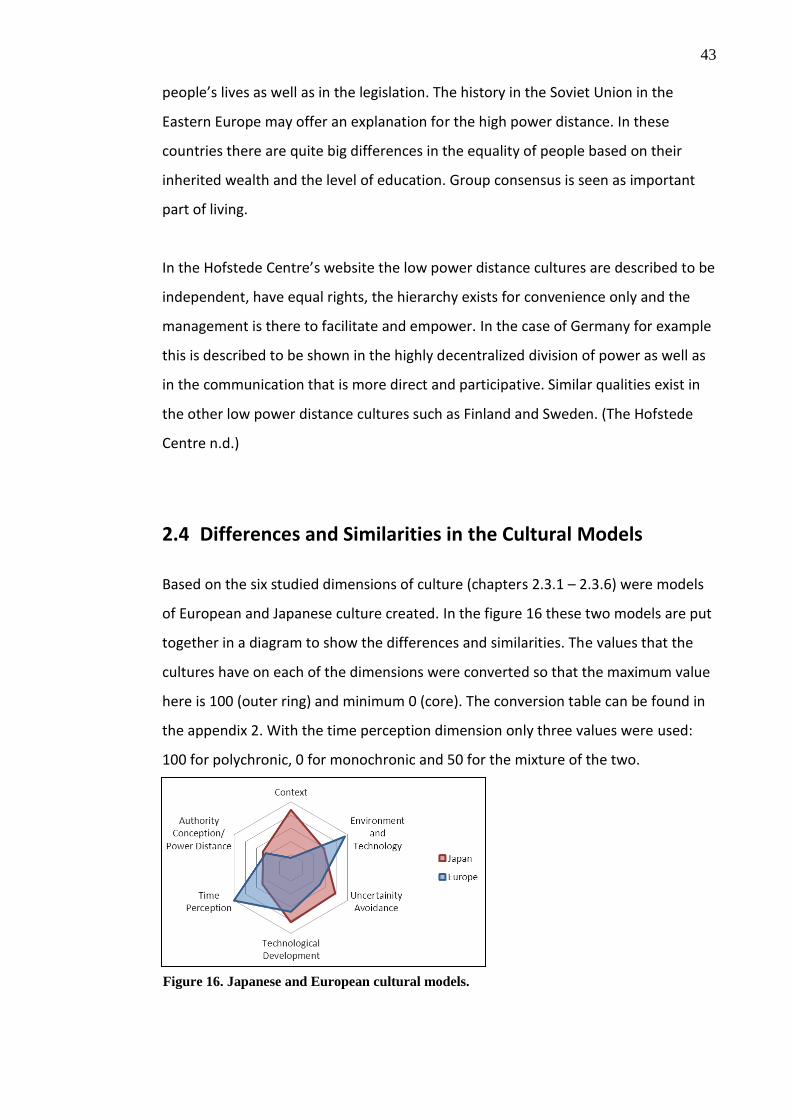
43
people’s lives as well as in the legislation. The history in the Soviet Union in the
Eastern Europe may offer an explanation for the high power distance. In these
countries there are quite big differences in the equality of people based on their
inherited wealth and the level of education. Group consensus is seen as important
part of living.
In the Hofstede Centre’s website the low power distance cultures are described to be
independent, have equal rights, the hierarchy exists for convenience only and the
management is there to facilitate and empower. In the case of Germany for example
this is described to be shown in the highly decentralized division of power as well as
in the communication that is more direct and participative. Similar qualities exist in
the other low power distance cultures such as Finland and Sweden. (The Hofstede
Centre n.d.)
2.4 Differences and Similarities in the Cultural Models
Based on the six studied dimensions of culture (chapters 2.3.1 – 2.3.6) were models
of European and Japanese culture created. In the figure 16 these two models are put
together in a diagram to show the differences and similarities. The values that the
cultures have on each of the dimensions were converted so that the maximum value
here is 100 (outer ring) and minimum 0 (core). The conversion table can be found in
the appendix 2. With the time perception dimension only three values were used:
100 for polychronic, 0 for monochronic and 50 for the mixture of the two.
Figure 16. Japanese and European cultural models.
44
In the following are the descriptions of these differences and similarities on each of
the dimensions. By stating the differences in the dimensions the factors that should
be examined more carefully are discovered and the less important factors can be left
out from the extent of this thesis work. The factors are used as a base for a set of
Japan specific cultural heuristics (see chapter 2.4) that can help to recognize the
aspects of Japanese user experience that should be considered when designing a
product in Europe for Japanese markets.
The Possibilities in the Usage of High Context Elements
In the context dimension of culture the two cultures studied here differ greatly.
Japan is high-context culture, whereas European culture is low-context. Although
more problems would probably occur if the interface was to be localized from high-
context to low-context culture, can high-context be used here to support the user
experience of the Japanese users.
Differences in the Perception of Technology
The differences between Japanese and European cultures in the matter of
environment and technology are small, but nevertheless existing. Not either one of
the cultures feels negatively about the technology, for both it is part of the everyday
life. What is different is the experience of technology. For Japanese technology is
normal part of the environment, almost ubiquitous, it has become unnoticeable part
of the environment; whereas in Europe technology is experienced as controlling
factor over the environment and less embedded in the environment. This difference
in the perception of technology should be recognized while localizing the user
interface.
“Try and See” Is Not an Option
Japan is evaluated here to be high uncertainty avoidance culture. As the uncertainty
avoidance level in Europe differs greatly based on the region that is being observed,
the average falls in the medium level of uncertainty avoidance. Though, for this
thesis work it was seen more feasible to use the value that show the most contrast

45
with Japanese culture, which was the Northern European culture with its very low
level of uncertainty avoidance. Therefore the two cultures can be seen to have great
differences in the uncertainty avoidance dimension. As the Japanese avoid situations
that are uncertain, it is important to know the results of certain actions beforehand.
The European ”learn by mistake” way is not considerable in Japan.
Equally Technologically Advanced Cultures
The two cultures have same level of technological development. They both are
considered to be leaders in technological capabilities and therefore are in the
advancement end of the scale.
The problems that might exist while localizing a product from the advancement end
of the scale to a culture in the backwardness end do not exist here. Therefore, the
technological development dimension was evaluated to be irrelevant here and was
left out of the extent of the thesis work.
Time Perception for All
In here the time perception value from Northern and Western Europe was used to
describe the European time perception, since monochronic culture was seen to
create bigger expectations for the user interface design. Using the average of
European cultures was not feasible, since South & East and North & West differ
greatly in this dimension. The average would have not resembled neither one of
them, but a mixture of the two which is not the actual case.
As Japan is described both mono- and polychornic culture, but specified to have
more monochronic tendencies in the matters of technology and work, it is treated as
monochronic culture here. Therefore the factors that are important for monochronic
culture are examined in the user interface. It was evaluated that a person from
polychronic culture would not probably have any greater problems of using
monochronic user interface, whereas a monochronic person would have great
problems while using a polychronic user interface.
46
Recognizing the Needs of High Power Distance Culture
The average of Europe in power distance is quite similar to Japan’s value, they both
are in the medium power distance category. However, as Europe has clear
separation between North & West (low) and South & East (high); and as the
description of medium power distance shares more similarities with high power
distance than low, is Europe treated as low power distance culture and Japan as high
power distance culture. Hereby the factors important for high power distance culture
in user interface should be recognized here.
2.5 Japanese Cultural Heuristics
Detecting the differences in the six cultural dimensions evaluated as the most
important ones for user interface design (in Baumgartner 2003) were used to create
guidelines about the factors that should be considered when designing a user
interface for Japanese markets.
A set of Japanese Cultural Heuristics was created based on the cultural models
presented in the chapter 2.3. The cultural heuristics attempt to describe some of the
aspects that are important for the Japanese user experience. The Japanese Cultural
Heuristics are shown in similar format as Dialog Principles for User Interface Design
(DIN-EN-ISO 9241, Part 110) (see appendix 3) that are currently in use at ETAS. The
document with the Japanese Cultural Heuristics can be found in the appendix 4. In
the following are descriptions of the cultural heuristics and their connection to the
cultural models.

47
2.5.1 High Context Elements (Context)
The usage of high-context elements would further support the usage of the user
interface in high-context culture. The usual communication in everyday life for a
person in high-context culture happens through collecting information from multiple
sources: not only direct communication is used as a base for the decisions, but also
the other elements of the context. Such things as body language, impressions and
the type of the relationships that the people have create the full meaning that is
conveyed through the communication.
When transferred to the user interface design this would mean that information that
the user interface provides should not only be direct labeling of objects and
commands, but also other aspects should be considered. Such aspects are how the
culture perceives colors, shapes and sounds to support the interaction. One culture’s
perception of a color can tremendously effect on how the message is interpreted.
For example the authors own perception of color red would make her pay attention
to the thing that is shown on red and look for the reason of this alarm state.
However, as shown in Barber and Badre’s color-culture chart (see third page of the
appendix 4), in China the color red has completely different meaning, it resembles
happiness.
2.5.2 Intuitive Ways of Interaction (Environment and Technology)
Japanese culture’s perceiving of technology as part of environment could be
supported by providing intuitive ways of interaction with the user interface.
Instead of making the user adjust to the technology provided in the user interface,
should the user interface provide intuitive ways of interaction with the system, like it
would be part of the already existing environment. This could be supported by for
example using interaction behaviors that are based on real world (e.g. instead of
48
scrolling down the manual document, providing a way to “turn the page” in the
document like in books). These actions could be prompted by instruction messages,
such as “swipe the screen to unlock”, in which case the system would predict which
would be the wanted actions.
Other aspect of the intuitive ways of interaction would be to provide a clear
structure of the software in which the connections between different components
could be easily recognized.
2.5.3 Certainty of Results of One’s Actions (Uncertainty Avoidance)
The high uncertainty avoidance level of Japanese culture creates high requirements
for the design of the user interface. The user should be able to recognize the results
of his actions before actually conducting them. Ito and Nakakoji (1996, 115) describe
that “Japanese users read instruction manuals very carefully before they start using a
system” by which they try their best to avoid breakdowns.
Avoiding the uncertainty of the results of the actions can be achieved by limiting the
choices, presenting clear metaphors and limiting the amount of data (Marcus &
Gould 2001, 19). This would also include the usage of high-context elements, so that
the user could have the confirmation of the type of action achieved through multiple
sources. Marcus et al. (2001, 19) also suggest using navigation system that provides
clear indications of the current location in the system, the next and previous steps.
This would help to prevent the user from getting lost in the system.
To avoid the ambiguity, clear labeling should be provided and the actions that
become irreversible once they are done should require confirmation from the user
before they are being carried out.
The manual is important for the Japanese users as mentioned by Ito et al. (1996, 115).
Therefore it is important to provide a wide manual that covers all the aspects of the
49
system, so that the user can at least inquire more knowledge from there in case he
encounters a situation in which he feels uncertain of the actions.
2.5.4 Clear Order and Progress of Tasks (Time Perception)
The monochronic cultures prefer having clear schedules and plans to follow. In the
terms of user interface design this aspect should be considered by providing a clear
order of the tasks and the possibility to follow the progress. The possibility to follow
the progress should include the full status of the system as well as the status of each
the smaller task. Meaning that in a case where multiple smaller tasks are required to
be done to complete the problem that the system solves should the status to
accomplish this be shown, as well as the progress of each smaller task included in
this over all task.
This can be achieved by dividing the tasks into smaller subtasks and using linear
interaction patterns to complete these tasks. The layout should also give indications
of the connections between different components in the system and about the order
in which they should be conducted.
2.5.5 Flexibility of the Time Consumption (Time Perception)
The arrangement of the schedules for monochronic cultures base on the time spent,
rather than to the completeness of the task(s). Therefore it is important that the
system supports the user’s freedom to choose when to stop a certain task and be
able to continue from the same point later without losing any data.
This could be supported by creating small enough tasks that can be completed
quickly, without having to continue later. The system should enable the user to
return to the same view as where it was the last time that the user closed the system.
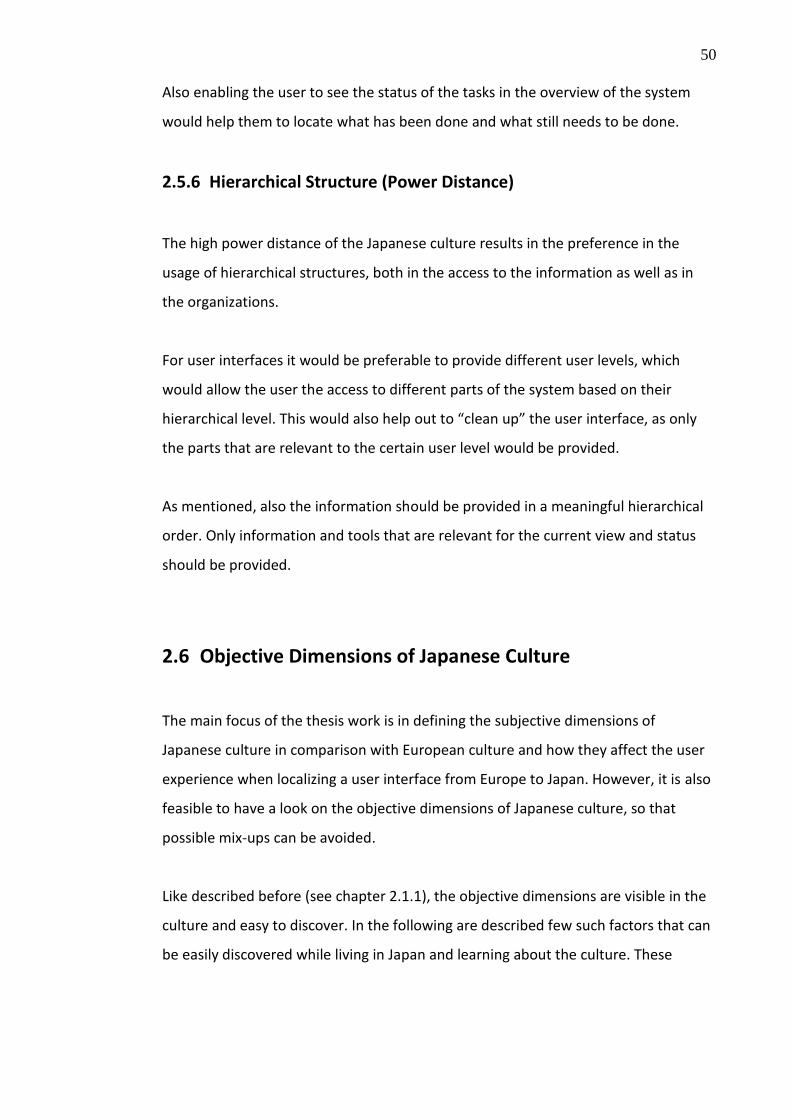
50
Also enabling the user to see the status of the tasks in the overview of the system
would help them to locate what has been done and what still needs to be done.
2.5.6 Hierarchical Structure (Power Distance)
The high power distance of the Japanese culture results in the preference in the
usage of hierarchical structures, both in the access to the information as well as in
the organizations.
For user interfaces it would be preferable to provide different user levels, which
would allow the user the access to different parts of the system based on their
hierarchical level. This would also help out to “clean up” the user interface, as only
the parts that are relevant to the certain user level would be provided.
As mentioned, also the information should be provided in a meaningful hierarchical
order. Only information and tools that are relevant for the current view and status
should be provided.
2.6 Objective Dimensions of Japanese Culture
The main focus of the thesis work is in defining the subjective dimensions of
Japanese culture in comparison with European culture and how they affect the user
experience when localizing a user interface from Europe to Japan. However, it is also
feasible to have a look on the objective dimensions of Japanese culture, so that
possible mix-ups can be avoided.
Like described before (see chapter 2.1.1), the objective dimensions are visible in the
culture and easy to discover. In the following are described few such factors that can
be easily discovered while living in Japan and learning about the culture. These

51
factors can be easily detected and integrated in the localized user interface. Making
this small effort already improves the user experience. A checklist created of the
objective matters of Japanese can be found in the appendix 6.
2.6.1 Language
It is defined in the CIA’s World Factbook that Japanese is the main language of Japan.
When having a look in the ethnic groups in Japan are 98.5 % Japanese, 0.5% Koreans
and 0.4% Chinese and the rest others. (People and Society :: Japan n.d.) With this it
can be stated that the language to be used should be Japanese.
2.6.2 Date and Time Formatting and Calendar
If both, time and date, are presented, date is shown first and time then.
The time is shown in 24-hour clock, presenting the hour on the left side and minutes
on the right side. The hours and minutes are separated by colon (:). In a case the
hour is only one digit (e.g. 8) no zero (0) is applied in front of the hour (e.g. 8.35).
In the date formats the order is from left to right as follows: year, month and day.
The different components of the date may be separated either by dots (.), slashes (/)
or with suffix (年 meaning year, 月 meaning month and 日 meaning day). If a day of
the week is shown, it is on the right side of the date. See figure 17 for examples of
date and time formatting.

52
Although Japan has its own calendar system (based on the current emperor’s reign),
is Gregorian calendar in general use. In the calendar the week starts from Sunday
and ends on Saturday. See figure 18 for examples of Japanese calendars.
2.6.3 Text Formatting
There are two writing systems in use in Japan (yokogaki and tategaki). While
observing the existing websites (see figure 19) and other user interfaces (see figure
20) it can be recognized that yokogaki (from left to right and then top to bottom) is in
Figure 17. Examples of date and time formatting in Japan (screenshots from Microsoft Outlook
2010 and i Phone 4; pictures taken by Elisa Karpoff).
Figure 18. Examples of Japanese calendars (screenshots from Microsoft Outlook 2010 and iPhone
4; picture taken by Elisa Karpoff).
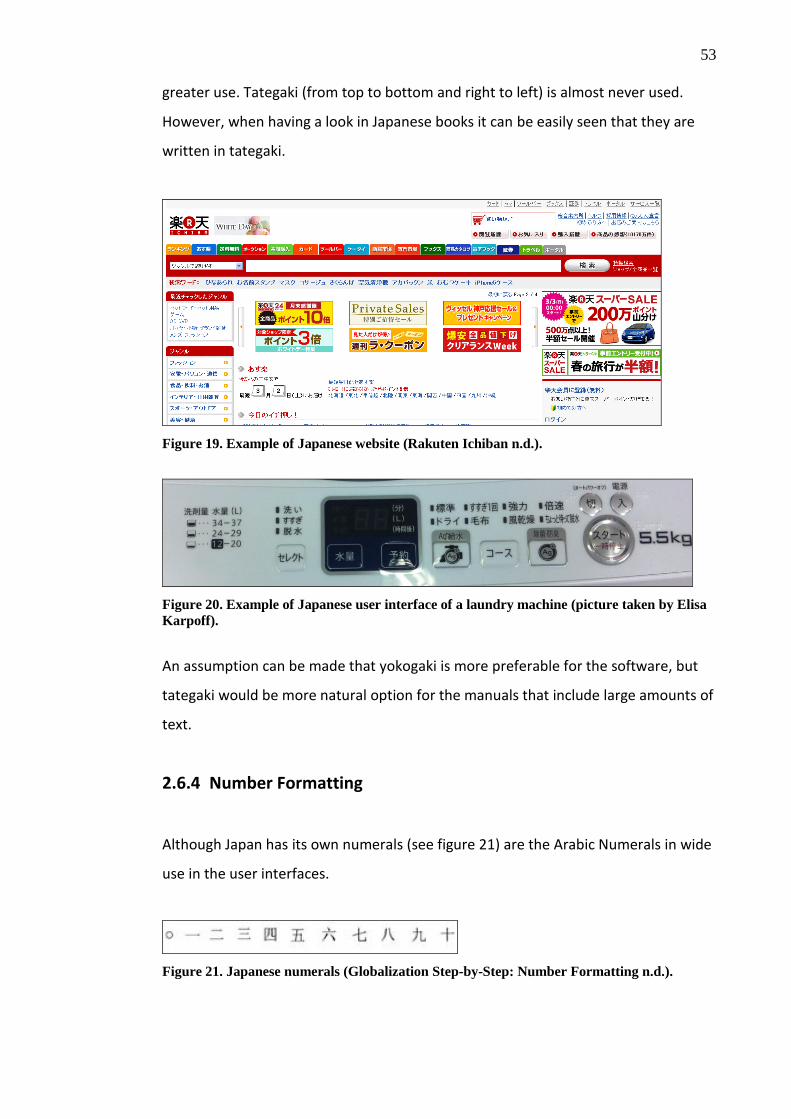
53
greater use. Tategaki (from top to bottom and right to left) is almost never used.
However, when having a look in Japanese books it can be easily seen that they are
written in tategaki.
Figure 19. Example of Japanese website (Rakuten Ichiban n.d.).
Figure 20. Example of Japanese user interface of a laundry machine (picture taken by Elisa
Karpoff).
An assumption can be made that yokogaki is more preferable for the software, but
tategaki would be more natural option for the manuals that include large amounts of
text.
2.6.4 Number Formatting
Although Japan has its own numerals (see figure 21) are the Arabic Numerals in wide
use in the user interfaces.
Figure 21. Japanese numerals (Globalization Step-by-Step: Number Formatting n.d.).
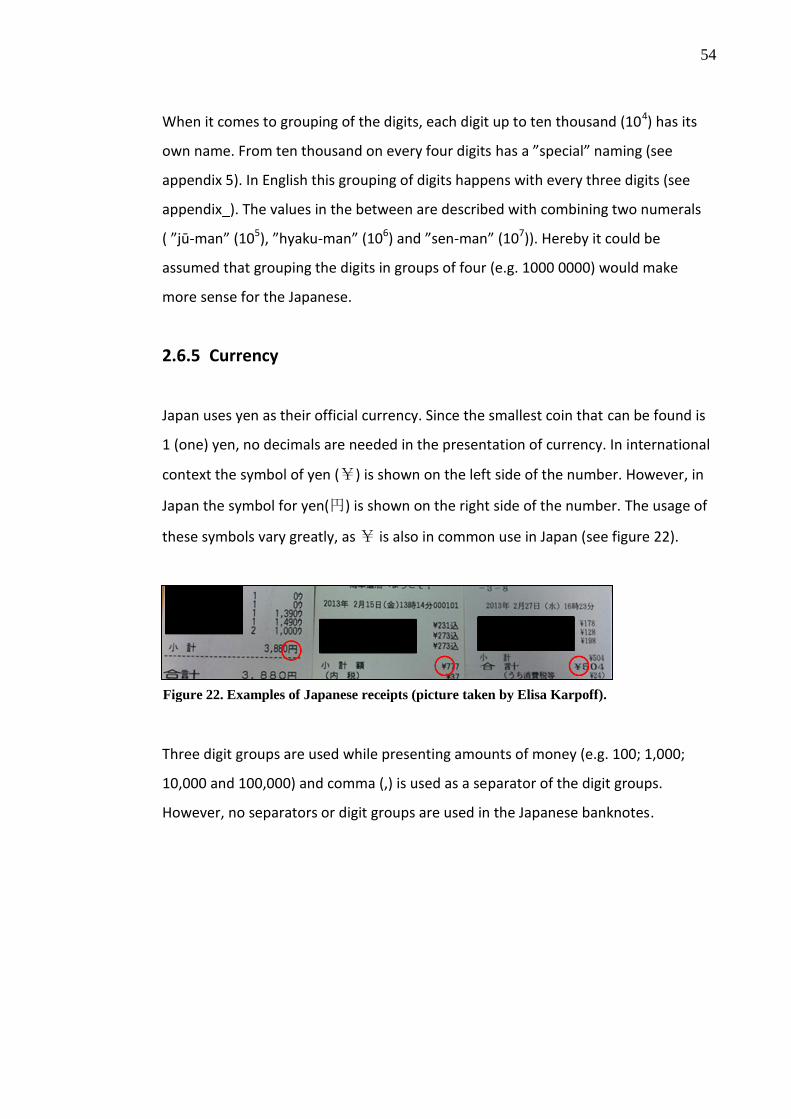
54
When it comes to grouping of the digits, each digit up to ten thousand (104) has its
own name. From ten thousand on every four digits has a ”special” naming (see
appendix 5). In English this grouping of digits happens with every three digits (see
appendix_). The values in the between are described with combining two numerals
( ”jū-man” (105), ”hyaku-man” (106) and ”sen-man” (107)). Hereby it could be
assumed that grouping the digits in groups of four (e.g. 1000 0000) would make
more sense for the Japanese.
2.6.5 Currency
Japan uses yen as their official currency. Since the smallest coin that can be found is
1 (one) yen, no decimals are needed in the presentation of currency. In international
context the symbol of yen (¥) is shown on the left side of the number. However, in
Japan the symbol for yen(円) is shown on the right side of the number. The usage of
these symbols vary greatly, as ¥ is also in common use in Japan (see figure 22).
Three digit groups are used while presenting amounts of money (e.g. 100; 1,000;
10,000 and 100,000) and comma (,) is used as a separator of the digit groups.
However, no separators or digit groups are used in the Japanese banknotes.
Figure 22. Examples of Japanese receipts (picture taken by Elisa Karpoff).
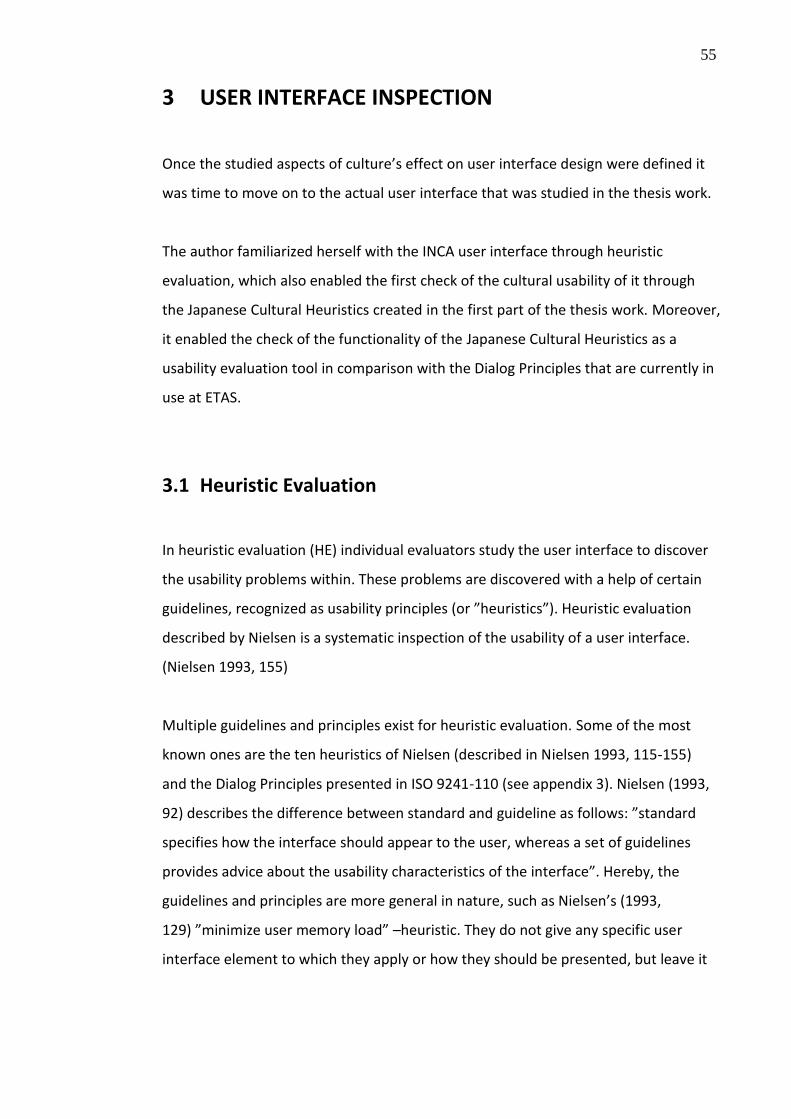
55
3 USER INTERFACE INSPECTION
Once the studied aspects of culture’s effect on user interface design were defined it
was time to move on to the actual user interface that was studied in the thesis work.
The author familiarized herself with the INCA user interface through heuristic
evaluation, which also enabled the first check of the cultural usability of it through
the Japanese Cultural Heuristics created in the first part of the thesis work. Moreover,
it enabled the check of the functionality of the Japanese Cultural Heuristics as a
usability evaluation tool in comparison with the Dialog Principles that are currently in
use at ETAS.
3.1 Heuristic Evaluation
In heuristic evaluation (HE) individual evaluators study the user interface to discover
the usability problems within. These problems are discovered with a help of certain
guidelines, recognized as usability principles (or ”heuristics”). Heuristic evaluation
described by Nielsen is a systematic inspection of the usability of a user interface.
(Nielsen 1993, 155)
Multiple guidelines and principles exist for heuristic evaluation. Some of the most
known ones are the ten heuristics of Nielsen (described in Nielsen 1993, 115-155)
and the Dialog Principles presented in ISO 9241-110 (see appendix 3). Nielsen (1993,
92) describes the difference between standard and guideline as follows: ”standard
specifies how the interface should appear to the user, whereas a set of guidelines
provides advice about the usability characteristics of the interface”. Hereby, the
guidelines and principles are more general in nature, such as Nielsen’s (1993,
129) ”minimize user memory load” –heuristic. They do not give any specific user
interface element to which they apply or how they should be presented, but leave it
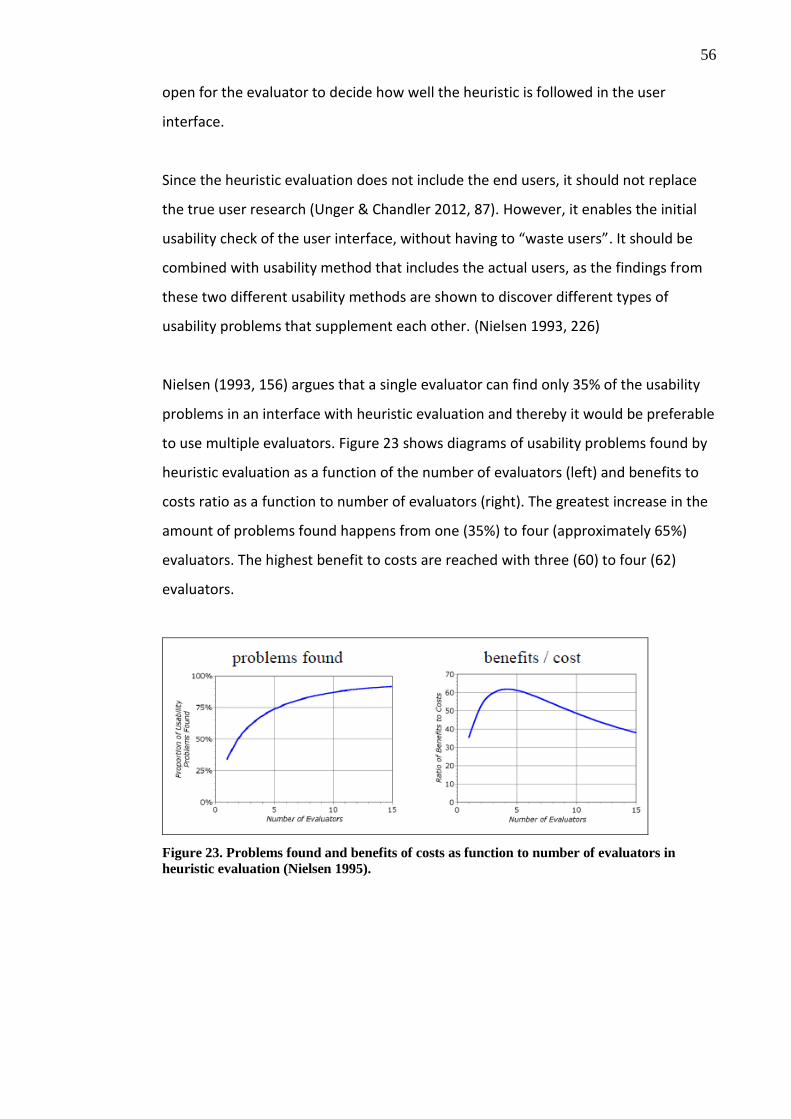
56
open for the evaluator to decide how well the heuristic is followed in the user
interface.
Since the heuristic evaluation does not include the end users, it should not replace
the true user research (Unger & Chandler 2012, 87). However, it enables the initial
usability check of the user interface, without having to “waste users”. It should be
combined with usability method that includes the actual users, as the findings from
these two different usability methods are shown to discover different types of
usability problems that supplement each other. (Nielsen 1993, 226)
Nielsen (1993, 156) argues that a single evaluator can find only 35% of the usability
problems in an interface with heuristic evaluation and thereby it would be preferable
to use multiple evaluators. Figure 23 shows diagrams of usability problems found by
heuristic evaluation as a function of the number of evaluators (left) and benefits to
costs ratio as a function to number of evaluators (right). The greatest increase in the
amount of problems found happens from one (35%) to four (approximately 65%)
evaluators. The highest benefit to costs are reached with three (60) to four (62)
evaluators.
Figure 23. Problems found and benefits of costs as function to number of evaluators in
heuristic evaluation (Nielsen 1995).

57
3.1.1 Phases of Heuristic Evaluation
Unger et al. (2012, 88-89) divide heuristic evaluation into four parts:
1. gathering background information of the object of the evaluation
2. choosing the heuristics to be used in the evaluation
3. conducting the evaluation and gathering information of the problems recognized
(observation, description, impact ranking and recommendations) and
4. presenting the findings to the stakeholders.
Siistonen (2012, 35) presents slightly different approach that assumes that more
than one evaluator is conducting the heuristic evaluation:
1. providing required information of the product to all evaluators in pre-evaluation
training
2. individuals conducting the evaluation with the product and later combining the
findings
3. evaluators determine the severity rating of each finding and
4. debriefing with the design team.
3.2 Heuristic Evaluation of INCA V7.0.0
In the thesis work the heuristic evaluation was used to examine the cultural usability
of ETAS INCA –software before conducting the user research. It also provided a base
to test the functionality of the Japanese Cultural Heuristics (see appendix 4) in
comparison to the existing Dialog Principles (see appendix 3).
58
3.2.1 Phases of the Heuristic Evaluation of INCA V7.0.0
Since the heuristic evaluation done in the thesis work was used together with three
other usability evaluation methods (user survey, user interviews and user
observation) and the non-validated status of some of the heuristics used (Japanese
Cultural Heuristics) was the heuristic evaluation done by a single evaluator (the
author). The process was conducted similarly as described by Unger et al. (see
previous page).
Gathering Background information of INCA
During her internship at ETAS K.K. the author received a newcomer orientation about
the software that are developed at ETAS and where they are used. Also an
introduction to electronic control unit (ECU) calibration was given, as well as to the
use of INCA in the field.
To recognize what is the startup point of a new Japanese INCA user, the following
information was gathered:
- users are commonly mechanical engineers (may not have a lot of information
about software development)
- the educational background of the users vary from technical high school graduate
to bachelor’s or master’s degree from university
- previously the new users were trained by the old users within the customer
company (sensei style, common in Japan)
- with a new demand ETAS K.K. is providing basic training for new customers (half
day training on basic functionalities, calibration concepts, etc.) as well as
especially requested trainings that are more thorough (one to two days)
- when a customer buys new INCA –product, they are provided with a CD from
which INCA is installed and that has electronic manual that supports multiple
languages (e.g. English, German, French, Japanese)
59
- customer does the installation and required connections to the hardware by
themselves (help provided on request). (Sienel 2013b)
The evaluator (the author) received help from a colleague at ETAS K.K. working with
INCA to install the software. He also provided the electronic manual that is given to
the customers, as well as the training manual used within the company.
The evaluator self-studied INCA through the training and electronic manuals before
(and while) conducting the heuristic evaluation. Ito et al. (1996, 115) mention that
the Japanese users usually read the manuals really carefully before starting to use
the system. This is linked to the high preference on breakdown avoidance (Ito et al.
1996, 115) which corresponds to the high uncertainty avoidance level found while
creating the cultural models. Self-study of the manual(s) was evaluated to
correspond the Japanese users’ way of learning how to use INCA.
Choosing Heuristics to Be Used in the Evaluation
The main focus of the heuristic evaluation was in the Japanese Cultural Heuristics
(see appendix 4) that were created based on the cultural models. Since these
Cultural Heuristics were created in the course of this thesis work, worked the
heuristic evaluation as a way of testing their functionality and allowing the author to
further develop them as she noticed the problematic areas while working with them.
Using the Dialog Principles (see appendix 3) that are in general use at ETAS offered
also a reflection point to the Cultural Heuristics, to see if they offered any additional
value compared to the Dialog Principles.
Additionally the objective matters of Japanese culture (see appendix 6) were
considered during the heuristic evaluation.
60
Conducting the Evaluation
The heuristic evaluation and the related tasks (creation of task flow chart) were done
with INCA V7.0.0. As the system turned out to be more complex than what the
evaluator had expected, required the process more time and one additional task:
creation of task flow chart. To limit the extent of the evaluation it was decided to
focus on three use cases: setting up and configuring an experiment (1); measuring
values (2) and calibrating values (3).
The task flow presented in appendix 7 was followed while conducting the evaluation
(excluding the last step: analyzing with MDA). The task flow was created by the
author while conducting the evaluation. It was revised and approved later by two
experienced colleagues from ETAS.
No actual hardware was used during the heuristic evaluation. The measurement
values were simulated to enable the evaluator to go through all of the use cases.
The findings of the evaluation were collected in a Microsoft PowerPoint file (see
appendix 8). Figure 24 shows an example of the documentation of a finding. The
documentation includes the number of the finding, region of the software where the
finding was located, task during which the finding was found, the heuristic to which it
was related to, specific description, screenshot, priority rating and suggestions on
how the problem could be handled.
Figure 24.Example of the heuristic evaluation finding’s documentation.
[Figure deleted due to confidentiality]
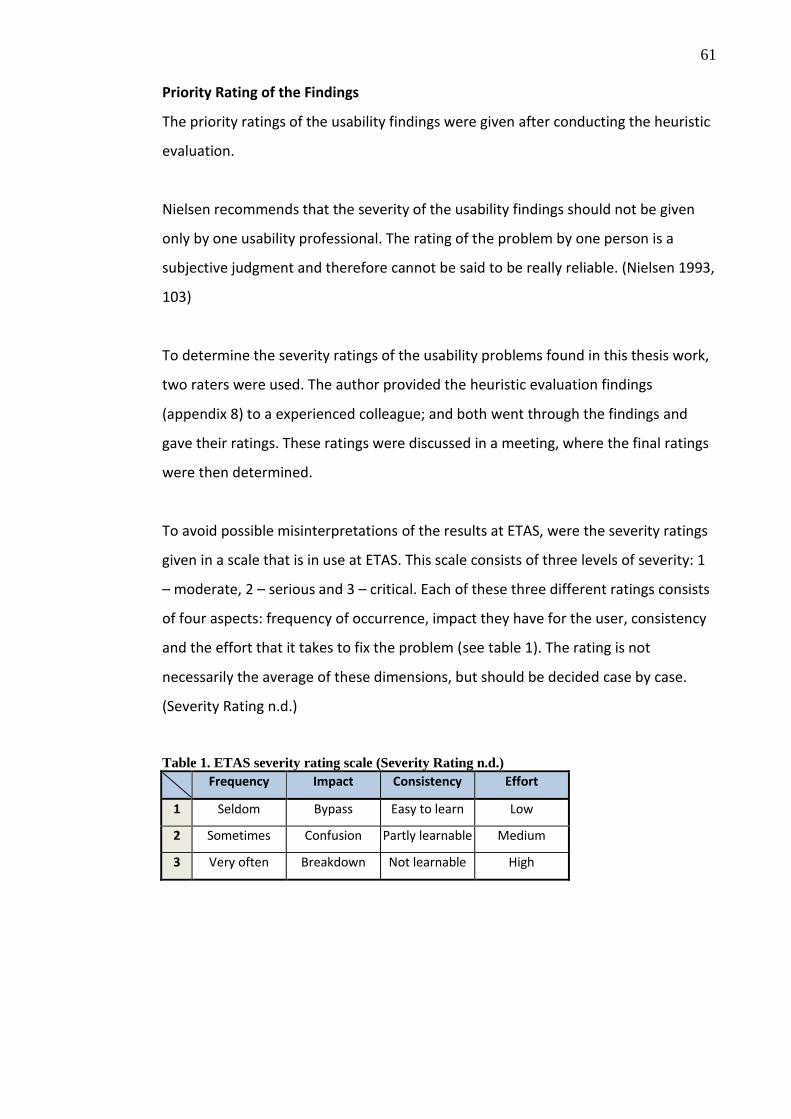
61
Priority Rating of the Findings
The priority ratings of the usability findings were given after conducting the heuristic
evaluation.
Nielsen recommends that the severity of the usability findings should not be given
only by one usability professional. The rating of the problem by one person is a
subjective judgment and therefore cannot be said to be really reliable. (Nielsen 1993,
103)
To determine the severity ratings of the usability problems found in this thesis work,
two raters were used. The author provided the heuristic evaluation findings
(appendix 8) to a experienced colleague; and both went through the findings and
gave their ratings. These ratings were discussed in a meeting, where the final ratings
were then determined.
To avoid possible misinterpretations of the results at ETAS, were the severity ratings
given in a scale that is in use at ETAS. This scale consists of three levels of severity: 1
– moderate, 2 – serious and 3 – critical. Each of these three different ratings consists
of four aspects: frequency of occurrence, impact they have for the user, consistency
and the effort that it takes to fix the problem (see table 1). The rating is not
necessarily the average of these dimensions, but should be decided case by case.
(Severity Rating n.d.)
Table 1. ETAS severity rating scale (Severity Rating n.d.)
Frequency Impact Consistency Effort
1 Seldom Bypass Easy to learn Low
2 Sometimes Confusion Partly learnable Medium
3 Very often Breakdown Not learnable High
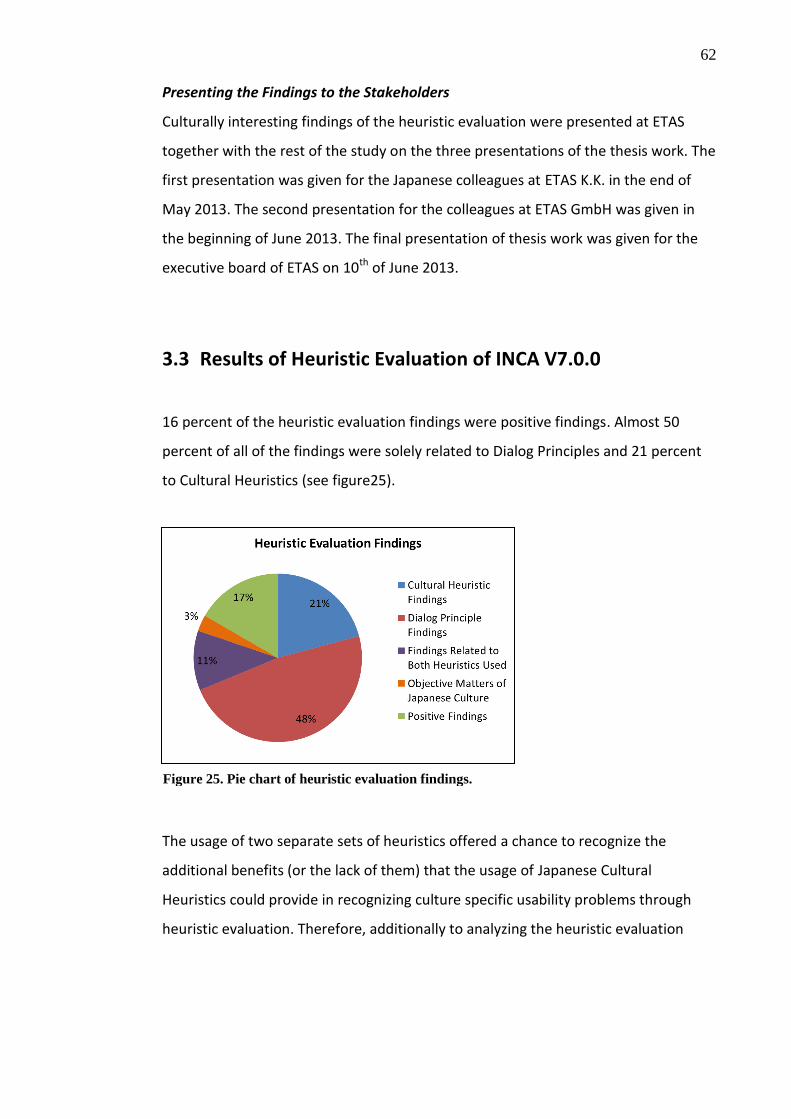
62
Presenting the Findings to the Stakeholders
Culturally interesting findings of the heuristic evaluation were presented at ETAS
together with the rest of the study on the three presentations of the thesis work. The
first presentation was given for the Japanese colleagues at ETAS K.K. in the end of
May 2013. The second presentation for the colleagues at ETAS GmbH was given in
the beginning of June 2013. The final presentation of thesis work was given for the
executive board of ETAS on 10th of June 2013.
3.3 Results of Heuristic Evaluation of INCA V7.0.0
16 percent of the heuristic evaluation findings were positive findings. Almost 50
percent of all of the findings were solely related to Dialog Principles and 21 percent
to Cultural Heuristics (see figure25).
The usage of two separate sets of heuristics offered a chance to recognize the
additional benefits (or the lack of them) that the usage of Japanese Cultural
Heuristics could provide in recognizing culture specific usability problems through
heuristic evaluation. Therefore, additionally to analyzing the heuristic evaluation
Figure 25. Pie chart of heuristic evaluation findings.

63
findings are the benefits in the usage of the Japanese Cultural Heuristics in
comparison to Dialog Principles being evaluated in this chapter.
3.3.1 Heuristic Evaluation Findings
[Text deleted due to confidentiality]
[Text deleted due to confidentiality]
[Text deleted due to confidentiality]
Figure 26. [Text deleted due to confidentiality]
[Figure deleted due to confidentiality]

64
[Text deleted due to confidentiality]
Figure 27. [Text deleted due to confidentiality]
[Text deleted due to confidentiality] [Text deleted due to confidentiality]
[Text deleted due to confidentiality]
[Figure deleted due to confidentiality]
65
Figure 28. [Text deleted due to confidentiality]
[Text deleted due to confidentiality]
[Text deleted due to confidentiality]
[Text deleted due to confidentiality]
[Figure deleted due to confidentiality]
66
[Text deleted due to confidentiality]
Figure 29. [Text deleted due to confidentiality]
[Figure deleted due to confidentiality]

67
[Text deleted due to confidentiality]
[Text deleted due to confidentiality]
[Text deleted due to confidentiality]
[Text deleted due to confidentiality]

68
[Text deleted due to confidentiality]
[Text deleted due to confidentiality]
[Text deleted due to confidentiality]
[Text deleted due to confidentiality]
69
[Text deleted due to confidentiality]
[Text deleted due to confidentiality]
[Text deleted due to confidentiality]
70
[Text deleted due to confidentiality]
[Text deleted due to confidentiality]
[Text deleted due to confidentiality]
Figure 30. [Text deleted due to confidentiality]
[Text deleted due to confidentiality]
[Figure deleted due to confidentiality]
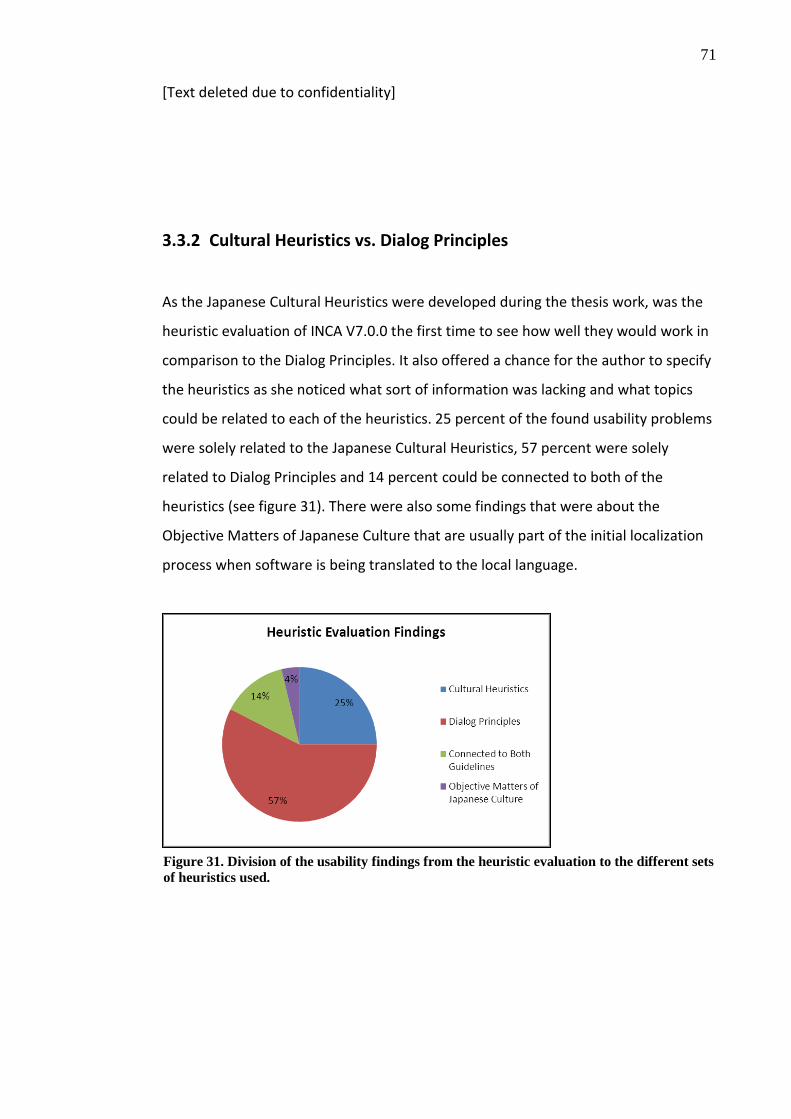
71
[Text deleted due to confidentiality]
3.3.2 Cultural Heuristics vs. Dialog Principles
As the Japanese Cultural Heuristics were developed during the thesis work, was the
heuristic evaluation of INCA V7.0.0 the first time to see how well they would work in
comparison to the Dialog Principles. It also offered a chance for the author to specify
the heuristics as she noticed what sort of information was lacking and what topics
could be related to each of the heuristics. 25 percent of the found usability problems
were solely related to the Japanese Cultural Heuristics, 57 percent were solely
related to Dialog Principles and 14 percent could be connected to both of the
heuristics (see figure 31). There were also some findings that were about the
Objective Matters of Japanese Culture that are usually part of the initial localization
process when software is being translated to the local language.
Figure 31. Division of the usability findings from the heuristic evaluation to the different sets
of heuristics used.
72
Similarities in the Heuristics
From the findings that could be connected to both sets of heuristics, the Japanese
Cultural Heuristics that had findings that could be connected to Dialog Principles too
were:
- High-Context Elements
- Intuitive Ways of Interaction
- Certainty of the Results of One’s Actions.
As there still are findings in these heuristics that are not related to the Dialog
Principles it is not preferable to make an assumption that usage of these heuristics
would not provide any additional benefits for the heuristic evaluation. Especially the
High-Context Elements –heuristic would require from the evaluator more cultural
knowledge about the Japanese culture in order for her to fully understand and
recognize the incompatibilities of the high-context elements within the system.
When it comes to Intuitive Ways of Interaction and Certainty of the Results of One’s
Actions the similarities to Suitability for Learning, Self-Descriptiveness and
Conformity with User Expectations can be recognized easily. These Japanese Cultural
Heuristics give more specified description of the matters that are included in the
Dialog Principles in more general level. Therefore, they do not provide so much of an
additional benefit from the heuristic evaluations point of view, but as guidelines to
the developers creating the user interfaces they offer more specific information
about the factors that affect the Japanese users’ user experience.
Benefits of the Cultural Heuristics
As the Japanese Cultural Heuristics are specified to Japanese culture they provide
specific information about the preferences of the Japanese users. From the total of
the usability findings 39 percent could be related to Cultural Heuristics, 25 percent
were solely related to them. Hereby they create a significant part of the heuristic
73
evaluation findings and show that there are culture related usability problems in
INCA V7.0.0 that may affect the user experience of the Japanese users.

74
4 USER RESEARCH
The last part of the research done during the thesis work was to get input from the
actual Japanese users about their experiences with INCA. Nielsen (1993, 223)
describes that the different usability engineering methods are meant to supplement
each other, as they are used to learn about different aspects of the usability. As
described already in the chapter 3.1, the heuristic evaluation cannot replace the
actual user research, since it does not include the actual users.
In this thesis work three different user research methods were applied to collect data
about the Japanese INCA users: user survey, user interview and user observation. As
each one of them provide different type and equally important data about the users,
was the usage of these methods justified.
All the user research methods were executed simultaneously and in the end analyzed
together.
4.1 User Survey
As described in Unger et al. (2012, 119): ”you can gain quantitative data from surveys
to supplement qualitative data gained from user interviews or contextual inquiry . . .
Combining two research methods provides richer picture of the user than one
method can provide on its own”.
Doing a survey is a way of getting quantitative information about the users. The
questions should be closed-ended, providing the answer options from which to
choose from (e.g. ”Yes/”No”, selecting item(s) from list, providing different levels of
agreement/disagreement). (Unger et al. 2012, 118-119)
75
While making a survey the following things should be considered:
- The amount of time that filling the survey takes (should be short)?
- When to start analyzing data (amount of responses got or timeline)?
- How will the data be collected (online, paper) and analyzed?
- What would be the efficient way of distributing the survey?
- To whom is the survey meant for? (Unger et al. 2012, 120)
4.1.1 INCA User Survey
Because of the small amount of the participants to the user interviews and user
observations, it was seen as beneficial to collect information from a wider user group
through a survey. This way the user research could include wider range of the
Japanese users and provide more of an overall picture of the users in Japan.
The goal of the survey was to get response from at least 15 Japanese INCA users to
provide quantitative data about the users. The survey was first constructed by the
author in English. The first version was distributed to four fellow Japanese ETAS K.K.
employees that are working with INCA. Based on their feedback the survey was
slightly modified to better fit the Japanese customers.
The survey was translated to Japanese by two Japanese colleagues at ETAS K.K. The
surveys were distributed to the users by colleagues at ETAS K.K. Both paper and
electronic survey forms were created, but in the end the electronic form was
evaluated (by the customer contacts) to be preferred by the users. The paper survey
(see English paper survey in appendix 9) was constructed using Microsoft Word 2010.
For the electronic survey (see Japanese electronic survey in appendix 10) fillable
form was created using Adobe Acrobat Standard 9.3.

76
Structure of the INCA User Survey
The structure of the INCA user survey was kept short and clear, so that filling it would
not take too much time and effort from the users. The survey was build based on the
interview and observation guidelines and had the following structure:
1. introduction (describing the purposes of the survey)
2. participants background information
3. current work
4. working with INCA
5. difficulties with INCA
6. specific questions about INCA
7. usability activities at ETAS.
In total the survey includes 22 questions which are mostly questions with options for
answers. The usage of questions with existing answering options was seen as feasible
to enable the participant quickly fill in the answers and to keep the translation work
in minimum. Five open questions are included and some of the other questions
include also a possibility for the participant to clarify their answers in writing.
INCA User Survey’s Connections to the Japanese Cultural Heuristics
Besides collecting information about the Japanese INCA users for ETAS, one of the
other reasons for the survey was to try to validate/invalidate the Japanese Cultural
Heuristics. In the appendix 11 are explained how the survey questions are connected
to the Cultural Heuristics. The questions under headline of ”Background Information”
are left out of this description, since they provide basic information about the user,
not specially linked to any of the heuristics. Also the last part about ”Usability
Activities at ETAS” is left out, since it is used to collect information about the interest
regarding the topic.
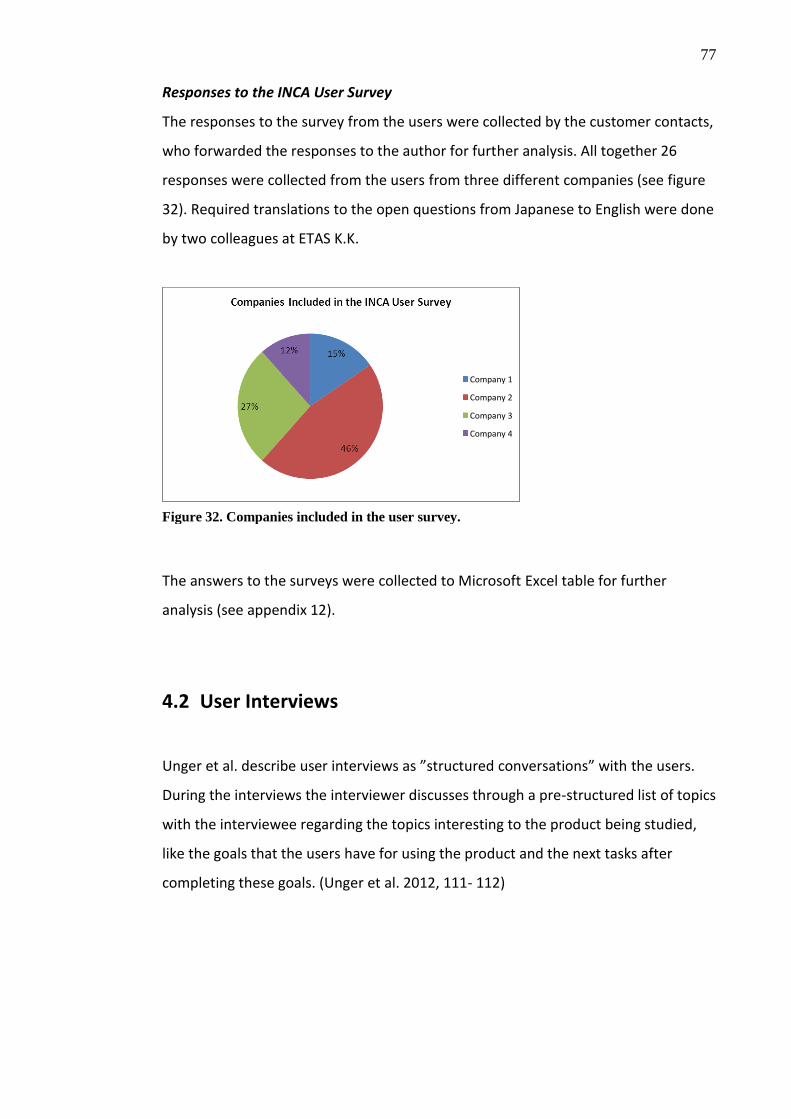
77
Responses to the INCA User Survey
The responses to the survey from the users were collected by the customer contacts,
who forwarded the responses to the author for further analysis. All together 26
responses were collected from the users from three different companies (see figure
32). Required translations to the open questions from Japanese to English were done
by two colleagues at ETAS K.K.
The answers to the surveys were collected to Microsoft Excel table for further
analysis (see appendix 12).
4.2 User Interviews
Unger et al. describe user interviews as ”structured conversations” with the users.
During the interviews the interviewer discusses through a pre-structured list of topics
with the interviewee regarding the topics interesting to the product being studied,
like the goals that the users have for using the product and the next tasks after
completing these goals. (Unger et al. 2012, 111- 112)
Figure 32. Companies included in the user survey.
Company 1
Company 2 Company 3 Company 4
78
4.2.1 Goals of the INCA User Interview
The goal for the user interviews with INCA users was to get at least two to three face-
to-face interviews on-site. Because of the authors insufficient Japanese language
skills, were the interviews planned to be conducted by Japanese colleagues from
ETAS K.K. who were supposed to work as the interviewers during the interviews; and
to collect and translate the answers from the participants.
The goal for the results of the interview was to collect qualitative data from the
Japanese INCA users about their thoughts regarding their work and INCA.
4.2.2 Guidelines to the INCA User Interviews
Since the interviewers that were planned to be used in the user interviews were not
usability professionals, nor did they have experience about similar activities, it was
important to create thorough guidelines that would instruct them on conducting the
interviews.
The author created User Interview Guideline (see appendix 13) that included
instructions to the interviewers about the practice and about things to focus on, as
well as the script for the interview.
The questions of the interview include both open- and closed-questions. To help the
interviewer fill in the answers were some answering options provided from which
the interviewer could select the participants answer quickly. The space for the open-
question answers were also provided within the guidelines.
Besides the guidelines, the author gave a short presentation about the user interview
as a user research method to the colleague participating in the user interviews.
During this presentation the author explained about the purposes and style of the
user interview, as well as about the things that the interviewer should focus on
79
during the interviews (see appendix 14 for the presentation (combined with user
observation presentation)). The author also did a test interview with the Japanese
colleague participating in the actual interviews, so that the problem points of the
interview guidelines could be recognized and that the colleague could have a feel
about what could be expected from the interview.
Structure of the User Interview Guidelines
The questions in the INCA user interview were concerning similar topics as the INCA
user survey. The guidelines had the following structure:
- Instructions for the interviewer
- Instructions for filling the answers
- Pre-interview information (from interviewer)
1. Welcome
2. Interview
1.1 Initial Interview
1.2 Current Work
1.3 Environment of Use
1.4 Questions about INCA
1.5 Concluding Interview
- Post-Interview Information (from Interviewer)
A declaration of consent form was also created. It turned out that requesting a
signature in this type of document in Japan would cause a lot of the bureaucracy
issues, since the employees would need to have the permission to sign such a
document from the higher board of the company. Based on the discussion with the
participants was the need for such document evaluated to be less important.
80
4.2.3 Conducting the INCA User Interviews
[Text deleted due to confidentiality]
Figure 33. [Text deleted due to confidentiality]
[Figure deleted due to confidentiality]
81
[Text deleted due to confidentiality]
4.3 User Observation
During the user observation, the observer follows the users normal work tasks with
the product. By doing this the observer gathers information about the user’s usual
tasks and usability of the system. (Nielsen 1993, 207)
Unger et al. provide two approaches to observation: active observation and passive
observation. During active observation the user acts as a master of the system and
teaches the apprentice (observer) about the usual tasks. This approach provides
important information about the reasons of the users behavior, as the user explains
the apprentice about the usage of the system. This allows the observer to ask the
user about the reasons behind certain behaviors in more natural way. Whereas
passive observation has the observer quietly observe the usual behavior of the user,
as if the observer was not there. Possible questions should be noted down and asked
in the end of the session. (Unger et al. 2012, 115)
As the observer may be from the development group of the system that is being
studied may the user be tempted to ask questions from him regarding the system
during the observation. However, the user should be advised to leave these
questions in the end of the session, once the observation is finished. This way it is
possible to first collect information about the ways in which the user currently uses

82
the system and then the questions can provide more information about the topics
that the user would like to do. It can also serve as a way to reward the user for taking
part in the study. (Nielsen 1993, 208)
4.3.1 Goals of the INCA User Observations
The goal of the INCA user observation was to gain empirical knowledge about the
users’ tasks and their working environments. With this empirical knowledge the
author could gain more detailed view about the factors that affect the users’ work,
as well as the ways in which they actually use INCA.
The initial goal was set to have two to three user interviews and observations in the
users’ actual working environments that were planned to be conducted as contextual
inquiry (combining the user interview with user observation). But as there turned out
to be difficulties in observing the users in their work (the strict confidentiality
requirements of the customer companies in the automotive) was the contextual
inquiry changed to traditional interviews and user observations. As there were also
difficulties also in scheduling the visits, was the goal set to have two half day passive
observations (not requiring input from the participant) with two different user level
users (novice and expert).
4.3.2 Guidelines to the INCA User Observations
Like with the user interviews, it was known that the Japanese colleague(s) that would
be participating in the user observation did not have any previous experience in the
field of usability engineering, nor had they taken part in similar activities before.
Therefore it was important to create a user observation guideline (see appendix 16)
which would instruct them in conducting the user observation and guarantee the
quality of the findings collected from the observation.

83
The method and style of the user observation was also explained in a presentation
given to the Japanese colleague prior the visit to the customer site (see appendix 14).
Structure of the Observation Guidelines
The observation guidelines include the following topics:
- Pre-observation information (from observer)
1. Explanation of the purposes and structure of the observation to user
- Instructions for the observer
- Space for observation notes
2. After observation discussion & possible questions
- Post-Interview Information (from Interviewer)
As the space provided in the guidelines for the observations is only one page, was
the observer instructed to take some additional papers or notebook to which he
could write his observations.
4.3.3 Conducting the INCA User Observations
[Text deleted due to confidentiality]
84
[Text deleted due to confidentiality]
4.3.4 Analyzing the Results of the INCA User Observation
The observation notes of the two observers (author and the colleague from ETAS
K.K.) were combined in a one day workshop done after the observations. The
workshop followed the structure for creating an affinity diagram presented at the
ETAS Usability Wiki that is derived from Holtzblatt, Wendell & Wood (2004):
1. observers going through their notes and writing them down on cards
2. mixing the notes on big surface so that everybody can read the notes
3. participants reading the notes in silence
4. participants creating clusters of notes related to each other
5. discussing together about created clusters
6. labeling the groups. (General User Research Issues n.d.)
The actual process would include further steps (such as giving the clusters different
priority ratings) that were not conducted during this workshop, because of the
limitations of time and their irrelevance for the thesis work.
In total 13 groups were defined (see figure 34) and later on documented in Microsoft
PowerPoint (see appendix 17) for further purposes. The workshop was not aimed to
analyze the observation notes from the cultural aspect, but to compile the
observation notes from the two observers. The further analysis of the cultural
matters was done later by the author together with the other user research results
(see chapter 4.4).
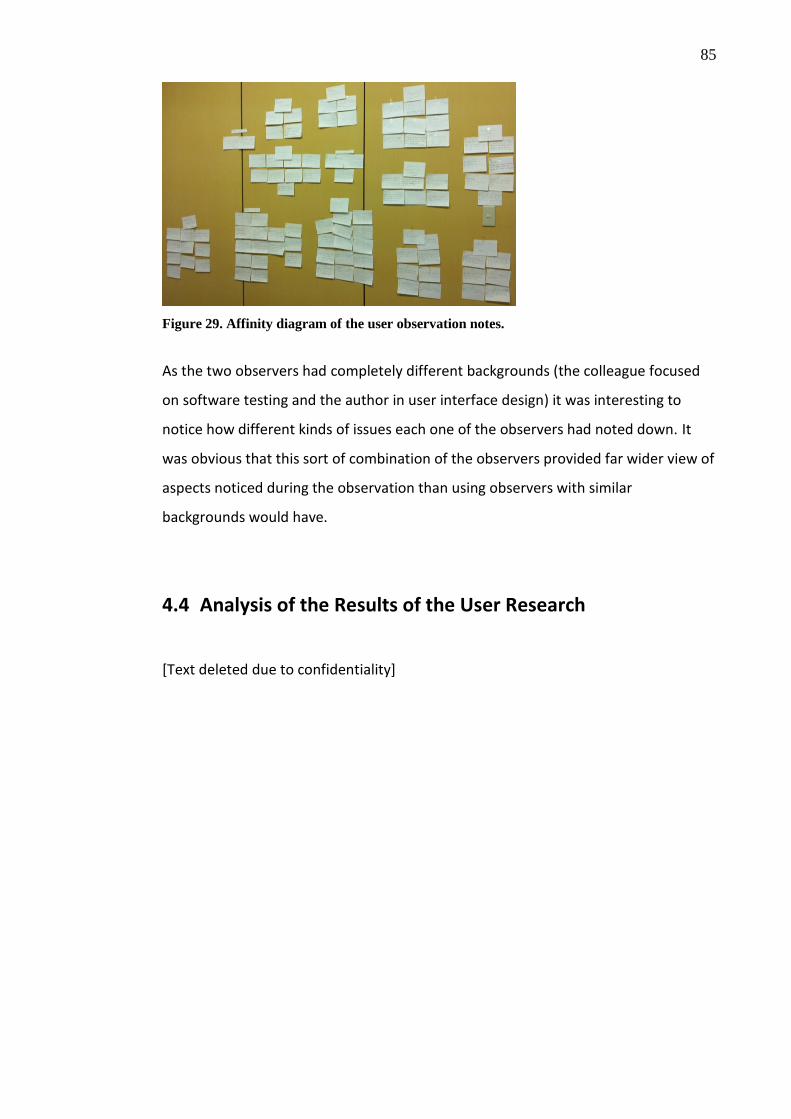
85
Figure 29. Affinity diagram of the user observation notes.
As the two observers had completely different backgrounds (the colleague focused
on software testing and the author in user interface design) it was interesting to
notice how different kinds of issues each one of the observers had noted down. It
was obvious that this sort of combination of the observers provided far wider view of
aspects noticed during the observation than using observers with similar
backgrounds would have.
4.4 Analysis of the Results of the User Research
[Text deleted due to confidentiality]
86
4.4.1 [Text deleted due to confidentiality]
[Text deleted due to confidentiality]
Figure 35. [Text deleted due to confidentiality]
[Text deleted due to confidentiality]
[Figure deleted due to confidentiality]
87
[Text deleted due to confidentiality]
4.4.2 [Text deleted due to confidentiality]
[Text deleted due to confidentiality]

88
Figure 36. [Text deleted due to confidentiality]
Figure 37. [Text deleted due to confidentiality]
[Text deleted due to confidentiality]
[Figure deleted due to confidentiality]
[Figure deleted due to confidentiality]
89
4.4.3 [Text deleted due to confidentiality]
[Text deleted due to confidentiality]
90
4.4.4 [Text deleted due to confidentiality
[Text deleted due to confidentiality]
Figure 38. [Text deleted due to confidentiality]
[Figure deleted due to confidentiality]
]

91
4.4.5 [Text deleted due to confidentiality]
[Text deleted due to confidentiality]
Figure 39. [Text deleted due to confidentiality]
[Text deleted due to confidentiality]
[Figure deleted due to confidentiality]

92
4.4.6 [Text deleted due to confidentiality]
[Text deleted due to confidentiality]

93
5 CONCLUSIONS
As the thesis progressed the effects of culture to the user experience became more
and more obvious. Culture affects the way in which we perceive the world and
therefore how the users experience a product.
The focus of the thesis was especially in the cultural usability of the user interfaces
and the differences in it between Japan and Europe. As the user research was solely
done in Japan and the author did not have previous knowledge about the European
INCA users, are the conclusions of the cultural usability of INCA solely made by
reflecting the findings to the Japanese Cultural Heuristics created during the thesis
work. To provide more accurate knowledge about the differences between the
Japanese and European INCA users, it would be beneficial to conduct similar user
research with European users, so that actual comparisons could be made.
The complexity of conducting a cultural study became obvious from the very
beginning of the thesis work, as mentioned before already the term “culture” can be
defined in several of different ways, as well as its structure. Multiple theories exist,
but no “ultimate truth” can be defined. The same can be said about the study of a
specific culture: the existing researches basis highly on empirical research and the
perception of an anthropologist or an ethnographer; therefore it is never completely
objective.
The cultural models were created based on a literature research as well as to the
author’s empirical knowledge about different cultures. This brings already two
different subjective sources of knowledge to the study: the author and the writers of
the used literature. As the author is neither anthropologist nor ethnographer, she
was learning how to do a cultural study as the thesis progressed.
94
To provide more accurate and more reliable definitions of the cultural dimensions,
would deeper cultural analysis needed to be done through literature (as well as
empirical) research in both of the cultures. The definitions provided in the thesis
work were highly relying in the existing research.
5.1 Which Culture?
Definition given in the chapter 2.1 by Hoft is that culture is learned behavior that
includes thoughts, feelings and actions. When studying as professional tool as ETAS
INCA, not only should the national culture be considered, but also the professional
culture. The users are not only affected by the national environment in which they
have grown and lived in, but also the professional and company culture in which they
are in. This was noticed during the user research, as the differences between the
expert and the novice user were noticed, as well as the strong influence that the
company culture had in their behavior.
The Japanese Cultural Heuristics were created based on the assumption of having a
product that is localized from one nation to another, without considering the field in
which the product is located in (leisure time, professional, hobby). For the purposes
of studying a professional tool like INCA, it might have been more beneficial to select
different dimensions of culture which would have provided more knowledge about
the working culture of different nations. Such would have been for example the
collectivism versus individualism -dimension described by Hofstede (see Hoft 1996,
59).
95
5.2 Usability of the Japanese Cultural Heuristics
Already during the heuristic evaluation of INCA it turned out that studying the High-
Context Elements –heuristic is complicated. It would be more beneficial that a
person from the target culture would do the evaluation, since learning about all the
preferences and values related to the High-Context Elements would be extremely
time consuming. Other heuristics were experienced to be easier to understand and
study.
Some overlaps between the Japanese Cultural Heuristics and the Dialog Principles
exist (see figure 31), which might suggest that the benefits in using the Japanese
Cultural Heuristics might not be so high. However, the 25% of the usability findings
that were solely related to the Japanese Cultural Heuristics would suggest that some
additional benefit can be gained from using them.
5.3 Cultural Model for Everybody
Ford and Kotzé studied Hofstede’s cultural dimensions (from which here studied the
power distance and uncertainty avoidance) to learn about the benefits of adapting
the user interface to the user’s cultural dimensions. They found that rather than
providing a user interface adapted to the user’s cultural model, would the usage of
certain cultural model provide benefits to all users. This model would consist of high
power distance, high uncertainty avoidance, masculinity and collectivism. (Ford et al.
2005, 8 &12)
As the set of cultural dimensions that were studied here differed a bit from the ones
used in Ford’s and Kotzé’s study, were some additional observations made. The
usage of the Japanese Cultural Heuristics would not only be beneficial for the
Japanese users, but most likely for the other users too. They might not be necessary

96
for the other cultures, but surely having the certainty for the results (high uncertainty
avoidance) that follow the users actions would be good for other users too, as well as
seeing clearly the progress and order of tasks (monochronic time perception) or
being able to leave a task in the middle and being able to catch up with it the next
time (monochronic time perception).
However, two of the dimensions that were studied here could be seen as more
culture sensitive: environment & technology and technological development. These
concern the culture’s perceiving of the technology, which may majorly affect the
usage of the product in the target culture. When comparing the two cultures studied
here (Japan and Europe) the differences in these dimensions are not as critical as
they could be, when for example localizing from Japan or Europe to one of the
developing countries for example in Africa.
5.4 Need for Localized User Interface of INCA for the Japanese
Users?
Currently The Dialog Principles for User Interface Design are in use at ETAS to provide
information about the usability factors that should be considered while creating a
user interface design. Additionally to them the set of cultural heuristics could be used,
not only for localizing the user interface to Japan, but to recognize some factors that
are important for certain cultures and that are also useful for other cultures.
In both, the heuristic evaluation and the user research, it became obvious that
before focusing on the cultural usability factors of INCA, should the focus first be in
recognizing the general usability problems that are important for all. From all of the
usability findings in heuristic evaluation 59% consisted of findings related to Dialog
Principles. Most of the responses and findings from the user research were also
97
evaluated to be non-cultural and therefore not analyzed in the course of the thesis
work.
5.5 Benefits for ETAS
The thesis work provided ETAS a wide view of the Japanese INCA users, as no such
previous studies had been conducted before. The data collected from the total of 30
INCA users involved in the user research provide an excellent base knowledge about
the Japanese users and their usual tasks and preferences for further use in the
company. The data utilized in the thesis work was only a small amount of the
complete data collected (as the rest of the data was not evaluated to be culture
sensitive).
Moreover, all the usability findings from the heuristic evaluation have been
described and prioritized, which provides a wide amount of identified usability
problems to start work on.
Identifying that most of the found usability problems were not connected to the
cultural aspects also shows that instead of focusing on the culture specific usability
issues should the first focus be in improving the general usability of INCA. Improving
the general usability would be beneficial for all of the users around the world and
these aspects were the ones that came out the strongest also in the research with
the Japanese users.

98
5.6 Suggested Follow up Studies
Study of the European INCA Users
The user research for the thesis work was only done in Japan. To enable more
thorough conclusions of the usefulness of the cultural heuristics in the case of ETAS,
would it require a follow up research to be conducted of the European users to see
the actual differences.

99
REFERENCES Archibugi, D. & Coco, A. 2004. A New Indicator of Technological Capabilities for Developed and Developing Countries (ArCo). Published in Wordl Development Vol. 32, No. 4, pp. 629-654 by Elsevier Ltd. Available on-line on 30.1.2013: http://www.danielearchibugi.org, Papers, Technological Change and Globalization, Theory and Measurement of Technological Change, A New Indicator of Technological Capabilities for Developed and Developing Countries (ArCo). Barber, W. & Badre, A. 1998. Culturability: The Merging of Culture and Usability. Human Factors and the Web (4th Conference), conference proceedings. Referred to 10.6.2013. http://zing.ncsl.nist.gov/hfweb/att4/proceedings/barber/. Baumgartner, V.J. 2003. A Practical Set of Cultural Dimensions for Global User-Interface Analysis and Design. Master’s thesis. FH JOANNEUM, Fachhochschulstudiengang Informations-Design. Countries. n.d. List of European Union member states. Referred to 29.1.2013. http://europa.eu/, english, How the EU works, Countries. Country Comparison :: Electricity - Consumption. 2011. The CIA World Factbook. Referred to 12.2.2013. https://www.cia.gov/, Library, The World Factbook, Guide to Country Comparisons, Energy, Electricity - consumption. Culture. n.d. Definition of culture in Merriam Webster’s online dictionary. Referred to January 10th, 2013. http://www.merriam-webster.com/ del Galdo, E.M. & Nielsen, J. 1996. International User Interfaces. Wiley Computer Publishing. Developed and developing regions. n.d. United Nations Statistics Division’s website. Referred to 12.2.2013. http://unstats.un.org/, Methods & Classifications, Country and area codes (M49), Composition of regions, Developed and developing regions Dialog Principles for User Interface Design (DIN-EN-ISO 9241, Part 110). 2006. Internal documentation from ETAS of the standard. ETAS Group. n.d. ETAS Group’s Website. Referred to 3.6.2013. http://www.etas.com, ETAS Group. Florida, R., Mellander, C., Stolarick, K., Silk, K., Matheson, Z. and Hopgood, M. 2011. Creativity and Prosperity: The Global Creativity Index. Martin Prosperity Institute. Referred to 12.2.2013. http://martinprosperity.org/media/GCI%20Report%20Sep%202011.pdf.
100
Ford, G. & Kotzé, P. 2005. Designing Usable Interfaces with Cultural Dimensions. Referred to 10.6.2013. http://hufee.meraka.org.za/Hufeesite/staff/the-hufee-group/paula-kotze-1/publications/ford-kotze-final-revised.pdf General User Research Issues. n.d. Article in the ETAS internal Usability Wiki that has information regarding the user-centered methods and style guide for the graphical user interfaces developed at ETAS. Globalization Step-by-Step: Number Formatting. n.d. Article in Microsoft Go Global Developer Center’s website. Referred to 10.6.2013. http://msdn.microsoft.com/en-us/goglobal/bb688127.aspx GlobalEDGE. n.d. Knowledge web-portal for global business knowledge. Created by the International Business Center at Michingan State University. Referred to 28.1.2013. http://globaledge.msu.edu/, Global Insights, By Country, Germany, Culture, Appointment Alert! Gekeler, M. 2013. Senior Manager of Technical Sales & Support team of INCA at ETAS K.K. ETAS. Training on 22.4.2013 at ETAS K.K. office in Yokohama, Japan. Hall, E.T. & Hall, M.R. 1990. Understanding Cultural Differences: Germans, French and Americans. United States of America: Intercultural Press, Inc. Hall, E.T. & Hall, M.R. 1987. Hidden Differences: Doing Business with the Japanese. United States: Anchor Books. Hoft, N. 1996. Developing a Cultural Model. In International User Interfaces. Edited by del Galdo, E.M. & Nielsen, J. 1st ed. Wiley Computer Publishing, 41-73. INCA User Training Manual. 2010. A internal manual provided from ETAS for INCA training. Ito, M & Nakakoji, K. 1996. Impact of Culture on User Interface Design. In International User Interfaces. Edited by del Galdo, E.M. & Nielsen, J. 1st ed. Wiley Computer Publishing,, 105-126. Japanese Communication Style. n.d. Doing Business in Japan –Website. Referred to 7.6.2013. http://www.rikkinyman.com/training/japanese_culture/, Japanese Culture. Kuniavsky, M. 2003. Observing The User Experience – A Practitioner’s Guide To User Research. United States of America: Morgan Kaufmann Publishers. Literacy. 2002. The CIA World Factbook website. Referred to 12.2.2013. https://www.cia.gov/, Library, The World Factbook, East & Southeast Asia, Japan, People and Society :: Japan, Literacy.
101
Marcus, A. & Gould, E.W. 2001. Cultural Dimensions and Global Web Design: What? So What? Now What? Referred to 10.6.2013. http://www.amanda.com/cms/uploads/media/AMA_CulturalDimensionsGlobalWebDesign.pdf. Nielsen, J. 1993. Usability Engineering. United States of America: Morgan Kaufman. Nielsen, J. 1995. How to Conduct a Heuristic Evaluation. Referred to 11.6.2013. http://www.nngroup.com/, About NN/G, Books, Usability Inspection Methods, 2.1. How to Conduct a Heuristic Evaluation. Nishimura, S., Nevgi, A. & Tella, S. 2008. Communication Style and Cultural Features in High/Low Context Communication Cultures: A Case Study of Finland, Japan and India. A conference publication: Uudistuva ja kehittyyvä ainedidaktiikka : Ainedidaktinen symposiumi 8.2.2008 Helsingissä. Osa 2.2008, 783-796. Referred to 29.1.2013. http://www.helsinki.fi/~tella/nishimuranevgitella299.pdf. Norbury, P. 2011. Japan – Culture Smart! The Essential Guide to Customs & Culture. Revised and updated edition 2011; second printing 2012. Great Britain: Kuperard, an imprint of Bravo Ltd. People and Society:: Japan. n.d. The CIA World Factbook website. Referred to 18.1.2013. https://www.cia.gov/, Library, Publications, The World Factbook, East & Southeast Asia, Japan, People and Society:: Japan. Rakuten Ichiba. n.d. Japanese online shopping website. Referred to 28.2.2013. http://www.rakuten.co.jp/ Schick, P. 2013. Usability Introduction. Internal presentation at ETAS about usability. ETAS. School life expectancy (primary to tertiary education). 2008. The CIA World Factbook website. Referred to 12.2.2013. https://www.cia.gov/, Library, The World Factbook, East & Southeast Asia, Japan, People and Society :: Japan, School life expectancy (primary to tertiary education). Severity Rating. n.d. Article in the ETAS internal Usability Wiki that has information regarding the user-centered methods and style guide for the graphical user interfaces developed at ETAS. Shen, J. 2000. User Interface Internationalization. Referred to 10.1.2013. http://web.njit.edu/~turoff/coursenotes/CIS732/samplepro/user_interface_internationalizat.htm. Sienel, W. 2013a. President and Representative Director of ETAS K.K. ETAS. Discussion on 6.6.2013.

102
Sienel, W. 2013b. President and Representative Director of ETAS K.K. ETAS. Discussion on 26.2.2013. Siistonen, M. 2012a. User Centred Design. Usability and Ergonomics –course lecture on 11.1.2012 at JAMK University of Applied Sciences. Siistonen, M. 2012b. Heuristic Evaluation – Expert Evaluation. Usability and Ergonomics –course lecture on 18.1.2012 at JAMK University of Applied Sciences. The Hofstede Centre. n.d. Scores of different countries in the Dimensions of National Culture defined by Geert Hofstede. The information provided in The Hofstede Center’s website is from Geert Hofstede’s books ”Culture’s Consequences: Comparing Values, Behaviors, Institutions, and Organizations Across Nations” (2001) and ”Cultures and Organizations: Software of the Mind, Revised and Expanded 3rd Edition” (2010). Referred to 25.1.2013. http://geert-hofstede.com, National Culture, Countries, selecting countries. Unger, R. and Chandler, C. 2012. A Project Guide to UX Design: For User Experience Designers in the Field or in the Making. Second Edition. United States of America: New Riders. Würtz, E. 2005. A Cross-Cultural Analysis of Websites from High-Context Cultures and Low-Context Cultures. Referred to 21.1.2013. Journal of Computer-Mediate Communication, 11(1), article 13. http://jcmc.indiana.edu/vol11/issue1/wuertz.html 2012 Production Statistics. n.d. Production statistics of the motor vehicles presented in the International Organization of Motor Vehicle Manufacturers (OICA). Referred to 10.6.2013. http://oica.net/, Production Statistics.