Embed Size (px)
Citation preview

.--Douglas BaartDale A. LivingstonRichard W. Soper
Considerations of Single LongRange Navigational System Usein the West Atlantic RouteSystem
FAA WJH Technical Center
\111\\\ 11\\\ 1111\ 11\\t I1I1I 11\\\1111\ \~\\ ~I\ \11\'00026084'
January 1988
DOT/FAA/CT-TN87/26
Document is on file at the Technical CenterLibrary, Atlantic City Airport. N.J. 08405
u.s Departmef1l ot TranSpOrTaTIOn
Federal Aviation Administration
Technical CenterAtlantiC City Airport. N.J. 08405
i'a-
NOTICE
This document is disseminated under the sponsorship ofthe De?artment of Transportation in the \nterest ofinformacion exchange. The United States Governmentassumes no liability for the contents or use thereof.
The United States Government does not endorse productsor manufacturers. Trade or manufacturer's names appearherein solely because they are considered essential tothe object of this report.
Technical J(eport Documentation Page1. A.port No. 2. Go..ernmenl Accession No. 3. Aecipient's Catala, No.
DOT/FAA/CT-TN87/264. Tille and Subtille
CONSIDERATIONS OF SINGLE LONG-RANGE NAVIGATIONALSYSTEM USE IN THE WEST ATLANTIC ROUTE SYSTEM
S. Aeporl r)ate
January 19886. Performing Organi aatian Code
~;-~:;:-:':i"':i:----------------------------48. Performing Or,ani a..tian Aeporl No.I 7. AUlhor's)
Douglas Baart, Dale A. Livingston, and Richard W. Soper DOT/FAA/CT-TN87/269. Perfarmin, Or,ani a..tion Nome and Addre ..
Federal Aviation AdministrationTechnical CenterAtlantic City International Airport, New Jersey 08405
10. Work Unit No. (TRAIS)
11. Contr..ct or Granl No.
Technical Note
14. Spansarinll Allency Code
12. Spansarin, Allerocy Name and Addre..
U.S. Department of TransportationFederal Aviation AdministrationTechnical CenterAtlantic City International Airport, New Jersey 08405
13. Type of Report and Period Ca.. eredr--:-::--::--------"""":'""~--------------_l
IS. Supplement..ry Nat..
16. Abstr..ct
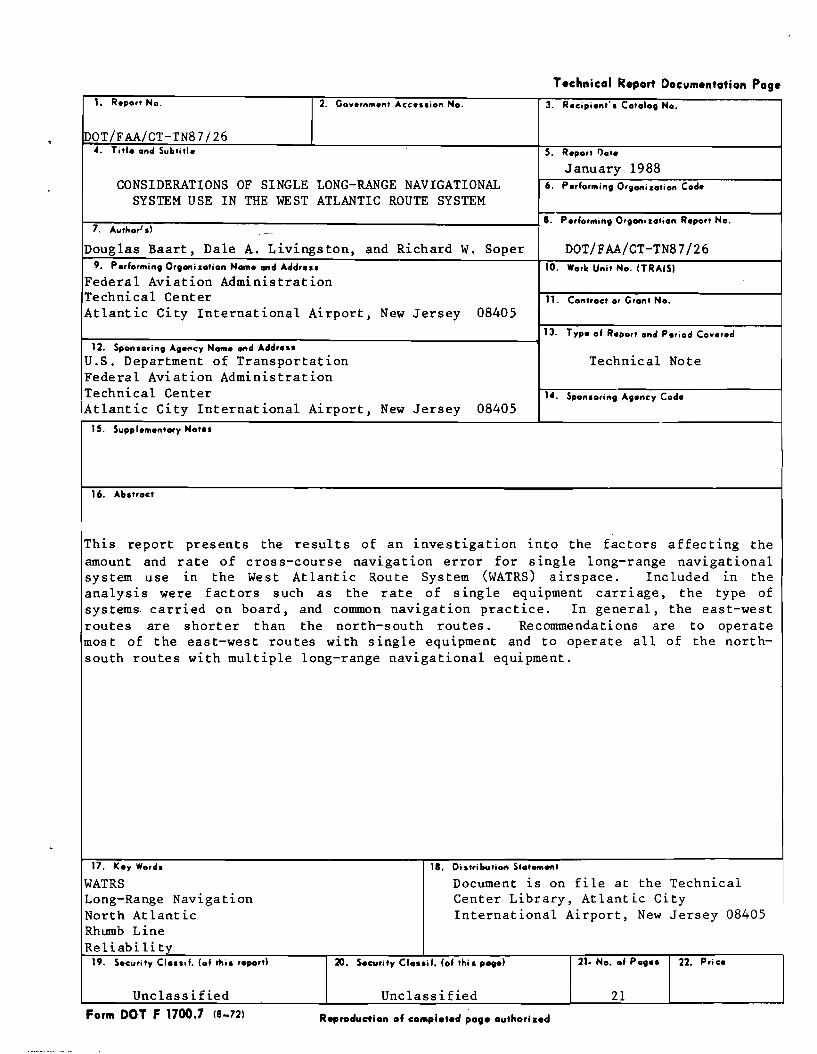
This report presents the results of an investigation into the factors affecting theamount and rate of cross-course navigation error for single long-range navigationalsystem use 1n the West Atlantic Route System (WATRS) airspace. Included In theanalysis were factors such as the rate of single equipment carriage, the type ofsystems. carried on board, and common navigation practice. In general, the east-westroutes are shorter than the north-south routes. Recommendations are to operatemost of the east-west routes with single equipment and to operate all of the northsouth routes with multiple long-range navigational equipment.
17. Key Wards
WATRSLong-Range NavigationNorth AtlanticRhumb LineReliability
18. Distribution SI..I __ t
Document 1S on file at the TechnicalCenter Library, Atlantic CityInternational Airport, New Jersey 08405
19. Securily CI .... if. (of "'is report) 20. Security Cla..if. (of thi s pog.) 21. No. of Pag.s 22. Price
Unclassified Unclassified 21Form DOT F 1700.7 (8-72) Reflroduc:tion of completed poge outhorized


TABLE OF CONTENTS
INTRODUCTION
BackgroundPurpose
DISCUSSION
Rate of Single-System Carriage in WATRSCommon Navigation PracticeA Bounding ArgumentReliability of Navigational Equipment in WATRS
CONCLUSION
iii
Page
1
11
1
234
11
15

Figure
1
2
3
Table
1
2
3
4
5
6
7
8
9
LIST OF ILLUSTRATIONS
Major East-West WATRS Routes
Major North-South WATRS Routes
Probability of Failure for Omega Navigational Systemafter Hours of Operation
LIST OF TABLES
Rate of Single Versus Multiple Long-Range NavigationalSystems in WATRS
Estimated Maximum Offsets - U.S. Coast to Bermuda(2 0 Directional Gyro Compass Error)
Estimated Maximun Offsets - New York to San Juan(2 0 Directional Gyro Compass Error)
Estimated Maximum Offsets - U.S. Coast to Bermuda(4 0 Directional Gyro Compass Error)
Estimated Maximum Offsets - New York to San Juan(4 0 Directional Gyro Compass Error)
Projected Yearly Flight Hours per Unit Navigationfor Single Long-Range Navigation (North-South Routes)
Projected Yearly Flight Hours per Unit Navigationfor Single Long-Range Navigation (East-West Routes)
Expected Failures per Year (North-South Routes)
Expected Failures per Year (East-West Routes)
1V
Page
7
8
12
Page
2
9
9
10
10
13
13
14
14

INTRODUCTION
BACKGROUND.
At the North At lant ic /Systems Planning Group's (NAT /SPG) 23rd annual meeting, aUnited States (U.S.) member presented a paper which reported on the analysis of theWestern Atlantic Route System (WATRS). This system, which primarily bearstraffic from the North American East Coast to the Caribbean Basin, was examinedwith respect to· the risk of collision with the view toward a reduction in thelateral and longitudinal separation minima. The rationale for present ing thisinforma tion to NAT /SPG was two fold. ·Fi rs t, the very same members 0 f manydelegations who sat at NAT/SPG also had influence in decisions regarding changes tothis oceanic airspace. Second, NAT/SPG had accumulated a basis of experience withthe separation minima that, it was hoped, could be applied in WATRS.
Generally, the report met with success and approval. However, one aspect of theproposed implementation was received with reservation. This area dealt withthe routine dispatching of aircraft in this system with a single long-rangenavigational platform. On the pos it ive side were the facts that the currentsystem had been successfully operated for a considerable time without majormishap nor evidence that the rate of larger navigational errors was excessive. Inaddition, the time period spent outside of the range of land-based, short-rangenavigational aids, VHF communications, and radar coverage was not nearly asgreat as in the North Atlantic (NAT). On the negative side was that, althoughcertain routes are operated under these rules in the NAT, sufficient experience hadnot been built up in order to generalize that experience; however, the operationalexperts opined that, in consideration of the NAT, this practice was the exceptionrather than the rule. In any case, high traffic, minimum separation use of thesingle long-range navigational systems was not applied.
PURPOSE.
These considerations and additional guidance from the U.S. Flight Standardsorganizat ion have led to the pursuit of a phased approach to the reduct ion ofseparation minimum for WATRS. In the condition where the separations wouldbe equal to those used in the NAT today, it is most likely that redundantlong-range navigational systems would be required. A few instances still existwhere operations would warrant the use of a single long-range platform. In anattempt to examine some of the arguments supporting these practices, this reportwill present some of the details associated with these special routes in theWATRS.
DISCUSSION
In general, the common long-range navigational systems used today, and likely inthe near-term future, are highly reliable and can achieve relatively accurateposl.t10ning. In fact, the accuracy of position is usually not influenced by thenumber of independent navigation systems carried on the aircraft. Concernsare raised when an aircraft that might be using a sole instrument as the primaryreference and with no backup capability loses the function of this system. This

is a remote possibi lity and, in such a situation, reliance is then placed onthe available instrumentation and the navigational ability of the aircrew.Several variables must be investigated in order to fully assess the situation. Theprincipal determining factors that would have an effect on the ability of anaircraft to hold course and on whether or not it would pose a threat to otheraircraft are:
1. The expected error of the remaining primary reference, the directional gyro(D.G.>'
2. The difference between the actual winds aloft and those used for flightplanning and corrections based upon known information.
3. The difference between a great-circle course and a rhumb-line course.
4. The availability of short-range, land-based navigational reference, and othersupporting services.
Each of these factors will have an effect on the aircraft's position withrespect to intended course and combine to produce a cross-course componentwhich could possibly place an aircraft near another route. If these factors weresufficiently well known, an estimate of the total reasonable cross-course errorcould be produced. I t turns out that some factors are better known than others.Information gathered with respect to the variables will be presented, and aqualitative assessment will be produced.
RATE OF SINGLE-SYSTEM CARRIAGE IN WATRS.
As a part of followup information gathering in WATRS, it was decided to determinethe rate of utilization of single versus multiple long-range navigational systems.A survey of the operators within the WATRS was conducted. All the ident ifiableoperators were provided a questionnaire from which responses were assembled withrespect to the proportion of traffic an operator exhibited, the fleet of aircraft,and the equipage of that fleet. A sufficient number of responses was received inorder to project the equipage across the population. The responses included themajor operators, nonscheduled air carriers, U. S. mi Ii tary, and general aviat ion(business jet) components of the population. The projections are based upon asample of flight progress data obtained during the high traffic period of late 1985and early 1986. Table 1 summarizes the projection of single versus multiplelong-range systems across the population.
TABLE 1. RATE OF SINGLE VERSUS MULTIPLE LONG-RANGE NAVIGATIONAL SYSTEMS IN WATRS
Air CarrierGeneral AviationMilitaryPopulation
Percent ofPopulation
9452
Percent Of SingleSystem Use
5213a
49
Percent of MultipleSystem Use
4887
10051
Note: Table entries are rounded.
2

The overall rate of single-system carriage in WATRS is approximately SO percent.This rate is expressed as a function of flights in the system rather than accordingto the fleet of aircraft.
Different flight regimes and situational demands give rise to roles which aresatisfied by an operator's fleet. Many of the operators in the airspace choose toequip an aircraft from its domestic fleet with the navigational systems requiredfor these over-water routes. This provides a maximum flexibility in using anoperator's f~ll fleet of aircraft without having to devote a particular subset offleet to the task. Adequate flexibility may be possible in a dual, long-rangeconfiguration with some of the confirmed domestic fleet equipped with thesenavigational systems, since Omega systems are prevalent.
COMMON NAVIGATION PRACTICE.
Discussions with pilots and other navigational experts indicate that there 1S
common navigation practice which can be used to qualitatively gauge the effects ofthe loss of a single long-range system. The typical flight plan includes en routepositions or fixes which lie between the oceanic entry and exit fixes. Thesepositions are published on charts and are primary way points used for navigation.That is, on a typical flight, the progression is from intermediate point tointermediate point as opposed to flying the entire route via a great circle fromentry to exit fix. The fixed reporting way points commonly lie on or very near tothe great circle path, but the progression through a series of intermediate pointsspecifically bears on calculation of the cross-course error accumulation.
Also included on the typical flight plan is the magnetic course for each segment.This can be used in the event of the loss of the long-range navigation reference tocontinue flight. In a normal situation, following the course will result in aparallel track to what would otherwise be a rhumb line between the way points. Acommon practice then, barring other sources of information, would be to use headinghold and continue by reference to the directional gyro, provided that the decisionis to continue to destination rather than to divert.
In addition to other information provided to the pilot for use inflight, the pilotalso has zonal wind forecasts for the winds aloft. These provide aloft forecastsvarying in cons is tency and accuracy and must be interpreted during the progressof the flight to provide the best results. Since the various operators usedifferent sources for the predicted winds (e.g., their own base of information andforecasters, the National Weather Service, et al.) and these forecasts vary withrespect to their age and the wind information base, it would require substantialresources which are currently unavailable to statistically assess the differencebetween the forecast and actually experienced conditions. Interviews with expertsrevealed that prior to the potential loss of the primary long-range navigationreference, the wind component is provided from the navigat ion instrumentat ion.This wind component is noted by the pilot and the resulting vector used for flight(exhibited in the heading) is compared to the flight planned heading. Should therebe a loss of the long-range navigational system, this difference between themeasured wind component and the flight planned heading is applied to the subsequentlegs of the flight. Insofar as the actual winds aloft are concerned, it is insome cases possible to use very high frequency (VHF) communications betweenadjacent aircraft to acquire information with respect to the current situation.The orientation of the principal routes with respect to the major prevailingwind patterns also affects the cross-course component of the wind vector. Theprevailing wind pattern for the WATRS is a general west to east flow.
3

All of these factors contribute to the cross-course deviation when one loses thelong-range navigational system. As a result of the experience and judgement thatthe aircrew brings to the situation, these connnon practices tend to reduce thedeviations over what would be if the aircraft continued the flight holding thepresent heading. Clearly, when faced with such a situation, the aircrew will applythe maximum available information to the problem and attempt to gain as muchinformation as possible.
A BOUNDING ARGUMENT.
Based upon information obtained from a certification specialist with respect to thelevel of error associated with the directional gyro, a deterministic approach tobounding the magnitude of the deviations from course was pursued. This sectionelaborates the assessment of those bounds.
The orientation of any particular route affects the lateral deviation from intendedtrack which will accrue as an aircraft proceeds in a dead-reckoning situation.Significant factors affecting the lateral deviation include the dead-reckoningprocedure followed by the aircraft, the general direction of the route, the lengthof subsequent route segments, the number of turns on the subsequent route segments,and the angular magnitude of those turns. Only the error of the directional gyroand the contribution of the difference between a great-circle and dead-reckonedcourse are considered here.
For the purpose of this analysis, the dead-reckoning procedure assumes a change inthe aircraft's course as the aircraft passes abeam of each subsequent, compulsoryfix on the route. For each new leg, the course will equal the rhumb-line coursebetween the current, abeam route fix and the subsequent, next route fix. This rulecauses the aircraft to parallel each new leg of the route which will minimize theaccrued lateral deviation from route centerline as the dead reckoning proceeds intime. With regard to this intended course, however, the analysis will introduce apredetermined directional gyro compass error in the direction which will cause theaircraft to deviate away from the desired track as the dead-reckoned leg is flown.Additionally, the aircraft will be forced to "lose" long-range navigationalability on the first route segment flown, at the point which maximizes the lateraloffset from route centerline when the aircraft later passes abeam of the firstsegment I s end point. This is the worst case, and it will maximize the accruedlateral offset as the entire route is dead reckoned. Thus, the results whichfollow later in this section are not the expected lateral offsets, in statisticalparlance, but rather represent bounds on the offsets which are likely to occur,based on the assumptions.
This analysis includes no errors other than the directional gyro compass error anderrors of course plotting as described above. Factors such as magnetic variation(declination), precession, and other directional gyro compass anomalies aresecond order effects. Also note that the directional gyro is usually slaved to aremote-indicating magnet ic compass; this tends to minimize magnet ic errors sincethe flight plans have accounted for magnetic variation. In addition, errors due towinds aloft were not considered for this quantitative assessment.
4

The rationale behind this approach to the analysis stems from the complexity ofthe route geometries, the uncertainty of where the aircrew would consider theaircraft abeam of successive route fixes (and thus initiate course changes), andthe low probabi li ty of single long-range navigational equipment failure. Theapproach considers the directional gyro compass as the primary instrument forcourse reference when the long-range navigation platform fails. Thus, afternavigation platform failure, the lateral offset from desired route centerlineaccumulates based on an angular measure; this measure is mainly influenced by theerrors in the directional gyro compass.
Typically, the directional gyro compass error is assumed Gaussian in distribution.Based on discussions with an expert certification specialist, the standarddeviation of the compass-error distribution equals 2°. Thus, approximately68 percent (l sigma) of the single, long-range-navigation-equipped aircraft wouldexhibit a 2° or less compass error; about 95 percent (2 sigma) of the aircraftwould exhibit a 4° or less compass error.
The analysis was performed for the principal routes in the WATRS. For each routein the system, the failing aircraft follows the first route segment until the pointon the great-circle track which has maximum deviation from the rhumb line whichconnects the segment's end points. At this point, the single navigation systemfails and the aircraft begins dead reckoning along a rhumb line with a course whichwill make the aircraft "parallel" the first route segment. In order to forcemaximum lateral deviation along the entire route, a specified directional gyrocompass error will be applied (1 sigma or 2 sigma) and the rhumb-line course willbe altered in the direction which will cause the aircraft to deviate away from thedesired great-circle track as the dead-reckoned leg is flown.
Once the aircraft is determined to be abeam of the next compulsory route fix, anew rhumb-line course is established based on the rhumb-line course between thecurrently abeam route fix and the following compulsory fix on the route. Onceagain, to force maximwn lateral deviation along the entire remaining route, thespecified directional gyro compass error is again applied (1 sigma or 2 sigma) andthe rhumb-line course established for dead reckoning the new leg will be altered inthe direction which will cause the aircraft to deviate away from the desired trackas the leg is flown. This algorithm then repeats for each new leg as the aircraftpasses abeam of the subsequent route fixes.
The net result of this algorithm is to compute a region of angular containment forthe expected lateral error. Given the 2 sigma compass error of 4°, one wouldexpect about 95 percent of the single, long-range-navigation-equipped aircraftthat experience navigation system failure to exhibit a direction gyro compass errorof 4 ° or less. Thus, by assuming a worst-case position along the first routesegment a t which the equipment fai lure is invoked and by always adding the 4 °compass error (maximwn) in the worst-case direction as far as lateral deviationfrom route centerline is concerned, the aircraft proceeds a long a dead-reckonedtrack which approximates the maximum deviat ion expected from the route. At eachpoint along the dead-reckoned track, the lateral offset distance to the desiredroute centerline is computed. The maximum deviation from each route segment isrecorded as calculations are performed iteratively along the dead-reckoned track.
5
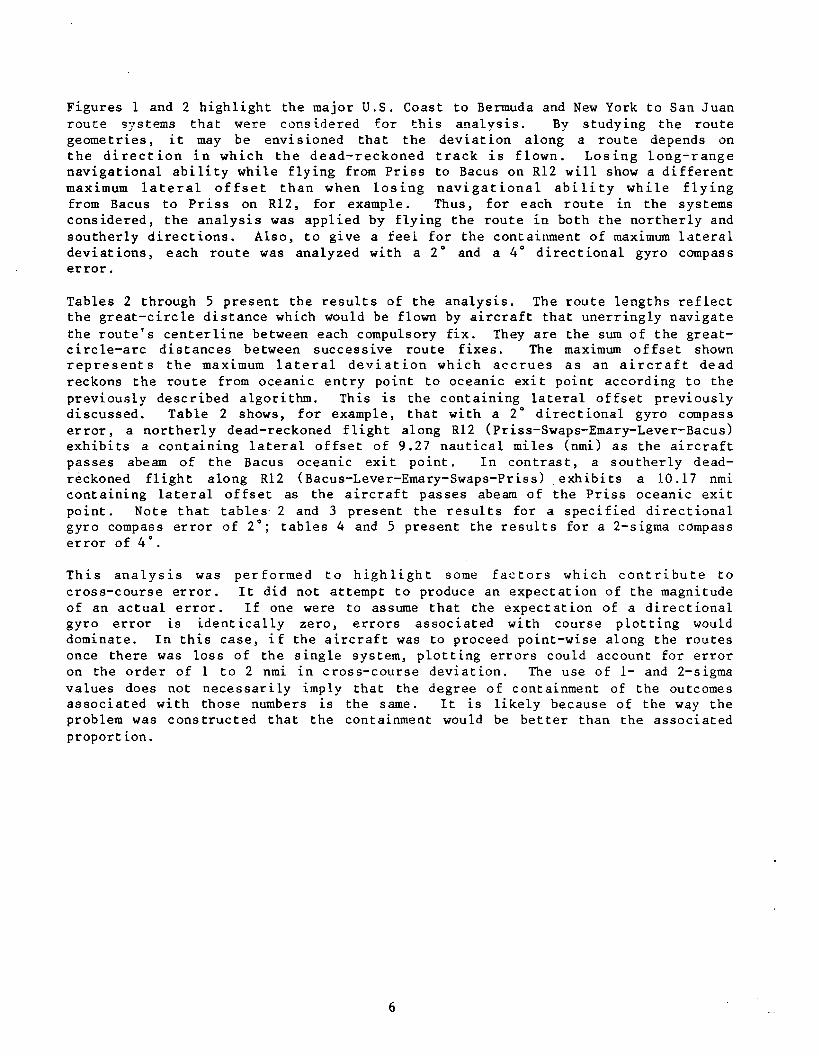
Figures 1 and 2 highlight the major U.S. Coast to Bermuda and New York to San Juanroute systems that were considered for this analysis. By studying the routegeometries, it may be envisioned that the deviation along a route depends onthe direction in which the dead-reckoned track is flown. Losing long-rangenavigational ability while flying from Priss to Bacus on R12 will show a differentmaximum lateral of fs et than when los ing naviga t ional abi li ty whi le flyingfrom Bacus to Priss on R12, for example. Thus, for each route in the systemsconsidered, the analysis was applied by flying the route in both the northerly andsoutherly directions. Also, to give a feel for the containment of maximum lateraldeviations, each route was analyzed with a 2 ° and a 4° directional gyro compasserror.
Tables 2 through 5 present the results of the analysis. The route lengths reflectthe great-circle distance which would be flown by aircraft that unerringly navigatethe route's centerline between each compulsory fix. They are the sum of the greatcircle-arc distances between successive route fixes. The maximum offset shownrepresents the maximum lateral deviation which accrues as an aircraft deadreckons the route from oceanic entry point to oceanic exit point according to thepreviously described algorithm. This is the containing lateral offset previouslydiscussed. Table 2 shows, for example, that with a 2 ° directional gyro compasserror, a northerly dead-reckoned flight along R12 (Priss-Swaps-Emary-Lever-Bacus)exhibits a containing lateral offset of 9.27 nautical miles (nmi) as the aircraftpasses abeam of the Bacus oceanic exit point. In contrast, a southerly deadreckoned flight along R12 (Bacus-Lever-Emary-Swaps-Priss) exhibi ts a 10.17 nmicontaining lateral offset as the aircraft passes abeam of the Priss oceanic exitpoint. Note that tables' 2 and 3 present the results for a specified directionalgyro compass error of 2°; tables 4 and 5 present the results for a 2-sigma compasserror of 4°.
This analysis was performed to highlight some factors which contribute tocross-course error. It did not attempt to produce an expectation of the magnitudeof an actual error. If one were to assume that the expectation of a directionalgyro error is identically zero, errors associated with course plotting woulddominate. In this case, if the aircraft was to proceed point-wise along the routesonce there was loss of the single system, plotting errors could account for erroron the order of I to 2 nmi in cross-course deviation. The use of 1- and 2-sigmavalues does not necessarily imply that the degree of containment of the outcomesassociated with those numbers is the same. It is likely because of the way theproblem was constructed that the containment would be better than the associatedproportion.
6

FIGURE 1.MAJOR EAST-WEST WATRS ROUTES
7
- I

I ............,
~ ..
FIGURE 2. MAJOR NORTH-SOUTH WATRS ROUTES
8
........
. '---.

TABLE 2. ESTIMATED MAXIMUM OFFSETS - U.S. COAST TO BERMUDA(2 0 DIRECTIONAL GYRO COMPASS ERROR)
Northerly Flight Southerly Flight
Route Length Maximmn Offset Maximmn OffsetRoute (nmi) (nmi) (nmi)
G432 265.2 5.77 6.04B24 287.2 8.23 7.56R12 322.2 9.27 10.17R13 450.0 14.20 4.54R14 463.3 15.07 14.82B646 624.2 19.93 22.02
TABLE 3. ESTIMATED MAXIMUM OFFSETS - NEW YORK TO SAN JUAN(2 0 DIRECTIONAL GYRO COMPASS ERROR)
Northerly Flight Southerly Flight
Route Length Maximmn Offset Maximmn OffsetRoute (nmi) (nmi) (nmi)
A23 913.3 26.10 30.65A300 1085.1 31.21 36.66A554 962.2 27.51 32.97A25 1172.8 32.35 41.63R69 718.9 17.64 21.26G431 908.9 26.34 31.34
9

TABLE 4. ESTIMATED MAXIMUM OFFSETS - U.S. COAST TO BERMUDA(4° DIRECTIONAL GYRO COMPASS ERROR)
Northerly Flight Southerly Flight
Route Length Maximum Offset Maximum OffsetRoute (nmi) (nmi) (nmi)
G432 265.2 10.25 10.711324 287.2 16.23 14.43R12 322.2 18.18 20.13R13 450.0 28.08 9.82R14 463.3 29.96 29.34B646 624.2 39.62 43.85
TABLE 5. ESTIMATED MAXIMUM OFFSETS - NEW YORK TO SAN JUAN(4° DIRECTIONAL GYRO COMPASS ERROR)
Northerly Flight Southerly Flight
Route Length Maximum Offset Maximum OffsetRoute (nmi) (nmi) (nmi)
A23 913.3 51.92 60.83A300 1085.1 62.13 72.70A554 962.2 54.91 65.73A25 1172.8 63.58 82.77R69 718.9 34.58 41.44G431 908.9 52.06 62.49
10

RELIABILITY OF NAVIGATIONAL EQUIPMENT IN WATRS.
Reliability is the probability that a device, such as a single long-rangenavigation sensor, will perform within design limits for a period of time undernormal operating conditions. A parameter generally defined as the mean-t imebetween-failures (MTBF) is a measure of the average time at which failures occur.Failures occur at random intervals, and the expected number of failures is the samefor equally long operating periods. The function which relates the reliability ofa component and time is generally exponential in nature. Figure 3 shows such arelationship between the probability of a failure expressed in hours of operationfor Omega equipment.
Generally, it was assumed for this analysis that components will be replaced beforedeterioration sets in, thus holding the failure rate constant. As a result, theuseful life of the component will only be considered, since wear-out reliabilitydepends on the age of the component and usually takes on a Gaussian shape. TheMTBF for Omega, inertial navigation systems (INS), and ring laser gyro navigationequipments were obtained from operational personnel and used in conjunction withprojected annual flight hours to produce estimates of expected failures. In theWATRS, Omega operations accounted for approximately 96 percent of the singlelong-range navigation system use in this region. An estimate of the MTBF for thistype of equipment is about 6000 hours. INS-equipped aircraft made up the remaining4 percent of the population. This type of equipment is estimated to have a MTBF ofapproximately 2000 hours. Although the estimate of the MTBF for the ring lasergyro equipment was substantially greater than conventional INS units, a sufficientbase of experience has not been acquired from which to reliably extrapolate. Theorder of this estimate is 105 hours. Few aircraft in this system use this type ofnavigation equipment.
For the analysis, results of a survey of principal users in the WATRS withrespect to the type of navigation systems on board was used. The flight hours werecalculated from flight progress data that were collected during a high trafficperiod in 1985. Tables 6 and 7 show a linear projection of the annual flight hourson routes within the WATRS region. It should be noted that the data were collectedduring one of the busiest times of the year for travel in the WATRS, including twoholiday periods. As a result, the projected yearly accumulation of flight hoursis inflated over the actual case. This leads to conservatism in calculatingthe expectat ion of the number of failures. For the analysis, the system waspartitioned into the east-west routes serving Bermuda and the north-south routesserving the New York-San Juan corridor.
The apportionment of the fligh~ hours to the different kinds of navigationequipment and on the particular routes is d.isplayed under the headings of INS andOmega in tables 6 and 7. Clearly, the proportion of traffic on the New York-SanJuan routes represents the majority of flight hours, along with Omega being themost utilized single long-range navigation system. Although some other types oflong-range navigation systems were observed in this airspace, they represented avery small proportion and were not considered principal to the analysis.
11

l.
.95
.9
.85
P .8R0 .75
B .7AB .65IL .6IT .55Y
.5
0- .45N F
F.4
A .35IL .3UR .25E
.2
.15
.1
.05
o.a 1000 2000 3000 4000
../'
5000 6000 7000 8000 9000 10000
FIGURE 3. PROBABILITY OF FAILURE FOR OMEGA NAVIGATIONAL SYSTEM AFTER HOURS OF OPERATION
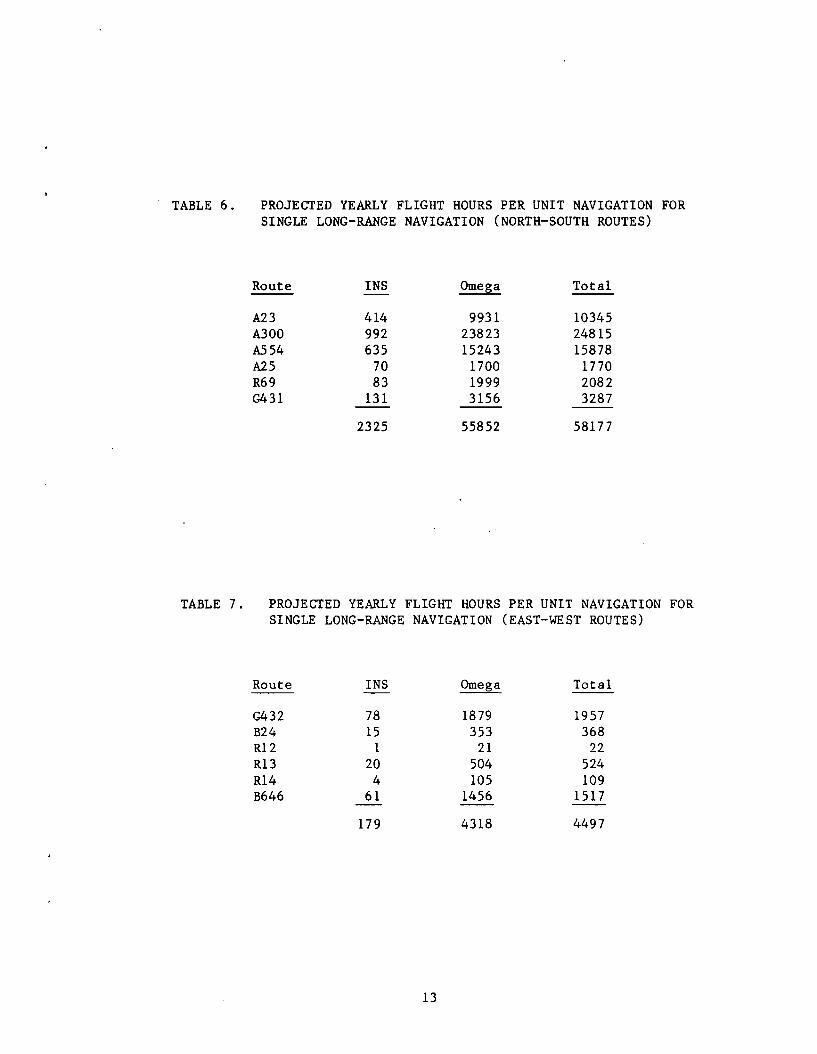
TABLE 6. PROJECTED YEARLY FLIGHT HOURS PER UNIT NAVIGATION FORSINGLE LONG-RANGE NAVIGATION (NORTH-SOUTH ROUTES)
Route INS Omega Total
A23 414 9931 10345A300 992 23823 24815A554 635 15243 15878A25 70 1700 1770R69 83 1999 2082G431 131 3156 3287
2325 55852 58177
TABLE 7. PROJECTED YEARLY FLIGHT HOURS PER UNIT NAVIGATION FORSINGLE LONG-RANGE NAVIGATION (EAST-WEST ROUTES)
Route INS Omega Total
G432 78 1879 1957B24 15 353 368R12 1 21 22R13 20 504 524R14 4 105 109B646 61 1456 1517
179 4318 4497
13

For the projections that follow, it was assumed that each flight that accumulatedhours in the system did so only by reference to a single long-range navigationsensor. The expected number of failures is derived from the total flight hours peryear adjusted to reflect (1) single system use, (2) navigation equipment use, and(3) MTBF of equipment used. These figures are stnnmarized in tables 8 and 9.
TABLE 8. EXPECTED FAILURES PER YEAR (NORTH-SOUTH ROUTES)
Route INS Omega Total
A23 0.207 1.655 1.862A300 0.496 3.971 4.467A554 0.318 2.541 2.859A25 0.035 0.283 0.318R69 0.042 0.333 0.375G431 0.066 0.526 0.592
1.164 9.309 10.473
TABLE 9. EXPECTED FAILURES PER YEAR (EAST-WEST ROUTES)
Route INS Omega Total
G432 0.039 0.313 0.352B24 0.008 0.059 0.067R12 0.001 0.004 0.005R13 O.OlD 0.084 0.094R14 0.002 0.018 0.020B646 0.031 0.243 0.274
0.091 0.721 0.812
14
The projections show that the expectation of failures in navigational equipment forthe north-south routes is substantially higher than the east-west routes and isdirectly related to the flight hours. While there is an expectation of less than1 for the east-west routes, an excess of 10 is expected for the north-south routes.Considerable conservatism was used in making these estimates. The actual numberexperienced in the system (as it would be if the usage rates of multiple equipmentand number of flight hours were accounted more accurately) would be fewer.
CONCLUSION
Estimates have been provided, mostly qualitative and some quantitative, as to whatcontributes to the cross-course navigational error when an aircraft in the WATRSairspace loses its primary long-range navigational system. Operational judgementis required in order to interpret whether such an event, in frequency and severity,could pose a safety hazard.
For routes which generally have an east-west orientation, several factors argue fortheir routine operation with a single long-range navigational system in the fleet.These routes in WATRS likely would connect the North American Northeast Coast andBermuda.
The distance outside of radar range, short-range land-based navigational aids, ordirect VHF communications is small and is approximately 350 nmi. The prevailingwind patterns are generally west to east, thus an unknown cross-course windcomponent which would adversely affect navigation is less likely to occur than forthe longer, north-south oriented routes. The relative amount of flight hours isquite small. Flight hours on the east-west routes currently atcount for less than10 percent of the overall WATRS operation hours. Given the reliability of thecurrent and near-term future navigation systems, it is unlikely that a failurewould occur. The expectat ion of an event is less than one per year with thecurrent equipment mix and on the basis of the current use. Even if these routes orsimilar ones were to be certified for single system operations, it is unlikely thatall flights would be conducted with a single system.
In the WATRS, for routes which are oriented north-south, there is reason tobelieve that cross-course error is likely to be greater. First, the time ordistance outside of radar, short-range land-based navigational aids, or directVHF communications is greater and is approximately 1000 nmi. Since the errorassociated with the remaining primary flight references (the directional gyro) isangular, there would be an accumulation of the cross-course component due to thissource. For the north-south routes this could be considerable. Aggravating thisis th"e fact that the prevailing wind patterns produce a greater cross-coursecomponent, and while the exact magnitude may be unknown, it can be reasonedthat, in comparison to routes with a different orientation (e.g., east-west), thesame general wind would have a more deleterious effect on the ability to holdthe centerlines. Since the north-south routes bear the bulk of the traffic,considerably more flight hours are expended on these routes. This produces twoeffects. First, the expectation of a system failure grows in direct proportion tothe amount of hours flown. Second, since more traffic is on the ·routes, the
15

likelihood of encountering another aircraft in the event of a large deviation wouldbe increased. One factor does tend to reduce the likelihood for total systemfailure. Since many of the aircraft which use the north-south routes are likely tobe used in other nondomestic roles, the proportion of multiple navigational systemson board is greater. Having two or more independent systems on board reducescons iderably the probabili ty of total system failures. Thus overall, the generalfailure rate should be quite small.
16

•

•
",.
•