Embed Size (px)
Citation preview

NREL is a national laboratory of the U.S. Department of Energy, Office of Energy Efficiency and Renewable Energy, operated by the Alliance for Sustainable Energy, LLC.
Michael Woodhouse, Ran Fu, Donald Chung, Kelsey Horowitz, Tim Remo, David Feldman, and Robert Margolis Strategic Energy Analysis Center
King Abdullah University of Science and Technology (KAUST) Solar Symposium 2015. Thuwal, Saudi Arabia. November 10, 2015 Alfred Hicks and Kendra Palmer
Graphics and Communications
Considerations for Solar Energy Technologies to Make Progress Towards Grid Price Parity
NREL/PR-6A20-65262

2
Analysis Disclaimer DISCLAIMER AGREEMENT These manufacturing cost model results (“Data”) are provided by the National Renewable Energy Laboratory (“NREL”), which is operated by the Alliance for Sustainable Energy LLC (“Alliance”) for the U.S. Department of Energy (the “DOE”).
It is recognized that disclosure of these Data is provided under the following conditions and warnings: (1) these Data have been prepared for reference purposes only; (2) these Data consist of forecasts, estimates or assumptions made on a best-efforts basis, based upon present expectations; and (3) these Data were prepared with existing information and are subject to change without notice. The names DOE/NREL/ALLIANCE shall not be used in any representation, advertising, publicity or other manner whatsoever to endorse or promote any entity that adopts or uses these Data. DOE/NREL/ALLIANCE shall not provide any support, consulting, training or assistance of any kind with regard to the use of these Data or any updates, revisions or new versions of these Data. YOU AGREE TO INDEMNIFY DOE/NREL/ALLIANCE, AND ITS AFFILIATES, OFFICERS, AGENTS, AND EMPLOYEES AGAINST ANY CLAIM OR DEMAND, INCLUDING REASONABLE ATTORNEYS' FEES, RELATED TO YOUR USE, RELIANCE, OR ADOPTION OF THESE DATA FOR ANY PURPOSE WHATSOEVER. THESE DATA ARE PROVIDED BY DOE/NREL/ALLIANCE "AS IS" AND ANY EXPRESS OR IMPLIED WARRANTIES, INCLUDING BUT NOT LIMITED TO, THE IMPLIED WARRANTIES OF MERCHANTABILITY AND FITNESS FOR A PARTICULAR PURPOSE ARE EXPRESSLY DISCLAIMED. IN NO EVENT SHALL DOE/NREL/ALLIANCE BE LIABLE FOR ANY SPECIAL, INDIRECT OR CONSEQUENTIAL DAMAGES OR ANY DAMAGES WHATSOEVER, INCLUDING BUT NOT LIMITED TO CLAIMS ASSOCIATED WITH THE LOSS OF DATA OR PROFITS, WHICH MAY RESULT FROM AN ACTION IN CONTRACT, NEGLIGENCE OR OTHER TORTIOUS CLAIM THAT ARISES OUT OF OR IN CONNECTION WITH THE USE OR PERFORMANCE OF THESE DATA.

3
Overview of Presentation I. Value Proposition and Needs for Increased Solar Deployment:
o Lower greenhouse gas emissions and predictable (zero) fuel price o The sensitivity of levelized cost of energy (LCOE) to capital costs,
operation and maintenance (O&M), and fuel prices for the traditional and other renewable energy options in power generation
o The LCOE of PV and relationship to total system costs o The current ranges of LCOE for photovoltaics (PV) across the United
States
II. Benchmarking Photovoltaics Component Costs: o Overview of NREL’s bottom-up cost modeling methods and results for
crystalline silicon and thin-film module technologies
III. The Path Forward: o Technology development opportunities that impact LCOE o A changing energy mix: Regional Energy Deployment Systems (ReEDS)
model results for expansion in power generation capacity.

4
Greenhouse Gas Emission Characteristics of Several Energy Choices
Sour
ce o
f GHG
rang
es: I
nter
gove
rnm
enta
l Pan
el o
n Cl
imat
e Ch
ange
(IPC
C). 2
011.
Fi
gure
8 in
Exe
cutiv
e Su
mm
ary
of th
e 33
rd S
essio
n (A
bu D
habi
, May
201
1). A
cces
sed
May
201
5, h
ttp:
//w
ww
.ipcc
.ch/
mee
tings
/ses
sion3
3/do
c20_
p33_
SPM
_SRR
EN.p
df.
5
Benchmark LCOE for Various Energy Options
Source: “Transparent Cost Database: LCOE Spreadsheet.” 2015. Golden, CO: NREL. Accessed October 2015. Available online: http://www.nrel.gov/analysis/data_tech_baseline.html
Estimates of Electricity Production Costs From New Capacity Representative fuel-based capital and O&M costs are without carbon capture and sequestration (CCS). Renewable resource classes selected on the basis of largest available U.S. capacity in 2015 (ranges reflect other resource classes within the U.S.).

6
Calculating the LCOE of PV
time (years)
Upfront System Cost
Any Applicable Incentives
Costs
Benefits
kilowatt hours (kWh)
Any component replacements or unusual events
Any routine O&M, including cleaning
For an overview of the NREL System Advisor Model (SAM) approach to calculating LCOE, please see: Short, W., D.J. Packey, and T. Holt. 1995. A Manual for the Economic Evaluation of Energy Efficiency and Renewable Energy Technologies. NREL/TP-462-5173. Golden, CO: NREL. Accessed May 2015, http://www.nrel.gov/docs/legosti/old/5173.pdf.

7
Calculating the LCOE of Solar: Location Matters
Source of figure: http://solargis.info/doc/free-solar-radiation-maps-GHI. Accessed November 2015.

8
Calculated Fixed-Tilt, Utility-Scale LCOE for PV Across the Contiguous United States
50-MW PV system (including 25-year system life, 10% IRR target, 10.9% nominal discount rate, 50% debt fraction at 7% interest for 20 years, 30% federal ITC, and 5-year federal and state MACRS depreciation). Regional considerations for wind and snow loads, labor rates, permitting costs, and sales taxes are also included. Source of figure: Fu, R., T. James, D. Chung, D. Gagne, A. Lopez, and A. Dobos. 2015. “Economic Competitiveness of U.S. Utility-Scale Photovoltaics Systems—Regional Cost Modeling of Installed Price and LCOE.” IEEE Journal of Photovoltaics, Accepted, 2015.

9
Benchmark and SunShot 2020 Target LCOEs for Solar PV So
urce
: Jon
es-A
lber
tus,
R.,
D. F
eldm
an, R
. Fu,
K. H
orow
itz, a
nd M
. Woo
dhou
se. 2
015.
Tec
hnol
ogy
Adva
nces
N
eede
d fo
r Pho
tovo
ltaic
s to
Achi
eve
Wid
espr
ead
Grid
Pric
e Pa
rity.
Was
hing
ton,
D.C
.: De
part
men
t of E
nerg
y (D
OE)
. Acc
esse
d Se
ptem
ber 2
015,
htt
p://
ener
gy.g
ov/e
ere/
suns
hot/
dow
nloa
ds/t
echn
olog
y-ad
vanc
es-
need
ed-p
hoto
volta
ics-
achi
eve-
wid
espr
ead-
grid
-pric
e-pa
rity.

10
Past, Present, and SunShot 2020 Systems Costs (Utility)
Sources: 2010: Feldman et al. 2014. “Photovoltaic System Pricing Trends: Historical, Recent, and Near-Term Projections –2014 Edition.” NREL/PR-6A20-62558. Golden, CO: NREL. 2015: Chung et al. 2015. U.S. Photovoltaic Prices and Cost Breakdowns: Q1 2015 Benchmarks for Residential, Commercial, and Utility-Scale Systems. NREL/TP-6A20-64746. Golden, CO: NREL. SunShot Goal: DOE. (2012). SunShot Vision Study. DOE/GO-102012-3037. Washington, D.C.: DOE.

11
Past, Present, and SunShot 2020 Systems Costs (Commercial)
Sources: 2010: Feldman et al. 2014. “Photovoltaic System Pricing Trends: Historical, Recent, and Near-Term Projections –2014 Edition.” NREL/PR-6A20-62558. Golden, CO: NREL. 2015: Chung et al. 2015. U.S. Photovoltaic Prices and Cost Breakdowns: Q1 2015 Benchmarks for Residential, Commercial, and Utility-Scale Systems. NREL/TP-6A20-64746. Golden, CO: NREL. SunShot Goal: DOE. (2012). SunShot Vision Study. DOE/GO-102012-3037. Washington, D.C.: DOE.

12
Past, Present, and SunShot Systems Costs (Residential)
Sources: 2010: Feldman et al. 2014. “Photovoltaic System Pricing Trends: Historical, Recent, and Near-Term Projections –2014 Edition.” NREL/PR-6A20-62558. Golden, CO: NREL. 2015: Chung et al. 2015. U.S. Photovoltaic Prices and Cost Breakdowns: Q1 2015 Benchmarks for Residential, Commercial, and Utility-Scale Systems. NREL/TP-6A20-64746. Golden, CO: NREL. SunShot Goal: DOE. (2012). SunShot Vision Study. DOE/GO-102012-3037. Washington, D.C.: DOE.

13
Benchmark and SunShot 2020 Target LCOEs for Solar PV So
urce
: Jon
es-A
lber
tus,
R.,
D. F
eldm
an, R
. Fu,
K. H
orow
itz, a
nd M
. Woo
dhou
se. 2
015.
Tec
hnol
ogy
Adva
nces
N
eede
d fo
r Pho
tovo
ltaic
s to
Achi
eve
Wid
espr
ead
Grid
Pric
e Pa
rity.
Was
hing
ton,
D.C
.: De
part
men
t of E
nerg
y (D
OE)
. Acc
esse
d Se
ptem
ber 2
015,
htt
p://
ener
gy.g
ov/e
ere/
suns
hot/
dow
nloa
ds/t
echn
olog
y-ad
vanc
es-
need
ed-p
hoto
volta
ics-
achi
eve-
wid
espr
ead-
grid
-pric
e-pa
rity.

14
Opportunities for Future Work: Applying the NREL LCOE Method to the Kingdom of Saudi Arabia
Source of figure: Saudi Arabia Solar Industry Association. Accessed November 2015. Available online: http://saudi-sia.com/solargis-data/

Part II: Overview of NREL’s Bottom-Up Cost Modeling Methods and Recent Results
Part IIa: The Crystalline Silicon (c-Si) Supply Chain
Source of figures: NREL.

16
The Global Nature of the Photovoltaics Industry Facility Locations and Manufacturing Capacities for the Top 500 Companies
Countries observed to currently have wafer, cell, and module manufacturing production: United States, China, Taiwan, South Korea, Japan, Philippines, Malaysia, Singapore, and Germany.
Market Share October 23, 2015

17
Source of figure: M Woodhouse, R Fu, T Remo, K Horowitz, D Feldman, D Chung, B Gallagher, and R Margolis “Economic Factors of Production Affecting Crystalline Silicon Photovoltaics Manufacturing Costs”, In Preparation.
The Processes of Multicrystalline Ingot Formation with the Bridgman Directional Solidification Method and Wafering with Wire Sawing

18
Aggregated Step Costs for Multicrystalline Ingot Growth and Wire Sawing of Wafers

19
Calculated Manufacturing Costs for the Directional Solidification Process Carried Out Across the Globe: The Case of the p-type Wafer Made with Solar Grade Polysilicon

20
The Standard c-Si Solar Cell
Source of figure: NREL.

21
Passivated Emitter and Rear Cells (PERC)
Source of figure: NREL.

22
Aggregated Step Costs for PERC Cell Conversion

23
Electroplated Cells
Source of figure: NREL.

24
Bottom-Up Cost Model Results for Several Cell Conversion Options

25
Total Module Components
Source of Figure: NREL

26
Review: Cost Elements Within the Crystalline Silicon Supply Chain
Source: Jones-Albertus, R., D. Feldman, R. Fu, K. Horowitz, and M. Woodhouse. 2015. Technology Advances Needed for Photovoltaics to Achieve Widespread Grid Price Parity. Washington, D.C.: Department of Energy (DOE). Accessed September 2015, http://energy.gov/eere/sunshot/downloads/technology-advances-needed-photovoltaics-achieve-widespread-grid-price-parity.

27
Elements in Multi-Module Costs and Calculated Minimum Sustainable Margins (Nationally Integrated)
Sour
ce o
f fig
ure:
NRE
L an
d M
IT.
Plea
se a
lso se
e: D
M P
owel
l, R
Fu, K
Hor
owitz
, P A
Bas
ore,
M
Woo
dhou
se, a
nd T
Buo
nass
isi “
The
Capi
tal I
nten
sity
of P
hoto
volta
ics M
anuf
actu
ring:
Ba
rrie
r to
Scal
e an
d O
ppor
tuni
ty fo
r Inn
ovat
ion”
, Ene
rgy
and
Envi
ronm
enta
l Sci
ence
, Ac
cept
ed 2
015.

28
Standard Multicrystalline Silicon Module Assembly With Nationally Integrated Minimum Sustainable Cell Prices
29
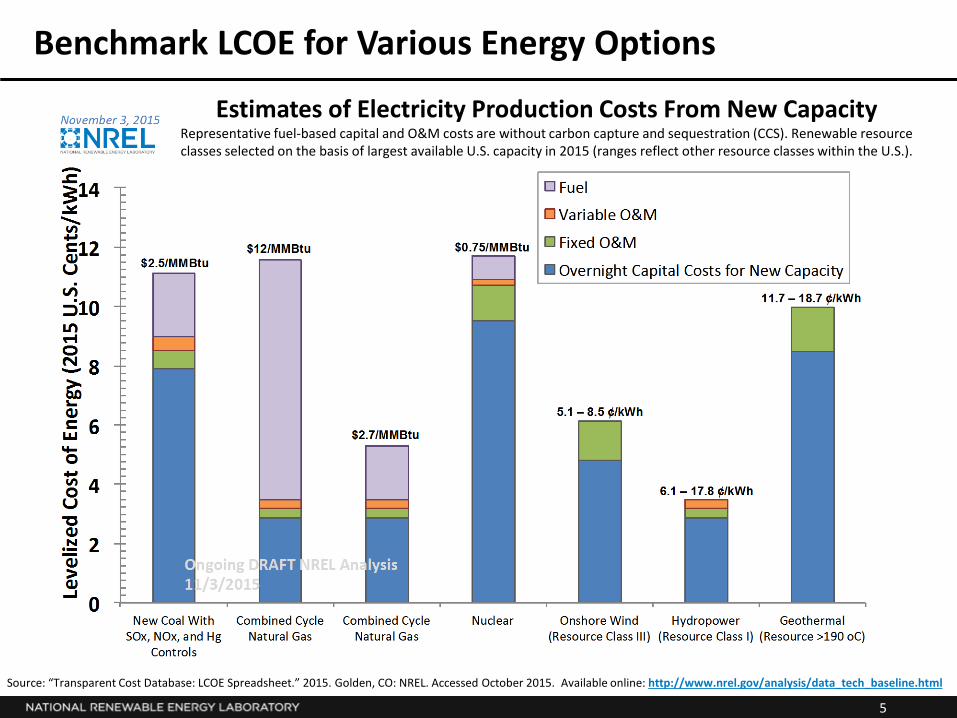
Part IIb: Thin-Film PV Module Technologies
Typical thin-film module by monolithic integration. Source of Figure: NREL
Multi-junction solar cells (left) and concentrating fresnel lens module (right). Source of Figure: NREL

30
The Process Flow Used in the NREL CdTe Cost Model
Source of Figure: NREL

31
Cost Elements for CdTe Manufacturing
Source: Jones-Albertus, R., D. Feldman, R. Fu, K. Horowitz, and M. Woodhouse. 2015. Technology Advances Needed for Photovoltaics to Achieve Widespread Grid Price Parity. Washington, D.C.: Department of Energy (DOE). Accessed September 2015, http://energy.gov/eere/sunshot/downloads/technology-advances-needed-photovoltaics-achieve-widespread-grid-price-parity.

32
Summary of Findings: Technologies

33
Summary of Findings: Technologies (Single Country)

Part III: Specific Technology Pathways to Lower the LCOE of PV

35
Costs-Benefits Analysis: Cells

36
Incorporation into LCOE and Other Projections

37
Incorporation into LCOE and Other Projections

38
Technology Pathways to Lower LCOE: Efficiency, Reliability, and Costs
Source: Jones-Albertus, R., D. Feldman, R. Fu, K. Horowitz, and M. Woodhouse. 2015. Technology Advances Needed for Photovoltaics to Achieve Widespread Grid Price Parity. Washington, D.C.: Department of Energy (DOE). Accessed September 2015, http://energy.gov/eere/sunshot/downloads/technology-advances-needed-photovoltaics-achieve-widespread-grid-price-parity.

39
Technology Pathways to Lower LCOE: Efficiency, Reliability, and Costs
Source: Jones-Albertus, R., D. Feldman, R. Fu, K. Horowitz, and M. Woodhouse. 2015. Technology Advances Needed for Photovoltaics to Achieve Widespread Grid Price Parity. Washington, D.C.: Department of Energy (DOE). Accessed September 2015, http://energy.gov/eere/sunshot/downloads/technology-advances-needed-photovoltaics-achieve-widespread-grid-price-parity.

Impacts to Energy Mix

41
Model Scenarios for Electricity Capacity Expansion
0
100
200
300
400
500
600
700
800
900
1000
2010 2015 2020 2025 2030 2035 2040 2045 2050
Sola
r Gen
erat
ion
(TW
h)
Central Scenario
Low Fuel Prices
High Fuel Prices
Low EconomicGrowthHigh EconomicGrowthLow Cost Solar &WindHigh Cost Solar &WindAccelerated CoalRetirementsExtended NuclearLifetime
Results from NREL’s Regional Energy Deployment Systems (ReEDS) model: o Capacity expansion model to meet projected U.S. electricity requirements o Based upon system-wide, least-cost optimization, including storage resource development and applicable state renewable
portfolio standards o Fuel price projections based upon 2014 EIA Annual Energy Outlook
Source of figure: Sullivan, P., W. Cole, N. Blair, E. Lantz, V. Krishnan, T. Mai, D. Mulcahy, and G. Porro. 2015. 2015 Standard Scenarios Annual Report: ReEDS Model Description and Scenario Exploration. NREL/TP-6A20-64072. Golden, CO: NREL. Accessed September 2015, http://www.nrel.gov/docs/fy15osti/64072.pdf.

42
0
200
400
600
800
1000
1200
1400
1600
1800
2010 2014 2018 2022 2026 2030 2034 2038 2042 2046 2050
Capa
city
(GW
)
Storage
Solar
Wind
Biopower
Geothermal
Hydro
Gas-CT
Gas-CC
Oil-Gas-Steam
Coal
Nuclear
ReEDS Model Scenarios for Electricity Capacity Expansion by Technology: The Central Scenario of Fuel Prices
Results shown are for the ‘Central Scenario’. Source of figure: Sullivan, P., W. Cole, N. Blair, E. Lantz, V. Krishnan, T. Mai, D. Mulcahy, and G. Porro. 2015. 2015 Standard Scenarios Annual Report: ReEDS Model Description and Scenario Exploration. NREL/TP-6A20-64072. Golden, CO: NREL. Accessed September 2015, http://www.nrel.gov/docs/fy15osti/64072.pdf.

43
Conclusions
1. The broader adoption of solar energy technologies is most significantly influenced by policy, economic growth, the continuation of module and total systems cost reductions, and future fuel prices for the traditional sources.
2. In terms of approaching LCOE parity with the traditional energy generation options, model results suggest that improvements to PV module and system reliability may contribute as much as improvements to PV module efficiency. Reliability is also believed to influence financing rates, which has a significant impact upon LCOE.
3. BUT, improvements in both efficiency and reliability are useful in lowering the LCOE of solar.
4. For further reductions in LCOE, innovations that could lead to lower hardware, installation labor, and financing costs could present larger opportunities than continued reductions in module prices.
5. Grid integration and reliability and developing compatible utility business models are also critical factors for the future adoption of solar.

44
1. Thank you to the organizers of KAUST Solar Symposium 2015!
2. Presenter’s contact information: [email protected]
3. Interested in working with NREL’s Clean Energy Manufacturing Analysis Center (CEMAC) and Strategic Energy Analysis Center (SEAC)?
• [email protected] (CEMAC Group Manager and Technical Director)
• [email protected] (SEAC Center Director)
Conclusions: Part II