Embed Size (px)
Citation preview
1
Considerations for Laboratory Testing of
Industrial Hemp
KEITH WEGNERCOLORADO DEPARTMENT OF AGRICULTURE INSPECTION AND CONSUMER SERVICES DIVISIONLaboratory Services Section
August 2017
2
Method Overview
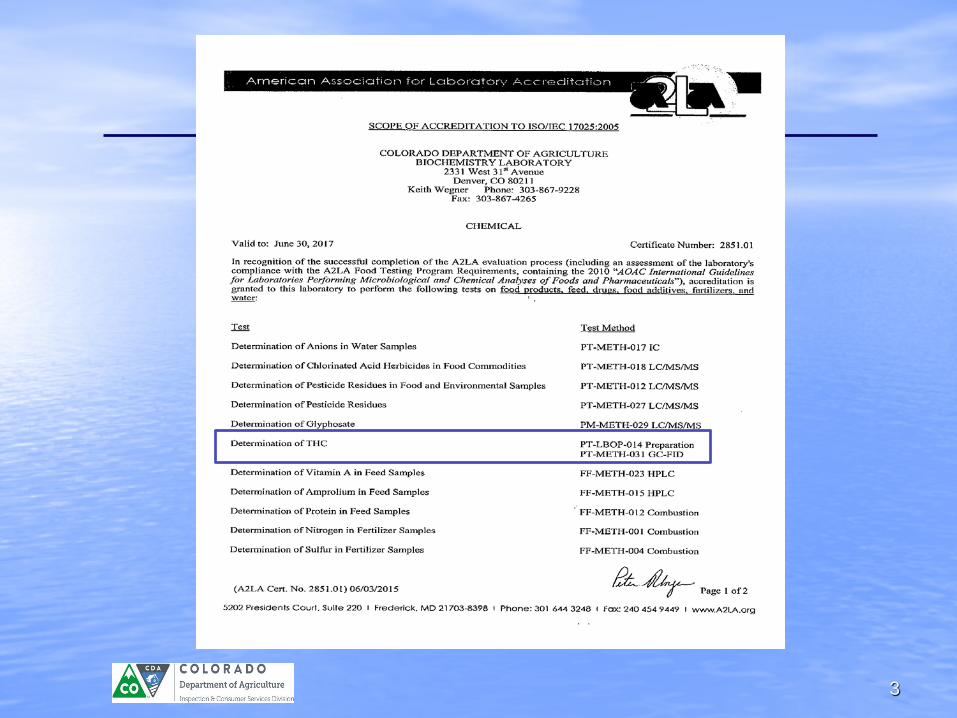
Industrial hemp samples are analyzed at the CDA Biochemistry Laboratory. The laboratory is accredited to ISO 17025.
Two protocols are documented in SOPs:
• PT-LBOP-014 Hemp Sample Preparation• PT-METH-031 Determination of Delta-9 THC in
Hemp by Gas Chromatography with Flame IonizationDetection (GC-FID)
3
Topics
4
Method Overview• Sample Prep – drying
Entire sample is dried at 90◦ C for 2 hours Allow to cool, then weigh Dry the sample for an additional 15+ minutes at 90◦ C Repeat this drying step until constant weight is achieved Samples must be at % moisture of 15% or less
• Sample Prep – size reduction Stems and seeds are removed from the sample Sample is gently worked through a No. 8 (2.38mm) mesh sieve
5
Method Overview
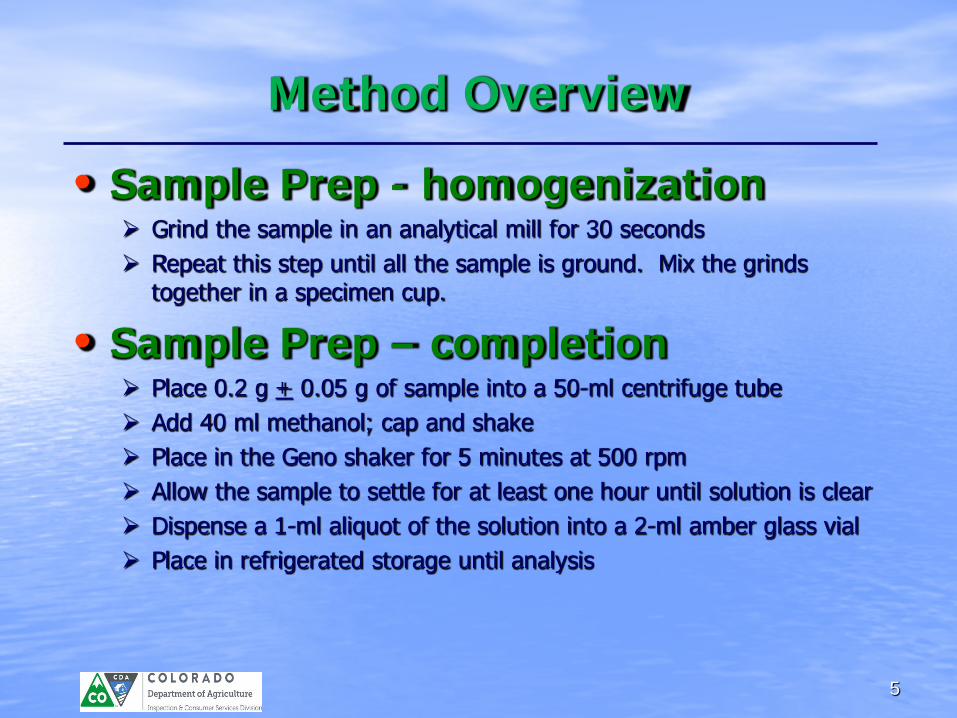
• Sample Prep - homogenization Grind the sample in an analytical mill for 30 seconds Repeat this step until all the sample is ground. Mix the grinds
together in a specimen cup.
• Sample Prep – completion Place 0.2 g + 0.05 g of sample into a 50-ml centrifuge tube Add 40 ml methanol; cap and shake Place in the Geno shaker for 5 minutes at 500 rpm Allow the sample to settle for at least one hour until solution is clear Dispense a 1-ml aliquot of the solution into a 2-ml amber glass vial Place in refrigerated storage until analysis
6
Method Overview
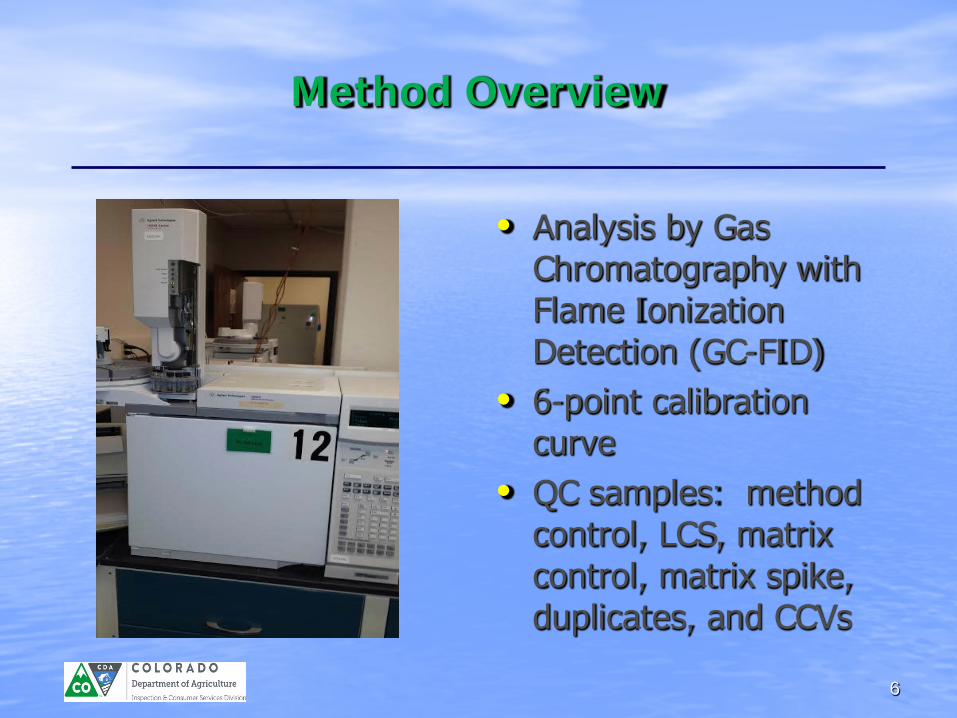
• Analysis by Gas Chromatography with Flame Ionization Detection (GC-FID)
• 6-point calibration curve
• QC samples: method control, LCS, matrix control, matrix spike, duplicates, and CCVs
7
Method Overview• Results reported as % THC concentration, on a dry
weight basis
• Data subjected to peer review, QA review and management review prior to reporting
8
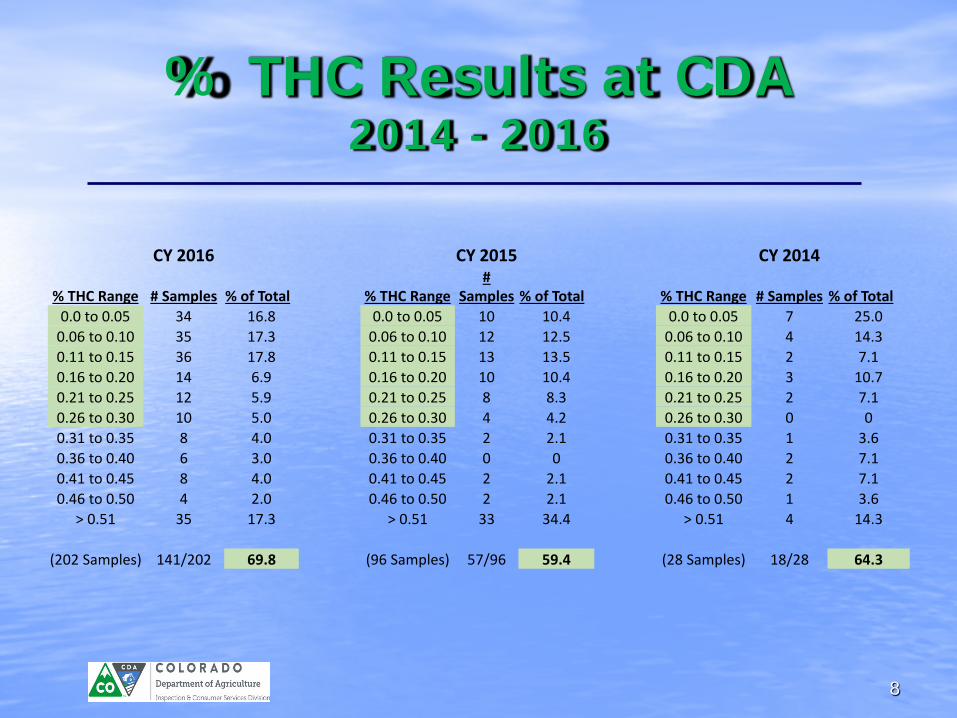
% THC Results at CDA2014 - 2016
CY 2016 CY 2015 CY 2014
% THC Range # Samples % of Total % THC Range#
Samples % of Total % THC Range # Samples % of Total0.0 to 0.05 34 16.8 0.0 to 0.05 10 10.4 0.0 to 0.05 7 25.0
0.06 to 0.10 35 17.3 0.06 to 0.10 12 12.5 0.06 to 0.10 4 14.30.11 to 0.15 36 17.8 0.11 to 0.15 13 13.5 0.11 to 0.15 2 7.10.16 to 0.20 14 6.9 0.16 to 0.20 10 10.4 0.16 to 0.20 3 10.70.21 to 0.25 12 5.9 0.21 to 0.25 8 8.3 0.21 to 0.25 2 7.10.26 to 0.30 10 5.0 0.26 to 0.30 4 4.2 0.26 to 0.30 0 00.31 to 0.35 8 4.0 0.31 to 0.35 2 2.1 0.31 to 0.35 1 3.60.36 to 0.40 6 3.0 0.36 to 0.40 0 0 0.36 to 0.40 2 7.10.41 to 0.45 8 4.0 0.41 to 0.45 2 2.1 0.41 to 0.45 2 7.10.46 to 0.50 4 2.0 0.46 to 0.50 2 2.1 0.46 to 0.50 1 3.6
> 0.51 35 17.3 > 0.51 33 34.4 > 0.51 4 14.3
(202 Samples) 141/202 69.8 (96 Samples) 57/96 59.4 (28 Samples) 18/28 64.3
9
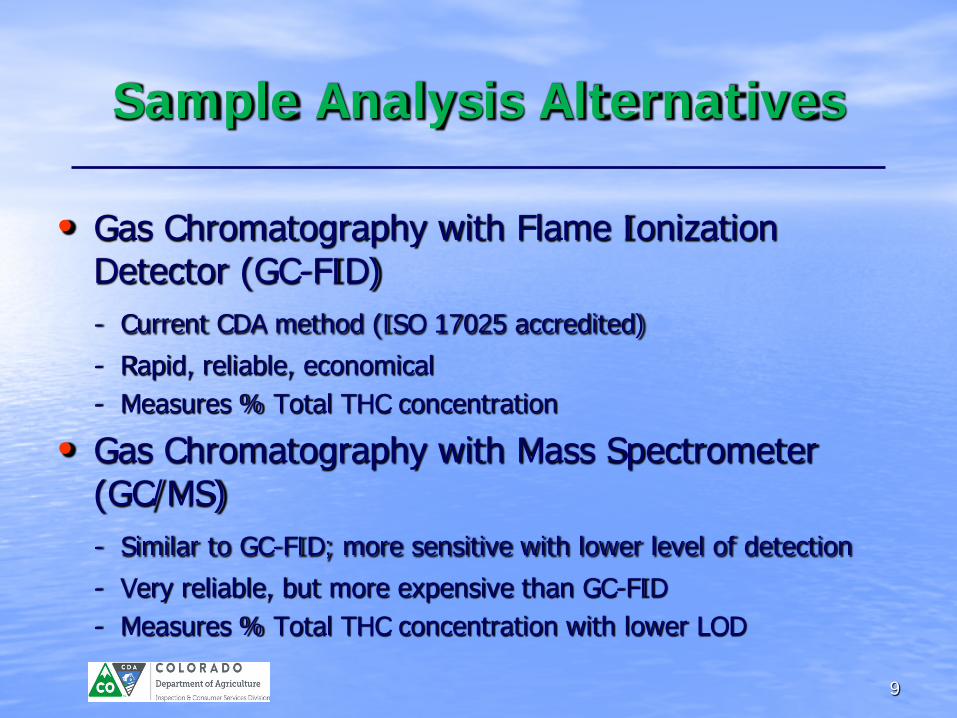
Sample Analysis Alternatives
• Gas Chromatography with Flame Ionization Detector (GC-FID)- Current CDA method (ISO 17025 accredited)
- Rapid, reliable, economical- Measures % Total THC concentration
• Gas Chromatography with Mass Spectrometer (GC/MS)- Similar to GC-FID; more sensitive with lower level of detection
- Very reliable, but more expensive than GC-FID- Measures % Total THC concentration with lower LOD
10
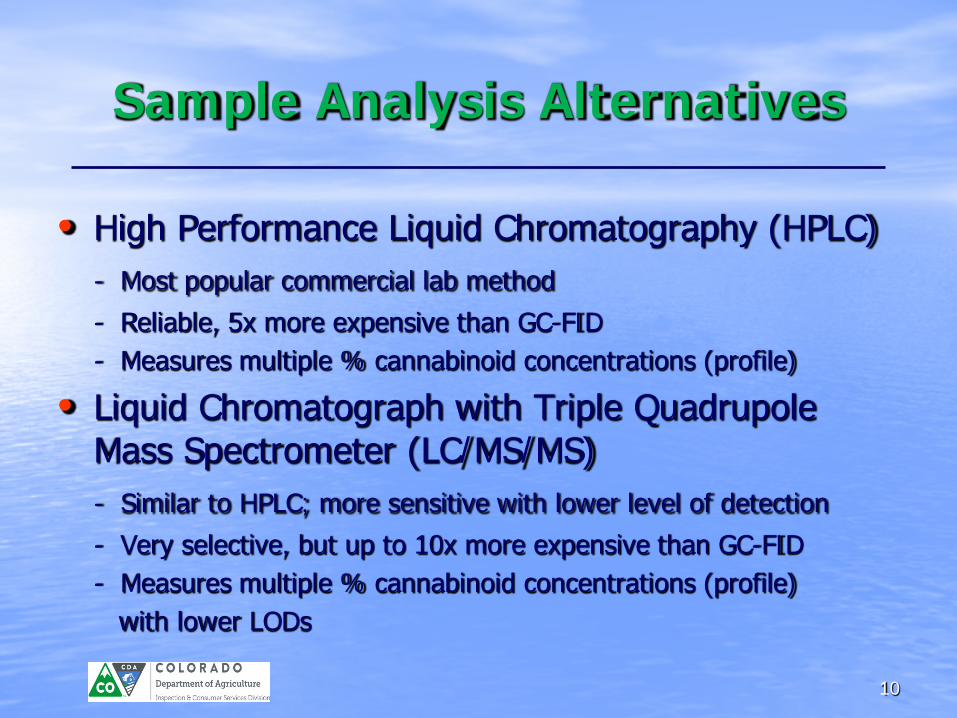
Sample Analysis Alternatives
• High Performance Liquid Chromatography (HPLC)- Most popular commercial lab method
- Reliable, 5x more expensive than GC-FID- Measures multiple % cannabinoid concentrations (profile)
• Liquid Chromatograph with Triple Quadrupole Mass Spectrometer (LC/MS/MS)- Similar to HPLC; more sensitive with lower level of detection
- Very selective, but up to 10x more expensive than GC-FID- Measures multiple % cannabinoid concentrations (profile)
with lower LODs
11
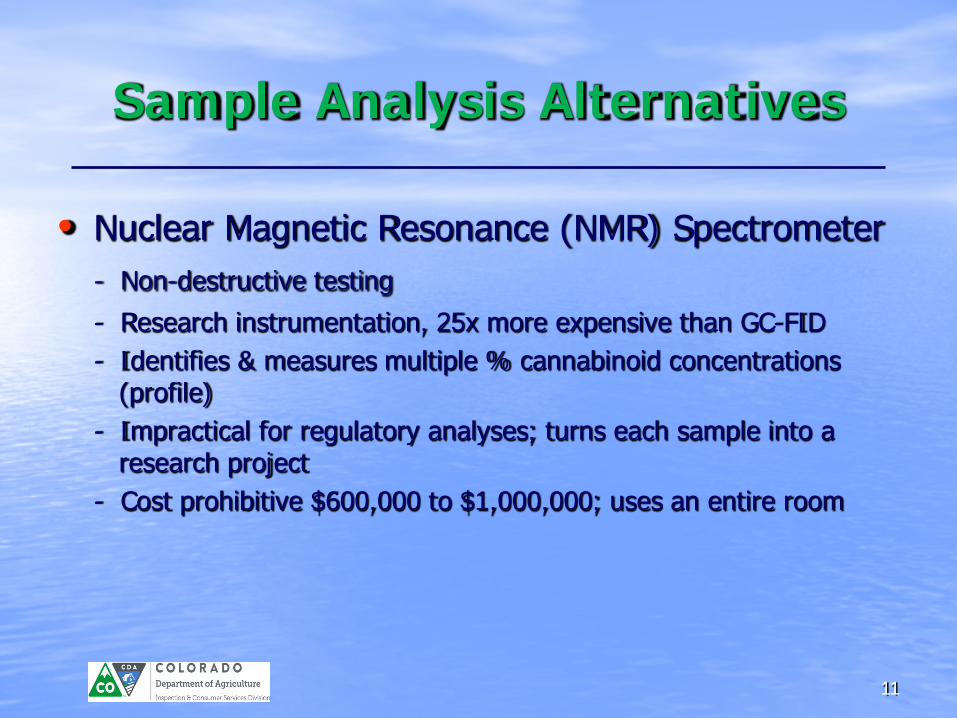
Sample Analysis Alternatives
• Nuclear Magnetic Resonance (NMR) Spectrometer- Non-destructive testing
- Research instrumentation, 25x more expensive than GC-FID- Identifies & measures multiple % cannabinoid concentrations
(profile)- Impractical for regulatory analyses; turns each sample into a
research project - Cost prohibitive $600,000 to $1,000,000; uses an entire room
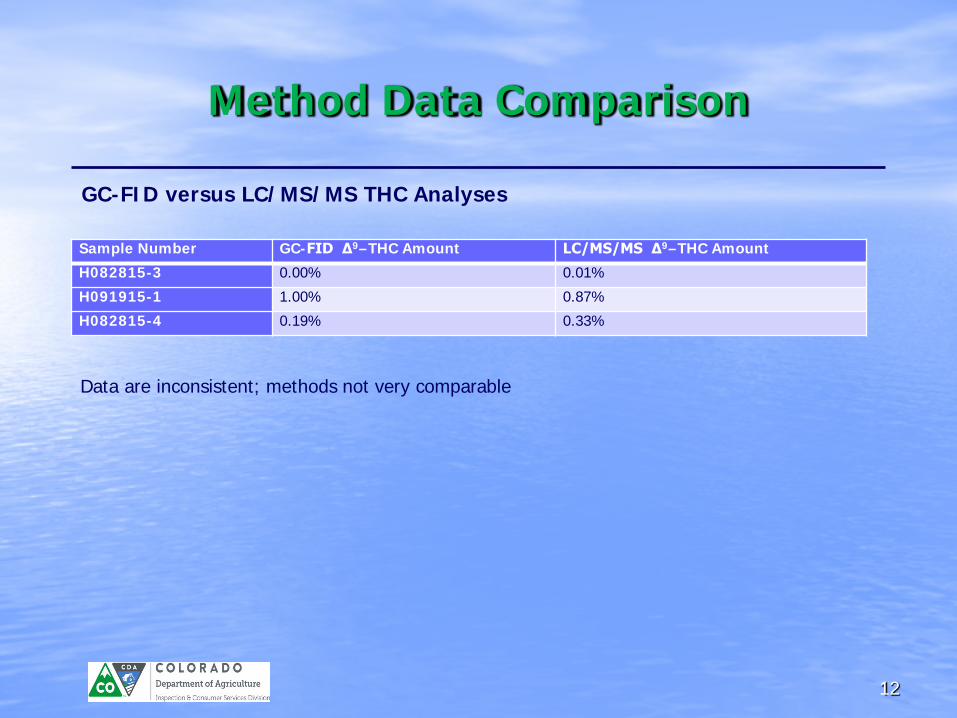
Sample Number GC-FID Δ9–THC Amount LC/MS/MS Δ9–THC Amount
H082815-3 0.00% 0.01%
H091915-1 1.00% 0.87%
H082815-4 0.19% 0.33%
12
Data are inconsistent; methods not very comparable
Method Data Comparison
GC-FID versus LC/MS/MS THC Analyses
13
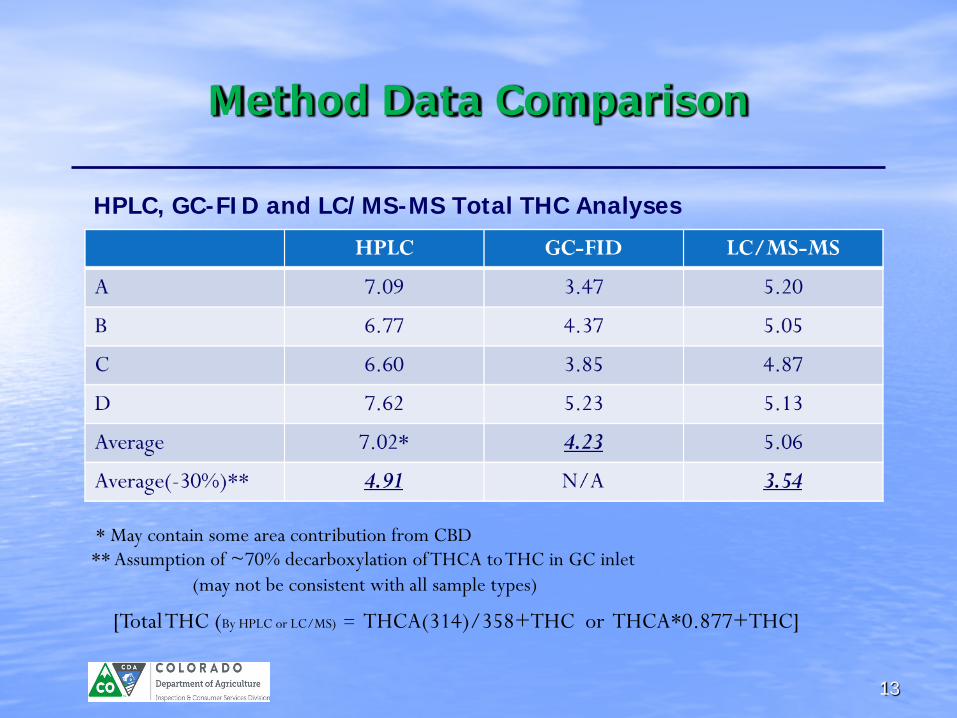
HPLC, GC-FID and LC/MS-MS Total THC Analyses
Method Data Comparison
** Assumption of ~70% decarboxylation of THCA to THC in GC inlet(may not be consistent with all sample types)
[Total THC (By HPLC or LC/MS) = THCA(314)/358+THC or THCA*0.877+THC]
* May contain some area contribution from CBD
14
Summary
QUESTIONS ?