Embed Size (px)
Citation preview

CSIRO MARINE LABORATORIESReport 242
CONSIDERATIONS FORAN UNDERWAYBIOGEOCHEMISTRYOBSERVING SYSTEM
Edward C. V. Butler (Ed.)
January2005

CSIRO MARINE LABORATORIESReport 242
CONSIDERATIONS FORAN UNDERWAYBIOGEOCHEMISTRYOBSERVING SYSTEM
Edward C. V. Butler (Ed.)
January2005
A report for the CSIRO Wealth from OceansFlagship

Considerations for an underway biogeochemistry observingsystem : a report for the CSIRO Wealth from Oceans Flagship.
Bibliography.ISBN 1 876996 90 0.
1. Oceanography - Observations. 2. Biogeochemistry - Australasia.
I. Butler, Edward, 1954- . II. CSIRO. Marine Laboratories. III. Wealth from Oceans Flagship. (Series : Report (CSIRO. Marine Laboratories) ; 242).
551.46
A task of Wealth from Oceans Project 1.2.1: compiled and authored byEdward Butler after a workshop (6 May 2004) and other contributions.

Summary
This report looks at aspects of an underway biogeochemical observing system for the Australian waters: location, frequency, vessels and platforms, instrumentation and ancillary equipment. Evaluating this information, recommendations are made to support two trans-basin (Pacific Ocean) and a single, localised (Tasman Sea/Bass Strait) lines. The latter should be a high-frequency transect to capture shorter term events; a ferry would be an appropriate vessel. Instrumentation suggested to be deployed includes fluorimeters and radiometers, flow analysers for nutrients (and possibly micronutrients) and devices to measure components of the carbon dioxide system. The program of underway measurements must be effectively integrated with other observing system elements (buoys, floats, satellites, etc.).

2
Introduction
The underway biogeochemical1 observing system (UBOS) must be founded on its scientific relevance; it will also derive credibility from its contribution to environmental management of Australia’s coastal waters and regional seas. We see such a system having three scientific aspects: marine surface-water monitoring, resolution of biogeochemical processes (across regional gradients and through time) and delivery of information to biogeochemical models.
The science that underpins UBOS relates to the oceanic biological pump that influences the cycling of carbon and the other nutrient elements (including those classified as micronutrients: Fe, Zn, Co, Mn, Cu, Se, etc.). Evaluating the strength and functioning of the biological pump in different locations, at different times, under different forcing (upwelling, terrestrial inputs, seasonality, ENSO, etc.), with various primary producer and microbial communities, and changing grazing regimes is where such an observing system can contribute.
It is important that UBOS is effectively integrated into other regional observing systems. The long-term Australian XBT SOOP network (founded in 1983 by CSIRO) is especially relevant because it makes use of underway, shipboard measurements; has established a rapport with the shipping industry; and is well-respected in the oceanographic community. Others include ARGO in Australian waters, CSIRO coastal stations, coastal observing systems implemented by state agencies (e.g. NSWEPA, QEPA/DNR) and moored observational platforms in coastal waters and neighbouring seas (e.g. proposed PULSE mixed-layer mooring). The association with remote sensing is another area that must be fully developed. The underway measurements have value for “ground-truthing” of satellite data, but more can be gained by aiming for the production of composite surface-water data. Naturally, it is expected that UBOS will be fully incorporated into other CSIRO Marine Research (CMR) initiatives in marine observing systems, and that it will deliver effectively to other relevant projects in the Wealth from Oceans (WfO) Flagship.
In this report, we assess the various design elements of UBOS, and from this exercise make recommendations as to how UBOS might proceed as a WfO/CMR project.
Location
Australian and international experience indicates that programs of underway observations are either made at the larger scale—oceanic basins down to regional (in our context relating to national or Australasian waters)—or locally (tracks of tens to hundreds of kilometers). The larger-scale programs tend to look at longer-term issues, such as climate variability and change, and marine ecosystem shifts (McPhaden et al. 2001, Barton et al. 2003); the localised observations grapple with higher frequency events (seasonal and shorter time scales), such as fluctuations in boundary currents and eddy fields, timetables of microalgal blooms, and terrestrial plumes (Holley et al. 2003, Romano & Younes 2003). The temporal nature of observations will be dealt with further in the next section.
1 A broad definition of marine biogeochemistry is intended throughout, viz. “the interacting influence of physical and biological processes on the cycling of chemical elements in marine systems, and geochemical regulation of marine ecosystems”

3
We can categorise regions of interest in Australian waters for regular biogeochemical observations using the following criteria. They are:
i) areas of high biogeochemical variability or enhanced biological productivity, or their extent defines an important biogeochemical transition (e.g. a meridional transect across the subtropical convergence zone from subtropical to sub-Antarctic waters);
ii) regions that are important in the ground-truthing of remotely sensed observations, in the validation of biogeochemical models, or they encompass established transects of international oceanic research programs; and
iii) regions that are important for environmental management of the coastal zone (e.g. source waters for harmful microalgal blooms, Commonwealth or State Government marine conservation areas).
Figure 1. SeaWiFS image (6 September 2001) depicting increased chlorophyll concentration in the Subtropical Convergence Zone around southern Australia; in this case, particularly in Bass Strait, off the east coast of Tasmania and into the Tasman Sea (provided by CSIRO Marine Research, under the auspices of the SeaWiFS Project, NASA/Goddard Space Flight Center and ORBIMAGE).
The Subtropical Convergence Zone (STCZ) is a seasonally variable and biologically productive band of water off southern Australia (Fig. 1). This zonal feature that encircles the Southern Hemisphere results from the mixing of warm, nutrient-poor waters of subtropical origin with cool sub-Antarctic waters richer in nutrients. The poleward currents, and their eddies, moving down the eastern and western seaboards of Australia (East Australian [EAC] and Leeuwin Currents, respectively) contort and confuse the STCZ around the south-east and south-west of the continent. Such complexity makes these regions particularly attractive for biogeochemical monitoring. This aspect will be considered more in discussion of localised regions below.
4
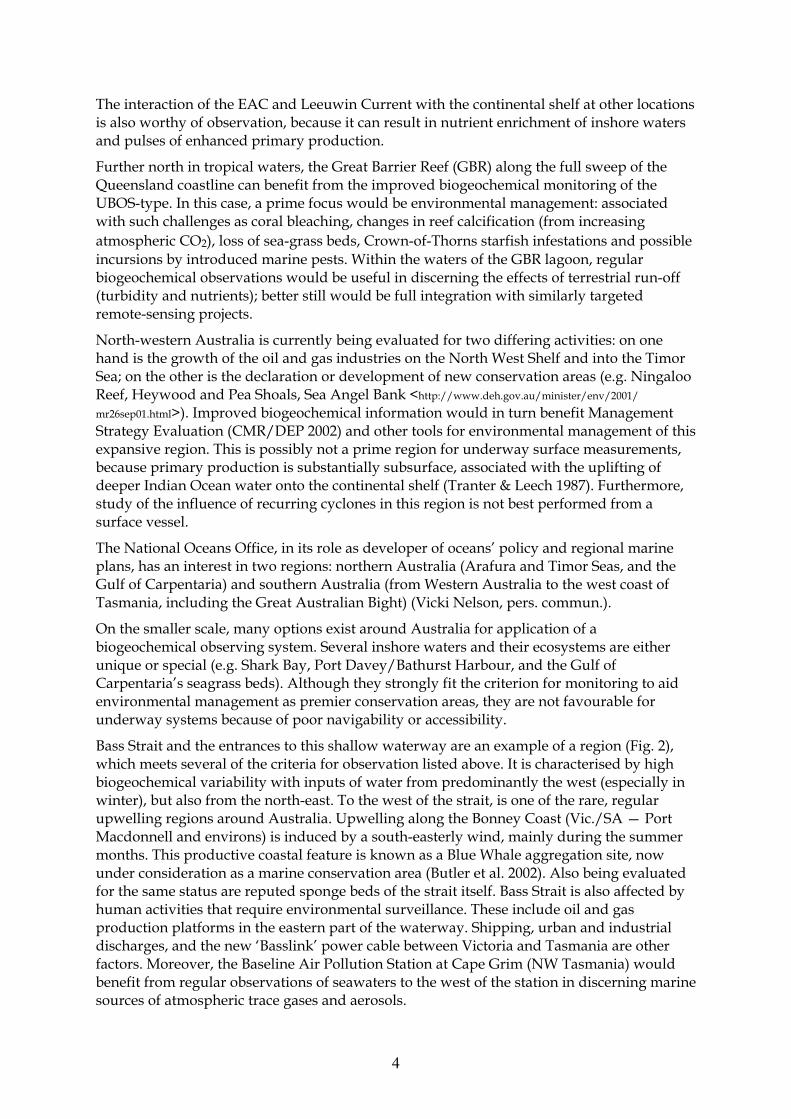
The interaction of the EAC and Leeuwin Current with the continental shelf at other locations is also worthy of observation, because it can result in nutrient enrichment of inshore waters and pulses of enhanced primary production.
Further north in tropical waters, the Great Barrier Reef (GBR) along the full sweep of the Queensland coastline can benefit from the improved biogeochemical monitoring of the UBOS-type. In this case, a prime focus would be environmental management: associated with such challenges as coral bleaching, changes in reef calcification (from increasing atmospheric CO2), loss of sea-grass beds, Crown-of-Thorns starfish infestations and possible incursions by introduced marine pests. Within the waters of the GBR lagoon, regular biogeochemical observations would be useful in discerning the effects of terrestrial run-off (turbidity and nutrients); better still would be full integration with similarly targeted remote-sensing projects.
North-western Australia is currently being evaluated for two differing activities: on one hand is the growth of the oil and gas industries on the North West Shelf and into the Timor Sea; on the other is the declaration or development of new conservation areas (e.g. Ningaloo Reef, Heywood and Pea Shoals, Sea Angel Bank <http://www.deh.gov.au/minister/env/2001/
mr26sep01.html>). Improved biogeochemical information would in turn benefit Management Strategy Evaluation (CMR/DEP 2002) and other tools for environmental management of this expansive region. This is possibly not a prime region for underway surface measurements, because primary production is substantially subsurface, associated with the uplifting of deeper Indian Ocean water onto the continental shelf (Tranter & Leech 1987). Furthermore, study of the influence of recurring cyclones in this region is not best performed from a surface vessel.
The National Oceans Office, in its role as developer of oceans’ policy and regional marine plans, has an interest in two regions: northern Australia (Arafura and Timor Seas, and the Gulf of Carpentaria) and southern Australia (from Western Australia to the west coast of Tasmania, including the Great Australian Bight) (Vicki Nelson, pers. commun.).
On the smaller scale, many options exist around Australia for application of a biogeochemical observing system. Several inshore waters and their ecosystems are either unique or special (e.g. Shark Bay, Port Davey/Bathurst Harbour, and the Gulf of Carpentaria’s seagrass beds). Although they strongly fit the criterion for monitoring to aid environmental management as premier conservation areas, they are not favourable for underway systems because of poor navigability or accessibility.
Bass Strait and the entrances to this shallow waterway are an example of a region (Fig. 2), which meets several of the criteria for observation listed above. It is characterised by high biogeochemical variability with inputs of water from predominantly the west (especially in winter), but also from the north-east. To the west of the strait, is one of the rare, regular upwelling regions around Australia. Upwelling along the Bonney Coast (Vic./SA — Port Macdonnell and environs) is induced by a south-easterly wind, mainly during the summer months. This productive coastal feature is known as a Blue Whale aggregation site, now under consideration as a marine conservation area (Butler et al. 2002). Also being evaluated for the same status are reputed sponge beds of the strait itself. Bass Strait is also affected by human activities that require environmental surveillance. These include oil and gas production platforms in the eastern part of the waterway. Shipping, urban and industrial discharges, and the new ‘Basslink’ power cable between Victoria and Tasmania are other factors. Moreover, the Baseline Air Pollution Station at Cape Grim (NW Tasmania) would benefit from regular observations of seawaters to the west of the station in discerning marine sources of atmospheric trace gases and aerosols.

5
To the east, the Tasman Sea is demarcated in its southern extent by the STCZ; to the north it is the meandering of the main stream of the EAC toward New Zealand. The result is a pronounced meridional gradient in biogeochemical properties. Climate modelling also predicts an anomalous temperature rise for surface waters of the Tasman Sea off the NSW coast .in the next few decades (A Hirst & S O’Farrell, WfO Theme 1, Stream 3). Underway monitoring can be a useful adjunct to remote sensing of SST in evaluating this prediction; resulting shifts in biogeochemical properties might then also be observed.
Figure 2. Regions and localities around Australia considered for underway biogeochemical monitoring using Ships of Opportunity.
Other localities that could benefit from UBOS include the south-west of Western Australia—for much the same reason as the Tasman Sea—with the strong gradient in properties through the Leeuwin Current into colder oceanic waters. Mesoscale eddies spawned in this region are also proving fruitful for biogeochemical studies (Waite 2004). Two marine conservation conservation areas (albeit deeper features) are also under consideration for this region: Naturaliste Plateau and Swan Canyon.
Another smaller-scale system for study could be the South Australian gulfs; they have been characterised as “inverse estuaries” (Petrusevics 1993). Their interaction with neighbouring coastal waters might be resolved with repeated, high-density biogeochemical observations.
Frequency
The frequency of measurements in UBOS will be influenced by the key biogeochemical processes under examination. There are two aspects to this question. The first applies to the frequency of measurement aboard the vessel during a transit. This is readily answered: the higher the sampling rate, the better will be the horizontal resolution. The goal of all

6
underway instruments should be continuous operation, with as short a cycle time as possible for staged measurement techniques (e.g. chemical analyses involving a series of steps). The only impediment here might be data handling and storage.
The other aspect of timing is the repeat rate of vessel transits. The objective here is to prevent aliasing of results (viz. measurement frequency is insufficient to resolve higher natural frequency of key events) or crucial data gaps (e.g. missed maxima or minima). The CSIRO XBT network, looking at interannual changes in basin-scale oceanography, chose to have repeat transits for merchant ships involved in Volunteer Observing Ship program of two weeks for high frequency lines. This repeat rate was arrived at to resolve intra-seasonal events with a period of 30–60 days. Newer international protocols suggested by the Ships of Opportunity Program Implementation Panel (SOOPIP – <http://www.ifremer.fr/ird/soopip/>) indicate that “frequently repeated” lines (FRX) should ideally be occupied 18 times per year (about every three weeks).
If instead the requirement is to monitor the sequence of phytoplankton blooms in coastal waters, to discern the effect of the passage of atmospheric cold fronts on biogeochemical properties in shallow shelf seas, or to track a spectrum of coastal hydrodynamical events (e.g. spring-neap tidal cycle, coastal trapped waves) the critical period decreases to about 4–20 days. The repeat rate to satisfactorily resolve such events comes down to near daily. Under such circumstances, the choice of observational vessel becomes limited, and the observational area becomes limited; since with the limited speed range for most ships, the frequency of transit is inversely related to length of track (or area of observation).
If frequent and sustained observations are required in a specific location, underway monitoring must be closely teamed with moored instrumentation and remotely sensed (satellite) data. This ensures that ephemeral events, such as terrestrial inputs (e.g. flood discharge, wind-blown dust), transient upwelling or a sequence of microalgal blooms, are fully captured.
Vessels and Platforms
The choice of vessel is to some extent determined by the two preceding issues: location and frequency. Longer trans-basin transects are well-suited to larger cargo vessels plying established fixed routes. Container vessels are preferred because of their usually rapid turn-around in ports, and because of their non-contaminating operation (in contrast with bulk carriers). The Australian XBT SOOP network, the former COOE project (<http://www.per.
marine.csiro.au/cooe/index.html>) and several international SOOP programs have focussed mainly on container ships (<http://uop.whoi.edu/vos/ships/ships.htm> and <http://www.bsh.de/de/Meeresdaten/
Beobachtungen/Klima/bsh_soop_status.pdf>). Disadvantages of these vessels are that they can be switched routes without warning, and that all observational work must be done with the ship maintaining its course and speed (often now in excess of 20 knots).
Another option for high-latitude monitoring is resupply vessels servicing polar bases. Examples in our region are vessels running between Hobart and the Australian and French Antarctic bases. In particular, the Hobart–Dumont D’Urville route is already being well utilised for SOOP monitoring (XBT, underway CO2 and other discrete biogeochemical measurements: nutrients, chlorophyll pigments, photosynthetic parameters and microalgal species) with 3–5 return transits between October and March each year. Research vessels can also be scheduled to re-occupy specific transects for national or international programs. The repeat interval is usually too long to offer any value as part of a biogeochemical observation system. Nevertheless, much benefit can be gained from teaming underway surface measurements with vertical (CTD) profiles obtained during hydrographic sections. Research

7
vessels are also ideal platforms for developing and carrying out trials for underway instrumentation.
For higher frequency monitoring of local water bodies, the options are almost restricted to ferries or service vessels running short, fixed routes (e.g. rig tenders, or those of Customs or Port Authorities). Here again, any observations must be done without disrupting the ships’ regular operations.
Alternative vessels for UBOS include: fishing boats, cruise liners, and navy ships (including those of the Hydrographic Office). None of these run regular routes, but there is more flexibility in operations of the first two if chartered, and the RAN can include oceanographic observational tasks if scheduled within their hydrographic survey program. Fishing vessels have been used successfully by CMR in ground-truth calibration of satellite observations off the east coast of Australia (McKenzie et al. 1998). Although fishing vessels do not follow fixed tracks, they do often work within confined zones (Fig. 3). Some cruise liners have recently taken on limited monitoring activities as a community service. (e.g. Marris 2004, <http://www.rsmas.miami.edu/rccl/>), but it is too soon to assess the advantages and disadvantages of this approach, and its applicability to the Australasian region.
Figure 3. Example of the track of a single trawler operating out of the port of Wickham, WA, during one month (courtesy of Northwest Shelf Joint Environmental Management Study, CSIRO and Government of Western Australia).
It might at first seem a paradox to suggest fixed structures for UBOS platforms, but since the oceans are dynamic media, a fixed monitoring location (especially one within a regular current field) can in effect sample a neighbouring region. Moreover, it obtains a more complete temporal set of observations, because it does not have port periods, and is not so influenced by wave motion. The instruments and sampling equipment used on a ship are readily transferable to larger off-shore structures. Obvious platforms around Australia are production rigs of the oil and gas industry (Tokar et al. 2000). They are located in Bass Strait (Fig. 4, inset) and on the North West Shelf. Surface and shallow sub-surface intakes could be oriented or switched to sample clean seawater upstream of the structure. Larger navigation buoys in coastal waters might also have some potential for biogeochemical monitoring, with instruments secured internally. These platforms have several advantages: availability of high-voltage power, procedures for servicing and established communications.

8
Figure 4. Shipping routes, traffic and petroleum infrastructure in waters of South East Australia (courtesy of National Oceans Office).
Instruments and Ancillary Equipment
A primary set of measurements stand out for any biogeochemical observing system. They include:
Fluorescence/pigments/bio-optics Nutrients (N, P, Si) Dissolved oxygen CO2 and related parameters Plankton (cell counts, etc.) Micronutrients/trace elements
Plankton and fluorescence/pigments/bio-optics relate to the primary producers, their biomass and light environment. The other measurements are in effect planktonic metabolic substrates or cofactors. It is assumed that any observing systems measuring some or all of the above set of parameters will by default also include temperature and salinity. They may also include other measurements specific to particular goals (e.g. other radiatively important gases (CH4, DMS, halocarbons, etc.), if the link between phytoplankton and climate is being studied (Belviso et al. 2000); or turbidimetry/ transmissometry, if particles in coastal waters is the subject).
Each of the primary-measurement set listed above will now be considered individually. This detail will briefly consider the instrumentation needs, any associated equipment requirements, and operational aspects and challenges. For example, fluorescence and

9
macronutrient measurements have been performed satisfactorily at sea using a standard ship’s intake of seawater (either directly or after reticulation). The other measurements of dissolved gases, trace elements or plankton require careful consideration of sampling systems to avoid entrained bubbles, analyte contamination, or other interference.
Fluorimetry is well established as an underway measurement aboard ships and smaller vessels (e.g. Mackey et al. 1989, Pinto et al. 2001)—both research and commercial (VOS); recent examples in CMR include the COOE (<http://www.per.marine.csiro.au/cooe/index.html> and Huon Estuary Studies (CSIRO 2000). The instruments and the means to operate them in an underway mode to determine chlorophyll are readily available (<http://aol.wff.nasa.gov/html/
slf.html>, <http://www.turnerdesigns.com/t2/doc/appnotes/998_5123.html>,). Apart from the need to de-bubble the ship’s intake water and prevent biofouling of the fluid path, the only other interference arises from coloured dissolved organic matter (CDOM) whose fluorescence overlaps that of chlorophyll. CDOM usually derives from terrestrial run-off, and consequently, is confined to inshore waters; it can also be determined fluorimetrically. Shipboard calibration of chlorophyll fluorescence is effected by solutions of chlorophyll a standard, or other standard fluorophores (e.g. rhodamine B) that are related back to precise laboratory determination of chlorophyll fluorescence. Combining fluorimetry with other underway measurements of bio-optical and biogeochemical sensors, Claustre et al. (2000) have separated the surface CDOM signal from that of chlorophyll fluorescence; moreover, its is possible with more sophisticated data processing to discern phytoplankton classes (e.g. diatoms from dinoflagellates). However, as yet underway determination of individual phytoplankton pigments, or a suite of them, remains as an experimental exercise. Shipboard laser fluorimetry (LIDAR) shows promise in this area (Fadeev et al. 1991, Chekalyuk et al. 2004). Another potential method to gain estimates for phytoplankton community composition uses inversion of optical spectral data (Schofield et al. 2004), but as yet this method is not fully adapted to underway monitoring, still requiring some vertical-profile observations.
Although in-situ chlorophyll fluorescence is related to phytoplankton biomass, this does not routinely equate to primary production. The latter data might be better evaluated by spectral analysis using a radiometer (e.g. Wetlabs AC9 light absorption and attenuation meter) to measure water transparency weighted for “biological effectiveness”, coupled with a reference solar irradiance spectrum at the surface, to determine water-column photosynthesis (Lehmann et al. 2004). Instrumentation for this dual approach—fluorimetry and radiometry—to underway monitoring has been described recently (<http://www.mbari.org/
bog/documents/underway_methods.htm>). Fast repetition-rate fluorimetry (FRRF) is another technique in this vein; it is suggested to give insight into the photosynthetic “competency” of phytoplankton (Chase et al. 2002, Vaillancourt et al. 2002)
The flow analysis methods developed for the determination of nutrients in marine waters (Grasshoff et al. 1999) are readily adapted to underway monitoring of the same analytes in a ship’s intake water (Sakamoto et al. 1998, Woodward & Rees 2001, Lyddy-Meaney et al. 2002; Fig. 5). New challenges for these systems are: (i) to increase the level of automation, (ii) to optimise nutrients measurements so that the analytical cycle is as brief as possible to improve the resolution of the surface mapping, (iii) to make the instrument package as small and robust as possible to improve its portability, and (iv) to extend the duration of unattended operation from days and weeks to months. Emphasising the need for automation, robustness and longer observational periods, published results of underway determination of nutrients appear limited to devices on research or agency vessels, where they are frequently inspected and maintained.

10
W
S
PC
PP
V1V2 V3
R1 R2 FCPG
W
V0
WW
PP
Std
TFF FSMC
W
S
PC
PP
V1V2 V3
R1 R2 FCPG
W
V0
WW
PP
Std
TFF FSMC
Figure 5. Schematic of a compact flow analyser (depicted within the box with the dashed line, see Lyddy-Meaney et al. 2002 for details) used to make underway measurements of filterable reactive phosphorus. S, sample inlet; PP, peristaltic pump; TFF, 0.2 µm tangential flow filter; FS, differential flow splitter; PG, propellant gas and regulator; MC, mixing coil; FC, flow cell; V0, 2-way valve; V1, V2 and V3, miniature solenoid valves; R1, ammonium molybdate reagent; R2, tin (II) chloride reagent; Std, standard; W, waste; —— 0.5-mm id PTFE tubing for liquid flow; ------ 0.5-mm id PTFE tubing for gas delivery; ····· components under computer control.
Calibration and quality control is effected by nutrient standard solutions and certified reference materials. Interference in nutrients’ measurement—particularly for ammonia (Watson et al., in press)—can be derived from the intake line, or from the shipboard environment in which the instrument is located. Generally, it is suitable to make the analyses with unfiltered samples, although monitoring in estuaries or coastal waters can require this pretreatment step.
Dissolved oxygen (DO) in surface waters is expected to be close to saturation, but minor departures—positive or negative—can be informative in regard to near-surface biological activity. Underway measurement of DO by sea-going vessels seems to be unreported in published scientific literature from the last two decades. The difficulties arising from the conventional titrimetric laboratory methods or the electrochemical DO probe with membrane when used in this manner might be a reason: both techniques are hampered by slow rates of measurement. Furthermore, the DO sensor has been shown in recent comparative studies to have an offset error under some circumstances (Dragos & Hunt 2003). Alternative sensor technologies are either recently released or in their developmental stages (e.g. <http://www.osl.dcu.ie/projects/MISPEC/>. Most are based on the DO quenching of fluorescence or luminescence (e.g. Aanderaa unit—<http://www.aanderaa.no/docs/
Sensors_&_Systems_19.pdf>) (Holst et al. 2000). This technique and the membraneless micro-electrode described by Atkinson et al. (1995) would appear to have promise for measuring DO in flow-streams from ship’s intake or towed bodies. In setting up such a system, other than the obvious de-bubbler, it would be necessary to ensure that the intake was sufficiently beneath the sea surface to prevent injection of microbubbles in stormy seas. The possibility of other artefacts should also receive careful attention (e.g. the avoidance of any metals in the fluid path that might interfere in the analysis, disturbances to electrode operation, etc.). DO analysers are typically calibrated in the field with a two-point calibration (0% and 100%

11
saturation); for better accuracy and precision, they can also be calibrated intermittently in the laboratory for intermediate DO concentrations.
Unlike DO, carbon dioxide and related dissolved inorganic carbon variables are strongly represented globally in underway monitoring programs (Dandonneau 1995, Cooper et al. 1998, Stoll et al. 2001, Bellerby et al. 2002). Standardised methods for the partial pressure (or strictly, fugacity) of carbon dioxide (pCO2), total CO2 (TCO2) and total alkalinity (TA) have evolved from early work (<http://usjgofs.whoi.edu/PI-NOTES/southern/Millero-TCO2.html>). Carbonate species contribute the bulk of alkalinity of seawater; the carbonic acid/carbonate buffer system is also influential in determining the pH of seawater, so the measurement of pH is often included as a parameter in the CO2 measurement set. Moreover, measurement of any two of the set fully defines the CO2 system, allowing the other two parameters to be calculated.
An equilibration chamber is the basis for pCO2 determination. The intake seawater stream is sprayed by a showerhead into the chamber. After a set equilibration time, the headspace gas is passed to a CO2 gas analyser (typically a LI-COR infra-red gas analyser). TCO2 is determined coulometrically in a seawater sample acidified with phosphoric acid. The instrument that is routinely used for this analysis is the SOMMA (Single-Operator Multiparameter Metabolic Analyzer); it is a semi-automated system. TA is determined using an autotitrator, with hydrochloric acid as the titrant and a pH electrode as the end-point (carbonic acid) detector. The titration is carried out in a temperature-controlled environment (25 C). The pH in seawater is determined by a spectrophotometric procedure with either of the indicators m-cresol purple or phenol red as the chromophore (Clayton & Byrne 1993, Bellerby et al. 2002). Certified reference seawaters are available for the TCO2 and TA determinations. Published methods are also available outlining the preparation of seawater pH buffers.
Underway monitoring of the carbon dioxide system is one of the more advanced of the primary set of biogeochemical measurements. Not only have the studies been done for many years, but automated systems have also been successfully implemented for unattended operation on commercial vessels (Cooper et al. 1998). CMR and the Antarctic CRC have made many measurements of the CO2 system (pCO2, TCO2and TA) in Southern Ocean waters over the last decade (e.g. McNeil et al. 2001). Underway measurements are now being made during regular transits of the French Antarctic resupply vessel l’Astrolabe between Hobart and the Dumont D’Urville base in Antarctica (Fig. 6). The recently developed ‘Lo-Flo’ atmospheric CO2 analyser, when coupled with surface-water measurements aboard ship (and meteorological data), shows potential to determine localised sea-air fluxes of CO2.
For plankton, the continuous plankton recorder (CPR) has been the device of note. It has generated the longest record of any surface-water biogeochemical measurement, dating from the pioneering work of Sir Alister Hardy in the early part of last century (Reid et al. 2003). Regular CPR surveys began in 1931, and except for a break of some seven years around the Second World War, have operated continuously since. From its very early stages, CPR surveys relied on volunteer merchant ships—a forerunner of the more regularised SOOP activities of the present day. The focus of activity has been the regional seas of Europe and the North Atlantic Ocean, but early experimental work was done in the Southern Ocean in the late 1920s. The Southern Ocean is now receiving interest again as one of the “daughter” CPR survey regions, a program initiated by the Australian Antarctic Division (Hosie et al. 2003).

12
The CPR operates as a towed body of rectangular cross-section; an opening in the tapered nose passes seawater over a filtering mesh of silk (mesh size ~270 µm) (Batten et al. 2003). It is designed to sample at a depth of about 10 m at the normal operating speed of the towing vessel (15–20 knots nowadays). Inside the CPR, a small propeller-driven mechanism feeds the filter mesh from a dispensing spool through the seawater stream to a storage spool submerged in a tank of preservative (formaldehyde). The filter mesh advances at a standard rate of four inches length per ten nautical miles sampled (i.e. 10.16 cm per 18.5 km). On completion of the survey, the preserved spool of filter mesh is returned to a shore-based laboratory for expert analysis by microscopy. Three separate microscopic examinations are carried out to quantify phytoplankton, and small and large zooplankton. A semi-quantitative estimate of the colour of the filter mesh (Phytoplankton Colour Index) for each stage is also made.
A disadvantage of the CPR is the often considerable interval between sampling and analysis; it is not a real-time monitoring system. Moreover, the analysis is very labour-intensive. Efforts to improve this aspect of plankton monitoring have spawned the ‘Optical Plankton Recorder’ and the ‘Video Plankton Recorder’ (for zooplankton and other microfauna in the size range 200 µm and 2 cm <http://www.focaltech.ns.ca/product-opc.html> <http://www.whoi.edu/institutes/
oli/facilities/rel_technology.htm>). However, these instruments are not proven to the extent that they are operable upon other than dedicated research vessels, nor do they apply to much of the phytoplankton size spectrum. Even further in the future is the possibility of using molecular techniques (e.g. DNA / RNA typing) to identify and quantify plankton, but this will depend upon the evolution of suitable rapid laboratory techniques that can be automated for use at sea.
With the relevance of micronutrients (trace metals, vitamins, etc.) to oceanic primary production demonstrated during the last decade (Whitfield 2001, Morel & Price 2003), their routine mapping assumes a higher priority. Fortunately, many of the instruments and apparatus associated with flow analysis of marine waters for the macronutrients can be readily adapted for micronutrients. The combination of flow analysis with spectrophotometry, fluorimetry, voltammetry, potentiometry and chemiluminescence techniques provides for compact, portable instruments (Worsfold et al. 2000). Further research is required into translating established laboratory methods to shipboard use, and more effort must be devoted to improving the analytical sensitivity of trace element detectors. Even so, published methods for shipboard determination of Fe, Mn, Co, etc. (De Jong et al. 2000, Worsfold et al. 2000; Chase et al. 2002; Bowie et al. 2003; Doi et al. 2004) are already available.
Certified reference marine waters are available for trace metals and some other elements for calibration of measurement techniques; these need to be coupled with quality control and tracking procedures (Howard & Statham 1993). A difficulty with analytical methods for trace elements, especially trace metals, is the likelihood of contamination in all steps from the collection of the sample through pretreatments to measurement. Rather than using standard ship’s intake systems, the use of inert piping and fittings (e.g. of PTFE plastic) is obligatory. Non-contaminating intakes and plumbing, as well as towed bodies and pumping systems, have been described for shipboard sampling for trace analyses of surface seawaters (Schussler & Kremling 1993, Zika et al. 1993, Vink et al. 2000, <http://www.mbari.org/expeditions/
SOFeX2002/gear.htm>). Another option would be to place small, automated analysers inside towed bodies.

13
Recommendations
Trans-basin lines across the Pacific Ocean to Australasia (Fig. 6) are already operated, or planned, by the USA and Japan, respectively. The Columbus Waikato has been instrumented by NOAA; its monitoring across the Tasman Sea can be assured by a contribution of logistic support from Australia. The Fuji Trans World is a car carrier currently under construction that has included an underway laboratory in its design. Again, Australia can join the underway monitoring program planned to start in 2006, if it is prepared to make a contribution of support. These are excellent opportunities for Australia to benefit from trans-basin biogeochemical data from surface waters, making just a small fraction of the outlay required to set up the SOOP vessels.
Figure 6. Recommended Ship-of-Opportunity program to implement the Underway Biogeochemical Observing System at the basin level.
In assessing locations around Australia for more focussed monitoring, the combination of Tasman Sea and Bass Strait stand out for several reasons. The region is replete with oceanographic and bathymetric features that can provide valuable information about biogeochemical processes (Bonney Upwelling, EAC eddies, ‘Bass Strait Cascade’, seamount features and the seasonal excursion of the STCZ). Extensive use of this region by shipping, fishing and aquaculture ventures, marine resources industries (oil and gas industry, ‘Basslink’) and tourism mean that there are many potential users of data gathered by underway monitoring. Additional requirements are expected from environmental regulators

14
as they consider important marine conservation areas, such as the Blue Whale aggregation area around the Bonney Upwelling and the Bass Strait sponge beds. Finally, interest within WfO, and climate modellers more broadly, arise from the anomalies predicted in the Tasman Sea in scenarios of various coupled atmosphere-ocean models.
An opportunity to carry out a high-frequency, more localised study is provided by shipping between Sydney and ports in Bass Strait (see Fig. 4), such as the TT Line ‘Spirit of Tasmania III’ ferry between Sydney and Devonport. The ferry’s route would likely overlap that of the less frequent, trans-basin SOOP vessels (mentioned above) off the east coast, from Sydney to Gabo Island. Such an overlap is beneficial in resolving the effects of different temporal scales in the surface waters, and in providing intercomparison of underway instruments.
A third, more experimental element could also be considered for a Tasman Sea/Bass Strait network. This is the instrumentation of one of the oil/gas production platforms in the strait. Seemingly, an untested approach in Australia, it would require negotiations with the industry to outline the set-up and operational requirements, and spell out the benefits of routine monitoring.
Existing SOOP vessels, such as those involved in the Australian XBT SOOP network also provide a valuable platform for augmenting with biogeochemical observations. The French resupply ship l’Astrolabe (transiting XBT high-density line PX-28), as acknowledged above, already carries CMR biogeochemical instruments. These observations need continued support, because they usefully extend proposed meridional observations down the east coast of Australia (especially if the Fuji Trans World is supported). Furthermore, since the ship operates out of Hobart, it is an ideal test-bed for development and testing of new instruments (e.g. flow analysis instruments for macro- and micronutrients).
Other locations around Australia discussed above had one or more features that recommended them for underway biogeochemical observations, but not currently as strong as the case for Tasman Sea/Bass Strait. If possible, secondary support ought to be considered for other short ferry routes supporting ground-truthing of remotely sensed SST. The ferries are operating from Fremantle to Rottnest Island (WA) and from Townsville to the Great Barrier Reef (Queensland). Each currently carries just a radiometer (for surface ‘skin’ temperature measurement). The first is of quite some interest, because it traverses the Leeuwin Current.
In evaluating underway instruments, two aspects are considered here: the first involves recommended instruments for deployment on SOOP vessels; the second concerns instruments or sensors favoured for enhancement or development. CMR has the capabilities to support deployment of instruments measuring fluorescence/pigments, macronutrients, dissolved oxygen, CO2 parameters and micronutrients/trace elements. Plankton measurements associated with the CPR should be left to the expert group at AAD.
Instruments routinely installed on SOOP vessels, as part of UBOS, could include fluorimeters/radiometers, nutrient analysers, and equipment for determining CO2 parameters. In most cases, these would be existing commercial instruments, with some devices constructed in-house. There is much scope for nutrient analysers to be improved for underway monitoring. We suggest that this be done through collaboration with other expert groups in Australia, and by learning of new commercial instruments of relevance in the international marketplace. Other sensors can be also be enhanced in sophistication—for example, the superseding of the standard fluorimeter by a LIDAR fluorimeter
Suitable underway instruments for dissolved oxygen are yet to be identified. Traditional DO electrodes appear unsuitable for the task. Overseas results involving the use of the new

15
generation of oxygen sensors demand careful scrutiny, before any recommendations are made concerning their application. There is also the question of suitable sampling systems; this aspect will be dealt with under equipment for micronutrients/trace elements.
The determination of micronutrients/trace elements requires improvements on two fronts for UBOS. First is the choice of suitable sampling systems that will not contaminate the sample stream: it comes down to inert intake systems and conduits on the ship itself; or towed bodies that either feed surface waters to the shipboard instrument along clean lines, or house instruments that make the measurements directly. Second is the development or modification of analytical methods for trace elements so that portable instruments with highly sensitive detection techniques ensue. These tasks are to be taken up in other aspects of the current WfO project.
Finally, it remains to re-assert the importance of UBOS being integrated with other observing systems. In WfO, these are remote sensing and ARGO float programs. We should also heed any prospects of a national observing system for Australia, and monitor developments with other observational approaches, such as drifters, gliders and other autonomous devices.
Collaboration and External Support
It is very unlikely that a single agency would support the development of UBOS as envisaged here; a consortium of sponsors will be needed. The longer term, basin-scale research considers matters such as climate change and perturbation of marine ecosystems. These topics are in the sphere of federal government. Possible funding agencies include Environment Australia, Australian Greenhouse Office, and FRDC, if the perspective of marine ecosystems is emphasised appropriately. The l’Astrolabe section has already gained in-kind support from the ACE CRC and the Australian Antarctic Division. Other ministries of federal government could be induced to provide support, if they see the monitoring lines as contributing to international commitments or responsibilities for Australia. One very recent success is that the Australian Greenhouse Office has agreed to provide partial funding for the implementation of Columbus Waikato and Fuji Trans World lines.
The more localised transects of coastal waters might gain part-funding from the relevant state governments, but this will need to be supplemented by contributions from industry and other agencies. In the Tasman Sea/Bass Strait region, we could look to the State Governments of NSW, Victoria and Tasmania, oil and gas industry, Australian Maritime Safety Authority (AMSA), fishing and aquaculture industries, TT lines (tourism aspect), other marine institutions (instrument support and development), and shipping companies (in-kind support).
The alternative location of coastal waters around the south-west of Western Australia would need sponsorship from the WA State Government and its agencies. It might be added to by AMSA, tourism industry, port authorities and fishing and aquaculture industries.
The associations with other themes in WfO (e.g. Themes 2 and 4) might also provide indirect funding to UBOS, either to provide specific services to their clients or to contribute information to development of products within these themes.

16
Acknowledgments
Anne Domaradzki is thanked sincerely for her dedicated efforts in arranging the workshop as an important preliminary for this report, and for taking a record of the workshop discussions. The input of attendees at the Workshop is also gratefully acknowledged.
Bibliography
Atkinson, M.J., Thomas, F.I.M., Larson, N., Terrill, E., Morita, K. and Liu, C.C. 1995. A micro-hole potentiostatic oxygen sensor for oceanic CTDs. Deep-Sea Research I, 42: 761–771.
Barton, A.D., Greene, C.H., Monger, B.C. and Pershing, A.J. 2003. The Continuous Plankton Recorder survey and the North Atlantic Oscillation: Interannual- to multi-decadal-scale patterns of phytoplankton variability in the North Atlantic Ocean. Progress in Oceanography 58: 337–358.
Batten, S.D., Clark, R., Flinkman, J., Hays, G., John, E., John, A.W.G., Jonas, T., Lindley, J.A., Stevens, D.P. and Walne, A. 2003. CPR sampling: the technical background, materials and methods, consistency and comparability. Progress in Oceanography 58: 193–215.
Bellerby, R.G.J., Olsen, A., Johannessen, T. and Croot, P. 2002. A high precision spectrophotometric method for on-line shipboard seawater pH measurements: the automated marine pH Sensor (AMpS). Talanta 56: 61–69.
Belviso, S., Morrow, R. and Mihalopoulos, N. 2000. An Atlantic meridional transect of surface water dimethyl sulfide concentrations with 10-15 km horizontal resolution and close examination of ocean circulation. Journal of Geophysical Research-Atmospheres 105: 14423–14431.
Bowie, A.R., Achterberg, E.P., Blain, S., Boye, M., Croot, P.L., De Baar, H.J.W., Laan, P., Sarthou, G. and Worsfold, P.J. 2003. Shipboard analytical intercomparison of dissolved iron in surface waters along a north-south transect of the Atlantic Ocean. Marine Chemistry 84: 19–34.
Butler, A., Althaus, F., Furlani, D. and Ridgway, K. 2002. Assessment of the conservation values of the Bonney upwelling area: a component of the Commonwealth Marine Conservation Assessment Program 2002-2004. Report to Environment Australia, December 2002. CSIRO Marine Research, Hobart. 73 pp. <http://www.deh.gov.au/coasts/mpa/assessments/pubs/bonney-upwelling.pdf>
Chase, Z., Van Geen, A., Kosro, P.M., Marra, J. and Wheeler, P.A. 2002. Iron, nutrient, and phytoplankton distributions in Oregon coastal waters. Journal of Geophysical Research–Oceans 107: paper 38.
Chekalyuk, A.M., Hoge, F.E., Swift, R.N., Yungel, J.K. and Lyon, P.E. 2004. Laser fluorescence analysis of phytoplankton: beyond chlorophyll concentration. Ocean Color Research Team Meeting 14-16 April 2004, Washington, D.C. <http://oceancolor.gsfc.nasa.gov/DOCS/ScienceTeam/OCRT_Apr2004/chekalyuk_ocrt04.pdf>
Claustre, H., Fell, F., Oubelkheir, K., Prieur, L., Sciandra, A., Gentili B. and Babin, M. 2000. Continuous monitoring of surface optical properties across a geostrophic front: Biogeochemical inferences. Limnology and Oceanography 45: 309–321.

17
Clayton, T.D. and Byrne, R.H. 1993. Spectrophotometric seawater pH measurements — total hydrogen-ion concentration scale calibration of m-cresol purple and at-sea results. Deep-Sea Research I, 40: 2115–2129.
Cooper, D.J., Watson A.J. and Ling R.D. 1998. Variation of PCO2 along a North Atlantic shipping route (U.K. to the Caribbean): A year of automated observations. Marine Chemistry 60: 147–164.
CMR/DEP 2002. CSIRO Division of Marine Research/Western Australia – Department of Environmental Protection. North West Shelf joint environmental management study interim report. CSIRO Marine Research and Western Australia. Dept. of Environmental Protection Hobart, Tasmania/Perth, W.A. 140 pp.
CSIRO 2000. Huon Estuary Study — environmental research for integrated catchment management and aquaculture. Final report to Fisheries Research and Development Corporation. Project number 96/284, June 2000. CSIRO Division of Marine Research. Marine Laboratories, Hobart. 285 pp.
Dandonneau, Y. 1995. Sea-surface partial-pressure of carbon-dioxide in the Eastern Equatorial Pacific (August 1991 to October 1992) – a multivariate-analysis of physical and biological factors. Deep-Sea Research II, 42: 349–364.
De Jong J.T.M, Boye M., Schoemann V.F., Nolting R.F. and de Baar H.J.W. 2000. Shipboard techniques based on flow injection analysis for measuring dissolved Fe, Mn and Al in seawater. Journal of Environmental Monitoring 2: 496–502.
Doi, T., Obata, H. and Maruo, M. 2004. Shipboard Analysis of Picomolar Levels of Manganese in Seawater by Chelating Resin Concentration and Chemiluminescence Detection. Analytical and Bioanalytical Chemistry 378: 1288–1293.
Dragos P and Hunt C. 2003. Comparison of shipboard and moored measurements. Letter report June 5, 2003. Boston: Massachusetts Water Resources Authority. 13 pp. <www.mwra.state.ma.us/harbor/enquad/pdf/ms-085_a.pdf>
Fadeev, V.V., Demidov, A.A. and Checkalyuk, A.M. 1991. Laser remote sensing of sea-water plankton. Proceedings, 12th Asian Conference on Remote Sensing, Singapore, 30 October – 5 November 1991. 3 pp. <http://www.gisdevelopment.net/aars/acrs/1991/ocean/ocean003pf.htm>
Grasshoff, K., Kremling, K. and Ehrhardt, M. (editors) 1999. Methods of seawater analysis, 3rd Edition. Wiley-VCH, Weinheim / New York. 600 pp.
Holley, S.E., Waniek, J. and Hydes, D. 2003. Ferrybox measurements of phytoplankton dynamics in a hypernutrified estuary (Southampton Water, UK), International Council for the Exploration of the Sea, Contributions to Statutory Meetings: Annual Science Conference and Centenary, Tallinn, Estonia, 24-27 September 2003, CM 2003/L:02, 2003, 9pp. <http://www.hydromod.de/ferrybox/Public_results/ICES_ASC-2003_TS-L/ICES_ASC-2003_TS-L_paper_ref-no_CM_2003-
L-02.pdf>
Holst, G., Klimant, I., Kohls, O., and Kühl, M. (2000) Optical microsensors and microprobes. In: Varney M.S. (editor), Chemical sensors in oceanography. Gordon and Breach Science Publishers, Amsterdam. pp. 143–188.
Hosie, G.W., Fukuchi, M. and Kawaguchi, S. 2003. Development of the Southern Ocean Continuous Plankton Recorder survey. Progress in Oceanography 58: 263–283.
Howard, A.G. and Statham, P.J. 1993. Inorganic trace analysis: philosophy and practice. Wiley, Chichester. 250 pp.

18
Lehmann, M.K., Davis, R.F., Huot, Y. and Cullen, J.J. 2004. Spectrally weighted transparency in models of water-column photosynthesis and photoinhibition by ultraviolet radiation. Marine Ecology-Progress Series 269: 101–110.
Lyddy-Meaney, A.J., Ellis, P., Worsfold, P.J., Butler, E.C.V. and McKelvie, I.D. 2002. A compact flow injection analysis system for surface mapping of phosphate in marine waters. Talanta, 58: 1043–1053.
Mackey, D.J., Butler, E.C.V., Nichols, P.D. and Higgins, H.W. 1989. Continuous shipboard measurements of pH and fluorescence in seawater. Marine Chemistry 28: 41–60.
Marris, E. 2004. Oceanography: Deckchair science. Nature 431: 394–395.
McKenzie, D.C., Clementson, L.A., J.S. Parslow, M.J. Sherlock, Young, J.W. and Lyne, V.D (1998). An underway TSF logging system to collect SeaWiFS ground truth data from fishing vessels. Proceedings Ocean Optics XIV, Hawaii, (CD-ROM).
McNeil, B.I., Tilbrook, B. and Matear, R.J. 2001. Accumulation and uptake of anthropogenic CO2 in the Southern Ocean, south of Australia between 1968 and 1996. Journal of Geophysical Research–Oceans 106: 31431–31445.
McPhaden, M.J., Delcroix, T., Hanawa, K., Kuroda, Y., Meyers, G., Picaut, J. and Swenson, M. 2001. The El Niño–Southern Oscillation (ENSO) Observing System. In: Koblinsky, C.J., and Smith, N.R. (editors), Observing the Ocean in the 21st Century. GODAE Project Office and Bureau of Meteorology, Melbourne. pp. 231–247.
Morel, F.M.M. and Price, N.M. 2003. The biogeochemical cycles of trace metals in the oceans. Science 300: 944–947.
Petrusevics, P.M. 1993. SST fronts in inverse estuaries, South Australia—indicators of reduced gulf-shelf exchange. Australian Journal of Marine and Freshwater Research 44: 305–32.
Pinto, A.M.F., Von Sperling, E. and Moreira, R.M. 2001. Chlorophyll-a determination via continuous measurement of plankton fluorescence: Methodology development. Water Research 35: 3977–3981.
Reid, P.C., Colebrook, J.M., Matthews, J.B.L., Aiken, J. and Continuous Plankton Recorder Team. 2003. The Continuous Plankton Recorder: concepts and history, from Plankton Indicator to undulating recorders. Progress in Oceanography 58: 117–173.
Romano, J-C. and Younes, W.A.N., 2003. A portable and low-cost recording system for time-series observation of coastal marine surface water: the case of Rhone River dilution plume. Journal of Coastal Research, 19: 740–747.
Sakamoto, C.M., Millero, F.J., Yao, W.S., Friederich, G.E. and Chavez, F.P. 1998. Surface seawater distributions of inorganic carbon and nutrients around the Galapagos Islands: Results from the Plumex experiment using automated chemical mapping. Deep-Sea Research II, 45: 1055–1071.
Schofield, O., Bergmann, T., Oliver, M.J., Irwin, A., Kirkpatrick, G., Bissett, W.P., Moline, M.A. and Orrico, C. 2004. Inversion of spectral absorption in the optically complex coastal waters of the Mid-Atlantic Bight. Journal of Geophysical Research, 109: C12S04.
Schussler, U. and Kremling, K. 1993. A pumping system for underway sampling of dissolved and particulate trace-elements in near-surface waters. Deep-Sea Research I, 40: 257–266

19
Stoll M.H.C., Bakker K., Nobbe G.H. and Haese R.R. 2001. Continuous-flow analysis of dissolved inorganic carbon content in seawater. Analytical Chemistry 73: 4111–4116.
Tokar J.M. and Dickey T.D. 2000. Chemical sensor technology: Current and future applications. In: Varney M.S. (editor), Chemical sensors in oceanography. Gordon and Breach Science Publishers, Amsterdam. pp. 303–329.
Tranter, D.J. and Leech, G.S. 1987. Factors influencing the standing crop of phytoplankton on the Australian Northwest Shelf seaward of the 40-m isobath. Continental Shelf Research 7: 115–133.
Vaillancourt, R.D., Sambrotto, R.N., Green, S. and Matsuda, A. 2003. Phytoplankton biomass and photosynthetic competency in the summertime Mertz Glacier Region of East Antarctica. Deep-Sea Research II, 50: 1415–1440.
Vink, S., Boyle, E.A., Measures, C.I. and Yuan, J. 2000. Automated high resolution determination of the trace elements iron and aluminium in the surface ocean using a towed Fish coupled to flow injection analysis. Deep-Sea Research I, 47: 1141–1156.
Waite, A.M. 2004. Leeuwin Current meso-scale eddies: death traps or nurseries? (A preliminary overview of the 2003 Eddy Voyage). AMSA2004, Program and Abstracts of the Annual Conference of the Australian Marine Sciences Association, Hobart, 6–9 July 2004. p. 132.
Watson, R.J., Butler, E.C.V., Clementson, L.A. and Berry, K.M. 2004. Flow analysis with fluorescence detection for the determination of trace levels of ammonium in seawater. Journal of Environmental Monitoring, in press.
Whitfield, M. 2001. Interactions between phytoplankton and trace metals in the ocean. In: Southwood, A. J. Tyler, P. A. Young, C. M. and Fuiman, L. A. (editors), Advances in Marine Biology, Vol. 41, Academic Press, London, pp. 1–128.
Woodward, E.M.S. and Rees, A.P. 2001. Nutrient distributions in an anticyclonic eddy in the northeast Atlantic Ocean, with reference to nanomolar ammonium concentrations. Deep-Sea Research II, 48: 775–793.
Worsfold, P.J., Achterberg, E.P., Bowie, A.R., Sandford, R.C. and Mantoura, R.F.C. 2000. Flow injection with chemiluminescence detection for the shipboard monitoring of trace metals. In: Varney M.S. (editor), Chemical sensors in oceanography. Gordon and Breach Science Publishers, Amsterdam. pp. 71–94.
Zika, R.G., Milne, P.J. and Zafiriou, O.C. 1993. Photochemical studies of the Eastern Caribbean — an introductory overview. Journal of Geophysical Research–Oceans 98: 2223–2232.

i
APPENDIX — Attendees at 6 May 2004 Workshop
Ian Barton * Edward Butler Lesley Clementson Scott Condie Brian Griffiths Richard Matear Gary Meyers Vicki Nelson (NOO) John Parslow Andreas Schiller Ann Thresher Bronte Tilbrook Tom Trull Karen Wild-Allen
* All CSIRO Marine Research, except where indicated otherwise

CSIRO Marine Laboratories
Division of Marine Research(formerly the Division of Fisheries and theDivision of Oceanography)
HeadquartersCastray Esplanade, Hobart, Tasmania 7001GPO Box 1538, Hobart, Tasmania 7001, Australia
Queensland Laboratory 133 Middle Street, Cleveland, Queensland 4163PO Box 120, Cleveland, Queensland 4163, Australia
Western Australia LaboratoryUnderwood Ave Floreat, Western Australia 6014Private Bag 5, Wembley W.A. 6913
ISBN 0 876996 90 0ISSN 0725–4598