Embed Size (px)
Citation preview
Conserving Energy and Preserving the Environment: The Role of Public
Transportation
Robert J. Shapiro
Kevin A. Hassett and Frank S. Arnold
July 2002
About the Authors
Dr. Robert J. Shapiro is Managing Director of Sonecon, LLC, a non-resident Fellow of theBrookings Institution and the Progressive Policy Institute, Economic Counselor to the U.S.Conference Board, and a director of the Axson-Johnson Foundation in Sweden and the Centerfor International Political Economy in New York. From 1997 to 2001, Dr. Shapiro was UnderSecretary of Commerce for Economic Affairs. In that position, he oversaw economic policy forthe Commerce Department and directed the Nation’s major statistical agencies, including theCensus Bureau as it conducted the decennial Census. Prior to that post, he was co-founder andVice President of the Progressive Policy Institute, and principal economic advisor to WilliamClinton in his 1991-1992 presidential campaign. He also has been Legislative Director forSenator Daniel P. Moynihan and Associate Editor of U.S. News & World Report. Dr. Shapirohas been a Fellow of Harvard University and Fellow of the National Bureau of EconomicResearch. He holds a Ph.D. and M.A. from Harvard University, an M.Sc. from the LondonSchool of Economics and Political Science, and an A.B. from the University of Chicago.
Dr. Kevin A. Hassett is a Resident Scholar of the American Enterprise Institute, where hefocuses on macroeconomics, public finance and tax policy. He is also the author or co-author offour books, including the forthcoming Bubbleology: The Remarkable Science of Stock MarketWinners and Losers, and numerous articles. Dr. Hassett was chief economic adviser to SenatorJohn McCain in his 2000 presidential campaign. Previously, he was a Senior Economist at theBoard of Governors of the Federal Reserve System and Associate Professor of economics andfinance at the Columbia University Graduate School of Business. He also has served as policyconsultant to the Treasury Department during the administrations of Presidents George Bush andWilliam Clinton. Dr. Hassett holds a Ph.D. from the University of Pennsylvania and a B.A. fromSwarthmore College.
Dr. Frank S. Arnold is President of Applied Microeconomics, Inc. He is also a columnist forThe Environmental Forum, published by the Environmental Law Institute, and a consultingeconomist to ICF Incorporated. Dr. Arnold is a nationally recognized expert on environmentaleconomics, including such areas as the analytic methods used to conduct EPA regulatory andeconomic impact analyses, life cycle assessment, environmental enforcement, and global changeand energy conservation. Prior to founding Applied Microeconomics, Inc., Dr. Arnold was VicePresident and Senior Economist for ICF Incorporated and a Visiting Scholar at theEnvironmental Law Institute. He has been a Fellow of the National Bureau of EconomicResearch, the National Science Foundation, and the Institute for Humane Studies. Dr. Arnoldholds a Ph.D. from Harvard University and a B.A. from the University of Virginia.
* This report was commissioned by the American Public Transportation Association.
TABLE OF CONTENTS
Executive Summary Page 1
I. Introduction Page 5
II. The Energy Savings from the Page 14 Use of Public Transportation
III. The Environmental Benefits from the Page 20 Use of Public Transportation
IV. Conclusion Page 29
V. Methodology Page 31
Appendix Page 33
EXECUTIVE SUMMARY
The role of transportation in our nation’s energy consumption and environmental quality isimmense. Americans use more energy and generate more pollution in their daily lives than theydo in the production of all the goods in the economy, the operations of all commercialenterprises, or the running of their homes. Any serious effort to reduce our dependence onforeign oil and make significant environmental progress must address the way Americans travel.
The vital role of public transportation in improving energy efficiency and the environment isoften under-appreciated. With its fuel and pollution advantages, increased use of transit offersthe most effective strategy available for reducing energy consumption and improving theenvironment without imposing new taxes, government mandates, or regulations on the economyor consumers.
Public transportation needs to be an essential element in sound national energy andenvironmental policies. Potential threats to the supply and price of foreign oil as a result ofterrorism, conflicts in the Middle East, and OPEC decisions underscore the need for a publictransportation strategy that reduces our nation’s dependence on imported oil. Likewise, ongoingefforts to reduce harmful emissions from our air can be more effective when they include waysto increase use of public transportation.
“Conserving Energy and Preserving the Environment: The Role of Public Transportation”demonstrates that traveling by transit, per person and per mile, uses significantly less energy andproduces substantially less pollution than comparable travel by private vehicles. The findingsprovide clear and indisputable evidence that public transportation is saving energy and reducingpollution in America today -- and that increased usage could have an even greater impact in thefuture.
Current Benefits
At our current levels of use, the study found public transportation is reducing Americans’energy bills and keeping the air cleaner. For example:
Energy savings from public transportation contribute to our national and economic security bymaking America less dependent on foreign oil or on new sources for drilling.
• Public transportation saves more than 855 million gallons of gasoline a year, or 45 millionbarrels of oil. These savings equal about one month’s oil imports from Saudi Arabia andthree months of the energy that Americans use to heat, cool and operate their homes, or halfthe energy used to manufacture all computers and electronic equipment in America.
2
• For every passenger mile traveled, public transportation uses about one-half the fuel ofprivate automobiles, sports utility vehicles (SUVs) and light trucks.
Even at current rates of usage, public transportation produces large environmental benefits.
• For every passenger mile traveled, public transportation produces only a fraction of theharmful pollution of private vehicles: only 5 percent as much carbon monoxide, less than 8percent as many volatile organic compounds, and nearly half as much carbon dioxide andnitrogen oxides.
• Compared to private vehicles, public transportation is reducing annual emissions of thepollutants that create smog, volatile organic compounds (VOCs) and nitrogen oxides (NOx),by more than 70,000 tons and 27,000 tons respectively. These reductions equal:
-- nearly 50 percent of all VOCs emitted from the dry cleaning industry, a major sourceof this pollutant;
-- 45 percent of VOCs emitted from the industrial uses of coal;-- 50 percent of NOx from the industrial uses of coal;-- more than 33 percent of the NOx emitted by all domestic oil and gas producers or by
the metal processing industry.
• The reduced VOC and NOx emissions that result from public transportation use savebetween $130 million and $200 million a year in regulatory costs.
• Public transportation is reducing emissions of carbon monoxide (CO) by nearly 745,000 tonsannually. This equals nearly 75 percent of the CO emissions by all U.S. chemicalmanufacturers.
• Public transportation is also reducing emissions of carbon dioxide (CO2), which contributesto global warming, by more than 7.4 million tons a year.
Potential, Achievable Benefits
As great as the current advantages are, far greater energy and environmental benefits could bederived through increased use of public transportation. Based on our findings, the studyconcludes that greater use of public transportation offers the single most effective strategycurrently available for achieving significant energy savings and environmental gains, withoutcreating new government programs or imposing new rules on the private sector.
If Americans increase their use of public transportation, the study found dramatic benefits inenergy conservation and a healthier environment.
For example, if Americans used public transportation at the same rate as Europeans -- forroughly ten percent of their daily travel needs -- the United States would:
3
• Reduce its dependence on imported oil by more than 40 percent or nearly the amount of oilwe import from Saudi Arabia each year;
• Save more energy every year than all the energy used by the U.S. petrochemical industry andnearly equal the energy used to produce food in the United States.
• Reduce carbon dioxide emissions by more than 25 percent of those directed under the KyotoAgreement.
• Reduce CO pollution by three times the combined levels emitted by four high pollutingindustries (chemical manufacturing; oil and gas production; metals processing; andindustrial use of coal).
• Reduce smog across the country by cutting NOx emissions by 35 percent of the combinedNOx emissions from the four industries cited above, and cut VOC pollution by 84 percent ofthe combined VOC emissions from these four industries.
If Americans used public transportation at the same rate as Canadians -- for roughly sevenpercent of their daily travel needs -- the United States would:
• Reduce its oil dependence by an amount equal to more than a half year’s oil imports fromSaudi Arabia.
• Save nearly the amount of energy used by the entire petrochemical industry every year.
• Reduce CO pollution by twice the combined levels emitted by the four high pollutingindustries (chemical manufacturing; oil and gas production; metals processing; andindustrial use of coal).
• Reduce NOx emissions by 25 percent of the combined NOx emissions from the fourindustries cited above, and cut VOC pollution by almost 60 percent of the combined VOCemissions from these four industries.
• Help prevent global warming by cutting CO2 emissions by amounts equal to nearly 20percent of the CO2 emitted from fuel burned for residential uses or more than 20 percent ofall CO2 emitted by commercial enterprises.
Even modest increases in the use of public transportation would produce great reductions inhazardous pollution in congested areas where pollution now poses the greatest risk.
• For example, almost half of the 35 largest public transportation systems, serving 26metropolitan areas, are located in areas currently failing to meet EPA air-quality standardsfor CO or smog. In these highly-populated, urban and suburban “non-attainment areas,” the
4
pollution reductions that public transit can deliver would go directly to the environmentalbottom line.
Achieving a genuine measure of energy independence and cleaner air by investing in our publictransportation systems has significant economic advantages. While this study measured currentand potential benefits of public transportation, the findings lead us to believe that achievinggreater energy savings and environmental gains by significantly increasing the passenger loadswould be less costly than continuing to expand the fleet of private vehicles, build and maintainmore roads and highways to accommodate them, and absorb the rising energy, environmentaland congestion expenses of this approach.
An Attainable Goal for Americans
Increasing Americans’ use of public transit is an achievable goal. In the early 20th century,America led the world in mass transit development and use. Recent data suggest that a transitrenaissance may be underway in the United States. Specifically, the study points to thefollowing facts: 1) since 1995, use of public transportation has grown sharply and faster than theuse of private vehicles; 2) passenger miles ridden on public buses and rail systems have grownfaster than the passenger miles ridden in private automobiles, SUVs and light trucks; and 3)public transportation ridership has grown at a faster rate than air travel in recent years.
“Conserving Energy and Preserving the Environment: The Role of Public Transportation”concludes that making much greater use of public transportation may be the most effectivestrategy to sharply reduce our dependence on foreign oil and make historic strides inenvironmental quality. The study argues that these results can be achieved if we make publictransportation a vital part of our nation’s energy and environmental policies.

Conserving Energy and Preserving theEnvironment: The Role of Public
Transportation
5
I. Introduction
As the United States strives to achieve greater energy efficiency and independence and toimprove the environment, the role of transportation has become paramount. America consumesmore energy and produces more pollution in mobility and travel than in any other activity. Itfollows that any serious effort to reduce our dependence on foreign oil and make significantadditional progress on the environment must address the way Americans travel. This studyexamines the role of public transportation in conserving energy and reducing pollution. The datashow that traveling by public transportation, per person and per mile, uses significantly lessenergy and produces substantially less pollution than comparable travel by private vehicles. Wefind that increasing the role of public transportation can provide the most effective strategyavailable for reducing energy consumption and improving the environment without imposingnew taxes and government regulations on the economy or consumers.
Americans highly value their mobility and with good reason. Our communities, theeconomy and much of our lives are organized around our ability to travel easily and efficientlyfrom home to work or school, to shop or play, to receive medical care or just for the sheerpleasure of traveling. This freedom has certain costs that accompany its many benefits.Vehicles, public and private, have to be purchased and operated; roads must be built andmaintained; laws must be enforced so many people can travel at the same time; and hundreds ofthousands of accidents inevitably occur.
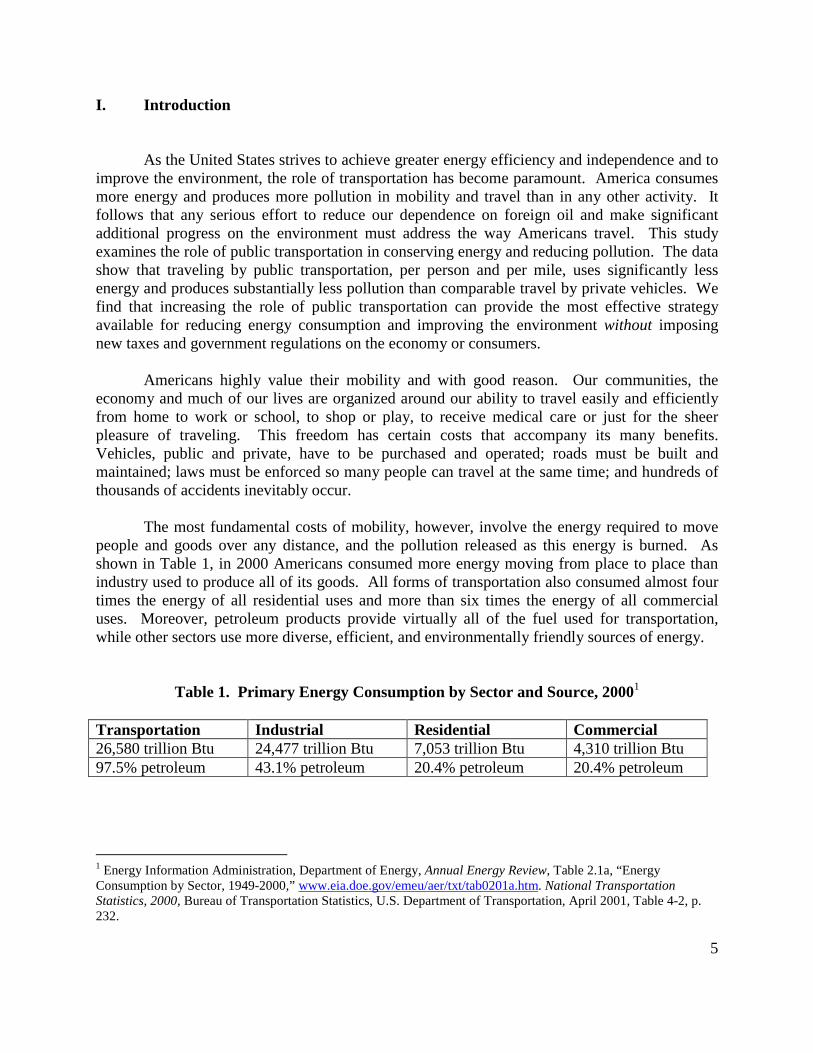
The most fundamental costs of mobility, however, involve the energy required to movepeople and goods over any distance, and the pollution released as this energy is burned. Asshown in Table 1, in 2000 Americans consumed more energy moving from place to place thanindustry used to produce all of its goods. All forms of transportation also consumed almost fourtimes the energy of all residential uses and more than six times the energy of all commercialuses. Moreover, petroleum products provide virtually all of the fuel used for transportation,while other sectors use more diverse, efficient, and environmentally friendly sources of energy.
Table 1. Primary Energy Consumption by Sector and Source, 20001
Transportation Industrial Residential Commercial26,580 trillion Btu 24,477 trillion Btu 7,053 trillion Btu 4,310 trillion Btu97.5% petroleum 43.1% petroleum 20.4% petroleum 20.4% petroleum
1 Energy Information Administration, Department of Energy, Annual Energy Review, Table 2.1a, “EnergyConsumption by Sector, 1949-2000,” www.eia.doe.gov/emeu/aer/txt/tab0201a.htm. National TransportationStatistics, 2000, Bureau of Transportation Statistics, U.S. Department of Transportation, April 2001, Table 4-2, p.232.
6
Energy and environmental costs are built into all forms of mobility by mechanical means,but personal and political choices can reduce the fuel and pollution “overhead” associated with agiven level of mobility. The primary approach for lowering these costs involves developing andusing technologies that reduce either the fuel required to move people and goods, or the amountof pollution associated with burning that fuel. The most prominent regulatory strategiesdeveloped to advance this approach are the Corporate Average Fuel Efficiency (CAFÉ) andauto-emission standards for private automobiles. The non-regulatory strategy with the greatestpotential for achieving the same results is greater use of public transportation, because on a per-person, per-mile basis, public transportation is much more energy efficient and much lesspolluting than private automobiles.
A Note about Categories and Years
In comparing public and private transportation, we include vehicletravel within metropolitan areas; we do not include trips betweenmetropolitan areas. The category of public transportation used herecovers all buses, commuter rail and light and heavy rail within ametropolitan area; it does not include taxicabs, other “demandresponse” vehicles such as vans for handicapped people, ferry boats,or trolley buses, nor inter-city train, bus or air service. The categoryof private vehicles used here includes passenger cars and “other 2-axle 4-tire vehicles,” which covers SUVs and light trucks; it doesnot include motorcycles and trucks with six or more tires.
In each case, we use the most recent and comprehensive dataavailable. The energy section draws on 1998 data on travel byprivate and public transportation, because 1998 is the latest year forwhich data on energy consumption by private vehicles is available(1999 data on energy use by public transportation systems isavailable). The analysis of public transportation and theenvironment draws on 1999 data, because that is the most recentdata available on pollution emissions by public and private vehicles.
The most recent data show that the current use of public transportation is a majorsource of energy savings.
Moving a person over a given distance by public transportation consumes, onaverage, about half the energy of moving a person the same distance by privateautomobile, sports-utility vehicle (SUV), or light truck.
7
Over the 42.5 billion passenger miles traveled on public transportation in 1998, theenergy benefits add up to nearly than 107 trillion British thermal units (Btus).2 As we will show,these energy benefits are comparable to the energy consumed by various manufacturingindustries. For example, the energy saved through the use of public transportation is equivalentto half of the energy used to manufacture computers and electronic equipment in America. Theseenergy savings are also equal to 99 percent of the energy used by the beverage and tobaccoindustries, and more than four times all the energy used to manufacture apparel. Finally, theseenergy benefits are equivalent to about one-fourth of the energy used to heat American homes in1997 (the most recent data).3
These savings carry clear significance for our national and economic security. TheUnited States is increasingly dependent on oil from the Middle East, at a time when dangers fromSaddam Hussein, the war against terrorism, and the Israeli-Palestinian conflict all threaten tointerrupt the supply of OPEC oil or sharply increase its price. Greater use of publictransportation can offer a powerful conservation strategy that could substantially reduce ourdependence on imported oil. There is no other technology or approach other than increased useof public transportation that, for every trip it is used, has the energy impact of nearly doubling thefuel efficiency of automobiles.
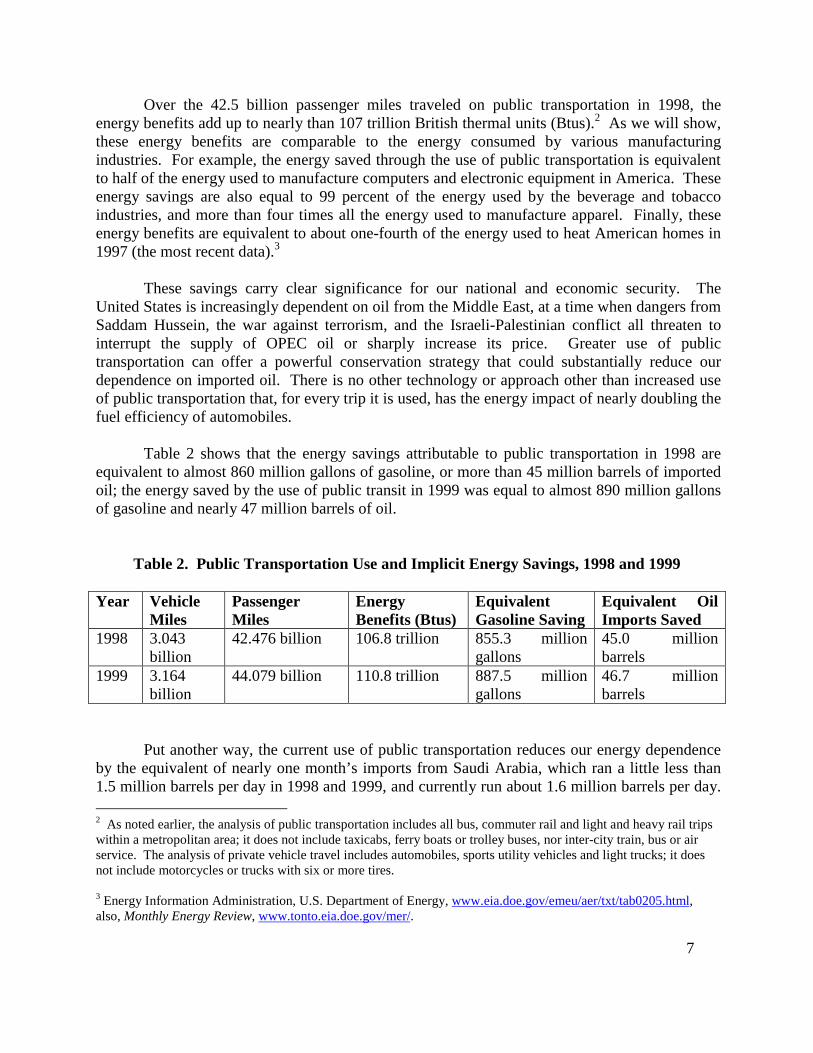
Table 2 shows that the energy savings attributable to public transportation in 1998 areequivalent to almost 860 million gallons of gasoline, or more than 45 million barrels of importedoil; the energy saved by the use of public transit in 1999 was equal to almost 890 million gallonsof gasoline and nearly 47 million barrels of oil.
Table 2. Public Transportation Use and Implicit Energy Savings, 1998 and 1999
Year VehicleMiles
PassengerMiles
EnergyBenefits (Btus)
EquivalentGasoline Saving
Equivalent OilImports Saved
1998 3.043billion
42.476 billion 106.8 trillion 855.3 milliongallons
45.0 millionbarrels
1999 3.164billion
44.079 billion 110.8 trillion 887.5 milliongallons
46.7 millionbarrels
Put another way, the current use of public transportation reduces our energy dependenceby the equivalent of nearly one month’s imports from Saudi Arabia, which ran a little less than1.5 million barrels per day in 1998 and 1999, and currently run about 1.6 million barrels per day. 2 As noted earlier, the analysis of public transportation includes all bus, commuter rail and light and heavy rail tripswithin a metropolitan area; it does not include taxicabs, ferry boats or trolley buses, nor inter-city train, bus or airservice. The analysis of private vehicle travel includes automobiles, sports utility vehicles and light trucks; it doesnot include motorcycles or trucks with six or more tires.
3 Energy Information Administration, U.S. Department of Energy, www.eia.doe.gov/emeu/aer/txt/tab0205.html,also, Monthly Energy Review, www.tonto.eia.doe.gov/mer/.
8
These energy savings from public transit are also equal to two-to-three weeks of imports from theentire Persian Gulf.
A Note About Terms
Vehicular travel is measured in several ways. “Vehicle Trips”refers to the number of single, one-way trips from one point toanother by public transportation or private vehicle. “PassengerTrips” refers to the number of person(s) traveling from one point toanother on public transportation; “Person Trips” refers to thenumber of persons traveling from one point to another in a privatevehicle. Here, we will use “passenger trips” to refer to both.“Vehicle Miles” or “Miles Driven” refers to the distance traveled ona single vehicle trip. “Passenger Miles” refers to the total distancetraveled by all passengers in a public-transit vehicle on a singlepassenger trip, and “Person Miles” refers to the combined distancetraveled by the driver and all passengers in a private vehicle. Again,here we will use “passenger miles” to refer to both. A 10-mileautomobile trip with one driver and two passengers would constituteone vehicle trip, three passenger trips, 10 vehicle miles or milesdriven, and 30 passenger miles. Similarly a five-mile commutertrain trip with a driver and 50 passengers would constitute onevehicle trip, 50 passenger trips, five vehicle miles or miles driven,and 250 passenger miles.
The environmental benefits from using public transportation, compared to privateautomobiles (including SUVs and light trucks), are also highly significant. Here, we willexamine the impact of public transportation, versus private automobiles, on emissions of fourmajor air pollutants.4 The first two are volatile organic compounds (VOCs) and nitrogen oxides(NOx), which combine with sunlight to form ozone, or smog. Smog is a serious irritant that cancause coughing, choking, and stinging eyes, damage lung tissues, and exacerbate respiratoryillnesses. Children are especially susceptible to the harmful effects of VOCs and NOx in smog,and even healthy adults usually feel its effects over time. Another important pollutant examinedhere is carbon monoxide (CO), a poisonous gas that reduces the body’s ability to transport
4 Sulfur dioxide (SO2) is also emitted in substantial quantities by electric utilities and in very small amounts byautomobiles. This pollutant is not included in the analysis because its nationwide emissions are capped at a givenlevel, and the fixed amount allowed is distributed based on an emission allowance trading system. Thus, total SO2emissions (due to the use of electricity by rail systems) will not change whether public transportation exists or not.In light of this, omitting the small SO2 emissions from automobiles means that the environmental benefits of publictransportation are understated in this analysis.
9
oxygen to organs and tissues, and interferes with learning. Elderly people, children and adultswith respiratory conditions are particularly vulnerable to the effects of CO exposure. These threepollutants pose the greatest risks to people living in urban and close-in suburban areas, wheresmog and CO concentrations are highest and public transportation systems are most highlydeveloped. Greater use of public transportation, therefore, would reduce hazardous pollution inprecisely those areas where it now presents the greatest risks. In addition to these threepollutants, the analysis also covers the impact of public transportation on emissions of carbondioxide (CO2), a major greenhouse gas that contributes to climate change.
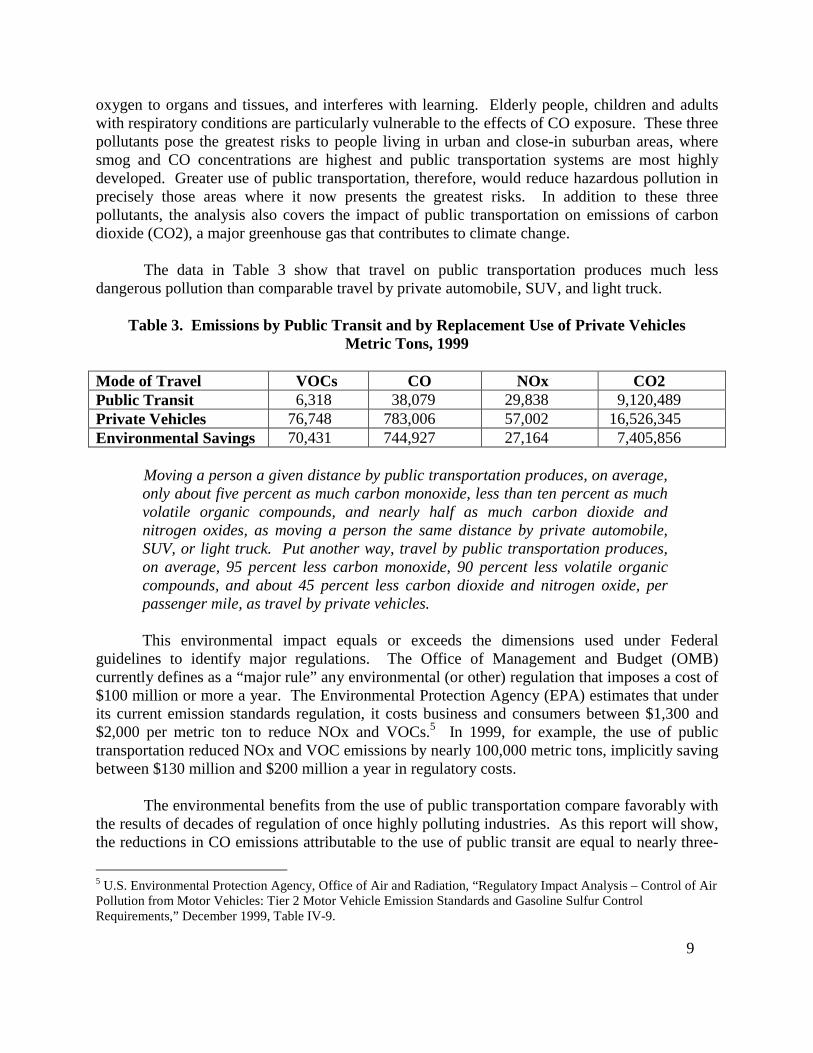
The data in Table 3 show that travel on public transportation produces much lessdangerous pollution than comparable travel by private automobile, SUV, and light truck.
Table 3. Emissions by Public Transit and by Replacement Use of Private VehiclesMetric Tons, 1999
Mode of Travel VOCs CO NOx CO2Public Transit 6,318 38,079 29,838 9,120,489Private Vehicles 76,748 783,006 57,002 16,526,345Environmental Savings 70,431 744,927 27,164 7,405,856
Moving a person a given distance by public transportation produces, on average,only about five percent as much carbon monoxide, less than ten percent as muchvolatile organic compounds, and nearly half as much carbon dioxide andnitrogen oxides, as moving a person the same distance by private automobile,SUV, or light truck. Put another way, travel by public transportation produces,on average, 95 percent less carbon monoxide, 90 percent less volatile organiccompounds, and about 45 percent less carbon dioxide and nitrogen oxide, perpassenger mile, as travel by private vehicles.
This environmental impact equals or exceeds the dimensions used under Federalguidelines to identify major regulations. The Office of Management and Budget (OMB)currently defines as a “major rule” any environmental (or other) regulation that imposes a cost of$100 million or more a year. The Environmental Protection Agency (EPA) estimates that underits current emission standards regulation, it costs business and consumers between $1,300 and$2,000 per metric ton to reduce NOx and VOCs.5 In 1999, for example, the use of publictransportation reduced NOx and VOC emissions by nearly 100,000 metric tons, implicitly savingbetween $130 million and $200 million a year in regulatory costs.
The environmental benefits from the use of public transportation compare favorably withthe results of decades of regulation of once highly polluting industries. As this report will show,the reductions in CO emissions attributable to the use of public transit are equal to nearly three-
5 U.S. Environmental Protection Agency, Office of Air and Radiation, “Regulatory Impact Analysis – Control of AirPollution from Motor Vehicles: Tier 2 Motor Vehicle Emission Standards and Gasoline Sulfur ControlRequirements,” December 1999, Table IV-9.
10
fourths of all CO emissions by chemical manufacturers. These reductions in CO emissions arealso equal to more than half the CO produced by the metal processing sector, and 60 percentmore than the CO emissions by the electric utility industry.6 The NOx benefits of publictransportation are also equal to more than one-third of the NOx emissions of American oil andgas producers, and nearly half of the NOx emissions from all industrial uses of coal.7 Similarly,the reductions in VOCs attributable to the use of public transportation are equal to about half ofall VOC emissions from the dry cleaning industry, a major source of this pollutant, and justunder 45 percent of the VOCs emitted by the industrial use of coal.
The energy savings and environmental benefits derived from public transportation couldbe much greater, if Americans used public transit more frequently. In the early 20th century whencities were growing rapidly, public and private streetcar and bus lines were established across thecountry, and America led the world in mass-transit development and use.8 Since World War II,private automobiles have become the dominant means of short-distance travel, even as publictransit assumed a larger role many other countries. Over the last several decades, for example,the number of privately-owned vehicles has grown more than twice as fast as the population.9
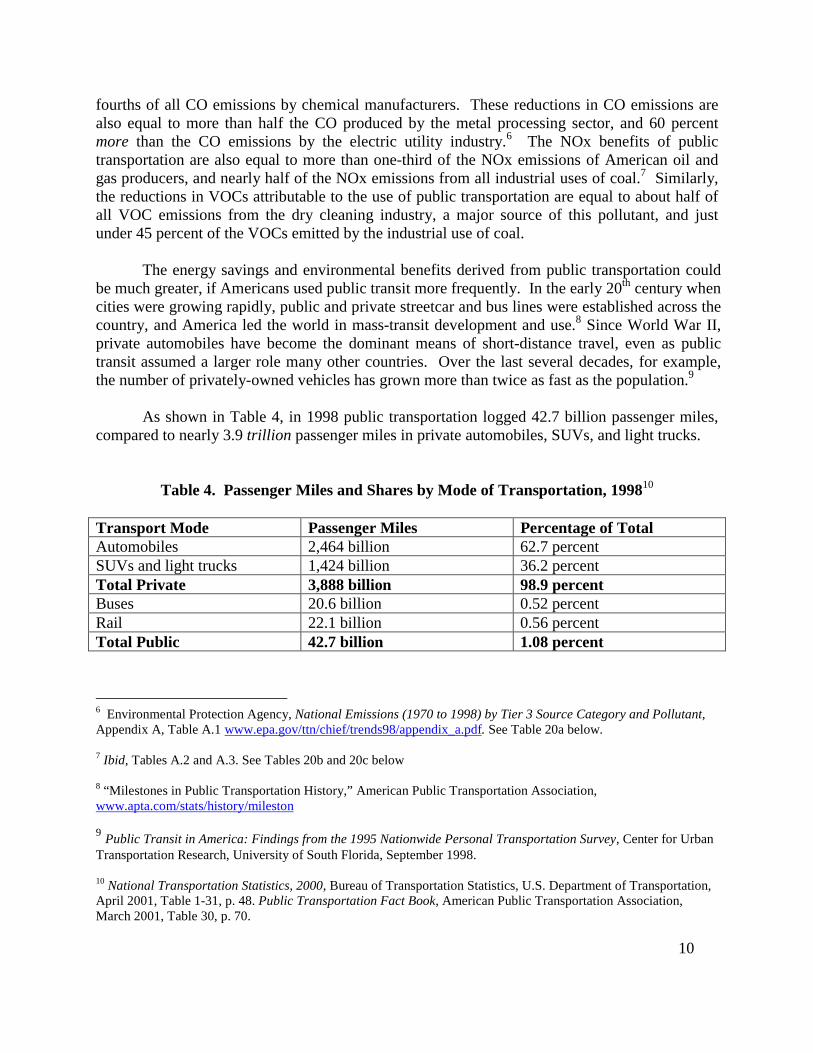
As shown in Table 4, in 1998 public transportation logged 42.7 billion passenger miles,compared to nearly 3.9 trillion passenger miles in private automobiles, SUVs, and light trucks.
Table 4. Passenger Miles and Shares by Mode of Transportation, 199810
Transport Mode Passenger Miles Percentage of TotalAutomobiles 2,464 billion 62.7 percentSUVs and light trucks 1,424 billion 36.2 percentTotal Private 3,888 billion 98.9 percentBuses 20.6 billion 0.52 percentRail 22.1 billion 0.56 percentTotal Public 42.7 billion 1.08 percent
6 Environmental Protection Agency, National Emissions (1970 to 1998) by Tier 3 Source Category and Pollutant,Appendix A, Table A.1 www.epa.gov/ttn/chief/trends98/appendix_a.pdf. See Table 20a below.
7 Ibid, Tables A.2 and A.3. See Tables 20b and 20c below
8 “Milestones in Public Transportation History,” American Public Transportation Association,www.apta.com/stats/history/mileston
9 Public Transit in America: Findings from the 1995 Nationwide Personal Transportation Survey, Center for UrbanTransportation Research, University of South Florida, September 1998.
10 National Transportation Statistics, 2000, Bureau of Transportation Statistics, U.S. Department of Transportation,April 2001, Table 1-31, p. 48. Public Transportation Fact Book, American Public Transportation Association,March 2001, Table 30, p. 70.
11
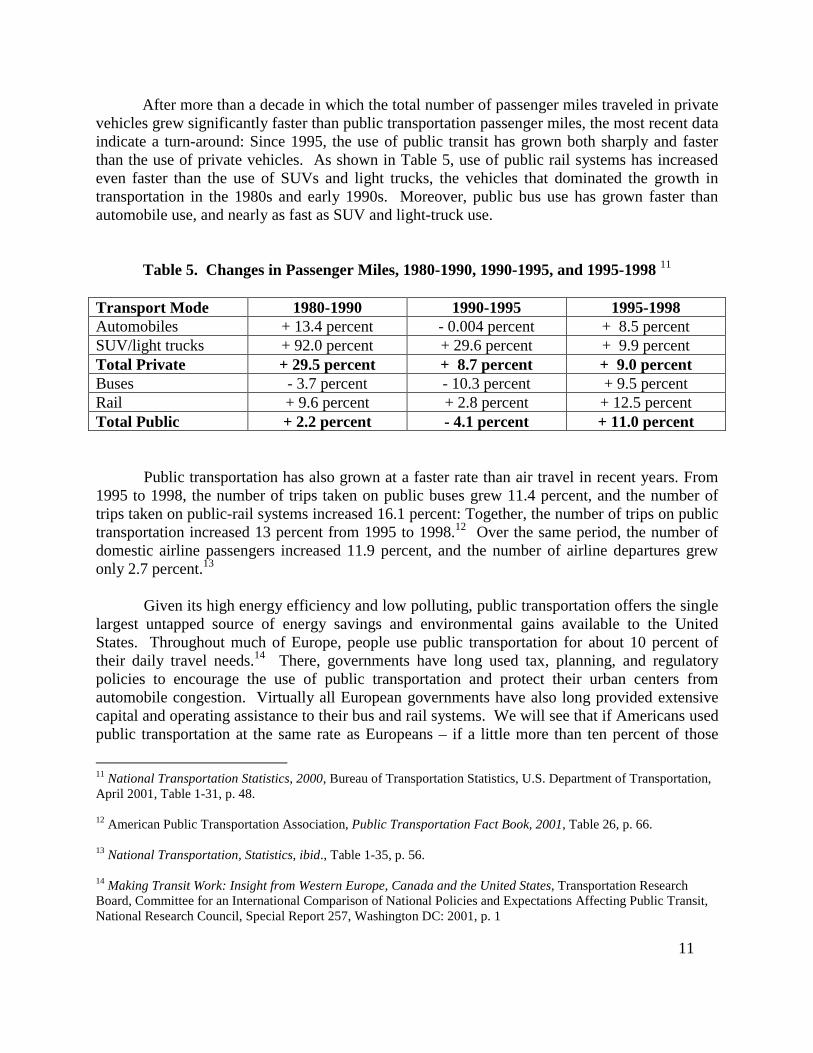
After more than a decade in which the total number of passenger miles traveled in privatevehicles grew significantly faster than public transportation passenger miles, the most recent dataindicate a turn-around: Since 1995, the use of public transit has grown both sharply and fasterthan the use of private vehicles. As shown in Table 5, use of public rail systems has increasedeven faster than the use of SUVs and light trucks, the vehicles that dominated the growth intransportation in the 1980s and early 1990s. Moreover, public bus use has grown faster thanautomobile use, and nearly as fast as SUV and light-truck use.
Table 5. Changes in Passenger Miles, 1980-1990, 1990-1995, and 1995-1998 11
Transport Mode 1980-1990 1990-1995 1995-1998Automobiles + 13.4 percent - 0.004 percent + 8.5 percentSUV/light trucks + 92.0 percent + 29.6 percent + 9.9 percentTotal Private + 29.5 percent + 8.7 percent + 9.0 percentBuses - 3.7 percent - 10.3 percent + 9.5 percentRail + 9.6 percent + 2.8 percent + 12.5 percentTotal Public + 2.2 percent - 4.1 percent + 11.0 percent
Public transportation has also grown at a faster rate than air travel in recent years. From1995 to 1998, the number of trips taken on public buses grew 11.4 percent, and the number oftrips taken on public-rail systems increased 16.1 percent: Together, the number of trips on publictransportation increased 13 percent from 1995 to 1998.12 Over the same period, the number ofdomestic airline passengers increased 11.9 percent, and the number of airline departures grewonly 2.7 percent.13
Given its high energy efficiency and low polluting, public transportation offers the singlelargest untapped source of energy savings and environmental gains available to the UnitedStates. Throughout much of Europe, people use public transportation for about 10 percent oftheir daily travel needs.14 There, governments have long used tax, planning, and regulatorypolicies to encourage the use of public transportation and protect their urban centers fromautomobile congestion. Virtually all European governments have also long provided extensivecapital and operating assistance to their bus and rail systems. We will see that if Americans usedpublic transportation at the same rate as Europeans – if a little more than ten percent of those
11 National Transportation Statistics, 2000, Bureau of Transportation Statistics, U.S. Department of Transportation,April 2001, Table 1-31, p. 48.
12 American Public Transportation Association, Public Transportation Fact Book, 2001, Table 26, p. 66.
13 National Transportation, Statistics, ibid., Table 1-35, p. 56.
14 Making Transit Work: Insight from Western Europe, Canada and the United States, Transportation ResearchBoard, Committee for an International Comparison of National Policies and Expectations Affecting Public Transit,National Research Council, Special Report 257, Washington DC: 2001, p. 1
12
who currently use private automobiles shifted to public transportation, or everyone used publictransit for about ten percent of their daily travel needs -- the United States could be virtuallyenergy independent from Saudi Arabia. The energy savings at that level of public-transit usewould be equal to one-quarter of all energy use in the commercial sector in 2000.15
This report shows that if just five percent of Americans left their cars at home and usedpublic transportation, or if everyone used public transit five percent of the time, it would reduceCO pollution by more than all of the CO emitted by the chemical manufacturing sector and allmetal processing plants.16 If ten percent of Americans switched to public transit or everyoneused public transit for ten percent of their daily travel needs, the United States would achievemore than one-quarter of the CO2 reductions mandated by the Kyoto Treaty, without increasinggas taxes or imposing regulatory restrictions on business. It would also reduce NOx pollution bymore than the NOx produced by all industrial uses of coal, and produce environmental benefitsequivalent to more than all the VOCs emitted by the chemical manufacturers and all oil and gasproduction.17
At one time, such levels of transit use, or even greater, were common. In 1920, theaverage person in an American city used public transportation about 250 times a year.18 Thiswidespread reliance on public transport declined with the rapid increase in automobile ownershipin the 1940s and 1950s. With growing use of faster and more flexible means of privatetransportation, residential and commercial development spread farther from the establishedtransit lines along which center cities and many early suburbs had formed. Today, with localland use planning generally uncoordinated with regional transportation planning, developmentcontinues to unfold even farther from existing public transportation corridors.19
Achieving much greater energy savings and environmental benefits by significantlyincreasing the passenger loads of existing public transportation systems would require modestnew investments, at a much lower cost than would be required to produce comparable energyand environmental benefits by other means. Achieving a genuine measure of energyindependence and markedly cleaner air by raising our public transportation use to Europeanlevels would require significant financial commitments, as well as changes in other areas such asland-use planning and the way many public transportation systems operate. The long-term pricetag for substantially expanding the country’s public transportation infrastructure, especially railsystems, would be less than the cost of continuing to expand the country’s fleet of privatevehicles, build and maintain more roads and highways to accommodate them, and absorb the
15 Energy Information Administration, U.S. Department of Energy, www.eia.doe.gov/emeu/aer/txt/tab0201a.html.
16 Environmental Protection Agency, Appendix A, National Emissions (1970 to 1998) by Tier 3 Source Categoryand Pollutant, Table A.1, www.epa.gov/ttn/chief/trends98/appendix_a.pdf. See Table 21b below.
17 Ibid., Tables A.2 and A.3. See Tables 21a and 21c below.
18 Making Transit Work: Insight from Western Europe, Canada and the United States, op. cit., pp. 1-2.
19 Op. cit., pp. 3-10.
13
rising energy, environmental, and congestion costs of this approach. Given the limits and risksto our energy supply and the threats to the environment, relying for the long-term on private cars,SUVs, and light trucks for 99 percent of all daily transportation needs will be unsustainable.
* * *
14
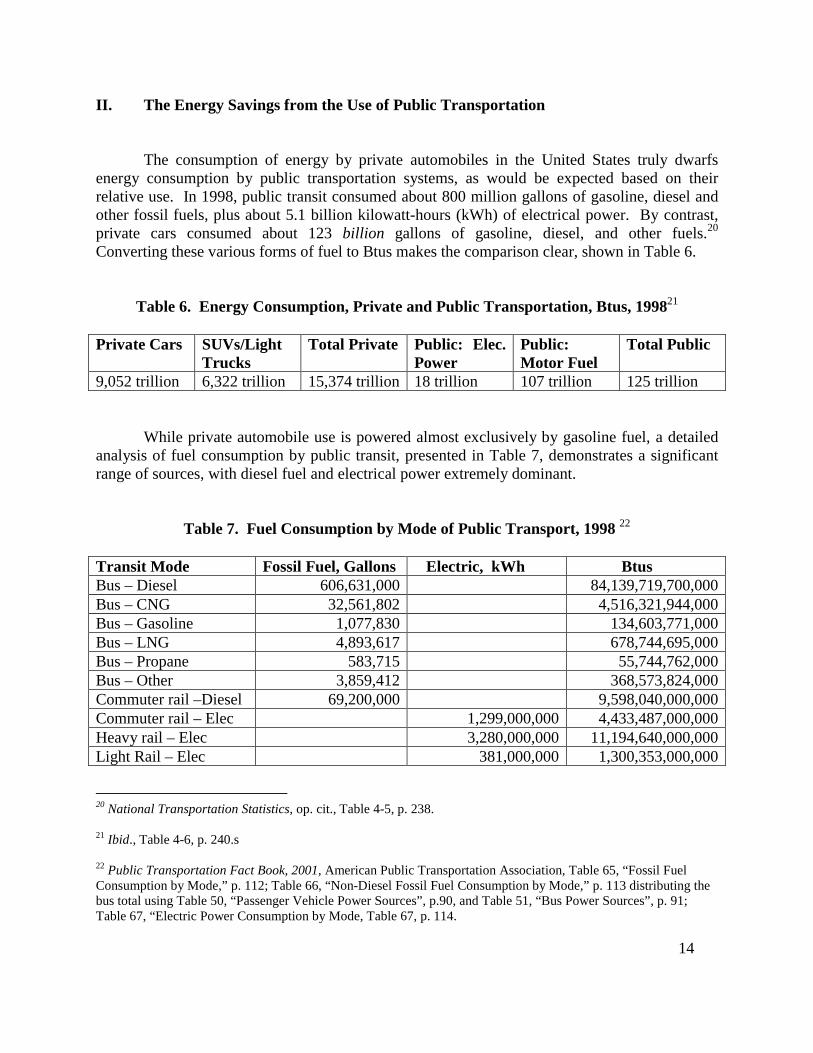
II. The Energy Savings from the Use of Public Transportation
The consumption of energy by private automobiles in the United States truly dwarfsenergy consumption by public transportation systems, as would be expected based on theirrelative use. In 1998, public transit consumed about 800 million gallons of gasoline, diesel andother fossil fuels, plus about 5.1 billion kilowatt-hours (kWh) of electrical power. By contrast,private cars consumed about 123 billion gallons of gasoline, diesel, and other fuels.20
Converting these various forms of fuel to Btus makes the comparison clear, shown in Table 6.
Table 6. Energy Consumption, Private and Public Transportation, Btus, 199821
Private Cars SUVs/LightTrucks
Total Private Public: Elec.Power
Public:Motor Fuel
Total Public
9,052 trillion 6,322 trillion 15,374 trillion 18 trillion 107 trillion 125 trillion
While private automobile use is powered almost exclusively by gasoline fuel, a detailedanalysis of fuel consumption by public transit, presented in Table 7, demonstrates a significantrange of sources, with diesel fuel and electrical power extremely dominant.
Table 7. Fuel Consumption by Mode of Public Transport, 1998 22
Transit Mode Fossil Fuel, Gallons Electric, kWh BtusBus – Diesel 606,631,000 84,139,719,700,000Bus – CNG 32,561,802 4,516,321,944,000Bus – Gasoline 1,077,830 134,603,771,000Bus – LNG 4,893,617 678,744,695,000Bus – Propane 583,715 55,744,762,000Bus – Other 3,859,412 368,573,824,000Commuter rail –Diesel 69,200,000 9,598,040,000,000Commuter rail – Elec 1,299,000,000 4,433,487,000,000Heavy rail – Elec 3,280,000,000 11,194,640,000,000Light Rail – Elec 381,000,000 1,300,353,000,000
20 National Transportation Statistics, op. cit., Table 4-5, p. 238.
21 Ibid., Table 4-6, p. 240.s
22 Public Transportation Fact Book, 2001, American Public Transportation Association, Table 65, “Fossil FuelConsumption by Mode,” p. 112; Table 66, “Non-Diesel Fossil Fuel Consumption by Mode,” p. 113 distributing thebus total using Table 50, “Passenger Vehicle Power Sources”, p.90, and Table 51, “Bus Power Sources”, p. 91;Table 67, “Electric Power Consumption by Mode, Table 67, p. 114.
15
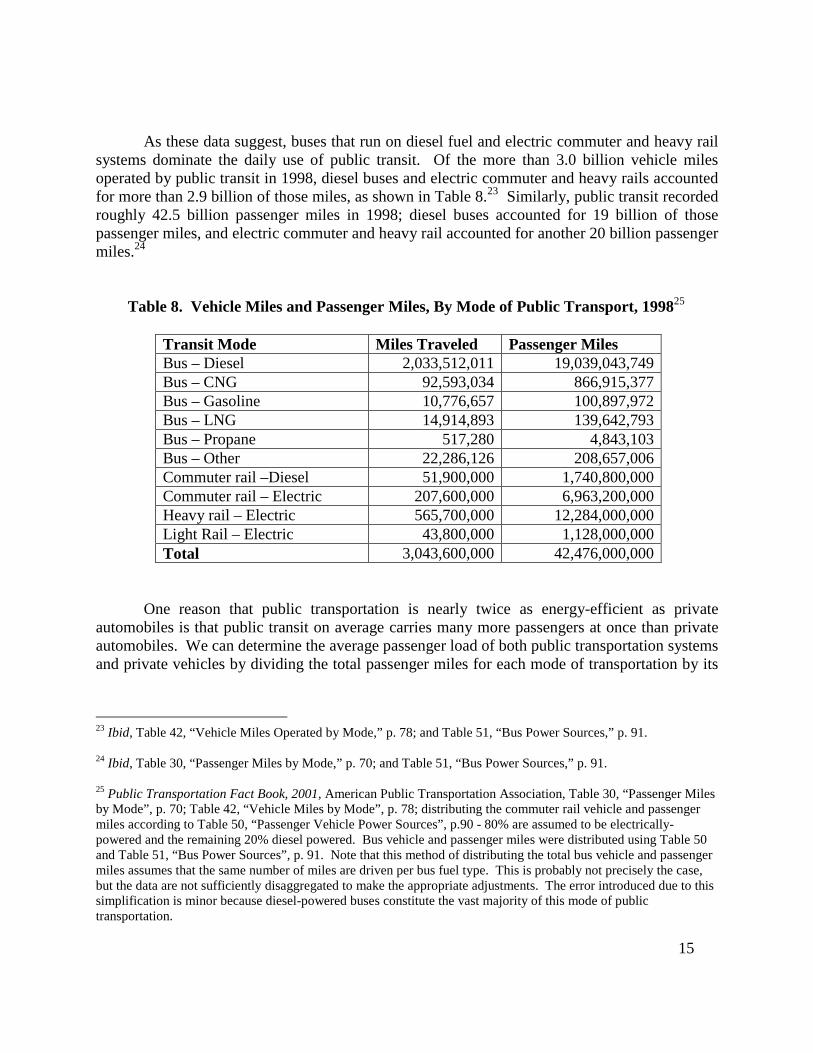
As these data suggest, buses that run on diesel fuel and electric commuter and heavy railsystems dominate the daily use of public transit. Of the more than 3.0 billion vehicle milesoperated by public transit in 1998, diesel buses and electric commuter and heavy rails accountedfor more than 2.9 billion of those miles, as shown in Table 8.23 Similarly, public transit recordedroughly 42.5 billion passenger miles in 1998; diesel buses accounted for 19 billion of thosepassenger miles, and electric commuter and heavy rail accounted for another 20 billion passengermiles.24
Table 8. Vehicle Miles and Passenger Miles, By Mode of Public Transport, 199825
Transit Mode Miles Traveled Passenger MilesBus – Diesel 2,033,512,011 19,039,043,749Bus – CNG 92,593,034 866,915,377Bus – Gasoline 10,776,657 100,897,972Bus – LNG 14,914,893 139,642,793Bus – Propane 517,280 4,843,103Bus – Other 22,286,126 208,657,006Commuter rail –Diesel 51,900,000 1,740,800,000Commuter rail – Electric 207,600,000 6,963,200,000Heavy rail – Electric 565,700,000 12,284,000,000Light Rail – Electric 43,800,000 1,128,000,000Total 3,043,600,000 42,476,000,000
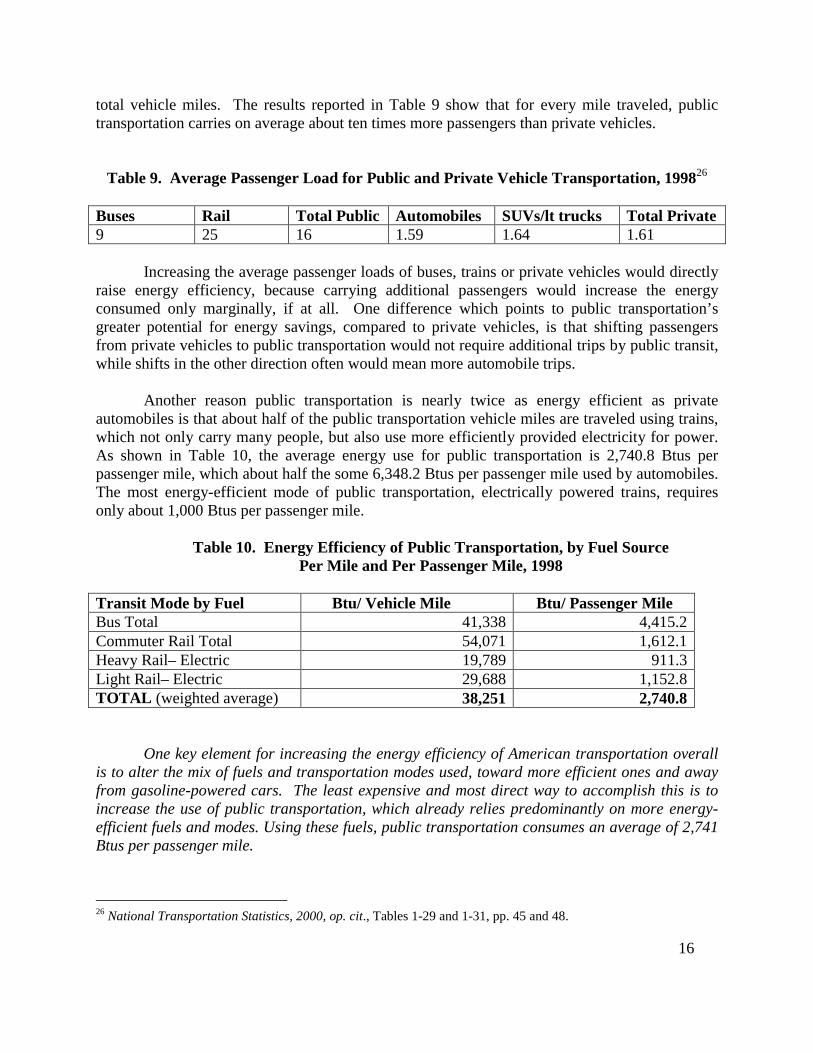
One reason that public transportation is nearly twice as energy-efficient as privateautomobiles is that public transit on average carries many more passengers at once than privateautomobiles. We can determine the average passenger load of both public transportation systemsand private vehicles by dividing the total passenger miles for each mode of transportation by its
23 Ibid, Table 42, “Vehicle Miles Operated by Mode,” p. 78; and Table 51, “Bus Power Sources,” p. 91.
24 Ibid, Table 30, “Passenger Miles by Mode,” p. 70; and Table 51, “Bus Power Sources,” p. 91.
25 Public Transportation Fact Book, 2001, American Public Transportation Association, Table 30, “Passenger Milesby Mode”, p. 70; Table 42, “Vehicle Miles by Mode”, p. 78; distributing the commuter rail vehicle and passengermiles according to Table 50, “Passenger Vehicle Power Sources”, p.90 - 80% are assumed to be electrically-powered and the remaining 20% diesel powered. Bus vehicle and passenger miles were distributed using Table 50and Table 51, “Bus Power Sources”, p. 91. Note that this method of distributing the total bus vehicle and passengermiles assumes that the same number of miles are driven per bus fuel type. This is probably not precisely the case,but the data are not sufficiently disaggregated to make the appropriate adjustments. The error introduced due to thissimplification is minor because diesel-powered buses constitute the vast majority of this mode of publictransportation.
16
total vehicle miles. The results reported in Table 9 show that for every mile traveled, publictransportation carries on average about ten times more passengers than private vehicles.
Table 9. Average Passenger Load for Public and Private Vehicle Transportation, 199826
Buses Rail Total Public Automobiles SUVs/lt trucks Total Private9 25 16 1.59 1.64 1.61
Increasing the average passenger loads of buses, trains or private vehicles would directlyraise energy efficiency, because carrying additional passengers would increase the energyconsumed only marginally, if at all. One difference which points to public transportation’sgreater potential for energy savings, compared to private vehicles, is that shifting passengersfrom private vehicles to public transportation would not require additional trips by public transit,while shifts in the other direction often would mean more automobile trips.
Another reason public transportation is nearly twice as energy efficient as privateautomobiles is that about half of the public transportation vehicle miles are traveled using trains,which not only carry many people, but also use more efficiently provided electricity for power.As shown in Table 10, the average energy use for public transportation is 2,740.8 Btus perpassenger mile, which about half the some 6,348.2 Btus per passenger mile used by automobiles.The most energy-efficient mode of public transportation, electrically powered trains, requiresonly about 1,000 Btus per passenger mile.
Table 10. Energy Efficiency of Public Transportation, by Fuel SourcePer Mile and Per Passenger Mile, 1998
Transit Mode by Fuel Btu/ Vehicle Mile Btu/ Passenger MileBus Total 41,338 4,415.2Commuter Rail Total 54,071 1,612.1Heavy Rail– Electric 19,789 911.3Light Rail– Electric 29,688 1,152.8TOTAL (weighted average) 38,251 2,740.8
One key element for increasing the energy efficiency of American transportation overallis to alter the mix of fuels and transportation modes used, toward more efficient ones and awayfrom gasoline-powered cars. The least expensive and most direct way to accomplish this is toincrease the use of public transportation, which already relies predominantly on more energy-efficient fuels and modes. Using these fuels, public transportation consumes an average of 2,741Btus per passenger mile.
26 National Transportation Statistics, 2000, op. cit., Tables 1-29 and 1-31, pp. 45 and 48.
17
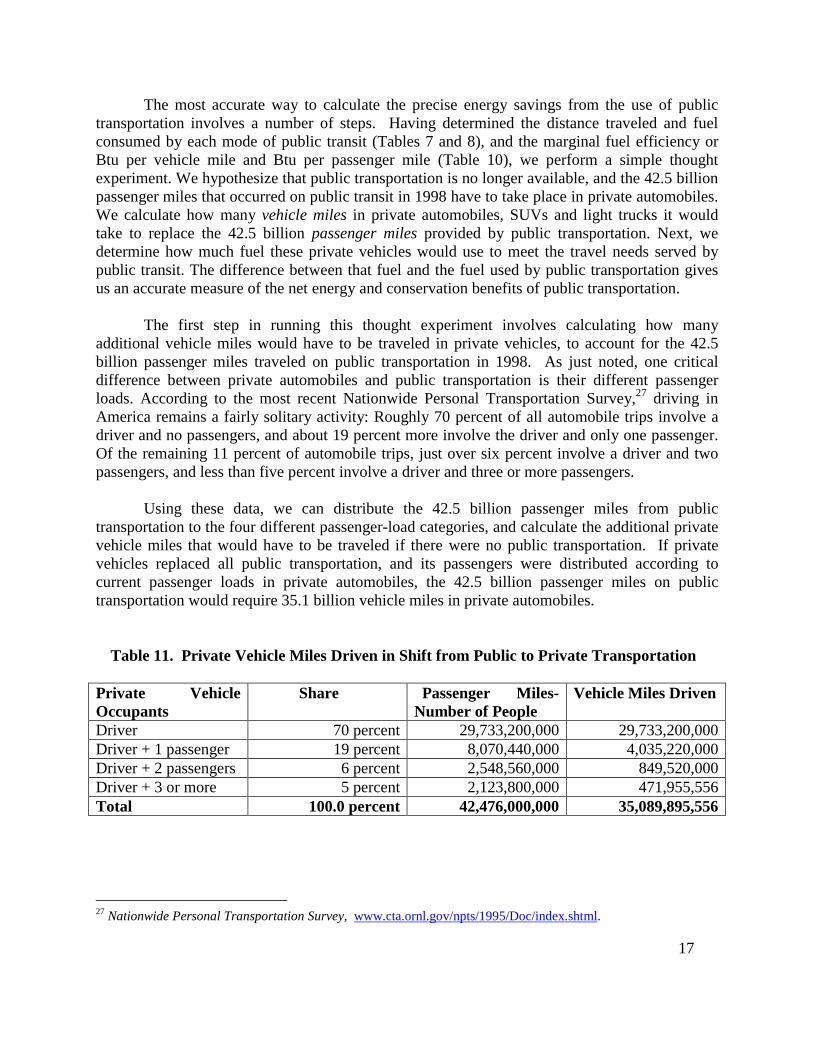
The most accurate way to calculate the precise energy savings from the use of publictransportation involves a number of steps. Having determined the distance traveled and fuelconsumed by each mode of public transit (Tables 7 and 8), and the marginal fuel efficiency orBtu per vehicle mile and Btu per passenger mile (Table 10), we perform a simple thoughtexperiment. We hypothesize that public transportation is no longer available, and the 42.5 billionpassenger miles that occurred on public transit in 1998 have to take place in private automobiles.We calculate how many vehicle miles in private automobiles, SUVs and light trucks it wouldtake to replace the 42.5 billion passenger miles provided by public transportation. Next, wedetermine how much fuel these private vehicles would use to meet the travel needs served bypublic transit. The difference between that fuel and the fuel used by public transportation givesus an accurate measure of the net energy and conservation benefits of public transportation.
The first step in running this thought experiment involves calculating how manyadditional vehicle miles would have to be traveled in private vehicles, to account for the 42.5billion passenger miles traveled on public transportation in 1998. As just noted, one criticaldifference between private automobiles and public transportation is their different passengerloads. According to the most recent Nationwide Personal Transportation Survey,27 driving inAmerica remains a fairly solitary activity: Roughly 70 percent of all automobile trips involve adriver and no passengers, and about 19 percent more involve the driver and only one passenger.Of the remaining 11 percent of automobile trips, just over six percent involve a driver and twopassengers, and less than five percent involve a driver and three or more passengers.
Using these data, we can distribute the 42.5 billion passenger miles from publictransportation to the four different passenger-load categories, and calculate the additional privatevehicle miles that would have to be traveled if there were no public transportation. If privatevehicles replaced all public transportation, and its passengers were distributed according tocurrent passenger loads in private automobiles, the 42.5 billion passenger miles on publictransportation would require 35.1 billion vehicle miles in private automobiles.
Table 11. Private Vehicle Miles Driven in Shift from Public to Private Transportation
Private VehicleOccupants
Share Passenger Miles-Number of People
Vehicle Miles Driven
Driver 70 percent 29,733,200,000 29,733,200,000Driver + 1 passenger 19 percent 8,070,440,000 4,035,220,000Driver + 2 passengers 6 percent 2,548,560,000 849,520,000Driver + 3 or more 5 percent 2,123,800,000 471,955,556Total 100.0 percent 42,476,000,000 35,089,895,556
27 Nationwide Personal Transportation Survey, www.cta.ornl.gov/npts/1995/Doc/index.shtml.
18
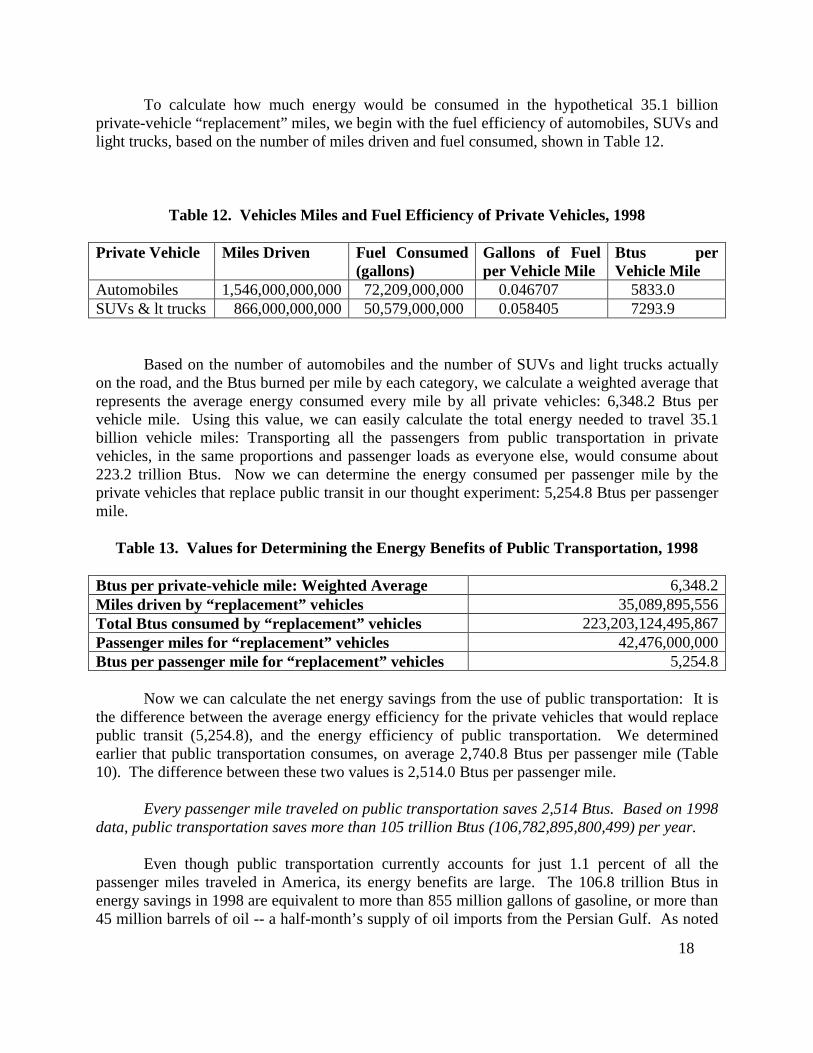
To calculate how much energy would be consumed in the hypothetical 35.1 billionprivate-vehicle “replacement” miles, we begin with the fuel efficiency of automobiles, SUVs andlight trucks, based on the number of miles driven and fuel consumed, shown in Table 12.
Table 12. Vehicles Miles and Fuel Efficiency of Private Vehicles, 1998
Private Vehicle Miles Driven Fuel Consumed(gallons)
Gallons of Fuelper Vehicle Mile
Btus perVehicle Mile
Automobiles 1,546,000,000,000 72,209,000,000 0.046707 5833.0SUVs & lt trucks 866,000,000,000 50,579,000,000 0.058405 7293.9
Based on the number of automobiles and the number of SUVs and light trucks actuallyon the road, and the Btus burned per mile by each category, we calculate a weighted average thatrepresents the average energy consumed every mile by all private vehicles: 6,348.2 Btus pervehicle mile. Using this value, we can easily calculate the total energy needed to travel 35.1billion vehicle miles: Transporting all the passengers from public transportation in privatevehicles, in the same proportions and passenger loads as everyone else, would consume about223.2 trillion Btus. Now we can determine the energy consumed per passenger mile by theprivate vehicles that replace public transit in our thought experiment: 5,254.8 Btus per passengermile.
Table 13. Values for Determining the Energy Benefits of Public Transportation, 1998
Btus per private-vehicle mile: Weighted Average 6,348.2Miles driven by “replacement” vehicles 35,089,895,556Total Btus consumed by “replacement” vehicles 223,203,124,495,867Passenger miles for “replacement” vehicles 42,476,000,000Btus per passenger mile for “replacement” vehicles 5,254.8
Now we can calculate the net energy savings from the use of public transportation: It isthe difference between the average energy efficiency for the private vehicles that would replacepublic transit (5,254.8), and the energy efficiency of public transportation. We determinedearlier that public transportation consumes, on average 2,740.8 Btus per passenger mile (Table10). The difference between these two values is 2,514.0 Btus per passenger mile.
Every passenger mile traveled on public transportation saves 2,514 Btus. Based on 1998data, public transportation saves more than 105 trillion Btus (106,782,895,800,499) per year.
Even though public transportation currently accounts for just 1.1 percent of all thepassenger miles traveled in America, its energy benefits are large. The 106.8 trillion Btus inenergy savings in 1998 are equivalent to more than 855 million gallons of gasoline, or more than45 million barrels of oil -- a half-month’s supply of oil imports from the Persian Gulf. As noted
19
earlier, the energy savings by 1999 amounted to the equivalent of almost 890 million gallons ofgasoline or nearly 47 million barrels of oil.
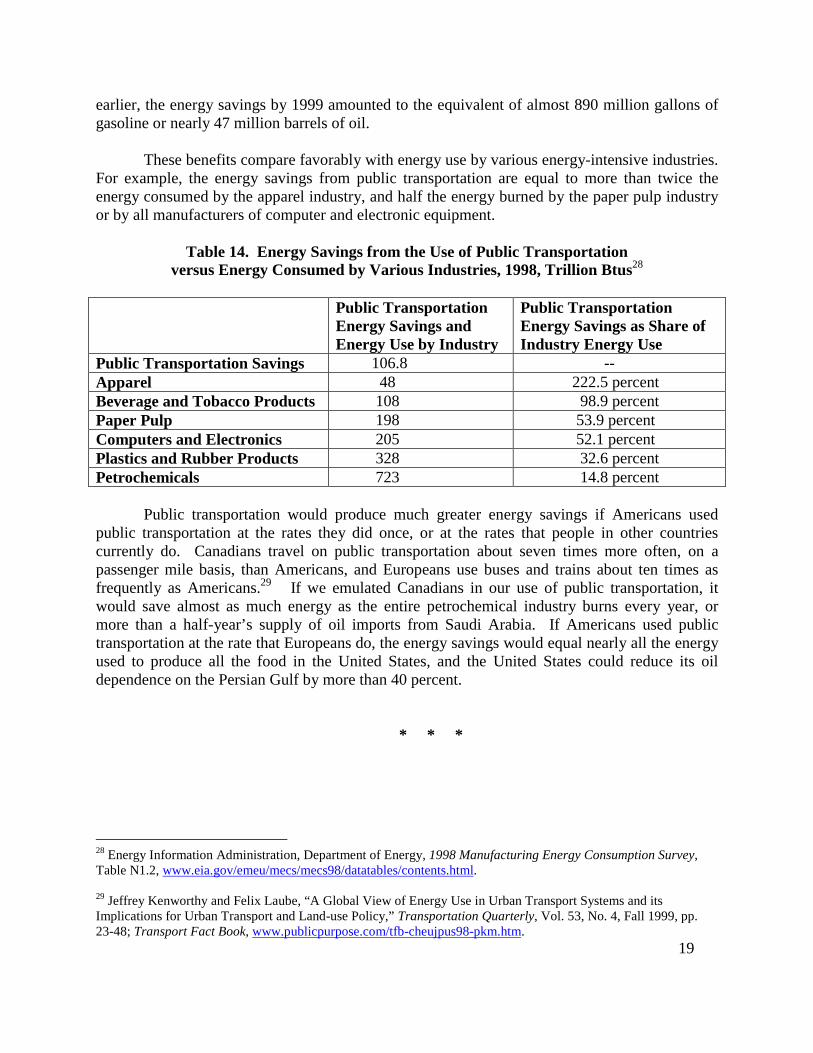
These benefits compare favorably with energy use by various energy-intensive industries.For example, the energy savings from public transportation are equal to more than twice theenergy consumed by the apparel industry, and half the energy burned by the paper pulp industryor by all manufacturers of computer and electronic equipment.
Table 14. Energy Savings from the Use of Public Transportationversus Energy Consumed by Various Industries, 1998, Trillion Btus28
Public TransportationEnergy Savings andEnergy Use by Industry
Public TransportationEnergy Savings as Share ofIndustry Energy Use
Public Transportation Savings 106.8 --Apparel 48 222.5 percentBeverage and Tobacco Products 108 98.9 percentPaper Pulp 198 53.9 percentComputers and Electronics 205 52.1 percentPlastics and Rubber Products 328 32.6 percentPetrochemicals 723 14.8 percent
Public transportation would produce much greater energy savings if Americans usedpublic transportation at the rates they did once, or at the rates that people in other countriescurrently do. Canadians travel on public transportation about seven times more often, on apassenger mile basis, than Americans, and Europeans use buses and trains about ten times asfrequently as Americans.29 If we emulated Canadians in our use of public transportation, itwould save almost as much energy as the entire petrochemical industry burns every year, ormore than a half-year’s supply of oil imports from Saudi Arabia. If Americans used publictransportation at the rate that Europeans do, the energy savings would equal nearly all the energyused to produce all the food in the United States, and the United States could reduce its oildependence on the Persian Gulf by more than 40 percent.
* * *
28 Energy Information Administration, Department of Energy, 1998 Manufacturing Energy Consumption Survey,Table N1.2, www.eia.gov/emeu/mecs/mecs98/datatables/contents.html.
29 Jeffrey Kenworthy and Felix Laube, “A Global View of Energy Use in Urban Transport Systems and itsImplications for Urban Transport and Land-use Policy,” Transportation Quarterly, Vol. 53, No. 4, Fall 1999, pp.23-48; Transport Fact Book, www.publicpurpose.com/tfb-cheujpus98-pkm.htm.
20
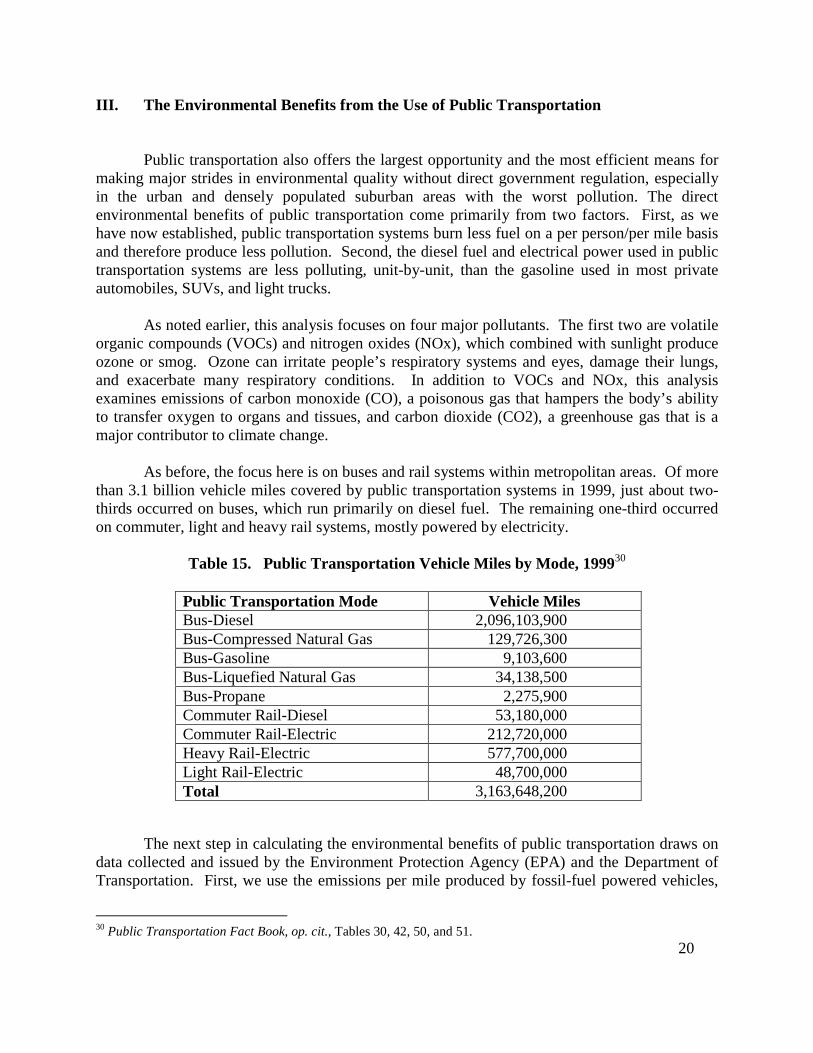
III. The Environmental Benefits from the Use of Public Transportation
Public transportation also offers the largest opportunity and the most efficient means formaking major strides in environmental quality without direct government regulation, especiallyin the urban and densely populated suburban areas with the worst pollution. The directenvironmental benefits of public transportation come primarily from two factors. First, as wehave now established, public transportation systems burn less fuel on a per person/per mile basisand therefore produce less pollution. Second, the diesel fuel and electrical power used in publictransportation systems are less polluting, unit-by-unit, than the gasoline used in most privateautomobiles, SUVs, and light trucks.
As noted earlier, this analysis focuses on four major pollutants. The first two are volatileorganic compounds (VOCs) and nitrogen oxides (NOx), which combined with sunlight produceozone or smog. Ozone can irritate people’s respiratory systems and eyes, damage their lungs,and exacerbate many respiratory conditions. In addition to VOCs and NOx, this analysisexamines emissions of carbon monoxide (CO), a poisonous gas that hampers the body’s abilityto transfer oxygen to organs and tissues, and carbon dioxide (CO2), a greenhouse gas that is amajor contributor to climate change.
As before, the focus here is on buses and rail systems within metropolitan areas. Of morethan 3.1 billion vehicle miles covered by public transportation systems in 1999, just about two-thirds occurred on buses, which run primarily on diesel fuel. The remaining one-third occurredon commuter, light and heavy rail systems, mostly powered by electricity.
Table 15. Public Transportation Vehicle Miles by Mode, 199930
Public Transportation Mode Vehicle MilesBus-Diesel 2,096,103,900Bus-Compressed Natural Gas 129,726,300Bus-Gasoline 9,103,600Bus-Liquefied Natural Gas 34,138,500Bus-Propane 2,275,900Commuter Rail-Diesel 53,180,000Commuter Rail-Electric 212,720,000Heavy Rail-Electric 577,700,000Light Rail-Electric 48,700,000Total 3,163,648,200
The next step in calculating the environmental benefits of public transportation draws ondata collected and issued by the Environment Protection Agency (EPA) and the Department ofTransportation. First, we use the emissions per mile produced by fossil-fuel powered vehicles,
30 Public Transportation Fact Book, op. cit., Tables 30, 42, 50, and 51.

21
including buses and diesel-powered trains. Diesel-powered rail systems produce roughly fourtimes as much emissions per mile as diesel buses, only because they require much larger enginesto carry many more passengers.
Table 16a. Emissions by Buses and Diesel-Powered Trains, Grams/Vehicle Mile, 199931
Volatile OrganicCompounds (VOCs)
CarbonMonoxide (CO)
Nitrogen Oxides(NOx)
Carbon Dioxide(CO2)
Buses 2.3 11.6 11.9 2,386.9Diesel Rail 9.2 47.6 48.8 9,771.0
Next, we calculate the emissions produced by electricity-powered rail systems, in gramsper million-kilowatt-hour (MKWH). We start with all the pollution in grams produced byelectric utilities, divide that by the million-kilowatt-hours generated by utilities, to arrive atelectric utility pollution in grams/MKWH, and multiply that result by the million-kilowatt-hoursused by public rail systems. The result is presented in Table 16b:
Table 16b. Emissions by Electricity-Powered Rail Systems, Grams/MKWH, 199932
VOCs CO NOx CO2 137,987 1,772,125 17,365 618,499,055
Now, we can easily calculate the total pollution produced by public transportation in1999: It is the sum of the emissions per-vehicle-mile in grams for fossil-fuel powered systems(Table 16a), times the vehicle miles traveled by these systems (Table 15), plus the emissions per-vehicle-mile for electrically-powered systems, in grams per MKWH (Table 16b), times theMKWH of electricity consumed by these public transit systems. The results have beenconverted to a common measure, metric tons, and presented in Table 17:
31 Data for VOCs, CO and NOx emissions by buses from National Transportation Statistics, op. cit., Table 4-38.Data for CO2 emission by buses scaled from car emissions, in “Emission Facts: Average Annual Emissions andFuel Consumption for Passenger Cars and Light Trucks,” U.S. Environmental Protection Agency, Office of Air andRadiation, Office of Transportation and Air Quality, EPA 420-F-00-013, April 2000. Scaling based on relative fuelefficiencies for buses and automobiles; see National Transportation Statistics, op. cit., Tables 4-22 and 4-24. Datafor diesel-driven trains derived by scaling bus emission factors by fuel use per mile; see Public Transportation FactBook, op. cit., Tables 42, 65.
32 Electricity production: Department of Energy, Electric Power Annual, 1999; emissions for all pollutants exceptcarbon dioxide: Environmental Protection Agency, National Pollutant Emission Estimates for 1999, Clearinghousefor Inventories and Emissions Factors, www.epa.gov/ttn/chiief/trends99/Tier3_1999EmisFeb5_forWeb.xls. Carbondioxide emissions: www.epa.gov/globalwarming/emissions/national/CO2.html, paragraphs after Table ES-15. Notethat sulfur dioxide (SO2) emissions are not included, because total SO2 emissions are capped nationally.
22
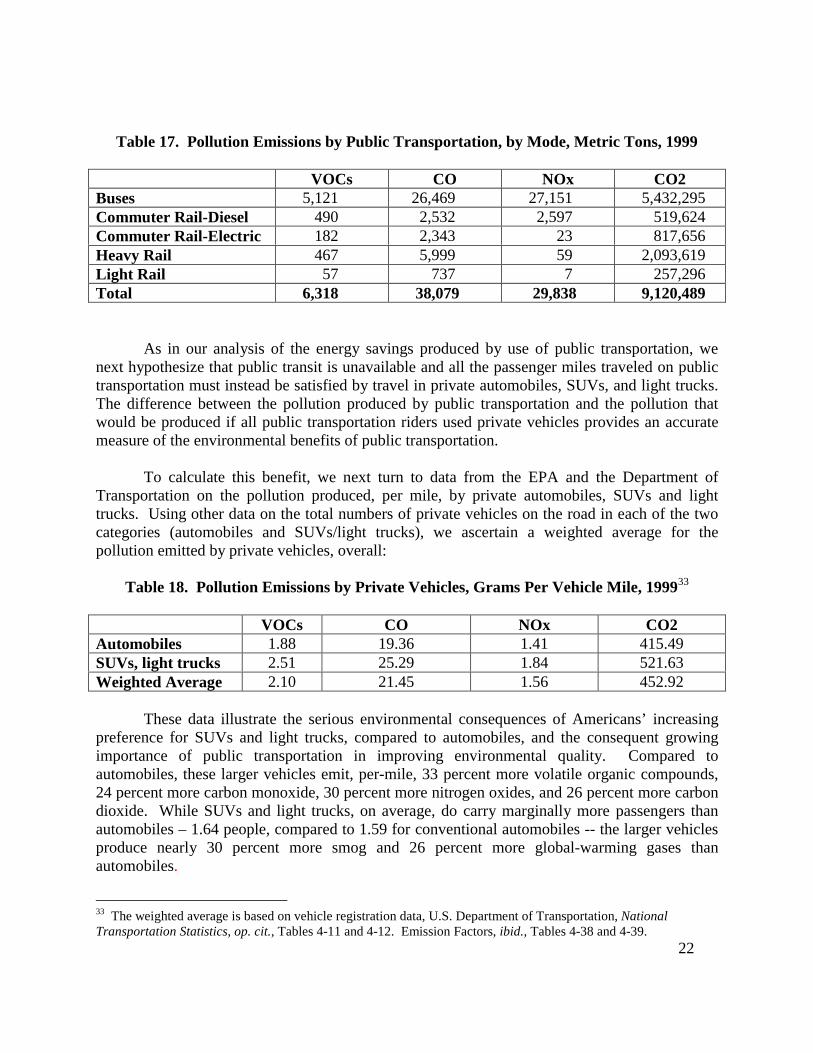
Table 17. Pollution Emissions by Public Transportation, by Mode, Metric Tons, 1999
VOCs CO NOx CO2Buses 5,121 26,469 27,151 5,432,295Commuter Rail-Diesel 490 2,532 2,597 519,624Commuter Rail-Electric 182 2,343 23 817,656Heavy Rail 467 5,999 59 2,093,619Light Rail 57 737 7 257,296Total 6,318 38,079 29,838 9,120,489
As in our analysis of the energy savings produced by use of public transportation, wenext hypothesize that public transit is unavailable and all the passenger miles traveled on publictransportation must instead be satisfied by travel in private automobiles, SUVs, and light trucks.The difference between the pollution produced by public transportation and the pollution thatwould be produced if all public transportation riders used private vehicles provides an accuratemeasure of the environmental benefits of public transportation.
To calculate this benefit, we next turn to data from the EPA and the Department ofTransportation on the pollution produced, per mile, by private automobiles, SUVs and lighttrucks. Using other data on the total numbers of private vehicles on the road in each of the twocategories (automobiles and SUVs/light trucks), we ascertain a weighted average for thepollution emitted by private vehicles, overall:
Table 18. Pollution Emissions by Private Vehicles, Grams Per Vehicle Mile, 199933
VOCs CO NOx CO2Automobiles 1.88 19.36 1.41 415.49SUVs, light trucks 2.51 25.29 1.84 521.63Weighted Average 2.10 21.45 1.56 452.92
These data illustrate the serious environmental consequences of Americans’ increasingpreference for SUVs and light trucks, compared to automobiles, and the consequent growingimportance of public transportation in improving environmental quality. Compared toautomobiles, these larger vehicles emit, per-mile, 33 percent more volatile organic compounds,24 percent more carbon monoxide, 30 percent more nitrogen oxides, and 26 percent more carbondioxide. While SUVs and light trucks, on average, do carry marginally more passengers thanautomobiles – 1.64 people, compared to 1.59 for conventional automobiles -- the larger vehiclesproduce nearly 30 percent more smog and 26 percent more global-warming gases thanautomobiles.
33 The weighted average is based on vehicle registration data, U.S. Department of Transportation, NationalTransportation Statistics, op. cit., Tables 4-11 and 4-12. Emission Factors, ibid., Tables 4-38 and 4-39.
23
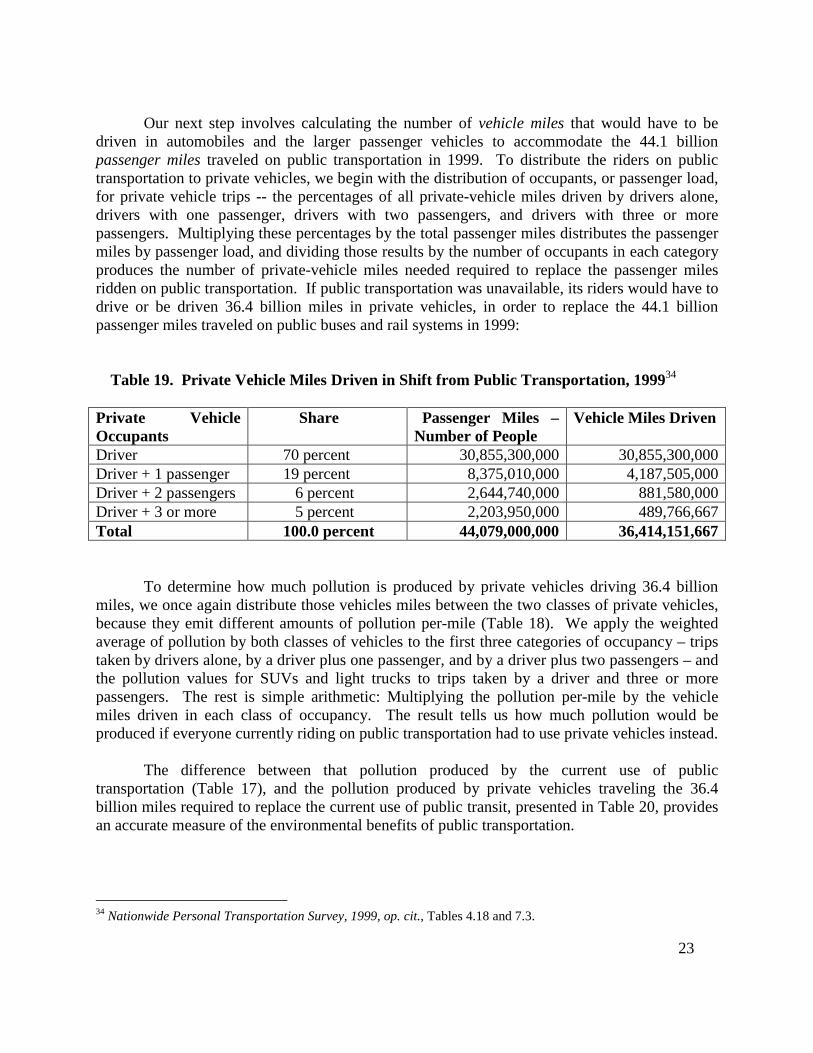
Our next step involves calculating the number of vehicle miles that would have to bedriven in automobiles and the larger passenger vehicles to accommodate the 44.1 billionpassenger miles traveled on public transportation in 1999. To distribute the riders on publictransportation to private vehicles, we begin with the distribution of occupants, or passenger load,for private vehicle trips -- the percentages of all private-vehicle miles driven by drivers alone,drivers with one passenger, drivers with two passengers, and drivers with three or morepassengers. Multiplying these percentages by the total passenger miles distributes the passengermiles by passenger load, and dividing those results by the number of occupants in each categoryproduces the number of private-vehicle miles needed required to replace the passenger milesridden on public transportation. If public transportation was unavailable, its riders would have todrive or be driven 36.4 billion miles in private vehicles, in order to replace the 44.1 billionpassenger miles traveled on public buses and rail systems in 1999:
Table 19. Private Vehicle Miles Driven in Shift from Public Transportation, 199934
Private VehicleOccupants
Share Passenger Miles –Number of People
Vehicle Miles Driven
Driver 70 percent 30,855,300,000 30,855,300,000Driver + 1 passenger 19 percent 8,375,010,000 4,187,505,000Driver + 2 passengers 6 percent 2,644,740,000 881,580,000Driver + 3 or more 5 percent 2,203,950,000 489,766,667Total 100.0 percent 44,079,000,000 36,414,151,667
To determine how much pollution is produced by private vehicles driving 36.4 billionmiles, we once again distribute those vehicles miles between the two classes of private vehicles,because they emit different amounts of pollution per-mile (Table 18). We apply the weightedaverage of pollution by both classes of vehicles to the first three categories of occupancy – tripstaken by drivers alone, by a driver plus one passenger, and by a driver plus two passengers – andthe pollution values for SUVs and light trucks to trips taken by a driver and three or morepassengers. The rest is simple arithmetic: Multiplying the pollution per-mile by the vehiclemiles driven in each class of occupancy. The result tells us how much pollution would beproduced if everyone currently riding on public transportation had to use private vehicles instead.
The difference between that pollution produced by the current use of publictransportation (Table 17), and the pollution produced by private vehicles traveling the 36.4billion miles required to replace the current use of public transit, presented in Table 20, providesan accurate measure of the environmental benefits of public transportation.
34 Nationwide Personal Transportation Survey, 1999, op. cit., Tables 4.18 and 7.3.
24
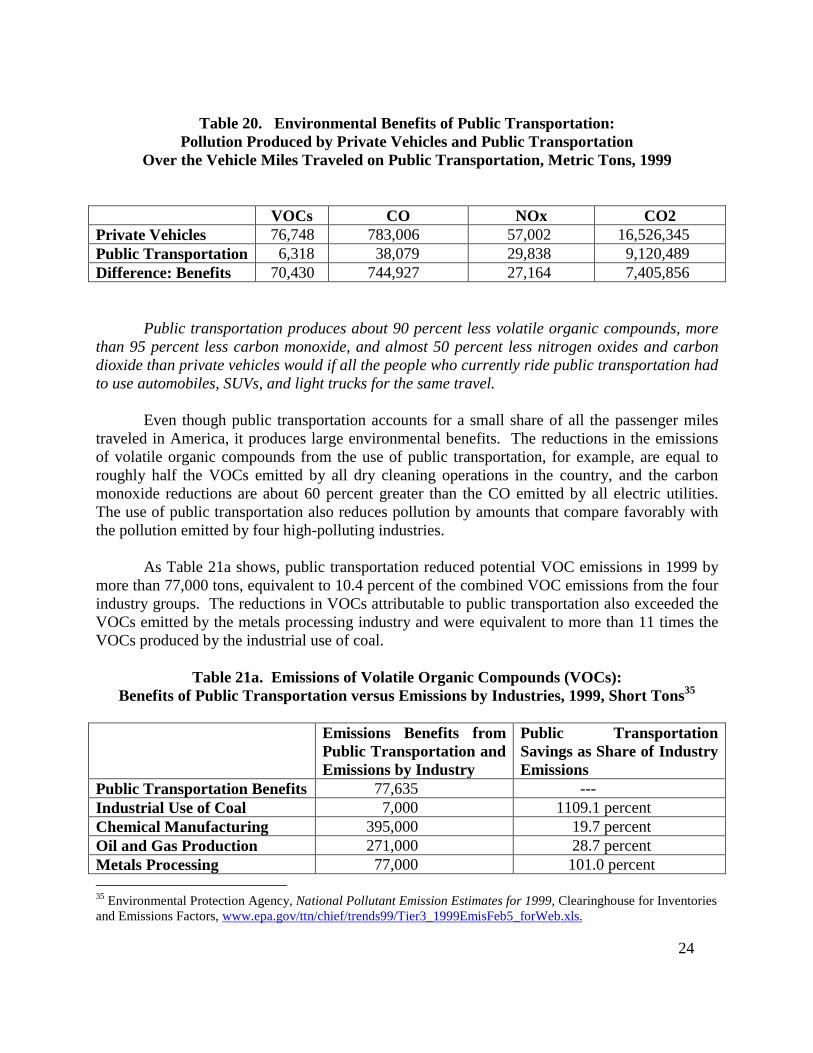
Table 20. Environmental Benefits of Public Transportation:Pollution Produced by Private Vehicles and Public Transportation
Over the Vehicle Miles Traveled on Public Transportation, Metric Tons, 1999
VOCs CO NOx CO2Private Vehicles 76,748 783,006 57,002 16,526,345Public Transportation 6,318 38,079 29,838 9,120,489Difference: Benefits 70,430 744,927 27,164 7,405,856
Public transportation produces about 90 percent less volatile organic compounds, morethan 95 percent less carbon monoxide, and almost 50 percent less nitrogen oxides and carbondioxide than private vehicles would if all the people who currently ride public transportation hadto use automobiles, SUVs, and light trucks for the same travel.
Even though public transportation accounts for a small share of all the passenger milestraveled in America, it produces large environmental benefits. The reductions in the emissionsof volatile organic compounds from the use of public transportation, for example, are equal toroughly half the VOCs emitted by all dry cleaning operations in the country, and the carbonmonoxide reductions are about 60 percent greater than the CO emitted by all electric utilities.The use of public transportation also reduces pollution by amounts that compare favorably withthe pollution emitted by four high-polluting industries.
As Table 21a shows, public transportation reduced potential VOC emissions in 1999 bymore than 77,000 tons, equivalent to 10.4 percent of the combined VOC emissions from the fourindustry groups. The reductions in VOCs attributable to public transportation also exceeded theVOCs emitted by the metals processing industry and were equivalent to more than 11 times theVOCs produced by the industrial use of coal.
Table 21a. Emissions of Volatile Organic Compounds (VOCs):Benefits of Public Transportation versus Emissions by Industries, 1999, Short Tons35
Emissions Benefits fromPublic Transportation andEmissions by Industry
Public TransportationSavings as Share of IndustryEmissions
Public Transportation Benefits 77,635 ---Industrial Use of Coal 7,000 1109.1 percentChemical Manufacturing 395,000 19.7 percentOil and Gas Production 271,000 28.7 percentMetals Processing 77,000 101.0 percent 35 Environmental Protection Agency, National Pollutant Emission Estimates for 1999, Clearinghouse for Inventoriesand Emissions Factors, www.epa.gov/ttn/chief/trends99/Tier3_1999EmisFeb5_forWeb.xls.
25
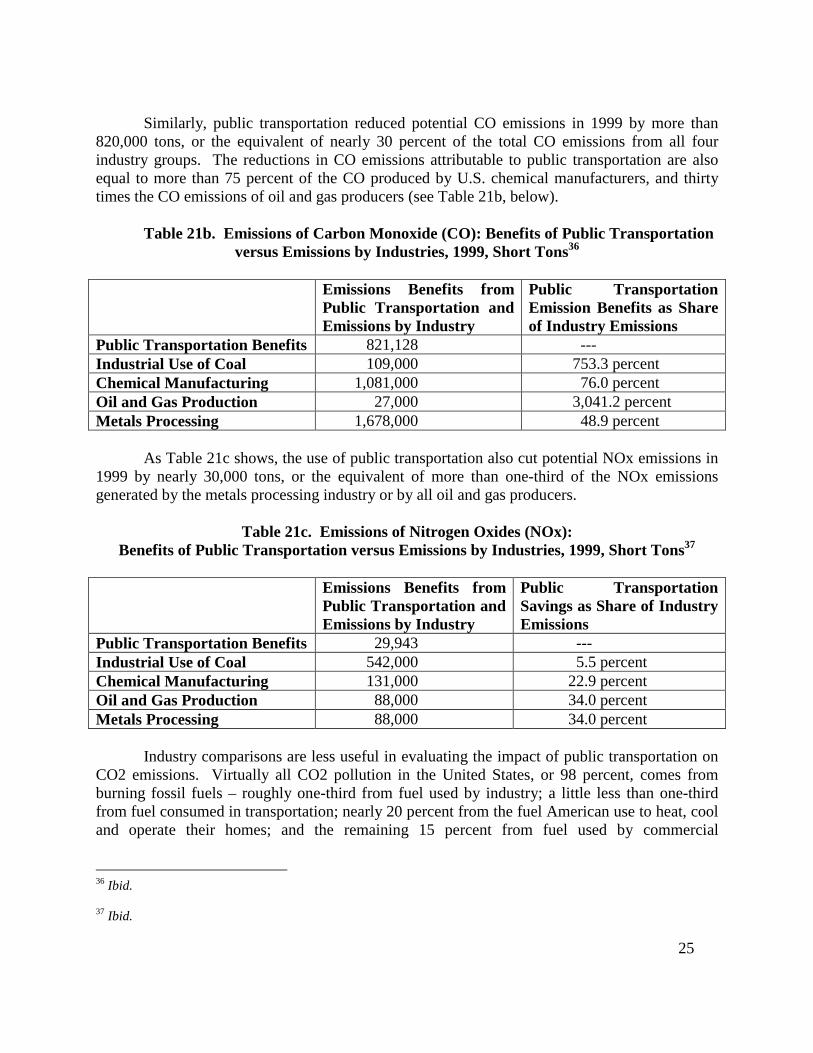
Similarly, public transportation reduced potential CO emissions in 1999 by more than820,000 tons, or the equivalent of nearly 30 percent of the total CO emissions from all fourindustry groups. The reductions in CO emissions attributable to public transportation are alsoequal to more than 75 percent of the CO produced by U.S. chemical manufacturers, and thirtytimes the CO emissions of oil and gas producers (see Table 21b, below).
Table 21b. Emissions of Carbon Monoxide (CO): Benefits of Public Transportationversus Emissions by Industries, 1999, Short Tons36
Emissions Benefits fromPublic Transportation andEmissions by Industry
Public TransportationEmission Benefits as Shareof Industry Emissions
Public Transportation Benefits 821,128 ---Industrial Use of Coal 109,000 753.3 percentChemical Manufacturing 1,081,000 76.0 percentOil and Gas Production 27,000 3,041.2 percentMetals Processing 1,678,000 48.9 percent
As Table 21c shows, the use of public transportation also cut potential NOx emissions in1999 by nearly 30,000 tons, or the equivalent of more than one-third of the NOx emissionsgenerated by the metals processing industry or by all oil and gas producers.
Table 21c. Emissions of Nitrogen Oxides (NOx):Benefits of Public Transportation versus Emissions by Industries, 1999, Short Tons37
Emissions Benefits fromPublic Transportation andEmissions by Industry
Public TransportationSavings as Share of IndustryEmissions
Public Transportation Benefits 29,943 ---Industrial Use of Coal 542,000 5.5 percentChemical Manufacturing 131,000 22.9 percentOil and Gas Production 88,000 34.0 percentMetals Processing 88,000 34.0 percent
Industry comparisons are less useful in evaluating the impact of public transportation onCO2 emissions. Virtually all CO2 pollution in the United States, or 98 percent, comes fromburning fossil fuels – roughly one-third from fuel used by industry; a little less than one-thirdfrom fuel consumed in transportation; nearly 20 percent from the fuel American use to heat, cooland operate their homes; and the remaining 15 percent from fuel used by commercial
36 Ibid.
37 Ibid.
26
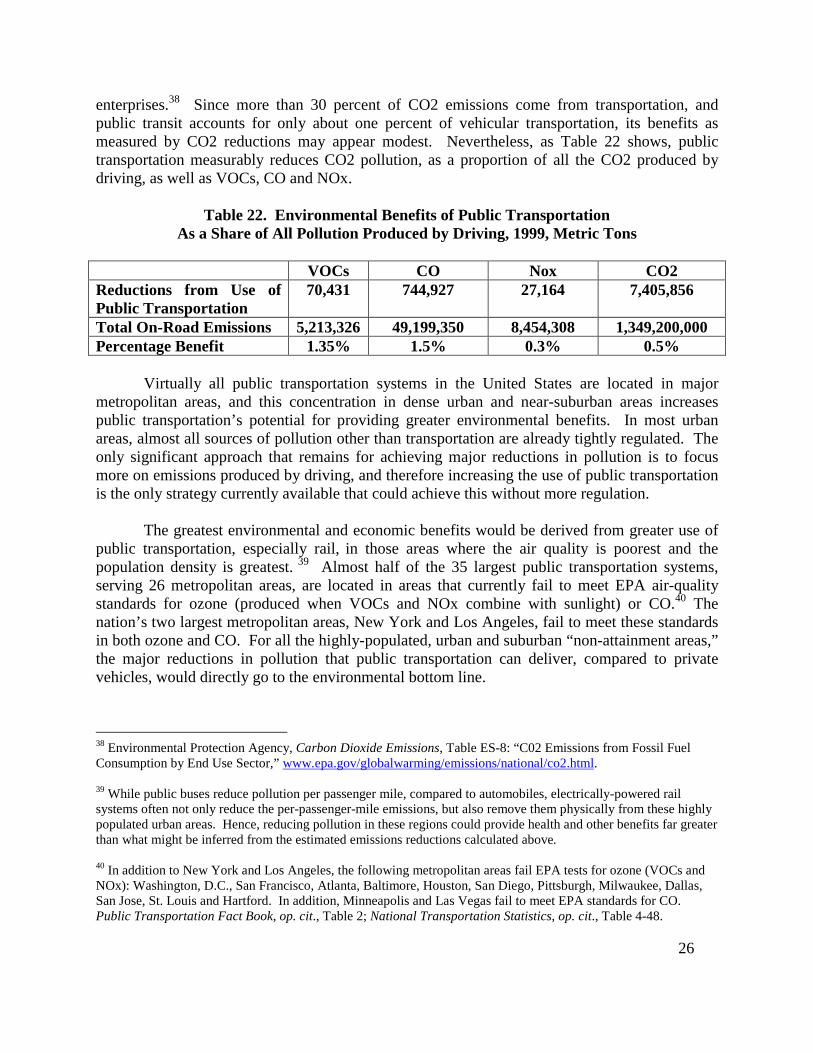
enterprises.38 Since more than 30 percent of CO2 emissions come from transportation, andpublic transit accounts for only about one percent of vehicular transportation, its benefits asmeasured by CO2 reductions may appear modest. Nevertheless, as Table 22 shows, publictransportation measurably reduces CO2 pollution, as a proportion of all the CO2 produced bydriving, as well as VOCs, CO and NOx.
Table 22. Environmental Benefits of Public TransportationAs a Share of All Pollution Produced by Driving, 1999, Metric Tons
VOCs CO Nox CO2Reductions from Use ofPublic Transportation
70,431 744,927 27,164 7,405,856
Total On-Road Emissions 5,213,326 49,199,350 8,454,308 1,349,200,000Percentage Benefit 1.35% 1.5% 0.3% 0.5%
Virtually all public transportation systems in the United States are located in majormetropolitan areas, and this concentration in dense urban and near-suburban areas increasespublic transportation’s potential for providing greater environmental benefits. In most urbanareas, almost all sources of pollution other than transportation are already tightly regulated. Theonly significant approach that remains for achieving major reductions in pollution is to focusmore on emissions produced by driving, and therefore increasing the use of public transportationis the only strategy currently available that could achieve this without more regulation.
The greatest environmental and economic benefits would be derived from greater use ofpublic transportation, especially rail, in those areas where the air quality is poorest and thepopulation density is greatest. 39 Almost half of the 35 largest public transportation systems,serving 26 metropolitan areas, are located in areas that currently fail to meet EPA air-qualitystandards for ozone (produced when VOCs and NOx combine with sunlight) or CO.40 Thenation’s two largest metropolitan areas, New York and Los Angeles, fail to meet these standardsin both ozone and CO. For all the highly-populated, urban and suburban “non-attainment areas,”the major reductions in pollution that public transportation can deliver, compared to privatevehicles, would directly go to the environmental bottom line.
38 Environmental Protection Agency, Carbon Dioxide Emissions, Table ES-8: “C02 Emissions from Fossil FuelConsumption by End Use Sector,” www.epa.gov/globalwarming/emissions/national/co2.html.
39 While public buses reduce pollution per passenger mile, compared to automobiles, electrically-powered railsystems often not only reduce the per-passenger-mile emissions, but also remove them physically from these highlypopulated urban areas. Hence, reducing pollution in these regions could provide health and other benefits far greaterthan what might be inferred from the estimated emissions reductions calculated above.
40 In addition to New York and Los Angeles, the following metropolitan areas fail EPA tests for ozone (VOCs andNOx): Washington, D.C., San Francisco, Atlanta, Baltimore, Houston, San Diego, Pittsburgh, Milwaukee, Dallas,San Jose, St. Louis and Hartford. In addition, Minneapolis and Las Vegas fail to meet EPA standards for CO.Public Transportation Fact Book, op. cit., Table 2; National Transportation Statistics, op. cit., Table 4-48.
27
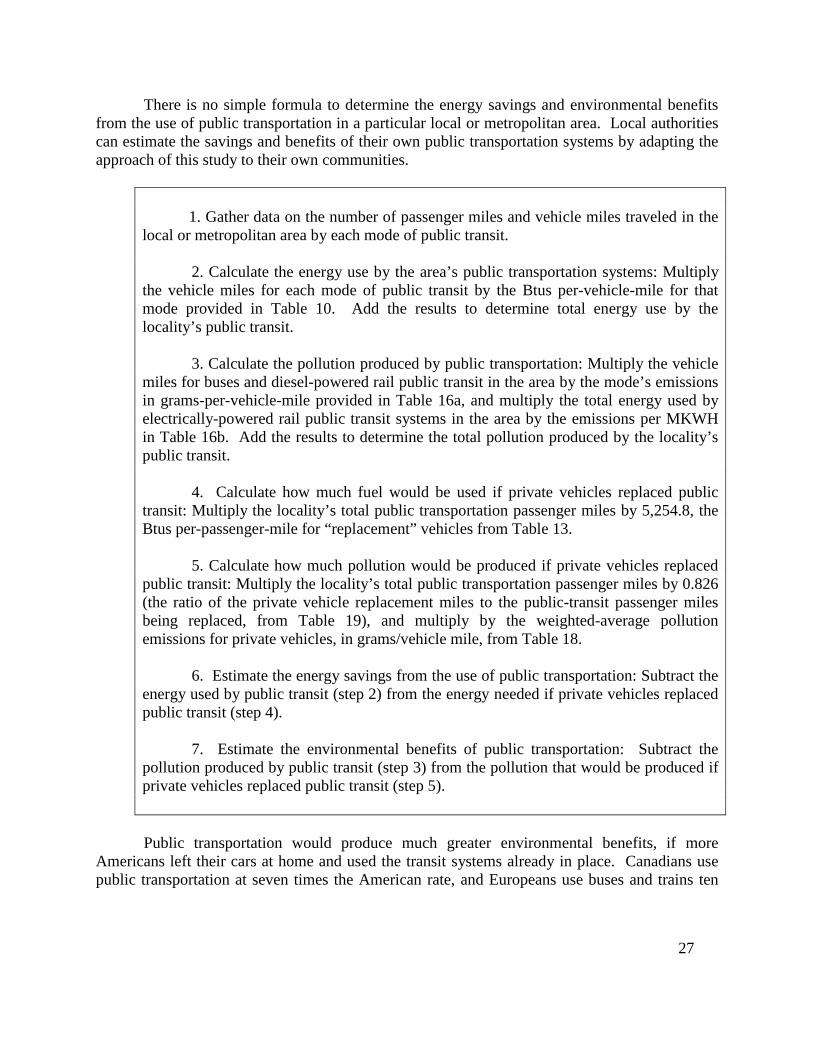
There is no simple formula to determine the energy savings and environmental benefitsfrom the use of public transportation in a particular local or metropolitan area. Local authoritiescan estimate the savings and benefits of their own public transportation systems by adapting theapproach of this study to their own communities.
1. Gather data on the number of passenger miles and vehicle miles traveled in thelocal or metropolitan area by each mode of public transit.
2. Calculate the energy use by the area’s public transportation systems: Multiplythe vehicle miles for each mode of public transit by the Btus per-vehicle-mile for thatmode provided in Table 10. Add the results to determine total energy use by thelocality’s public transit.
3. Calculate the pollution produced by public transportation: Multiply the vehiclemiles for buses and diesel-powered rail public transit in the area by the mode’s emissionsin grams-per-vehicle-mile provided in Table 16a, and multiply the total energy used byelectrically-powered rail public transit systems in the area by the emissions per MKWHin Table 16b. Add the results to determine the total pollution produced by the locality’spublic transit.
4. Calculate how much fuel would be used if private vehicles replaced publictransit: Multiply the locality’s total public transportation passenger miles by 5,254.8, theBtus per-passenger-mile for “replacement” vehicles from Table 13.
5. Calculate how much pollution would be produced if private vehicles replacedpublic transit: Multiply the locality’s total public transportation passenger miles by 0.826(the ratio of the private vehicle replacement miles to the public-transit passenger milesbeing replaced, from Table 19), and multiply by the weighted-average pollutionemissions for private vehicles, in grams/vehicle mile, from Table 18.
6. Estimate the energy savings from the use of public transportation: Subtract theenergy used by public transit (step 2) from the energy needed if private vehicles replacedpublic transit (step 4).
7. Estimate the environmental benefits of public transportation: Subtract thepollution produced by public transit (step 3) from the pollution that would be produced ifprivate vehicles replaced public transit (step 5).
Public transportation would produce much greater environmental benefits, if moreAmericans left their cars at home and used the transit systems already in place. Canadians usepublic transportation at seven times the American rate, and Europeans use buses and trains ten
28
times as much as Americans.41 If we matched Canadians in the use of public transportation, itwould reduce potential CO pollution by nearly twice the combined levels emitted by four high-polluting industry groups (chemical manufacturing, oil and gas production, metals processing,and industrial uses of coal). It also would cut potential NOx pollution by one-fourth of thecombined NOx emissions from the four industries, and the reductions in VOC pollution wouldbe equivalent to almost 60 percent of the combined VOC emissions of the four industries.
Similarly, if Americans used public transportation at the same rate as Europeans, it wouldreduce CO emissions by almost three times the combined CO output of the four industriesidentified above, and cut NOx emissions by more than one-third of the combined NOx pollutionfrom these four industries. The reductions in VOC pollution would be equal to more than 84percent of the total VOC emissions from these industries.
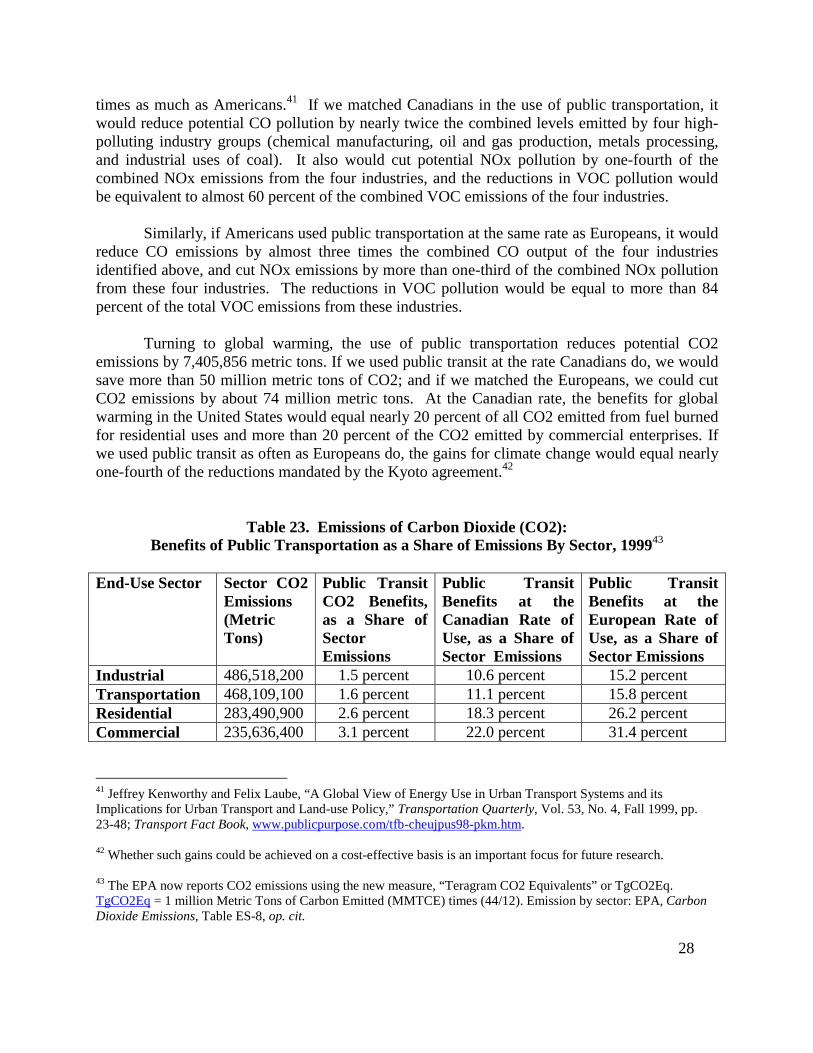
Turning to global warming, the use of public transportation reduces potential CO2emissions by 7,405,856 metric tons. If we used public transit at the rate Canadians do, we wouldsave more than 50 million metric tons of CO2; and if we matched the Europeans, we could cutCO2 emissions by about 74 million metric tons. At the Canadian rate, the benefits for globalwarming in the United States would equal nearly 20 percent of all CO2 emitted from fuel burnedfor residential uses and more than 20 percent of the CO2 emitted by commercial enterprises. Ifwe used public transit as often as Europeans do, the gains for climate change would equal nearlyone-fourth of the reductions mandated by the Kyoto agreement.42
Table 23. Emissions of Carbon Dioxide (CO2):Benefits of Public Transportation as a Share of Emissions By Sector, 199943
End-Use Sector Sector CO2Emissions(MetricTons)
Public TransitCO2 Benefits,as a Share ofSectorEmissions
Public TransitBenefits at theCanadian Rate ofUse, as a Share ofSector Emissions
Public TransitBenefits at theEuropean Rate ofUse, as a Share ofSector Emissions
Industrial 486,518,200 1.5 percent 10.6 percent 15.2 percentTransportation 468,109,100 1.6 percent 11.1 percent 15.8 percentResidential 283,490,900 2.6 percent 18.3 percent 26.2 percentCommercial 235,636,400 3.1 percent 22.0 percent 31.4 percent
41 Jeffrey Kenworthy and Felix Laube, “A Global View of Energy Use in Urban Transport Systems and itsImplications for Urban Transport and Land-use Policy,” Transportation Quarterly, Vol. 53, No. 4, Fall 1999, pp.23-48; Transport Fact Book, www.publicpurpose.com/tfb-cheujpus98-pkm.htm.
42 Whether such gains could be achieved on a cost-effective basis is an important focus for future research.
43 The EPA now reports CO2 emissions using the new measure, “Teragram CO2 Equivalents” or TgCO2Eq.TgCO2Eq = 1 million Metric Tons of Carbon Emitted (MMTCE) times (44/12). Emission by sector: EPA, CarbonDioxide Emissions, Table ES-8, op. cit.
29
IV. Conclusion
Greater reliance on more fuel-efficient means of travel, especially use of publictransportation is the key to the United States achieving greater energy independence andenvironmental progress.
The facts are clear and indisputable. For every passenger mile traveled by Americans,public transportation consumes about one-half the fuel and energy of private automobiles, SUVsand light trucks. For every passenger mile traveled by Americans, public transportationproduces only five percent as much carbon monoxide, less than ten percent as much volatileorganic compounds, and little more than half as much carbon dioxide and nitrogen oxides.Greater use of public transportation offers the most effective strategy available for achievingsignificant energy savings and environmental gains without imposing new taxes, governmentmandates or regulations.
At our current levels of use, every year public transportation saves close to one billiongallons of gasoline and reduces harmful emissions by millions of tons. Increasing Americans’use of public transit would produce even greater benefits for our nation’s economy, security andenvironment.
This is an achievable goal – and one that Americans had formerly attained. In the early20th century, America led the world in mass transit development and use. Today, there are signsof a transit renaissance. Since 1995, use of public transportation has grown faster than the useof private vehicles. Passenger miles ridden on public buses and rail systems have grown fasterthan the passenger miles ridden in private automobiles, sports utility vehicles (SUVs) and lighttrucks. As ridership increases, so will the energy savings and environmental benefits.
Both pragmatism and patriotism can become catalysts for much greater use of publictransportation. As a practical matter, increasing transit use may be one of the most feasible --and desirable -- strategies for sharply reducing our dependence on foreign oil and makinghistoric strides in environmental quality. As a act of civic commitment, many Americans mayview riding public transportation, even on a limited basis, as a small but important contributionto our country’s well being. As this study demonstrates, if one out of ten people shifted his orher daily transportation from private vehicle to transit, or if the general public used transit foronly 10 percent of its daily transportation needs or used public transportation for three daysevery month, the energy savings and environmental benefits would be enormous: the UnitedStates would no longer need to import oil from Saudi Arabia, every metropolitan area in thecountry would meet EPA air quality standards for smog and carbon monoxide, and Americawould achieve more than one-fourth of the reductions in global-warming emissions directedunder the Kyoto Agreement.
Realizing these benefits does not depend on technology or new regulatory schemes, butrather on a political and economic commitment. By making public transit a key element of our
30
nation’s long-term transportation, energy and environmental policies, we can attain conservationand clear air goals that strengthen America.
* * *
31
V. Methodology: A Review
The technical approach employed in this study to estimate the energy and environmentaleffects of public transportation is designed to be conceptually transparent and rely on readilyavailable data. This ensures that the results can be easily understood and verified. In essence,we postulate a world without public transportation and estimate how much additional fuelconsumption and pollutant emissions would occur if current users of public transit had to relyinstead on private automobiles.
To do this, we first estimated the energy used and the pollution caused by publictransportation. Buses account for roughly half of the more than 42.5 billion passenger miles thatpublic transit systems provided in 1998; commuter rail, light rail, and heavy rail systems accountfor almost all of the other half of public-transit passenger miles. Public buses use primarilydiesel fuel, with relatively modest amounts of other fossil fuels, while electricity powers most ofthe rail systems. The amount of fuels used in public transportation is determined by calculatingthe distance traveled by each mode of public transit and the fuel consumed by each mode totraverse those miles. The aggregate fuel consumption of each of the modes of public transit isconverted to British thermal units (Btus) to arrive at the total energy consumed by publictransportation systems.
Both public transit and private automobiles emit four major classes of pollutants into theenvironment: volatile organic compounds, nitrogen oxides, carbon monoxide, and carbondioxide. For diesel-powered buses and commuter-rail locomotives, emissions are determined ona grams-per-vehicle-mile-traveled basis, which then is multiplied by the total miles traveled bythese modes of public transit to calculate the total pollution produced by them. The emissionsassociated with electrically-powered light-rail and heavy-rail systems are calculated bydetermining the total emissions produced by utilities, in grams per million kilowatt hours(MKWH), which is then multiplied by the electric power in MKWH used by publictransportation systems.
Once we calculate the energy needs and environmental costs associated with publictransportation, we perform a thought experiment in which public transportation is no longeravailable and the passenger miles currently traveled on public transit occur instead in privateautomobiles, SUVs and light trucks. We do not assume that in a world without publictransportation, all those currently using it would become lone drivers of private vehicles.Commuting to work or to school accounts for a majority of current passenger miles on publictransportation, and a significant share of these trips involves at least two people in one vehicle (adriver and passenger). To accurately distribute the passenger miles from public transportation toprivate automobiles, we use the four-category distribution for private automobile travel from the1995 Nationwide Personal Transportation Survey -- single driver with no passengers; driver plusone passenger; driver plus two passengers; and driver plus three or more passengers. Based onthis distribution, we calculated the total number of automobile vehicle miles required to replaceall the public transportation passenger miles. We multiply those vehicle miles by the averagefuel consumption and pollution emissions, per mile, for passenger cars, SUVs, and light-duty
32
trucks, in the appropriate proportions, to determine the fuel consumed and pollution emitted ifcurrent public transportation needs had to be met by private automobiles.
The difference between the fuel consumption and pollution levels associated with thecurrent use of public transportation, and the higher levels of energy consumed and pollutionemitted by the automobile trips required to replace public transit, provides an accurate measureof the net energy and environmental benefits of public transportation. These differences areexpressed in a variety of ways to illustrate the dimensions of the current energy andenvironmental benefits of public transportation.
* * *
Appendix
33
TABLES
Table 1. Primary Energy Consumption by Sector and Source, 2000—page 5
Table 2. Public Transportation Use and Implicit Energy Savings,1998 and 1999—page 7
Table 3. Emissions by Public Transit and by Comparable Use of Private VehiclesMetric Tons, 1999—page 9
Table 4. Passenger Miles and Shares by Mode of Transportation, 1998—page 10
Table 5. Changes in Passenger Miles, 1980-1990, 1990-1995, and1995-1998—page 11
Table 6. Energy Consumption, Private and Public Transportation, Btus,1998—page 14
Table 7. Fuel Consumption by Mode of Public Transport, 1998—page 14
Table 8. Vehicle Miles and Passenger Miles, By Mode of Public Transport,1998—page 15
Table 9. Average Passenger Load for Public and Private Vehicle Transportation,1998—page 16
Table 10. Energy Efficiency of Public Transportation, by Fuel Source Per Mile andPer Passenger Mile, 1998—page 16
Table 11. Private Vehicle Miles Driven in Shift from Public to PrivateTransportation—page 17
Table 12. Vehicles Miles and Fuel Efficiency of Private Vehicles, 1998—page 18
Table 13. Values for Determining the Energy Benefits of Public Transportation,1998—page 18
Table 14. Energy Savings from the Use of Public Transportation versus EnergyConsumed by Various Industries, 1998, Trillion Btus—page 19
Table 15. Public Transportation Vehicle Miles by Mode, 1999—page 20
Table 16a. Emissions by Buses and Diesel-Powered Trains, Grams/Vehicle Mile,1999—page 21
34
Table 16b. Emissions by Electricity-Powered Rail Systems, Grams/MKWH,1999—page 21
Table 17. Pollution Emissions by Public Transportation, by Mode, Metric Tons,1999—page 22
Table 18. Pollution Emissions by Private Vehicles, Grams Per Vehicle Mile,1999—page 22
Table 19. Private Vehicle Miles Driven in Shift from Public Transportation,1999—page 23
Table 20. Environmental Benefits of Public Transportation Pollution Produced byPrivate Vehicles and Public Transportation Over the Vehicle MilesTraveled on Public Transportation, Metric Tons, 1999—page 24
Table 21a. Emissions of Volatile Organic Compounds (VOCs): Benefits of PublicTransportation versus Emissions by Industries, 1999, ShortTons—page 24
Table 21b. Emissions of Carbon Monoxide (CO): Benefits of Public Transportationversus Emissions by Industries, 1999, Short Tons—page 25
Table 21c. Emissions of Nitro gen Oxides (NOx): Benefits of Public Transportationversus Emissions by Industries, 1999, Short Tons—page 25
Table 22. Environmental Benefits of Public Transportation As a Share of AllPollution Produced by Driving, Metric Tons, 1999—page 26
Table 23. Emissions of Carbon Dioxide (CO2): Benefits of Public Transportation asa Share of Emissions By Sector, 1999—page 28

![Thematic Competition - 2019 - IMCTF · IMCT’s Initiative imparts six universally important Values [Themes] – Conserving Forest and Protecting Wildlife, Preserving Ecology, Sustaining](https://img.pdfslide.us/doc/110x75/5f79024783fec93c4c787ca9/thematic-competition-2019-imctf-imctas-initiative-imparts-six-universally.jpg)