Embed Size (px)
Citation preview

Conservation’s Impact on the Farm Bottom Line

2 // Conservation’s Impact on the Farm Bottom Line
Table of Contents
Achieving Profitability with On-Farm Conservation .......................................3
Project Team .................................................................................................................5
Data Collection ............................................................................................................6
Conservation Tillage Reduces Operating Costs .................................................9
Farmer Profile: Ryberg Farms – Minnesota ....................................................... 13
Cover Crops Can Be Part of a Profitable System, Especially as Experience Grows ............................................................................ 14
Farmer Profile: Indiana Farmer ............................................................................. 19
Farmer Profile: Gaesser Farms – Iowa ................................................................ 20
Success with Conservation Practices is Optimized with a Targeted, Stepwise, Tailored Approach .................................................. 21
What Comes Next? ....................................................................................................22

Soil Health Partnership (SHP), Environmental Defense Fund (EDF) and K·Coe Isom collaborated to evaluate the financial impact of conservation tillage and cover crop usage among Midwest corn and soybean farmers.
3 // Conservation’s Impact on the Farm Bottom Line
Achieving Profitability with On-Farm Conservation
Agricultural conservation practices are pivotal to addressing some of agriculture’s most important natural resource concerns. At the same time, it is critical that farmers run profitable businesses and that environmental stewardship priorities support farm profitability.
To expand on growing information around the profitability of conservation agriculture, Soil Health Partnership (SHP), Environmental Defense Fund (EDF) and K·Coe Isom collaborated to evaluate the financial impact of conservation tillage and cover crop usage among Midwest corn and soybean farmers. The goals of this project were to:
1. Compare crop budgets for fields using conventional vs. conservation practices
2. Identify benefits, opportunities and limiting factors associated with common conservation approaches
3. Help farmers and their business partners better understand the financial dynamics of conservation practice adoption
Throughout 2020, the project team collected information about farm operations, management practices, and financial data, which was then analyzed to identify the impact on each farmer’s bottom line.
4 // Conservation’s Impact on the Farm Bottom Line
Key finding:
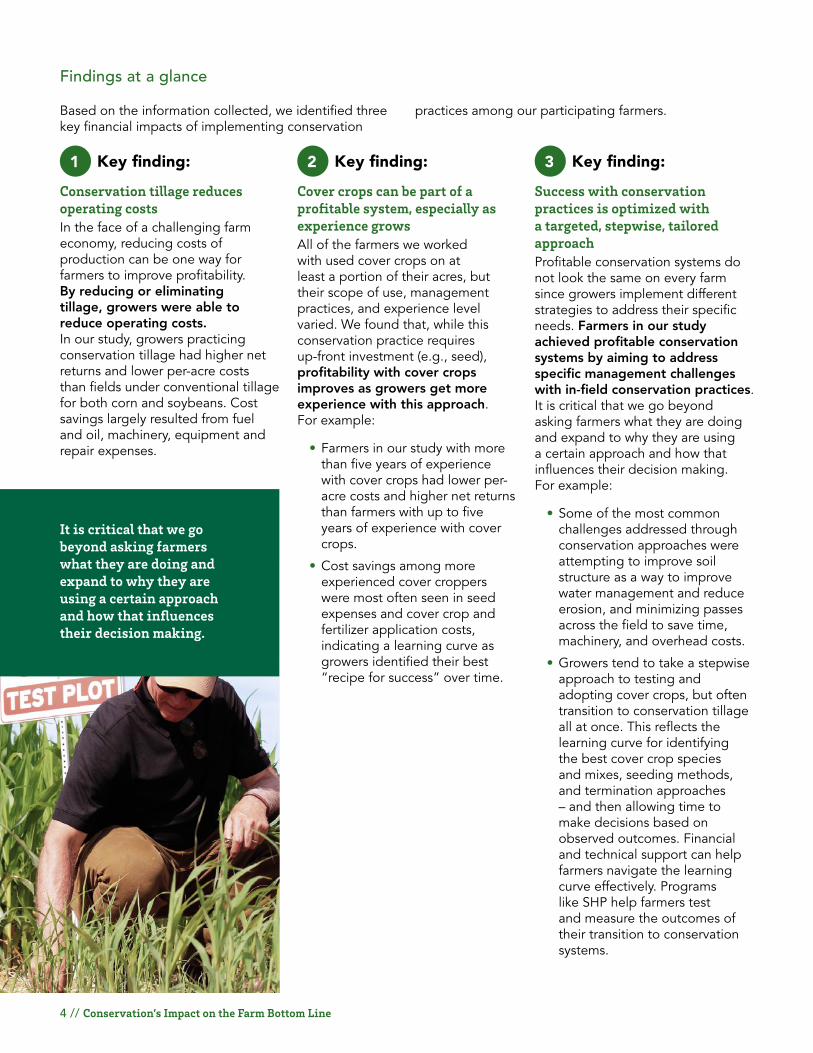
Conservation tillage reduces operating costsIn the face of a challenging farm economy, reducing costs of production can be one way for farmers to improve profitability. By reducing or eliminating tillage, growers were able to reduce operating costs. In our study, growers practicing conservation tillage had higher net returns and lower per-acre costs than fields under conventional tillage for both corn and soybeans. Cost savings largely resulted from fuel and oil, machinery, equipment and repair expenses.
Key finding:
Cover crops can be part of a profitable system, especially as experience growsAll of the farmers we worked with used cover crops on at least a portion of their acres, but their scope of use, management practices, and experience level varied. We found that, while this conservation practice requires up-front investment (e.g., seed), profitability with cover crops improves as growers get more experience with this approach. For example:
• Farmers in our study with more than five years of experience with cover crops had lower per-acre costs and higher net returns than farmers with up to five years of experience with cover crops.
• Cost savings among more experienced cover croppers were most often seen in seed expenses and cover crop and fertilizer application costs, indicating a learning curve as growers identified their best “recipe for success” over time.
Key finding:
Success with conservation practices is optimized with a targeted, stepwise, tailored approach Profitable conservation systems do not look the same on every farm since growers implement different strategies to address their specific needs. Farmers in our study achieved profitable conservation systems by aiming to address specific management challenges with in-field conservation practices. It is critical that we go beyond asking farmers what they are doing and expand to why they are using a certain approach and how that influences their decision making. For example:
• Some of the most common challenges addressed through conservation approaches were attempting to improve soil structure as a way to improve water management and reduce erosion, and minimizing passes across the field to save time, machinery, and overhead costs.
• Growers tend to take a stepwise approach to testing and adopting cover crops, but often transition to conservation tillage all at once. This reflects the learning curve for identifying the best cover crop species and mixes, seeding methods, and termination approaches – and then allowing time to make decisions based on observed outcomes. Financial and technical support can help farmers navigate the learning curve effectively. Programs like SHP help farmers test and measure the outcomes of their transition to conservation systems.
1 2 3
It is critical that we go beyond asking farmers what they are doing and expand to why they are using a certain approach and how that influences their decision making.
Findings at a glance
Based on the information collected, we identified three key financial impacts of implementing conservation
practices among our participating farmers.

5 // Conservation’s Impact on the Farm Bottom Line
Project Team
Soil Health PartnershipSHP is a program of the National Corn Growers Association, dedicated to promoting the adoption of soil health practices among farmers. By building a peer-to-peer network – which, to date, spans more than 16 states and includes more than 200 growers – we collaborate with farmers to conduct on-farm research exploring the economic and environmental benefits and risks of soil health practices.
SHP takes a three-pronged approach to our work:
On-Farm engagement: Farmers work alongside experienced, regional field managers to conduct field trials comparing soil health practices to historical approaches.
Data & science: SHP is building an in-depth data set to learn more about the relationship between soil health practices, management systems, environmental quality and quantity, and farm economics.
Communication & outreach:Insights gained from on-farm trials provide farmers with tools to make the best decisions for their farms.
To learn more, visit soilhealthpartnership.org.
Project leaders: Maria Bowman, PhDTricia VervilleJack Cornell
Environmental Defense FundEDF is a leading international nonprofit organization on a mission to create transformational solutions to the most serious environmental challenges. We link science, economics, law, and innovative private-sector partnerships in order to maximize the impact of our efforts. EDF’s agricultural finance work includes farm budget analyses, financial solutions, and agricultural finance policy. To learn more, visit edf.org/farm-finance.
Project leaders:Vincent Gauthier
K·Coe IsomK·Coe Isom is the nation’s leading agricultural business advisory firm serving the food and agricultural sector. To develop a deeper understanding of the financial impact of conservation on the farm businesses in this report, K·Coe Isom’s AgKnowledge professionals worked with farmers to make accrual adjustments to determine the relevant cost/benefit analysis. AgKnowledge is a managerial accounting and advisory service that serves farms and ranches. To learn more, visit kcoe.com.
Project leaders:Laura SandsAlan GraftonJenna Nichol
Building soil health knowledge takes a collaborative effort. Below are the partner organizations and contributors that made this project possible.
Special thanks to our reviewersRachel Orf, National Corn Growers Association
Matt Yost, PhD, Utah State University
Laura Gentry, PhD, Illinois Corn Growers Association
Maggie Monast, Environmental Defense Fund
Chandler Clay, Environmental Defense Fund
Amanda Sollman, Soil Health Partnership

6 // Conservation’s Impact on the Farm Bottom Line
The project team took a multistep approach to gather, analyze and report on the data included in this report. Below is a high-level summary of our process. For more details, please visit soilhealthpartnership.org/farmfinance and see EDF’s report “A practitioner’s guide to conducting budget analyses for conservation agriculture” for best practices in collecting economic data (edf.org/measuring-conservation-profitability).
Farmer recruitmentFarmers were recruited through SHP’s grower network and K·Coe Isom’s client base based on the following criteria:
1. Located in the Midwest
2. Grow corn, soybeans, and/or wheat
3. Have at least three years of experience with conservation practices
4. Willing to share information from detailed management and financial records, including those dating back to before the adoption of conservation practices
5. Attend one virtual workshop session introducing the data-gathering process
6. Available and willing to work with SHP Field Managers and K·Coe Isom staff to complete questionnaire and discuss answers
1 Participating farmers were offered the option to remain anonymous. Farmers who requested to be anonymous (2/7) are referred to based on the state in which they reside and described by their farming practices, and the financial and management data they provided through the project.
Number of farmers1 7 (6 SHP farmers, 1 K·Coe Isom customer)
GeographyIowa (2), Indiana (1), Minnesota (2), Missouri (1), Wisconsin (1)
Average farm size 3,108 acres
Total acreage analyzed 21,754 acres
Crops grown Corn, soybeans, winter wheat, sugar beets
Conservation practices
Conservation tillage (reduced till, strip-till, no-till), cover crops, nutrient management
Average years of conservation tillage experience
20 (range: 3-34)
Average years of cover crop experience 6 (range: 3-10)
Data Collection
Table 1: Summary of participating farmers
For more details, please visit soilhealthpartnership.org/farmfinance.

Farmers tend to realize cost savings as they learn the best cover crop mix, application method, and weed suppression and nutrient cycling benefits for their farm.
7 // Conservation’s Impact on the Farm Bottom Line
Data collection, analysis and follow-upK·Coe Isom developed a Microsoft® Excel®-based workbook to gather data, including:
• Basic operation information
• Detailed conservation practice information
• Estimated cost changes attributed to conservation practices
• Farm-level financial information broken down by crop and conservation practice
K·Coe Isom and SHP Field Managers worked with participating farmers to gather the necessary data and fill out their workbooks. K·Coe Isom then analyzed financial outcomes and differences across production systems, both for individual farmers and at an aggregate level. Growers were asked to report numbers using accrual accounting methods instead of cash accounting,
2 Sustainable Agriculture Research and Education (SARE). 2019. Cover crop economics. Opportunities to improve your bottom line in row crops. https://www.sare.org/resources/cover-crop-economics/
3 Monast, M., Sands, L., Grafton, A. 2018. Farm finance and conservation. Environmental Defense Fund and K·Coe Isom. https://www.edf.org/ecosystems/how-farm-conservation-can-generate-financial-value
allowing us to look at a cropping (instead of a calendar) year. In the aggregate, cost and revenue differences were evaluated between a variety of comparison groups (Table 2).
When analyzing cover crop data, farmers were further divided into experienced adopters (more than five years of cover crop experience) and recent adopters (up to five years of experience). This was informed by previous findings,2,3 that farmers tend to realize cost savings as they learn the best cover crop mix and application methods for their farm, and start seeing weed suppression or nutrient cycling benefits.
After preliminary data analysis, a follow-up questionnaire was used to create more clarity around the details of their soil health management system and participation in conservation programs.
Corn Soybeans
Conventional tillage Conventional tillage
Conservation tillage, no cover crops
Conservation tillage, no cover crops
Experienced adopters Conservation tillage/ cover crops
Experienced adopters Conservation tillage/ cover crops
Recent adopters Conservation tillage/ cover crops
Recent adopters Conservation tillage/ cover crops
Table 2: Comparison groups

8 // Conservation’s Impact on the Farm Bottom Line
About the farmers
Ken Rosenow – Wisconsin:Crops: corn, soybeans and wheat
Acreage: 1,100 acres
Tillage Practices: no-till, conventional till
Cover Crop Practices (204 acres): aerial-seeded cereal rye
Peter Rost – Missouri:Crops: corn and soybeans
Acreage: 3,500
Tillage Practices: reduced tillage
Cover Crop Practices (1,362 acres)
Ryberg Farms – Minnesota:Crops: corn, soybeans and sugar beets
Acreage: 4,800 acres
Tillage Practices: strip-till, no-till
Cover Crop Practices (2,900 acres): interseeded annual ryegrass, hairy vetch, turnips and rapeseed by broadcast with incorporation
Minnesota Farmer:
Crops: corn and soybeans
Acreage: 914 acres
Tillage Practices: no-till, reduced tillage, conventional till
Cover Crop Practices (107 acres): drilled cereal rye
Dwight Dial – Iowa:Crops: corn and soybeans
Acreage: 640 acres
Tillage Practices: no-till
Cover Crop Practices (317 acres): aerial-seeded cereal rye and rapeseed
Gaesser Farms – Iowa:Crops: corn and soybeans
Acreage: 5,000 acres
Tillage Practices: no-till
Cover Crop Practices (4,855 acres): drilled cereal rye
Indiana Farmer:Crops: corn and soybeans
Acreage: 5,800 acres
Tillage Practices: strip-till, no-till, conventional till
Cover Crop Practices (188 acres): aerial-seeded oats, crimson clover, radish and rapeseed
In this project, we collected data from seven Midwestern farmers. Below is a synopsis of each operation and expanded details for selected farmers are highlighted throughout this report.
9 // Conservation’s Impact on the Farm Bottom Line
Conservation Tillage Reduces Operating Costs
Overview:
Net returns were higher for conservation tillage for both corn and soybeans compared to conventional tillage
No-till had lower per-acre costs than conventional tillage for corn and soybeans
Conservation tillage saves costs from fuel and oil, machinery, repairs, and equipment
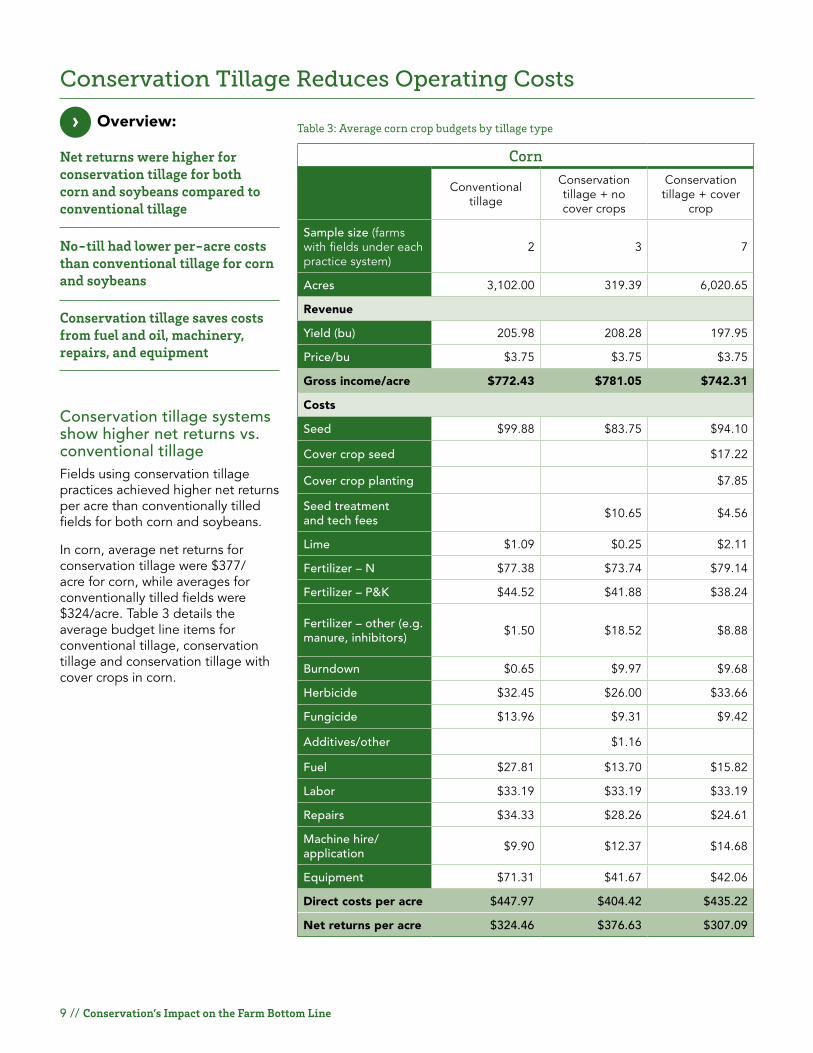
Conservation tillage systems show higher net returns vs. conventional tillageFields using conservation tillage practices achieved higher net returns per acre than conventionally tilled fields for both corn and soybeans.
In corn, average net returns for conservation tillage were $377/acre for corn, while averages for conventionally tilled fields were $324/acre. Table 3 details the average budget line items for conventional tillage, conservation tillage and conservation tillage with cover crops in corn.
Table 3: Average corn crop budgets by tillage type
Corn
Conventional tillage
Conservation tillage + no cover crops
Conservation tillage + cover
crop
Sample size (farms with fields under each practice system)
2 3 7
Acres 3,102.00 319.39 6,020.65
Revenue
Yield (bu) 205.98 208.28 197.95
Price/bu $3.75 $3.75 $3.75
Gross income/acre $772.43 $781.05 $742.31
Costs
Seed $99.88 $83.75 $94.10
Cover crop seed $17.22
Cover crop planting $7.85
Seed treatment and tech fees $10.65 $4.56
Lime $1.09 $0.25 $2.11
Fertilizer – N $77.38 $73.74 $79.14
Fertilizer – P&K $44.52 $41.88 $38.24
Fertilizer – other (e.g. manure, inhibitors) $1.50 $18.52 $8.88
Burndown $0.65 $9.97 $9.68
Herbicide $32.45 $26.00 $33.66
Fungicide $13.96 $9.31 $9.42
Additives/other $1.16
Fuel $27.81 $13.70 $15.82
Labor $33.19 $33.19 $33.19
Repairs $34.33 $28.26 $24.61
Machine hire/application $9.90 $12.37 $14.68
Equipment $71.31 $41.67 $42.06
Direct costs per acre $447.97 $404.42 $435.22
Net returns per acre $324.46 $376.63 $307.09
›

10 // Conservation’s Impact on the Farm Bottom Line
Table 4: Average soybean crop budgets by tillage type
Soybeans
Conventional tillage
Conservation tillage + no cover crops
Conservation tillage + cover
crop
Sample size 2 2 7
Acres 3,115.00 216.73 5,072.20
Revenue
Yield (bu) 60.25 53.50 55.24
Price/bu $8.75 $8.75 $8.75
Gross Income/Acre $527.19 $468.13 $483.35
Costs
Seed $57.75 $39.09 $59.50
Cover crop seed $12.50
Cover crop planting $10.39
Seed treatment and tech fees $20.06 $8.17
Lime $8.22 $6.06
Fertilizer – N, P & K $48.47 $15.00 $39.42
Fertilizer – other $8.37 $2.67
Burndown $15.62 $12.74
Herbicide $33.71 $29.76 $28.41
Fungicide $6.13
Additives/other $1.00 $1.74 $3.67
Fuel $25.31 $6.22 $13.22
Labor $33.19 $33.19 $33.19
Repairs $29.41 $24.77 $22.06
Machine hire/application $8.44 $10.75 $14.05
Equipment $57.61 $20.89 $38.51
Direct costs per acre $311.48 $217.09 $310.69
Net returns per acre $215.71 $251.04 $172.66
In soybeans, average net returns for conservation tillage were $251/acre, while averages for conventionally tilled fields were $216/acre. Table 4 details the average budget line items for conventional tillage, conservation tillage and conservation tillage with cover crops in soybeans.
11 // Conservation’s Impact on the Farm Bottom Line
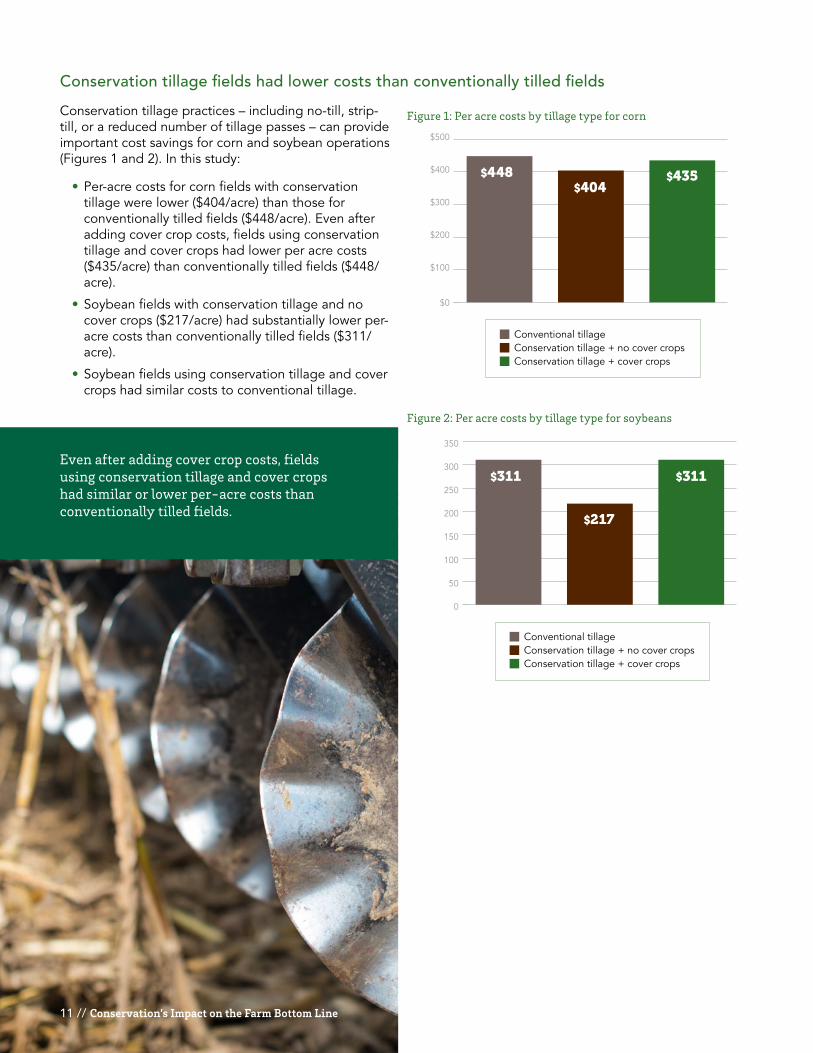
Conservation tillage fields had lower costs than conventionally tilled fields
Conservation tillage practices – including no-till, strip-till, or a reduced number of tillage passes – can provide important cost savings for corn and soybean operations (Figures 1 and 2). In this study:
• Per-acre costs for corn fields with conservation tillage were lower ($404/acre) than those for conventionally tilled fields ($448/acre). Even after adding cover crop costs, fields using conservation tillage and cover crops had lower per acre costs ($435/acre) than conventionally tilled fields ($448/acre).
• Soybean fields with conservation tillage and no cover crops ($217/acre) had substantially lower per-acre costs than conventionally tilled fields ($311/acre).
• Soybean fields using conservation tillage and cover crops had similar costs to conventional tillage.
$0
$100
$200
$300
$400
$500
Conventional tillageConservation tillage + no cover cropsConservation tillage + cover crops
$448$404
$435
0
50
100
150
200
250
300
350
Conventional tillageConservation tillage + no cover cropsConservation tillage + cover crops
$311
$217
$311
($435.21) ($461.25) ($394.07) ($404.40) ($447.93)
$307.10 $266.72 $362.60 $376.66 $324.48
$742.31 $727.96$756.67 $781.06 $772.41
($500)
($4000)
($300)
($200)
($100)
$0
$100
$200
$300
$400
$500
$600
$700
$800
Cover crops (all) Recent adopters Experiencedadopters
Conservation tillage(no cover crops)
Conventional tillage(no cover crops)
RevenueNet returnCosts
($310.69) ($356.10)($236.77) ($217.07) ($311.47)
$172.69 $123.29 $250.61 $251.06 $215.70
$483.38 $479.38$487.38 $455.96 $527.17
($400)
($300)
($200)
($100)
$0
$100
$200
$300
$400
$500
$600
Cover crops (all) Recent adopters Experiencedadopters
Conservation tillage(no cover crops)
Conventional tillage(no cover crops)
RevenueNet returnCosts
Cover crops (all) Recent adopters Experiencedadopters
Conservation tillage(no cover crops)
Conventional tillage(no cover crops)
$310.69 $356.10
$236.77 $217.07
$311.47
$0
$50
$100
$150
$200
$250
$300
$350
$400
Cover crops (all) Recent adopters Experiencedadopters
Conservation tillage(no cover crops)
Conventional tillage(no cover crops)
$435.21 $461.25
$394.07 $404.40 $447.93
$0
$50
$100
$150
$200
$250
$300
$350
$400
$450
$500
Per acre costs by tillage type and cover crop groups, soybeans
Per acre costs by tillage and cover crop groups, corn
Net returns for soybeans, by tillage type and cover crop groups
Net returns to corn, by tillage and cover crop groups
Per acre costs by tillage type for soybeans
Per acre costs by tillage type for corn
$0
$100
$200
$300
$400
$500
Conventional tillageConservation tillage + no cover cropsConservation tillage + cover crops
$448$404
$435
0
50
100
150
200
250
300
350
Conventional tillageConservation tillage + no cover cropsConservation tillage + cover crops
$311
$217
$311
($435.21) ($461.25) ($394.07) ($404.40) ($447.93)
$307.10 $266.72 $362.60 $376.66 $324.48
$742.31 $727.96$756.67 $781.06 $772.41
($500)
($4000)
($300)
($200)
($100)
$0
$100
$200
$300
$400
$500
$600
$700
$800
Cover crops (all) Recent adopters Experiencedadopters
Conservation tillage(no cover crops)
Conventional tillage(no cover crops)
RevenueNet returnCosts
($310.69) ($356.10)($236.77) ($217.07) ($311.47)
$172.69 $123.29 $250.61 $251.06 $215.70
$483.38 $479.38$487.38 $455.96 $527.17
($400)
($300)
($200)
($100)
$0
$100
$200
$300
$400
$500
$600
Cover crops (all) Recent adopters Experiencedadopters
Conservation tillage(no cover crops)
Conventional tillage(no cover crops)
RevenueNet returnCosts
Cover crops (all) Recent adopters Experiencedadopters
Conservation tillage(no cover crops)
Conventional tillage(no cover crops)
$310.69 $356.10
$236.77 $217.07
$311.47
$0
$50
$100
$150
$200
$250
$300
$350
$400
Cover crops (all) Recent adopters Experiencedadopters
Conservation tillage(no cover crops)
Conventional tillage(no cover crops)
$435.21 $461.25
$394.07 $404.40 $447.93
$0
$50
$100
$150
$200
$250
$300
$350
$400
$450
$500
Per acre costs by tillage type and cover crop groups, soybeans
Per acre costs by tillage and cover crop groups, corn
Net returns for soybeans, by tillage type and cover crop groups
Net returns to corn, by tillage and cover crop groups
Per acre costs by tillage type for soybeans
Per acre costs by tillage type for corn
Figure 1: Per acre costs by tillage type for corn
Figure 2: Per acre costs by tillage type for soybeans
Even after adding cover crop costs, fields using conservation tillage and cover crops had similar or lower per-acre costs than conventionally tilled fields.

12 // Conservation’s Impact on the Farm Bottom Line
Fuel, repairs, and equipment cost savings contribute to profitable conservation tillage systems
By decreasing the number and/or intensity of tillage passes, farmers were able to save money. Table 5 shows the amount of cost savings (positive and negative) associated with conservation tillage and conservation tillage with cover crops, when compared to conventional tillage without cover crops on corn fields. The most substantial savings from no-till on corn came from equipment and fuel costs. Conservation tillage acres with and without cover crops did, however, have increased burndown costs due to using herbicide (vs. tillage) for weed control.
Table 5: Cost savings associated with conservation tillage production systems as compared to conventional tillage with no cover crops, corn
Conservation tillage + no cover crops
Conservation tillage + cover
crops
Sample size 3 7
Burndown -$9.33 -$9.04
Fuel $14.11 $11.99
Repairs $6.08 $9.71
Machine hire/application -$2.48 -$4.78
Equipment $29.64 $29.25
Total cost per acre* $43.53 $12.72
Farmers using conservation tillage on their soybean acres also showed substantial cost savings. Like Table 5, Table 6 shows the amount of cost savings (positive and negative) associated with conservation tillage and conservation tillage with cover crops, when compared to conventional tillage without cover crops on soybean fields. The table demonstrates that farmers using conservation tillage had substantially lower equipment and fuel costs compared to conventional tillage. Again, conservation tillage on soybean fields included increased costs in burndown and machine hire and application.
Table 6: Cost savings associated with conservation tillage production systems as compared to conventional tillage with no cover crops, soybeans
Conservation tillage + no cover crops
Conservation tillage + cover
crops
Sample size 2 7
Burndown -$19.09 -$12.74
Fuel $4.64 $12.08
Repairs $4.64 $7.34
Machine hire/application -$2.31 -$5.60
Equipment $36.73 $19.10
Total Cost per acre* $94.40 $ 0.77
*All budget lines from Table 3. A negative number represents an increased cost associated with the practice relative to conventional tillage.
*All budget lines from Table 4. A negative number represents an increased cost associated with the practice relative to conventional tillage.

13 // Conservation’s Impact on the Farm Bottom Line
About the farmers• Owners: Brian and Sandy Ryberg
• Farm size: 5,300 acres
• Crops grown: corn, soybeans, sugar beets
• Conservation practices: strip-till, no-till, cover crops
• Conservation goals: save costs, improve soil health through reduced disturbance and increased cover
About the conservation system• Use an ETS SoilWarrior® XS 24-row/22-inch strip-
till bar with two fertilizer tanks and variable-rate capabilities
• Strip-till in the fall with P&K and sometimes micronutrient applications
• Plant directly into the strips in the spring with no additional tillage passes
• Interseed a mix of annual ryegrass, hairy vetch, turnip, and rapeseed into corn (at V-6, approx. eight inches tall) while sidedressing nitrogen
• If the cover crop is well established after corn harvest, they no-till the following spring’s soybeans
• Seed cereal rye after sugar beet harvest to protect against wind erosion
Profitability impactsThe Rybergs have a profitable strip-till and cover crop system, primarily due to fuel and equipment cost savings combined with conservation program revenues.
• 25% reduction in field passes led to a 60% decrease in fuel consumption (approx. $52.50/acre saved)
• Further savings (approx. $20/acre) realized when cover crop is well established and Brian can no-till soybeans
• Moved from two four-wheel-drive (4WD) tractors at 400 hours/year to one 4WD tractor at 200 hours/year (approx. $25.31-$36.59/acre – or $103,800-$150,000 per year4 – saved)
• For using cover crops, USDA’s Environmental Quality Incentive Program (EQIP) provides $18/acre and Conservation Stewardship Program (CSP) provides $40,000 for 1,500 acres (~$27 per acre)
4 Estimated using Machinery Cost Estimates from The Department of Agricultural and Consumer Economics at the University of Illinois. Link: https://farmdoc.illinois.edu/handbook/machinery-cost-estimates-summary
Table 7: Estimated strip-till equipment savings for Ryberg Farms
Conventional tillage Strip-till
a. Total cost per acre (overhead, labor, fuel)
$173-$250 (Lower end assumes a 370 HP
tractor, and higher end assumes a 620 HP tractor)
b. Number of hours 400 200
c. Number of tractors 2 1
d. Number of acres 4,100
Total cost per acre [(a X b X c)/d] $33.75-$48.78 $8.44-$12.19
Cost savings per acre $25.31-$36.59
Cost savings per year
$103,800-$150,000
Other benefits of conservation practicesIn addition to cost savings from reduced tillage, Brian has seen other benefits from conservation practices, including improved water holding capacity, more water infiltration, improved soil structure, better drained seed beds and weed suppression. He hopes that, by connecting soil health to financial data, farmers can have more intentional conversations with lenders. “If I am showing an entry for cover crop seed, how do I show something on the income side to offset that?” Ryberg said. “There are hidden numbers there, and I hope someday we can quantify that.”
Farmer Profile:
Ryberg Farms – MinnesotaIncreased profitability through decreased tillage

14 // Conservation’s Impact on the Farm Bottom Line
Cover Crops Can Be Part of a Profitable System, Especially as Experience Grows
Overview:
Unlike the immediate cost savings of conservation tillage, cover crops have annual costs, as well as efficiencies and soil health benefits that take time to achieve
Farmers with many years of cover crop experience are more profitable than farmers who have recently adopted cover crops
Reducing cover crop and input costs is critical to cover crop profitability
5 See “Managing Cover Crops Profitably,” a Sustainable Agriculture Research and Education handbook, for a summary of the research on cover crop benefits. Link: https://www.sare.org/wp-content/uploads/Managing-Cover-Crops-Profitably.pdf
6 See “2019 Cover Crop Planting Report” from Soil Health Partnership for more findings. Link: https://www.soilhealthpartnership.org/wp-content/uploads/2020/08/SHP-cover-crop-survey-results-2020.pdf
The reality of up-front investments in cover crops can’t be ignoredThe financial dynamics of adopting cover crops are less straightforward than for conservation tillage. Working with cover crops often means increased annual costs in the form of seed, labor and machinery, and it takes time to discover the right combination of practices for your farm.
While the long-term benefits of cover cropping are well established5, it is important to measure the short-term costs incurred, understand how these may prevent farmers from adopting this practice, and identify ways to support farmers through the
short-term costs in order to realize the long-term savings and benefits.
On average, per-acre cover crop seed costs for our farmers were $14.86 plus $9.12/acre to apply (though these costs varied widely). This is consistent with a 2019 survey of more than 80 SHP farmers across 11 states who reported median seed and application costs of $15/acre and $12/acre, respectively.6 Table 8 presents a detailed overview of our participating farmers’ cover crop practices. Note that costs for cover crop seed and seeding method may differ due to regional differences in seed or service markets, economies of scale, differences in how farmers value their own time, or other factors.
Table 8: Cover crop goals and systems used by participating farmers
Issue they were trying to solve/management goal
Years of experience Acres Cover crop type Seeding method
Ken Rosenow – Wisconsin
Erosion control and community goals of improved water quality
5 204 Cereal rye ($25/acre) Aerial, contracted ($20/acre)
Peter Rost – Missouri Not provided 5 1,362 Not provided ($15/acre)
Ryberg Farms – Minnesota
Soil health and cost savings 7 2,900
Annual ryegrass, hairy vetch, turnip, and rapeseed mix ($4/acre)
Interseeded by broadcast with incorporations, self-applied ($15/acre)
Minnesota Farmer
Increase water holding capacity and improve water quality
4 107 Cereal rye ($16/acre) Drilled, self-applied ($16/acre)
Dwight Dial – Iowa
Improve soil health while reducing costs 8 317 Cereal rye and rapeseed
mix ($13.90/acre)Aerial, contracted ($12.75/acre)
Gaesser Farms – Iowa Erosion control 10 4,855 Cereal rye ($7/acre) Drilled, self-applied ($20/
acre)
Indiana Farmer
Improve soil structure and reduce erosion 3 188
Oats, crimson clover, radish and rapeseed mix ($25.07/acre)
Aerial, contracted ($10/acre)
›
15 // Conservation’s Impact on the Farm Bottom Line
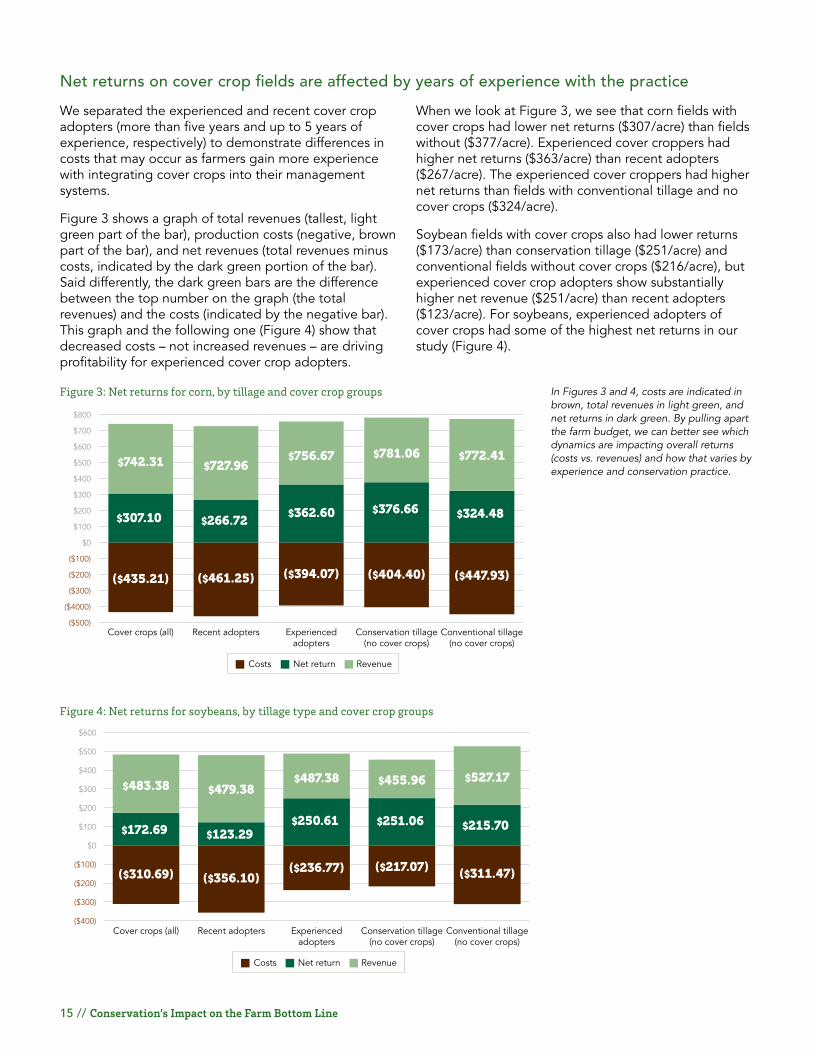
Net returns on cover crop fields are affected by years of experience with the practice
We separated the experienced and recent cover crop adopters (more than five years and up to 5 years of experience, respectively) to demonstrate differences in costs that may occur as farmers gain more experience with integrating cover crops into their management systems.
Figure 3 shows a graph of total revenues (tallest, light green part of the bar), production costs (negative, brown part of the bar), and net revenues (total revenues minus costs, indicated by the dark green portion of the bar). Said differently, the dark green bars are the difference between the top number on the graph (the total revenues) and the costs (indicated by the negative bar). This graph and the following one (Figure 4) show that decreased costs – not increased revenues – are driving profitability for experienced cover crop adopters.
When we look at Figure 3, we see that corn fields with cover crops had lower net returns ($307/acre) than fields without ($377/acre). Experienced cover croppers had higher net returns ($363/acre) than recent adopters ($267/acre). The experienced cover croppers had higher net returns than fields with conventional tillage and no cover crops ($324/acre).
Soybean fields with cover crops also had lower returns ($173/acre) than conservation tillage ($251/acre) and conventional fields without cover crops ($216/acre), but experienced cover crop adopters show substantially higher net revenue ($251/acre) than recent adopters ($123/acre). For soybeans, experienced adopters of cover crops had some of the highest net returns in our study (Figure 4).
$0
$100
$200
$300
$400
$500
Conventional tillageConservation tillage + no cover cropsConservation tillage + cover crops
$448$404
$435
0
50
100
150
200
250
300
350
Conventional tillageConservation tillage + no cover cropsConservation tillage + cover crops
$311
$217
$311
($435.21) ($461.25) ($394.07) ($404.40) ($447.93)
$307.10 $266.72 $362.60 $376.66 $324.48
$742.31 $727.96$756.67 $781.06 $772.41
($500)
($4000)
($300)
($200)
($100)
$0
$100
$200
$300
$400
$500
$600
$700
$800
Cover crops (all) Recent adopters Experiencedadopters
Conservation tillage(no cover crops)
Conventional tillage(no cover crops)
RevenueNet returnCosts
($310.69) ($356.10)($236.77) ($217.07) ($311.47)
$172.69 $123.29 $250.61 $251.06 $215.70
$483.38 $479.38$487.38 $455.96 $527.17
($400)
($300)
($200)
($100)
$0
$100
$200
$300
$400
$500
$600
Cover crops (all) Recent adopters Experiencedadopters
Conservation tillage(no cover crops)
Conventional tillage(no cover crops)
RevenueNet returnCosts
Cover crops (all) Recent adopters Experiencedadopters
Conservation tillage(no cover crops)
Conventional tillage(no cover crops)
$310.69 $356.10
$236.77 $217.07
$311.47
$0
$50
$100
$150
$200
$250
$300
$350
$400
Cover crops (all) Recent adopters Experiencedadopters
Conservation tillage(no cover crops)
Conventional tillage(no cover crops)
$435.21 $461.25
$394.07 $404.40 $447.93
$0
$50
$100
$150
$200
$250
$300
$350
$400
$450
$500
Per acre costs by tillage type and cover crop groups, soybeans
Per acre costs by tillage and cover crop groups, corn
Net returns for soybeans, by tillage type and cover crop groups
Net returns to corn, by tillage and cover crop groups
Per acre costs by tillage type for soybeans
Per acre costs by tillage type for corn
$0
$100
$200
$300
$400
$500
Conventional tillageConservation tillage + no cover cropsConservation tillage + cover crops
$448$404
$435
0
50
100
150
200
250
300
350
Conventional tillageConservation tillage + no cover cropsConservation tillage + cover crops
$311
$217
$311
($435.21) ($461.25) ($394.07) ($404.40) ($447.93)
$307.10 $266.72 $362.60 $376.66 $324.48
$742.31 $727.96$756.67 $781.06 $772.41
($500)
($4000)
($300)
($200)
($100)
$0
$100
$200
$300
$400
$500
$600
$700
$800
Cover crops (all) Recent adopters Experiencedadopters
Conservation tillage(no cover crops)
Conventional tillage(no cover crops)
RevenueNet returnCosts
($310.69) ($356.10)($236.77) ($217.07) ($311.47)
$172.69 $123.29 $250.61 $251.06 $215.70
$483.38 $479.38$487.38 $455.96 $527.17
($400)
($300)
($200)
($100)
$0
$100
$200
$300
$400
$500
$600
Cover crops (all) Recent adopters Experiencedadopters
Conservation tillage(no cover crops)
Conventional tillage(no cover crops)
RevenueNet returnCosts
Cover crops (all) Recent adopters Experiencedadopters
Conservation tillage(no cover crops)
Conventional tillage(no cover crops)
$310.69 $356.10
$236.77 $217.07
$311.47
$0
$50
$100
$150
$200
$250
$300
$350
$400
Cover crops (all) Recent adopters Experiencedadopters
Conservation tillage(no cover crops)
Conventional tillage(no cover crops)
$435.21 $461.25
$394.07 $404.40 $447.93
$0
$50
$100
$150
$200
$250
$300
$350
$400
$450
$500
Per acre costs by tillage type and cover crop groups, soybeans
Per acre costs by tillage and cover crop groups, corn
Net returns for soybeans, by tillage type and cover crop groups
Net returns to corn, by tillage and cover crop groups
Per acre costs by tillage type for soybeans
Per acre costs by tillage type for corn
Figure 3: Net returns for corn, by tillage and cover crop groups
Figure 4: Net returns for soybeans, by tillage type and cover crop groups
In Figures 3 and 4, costs are indicated in brown, total revenues in light green, and net returns in dark green. By pulling apart the farm budget, we can better see which dynamics are impacting overall returns (costs vs. revenues) and how that varies by experience and conservation practice.

16 // Conservation’s Impact on the Farm Bottom Line
Farmers with many years of cover crop experience make cost-saving adjustments
Farmers who integrated cover crops and reduced tillage on their operations for more than five years seemed to have fine-tuned their systems and achieved cost savings. They had some of the lowest costs and
highest profitability per acre, when compared to other combinations of practices, and had lower costs compared to recent cover crop adopters (Figure 5 and 6).
Figure 5: Per-acre costs by tillage and cover crop groups, corn
Figure 6: Per-acre costs by tillage and cover crop groups, soybeans
$0
$100
$200
$300
$400
$500
Conventional tillageConservation tillage + no cover cropsConservation tillage + cover crops
$448$404
$435
0
50
100
150
200
250
300
350
Conventional tillageConservation tillage + no cover cropsConservation tillage + cover crops
$311
$217
$311
($435.21) ($461.25) ($394.07) ($404.40) ($447.93)
$307.10 $266.72 $362.60 $376.66 $324.48
$742.31 $727.96$756.67 $781.06 $772.41
($500)
($4000)
($300)
($200)
($100)
$0
$100
$200
$300
$400
$500
$600
$700
$800
Cover crops (all) Recent adopters Experiencedadopters
Conservation tillage(no cover crops)
Conventional tillage(no cover crops)
RevenueNet returnCosts
($310.69) ($356.10)($236.77) ($217.07) ($311.47)
$172.69 $123.29 $250.61 $251.06 $215.70
$483.38 $479.38$487.38 $455.96 $527.17
($400)
($300)
($200)
($100)
$0
$100
$200
$300
$400
$500
$600
Cover crops (all) Recent adopters Experiencedadopters
Conservation tillage(no cover crops)
Conventional tillage(no cover crops)
RevenueNet returnCosts
Cover crops (all) Recent adopters Experiencedadopters
Conservation tillage(no cover crops)
Conventional tillage(no cover crops)
$310.69 $356.10
$236.77 $217.07
$311.47
$0
$50
$100
$150
$200
$250
$300
$350
$400
Cover crops (all) Recent adopters Experiencedadopters
Conservation tillage(no cover crops)
Conventional tillage(no cover crops)
$435.21 $461.25
$394.07 $404.40 $447.93
$0
$50
$100
$150
$200
$250
$300
$350
$400
$450
$500
Per acre costs by tillage type and cover crop groups, soybeans
Per acre costs by tillage and cover crop groups, corn
Net returns for soybeans, by tillage type and cover crop groups
Net returns to corn, by tillage and cover crop groups
Per acre costs by tillage type for soybeans
Per acre costs by tillage type for corn
$0
$100
$200
$300
$400
$500
Conventional tillageConservation tillage + no cover cropsConservation tillage + cover crops
$448$404
$435
0
50
100
150
200
250
300
350
Conventional tillageConservation tillage + no cover cropsConservation tillage + cover crops
$311
$217
$311
($435.21) ($461.25) ($394.07) ($404.40) ($447.93)
$307.10 $266.72 $362.60 $376.66 $324.48
$742.31 $727.96$756.67 $781.06 $772.41
($500)
($4000)
($300)
($200)
($100)
$0
$100
$200
$300
$400
$500
$600
$700
$800
Cover crops (all) Recent adopters Experiencedadopters
Conservation tillage(no cover crops)
Conventional tillage(no cover crops)
RevenueNet returnCosts
($310.69) ($356.10)($236.77) ($217.07) ($311.47)
$172.69 $123.29 $250.61 $251.06 $215.70
$483.38 $479.38$487.38 $455.96 $527.17
($400)
($300)
($200)
($100)
$0
$100
$200
$300
$400
$500
$600
Cover crops (all) Recent adopters Experiencedadopters
Conservation tillage(no cover crops)
Conventional tillage(no cover crops)
RevenueNet returnCosts
Cover crops (all) Recent adopters Experiencedadopters
Conservation tillage(no cover crops)
Conventional tillage(no cover crops)
$310.69 $356.10
$236.77 $217.07
$311.47
$0
$50
$100
$150
$200
$250
$300
$350
$400
Cover crops (all) Recent adopters Experiencedadopters
Conservation tillage(no cover crops)
Conventional tillage(no cover crops)
$435.21 $461.25
$394.07 $404.40 $447.93
$0
$50
$100
$150
$200
$250
$300
$350
$400
$450
$500
Per acre costs by tillage type and cover crop groups, soybeans
Per acre costs by tillage and cover crop groups, corn
Net returns for soybeans, by tillage type and cover crop groups
Net returns to corn, by tillage and cover crop groups
Per acre costs by tillage type for soybeans
Per acre costs by tillage type for corn
Where experienced cover crop adopters save
Significant differences in savings between experienced cover croppers and recent adopters came from cover crop seed, total fertilizer, fuel, machinery, and equipment costs. Experienced cover crop adopters saved $9.19/acre on cover crop seed on corn acres compared to recent adopters, $25/acre on fertilizer, and $25/acre
on equipment. Experienced adopters had similar cost savings on soybeans, including $5.90/acre on cover crop seed, $48/acre on fertilizer and $28/acre on equipment. Tables 9 and 10 present the cost differences associated with cover crop systems, broken up by experienced and recent cover crop adopters.
Continued on the following page

17 // Conservation’s Impact on the Farm Bottom Line
Table 9: Select input cost categories for experienced and recent cover crop adopters, corn
Conventional tillage Conservation tillage Recent cover crop adopters
Experienced cover crop adopters
Cover crop seed $21.16 $11.97
Cover crop planting $8.79 $6.58
Total fertilizer $123.39 $134.14 $136.87 $112.10
Burndown + herbicide $33.09 $35.97 $37.35 $51.33
Fungicide $13.96 $9.31 $10.73 $7.67
Fuel $27.81 $13.70 $16.78 $14.53
Repairs $34.33 $28.25 $28.57 $19.33
Machine hire/application $9.90 $12.37 $14.97 $13.50
Equipment $71.31 $41.67 $50.51 $25.15
Total per-acre input costs $447.93 $404.40 $461.25 $394.07
Table 10: Select input cost categories for experienced and recent cover crop adopters, soybeans
Conventional tillage Conservation tillageRecent cover
croppers + no-till/min-till
Experienced cover croppers + no-till/
min-till
Cover crop seed $15.03 $9.13
Cover crop planting $11.50 $8.92
Total fertilizer $56.84 $29.43 $62.67 $14.67
Burndown + herbicide $33.71 $39.47 $42.69 $39.09
Fungicide $2.85 $10.50
Fuel $25.31 $7.87 $16.03 $9.48
Repairs $29.41 $27.00 $25.86 $17.00
Machine hire/application $8.44 $11.69 $14.18 $6.75
Equipment $57.61 $21.59 $47.92 $19.70
Total per-acre input costs $311.57 $217.07 $356.10 $236.77
Significant differences in savings between experienced cover croppers and recent adopters came from cover crop seed, total fertilizer, fuel, machinery, and equipment costs.

18 // Conservation’s Impact on the Farm Bottom Line
Small adjustments reduce costs
The cost savings experienced adopters see often come from changes they’ve made over time in their seed mix, application, and equipment as they learned to adjust their systems, as well as potential input savings through cover crop impacts on weed pressure and other factors. Based upon the experiences of more than 100 farmers working with SHP to implement cover crops over a 3-5 year period, these types of adjustments can reduce costs over time through several pathways:
The following farmer profiles show how a recent cover crop adopter, Indiana Farmer, is testing different cover crop practices and how experienced cover croppers at Gaesser Farms have achieved a profitable cover crop system since identifying the best “recipe” for their operation.
› Reducing seed costs Experienced adopters can find cost savings by changing suppliers or sources, growing cover crop seed on the operation, using a less costly mix that achieves management goals, or reducing seeding rates to a level that provides good coverage without excess seed cost. This choice is related to seeding method and several years of experience, which can both lead to joint cost savings. This is reflected in the $5-10/acre difference in cover crop seed costs between recent adopters and more experienced adopters.
› Reducing cover crop planting and equipment costs. Although cover crop planting costs do not differ between recent and more experienced cover crop adopters in this study, on average, SHP farmers typically experiment with different species and seeding methods in their first 3-5 years of cover crops. Some find that saving time and labor by broadcasting cover crop seed or contracting the aerial seeding of the cover crop is the best fit for their operation; others find that drilling the seed provides the biggest bang for the buck given their geography, soils and labor constraints. These decisions over time could be related to the reduced equipment costs we see in Tables 9 and 10. For example, a decision
to contract out cover crop seeding or application can save wear-and-tear on equipment, as well as expenses associated with maintenance. One common method to reduce cover crop planting costs is to combine cover crop seeding with other field operations, such as broadcasting seed with a fall fertilizer application and incorporating with a fall tillage pass that was already occurring.
› Reducing fertilizer costs over time Fertilizer costs can be reduced through attention to nutrient management or through improved nutrient cycling. Although most farmers in this study were not using legumes as part of their cover crop mix, which provide nitrogen through fixation, cover crops can contribute to keeping soil (and nutrients) in place, as well as to improve nutrient cycling through improved soil health. In addition to these factors, it is common that farmers in the Soil Health Partnership are adjusting soil health practices and nutrient management practices over time – which can contribute to improved nutrient use efficiency as farmers move away from fall applications of fertilizer and toward in-season applications that can be used more efficiently by the growing crop.

19 // Conservation’s Impact on the Farm Bottom Line
About the farmer• Farm size: 5,800 acres
• Crops grown: corn, soybeans, seed beans, wheat
• Conservation practices: no-till, strip-till, cover crops
• Conservation goals: reduce overall tillage, improve soil structure while reducing machinery and overhead costs
About the conservation system• Started adopting strip-till, no-till and cover crops
three years ago
• Evaluating different methods of cover cropping before expanding across the farm
• Began cover crops on 25 acres – has expanded to 5% of his ground
• Cover crops are targeted on acres that could benefit the most from erosion control
• Partnering with SHP on a 70-acre strip trial looking at conventional tillage, strip-tillage with cover crops, and no-till with cover crops
Indiana Farmer sees cover crops as a long-term investment, but recognizes that timing and logistics are hard in his area. That’s one of the reasons he prioritizes data collection efforts with SHP. “The big thing we were interested in was strip-tillage and cover crops. We didn’t want to just jump into it and go full bore,” he said. “We wanted to see how things worked for us, rather than just spending a lot of money up front.”
Profitability impactsWith only three years of experience with cover crops, Indiana Farmer is still identifying the best recipe for his farm and weather conditions. He has not yet found the input cost savings seen by experienced cover croppers in our study; since adopting strip-till and cover crops, he has made one extra burndown pass on both corn and soybeans to terminate cover crops and clean up the seedbed.
Indiana Farmer is working directly with SHP staff to identify ways to improve his cover crop system and save costs. One of the biggest adaptations he is considering is moving from aerial application (which costs $10/acre) to a more direct incorporation method, either through a high-boy applicator to get the seed directly on the ground, a fertilizer spreader truck, or through a high-speed disk and box. In addition to cost savings, Indiana Farmer believes a change in seeding method could also increase stand count and plant vigor, ultimately increasing nitrogen uptake.
Farmer Profile:
Indiana FarmerExperimenting to identify the most cost-effective cover crop approach
Farmer Profile:
Gaesser Farms – IowaMaking cover crops profitable through efficiencies
20 // Conservation’s Impact on the Farm Bottom Line
About the farmer• Owner: Chris Gaesser
• Farm Size: 4,855 acres
• Crops Grown: corn, soybeans
• Conservation practices: no-till, cover crops, nutrient management
• Conservation goals: implement cover crops on a large-scale in a cost-effective manner without significant external funding programs, prevent erosion
About the conservation system• Committed to identifying cost efficiencies in their
system, which has been key to getting cover crops on more acres
• Tailors cover crop usage across farms based on time constraints and cost-effectiveness, prioritizing owned fields and fields under long-term contracts
• Originally planted annual ryegrass, but eventually transitioned to cereal rye
• Moved from aerial application of cover crop seed to broadcasting and drilling
• Trialing seeding cover crops into standing soybeans toward the end of the season
Profitability impactsOne of Chris’s primary goals in working with cover crops was to implement them in a cost-effective way across large areas of his farm – and he wanted to know that the cover crop system was financially sustainable without large financial incentives. “We wanted to know that the management system would work, even without program funding,” Chris told us. In order to make cover crops financially sustainable, he has:
› Selected a species that gives the biggest bang for the buck.
Although they began working with annual ryegrass, they found it to be difficult to terminate and not very cold tolerant. They also tried oats, but finally settled on cereal rye due to its ability to overwinter, strong growth in the spring, ease of termination and cost effectiveness.
› Reduced cost of application by moving away from aerial seeding and using existing equipment.
Over time, Chris moved from aerial application of cover crop seed, which he found to be costly and had inconsistent emergence, to broadcasting and drilling the seed himself. He is trialing seeding cover crops into standing soybeans toward the end of the season, using the same tracks as the last spray pass to protect soybean yield. These efficiencies have been key to getting cover crops out on more acres.
› Reduced costs by growing their own cover crop seed.
Chris’s seed costs are lower ($7/acre) than most of the farmers we worked with for this study because he grows his own cereal rye cover crop seed on approximately 100-150 acres (he also generates additional income by selling the seed they don’t use). Keeping seed costs down also drives savings when considering the large number of acres Gaesser Farms cover crops.
Decision making based on long-term valueWhile Chris prioritizes owned land and ground under long-term contracts because it makes the most sense cost-wise, he is committed to communicating the benefits of cover cropping to the landowners he rents from. He highlights cover cropping as a way to preserve their assets through better soil health – making the land more manageable and forgiving, both in drought and wet conditions.

21 // Conservation’s Impact on the Farm Bottom Line
Success with Conservation Practices is Optimized with a Targeted, Stepwise, Tailored Approach
Overview:
No two farms are the same, but common success factors emerged among our farmers which may help others in the transition to conservation practices
Farmers had clear goals they wanted to achieve with conservation practicesWhen deciding which approach to take, how to tailor a practice, and evaluating success, our farmers benefited from clearly defined objectives. Two goals were especially prevalent:
1. Improving soil structure to help with erosion control and water holding capacity
2. Reducing hours on the tractor to save time, machinery and overhead costs
Each farmer reached these goals in their own unique way – ranging from reducing tillage intensity to adopting cover crops to some combination of the two – and all have seen positive outcomes as a result of clearly knowing where they wanted to head.
Farmers approached cover crops and conservation tillage differentlyEarlier sections of this report detail the different financial dynamics at play between conservation approaches. Those dynamics impacted how participating farmers implemented a practice, based on their financial goals and comfort levels:
› Conservation tillage: Most farmers made a wholesale change with associated equipment updates, with the knowledge they could achieve short-term cost savings.
› Cover crops: Most farmers took a stepwise approach to testing seed varieties, seeding methods, and weed pressure outcomes, with the knowledge that the cost savings and soil health benefits from cover crops take longer.
While we would love to see a broader shift to cover crops, in the same way we see those changes in tillage practices, we found that – as long as expectations are clearly set up front and in alignment with long-term goals – growers are comfortable taking their time to “get it right” so they are confident when they make the choice to rollout the practice on a larger scale. Programs like SHP help make this transition easier by providing support in testing and measuring the outcomes of their adoption of conservation systems.
Conservation practices were prioritized based on individual farm needsSince most farmers face time and practicality constraints in adopting conservation practices across all acres, our farmers targeted specific fields or prioritized the biggest challenges needing a solution to maximize the effectiveness of their practices. Examples of this included:
• Using cover crops in fields with swales to retain soil during heavy rain events
• Changing conservation practices based on crop rotation
• Choosing to cover crop owned or long-term contracted ground over land with high rent
Although farmers differed on tactics for tailoring their cover crop systems, they all identified the most effective ways to test, adapt, and scale their conservation practices.
›

22 // Conservation’s Impact on the Farm Bottom Line
What Comes Next?
As our study demonstrates, conservation practices do not pay for themselves in all situations. The business case for adopting these practices is complex and variables that differ across farms – including soil type, precipitation, geography and crop rotation – can alter the optimal financial conservation system. However, as this and other studies have shown, adopting conservation systems can be profitable and can provide solutions for natural resource and management challenges. It is therefore important to provide more and increasingly refined financial information about conservation practices to farmers from different geographies, farm sizes and crop productions.
Financial information on conservation practices is especially important for stakeholders to gather and communicate, since groups across the agriculture sector are raising their sustainability ambitions and
looking to invest in environmental solutions. But, like any other investment, financial support for adopting agricultural conservation practices must be informed by the underlying costs and benefits that occur over time. Gathering financial and management data to better understand the financial impacts of conservation practices can help develop solutions that effectively provide the financial support farmers need to achieve profitable conservation management systems.
With that in mind, we encourage stakeholders across the agriculture sector – including federal and state agencies, farmer associations, agricultural lenders, food and grain supply chain companies, and conservation organizations – to integrate financial data gathering within their programs to inform their conservation solutions and to support farmers in establishing profitable conservation systems.
…like any other investment, financial support for adopting agricultural conservation practices must be informed by the underlying costs and benefits that occur over time.

soilhealthpartnership.org edf.org kcoe.com