Embed Size (px)
Citation preview

Conservation versus Equity: Can Payments forEnvironmental Services Achieve Both?
Miriam Vorlaufer, Marcela Ibanez, Bambang Juanda,and Meike Wollni
ABSTRACT. Based on a framed field experiment, weinvestigate the trade-off between conservation andequity in the use of payments for environmental ser-vices (PES). We compare the effects of two PESschemes that implicitly incorporate different distrib-utive justice principles: a flat-rate payment per bio-physical unit conserved and a redistributive paymentbased on the Rawls maxi-min distributional principle.The main findings indicate that the introduction of aredistributive scheme can function as a multipurposeinstrument. Under the assumed condition that partic-ipants with lower endowments face higher opportu-nity costs of conservation, it realigns the income dis-tribution in favor of low-endowed participantswithout compromising conservation outcomes. (JELQ15, Q57)
I. INTRODUCTION
Payments for environmental services(PES) aim to create, conserve, and restore nat-ural resources by creating a market in whichbuyers compensate providers who voluntarilyaccept to forgo benefits in order to provide awell-defined service (Alix-Garcia, De Janvry,and Sadoulet 2008; Jack, Kousky, and Sims2008; Muradian et al. 2010; Engel, Pagiola,and Wunder 2008; Pascual et al. 2010). Al-though PES are proposed as an efficient in-strument to promote conservation comparedto traditional command-and-control mecha-nisms (Pagiola, Arcenas, and Platais 2005),critics argue that PES are regressive, as theyprivilege a few large-scale landholders, whoare often the least-cost suppliers of environ-mental services (Pascual et al. 2010; Narloch,Pascual, and Drucker 2013; Muradian et al.2010). In addition, the environmental effec-
Land Economics • November 2017 • 93 (4): 667–688ISSN 0023-7639; E-ISSN 1543-8325� 2017 by the Board of Regents of theUniversity of Wisconsin System
tiveness and efficiency of PES schemes arecontested, as the large-scale landholdersmight have conserved their land even in theabsence of PES schemes (Wunder 2005).
In the majority of PES schemes, poor land-holders tend to be excluded from participationor lack adequate benefits generated throughPES adoption (Landell-Mills 2002; Zbindenand Lee 2005; Grieg-Gran, Porras, and Wun-der 2005; Corbera, Brown, and Adger 2007;Sommerville et al. 2010). Hence, practitioners(e.g., NGOs, government agencies) have pro-posed that PES shall be used as a win-winmechanism for both environmental protectionand poverty alleviation (Landell-Mills andPorras 2002; Pagiola, Arcenas, and Platais2005; Grieg-Gran, Porras, and Wunder 2005;Corbera, Brown, and Adger 2007; Muradianet al. 2010; Corbera and Pascual 2012; Nar-loch, Pascual, and Drucker 2013; Muradian etal. 2013). In this paper we investigate the po-tential of using PES as a multipurpose instru-ment to promote conservation and enhanceequity.
PES schemes can vary in terms of the rela-tive importance given to efficiency and equityconcerns and thus the implicit concept of dis-tributional justice. Pascual et al. (2010) iden-tify several implicit distributive justice prin-ciples in PES, including accountability-based,egalitarian, and Rawlsian principles. Ac-
The authors are, respectively, doctoral researcher, De-partment of Agricultural Economics and Rural De-velopment, Georg-August-University Gottingen,Gottingen, Germany; professor, Research Centre, Eq-uity, Poverty and Growth, Georg-August-UniversityGottingen, Gottingen, Germany; professor, Depart-ment of Economics, Bogor Agricultural University(IPB), Kampus Darmaga, Bogor, Indonesia; and pro-fessor, Department of Agricultural Economics andRural Development, Georg-August-University Got-tingen, Gottingen, Germany.

November 2017Land Economics668
countability-based principles seek to compen-sate service providers according to their actualecosystem service provision and thereby placemajor emphasis on the efficient allocation ofgiven funds to achieve maximum conserva-tion outcomes. However, such a payment rulerests on comprehensive data requirements,which are often not available in practice. PESschemes based on an egalitarian principle paya flat rate per biophysical unit conserved (e.g.,per hectare), which thus does not equate withthe marginal benefit of ecosystem service pro-vision. However, due to their relative ease ofimplementation, flat-rate PES schemes arewidely used in practice.1
Depending on the initial distribution of re-sources and returns to these resources amonglandholders, both egalitarian and account-ability-based schemes may perpetuate andeven exacerbate prevailing inequalities. Incontrast, PES schemes based on the Rawlsianprinciple seek to maximize the welfare of themost disadvantaged, by offering higher pay-ments per biophysical unit conserved topoorer landholders. Such redistributive PESschemes thus consider the reduction of in-equalities as an explicit goal, irrespective ofthe marginal benefits and costs of the provi-sion of ecosystem services. In this paper, weaddress the questions of whether the imple-mentation of a redistributive PES scheme thatoffers differential payments improves distri-butional outcome in favor of the disadvan-taged and whether this comes at the cost ofconservation outcomes. In our analysis, con-servation outcome is measured as the net im-pact on land units conserved2 and is com-pared to the situation where a flat-ratepayment rule is in place.
To investigate the effect of two PESschemes with different implicit distributivejustice principles, we conducted a framed fieldexperiment where participants make decisionsin a controlled and incentive-compatible en-
1 An example of a PES scheme that is based on an egal-itarian principle is the nationwide forest conservation pro-gram (FONAFIFO) in Costa Rica.
2 Environmental outcome should ideally be measured asadditional environmental services provided. However, theseare difficult to measure, and therefore in practice, roughproxies such as land units conserved are often used to quan-tify the environmental impact of a policy.
vironment. To increase the external validity ofour study, we conducted the experiment withIndonesian farmers, who in their daily lifeface the decision to cultivate rubber agroforestand oil palm. In Jambi province, rubber agro-forest area has continuously declined due tothe growing demand for oil palm area. Thepractice of rubber agroforestry, while gener-ating a lower private profit than oil palm, gen-erates positive externalities, such as increasedbiodiversity (Barnes et al. 2014). In this con-text, PES to protect rubber agroforestry hasbeen identified as a promising tool to inter-nalize externalities and foster sustainable landuse (Villamor et al. 2011).
Our design builds on an investment gamewhere households, who differ in terms of theirland endowment, decide how to allocate theirland between oil palm and rubber agrofores-try. Mimicking real-life conditions in the ex-periment, the practice of rubber agroforestry,while generating lower private profit than oilpalm, is associated with positive externalitiesthat benefit other group members. In line withthe observation that in our research areasmall-scale family farms tend to obtain higheroil palm yields compared to large-scale familyfarms, participants with lower endowmentshave a higher marginal incentive to invest inoil palm (equivalent to higher opportunitycosts of conservation) than participants withhigh endowments. In our analysis, we com-pare participants’ land allocations to rubberagroforestry and the associated income distri-butions under a flat-rate and a redistributivePES scheme.
A central assumption in our experimentaldesign is that participants with low endow-ments have a higher marginal incentive to cul-tivate oil palm and thus higher opportunitycosts of conservation. To what extent this ap-plies to small-scale farmers in reality is de-bated in the literature. Pagiola, Arcenas, andPlatais (2005) show that the desire of the poorto participate in a PES scheme is often re-stricted by low marginal incentives to allocatescarce resources to conservation. Some au-thors have explained this based on the need ofthe poor to use their limited endowments togenerate income for survival (Baland andPlatteau 1999; Narloch, Pascual, and Drucker2013). In contrast, other scholars point out
93(4) Vorlaufer et al.: Conservation versus Equity 669
that poor households are likely to have highermarginal incentives for conservation as theytend to own marginal land of low soil fertility,resulting in lower productivity of commercialcrops like oil palm. In our research area, thisdoes not seem to be the case, as we observe anegative relationship between cultivated landsize and land productivity among oil palmfamily farms. From a policy perspective, thescenario considered in our experiment is mostinteresting. If small landholders had lowermarginal incentives to invest in oil palm thanlarger landholders, they would more readilybenefit from the introduction of PES in anycase (no equity-efficiency trade-off). It is thisspecific scenario of small landholders havinghigh incentives to cultivate oil palm, wherewe are likely to observe a conflict betweenconservation and equity goals. Nonetheless,before implementing an actual PES scheme,key parameters should be validated in the lo-cal context.
Several authors have used framed field ex-periments to investigate the role of PES-likeincentive schemes on conservation decisionsbetween homogenous resource users (e.g.,Vollan 2008; Travers et al. 2011; Kerr, Var-dhan, and Jindal 2012). Expanding on theseprevious studies, we explicitly incorporateheterogeneity among participants, which al-lows us to focus on the distributional effectsof PES schemes. We consider in our experi-ment not only endowment heterogeneity (seeCherry, Kroll, and Shogren 2005; Narloch,Pascual and Drucker 2012; Reuben and Riedl2013) or only productivity heterogeneity (seeCardenas, Stranlund, and Willis 2002; Reubenand Riedl 2013), but similar to Chan et al.(1999) we assume that participants with dif-ferent endowments also differ with respect totheir marginal incentive to conserve. This ex-tension allows us to capture potential trade-offs between distributional and conservationoutcomes when comparing redistributive andflat-rate PES schemes.
To the best of our knowledge only the pa-per by Narloch, Pascual, and Drucker (2012)implemented a framed field experiment (usinga public good game) with endowment hetero-geneity in the context of PES. While they con-sider how individual versus collective rewardschemes affect conservation, we focus on the
distributive principles of PES. Therefore, ourpaper is also complementary to former studiesthat have attempted to capture the effect ofdifferent distributive justice principles on PESusing microsimulation modeling (Alix-Gar-cia, De Janvry, and Sadoulet 2008; Borner etal. 2010). Unlike microsimulation studies, ourexperimental approach allows capturing theeffect of intangible factors associated withpolicy design, such as the local norms of whatis perceived as fair or equitable (Kosoy et al.2007; Rodriguez-Sickert, Guzman, and Car-denas 2008; Sommerville et al. 2010; Nar-loch, Pascual, and Drucker 2013).
II. BACKGROUND
Among the countries that faced significantlosses in forestland between 1990 and 2005,Indonesia ranks second with regard to the ab-solute decline in forest area (280,000 km2)(World Trade Organization 2010). Rapid oilpalm expansion has been identified as a majordriver of deforestation (Koh et al. 2011). Es-timates suggest that between 1990 and 2005at least 56% of the oil palm expansion in In-donesia occurred at the expense of tropicalrainforest (Koh and Wilcove 2008). Laumon-ier et al. (2010) document that between 1985and 2007, forest cover in Sumatra declinedfrom 57% to 30%. Jambi province is amongthe areas on Sumatra that experienced themost drastic forest losses during this time span(Laumonier et al. 2010).
The transformation of tropical lowlandrainforest was initially driven by the trans-mi-grant program, which was launched by the In-donesian government in the early 1980s to re-locate households from the overpopulatedisland of Java to the less populous islands ofSumatra and Kalimantan (Feintrenie and Lev-ang 2009; Feintrenie, Chong, and Levang2010; Gatto, Wollni, and Qaim 2015). Morerecently, new oil palm plantations have in-creasingly been established by independentsmallholder farmers (Euler et al. 2016; Eka-dinata and Vincent 2011). Between 2000 and2010, the oil palm area in Indonesia almostdoubled from 4.2 million ha to around 8 mil-lion ha (Obidzinski et al. 2012). This expan-sion took place mostly on the islands of Su-matra and Kalimantan, which concentrate
November 2017Land Economics670
66% and 30% of the national oil palm area,respectively (Rianto, Mochtar, and Sasmito2012). In the near future, further expansionsare planned, and local governments have ear-marked 18 million ha, mainly located on theislands of Kalimantan, Sulawesi, and Papua(Jakarta Post 2009).
For many rural households the growing oilpalm sector offers an attractive pathway outof poverty (in 2010, 38% of the total oil palmarea was managed by smallholder farmers)(Rianto, Mochtar, and Sasmito 2012; McCar-thy, Gillespie, and Zen 2012).3 At the sametime, oil palm expansion in Indonesia hasbeen associated with significant social con-flicts and negative environmental impacts(Colchester et al. 2006; Belcher and Schreck-enberg 2007; McCarthy, Gillespie, and Zen2012). The transformation of complex landuse systems into oil palm plantations has beenidentified as a major factor in the significantloss in biodiversity (Danielsen et al. 2009;Wilcove and Koh 2010) and ecosystem func-tioning (Barnes et al. 2014).
Since primary lowland rainforest has beenalmost completely converted into more inten-sive land uses, currently rubber agroforestrysystems are the most extensive forestlike veg-etation type in Jambi province. Rubber agro-forestry, which has been in place since theearly twentieth century in Jambi province, isa smallholder cultivation system that com-bines the cultivation of a perennial crop (i.e.,rubber) with other plants such as timber andfruit trees, building/handicraft trees, andmedical plants. From a biodiversity view-point, rubber agroforestry mimics secondaryforest, since it incorporates the components ofspontaneous secondary vegetation (pioneer,postpioneer and late-phase species4) (Beu-
3 Private enterprises managed 58% of the total oil palmarea in 2000, dropping to 54% in 2010. Meanwhile the shareof smallholder plantations increased from 28% to 38% inthe same period (Rianto, Mochtar, and Sasmito 2012).
4 In the pioneer stage, the first stage after slash and burn,heliophilous crops (such as rice and vegetables) function aspioneers, inhibiting weeds. This stage creates a favorablemicroclimate for tree species (such as rubber, fruit, and tim-ber trees). Postpioneers are fast growing species such as cof-fee or pepper, maintaining a favorable biophysical environ-ment for the main perennial crops (such as rubber). After 15to 20 years rubber agroforestry systems simulate complex
kema et al. 2007; Feintrenie and Levang 2009;Feintrenie, Chong, and Levang 2010). Inrubber agroforestry systems, fertilizer andpesticide applications are rarely reported.Weeding is limited to paths, which allow thetapping of the rubber trees. Beukema et al.(2007) show that rubber agroforestry systemsincorporate high levels of bird and plant spe-cies richness and are more similar to neigh-boring forest than to oil palm monocultures.Ecological functions of the forest such as wa-ter flow regulation and soil protection can bepreserved in rubber agroforestry systems(Feintrenie and Levang 2009). While the con-version of tropical forest to any managed landuse system is associated with losses in carbonstorage, rubber agroforestry systems still faremuch better in terms of carbon sequestrationpotential in comparison to monoculture oilpalm plantations (Kotowska et al. 2015).5
Despite the environmental benefits ofrubber agroforestry, oil palm and rubber mon-ocultures are often preferred by farmers dueto their higher economic profitability.6 For thecase of Jambi, Feintrenie, Chong, and Levang(2010) estimate that the relative profit of agro-forestry represents approximately 61% to69% of the profit of oil palm and about 50%of the profit of rubber monoculture, dependingon relative prices.7 Furthermore, technical
secondary forests, reaching maximum canopy height of 20to 40 m (Feintrenie and Levang 2009).
5 Kotowska et al. (2015) find that total biomass in thenatural forest (mean: 384 Mg/ha) was more than two timeshigher than in rubber agroforestry (147 Mg/ha) and morethan four times higher than in monoculture rubber and oilpalm plantations (78 and 50 Mg/ha). Net primary productiv-ity was highest in oil palm (33 Mg/ha/yr) compared to nat-ural forest (24 Mg/ha/yr), rubber agroforestry (20 Mg/ha/yr), and rubber plantations (15 Mg/ha/yr). Yet, in oil palmmore than 50% of the carbon was sequestered in the fruitsand thus exported through harvest and released into the at-mosphere.
6 To the best of our knowledge, no previous studies havequantified the economic value of the environmental effectsof rubber agroforestry.
7 Only the study by Feintrenie, Chong, and Levang(2010) compares the profitability of oil palm monoculture,rubber monoculture, and rubber agroforestry in Jambi prov-ince. Considering relatively high rubber and palm oil prices(July 2008), they estimate an average return to land basedon a full plantation cycle of €2,100/ha for oil palm, €2,600/ha for rubber plantations, and €1,300/ha for rubber agrofo-restry. With low rubber and palm oil prices (November2008), average returns to land decrease to €990/ha for oil

93(4) Vorlaufer et al.: Conservation versus Equity 671
characteristics, in particular lower labor re-quirements, and the encouragement and sup-port by the government and private oil palmcompanies may explain farmers’ preferencesfor oil palm compared to rubber. As a result,the remaining rubber agroforestry area inJambi province is threatened by conversioninto monocultures, in particular, oil palmplantations.
Payments for environmental services havebeen proposed as an option to counteract thethreat of rapidly decreasing agro-biodiversityin Jambi province (Villamor et al. 2011). In-centive schemes developed under the frame-work of Reduced Emissions from Deforesta-tion and Degradation (REDD+ ) may targetrubber agroforestry,8 given its positive carbonimpacts compared to oil palm plantations(Kotowska et al. 2015). Our research aims toinform the development and design of market-based incentive schemes offering monetaryincentives for the provision of ecosystem ser-vices, such as agro-biodiversity conservationand carbon sequestration.
III. CONCEPTUAL FRAMEWORK
The Producer Problem
We consider a partial equilibrium model inwhich farmers individually decide how to al-locate their land, L, between rubber agrofo-restry and oil palm cultivation.9 The privateprofit of rubber agroforestry is lower than the
palm, €1,300/ha for rubber, and €690/ha for rubber agrofo-restry.
8 There is an ongoing discussion whether to allow rubberagroforestry through Hutan desa (village forest) to be in-cluded as a land use in the REDD+ scheme (see Pramovaet al. 2013; Villamor et al. 2011).
9 Although rubber monoculture is still an important landuse type in the research area (see our descriptive statistics),oil palm is the land use type most rapidly expanding (andthus threatening biodiversity) in the region (Gatto, Wollni,and Qaim 2015). Therefore, in the conceptual frameworkand in the experimental design we focus only on the choicebetween oil palm and rubber agroforestry. The model couldbe extended to consider rubber monoculture as a third alter-native. In this case, the decision to choose rubber agrofo-restry would depend on the net return and negative exter-nalities of two production systems, oil palm and rubbermonoculture. Given that our main interest is to consider theimpacts of alternative payment schemes on conservation,this would complicate the model unnecessarily.
profit generated from oil palm cultivation.Hence each land unit allocated to oil palm, x,yields a return of 1, while each land unit al-located to rubber agroforestry gives a return
. Assuming that all land units need to bea <1distributed, the number of land units allocatedto rubber agroforestry equals . RubberL − xagroforestry generates positive environmentaleffects such as improved water quality, in-creased soil fertility, and higher biodiversity.Let b be the positive externalities for N com-munity members, generated by each unit ofland allocated to rubber agroforestry.
Furthermore, we take into account that pro-ducers are heterogeneous in terms of the sizeof available land and also vary with respect totheir relative return from rubber agroforestry,and thus their marginal incentive to cultivateoil palm. Type 1 producers have land endow-ments and a marginal return from rubberLLagroforestry . In contrast, type 2 producersaLhave land endowments and a marginal re-LHturn from rubber agroforestry . We consideraHthe particular case where , andL < LL H
. Hence, type 1 producers are smallera < aL H(in terms of land endowment) and relativelyless productive in rubber agroforestry thantype 2 producers. As the marginal return ofrubber agroforestry is set to be lower for type1 producers, they have a higher individualmarginal incentive to cultivate oil palm thanhigh-endowed participants ( ).1− a <1− aH L
This model can be extended by consideringthat producers have an intrinsic motivation toconserve. We thus assume that producers ex-perience a moral cost of transforming theirland into oil palm, M, which is a function ofan individual parameter , capturing the im-ciportance that the individual gives to conser-vation, and the individual area cultivated withoil palm, . Similar to Ibanez and Martinssonxi(2013), we assume that the moral cost oftransformation is given by , implying2M = c xi ithat the cost increases at an increasing ratewith an increase in the area cultivated in oilpalm.10 The optimization problem for the in-dividual producer is given by
10 The moral cost is related to one’s own conscienceaddressing concerns about the effect of one’s decisions onneighbors (as described by Sheeder and Lynne 2011), or

November 2017Land Economics672
N2max U = x + a (L − x )+ b (L − x )− c xi K K,i i � K,j j i i
x j≠ ii
for K = L,H, [1]
where the subindex K denotes producer typeL or H. If , the first-order condition1− a >0Kimplies that individual producers who deriveno intrinsic utility from conservation ( )c = 0iwould specialize and allocate all land units tooil palm cultivation. For producers who givea certain importance to conservation ( ),c >0ithe optimal area cultivated with oil palm, *xiis given by
1−aK,i*x = . [2]K,i
2ci
Since , we would expect that in thea < aL Habsence of payments for environmental ser-vices, type 1 producers—with low endow-ments of land and high marginal incentive toinvest in oil palm—allocate a smaller fractionof land to rubber agroforestry than type 2 pro-ducers—with high endowments of land andlower marginal incentive to invest in oil palm.
The Social Planner Problem
The problem for the social planner is tomaximize social welfare by selecting the op-timal amount of land to be transformed to oilpalm cultivation. For a society that is com-posed of N producers, the problem of a socialplanner is to maximize the sum of theweighted utility of all individuals:
N
max W = w [x + a (L − x )� i i K K,i ix = (x , . . . , x ) i = 1i N
N2+ b (L − x )− c x ], [3]� K,j j i i
j ≠ i
where wi represents the weights that the socialplanner gives to the different individuals suchthat , and K represents a subindexN w = 1� ii = 1for type 1 (L) and type 2 (H) producers. Asocial planner who has preferences for pro-gressive redistribution could give a higher
more abstract concerns such as the moral cost of seeing allforest cleared for oil palm.
weight to the utility of low-endowed than tothe utility of high-endowed participants( ).w > wL H
Defining as the relative weightv = w /wL Hthat the low-endowed participant has in com-parison to the high-endowed participant, andassuming that there are two type 1 producersand one type 2 producer, the optimal alloca-tion of land to oil palm from the social pointof view is and*x = [1− a − b(1/v +1)]/2cL L i
, for producers type 1*x = (1− a −2vb)/2cH H iand type 2, respectively. From the social plan-ner point of view, the amount of land that eachindividual should invest in oil palm is lowerthan the optimal investment from an individ-ual point of view, as the social planner wouldinternalize the negative externality that oilpalm production imposes on other individ-uals. In order to induce producers to internal-ize the positive externalities associated withconservation, the social planner could offermonetary incentives, such as payments for en-vironmental services (PES), and thereby re-duce the divergence between private and so-cial optimum levels of land allocated to oilpalm.
Payments for Environmental Services
Modeling PES as an increase in the relativeprofit of rubber agroforestry, , it isa + PESKstraightforward to show that keeping every-thing else constant, the proportion of land al-located to rubber agroforestry increases withthe introduction of PES. Yet, the effect of theintroduction of a flat-rate PES scheme on theproportion of land endowment contributed toconservation would be different for type 1 andtype 2 producers. This leads to our first hy-pothesis:
Hypothesis 1. The implementation of a flat-rate PES scheme will result in a larger in-crease in the proportion of land conserved fortype 1 producers with low endowments andhigh marginal incentive to invest in oil palmthan for type 2 producers with high endow-ments and low marginal incentive to invest inoil palm. (Proof 1 in Appendix A.)
Since the introduction of a flat-rate PESscheme induces a larger marginal change in
93(4) Vorlaufer et al.: Conservation versus Equity 673
the proportion of land allocated to rubberagroforestry for type 1 producers than for type2 producers, and the PES scheme does notfully compensate for the forgone benefits, theimplementation of the flat-rate PES schemeresults in an increase in income inequality be-tween type 1 and type 2 producers.
Hypothesis 2. Assuming that the individualmoral costs of cultivating oil palm arec , ci jequal in absolute values, that is, ac = c = c,i jflat-rate PES scheme might increase inequal-ity by generating a larger reduction in the in-come of type 1 producers relative to type 2producers. (Proof 2 in Appendix A.)
A social planner that takes into account thedistributional outcome might consider usingPES not only to increase conservation, butalso to reduce inequality. Hence, this socialplanner might choose a redistributive PESscheme, offering higher payments to type 1producers with low endowments and lowerpayments to type 2 producers with high en-dowments.
Hypothesis 3. A redistributive PES schemethat reallocates payments toward the low-en-dowed participants and hence results in ahigher payment for low-endowed participantsin exchange for a lower payment for high-en-dowed participants, decreases income in-equality compared to a flat-rate PES scheme.(Proof 3 in Appendix A.)
Last but not least, we address the questionof whether using PES as a redistributivemechanism necessarily compromises conser-vation outcomes. While the proportion of landconserved by high-endowed and low-en-dowed participants is affected by the differentpayment mechanisms considered here, we hy-pothesize that at the aggregate level, conser-vation outcomes will not diverge significantlybetween the different PES schemes.
Hypothesis 4. The redistributive PES schemedoes not lead to a reduction in the increase inthe conservation area at the aggregate levelcompared to a flat-rate PES scheme. (Proof 4in Appendix A.)
IV. EXPERIMENTAL DESIGN ANDPROCEDURES
To empirically test our model we set up aninvestment game. Participants were randomlymatched into groups of three. Two partici-pants in the group were endowed with 5 ex-perimental units of land ( ); one partic-L = 5Lipant received 10 experimental units of land(LH = 10). Considering the rubber agrofores-try and oil palm profitability estimates forJambi province by Feintrenie, Chong, andLevang (2010) as a benchmark, the relativeprofit of rubber agroforestry of low-endowedparticipants was set to , and that ofa = 0.5Lhigh-endowed participants to . Thus,a = 0.6Has described before, our experimental setupincludes endowment heterogeneity, and weimplicitly consider the case where low-en-dowed participants have a higher marginal in-centive to cultivate oil palm.
To capture perceptions and preferences as-sociated with the two cultivation systems, theendowment allocation decision was framed asa cultivation decision between oil palm andrubber agroforestry. To illustrate these invest-ment options, pictures of the two systemswere presented to the participants. Each par-ticipant decided individually, how much ofher endowment to allocate to oil palm andrubber agroforestry, respectively. We ex-plained to participants that rubber agrofores-try has positive effects on the environment,which in the experiment translate into higherpay-offs for other group members. Accord-ingly, each land unit allocated to rubber agro-forestry increased the income of other groupmembers by .11b = 0.2
Experimental Treatments
Our experiment uses a within-between sub-ject design. The within-subject design wasused to capture individual preferences forconservation and test how changes in conser-vation incentives interact with these prefer-ences. Hence, each participant played three
11 Since there are no estimations on the economic valueof the environmental externalities of rubber agroforestry, weassumed this value. Future research should quantify theseeffects.

November 2017Land Economics674
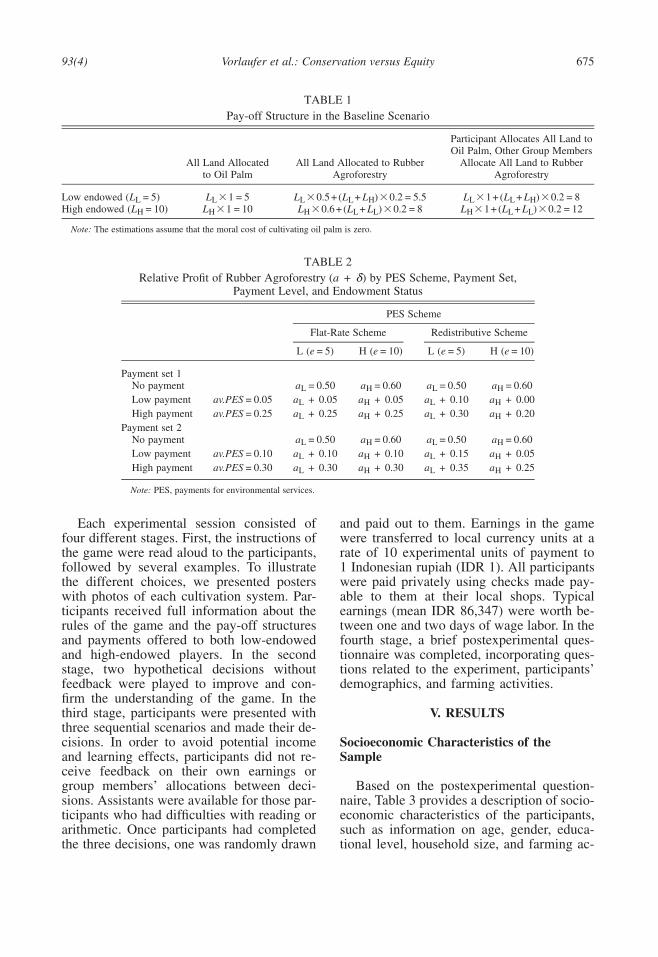
scenarios that were presented as sequentialdecisions. In each scenario, we varied themonetary incentives for conservation. In thefirst scenario, or decision, participants decidedhow to allocate their endowment without anyPES. This first decision allows us to captureindividual heterogeneity in preferences forconservation. Moreover, this decision allowsus to build a baseline against which we cancompare the effect of PES on conservationand equity. Table 1 shows the pay-off struc-ture in the baseline scenario, when we assumeno moral cost of cultivating oil palm ( .c = 0)iUnder this scenario and assumption, it can beseen that low-endowed participants are betteroff if all land is allocated to rubber agrofores-try, whereas high-endowed participants arebetter off if all land is allocated to oil palm.12
Irrespective of their type, individual partici-pants benefit most if they invest their endow-ment in oil palm (given that , i.e.,1− a >0Kthe marginal incentive to invest in oil palm ispositive).
In Scenarios 2 and 3, payments for envi-ronmental services, δ, associated with thepractice of rubber agroforestry were intro-duced. The marginal incentive per unit of landendowment allocated to rubber agroforestrywas . Each participant played one1− a − δscenario with a low and one with a high pay-ment level. Since we were interested in testingthe effect of different payment levels withoutcreating a high cognitive load for participants,we used two payment sets that were randomlyallocated to participants. The first payment setoffered relatively lower payments comparedto the second payment set. Moreover, to con-trol for order effects, the decision sets werepresented in different orders to participants.Hence, half of the participants received a lowpayment in the second decision and a highpayment in the third decision, whereas theother half received a high payment first, anda low payment subsequently.
12 The total gain that low-endowed participants receivewhen all endowment is allocated to rubber agroforestry issmaller than the loss experienced by high-endowed partici-pants. However, this could be justified, if the weight attachedto the welfare function of low-endowed participants is suf-ficiently high ( ).w >2w1 2
Finally, the between-subject design allowsus to compare the conservation and distribu-tional outcomes of the two alternative PESschemes: a flat-rate payment rule and a redis-tributive (Rawlsian maxi-min) payment rule.Each participant took part in only one of thetwo PES schemes. In the flat-rate PESscheme, high- and low-endowed participantswere offered a unitary payment for each unitof land conserved ( ). In the redistrib-δ = δL Hutive PES scheme, low-endowed participantsreceived a higher payment than high-endowedparticipants per unit of land conserved( ). This payment rule implies thatδ > δL Hhigher payments are given to the more costlyproviders of conservation units and may thusresult in a trade-off between redistributive andconservation goals. To compare the two alter-native PES schemes, and to avoid generatingincome effects, the average payment per unitconserved (average PES) was kept constantacross the two alternative PES schemes. Table2 depicts the marginal private incentive to in-vest in rubber agroforestry ( ) by endow-a + δment status (L, H), payment set (1, 2), pay-ment level (none, low, high), and PES scheme(flat-rate, redistributive).
Procedures
The experiment was conducted in four vil-lages in the Batanghari district (Jambi prov-ince); two autochthonous13 villages (PulauBetung, Karmeo), which were not targeted bythe governmental trans-migration program,and two trans-migrant villages (Bukit Hara-pan, Bukit Sari). In total, 32 experimental ses-sions were carried out between November2012 and March 2013. Participants were ran-domly selected among household heads of oilpalm and/or rubber cultivating families usingvillage census information. A total number of260 farmers took part in the experiment. Alldecisions were made anonymously, and infor-mation on group membership or identity wasnot revealed to participants. Thus, the com-position of their group was unknown to theparticipants.
13 In this context, “autochthonous” refers to villages thatwere formed by indigenous people from the local area, asopposed to villages formed by migrants or their descendants.
93(4) Vorlaufer et al.: Conservation versus Equity 675
TABLE 1Pay-off Structure in the Baseline Scenario
All Land Allocatedto Oil Palm
All Land Allocated to RubberAgroforestry
Participant Allocates All Land toOil Palm, Other Group Members
Allocate All Land to RubberAgroforestry
Low endowed ( )L = 5L L ×1 = 5L L ×0.5+(L + L )×0.2 = 5.5L L H L ×1+(L + L )×0.2 = 8L L HHigh endowed ( )L = 10H L ×1 = 10H L ×0.6+(L + L )×0.2 = 8H L L L ×1+(L + L )×0.2 = 12H L L
Note: The estimations assume that the moral cost of cultivating oil palm is zero.
TABLE 2Relative Profit of Rubber Agroforestry (a + δ) by PES Scheme, Payment Set,
Payment Level, and Endowment Status
PES Scheme
Flat-Rate Scheme Redistributive Scheme
L (e = 5) H (e = 10) L (e = 5) H (e = 10)
Payment set 1No payment = 0.50aL = 0.60aH = 0.50aL = 0.60aH
Low payment av.PES = 0.05 + 0.05aL + 0.05aH + 0.10aL + 0.00aH
High payment av.PES = 0.25 + 0.25aL + 0.25aH + 0.30aL + 0.20aH
Payment set 2No payment = 0.50aL = 0.60aH = 0.50aL = 0.60aH
Low payment av.PES = 0.10 + 0.10aL + 0.10aH + 0.15aL + 0.05aH
High payment av.PES = 0.30 + 0.30aL + 0.30aH + 0.35aL + 0.25aH
Note: PES, payments for environmental services.
Each experimental session consisted offour different stages. First, the instructions ofthe game were read aloud to the participants,followed by several examples. To illustratethe different choices, we presented posterswith photos of each cultivation system. Par-ticipants received full information about therules of the game and the pay-off structuresand payments offered to both low-endowedand high-endowed players. In the secondstage, two hypothetical decisions withoutfeedback were played to improve and con-firm the understanding of the game. In thethird stage, participants were presented withthree sequential scenarios and made their de-cisions. In order to avoid potential incomeand learning effects, participants did not re-ceive feedback on their own earnings orgroup members’ allocations between deci-sions. Assistants were available for those par-ticipants who had difficulties with reading orarithmetic. Once participants had completedthe three decisions, one was randomly drawn
and paid out to them. Earnings in the gamewere transferred to local currency units at arate of 10 experimental units of payment to1 Indonesian rupiah (IDR 1). All participantswere paid privately using checks made pay-able to them at their local shops. Typicalearnings (mean IDR 86,347) were worth be-tween one and two days of wage labor. In thefourth stage, a brief postexperimental ques-tionnaire was completed, incorporating ques-tions related to the experiment, participants’demographics, and farming activities.
V. RESULTS
Socioeconomic Characteristics of theSample
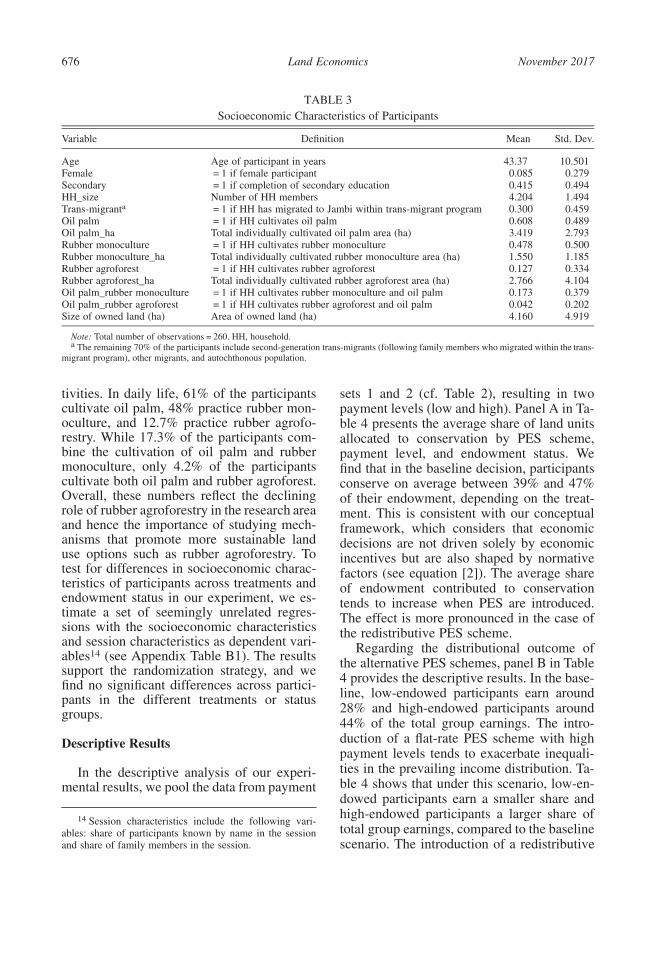
Based on the postexperimental question-naire, Table 3 provides a description of socio-economic characteristics of the participants,such as information on age, gender, educa-tional level, household size, and farming ac-
November 2017Land Economics676
TABLE 3Socioeconomic Characteristics of Participants
Variable Definition Mean Std. Dev.
Age Age of participant in years 43.37 10.501Female = 1 if female participant 0.085 0.279Secondary = 1 if completion of secondary education 0.415 0.494HH_size Number of HH members 4.204 1.494Trans-migranta = 1 if HH has migrated to Jambi within trans-migrant program 0.300 0.459Oil palm = 1 if HH cultivates oil palm 0.608 0.489Oil palm_ha Total individually cultivated oil palm area (ha) 3.419 2.793Rubber monoculture = 1 if HH cultivates rubber monoculture 0.478 0.500Rubber monoculture_ha Total individually cultivated rubber monoculture area (ha) 1.550 1.185Rubber agroforest = 1 if HH cultivates rubber agroforest 0.127 0.334Rubber agroforest_ha Total individually cultivated rubber agroforest area (ha) 2.766 4.104Oil palm_rubber monoculture = 1 if HH cultivates rubber monoculture and oil palm 0.173 0.379Oil palm_rubber agroforest = 1 if HH cultivates rubber agroforest and oil palm 0.042 0.202Size of owned land (ha) Area of owned land (ha) 4.160 4.919
Note: Total number of observations = 260. HH, household.a The remaining 70% of the participants include second-generation trans-migrants (following family members who migrated within the trans-
migrant program), other migrants, and autochthonous population.
tivities. In daily life, 61% of the participantscultivate oil palm, 48% practice rubber mon-oculture, and 12.7% practice rubber agrofo-restry. While 17.3% of the participants com-bine the cultivation of oil palm and rubbermonoculture, only 4.2% of the participantscultivate both oil palm and rubber agroforest.Overall, these numbers reflect the decliningrole of rubber agroforestry in the research areaand hence the importance of studying mech-anisms that promote more sustainable landuse options such as rubber agroforestry. Totest for differences in socioeconomic charac-teristics of participants across treatments andendowment status in our experiment, we es-timate a set of seemingly unrelated regres-sions with the socioeconomic characteristicsand session characteristics as dependent vari-ables14 (see Appendix Table B1). The resultssupport the randomization strategy, and wefind no significant differences across partici-pants in the different treatments or statusgroups.
Descriptive Results
In the descriptive analysis of our experi-mental results, we pool the data from payment
14 Session characteristics include the following vari-ables: share of participants known by name in the sessionand share of family members in the session.
sets 1 and 2 (cf. Table 2), resulting in twopayment levels (low and high). Panel A in Ta-ble 4 presents the average share of land unitsallocated to conservation by PES scheme,payment level, and endowment status. Wefind that in the baseline decision, participantsconserve on average between 39% and 47%of their endowment, depending on the treat-ment. This is consistent with our conceptualframework, which considers that economicdecisions are not driven solely by economicincentives but are also shaped by normativefactors (see equation [2]). The average shareof endowment contributed to conservationtends to increase when PES are introduced.The effect is more pronounced in the case ofthe redistributive PES scheme.
Regarding the distributional outcome ofthe alternative PES schemes, panel B in Table4 provides the descriptive results. In the base-line, low-endowed participants earn around28% and high-endowed participants around44% of the total group earnings. The intro-duction of a flat-rate PES scheme with highpayment levels tends to exacerbate inequali-ties in the prevailing income distribution. Ta-ble 4 shows that under this scenario, low-en-dowed participants earn a smaller share andhigh-endowed participants a larger share oftotal group earnings, compared to the baselinescenario. The introduction of a redistributive
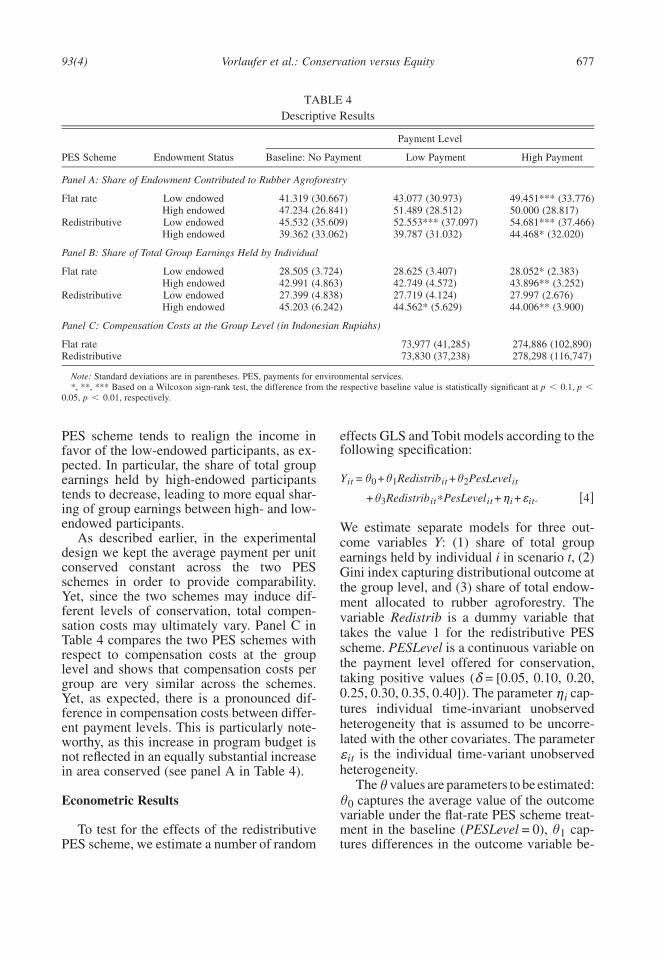
93(4) Vorlaufer et al.: Conservation versus Equity 677
TABLE 4Descriptive Results
Payment Level
PES Scheme Endowment Status Baseline: No Payment Low Payment High Payment
Panel A: Share of Endowment Contributed to Rubber Agroforestry
Flat rate Low endowed 41.319 (30.667) 43.077 (30.973) 49.451*** (33.776)High endowed 47.234 (26.841) 51.489 (28.512) 50.000 (28.817)
Redistributive Low endowed 45.532 (35.609) 52.553*** (37.097) 54.681*** (37.466)High endowed 39.362 (33.062) 39.787 (31.032) 44.468* (32.020)
Panel B: Share of Total Group Earnings Held by Individual
Flat rate Low endowed 28.505 (3.724) 28.625 (3.407) 28.052* (2.383)High endowed 42.991 (4.863) 42.749 (4.572) 43.896** (3.252)
Redistributive Low endowed 27.399 (4.838) 27.719 (4.124) 27.997 (2.676)High endowed 45.203 (6.242) 44.562* (5.629) 44.006** (3.900)
Panel C: Compensation Costs at the Group Level (in Indonesian Rupiahs)
Flat rate 73,977 (41,285) 274,886 (102,890)Redistributive 73,830 (37,238) 278,298 (116,747)
Note: Standard deviations are in parentheses. PES, payments for environmental services.*, **, *** Based on a Wilcoxon sign-rank test, the difference from the respective baseline value is statistically significant at p < 0.1, p <
0.05, p < 0.01, respectively.
PES scheme tends to realign the income infavor of the low-endowed participants, as ex-pected. In particular, the share of total groupearnings held by high-endowed participantstends to decrease, leading to more equal shar-ing of group earnings between high- and low-endowed participants.
As described earlier, in the experimentaldesign we kept the average payment per unitconserved constant across the two PESschemes in order to provide comparability.Yet, since the two schemes may induce dif-ferent levels of conservation, total compen-sation costs may ultimately vary. Panel C inTable 4 compares the two PES schemes withrespect to compensation costs at the grouplevel and shows that compensation costs pergroup are very similar across the schemes.Yet, as expected, there is a pronounced dif-ference in compensation costs between differ-ent payment levels. This is particularly note-worthy, as this increase in program budget isnot reflected in an equally substantial increasein area conserved (see panel A in Table 4).
Econometric Results
To test for the effects of the redistributivePES scheme, we estimate a number of random
effects GLS and Tobit models according to thefollowing specification:
Y = j + j Redistrib + j PesLevelit 0 1 it 2 it
+ j Redistrib ∗PesLevel +η + ε . [4]3 it it i it
We estimate separate models for three out-come variables Y: (1) share of total groupearnings held by individual i in scenario t, (2)Gini index capturing distributional outcome atthe group level, and (3) share of total endow-ment allocated to rubber agroforestry. Thevariable Redistrib is a dummy variable thattakes the value 1 for the redistributive PESscheme. PESLevel is a continuous variable onthe payment level offered for conservation,taking positive values (δ = [0.05, 0.10, 0.20,0.25, 0.30, 0.35, 0.40]). The parameter cap-ηitures individual time-invariant unobservedheterogeneity that is assumed to be uncorre-lated with the other covariates. The parameter
is the individual time-variant unobservedεitheterogeneity.
The values are parameters to be estimated:jcaptures the average value of the outcomej0
variable under the flat-rate PES scheme treat-ment in the baseline (PESLevel = 0), cap-j1tures differences in the outcome variable be-
November 2017Land Economics678
tween the baseline decisions of the twoalternative PES schemes15, measures thej2change in outcome associated with a change inpayment level under the flat-rate PES scheme,and tests for potential differences in the pay-j3ment level effects between the two alternativePES schemes.
The Gini coefficient is calculated based onthe income distribution within groups and var-ies between 0, reflecting complete equality,and 1, reflecting complete inequality. At thegroup level, is calculated as thePesLevelgtaverage payment offered to low- and high-en-dowed participants of group g in decision t.
Impact of Alternative PES Schemes onDistributional Outcome
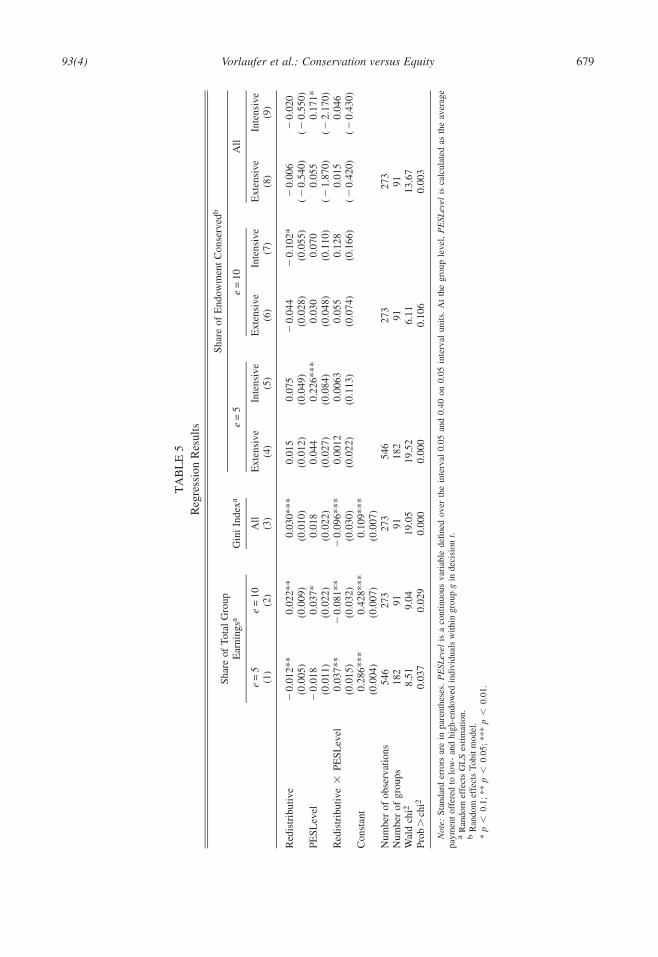
We first address the impact of the two al-ternative PES schemes on distributional out-comes. In particular, we test whether the in-troduction of a flat-rate PES scheme increasesinequality among group members, as pro-posed in Hypothesis 2, and whether the redis-tributive PES scheme can function as a redis-tributive instrument decreasing inequalityamong group members, as proposed in Hy-pothesis 3. For this purpose, we estimateequation [4] separately for low- and high-en-dowed participants. Table 5 presents the esti-mation results obtained by random effectsGLS.16 Columns 1 and 2 provide the resultson the earnings share held by low-endowedand high-endowed participants, respectively.Column 3 provides the results on the group-level Gini index.
The constant term ( indicates that in thej )0baseline, on the average, low-endowed partic-ipants receive 29% of the group earnings (col-umn 1), high-endowed participants receive43% of the group earnings (column 2), and
15 Given that under the redistributive PES scheme andpayment set 1, high-endowed participants do not receive anypayment when the low payment level is introduced (see Ta-ble 2), this decision is also reflected in the redistributive PESdummy.
16 Even though the dependent variable ranges between0 and 1, it is distributed normally, and thus GLS estimationis preferred over Tobit. Tobit model results are very similarand can be provided upon request.
the Gini index is 0.1117 (column 3). The es-timated parameters on PESLevel ( ) indicatej2that the introduction of payments under a flat-rate PES scheme significantly increases theearnings share held by high-endowed partici-pants. Yet, these effects are not reflected insignificant changes in the Gini index, imply-ing that the evidence for an inequality-in-creasing effect of the flat-rate PES scheme, aspresented in Hypothesis 2, is rather weak.
In contrast, we find significant evidence infavor of Hypothesis 3, stating that the intro-duction of a redistributive PES scheme re-duces inequality. The estimated coefficient onthe interaction term ( ) indicates that underj3the redistributive PES scheme, the effect of aone percentage point increase in payment lev-els leads to an increase of 0.04 percentagepoints in the share of group earnings of low-endowed participants and to a decrease of0.08 percentage points in the share of groupearnings of high-endowed participants com-pared to the flat-rate PES scheme. Thesechanges in distributional outcome are also re-flected in the group-level analysis: column 3shows that a one percentage point increase inpayment levels under the redistributive PESscheme decreases the Gini coefficient by 0.1index points. The results, hence, imply thatthe introduction of a redistributive PESscheme, under the assumptions made, canhave an inequality-decreasing effect, influenc-ing the income distribution in favor of pro-ducers with lower endowments.
Result 1. While we do not find strong evi-dence for an inequality-enhancing effect ofthe flat-rate PES scheme, it is associated withthe perpetuation of existing inequality struc-tures. In contrast, the introduction of a redis-tributive PES based on a Rawlsian maxi-minpayment rule has a significant inequality-re-ducing effect.
17 While this suggests relatively low levels of inequality,we do not intend to interpret the absolute level of the Giniindex, which is partly an artifact of the small number ofindividuals within groups for which the Gini index is cal-culated, but rather focus on changes in the Gini index.
93(4) Vorlaufer et al.: Conservation versus Equity 679
TA
BL
E5
Reg
ress
ion
Res
ults
Shar
eof
Tota
lG
roup
Ear
ning
saG
ini
Inde
xa
Shar
eof
End
owm
ent
Con
serv
edb
e=
5e
=10
All
e=
5e
=10
All
Ext
ensi
veIn
tens
ive
Ext
ensi
veIn
tens
ive
Ext
ensi
veIn
tens
ive
(1)
(2)
(3)
(4)
(5)
(6)
(7)
(8)
(9)
Red
istr
ibut
ive
−0.
012*
*(0
.005
)0.
022*
*(0
.009
)0.
030*
**(0
.010
)0.
015
(0.0
12)
0.07
5(0
.049
)−
0.04
4(0
.028
)−
0.10
2*(0
.055
)−
0.00
6(−
0.54
0)−
0.02
0(−
0.55
0)PE
SLev
el−
0.01
8(0
.011
)0.
037*
(0.0
22)
0.01
8(0
.022
)0.
044
(0.0
27)
0.22
6***
(0.0
84)
0.03
0(0
.048
)0.
070
(0.1
10)
0.05
5(−
1.87
0)0.
171*
(−2.
170)
Red
istr
ibut
ive
×PE
SLev
el0.
037*
*(0
.015
)−
0.08
1**
(0.0
32)
−0.
096*
**(0
.030
)0.
0012
(0.0
22)
0.00
63(0
.113
)0.
055
(0.0
74)
0.12
8(0
.166
)0.
015
(−0.
420)
0.04
6(−
0.43
0)C
onst
ant
0.28
6***
(0.0
04)
0.42
8***
(0.0
07)
0.10
9***
(0.0
07)
Num
ber
ofob
serv
atio
ns54
627
327
354
627
327
3N
umbe
rof
grou
ps18
291
9118
291
91W
ald
chi2
8.51
9.04
19.0
519
.52
6.11
13.6
7Pr
ob>
chi2
0.03
70.
029
0.00
00.
000
0.10
60.
003
Not
e:St
anda
rder
rors
are
inpa
rent
hese
s.P
ESL
evel
isa
cont
inuo
usva
riab
lede
fined
over
the
inte
rval
0.05
and
0.40
on0.
05in
terv
alun
its.
At
the
grou
ple
vel,
PE
SLev
elis
calc
ulat
edas
the
aver
age
paym
ent
offe
red
tolo
w-
and
high
-end
owed
indi
vidu
als
with
ingr
oup
gin
deci
sion
t.a
Ran
dom
effe
cts
GL
Ses
timat
ion.
bR
ando
mef
fect
sTo
bit
mod
el.
*p
<0.
1;**
p<
0.05
;**
*p
<0.
01.
November 2017Land Economics680
Impact of Alternative PES Schemes on AdditionalLand Units Conserved
Next, we investigate whether the introduc-tion of a redistributive PES scheme that offershigher payments to low-endowed participantscomes at the cost of lower aggregate conser-vation outcomes at the group level, comparedto a flat-rate PES scheme. Taking into accountthat individuals made repeated decisions andthat the share of endowment allocated to con-servation is censored at zero and one, we es-timate three random effects Tobit models. Wepresent the effect separately for low- andhigh-endowed participants and at the grouplevel. Based on the estimated beta coefficientswe obtain extensive and intensive marginaleffects. The extensive margins represent theeffects on the probability of allocating a posi-tive share of experimental land units to con-servation. The intensive margins indicate theeffects on additional units of experimentalland conserved conditional on a nonzero shareof endowment being allocated to conserva-tion. The estimation results are presented incolumns 4 to 9 in Table 5.
The group-level results in columns 8 and 9indicate that the extensive margin derivedfrom the coefficient on PESLevel is positiveand significant. This indicates that conditionalon conservation, a one percentage point in-crease in payment levels offered under theflat-rate PES scheme increases the share ofland conserved at the group level by 0.17 per-centage points. Furthermore, we find no sig-nificant difference in the increase in the pro-portion of land conserved between theflat-rate and the redistributive PES scheme(cf. ). These findings support Hypothesis 4j3that the introduction of a redistributive PESscheme (compared to a flat-rate PES scheme)does not need to be compromised by lowerconservation outcomes at the aggregate level.
Furthermore, the results in columns 4 to 7indicate that the observed effect at the grouplevel is driven mainly by the land allocationdecisions of low-endowed participants. Col-umn 5 shows that low-endowed participantssignificantly increase the proportion of landconserved in response to higher payment lev-els, and this effect does not differ significantlybetween the two alternative PES schemes. For
high-endowed participants, however, the re-sults in columns 6 and 7 suggest that theirpropensity to conserve remains unaffected bythe introduction of payments under both al-ternative PES schemes.
Result 2. Conditional on a positive conserva-tion decision, the introduction of PES leads toan increase in the proportion of land dedicatedto conservation. The magnitude of the effectis similar for the flat-rate and the redistributivePES schemes. The effect observed at thegroup level is driven mainly by the conser-vation decisions of low-endowed participants.
In a nutshell, the experimental results re-ported in this section provide evidence thatthe design of PES schemes matters for distri-butional outcomes: While a flat-rate PES con-tributes to the perpetuation of existing in-equalities, a redistributive PES scheme canhave inequality-reducing effects. We do notfind a trade-off between conservation and eq-uity: our results indicate that—under certainconditions—a redistributive PES scheme canbe designed that enhances equity, while over-all achieving the same level of additional landunits conserved as a flat-rate PES scheme.
VI. DISCUSSION
While PES are increasingly proposed as anefficient instrument to promote conservation,concerns have been raised that they privilegelarge landowners and perpetuate or even ag-gravate existing inequalities in income distri-bution. Against this background, it has beenclaimed that besides environmental goals,PES should also address equity considerationsto secure the social and political legitimacy ofprogram interventions. In this paper, we con-tribute to this discussion by providing exper-imental results on the effects of two alterna-tive PES schemes on conservation decisionsand distributional equity. Our results showthat under the experimental assumed condi-tions, the introduction of a redistributive PESscheme realigns income in favor of low-en-dowed participants, while inducing conser-vation outcomes (in terms of additional landunits conserved) similar to those of a flat-ratePES scheme. This implies that payment

93(4) Vorlaufer et al.: Conservation versus Equity 681
schemes can be designed in such a way thatthey function as multipurpose instrumentssuitable for policy makers wishing to recon-cile equity and conservation goals.
Our findings further suggest that whilelow-endowed participants conserve signifi-cantly more with increasing payment levels,the conservation behavior of high-endowedparticipants remains largely unaffected by theintroduction of incentive payments. We canthus conclude that in our case study, the in-crease in conservation area at the group levelin response to the introduction of PES stemsmainly from low-endowed participants. Thissupports the common criticism that large-scale farmers may cash in on PES for conser-vation activities that they would have carriedout anyway. It also suggests that under theconditions explored here, targeting large land-owners does not necessarily make conserva-tion policy interventions more effective inachieving conservation targets.
When assessing policy implications, it iscrucial to consider the external validity of theexperiment. Evidence has shown that the nec-essary simplifications in experimental settingscan affect the external validity of experimen-tal results (Castillo et al. 2011; Rustagi, Engel,and Kosfeld 2010; Gurven and Winking 2008;Travers et al. 2011). As pointed out before, acentral assumption in our experimental designis that low-endowed participants have highermarginal incentives to cultivate oil palm andthus higher opportunity costs of conservation.If, alternatively, small-scale farmers indeedface higher marginal incentives to conserve(i.e., adopt rubber agroforestry), their initialconservation levels in the absence of incentivepayments are likely to be higher, and poten-tially, their response to the introduction ofpayments could be lower. Thus, the aggregateconservation outcome at the group level is un-clear, in particular, because under the currentsetting the increase in group-level conserva-tion resulted mostly from the conservation de-cision of low-endowed participants. Regard-ing the distributional implications of the PESscheme, we would still expect the redistribu-tive scheme to have an (even stronger) in-equality-decreasing effect. But even the flat-rate PES scheme may contribute to decreasinginequality in such a scenario. Equation [A2]
shows that the inequality-increasing effect ofthe flat-rate PES scheme is conditional on thedifference in the marginal return of rubberagroforestry between large and small land-holders. If the marginal return of rubber agro-forestry of low-endowed participants is sub-stantially higher than that of high-endowedparticipants, the introduction of a flat-rate PESscheme may indeed decrease inequality.These considerations point to the importanceof estimating key parameters and pretestingthe policy before scaling up the intervention.
From a policy perspective, it is importantto note that the focus of our analysis is onadditional units of land conserved, and hence,our analysis disregards potential agglomera-tion effects that would derive from contagiousprotected areas (Parkhurst et al. 2002). In casesuch effects exist, the increase in environmen-tal services associated with the protection ofland by relatively large landholders is likelyto be higher than that of dispersed landhold-ers. Under such circumstances, the redistrib-utive PES introduced here would not neces-sarily function as a win-win strategy topromote conservation and poverty reduction.
Furthermore, our outcome measure focuseson increases in biophysical units conserved.Admittedly, this does not necessarily corre-spond to the marginal benefit of ecosystemservice provision. Environmental perfor-mance depends on many factors, including thelocation of the land unit (e.g., on peat soils, inriparian buffer zones, in close proximity toforest areas) as well as the management. Thisis further complicated due to the fact that formany ecosystem services, changes in land useand management intensity induce a nonlinearshift in environmental benefits due to, for ex-ample, threshold effects in ecosystems (Jack,Kousky, and Sims 2008). Our experimentalfindings are relevant for PES schemes aimingto increase, for example, forest area in gen-eral, such as the forest conservation programFONAFIFO in Costa Rica. In contrast, whenthe program’s aim is to increase a specific eco-system service, the above-cited managementfactors need to be taken into account. In par-ticular, if management practices differ be-tween large and small landholders (e.g., dueto differences in available technology or hu-man capital), the redistributive scheme may

November 2017Land Economics682
induce the same level of conservation area asthe flat-rate scheme but differ with respect toenvironmental performance.
In our study, we investigated the behavioralresponses of Indonesian farmers to the intro-duction of alternative payment schemes re-flecting different implicit equity principles. Itshould be kept in mind that several other in-stitutional factors potentially affecting theconservation decision of farmers could not beconsidered in the experimental design. Inpractice, the establishment of oil palm plan-tations is associated with high upfront invest-ments that yield a return only once the palmsstart producing. Effectively, for credit-con-strained farmers this is likely to be a barrierto oil palm adoption. Thus, in comparison tothe experimental land use decisions, in realitywe may observe less land allocated to oil palmcultivation, due to existing capital constraints.
On the other hand, land use decisions arelikely to be influenced by insecure land ten-ure, overlapping claims, and lack of infor-mation on private tenure (Engel and Palmer2008; Muradian et al. 2010; Borner et al.2010; Grimm and Klasen 2015). This is ofspecial relevance in our study region. Whileoil palm farmers who obtained their landthrough nucleus estate smallholderschemes—in our sample, the trans-migrantvillages—and who participate in the rural mi-crofinance program often hold formal land ti-tles, other rural households receive privateland through informal land markets based oncustomary land tenure arrangements (McCar-thy, Gillespie, and Zen 2012; Hauser-Schaub-lin and Steinebach 2014). In the case of cus-tomary land tenure, overlapping claims fromthe community and state are common, posinga threat to land tenure security. Given thatrubber agroforestry is traditionally practicedon customary land, farmers may be reluctantto convert oil palm into rubber agroforestry,as this may jeopardize land tenure security.
Furthermore, the ability of farmers to par-ticipate in a given PES scheme may be re-stricted by transaction costs, such as programenrollment costs, that are not taken into ac-count in our experimental setup. For example,in the Costa Rican forest conservation pro-gram FONAFIFO, applicants are required tosubmit a management plan approved by an
audited forest engineer (Pagiola, Arcenas, andPlatais 2005). Such costs are usually fixedcosts, implying that smaller landholders facesignificantly higher costs per hectare, and thussuch costs introduce a bias against small-holder enrollment in PES schemes. Thus, tak-ing enrollment costs into account would likelylead to lower levels of conservation in generaland in particular among low-endowed pro-ducers.
Finally, alternative schemes may also differin terms of their implementation costs. In ourexperiment, we were able to show that thecompensation budget was similar across thetwo alternative PES schemes. However, theactual compensation expenses are a functionof the number of hectares conserved and, inthe case of the redistributive scheme, also ofthe proportions of small and large landholdersenrolling in the scheme. In particular, if thefarming structure is relatively homogenousand dominated by small landholders, thehigher expected compensation costs of the re-distributive scheme compared to the flat-ratescheme may outweigh its equity-enhancingbenefits.
Besides the direct costs of compensation,implementation costs also comprise the trans-action costs associated with searching for in-formation, delivering payments, and enforc-ing agreements. If land size is a good indicatorof wealth, as assumed in the experiment, aredistributive payment in principle could bebased on land title registrations. However, ina setting like our study region, where custom-ary land tenure arrangements are widespread,such a procedure would risk excluding themost disadvantaged landholders lacking for-mal titles to their land. Furthermore, depend-ing on the setting, land size may represent arather imperfect proxy for wealth. Hence, aredistributive PES scheme would require sub-stantial information on the potential benefici-aries and thus imply higher implementationcosts for program administrators than a flate-rate PES scheme (Pascual et al. 2010).
Given high program administration costs,a redistributive PES scheme may result inlower cost-effectiveness compared to a flat-rate PES scheme—an important policy crite-rion that is beyond the scope of our study. Yet,it should also be kept in mind that the equity
93(4) Vorlaufer et al.: Conservation versus Equity 683
principle underlying the redistributive PESscheme may increase acceptance of thescheme in the community, which could inducecommunity cooperation and thereby facilitateprogram implementation. Which equity prin-ciple local communities indeed favor willvary from case to case, and therefore, our re-sults should be validated in the local context.Before the implementation of a PES scheme,it is necessary to establish the social accept-ability of different schemes and investigatewhether local norms favor equity of outcomes(as in the flat-rate PES scheme, where every-body receives the same payment) or equity ofopportunities (as reflected by the redistribu-tive PES scheme).
VII. CONCLUSION
In conclusion, our study provides behav-ioral evidence on the implications of differentpayment scheme designs (based on differentprinciples of distributive justice) for environ-mental and social outcomes. As Guerry et al.(2015) emphasize, such insights from behav-ioral economics are crucial to better under-stand how people make conservation deci-sions and for designing more effective policyinterventions. As discussed in the previoussection, some limitations apply to our dataand, accordingly, to the results that can be de-rived from our analysis. In order to informpolicy makers, further research is needed test-ing alternative PES designs beyond the twoschemes evaluated here, as well as differentscenarios of heterogeneity. It may be interest-ing, for example, to use a full factorial designin order to disentangle the effects of hetero-geneity in endowment on the one hand, andin marginal incentives to conserve on theother hand. Given that the results presentedhere apply under the experimental assumedconditions of heterogeneity, it is critical thatfurther research be dedicated to discoveringthe actual values of these key parameters inthe local context before implementing PES.
Future research could also extend our re-search by choosing a more comprehensivemeasure to assess conservation outcomes. Ourmeasure of additional number of land unitsconserved clearly has the advantage of beingeasy to measure and implement in an experi-
mental setting. Yet, monitoring and evaluatingenvironmental performance more directlywould be of great interest, in particular for thedesign of accountability-based PES schemes.
Furthermore, future experimental studiescould seek to capture additional institutionaldrivers and constraints of land use decisions,such as land tenure security and program en-rollment costs, as well as initial investmentcosts and capital constraints. Similarly, therole of social norms and preferences in con-servation decision-making could be furtherexplored. Sheeder and Lynne (2011), for ex-ample, show that some of the farmers in theirstudy in the United States take the welfare oftheir neighbors into account when makingconservation decisions. Such social prefer-ences could be explicitly integrated in an ex-perimental design to gain further knowledgeon the social interactions and preferences thatshape human-nature interactions.
APPENDIX A: PROOFS FOR THECONCEPTUAL FRAMEWORK
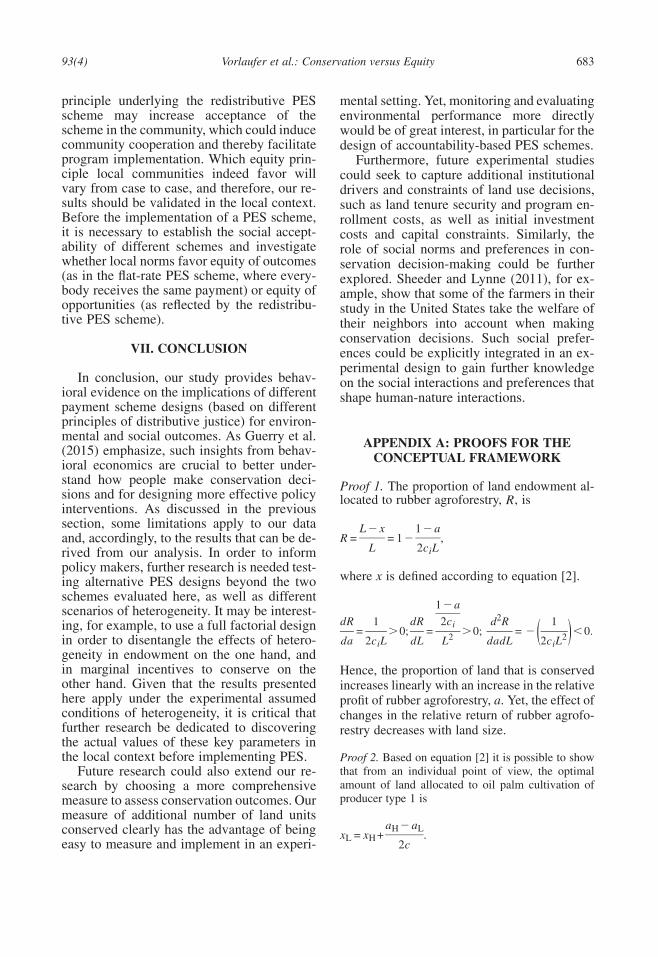
Proof 1. The proportion of land endowment al-located to rubber agroforestry, , isR
L − x 1− aR = = 1− ,
L 2c Li
where x is defined according to equation [2].
1− a2dR 1 dR 2c d R 1i
= >0; = >0; = − <0.2 2( )da 2c L dL L dadL 2c Li i
Hence, the proportion of land that is conservedincreases linearly with an increase in the relativeprofit of rubber agroforestry, a. Yet, the effect ofchanges in the relative return of rubber agrofo-restry decreases with land size.
Proof 2. Based on equation [2] it is possible to showthat from an individual point of view, the optimalamount of land allocated to oil palm cultivation ofproducer type 1 is
a − aH Lx = x + .L H
2c

November 2017Land Economics684
The difference in the income between type 1 and type2 producers, , is hence given byI (a , a ) = π −πH L H L
a − aL HI(a , a ) = (2− a − a + b)H L L H( )2c
+ a L − a L − b(L − L ). [A1]H H L L H L
The larger the differences in the amount of availableland endowments and in the relative profit of rubberagroforestry, the larger the inequality, I, among type1 and type 2 producers.
Next, we want to know how income inequality, I,changes if we add a fixed amount of δ to both returns:
Defining a new functiona , a .H L
G(δ, a , a ): = I (a +δ, a + δ),H L H L
a − aH LG(δ; a , a ) = I (a , a )+δ L − L + . [A2]H L H L H L( )c
In particular, differentiating G with respect to δ yields
dG(δ; a , a ) a − aH L H L= L − L + >0. [A3]H L
dδ c
Proof 3. Defining a new function ): =D(δ,γ,a , aH LI ( , where γ is the fraction ofa + δ−γ, a + δ+γ)H Lpayment that is taken from the high-endowed partic-ipant and redistributed to the low-endowed partici-pant, it can be shown that
D(δ,γ,a , a ): = I (a , a )H L H L
a − a −2γH L+δ L − L +H L( )c
γ+ (2− a − a + b − cL − cL ). [A4]L H L H
c
The effect of an increase in the relative profit ofrubber agroforestry on income inequality is given by
dD a − a −2γ dG(δ; a , a )H L H L= L −L + < . [A5]H L
dδ c dδ
Therefore, the use of a redistributive PES schemereduces the income inequality compared to a flat-ratePES scheme. Moreover, the effect of an increase inthe amount of payment that is redistributed in favorof low-endowed participants, γ, on income inequalityis
dD 2= − <0. [A6]
dδdγ c
Hence, the larger the amount of payment redistribu-tion, the larger the decrease in income inequality.
Proof 4. The proportion of land that is conserved inrubber agroforestry due to PES,
(L − x )iR = ,
Li
is a negative function of land size,
2d R 1= − <0.2( )dadL 2c Li
Hence, the redistributional payment scheme would re-sult in an increase in the fraction of land allocated toconservation of rubber agroforestry by type 1 pro-ducers that is not smaller than the respective decreasein conservation by type 2 producers.

93(4) Vorlaufer et al.: Conservation versus Equity 685
APPENDIX B: RANDOMIZATION TESTS
TABLE B1Results of the Seemingly Unrelated Regressions with Socioeconomic and Session Characteristics as the
Dependent Variables
Flat-Rate PES Redistributive PES
e = 5(Constant) e = 10 e = 5 e = 10
Age (number of years) 44.01 (1.14) −0.79 (1.97) −2.02 (1.58) 3.99 (2.77)Female (0/1) 0.059 (0.029) 0.045 (0.072) 0.050 (0.041) −0.036 (0.051)Secondary (0/1) 0.476 (0.053) 0.036 (0.130) −0.036 (0.074) −0.143 (0.092)HH_size 4.29 (0.163) 0.225 (0.396) −0.154 (0.226) −0.119 (0.282)Transmigrant (0/1) 0.333 (0.049) 0.013 (0.122) −0.037 (0.069) −0.047 (0.087)Oil palm (0/1) 0.642 (0.053) −0.059 (0.129) −0.060 (0.073) 0.024 (0.092)Oil palm_ha (ha) 1.92 (0.299) −0.530 (0.727) 0.342 (0.414) 0.608 (0.517)Rubber monoculture (0/1) 0.476 (0.054) −0.009 (0.133) −0.015 (0.076) 0.024 (0.094)Rubber monoculture _ha (ha) 0.708 (0.122) −0.151 (0.298) −0.044 (0.169) 0.238 (0.212)Rubber agroforestry (0/1) 0.095 (0.036) 0.039 (0.088) 0.081 (0.050) −0.048 (0.062)Rubber agroforestry_ha (ha) 0.440 (0.186) 0.484 (0.453) −0.091 (0.258) −0.369 (0.323)Oil palm_rubber monoculture (0/1) 0.178 (0.041) −0.036 (0.100) −0.036 (0.057) 0.059 (0.071)Oil palm_rubber agroforestry (0/1) 0.024 (0.022) 0.029 (0.053) 0.042 (0.030) −0.024 (0.038)Session characteristics
Share_known_names 0.840 (0.019) −0.077 (0.047) −0.038 (0.027) 0.029 (0.033)Share_family_members 0.132 (0.022) 0.017 (0.052) −0.013 (0.030) −0.019 (0.037)
Note: Standard errors are in parentheses. PES, payments for environmental services.
Acknowledgments
The authors gratefully acknowledge funding pro-vided by the German Research Foundation (DFG)through the CRC 990 Ecological and SocioeconomicFunctions of Tropical Lowland Rainforest Transfor-mation Systems (Sumatra, Indonesia).
References
Alix-Garcia, Jennifer, Alain De Janvry, and ElisabethSadoulet. 2008. “The Role of Deforestation Riskand Calibrated Compensation in Designing Pay-ments for Environmental Services.” Environmentand Development Economics 13 (3): 375–94.
Baland, Jean-Marie, and Jean-Philippe Platteau.1999. “The Ambiguous Impact of Inequality onLocal Resource Management.” World Develop-ment 27 (5): 773–78.
Barnes, Andrew D., Malte Jochum, Steffen Mumme,Noor Farikhah Haneda, Achmad Farajallah, Tri H.Widarto, and Ulrich Brose. 2014. “Consequencesof Tropical Land Use for Multitrophic Biodiver-sity and Ecosystem Functioning.” Nature Com-munication 5: 1–7.
Belcher, Brian, and Kathrin Schreckenberg. 2007.“Commercialization of Non-timber Forest Prod-ucts: A Reality Check.” Development Policy Re-view 25 (3): 355–77.
Beukema, Hendrien, Finn Danielsen, Gregoire Vin-cent, Suryo Hardiwinoto, and Jelte van Andel.2007. “Plant and Bird Diversity in Rubber Agro-forestry in the Lowlands of Sumatra, Indonesia.”Agroforestry Systems 70 (3): 217–42.
Borner, Jan, Sven Wunder, Sheila Wertz-Kanounnikoff,Marcos Rugnitz Tito, Ligia Pereira, and NathaliaNascimento. 2010. “Direct Conservation Paymentsin the Brazilian Amazon: Scope and Equity Impli-cations.” Ecological Economics 69 (6): 1272–82.
Cardenas, Juan C., John Stranlund, and Cleve Willis.2002. “Economic Inequality and Burden-sharingin the Provision of Local Environmental Quality.”Ecological Economics 40 (3): 379–95.
Castillo, Daniel, Francois Bousquet, Marco A. Jans-sen, Kobchai Worrapimphong, and Juan C. Car-denas. 2011. “Context Matters to Explain FieldExperiments: Results from Colombian and ThaiFishing Villages.” Ecological Economics 70 (9):1609–20.
Chan, Kenneth S., Stuart Mestelman, Robert Moir,and R. Andrew Muller. 1999. “Heterogeneity andthe Voluntary Provision of Public Goods.” Exper-imental Economics 2 (1): 5–30.
Cherry, Todd L., Stephan Kroll, and Jason F. Shogren.2005. “The Impact of Endowment Heterogeneityand Origin on Public Good Contributions: Evi-dence from the Lab.” Journal of Economic Be-havior and Organization 57 (3): 357–65.
November 2017Land Economics686
Colchester, Marcus, Norman Jiwan, Andiko, MartuaSirait, Asep Y. Firdaus, A. Surambo, and HerbertPane. 2006. Promised Land: Palm Oil and LandAcquisition in Indonesia: Implications for LocalCommunities and Indigenous Peoples. Bogor, In-donesia: Forest Peoples Programme, Sawit Watch,ICRAF.
Corbera, Esteve, Katrina Brown, and W. Neil Adger.2007. “The Equity and Legitimacy of Markets forEcosystem Services.” Development and Change38 (4): 587–613.
Corbera, Esteve, and Unai Pascual. 2012. “EcosystemServices: Head Social Goals.” Science 335 (6069):655–56.
Danielsen, Finn, Hendrien Beukema, Neil D. Bur-gess, Faizal Parish, Carsten A. Bruhl, Paul F. Don-ald, Daniel Murdiyarso, Ben Phalan, Lucas Re-ijnders, Matthew Struebig, and Emily B.Fitzherbert. 2009. “Biofuel Plantations on For-ested Lands: Double Jeopardy for Biodiversityand Climate.” Conservation Biology 23 (2): 348–58.
Ekadinata, Andree, and Gregoire Vincent. 2011.“Rubber Agroforests in a Changing Landscape:Analysis of Land Use/Cover Trajectories in BungoDistrict, Indonesia.” Forests, Trees and Liveli-hoods 20 (1): 3–14.
Engel, Stefanie, Stefano Pagiola, and Sven Wunder.2008. “Designing Payments for EnvironmentalServices in Theory and Practice: An Overview ofthe Issues.” Ecological Economic 65 (4): 663–74.
Engel, Stefanie, and Charles Palmer. 2008. “Paymentsfor Environmental Services as an Alternative toLogging under Weak Property Rights: The Caseof Indonesia.” Ecological Economics 65 (4): 799–809.
Euler, Michael, Stefan Schwarze, Hermanto Siregar,and Matin Qaim. 2016. “Oil Palm Expansionamong Smallholder Farmers in Sumatra, Indone-sia.” Journal of Agricultural Economics 67 (3):658–76.
Feintrenie, Laurene, Wan K. Chong, and Patrice Lev-ang. 2010. “Why Do Farmers Prefer Oil Palm?Lessons Learnt from Bungo District, Indonesia.”Small-Scale Forestry 9 (3): 379–96.
Feintrenie, Laurene, and Patrice Levang. 2009. “Su-matra’s Rubber Agroforests: Advent, Rise and Fallof a Sustainable Cropping System.” Small-scaleForestry 8 (3): 323–35.
Gatto, Marcel, Meike Wollni, and Matin Qaim. 2015.“Oil Palm Boom and Land-Use Dynamics in In-donesia: The Role of Policies and SocioeconomicFactors.” Land Use Policy 46: 292–303.
Grieg-Gran, Maryanne, Ina Porras, and Sven Wunder.2005. “How Can Market Mechanisms for ForestEnvironmental Services Help the Poor? Prelimi-
nary Lessons from Latin America.” World Devel-opment 33 (9): 1511–27.
Grimm, Michael, and Stephan Klasen. 2015. “Migra-tion Pressure, Tenure Security, and AgriculturalIntensification: Evidence from Indonesia.” LandEconomics 91 (3): 411–34.
Guerry, Anne D., Stephen Polasky, Jane Lubchenco,Rebecca Chaplin-Kramer, Gretchen C. Daily,Rob-ert Griffin, Mary Ruckelshaus, Ian J. Bateman,Anantha Duraiappah, Thomas Elmqvist, et al.2015. “Natural Capital and Ecosystem ServicesInforming Decisions: From Promise to Practice.”Proceedings of the National Academy of SciencesUSA 112 (24): 7348–55.
Gurven, Michael, and Jeffery Winking. 2008. “Col-lective Action in Action: Prosocial Behavior inand out of the Laboratory.” American Anthropol-ogist 110 (2): 179–90.
Hauser-Schaublin, Brigitta, and Stefanie Steinebach.2014. “Harapan: A ‘No Man’s Land’ Turned intoa Contested Agro-industrial Zone.” EFForTS Dis-cussion Paper 4. Gottingen, Germany: Universityof Gottingen.
Ibanez, Marcella, and Peter Martinsson. 2013. “Curb-ing Coca Cultivation in Colombia: A FramedField Experiment.” Journal of Public Economics105: 1–10.
Jack, B. Kelsey, Carolyn Kousky, and Katharine R.E. Sims. 2008. “Designing Payments for Ecosys-tem Services: Lessons from Previous Experiencewith Incentive-Based Mechanisms.” PNAS 105(28): 9465–70.
Jakarta Post. 2009. “Indonesia Allocates 18 MillionHectares of Land for Palm Oil.” Jakarta Post,Nusa Dua, Bali, December 2. Available at http://naturealert.blogspot.de/2009/12/indonesia-allocates-18-million-hectares.html (accessed Jan-uary 5, 2017).
Kerr, John, Mamta Vardhan, and Rohit Jindal. 2012.“Prosocial Behavior and Incentives: Evidencefrom Field Experiments in Rural Mexico and Tan-zania.” Ecological Economics 73 (C): 220–27.
Koh, Lian P., Jukka Miettinen, Soo C. Liew, and Ja-boury Ghazoul. 2011. “Remotely Sensed Evi-dence of Tropical Peatland Conversion to OilPalm.” Proceedings of the National Academy ofSciences USA 108 (12): 5127–32.
Koh, Lian P., and David Wilcove. 2008. “Is Oil PalmAgriculture Really Destroying Tropical Biodiver-sity?” Conservation Letters 1 (2): 60–64.
Kosoy, Nicolas, Miguel Martinez-Tuna, Roldan Mu-radian, and Joan Martinez-Alier. 2007. “Paymentsfor Environmental Services in Watersheds: In-sights from a Comparative Study of Three Casesin Central America.” Ecological Economics 61(2): 446–55.
93(4) Vorlaufer et al.: Conservation versus Equity 687
Kotowska, Martyna M., Christoph Leuschner, Tria-diati Triadiati, Selis Meriem, and Dietrich Hertel.2015. “Quantifying Above- and BelowgroundBiomass Carbon Loss with Forest Conversion inTropical Lowlands of Sumatra (Indonesia).”Global Change Biology 21 (10): 3620–34.
Landell-Mills, Natasha. 2002. “Developing Marketsfor Forest Environmental Services: An Opportu-nity for Promoting Equity While Securing Effi-ciency.” Philosophical Transactions of the RoyalSociety 360 (1797): 1817–25.
Landell-Mills, Natasha, and Ina T. Porras. 2002. Sil-ver Bullet or Foods Gold? A Global Review ofMarkets for Forest Environmental Services andTheir Impacts on the Poor. Instruments for Sus-tainable Private Sector Forestry Series. London:International Institute for Environment and De-velopment.
Laumonier, Yves, Yumiko Uryu, Michael Stuwe, ArifBudiman, Budi Setiabudi, and Oki Hadian. 2010.“Eco-floristic Sectors and Deforestation Threats inSumatra: Identifying New Conservation Area Net-work Priorities for Ecosystem-Based Land UsePlanning.” Biodiversity and Conservation 19 (4):1153–74.
McCarthy, John F., Piers Gillespie, and Zahari Zen.2012. “Swimming Upstream: Local IndonesianProduction Networks in ‘Globalized’ Palm OilProduction.” World Development 40 (3): 555–69.
Muradian, Roldan, M. Arsel, L. Pellefrini, F. Ada-man, B. Aguilar, B. Agarwal, E. Corbera, D. Ezz-ine de Blas, J. Farley, G. Froger, et al. 2013. “Pay-ments for Ecosystem Services and the FatalAttraction of Win-win Solutions.” ConservationLetters 6 (4): 1–6.
Muradian, Roldan, Esteve Corbera, Unai Pascual, Ni-colas Kosoy, and Peter H. May. 2010. “Reconcil-ing Theory and Practice: An Alternative Concep-tual Framework for Understanding Payments forEnvironmental Services.” Ecological Economics69 (6): 1202–08.
Narloch, Ulf, Unai Pascual, and Adam G. Drucker.2012. “Collective Action Dynamics under Exter-nal Rewards: Experimental Insights from AndeanFarming Communities.” World Development 40(10): 2096–107.
———. 2013. “How to Achieve Fairness in Paymentsfor Ecosystem Services? Insights from Agrobi-odiversity Conservation Auctions.” Land Use Pol-icy 35: 107–18.
Obidzinski, Kystof, Rubeta Andriani, Heru Komaru-din, and Agnus Andrianto. 2012. “Environmentaland Social Impacts of Oil Palm Plantations andTheir Implications for Biofuel Production In In-donesia.” Ecology and Society 17 (1): article 25.
Pagiola, Stefano, Agustin Arcenas, and Gunars Pla-tais. 2005. “Can Payments for Environmental Ser-
vices Help Reduce Poverty? An Exploration of theIssue and the Evidence to Date from Latin Amer-ica.” World Development 33 (2): 237–53.
Parkhurst, Gregory M., Jason F. Shogren, Chris Bas-tian, Paul Kivi, Jennifer Donner, and Rodney B.W. Smith. 2002. “Agglomeration Bonus: An In-centive Mechanism to Reunite Fragmented Habi-tat for Biodiversity Conservation.” EcologicalEconomics 41 (2): 305–28.
Pascual, Unai, Roldan Muradian, Luis C. Rodriguez,and Anantha Duraiappah. 2010. “Exploring theLinks between Equity and Efficiency in Paymentsfor Environmental Services: A Conceptual Ap-proach.” Ecological Economics 69 (6): 1237–44.
Pramova, Emilia, Bruno Locatelli, Andreas Mench,Edy Marbyanto, Karlina Kartika, and Hangga Pri-hatmaja. 2013. “Integrating Adaptation intoREDD+: Potential Impacts and Social Return onInvestment in Setulang, Malinau District, Indo-nesia.” CIFOR Working Paper 2013-112. Bogor,Indonesia: Center for International Forestry Re-search.
Reuben, Ernesto, and Arno Riedl. 2013. “Enforce-ment of Contribution Norms in Public GoodGames with Heterogenous Populations.” Gamesand Economic Behavior 77 (1): 122–137.
Rianto, Buntoro, Hafidsyah Mochtar, and AdityaSasmito. 2012. “Overview of Palm Oil IndustryLandscape in Indonesia.” In Palm Oil Planta-tion: Industry Landscape, Regulatory and Finan-cial Overview. Jakarta: PwC Indonesia. Availableat www.pwc.com/id/en/publications/assets/palm-oil-plantation-2012.pdf (accessed January 5,2017).
Rodriguez-Sickert, Carlos, Ricardo A. Guzman, andJuan C. Cardenas. 2008. “Institutions InfluencePreferences: Evidence from a Common Pool Re-source Experiment.” Journal of Economic Behav-ior and Organization 67 (1): 215–27.
Rustagi, Devesh, Stefanie Engel, and Michael Kos-feld. 2010. “Conditional Cooperation and CostlyMonitoring Explain Success in Forest CommonsManagement.” Science 330 (6006): 961–65.
Sheeder, Robert J., and Gary D. Lynne. 2011. “Em-pathy-Conditioned Conservation: ‘Walking in theShoes of Others’ as a Conservation Farmer.” LandEconomics 87 (3): 433–52.
Sommerville, Matthew, Julia P. G. Jones, Michael Ra-hajaharison, and E. J. Mildner-Gulland. 2010.“The Role of Fairness and Benefit Distribution inCommunity-Based Payment for EnvironmentalServices Interventions: A Case Study from Men-abe, Madagascar.” Ecological Economics 69 (6):1262–71.
Travers, Henry, Tom Clements, Aidan Keane, and E.J. Mildner-Gulland. 2011. “Incentives for Coop-
November 2017Land Economics688
eration: The Effects of Institutional Controls onCommon Pool Resource Extraction in Cambodia.”Ecological Economics 71: 151–61.
Villamor, Grace B., Quang B. Le, Paul L. G. Vlek,and Meine Van Noordwijk. 2011. “Payments forAgro-biodiversity: An Analysis of Participation inJambi’s Conservation Agreements for RubberAgroforests, (Sumatra) Indonesia.” Paper pre-sented at the 13th Annual BIOECON Conferenceon Resource Economics, Biodiversity Conserva-tion and Development, Geneva, Switzerland.
Vollan, Bjorn. 2008. “Socio-ecological Explanationsfor Crowding-out Effects from Economic FieldExperiments in Southern Africa.” Ecological Eco-nomics 67 (4): 560–73.
Wilcove, David S., and Lian P. Koh. 2010. “Address-ing the Threats to Biodiversity from Oil-Palm Ag-riculture.” Biodiversity and Conservation 19 (4):999–1007.
World Trade Organization. 2010. World Trade Report2010: Trade in Natural Resources. Geneva, Swit-zerland: World Trade Organization.
Wunder, Sven. 2005. “Payments for EnvironmentalServices: Some Nuts and Bolts.” CIFOR Occa-sional Paper No. 42. Bogor, Indonesia: Center forInternational Forestry Research (CIFOR).
Zbinden, Simon, and David R. Lee. 2005.” Paying forEnvironmental Services: An Analysis of Partici-pation in Costa Rica’s PSA Program.” World De-velopment 33 (2): 255–72.