Embed Size (px)
Citation preview
Soil & Tillage Research, 7 (1986) 341--353 341 Elsevier Science Publishers B.V., Amsterdam -- Printed in The Netherlands
CONSERVATION TILLAGE IN THE SUBARCTIC
CHARLES W. KNIGHT and CAROL E. LEWIS
Alaska Agricultural and Forestry Experiment Station, University of Alaska, Fairbanks, Alaska 99775-00~0 (U.S.A.)
Contribution No. J-165
(Accepted for publication 11 April 1986)
ABSTRACT
Knight, C.W. and Lewis, C.E., 1986. Conservation tillage in the subarctic. Soil Tillage Res., 7 : 341--353.
Three tillage practices were compared on a subarctic silt-loam soil to evaluate whether conservation tillage could be used effectively to reduce soil losses from wind erosion without delaying crop maturity or reducing yield. Urea and ammonium nitrate were also compared as sources of fertilizer nitrogen. Plots were cropped to rapeseed (Brassica campestris L.) and barley (Hordeum vulgare L.) in a rapeseed--barley--fallow rotation and in continuous barley. Zero-tillage did not delay maturity nor did it result in reduced yields except where there was excessive competit ion from perennial grassy weeds. Neither source of nitrogen was superior in affecting either crop maturity or seed yield. Fertilizer placement appeared to be less than optimum in zero-tilled plots. With proper fertilizer placement and grassy-weed control, conservation tillage appears to be a viable method of reducing the potential for wind erosion in the subarctic.
INTRODUCTION
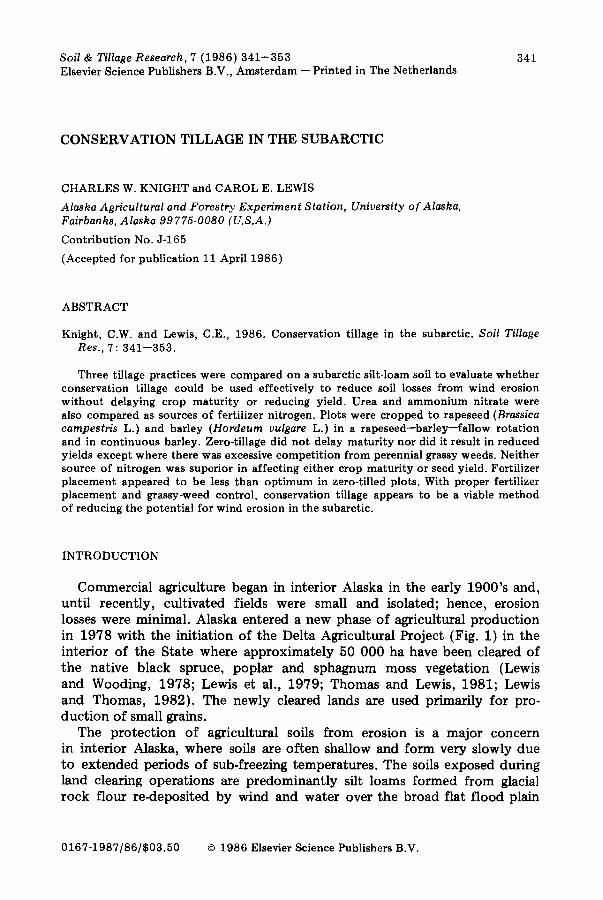
Commercial agriculture began in interior Alaska in the early 1900's and, until recently, cultivated fields were small and isolated; hence, erosion losses were minimal. Alaska entered a new phase of agricultural production in 1978 with the initiation of the Delta Agricultural Project (Fig. 1) in the interior of the State where approximately 50 000 ha have been cleared of the native black spruce, poplar and sphagnum moss vegetation (Lewis and Wooding, 1978; Lewis et al., 1979; Thomas and Lewis, 1981; Lewis and Thomas, 1982). The newly cleared lands are used primarily for pro- duction of small grains.
The protection of agricultural soils from erosion is a major concern in interior Alaska, where softs are often shallow and form very slowly due to extended periods of sub-freezing temperatures. The soils exposed during land clearing operations are predominantly silt loams formed from glacial rock flour re<leposited by wind and water over the broad flat flood plain
0167-1987/86/$03.50 © 1986 Elsevier Science Publishers B.V.
342
~ARCTIC A OCE~N ~
~ yd~O N I
o~ ~.,.~ * C IC OCE~ IV " ~ .
Fig. 1. The Delta Agricultural Project is located approx imate ly 50 km southeast of Fairbanks, near 64 ° nor th lat i tude.
of the Tanana River. At the t ime of clearing, many of the softs contain permafrost from the surface to a depth of approximately 25 m. As these soils are brought into agricultural production, the permafrost rapidly recedes from the surface and may eventually disappear. Water erosion has not been a major concern because rainfall is low (annual precipitation of 29.2 cm), and the topography is nearly level. However, the wind erosion hazard has been ranked as moderate to severe (Schoephorster, 1973). The clay content of the soils is generally less than 10%, and clods tend to break-down easily to their single-grain structure. The fields are particularly susceptible to erosion during the peak windy seasons of November--February and May-- June.
Debris such as sticks and roots remain in newly cleared fields even after they have been farmed for several years. As a result, the heavy tandem disk has become a popular tillage implement because of its ability to ride up and over foreign material in the soil wi thout plugging. However, it buries a large portion of the crop residues. To reduce their spring work-load, farmers prefer to disk the fields in the autumn if harvest can be completed prior to the soil freezing. This leaves the soil with little protect ion from wind erosion from the time of initial tillage until after crop emergence.
The practice of conservation tillage, leaving crop residues on the soil surface, has been well documented as an effective means of reducing wind erosion (Soil Conservation Society of America, 1979). Numerous studies, however, have shown that excessive crop residues on the soil surface reflect solar radiation and insulate the soil, generally reducing spring and summer soil temperatures (McCalla and Duley, 1946; Burrows and Larson, 1962; Watson, et al., 1971; Hay, 1977; Black and Siddoway, 1979; Aase and Siddoway, 1980). This has caused concern that crop residues left on the soil surface in Alaska will delay soil warming in the spring and consequently diminish an already short growing season.
343
Several reports from Western Canada and Europe have shown favorable results from reduced tillage systems in regions near 55 ° latitude (Bentley, et al., 1978; Zentner and Lindwall, 1978; Pidgeon and Ragg, 1979; Stobbe, 1979). However, the Delta Agricultural Project is located further north near 64 ° latitude. Cold soils containing intermittent permafrost, a short growing season, long summer photoperiods (maximum of 21 h) and a cool, damp harvest season make the direct transfer of information questionable.
The Agricultural Research Service of the United States Department of Agriculture has developed a wind erosion equation that defines average annual soil loss (E) as a function of soil erodability index (I), soil-surface roughness (K), climate (C), field width (L) and vegetative cover (V) (Wood- ruff and Siddoway, 1965). Two parameters essential for evaluating the erodability of the soils in interior Alaska are: the soil erodability index (I), which is an expression of soil structure or degree of aggregation; and a measurement of vegetative cover (V), which is an expression of the crop residues on the soil surface during peak wind periods.
The primary objective of this research was to evaluate conservation tillage practices in interior Alaska to determine how each tillage practice affected crop response. Secondary objectives were to determine the effects of conservation tillage on soil fertility, and how each tillage practice affected the erodability factors I and V in this subarctic environment.
METHODS
A 3-year field experiment was initiated in 1980 near the Delta Agricul- tural Project, Delta Junction, Alaska. Soils at the study site are in the Nenana series (Typic Cryochrepts; coarse-silty, mixed, acid) averaging 31 cm in depth overlaying coarse sand and gravel. The site had been farmed for approximately 15 years.
The study was arranged in a randomized complete block design with split-split plots. Each treatment was replicated three times. Main plots consisted of three tillage systems: maximum-tillage (chisel plowing in autumn and two tandem disking operations in the spring prior to planting); mini- mum-tillage (one disking just prior to spring planting); and zero-tillage. Each main plot was randomly split into four subplots; one of which was continuously cropped to 'Galt' barley (Hordeum vulgare L.), the other three were alternately fallowed or cropped to 'Candle' rapeseed (Brassica campestris L.) or barley in a rapeseed--barley--fallow rotation. Each sub- plot was randomly split and one-half received all nitrogen (N) fertilizer in the form of urea, the other half received ammonium nitrate. Each sub- subplot was 0.14 ha in size.
Fallow in maximum-tillage plots was accomplished by chisel plowing once in autumn to a 20-cm depth with 5-cm wide twisted points, then disking the following summer as needed for weed control. Minimum-tillage fallow consisted of one tandem disking operation in the spring, followed by shallow (8-cm depth) chiseling as needed with 45-cm wide sweeps.
344
Zero-tillage fallow was accomplished entirely with the herbicides paraquat (1,1'~limethyl-4,4'-biypridinium ion) and glyphosate [N-(phosphonomethyl) glycine] applied as needed.
Each year, all plots except those being fallowed were fertilized with N as ammonium nitrate or urea, phosphorus (P) as triple superphosphate and potassium (K) as potassium sulfate, at a rate of 84, 25 and 42 kg ha -1 N, P and K, respectively. Continuous barley plots received an additional increment of 28 kg ha -1 N for each 2200 kg ha -1 of crop residue present at the time of fertilization. All N and K fertilizers were broadcast prior to spring tillage and all P was banded in the row with the seed.
All soil samples were collected to a depth of 15 cm. This was the approxi- mate depth of thawed soil which could be sampled before spring fertiliza- tion. It also represents the major rooting depth of agronomic crops in cool subarctic soils.
Each spring prior to fertilizer application, five soil cores were collected, divided into 5-cm depth increments, and combined to form a composite sample for each depth in each plot. The samples were kept frozen until they could be analyzed for pH, organic matter, N, P and K by standard methods (Dahnke, 1980). Baseline soil conditions at the beginning of this study are presented in Table I.
TABLE I
Composite soil sample analyses prior to treatment applications I
Sample pH NH4-N NO3-N Total P K Ca Mg Organic depth N (%) Matter (cm) (%)
0-- 5 6.06 24.3 36.4 0.17 58 .5 147 1367 170 4.46 5--10 6 .25 18.3 24.7 0.11 19.0 90 1068 167 2.85
10--15 6 .18 16.1 15.5 0.09 3.6 54 710 205 1.25
1NH4-N, NO3-N, P, K, Ca and Mg are expressed in ppm.
Soil moisture was monitored by collecting five soil cores from each plot approximately every two weeks from planting through to harvest. These five cores were composited and moisture was determined gravimetrically. Soil temperatures were also recorded in each plot at the same time that soil moisture samples were collected. This was accomplished with calibrated dial thermometers placed at 5-, 10- and 15-cm depths. Readings were taken at 2-week intervals between the times of 10 00 and 14 00 h.
Seed yields were determined from an area 1.2 × 30.4 m harvested from the middle of each plot with a plot combine. Yields were corrected to 13.5% moisture for barley and 10% moisture for rapeseed.
Crop residues on the soil surface were collected from six 30-cm square
345
quadrats in each plot following harvest each autumn, oven-dried at 45°C and weighed. At the end of the 3-year study, determinations of soil aggrega- tion were made by sieving soil from the top 2.5 cm in each plot using pro- cedures suggested for gathering information to be used in the wind erosion equation (Woodruff and Siddoway, 1965). The percentage of air~lried soil having an aggregate diameter greater than 0.84 mm was recorded. Weed surveys were conducted anually to assess the effects of tillage on weed control.
All data were analyzed by analysis of variance. If significant differences at the 0.05 level were indicated and the analysis was appropriate, Duncan's multiple range test was used to compare means.
RESULTS AND DISCUSSION
In 1979, the entire s tudy site had been uniformly cropped to barley. Hence, 1980 was essentially a year of establishment for crop rotations and tillage practices. Data collected in 1980 showed little correlation with any of the study variables and is, therefore, reported only when background information appears beneficial for interpreting subsequent results.
Fertilizer effects
During the three years of this study, neither ammonium nitrate nor urea was found to be a superior N-source for subarctic crop production. No significant differences in grain yield, crop residue production, available soil N, soil moisture or soil temperature could be at tr ibuted to N-source. Also, N-source had no visible effect on rate of crop maturity. Therefore, all results in Tables I I - I V are averaged across N sources. Each spring, when soil samples were collected, supplies of available N had been depleted to such an extent that no effect of tillage on available soil N was discernible (data not shown).
TABLE II
Distribution of potassium in the soil at the end of the 3-year study as affected by tillage method
Tillage Soil depth (cm) method
0--5 5--10 10--15
Available K (ppm)
Maximum 181 122 76 Minimum 228 113 77 Zero 292 68 43
346
TABLE III
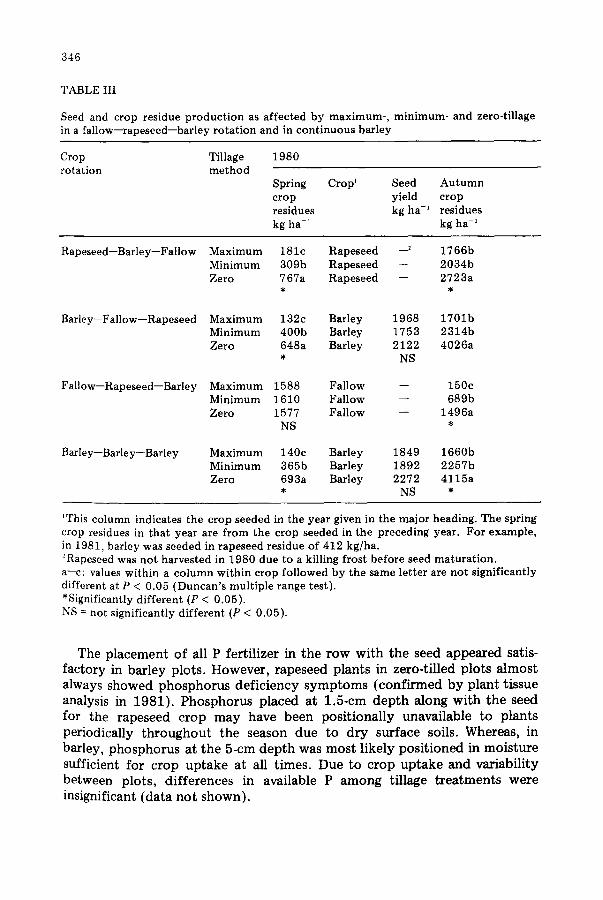
Seed and crop residue p r o d u c t i o n as a f fec ted by max imum- , m i n i m u m - and zero-ti l lage in a fa l low--rapeseed--bar ley r o t a t i o n and in c o n t i n u o u s bar ley
Crop Tillage 1980 ro ta t ion m e t h o d
Spring Crop ~ Seed A u t u m n crop yield c rop residues kg h a -~ residues kg ha -~ kg ha -~
Rapeseed--Bar ley--Fal low
Bar ley--Fal low--Rapeseed
Fal low--Rapeseed--Bar ley
Barley--Barle y--Bar ley
M a x i m u m 181c Rapeseed --~ 1 7 6 6 b M i n i m u m 309b Rapeseed - - 2 0 3 4 b Zero 767a Rapeseed - - 2 7 2 3 a
* *
M a x i m u m 132c Barley 1968 1 7 0 1 b M i n i m u m 4 0 0 b Barley 1753 2 3 1 4 b Zero 648a Barley 2122 4 0 2 6 a
* NS
M a x i m u m 1588 Fal low - - 150c M i n i m u m 1610 Fal low - - 689b Zero 1577 Fal low - - 1496a
NS *
M a x i m u m 140c Barley 1849 1 6 6 0 b M i n i m u m 365b Barley 1892 2 2 5 7 b Zero 693a Barley 2272 4115a
* N S *
'This co lumn indicates the c rop seeded in the year given in the ma jo r heading. The spr ing crop residues in t h a t year are f r o m the c rop seeded in the preceding year. Fo r example , in 1981, bar ley was seeded in rapeseed res idue of 412 kg/ha . ~Rapeseed was no t harves ted in 1980 due to a kill ing f ros t before seed m a t u r a t i o n . a--c : values w i th in a c o l u m n w i t h i n crop fol lowed by the same le t te r are n o t s igni f icant ly different at P < 0.05 ( D u n c a n ' s mul t ip le range test) . *Significantly d i f f e ren t (P < 0.05). NS = no t s ignif icant ly d i f fe ren t (P < 0.05).
The placement of all P fertilizer in the row with the seed appeared satis- factory in barley plots. However, rapeseed plants in zero-tilled plots almost always showed phosphorus deficiency symptoms (confirmed by plant tissue analysis in 1981). Phosphorus placed at 1.5-cm depth along with the seed for the rapeseed crop may have been positionally unavailable to plants periodically throughout the season due to dry surface soils. Whereas, in barley, phosphorus at the 5-cm depth was most likely positioned in moisture sufficient for crop uptake at all times. Due to crop uptake and variability between plots, differences in available P among tillage treatments were insignificant (data not shown).
347
1981
Spring crop residues kg ha -~
Crop ~
1982
Seed Autumn Spring Crop ~ Seed Autumn yield crop crop yield crop kg ha -1 residues residues kg ha -~ residues
kg ha -~ kg ha -~ kg ha -1
412b Barley 2356a 4298 4210a Fallow -- 1434b 694b Barley 2480a 3760 3674b Fallow -- 2053ab
2828a Barley 1870b 4099 4008a Fallow -- 2427a * * NS * *
1452b Fallow -- 431b 128b Rapeseed 659 6808b 1459b Fallow -- 743ab 328b Rapeseed 833 8157ab 1890a Fallow -- 1249a 1120a Rapeseed 950 8900a
* * * NS *
104b Rapeseed 808 5122a 1754b Barley 2212 5849b 587a Rapeseed 608 3529b 1295b Barley 2315 4988b 535a Rapeseed 364 3861b 3775a Barley 2469 8756a * NS * * NS *
1428b Barley 2228 3281 1612b Barley 3116 7427 1432b Barley 2388 3304 2587ab Barley 2886 7248 2100a Barley 2226 4044 3913a Barley 2183 6710
* NS NS * NS NS
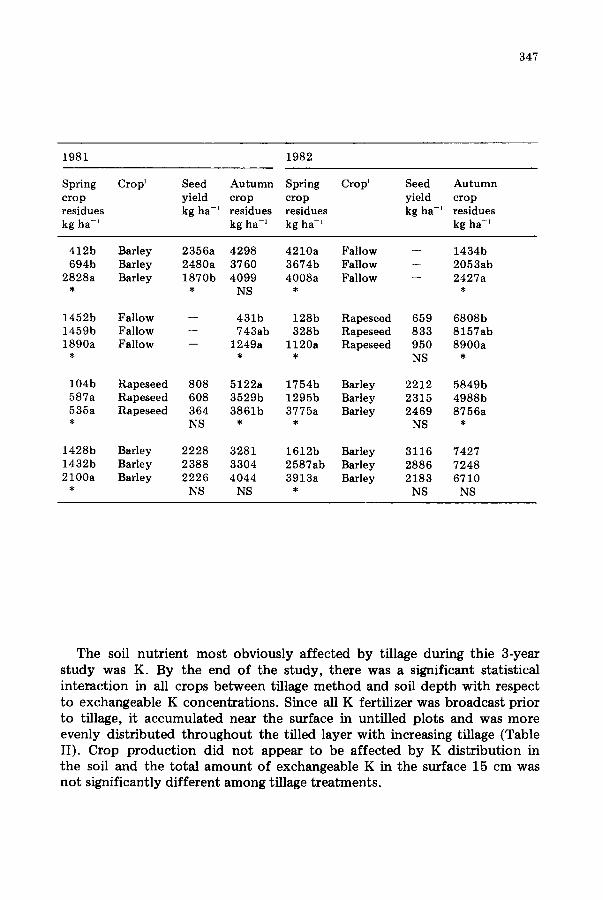
T h e soil n u t r i e n t m o s t o b v i o u s l y a f f e c t e d b y t i l lage d u r i n g t h i e 3 -year
s t u d y was K. By t h e e n d o f t h e s t u d y , t h e r e was a s i g n i f i c a n t s t a t i s t i ca l i n t e r a c t i o n in all c rops b e t w e e n t i l lage m e t h o d a n d soil d e p t h w i t h r e s p e c t
t o e x c h a n g e a b l e K c o n c e n t r a t i o n s . S ince all K fe r t i l i ze r was b r o a d c a s t p r i o r t o t i l lage , i t a c c u m u l a t e d n e a r t h e su r face in u n t i l l e d p l o t s a n d was m o r e e v e n l y d i s t r i b u t e d t h r o u g h o u t t he t i l l ed l aye r w i t h i n c r e a s i n g t i l lage ( T a b l e II) . C rop p r o d u c t i o n d id n o t a p p e a r t o be a f f e c t e d b y K d i s t r i b u t i o n in t h e soil a n d t h e t o t a l a m o u n t o f e x c h a n g e a b l e K in t h e su r f ace 15 c m was n o t s i g n i f i c a n t l y d i f f e r e n t a m o n g t i l lage t r e a t m e n t s .
348
T A B L E IV
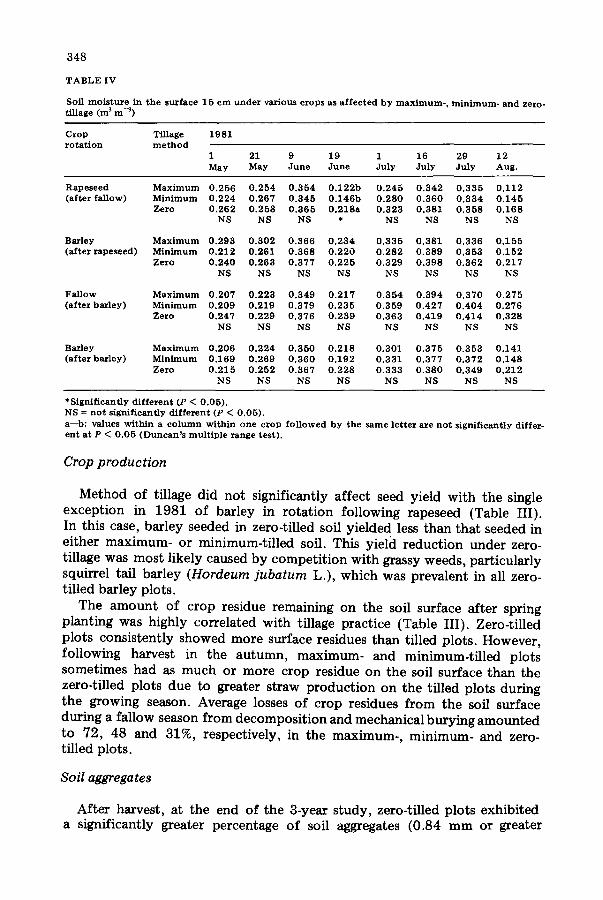
Soil mois ture in the surface 1 5 cm under various crops as af fected b y max imum- , min imum- and zero- tillage (m 3 m -3)
Crop Tillage 1 9 8 1 rotat ion m e t h o d
1 21 9 1 9 1 16 29 1 2 May May June June July July July Aug .
Rapeseed M a x i m u m 0 . 2 5 6 0 . 2 5 4 0 . 3 5 4 0 . 1 2 2 b 0 . 2 4 5 0 . 3 4 2 0 . 3 3 5 0 . 1 1 2 (after fa l low) Minimum 0 . 2 2 4 0 . 2 6 7 0 . 3 4 5 0 . 1 4 6 b 0 . 2 8 0 0 . 3 6 0 0 . 3 3 4 0 . 1 4 5
Zero 0 . 2 6 2 0 . 2 5 8 0 . 3 6 5 0 . 2 1 8 a 0 . 3 2 3 0 . 3 8 1 0 . 3 5 8 0 . 1 6 8 NS NS NS * NS NS NS NS
Barley Max imum 0 . 2 9 3 0 . 3 0 2 0 . 3 6 6 0 . 2 3 4 0 . 3 3 5 0 . 3 8 1 0 . 3 3 6 0 . 1 5 5 (after rapeseed) Minimum 0 . 2 1 2 0 . 2 6 1 0 . 3 6 8 0 . 2 2 0 0 . 2 8 2 0 . 3 8 9 0 . 3 5 3 0 . 1 5 2
Zero 0 . 2 4 0 0 . 2 6 3 0 . 3 7 7 0 . 2 2 5 0 . 3 2 9 0 . 3 9 8 0 . 3 6 2 0 . 2 1 7 NS NS NS NS NS NS NS NS
F a l l o w M a x i m u m 0 . 2 0 7 0 . 2 2 3 0 . 3 4 9 0 . 2 1 7 0 . 3 5 4 0 . 3 9 4 0 . 3 7 0 0 . 2 7 5 (after barley) Minimum 0 . 2 0 9 0 . 2 1 9 0 . 3 7 9 0 . 2 3 5 0 . 3 5 9 0 . 4 2 7 0 . 4 0 4 0 . 2 7 6
Zero 0 . 2 4 7 0 . 2 2 9 0 . 3 7 6 0 . 2 3 9 0 . 3 6 3 0 . 4 1 9 0 . 4 1 4 0 . 3 2 8 NS NS NS NS NS NS NS NS
Barley Max imum 0 . 2 0 6 0 . 2 2 4 0 . 3 5 0 0 . 2 1 8 0 . 3 0 1 0 . 3 7 5 0 . 3 5 3 0 . 1 4 1 (after barley) Minimum 0 , 1 6 9 0 . 2 6 9 0 . 3 6 0 0 , 1 9 2 0 . 3 3 1 0 . 3 7 7 0 . 3 7 2 0 . 1 4 8
Zero 0 . 2 1 5 0 . 2 5 2 0 . 3 6 7 0 . 2 2 8 0 . 3 3 3 0 . 3 8 0 0 . 3 4 9 0 . 2 1 2 NS NS NS NS NS NS NS NS
*Signif icantly di f ferent (P < 0 . 0 5 ) . NS = not s ignif icantly dif ferent (P < 0 , 0 5 ) . a--b: values wi th in a c o l u m n with in one crop f o l l o w e d by the same letter are not s ignif icantly differ- ent at P < 0 . 0 5 (Duncan's mult iple range test) .
Crop production
Method of tillage did not significantly affect seed yield with the single exception in 1981 of barley in rotation following rapeseed (Table III). In this case, barley seeded in zero-tilled soil yielded less than that seeded in either maximum- or minimum-tilled soil. This yield reduction under zero- tillage was most likely caused by competition with grassy weeds, particularly squirrel tail barley (Hordeum jubatum L.), which was prevalent in all zero- tilled barley plots.
The amount of crop residue remaining on the soil surface after spring planting was highly correlated with tillage practice (Table III). Zero-tilled plots consistently showed more surface residues than tilled plots. However, following harvest in the autumn, maximum- and minimum-tilled plots sometimes had as much or more crop residue on the soil surface than the zero-tilled plots due to greater straw production on the tilled plots during the growing season. Average losses of crop residues from the soil surface during a fallow season from decomposition and mechanical burying amounted to 72, 48 and 31%, respectively, in the maximum-, minimum- and zero- tilled plots.
Soil aggregates
After harvest, at the end of the 3-year study, zero-tilled plots exhibited a significantly greater percentage o f soil aggregates (0.84 mm or greater
349
1 9 8 1 1 9 8 2
27 1 0 2 4 9 2 5 8 23 1 2 21 4 17 Aug . Sep t . Sep t . M a y M a y J u n e J u n e J u l y J u l y Aug . Aug .
O . 1 9 0 b 0 . 1 5 2 0 . 2 2 0 b 0 . 3 5 4 0 . 2 6 5 0 . 2 9 9 0 . 3 1 5 0 . 2 1 9 0 . 2 8 6 0 . 2 1 5 0 . 2 1 8 0 . 2 3 1 a 0 . 2 2 0 0 . 2 6 2 a b 0 . 3 5 4 0 . 2 8 5 0 . 3 1 5 0 . 3 1 8 a b 0 . 1 8 6 0 . 2 8 1 0 . 1 9 8 0 . 3 1 4 0 . 2 4 4 a 0 . 2 3 0 0 . 2 7 5 a 0 . 3 8 7 0 . 3 2 9 0 . 3 2 6 0 . 3 3 4 a 0 . 1 9 6 0 . 2 8 3 0 . 2 2 9 0 . 2 2 5
* NS * NS NS NS * NS NS NS NS
0 . 2 5 2 0 . 2 4 1 0 . 2 3 9 0 . 3 1 8 0 . 2 8 7 b 0 . 3 2 0 0 . 2 9 6 0 . 1 6 0 b 0 . 2 6 4 b 0 . 1 9 8 0 . 2 0 7 0 . 2 2 2 0 . 1 9 4 0 . 2 3 7 0 . 3 3 9 0 . 2 8 4 b 0 . 3 1 4 0 . 3 1 9 0 . 1 8 1 b 0 . 2 6 8 b 0 . 2 0 6 0 . 2 1 0 0 . 2 8 3 0 . 2 5 2 0 . 2 6 4 0 . 3 5 5 0 . 3 2 8 a 0 . 3 4 6 0 . 3 2 0 0 . 2 1 2 a 0 . 2 9 3 a 0 . 2 2 3 0 . 2 4 3
NS NS NS NS * NS NS * * NS NS
0 . 2 8 8 b 0 . 2 8 4 b 0 . 3 1 8 b 0 . 3 7 1 0 . 3 4 5 0 . 3 5 1 0 . 3 0 8 0 . 2 7 4 b 0 . 3 0 1 0 . 2 7 5 0 . 2 8 1 b 0 . 2 8 0 b 0 . 3 1 0 b 0 . 3 4 4 a b 0 . 3 6 8 0 . 3 5 4 0 . 3 6 1 0 . 3 4 0 0 . 3 1 2 a 0 . 3 2 8 0 . 2 7 2 0 . 2 7 8 b 0 . 3 6 8 a 0 . 3 9 8 a 0 . 4 0 1 a 0 . 3 6 1 0 . 3 3 1 0 . 3 6 8 0 . 3 3 6 0 . 3 2 5 a 0 . 3 2 9 0 . 2 7 6 0 . 3 1 8 a
* * * NS NS NS NS * NS NS NS
0 . 2 1 5 0 . 1 9 0 0 . 2 2 1 0 . 3 5 8 0 . 2 8 0 0 . 3 2 7 b 0 . 3 1 1 0 . 1 9 1 0 . 2 7 4 b 0 . 2 0 2 b 0 . 2 0 8 0 . 2 3 8 0 . 1 9 7 0 . 1 9 8 0 . 3 5 1 0 . 2 8 9 0 . 3 1 9 b 0 . 3 2 2 0 . 2 2 0 0 . 2 8 4 a b 0 . 2 1 5 a b 0 . 2 4 1 0 . 2 4 3 0 . 2 2 2 0 . 2 5 2 0 . 3 5 1 0 . 3 1 7 0 . 3 5 1 a 0 . 3 3 1 0 . 2 2 6 0 . 3 0 2 a 0 . 2 4 2 a 0 . 2 3 1
NS NS NS NS NS * NS NS * * NS
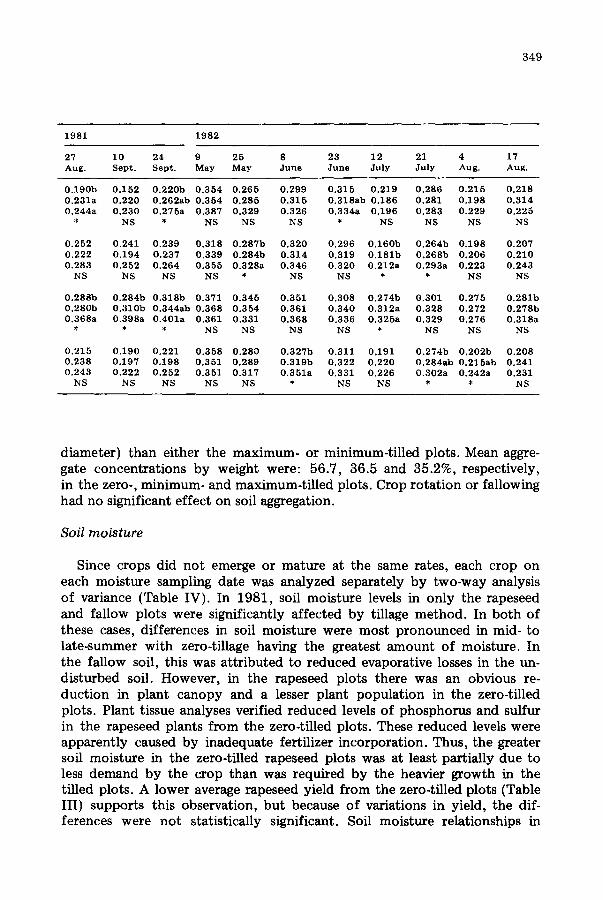
diameter) than either the maximum- or minimum-tilled plots. Mean aggre- gate concentrations by weight were: 56.7, 36.5 and 35.2%, respectively, in the zero-, minimum- and maximum-tilled plots. Crop rotat ion or fallowing had no significant effect on soil aggregation.
Soil moisture
Since crops did not emerge or mature at the same rates, each crop on each moisture sampling date was analyzed separately by two-way analysis of variance (Table IV). In 1981, soil moisture levels in only the rapeseed and fallow plots were significantly affected by tillage method. In both of these cases, differences in soil moisture were most pronounced in mid- to late~summer with zero-tillage having the greatest amount of moisture. In the fallow soil, this was attributed to reduced evaporative losses in the un- disturbed soil. However, in the rapeseed plots there was an obvious re- duction in plant canopy and a lesser plant population in the zero-tilled plots. Plant tissue analyses verified reduced levels of phosphorus and sulfur in the rapeseed plants from the zero-tilled plots. These reduced levels were apparently caused by inadequate fertilizer incorporation. Thus, the greater soil moisture in the zero-tilled rapeseed plots was at least partially due to less demand by the crop than was required by the heavier growth in the tilled plots. A lower average rapeseed yield from the zero-tilled plots (Table III) supports this observation, but because of variations in yield, the dif- ferences were not statistically significant. Soil moisture relationships in
350
1982 were very similar to those in 1981, with zero-tillage plots again having the highest moisture levels on those dates when differences between tillage t reatment means were significant.
The main purpose of fallow in the crop rotat ion was to accumulate soil moisture for the succeeding rapeseed crop. Although considerably more soil moisture was present in the fallow plots than in the cropped plots each autumn, moisture levels between cropped and fallowed plots had equalized to the point that they were no longer significantly different by the following spring (Table IV). The stubble on the cropped plots was much more erect and appeared to be more efficient in trapping and holding snow than the year-old stubble on the fallow plots. Erect stubble has been shown to be very effective in both holding snow on the field and preserving soil moisture by reducing evaporative losses (Willis, et al., 1969; Aase and Siddoway, 1980; Gauer, et al., 1982). In contrast to the fallowed plots, the upright stubble on the recently cropped plots evidently captured enough additional snow and possibly reduced soil moisture losses enough to offset soil moisture differences that were present in autumn.
Soil temperature
An interesting observation concerning soil temperature was made during soil sampling in late-April. Each year, despite the insulating crop residues present, the soil in plots that had been cropped the previous year thawed to the 15-cm sampling depth approximately 5--7 days earlier than in the maximum- and minimum-tillage fallow plots which were almost devoid of crop residues on the soil surface. Soil moisture levels were found not to be significantly different among plots at this time. In the cropped plots on which stubble remained through the winter, it was observed that snow was trapped and stabilized while wind of ten blew the fallowed plots bare of snow cover. The beneficial effect of stubble in retarding heat loss from the soil during winter was apparently greater than the adverse effects of s tubble on soil warming in the spring.
It was observed that maximum-tilled plots of ten exhibited colder average temperatures into mid-season than either the minimum- or zero-tilled plots. On these occasions, the moisture content of the maximum-tilled soils was also the lowest. Dryer soils have a lower heat capacity and would be ex- pected to warm up faster than the wet ter soils. However, the maximum- tilled soils were also fluffier and contained large amounts of air space which apparently reduced the thermal conductivity of the soil. Later in the season, however, after the soils had settled, the zero-tilled soils were the coldest due to the crop residues remaining on the surface.
Three-way analysis of variance was used to compare the effects of tillage method, N-source and sampling depth on soil temperatures. There were no significant interactions between tillage method and sampling depth. Tillage method had a significant effect on soil temperature only on scattered dates
351
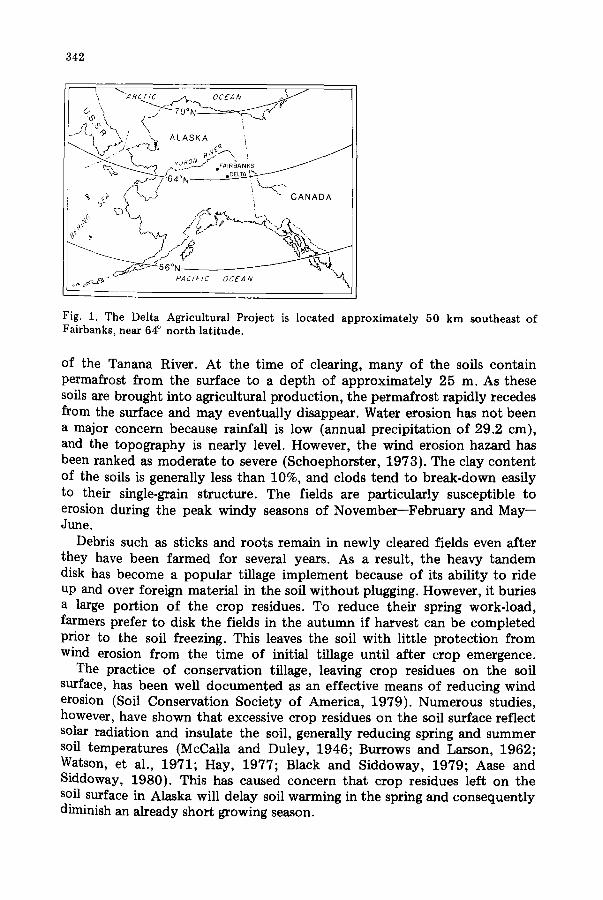
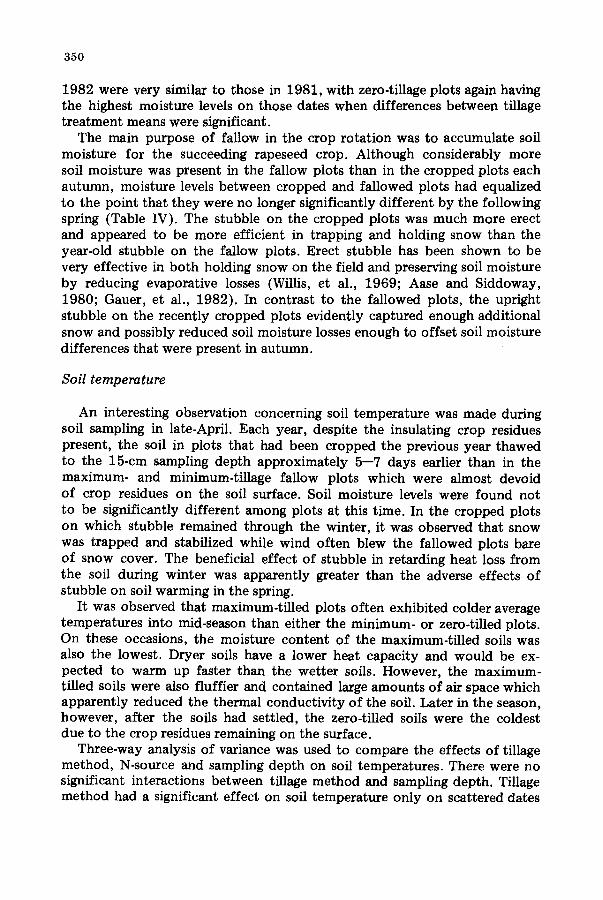
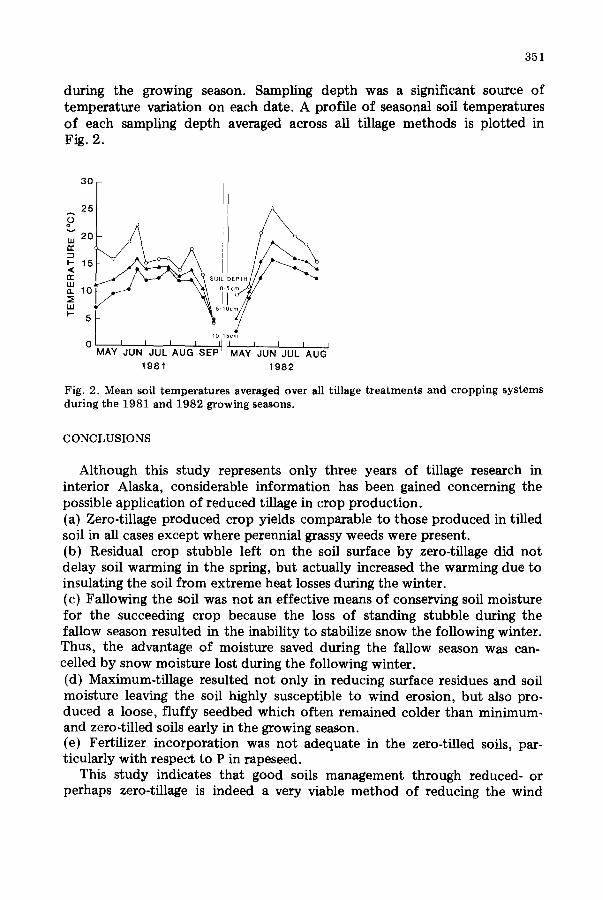
during the growing season. Sampling depth was a significant source of temperature variation on each date. A profile of seasonal soil temperatures of each sampling depth averaged across all tillage methods is plotted in Fig. 2.
30
218 I " ~ SOIL EPTH ~I
i
oi,5o 1981 1982
Fig. 2. Mean soil temperatures averaged over all tillage treatments and cropping systems during the 1981 and 1982 growing seasons.
CONCLUSIONS
Although this study represents only three years of tillage research in interior Alaska, considerable information has been gained concerning the possible application of reduced tillage in crop production. (a) Zero-tillage produced crop yields comparable to those produced in tilled soil in all cases except where perennial grassy weeds were present. (b) Residual crop stubble left on the soil surface by zero-tillage did not delay soil warming in the spring, but actually increased the warming due to insulating the soil from extreme heat losses during the winter. (c) Fallowing the soil was not an effective means of conserving soil moisture for the succeeding crop because the loss of standing stubble during the fallow season resulted in the inability to stabilize snow the following winter. Thus, the advantage of moisture saved during the fallow season was can- celled by snow moisture lost during the following winter. (d) Maximum-tillage resulted not only in reducing surface residues and soil moisture leaving the soil highly susceptible to wind erosion, but also pro- duced a loose, fluffy seedbed which often remained colder than minimum- and zero.tilled soils early in the growing season. (e) Fertilizer incorporation was not adequate in the zero-tilled soils, par- ticularly with respect to P in rapeseed.
This study indicates that good soils management through reduced-or perhaps zero-tillage is indeed a very viable method of reducing the wind
352
erosion potential in interior Alaska. Potential problems with the use of reduced tillage will include the control of perennial grassy weeds and proper fertilizer placement.
ACKNOWLEDGEMENTS
Grateful acknowledgement is made to the United States Department of Agriculture, Soil Conservation Service for financial and technical assistance in this research. The authors thank Roger Boyer, District Conservationist, Salcha-Big Delta Soil Conservation District, for collecting the soil aggregate and crop residue data. Special thanks are also extended to Cathy Birklid, Research Assistant, Alaska Agricultural Experiment Station and Dr. Dana Thomas, Assistant Professor of Statistics, University of Alaska, for assistance in statistical analyses.
REFERENCES
Aase, J.K. and Siddoway, F.H., 1980. Stubble height effects on seasonal microclimate, water balance and plant development of no-till winter wheat. Agric. Meteorol., 21: 1--20.
Bentley, C.F., Crepin, J.M. and Domier, K.W., 1978. No-tillage grain product ion in the Edmonton region. Agric. For. Bull. University of Alberta, Edmonton, 1(1): 17--25.
Black, A.L. and Siddoway, F.H., 1979. Influence of tillage and wheat straw residue management on soil properties in the Great Plains. J. Soil Water Cons., 34: 220-- 223.
Burrows, W.C. and Larson, W.E., 1962. Effect of amount of mulch on soil temperature and early growth of corn. Agron. J., 54: 19--23.
Dahnke, W.C. (Editor), 1980. Recommended chemical soil test procedures for the North Central Region. North Central Regional Publication No. 221 (Revised). North Dakota Agric. Exp. Stn., University of North Dakota, Fargo.
Gauer, E., Shaykewich, C.F. and Stobbe, E.H., 1982. Soil temperature and soil water under zero tillage in Manitoba. Can. J. Soil Sci., 62: 311--325.
Hay, R.K.M., 1977. Effects of tillage and direct drilling on soil temperature in winter. J. Soil Sci., 28: 403--409.
Lewis, C.E. and Wooding, F.J., 1978. Barley product ion in the Delta - - Clearwater area of interior Alaska. Agric. Exp. Stn., Bull. No. 49. University of Alaska, Fairbanks, 46 pp.
Lewis, C.E. and Thomas, W.C., 1982. Expanding subarctic agriculture - - social, political and economic aspects in Alaska. Interdiscip. Sci. Rev., 7(3): 178--187.
Lewis, C.E., Franklin, G.D. and Quarberg, D.M., 1979. Delta-Clearwater lands opened for agricultural use -- 2000 acre clearing-triais project. Agroborealis, 11 : 32--34.
McCalla, T.M. and Duley, F.L., 1946. Effects of crop residues on soil temperature. J. Am. Soc. Agron., 38: 75--89.
Pidgeon, J.D. and Ragg, J.M., 1979. Soil, climatic and management options for direct drilling cereals in Scotland. Outlook Agric., 10: 49--56.
Schoephorster, D.B., 1973. Soil survey of Salcha - - Big Delta area, Alaska. USDA-SCS, U.S. Government Printing Office, Washington, DC, 51 pp.
Soil Conservation Society of America, 1979. Effects of tillage and crop residue removal on erosion, runoff and plant nutrients. Soll Sci. Soc. Am. Special Pub. No. 25, Ankeny, IA, 28 pp.

353
Stohbe, E.H., 1979. Tillage practices on the Canadian prairie. Outlook Agric., 10: 21--26. Thomas, W.C. and Lewis, C.E., 1981. Alaska's Delta Agricultural Project: a review and
analysis. Agric. Admin., 8: 357--374. Watson, C.E., Branton, C.I. and Newman, J.E., 1971. Climatic characteristics of selected
Alaskan locations. Agric. Exp. Stn. Tech. Bull. No. 2. University of Alaska, Fairbanks, 56 pp.
Willis, W.O., Haas, H.J. and Carlson, C.W., 1969. Snowpack runoff as affected by stubble height. Soil Sci., 107: 256--259.
Woodruff, N.P. and Siddoway, F.H., 1965. A wind erosion equation. Soil Sci. Soc. Am. Proc., 29: 602--608.
Zentner, R.P. and Lindwall, C.W., 1978. An economic assessment of zero tillage in wheat--fallow rotations in southern Alberta. Can. Farm Econ., 13(6): 1--6.