Embed Size (px)
Citation preview
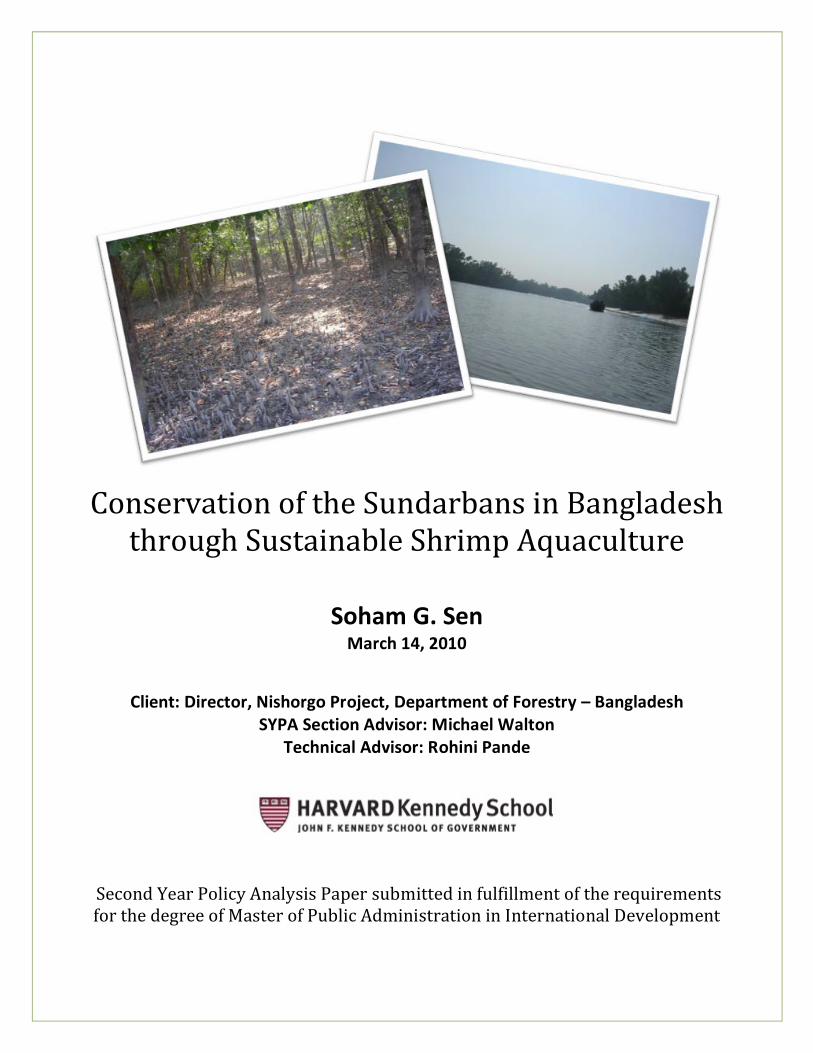
Conservation of the Sundarbans in Bangladesh through Sustainable Shrimp Aquaculture
Soham G. Sen
March 14, 2010
Client: Director, Nishorgo Project, Department of Forestry – Bangladesh SYPA Section Advisor: Michael Walton
Technical Advisor: Rohini Pande
Second Year Policy Analysis Paper submitted in fulfillment of the requirements for the degree of Master of Public Administration in International Development
i
Acknowledgments
No project of this kind is ever possible without the kindness and support of many people and this one
was no exception.
I benefited tremendously from the guidance and encouragement of my wonderful advisors at the
Harvard Kennedy School. Particular thanks go to my SYPA advisors Michael Walton and Rohini Pande. I
must also mention in gratitude Matt Andrews, my academic advisor, and Lant Pritchett who stepped in
whenever asked in the role of general advisor.
I was also fortunate indeed to have the support of several kind people at the World Bank particularly
Ernesto Sanchez-Triana in Washington who pointed me in the direction of the Sundarbans and Shakil
Ahmed Ferdausi, in Dhaka, who kindly hosted me during my field visit to Bangladesh. I cannot name all
the Bank staff who generously shared their time and insights, but I must mention the tireless work of
Nadia Sharmin who arranged my meetings in Dhaka and my journey to the Sundarbans.
There were again too many government officials, statisticians, shrimp farmers, and businessmen to
thank in Bangladesh, but I would like to express my appreciation generally to all who made the time to
speak with me and bore patiently with my anglicized Bengali. A special thanks to the people on the edge
of the forest. It was an honor to be allowed to peek into your lives and work, and I hope our paths cross
again someday in a better future.
Next, I would like to acknowledge the generous support from the Ash Institute for Democratic
Governance and Innovation at the Harvard Kennedy School which made the field visit possible.
Finally, any list of acknowledgement would be incomplete without a kind word of thanks to all those
who help in ways as important but perhaps less direct. Thanks to my fellow MPA/IDs and HKS colleagues
who listened, advised, or poured drinks throughout the process. And Carol Finney, MPA/ID program
director extraordinaire, deserves a general thanks for everything MPA/ID. Last but certainly not least, a
warm note of gratitude to my mom, dad, and sister: without you none of this would have been
possible.
While the guidance and advice I have received has been extraordinary and flawless, the work below is
certainly not. It has been a grand exercise in advancing my own learning if not producing outputs
valuable to others; wherever it falls short, it does so for my faults alone.
ii
Table of Contents
I. Executive Summary ............................................................................................................................ 1
II. The Need for a New Approach to Managing the Sundarbans: Thinking Outside of the Forest .............. 2
A. Importance of the Sundarbans and the Case for Conservation ..................................................... 2
B. The Command and Control Approach to Sundarbans Management: Not Enough ......................... 5
C. Causes of Degradation Inside the Sundarbans from Outside the Forest ........................................ 7
D. Why the Forest Department should Focus on Poverty .................................................................. 9
E. What can be done? Motivating Assumptions ............................................................................. 11
III. The Promise of Shrimp Aquaculture .................................................................................................. 12
A. The Returns to Shrimp Aquaculture ........................................................................................... 12
B. The International Market for Shrimp .......................................................................................... 13
C. Shrimp Industry in Bangladesh ................................................................................................... 14
D. Degradation Continued Despite Shrimp Aquaculture ................................................................. 15
IV. Sundarbans Management and the Nishorgo Program ....................................................................... 16
A. Public Value and Jurisdiction ...................................................................................................... 16
B. Technical and Administrative Capacity ....................................................................................... 17
C. Political and Institutional Environment....................................................................................... 18
V. Why Shrimp Aquaculture has not Delivered ...................................................................................... 19
A. Uneven Distribution of Employment and Wages ........................................................................ 19
B. Direct and Indirect Impacts of Shrimp Production on the Sundarbans ........................................ 29
VI. Fixing a Broken Promise: Towards Sustainable Aquaculture .............................................................. 32
A. What Can the Nishorgo Project Do? ........................................................................................... 32
B. Considerations in Promoting a Switch to Golda Production ........................................................ 36
C. How to Switch from Bagda to Golda? Policy Options .................................................................. 41
VII. Appendix ....................................................................................................................................... 44
A. SYPA Table ................................................................................................................................. 44
B. Estimating the Implications of Input Subsidy .............................................................................. 44
C. Field Visit to Bangladesh ............................................................................................................ 47
D. Additional Figures and Charts .................................................................................................... 48
E. Bibliography ............................................................................................................................... 51
iii
Table of Figures
Figure 1 - Inside the Sundarbans .............................................................................................................. 2
Figure 2 - The Sundarbans in Bangladesh (CEGIS 2006) ............................................................................ 3
Figure 3 - Tree Species in the Sundarbans (1995) ..................................................................................... 4
Figure 4 - Bangladesh Protect Areas Compared to Neighbors and World (Source: UNEP) ......................... 6
Figure 5 - Protected Areas of Bangladesh................................................................................................. 6
Figure 6 - Tree coverage (Iftekar and Islam 2004) .................................................................................... 7
Figure 7 - Trees per hectare (FAO 2000) ................................................................................................... 7
Figure 8 - Changes in Forest Composition (CEGIS 2006) ........................................................................... 7
Figure 9 - Change in Illegal Felling in the Sundarbans (Bangladesh FD) ..................................................... 8
Figure 10 - The Districts Containing the Sundarbans .............................................................................. 10
Figure 11 - Population Growth and Livelihoods in the Impact Zone ........................................................ 10
Figure 12 - Returns from Shrimp, Rice, and Wage Labor ........................................................................ 13
Figure 13 - Volume of Shrimp Imports 1950-2000 .................................................................................. 13
Figure 14 - Quantity and Value of Shrimp Produced ............................................................................... 13
Figure 15 - Price of Shrimp 1990 – 2004 (FAO) ....................................................................................... 14
Figure 16 - The Rise of Frozen Shrimp Exports to Bangladesh (DoF, 2001) .............................................. 15
Figure 17 - Productivity (kg/ha).............................................................................................................. 15
Figure 18 – Shrimp Area Khulna ............................................................................................................. 15
Figure 19 – Types of Shrimp Produced ................................................................................................... 15
Figure 20 - MOEF in the Bangladesh Budget (Source: Bangladesh Ministry of Finance, Author’s
Calculations) .......................................................................................................................................... 18
Figure 21 -- Value Chain Diagram (Souce: USAID) ................................................................................... 20
Figure 22 – Simplified Shrimp Value Chain ............................................................................................. 20
Figure 23: Detailed Shrimp Value Chain (USAID/Bangladesh 2006) ........................................................ 21
Figure 24: Saltwater Shrimp Production. Author and Interviews ............................................................ 23
Figure 25 - Sluice Gate System ............................................................................................................... 23
Figure 26 - Bagda Gher and Trip............................................................................................................. 24
Figure 27 - Shrimp Trap ......................................................................................................................... 24
Figure 28 - Returns to Bagda Farming .................................................................................................... 24
Figure 29 - Golda Farm .......................................................................................................................... 26
iv
Figure 30 - Golda Farm with Rice Adjacent............................................................................................. 26
Figure 31 - Returns to Golda Farming .................................................................................................... 26
Figure 32 - Employment Along the Value Chain (Author Calculations and (USAID/Bangladesh 2006)) .... 29
Figure 33 - Income Along the Value Chain (Author Calculations and (USAID/Bangladesh 2006)) ............ 29
Figure 34 – Comparison of Income and Employment Dispersion (Author Calculations and
(USAID/Bangladesh 2006)) .................................................................................................................... 29
Figure 35 - Mr. Rafiquzzaman, Bagda Farmer near Hadda ...................................................................... 36
Figure 36 - Mr. Mullah, Golda Farmer in Doomoria ................................................................................ 36
Figure 37 - Bagda Suitability Map (CEGIS) .............................................................................................. 37
Figure 38 - Actual Bagda Growth (CEGIS) ............................................................................................... 37
Figure 39 - Golda Suitability Map (CEGIS) ............................................................................................... 38
Figure 40 - Actual Golda Growth ............................................................................................................ 38
Figure 41 - The SYPA-Meter ................................................................................................................... 44
Figure 42 - Services Provided by the Sundarbans (Iftekar and Islam 2004) ............................................. 48
Figure 43 - Extreme Poverty and Travel to Dhaka(BBS 2009) .................................................................. 48
Figure 44 - Hadda FD Post Showing Captured Boats ............................................................................... 49
Figure 45 - Hadda FD Post Showing Illegal Felling ................................................................................... 49
Figure 46 - Growing stock of Sundarbans decreasing (FAO 2000) ........................................................... 49
Figure 47 - Composition II (Iftekar and Islam 2004) ................................................................................ 49
Figure 48 - Shrimp Producing Countries and Market Share (Leung and Eagle 2006) ............................... 50
Figure 49 - Bangladesh Growth in Frozen Shrimp Volume ...................................................................... 50
1
I. Executive Summary
This second year policy analysis paper observes that the command and control approach of the Forest
Department of Bangladesh toward managing the Sundarbans mangrove forest has been unsuccessful. The
Sundarbans, a treasured UNESCO World Heritage Site, have degraded steadily over time. This paper argues
that the Forest Department needs to “think outside of the forest” and address the primary causes of
degradation nearly all of which fall outside the forest. It adopts the perspective of the Nishorgo Program that
was created within the Forest Department to develop and implement strategies to co-manage areas like the
Sundarbans with the involvement of key stakeholders.
While there are many significant factors that are responsible for forest degradation, the paper focuses on a
factor that the Nishorgo Program is most able to influence: the high levels of poverty in the dense population
of over 6 million people that live just outside of the forest in the three districts that contain the Sundarbans.
The forest is degrading due to the dependence of nearly 1.35 million people who earn a living by selling
materials extracted from the forest. The paper argues that conservation of the Sundarbans requires an
alternative livelihood that generates sufficient income for this vulnerable population to curb their
dependence on the forest.
While in many other parts of the world an alternative is not easily available, the same region outside the
Sundarbans hosts one of the most dynamic sectors of the Bangladeshi economy: shrimp aquaculture. This
promising alternative livelihood has developed over the past three decades. Today it accounts for 5% of GDP,
over $300M in exports and 1.2 million jobs. Yet perplexingly, over this time period, forest degradation has
continued, and poverty has remained much the same. This paper examines the shrimp value chain to explain
that productivity is much lower than in other countries; that jobs generated in the industry are poorly, paid
and a majority of earnings accrue to a small number of participants; and that shrimp production itself can
have significant environmental impacts.
The analysis also explores important differences between the saltwater and freshwater shrimp production.
The freshwater variety is found to create more jobs for the poor, be more productive, less costly to produce,
yield higher returns, and have a smaller environmental footprint. The paper proceeds to examine the
feasibility and benefits of switching saltwater shrimp farmers to freshwater and determines that such a
switch would be possible for a majority of the farmers. It concludes with a recommendation to the Nishorgo
Program to facilitate such a switch through the subsidy of an important input for freshwater shrimp
production. The result of such a switch could convert shrimp aquaculture into the alternative livelihood that
people at the edge of the forest need to curb their dependency on the Sundarbans.
2
II. The Need for a New Approach to Managing the Sundarbans: Thinking Outside
of the Forest
A. Importance of the Sundarbans and the Case for Conservation
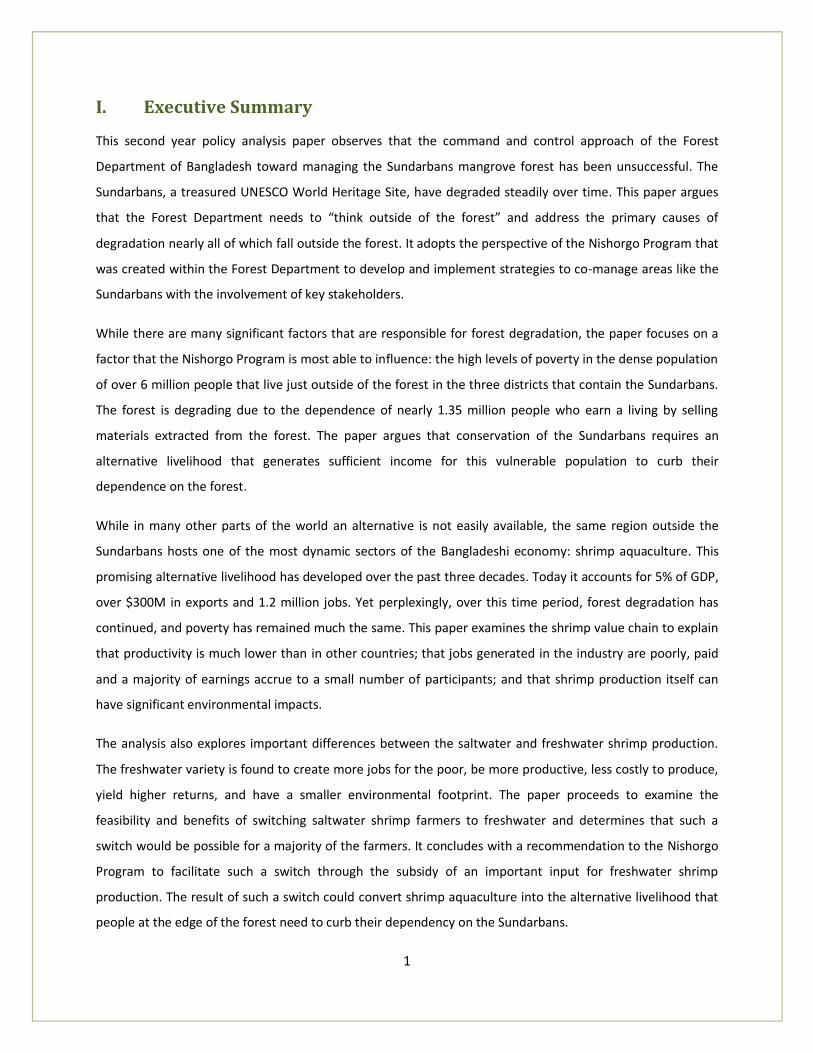
1. The Sundarbans
To the uninitiated traveler, passing through the endless pastoral scenes of rice fields and shrimp ponds
in the southwestern districts of Bangladesh, the Sundarbans appear abruptly on the horizon – as if by
mistake. The wall of dense greenery seems out of place in the otherwise treeless, delta landscape where
the mighty Ganges, Jamuna, and Mehna rivers finish their long journey down from the Himalayan
Mountains and empty into the Bay of Bengal. Inside the forest is even stranger, the mangrove trees
have adapted to the unique environment of annual flooding, daily tidal fluctuations and the mixture of
saltwater from the Bay and freshwater from the rivers. From the low oxygen soil, the tree roots
protrude sharply up from the ground warning intruders to handle with care the immense biodiversity
that lies within. Some 300 species of plants, 120 types of fish, 300 unique birds, and 32 mammals
including the famous Royal Bengal tiger live in the Forest (Iftekar and Islam 2004). A soft light penetrates
the canopy from where a multitude of birds sing over a herd of deer moving to the water hole. At first
glance, the forest is as the Bengali language name given it implies, a “beautiful (sunder) forest (bon).”
Figure 1 - Inside the Sundarbans
At a second glance however, one begins to notice things amiss; empty spots where trees once were
become apparent. Or, many of the tall trees look as if their tops have been charred by flame. Historical
records give further cause for concern. Less than two hundred years ago, the forest is thought to have
extended along the Bay from Calcutta to the east, to Burma to the west, and nearly to Dhaka to the
3
north (Iftekar and Islam 2004). The forest would not have looked out of place in the delta landscape, it
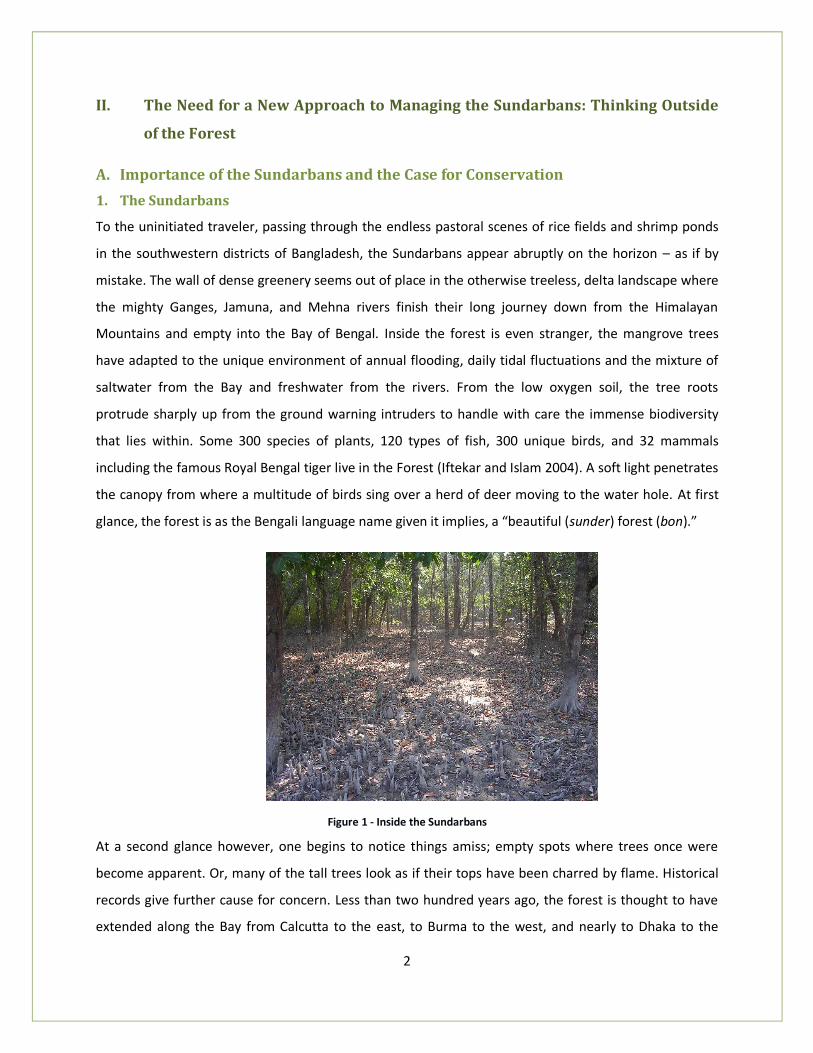
would have dominated it. Today, the Sundarbans cover significantly less territory (See Figure 2) spanning
just over 10,000 km2 across India and Bangladesh along the Bay of Bengal and still form the world’s
largest mangrove forest. Of the total territory, approximately 577,100 ha (6,017 km2) fall in Bangladesh;
407,100 ha are mangrove forest and 170,000 ha are waterways (CEGIS 2006).
Despite the fact that nearly a quarter of the world’s tropical coastline, across 112 countries has some
mangrove habitation, the mangrove forest is rare. The total area is between 15.6 to 17 million hectares
(ha) out of total worldwide forest cover of 3,952 million ha (FAO 2007).
Figure 2 - The Sundarbans in Bangladesh (CEGIS 2006)
Forest Composition
It is important to note at the outset that, just as the mangrove forests comprise of many different
animal species, there are numerous tree species as well which are quite different from each other in
significant ways; some can be used for firewood and others not while some have commercial value
while others not. The key point is that conservation of the mangroves is not simply a question of
conserving total forest area, but also forest composition (Salafsky and Wollenbert 2000). In the
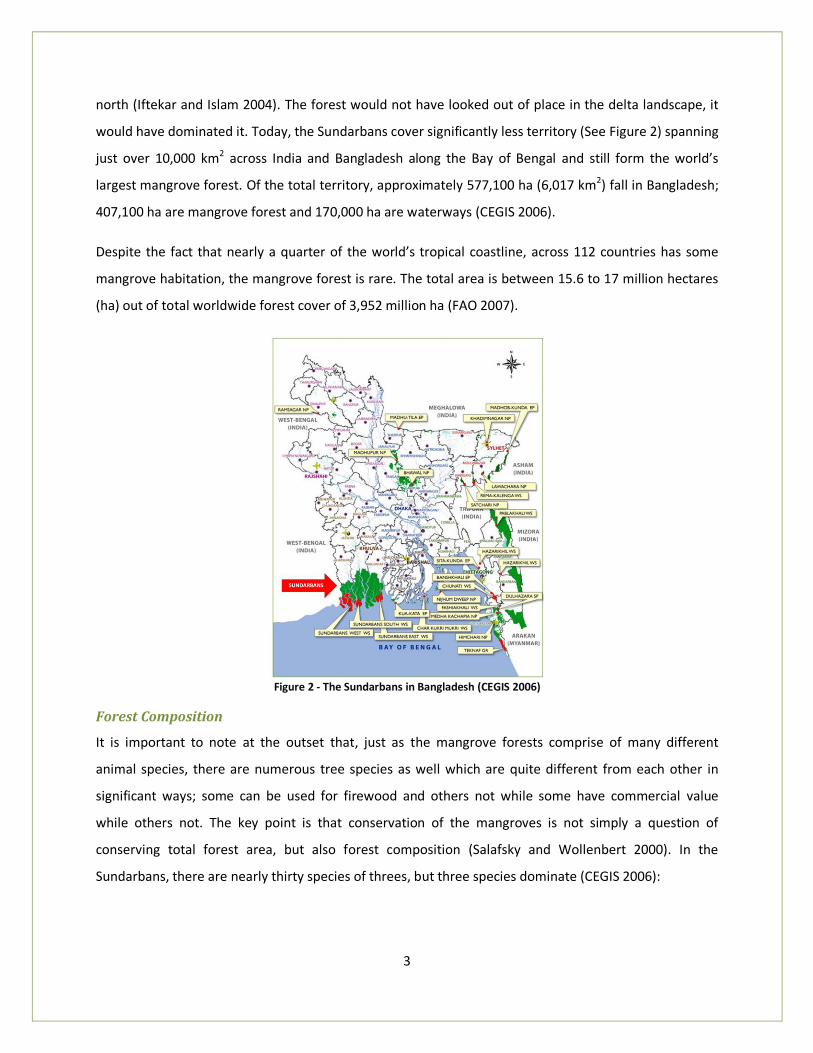
Sundarbans, there are nearly thirty species of threes, but three species dominate (CEGIS 2006):
4
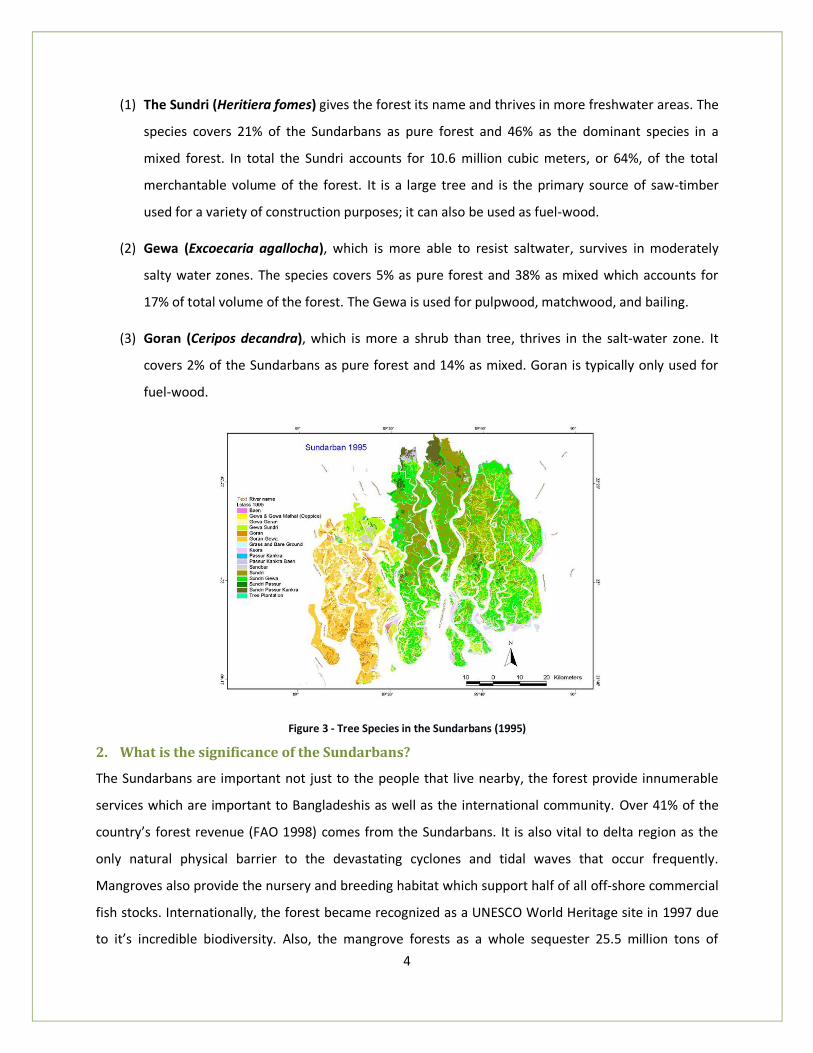
(1) The Sundri (Heritiera fomes) gives the forest its name and thrives in more freshwater areas. The
species covers 21% of the Sundarbans as pure forest and 46% as the dominant species in a
mixed forest. In total the Sundri accounts for 10.6 million cubic meters, or 64%, of the total
merchantable volume of the forest. It is a large tree and is the primary source of saw-timber
used for a variety of construction purposes; it can also be used as fuel-wood.
(2) Gewa (Excoecaria agallocha), which is more able to resist saltwater, survives in moderately
salty water zones. The species covers 5% as pure forest and 38% as mixed which accounts for
17% of total volume of the forest. The Gewa is used for pulpwood, matchwood, and bailing.
(3) Goran (Ceripos decandra), which is more a shrub than tree, thrives in the salt-water zone. It
covers 2% of the Sundarbans as pure forest and 14% as mixed. Goran is typically only used for
fuel-wood.
Figure 3 - Tree Species in the Sundarbans (1995)
2. What is the significance of the Sundarbans?
The Sundarbans are important not just to the people that live nearby, the forest provide innumerable
services which are important to Bangladeshis as well as the international community. Over 41% of the
country’s forest revenue (FAO 1998) comes from the Sundarbans. It is also vital to delta region as the
only natural physical barrier to the devastating cyclones and tidal waves that occur frequently.
Mangroves also provide the nursery and breeding habitat which support half of all off-shore commercial
fish stocks. Internationally, the forest became recognized as a UNESCO World Heritage site in 1997 due
to it’s incredible biodiversity. Also, the mangrove forests as a whole sequester 25.5 million tons of
5
carbon dioxide - the main cause of climate change – each year (Miththapala 2008). A comprehensive
overview study of 13 other valuations of mangrove systems, puts the services they provide at between
$1,000 to over $11,000 per hectare annually (Primavera 1997).
B. The Command and Control Approach to Sundarbans Management: Not Enough
The Sundarbans have been under active management for much of recent history by whichever authority
has administered the delta region that Bangladesh now occupies. The Bengal Forest Department of the
British Colonial Administration, applied the Indian Forest Act of 1865 to declare the Sundarbans a
Reserve Forest in 1878 (Millat-e-Mustafa 2002). The end of the British colonial era brought partition to
the sub-continent, and Bengal and the Sundarbans were not spared. 60% of the forest was transferred
to East Pakistan in 1947 which Bangladesh after the independence war in 1971.
While the political world changed much around the Forest, its administration has remained remarkably
consistent up to the present day. The Forest Department (FD) -- specifically, the Sundarbans Division of
the FD (ADB 1998) – brought under the newly created Ministry of Environment and Forests in 1989
(World Bank 2006), continues to manage the forest using the same “command and control policy” as it
did under during the colonial era. The thrust of the policy continues to be one where the forest is
cordoned off as a reserve forest and then entry, exit, and economic activity are controlled through
policing and licenses. If there has been any change, it has been to cordon off more of the forest and
specifically protect wildlife or particular trees. For example, parts of the Sundarbans were declared a
Wildlife Sanctuary in 1974 to conserve animals as well as trees. A moratorium on felling of the dominant
Sundari tree was enacted in 1989, and UNESCO declared the Sundarbans to be a World Heritage Site in
1997. A 20km buffer area around the forest was declared an “Ecologically Critical Area” in 2006. Finally,
after the devastation of Hurricane Aila in 2007, a ban on all forest extraction was put in place. The same
command and control policy, in other words, but taken to the extreme (FAO 2007).
1. The Degradation of the Bangladeshi Forests and the Sundarbans
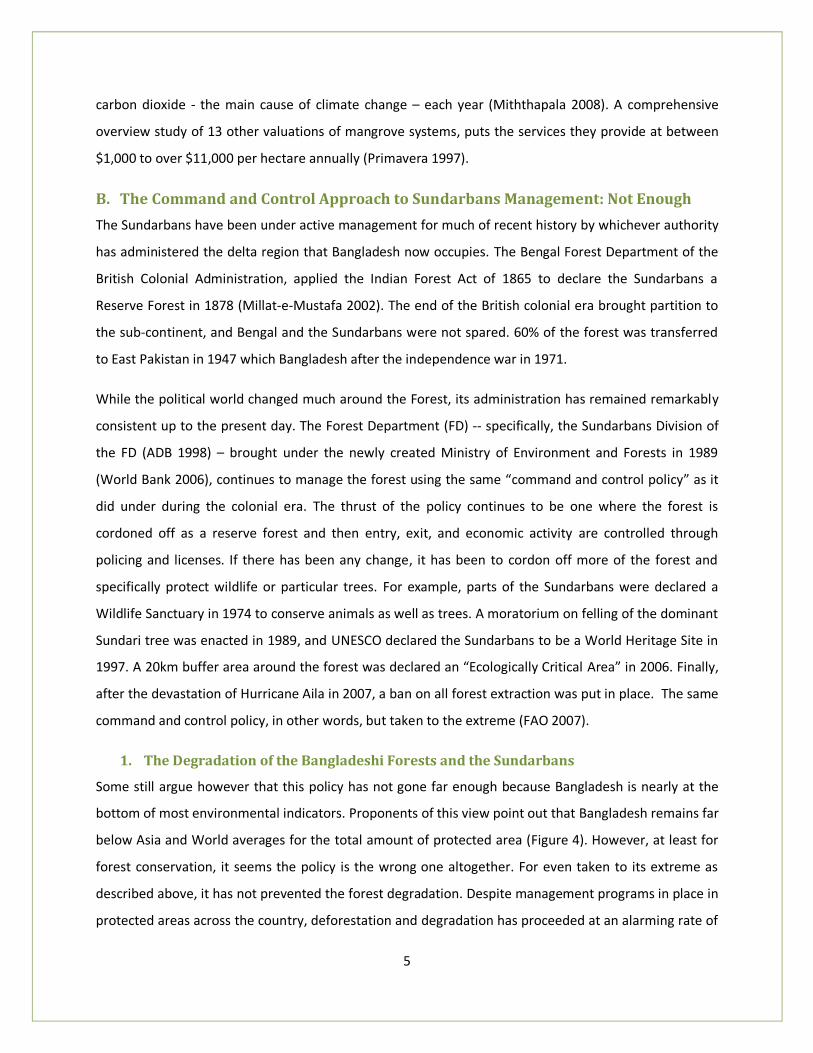
Some still argue however that this policy has not gone far enough because Bangladesh is nearly at the
bottom of most environmental indicators. Proponents of this view point out that Bangladesh remains far
below Asia and World averages for the total amount of protected area (Figure 4). However, at least for
forest conservation, it seems the policy is the wrong one altogether. For even taken to its extreme as
described above, it has not prevented the forest degradation. Despite management programs in place in
protected areas across the country, deforestation and degradation has proceeded at an alarming rate of
6
3% in the 1980s and over 1% in the 1990s (World Bank 2006). Indeed, USAID and CIDA have conducted a
study concluding that 50% of the nation’s forests have been destroyed in the last 20 years (Huda and
Roy 1999) to which there is real ascribable cost. The World Bank, for example, estimates that this forest
degradation is costing Bangladesh 4% of its annual GDP (World Bank 2006).
Figure 4 - Bangladesh Protect Areas Compared to Neighbors and World (Source: UNEP)
Figure 5 - Protected Areas of Bangladesh
Similarly, the protected status of the Sundabans has served to maintain the area of the forest, but aside
from this the mangroves have been steadily degrading (FAO 1998) from nearly every conceivable
measure such as coverage, density, composition, and overall productivity. Forest cover has decreased
between 1983 and 1995 at an average annual rate of 0.12%, and average stand density of the forest has
been reduced by 87% between 1933 and 1995. Over 215,000 cubic meters of Sundari species (H. fomes),
which comprise the majority of the trees (> 50%), are suffering from top-dying disease (Iftekar and Islam
2004). Indeed it is this top dying disease that makes trees appear as if the tops have been abruptly
truncated or charred by flame. Further, the productivity of the mangrove system had already declined
by 25% in the two decades leading up 1985, and the rate is estimated to be higher for the two decades
since (Millat-e-Mustafa 2002).
0
5
10
15
20
25
Cam
bo
dia
Thai
lan
d
Ch
ina
Asi
a
Nep
al
Wo
rld
Dev
elo
pin
g
Ind
ia
Ban
glad
esh
Bu
rma
Protected Areas% of Total Country Area
7
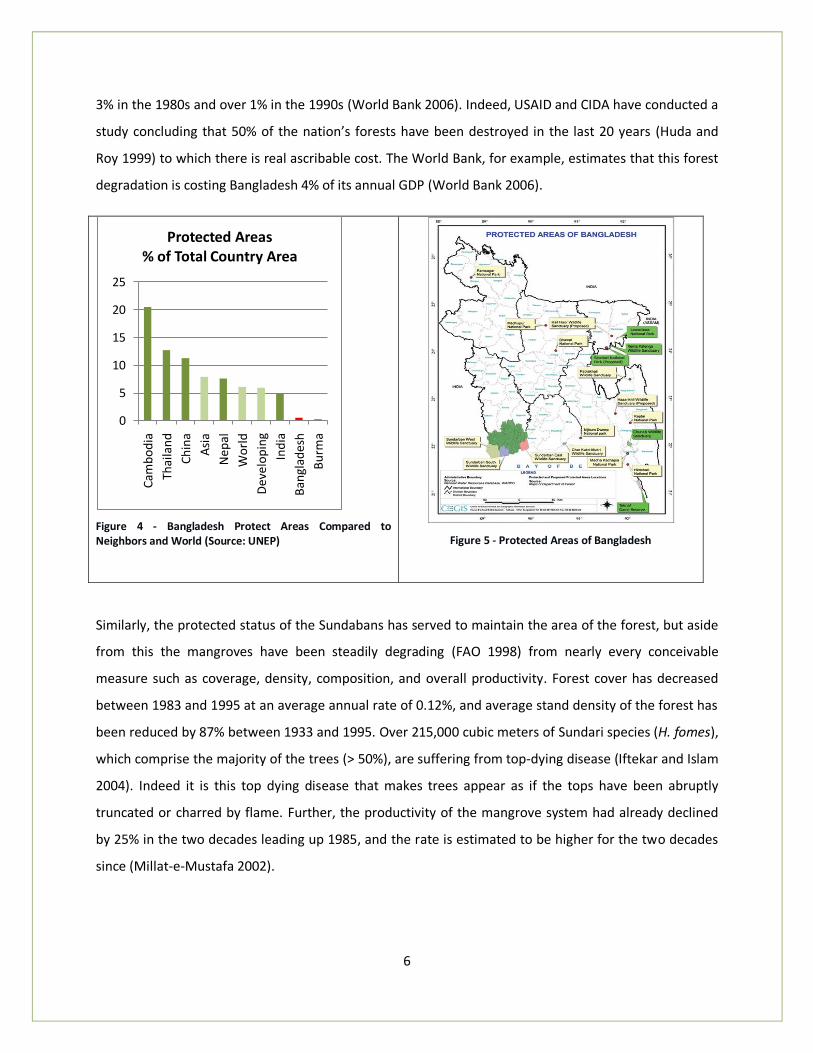
Table 1 - Degradation of the Sundarbans
Figure 6 - Tree coverage (Iftekar and Islam 2004)
Figure 7 - Trees per hectare (FAO 2000)
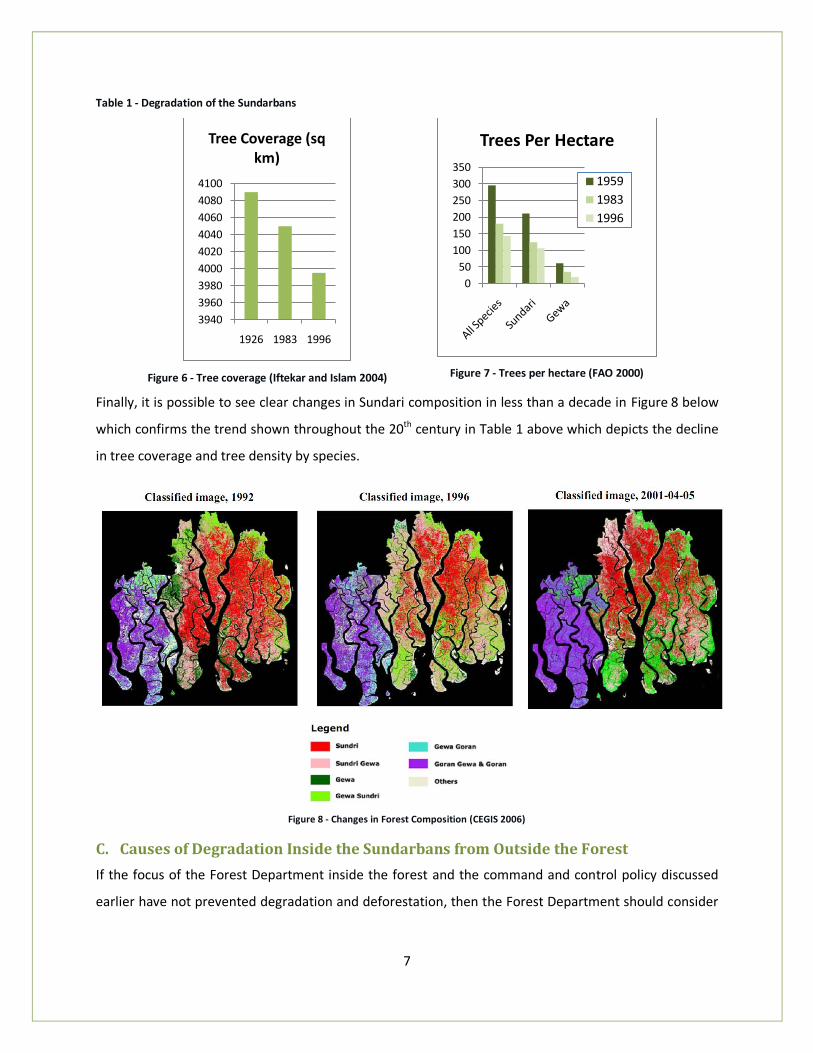
Finally, it is possible to see clear changes in Sundari composition in less than a decade in Figure 8 below
which confirms the trend shown throughout the 20th century in Table 1 above which depicts the decline
in tree coverage and tree density by species.
Figure 8 - Changes in Forest Composition (CEGIS 2006)
C. Causes of Degradation Inside the Sundarbans from Outside the Forest
If the focus of the Forest Department inside the forest and the command and control policy discussed
earlier have not prevented degradation and deforestation, then the Forest Department should consider
3940
3960
3980
4000
4020
4040
4060
4080
4100
1926 1983 1996
Tree Coverage (sq km)
0
50
100
150
200
250
300
350
Trees Per Hectare
1959
1983
1996
8
addressing the causes of degradation that occur outside of the forest. The literature suggests several
such causes:
Natural processes shifting the delta east - the tectonic plate structure is such (imagine tilting a
plate of spaghetti over just slightly and watching the noodles slide toward the edge) that the
river delta is naturally shifting away from India toward Burma. This would cause the western
edge of the Sundarbans to wither away (CEGIS and IWM 2007).
Diversion of water away to India – India has build several barrages along the Ganges river which
have diverted freshwater flow towards Indian fields for irrigation and drinking water necessarily
reducing the flow into Bangladesh downstream. Loss of freshwater increases the salinity of the
delta region as the salt water from the Bay of Bengal is able to penetrate further into the delta.
India and Bangladesh have signed a treaty to share water more equitably (World Bank 2009).
Climate Change and Sea Level Rise – Climate change generally greatly threatens the Sundarbans
in the long term. The World Bank reports that even a 25cm increase in the sea level will
inundate 40% of the Sundarbans; and the World Wildlife Fund estimates the rate of increase to
be approximately 3 mm per year implying about 85 years to the partial inundation. However
while the rates and implications are contested, there seems to be a consensus on the general
trend (World Bank 2009).
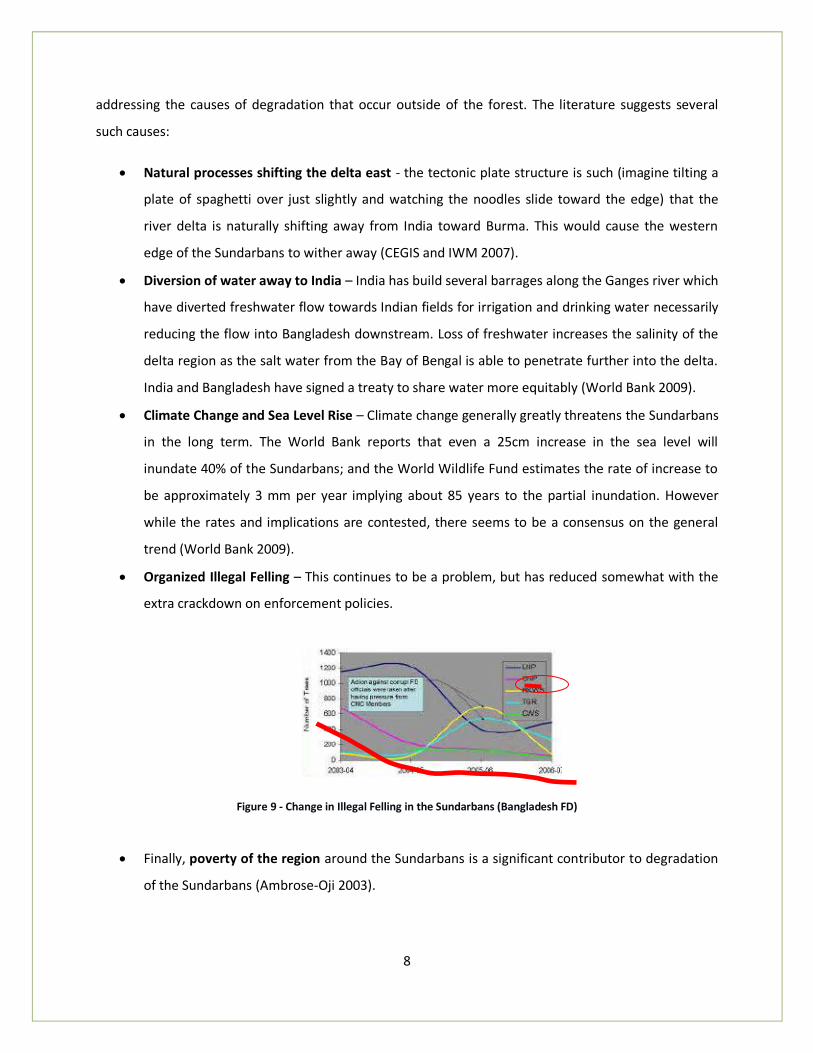
Organized Illegal Felling – This continues to be a problem, but has reduced somewhat with the
extra crackdown on enforcement policies.
Figure 9 - Change in Illegal Felling in the Sundarbans (Bangladesh FD)
Finally, poverty of the region around the Sundarbans is a significant contributor to degradation
of the Sundarbans (Ambrose-Oji 2003).
9
D. Why the Forest Department should Focus on Poverty
How the Forest Department can address poverty will be the focus of this paper because while the Forest
Department can do little to affect the geological forces associated with plate tectonics, international
politics with India or global climate change, it does have a significant ability to affect the poverty in the
region around the Sundarbans. This is particularly so since many of the poor in the region depend
directly on the forest for their daily livelihood.
It is important to note that the relationship between poverty and forest degradation is not an obvious
one and depends on the nature of the forest, the density of the population living beside it, the isolation
of the population, and property rights to the forest (Chomitz 2007). In Bangladesh however, where the
population is highly dense, not isolated, and lack property rights, one would predict that poverty would
be positively associated with forest degradation. The evidence in the region bears this out as in the ADB
project (ADB 2008) and a study by the Forest Department(Karim 2008). The ADB study noted:
Communities that are reliant on the SRF [Sundarbans Reserve Forest] for subsistence
and income have no formally recognized rights of access to the forest, nor do they act
responsibly to care for the resources. Traditional user practices (e.g., seasonality of
harvesting, gender roles, awareness of the need for regeneration, etc.) have largely
broken down due to increased poverty and population pressure, lack of effective
controls, and a perceived lack of viable alternatives. The un-sustainability of many
current activities and the lack of access to productive resources on fair terms lead
directly to depletion of the SRF and to continuing poverty and inequity (ADB 1998).
1. The People of the Impact Zone
The Sundarbans are located within three districts of Bangladesh. From west to east they are Shatkhira,
Khula, and Bagerhat covering and 12,212 km2. In each district, the southern half contains the forest,
while the northern halves are home to a total population of 6.6 million (Figure 10). Given that the forest
occupies 6,017 km2 the population density of the three rural districts is about 1,066/km2. This is
extremely high for a rural region (nearly a quarter of the density of the city of London) and has increased
16% between 1991 and 2005(CEGIS and IWM 2007).
10
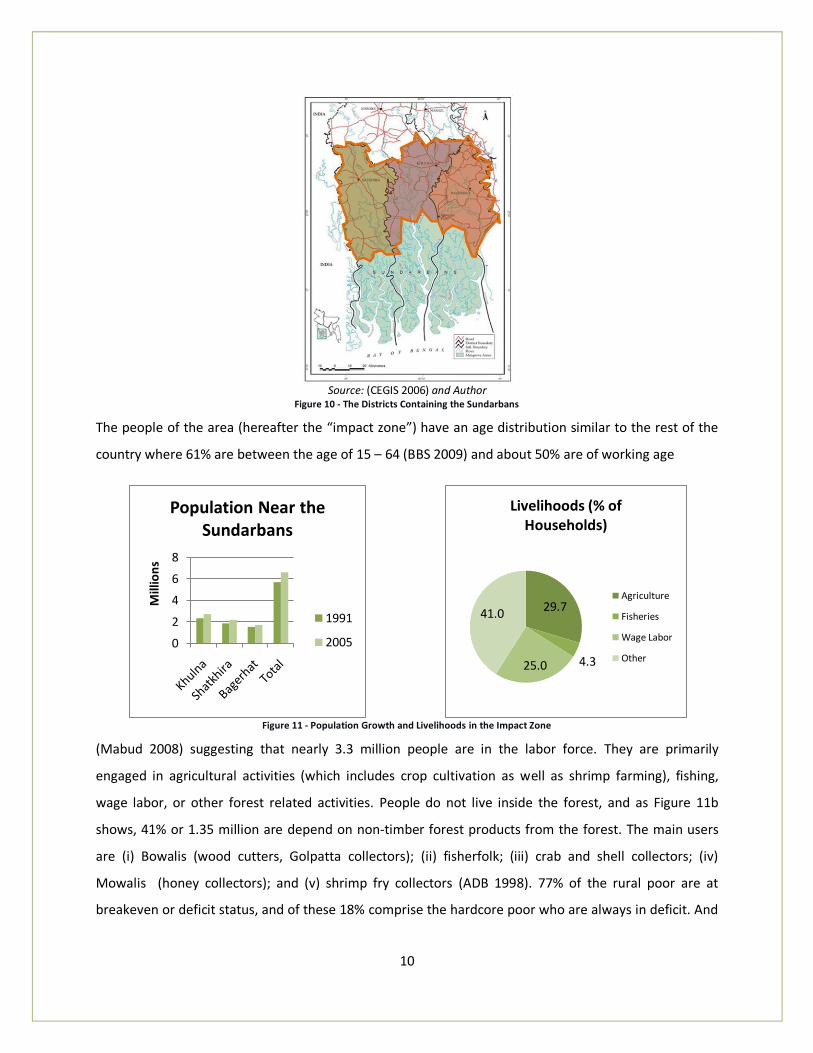
Source: (CEGIS 2006) and Author
Figure 10 - The Districts Containing the Sundarbans
The people of the area (hereafter the “impact zone”) have an age distribution similar to the rest of the
country where 61% are between the age of 15 – 64 (BBS 2009) and about 50% are of working age
Figure 11 - Population Growth and Livelihoods in the Impact Zone
(Mabud 2008) suggesting that nearly 3.3 million people are in the labor force. They are primarily
engaged in agricultural activities (which includes crop cultivation as well as shrimp farming), fishing,
wage labor, or other forest related activities. People do not live inside the forest, and as Figure 11b
shows, 41% or 1.35 million are depend on non-timber forest products from the forest. The main users
are (i) Bowalis (wood cutters, Golpatta collectors); (ii) fisherfolk; (iii) crab and shell collectors; (iv)
Mowalis (honey collectors); and (v) shrimp fry collectors (ADB 1998). 77% of the rural poor are at
breakeven or deficit status, and of these 18% comprise the hardcore poor who are always in deficit. And
0
2
4
6
8
Mill
ion
s
Population Near the Sundarbans
1991
2005
29.7
4.325.0
41.0
Livelihoods (% of Households)
Agriculture
Fisheries
Wage Labor
Other
11
this group, in particular, is entirely dependent on natural resources from the forest (USAID/Bangladesh-
IPAC 2008).
This region is poorer than much of the rest of Bangladesh and more isolated (Figure 43). The 1998 ADB
study found that at least 33% live below extreme poverty, that health indicators are poor, as is access to
water, sanitation services and basic infrastructure such as roads. A separate study found that families
earn between 165-416 USD annually. The bright spot is education: the literacy rate is thought to be
higher than the national average due to the effort of numerous NGOs that operate within the country
(World Bank 2009).
E. What can be done? Motivating Assumptions
The broad point and the normative assumption here is that the Forest Department cannot pursue
conservation of the Sundarbans through a command and control policy focused inside the forest; it will
need a more holistic, integrated approach to forestry management that looks outside the forest and
tackles poverty. Intellectually, environmental policy drivers in Bangladesh (typically multilateral
institutions and NGOs) seem to grasp this point, and government documents in the 1990s mark the
change. Reports referring to the Forest Policy enacted in 1994, the Master Plan enacted in 1995 (Millat-
e-Mustafa 2002) (Muhammed, Koike and Haque 2008) and project documents of several multilateral
institutions (ADB 1998) (FAO 1998) referring to integrated resource management plans (IRMP)
underscore the importance of the FD to actively engage with and manage actors and factors outside of
the forest that affect the forest. There is also some indication that the FD is actively planning to manage
land use near the Sundarbans through the Integrated Coastal Zone Management Project (Iftekhar and
Islam 2004). Finally, the Nishorgo Program of the Forest Department was created in 2004 with support
from USAID and the International Resource Group (IRG) with the stated objective of promoting a co-
management model for administering protected areas of Bangladesh including the Sundarbans by
focusing on building partnerships between the FD and key local, regional and national stakeholders.
This last is a particularly promising start, but as we will see later (in Section IV), the Nishorgo program,
like other plans leaves much doubt as to whether it can fulfill its stated mandate. But even before the
implementation stage, it is not clear that these plans and programs have sufficiently overcome the
command and control perspective to really formulate strategy to tackle the poverty around the forest
directly.
12
This paper focuses on, as the ADB report quoted above points out, the need for a viable alternative
livelihood activity to extracting forest resources. It posits that, if the Forest Department’s Nishorgo
Program can work with other stakeholders to harness the economic promise of shrimp aquaculture (the
country’s booming export industry that contributes 5% to GDP and employs 1.2 million) for the people
of the impact zone, then shrimp aquaculture can be the alternative livelihood activity that can reduce
poverty and replace the dependence of this population on the forest and promote conservation of the
Sundarbans. The remainder of the paper proceeds as follows:
(1) Section III describes why shrimp aquaculture is a promising alternative activity to replace forest
dependence.
(2) Section IV explains why the activity has not delivered on this promise so far and what the
objectives of the Forest Deparment’s Nishorgo Program should be with regard to shrimp
aquaculture.
(3) Section V examines how the Nishorgo Program works and why it is suitable for spearheading
this non-traditional forestry management effort.
(4) Section VI concludes with recommendations for the Nishorgo Program to harness shrimp
aquaculture as a means to forest conservation.
III. The Promise of Shrimp Aquaculture
Since the turn of the millennium, Aquaculture has been hailed as the harbinger of a blue revolution that
could supply most of the world’s marine products over the next three decades reducing poverty and
food shortages in poor countries just as the green revolution did with agriculture after World War II. The
downside however, is that aquaculture can cause serious environmental problems (The Economist
2003). So much so that shrimp aquaculture is typically seen as an enemy of both the forest and the
people who live outside of it. This may be for good reasons as will be the topic of Section V below,
however there are three reasons that shrimp makes sense as an alternate livelihood activity: the returns
to the activity are higher than alternatives in the area, these returns might increase over time as the
international demand for shrimp increases, and people of the area have become increasingly familiar
with the activity and therefore are better able to take advantage of their engagement in it.
A. The Returns to Shrimp Aquaculture
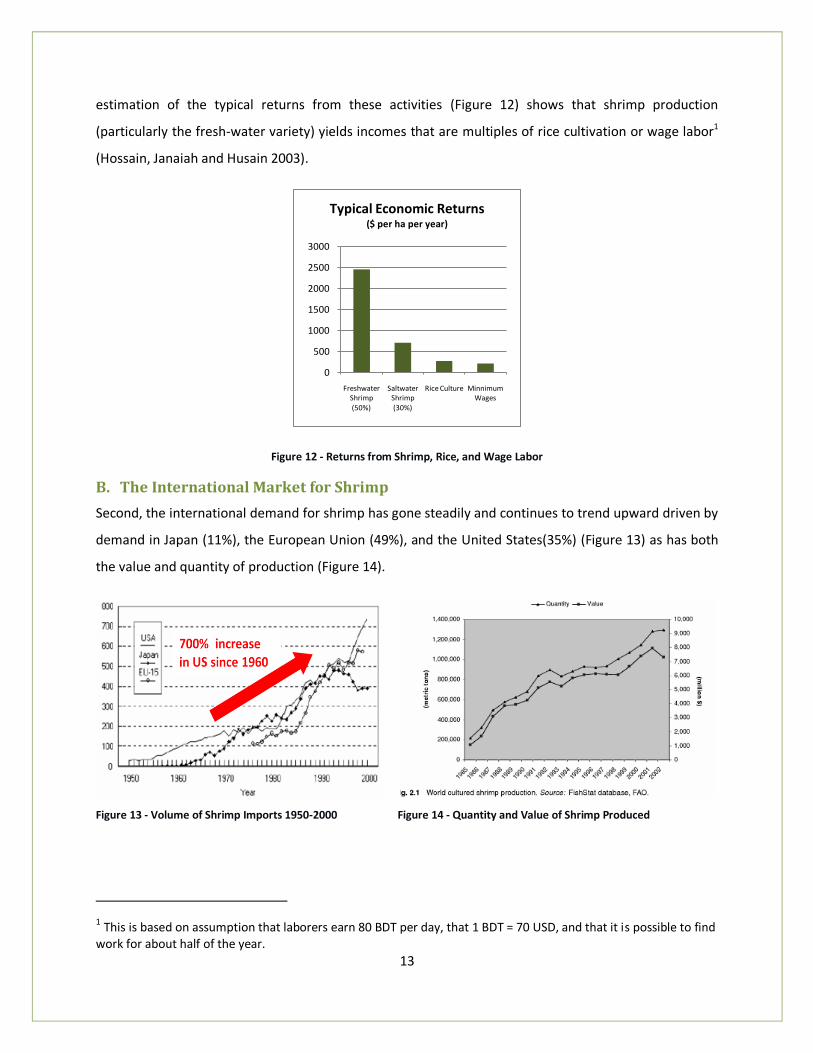
First, as noted in Figure 11 above, the majority of people in the impact zone cultivate rice, farm shrimp,
catch fish, work as wage laborers, or depend on forest extractions as a means of livelihood. An
13
estimation of the typical returns from these activities (Figure 12) shows that shrimp production
(particularly the fresh-water variety) yields incomes that are multiples of rice cultivation or wage labor1
(Hossain, Janaiah and Husain 2003).
Figure 12 - Returns from Shrimp, Rice, and Wage Labor
B. The International Market for Shrimp
Second, the international demand for shrimp has gone steadily and continues to trend upward driven by
demand in Japan (11%), the European Union (49%), and the United States(35%) (Figure 13) as has both
the value and quantity of production (Figure 14).
Figure 13 - Volume of Shrimp Imports 1950-2000
Figure 14 - Quantity and Value of Shrimp Produced
1 This is based on assumption that laborers earn 80 BDT per day, that 1 BDT = 70 USD, and that it is possible to find work for about half of the year.
0
500
1000
1500
2000
2500
3000
Freshwater Shrimp (50%)
Saltwater Shrimp (30%)
Rice Culture Minnimum Wages
Typical Economic Returns ($ per ha per year)
14
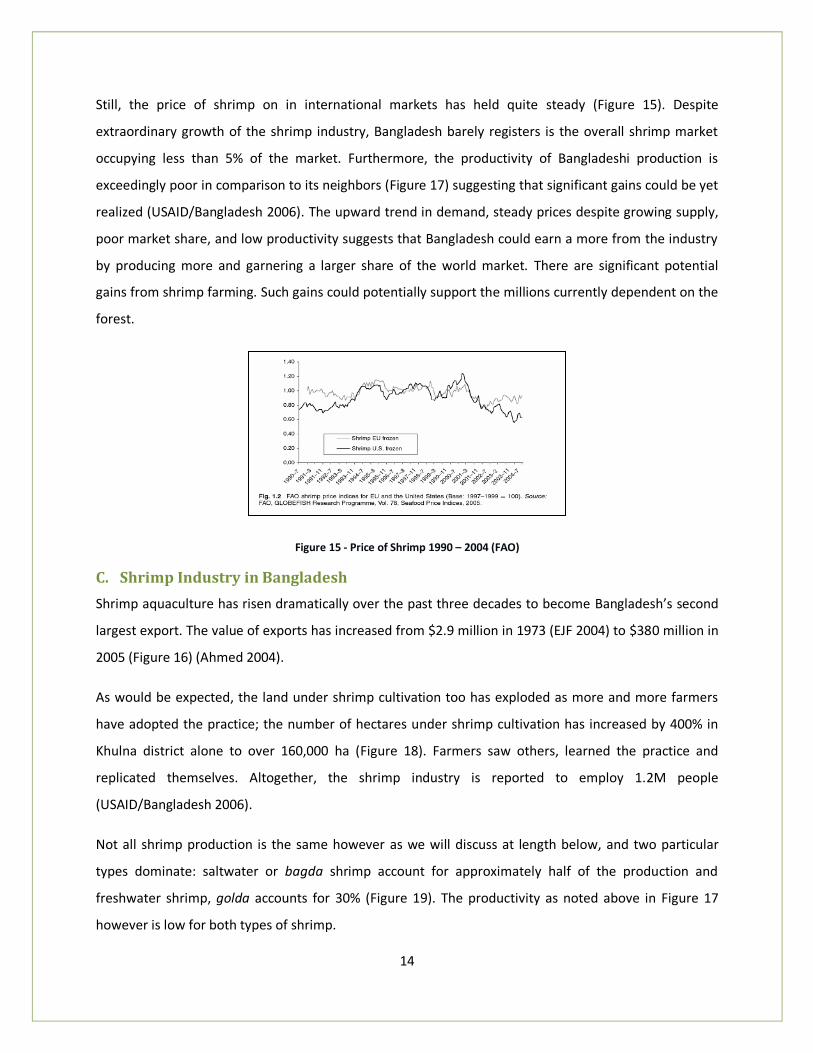
Still, the price of shrimp on in international markets has held quite steady (Figure 15). Despite
extraordinary growth of the shrimp industry, Bangladesh barely registers is the overall shrimp market
occupying less than 5% of the market. Furthermore, the productivity of Bangladeshi production is
exceedingly poor in comparison to its neighbors (Figure 17) suggesting that significant gains could be yet
realized (USAID/Bangladesh 2006). The upward trend in demand, steady prices despite growing supply,
poor market share, and low productivity suggests that Bangladesh could earn a more from the industry
by producing more and garnering a larger share of the world market. There are significant potential
gains from shrimp farming. Such gains could potentially support the millions currently dependent on the
forest.
Figure 15 - Price of Shrimp 1990 – 2004 (FAO)
C. Shrimp Industry in Bangladesh
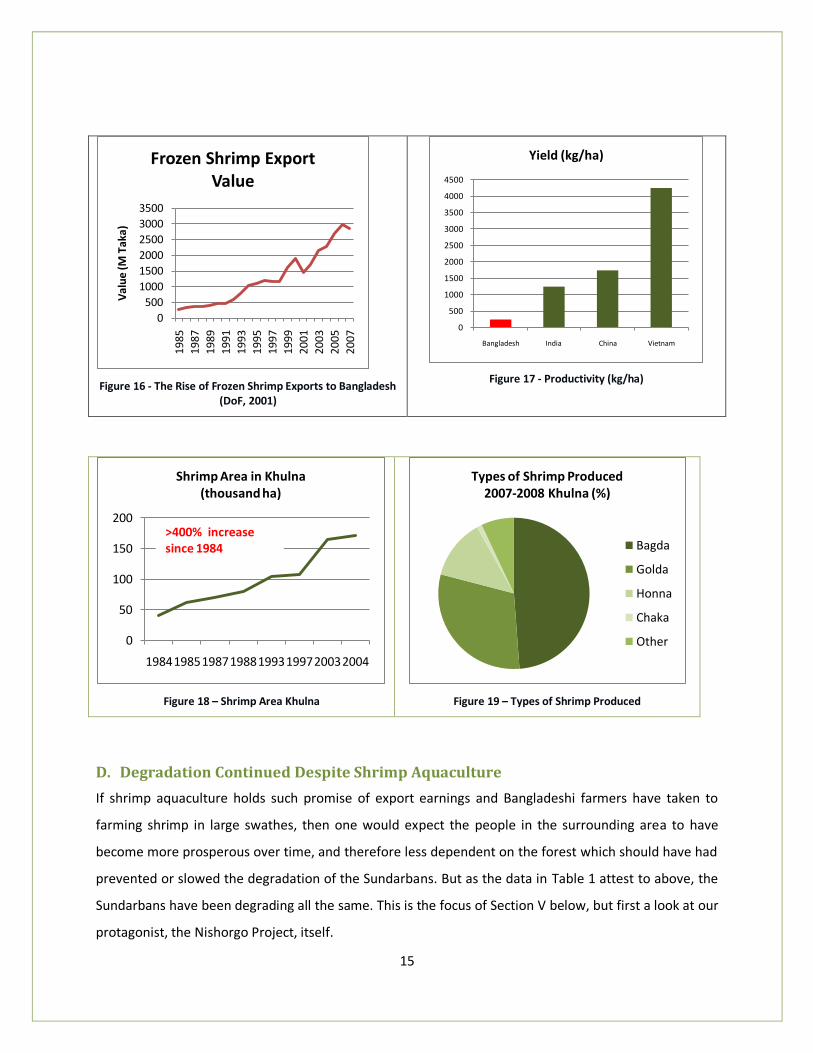
Shrimp aquaculture has risen dramatically over the past three decades to become Bangladesh’s second
largest export. The value of exports has increased from $2.9 million in 1973 (EJF 2004) to $380 million in
2005 (Figure 16) (Ahmed 2004).
As would be expected, the land under shrimp cultivation too has exploded as more and more farmers
have adopted the practice; the number of hectares under shrimp cultivation has increased by 400% in
Khulna district alone to over 160,000 ha (Figure 18). Farmers saw others, learned the practice and
replicated themselves. Altogether, the shrimp industry is reported to employ 1.2M people
(USAID/Bangladesh 2006).
Not all shrimp production is the same however as we will discuss at length below, and two particular
types dominate: saltwater or bagda shrimp account for approximately half of the production and
freshwater shrimp, golda accounts for 30% (Figure 19). The productivity as noted above in Figure 17
however is low for both types of shrimp.
15
Figure 16 - The Rise of Frozen Shrimp Exports to Bangladesh (DoF, 2001)
Figure 17 - Productivity (kg/ha)
Figure 18 – Shrimp Area Khulna
Figure 19 – Types of Shrimp Produced
D. Degradation Continued Despite Shrimp Aquaculture
If shrimp aquaculture holds such promise of export earnings and Bangladeshi farmers have taken to
farming shrimp in large swathes, then one would expect the people in the surrounding area to have
become more prosperous over time, and therefore less dependent on the forest which should have had
prevented or slowed the degradation of the Sundarbans. But as the data in Table 1 attest to above, the
Sundarbans have been degrading all the same. This is the focus of Section V below, but first a look at our
protagonist, the Nishorgo Project, itself.
0
500
1000
1500
2000
2500
3000
3500
19
85
19
87
1989
1991
1993
19
95
19
97
19
99
20
01
20
03
20
05
20
07
Val
ue
(M T
aka)
Frozen Shrimp Export Value
0
500
1000
1500
2000
2500
3000
3500
4000
4500
Bangladesh India China Vietnam
Yield (kg/ha)
0
50
100
150
200
19841985198719881993199720032004
Shrimp Area in Khulna(thousand ha)
>400% increase since 1984
Types of Shrimp Produced2007-2008 Khulna (%)
Bagda
Golda
Honna
Chaka
Other
16
IV. Sundarbans Management and the Nishorgo Program
In considering which institution might be most suitable for our purposes, several criteria that might be
used: (1) public values and legal jurisdiction (2) technical and administrative capacity to carry out the
task (3) funding and political support (Moore 1995).
A. Public Value and Jurisdiction
First, as noted earlier, the Sundarbans have been under continuous management since 1878 when the
British declared them reserve forests under the management of the Forest Department (FD). This
structure passed onto Bangladesh through the East Pakistan period from 1947 to 1971. In 1989, the FD
was brought under the control of the Ministry of Environment and Forests along with the new
Department of Environment. As such, while the Ministry of Lands, the Ministry of Fisheries, or the
Ministry of Agriculture might make plausible arguments for jurisdiction over the Sundarbans, that right
legally continues to rest with the Forest Department of the Ministry of Environment and Forests (World
Bank 2006).
Yet, this limited jurisdiction is precisely one of the impediments to achieving the goals outlined above:
shrimp aquaculture potentially holds the key to conservation of the Sundarbans through poverty
reduction, but the FD is wholly inadequate to influence this activity on its own. It has no legal authority
outside the forest nor does it possess the requisite technical capacity to affect the second important
criteria. Therefore the FD as a whole cannot be the right institution of choice. What the FD can do
however, is recognize the need to look outside the forest in order to achieve its stated conservation
goals, and take the lead in creating an agency within itself to pursue these goals.
The Nishorgo Program of the Forest Department was created in 2004 through support from USAID and
the International Resource Group (IRG) with just this goal to promote a co-management model for
administering the protected areas of Bangladesh including the Sundarbans by focusing on building
partnerships between the FD and key local, regional and national stakeholders. The Nishorgo Program
has six official objectives: to create a formal institution to bring together stakeholders to co-manage the
protected areas; to generate alternative incomes; advocate for better management policies; develop
the institutional capacity of the FD; anddevelop infrastructure in protected areas; and actively restore
such areas (K. S. Huda 2006).
17
B. Technical and Administrative Capacity
The FD, USAID, and IRG between them are expected to have sufficient technical capacity particularly
through a dedicated program run by the IRG and funded by USAID called the Nishorgo Support Project.
Administratively, however, the institution is complex. There is a four tiered structure of stakeholders to
form a “Nishorgo Co-Management institution” as follows.
At the national level there is a Wildlife Advisory Board composted of FD leadership, professors,
and other ministry officials. The board was created through the 1974 Wildlife Act as a supreme
authority on wildlife and forests. At the local level there are three tiers which loosely report to
the Advisory Board but have quite a bit of autonomy.
Each protected area (the Sundarbans together constitute three such areas) has a Conservation
Council comprised of 50 members from region, typically elites: NGO leaders, resource owners,
the District Forest Officer, journalists, teachers, and leaders from other relevant government
ministries such as Agriculture, Lands and Fisheries. Their task is to develop a consensus plan on
how forest resources are to be managed in the area.
The conservation council elects a Co-Management Committee which is comprised of 15-19
members from the Council to act as the nodal agency of the NSP and functions as executive
body of Council. The committee serve as liaison between local people and FD. It distributes
benefits from protected areas as agreed in the Council, develops projects to be implemented
with funds from the PA, maintain accounts, protects forests, and facilitates conflict resolution
between local people and FD.
The Committee also coordinates the Forest User Groups comprised of local grassroots
organizations (K. S. Huda 2006).
This multi-party, multi-tiered structure appears to be a significant departure from the standard
command and control management style used by the Forest Department as described above. Yet there
are significant areas of concern in how the Nishorgo Program as an institution functions in reality. For
example, nowhere in the committees is there any inclusion of the poor who truly depend on the forest.
Even when NGOs representing the voice of the super-poor are included in the meetings, they complain
that they are not listened to. Second, the Council cannot be held accountable. Nor does it possess legal
authority over the Forest Department. As a result, it has begun to appear both out of touch as well as
incapable. Finally, there is a lack of strategic or visionary thinking in the council. None of the case studies
seem to indicate that besides this new structure there is any movement away from the command and
18
control way of thinking even if there is significant possibility in the new program to do so (Chowdhury
2008).
C. Political and Institutional Environment
It is difficult to gauge the importance of the environment from speaking to Bangladeshis. Those few I
spoke with were only vaguely familiar with environmental issues, and government officials lamented the
public’s lack of interest (Shameem 2010). Growth and development are priorities, but the link between
development and conservation are poorly understood.
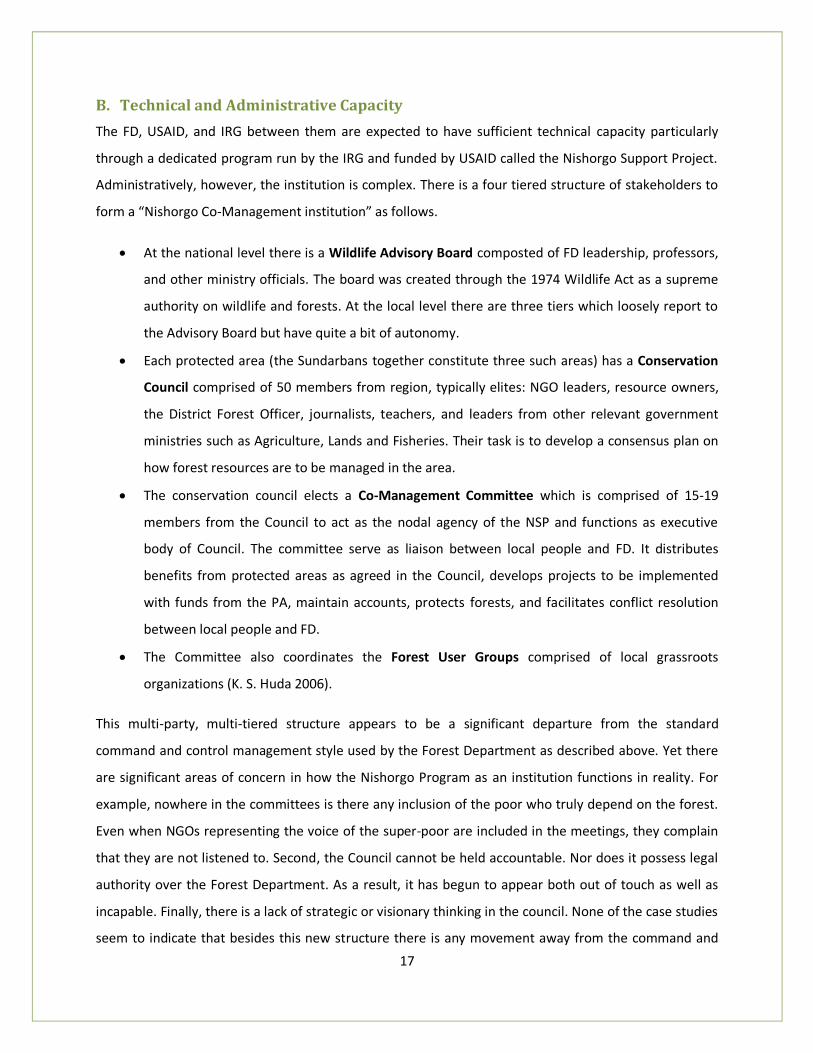
The current administration is said to be supportive of the environment, but if budget allocations can
used an indicator, then in Bangladesh, the environment falls low amongst national priories: Defense has
an allocation 20 times larger, and the MoEF gets less than the Ministry of Youth Sports. The budget
allocation of the Ministry of Environment and Forests ($33M of a total government of about $14.3B, or
about 0.2%) is miniscule (Figure 20). The FD receives around 80% of total budget of the MoEF which
amounts to about 26.4M annually for the FD as a whole. The Nishorgo Project receives some unspecified
portion of that funding in addition to $1.3M per year for the five year project starting in 2005 from
USAID(USAID/Bangladesh 2005).
Figure 20 - MOEF in the Bangladesh Budget (Source: Bangladesh Ministry of Finance, Author’s Calculations)
Given its jurisdiction, mission, technical capacity, and resource availability, the Nishorgo program within
the FD of the MoEF seems to be the ideal institution to spearhead this non-traditional forestry
management effort.
General Service
21%
Social Infrastructur
e32%
Physical Infrastructur
e29%
Interest13%
Memorandum Items
5%
Allocation of National BudgetTotal = $14.28 B (2009)
MOEF, < 1%
Agriculture and Rural
Development Breakout,
57%
Breakout of Physical Infrastructure Budget and Agricultural and Rural
Development Spending
19
V. Why Shrimp Aquaculture has not Delivered
With some understanding of who will be responsible for what needs to be done, we return now to the
problem facing the Nishorgo Program. As we noted before, if shrimp aquaculture holds such promise of
export earnings and Bangladeshi farmers have taken to farming shrimp in large swathes, then one would
expect the people in the surrounding area to have become more prosperous over time, and therefore
less dependent on the forest. This in turn should have had prevented or slowed the degradation of the
Sundarbans. However, as the figures in Table 1 attest to above, the Sundarbans have continued to
degrade all the same.
This section will highlight three reasons why shrimp aquaculture has not delivered on the promise of
lowering poverty. First, as we have seen above, the productivity is too low. That is to say, the total
reward (the size of the pie) is smaller than it could be. Second, a value chain analysis below will show
that even taking the size of the pie as a given, the slices accrue unevenly to the various actors involved in
production; parts of the chain where the most people are involved invariably receive the smallest
portion of the profit. Finally, shrimp production itself has troubling impacts on the environment which
are discussed below.
A. Uneven Distribution of Employment and Wages
1. Methodology
To determine how to best intervene to improve the distribution of earnings from shrimp production, the
Nishorgo Project could conduct a value chain analysis of the shrimp industry in Bangladesh. Such an
analysis identifies the key actors and steps involved in the production of the final exportable shrimp
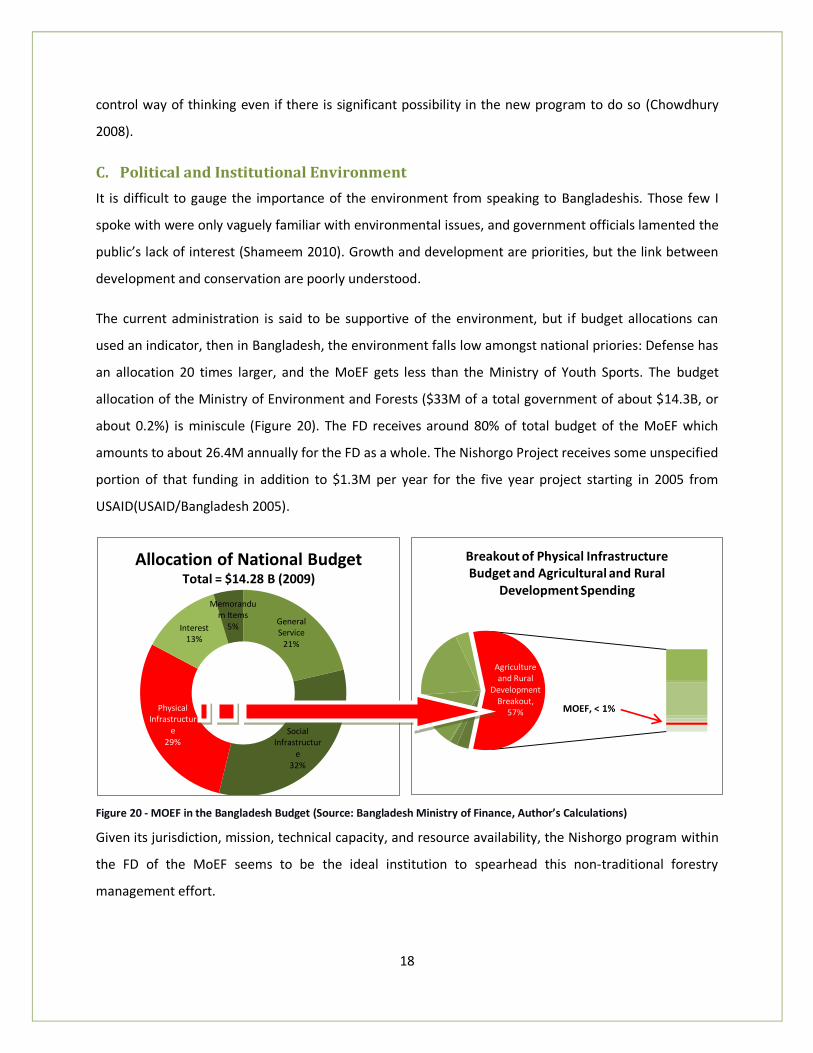
product (Figure 21). The analysis might focuses on final markets, income distribution and governance
along the chain (Kaplinsky and Morris 2001), but in the USAID methodology, the primary focus is on
“identifying and exploring the spaces where return is generated. Further: “value chain analysis
recognizes that various configurations of actors may influence capabilities, possess different levels of
bargaining power, and subsequently affect outcomes along the value chain” (Campbell and Downing
2008).
20
Figure 21 -- Value Chain Diagram (Souce: USAID)
What follows in the rest of the section is a “light” analysis of the shrimp production value chain. The
word light is used for several reasons. First, there has not been any statistically representative sampling
of the actors and prices upon which an ideal analysis would be based. Instead, this analysis relies on
data and information from two secondary analyses of the shrimp value chain in Bangladesh, the first by
USAID and a second by the World Bank, and augmented by observations and data collected from a field
visit to the region by the author. Second, the following analysis will be focused on the pieces of the
movement of the shrimp along the steps between larvae stage and export, the actors involved, costs of
production, and the distribution of incomes. A full value chain analysis might include the flow of
information along the chain, dissemination of technology, availability of credit, and so on. These
additional areas of focus are not immediately relevant for the current purpose of uncovering possible
points of intervention in the value chain by the Nishorgo project and are therefore omitted.
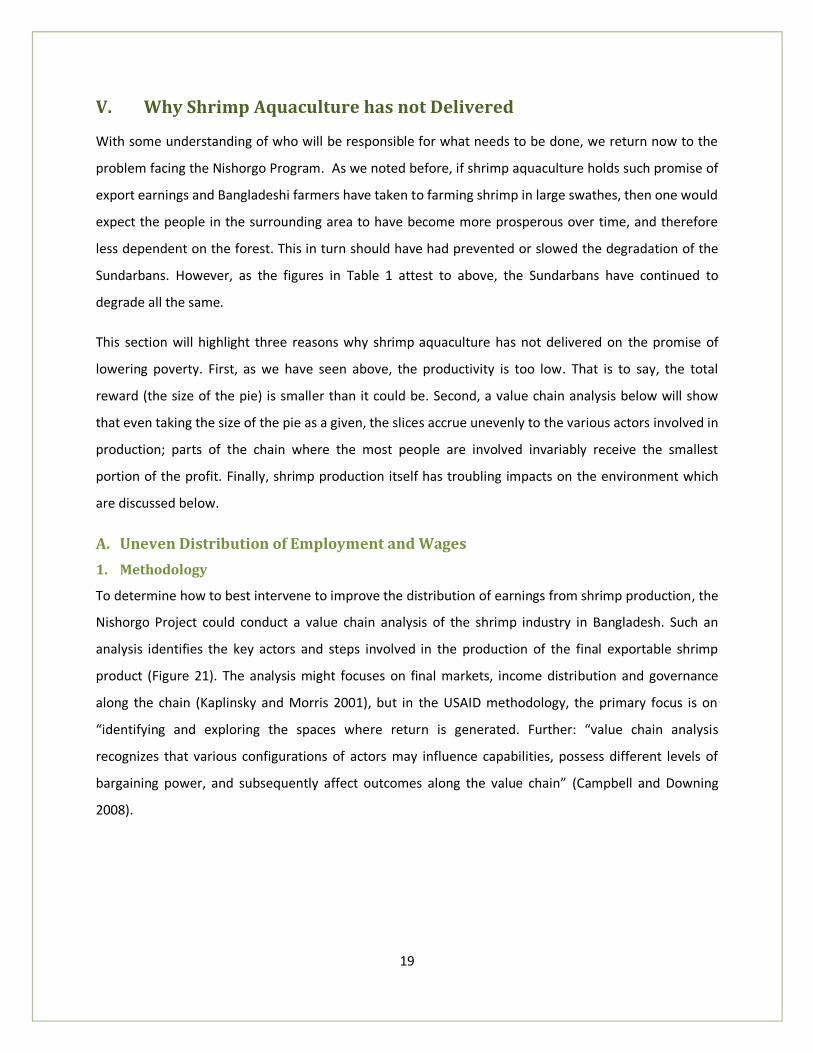
2. Overview of the Value Chain
Reduced to its most basic, there are three significant steps to the of shrimp farming analogous to
farming anything else. First, it is necessary to acquire the seed. In the case of shrimp, this means getting
the shrimp larvae, called shrimp fry. Second, the fry needs to be grown out and then harvested. Finally,
the harvest needs to be processed to become the final consumable good to be sold in retail stores or
exported. Interactions between these stages are facilitated by intermediaries.
Figure 22 – Simplified Shrimp Value Chain
Of course the chain is not so simple in reality. This picture becomes more complicated with the inclusion
of various intermediaries of several sizes that have been consolidated into two single intermediary steps
Collect Shrimp Fry
IntermediariesGrowout and
HarvestIntermediaries
Process and Export
21
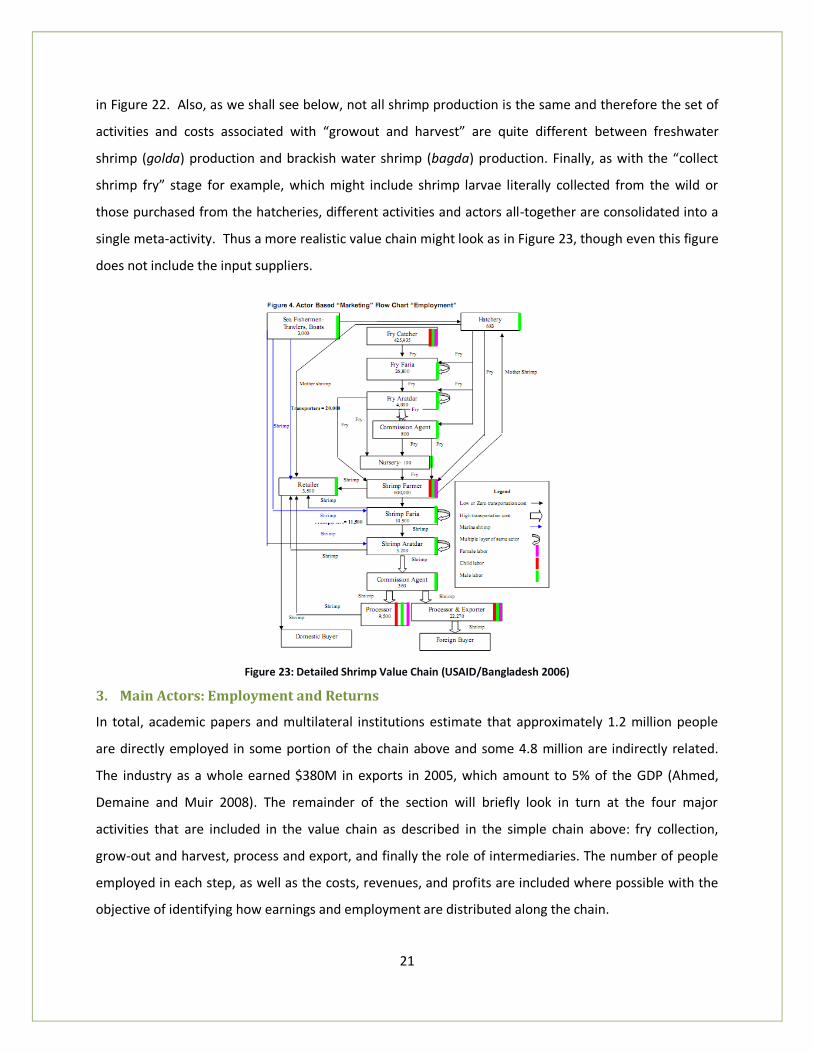
in Figure 22. Also, as we shall see below, not all shrimp production is the same and therefore the set of
activities and costs associated with “growout and harvest” are quite different between freshwater
shrimp (golda) production and brackish water shrimp (bagda) production. Finally, as with the “collect
shrimp fry” stage for example, which might include shrimp larvae literally collected from the wild or
those purchased from the hatcheries, different activities and actors all-together are consolidated into a
single meta-activity. Thus a more realistic value chain might look as in Figure 23, though even this figure
does not include the input suppliers.
Figure 23: Detailed Shrimp Value Chain (USAID/Bangladesh 2006)
3. Main Actors: Employment and Returns
In total, academic papers and multilateral institutions estimate that approximately 1.2 million people
are directly employed in some portion of the chain above and some 4.8 million are indirectly related.
The industry as a whole earned $380M in exports in 2005, which amount to 5% of the GDP (Ahmed,
Demaine and Muir 2008). The remainder of the section will briefly look in turn at the four major
activities that are included in the value chain as described in the simple chain above: fry collection,
grow-out and harvest, process and export, and finally the role of intermediaries. The number of people
employed in each step, as well as the costs, revenues, and profits are included where possible with the
objective of identifying how earnings and employment are distributed along the chain.
22
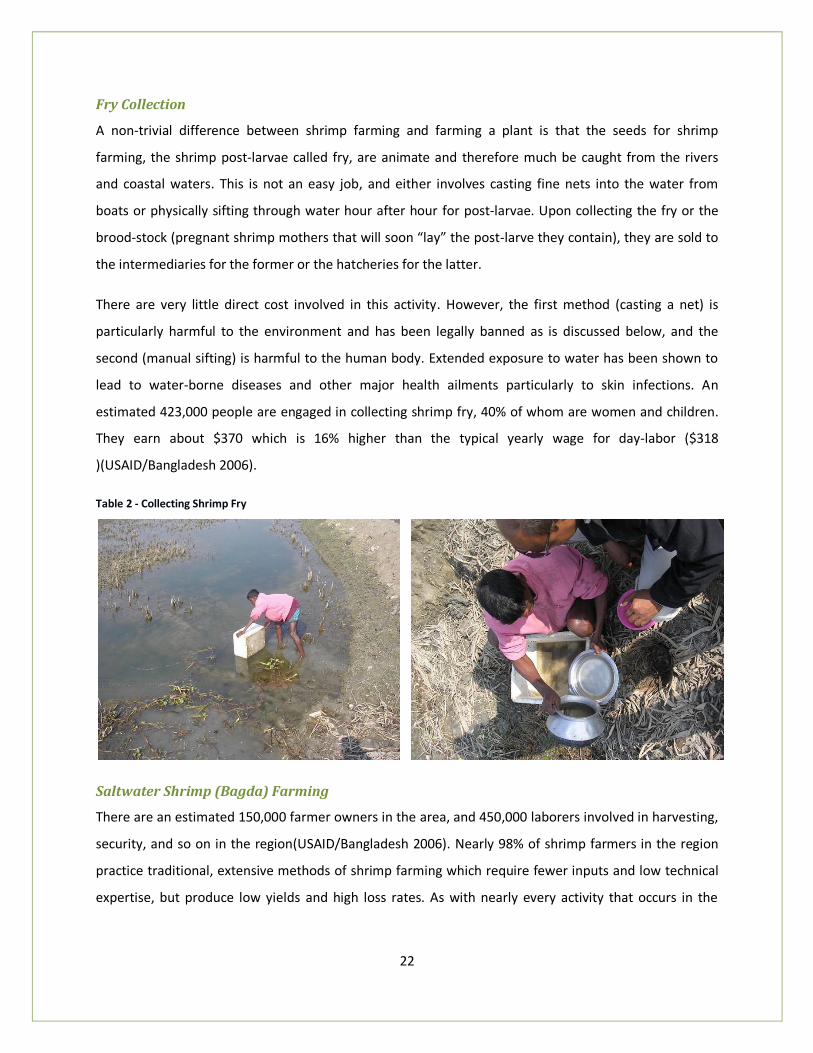
Fry Collection
A non-trivial difference between shrimp farming and farming a plant is that the seeds for shrimp
farming, the shrimp post-larvae called fry, are animate and therefore much be caught from the rivers
and coastal waters. This is not an easy job, and either involves casting fine nets into the water from
boats or physically sifting through water hour after hour for post-larvae. Upon collecting the fry or the
brood-stock (pregnant shrimp mothers that will soon “lay” the post-larve they contain), they are sold to
the intermediaries for the former or the hatcheries for the latter.
There are very little direct cost involved in this activity. However, the first method (casting a net) is
particularly harmful to the environment and has been legally banned as is discussed below, and the
second (manual sifting) is harmful to the human body. Extended exposure to water has been shown to
lead to water-borne diseases and other major health ailments particularly to skin infections. An
estimated 423,000 people are engaged in collecting shrimp fry, 40% of whom are women and children.
They earn about $370 which is 16% higher than the typical yearly wage for day-labor ($318
)(USAID/Bangladesh 2006).
Table 2 - Collecting Shrimp Fry
Saltwater Shrimp (Bagda) Farming
There are an estimated 150,000 farmer owners in the area, and 450,000 laborers involved in harvesting,
security, and so on in the region(USAID/Bangladesh 2006). Nearly 98% of shrimp farmers in the region
practice traditional, extensive methods of shrimp farming which require fewer inputs and low technical
expertise, but produce low yields and high loss rates. As with nearly every activity that occurs in the
23
delta, traditional shrimp farming too is intimately connected to and dependent on the unique mixture of
sea and river as well as the ebb and flow of the daily tides.
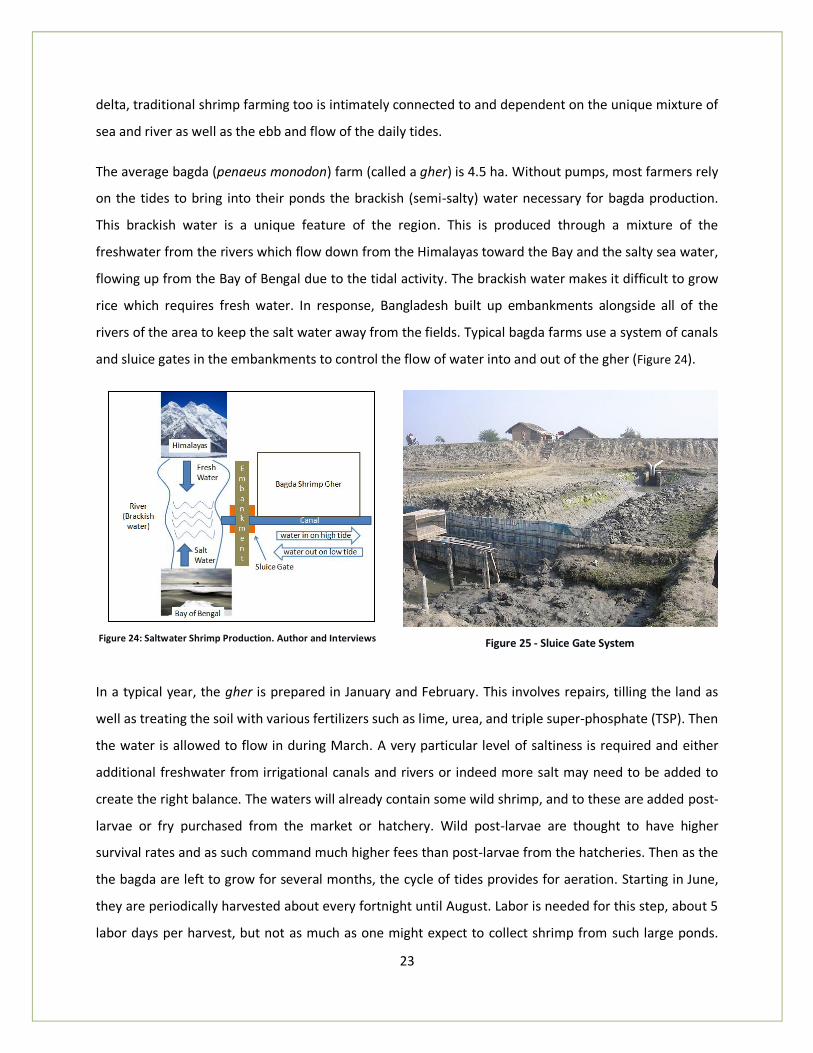
The average bagda (penaeus monodon) farm (called a gher) is 4.5 ha. Without pumps, most farmers rely
on the tides to bring into their ponds the brackish (semi-salty) water necessary for bagda production.
This brackish water is a unique feature of the region. This is produced through a mixture of the
freshwater from the rivers which flow down from the Himalayas toward the Bay and the salty sea water,
flowing up from the Bay of Bengal due to the tidal activity. The brackish water makes it difficult to grow
rice which requires fresh water. In response, Bangladesh built up embankments alongside all of the
rivers of the area to keep the salt water away from the fields. Typical bagda farms use a system of canals
and sluice gates in the embankments to control the flow of water into and out of the gher (Figure 24).
Figure 24: Saltwater Shrimp Production. Author and Interviews
Figure 25 - Sluice Gate System
In a typical year, the gher is prepared in January and February. This involves repairs, tilling the land as
well as treating the soil with various fertilizers such as lime, urea, and triple super-phosphate (TSP). Then
the water is allowed to flow in during March. A very particular level of saltiness is required and either
additional freshwater from irrigational canals and rivers or indeed more salt may need to be added to
create the right balance. The waters will already contain some wild shrimp, and to these are added post-
larvae or fry purchased from the market or hatchery. Wild post-larvae are thought to have higher
survival rates and as such command much higher fees than post-larvae from the hatcheries. Then as the
the bagda are left to grow for several months, the cycle of tides provides for aeration. Starting in June,
they are periodically harvested about every fortnight until August. Labor is needed for this step, about 5
labor days per harvest, but not as much as one might expect to collect shrimp from such large ponds.
1.
24
Apparently the bagda automatically try to return to the saltier sea upon reaching maturity. Innovative
traps that allow for easy entry but impossible exit are placed in saltier water in the mouth of the gher
and catch the shrimp automatically.
Figure 26 - Bagda Gher and Trip
Figure 27 - Shrimp Trap
At harvest, the local intermediary or middleman makes a visit to the gher to purchase the shrimp. The
monsoon rains come in August and some farmers drain their ghers to prepare the land to grow a crop of
rice. However, the farmers that were interviewed noted that few large farmers bother growing rice;
most grow bagda throughout the year on bigger farms of 10 ha or more. The smaller farms grow rice as
a means of diversification since rice which is a staple of the region.
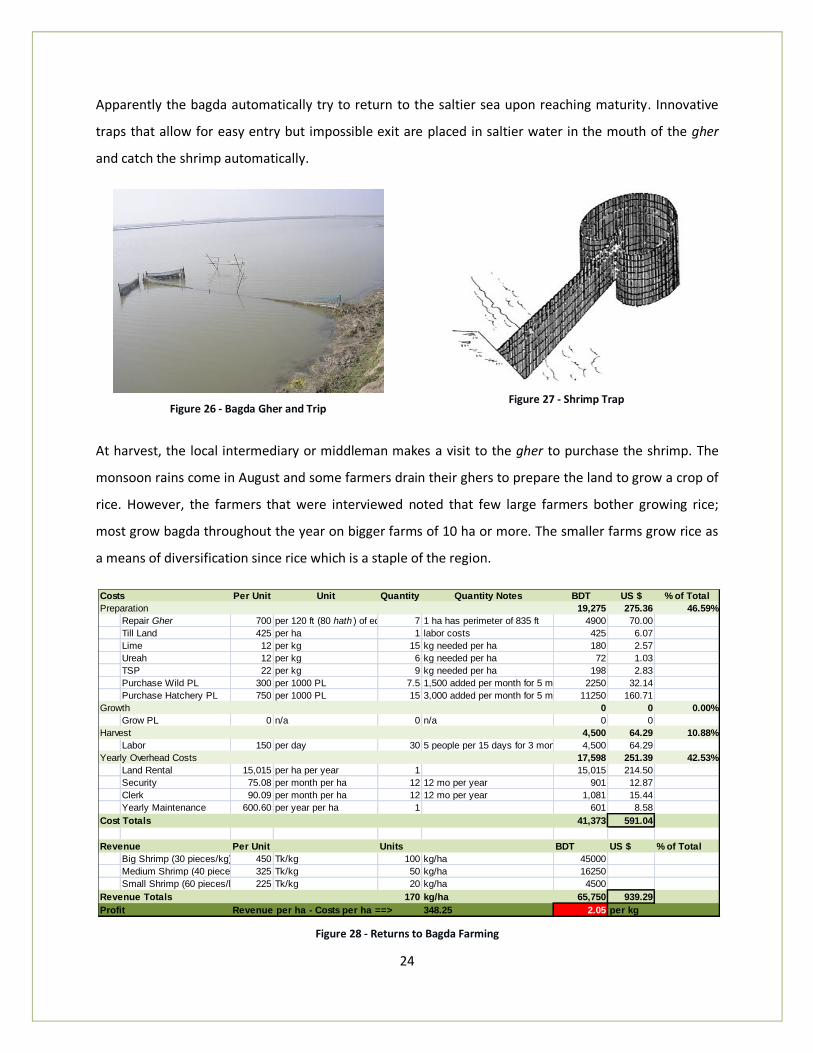
Figure 28 - Returns to Bagda Farming
Costs Per Unit Unit Quantity Quantity Notes BDT US $ % of Total
Preparation 19,275 275.36 46.59%
Repair Gher 700 per 120 ft (80 hath ) of edge 7 1 ha has perimeter of 835 ft 4900 70.00
Till Land 425 per ha 1 labor costs 425 6.07
Lime 12 per kg 15 kg needed per ha 180 2.57
Ureah 12 per kg 6 kg needed per ha 72 1.03
TSP 22 per kg 9 kg needed per ha 198 2.83
Purchase Wild PL 300 per 1000 PL 7.5 1,500 added per month for 5 mo 2250 32.14
Purchase Hatchery PL 750 per 1000 PL 15 3,000 added per month for 5 mo 11250 160.71
Growth 0 0 0.00%
Grow PL 0 n/a 0 n/a 0 0
Harvest 4,500 64.29 10.88%
Labor 150 per day 30 5 people per 15 days for 3 months 4,500 64.29
Yearly Overhead Costs 17,598 251.39 42.53%
Land Rental 15,015 per ha per year 1 15,015 214.50
Security 75.08 per month per ha 12 12 mo per year 901 12.87
Clerk 90.09 per month per ha 12 12 mo per year 1,081 15.44
Yearly Maintenance 600.60 per year per ha 1 601 8.58
Cost Totals 41,373 591.04
Revenue Per Unit Units BDT US $ % of Total
Big Shrimp (30 pieces/kg) 450 Tk/kg 100 kg/ha 45000
Medium Shrimp (40 pieces/kg) 325 Tk/kg 50 kg/ha 16250
Small Shrimp (60 pieces/kg) 225 Tk/kg 20 kg/ha 4500
Revenue Totals 170 kg/ha 65,750 939.29
Profit Revenue per ha - Costs per ha ==> 348.25 2.05 per kg
25
Throughout the year, there are several overhead costs: land rent, security, accountants, and
maintenance. The costs and revenues as well as the average return per hectare and per kg of shrimp for
a typical bagda farm consolidated from the information collected from five farmers interviewed during a
field visit are shown in Figure 28 above. The average return of $348 per hectare or $2.05 per kg of
shrimp is less than the USAID study which found returns of about $436 per hectare. This is likely because
they assume the study does not grade the different types of shrimp, but uses one price across their
calculation (USAID/Bangladesh 2005).
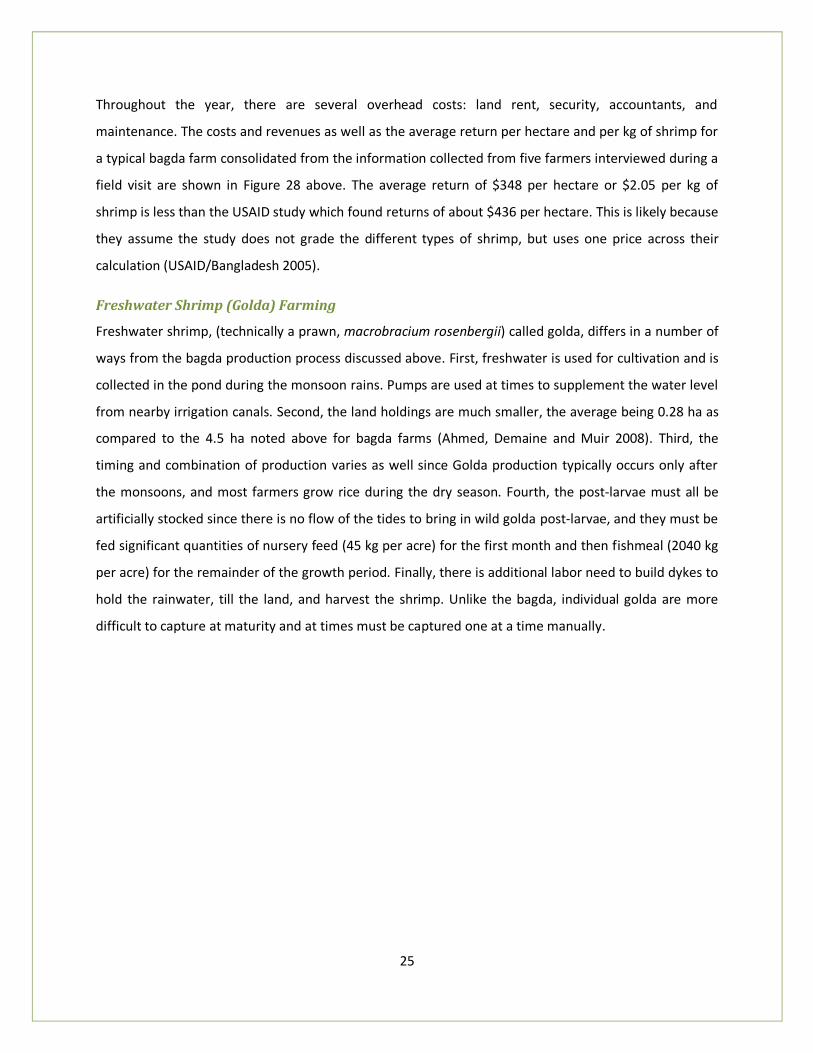
Freshwater Shrimp (Golda) Farming
Freshwater shrimp, (technically a prawn, macrobracium rosenbergii) called golda, differs in a number of
ways from the bagda production process discussed above. First, freshwater is used for cultivation and is
collected in the pond during the monsoon rains. Pumps are used at times to supplement the water level
from nearby irrigation canals. Second, the land holdings are much smaller, the average being 0.28 ha as
compared to the 4.5 ha noted above for bagda farms (Ahmed, Demaine and Muir 2008). Third, the
timing and combination of production varies as well since Golda production typically occurs only after
the monsoons, and most farmers grow rice during the dry season. Fourth, the post-larvae must all be
artificially stocked since there is no flow of the tides to bring in wild golda post-larvae, and they must be
fed significant quantities of nursery feed (45 kg per acre) for the first month and then fishmeal (2040 kg
per acre) for the remainder of the growth period. Finally, there is additional labor need to build dykes to
hold the rainwater, till the land, and harvest the shrimp. Unlike the bagda, individual golda are more
difficult to capture at maturity and at times must be captured one at a time manually.
26
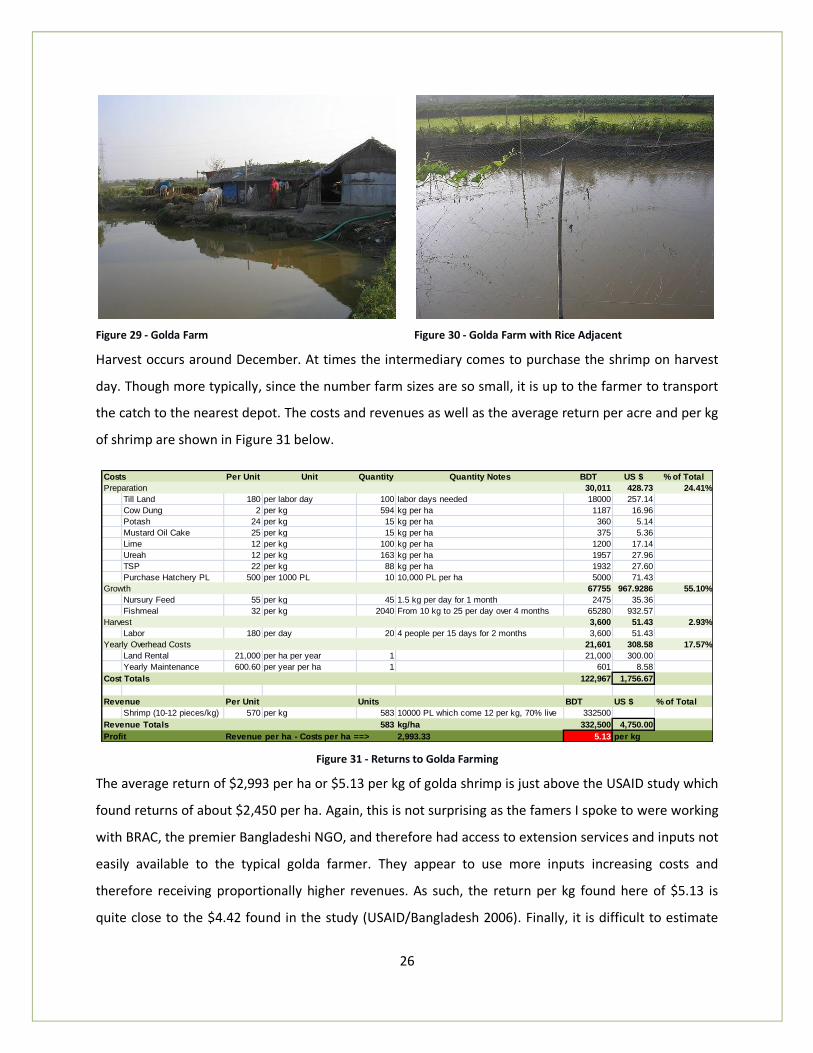
Figure 29 - Golda Farm
Figure 30 - Golda Farm with Rice Adjacent
Harvest occurs around December. At times the intermediary comes to purchase the shrimp on harvest
day. Though more typically, since the number farm sizes are so small, it is up to the farmer to transport
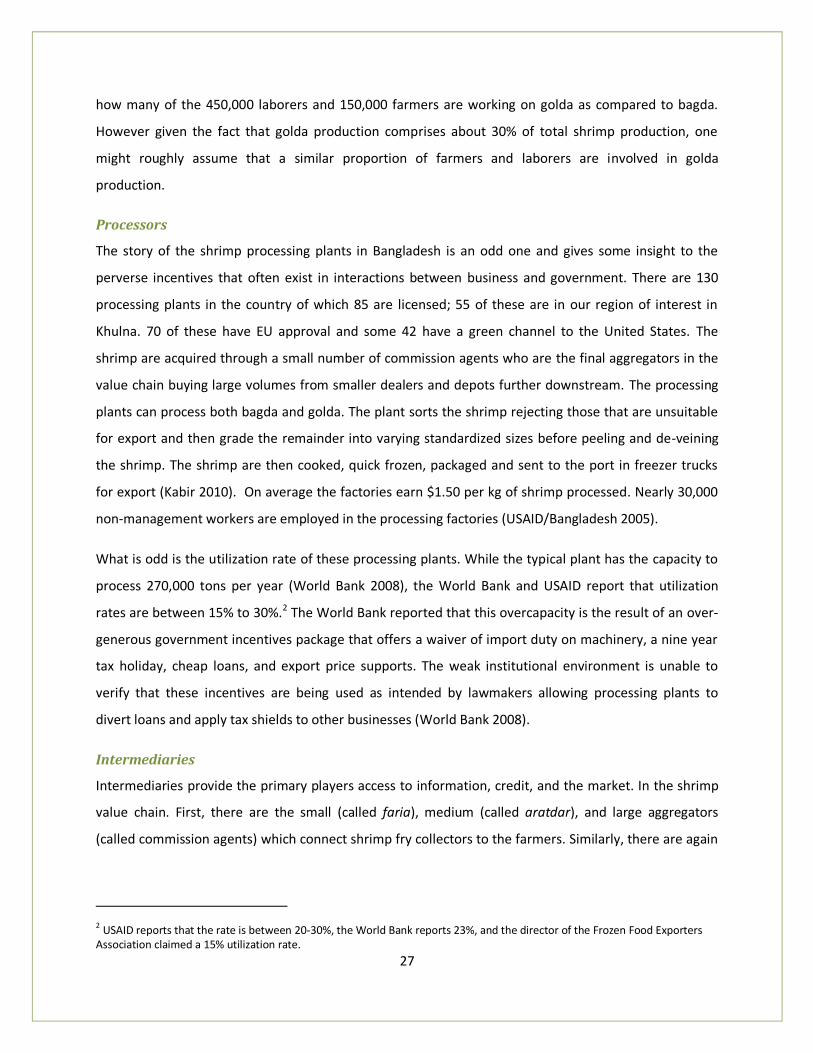
the catch to the nearest depot. The costs and revenues as well as the average return per acre and per kg
of shrimp are shown in Figure 31 below.
Figure 31 - Returns to Golda Farming
The average return of $2,993 per ha or $5.13 per kg of golda shrimp is just above the USAID study which
found returns of about $2,450 per ha. Again, this is not surprising as the famers I spoke to were working
with BRAC, the premier Bangladeshi NGO, and therefore had access to extension services and inputs not
easily available to the typical golda farmer. They appear to use more inputs increasing costs and
therefore receiving proportionally higher revenues. As such, the return per kg found here of $5.13 is
quite close to the $4.42 found in the study (USAID/Bangladesh 2006). Finally, it is difficult to estimate
Costs Per Unit Unit Quantity Quantity Notes BDT US $ % of Total
Preparation 30,011 428.73 24.41%
Till Land 180 per labor day 100 labor days needed 18000 257.14
Cow Dung 2 per kg 594 kg per ha 1187 16.96
Potash 24 per kg 15 kg per ha 360 5.14
Mustard Oil Cake 25 per kg 15 kg per ha 375 5.36
Lime 12 per kg 100 kg per ha 1200 17.14
Ureah 12 per kg 163 kg per ha 1957 27.96
TSP 22 per kg 88 kg per ha 1932 27.60
Purchase Hatchery PL 500 per 1000 PL 10 10,000 PL per ha 5000 71.43
Growth 67755 967.9286 55.10%
Nursury Feed 55 per kg 45 1.5 kg per day for 1 month 2475 35.36
Fishmeal 32 per kg 2040 From 10 kg to 25 per day over 4 months 65280 932.57
Harvest 3,600 51.43 2.93%
Labor 180 per day 20 4 people per 15 days for 2 months 3,600 51.43
Yearly Overhead Costs 21,601 308.58 17.57%
Land Rental 21,000 per ha per year 1 21,000 300.00
Yearly Maintenance 600.60 per year per ha 1 601 8.58
Cost Totals 122,967 1,756.67
Revenue Per Unit Units BDT US $ % of Total
Shrimp (10-12 pieces/kg) 570 per kg 583 10000 PL which come 12 per kg, 70% live 332500
Revenue Totals 583 kg/ha 332,500 4,750.00
Profit Revenue per ha - Costs per ha ==> 2,993.33 5.13 per kg
27
how many of the 450,000 laborers and 150,000 farmers are working on golda as compared to bagda.
However given the fact that golda production comprises about 30% of total shrimp production, one
might roughly assume that a similar proportion of farmers and laborers are involved in golda
production.
Processors
The story of the shrimp processing plants in Bangladesh is an odd one and gives some insight to the
perverse incentives that often exist in interactions between business and government. There are 130
processing plants in the country of which 85 are licensed; 55 of these are in our region of interest in
Khulna. 70 of these have EU approval and some 42 have a green channel to the United States. The
shrimp are acquired through a small number of commission agents who are the final aggregators in the
value chain buying large volumes from smaller dealers and depots further downstream. The processing
plants can process both bagda and golda. The plant sorts the shrimp rejecting those that are unsuitable
for export and then grade the remainder into varying standardized sizes before peeling and de-veining
the shrimp. The shrimp are then cooked, quick frozen, packaged and sent to the port in freezer trucks
for export (Kabir 2010). On average the factories earn $1.50 per kg of shrimp processed. Nearly 30,000
non-management workers are employed in the processing factories (USAID/Bangladesh 2005).
What is odd is the utilization rate of these processing plants. While the typical plant has the capacity to
process 270,000 tons per year (World Bank 2008), the World Bank and USAID report that utilization
rates are between 15% to 30%.2 The World Bank reported that this overcapacity is the result of an over-
generous government incentives package that offers a waiver of import duty on machinery, a nine year
tax holiday, cheap loans, and export price supports. The weak institutional environment is unable to
verify that these incentives are being used as intended by lawmakers allowing processing plants to
divert loans and apply tax shields to other businesses (World Bank 2008).
Intermediaries
Intermediaries provide the primary players access to information, credit, and the market. In the shrimp
value chain. First, there are the small (called faria), medium (called aratdar), and large aggregators
(called commission agents) which connect shrimp fry collectors to the farmers. Similarly, there are again
2 USAID reports that the rate is between 20-30%, the World Bank reports 23%, and the director of the Frozen Food Exporters Association claimed a 15% utilization rate.
28
the farias, aratdars, and commission agents who connect the shrimp farmer to the processing plants and
exporters (Rafiquzzaman 2010).
The essential difference between these three types of intermediaries appears to be the volumes that
they deal in which in turn depends on their access to finance. The faria buys directly from the farmer
and often provides working capital loans and inputs supplies for informal purchase agreement. The
farmer or fry collector is vitally dependent on the financing at the beginning of the season and agrees to
sell to a particular faria who will typically use any number of means to both ensure supply and suppress
the buying price. These include fewer grades, inaccurate scales, or even physical threats (Rafiquzzaman
2010) .
The faria is in turn dependent on the aratdar for credit and similarly receives sub-optimal prices. The
aratdar runs local depots where the shrimp are stored, often in poor hygienic conditions, until there is
enough quantity to transport them to the nearest market where he will sell to the commission agent.
These agents of the processing factories are few in number and are typically medium to large scale
entrepreneurs who are either rich themselves or are politically well connected with significant access to
finance. In total, there are estimated to be 30,000 fry middle men who earn a profit of $0.80 per kg of
shrimp on average, and there are 14,000 shrimp middlemen who earn a profit of $2.50 per kg of shrimp
again on average (USAID/Bangladesh 2006).
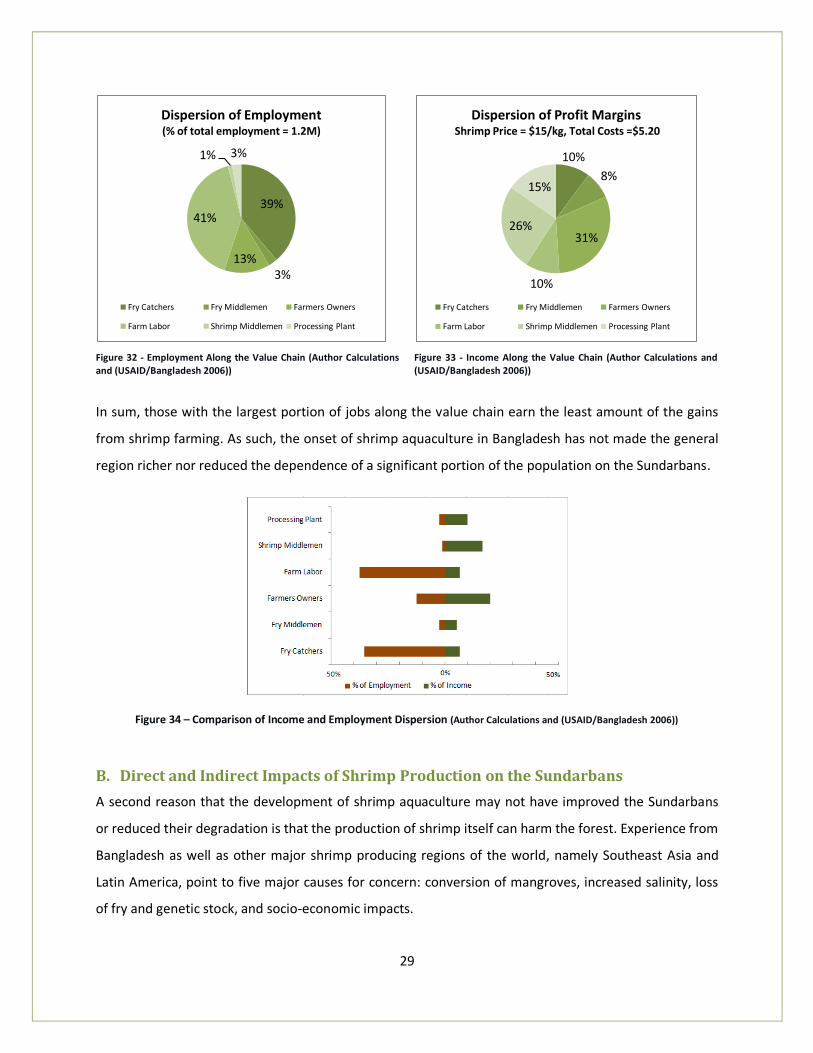
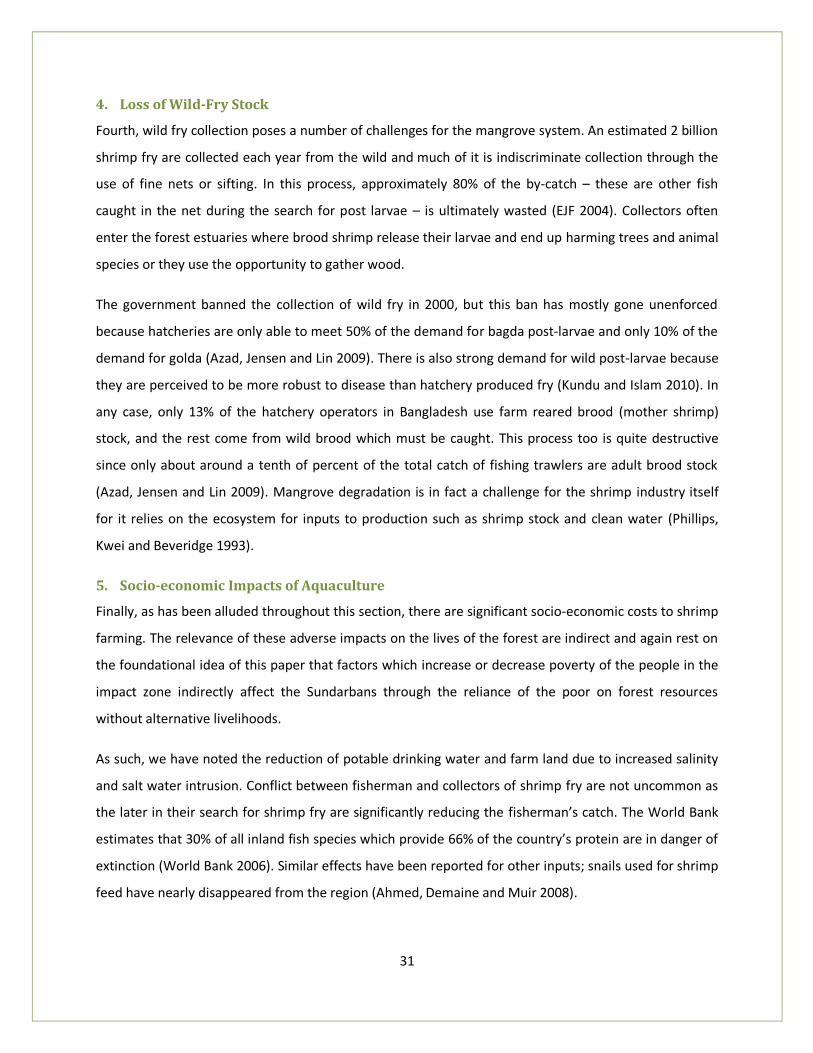
4. Dispersion of Employment and Earnings along the Value Chain
The examination of the value chain above yields several interesting points about the dispersion of both
employment and earnings along the shrimp value chain. First, the majority of those who find
employment in the shrimp industry are not the owners of the shrimp farms but rather the laborers
(41%) who prepare and till the land and help with the harvest. The second largest group are the are the
fry collectors who comprise 39%. Farmers are only 13% and the intermediaries are the smallest fraction
with about 4% (Figure 32).
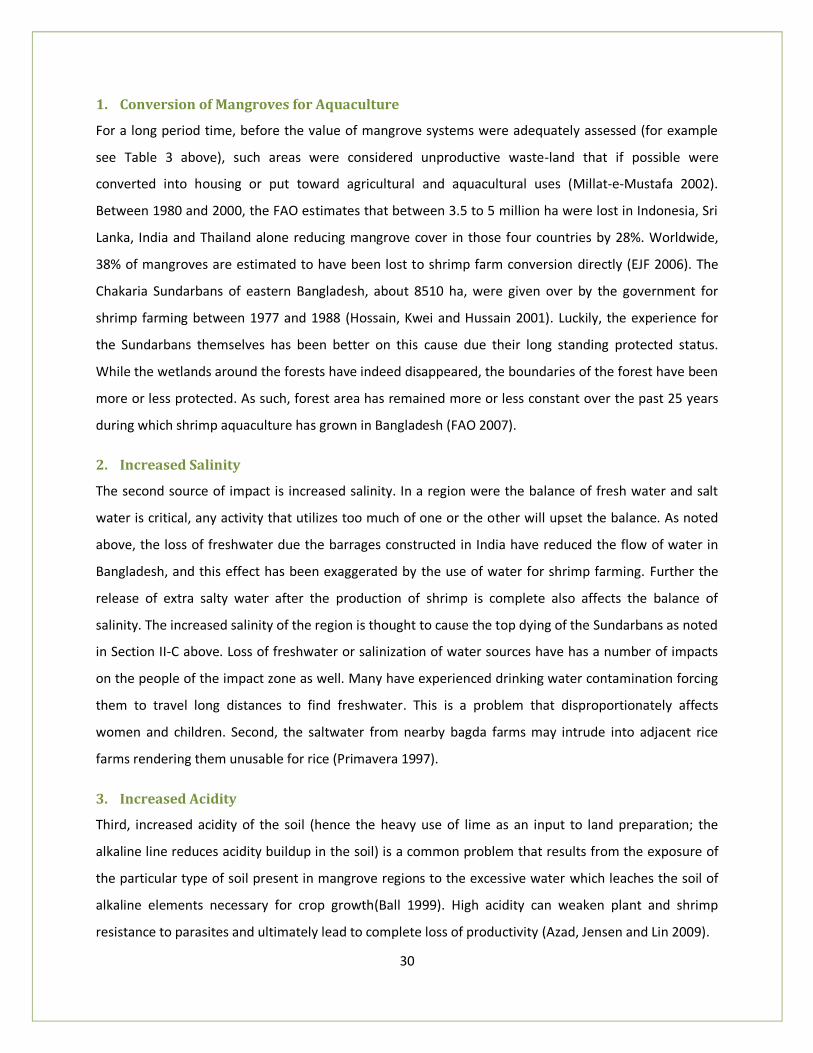
The dispersion of profits is different: 31%, the largest portion, accrue to farm owners. Shrimp
middlemen earn 26%, the processing plant earns 15% of the margin, and farm laborers and fry collectors
each earn about 10%. Fry middlemen make out with the smallest slice of 8%. These differences would
only be more exaggerated if the profit margin calculation took into account the number of people that
constitute the groups across whom these profit margins are distributed. Even so, the outcome is telling
if not surprising (Figure 34).
29
Figure 32 - Employment Along the Value Chain (Author Calculations and (USAID/Bangladesh 2006))
Figure 33 - Income Along the Value Chain (Author Calculations and (USAID/Bangladesh 2006))
In sum, those with the largest portion of jobs along the value chain earn the least amount of the gains
from shrimp farming. As such, the onset of shrimp aquaculture in Bangladesh has not made the general
region richer nor reduced the dependence of a significant portion of the population on the Sundarbans.
Figure 34 – Comparison of Income and Employment Dispersion (Author Calculations and (USAID/Bangladesh 2006))
B. Direct and Indirect Impacts of Shrimp Production on the Sundarbans
A second reason that the development of shrimp aquaculture may not have improved the Sundarbans
or reduced their degradation is that the production of shrimp itself can harm the forest. Experience from
Bangladesh as well as other major shrimp producing regions of the world, namely Southeast Asia and
Latin America, point to five major causes for concern: conversion of mangroves, increased salinity, loss
of fry and genetic stock, and socio-economic impacts.
39%
3%13%
41%
1% 3%
Dispersion of Employment(% of total employment = 1.2M)
Fry Catchers Fry Middlemen Farmers Owners
Farm Labor Shrimp Middlemen Processing Plant
10%
8%
31%
10%
26%
15%
Dispersion of Profit MarginsShrimp Price = $15/kg, Total Costs =$5.20
Fry Catchers Fry Middlemen Farmers Owners
Farm Labor Shrimp Middlemen Processing Plant
30
1. Conversion of Mangroves for Aquaculture
For a long period time, before the value of mangrove systems were adequately assessed (for example
see Table 3 above), such areas were considered unproductive waste-land that if possible were
converted into housing or put toward agricultural and aquacultural uses (Millat-e-Mustafa 2002).
Between 1980 and 2000, the FAO estimates that between 3.5 to 5 million ha were lost in Indonesia, Sri
Lanka, India and Thailand alone reducing mangrove cover in those four countries by 28%. Worldwide,
38% of mangroves are estimated to have been lost to shrimp farm conversion directly (EJF 2006). The
Chakaria Sundarbans of eastern Bangladesh, about 8510 ha, were given over by the government for
shrimp farming between 1977 and 1988 (Hossain, Kwei and Hussain 2001). Luckily, the experience for
the Sundarbans themselves has been better on this cause due their long standing protected status.
While the wetlands around the forests have indeed disappeared, the boundaries of the forest have been
more or less protected. As such, forest area has remained more or less constant over the past 25 years
during which shrimp aquaculture has grown in Bangladesh (FAO 2007).
2. Increased Salinity
The second source of impact is increased salinity. In a region were the balance of fresh water and salt
water is critical, any activity that utilizes too much of one or the other will upset the balance. As noted
above, the loss of freshwater due the barrages constructed in India have reduced the flow of water in
Bangladesh, and this effect has been exaggerated by the use of water for shrimp farming. Further the
release of extra salty water after the production of shrimp is complete also affects the balance of
salinity. The increased salinity of the region is thought to cause the top dying of the Sundarbans as noted
in Section II-C above. Loss of freshwater or salinization of water sources have has a number of impacts
on the people of the impact zone as well. Many have experienced drinking water contamination forcing
them to travel long distances to find freshwater. This is a problem that disproportionately affects
women and children. Second, the saltwater from nearby bagda farms may intrude into adjacent rice
farms rendering them unusable for rice (Primavera 1997).
3. Increased Acidity
Third, increased acidity of the soil (hence the heavy use of lime as an input to land preparation; the
alkaline line reduces acidity buildup in the soil) is a common problem that results from the exposure of
the particular type of soil present in mangrove regions to the excessive water which leaches the soil of
alkaline elements necessary for crop growth(Ball 1999). High acidity can weaken plant and shrimp
resistance to parasites and ultimately lead to complete loss of productivity (Azad, Jensen and Lin 2009).
31
4. Loss of Wild-Fry Stock
Fourth, wild fry collection poses a number of challenges for the mangrove system. An estimated 2 billion
shrimp fry are collected each year from the wild and much of it is indiscriminate collection through the
use of fine nets or sifting. In this process, approximately 80% of the by-catch – these are other fish
caught in the net during the search for post larvae – is ultimately wasted (EJF 2004). Collectors often
enter the forest estuaries where brood shrimp release their larvae and end up harming trees and animal
species or they use the opportunity to gather wood.
The government banned the collection of wild fry in 2000, but this ban has mostly gone unenforced
because hatcheries are only able to meet 50% of the demand for bagda post-larvae and only 10% of the
demand for golda (Azad, Jensen and Lin 2009). There is also strong demand for wild post-larvae because
they are perceived to be more robust to disease than hatchery produced fry (Kundu and Islam 2010). In
any case, only 13% of the hatchery operators in Bangladesh use farm reared brood (mother shrimp)
stock, and the rest come from wild brood which must be caught. This process too is quite destructive
since only about around a tenth of percent of the total catch of fishing trawlers are adult brood stock
(Azad, Jensen and Lin 2009). Mangrove degradation is in fact a challenge for the shrimp industry itself
for it relies on the ecosystem for inputs to production such as shrimp stock and clean water (Phillips,
Kwei and Beveridge 1993).
5. Socio-economic Impacts of Aquaculture
Finally, as has been alluded throughout this section, there are significant socio-economic costs to shrimp
farming. The relevance of these adverse impacts on the lives of the forest are indirect and again rest on
the foundational idea of this paper that factors which increase or decrease poverty of the people in the
impact zone indirectly affect the Sundarbans through the reliance of the poor on forest resources
without alternative livelihoods.
As such, we have noted the reduction of potable drinking water and farm land due to increased salinity
and salt water intrusion. Conflict between fisherman and collectors of shrimp fry are not uncommon as
the later in their search for shrimp fry are significantly reducing the fisherman’s catch. The World Bank
estimates that 30% of all inland fish species which provide 66% of the country’s protein are in danger of
extinction (World Bank 2006). Similar effects have been reported for other inputs; snails used for shrimp
feed have nearly disappeared from the region (Ahmed, Demaine and Muir 2008).
32
More broadly, this dramatic change in landscape (ponds for fields) and the introduction of a new
economic activity has deep consequences on the old activities. It is no longer possible to graze livestock
on such terrain, areas of the coast are no longer accessible for fishing, and increasing land values due to
the profitability of shrimp has put rental prices out of reach for many of the area who do not have
access to finance thus transferring effective control of the lands to outsiders with political connections
and financial resources necessary to farm shrimp (Primavera 1997).
The administration of the lands that have been reclaimed from the rivers during the process of creating
embankments(called khas lands), as described by the country director of the IUCN, provides a small
window into the nexus of power and shrimp. Khas lands are meant to be given over to the landless
according to the land reforms of 1989. They are administered by the local district administration but are
held under ownership of the Ministry of Lands in Dhaka which has no local office. There is insufficient
coordination between the two offices allowing powerful interests to pay off both sides and claim the
land. Any legal challenge would take five to ten years, and in any case, no land survey data exist to prove
definitively where the boundaries of disputed khas land actually lie. In such a power vacuum coupled
with weak institutions, it is easy for the powerful to gain the advantage (Khan 2010).
It important to note here that the discussion above has been quite general about shrimp production, but
as we have seen before: there is quite a difference between bagda and gold production. It follows that
their impacts are also quite different. In general, golda production does not suffer from many of the
harmful impacts of bagda production particularly as related to salinity (freshwater is used in production)
and socio-economic impacts (average farm is much smaller and returns higher) (Ahmed 2003).
VI. Fixing a Broken Promise: Towards Sustainable Aquaculture
A. What Can the Nishorgo Project Do?
1. Shrimp Fails Criteria for a Viable Alternative Livelihood
The value chain analysis presents some troubling results for the Nishorgo Project. Presumably it only
makes sense to support shrimp aquaculture as a viable alternative livelihood if the activity meets at least
the following criteria:
1. The activity as a whole generates enough income for those involved to make a living without
relying on the Sundarbans, and is capable of absorbing a significant portion of the roughly 1.35
million people of the area who are currently reliant on the forest.
33
2. The earnings from the activity are sufficiently dispersed such that even those in the value chain
that receive the smallest portions of income are still able to substitute their dependence on the
Sundarbans.
3. The direct environmental impacts of the activity on the Sundarbans do not outweigh the gains
derived through poverty reduction.
Shrimp production is promising because it meets the first criteria (as we saw in Section III however, even
here there is much room for improvements in productivity), but has failed to meet this promise because
it does not seem to meet the second or third criteria (as we saw in Section V).
So where does that leave the Nishorgo project? One obvious option is simply to abandon the idea of
using shrimp as a potential alternative and move on to other projects. But, as has been lamented
elsewhere, few real alternatives exist in the region (ADB 1998). That is, most alternatives do not seem to
meet the first criteria. However, if shrimp is to be retained as an alternative, then interventions of some
form or another are necessary to address the deficiencies in the second and third criteria.
2. Alternative 1: Address One Weakness at a Time
The first approach would be for the Nishorgo Project to tackle each of these weaknesses in shrimp
aquaculture in turn, but in most cases, there are no obvious answers.
Increase Productivity
Much can be done to improve the productivity of the current method of shrimp aquaculture. Extension
services could be deployed to teach farmers how to adopt more intensive farming methods and utilize
inputs more efficiently. As has been noted, other countries dwarf the per acre yields found in
Bangladesh (Figure 17). The state can also invest in cold chains and post-harvest services to reduce
significant losses in this stage which are reported to be a third of the final sale price of shrimp in export
markets (USAID/Bangladesh 2005). Private companies, particularly the idle processing factories could be
incentivized to make some of these investments so they can increase their own utilization rates.
The list could go on and on, but the problem with each of these is that the Nishorgo Project neither has
the technical capacity to manage such changes nor do they have the political authority to do so. Indeed
they lack the funding as well. In any case, productivity alone will not allow them to meet their goal.
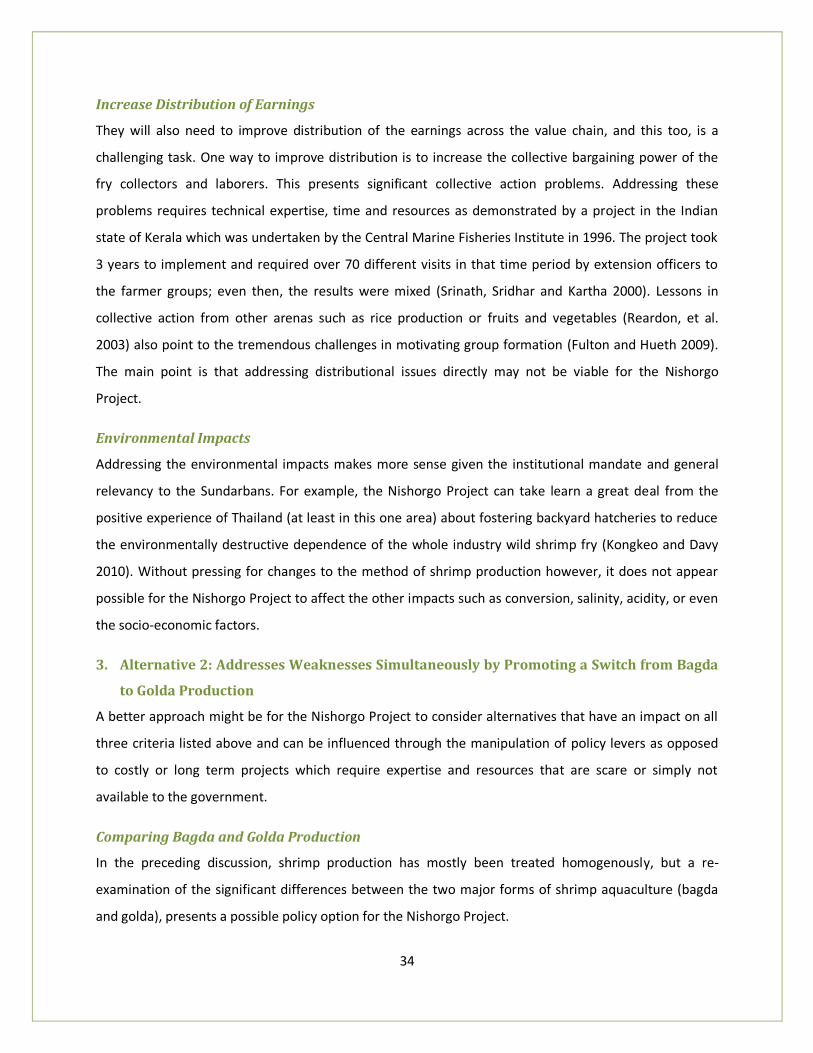
34
Increase Distribution of Earnings
They will also need to improve distribution of the earnings across the value chain, and this too, is a
challenging task. One way to improve distribution is to increase the collective bargaining power of the
fry collectors and laborers. This presents significant collective action problems. Addressing these
problems requires technical expertise, time and resources as demonstrated by a project in the Indian
state of Kerala which was undertaken by the Central Marine Fisheries Institute in 1996. The project took
3 years to implement and required over 70 different visits in that time period by extension officers to
the farmer groups; even then, the results were mixed (Srinath, Sridhar and Kartha 2000). Lessons in
collective action from other arenas such as rice production or fruits and vegetables (Reardon, et al.
2003) also point to the tremendous challenges in motivating group formation (Fulton and Hueth 2009).
The main point is that addressing distributional issues directly may not be viable for the Nishorgo
Project.
Environmental Impacts
Addressing the environmental impacts makes more sense given the institutional mandate and general
relevancy to the Sundarbans. For example, the Nishorgo Project can take learn a great deal from the
positive experience of Thailand (at least in this one area) about fostering backyard hatcheries to reduce
the environmentally destructive dependence of the whole industry wild shrimp fry (Kongkeo and Davy
2010). Without pressing for changes to the method of shrimp production however, it does not appear
possible for the Nishorgo Project to affect the other impacts such as conversion, salinity, acidity, or even
the socio-economic factors.
3. Alternative 2: Addresses Weaknesses Simultaneously by Promoting a Switch from Bagda
to Golda Production
A better approach might be for the Nishorgo Project to consider alternatives that have an impact on all
three criteria listed above and can be influenced through the manipulation of policy levers as opposed
to costly or long term projects which require expertise and resources that are scare or simply not
available to the government.
Comparing Bagda and Golda Production
In the preceding discussion, shrimp production has mostly been treated homogenously, but a re-
examination of the significant differences between the two major forms of shrimp aquaculture (bagda
and golda), presents a possible policy option for the Nishorgo Project.
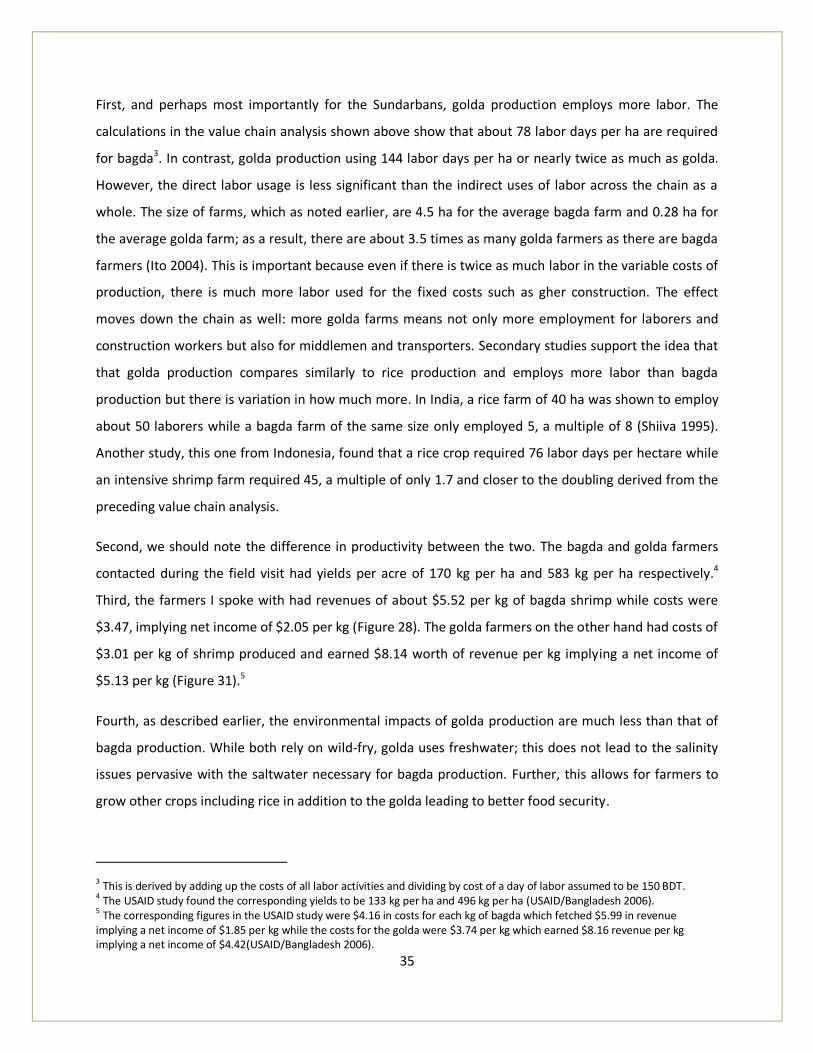
35
First, and perhaps most importantly for the Sundarbans, golda production employs more labor. The
calculations in the value chain analysis shown above show that about 78 labor days per ha are required
for bagda3. In contrast, golda production using 144 labor days per ha or nearly twice as much as golda.
However, the direct labor usage is less significant than the indirect uses of labor across the chain as a
whole. The size of farms, which as noted earlier, are 4.5 ha for the average bagda farm and 0.28 ha for
the average golda farm; as a result, there are about 3.5 times as many golda farmers as there are bagda
farmers (Ito 2004). This is important because even if there is twice as much labor in the variable costs of
production, there is much more labor used for the fixed costs such as gher construction. The effect
moves down the chain as well: more golda farms means not only more employment for laborers and
construction workers but also for middlemen and transporters. Secondary studies support the idea that
that golda production compares similarly to rice production and employs more labor than bagda
production but there is variation in how much more. In India, a rice farm of 40 ha was shown to employ
about 50 laborers while a bagda farm of the same size only employed 5, a multiple of 8 (Shiiva 1995).
Another study, this one from Indonesia, found that a rice crop required 76 labor days per hectare while
an intensive shrimp farm required 45, a multiple of only 1.7 and closer to the doubling derived from the
preceding value chain analysis.
Second, we should note the difference in productivity between the two. The bagda and golda farmers
contacted during the field visit had yields per acre of 170 kg per ha and 583 kg per ha respectively.4
Third, the farmers I spoke with had revenues of about $5.52 per kg of bagda shrimp while costs were
$3.47, implying net income of $2.05 per kg (Figure 28). The golda farmers on the other hand had costs of
$3.01 per kg of shrimp produced and earned $8.14 worth of revenue per kg implying a net income of
$5.13 per kg (Figure 31).5
Fourth, as described earlier, the environmental impacts of golda production are much less than that of
bagda production. While both rely on wild-fry, golda uses freshwater; this does not lead to the salinity
issues pervasive with the saltwater necessary for bagda production. Further, this allows for farmers to
grow other crops including rice in addition to the golda leading to better food security.
3 This is derived by adding up the costs of all labor activities and dividing by cost of a day of labor assumed to be 150 BDT. 4 The USAID study found the corresponding yields to be 133 kg per ha and 496 kg per ha (USAID/Bangladesh 2006). 5 The corresponding figures in the USAID study were $4.16 in costs for each kg of bagda which fetched $5.99 in revenue
implying a net income of $1.85 per kg while the costs for the golda were $3.74 per kg which earned $8.16 revenue per kg implying a net income of $4.42(USAID/Bangladesh 2006).
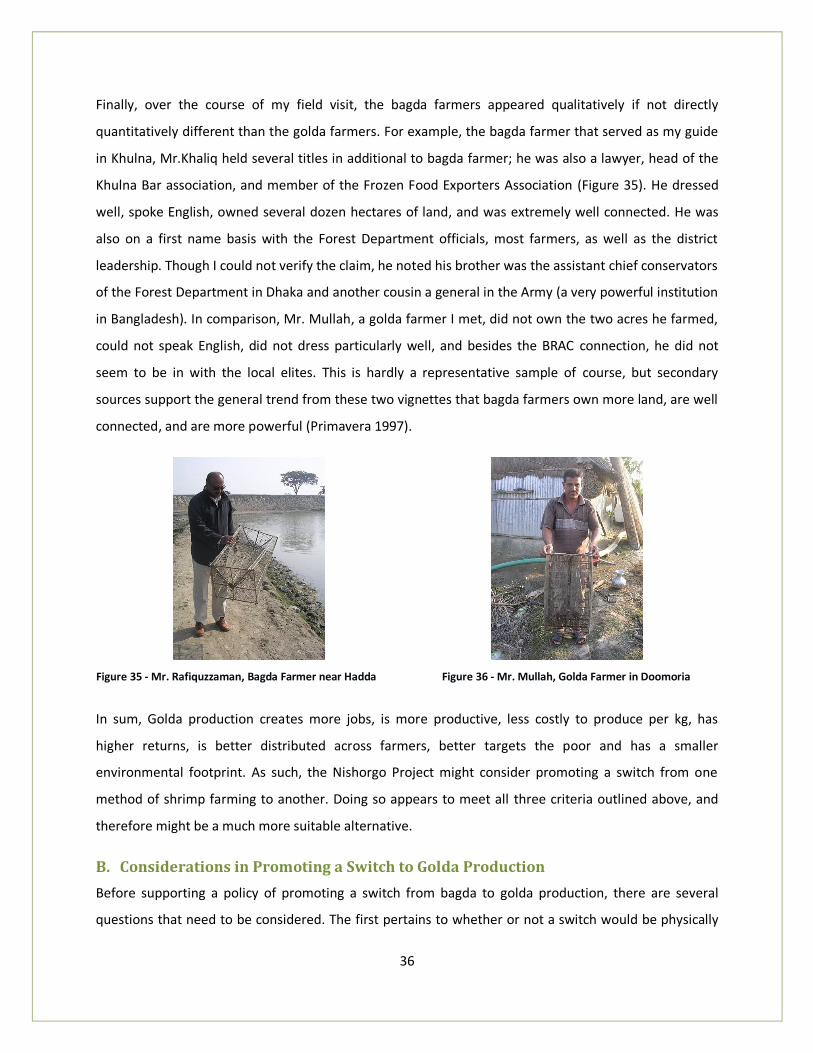
36
Finally, over the course of my field visit, the bagda farmers appeared qualitatively if not directly
quantitatively different than the golda farmers. For example, the bagda farmer that served as my guide
in Khulna, Mr.Khaliq held several titles in additional to bagda farmer; he was also a lawyer, head of the
Khulna Bar association, and member of the Frozen Food Exporters Association (Figure 35). He dressed
well, spoke English, owned several dozen hectares of land, and was extremely well connected. He was
also on a first name basis with the Forest Department officials, most farmers, as well as the district
leadership. Though I could not verify the claim, he noted his brother was the assistant chief conservators
of the Forest Department in Dhaka and another cousin a general in the Army (a very powerful institution
in Bangladesh). In comparison, Mr. Mullah, a golda farmer I met, did not own the two acres he farmed,
could not speak English, did not dress particularly well, and besides the BRAC connection, he did not
seem to be in with the local elites. This is hardly a representative sample of course, but secondary
sources support the general trend from these two vignettes that bagda farmers own more land, are well
connected, and are more powerful (Primavera 1997).
Figure 35 - Mr. Rafiquzzaman, Bagda Farmer near Hadda
Figure 36 - Mr. Mullah, Golda Farmer in Doomoria
In sum, Golda production creates more jobs, is more productive, less costly to produce per kg, has
higher returns, is better distributed across farmers, better targets the poor and has a smaller
environmental footprint. As such, the Nishorgo Project might consider promoting a switch from one
method of shrimp farming to another. Doing so appears to meet all three criteria outlined above, and
therefore might be a much more suitable alternative.
B. Considerations in Promoting a Switch to Golda Production
Before supporting a policy of promoting a switch from bagda to golda production, there are several
questions that need to be considered. The first pertains to whether or not a switch would be physically
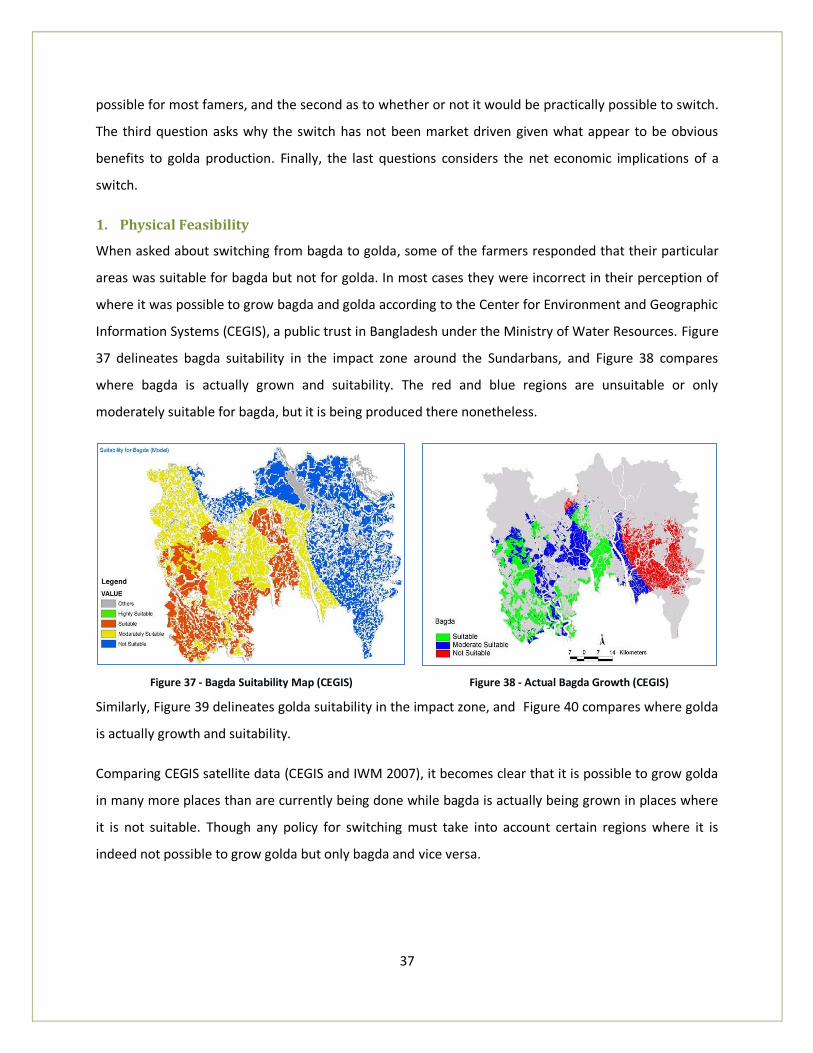
37
possible for most famers, and the second as to whether or not it would be practically possible to switch.
The third question asks why the switch has not been market driven given what appear to be obvious
benefits to golda production. Finally, the last questions considers the net economic implications of a
switch.
1. Physical Feasibility
When asked about switching from bagda to golda, some of the farmers responded that their particular
areas was suitable for bagda but not for golda. In most cases they were incorrect in their perception of
where it was possible to grow bagda and golda according to the Center for Environment and Geographic
Information Systems (CEGIS), a public trust in Bangladesh under the Ministry of Water Resources. Figure
37 delineates bagda suitability in the impact zone around the Sundarbans, and Figure 38 compares
where bagda is actually grown and suitability. The red and blue regions are unsuitable or only
moderately suitable for bagda, but it is being produced there nonetheless.
Figure 37 - Bagda Suitability Map (CEGIS)
Figure 38 - Actual Bagda Growth (CEGIS)
Similarly, Figure 39 delineates golda suitability in the impact zone, and Figure 40 compares where golda
is actually growth and suitability.
Comparing CEGIS satellite data (CEGIS and IWM 2007), it becomes clear that it is possible to grow golda
in many more places than are currently being done while bagda is actually being grown in places where
it is not suitable. Though any policy for switching must take into account certain regions where it is
indeed not possible to grow golda but only bagda and vice versa.
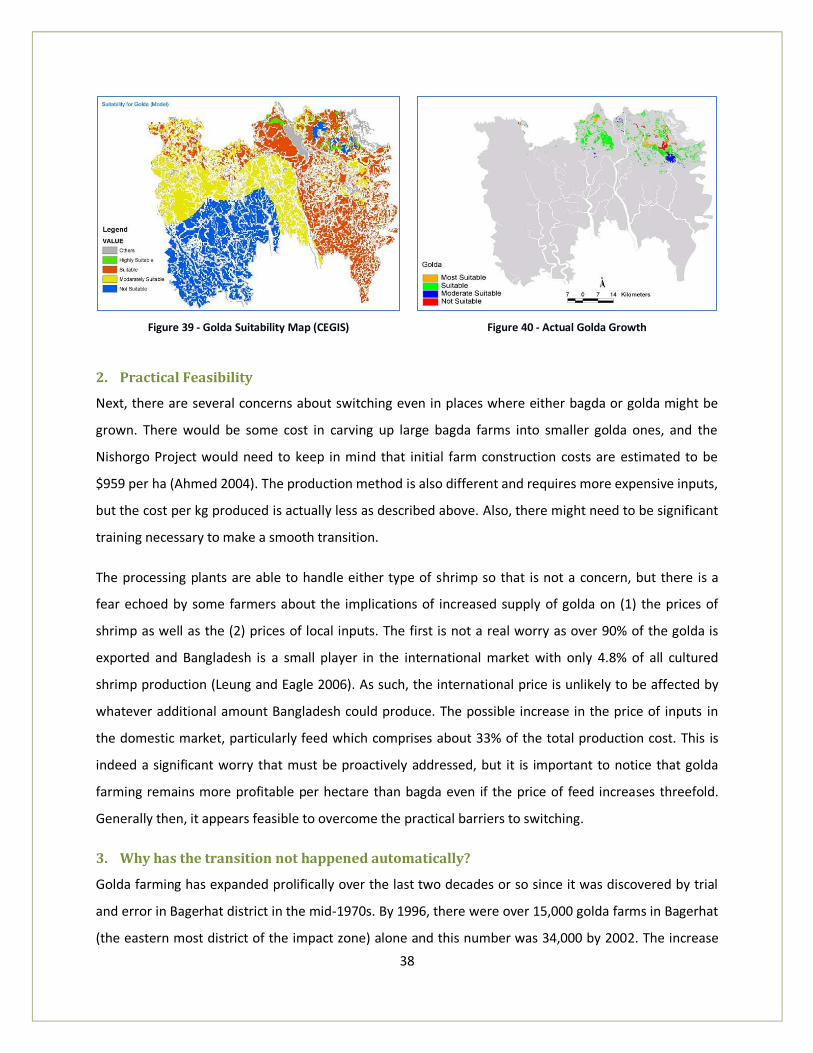
38
Figure 39 - Golda Suitability Map (CEGIS)
Figure 40 - Actual Golda Growth
2. Practical Feasibility
Next, there are several concerns about switching even in places where either bagda or golda might be
grown. There would be some cost in carving up large bagda farms into smaller golda ones, and the
Nishorgo Project would need to keep in mind that initial farm construction costs are estimated to be
$959 per ha (Ahmed 2004). The production method is also different and requires more expensive inputs,
but the cost per kg produced is actually less as described above. Also, there might need to be significant
training necessary to make a smooth transition.
The processing plants are able to handle either type of shrimp so that is not a concern, but there is a
fear echoed by some farmers about the implications of increased supply of golda on (1) the prices of
shrimp as well as the (2) prices of local inputs. The first is not a real worry as over 90% of the golda is
exported and Bangladesh is a small player in the international market with only 4.8% of all cultured
shrimp production (Leung and Eagle 2006). As such, the international price is unlikely to be affected by
whatever additional amount Bangladesh could produce. The possible increase in the price of inputs in
the domestic market, particularly feed which comprises about 33% of the total production cost. This is
indeed a significant worry that must be proactively addressed, but it is important to notice that golda
farming remains more profitable per hectare than bagda even if the price of feed increases threefold.
Generally then, it appears feasible to overcome the practical barriers to switching.
3. Why has the transition not happened automatically?
Golda farming has expanded prolifically over the last two decades or so since it was discovered by trial
and error in Bagerhat district in the mid-1970s. By 1996, there were over 15,000 golda farms in Bagerhat
(the eastern most district of the impact zone) alone and this number was 34,000 by 2002. The increase
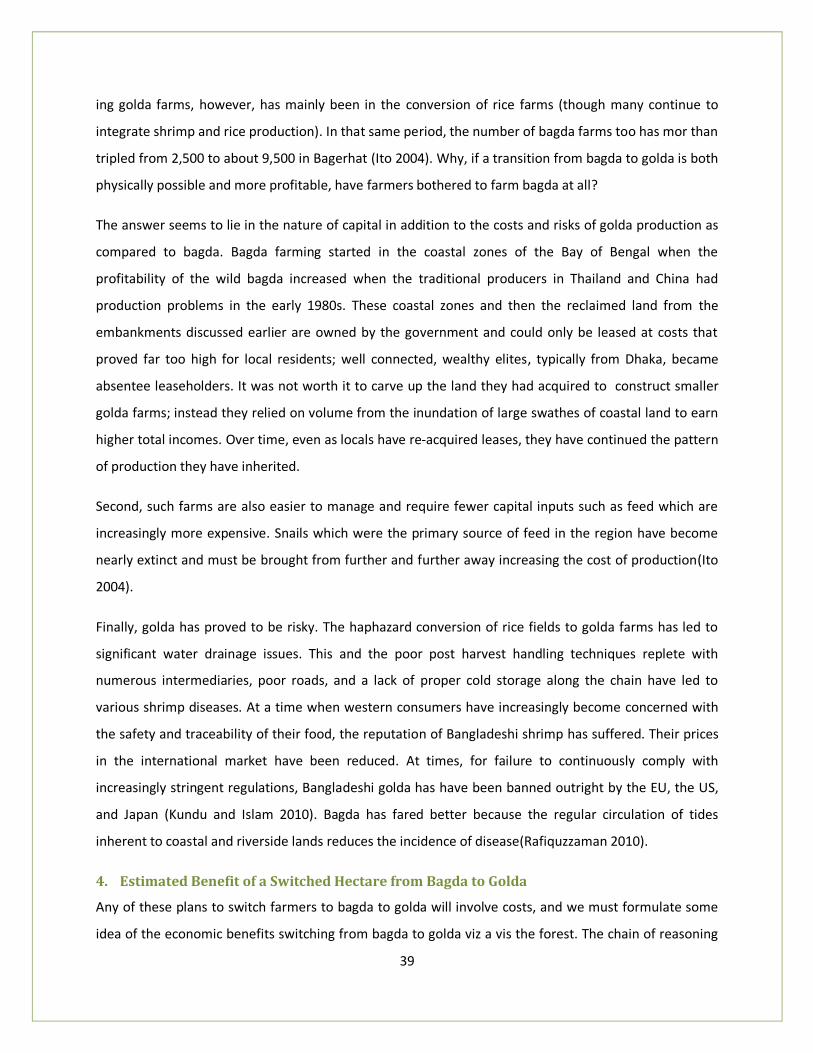
39
ing golda farms, however, has mainly been in the conversion of rice farms (though many continue to
integrate shrimp and rice production). In that same period, the number of bagda farms too has mor than
tripled from 2,500 to about 9,500 in Bagerhat (Ito 2004). Why, if a transition from bagda to golda is both
physically possible and more profitable, have farmers bothered to farm bagda at all?
The answer seems to lie in the nature of capital in addition to the costs and risks of golda production as
compared to bagda. Bagda farming started in the coastal zones of the Bay of Bengal when the
profitability of the wild bagda increased when the traditional producers in Thailand and China had
production problems in the early 1980s. These coastal zones and then the reclaimed land from the
embankments discussed earlier are owned by the government and could only be leased at costs that
proved far too high for local residents; well connected, wealthy elites, typically from Dhaka, became
absentee leaseholders. It was not worth it to carve up the land they had acquired to construct smaller
golda farms; instead they relied on volume from the inundation of large swathes of coastal land to earn
higher total incomes. Over time, even as locals have re-acquired leases, they have continued the pattern
of production they have inherited.
Second, such farms are also easier to manage and require fewer capital inputs such as feed which are
increasingly more expensive. Snails which were the primary source of feed in the region have become
nearly extinct and must be brought from further and further away increasing the cost of production(Ito
2004).
Finally, golda has proved to be risky. The haphazard conversion of rice fields to golda farms has led to
significant water drainage issues. This and the poor post harvest handling techniques replete with
numerous intermediaries, poor roads, and a lack of proper cold storage along the chain have led to
various shrimp diseases. At a time when western consumers have increasingly become concerned with
the safety and traceability of their food, the reputation of Bangladeshi shrimp has suffered. Their prices
in the international market have been reduced. At times, for failure to continuously comply with
increasingly stringent regulations, Bangladeshi golda has have been banned outright by the EU, the US,
and Japan (Kundu and Islam 2010). Bagda has fared better because the regular circulation of tides
inherent to coastal and riverside lands reduces the incidence of disease(Rafiquzzaman 2010).
4. Estimated Benefit of a Switched Hectare from Bagda to Golda
Any of these plans to switch farmers to bagda to golda will involve costs, and we must formulate some
idea of the economic benefits switching from bagda to golda viz a vis the forest. The chain of reasoning
40
we have constructed can be simplified for this exercise as follows: (1) convert bagda farm to golda farm
absorbing more labor (2) less labor means lowered dependence on the forest, and (3) lower
dependence means more conservation of the forest. The difficulty appears in being quantitatively
precise about these links for there seems to be a lack of data (see Appendix) and inadequate research
on these topics for Bangladesh (World Bank 2009).
Still, some approximation might be attempted using secondary sources most of which were discussed
above following the concept of marginal opportunity cost as described in (Pearce and Markandya 1987).
As we noted above (in A3 of this section), golda farms were found to absorb between 1.7 and 8
times as much labor as bagda farms; these can form low and high values scenarios.
Second, we can rely on a study that reviews 24 other efforts to value non-timber forest products
(NTFP) to estimate how much forest material is being extracted per person from the forest. The
figures range from $50 to $150 ha-1yr-1 (Godoy, Lubowski and Markandya 1993) for forests
comparable to the Sundarbans.
We also know that those reliant on the forest are earning about quite poor and families earning
between 165-416 USD annually (World Bank 2009). Some portions, perhaps 1.5% to 3.3%, of the
consumption are not renewable and degrades stand density and affects total function of the
forest(Iftekar and Islam 2004). The complete services of mangrove systems, as we saw before,
are between $600 ha-1yr-1 to $11,300 ha-1yr-1 (Primavera 1997).
We now have a upper and lower bound for each of these variables, and we can derive our rough
estimate using the values in between. One person extracting NTFP from 2.5 ha of the forest
annually reduces the value of the forest by $100 ha-1yr-1 to earn about $250 for his family.
Of this about 2% is non-renewable and degrades density and functioning of the total forest. 2%
of 2.5 ha is 0.05 ha which is worth $300 annually if the forest is valued at $6,000 ha-1yr-1.
Therefore, if 5 people receive a job on a golda farm converted from one ha of bagda, then this
leads to a decrease in annual degradation of 5 x $300 or $1,500 per ha switched.
Suppose the job multiple is 2 instead of 5, which is approximately the multiple derived above; the
degradation is a more conservative 1% instead of 2%; the value of the NTFP reduced to 70 ha-1yr-1 ;and,
the value remains the same for the value of the forest, then each switch is worth about $430 annually.
Similarly, if the family earns $300 per year; the value of NTFP remains 70 ha-1yr-1 ; the degradation is 2%,
the value of the forest is $11,300 ha-1yr-1 (the high value which might be the case for Bangladesh where
41
the forest serves additional functions such as tidal wave protection); and, the job multiple is 2, then the
value of a switch is $1,900 per ha switched. The purpose is not to establish an exact figure, but only to
establish a approximate range of possible values between $430 per switch to $1900 per switch. The
positive values within this range underscore the need, as described throughout the paper, to do
something rather than nothing at all.
C. How to Switch from Bagda to Golda? Policy Options
If right move for the Nishorgo Project is to switch as many bagda farmers to golda production as is
feasible in order to advance a form of aquaculture that better meets the criteria for an alternative
livelihood set out above (in Section VI-A-1), then the next consideration is to determine what policy
options might be used to accomplish this goal. We proceed by making several assumptions, first that the
shrimp farmers are rational and second, that they are interested primarily in earning the as much
income from their efforts and inputs as possible meaning they want to maximize their profits by
choosing an optimal level of outputs. Based on these two assumptions, we can frame the goal of the
Nishorgo Project to affect specific policy levers so as to increase the profitability of golda production
relative to bagda production including the costs of switching.
This equation simply shows that profits are revenues (price times quantity produced) less the costs of
production (price of inputs times how much was needed). Profit π for a farmers is dependent on p (the
price of shrimp), and w (the vector of corresponding input prices) and the farmer maximizes by choosing
the, xj the set of inputs (i to k) used to produce f() quantity of shrimp such as labor, feed, fertilizer. If we
let πG and πB be the expected net present value of a perpetual stream of profits incorporating the risk of
a future ban6, of golda and bagda respectively, the Nishorgo project must make:
πG – C > πB
Here C is the fixed cost of conversion noted above to be about $959 per ha. Considering even a simple
profit equation provides ideas for possible options by which the Nishorgo project might affect the
profitability of golda vs bagda. To increase the profitability, one must (1) increase price of shrimp, (2)
6 A perpetuity is annual profit divided by the discount rate, r, which is assumed to be constant over time. And a simple approximation of the expected value of profit assumping the probability of a ban, b: E[NPV(πG)] = (1-b)*πG /r – b* πGb / r where πGb is the profit in the event of a ban; the equation for bagda would be similar.
42
increase the quantity of shrimp produced, (3) decrease the quantity of inputs needed or (4) decrease
the respective costs of production inputs. An additional option (5) here is to decrease the cost of
conversion (6) decrease the discount rate of golda vs. bagda, or (7) decrease the probability of a future
ban. Each of these would increase the profitability of golda relative to bagda, of course, the opposite of
each of these could be done for bagda to decrease profitability.
Bangladesh is a price taker in the international market, so (1) is not a realistic option nor is (6) practical.
The Nishorgo project as noted in above (in Section IV) is small and limited in its resources and capacity,
and as such (2), (3), and (7) are eliminated outright for each of these require broad structural changes in
the shrimp industry to increase productivity and develop infrastructure. Two options remain as viable
from the list: (4) and (5) that is, those that involve altering the price of inputs or reducing the cost of
conversion.
1. Reduce the Cost of Conversion?
Returning then to the first of our remaining options: to increase profitability of golda by reducing the
cost of conversion. Clearly the cost of nearly $1,000 ha-1 is quite prohibitive particularly in the face of
risks of golda production. One way to reduce this cost is discounted credit or even subsidies up to the
value of per switch as described in the previous sub-section. This might in theory work both technically
and politically to incentivize a conversion, but it is not difficult to foresee implementation issues.
Recalling the experience with loans for processing plants (Section V-A-3 above on p27) which were
diverted from their original purpose, one might imagine a similar diversion here. Also, there would be a
need for monitoring to ensure compliance. This is difficult to do and requires resources the Nishorgo
Program lacks.
2. Tax Bagda Production?
A second way might be to implement taxes on bagda production, perhaps on their inputs or simply on
the finished product itself. This might technically work, but it would be a political non-starter given the
close connections that the bagda farmers maintain with the government and their general wealth and
influence (Khan 2010). It would also be difficult to collect such taxes which are generally a problem in
Bangladesh (Sarkar 2008).
3. Recommendation: Subsidize Golda Inputs
The third and most supportable option might be to subsidize the cost of conversion in a way that better
ensures compliance. For example, the price of feed has been shown to have the most significant impact
43
on shrimp farm expansion on a study done in Thailand (Barbier and Cox 2004). Freshwater shrimp feed,
typically fishmeal, is not used for bagda production and would only benefit those who had switched. It is
also a significant portion: between 33% to 55% of the production costs. We noted above that there are
approximately 150,000 farm owners(USAID/Bangladesh 2005), and that there are about three times as
many golda farmers as bagda farmers. That is, about one fourth or 37,500 bagda farm owners who
control about 4.5 ha on average and therefore 168,750 ha would be eligible. Of these, 35% or so are
areas that physically cannot be switched over as discussed above (in section VI-B-1 p37) leaving
approximately 110,000 ha. The subsidy for fishmeal which should amount to the total cost of converting
a gher of $1000 per ha which is incidentally the cost per ha of fishmeal necessary per year for golda
farming.
The subsidy should be phased in however so the purchased fishfeed is not simply re-sold to existing
golda farmers. Instead, there should be increasing subsidy that provides $200 per ha the first year, $300
per ha the second year assuming the farmer has converted his gher and completed one year of
production. The remaining $500 can be given the following year, again only if there has been compliance
the second year. The total cost of the subsidy would amount to $110 million over three years if all
possible bagda famers who were eligible switched, but this is unlikely. In any case, this is not an
exorbitant sum for a subsidy in Bangladesh; a diesel subsidy launched this year cost $107 million
(Weiwei 2010).
Besides being well targeted, it would be relatively easy for the Nishorgo Project to implement since it
could utilize the existing infrastructure the government already has for providing agricultural input
subsidies to over 9 million farmers(Weiwei 2010). The government provides an input assistance card to
those eligible for a subsidy and opens a bank account for them; the subsidies are transferred directly to
the accounts and can only be accessed by the cards for the intended use: in this case to purchase shrimp
freed.
Ideally, the program would be launched in a small sub-district first to determine its viability. The
immediate next step for the Nishorgo Project then would be to acquire enough money 50 bagda farmers
and offer an opportunity to participate in the program. Even if they all joined, the first year would cost
$45,000. The program could be expanded if successful in converting bagda farmers, absorbing labor, and
reducing dependence on the forest.
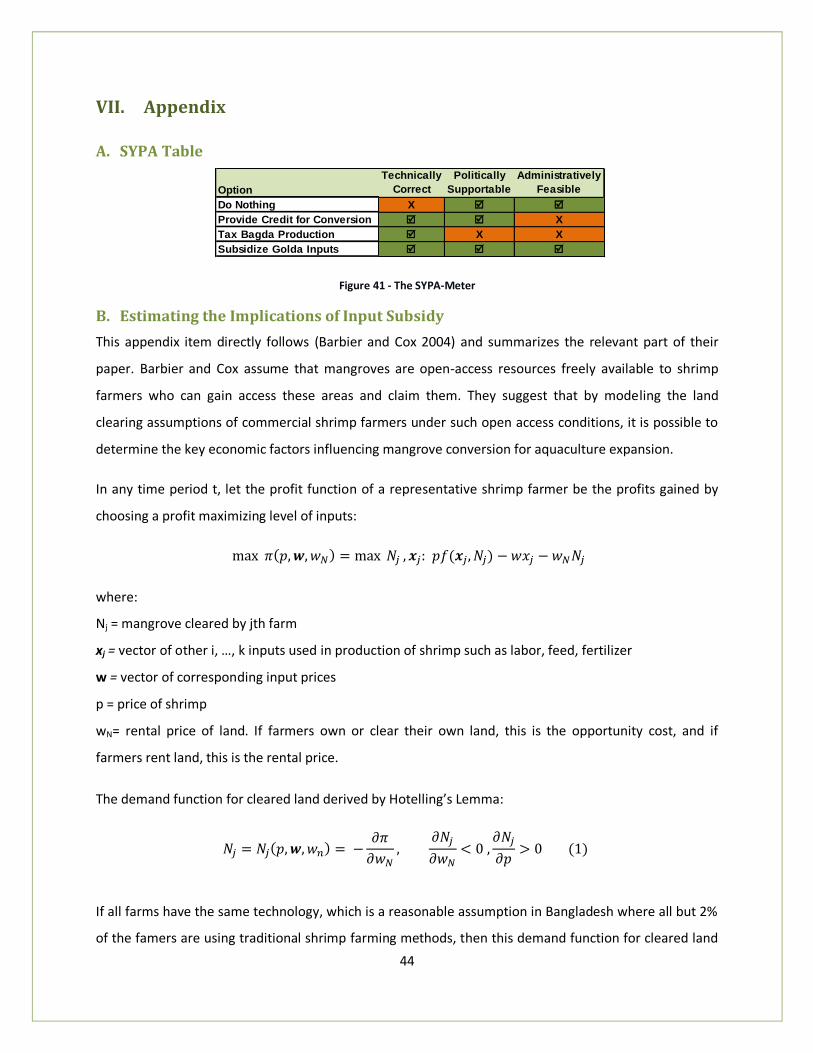
44
VII. Appendix
A. SYPA Table
Figure 41 - The SYPA-Meter
B. Estimating the Implications of Input Subsidy
This appendix item directly follows (Barbier and Cox 2004) and summarizes the relevant part of their
paper. Barbier and Cox assume that mangroves are open-access resources freely available to shrimp
farmers who can gain access these areas and claim them. They suggest that by modeling the land
clearing assumptions of commercial shrimp farmers under such open access conditions, it is possible to
determine the key economic factors influencing mangrove conversion for aquaculture expansion.
In any time period t, let the profit function of a representative shrimp farmer be the profits gained by
choosing a profit maximizing level of inputs:
where:
Nj = mangrove cleared by jth farm
xj = vector of other i, …, k inputs used in production of shrimp such as labor, feed, fertilizer
w = vector of corresponding input prices
p = price of shrimp
wN= rental price of land. If farmers own or clear their own land, this is the opportunity cost, and if
farmers rent land, this is the rental price.
The demand function for cleared land derived by Hotelling’s Lemma:
If all farms have the same technology, which is a reasonable assumption in Bangladesh where all but 2%
of the famers are using traditional shrimp farming methods, then this demand function for cleared land
Option
Technically
Correct
Politically
Supportable
Administratively
Feasible
Do Nothing X
Provide Credit for Conversion X
Tax Bagda Production X X
Subsidize Golda Inputs
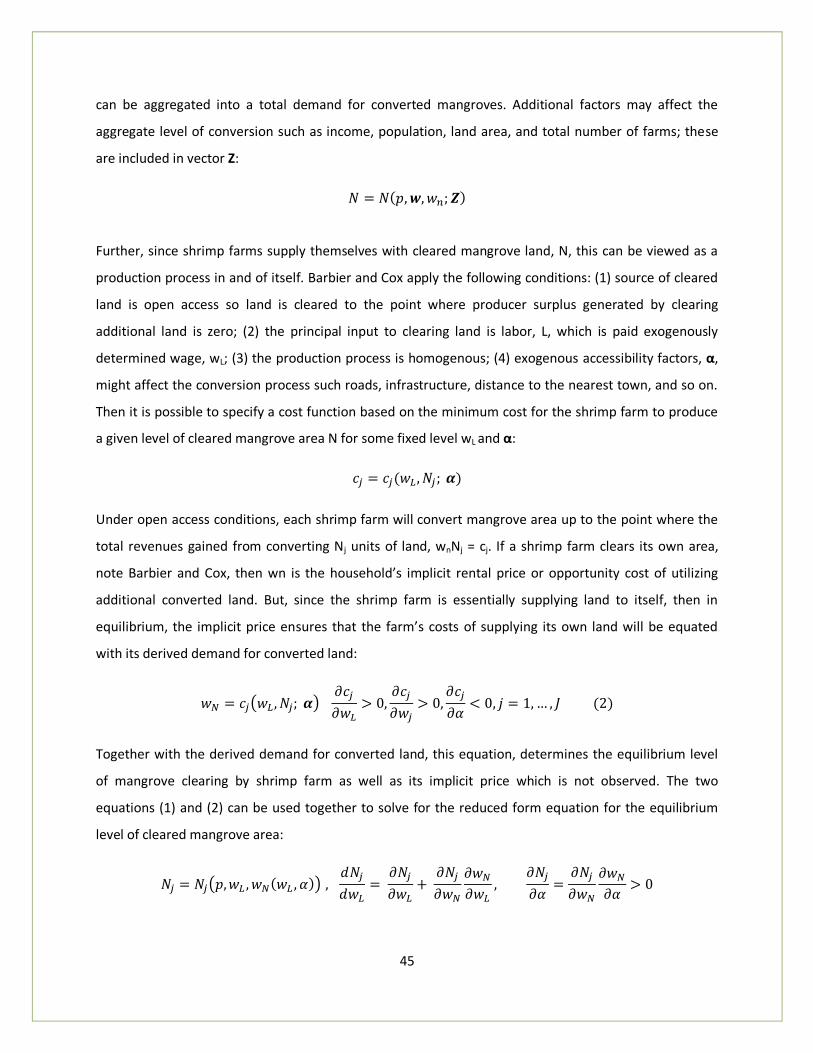
45
can be aggregated into a total demand for converted mangroves. Additional factors may affect the
aggregate level of conversion such as income, population, land area, and total number of farms; these
are included in vector Z:
Further, since shrimp farms supply themselves with cleared mangrove land, N, this can be viewed as a
production process in and of itself. Barbier and Cox apply the following conditions: (1) source of cleared
land is open access so land is cleared to the point where producer surplus generated by clearing
additional land is zero; (2) the principal input to clearing land is labor, L, which is paid exogenously
determined wage, wL; (3) the production process is homogenous; (4) exogenous accessibility factors, α,
might affect the conversion process such roads, infrastructure, distance to the nearest town, and so on.
Then it is possible to specify a cost function based on the minimum cost for the shrimp farm to produce
a given level of cleared mangrove area N for some fixed level wL and α:
Under open access conditions, each shrimp farm will convert mangrove area up to the point where the
total revenues gained from converting Nj units of land, wnNj = cj. If a shrimp farm clears its own area,
note Barbier and Cox, then wn is the household’s implicit rental price or opportunity cost of utilizing
additional converted land. But, since the shrimp farm is essentially supplying land to itself, then in
equilibrium, the implicit price ensures that the farm’s costs of supplying its own land will be equated
with its derived demand for converted land:
Together with the derived demand for converted land, this equation, determines the equilibrium level
of mangrove clearing by shrimp farm as well as its implicit price which is not observed. The two
equations (1) and (2) can be used together to solve for the reduced form equation for the equilibrium
level of cleared mangrove area:

46
Aggregating across all J farms in the area, including exogenous factors Z, and separating labor from
other input costs, leads to a reduced form relationship for the aggregate equilibrium level of cleared
mangrove land:
The impact of wage rate and other input prices is ambiguous, and Barbier and Cox proceed to estimate
the model with the following variables:
Data
A goal of this project was to gather this same information for Bangladesh to be able to estimate this
model specifically for Bangladesh. Unfortunately the data proved elusive during a short field visit to
Dhaka. Significant cost and effort, much beyond the scope of this data, would be necessary to collect
some of it that exist, but often there is a general lack of reliable data. Shrimp farm registration has only
begun in the last two years, and surveys of mangrove area have not been done regularly or using the
same methods and estimates vary (ADB 2008). Even prices of shrimp or feed over time are not
maintained by the Bangladesh Bureau of Statistics. As such, the results presented by Barbier and Cox for
Thailand are relied on to provide some guidance for what may be happening in Bangladesh:
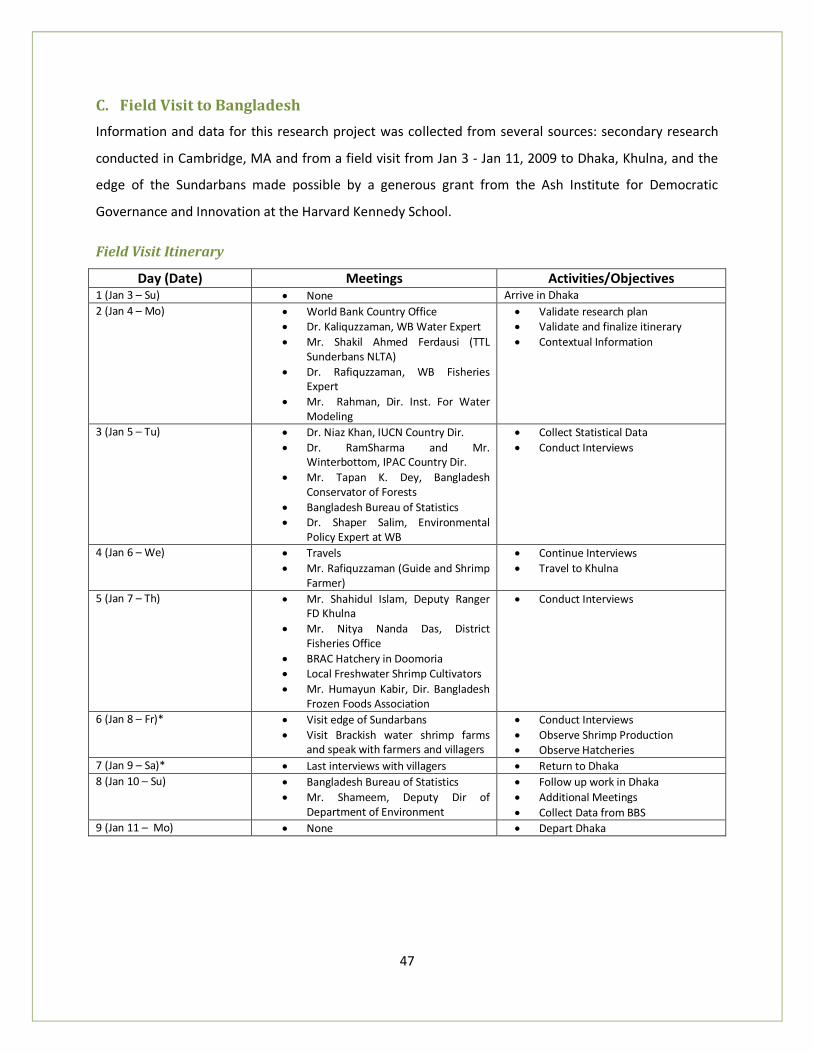
47
C. Field Visit to Bangladesh
Information and data for this research project was collected from several sources: secondary research
conducted in Cambridge, MA and from a field visit from Jan 3 - Jan 11, 2009 to Dhaka, Khulna, and the
edge of the Sundarbans made possible by a generous grant from the Ash Institute for Democratic
Governance and Innovation at the Harvard Kennedy School.
Field Visit Itinerary
Day (Date) Meetings Activities/Objectives 1 (Jan 3 – Su) None Arrive in Dhaka
2 (Jan 4 – Mo) World Bank Country Office Dr. Kaliquzzaman, WB Water Expert
Mr. Shakil Ahmed Ferdausi (TTL Sunderbans NLTA)
Dr. Rafiquzzaman, WB Fisheries Expert
Mr. Rahman, Dir. Inst. For Water Modeling
Validate research plan Validate and finalize itinerary
Contextual Information
3 (Jan 5 – Tu) Dr. Niaz Khan, IUCN Country Dir.
Dr. RamSharma and Mr. Winterbottom, IPAC Country Dir.
Mr. Tapan K. Dey, Bangladesh Conservator of Forests
Bangladesh Bureau of Statistics Dr. Shaper Salim, Environmental
Policy Expert at WB
Collect Statistical Data
Conduct Interviews
4 (Jan 6 – We) Travels
Mr. Rafiquzzaman (Guide and Shrimp Farmer)
Continue Interviews
Travel to Khulna
5 (Jan 7 – Th) Mr. Shahidul Islam, Deputy Ranger FD Khulna
Mr. Nitya Nanda Das, District Fisheries Office
BRAC Hatchery in Doomoria Local Freshwater Shrimp Cultivators
Mr. Humayun Kabir, Dir. Bangladesh Frozen Foods Association
Conduct Interviews
6 (Jan 8 – Fr)* Visit edge of Sundarbans
Visit Brackish water shrimp farms and speak with farmers and villagers
Conduct Interviews
Observe Shrimp Production Observe Hatcheries
7 (Jan 9 – Sa)* Last interviews with villagers Return to Dhaka
8 (Jan 10 – Su) Bangladesh Bureau of Statistics
Mr. Shameem, Deputy Dir of Department of Environment
Follow up work in Dhaka
Additional Meetings
Collect Data from BBS 9 (Jan 11 – Mo) None Depart Dhaka
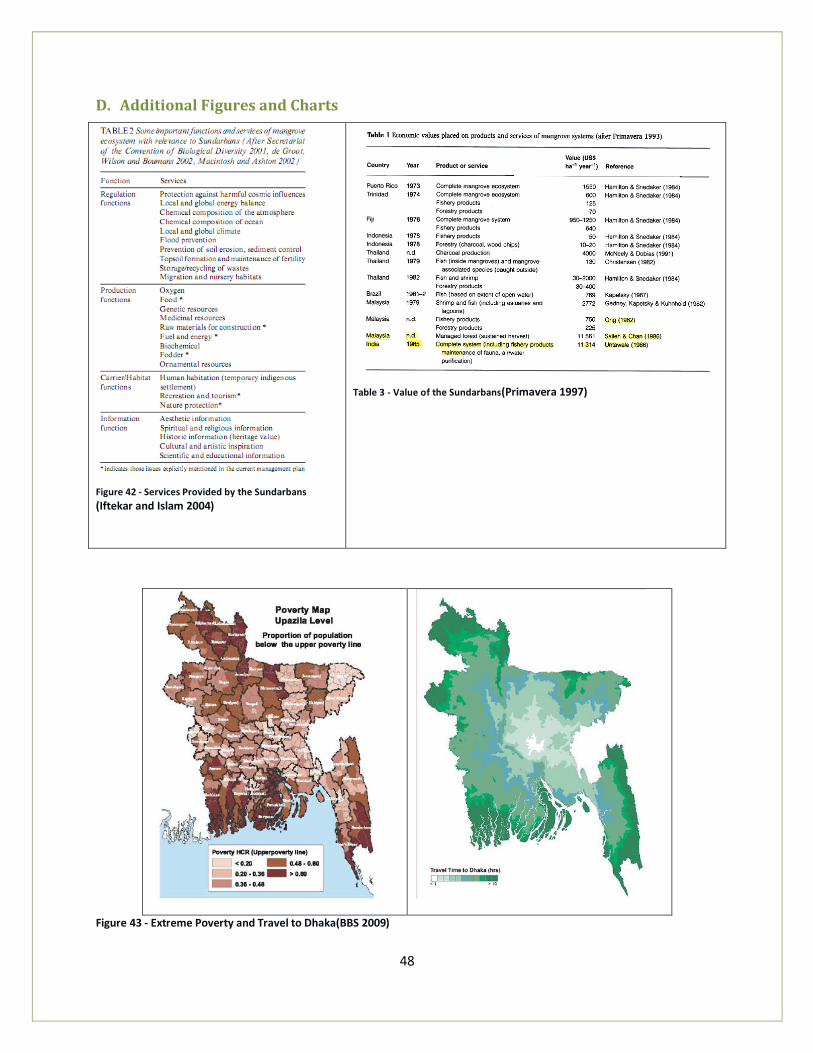
48
D. Additional Figures and Charts
Figure 42 - Services Provided by the Sundarbans
(Iftekar and Islam 2004)
Table 3 - Value of the Sundarbans(Primavera 1997)
Figure 43 - Extreme Poverty and Travel to Dhaka(BBS 2009)
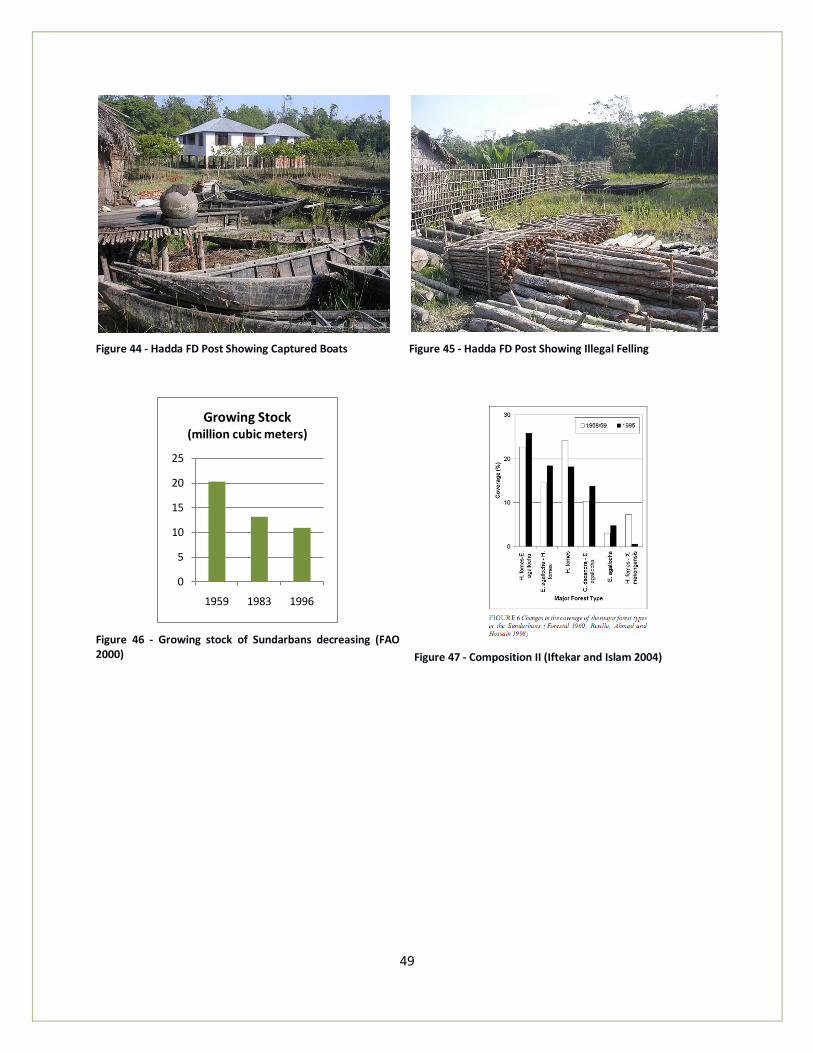
49
Figure 44 - Hadda FD Post Showing Captured Boats
Figure 45 - Hadda FD Post Showing Illegal Felling
Figure 46 - Growing stock of Sundarbans decreasing (FAO 2000)
Figure 47 - Composition II (Iftekar and Islam 2004)
0
5
10
15
20
25
1959 1983 1996
Growing Stock (million cubic meters)
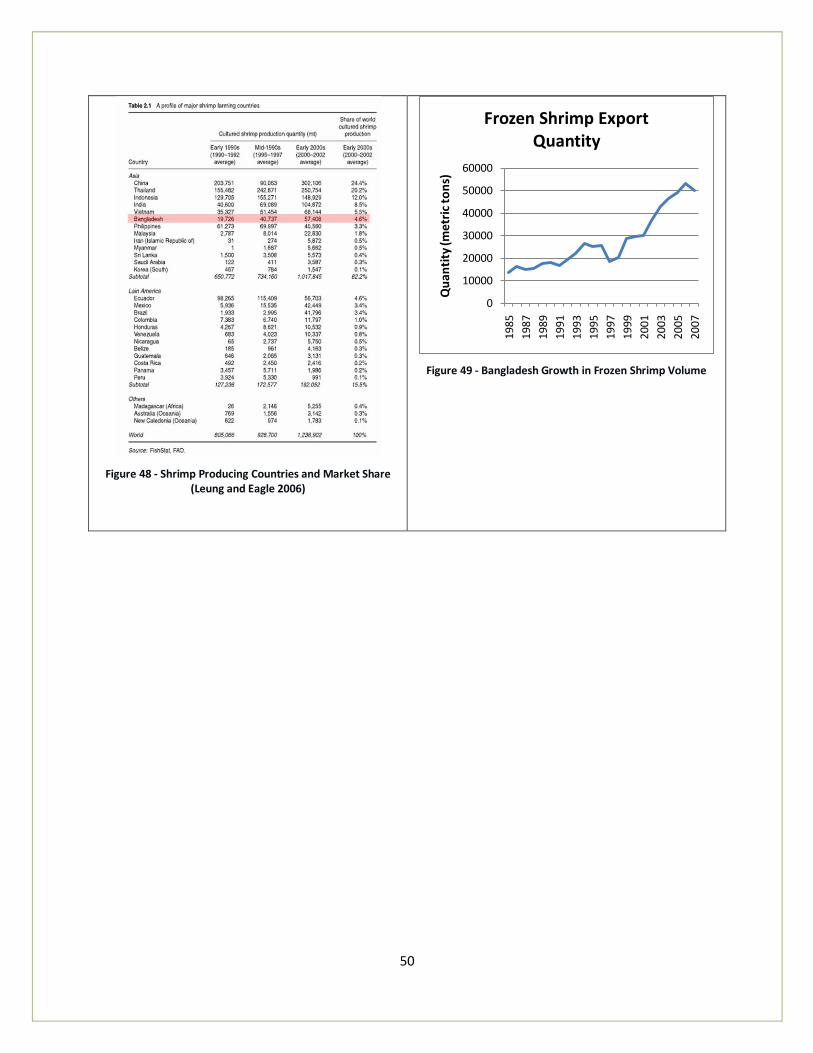
50
Figure 48 - Shrimp Producing Countries and Market Share (Leung and Eagle 2006)
Figure 49 - Bangladesh Growth in Frozen Shrimp Volume
0
10000
20000
30000
40000
50000
60000
1985
19
87
19
89
19
91
19
93
19
95
19
97
19
99
20
01
20
03
20
05
20
07
Qu
anti
ty (m
etr
ic t
on
s)
Frozen Shrimp Export Quantity
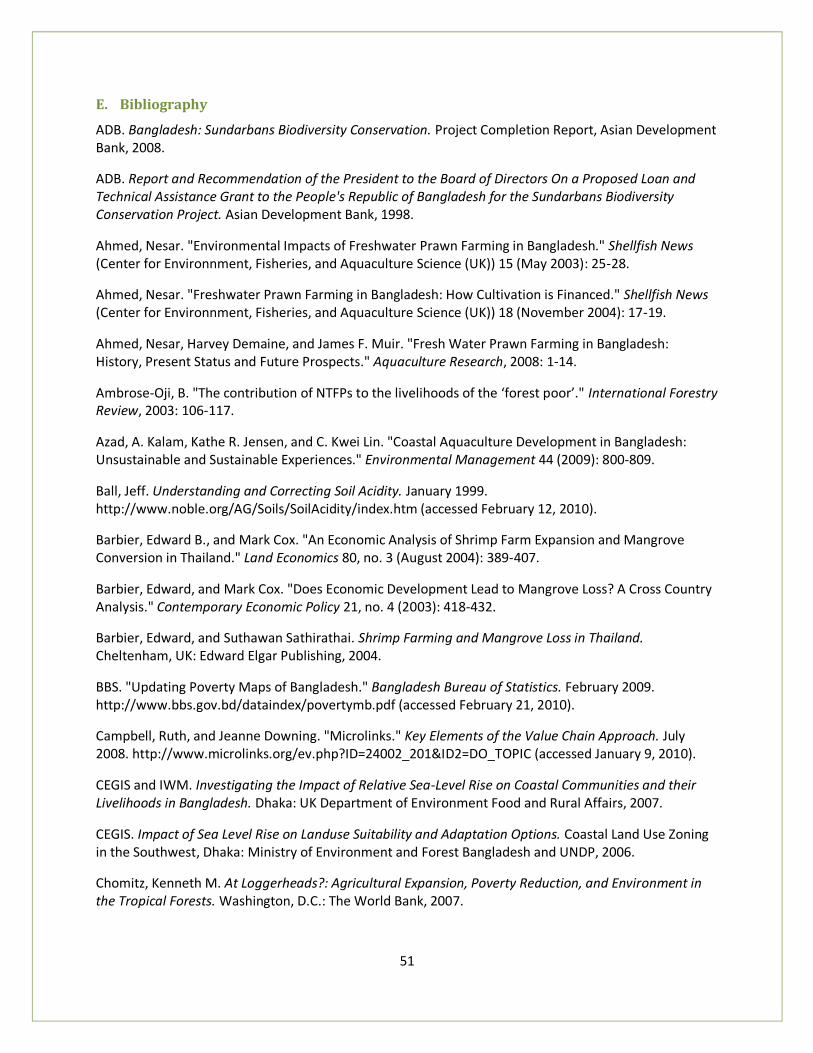
51
E. Bibliography
ADB. Bangladesh: Sundarbans Biodiversity Conservation. Project Completion Report, Asian Development Bank, 2008.
ADB. Report and Recommendation of the President to the Board of Directors On a Proposed Loan and Technical Assistance Grant to the People's Republic of Bangladesh for the Sundarbans Biodiversity Conservation Project. Asian Development Bank, 1998.
Ahmed, Nesar. "Environmental Impacts of Freshwater Prawn Farming in Bangladesh." Shellfish News (Center for Environnment, Fisheries, and Aquaculture Science (UK)) 15 (May 2003): 25-28.
Ahmed, Nesar. "Freshwater Prawn Farming in Bangladesh: How Cultivation is Financed." Shellfish News (Center for Environnment, Fisheries, and Aquaculture Science (UK)) 18 (November 2004): 17-19.
Ahmed, Nesar, Harvey Demaine, and James F. Muir. "Fresh Water Prawn Farming in Bangladesh: History, Present Status and Future Prospects." Aquaculture Research, 2008: 1-14.
Ambrose-Oji, B. "The contribution of NTFPs to the livelihoods of the ‘forest poor’." International Forestry Review, 2003: 106-117.
Azad, A. Kalam, Kathe R. Jensen, and C. Kwei Lin. "Coastal Aquaculture Development in Bangladesh: Unsustainable and Sustainable Experiences." Environmental Management 44 (2009): 800-809.
Ball, Jeff. Understanding and Correcting Soil Acidity. January 1999. http://www.noble.org/AG/Soils/SoilAcidity/index.htm (accessed February 12, 2010).
Barbier, Edward B., and Mark Cox. "An Economic Analysis of Shrimp Farm Expansion and Mangrove Conversion in Thailand." Land Economics 80, no. 3 (August 2004): 389-407.
Barbier, Edward, and Mark Cox. "Does Economic Development Lead to Mangrove Loss? A Cross Country Analysis." Contemporary Economic Policy 21, no. 4 (2003): 418-432.
Barbier, Edward, and Suthawan Sathirathai. Shrimp Farming and Mangrove Loss in Thailand. Cheltenham, UK: Edward Elgar Publishing, 2004.
BBS. "Updating Poverty Maps of Bangladesh." Bangladesh Bureau of Statistics. February 2009. http://www.bbs.gov.bd/dataindex/povertymb.pdf (accessed February 21, 2010).
Campbell, Ruth, and Jeanne Downing. "Microlinks." Key Elements of the Value Chain Approach. July 2008. http://www.microlinks.org/ev.php?ID=24002_201&ID2=DO_TOPIC (accessed January 9, 2010).
CEGIS and IWM. Investigating the Impact of Relative Sea-Level Rise on Coastal Communities and their Livelihoods in Bangladesh. Dhaka: UK Department of Environment Food and Rural Affairs, 2007.
CEGIS. Impact of Sea Level Rise on Landuse Suitability and Adaptation Options. Coastal Land Use Zoning in the Southwest, Dhaka: Ministry of Environment and Forest Bangladesh and UNDP, 2006.
Chomitz, Kenneth M. At Loggerheads?: Agricultural Expansion, Poverty Reduction, and Environment in the Tropical Forests. Washington, D.C.: The World Bank, 2007.
52
Chowdhury, Ruhul Mohaiman. "Governance through Protected Area Conservation Co-Management Committees: A Case Study at Lawachara National Park." In Connecting Communities and Conservation: Collaborative Management of Protected Areas in Bangladesh, by Jefferson Fox, Bryan Bushley, Wendy Miles and Shimona Quazi, 49-72. Dhaka: East-West Center and Nishorgo Program of Bangladesh Forest Department, 2008.
Dixon, John A., and Paul B. Sherman. "Economics of Protected Areas." Ambio 20, no. 2 (April 1991): 68-74.
DoE. Annual Report 2006. Dhaka: Bangladesh Ministry of Environment and Forests - Department of Environment , 2006.
EJF. Desert in the Delta. A Report on the Environmental, Human Rights and Social Impacts of Shrimp Production in Bangladesh, London: Environmental Justice Foundation, 2004.
EJF. Mangroves: Nature's Defense Against Tsunamis. A Report on the Impact of Mangrove Loss and Shrimp Fram Development on Coastal Defenses, London: Environmental Justice Foundation, 2006.
FAO. Forest Resources of Bangladesh - Country Report. Forest Resource Assessment Programme, Rome: FAO - Forestry Department, 2000.
FAO. Integrated Resource Development of the Sundarbans Reserve Forest Project - Finding and Recommendations. Final Project Report, Rome: Food and Agriculture Organization of the United Nations, 1998.
FAO. The World's Mangroves 1980 - 2005. FAO Forestry Paper 153, Rome: Food and Agricultural Organization of the UN, 2007.
Fulton, Murray, and Brent Hueth. "Cooperative Conversions, Failures and Restructurings: An Overview." Journal of Cooperatives 23 (2009): i-xi.
Godoy, Ricardo, Ruben Lubowski, and Anil Markandya. "A Method for the Economic Valuation of Non-Timber Tropical Forest Products." Economic Botany 47, no. 3 (1993): 220-133.
Hossain, Mahabub, Aldas Janaiah, and Muazzam Husain. "Hybrid Rice in Bangladesh." Economic and Political Weekly, 2003: 2517-2522.
Hossain, Md. Shahadat, Lin C. Kwei, and M. Zakir Hussain. "Goodbye Chakaria Sunderban: The Oldest Mangrove Forest." Tropical Coastal Zone Management-Asian Institute of Technology, 2001: 19-22.
Huda, Khawja Shamsul. "Co-Management Of Protected Areas In Bangladesh: A Strategy For Establishing An Institutional Framework." Nishorgo Web Site. 2006. http://www.nishorgo.org/files_pdf/ (accessed February 8, 2010).
Huda, N, and M. K. Roy. State of the Forests in Bangladesh State of Environment Report 1999. Dhaka: Dhaka: Forum of Environmental Journalists of Bangladesh, 1999.
Iftekar, M.S., and M.R. Islam. "Degeneration of Bangladesh's Sundarbans Mangroves: A Management Issue." International Forestry Review 6, no. 2 (2004): 123-135.
53
Iftekhar, M.S., and M.R. Islam. "Managing mangroves in Bangladesh: A strategy analysis." Journal of Coastal Conservation 10 (2004): 139-146.
Ito, Sanae. "From Rice to Prawns: Economic Transformation and Agrarian Structure in Rural Bangladesh." Journal of Peasant Studies 29, no. 2 (January 2002): 47-70.
Ito, Sanae. "Globalization and agrarian change: a case of freshwater prawn farming in Bangladesh." Journal of International Development 16, no. 7 (November 2004): 1003-1013.
Kabir, S. Humayun, interview by Author. Director - Bangladesh Frozen Foods Exporters Association Khulna, (January 7, 2010).
Kaplinsky, Raphael, and Mike Morris. "Handbook for Value Chain Research." 2001. http://asiandrivers.open.ac.uk/documents/Value_chain_Handbook_RKMM_Nov_2001.pdf (accessed December 28, 2009).
Karim, Quazi Md. Nurul. " Can Alternative Income Generating Activities Reduce Dependency on Protected Areas? Evidence from Teknaf Game Reserve." In Connecting Communities and Conservation: Collaborative Management of Protected Areas in Bangladesh, 191-208. Dhaka: East-West Center and Nishorgo Program of Bangladesh Forest Department, 2008.
Khan, Niaz Dr., interview by Soham Sen. Country Director - International Union for Conservation of Nature (IUCN) (January 5, 2010).
Knowler, D, and Others. "Assessing prospects for shrimp culture in the Indian Sundarbans: A combined simulation modelling and choice experiment approach." Marine Policy 33 (2009): 613–623.
Kongkeo, Hassanai, and F. Brian Davy. "Backyard Hatcheries and Small Scale Shrimp and Prawn Farming in Thailand ." In Success Stories in Asian Aquaculture, by Sena De Silva and F. Brian Davy, 67-83. Springer Netherlands, 2010.
Kundu, Ram Prasad, and Md. Sirajul Islam, interview by Soham Sen. Managers BRAC Prawn Hatcheries - Doomoria (January 7, 2010).
Leung, PingSun, and Carole Eagle. Shrimp Culture: Economics, Market, and Trade. Ames, IA: Blackwell Publishing, 2006.
Mabud, Mohammed A. "Bangladesh Population: Prospects and Problems." National Seminar on Bangladesh Population. Dhaka: Organization for Population and Poverty Alleviation, 2008. 1-14.
Mangrove Action Network. "Sustainable Alternatives to Shrimp Aquaculture." http://www.mangroveactionproject.org/issues/shrimp-farming/sustainable-alternatives-of-shrimp-aquaculture (accessed December 25, 2009).
Merrett, Neill. "Shrimp certification boost for Vietnam exports." Mangrove Action Network. May 29, 2007. http://www.mangroveactionproject.org/news/current_headlines/shrimp-certification-boost-for-vietnam-exports-1/ (accessed January 11, 2010).
Millat-e-Mustafa, Md. "A Review of Forest Policy Trends in Bangladesh." Policy Trend Report, 2002: 114-121.
54
Miththapala, Sriyanie. Mangroves. Colombo, Sri Lanka: International Union for Conservation of Nature and Natural Resources, 2008.
Moore, Mark H. Creating Public Value: Strategic Management in Government. Cambridge: Harvard University Press, 1995.
Muhammed, Nur, Masao Koike, and Farhana Haque. "Forest policy and sustainable forest management in Bangladesh; an analysis from national and international perspectives." New Forests 36, no. 2 (2008).
Pearce, David, and Anil Markandya. "Marginal Opportunity Cost as a Planning Concept in Natural Resource Management." The Annals of Regional Science 21, no. 3 (1987): 18-32.
Phillips, M.J., Lin C. Kwei, and M.C.M. Beveridge. "Shrimp Culture and the Environment: Lessons from the World's Most Rapidly Expanding Warmwater Aquaculture Sector." In Environment and Aquaculture in Developing Countries, by R.S.V Pulin, H. Rosenthal and J.L. Maclean, 171-197. Manila: International Center for Living Aquatic Resources Management (ICLARM), 1993.
Primavera, J. Honculada. "Socio-Economic Impacts of Shrimp Culture." Aquaculture Research 28 (1997): 815-827.
Rafiquzzaman, M., interview by Soham Sen. Bagda Farmer and Head of Khulna Bar Association (January 6, 2010).
Reardon, Thomas, C. Peter Timmer, Christopher Barrett, and Julio Berdegue. "The Rise of Supermarkets in Africa, Asia, and Latin America." American Journal of Agricultural Economics 85, no. 5 (December 2003): 1140-1146.
Salafsky, Nick, and Eva Wollenbert. "Linking Livelihoods and Conservation; A Conceptual Framework and Scale for Assessing the Integration of Human Needs and Biodiversity." World Development 28, no. 8 (2000): 1421-1438.
Samsuddoha, M. The Sundarban of Bangladesh. Salinity Threatens the World Heritage, COAST Trust, Dhaka: Equity and Justice Working Group, 2007.
Sarkar, Tapan. "Incidence of income taxation in Bangladesh." UN Public Administration Network. 2008. http://unpan1.un.org/intradoc/groups/public/documents/UNPAN/UNPAN014405.pdf (accessed December 21, 2009).
Shameem, Masud Iqbal Md., interview by Author. Deputy Director - Technical, Department of Environment (January 10, 2010).
Shiiva, V. "The damaging social and environment effects of aquaculture." Third World Resurgenc 59 (1995): 22-24.
Srinath, Krishna, Manpal Sridhar, and P.N.R. Kartha. "Group farming for sustainable aquaculture." Ocean and Coastal Management 43 (2000): 557-571.
The Economist. "The promise of a blue revolution." The Economist , August 7, 2003.
USAID/Bangladesh. "A Pro-Poor Analysis of The Shrimp Sector in Bangladesh." USAID Website. Keywords: Women in Development. 2006. http://www.usaid.gov/our_work/cross-
55
cutting_programs/wid/pubs/Bangladesh_Shrimp_Value_Chain_Feb_2006.pdf (accessed February 2, 2010).
USAID/Bangladesh. Conservation of Tropical Forests and Biological Diversity in Bangladesh. FAA 118/119 Analysis, USAID, 2005.
USAID/Bangladesh-IPAC. Work Planning Session With Department of Environment on Co-Management of Protected Areas. Summary Report, Dhaka: USAID, 2008.
Weiwei, Xu. "Bangladesh to Launch Agriculture Subsidy Card System ." Xinhua - China Radio International. February 11, 2010. http://english.cri.cn/6826/2010/02/11/1601s549781.htm (accessed February 14, 2010).
World Bank. Bangladesh: Country Environmental Analysis. Bangladesh Development Series: Paper 12, Dhaka: The World Bank, 2006.
World Bank. High-value Agriculture in Bangladesh: An Assessment of Agro-business Opportunities and Constraints. Bangladesh Development Series #21, Sustainable Development Department, Agricultural and Rural Development Unit, South Asia Region, Dhaka: The World Bank, 2008.
World Bank. The Sundarbans in Bangladesh (Forthcoming). Background Paper, The World Bank, 2009.