Embed Size (px)
Citation preview
Conservation of natural resources for sustainable Agriculture
what you should know about…
Farm Management and Economics aspects of Conservation Agriculture
Introduction
Production and input use in conservation agriculture
Farm management and conservation agriculture
Farm planning - gross margin
Farm planning - partial budgeting
Farm planning - cash flow
Risk and uncertainty
Economic Benefit
INTRODUCTION Farmers are continually exposed to new information that affects how their farms are organised, what commodities are produced, how they are produced, what inputs should be used, how much of each input should be used, how to finance the business, and how and when to market their production.
Small farmers have traditionally been producers of staple foods and originally, they aimed to supply their own food needs and some have managed to produce surpluses for sale. Today, this sector is highly heterogeneous, differentiating according to well-being level and different grades of orientation towards the market. Moreover, small farmers has traditionally lacked a business and marketing orientation because effort was concentrated on traditional production, which is characterised by a rural market supply that, usually do not respond to market demands.
This Training Manual is a tool aimed at supporting small farmers in the adoption and/or adaptation of Conservation Agriculture techniques through the improvement of farm management and marketing techniques. By doing so, farmers can be better prepared to detect opportunities for traditional products in rural economies by adopting a business approach which includes formal agronomic, commercial and economic evaluations for potential market options. In this specific case, the Training Manual uses the diversification of agricultural production through the use of Conservation Agriculture techniques.
Conservation Agriculture techniques aims to conserve, improve and make more efficient use of natural resources through integrated management of available soil, water and biological resources combined with external inputs. It contributes to environmental conservation as well as to enhanced and sustained agricultural production and can be referred to as resource-efficient/ resource effective agriculture.
What is Conservation Agriculture?
Changes in the farmers' behaviour maybe due to prices, weather, government policy and programmes, exports, international events, and other factors. In any case, price changes are a major source of risk that exists in agricultural production.
New technology provides a constant source of information on new agricultural techniques, new seeds variety, new biological or chemicals agents for weed control, etc. Farmers cannot simply memorise the answers, but they must learn to continually rethink their decisions as environmental and economic condition change.
Conservation agriculture is an alternative to traditional land use and management. It is a practical method to reduce soil erosion, restore organic matter and conserve soil moisture and soil fertility. The method is based on the following:1
a) Maintaining a permanent or semi-permanent organic soil cover to protect the soil physically from sun, rain and wind and to feed soil biota,
b) No-Tillage (or Minimum Tillage): the idea is based on the elimination of mechanical tillage in order no to disturb soil micro-organisms and soil fauna activities.
c) Crop Rotation: a varied crop rotation is also important to avoid disease and pest problems.
1 Extracted from Conservation Agriculture web page (http://www.fao.org/ag/ags/AGSE/Main.htm)
Rather than incorporating biomass such as green manure crops, cover crops or crop residues, the dead biomass, left on the soil surface, serves as physical protection of the soil surface and as substrate for the soil fauna. In this way, mineralization is reduced and suitable soil levels of organic matter are built up and maintained.
When adopting conservation agriculture, farmers usually have in mind some technical aspects such as erosion, re-seedling, lost of soil fertility and productivity, extensive use of chemicals, etc. These aspects are simply steps of farm management and economic reasoning, because at the end of the day farmers are effectively loosing money. In several situations, farmers can choose between two solutions:
to adopt a stop-gap measure (e.g. wind-breaks, contours, etc.); or
to choose a more radical and definitive measure. In this case, besides making changes the farm's structure, farmers will have to change the way of "thinking agriculture".
Unfortunately, short-term solutions and immediate benefits always attract farmers and the full technical and economic advantages of conservation agriculture can be seen only in the medium- long-term run, when its principles (no-tillage, permanent cover crop and crop rotation) are well established within the farming system.
In fact, if the two systems (conventional and conservation agriculture) are applied in two plots with the same agro-ecological and fertility conditions, no great differences in productivity during the first years are to be expected. However, after been cultivating the same crops in the same areas for several years, the differences between the two systems became more evident.
Along with this "way of thinking agriculture", enough technical and agronomic factors that could positively influence the farmers in the adoption of Conservation Agriculture principles, have been found. It is, however, important to demonstrate to farmers that the technical and agronomic aspects are directly related to the management and economic ones and, therefore, any technical and agronomic improvement obtained by using the Conservation Agriculture principles need to be quantified in monetary and economic terms.
In spite of the obstacles related to short-term solutions, several reasons may lead towards a change from conventional to conservation agriculture in the production system. The most convincing one is generated by the farm management and economic point of view. With conservation agriculture, farmers could have:
Some short-term benefits in saving variable costs, especially related to reduced machinery use and labour;
Several long-term benefits in saving fixed costs, as the less investment is necessary in machinery and equipment as well as broad environmental benefits.
Of all the aspects embracing conservation agriculture, farm management and economics are probably the most important as well as the least developed aspects. The economic aspects would determine whether or not a farmer would adopt the new technology. Some farmers may be easier convinced when they see the calculations on paper. This means that extension workers and facilitators should feel comfortable when they analyse how the economic situation would change when technological changes are introduced and adopted by farmers.
Before analysing the farm management and economic aspects of Conservation Agriculture, it is necessary to divide the adoption/adaptation process of into four theoretical phases. This theoretical division2, represented in Fig. 1, would facilitate the reasoning when analysing the farm activities and the impacts of new technologies in the production process.
2 Prepared by Walter de Oliveira and John Dixon
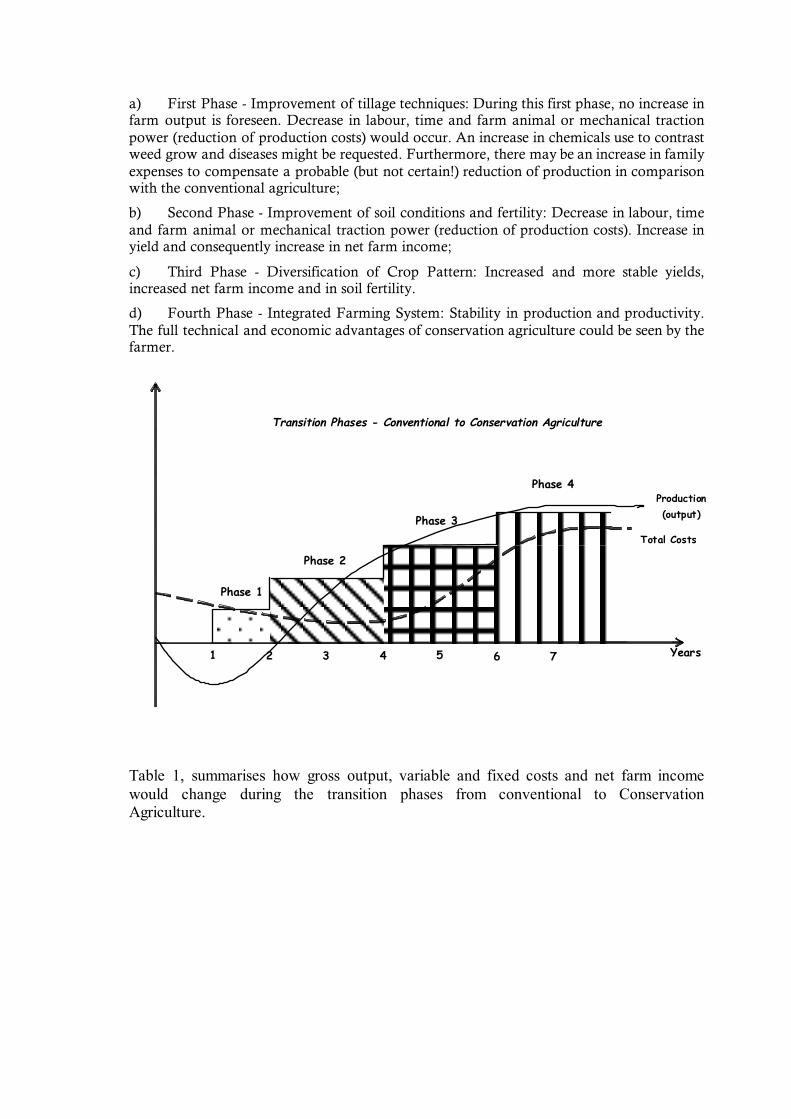
a) First Phase - Improvement of tillage techniques: During this first phase, no increase in farm output is foreseen. Decrease in labour, time and farm animal or mechanical traction power (reduction of production costs) would occur. An increase in chemicals use to contrast weed grow and diseases might be requested. Furthermore, there may be an increase in family expenses to compensate a probable (but not certain!) reduction of production in comparison with the conventional agriculture;
b) Second Phase - Improvement of soil conditions and fertility: Decrease in labour, time and farm animal or mechanical traction power (reduction of production costs). Increase in yield and consequently increase in net farm income;
c) Third Phase - Diversification of Crop Pattern: Increased and more stable yields, increased net farm income and in soil fertility.
d) Fourth Phase - Integrated Farming System: Stability in production and productivity. The full technical and economic advantages of conservation agriculture could be seen by the farmer.
�����������������������������������
������������������
����������������������������������������
Transition Phases - Conventional to Conservation Agriculture
Years1 32 4 5 6 7
Phase 1
Phase 2
Phase 3
Phase 4
Total Costs
Production(output)
Table 1, summarises how gross output, variable and fixed costs and net farm income would change during the transition phases from conventional to Conservation Agriculture.
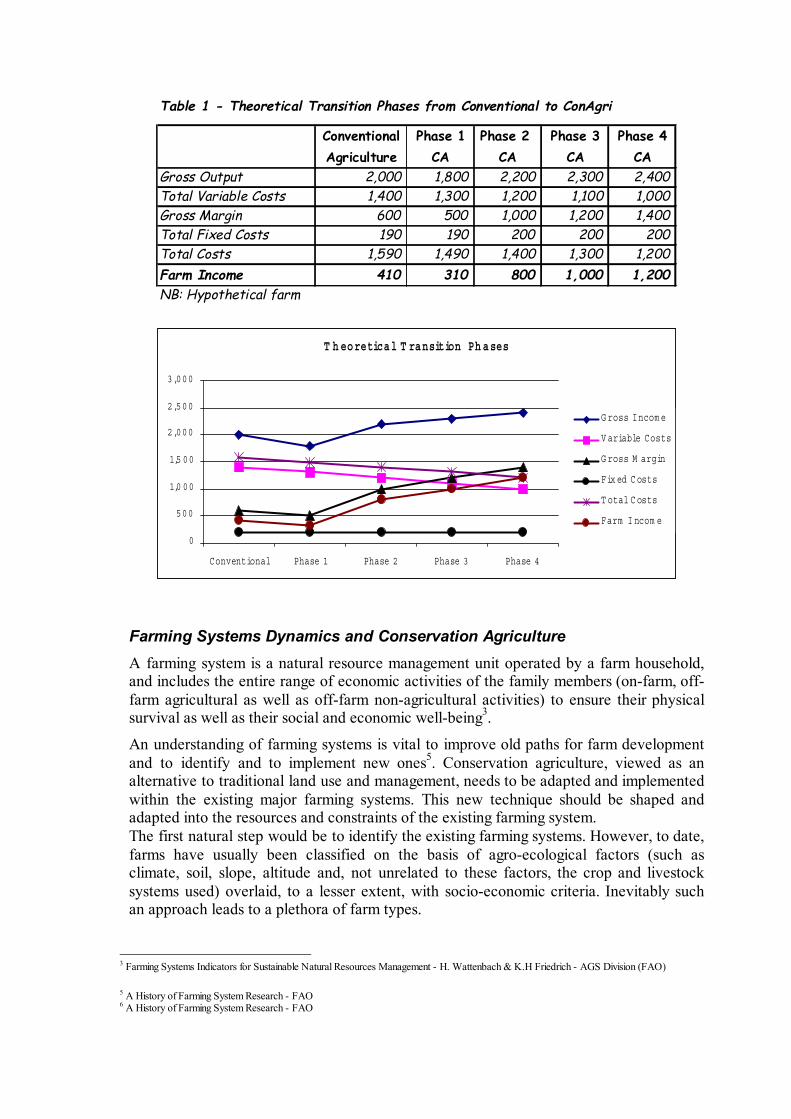
Table 1 - Theoretical Transition Phases from Conventional to ConAgri
Conventional Phase 1 Phase 2 Phase 3 Phase 4Agriculture CA CA CA CA
Gross Output 2,000 1,800 2,200 2,300 2,400Total Variable Costs 1,400 1,300 1,200 1,100 1,000Gross Margin 600 500 1,000 1,200 1,400Total Fixed Costs 190 190 200 200 200Total Costs 1,590 1,490 1,400 1,300 1,200Farm Income 410 310 800 1,000 1,200NB: Hypothetical farm
T h eoretical T ransition Ph ases
0
500
1,0 00
1,5 00
2,000
2,500
3,000
Conventional Phase 1 Phase 2 Phase 3 Phase 4
G ross Incom e
V ariable Costs
G ross M argin
Fix ed C osts
T otal C osts
Farm I ncom e
Farming Systems Dynamics and Conservation Agriculture A farming system is a natural resource management unit operated by a farm household, and includes the entire range of economic activities of the family members (on-farm, off-farm agricultural as well as off-farm non-agricultural activities) to ensure their physical survival as well as their social and economic well-being3.
An understanding of farming systems is vital to improve old paths for farm development and to identify and to implement new ones5. Conservation agriculture, viewed as an alternative to traditional land use and management, needs to be adapted and implemented within the existing major farming systems. This new technique should be shaped and adapted into the resources and constraints of the existing farming system. The first natural step would be to identify the existing farming systems. However, to date, farms have usually been classified on the basis of agro-ecological factors (such as climate, soil, slope, altitude and, not unrelated to these factors, the crop and livestock systems used) overlaid, to a lesser extent, with socio-economic criteria. Inevitably such an approach leads to a plethora of farm types.
3 Farming Systems Indicators for Sustainable Natural Resources Management - H. Wattenbach & K.H Friedrich - AGS Division (FAO) 5 A History of Farming System Research - FAO 6 A History of Farming System Research - FAO
A different approach, which emphasizes the farm-system structure from a farm management and farm-household perspective, is proposed here. This approach classifies the different farming systems based on:
1) the main purpose of the farm, 2) the degree of independence and 3) the “size” of the farm.
Under this approach and from a structural viewpoint, there are basically six major types of farm system to be found around the developing world with dozens of subtypes constituting a continuum of farm types between the extremes of a totally subsistence to a totally commercial orientation7:
Farm types The six basic farm types are:
Type 1 Small subsistence-oriented family farms. Type 2 Small semi-subsistence or part-commercial family farms, usually of one half
to two hectares, but area is not a good criterion: the same basic structure can be found on much larger 20- to 30-hectare farms.
Type 3 Small independent specialized family farms. Type 4 Small dependent specialized family farms, often with the family as tenants. Type 5 Large commercial family farms, usually specialized and operated along
modified estate lines. Type 6 Commercial estates, usually mono-crop and with hired management and
absentee ownership. .
7 Farm Management for Asia: a Systems Approach. (FAO Farm Systems Management Series - 13) Douglas J. McConnell & John L. Dillon
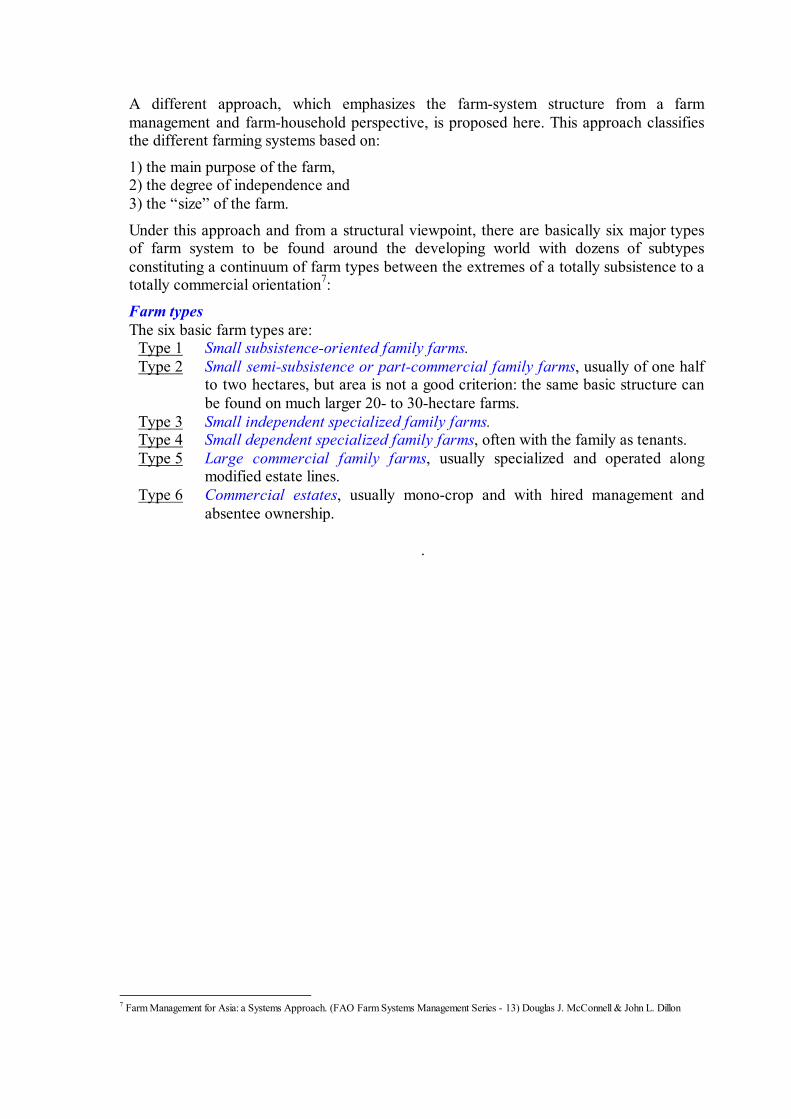
PRODUCTION AND INPUT USE IN CONSERVATION AGRICULTURE Farming is an activity in which resources such as seeds, feedstuff, fertilisers and labour, are used to produce valuable products such as wheat, eggs, meat, cotton, vegetables and fruits. The adoption of conservation agriculture should be seen in this context. The resources used in the farm are called input and the products obtained are called output. The farmer must run his farm as an economic production unit, so his aim must be to produce output of which, the total value of outputs exceeds the total value of the inputs. Doing so, he/she will have a profit. Of course, if the total value of the inputs is higher than the total value of outputs there will be a loss.
The total value of the output is called gross output and the total value of all input is called total costs.
In the same way:
Here we only consider input and output from the farm. If a farmer buys a bicycle, which is only going to be used privately, it will not be considered as farm input. But products produced on the farm and consumed by the farmer’s family will still be farm output because they could have been sold. Production and yield
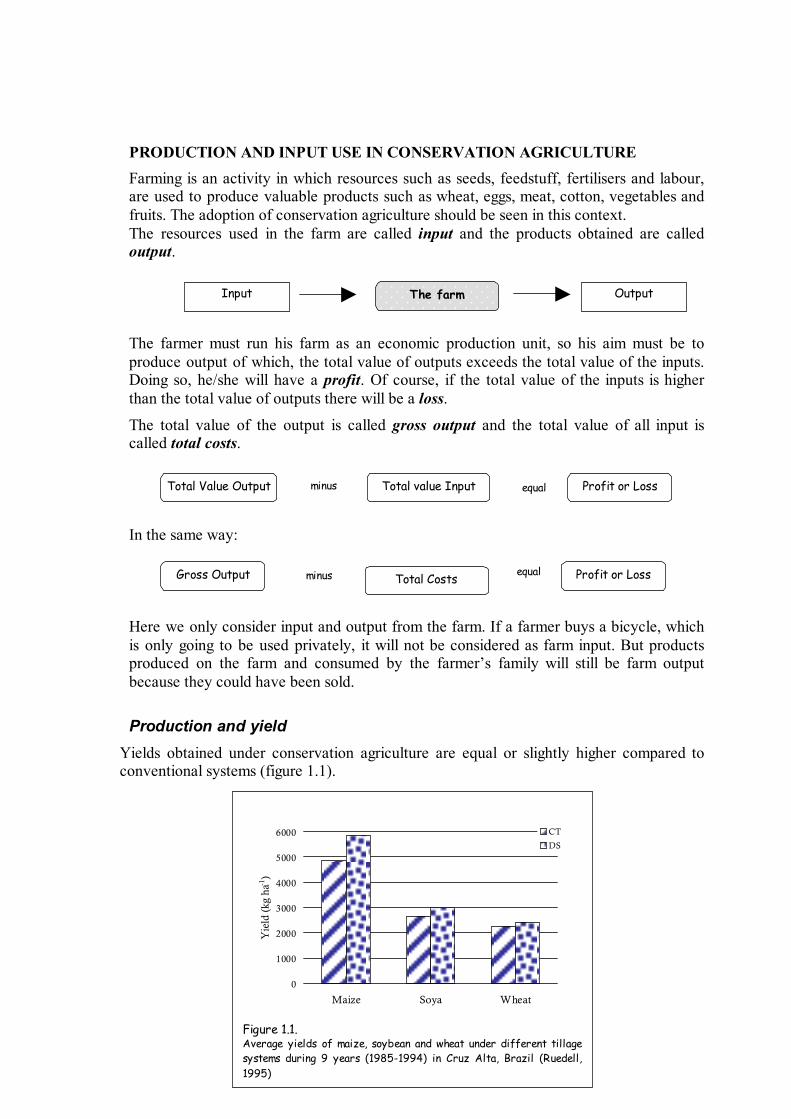
Yields obtained under conservation agriculture are equal or slightly higher compared to conventional systems (figure 1.1).
Input
Gross Output
Output The farm
Total value Input equal Profit or Loss minus Total Value Output
Total Costs minus equal Profit or Loss
������������������������
������ ��� ���
0
1000
2000
3000
4000
5000
6000
Maize Soya Wheat
Yie
ld (
kg h
a-1)
���CT
���DS
Figure 1.1. Average yields of maize, soybean and wheat under different tillage systems during 9 years (1985-1994) in Cruz Alta, Brazil (Ruedell, 1995)
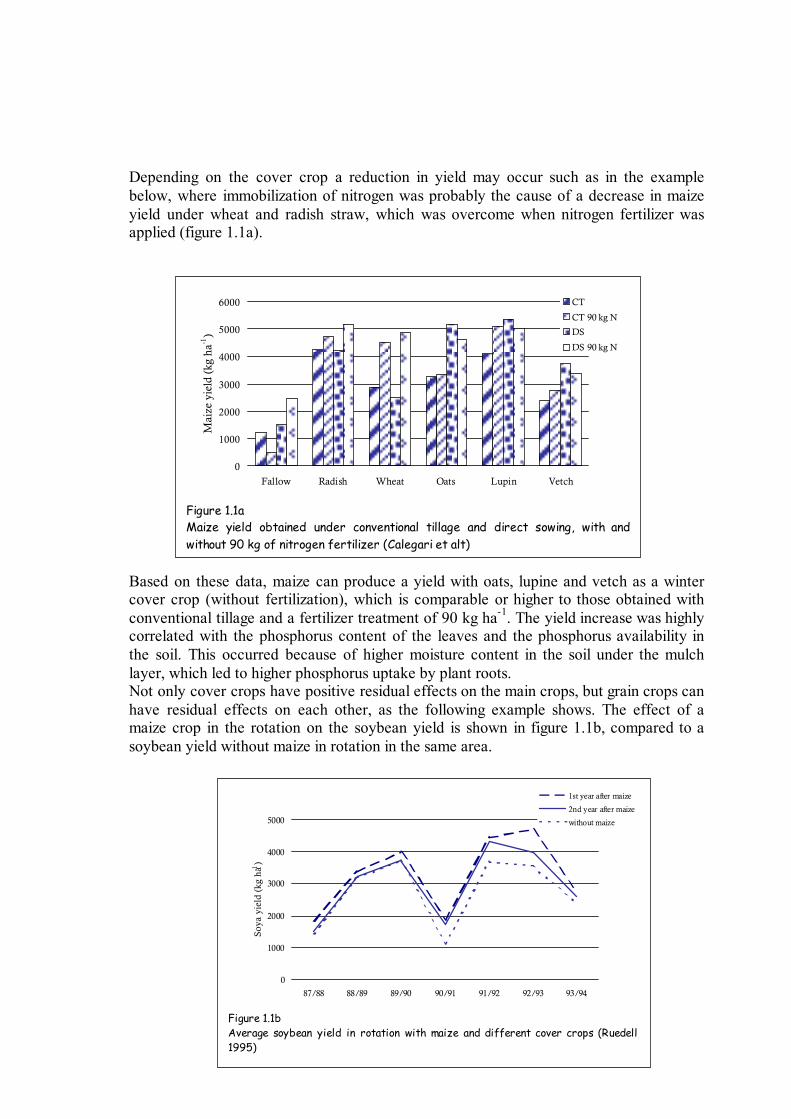
Depending on the cover crop a reduction in yield may occur such as in the example below, where immobilization of nitrogen was probably the cause of a decrease in maize yield under wheat and radish straw, which was overcome when nitrogen fertilizer was applied (figure 1.1a).
Based on these data, maize can produce a yield with oats, lupine and vetch as a winter cover crop (without fertilization), which is comparable or higher to those obtained with conventional tillage and a fertilizer treatment of 90 kg ha-1. The yield increase was highly correlated with the phosphorus content of the leaves and the phosphorus availability in the soil. This occurred because of higher moisture content in the soil under the mulch layer, which led to higher phosphorus uptake by plant roots. Not only cover crops have positive residual effects on the main crops, but grain crops can have residual effects on each other, as the following example shows. The effect of a maize crop in the rotation on the soybean yield is shown in figure 1.1b, compared to a soybean yield without maize in rotation in the same area.
������������� ���������������������
����������
�����������������
������
������
���������
��������������
������
���������
0
1000
2000
3000
4000
5000
6000
Fallow Radish Wheat Oats Lupin Vetch
Mai
ze y
ield
(kg
ha-1
)����
CT
����CT 90 kg N
����DS
����DS 90 kg N
Figure 1.1a Maize yield obtained under conventional tillage and direct sowing, with andwithout 90 kg of nitrogen fertilizer (Calegari et alt)
0
1000
2000
3000
4000
5000
87/88 88/89 89/90 90/91 91/92 92/93 93/94
Soya
yie
ld (
kg h
a-1)
1st year after maize
2nd year after maize
without maize
Figure 1.1b Average soybean yield in rotation with maize and different cover crops (Ruedell,1995)
Crop yields under conservation agriculture are less variable through the stabilizing effects of favourable conditions of soil properties and micro-climate. Improvements in crop growth and vigour are due to direct and indirect effects. Direct effects are due to improvements in nutrient and water content, as indirect effects are due to favourable rooting environment and possible weed suppression and reduction in pests and diseases.
Key Management Changes
As mentioned before, when adopting Conservation Agriculture techniques, farmers do so in response to changes in their "way of thinking agriculture". They have in mind both technical (e.g. erosion, lost of soil fertility re-seeding, extensive use of chemicals, etc.) and economic aspects (increasing profit by reducing the use of labour, fertiliser and chemicals and by increasing yield), which are directly influenced by the technical aspects.
Farmers, in managing their farms, would need to develop an understanding of its environment in order to tailor strategies to its strengths and needs. The major changing environments to which farmers must adapt are:
the physical environment in relation to resource use, depletion and pollution; the social environment in relation to socially oriented special-interest groups; the information and communication environment with its exponential growth in technology, coverage and accessibility and the political environment with its increasingly better-informed constituency demanding transparency and accountability.
Technological Changes
Technological change is an improvement in the state of knowledge such that production possibilities are enhanced. The chief source of technological changes to which farmers might have access are: - “Learning by using” - Private and public research and development: - Imported research and development:
Because of the opportunities for increased outputs, reduction in production costs and higher income levels which a technological change can offer, it is important to take into consideration the process of adoption/adaptation and diffusion of technical innovations. The economic potential of conservation agriculture, in terms of costs of production, profit, yield, soil conservation, etc. is very important. However, unfamiliarity with conservation agriculture practices might make the initial impact on yield and input usage uncertain.
It should not be forgotten that, since the adoption/adaptation decision must take place in an uncertain environment (vagaries of nature), the farmer’s attitude to risk and in particular the degree of risk aversion must also be taken into consideration.
Moreover, the potential conservation agriculture adopter/adapter may be confronted with constraints in terms of purchasing power, of access to credit and information, and poor communications links with product and input markets. IN this regards, the availability of inputs in the quantity and at the time required may prove to be important considerations in the adoption/adaptation process.
Managing Changes in Input Use
In principle, the cost of some inputs (e.g. for seed purchase) should not differ in conservation agriculture compared to conventional tillage. However, differences are often observed and can be explained through:
in conservation agriculture less seed is needed because the losses in the field are reduced;
sometimes more seed is needed because the plant density in conservation agriculture is optimal and might be higher than under traditional dibble stick planting;
in conservation agriculture cover crops play an important role and if the seeds for cover crops are not produced on-farm, the farmer needs to buy them elsewhere.
As with the cost of seeds, fertilizer costs are considered to be the same under conservation agriculture compared to conventional tillage. However, as the organic matter of the soil increases under conservation agriculture, so will the moisture content of the soil. Both aspects lead to an increased fertilizer efficiency, which will reduce fertilizer need in the long run.
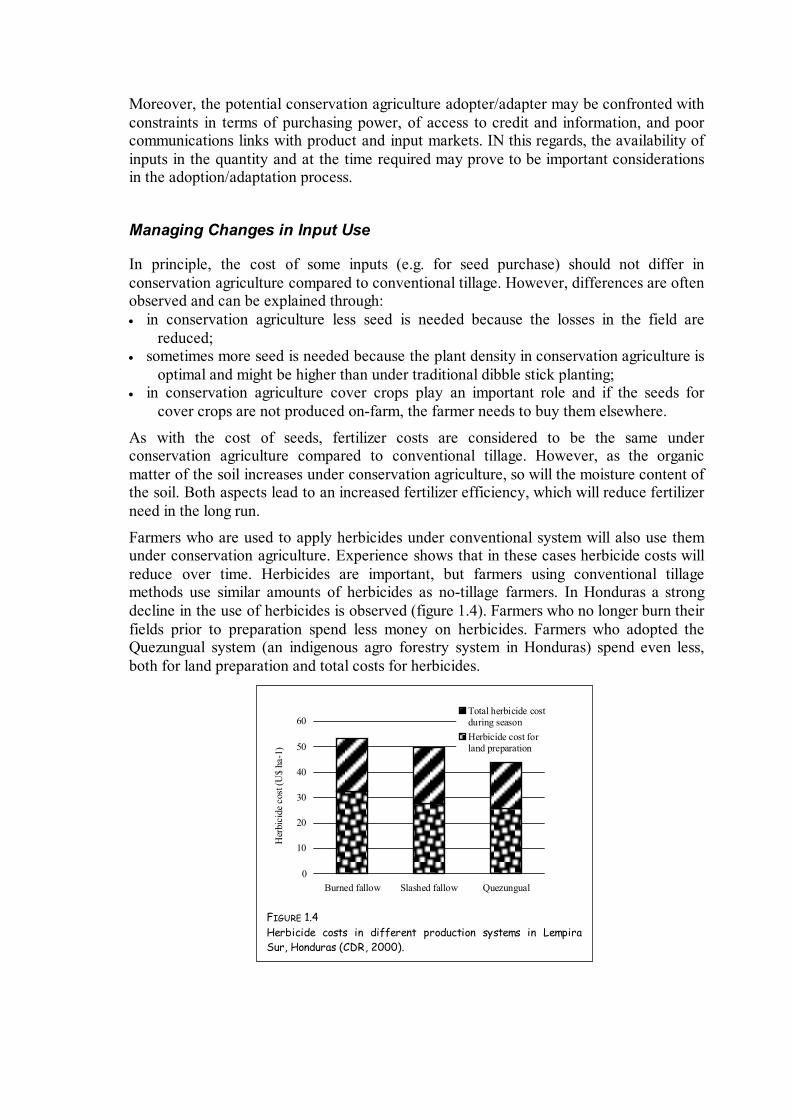
Farmers who are used to apply herbicides under conventional system will also use them under conservation agriculture. Experience shows that in these cases herbicide costs will reduce over time. Herbicides are important, but farmers using conventional tillage methods use similar amounts of herbicides as no-tillage farmers. In Honduras a strong decline in the use of herbicides is observed (figure 1.4). Farmers who no longer burn their fields prior to preparation spend less money on herbicides. Farmers who adopted the Quezungual system (an indigenous agro forestry system in Honduras) spend even less, both for land preparation and total costs for herbicides.
������
����������������
��� ��������0
10
20
30
40
50
60
Burned fallow Slashed fallow Quezungual
Her
bici
de c
ost (
U$
ha-1
)
���Total herbicide costduring season
������Herbicide cost for
land preparation
FIGURE 1.4 Herbicide costs in different production systems in Lempira Sur, Honduras (CDR, 2000).
Those farmers, who have never used herbicides because they are simply not available or very expensive, are likely to adopt alternative practices for weed control, like the use of knife rollers. When conservation agriculture is practised correctly, pest and disease incidence will be less compared to conventional tillage due to crop rotation and the use of cover crops. Consequently, the cost for treatment will also be reduced.
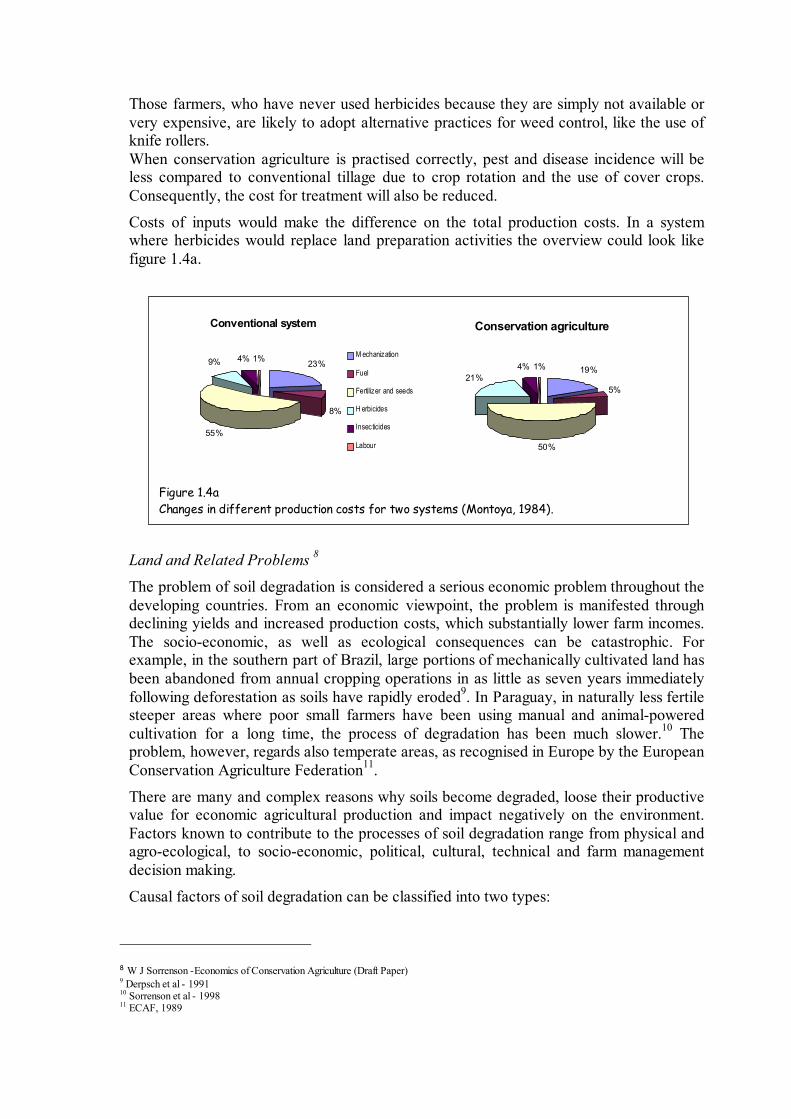
Costs of inputs would make the difference on the total production costs. In a system where herbicides would replace land preparation activities the overview could look like figure 1.4a.
Land and Related Problems 8
The problem of soil degradation is considered a serious economic problem throughout the developing countries. From an economic viewpoint, the problem is manifested through declining yields and increased production costs, which substantially lower farm incomes. The socio-economic, as well as ecological consequences can be catastrophic. For example, in the southern part of Brazil, large portions of mechanically cultivated land has been abandoned from annual cropping operations in as little as seven years immediately following deforestation as soils have rapidly eroded9. In Paraguay, in naturally less fertile steeper areas where poor small farmers have been using manual and animal-powered cultivation for a long time, the process of degradation has been much slower.10 The problem, however, regards also temperate areas, as recognised in Europe by the European Conservation Agriculture Federation11.
There are many and complex reasons why soils become degraded, loose their productive value for economic agricultural production and impact negatively on the environment. Factors known to contribute to the processes of soil degradation range from physical and agro-ecological, to socio-economic, political, cultural, technical and farm management decision making.
Causal factors of soil degradation can be classified into two types:
8 W J Sorrenson -Economics of Conservation Agriculture (Draft Paper) 9 Derpsch et al - 1991 10 Sorrenson et al - 1998 11 ECAF, 1989
Conventional system
23%
8%
55%
9% 4% 1% M echanization
Fuel
Fertilizer and seeds
H erbicides
Insecticides
Labour
Conservation agriculture
19%
5%
50%
21%4% 1%
Figure 1.4a Changes in different production costs for two systems (Montoya, 1984).
1) Physical factors: which are not under direct human control which are often influenced by the climate, and
2) Human factors: those caused by direct human intervention.
Although the extent of soil degradation tends to be site specific, the regions where soils degrade the most rapidly generally have a number of common characteristics. These commonly include:
frequent torrential rainfall; steep slopes; reduced vegetative cover through increased agriculture; abundance of poor soils highly susceptible to erosion; rainy periods out-of-phase with periods of vegetative cover; reduction in extensive sustainable agriculture;
Probably the most significant cause of soil degradation has been soil erosion by water and wind, although soil erosion is not the only cause of soil degradation. A major determinant of soil quality is the amount of organic matter contained in the soil and this is known to vary rapidly to changes in soil management. More intensive agriculture methods, especially using modern techniques of cultivation and cropping, cause a decrease in soil organic matter content.
Besides direct impacts of soil erosion, a number of off-site affects also arise. Examples are siltation12, contamination of groundwater by sediment and chemicals, declining groundwater aquifers, deposition of eroded material in river beds, lakes or artificial dams and reservoirs. Often soil erosion causes abandonment of cropland, commonly followed by overgrazing, which in turn provokes more severe erosion. Sometimes conventional soil conservation measures inadvertently worsen the situation. In Southern Brazil and in some Mediterranean regions for example, it is commonly observed that soil erosion has increased spectacularly following the breakdown of terraces which were constructed to reduce soil erosion occurring in conventional annual cropping systems. Labour The positive impact of conservation agriculture on the distribution of labour during the production cycle and, even more important, the reduction in labour requirement is the main reason for the adoption of Conservation Agriculture n Latin America, especially for farmers who rely fully on family labour.
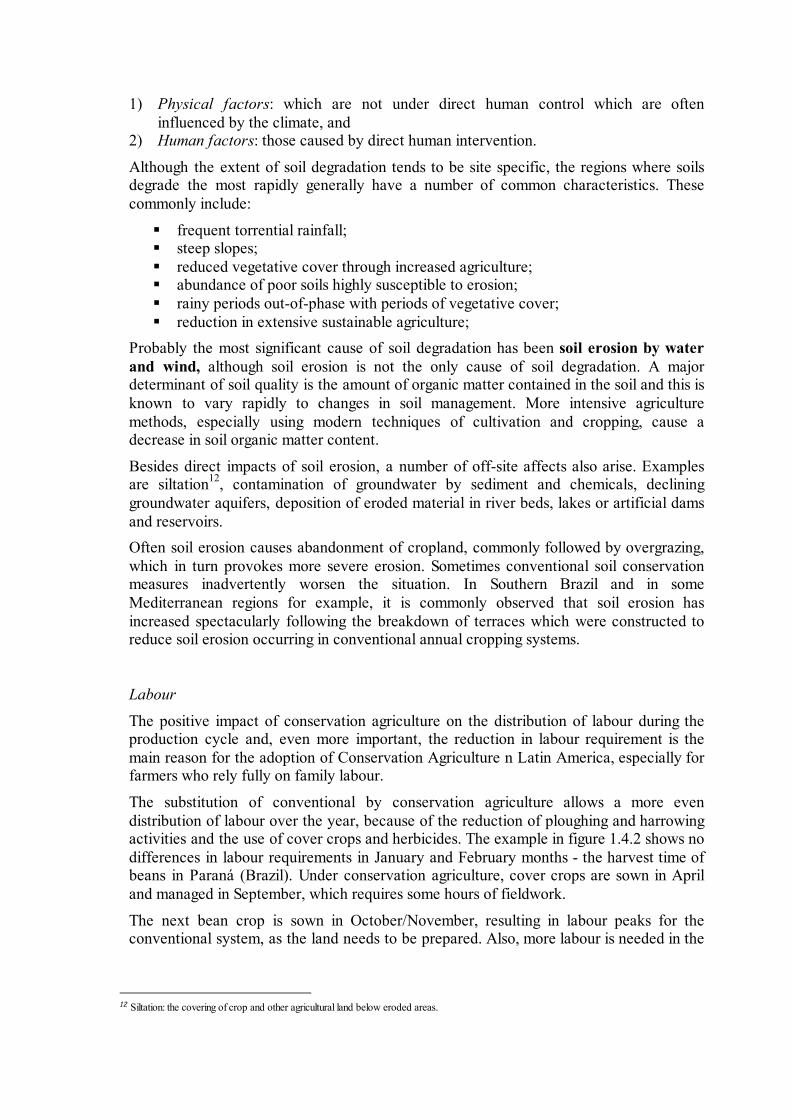
The substitution of conventional by conservation agriculture allows a more even distribution of labour over the year, because of the reduction of ploughing and harrowing activities and the use of cover crops and herbicides. The example in figure 1.4.2 shows no differences in labour requirements in January and February months - the harvest time of beans in Paraná (Brazil). Under conservation agriculture, cover crops are sown in April and managed in September, which requires some hours of fieldwork.
The next bean crop is sown in October/November, resulting in labour peaks for the conventional system, as the land needs to be prepared. Also, more labour is needed in the
12 Siltation: the covering of crop and other agricultural land below eroded areas.
conventional system for weeding activities in December. The total labour saved was approximately 50 hours per hectare.
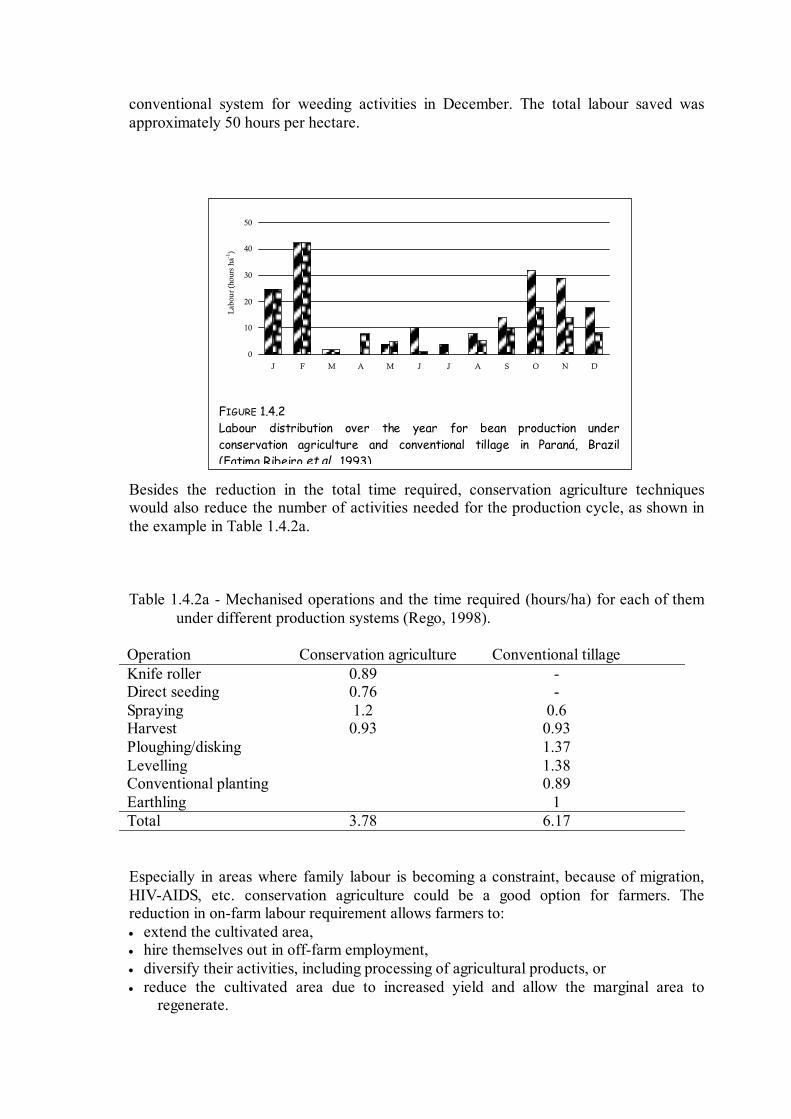
Besides the reduction in the total time required, conservation agriculture techniques would also reduce the number of activities needed for the production cycle, as shown in the example in Table 1.4.2a.
Table 1.4.2a - Mechanised operations and the time required (hours/ha) for each of them under different production systems (Rego, 1998).
Operation Conservation agriculture Conventional tillage Knife roller 0.89 - Direct seeding 0.76 - Spraying 1.2 0.6 Harvest 0.93 0.93 Ploughing/disking 1.37 Levelling 1.38 Conventional planting 0.89 Earthling 1 Total 3.78 6.17
Especially in areas where family labour is becoming a constraint, because of migration, HIV-AIDS, etc. conservation agriculture could be a good option for farmers. The reduction in on-farm labour requirement allows farmers to:
extend the cultivated area, hire themselves out in off-farm employment, diversify their activities, including processing of agricultural products, or reduce the cultivated area due to increased yield and allow the marginal area to
regenerate.
��������������������
��������
��������������
��������������
��
��������������
�����������������
��������
����������������
����
0
10
20
30
40
50
J F M A M J J A S O N D
Lab
our
(hou
rs h
a-1)
FIGURE 1.4.2 Labour distribution over the year for bean production under conservation agriculture and conventional tillage in Paraná, Brazil (Fatima Ribeiro et al 1993)
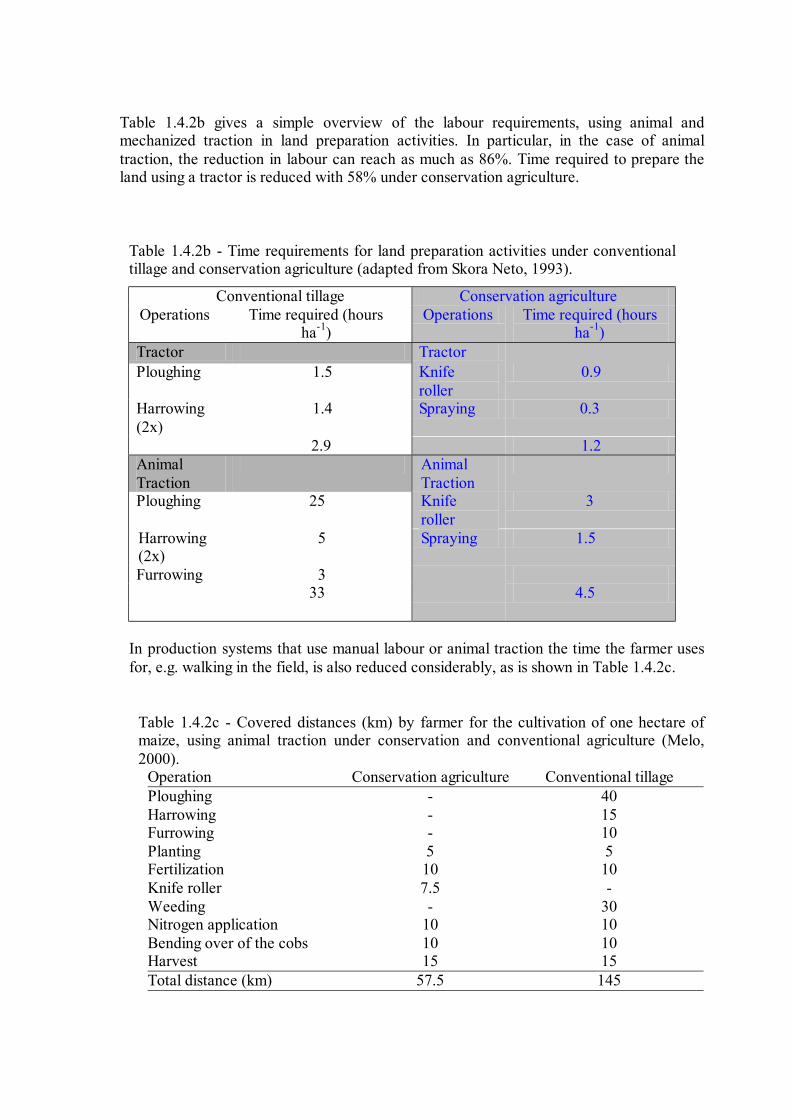
Table 1.4.2b gives a simple overview of the labour requirements, using animal and mechanized traction in land preparation activities. In particular, in the case of animal traction, the reduction in labour can reach as much as 86%. Time required to prepare the land using a tractor is reduced with 58% under conservation agriculture.
Table 1.4.2b - Time requirements for land preparation activities under conventional tillage and conservation agriculture (adapted from Skora Neto, 1993).
Conventional tillage Conservation agriculture Operations Time required (hours
ha-1) Operations Time required (hours
ha-1) Tractor Tractor Ploughing 1.5 Knife
roller 0.9
Harrowing (2x)
1.4 Spraying 0.3
2.9 1.2 Animal Traction
Animal Traction
Ploughing 25 Knife roller
3
Harrowing (2x)
5 Spraying 1.5
Furrowing 3 33 4.5
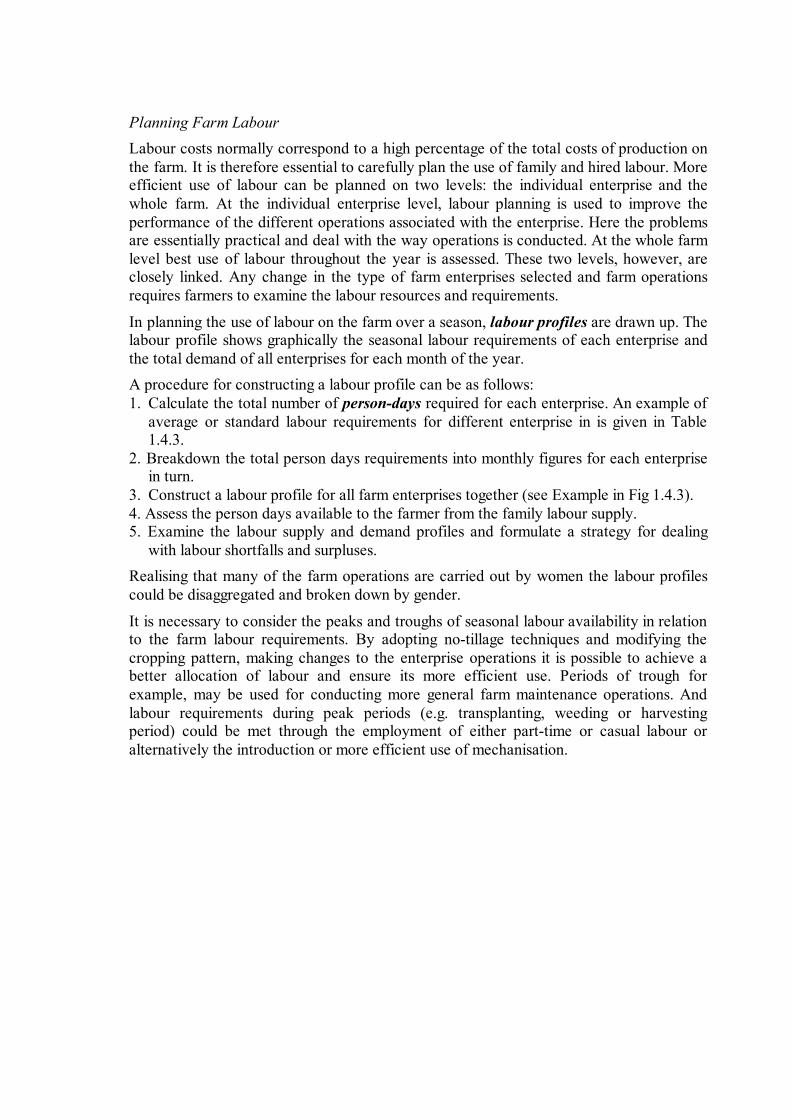
In production systems that use manual labour or animal traction the time the farmer uses for, e.g. walking in the field, is also reduced considerably, as is shown in Table 1.4.2c.
Table 1.4.2c - Covered distances (km) by farmer for the cultivation of one hectare of maize, using animal traction under conservation and conventional agriculture (Melo, 2000).
Operation Conservation agriculture Conventional tillage Ploughing - 40 Harrowing - 15 Furrowing - 10 Planting 5 5 Fertilization 10 10 Knife roller 7.5 - Weeding - 30 Nitrogen application 10 10 Bending over of the cobs 10 10 Harvest 15 15 Total distance (km) 57.5 145
Planning Farm Labour Labour costs normally correspond to a high percentage of the total costs of production on the farm. It is therefore essential to carefully plan the use of family and hired labour. More efficient use of labour can be planned on two levels: the individual enterprise and the whole farm. At the individual enterprise level, labour planning is used to improve the performance of the different operations associated with the enterprise. Here the problems are essentially practical and deal with the way operations is conducted. At the whole farm level best use of labour throughout the year is assessed. These two levels, however, are closely linked. Any change in the type of farm enterprises selected and farm operations requires farmers to examine the labour resources and requirements.
In planning the use of labour on the farm over a season, labour profiles are drawn up. The labour profile shows graphically the seasonal labour requirements of each enterprise and the total demand of all enterprises for each month of the year. A procedure for constructing a labour profile can be as follows: 1. Calculate the total number of person-days required for each enterprise. An example of
average or standard labour requirements for different enterprise in is given in Table 1.4.3.
2. Breakdown the total person days requirements into monthly figures for each enterprise in turn.
3. Construct a labour profile for all farm enterprises together (see Example in Fig 1.4.3). 4. Assess the person days available to the farmer from the family labour supply. 5. Examine the labour supply and demand profiles and formulate a strategy for dealing
with labour shortfalls and surpluses. Realising that many of the farm operations are carried out by women the labour profiles could be disaggregated and broken down by gender.
It is necessary to consider the peaks and troughs of seasonal labour availability in relation to the farm labour requirements. By adopting no-tillage techniques and modifying the cropping pattern, making changes to the enterprise operations it is possible to achieve a better allocation of labour and ensure its more efficient use. Periods of trough for example, may be used for conducting more general farm maintenance operations. And labour requirements during peak periods (e.g. transplanting, weeding or harvesting period) could be met through the employment of either part-time or casual labour or alternatively the introduction or more efficient use of mechanisation.
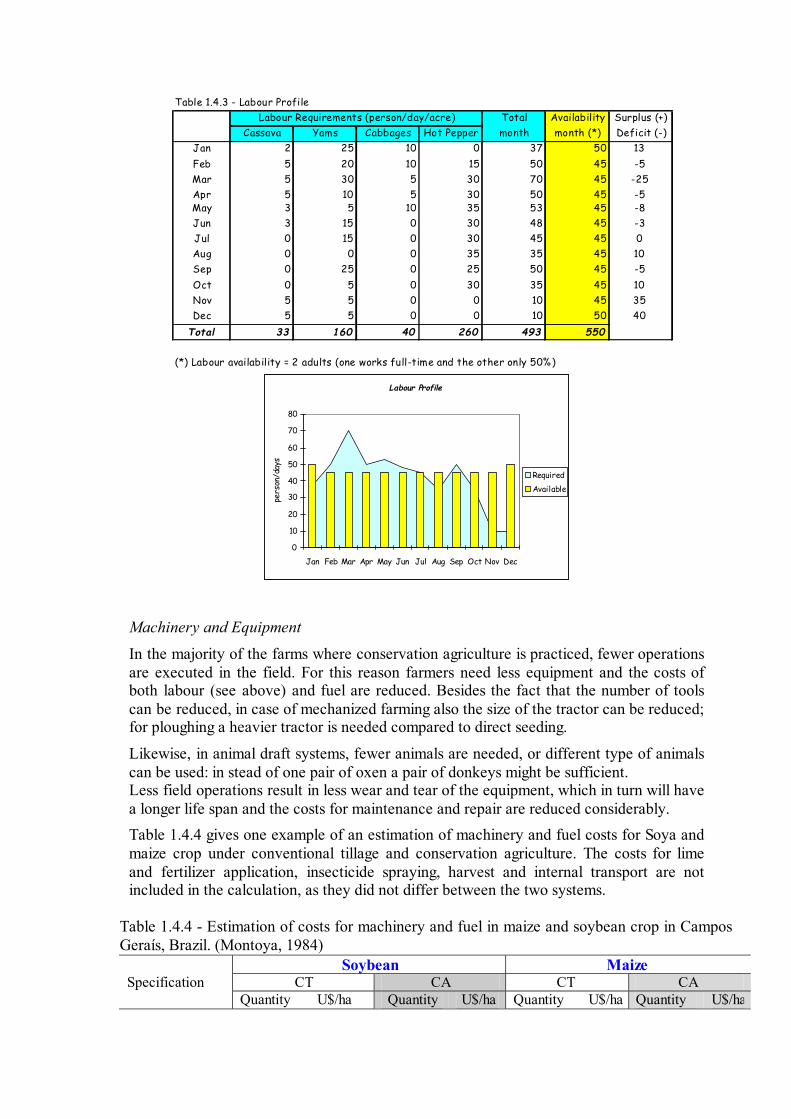
Table 1.4.3 - Labour ProfileTotal Availability Surplus (+)
Cassava Yams Cabbages Hot Pepper month month (*) Deficit (-)Jan 2 25 10 0 37 50 13Feb 5 20 10 15 50 45 -5 Mar 5 30 5 30 70 45 -25 Apr 5 10 5 30 50 45 -5 May 3 5 10 35 53 45 -8 Jun 3 15 0 30 48 45 -3 Jul 0 15 0 30 45 45 0Aug 0 0 0 35 35 45 10Sep 0 25 0 25 50 45 -5 Oct 0 5 0 30 35 45 10Nov 5 5 0 0 10 45 35Dec 5 5 0 0 10 50 40
Total 33 160 40 260 493 550
(*) Labour availability = 2 adults (one works full-time and the other only 50%)
Labour Requirements (person/day/acre)
Labour Profile
0
10
20
30
40
50
60
70
80
Jan Feb Mar Apr May Jun Jul Aug Sep Oct Nov Dec
pers
on/d
ays
RequiredAvailable
Machinery and Equipment
In the majority of the farms where conservation agriculture is practiced, fewer operations are executed in the field. For this reason farmers need less equipment and the costs of both labour (see above) and fuel are reduced. Besides the fact that the number of tools can be reduced, in case of mechanized farming also the size of the tractor can be reduced; for ploughing a heavier tractor is needed compared to direct seeding.
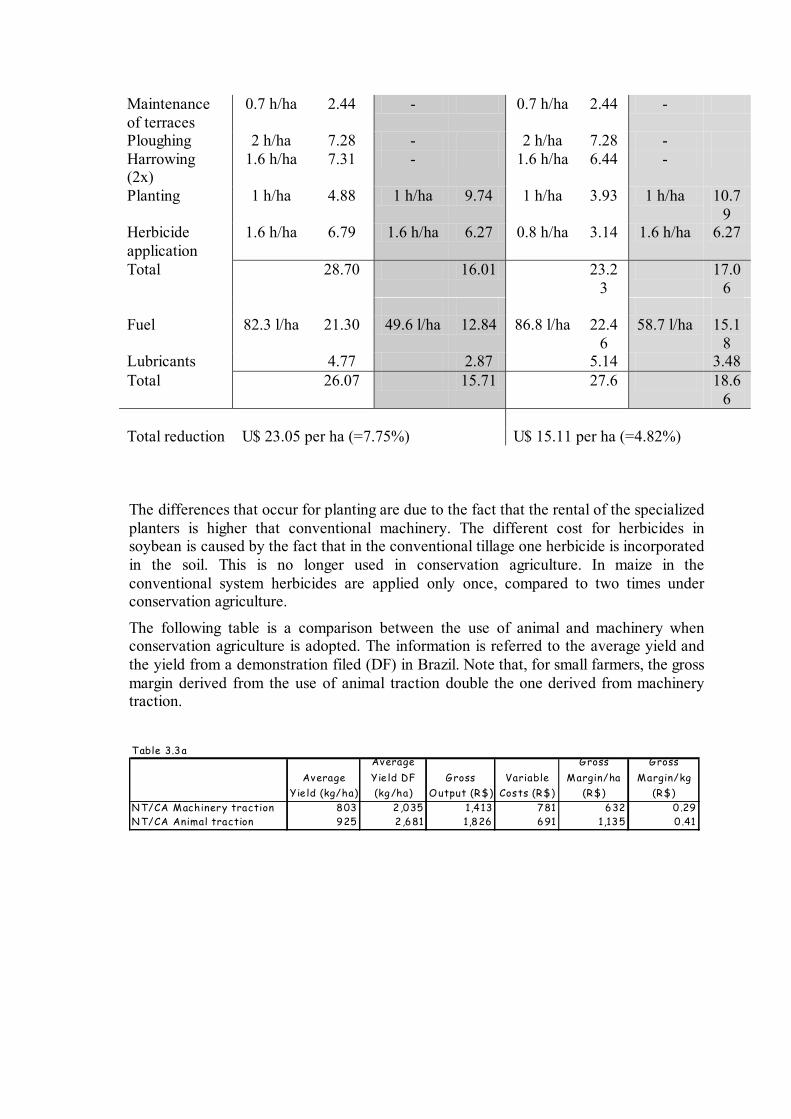
Likewise, in animal draft systems, fewer animals are needed, or different type of animals can be used: in stead of one pair of oxen a pair of donkeys might be sufficient. Less field operations result in less wear and tear of the equipment, which in turn will have a longer life span and the costs for maintenance and repair are reduced considerably. Table 1.4.4 gives one example of an estimation of machinery and fuel costs for Soya and maize crop under conventional tillage and conservation agriculture. The costs for lime and fertilizer application, insecticide spraying, harvest and internal transport are not included in the calculation, as they did not differ between the two systems.
Table 1.4.4 - Estimation of costs for machinery and fuel in maize and soybean crop in Campos Geraís, Brazil. (Montoya, 1984)
Soybean Maize Specification CT CA CT CA Quantity U$/ha Quantity U$/ha Quantity U$/ha Quantity U$/ha
Maintenance of terraces
0.7 h/ha 2.44 - 0.7 h/ha 2.44 -
Ploughing 2 h/ha 7.28 - 2 h/ha 7.28 - Harrowing (2x)
1.6 h/ha 7.31 - 1.6 h/ha 6.44 -
Planting 1 h/ha 4.88 1 h/ha 9.74 1 h/ha 3.93 1 h/ha 10.79
Herbicide application
1.6 h/ha 6.79 1.6 h/ha 6.27 0.8 h/ha 3.14 1.6 h/ha 6.27
Total 28.70 16.01 23.23
17.06
Fuel 82.3 l/ha 21.30 49.6 l/ha 12.84 86.8 l/ha 22.4
6 58.7 l/ha 15.1
8 Lubricants 4.77 2.87 5.14 3.48 Total 26.07 15.71 27.6 18.6
6 Total reduction U$ 23.05 per ha (=7.75%) U$ 15.11 per ha (=4.82%)
The differences that occur for planting are due to the fact that the rental of the specialized planters is higher that conventional machinery. The different cost for herbicides in soybean is caused by the fact that in the conventional tillage one herbicide is incorporated in the soil. This is no longer used in conservation agriculture. In maize in the conventional system herbicides are applied only once, compared to two times under conservation agriculture.
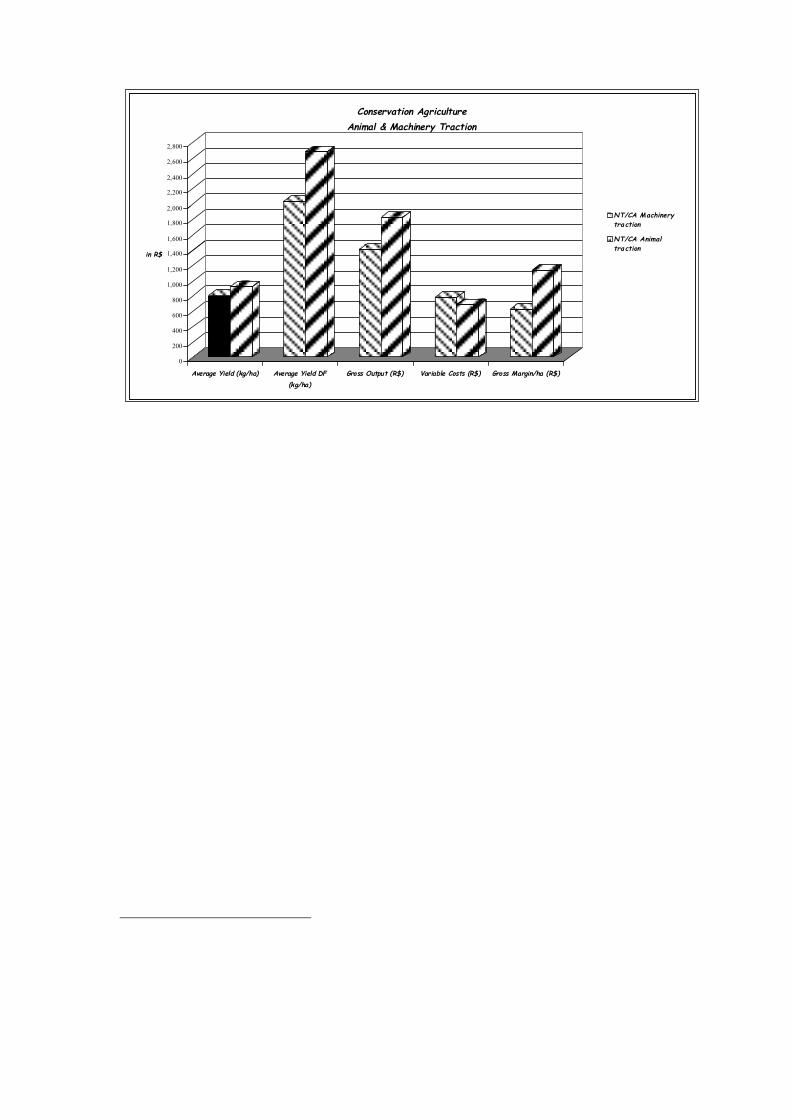
The following table is a comparison between the use of animal and machinery when conservation agriculture is adopted. The information is referred to the average yield and the yield from a demonstration filed (DF) in Brazil. Note that, for small farmers, the gross margin derived from the use of animal traction double the one derived from machinery traction.
Table 3.3a
Average Yie ld (kg/ha)
Average Yie ld DF (kg/ha)
Gross Output (R$)
Variable Costs (R$)
Gross Margin/ha
(R$)
Gross Margin/kg
(R$)NT/CA Machinery traction 803 2,035 1,413 781 632 0.29NT/CA Animal traction 925 2,681 1,826 691 1,135 0.41
���������������������
����������������
������������
������������
�������
���������������
��������������������������������������
������������
�������������������������������������������
����������������������������
0
200
400
600
800
1,000
1,200
1,400
1,600
1,800
2,000
2,200
2,400
2,600
2,800
in R$
Average Yield (kg/ha) Average Yield DF(kg/ha)
Gross Output (R$) Variable Costs (R$) Gross Margin/ha (R$)
Conservation Agriculture Animal & Machinery Traction
��NT/CA Machinerytraction��NT/CA Animaltraction
FARM MANAGEMENT AND CONSERVATION AGRICULTURE Management is a widely used term. Common definitions of management use phrases such as "making decisions to increase profit", "making the best use of available resources", "using, managing and allocating resources", etc. The above definitions provide some insight into management and the things that managers do:
First, they imply the existence of an objective (or objectives); Second, there are resources that can be used or allocated; and Third, the resources to be used or allocated imply more than one possible use.
Farm Management is doing something with limited resources available (e.g. land, labour and capital). It can be defined as the activity that combines planning, implementation and operation activities of a farm. Farmers should know how to combine these resources for the right outcome. Regardless of definition, management takes time and work. It is just as critical to success as planting, growing, harvesting and marketing a crop or a livestock product. Farmers should be able to recognise their mistakes, be accountable for their actions, and be willing to change their thinking based on better information. In other words, they should continue to learn how to combine available resources to achieve their objectives. The successful management of a farm would also require the manager to have the following qualities:
ability to self-organise and to motivate people involved in the farm activities to achieve specific objectives and targets; understanding of technical issues involved in the production and marketing of farm products; ability to communicate with other people involved in similar production and marketing activities to ensure a continuous flow of clear information; ability to make decisions.
Individual farmers already possess some or maybe all of these qualities. However, the farmer, in order to achieve the desired objectives, must develop marketing and production plans, make estimates about future events and forecasts and constantly re-adapt his/her decisions to a continuously changing environment.
The changes in the environment are linked to several factors, which can be summarised under four headings:
Technical - yield variability due to diseases, weather, variety, breeding or technology; Prices - changes due to supply and demand in the market place; Institutional - factors concerning governments and banks; Human - individuals make unique contributions to the farm. Changes in staff involved in the farm can seriously affect its performance.
The common functions of management that help farmers deal with changes in the environment are:
Farm management is concernedwith achieving the rightcombination of available inputs(land, labour, and capital) inproduction (crop and/orlivestock).
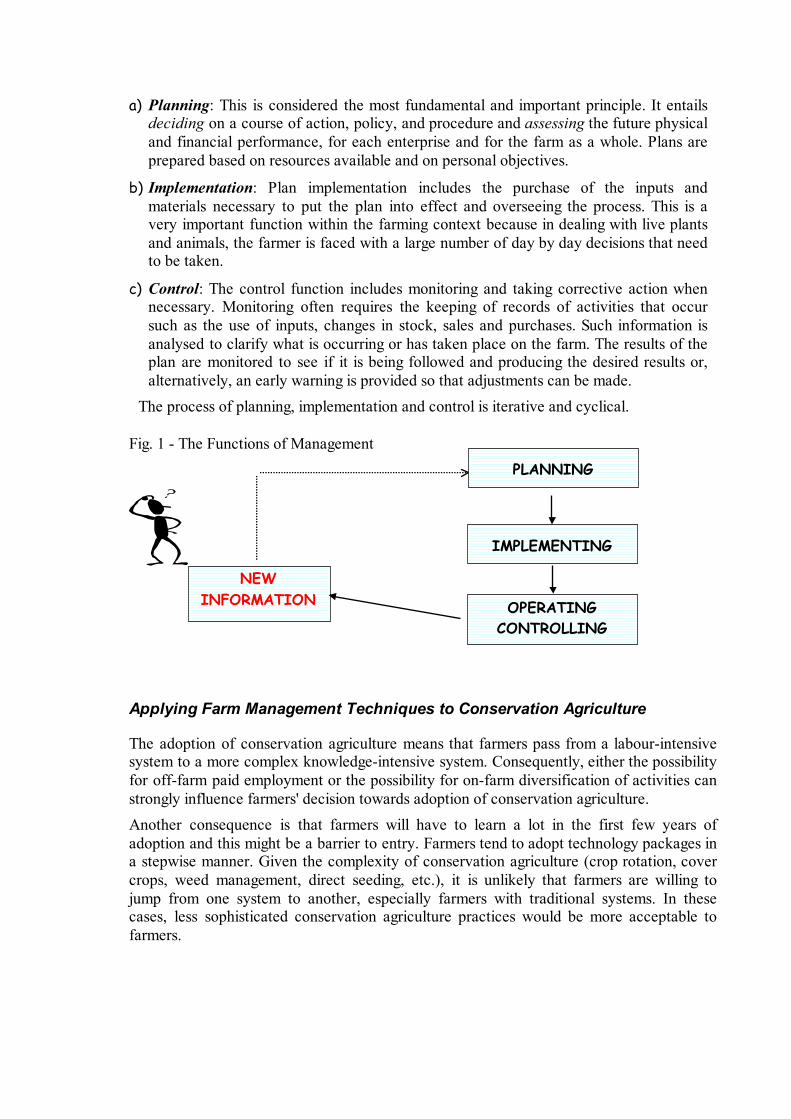
a) Planning: This is considered the most fundamental and important principle. It entails deciding on a course of action, policy, and procedure and assessing the future physical and financial performance, for each enterprise and for the farm as a whole. Plans are prepared based on resources available and on personal objectives.
b) Implementation: Plan implementation includes the purchase of the inputs and materials necessary to put the plan into effect and overseeing the process. This is a very important function within the farming context because in dealing with live plants and animals, the farmer is faced with a large number of day by day decisions that need to be taken.
c) Control: The control function includes monitoring and taking corrective action when necessary. Monitoring often requires the keeping of records of activities that occur such as the use of inputs, changes in stock, sales and purchases. Such information is analysed to clarify what is occurring or has taken place on the farm. The results of the plan are monitored to see if it is being followed and producing the desired results or, alternatively, an early warning is provided so that adjustments can be made.
The process of planning, implementation and control is iterative and cyclical.
Fig. 1 - The Functions of Management
Applying Farm Management Techniques to Conservation Agriculture
The adoption of conservation agriculture means that farmers pass from a labour-intensive system to a more complex knowledge-intensive system. Consequently, either the possibility for off-farm paid employment or the possibility for on-farm diversification of activities can strongly influence farmers' decision towards adoption of conservation agriculture. Another consequence is that farmers will have to learn a lot in the first few years of adoption and this might be a barrier to entry. Farmers tend to adopt technology packages in a stepwise manner. Given the complexity of conservation agriculture (crop rotation, cover crops, weed management, direct seeding, etc.), it is unlikely that farmers are willing to jump from one system to another, especially farmers with traditional systems. In these cases, less sophisticated conservation agriculture practices would be more acceptable to farmers.
NEW INFORMATION
IMPLEMENTING
OPERATING CONTROLLING
PLANNING
Farm Income and Profitability of Conservation Agriculture Conservation agriculture techniques provide an effective control of land degradation, reducing soil erosion, and increasing efficiency, productivity, and soil organic matter, together with a substantial improvement in environmental quality due to the sustainable use and management of natural resources.
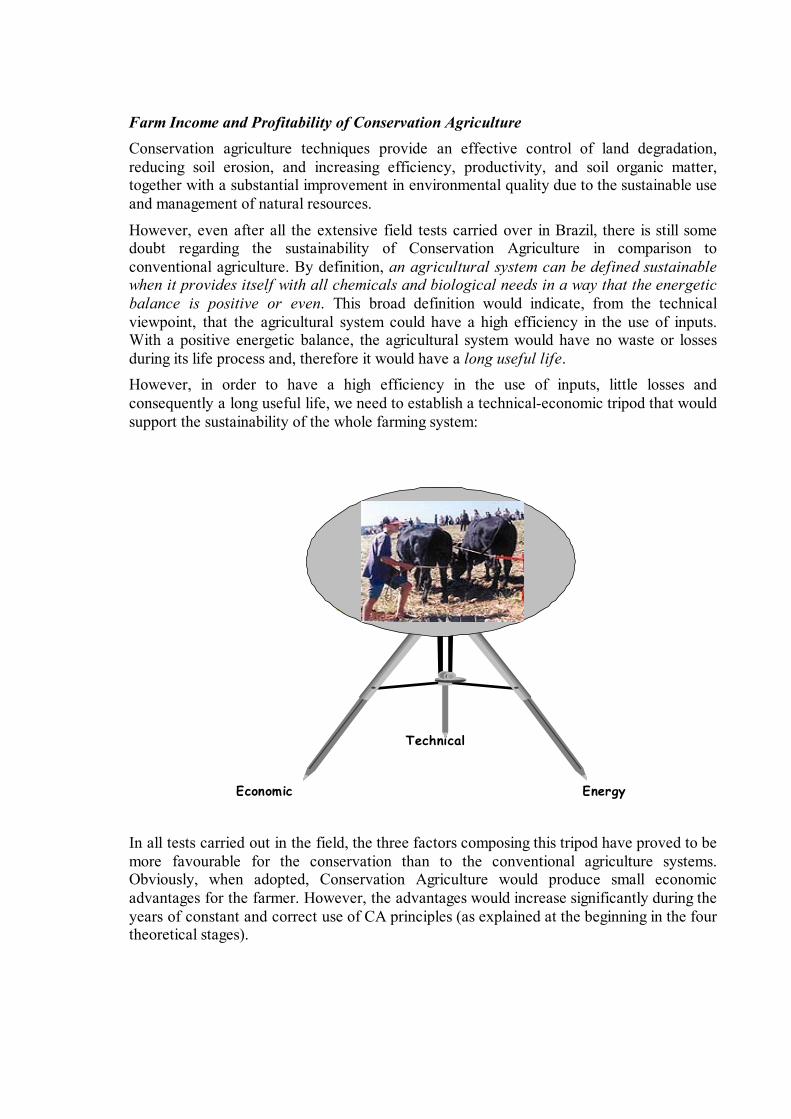
However, even after all the extensive field tests carried over in Brazil, there is still some doubt regarding the sustainability of Conservation Agriculture in comparison to conventional agriculture. By definition, an agricultural system can be defined sustainable when it provides itself with all chemicals and biological needs in a way that the energetic balance is positive or even. This broad definition would indicate, from the technical viewpoint, that the agricultural system could have a high efficiency in the use of inputs. With a positive energetic balance, the agricultural system would have no waste or losses during its life process and, therefore it would have a long useful life. However, in order to have a high efficiency in the use of inputs, little losses and consequently a long useful life, we need to establish a technical-economic tripod that would support the sustainability of the whole farming system:
In all tests carried out in the field, the three factors composing this tripod have proved to be more favourable for the conservation than to the conventional agriculture systems. Obviously, when adopted, Conservation Agriculture would produce small economic advantages for the farmer. However, the advantages would increase significantly during the years of constant and correct use of CA principles (as explained at the beginning in the four theoretical stages).
Economic Energy
Technical
Farming System
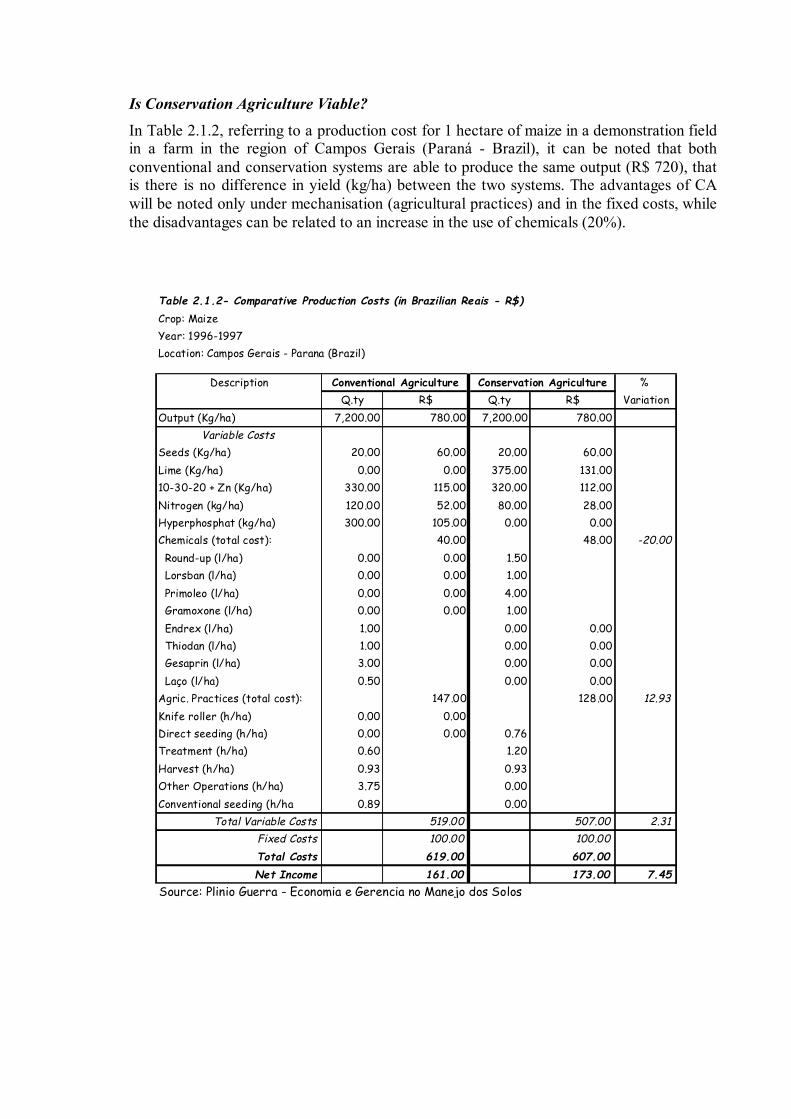
Is Conservation Agriculture Viable? In Table 2.1.2, referring to a production cost for 1 hectare of maize in a demonstration field in a farm in the region of Campos Gerais (Paraná - Brazil), it can be noted that both conventional and conservation systems are able to produce the same output (R$ 720), that is there is no difference in yield (kg/ha) between the two systems. The advantages of CA will be noted only under mechanisation (agricultural practices) and in the fixed costs, while the disadvantages can be related to an increase in the use of chemicals (20%).
Table 2.1.2- Comparative Production Costs (in Brazilian Reais - R$)Crop: MaizeYear: 1996-1997Location: Campos Gerais - Parana (Brazil)
Description % Q.ty R$ Q.ty R$ Variation
Output (Kg/ha) 7,200.00 780.00 7,200.00 780.00Variable Costs
Seeds (Kg/ha) 20.00 60.00 20.00 60.00Lime (Kg/ha) 0.00 0.00 375.00 131.0010-30-20 + Zn (Kg/ha) 330.00 115.00 320.00 112.00Nitrogen (kg/ha) 120.00 52.00 80.00 28.00Hyperphosphat (kg/ha) 300.00 105.00 0.00 0.00Chemicals (total cost): 40.00 48.00 -20.00 Round-up (l/ha) 0.00 0.00 1.50 Lorsban (l/ha) 0.00 0.00 1.00 Primoleo (l/ha) 0.00 0.00 4.00 Gramoxone (l/ha) 0.00 0.00 1.00 Endrex (l/ha) 1.00 0.00 0.00 Thiodan (l/ha) 1.00 0.00 0.00 Gesaprin (l/ha) 3.00 0.00 0.00 Laço (l/ha) 0.50 0.00 0.00Agric. Practices (total cost): 147.00 128.00 12.93Knife roller (h/ha) 0.00 0.00Direct seeding (h/ha) 0.00 0.00 0.76Treatment (h/ha) 0.60 1.20Harvest (h/ha) 0.93 0.93Other Operations (h/ha) 3.75 0.00Conventional seeding (h/ha 0.89 0.00
Total Variable Costs 519.00 507.00 2.31Fixed Costs 100.00 100.00Total Costs 619.00 607.00Net Income 161.00 173.00 7.45
Source: Plinio Guerra - Economia e Gerencia no Manejo dos Solos
Conventional Agriculture Conservation Agriculture
���������������������������� ��
��������������������
���������������������������������
�������������������������������������������
0
200
400
600
800
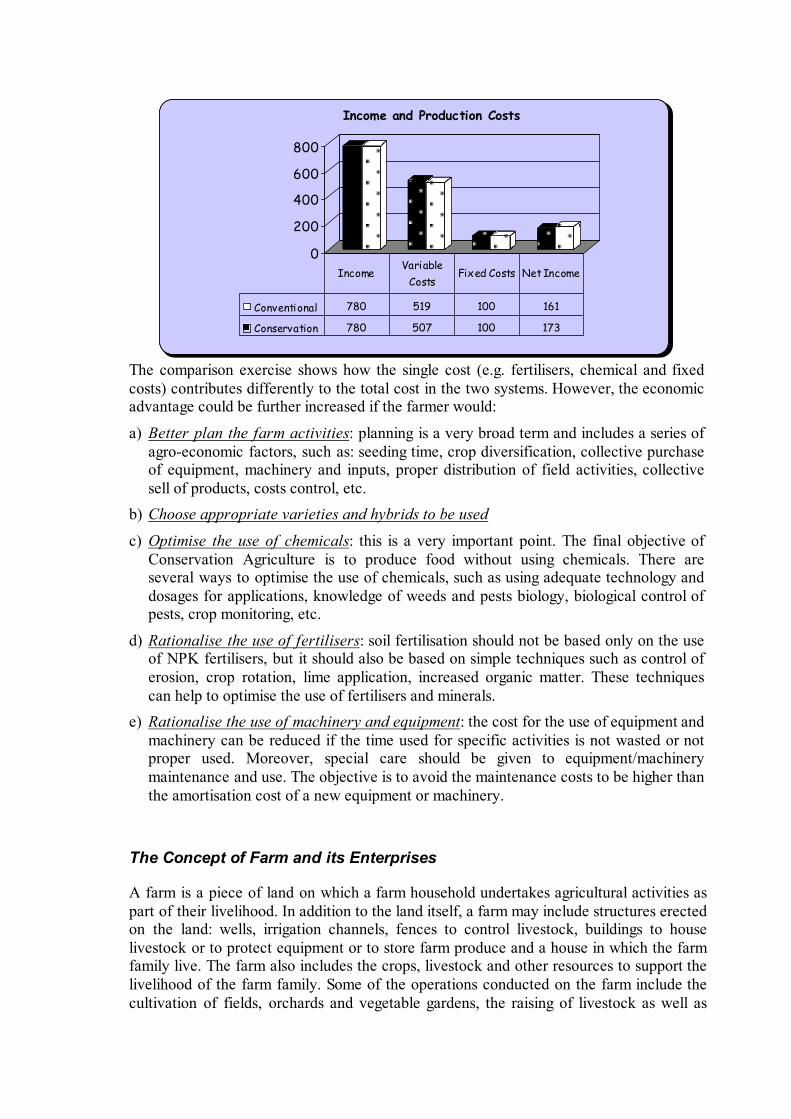
Income and Production Costs
�Conventional 780 519 100 161
�Conservation 780 507 100 173
IncomeVariable
CostsFixed Costs Net Income
The comparison exercise shows how the single cost (e.g. fertilisers, chemical and fixed costs) contributes differently to the total cost in the two systems. However, the economic advantage could be further increased if the farmer would:
a) Better plan the farm activities: planning is a very broad term and includes a series of agro-economic factors, such as: seeding time, crop diversification, collective purchase of equipment, machinery and inputs, proper distribution of field activities, collective sell of products, costs control, etc.
b) Choose appropriate varieties and hybrids to be used
c) Optimise the use of chemicals: this is a very important point. The final objective of Conservation Agriculture is to produce food without using chemicals. There are several ways to optimise the use of chemicals, such as using adequate technology and dosages for applications, knowledge of weeds and pests biology, biological control of pests, crop monitoring, etc.
d) Rationalise the use of fertilisers: soil fertilisation should not be based only on the use of NPK fertilisers, but it should also be based on simple techniques such as control of erosion, crop rotation, lime application, increased organic matter. These techniques can help to optimise the use of fertilisers and minerals.
e) Rationalise the use of machinery and equipment: the cost for the use of equipment and machinery can be reduced if the time used for specific activities is not wasted or not proper used. Moreover, special care should be given to equipment/machinery maintenance and use. The objective is to avoid the maintenance costs to be higher than the amortisation cost of a new equipment or machinery.
The Concept of Farm and its Enterprises
A farm is a piece of land on which a farm household undertakes agricultural activities as part of their livelihood. In addition to the land itself, a farm may include structures erected on the land: wells, irrigation channels, fences to control livestock, buildings to house livestock or to protect equipment or to store farm produce and a house in which the farm family live. The farm also includes the crops, livestock and other resources to support the livelihood of the farm family. Some of the operations conducted on the farm include the cultivation of fields, orchards and vegetable gardens, the raising of livestock as well as
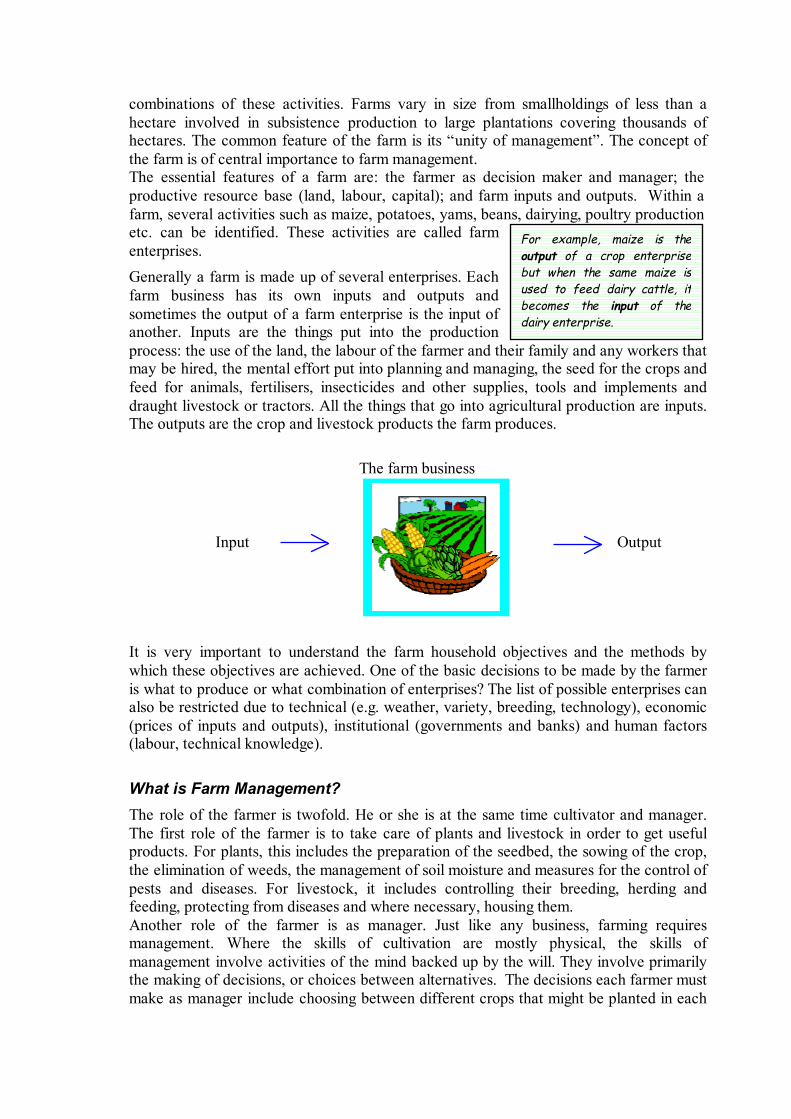
combinations of these activities. Farms vary in size from smallholdings of less than a hectare involved in subsistence production to large plantations covering thousands of hectares. The common feature of the farm is its “unity of management”. The concept of the farm is of central importance to farm management. The essential features of a farm are: the farmer as decision maker and manager; the productive resource base (land, labour, capital); and farm inputs and outputs. Within a farm, several activities such as maize, potatoes, yams, beans, dairying, poultry production etc. can be identified. These activities are called farm enterprises. Generally a farm is made up of several enterprises. Each farm business has its own inputs and outputs and sometimes the output of a farm enterprise is the input of another. Inputs are the things put into the production process: the use of the land, the labour of the farmer and their family and any workers that may be hired, the mental effort put into planning and managing, the seed for the crops and feed for animals, fertilisers, insecticides and other supplies, tools and implements and draught livestock or tractors. All the things that go into agricultural production are inputs. The outputs are the crop and livestock products the farm produces.
The farm business Input Output
It is very important to understand the farm household objectives and the methods by which these objectives are achieved. One of the basic decisions to be made by the farmer is what to produce or what combination of enterprises? The list of possible enterprises can also be restricted due to technical (e.g. weather, variety, breeding, technology), economic (prices of inputs and outputs), institutional (governments and banks) and human factors (labour, technical knowledge).
What is Farm Management? The role of the farmer is twofold. He or she is at the same time cultivator and manager. The first role of the farmer is to take care of plants and livestock in order to get useful products. For plants, this includes the preparation of the seedbed, the sowing of the crop, the elimination of weeds, the management of soil moisture and measures for the control of pests and diseases. For livestock, it includes controlling their breeding, herding and feeding, protecting from diseases and where necessary, housing them. Another role of the farmer is as manager. Just like any business, farming requires management. Where the skills of cultivation are mostly physical, the skills of management involve activities of the mind backed up by the will. They involve primarily the making of decisions, or choices between alternatives. The decisions each farmer must make as manager include choosing between different crops that might be planted in each
For example, maize is theoutput of a crop enterprisebut when the same maize isused to feed dairy cattle, itbecomes the input of thedairy enterprise.
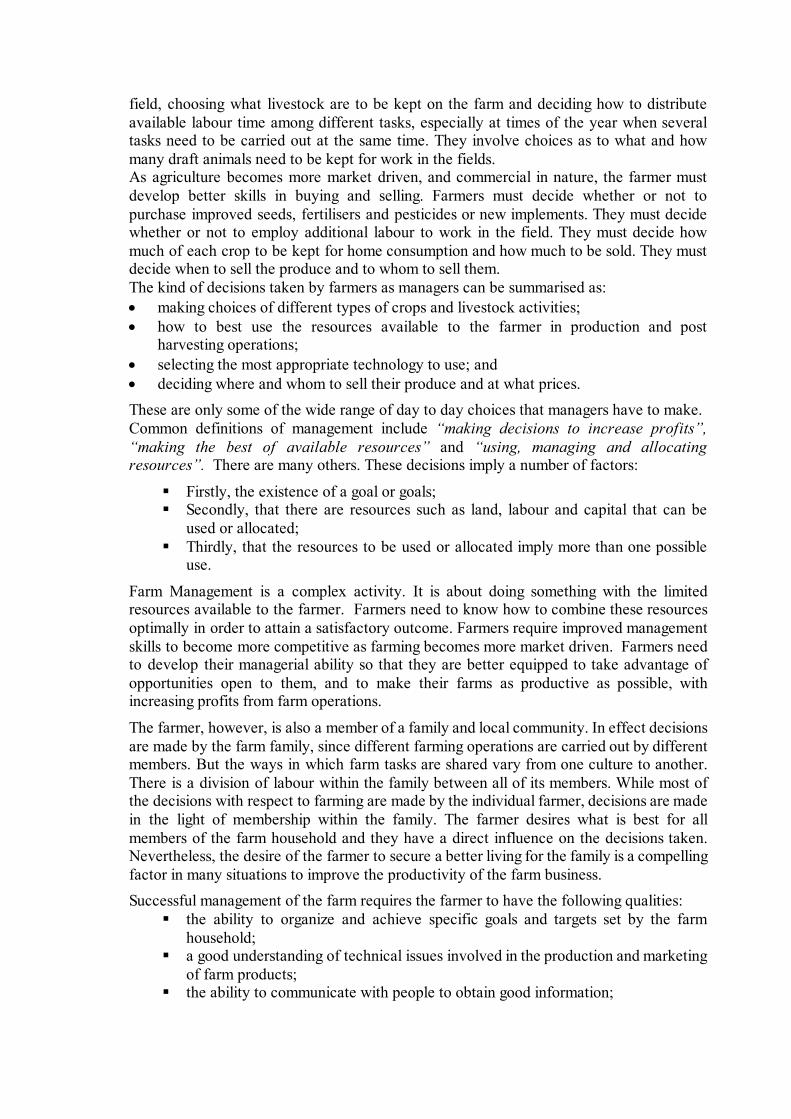
field, choosing what livestock are to be kept on the farm and deciding how to distribute available labour time among different tasks, especially at times of the year when several tasks need to be carried out at the same time. They involve choices as to what and how many draft animals need to be kept for work in the fields. As agriculture becomes more market driven, and commercial in nature, the farmer must develop better skills in buying and selling. Farmers must decide whether or not to purchase improved seeds, fertilisers and pesticides or new implements. They must decide whether or not to employ additional labour to work in the field. They must decide how much of each crop to be kept for home consumption and how much to be sold. They must decide when to sell the produce and to whom to sell them. The kind of decisions taken by farmers as managers can be summarised as:
making choices of different types of crops and livestock activities; how to best use the resources available to the farmer in production and post harvesting operations; selecting the most appropriate technology to use; and deciding where and whom to sell their produce and at what prices.
These are only some of the wide range of day to day choices that managers have to make. Common definitions of management include “making decisions to increase profits”, “making the best of available resources” and “using, managing and allocating resources”. There are many others. These decisions imply a number of factors:
Firstly, the existence of a goal or goals; Secondly, that there are resources such as land, labour and capital that can be used or allocated; Thirdly, that the resources to be used or allocated imply more than one possible use.
Farm Management is a complex activity. It is about doing something with the limited resources available to the farmer. Farmers need to know how to combine these resources optimally in order to attain a satisfactory outcome. Farmers require improved management skills to become more competitive as farming becomes more market driven. Farmers need to develop their managerial ability so that they are better equipped to take advantage of opportunities open to them, and to make their farms as productive as possible, with increasing profits from farm operations.
The farmer, however, is also a member of a family and local community. In effect decisions are made by the farm family, since different farming operations are carried out by different members. But the ways in which farm tasks are shared vary from one culture to another. There is a division of labour within the family between all of its members. While most of the decisions with respect to farming are made by the individual farmer, decisions are made in the light of membership within the family. The farmer desires what is best for all members of the farm household and they have a direct influence on the decisions taken. Nevertheless, the desire of the farmer to secure a better living for the family is a compelling factor in many situations to improve the productivity of the farm business. Successful management of the farm requires the farmer to have the following qualities:
the ability to organize and achieve specific goals and targets set by the farm household; a good understanding of technical issues involved in the production and marketing of farm products; the ability to communicate with people to obtain good information;
the capacity to make informed and relevant decisions.
Individual farmers may already possess some or all of these qualities. However, in order to achieve their desired objectives, the farmer must develop marketing and production plans, make estimates on future events and forecasts, and adapt their decisions in the light of technical, market and policy changes that are regularly occurring in the broad environment within which farming takes place. Farmers require the skills and know how to adapt effectively to external changes and ensure greater competitiveness. Farm Management takes time and work and is just as critical for success as planting, growing, harvesting and marketing a crop or a livestock product. Good farmers need to learn from their day to day experience and recognise their mistakes, become accountable for their actions, and are willing to change their thinking based on new information.
Why is Better Farm Management Important?
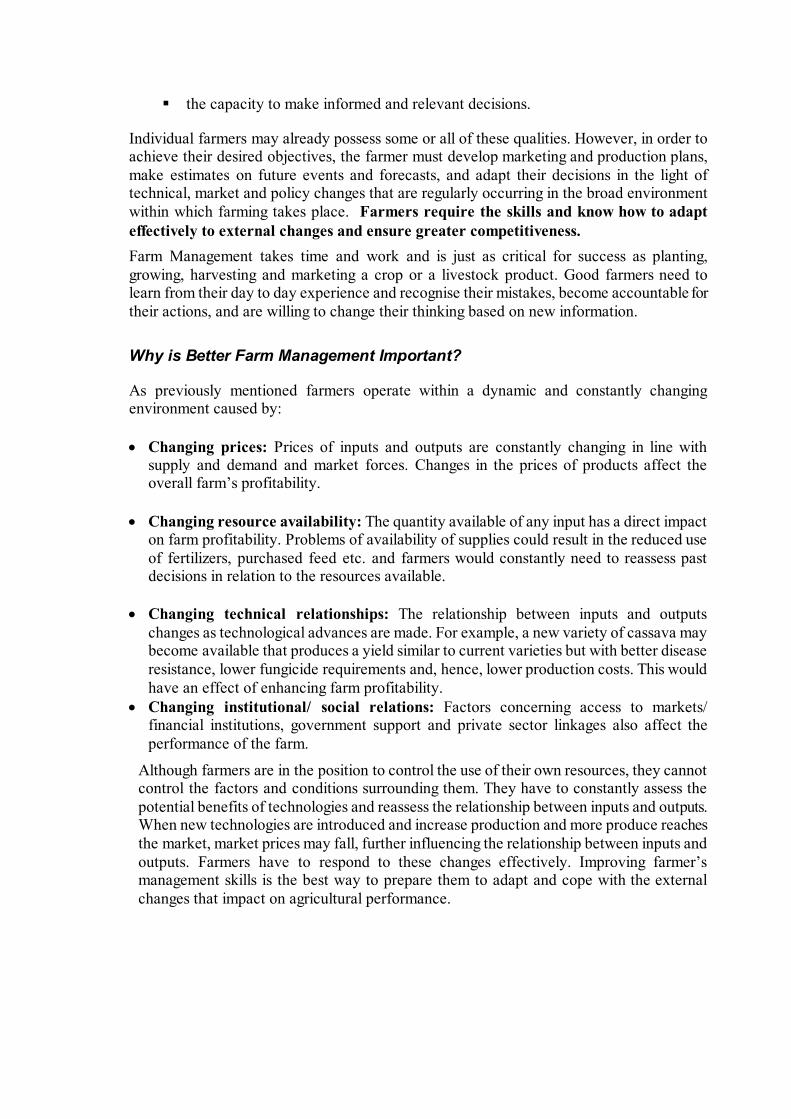
As previously mentioned farmers operate within a dynamic and constantly changing environment caused by:
Changing prices: Prices of inputs and outputs are constantly changing in line with supply and demand and market forces. Changes in the prices of products affect the overall farm’s profitability.
Changing resource availability: The quantity available of any input has a direct impact on farm profitability. Problems of availability of supplies could result in the reduced use of fertilizers, purchased feed etc. and farmers would constantly need to reassess past decisions in relation to the resources available.
Changing technical relationships: The relationship between inputs and outputs changes as technological advances are made. For example, a new variety of cassava may become available that produces a yield similar to current varieties but with better disease resistance, lower fungicide requirements and, hence, lower production costs. This would have an effect of enhancing farm profitability. Changing institutional/ social relations: Factors concerning access to markets/ financial institutions, government support and private sector linkages also affect the performance of the farm.
Although farmers are in the position to control the use of their own resources, they cannot control the factors and conditions surrounding them. They have to constantly assess the potential benefits of technologies and reassess the relationship between inputs and outputs. When new technologies are introduced and increase production and more produce reaches the market, market prices may fall, further influencing the relationship between inputs and outputs. Farmers have to respond to these changes effectively. Improving farmer’s management skills is the best way to prepare them to adapt and cope with the external changes that impact on agricultural performance.
What are the Farmer's Objectives?
In order to improve farm management, it is important to understand the expectations of farmers and their families. Farmers tend to have a number of objectives that guide their choices between alternative actions. Some of these are:
ensuring stable food supplies for the family. increasing production; maximising profits; increasing sales; minimising costs; avoiding debt; achieving a “satisfactory” standard of living; reducing the risks involved in farming; transferring the farm to the next generation ;and
Farmers often have multiple objectives and some may even conflict. Nevertheless, for market oriented production an important common objective is profit. In the long-term, farm profit must be sufficient to cover family expenses and production costs related to the farm.
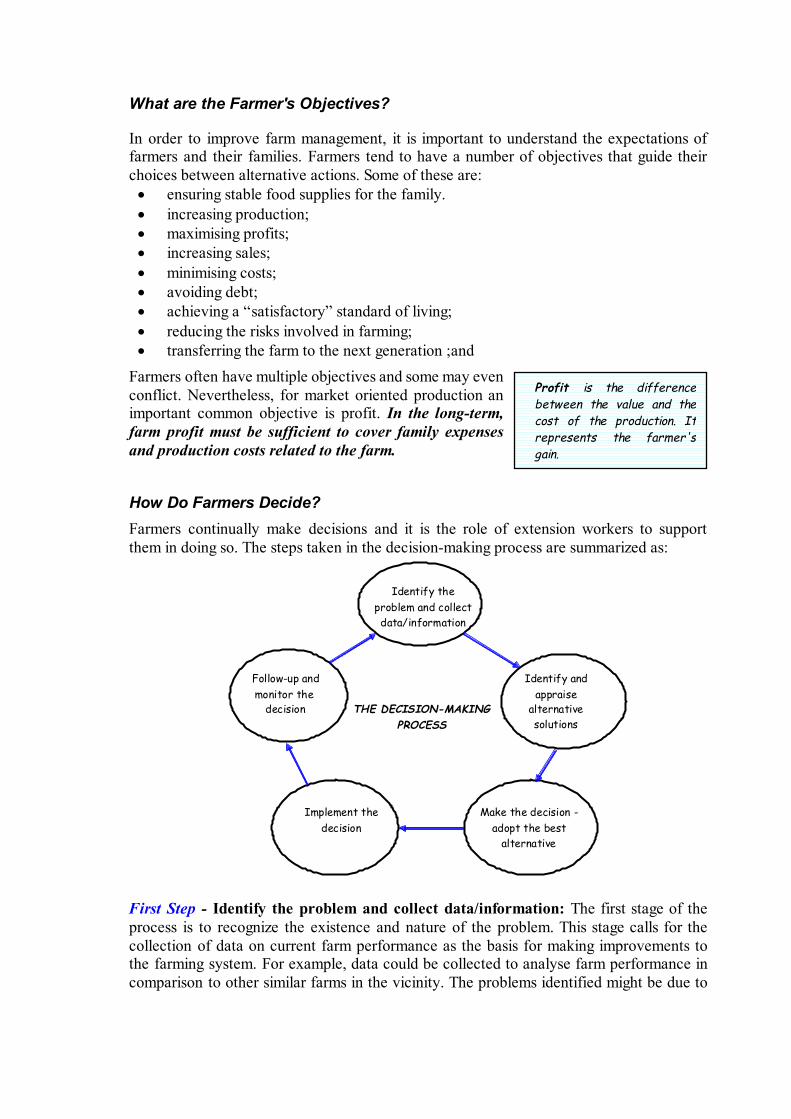
How Do Farmers Decide? Farmers continually make decisions and it is the role of extension workers to support them in doing so. The steps taken in the decision-making process are summarized as:
Identify theproblem and collectdata/information
Identify andappraise
alternativesolutions
adopt the bestMake the decision -
alternative
THE DECISION-MAKINGPROCESS
Implement thedecision
Follow-up andmonitor the
decision
First Step - Identify the problem and collect data/information: The first stage of the process is to recognize the existence and nature of the problem. This stage calls for the collection of data on current farm performance as the basis for making improvements to the farming system. For example, data could be collected to analyse farm performance in comparison to other similar farms in the vicinity. The problems identified might be due to
Profit is the difference between the value and the cost of the production. It represents the farmer's gain.
the use of obsolete or inappropriate production techniques, constraints on marketing and limited alternative market channels. Second Step - Identify and analyse alternative solutions: Possible solutions to the identified problems may include increasing the use of purchased inputs and materials, and introducing improved bio-fertiliser and pest management methods amongst others. The consequences of the alternative actions would be evaluated to assess their likely impact on farm performance.
Third Step - Make the decision and adopt the best alternative: Which of the alternatives is most likely to improve farm performance? Since it is rare that all the information required in making a decision would be available, selection often requires judgement by the farmer before a decision is made. The final decision, therefore, will frequently reflect the farmer’s attitude towards risk and more specifically, the perceived risks of each of the alternatives.
Fourth Step - Implement the decision: Farmers have a role in implementing decisions and enforcing the action needed to ensure that the decisions are followed. On a small farm, very often different members of the farm family undertake the planning and implementation tasks.
Fifth Step - Follow-up: Once the first four steps have been completed, it is useful to review the results of the decisions taken. Having identified the changes made, it is important to continue monitoring progress to ensure that the new plans are being followed and that revised targets are being achieved.
There are three different time horizons within which decisions are taken in agriculture. These are:
a) Short-term. These decisions are concerned with the daily organization of farm operations such as sowing, weeding, fertilising, harvesting and storage. They also involve culling of stock, veterinary interventions and artificial insemination of livestock.
b) Medium -term. These are concerned with the annual organisation of the farm e.g. preparing the cropping plan, deciding on the amount of labour to use and whether to introduce new crop varieties and animal husbandry practices.
c) Long-term. These decisions relate to the long-term nature of the farm e.g. whether or not to expand farm size through purchasing or leasing land; and whether or not to construct buildings and/ or purchase of machinery and equipment.
Short-term decisions are operational in nature, medium and long-term decisions are concerned with capital investments.
Understanding Farm Enterprises
There are several restrictions and opportunities in managing farm enterprises. Knowledge of enterprise gross income, costs of production, gross margin and profitability is essential for both extension workers and farmers.
Gross Income Gross Income is the value of the output of an enterprise. The gross income is obtained by multiplying the physical output (including home consumption) by the farm gate price of the product. The farm gate represents the point of first sale. It would be incorrect to calculate gross income for the enterprise by using the price at which the farmer sold the produce in the marketplace or elsewhere off the farm. The costs of transportation and other marketing expenses need to be deducted from the market price in order to arrive at the gross income at the farm gate. Since it is possible to produce more than a single short term crop from the same land area within a year, a distinction needs to be made between gross income for a particular season and gross income for a particular year. The gross income of a particular crop for the year may be the sum of the gross income for two or more crops grown during the year.
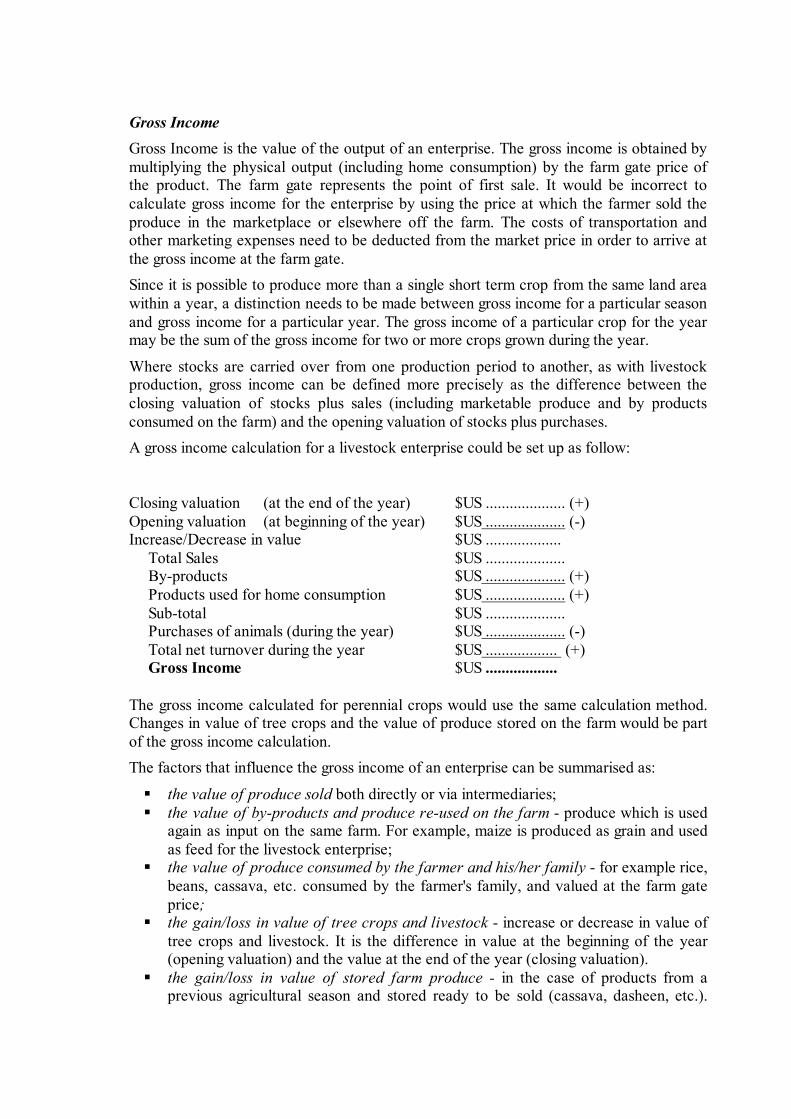
Where stocks are carried over from one production period to another, as with livestock production, gross income can be defined more precisely as the difference between the closing valuation of stocks plus sales (including marketable produce and by products consumed on the farm) and the opening valuation of stocks plus purchases. A gross income calculation for a livestock enterprise could be set up as follow:
Closing valuation (at the end of the year) $US .................... (+) Opening valuation (at beginning of the year) $US .................... (-) Increase/Decrease in value $US ...................
Total Sales $US .................... By-products $US .................... (+) Products used for home consumption $US .................... (+) Sub-total $US .................... Purchases of animals (during the year) $US .................... (-) Total net turnover during the year $US .................. (+) Gross Income $US ..................
The gross income calculated for perennial crops would use the same calculation method. Changes in value of tree crops and the value of produce stored on the farm would be part of the gross income calculation. The factors that influence the gross income of an enterprise can be summarised as:
the value of produce sold both directly or via intermediaries; the value of by-products and produce re-used on the farm - produce which is used again as input on the same farm. For example, maize is produced as grain and used as feed for the livestock enterprise; the value of produce consumed by the farmer and his/her family - for example rice, beans, cassava, etc. consumed by the farmer's family, and valued at the farm gate price; the gain/loss in value of tree crops and livestock - increase or decrease in value of tree crops and livestock. It is the difference in value at the beginning of the year (opening valuation) and the value at the end of the year (closing valuation). the gain/loss in value of stored farm produce - in the case of products from a previous agricultural season and stored ready to be sold (cassava, dasheen, etc.).
This is the difference in value from the time that the produce is stored to the time that it is sold.
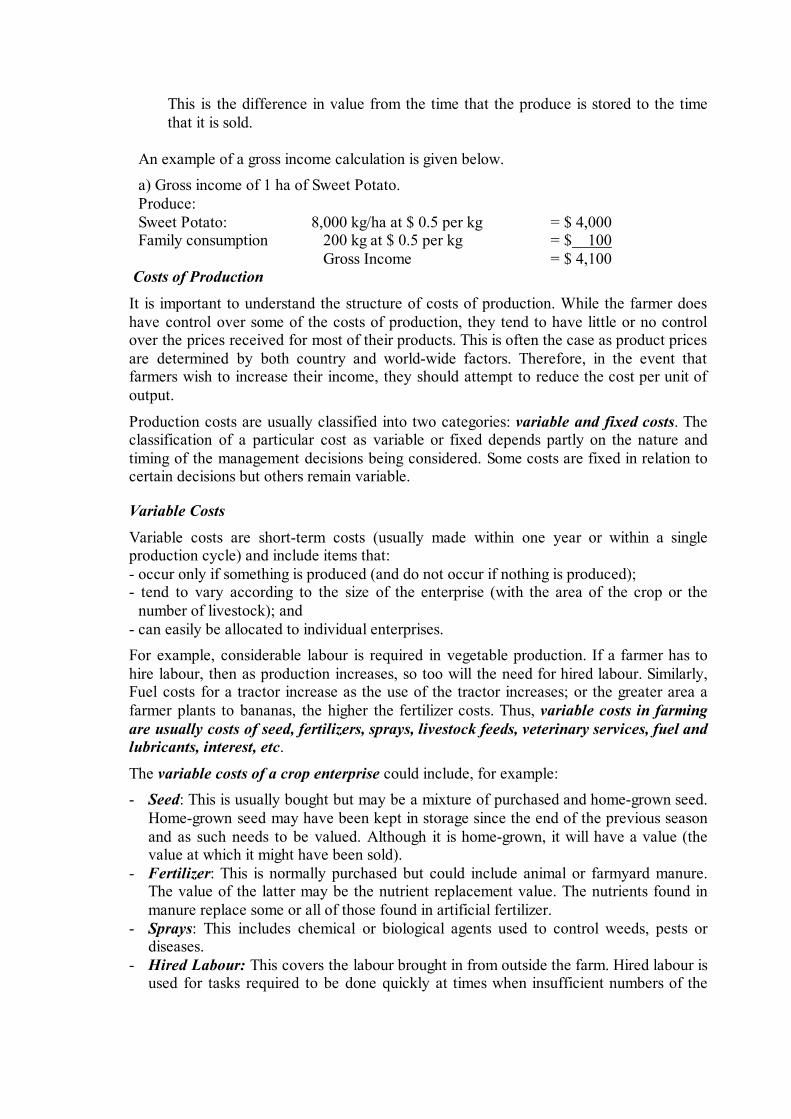
An example of a gross income calculation is given below. a) Gross income of 1 ha of Sweet Potato. Produce: Sweet Potato: 8,000 kg/ha at $ 0.5 per kg = $ 4,000 Family consumption 200 kg at $ 0.5 per kg = $ 100 Gross Income = $ 4,100
Costs of Production It is important to understand the structure of costs of production. While the farmer does have control over some of the costs of production, they tend to have little or no control over the prices received for most of their products. This is often the case as product prices are determined by both country and world-wide factors. Therefore, in the event that farmers wish to increase their income, they should attempt to reduce the cost per unit of output.
Production costs are usually classified into two categories: variable and fixed costs. The classification of a particular cost as variable or fixed depends partly on the nature and timing of the management decisions being considered. Some costs are fixed in relation to certain decisions but others remain variable.
Variable Costs Variable costs are short-term costs (usually made within one year or within a single production cycle) and include items that: - occur only if something is produced (and do not occur if nothing is produced); - tend to vary according to the size of the enterprise (with the area of the crop or the
number of livestock); and - can easily be allocated to individual enterprises. For example, considerable labour is required in vegetable production. If a farmer has to hire labour, then as production increases, so too will the need for hired labour. Similarly, Fuel costs for a tractor increase as the use of the tractor increases; or the greater area a farmer plants to bananas, the higher the fertilizer costs. Thus, variable costs in farming are usually costs of seed, fertilizers, sprays, livestock feeds, veterinary services, fuel and lubricants, interest, etc.
The variable costs of a crop enterprise could include, for example: - Seed: This is usually bought but may be a mixture of purchased and home-grown seed.
Home-grown seed may have been kept in storage since the end of the previous season and as such needs to be valued. Although it is home-grown, it will have a value (the value at which it might have been sold).
- Fertilizer: This is normally purchased but could include animal or farmyard manure. The value of the latter may be the nutrient replacement value. The nutrients found in manure replace some or all of those found in artificial fertilizer.
- Sprays: This includes chemical or biological agents used to control weeds, pests or diseases.
- Hired Labour: This covers the labour brought in from outside the farm. Hired labour is used for tasks required to be done quickly at times when insufficient numbers of the
farm’s own workforce are available (e.g. special weeding operations, assistance with pineapple harvesting or banana sorting before marketing).
- Fuel and Lubricants: Includes the costs of fuel and lubricants used in farm equipment and machinery.
- Miscellaneous Crop Costs: This includes all other costs attributable to crops that have not been included under the other headings. For example, bananas may be sold in boxes. This item would be placed under this heading.
The variable costs of a livestock enterprise would include:
- Feed: Includes feed purchased or transferred from another enterprise on the farm (e.g. maize produced on the farm and used to prepare a ration for animal feed).
- Veterinary Fees and Medicines: This heading covers all expenditures for animal health, mainly veterinary practitioners’ fees and medicines. Prophylactic doses of mineral or vitamins for the improved animal health of intensively reared stock (e.g. pigs or poultry) would also be included.
- Livestock Transport: If the amount of produce to be transported is considerable, a transportation company may need to be contracted. For small amounts of produce sold, farmers often prefer to take their own animals to market.
- Fuel and Lubricants: These include the costs of fuel and lubricants for farm equipment.
- Miscellaneous Livestock Costs: These include such items as ear tags for animal identification and bedding. Purchased forage in small amounts could also be included but large quantities purchased should be added to the feed cost item.
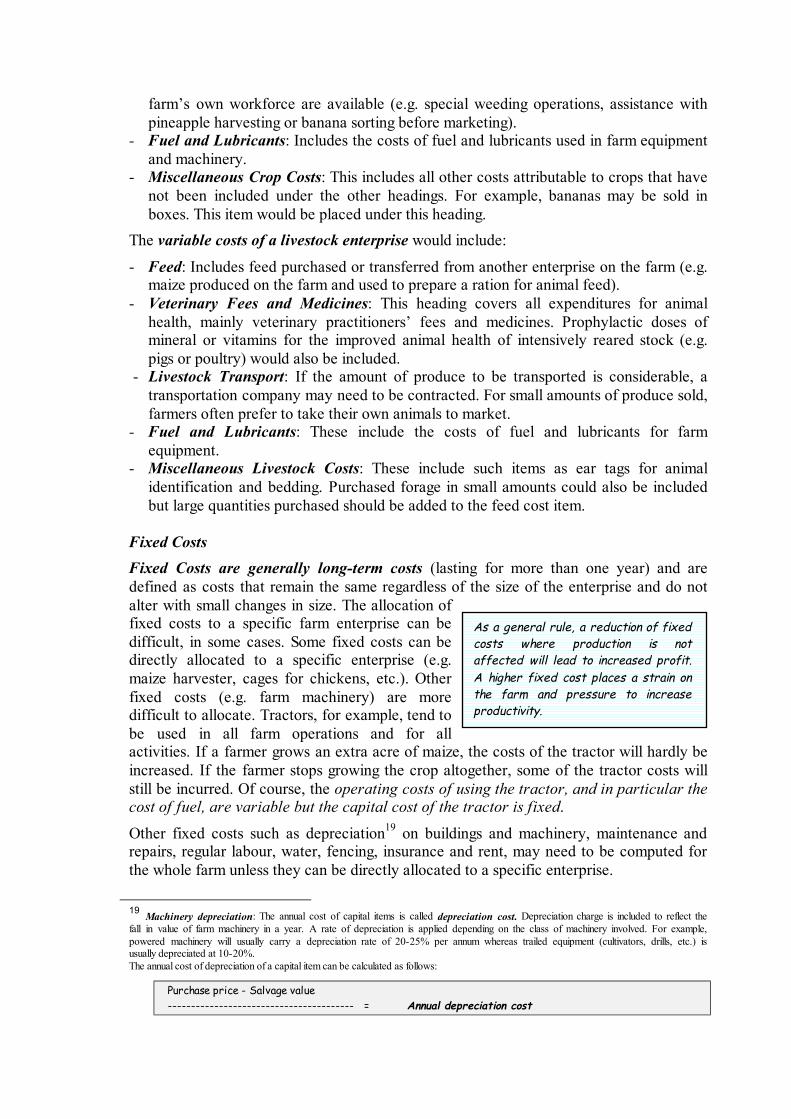
Fixed Costs Fixed Costs are generally long-term costs (lasting for more than one year) and are defined as costs that remain the same regardless of the size of the enterprise and do not alter with small changes in size. The allocation of fixed costs to a specific farm enterprise can be difficult, in some cases. Some fixed costs can be directly allocated to a specific enterprise (e.g. maize harvester, cages for chickens, etc.). Other fixed costs (e.g. farm machinery) are more difficult to allocate. Tractors, for example, tend to be used in all farm operations and for all activities. If a farmer grows an extra acre of maize, the costs of the tractor will hardly be increased. If the farmer stops growing the crop altogether, some of the tractor costs will still be incurred. Of course, the operating costs of using the tractor, and in particular the cost of fuel, are variable but the capital cost of the tractor is fixed.
Other fixed costs such as depreciation19 on buildings and machinery, maintenance and repairs, regular labour, water, fencing, insurance and rent, may need to be computed for the whole farm unless they can be directly allocated to a specific enterprise.
19 Machinery depreciation: The annual cost of capital items is called depreciation cost. Depreciation charge is included to reflect the fall in value of farm machinery in a year. A rate of depreciation is applied depending on the class of machinery involved. For example, powered machinery will usually carry a depreciation rate of 20-25% per annum whereas trailed equipment (cultivators, drills, etc.) is usually depreciated at 10-20%. The annual cost of depreciation of a capital item can be calculated as follows:
Purchase price - Salvage value ---------------------------------------- = Annual depreciation cost
As a general rule, a reduction of fixed costs where production is not affected will lead to increased profit. A higher fixed cost places a strain on the farm and pressure to increase productivity.
Labour can be either supplied by the farm family or hired. Hired labour is treated as a variable cost as noted above. Family labour is sometimes treated as a variable cost and on other occasions as a fixed cost. This depends very much on the family unit size and composition which varies between countries and cultures. Where the farm operations are shared between the adult members of the family on a regular basis throughout the year, family labour is treated as a fixed cost. However, some members of the family, particularly children, might also help out for specific operations at particular times of the year. In this event their labour contribution could be treated as a variable cost.
For small farms, family labour normally does not constitute a cost. However, the cost of family labour should be valued as if it were all hired. To value this cost, the concept of opportunity cost - the cost of any choice is given by the value of the best alternative use foregone - can be applied. Gross Margin Gross margin is a simple, useful and practical tool to assess farm performance. The gross margin for an enterprise is defined as the gross income minus its variable costs.
Gross margin = Gross income - variable costs
A farmer who uses his resources to grow crops worth $60 at a variable cost of $10 is generating a gross margin of $50 ($60-$50). The gross margin is a measure of what that enterprise is adding to farm profits. Variable costs rise and fall as the enterprise expands and contracts. The fixed costs of the farm will not be affected if a farmer decides to grow a new crop. Only the variable costs will be increased together with the total value of production of the farm. If the extra variable cost is less than the value of extra production, the farmer will increase profits by growing that crop. Farm profits will be increased by the value of the gross margin for the crop. Enterprise Profitability A profitability calculation conducted for the whole farm may indicate a problem, but the source of the problem is often difficult to find if there are many enterprises. Some enterprises may be highly profitable, while others are unprofitable or less profitable. This requires analyses of profitability for the different farm enterprises.
The calculation of enterprise profitability consists of deducting all of the costs incurred for the enterprise i.e. fixed and variable costs, from the enterprise gross income. When the enterprise gross margin was calculated above, only the variable costs were taken into account. Now in calculating the enterprise profit the total cost of production – fixed as well as variable- is considered.
Enterprise profit calculations assume that the fixed costs can be allocated to the enterprise. This may, however, in some cases be difficult to assess. The allocable fixed costs may include family labour, rental charges, taxes, depreciation and interest on machinery and
Useful life in years
Where: Purchase price = is the value of the capital investment at the time of the purchase. Salvage value = is the value of the implement at the time it has come to the end of its useful life.
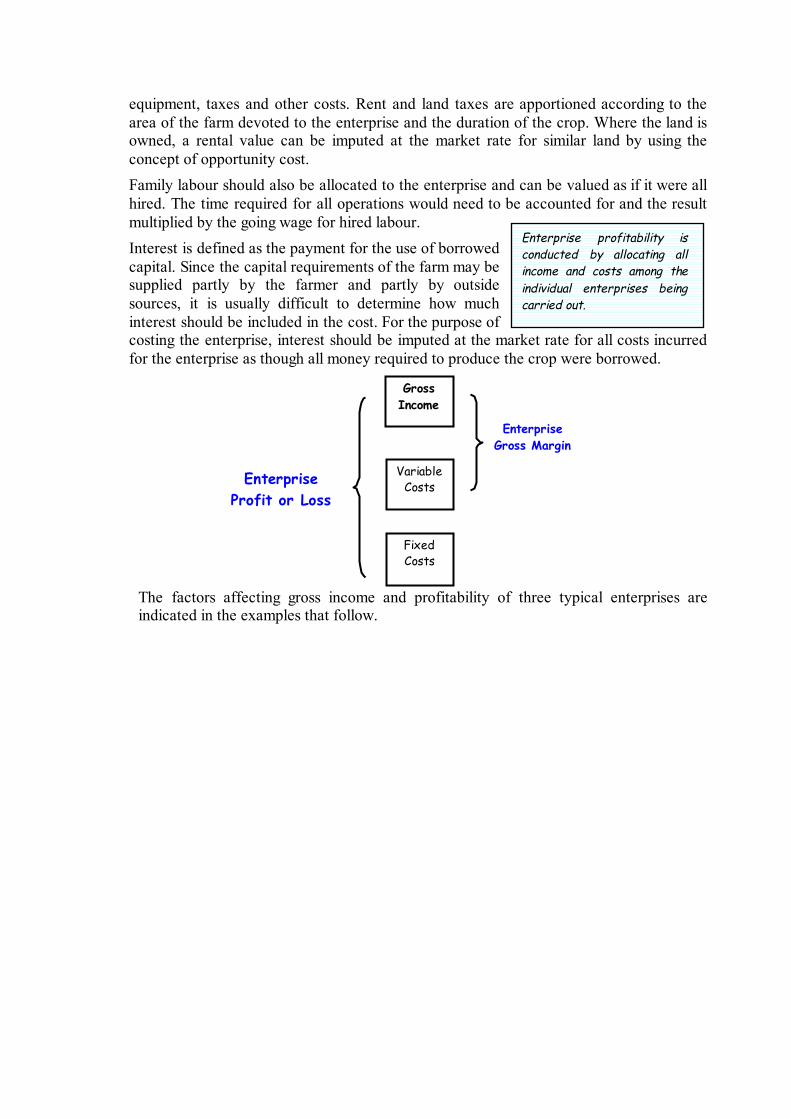
equipment, taxes and other costs. Rent and land taxes are apportioned according to the area of the farm devoted to the enterprise and the duration of the crop. Where the land is owned, a rental value can be imputed at the market rate for similar land by using the concept of opportunity cost. Family labour should also be allocated to the enterprise and can be valued as if it were all hired. The time required for all operations would need to be accounted for and the result multiplied by the going wage for hired labour. Interest is defined as the payment for the use of borrowed capital. Since the capital requirements of the farm may be supplied partly by the farmer and partly by outside sources, it is usually difficult to determine how much interest should be included in the cost. For the purpose of costing the enterprise, interest should be imputed at the market rate for all costs incurred for the enterprise as though all money required to produce the crop were borrowed.
The factors affecting gross income and profitability of three typical enterprises are indicated in the examples that follow.
Gross Income
Variable Costs
Fixed Costs
Enterprise Gross Margin
Enterprise Profit or Loss
Enterprise profitability is conducted by allocating all income and costs among the individual enterprises being carried out.
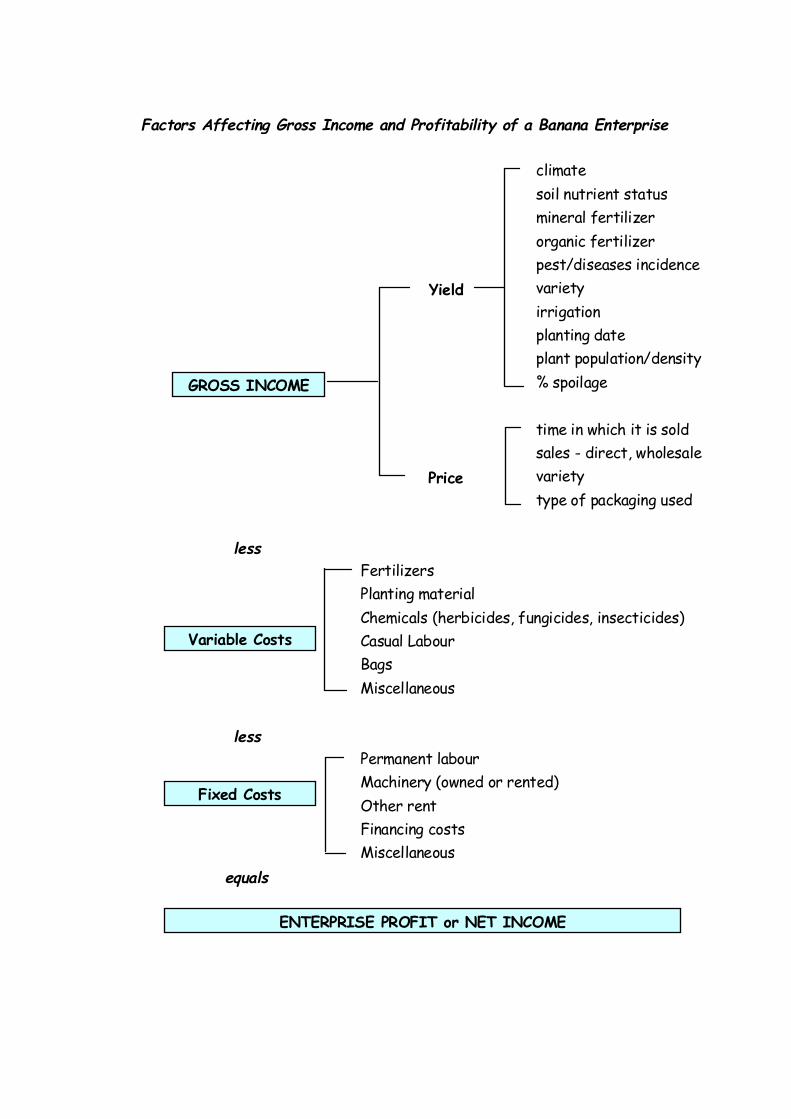
Factors Affecting Gross Income and Profitability of a Banana Enterprise
climatesoil nutrient statusmineral fertilizerorganic fertilizerpest/diseases incidence
Yield varietyirrigationplanting dateplant population/density% spoilage
time in which it is soldsales - direct, wholesale
Price varietytype of packaging used
lessFertilizersPlanting materialChemicals (herbicides, fungicides, insecticides)Casual LabourBagsMiscellaneous
lessPermanent labourMachinery (owned or rented)Other rentFinancing costsMiscellaneous
equals
GROSS INCOME
Variable Costs
Fixed Costs
ENTERPRISE PROFIT or NET INCOME
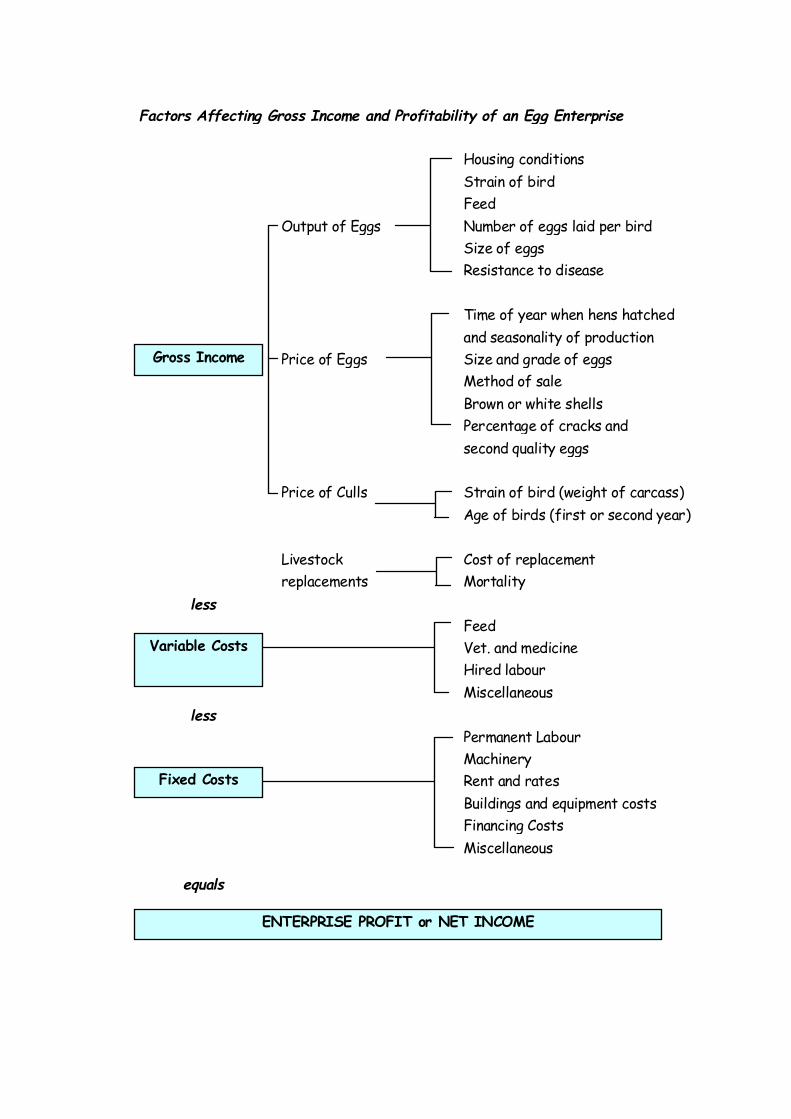
Factors Affecting Gross Income and Profitability of an Egg Enterprise
Housing conditionsStrain of birdFeed
Output of Eggs Number of eggs laid per birdSize of eggsResistance to disease
Time of year when hens hatchedand seasonality of production
Price of Eggs Size and grade of eggsMethod of saleBrown or white shellsPercentage of cracks andsecond quality eggs
Price of Culls Strain of bird (weight of carcass)Age of birds (first or second year)
Livestock Cost of replacementreplacements Mortality
lessFeedVet. and medicineHired labourMiscellaneous
lessPermanent LabourMachineryRent and ratesBuildings and equipment costsFinancing CostsMiscellaneous
equals
Gross Income
Variable Costs
Fixed Costs
ENTERPRISE PROFIT or NET INCOME
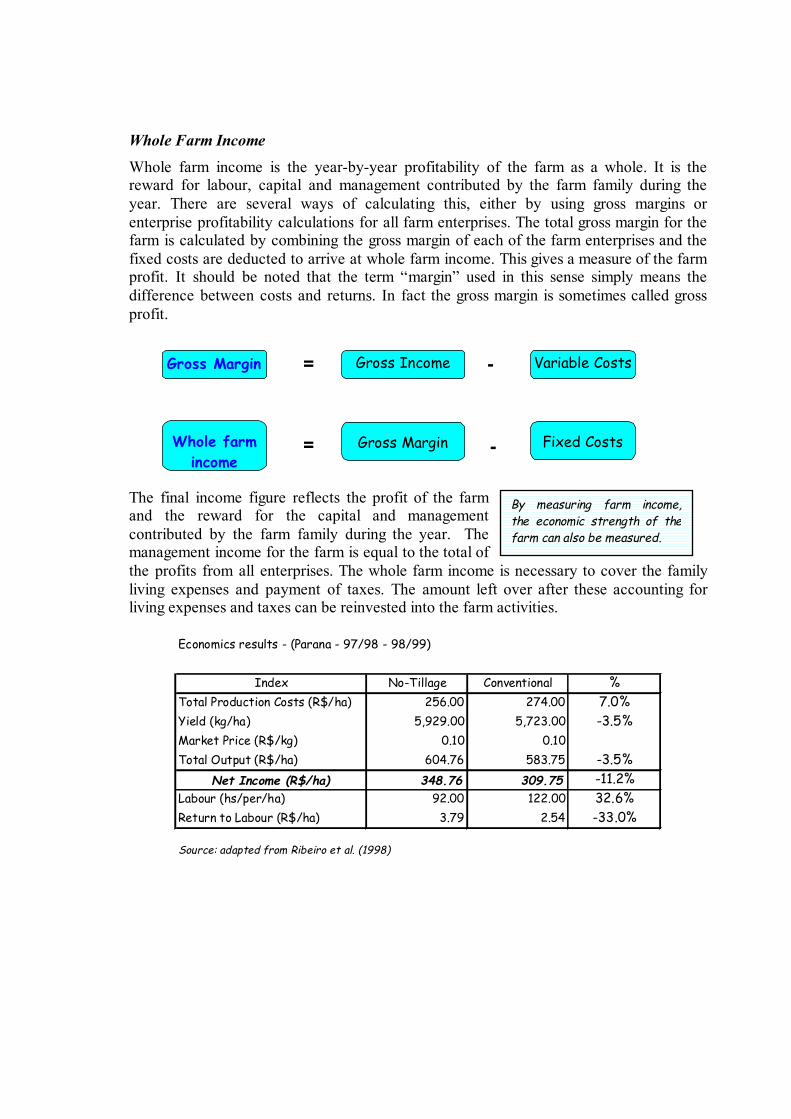
Whole Farm Income Whole farm income is the year-by-year profitability of the farm as a whole. It is the reward for labour, capital and management contributed by the farm family during the year. There are several ways of calculating this, either by using gross margins or enterprise profitability calculations for all farm enterprises. The total gross margin for the farm is calculated by combining the gross margin of each of the farm enterprises and the fixed costs are deducted to arrive at whole farm income. This gives a measure of the farm profit. It should be noted that the term “margin” used in this sense simply means the difference between costs and returns. In fact the gross margin is sometimes called gross profit.
The final income figure reflects the profit of the farm and the reward for the capital and management contributed by the farm family during the year. The management income for the farm is equal to the total of the profits from all enterprises. The whole farm income is necessary to cover the family living expenses and payment of taxes. The amount left over after these accounting for living expenses and taxes can be reinvested into the farm activities.
Economics results - (Parana - 97/98 - 98/99)
Index No-Tillage Conventional %Total Production Costs (R$/ha) 256.00 274.00 7.0%Yield (kg/ha) 5,929.00 5,723.00 -3.5%Market Price (R$/kg) 0.10 0.10Total Output (R$/ha) 604.76 583.75 -3.5%
Net Income (R$/ha) 348.76 309.75 -11.2%Labour (hs/per/ha) 92.00 122.00 32.6%Return to Labour (R$/ha) 3.79 2.54 -33.0%
Source: adapted from Ribeiro et al. (1998)
Gross Margin
Whole farm income
Gross Income
Gross Margin
Variable Costs
Fixed Costs
=
=
-
-
By measuring farm income,the economic strength of thefarm can also be measured.
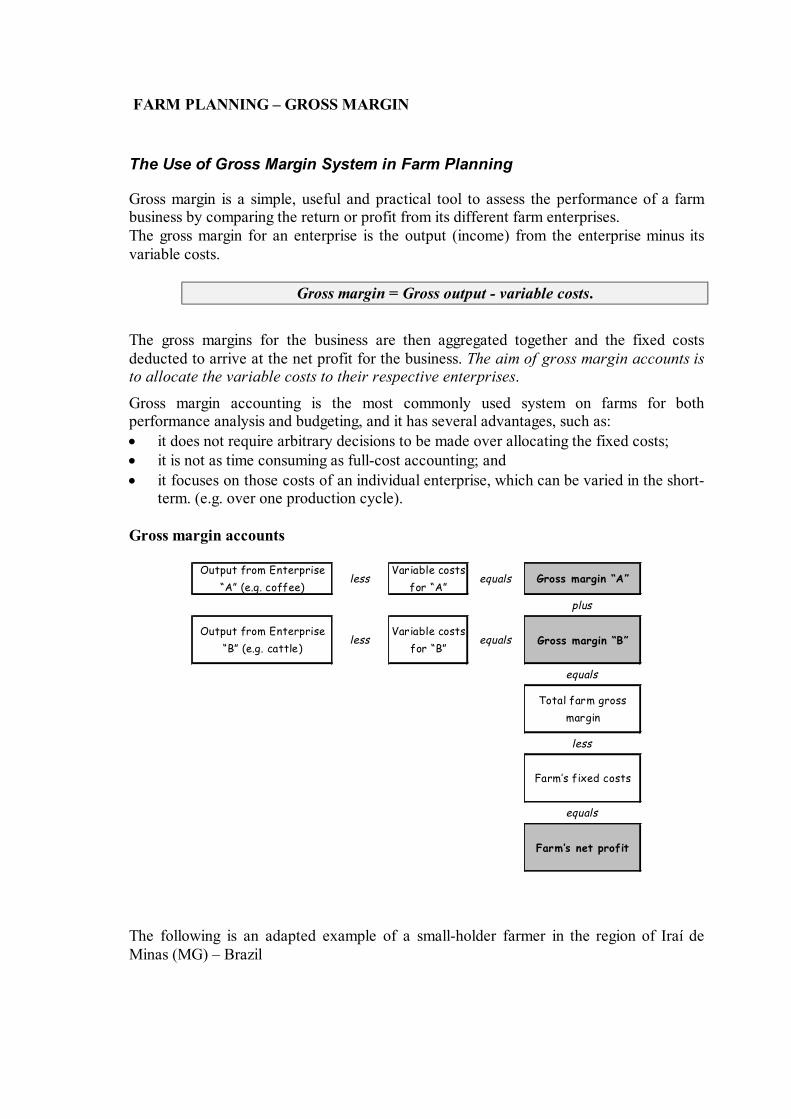
FARM PLANNING – GROSS MARGIN
The Use of Gross Margin System in Farm Planning
Gross margin is a simple, useful and practical tool to assess the performance of a farm business by comparing the return or profit from its different farm enterprises. The gross margin for an enterprise is the output (income) from the enterprise minus its variable costs.
Gross margin = Gross output - variable costs.
The gross margins for the business are then aggregated together and the fixed costs deducted to arrive at the net profit for the business. The aim of gross margin accounts is to allocate the variable costs to their respective enterprises.
Gross margin accounting is the most commonly used system on farms for both performance analysis and budgeting, and it has several advantages, such as:
it does not require arbitrary decisions to be made over allocating the fixed costs; it is not as time consuming as full-cost accounting; and it focuses on those costs of an individual enterprise, which can be varied in the short-term. (e.g. over one production cycle).
Gross margin accounts
Output from Enterprise “A” (e.g. coffee)
lessVariable costs
for “A”equals Gross margin “A”
plus
Output from Enterprise “B” (e.g. cattle)
lessVariable costs
for “B”equals Gross margin “B”
equals
Total farm gross margin
less
Farm’s fixed costs
equals
Farm’s net profit
The following is an adapted example of a small-holder farmer in the region of Iraí de Minas (MG) – Brazil
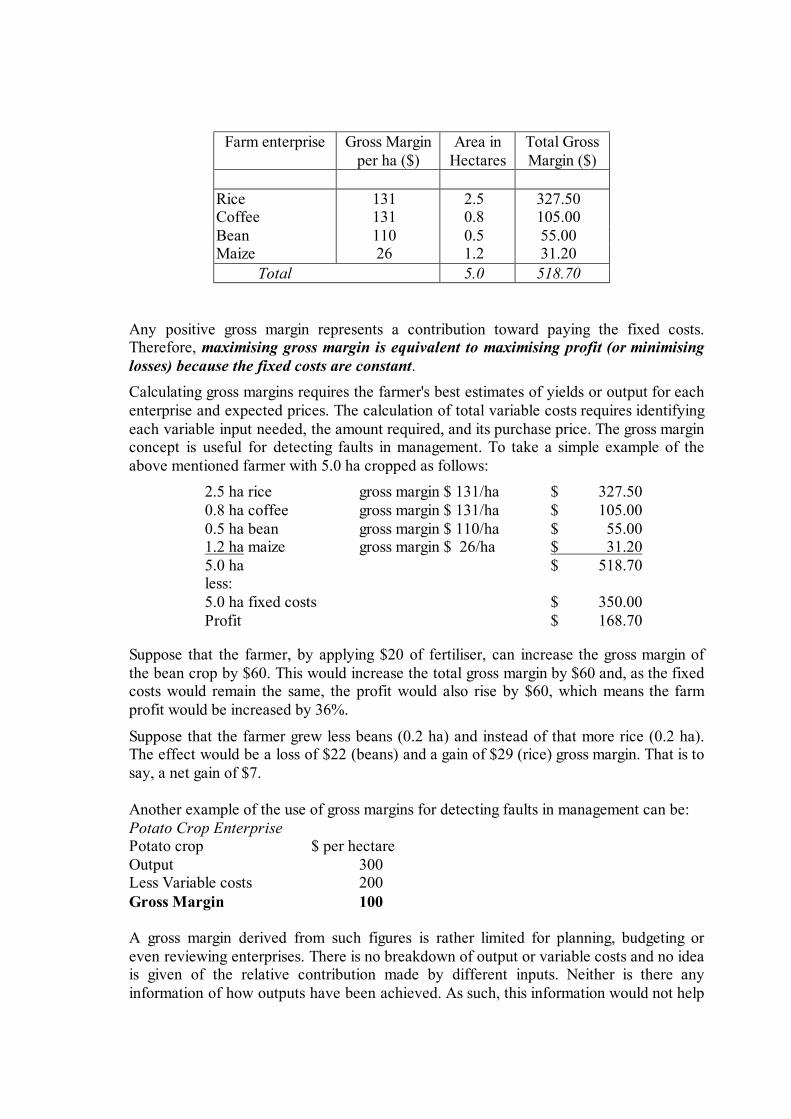
Farm enterprise Gross Margin per ha ($)
Area in Hectares
Total Gross Margin ($)
Rice 131 2.5 327.50 Coffee 131 0.8 105.00 Bean 110 0.5 55.00 Maize 26 1.2 31.20
Total 5.0 518.70
Any positive gross margin represents a contribution toward paying the fixed costs. Therefore, maximising gross margin is equivalent to maximising profit (or minimising losses) because the fixed costs are constant. Calculating gross margins requires the farmer's best estimates of yields or output for each enterprise and expected prices. The calculation of total variable costs requires identifying each variable input needed, the amount required, and its purchase price. The gross margin concept is useful for detecting faults in management. To take a simple example of the above mentioned farmer with 5.0 ha cropped as follows:
2.5 ha rice gross margin $ 131/ha $ 327.50 0.8 ha coffee gross margin $ 131/ha $ 105.00 0.5 ha bean gross margin $ 110/ha $ 55.00 1.2 ha maize gross margin $ 26/ha $ 31.20 5.0 ha $ 518.70 less: 5.0 ha fixed costs $ 350.00 Profit $ 168.70
Suppose that the farmer, by applying $20 of fertiliser, can increase the gross margin of the bean crop by $60. This would increase the total gross margin by $60 and, as the fixed costs would remain the same, the profit would also rise by $60, which means the farm profit would be increased by 36%.
Suppose that the farmer grew less beans (0.2 ha) and instead of that more rice (0.2 ha). The effect would be a loss of $22 (beans) and a gain of $29 (rice) gross margin. That is to say, a net gain of $7. Another example of the use of gross margins for detecting faults in management can be: Potato Crop Enterprise Potato crop $ per hectare Output 300 Less Variable costs 200 Gross Margin 100 A gross margin derived from such figures is rather limited for planning, budgeting or even reviewing enterprises. There is no breakdown of output or variable costs and no idea is given of the relative contribution made by different inputs. Neither is there any information of how outputs have been achieved. As such, this information would not help
farmers in the adoption of a new technology. Therefore, it is essential to have as detailed a breakdown of variable costs and output as possible.
Potato crop $/hectare Output 300 less Variable costs: - seed 60 (30.0%) - fertiliser 25 (12.5%) - pesticides 35 (17.5%) - contract labour 40 (20.0%) - other 40 (20.0%) Total variable costs 200 Gross Margin 100
Now we have a much clearer picture of how costs have been made up and we can take the first step assessing technical as well as financial performance of the enterprise. For example, we know that 30% of the variable costs of production is seeds and contract labour account for 20%. This will provide useful data for comparison with other similar enterprises on neighbouring farms or in the region.
However to be most useful we should have details of the physical usage relating to each cost. For example: Potato crop $/unit $/hectare Variable costs - seed 3.0 t/ha x 20 $/t 60 - fertiliser: 25 200 kg N 7 250 kg P2O5 12 250 kg K2O 6 - pesticides: 35 herbicides (2.5 l/ha) 12 fungicides (3x3 l/ha) 17 desiccant (4 l/ha) 6 - hired labour (100 hours) 40 - other: 40 bags 25 levy 15
Total variable costs 200
We now have a full picture of the variable costs of this potato enterprise. It is possible to assess the technical and financial strengths and weaknesses that are contributing to the overall gross margin. For example:
is the level of fertiliser application correct? is the price of seed per tonne too low, to high? why are 3 fungicides applied when other farmers locally are applying one?
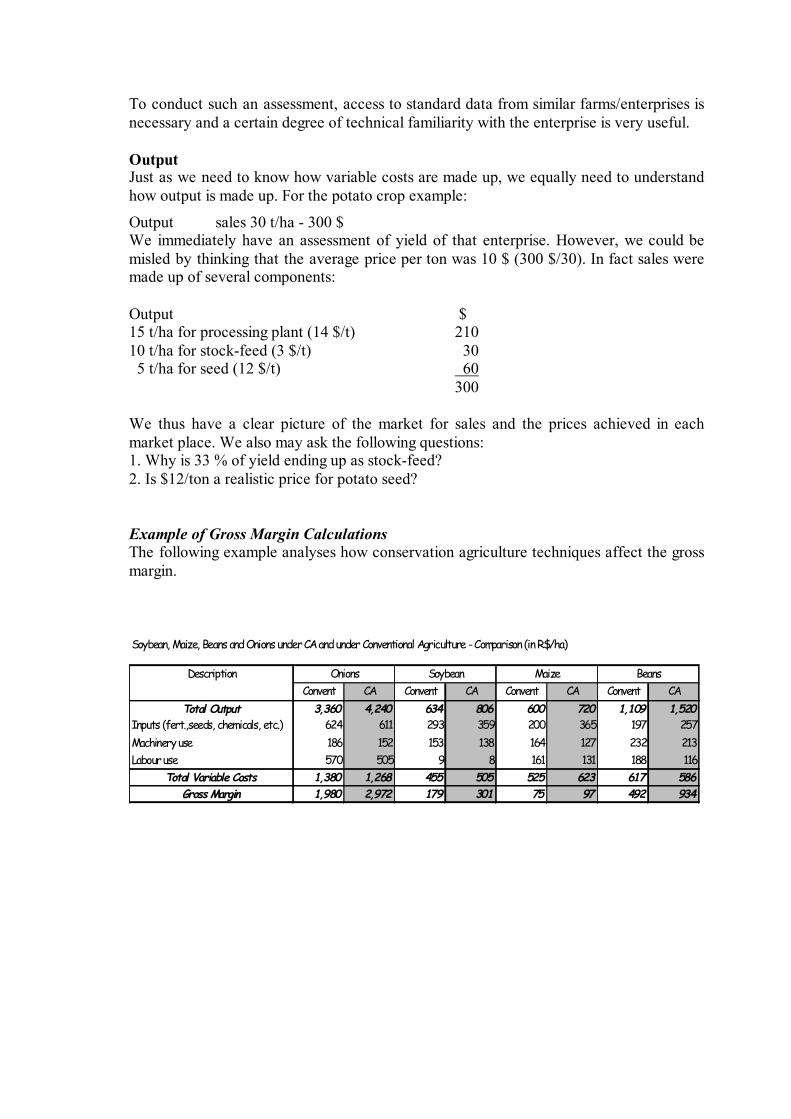
To conduct such an assessment, access to standard data from similar farms/enterprises is necessary and a certain degree of technical familiarity with the enterprise is very useful. Output Just as we need to know how variable costs are made up, we equally need to understand how output is made up. For the potato crop example:
Output sales 30 t/ha - 300 $ We immediately have an assessment of yield of that enterprise. However, we could be misled by thinking that the average price per ton was 10 $ (300 $/30). In fact sales were made up of several components: Output $ 15 t/ha for processing plant (14 $/t) 210 10 t/ha for stock-feed (3 $/t) 30 5 t/ha for seed (12 $/t) 60 300 We thus have a clear picture of the market for sales and the prices achieved in each market place. We also may ask the following questions: 1. Why is 33 % of yield ending up as stock-feed? 2. Is $12/ton a realistic price for potato seed? Example of Gross Margin Calculations The following example analyses how conservation agriculture techniques affect the gross margin. Soybean, Maize, Beans and Onions under CA and under Conventional Agriculture - Comparison (in R$/ha)
DescriptionConvent CA Convent CA Convent CA Convent CA
Total Output 3,360 4,240 634 806 600 720 1,109 1,520Inputs (fert.,seeds, chemicals, etc.) 624 611 293 359 200 365 197 257Machinery use 186 152 153 138 164 127 232 213Labour use 570 505 9 8 161 131 188 116
Total Variable Costs 1,380 1,268 455 505 525 623 617 586Gross Margin 1,980 2,972 179 301 75 97 492 934
Onions Soybean Maize Beans
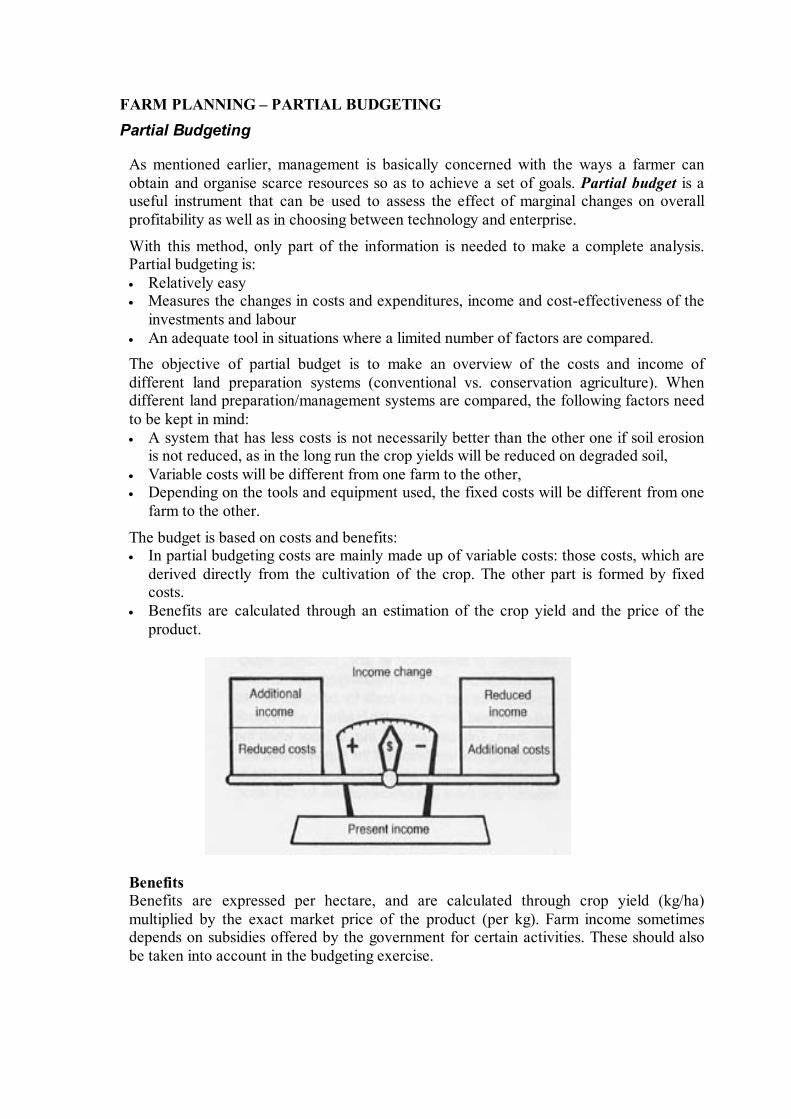
FARM PLANNING – PARTIAL BUDGETING Partial Budgeting
As mentioned earlier, management is basically concerned with the ways a farmer can obtain and organise scarce resources so as to achieve a set of goals. Partial budget is a useful instrument that can be used to assess the effect of marginal changes on overall profitability as well as in choosing between technology and enterprise.
With this method, only part of the information is needed to make a complete analysis. Partial budgeting is:
Relatively easy Measures the changes in costs and expenditures, income and cost-effectiveness of the investments and labour An adequate tool in situations where a limited number of factors are compared.
The objective of partial budget is to make an overview of the costs and income of different land preparation systems (conventional vs. conservation agriculture). When different land preparation/management systems are compared, the following factors need to be kept in mind:
A system that has less costs is not necessarily better than the other one if soil erosion is not reduced, as in the long run the crop yields will be reduced on degraded soil, Variable costs will be different from one farm to the other, Depending on the tools and equipment used, the fixed costs will be different from one farm to the other.
The budget is based on costs and benefits: In partial budgeting costs are mainly made up of variable costs: those costs, which are derived directly from the cultivation of the crop. The other part is formed by fixed costs. Benefits are calculated through an estimation of the crop yield and the price of the product.
Benefits Benefits are expressed per hectare, and are calculated through crop yield (kg/ha) multiplied by the exact market price of the product (per kg). Farm income sometimes depends on subsidies offered by the government for certain activities. These should also be taken into account in the budgeting exercise.
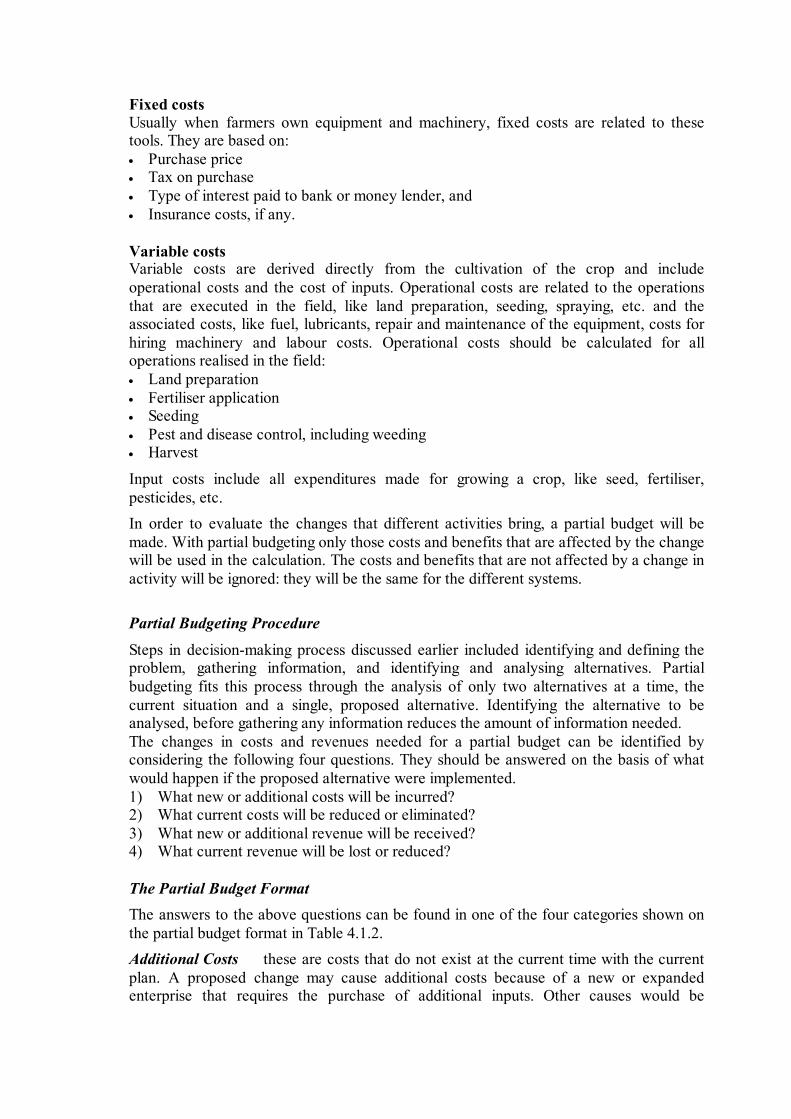
Fixed costs Usually when farmers own equipment and machinery, fixed costs are related to these tools. They are based on:
Purchase price Tax on purchase Type of interest paid to bank or money lender, and Insurance costs, if any.
Variable costs Variable costs are derived directly from the cultivation of the crop and include operational costs and the cost of inputs. Operational costs are related to the operations that are executed in the field, like land preparation, seeding, spraying, etc. and the associated costs, like fuel, lubricants, repair and maintenance of the equipment, costs for hiring machinery and labour costs. Operational costs should be calculated for all operations realised in the field:
Land preparation Fertiliser application Seeding Pest and disease control, including weeding Harvest
Input costs include all expenditures made for growing a crop, like seed, fertiliser, pesticides, etc. In order to evaluate the changes that different activities bring, a partial budget will be made. With partial budgeting only those costs and benefits that are affected by the change will be used in the calculation. The costs and benefits that are not affected by a change in activity will be ignored: they will be the same for the different systems.
Partial Budgeting Procedure Steps in decision-making process discussed earlier included identifying and defining the problem, gathering information, and identifying and analysing alternatives. Partial budgeting fits this process through the analysis of only two alternatives at a time, the current situation and a single, proposed alternative. Identifying the alternative to be analysed, before gathering any information reduces the amount of information needed. The changes in costs and revenues needed for a partial budget can be identified by considering the following four questions. They should be answered on the basis of what would happen if the proposed alternative were implemented. 1) What new or additional costs will be incurred? 2) What current costs will be reduced or eliminated? 3) What new or additional revenue will be received? 4) What current revenue will be lost or reduced? The Partial Budget Format The answers to the above questions can be found in one of the four categories shown on the partial budget format in Table 4.1.2. Additional Costs these are costs that do not exist at the current time with the current plan. A proposed change may cause additional costs because of a new or expanded enterprise that requires the purchase of additional inputs. Other causes would be
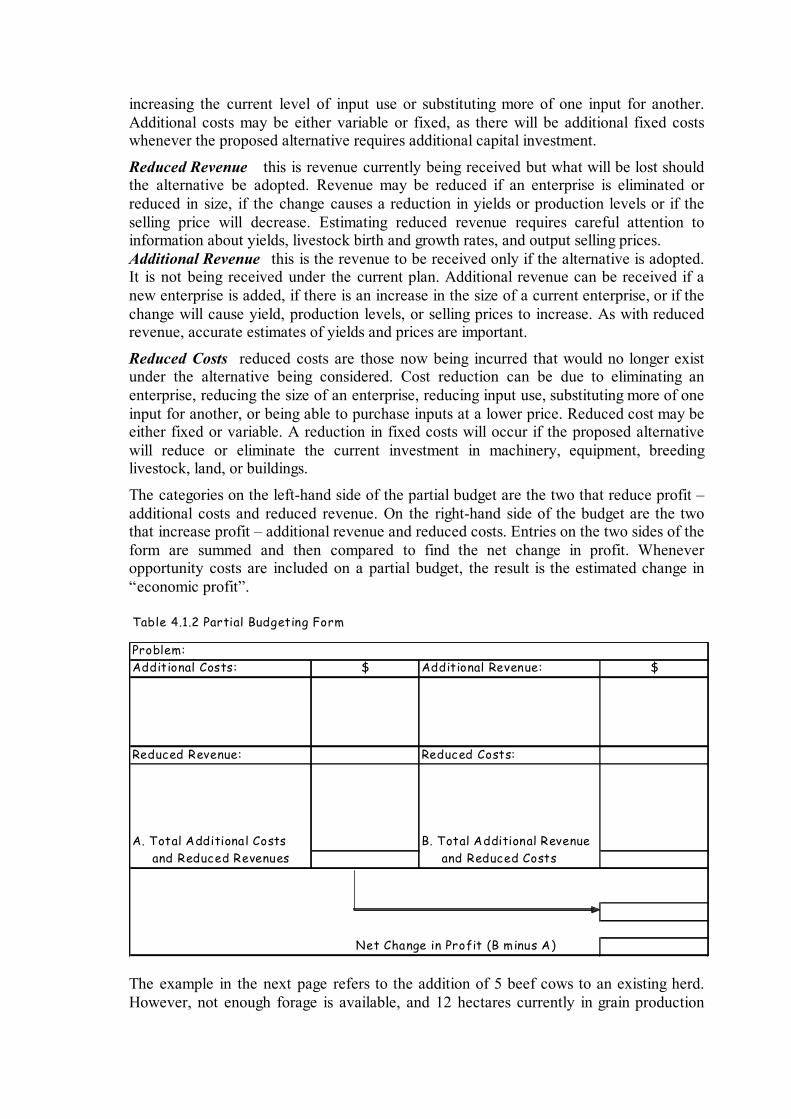
increasing the current level of input use or substituting more of one input for another. Additional costs may be either variable or fixed, as there will be additional fixed costs whenever the proposed alternative requires additional capital investment.
Reduced Revenue this is revenue currently being received but what will be lost should the alternative be adopted. Revenue may be reduced if an enterprise is eliminated or reduced in size, if the change causes a reduction in yields or production levels or if the selling price will decrease. Estimating reduced revenue requires careful attention to information about yields, livestock birth and growth rates, and output selling prices. Additional Revenue this is the revenue to be received only if the alternative is adopted. It is not being received under the current plan. Additional revenue can be received if a new enterprise is added, if there is an increase in the size of a current enterprise, or if the change will cause yield, production levels, or selling prices to increase. As with reduced revenue, accurate estimates of yields and prices are important.
Reduced Costs reduced costs are those now being incurred that would no longer exist under the alternative being considered. Cost reduction can be due to eliminating an enterprise, reducing the size of an enterprise, reducing input use, substituting more of one input for another, or being able to purchase inputs at a lower price. Reduced cost may be either fixed or variable. A reduction in fixed costs will occur if the proposed alternative will reduce or eliminate the current investment in machinery, equipment, breeding livestock, land, or buildings.
The categories on the left-hand side of the partial budget are the two that reduce profit – additional costs and reduced revenue. On the right-hand side of the budget are the two that increase profit – additional revenue and reduced costs. Entries on the two sides of the form are summed and then compared to find the net change in profit. Whenever opportunity costs are included on a partial budget, the result is the estimated change in “economic profit”. Table 4.1.2 Partial Budgeting Form
Problem:Additional Costs: $ Additional Revenue: $
Reduced Revenue: Reduced Costs:
A. Total Additional Costs B. Total Additional Revenue and Reduced Revenues and Reduced Costs
Net Change in Profit (B minus A) The example in the next page refers to the addition of 5 beef cows to an existing herd. However, not enough forage is available, and 12 hectares currently in grain production
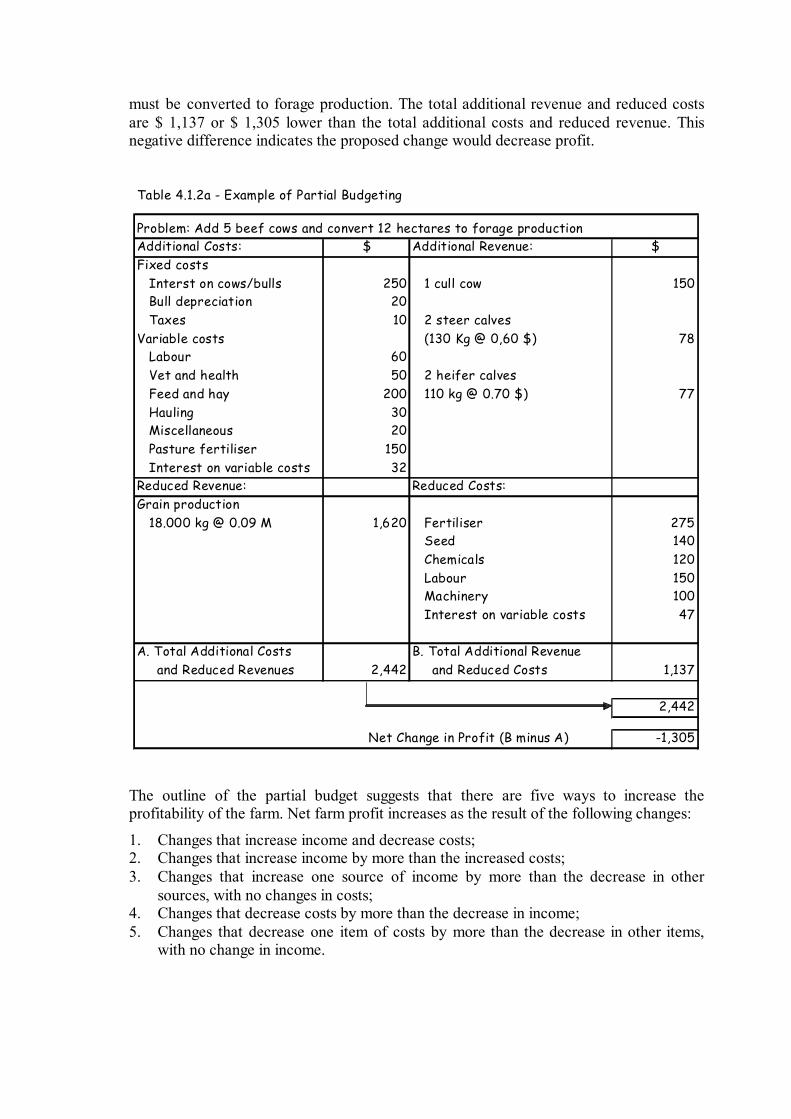
must be converted to forage production. The total additional revenue and reduced costs are $ 1,137 or $ 1,305 lower than the total additional costs and reduced revenue. This negative difference indicates the proposed change would decrease profit.
Table 4.1.2a - Example of Partial Budgeting
Problem: Add 5 beef cows and convert 12 hectares to forage productionAdditional Costs: $ Additional Revenue: $Fixed costs Interst on cows/bulls 250 1 cull cow 150 Bull depreciation 20 Taxes 10 2 steer calvesVariable costs (130 Kg @ 0,60 $) 78 Labour 60 Vet and health 50 2 heifer calves Feed and hay 200 110 kg @ 0.70 $) 77 Hauling 30 Miscellaneous 20 Pasture fertiliser 150 Interest on variable costs 32Reduced Revenue: Reduced Costs:Grain production 18.000 kg @ 0.09 M 1,620 Fertiliser 275
Seed 140 Chemicals 120 Labour 150 Machinery 100 Interest on variable costs 47
A. Total Additional Costs B. Total Additional Revenue and Reduced Revenues 2,442 and Reduced Costs 1,137
2,442
-1,305Net Change in Profit (B minus A) The outline of the partial budget suggests that there are five ways to increase the profitability of the farm. Net farm profit increases as the result of the following changes:
1. Changes that increase income and decrease costs; 2. Changes that increase income by more than the increased costs; 3. Changes that increase one source of income by more than the decrease in other
sources, with no changes in costs; 4. Changes that decrease costs by more than the decrease in income; 5. Changes that decrease one item of costs by more than the decrease in other items,
with no change in income.

Although these five ways to increase profitability are quite obvious, the farmer's job is not easy to discover the changes that are possible and evaluate them within the partial budget framework.
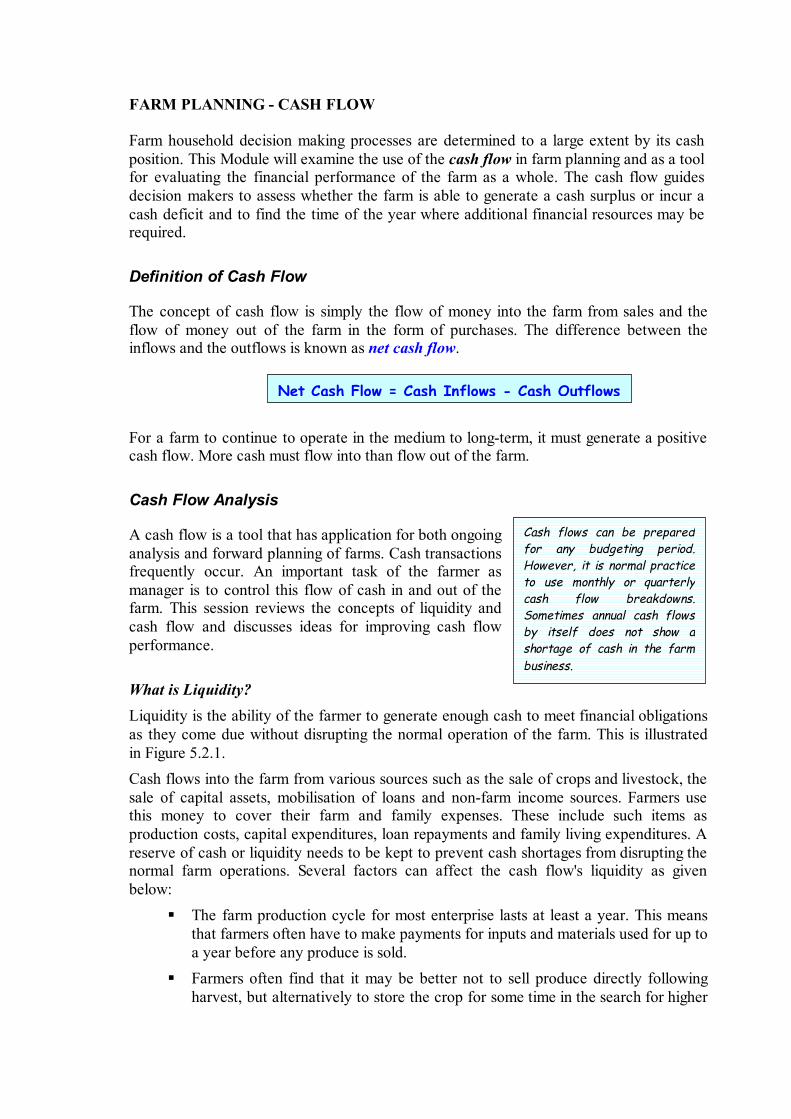
FARM PLANNING - CASH FLOW Farm household decision making processes are determined to a large extent by its cash position. This Module will examine the use of the cash flow in farm planning and as a tool for evaluating the financial performance of the farm as a whole. The cash flow guides decision makers to assess whether the farm is able to generate a cash surplus or incur a cash deficit and to find the time of the year where additional financial resources may be required. Definition of Cash Flow
The concept of cash flow is simply the flow of money into the farm from sales and the flow of money out of the farm in the form of purchases. The difference between the inflows and the outflows is known as net cash flow.
For a farm to continue to operate in the medium to long-term, it must generate a positive cash flow. More cash must flow into than flow out of the farm. Cash Flow Analysis
A cash flow is a tool that has application for both ongoing analysis and forward planning of farms. Cash transactions frequently occur. An important task of the farmer as manager is to control this flow of cash in and out of the farm. This session reviews the concepts of liquidity and cash flow and discusses ideas for improving cash flow performance. What is Liquidity? Liquidity is the ability of the farmer to generate enough cash to meet financial obligations as they come due without disrupting the normal operation of the farm. This is illustrated in Figure 5.2.1. Cash flows into the farm from various sources such as the sale of crops and livestock, the sale of capital assets, mobilisation of loans and non-farm income sources. Farmers use this money to cover their farm and family expenses. These include such items as production costs, capital expenditures, loan repayments and family living expenditures. A reserve of cash or liquidity needs to be kept to prevent cash shortages from disrupting the normal farm operations. Several factors can affect the cash flow's liquidity as given below:
The farm production cycle for most enterprise lasts at least a year. This means that farmers often have to make payments for inputs and materials used for up to a year before any produce is sold. Farmers often find that it may be better not to sell produce directly following harvest, but alternatively to store the crop for some time in the search for higher
Net Cash Flow = Cash Inflows - Cash Outflows
Cash flows can be preparedfor any budgeting period.However, it is normal practiceto use monthly or quarterlycash flow breakdowns.Sometimes annual cash flowsby itself does not show ashortage of cash in the farmbusiness.
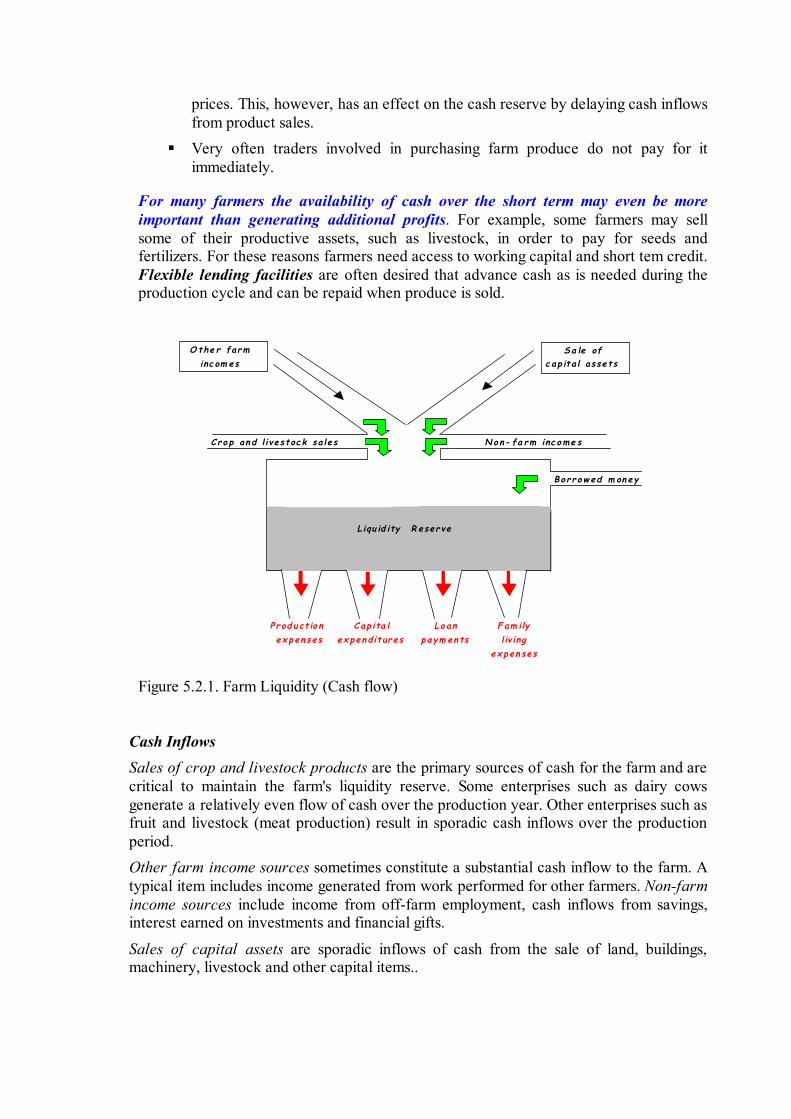
prices. This, however, has an effect on the cash reserve by delaying cash inflows from product sales. Very often traders involved in purchasing farm produce do not pay for it immediately.
For many farmers the availability of cash over the short term may even be more important than generating additional profits. For example, some farmers may sell some of their productive assets, such as livestock, in order to pay for seeds and fertilizers. For these reasons farmers need access to working capital and short tem credit. Flexible lending facilities are often desired that advance cash as is needed during the production cycle and can be repaid when produce is sold.
Figure 5.2.1. Farm Liquidity (Cash flow)
Cash Inflows Sales of crop and livestock products are the primary sources of cash for the farm and are critical to maintain the farm's liquidity reserve. Some enterprises such as dairy cows generate a relatively even flow of cash over the production year. Other enterprises such as fruit and livestock (meat production) result in sporadic cash inflows over the production period. Other farm income sources sometimes constitute a substantial cash inflow to the farm. A typical item includes income generated from work performed for other farmers. Non-farm income sources include income from off-farm employment, cash inflows from savings, interest earned on investments and financial gifts.
Sales of capital assets are sporadic inflows of cash from the sale of land, buildings, machinery, livestock and other capital items..
Cro p an d l ivestoc k sa les Non- fa rm inc ome s
Bo rrowed m on ey
P rod u ct io n Cap ita l Lo an Fam ily ex pen ses ex penditures paym en ts l iv ing
ex pen ses
L iqu id ity R eserve
Sa le of c ap ita l assets
O the r farm inc om es
Borrowed money is also a source of cash, as shown in Figure 1. It enters the cash reserve from the side rather than the top as it is often considered a source of cash used to maintain liquidity when cash outflows exceed inflows. Borrowed money takes the form of short-term loans to cover operating costs and longer term loans for the purchase of assets such as machinery, livestock and buildings.
Cash Outflows Production costs constitute a relatively large draw on the liquidity reserve. These costs include seed, fertilizer, pesticides, feed, hired labour, repairs and others. If a farmer fails to maintain a liquidity reserve to meet these costs, farm production could immediately drop and the farmer could end up paying a high level of interest on borrowed money.
Capital expenditures include cash outlays for replacing or adding machinery and equipment, breeding livestock, and purchasing land and buildings. These expenditures are important for increasing and maintaining farm growth. The cash outflows are sporadic but often involve large amounts of money. Consequently, the farmer needs to ensure that the liquidity reserve is adequate to meet these expenditures.
Loan payments on borrowed money can be made during times when cash inflow from non-borrowed sources exceed cash outflow.
Family living expenditures are often overlooked in assessing the liquidity reserve. Certain basic family living expenses must be covered because money allocated to other uses in the farm sometimes find its way into the family budget.
Practical Application of Cash Flow Farmers need to be aware of the cash flow situation of the farm to ensure that cash is available to cover expenses when needed. In practice, cash flow can be used:
a) To monitor liquidity An effective way of maintaining a cash reserve is through cash flow planning. The cash flow records the timing and size of the cash inflows and outflows that occur over a given period, normally one year. The year is broken down into shorter periods of months or quarters.
A projected cash flow could be completed at the beginning of the year and estimates made of the expected cash inflows and outflows over the period. This is done to estimate the liquidity reserve or cash balance. A cash flow of actual cash transactions could be record as they take place over the year. The actual cash flow could be compared with the projected cash flow as a way of monitoring the plan, devising solutions to problems, and take advantage of opportunities that occur.
b) For farm planning and management The actual cash flow is compared with the projected cash flow to improve the performance of the farm. The actual cash flow from one year can be used to project the cash flow for the next year. In this way farmers will know that they have cash reserves available and will not be surprised by cash shortfalls.
Projecting a cash flow is sometimes difficult. Crop and livestock budgets are useful in this, providing necessary information for projecting future cash flows. The farmer should also anticipate the changes in farm operations that are expected to take place the
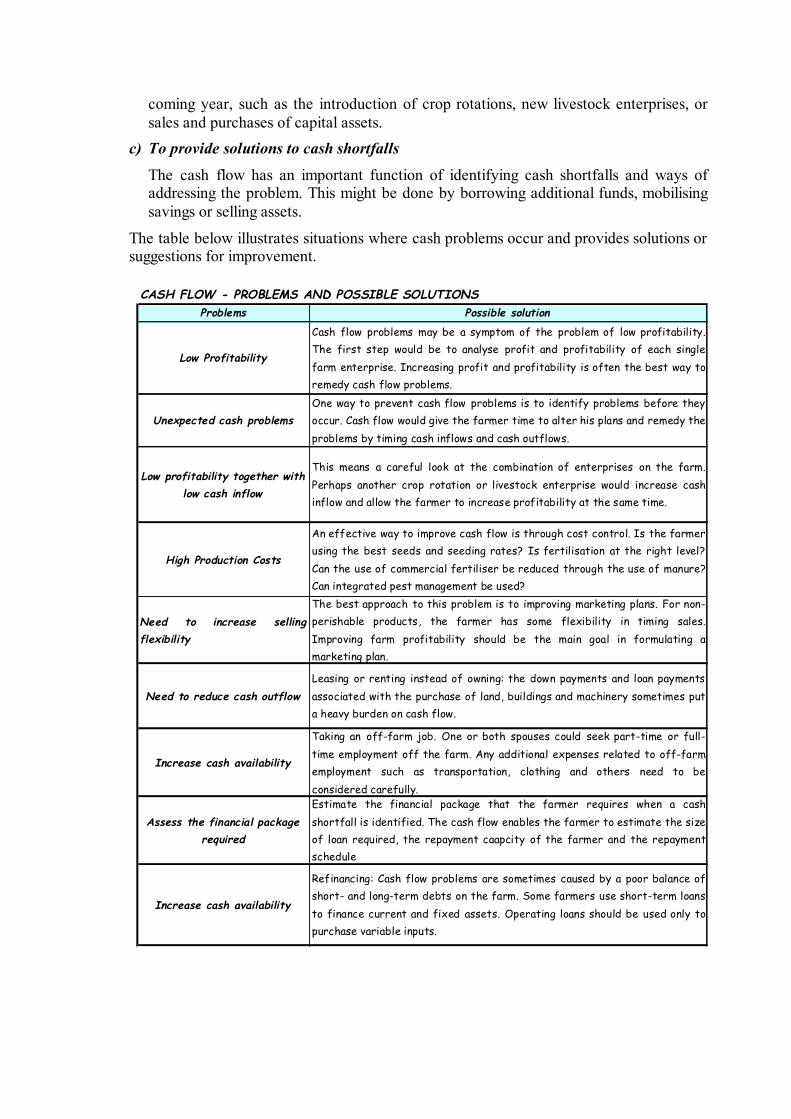
coming year, such as the introduction of crop rotations, new livestock enterprises, or sales and purchases of capital assets.
c) To provide solutions to cash shortfalls The cash flow has an important function of identifying cash shortfalls and ways of addressing the problem. This might be done by borrowing additional funds, mobilising savings or selling assets.
The table below illustrates situations where cash problems occur and provides solutions or suggestions for improvement.
CASH FLOW - PROBLEMS AND POSSIBLE SOLUTIONSProblems Possible solution
Low Profitability
Cash flow problems may be a symptom of the problem of low profitability.The first step would be to analyse profit and profitability of each singlefarm enterprise. Increasing profit and profitability is often the best way toremedy cash flow problems.
Unexpected cash problemsOne way to prevent cash flow problems is to identify problems before theyoccur. Cash flow would give the farmer time to alter his plans and remedy theproblems by timing cash inflows and cash outflows.
Low profitability together with low cash inflow
This means a careful look at the combination of enterprises on the farm.Perhaps another crop rotation or livestock enterprise would increase cashinflow and allow the farmer to increase profitability at the same time.
High Production Costs
An effective way to improve cash flow is through cost control. Is the farmerusing the best seeds and seeding rates? Is fertilisation at the right level?Can the use of commercial fertiliser be reduced through the use of manure?Can integrated pest management be used?
Need to increase sellingflexibility
The best approach to this problem is to improving marketing plans. For non-perishable products, the farmer has some flexibility in timing sales.Improving farm profitability should be the main goal in formulating amarketing plan.
Need to reduce cash outflowLeasing or renting instead of owning: the down payments and loan paymentsassociated with the purchase of land, buildings and machinery sometimes puta heavy burden on cash flow.
Increase cash availability
Taking an off-farm job. One or both spouses could seek part-time or full-time employment off the farm. Any additional expenses related to off-farmemployment such as transportation, clothing and others need to beconsidered carefully.
Assess the financial package required
Estimate the financial package that the farmer requires when a cashshortfall is identified. The cash flow enables the farmer to estimate the sizeof loan required, the repayment caapcity of the farmer and the repaymentschedule
Increase cash availability
Refinancing: Cash flow problems are sometimes caused by a poor balance ofshort- and long-term debts on the farm. Some farmers use short-term loansto finance current and fixed assets. Operating loans should be used only topurchase variable inputs.
RISK AND UNCERTAINTY Managing Risk and Uncertainty
Farmers make decisions in a risky and ever-changing environment. The consequences of their decisions are generally not known when the decisions are made, and outcomes may be better or worse than expected. Variability of prices and yields are major sources of risk in agriculture. Changes in technology, legal and social factors, and the human factor itself all contribute to the risky environment that farmers have to operate in. Risk management is trying to prevent something happen that you don’t want too, or to makes its effect as small as possible.
Farmers have to take risks to grow a crop. They are not sure about the: The weather; The price they may get if they choose to sell; What people may what to buy.
Effective risk management involves: anticipating that an unfavourable event may occur and acting to reduce the probability of its occurrence; and taking actions to reduce the adverse consequences should an unfavourable event occur.
For example, a risk management strategy relating to mechanisation might involve a complete overhaul of an old tractor before peak season work load, to reduce the chances of a major breakdown in operations over the period. During planting and harvesting, farmers keep may decide to keep some spare parts readily available. While they may not be able to prevent a breakdown from occurring, they can help to reduce the unfavourable consequences should the breakdown occur.
Farmers need to make choices. To do this they need to know about input and selling prices, yields, markets and other technical data. However, very often farmers find that their best decisions often turn out to be wrong, because things change from the time the decision was made and the crop or animal was finally harvested or sold.
Farmers must make decisions about what crops to plant and what seeding rates, fertiliser levels, etc., to use early in the cropping season. The final yield and prices will not be known for several months, or even several years in the case of tree crops. Risks in farming activities can come from unexpected places, resulting in low prices, drought, or disease. Risk management is mostly concerned with reducing the chances of less favourable outcomes occurring, or at least softening their effects.
Sources of Risk and Uncertainty
Risks can be classified in several ways. One useful way is to classify them under technical and financial risks.
Technical risks are those risks associated with farming and are independent of the farmer's financial situation. These include variable yields, fluctuating prices, and many other factors that make the consequences of a decision unknown.
Risk and uncertainty are inherent in setting the objectives of the farm business and in the farmer’s decision-making process made by farmers. The most common sources of technical risks for the farm operator are:
a) Market or price risk. This is associated with the purchase of inputs as well as the sale of commodities. Fluctuations in input and output prices cause income gains or losses. The fluctuations occur both within a marketing year and between years. Net worth may also be affected if prices of inputs such as land and machinery change. Availability of inputs is also a risk. In addition, in the long run, the variability of prices, interest rates, and relative prices are risk factors that influence decisions taken.
b) Production risk. This refers to the random variability inherent in the production process. Weather, diseases, and pest infestations lead to production risk in crop and livestock activities. Fire, wind, theft, and other adversities are also sources of production risk.
c) Technology-related risk. This refers to the effect of technological improvements in existing farm management decisions. For example, there is the risk that durable may become obsolete as technological changes occur. The rapid changes in farm machinery and cultivation techniques, as a result of conservation agriculture, are noticeable examples.
d) Legal and social risks include government prices and income programmes, tax, trade, credit, and environmental policies, all of which have impact on the operating environment. These risks may increase for larger farms. New risks may also occur from, for example, forward contracting and minimum price contracts that introduce risks associated with contractor’s integrity.
e) Human sources of risk are associated with the labour and management functions in farming. Health problems of key individuals can severely disrupt farm performance. Changing objectives of individuals and family members can have major effects on a farm's long-run changes and viability.
Financial risks are the risks faced by farmers who have to rely on borrowed capital for their farm operations and has a low equity base. Availability of loan funds and the costs of credit are some examples.
Expectations and Variability
What the farmer thinks they will get in the future for their crop or livestock is important in the decisions that are made. What happened in the past is very particularly important to the farmer and helps him or her decide what they think they will get next time.
Farmers tend to remember the bad things and the good things. If a tractor recently broke down, they tend to think it is bound to happen again, soon. However, if something has not happened before, like a severe drought, floods or hurricanes, the farmer may not be prepared to consider such an event ever happening to them. What happened last month is considered more important than what happened last year. When things change, like the start of an El Nino, the amount of rain will not tell the farmer what to expect now. Basing what will happen tomorrow on what happened yesterday means you believe that what happened yesterday will continue to happen.
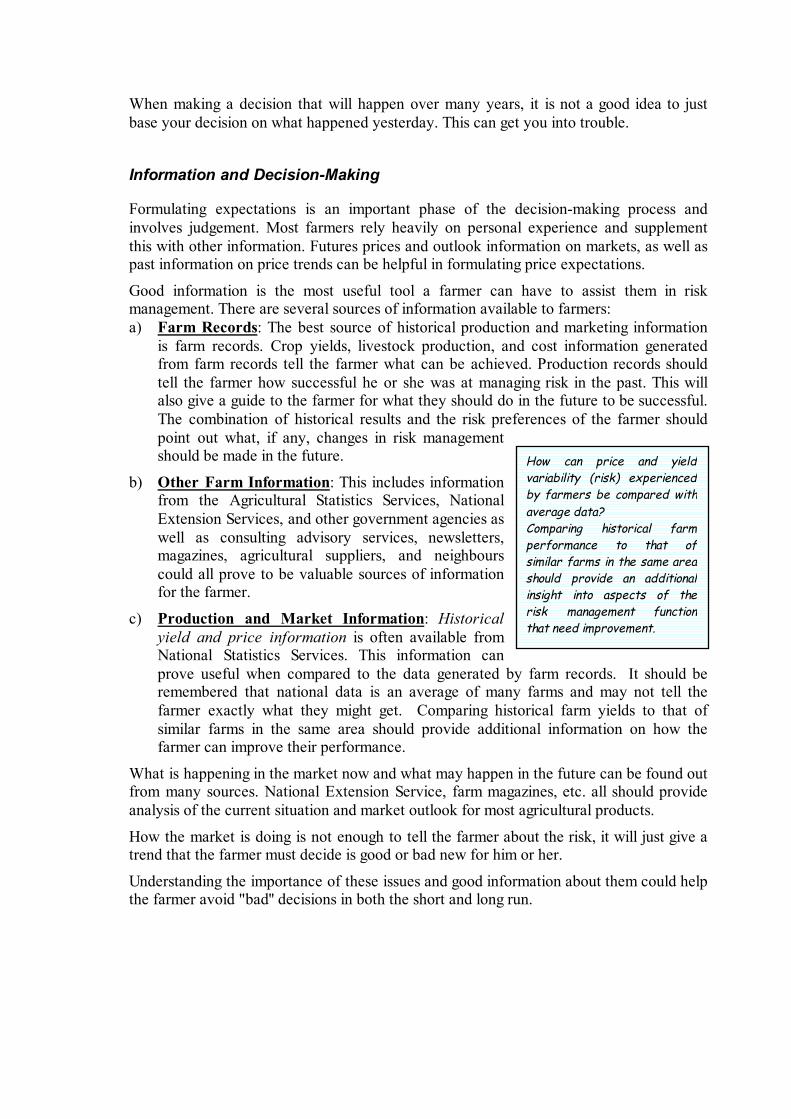
When making a decision that will happen over many years, it is not a good idea to just base your decision on what happened yesterday. This can get you into trouble.
Information and Decision-Making
Formulating expectations is an important phase of the decision-making process and involves judgement. Most farmers rely heavily on personal experience and supplement this with other information. Futures prices and outlook information on markets, as well as past information on price trends can be helpful in formulating price expectations.
Good information is the most useful tool a farmer can have to assist them in risk management. There are several sources of information available to farmers: a) Farm Records: The best source of historical production and marketing information
is farm records. Crop yields, livestock production, and cost information generated from farm records tell the farmer what can be achieved. Production records should tell the farmer how successful he or she was at managing risk in the past. This will also give a guide to the farmer for what they should do in the future to be successful. The combination of historical results and the risk preferences of the farmer should point out what, if any, changes in risk management should be made in the future.
b) Other Farm Information: This includes information from the Agricultural Statistics Services, National Extension Services, and other government agencies as well as consulting advisory services, newsletters, magazines, agricultural suppliers, and neighbours could all prove to be valuable sources of information for the farmer.
c) Production and Market Information: Historical yield and price information is often available from National Statistics Services. This information can prove useful when compared to the data generated by farm records. It should be remembered that national data is an average of many farms and may not tell the farmer exactly what they might get. Comparing historical farm yields to that of similar farms in the same area should provide additional information on how the farmer can improve their performance.
What is happening in the market now and what may happen in the future can be found out from many sources. National Extension Service, farm magazines, etc. all should provide analysis of the current situation and market outlook for most agricultural products.
How the market is doing is not enough to tell the farmer about the risk, it will just give a trend that the farmer must decide is good or bad new for him or her.
Understanding the importance of these issues and good information about them could help the farmer avoid "bad'' decisions in both the short and long run.
How can price and yieldvariability (risk) experiencedby farmers be compared withaverage data? Comparing historical farmperformance to that ofsimilar farms in the same areashould provide an additionalinsight into aspects of therisk management functionthat need improvement.
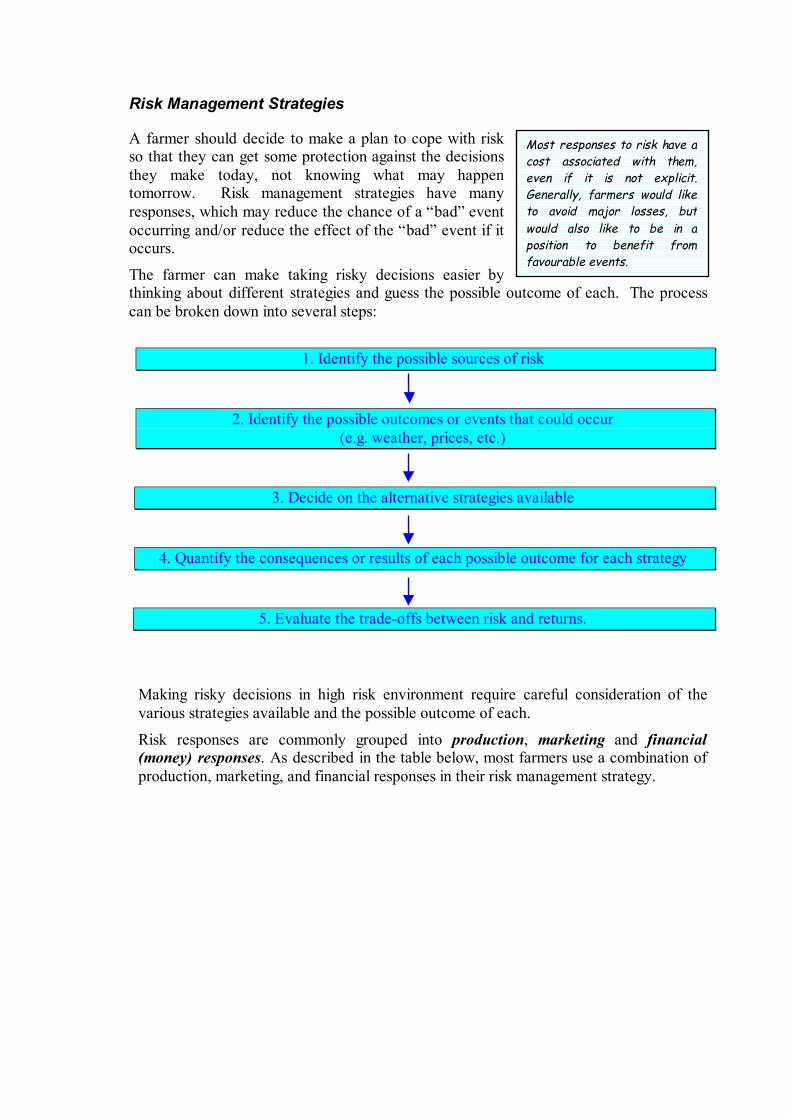
Risk Management Strategies
A farmer should decide to make a plan to cope with risk so that they can get some protection against the decisions they make today, not knowing what may happen tomorrow. Risk management strategies have many responses, which may reduce the chance of a “bad” event occurring and/or reduce the effect of the “bad” event if it occurs.
The farmer can make taking risky decisions easier by thinking about different strategies and guess the possible outcome of each. The process can be broken down into several steps:
1. Identify the possible sources of risk
2. Identify the possible outcomes or events that could occur (e.g. weather, prices, etc.)
3. Decide on the alternative strategies available
4. Quantify the consequences or results of each possible outcome for each strategy
5. Evaluate the trade-offs between risk and returns.
Making risky decisions in high risk environment require careful consideration of the various strategies available and the possible outcome of each.
Risk responses are commonly grouped into production, marketing and financial (money) responses. As described in the table below, most farmers use a combination of production, marketing, and financial responses in their risk management strategy.
Most responses to risk have acost associated with them,even if it is not explicit.Generally, farmers would liketo avoid major losses, butwould also like to be in aposition to benefit fromfavourable events.
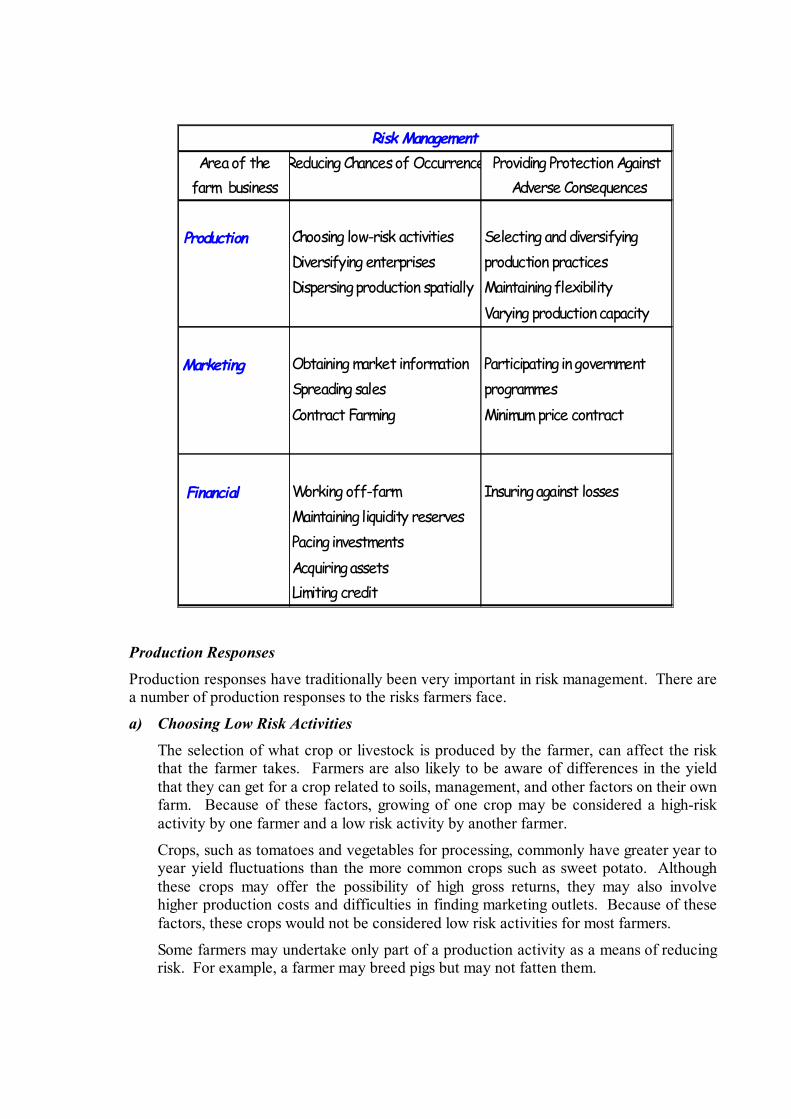
Production Responses Production responses have traditionally been very important in risk management. There are a number of production responses to the risks farmers face.
a) Choosing Low Risk Activities The selection of what crop or livestock is produced by the farmer, can affect the risk that the farmer takes. Farmers are also likely to be aware of differences in the yield that they can get for a crop related to soils, management, and other factors on their own farm. Because of these factors, growing of one crop may be considered a high-risk activity by one farmer and a low risk activity by another farmer.
Crops, such as tomatoes and vegetables for processing, commonly have greater year to year yield fluctuations than the more common crops such as sweet potato. Although these crops may offer the possibility of high gross returns, they may also involve higher production costs and difficulties in finding marketing outlets. Because of these factors, these crops would not be considered low risk activities for most farmers.
Some farmers may undertake only part of a production activity as a means of reducing risk. For example, a farmer may breed pigs but may not fatten them.
Area of the Reducing Chances of Occurrence Providing Protection Againstfarm business Adverse Consequences
Production Choosing low-risk activities Selecting and diversifying Diversifying enterprises production practices Dispersing production spatially Maintaining flexibility
Varying production capacity
Marketing Obtaining market information Participating in government Spreading sales programmes
Contract Farming Minimum price contract
Financial Working off-farm Insuring against losses Maintaining liquidity reserves Pacing investments Acquiring assets Limiting credit
Risk Management
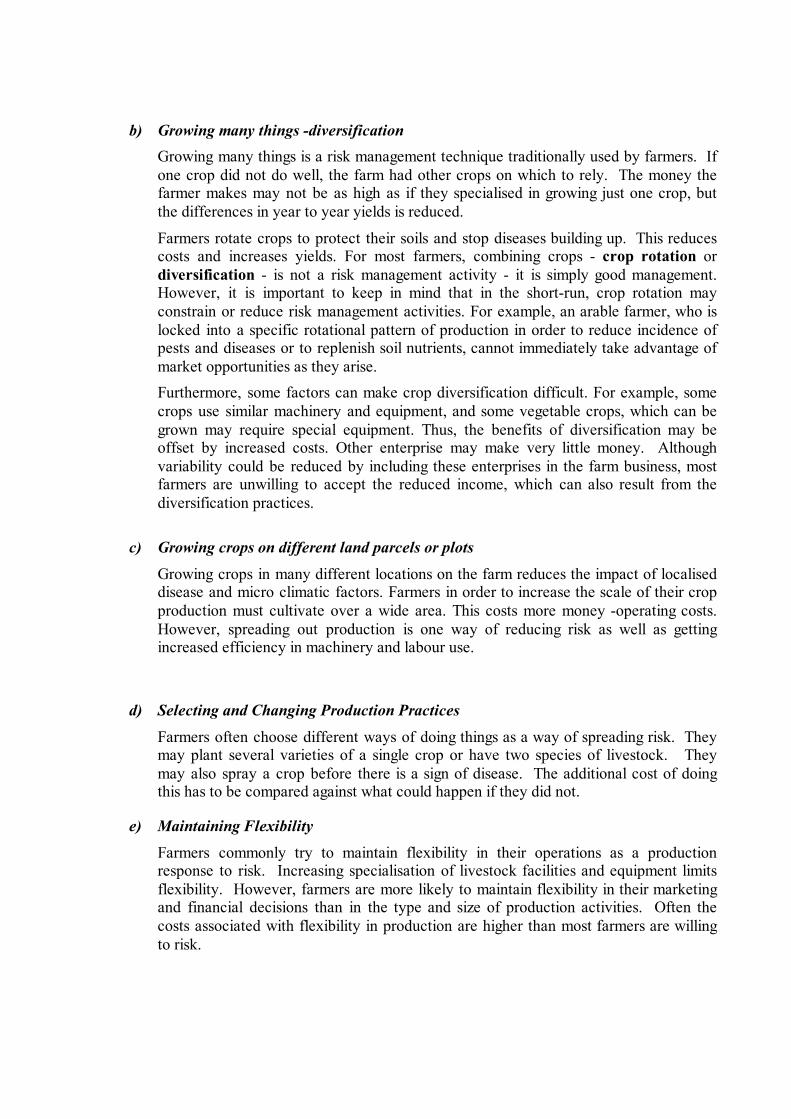
b) Growing many things -diversification
Growing many things is a risk management technique traditionally used by farmers. If one crop did not do well, the farm had other crops on which to rely. The money the farmer makes may not be as high as if they specialised in growing just one crop, but the differences in year to year yields is reduced.
Farmers rotate crops to protect their soils and stop diseases building up. This reduces costs and increases yields. For most farmers, combining crops - crop rotation or diversification - is not a risk management activity - it is simply good management. However, it is important to keep in mind that in the short-run, crop rotation may constrain or reduce risk management activities. For example, an arable farmer, who is locked into a specific rotational pattern of production in order to reduce incidence of pests and diseases or to replenish soil nutrients, cannot immediately take advantage of market opportunities as they arise. Furthermore, some factors can make crop diversification difficult. For example, some crops use similar machinery and equipment, and some vegetable crops, which can be grown may require special equipment. Thus, the benefits of diversification may be offset by increased costs. Other enterprise may make very little money. Although variability could be reduced by including these enterprises in the farm business, most farmers are unwilling to accept the reduced income, which can also result from the diversification practices.
c) Growing crops on different land parcels or plots
Growing crops in many different locations on the farm reduces the impact of localised disease and micro climatic factors. Farmers in order to increase the scale of their crop production must cultivate over a wide area. This costs more money -operating costs. However, spreading out production is one way of reducing risk as well as getting increased efficiency in machinery and labour use.
d) Selecting and Changing Production Practices Farmers often choose different ways of doing things as a way of spreading risk. They may plant several varieties of a single crop or have two species of livestock. They may also spray a crop before there is a sign of disease. The additional cost of doing this has to be compared against what could happen if they did not.
e) Maintaining Flexibility Farmers commonly try to maintain flexibility in their operations as a production response to risk. Increasing specialisation of livestock facilities and equipment limits flexibility. However, farmers are more likely to maintain flexibility in their marketing and financial decisions than in the type and size of production activities. Often the costs associated with flexibility in production are higher than most farmers are willing to risk.
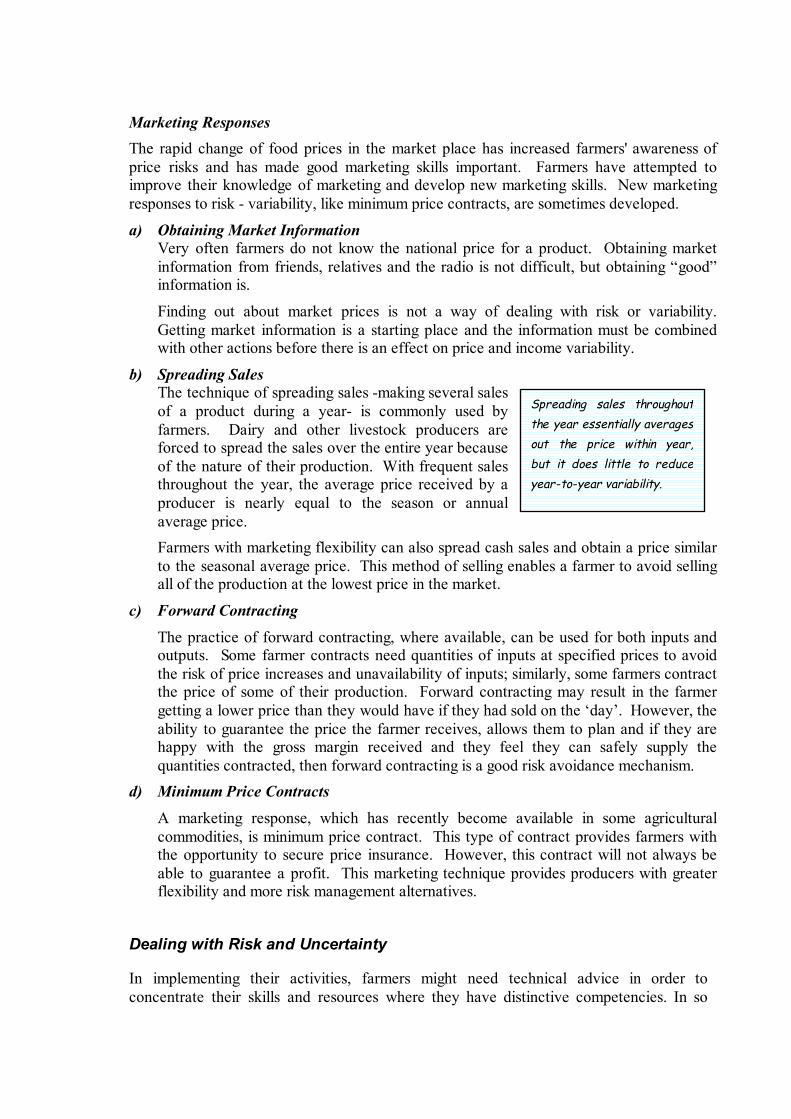
Marketing Responses The rapid change of food prices in the market place has increased farmers' awareness of price risks and has made good marketing skills important. Farmers have attempted to improve their knowledge of marketing and develop new marketing skills. New marketing responses to risk - variability, like minimum price contracts, are sometimes developed.
a) Obtaining Market Information Very often farmers do not know the national price for a product. Obtaining market information from friends, relatives and the radio is not difficult, but obtaining “good” information is.
Finding out about market prices is not a way of dealing with risk or variability. Getting market information is a starting place and the information must be combined with other actions before there is an effect on price and income variability.
b) Spreading Sales The technique of spreading sales -making several sales of a product during a year- is commonly used by farmers. Dairy and other livestock producers are forced to spread the sales over the entire year because of the nature of their production. With frequent sales throughout the year, the average price received by a producer is nearly equal to the season or annual average price. Farmers with marketing flexibility can also spread cash sales and obtain a price similar to the seasonal average price. This method of selling enables a farmer to avoid selling all of the production at the lowest price in the market.
c) Forward Contracting The practice of forward contracting, where available, can be used for both inputs and outputs. Some farmer contracts need quantities of inputs at specified prices to avoid the risk of price increases and unavailability of inputs; similarly, some farmers contract the price of some of their production. Forward contracting may result in the farmer getting a lower price than they would have if they had sold on the ‘day’. However, the ability to guarantee the price the farmer receives, allows them to plan and if they are happy with the gross margin received and they feel they can safely supply the quantities contracted, then forward contracting is a good risk avoidance mechanism.
d) Minimum Price Contracts A marketing response, which has recently become available in some agricultural commodities, is minimum price contract. This type of contract provides farmers with the opportunity to secure price insurance. However, this contract will not always be able to guarantee a profit. This marketing technique provides producers with greater flexibility and more risk management alternatives.
Dealing with Risk and Uncertainty
In implementing their activities, farmers might need technical advice in order to concentrate their skills and resources where they have distinctive competencies. In so
Spreading sales throughoutthe year essentially averagesout the price within year,but it does little to reduceyear-to-year variability.
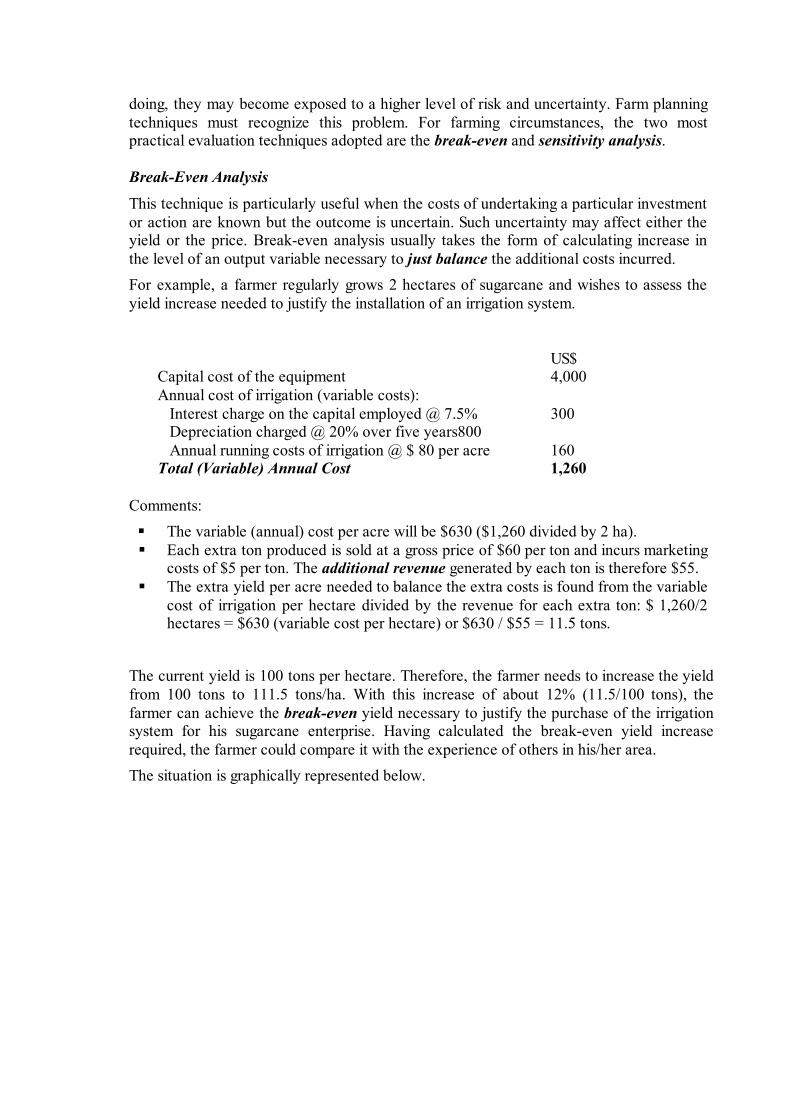
doing, they may become exposed to a higher level of risk and uncertainty. Farm planning techniques must recognize this problem. For farming circumstances, the two most practical evaluation techniques adopted are the break-even and sensitivity analysis. Break-Even Analysis This technique is particularly useful when the costs of undertaking a particular investment or action are known but the outcome is uncertain. Such uncertainty may affect either the yield or the price. Break-even analysis usually takes the form of calculating increase in the level of an output variable necessary to just balance the additional costs incurred. For example, a farmer regularly grows 2 hectares of sugarcane and wishes to assess the yield increase needed to justify the installation of an irrigation system.
US$ Capital cost of the equipment 4,000 Annual cost of irrigation (variable costs): Interest charge on the capital employed @ 7.5% 300 Depreciation charged @ 20% over five years800 Annual running costs of irrigation @ $ 80 per acre 160 Total (Variable) Annual Cost 1,260
Comments:
The variable (annual) cost per acre will be $630 ($1,260 divided by 2 ha). Each extra ton produced is sold at a gross price of $60 per ton and incurs marketing costs of $5 per ton. The additional revenue generated by each ton is therefore $55. The extra yield per acre needed to balance the extra costs is found from the variable cost of irrigation per hectare divided by the revenue for each extra ton: $ 1,260/2 hectares = $630 (variable cost per hectare) or $630 / $55 = 11.5 tons.
The current yield is 100 tons per hectare. Therefore, the farmer needs to increase the yield from 100 tons to 111.5 tons/ha. With this increase of about 12% (11.5/100 tons), the farmer can achieve the break-even yield necessary to justify the purchase of the irrigation system for his sugarcane enterprise. Having calculated the break-even yield increase required, the farmer could compare it with the experience of others in his/her area. The situation is graphically represented below.
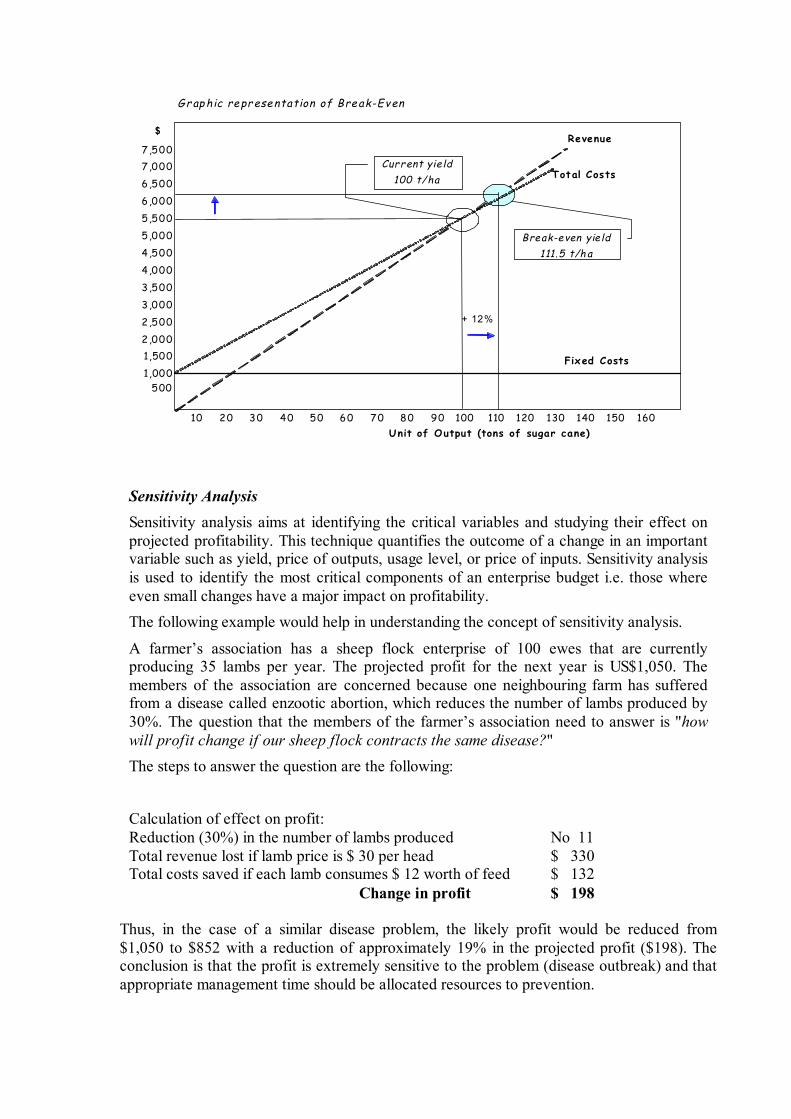
Grap hic representation of Break-Even
7,5007,0006,5006,0005,5005,0004,5004,0003,5003,0002,5002,0001,5001,000
500
10 20 30 40 50 60 70 80 90 100 110 120 130 140 150 160Unit of Output (tons of sugar cane)
Fixed Costs
Total Costs
Revenue
Current yie ld100 t/ha
Break-even yie ld111.5 t/h a
+ 12%
$
Sensitivity Analysis Sensitivity analysis aims at identifying the critical variables and studying their effect on projected profitability. This technique quantifies the outcome of a change in an important variable such as yield, price of outputs, usage level, or price of inputs. Sensitivity analysis is used to identify the most critical components of an enterprise budget i.e. those where even small changes have a major impact on profitability. The following example would help in understanding the concept of sensitivity analysis.
A farmer’s association has a sheep flock enterprise of 100 ewes that are currently producing 35 lambs per year. The projected profit for the next year is US$1,050. The members of the association are concerned because one neighbouring farm has suffered from a disease called enzootic abortion, which reduces the number of lambs produced by 30%. The question that the members of the farmer’s association need to answer is "how will profit change if our sheep flock contracts the same disease?" The steps to answer the question are the following:
Calculation of effect on profit: Reduction (30%) in the number of lambs produced No 11 Total revenue lost if lamb price is $ 30 per head $ 330 Total costs saved if each lamb consumes $ 12 worth of feed $ 132 Change in profit $ 198
Thus, in the case of a similar disease problem, the likely profit would be reduced from $1,050 to $852 with a reduction of approximately 19% in the projected profit ($198). The conclusion is that the profit is extremely sensitive to the problem (disease outbreak) and that appropriate management time should be allocated resources to prevention.
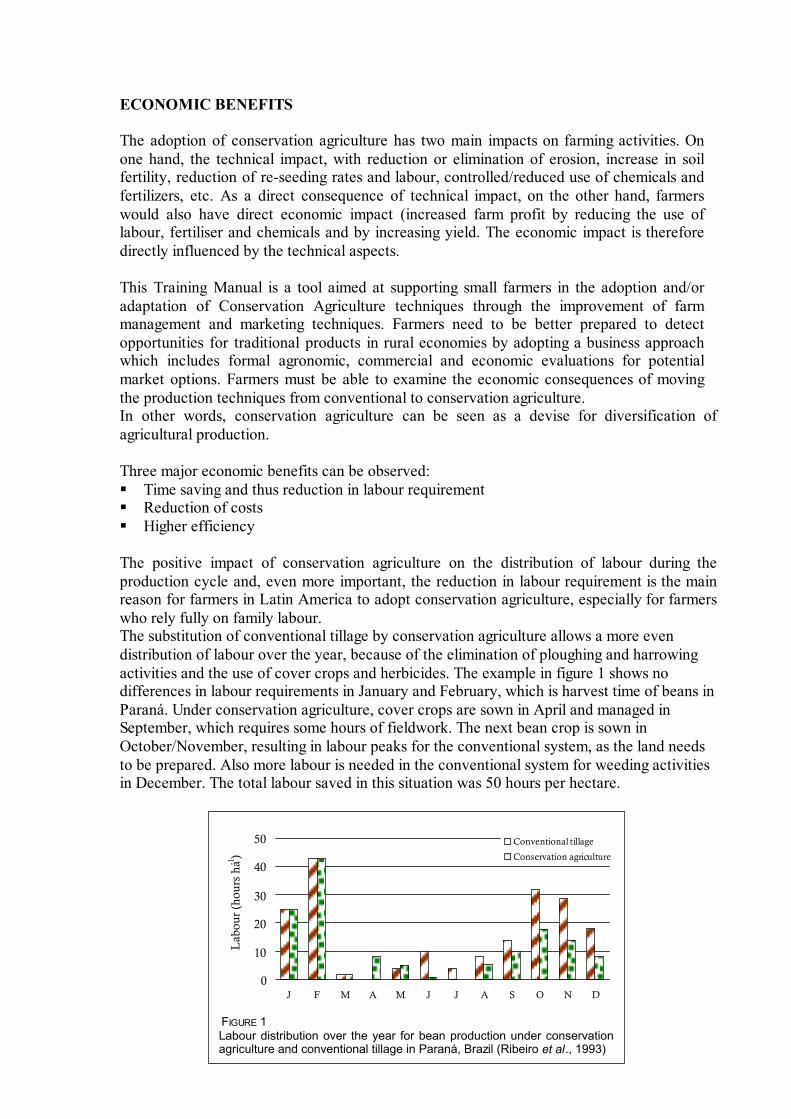
ECONOMIC BENEFITS The adoption of conservation agriculture has two main impacts on farming activities. On one hand, the technical impact, with reduction or elimination of erosion, increase in soil fertility, reduction of re-seeding rates and labour, controlled/reduced use of chemicals and fertilizers, etc. As a direct consequence of technical impact, on the other hand, farmers would also have direct economic impact (increased farm profit by reducing the use of labour, fertiliser and chemicals and by increasing yield. The economic impact is therefore directly influenced by the technical aspects. This Training Manual is a tool aimed at supporting small farmers in the adoption and/or adaptation of Conservation Agriculture techniques through the improvement of farm management and marketing techniques. Farmers need to be better prepared to detect opportunities for traditional products in rural economies by adopting a business approach which includes formal agronomic, commercial and economic evaluations for potential market options. Farmers must be able to examine the economic consequences of moving the production techniques from conventional to conservation agriculture. In other words, conservation agriculture can be seen as a devise for diversification of agricultural production. Three major economic benefits can be observed:
Time saving and thus reduction in labour requirement Reduction of costs Higher efficiency
The positive impact of conservation agriculture on the distribution of labour during the production cycle and, even more important, the reduction in labour requirement is the main reason for farmers in Latin America to adopt conservation agriculture, especially for farmers who rely fully on family labour. The substitution of conventional tillage by conservation agriculture allows a more even distribution of labour over the year, because of the elimination of ploughing and harrowing activities and the use of cover crops and herbicides. The example in figure 1 shows no differences in labour requirements in January and February, which is harvest time of beans in Paraná. Under conservation agriculture, cover crops are sown in April and managed in September, which requires some hours of fieldwork. The next bean crop is sown in October/November, resulting in labour peaks for the conventional system, as the land needs to be prepared. Also more labour is needed in the conventional system for weeding activities in December. The total labour saved in this situation was 50 hours per hectare.
�������������������������������������������������������������������������
0
10
20
30
40
50
J F M A M J J A S O N D
Lab
our
(hou
rs h
a-1)
�Conventional tillage
�Conservation agriculture
FIGURE 1 Labour distribution over the year for bean production under conservation agriculture and conventional tillage in Paraná, Brazil (Ribeiro et al., 1993)
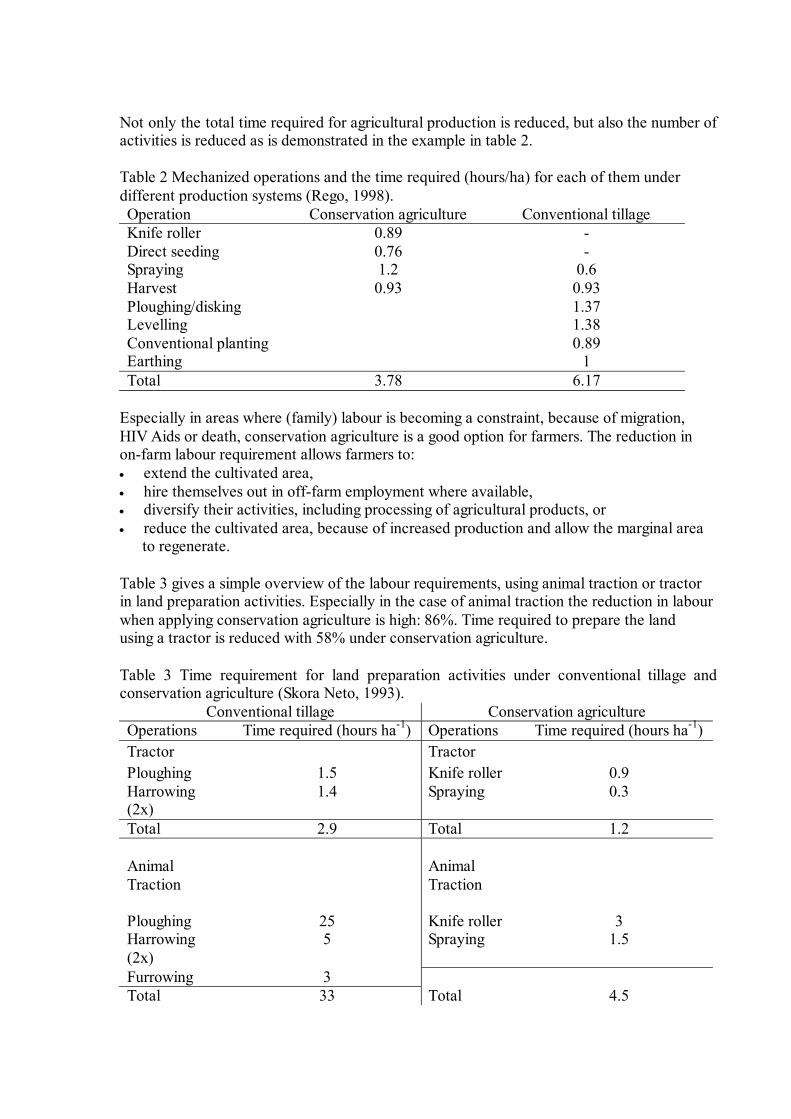
Not only the total time required for agricultural production is reduced, but also the number of activities is reduced as is demonstrated in the example in table 2. Table 2 Mechanized operations and the time required (hours/ha) for each of them under different production systems (Rego, 1998). Operation Conservation agriculture Conventional tillage Knife roller 0.89 - Direct seeding 0.76 - Spraying 1.2 0.6 Harvest 0.93 0.93 Ploughing/disking 1.37 Levelling 1.38 Conventional planting 0.89 Earthing 1 Total 3.78 6.17
Especially in areas where (family) labour is becoming a constraint, because of migration, HIV Aids or death, conservation agriculture is a good option for farmers. The reduction in on-farm labour requirement allows farmers to:
extend the cultivated area, hire themselves out in off-farm employment where available, diversify their activities, including processing of agricultural products, or reduce the cultivated area, because of increased production and allow the marginal area to regenerate.
Table 3 gives a simple overview of the labour requirements, using animal traction or tractor in land preparation activities. Especially in the case of animal traction the reduction in labour when applying conservation agriculture is high: 86%. Time required to prepare the land using a tractor is reduced with 58% under conservation agriculture. Table 3 Time requirement for land preparation activities under conventional tillage and conservation agriculture (Skora Neto, 1993).
Conventional tillage Conservation agriculture Operations Time required (hours ha-1) Operations Time required (hours ha-1) Tractor Tractor Ploughing 1.5 Knife roller 0.9 Harrowing (2x)
1.4 Spraying 0.3
Total 2.9 Total 1.2 Animal Traction
Animal Traction
Ploughing 25 Knife roller 3 Harrowing (2x)
5 Spraying 1.5
Furrowing 3 Total 33 Total 4.5
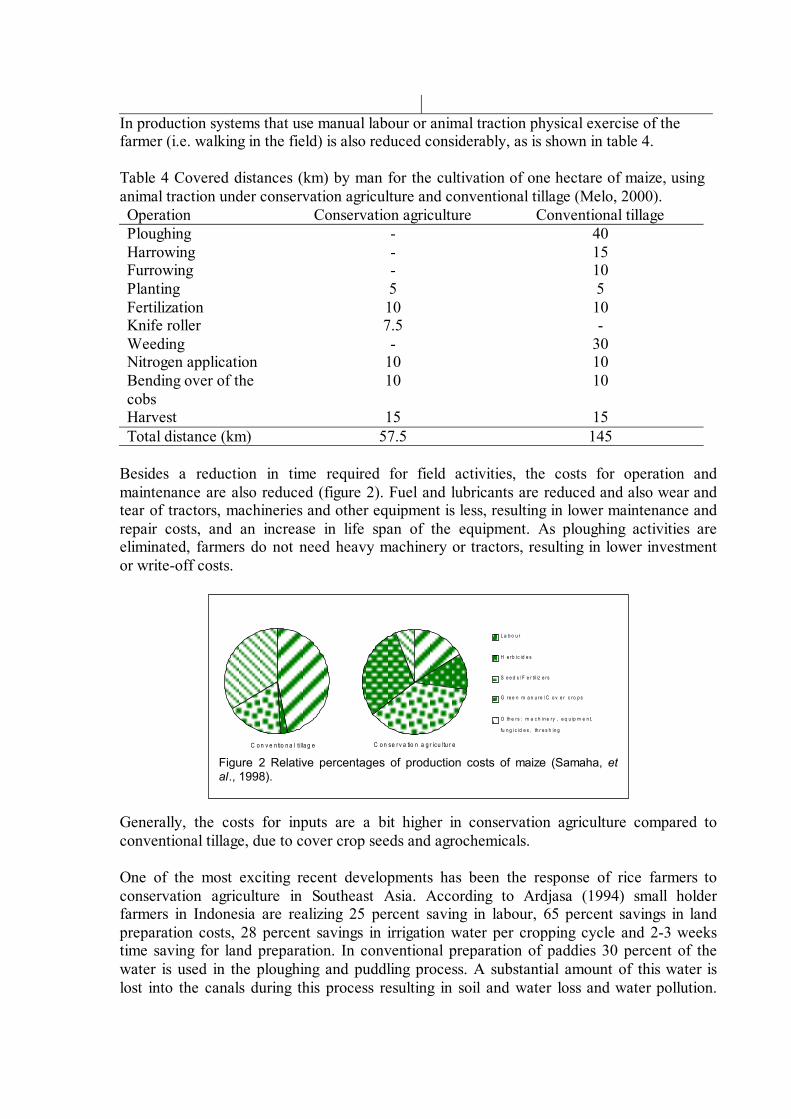
In production systems that use manual labour or animal traction physical exercise of the farmer (i.e. walking in the field) is also reduced considerably, as is shown in table 4. Table 4 Covered distances (km) by man for the cultivation of one hectare of maize, using animal traction under conservation agriculture and conventional tillage (Melo, 2000). Operation Conservation agriculture Conventional tillage Ploughing - 40 Harrowing - 15 Furrowing - 10 Planting 5 5 Fertilization 10 10 Knife roller 7.5 - Weeding - 30 Nitrogen application 10 10 Bending over of the cobs
10 10
Harvest 15 15 Total distance (km) 57.5 145
Besides a reduction in time required for field activities, the costs for operation and maintenance are also reduced (figure 2). Fuel and lubricants are reduced and also wear and tear of tractors, machineries and other equipment is less, resulting in lower maintenance and repair costs, and an increase in life span of the equipment. As ploughing activities are eliminated, farmers do not need heavy machinery or tractors, resulting in lower investment or write-off costs. Generally, the costs for inputs are a bit higher in conservation agriculture compared to conventional tillage, due to cover crop seeds and agrochemicals. One of the most exciting recent developments has been the response of rice farmers to conservation agriculture in Southeast Asia. According to Ardjasa (1994) small holder farmers in Indonesia are realizing 25 percent saving in labour, 65 percent savings in land preparation costs, 28 percent savings in irrigation water per cropping cycle and 2-3 weeks time saving for land preparation. In conventional preparation of paddies 30 percent of the water is used in the ploughing and puddling process. A substantial amount of this water is lost into the canals during this process resulting in soil and water loss and water pollution.
�������������������� ����������������������������L a b o u r
�����H e rb ic id e s
�����S e e d s / F e r ti l iz e rs
�����G re e n m a n u re / C o v e r c ro p s
�����O th e rs : m a c h in e ry , e q u ip m e n t,
fu n g i c id e s , th r e s h in g
C o n se r v a tio n a g r icu ltu r eC o n v e n tio n a l ti lla g e
Figure 2 Relative percentages of production costs of maize (Samaha, et al., 1998).
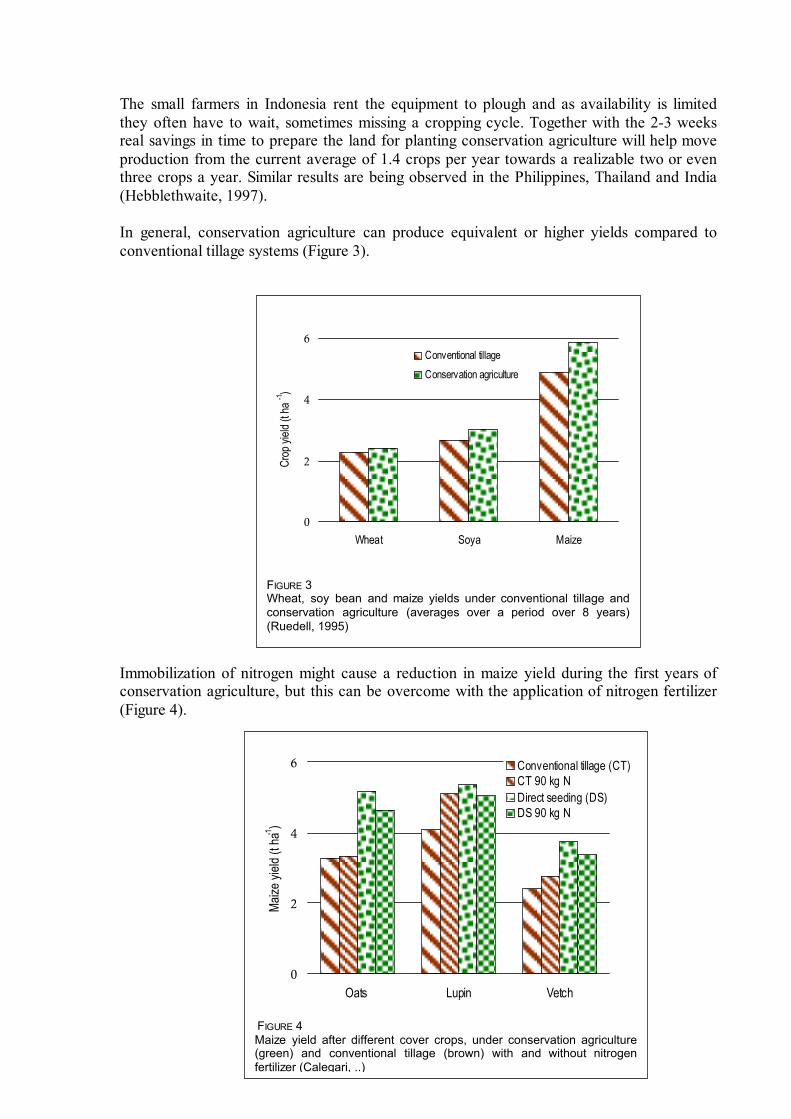
The small farmers in Indonesia rent the equipment to plough and as availability is limited they often have to wait, sometimes missing a cropping cycle. Together with the 2-3 weeks real savings in time to prepare the land for planting conservation agriculture will help move production from the current average of 1.4 crops per year towards a realizable two or even three crops a year. Similar results are being observed in the Philippines, Thailand and India (Hebblethwaite, 1997). In general, conservation agriculture can produce equivalent or higher yields compared to conventional tillage systems (Figure 3). Immobilization of nitrogen might cause a reduction in maize yield during the first years of conservation agriculture, but this can be overcome with the application of nitrogen fertilizer (Figure 4).
������
������
��������
��������
����������
���������������
0
2
4
6
Wheat Soya Maize
Crop
yield
(t ha
-1 )
�Conventional tillage�Conservation agriculture
FIGURE 3 Wheat, soy bean and maize yields under conventional tillage and conservation agriculture (averages over a period over 8 years) (Ruedell, 1995)
����������
���� ���
����
������ ����
������
��������
��������
��������
����������
����������
0
2
4
6
Oats Lupin Vetch
Maize
yield
(t ha
-1 )
�Conventional tillage (CT)
�CT 90 kg N
�Direct seeding (DS)
�DS 90 kg N
FIGURE 4 Maize yield after different cover crops, under conservation agriculture (green) and conventional tillage (brown) with and without nitrogen fertilizer (Calegari, ..)
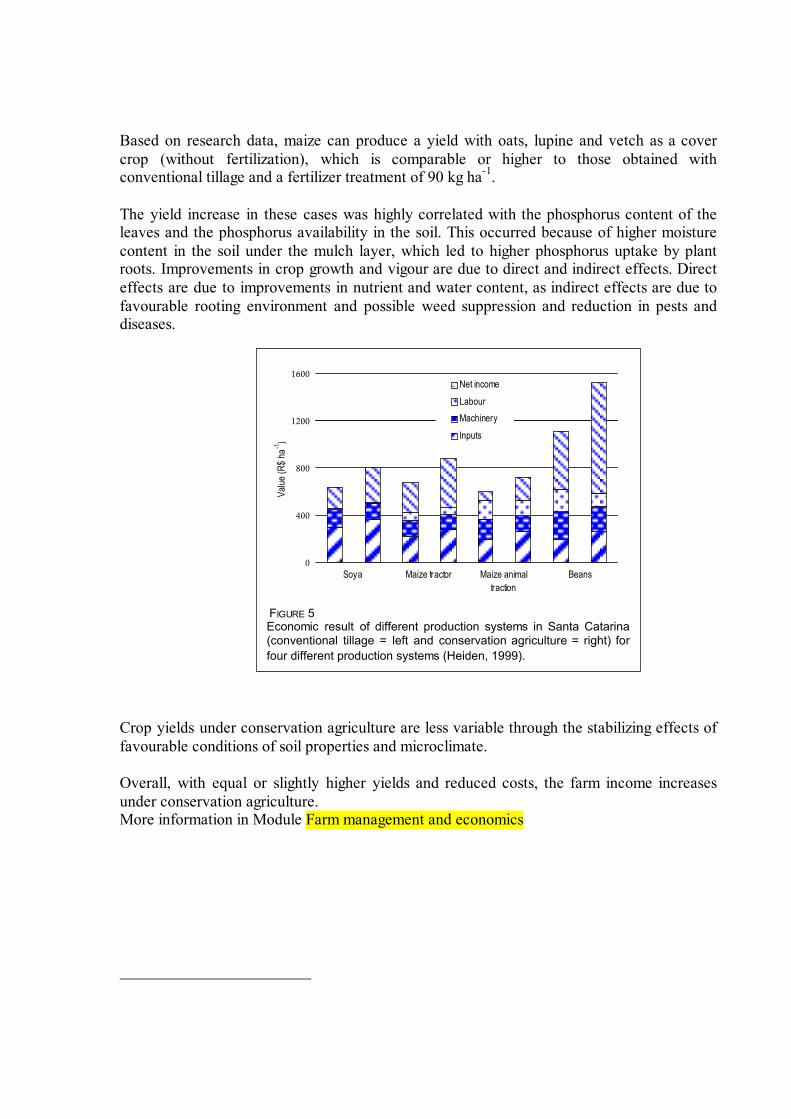
Based on research data, maize can produce a yield with oats, lupine and vetch as a cover crop (without fertilization), which is comparable or higher to those obtained with conventional tillage and a fertilizer treatment of 90 kg ha-1. The yield increase in these cases was highly correlated with the phosphorus content of the leaves and the phosphorus availability in the soil. This occurred because of higher moisture content in the soil under the mulch layer, which led to higher phosphorus uptake by plant roots. Improvements in crop growth and vigour are due to direct and indirect effects. Direct effects are due to improvements in nutrient and water content, as indirect effects are due to favourable rooting environment and possible weed suppression and reduction in pests and diseases. Crop yields under conservation agriculture are less variable through the stabilizing effects of favourable conditions of soil properties and microclimate. Overall, with equal or slightly higher yields and reduced costs, the farm income increases under conservation agriculture. More information in Module Farm management and economics
������������������������������������������������������������������������������������
����������
������������
����
0
400
800
1200
1600
Value
(R$ h
a-1)
���Net income
���Labour
���Machinery
���Inputs
Soya Maize tractor Maize animal traction
Beans
FIGURE 5 Economic result of different production systems in Santa Catarina (conventional tillage = left and conservation agriculture = right) for four different production systems (Heiden, 1999).