Embed Size (px)
DESCRIPTION
Conservation and Ecology of Marine Reptiles MARE 490 Dr. Turner Summer 2011. Turtles in Marine Ecosystems. Sea turtle populations severely declined Many substantially harvested before European contact with Caribbean Difficult to determine past roles due to : “Shifting Baseline Syndrome”. - PowerPoint PPT Presentation
Citation preview

Conservation and Ecology of Marine Reptiles
MARE 490Dr. Turner
Summer 2011
Turtles in Marine EcosystemsSea turtle populations severely declined
Many substantially harvested before European contact with Caribbean
Difficult to determine past roles due to :“Shifting Baseline Syndrome”

Shifting Baseline Syndrome
Use of inappropriate baselines to assess population change
Usually based upon “recent levels” or levels present at “British Invasion”
Example – hawksbills heavily taken for shells long before they were recorded
“You have an absolutely unique genetic condition known as "Homer Simpson" syndrome.” Dr. Julius Hibbert
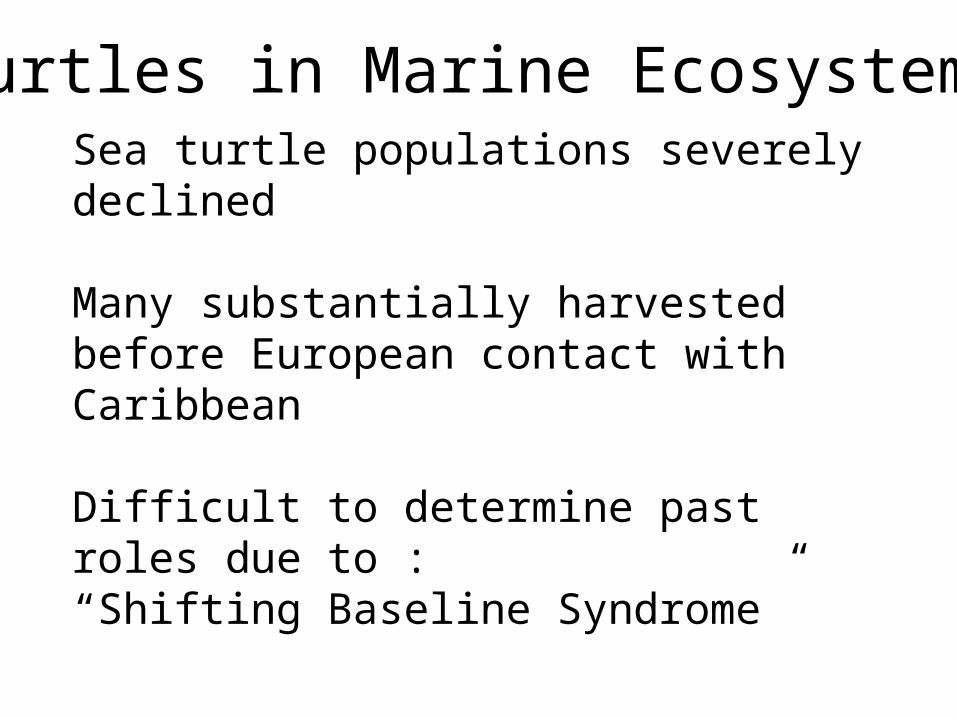
Ecological Roles Important?1. Ecosystem function
2. Understanding of environmental effects
3. Meaningful goals of conservation & management
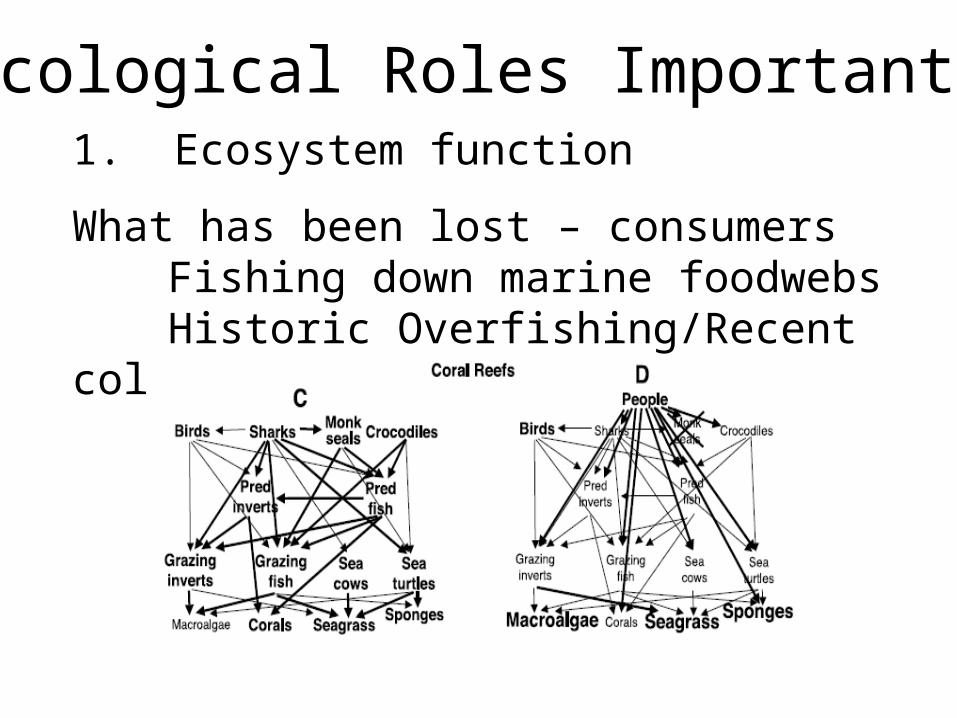
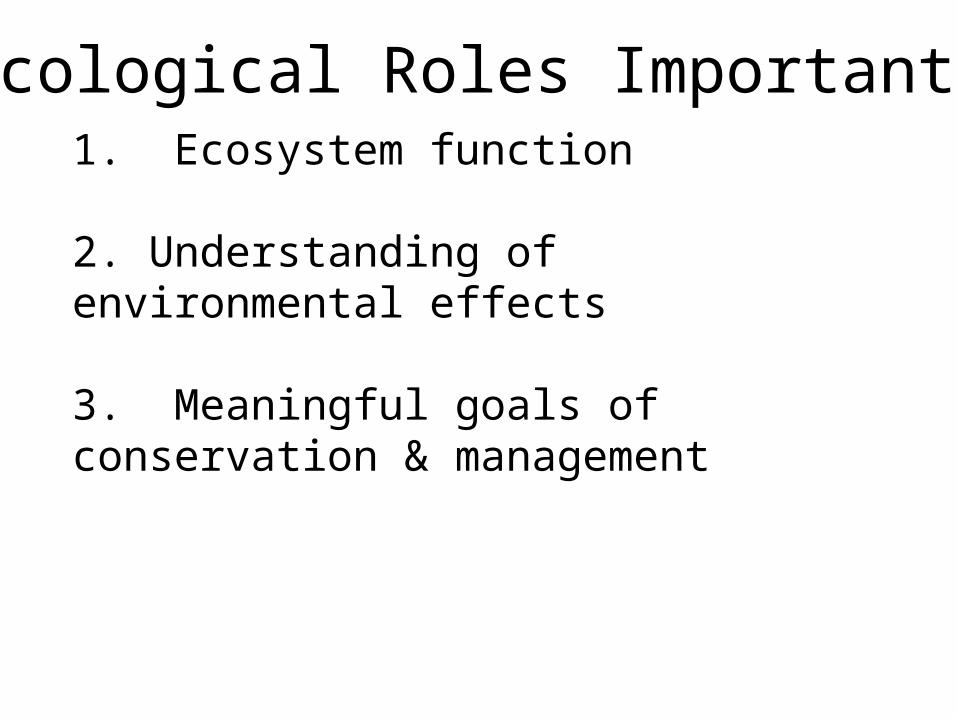
Ecological Roles Important?1. Ecosystem function
What has been lost – consumersFishing down marine foodwebsHistoric Overfishing/Recent collapse
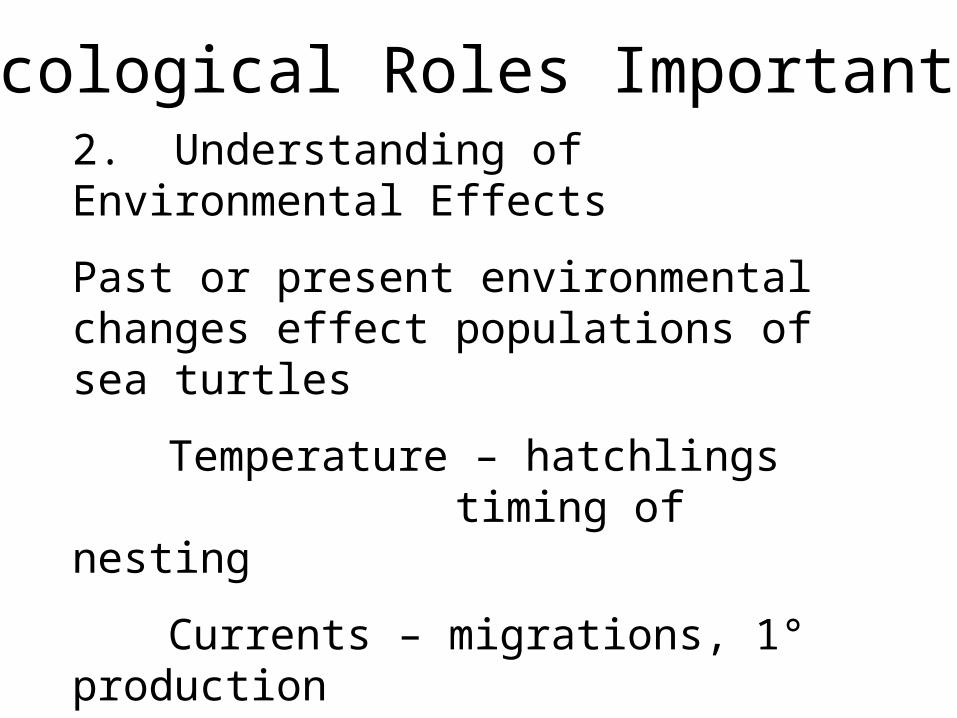
Ecological Roles Important?2. Understanding of Environmental Effects
Past or present environmental changes effect populations of sea turtles
Temperature – hatchlingstiming of nesting
Currents – migrations, 1° production
Habitat loss – nesting beaches, foraging areas

Ecological Roles Important?3. Meaningful goals of conservation & management
From – single-species managementTo – Ecosystem-based fishery
management
Lack of information – how many sea turtles required for a population to be ecologically important

Return of the Chelonii
Difficult to conceive large numbers of sea turtles in past oceans
Estimates: 15-30 fold decrease in last 300-500 years
Would have had very significant effects/impacts upon marine ecosystems
"Oh Jar Jar, everyone hates you but me.“ – Comic Book Guy
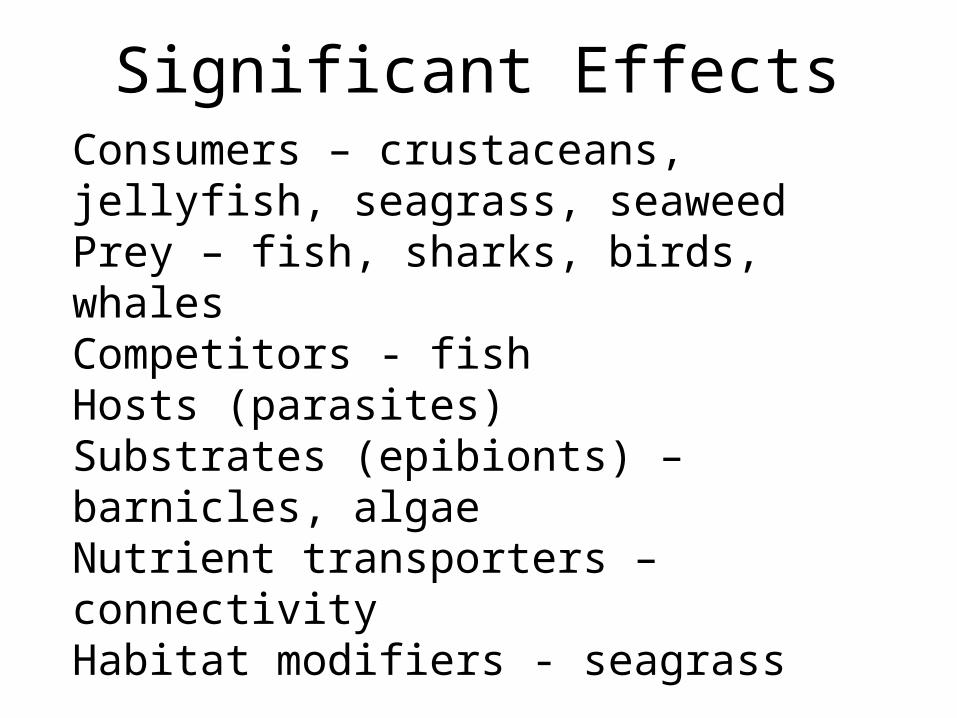
Significant EffectsConsumers – crustaceans, jellyfish, seagrass, seaweedPrey – fish, sharks, birds, whalesCompetitors - fishHosts (parasites)Substrates (epibionts) – barnicles, algaeNutrient transporters – connectivityHabitat modifiers - seagrass
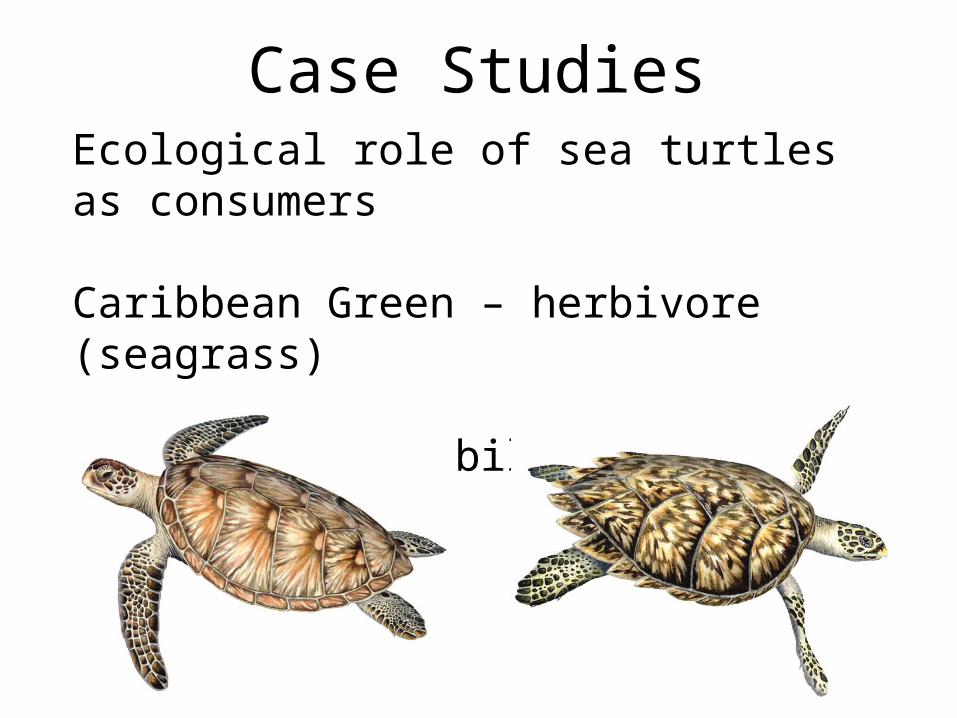
Case StudiesEcological role of sea turtles as consumers
Caribbean Green – herbivore (seagrass)
Caribbean Hawksbill – carnivore (sponges)

Caribbean Green Turtle1492-1734 Cayman Islands not inhabited by people but turtles exploited by visitors
1688-1730 – 13,000 turtles/yr1790 economically extinct
1830 – econ extinct off Cuba1890 – Miskito Cays1901 – urged rearing program
How high were pre-exploitation numbers?Past records say 33-39 million
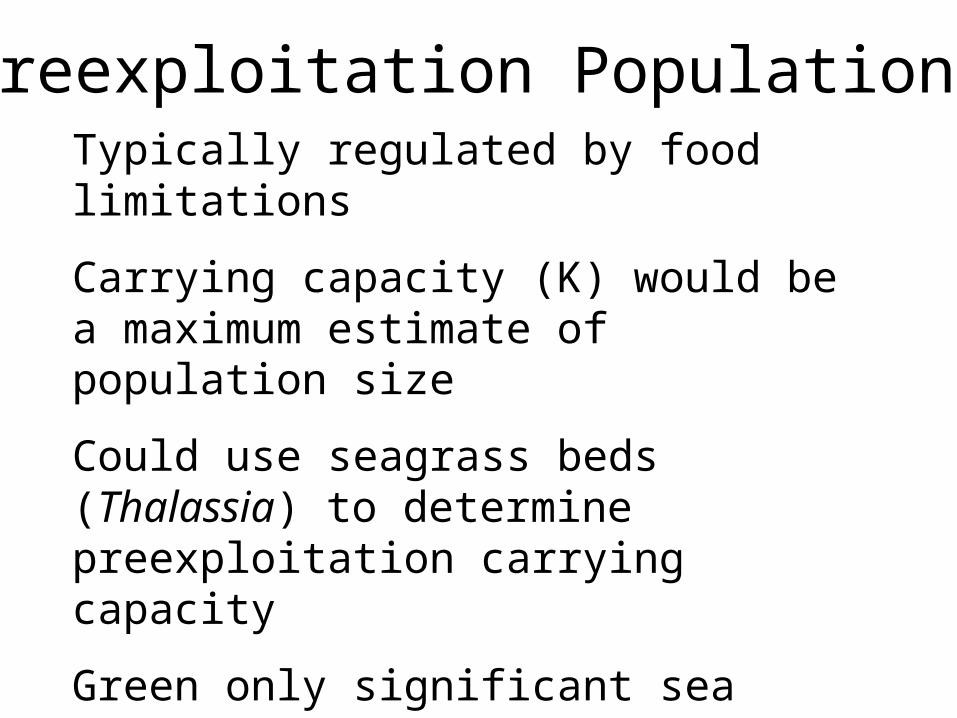
Preexploitation PopulationsTypically regulated by food limitations
Carrying capacity (K) would be a maximum estimate of population size
Could use seagrass beds (Thalassia) to determine preexploitation carrying capacity
Green only significant sea grass consumer since Dugongid extinct in Pleistocene

Survey Says!Based upon estimates of intake and productivity – 660 million green turtles
Dependent upon grazing variability probably ranged from 33-660 million
Current estimates represent 3-7% of preexploitation levels
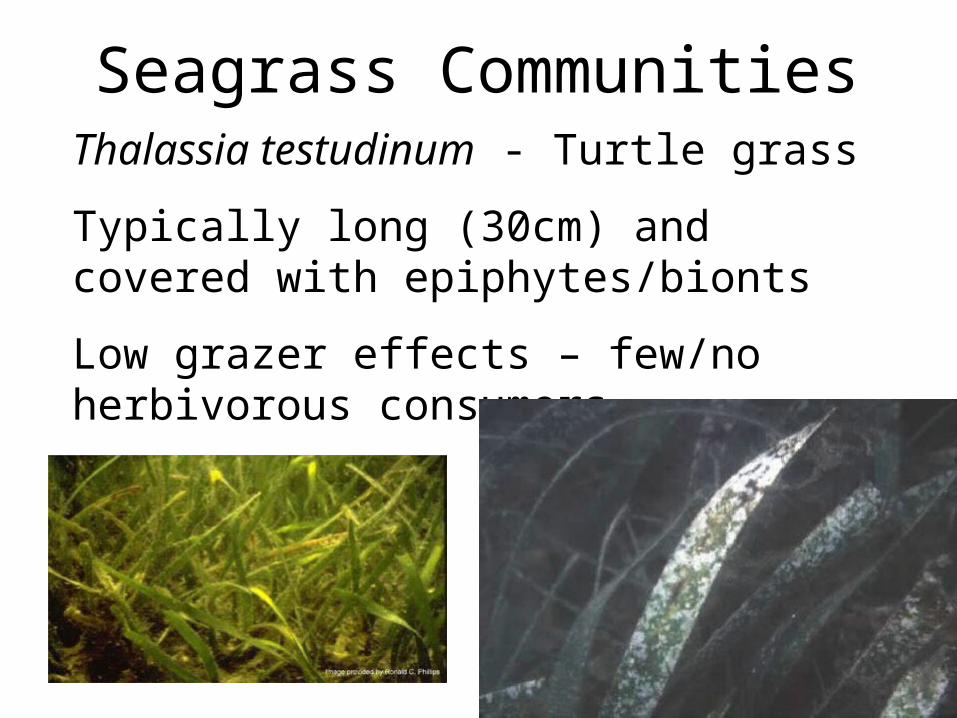
Seagrass CommunitiesThalassia testudinum - Turtle grass
Typically long (30cm) and covered with epiphytes/bionts
Low grazer effects – few/no herbivorous consumers
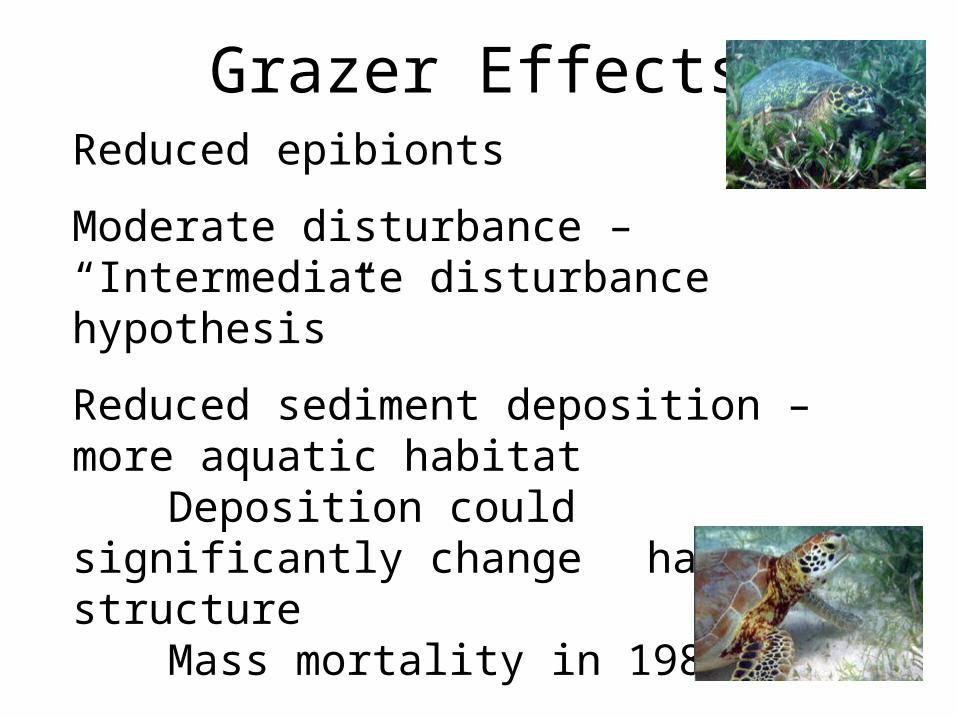
Grazer EffectsReduced epibionts
Moderate disturbance – “Intermediate disturbance hypothesis”
Reduced sediment deposition – more aquatic habitat
Deposition could significantly change habitat structureMass mortality in 1980’s
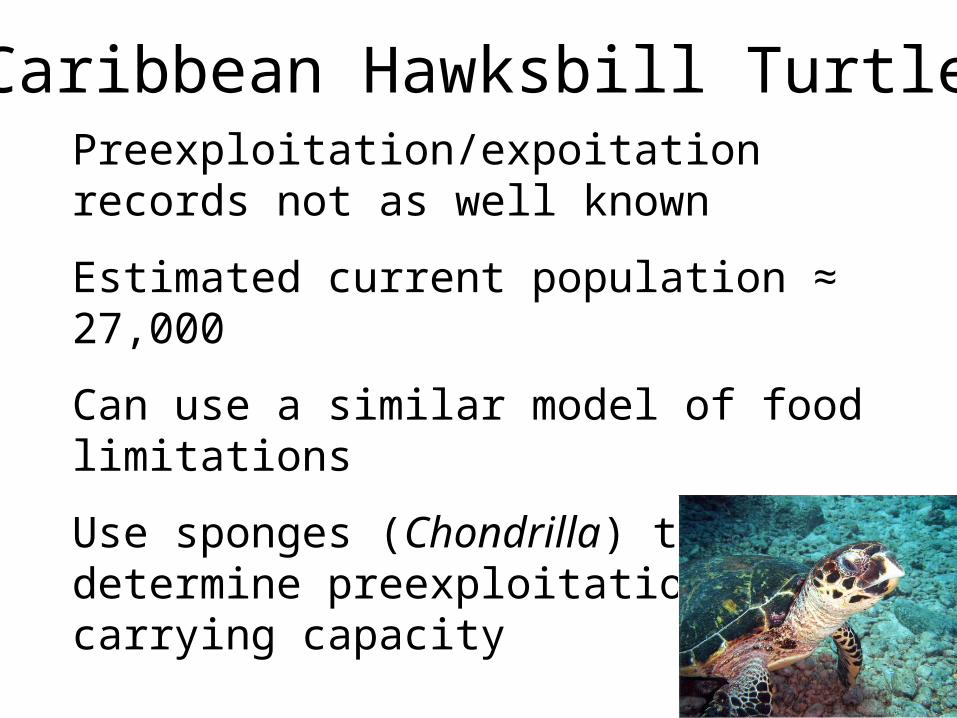
Caribbean Hawksbill TurtlePreexploitation/expoitation records not as well known
Estimated current population ≈ 27,000
Can use a similar model of food limitations
Use sponges (Chondrilla) to determine preexploitation carrying capacity

SpongeworthyEstimates of abundance, energy content, & assimilation efficiency
Used intermediate models between green (herbivore) & loggerhead (carnivore)
Sponge wet mass shows carrying capacity for more than recorded decline

Documented decline in last 100 yrs – 75-98%
Estimated preexploitation levels at 540,000conservative estimate – 95% decline
Levels high enough to have significant effect upon structuring of coral reef systems
Survey Says!
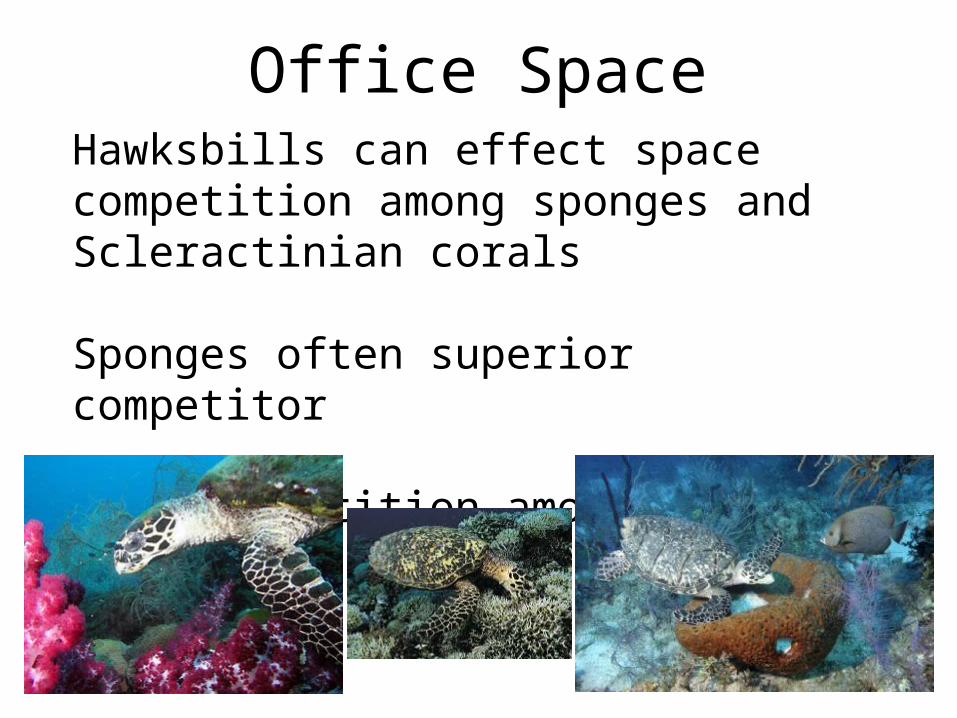
Hawksbills can effect space competition among sponges and Scleractinian corals
Sponges often superior competitor
Also competition among sponge species
Office Space

Why extensive coral populations in Caribbean as compared with sponges in postexploitation hawksbill ecosystems?
Shift in other species – redundancy in webCan mask the effect of species removal
Fishing effects on spongivorous fish species now becoming depleted
Caribbean Situation
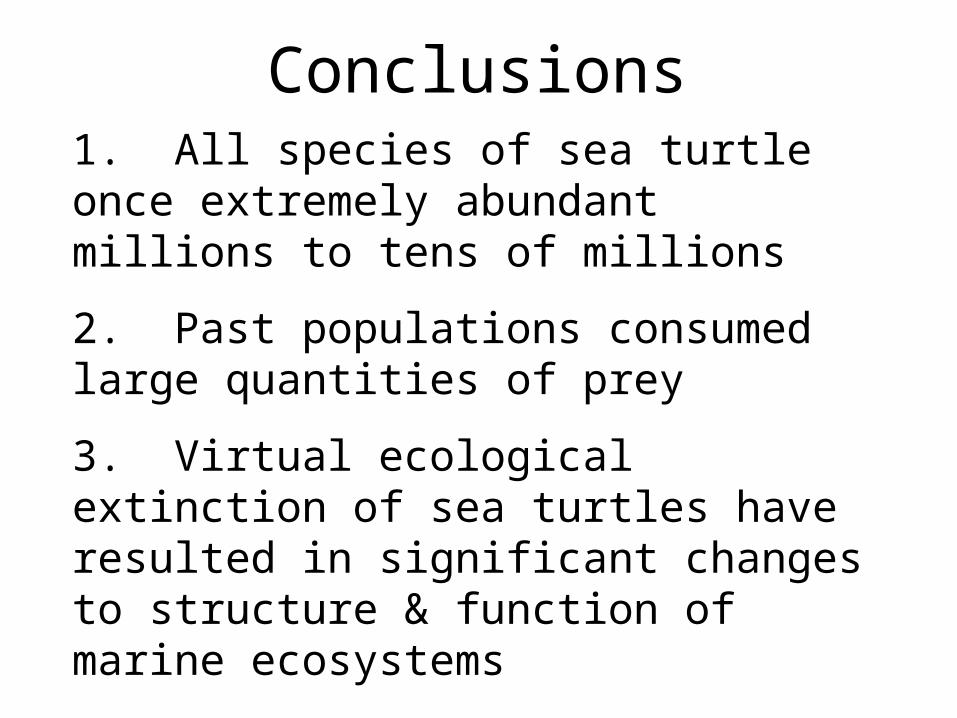
1. All species of sea turtle once extremely abundant millions to tens of millions
2. Past populations consumed large quantities of prey
3. Virtual ecological extinction of sea turtles have resulted in significant changes to structure & function of marine ecosystems
Conclusions