Embed Size (px)
Citation preview
Pitblado et al: LNG Marine Consequences 1
CCPS Conference Orlando June 29-July 1 2004
Consequences of LNG Marine Incidents
R M Pitblado, J Baik, G J Hughes, C Ferro, S J Shaw Det Norske Veritas (USA) Inc., Houston, TX 77084 Email: [email protected]
ABSTRACT
The LNG industry in the US is currently facing challenges obtaining approvals for new receiving terminals. A factor of concern at public meetings relates to the
potential hazards associated with marine transport accidents or terrorist events. The purpose of this study is to develop a range of well conceived maximum credible
failure cases from accidental or terrorism causes and to predict hazard zones using a well validated model. Hazard zones that are presented in this paper tend to fall
below many of the values previously quoted. While additional experimental trials may be warranted, current results are of sufficient confidence to draw valid
conclusions.
1. INTRODUCTION 1.1 Background Liquefied Natural Gas (LNG) represents an important potential energy source for the US over the next 30 years and will contribute to energy security and diversity. Government agencies (including the US Department of Energy, the Federal Energy Regulatory Commission and the US Coast Guard) are actively involved to ensure a suitable and safe infrastructure. One public concern is the marine transport element, as this may appear to have more vulnerability to threats than the LNG terminal itself which has robust LNG tanks and secure boundaries.
Currently there are 5 import and 1 export LNG terminals in the US including Puerto Rico. There are over 30 proposed developments in the US and in nearby parts of Canada and Mexico. While a small number of new terminals have been approved or are proceeding through the approval process, a number have failed to go forward and local opposition to LNG has developed. Part of the public objections relate to safety concerns about the potentially large consequence zones for LNG shipping incidents. While some of these estimates have been based on non-credible assumptions and inappropriate models, others have been based on sound assessments but with overly pessimistic assumptions.
The objective of this paper is to review the range of potential LNG marine spillage events from collision, grounding, operational error, and terrorism. The identification of credible hole sizes for loss of containment events is based on a review by specialists knowledgeable in all aspects of the LNG transport activity. Credible in this context means those events whose precursors are technically feasible but still highly unlikely within a future context of LNG activity in the US – 30 terminals, 30 years, 100 visits/year. The consequences from maximum credible events are assessed, regardless of their likelihood – none of which have occurred in the 40 years of LNG shipping and many of which will be extremely unlikely given the excellent
Pitblado et al: LNG Marine Consequences 2
CCPS Conference Orlando June 29-July 1 2004
operating history and the degree of safeguards now required. Operational safety has improved in the past 20 years through training, procedures, regulations, security measures and operational experience, etc. A projection based on historical information would give the most likely leak size for the foreseeable future of the LNG trade in the US (30 years, 30 terminals, 100 visits/yr) as zero – i.e. no leak event would be anticipated.
The methodology employed on this study involved a review of published literature and operational experience with LNG carriers and LNG experimental trials. A formal hazard identification (HAZID) was carried out using a group of classification, industry and risk specialists to identify precursor events that could lead to credible loss of containment events. These were converted into maximum credible hole sizes. Additional discussions were held with Sandia National Laboratories to further refine hole sizes to account for potential terrorism events. In order to predict hazard distances from maximum credible hole sizes, the PHAST software model was selected. Its validation, both generally and for LNG specifically, is presented and hazard distances for people developed. Potential uncertainties are estimated and suggestions made for further research.
Consequence assessment is valuable for decision making, particularly for locations beyond the hazard ranges predicted. For critical locations within hazard ranges, a more detailed risk analysis, that takes account of the safeguards and explicitly assesses the likelihood of events as well as the consequence, would be most appropriate. The scope of the shipping activity covers port entry, port transit, maneuvering and jetty activities.
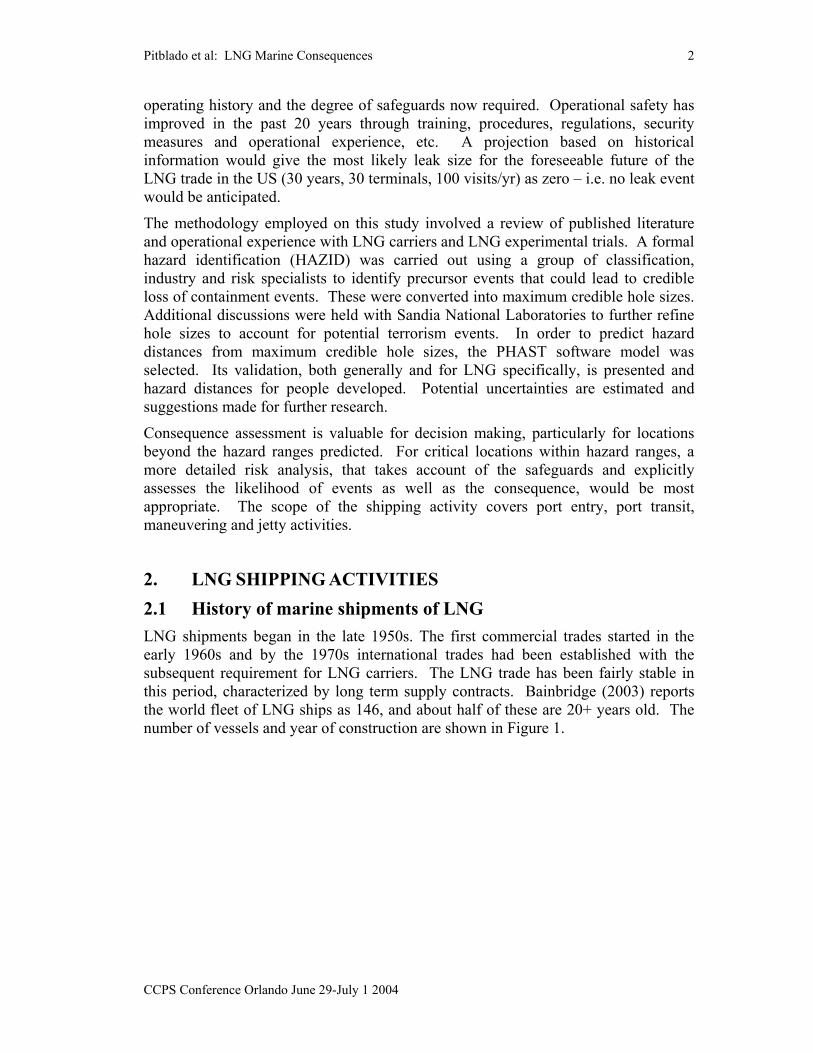
2. LNG SHIPPING ACTIVITIES 2.1 History of marine shipments of LNG LNG shipments began in the late 1950s. The first commercial trades started in the early 1960s and by the 1970s international trades had been established with the subsequent requirement for LNG carriers. The LNG trade has been fairly stable in this period, characterized by long term supply contracts. Bainbridge (2003) reports the world fleet of LNG ships as 146, and about half of these are 20+ years old. The number of vessels and year of construction are shown in Figure 1.
Pitblado et al: LNG Marine Consequences 3
CCPS Conference Orlando June 29-July 1 2004
Figure 1. LNG carriers in service by build year There are 20 ships scheduled for delivery in 2004 and a further 20 in 2005. There are a number of LNG carriers in service of over 20 years age as can be seen in Figure 1. The majority of these older carriers are small and dedicated to trades away from the US. Most of the projects under consideration in the US will have new dedicated LNG vessels ordered to support the specific requirements of the project.
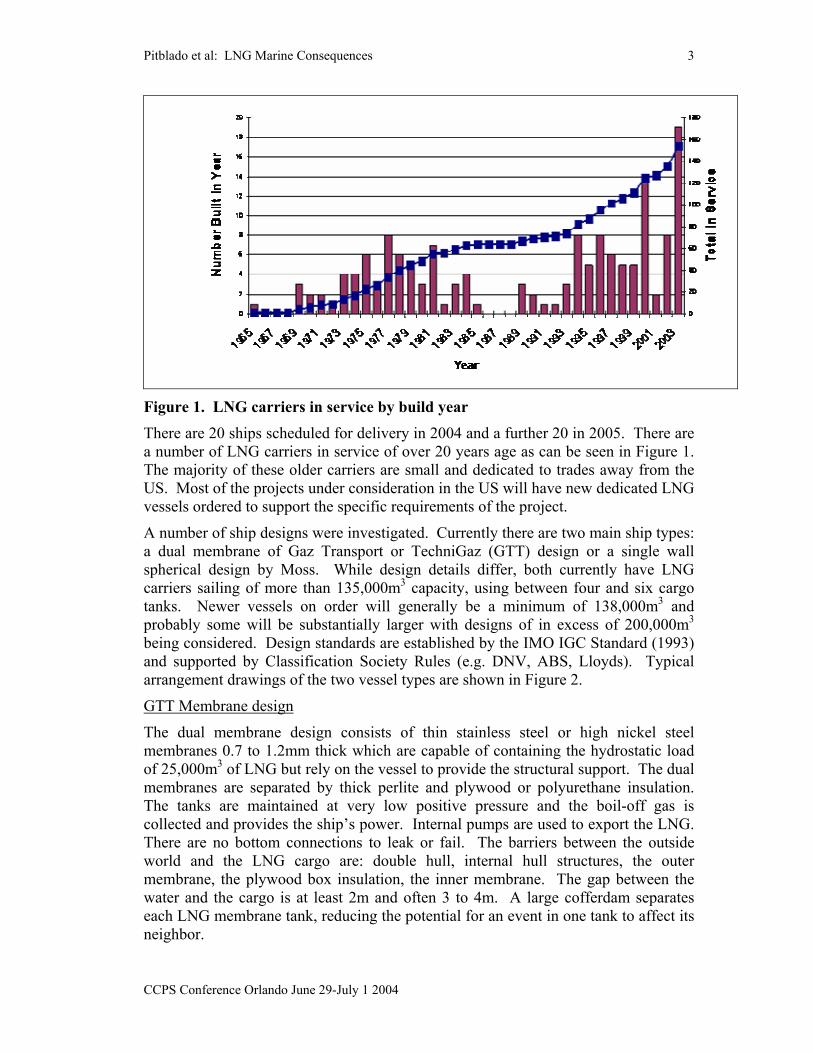
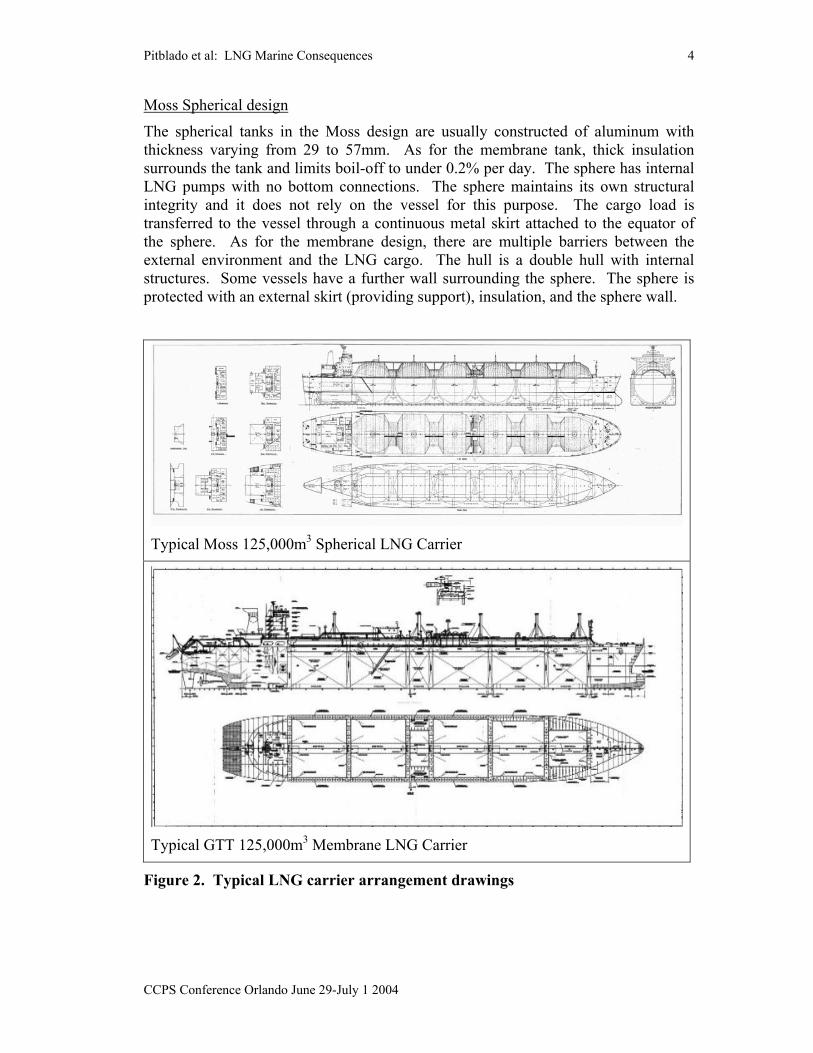
A number of ship designs were investigated. Currently there are two main ship types: a dual membrane of Gaz Transport or TechniGaz (GTT) design or a single wall spherical design by Moss. While design details differ, both currently have LNG carriers sailing of more than 135,000m3 capacity, using between four and six cargo tanks. Newer vessels on order will generally be a minimum of 138,000m3 and probably some will be substantially larger with designs of in excess of 200,000m3 being considered. Design standards are established by the IMO IGC Standard (1993) and supported by Classification Society Rules (e.g. DNV, ABS, Lloyds). Typical arrangement drawings of the two vessel types are shown in Figure 2.
GTT Membrane design
The dual membrane design consists of thin stainless steel or high nickel steel membranes 0.7 to 1.2mm thick which are capable of containing the hydrostatic load of 25,000m3 of LNG but rely on the vessel to provide the structural support. The dual membranes are separated by thick perlite and plywood or polyurethane insulation. The tanks are maintained at very low positive pressure and the boil-off gas is collected and provides the ship’s power. Internal pumps are used to export the LNG. There are no bottom connections to leak or fail. The barriers between the outside world and the LNG cargo are: double hull, internal hull structures, the outer membrane, the plywood box insulation, the inner membrane. The gap between the water and the cargo is at least 2m and often 3 to 4m. A large cofferdam separates each LNG membrane tank, reducing the potential for an event in one tank to affect its neighbor.
Pitblado et al: LNG Marine Consequences 4
CCPS Conference Orlando June 29-July 1 2004
Moss Spherical design
The spherical tanks in the Moss design are usually constructed of aluminum with thickness varying from 29 to 57mm. As for the membrane tank, thick insulation surrounds the tank and limits boil-off to under 0.2% per day. The sphere has internal LNG pumps with no bottom connections. The sphere maintains its own structural integrity and it does not rely on the vessel for this purpose. The cargo load is transferred to the vessel through a continuous metal skirt attached to the equator of the sphere. As for the membrane design, there are multiple barriers between the external environment and the LNG cargo. The hull is a double hull with internal structures. Some vessels have a further wall surrounding the sphere. The sphere is protected with an external skirt (providing support), insulation, and the sphere wall.
Typical Moss 125,000m3 Spherical LNG Carrier
Typical GTT 125,000m3 Membrane LNG Carrier
Figure 2. Typical LNG carrier arrangement drawings
Pitblado et al: LNG Marine Consequences 5
CCPS Conference Orlando June 29-July 1 2004
Comparisons between LNG Ship Designs
Both the membrane and spherical ships afford extra physical barriers between the cargo and the external environment compared to double hull oil tankers. Because of its shape, the sphere is on average much further separated from the external environment. It also has additional structural barriers. Conversely, as the membrane design uses its internal volume more efficiently, there are no large internal void spaces, and it presents less windage area. Overall the risk is thought to be of similar order for either design.
2.2 LNG Shipping Accident Record The LNG shipping industry has an exemplary safety record in terms of cargo loss. To date, there have been close to 80,000 loaded port transits with no loss of containment failure. There have been two serious groundings, both in the late 1970s, but neither of these resulted in cargo loss. As the El Paso Paul Kayser event was very serious, striking a rock at 19kts, and the LNG Taurus also serious at 12 kts, these are good confirmations of the inherent strength of this type of vessel with its additional barriers and physical separation of the cargo to the sea. LNG vessels have experienced a broadly similar number of events to other vessels in terms of minor collisions, strikings, small leaks and fires. None of these resulted in a containment failure or release of cargo.
Analysis of oil tanker accident records (IOTPF, 2004) and specific records for LNG and LPG gas carriers shows that the number of serious incidents reported annually has improved by a factor of between seven to ten since 1980, due to a wide range of regulatory, design, crew competence and ship management improvements. Both grounding events occurred in 1979, qualitatively supporting improvement statistics.
The historical record of 80,000 loaded port visits is very close to matching the foreseeable future of 100,000 visits in the US and this shows no significant LNG cargo loss of containment events. Given the improvement in operational safety in the past 20 years, through training, procedures, regulations, security measures and operational experience etc, a projection based on historical information would give the most likely leak size for the foreseeable future of the LNG trade in the US (30 years, 30 terminals, 100 visits/yr) as zero – i.e. no leak event would be anticipated. The analysis presented in this paper uses a much more conservative approach of maximum credible event.
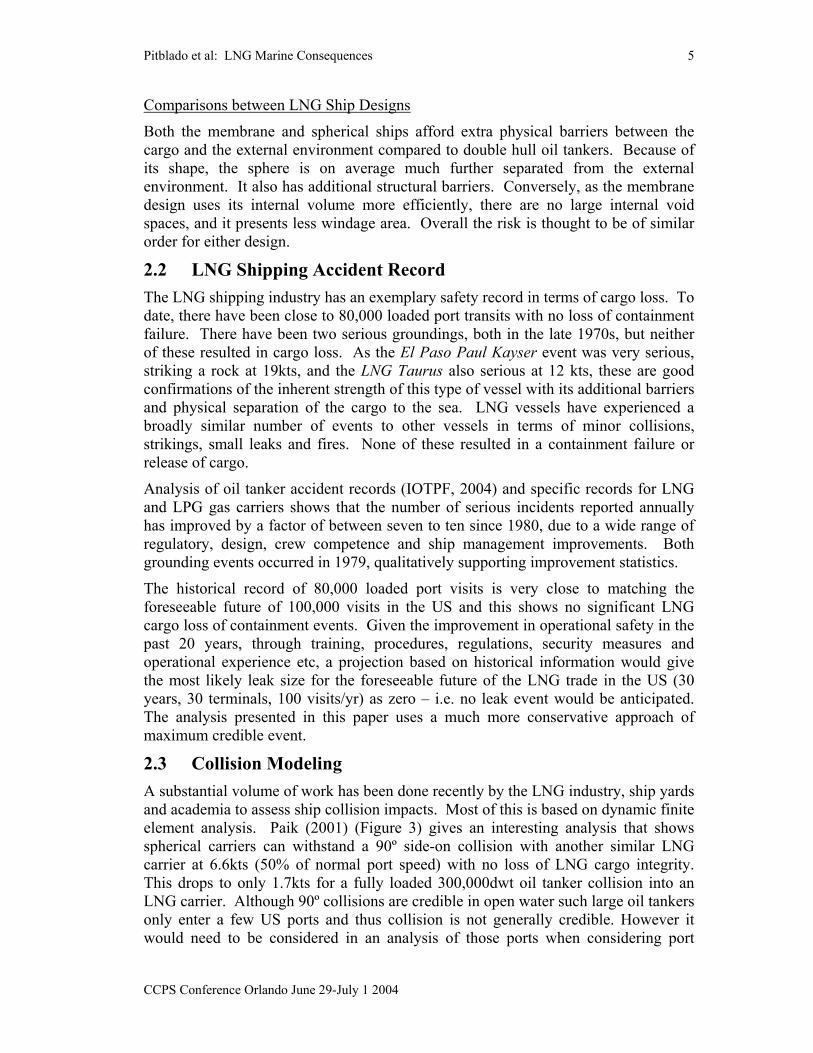
2.3 Collision Modeling A substantial volume of work has been done recently by the LNG industry, ship yards and academia to assess ship collision impacts. Most of this is based on dynamic finite element analysis. Paik (2001) (Figure 3) gives an interesting analysis that shows spherical carriers can withstand a 90º side-on collision with another similar LNG carrier at 6.6kts (50% of normal port speed) with no loss of LNG cargo integrity. This drops to only 1.7kts for a fully loaded 300,000dwt oil tanker collision into an LNG carrier. Although 90º collisions are credible in open water such large oil tankers only enter a few US ports and thus collision is not generally credible. However it would need to be considered in an analysis of those ports when considering port
Pitblado et al: LNG Marine Consequences 6
CCPS Conference Orlando June 29-July 1 2004
geometry. A conservatism in most of this work is that leakage is assumed whenever the LNG tank space is impinged upon (i.e., the LNG containment is unable to withstand any deformation). However, experience indicates that some deformation of the cargo tank can be expected without any loss of containment.
Figure 3. LNG to LNG ship collision analysis (Paik, 2001)
3. HAZID AND HOLE SIZE DETERMINATION A feature of this work was the effort to assess hole sizes in the hull and LNG tank based on the input of specialists knowledgeable both in LNG shipping activities and in general risk assessment of flammable process facilities. Key skills of HAZID (Hazard Identification) team members included marine classification engineers, naval architects, structural specialists, marine officers, risk analysts, and process, mechanical and safety engineers. The HAZID session involved a total of 23 specialists. A formal procedure was followed where the team reviewed the various phases of an LNG vessel progress through the port (approach, transit, maneuvering, at the jetty) as different threats and safeguards apply to each phase.
The team worked with a definition of credible which was: there must be the potential for an initiating event to be technically feasible (even if highly unlikely) within the expected lifetime of the activity. In the US context, this is 30 terminals, operating for 30 years, with 100 loaded LNG visits per year. This is approximately 100,000 loaded visits. The major outcome would be at a very much lower frequency as there are intervening safeguards (design and procedural).
The team did not require that the event had occurred – in fact, no significant loss of LNG tank cargo event has ever occurred. The test for credibility was based on the threats and safeguards currently deployed. Essentially all the events identified as credible have never occurred to an LNG vessel. To put the test of credibility into context, there have been 80,000 loaded port transits of LNG vessels since the trade started without cargo tank loss of containment events.
Identified Events
The HAZID (Hazard Identification) team identified a number of significant, but rare, events. These were judged credible as the precursor events were realistic, but no formal likelihood evaluation was carried out. It is probable that the actual likelihood of these events would be very much less than 1 in 100,000 visits. A formal QRA
Pitblado et al: LNG Marine Consequences 7
CCPS Conference Orlando June 29-July 1 2004
(Quantitative Risk Assessment) and fault tree analysis would be necessary to better estimate the event probabilities.
The main focus of the HAZID was accidental events – that is collision, grounding, striking and operational error. Potential effects of terrorist events was initially considered by the HAZID team, and subsequently updated later based on discussions with Sandia National Laboratories who are advising the US Department of Energy on LNG shipping safety, including terrorism threats.
Key operational threats identified as credible given the current safeguards were as follows:
─ Collision at 90º with vessels between to 30 – 150,000 dwt ─ Grounding against a pinnacle rock at 12 kts ─ Loading arm safety system failure at the jetty resulting in 7-10,000m3/hr
discharge for 10 minutes
Involvement of more than one tank in an incident was not judged credible due to vessel design and the accident history.
Hole Size Determination
Estimation of hole size arising from accidents for LNG carriers is difficult as there are multiple barriers in place. Typically there are between four to five physical barriers which must be breached to release LNG cargo. Paik and others who have presented work on collisions base their analysis on when the LNG tank space is intruded upon. In fact, the LNG tank can absorb significant deformation before it fails. The tank material is designed to remain ductile at -162ºC. The tank is not completely full of liquid, typically about 96-97% full on arrival, giving a vapor space of over 800m3. So long as the tank is not liquid full and the structure can deform, there is a good chance there will be no leak as the velocity of deformation will be low. The El Paso Paul Kayser grounding accident caused major deformation to the hull, but the intervening barriers limited the membrane LNG tank deformation to around 1m, with no leak.
The Hazard Identification team identified that 250mm would be a credible hole size for a ‘puncture’ type event, therefore this was one of the hole sizes modeled. The other hole sizes to be modeled were derived following the HAZID through discussion with the appropriate experts.
DNV’s leading structural specialist, Dr Bo Cerup-Simonsen, carried out a judgment based review to estimate potential hole size. His qualifications include: Head of DNV’s Hydrodynamics and Structures Section, PhD in Mechanical Engineering, Associate Professor at the Technical University of Denmark, co-organizer of the 2nd International Conference on Collisions and Grounding in 2001, co-developer of a collision model at MIT currently used in the US, and author of over 50 technical papers on topics related to collision and grounding. Additional valuable input was received from Sverre Vålsgard, a colleague in the Hydrodynamics and Structures Department, also with substantial collision and grounding experience.
Dr. Simonsen’s judgment was based on statistical data for collision and grounding damage given in the IMO Guideline for alternative tanker design (IMO, 1995). This damage statistic is made non-dimensional with principal vessel dimensions and the
Pitblado et al: LNG Marine Consequences 8
CCPS Conference Orlando June 29-July 1 2004
amount of damage records does not allow for accurate, detailed analyses. It is however believed to be valid for a rough estimate of likely damage extents. If it is assumed that the extent from the outer shell to the LNG tank is 3m and the deformability is 2m, then penetrations less than 5m will not result in leakage. Under this assumption, the damage statistics indicate that only approximately 10% of grounding or collision events will result in leakage. For the events that lead to leakage, opening widths between 0 and 1500mm are equally likely. The average hole width in events leading to leakage is thus 750mm. The longitudinal extent of damage in a grounding event as well as the vertical extent of damage in a collision event may be considerably larger, and the results are obviously quite sensitive to the ductility of the containment system, which is very uncertain. Further analyses are therefore recommended to reduce the uncertainty.
The maximum credible event of 750mm from an operational accident was selected as the maximum credible for two reasons: the data was based on the total merchant navy fleet and LNG carriers have additional strength compared to the norm, and only 10% of grounding events will lead to leakage. A hole size of 1500mm is also selected, but primarily to address terrorist intervention (see later discussion).
The loading arm event assumes some total failure of the loading arm and the associated powered emergency release coupler (PERC) automatic shutoff system. It further assumes that the ship’s crew takes 10 minutes to recognize the situation and shut down the LNG supply using other shutoff valves or shutting down the LNG pumps. These actions could be achieved manually if automatic systems failed. This event is very much larger than any leakage event that has occurred over a statistical period similar to that used for the credibility test. As LNG cargo is normally discharged through two arms, the leak rate was taken as 7,000m3/hr.
In the review of potential terrorist threats, DNV considered typical weapons used elsewhere in terrorist attacks. These can do serious damage to the objects they are designed to target, but they would probably make relatively poor weapons to attack LNG carriers which have very different internal design. Furthermore, if the weapon did penetrate into the LNG cargo space, it would most likely be expected to cause immediate ignition and give a serious local fire, but not a long distance delayed ignition flammable cloud that would be hazardous to the public and nearby critical installations.
Additional discussions with Sandia National Laboratories (private communication) indicated that their analysis of terrorist threats would support a larger hole size. They had undertaken more detailed analysis of the type of threats that may be present. One aspect was that as the attack size became larger, the logistics or means necessary to be successful might suggest other vulnerable targets in the US might become more attractive than an LNG ship. There are many LNG terrorism scenarios that might either fail because of the inherent strength of the vessel, or if they succeeded might generate a very large fire and possibly destroy the vessel but do no significant harm to more distant surrounding communities or critical facilities. Based on Sandia’s input, but using our own judgment with respect to our credibility threshold, DNV believes that the maximum credible hole size for LNG marine activities would need to be
Pitblado et al: LNG Marine Consequences 9
CCPS Conference Orlando June 29-July 1 2004
increased from 750mm from accidental operational causes to 1500mm to account for terrorism events.
The consequence events considered credible were as follows: 1. 250mm Maximum credible puncture hole 2. 750mm Maximum credible hole from accidental operational events 3. 1500mm Maximum credible hole from terrorist events 4. 7,000m3/hr Maximum credible operational spillage event (10 minutes) 5. 10,000m3/hr Maximum credible sabotage event (60 minutes)
The HAZID Team was not able to consider cryogenic spill effects to the vessel structure and whether this might increase the size of event due to brittle fracture of the ship’s structure. While this is possible, there are design and physical features that also may limit escalation due to cryogenic effects (e.g. tank separation, water ingress, interaction with colliding vessel). It would require significant further analysis to evaluate this as there are multiple outcome potentials and time delays, which could range from no increase in the event to some significant increase. This is better analyzed using an approach based on quantitative risk assessment where the probability and consequence of each outcome are assessed in detail.
4. MODELING APPROACH 4.1 Physics of Releases Given a serious leakage of LNG onto water from a ship, there are many possible physical phenomena that could occur. These have been reviewed and DNV has modeled: LNG discharge (above and below the waterline), pool formation and evaporation, dense gas dispersion, ignition at the lower flammable limit distance, flash fire, and pool fire (initial and sustained). This approach is conservative as it assumes the event causing the hole does not lead to immediate ignition. If immediate ignition occurs (as might be likely in a collision event) then hazard zones would be determined by the fire scenario and the longer dispersion hazard ranges would not be relevant. Also flammable clouds ignited remotely often ignite before they reach their lower flammable limit as ignition points are at specific locations.
DNV considered other potential hazardous outcomes such as BLEVE and VCE and considers that such outcomes are generally not credible for LNG marine releases. A BLEVE (Boiling Liquid Expanding Vapor Explosions) is most often associated with fire impingement of a pressurized liquefied gas (e.g. propane or butane) contained in a pressure vessel. While the pressure relief valve can maintain the pressure within the vessel’s allowable limit, the fire can weaken the metal shell in the upper vapor space (but not the lower liquid space) so that it can fail. The sudden opening of the pressure vessel releases large quantities of pressurized liquid that immediately flashes to gas at atmospheric pressure. The flashing gas is ignited by the fire and expands rapidly and turbulently, radiating heat as a fireball. No significant pressure wave is generated.
An LNG-related BLEVE would require that a large external fire could exist and cause the pressure inside the LNG tank to rise to a significant level such that upon tank failure due to thermal weakening a large flash of pressurized methane would occur. There is no potential for this to occur either for the membrane or spherical design.
Pitblado et al: LNG Marine Consequences 10
CCPS Conference Orlando June 29-July 1 2004
The cargo tanks are not designed for significant pressure and pressure relief would limit the pressure rise to a small amount insufficient to cause a BLEVE event.
A VCE (Vapor Cloud Explosion) event was reviewed for its potential. Bull (2004) has summarized the now well advanced current knowledge on vapor cloud explosions and the conditions necessary to cause combustion of a cloud of flammable gas to accelerate sufficiently to generate pressure effects. Methane in the open (as over water) has no mechanism to cause the flame front to accelerate. Work by Mitzner and Eyre (1983) which ignited several LNG flammable clouds found most flame fronts progressed slowly, often under 10-12m/s. They reported that in one case the flame front could not progress against a wind speed of 5m/s and that several clouds also self-extinguished. LNG vapors are very cold and the cloud will be filled with condensed fog. These create very poor combustion conditions. DNV believes that LNG VCE events are not credible over water, but that they may need to be considered in specific situations if flammable vapors can drift into highly congested areas where there is sufficient obstruction present to result in an acceleration of the flame front to speeds where overpressures are developed. Typically, such events are considered for releases within process plants where there is a large number of process equipment such as piping, vessels, and equipment supports.
DNV considered Rapid Phase Transition (RPT). Nedelka (2003) reviews the current state of understanding of RPT, which still has significant uncertainty. In general, RPT effects tend to generate pressure waves of low intensity but sufficient to cause window breakage local to the point of release and of insufficient energy to have long distance impacts.
4.2 PHAST Model The consequence model employed was PHAST (ver 6.4). This is the latest version of a commercial consequence package, produced by DNV in 1987 and it currently is amongst the most widely used packages in the oil, gas and chemical industries with over 600 licenses. It is also the consequence engine for the SAFETI QRA package and its results underpin the API RP 580 / 581 risk based inspection methodology used globally at most refineries.
PHAST is a suite of interconnected consequence packages for modeling: discharge, pool formation and evaporation, dense and buoyant gas dispersion, jet and pool fire, BLEVE and vapor cloud explosion. It is supported by physical property information for a wide range of chemicals. The package is described in Witlox and Holt (1999). The dispersion model is of the similarity-type common for many dense-gas dispersion models, including the public domain model DEGADIS, but PHAST has more extensive source term modeling and other flammable outcomes. Similarity models impose some geometric constraints on the cloud and this allows solution of difficult dense gas plumes without resorting to more complex computational fluid dynamics (CFD) approaches. CFD models offer the ability to solve some special issues associated with wake effects, congestion and terrain, and the potential for inherently buoyant gases (like methane) to lift-off over time. These models may become more common in the future, but they are difficult to run and peer review, and long project times are necessary to assure meaningful results.
Pitblado et al: LNG Marine Consequences 11
CCPS Conference Orlando June 29-July 1 2004
4.3 Validation Trials for LNG LNG was a topic of major safety concern in the period 1978-1983 and substantial analyses and technical work was done around that time. Field experiments were carried out to simulate LNG spills onto land and water, dense gas dispersion, flash fire and pool fires. Thyer (2003) reviews well known cryogenic gas validation trials. The best known trials and those used extensively for validation of LNG spills onto water include the work of Koopman et al (1982) of Lawrence Livermore in the US and Shell at Maplin Sands in the UK (e.g. Mitzner and Eyre 1983). Ten specific LNG onto water trials were available and used for validation: Burro (trials 3, 7, 8, 9), Coyote (5, 6), and Maplin Sands (27, 29, 34, 35)
There is less data available for LNG fires on water, thus large scale LNG fires on land were used for validation. The trials used are described by Nedelka (1989) and Johnson (1992). Subsequent modeling allowed for the higher boil-off rate of LNG on water.
Types of Validation
The European Model Evaluation Committee (Britter, 2002) set out its view that validation is more than simply matching experimental data. Three important aspects to be checked include:
Assessment Does the model include the full range of phenomena and equations necessary to simulate all important mechanisms.
Validation Does the model accurately predict concentrations obtained from suitable trials.
Verification Does the model accurately implement the phenomena and equations it contains and does model development conform to good modern IT systematics (to avoid introducing errors).
PHAST is one of the best validated consequence codes. Using the terminology above the key validations are listed in Table 1.
Validation of Pool Formation
LNG pool formation is very important to the final result – both for dispersion and subsequent pool fire. Feldbauer et al (1972) spilled 415kg of LNG on water giving a pool for 11s and a maximum diameter of 14m. In comparison, PHAST gave 15s to a maximum diameter of 18.5m. Koopman et al. conducted four experiments spilling about 2000kg of LNG over a 60s time period. They observed that pools formed with a maximum diameter of 14 to 16m, which boiled off in about 80 to 90s. PHAST gave a maximum diameter of 22m with a boil-off time of 80s. DNV concludes that PHAST validates reasonably well, but gives conservative (i.e. larger) pool dimensions.
Pitblado et al: LNG Marine Consequences 12
CCPS Conference Orlando June 29-July 1 2004
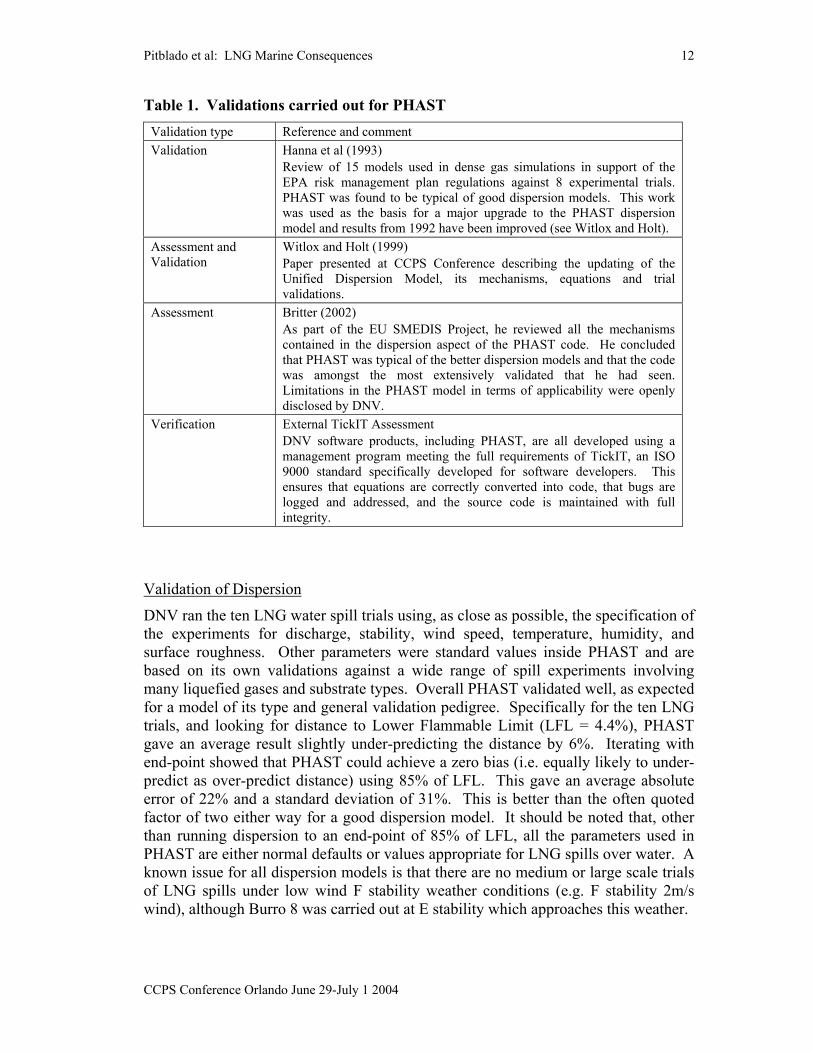
Table 1. Validations carried out for PHAST Validation type Reference and comment Validation Hanna et al (1993)
Review of 15 models used in dense gas simulations in support of the EPA risk management plan regulations against 8 experimental trials. PHAST was found to be typical of good dispersion models. This work was used as the basis for a major upgrade to the PHAST dispersion model and results from 1992 have been improved (see Witlox and Holt).
Assessment and Validation
Witlox and Holt (1999) Paper presented at CCPS Conference describing the updating of the Unified Dispersion Model, its mechanisms, equations and trial validations.
Assessment Britter (2002) As part of the EU SMEDIS Project, he reviewed all the mechanisms contained in the dispersion aspect of the PHAST code. He concluded that PHAST was typical of the better dispersion models and that the code was amongst the most extensively validated that he had seen. Limitations in the PHAST model in terms of applicability were openly disclosed by DNV.
Verification External TickIT Assessment DNV software products, including PHAST, are all developed using a management program meeting the full requirements of TickIT, an ISO 9000 standard specifically developed for software developers. This ensures that equations are correctly converted into code, that bugs are logged and addressed, and the source code is maintained with full integrity.
Validation of Dispersion
DNV ran the ten LNG water spill trials using, as close as possible, the specification of the experiments for discharge, stability, wind speed, temperature, humidity, and surface roughness. Other parameters were standard values inside PHAST and are based on its own validations against a wide range of spill experiments involving many liquefied gases and substrate types. Overall PHAST validated well, as expected for a model of its type and general validation pedigree. Specifically for the ten LNG trials, and looking for distance to Lower Flammable Limit (LFL = 4.4%), PHAST gave an average result slightly under-predicting the distance by 6%. Iterating with end-point showed that PHAST could achieve a zero bias (i.e. equally likely to under-predict as over-predict distance) using 85% of LFL. This gave an average absolute error of 22% and a standard deviation of 31%. This is better than the often quoted factor of two either way for a good dispersion model. It should be noted that, other than running dispersion to an end-point of 85% of LFL, all the parameters used in PHAST are either normal defaults or values appropriate for LNG spills over water. A known issue for all dispersion models is that there are no medium or large scale trials of LNG spills under low wind F stability weather conditions (e.g. F stability 2m/s wind), although Burro 8 was carried out at E stability which approaches this weather.
Pitblado et al: LNG Marine Consequences 13
CCPS Conference Orlando June 29-July 1 2004
Validation of LNG Pool Fire Trials
DNV used the largest LNG trials on land for validation: 35m fires at Montoir (Nedelka, 1989) and 10m fires (Johnson, 1992). PHAST results were very good on average for Montoir, with results at 5kW/m2 giving an overprediction of 7% in the downwind direction and an under-prediction of 9% in the cross wind direction. The 10m fire results were also good. As the downwind direction is longest, it is thus the more important and PHAST is a little conservative.
One area of change necessary in this project was to estimate the effect of fires on water compared to land. Normally heat from the fire radiates back into the pool generating the vapor that burns in a quasi-steady state situation; little heat enters from the soil. On water, researchers believe the situation is quite different and Cook (1993) implemented a correction factor between 2 and 3 which is the average of several published opinions. PHAST increases the boil-off rate to 2.5x the land based rate. The validation used luminous rather than smoky flames, and this fits the data well. However, the effect of increased boil-off over water, will be to put more fuel into the same air space as over land without any mechanism for entraining more air. This is likely to make the fire smokier and thus less luminous, with a greater fraction of the combustion energy going into heating the plume and less into thermal radiation. Overall, large pool fires have several areas of uncertainty. The large evaporating pool that is sustainable for dispersion is too thin to sustain combustion at the much higher rate of LNG consumption in a pool fire – LNG cannot flow from the source out to the periphery sufficiently quickly to replenish the material lost to combustion. Other uncertainty is associated with the degree of additional smoke associated with pool fires over water. The smaller diameter pool and the greater smoke generation would tend to reduce the thermal hazard range. This consequence area could benefit from large scale trials on water.
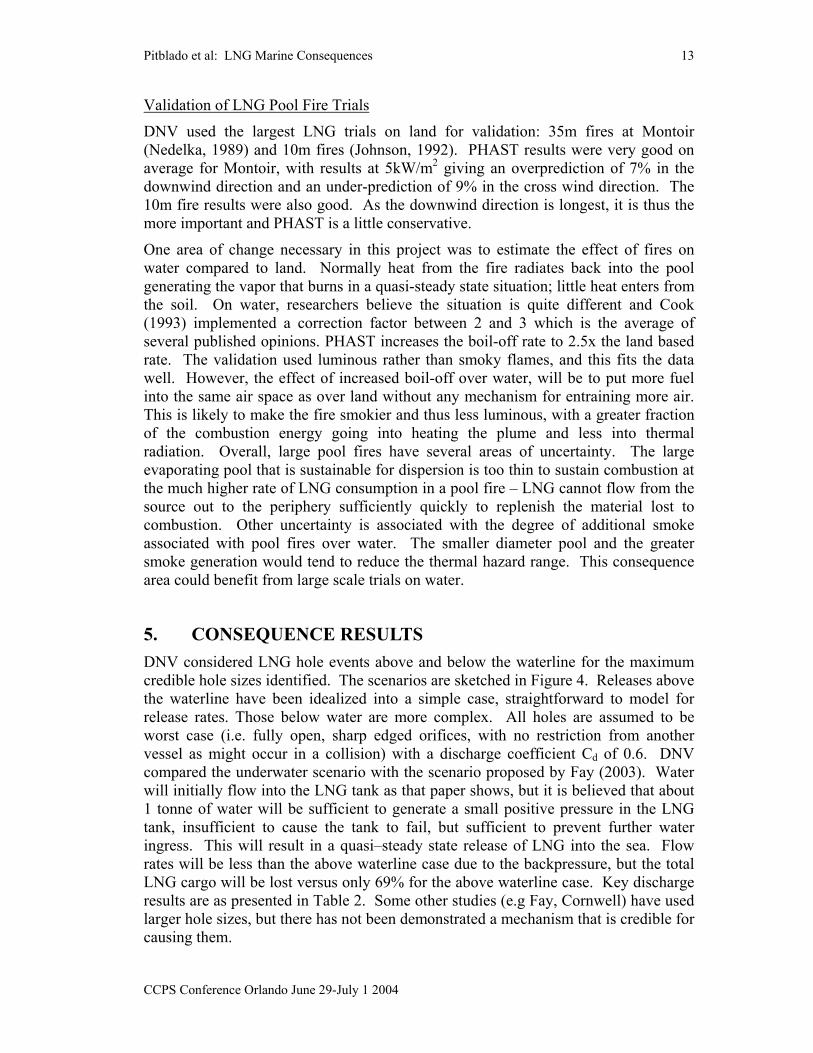
5. CONSEQUENCE RESULTS DNV considered LNG hole events above and below the waterline for the maximum credible hole sizes identified. The scenarios are sketched in Figure 4. Releases above the waterline have been idealized into a simple case, straightforward to model for release rates. Those below water are more complex. All holes are assumed to be worst case (i.e. fully open, sharp edged orifices, with no restriction from another vessel as might occur in a collision) with a discharge coefficient Cd of 0.6. DNV compared the underwater scenario with the scenario proposed by Fay (2003). Water will initially flow into the LNG tank as that paper shows, but it is believed that about 1 tonne of water will be sufficient to generate a small positive pressure in the LNG tank, insufficient to cause the tank to fail, but sufficient to prevent further water ingress. This will result in a quasi–steady state release of LNG into the sea. Flow rates will be less than the above waterline case due to the backpressure, but the total LNG cargo will be lost versus only 69% for the above waterline case. Key discharge results are as presented in Table 2. Some other studies (e.g Fay, Cornwell) have used larger hole sizes, but there has not been demonstrated a mechanism that is credible for causing them.
Pitblado et al: LNG Marine Consequences 14
CCPS Conference Orlando June 29-July 1 2004
Table 2. Discharge results – various holes sizes and locations Discharge Case Above waterline release Below waterline release Hole Size (mm) 250 750 1500 250 750 1500 Initial rate (kg/s) 226 2030 8130 200 1800 7220 Duration (hr) † 19 2.2 0.54 30+† 3+† 0.8+† Total release (%) 69% 100% † Durations are based on the average flowrate from the hole. For underwater cases this is an estimate only as the duration becomes complicated to estimate when the LNG driving force equalizes water back pressure.
Figure 4. LNG releases above and below the waterline
Dispersion Distances
Dispersion cases were run for F2, D3 and D5 where the letter is the atmospheric stability class and the number is wind speed in m/s. The most typical weather conditions in port areas would be D5. Other parameters include 20ºC air and water temperature, 70% relative humidity, surface roughness 0.3mm, and ambient solar flux 0.5 kW/m2. Results for above and below waterline cases are provided in Table 3.
A characteristic of flammable LNG releases is that the initial period following the start of the leak often results in the largest effect size. This is because the leak is at its largest rate. Dispersion distances are taken to the best estimate for LFL (lower flammable limit) which was established from the experimental trials validation to be best represented by an end point of 0.85 of LFL (see earlier discussion).
Pitblado et al: LNG Marine Consequences 15
CCPS Conference Orlando June 29-July 1 2004
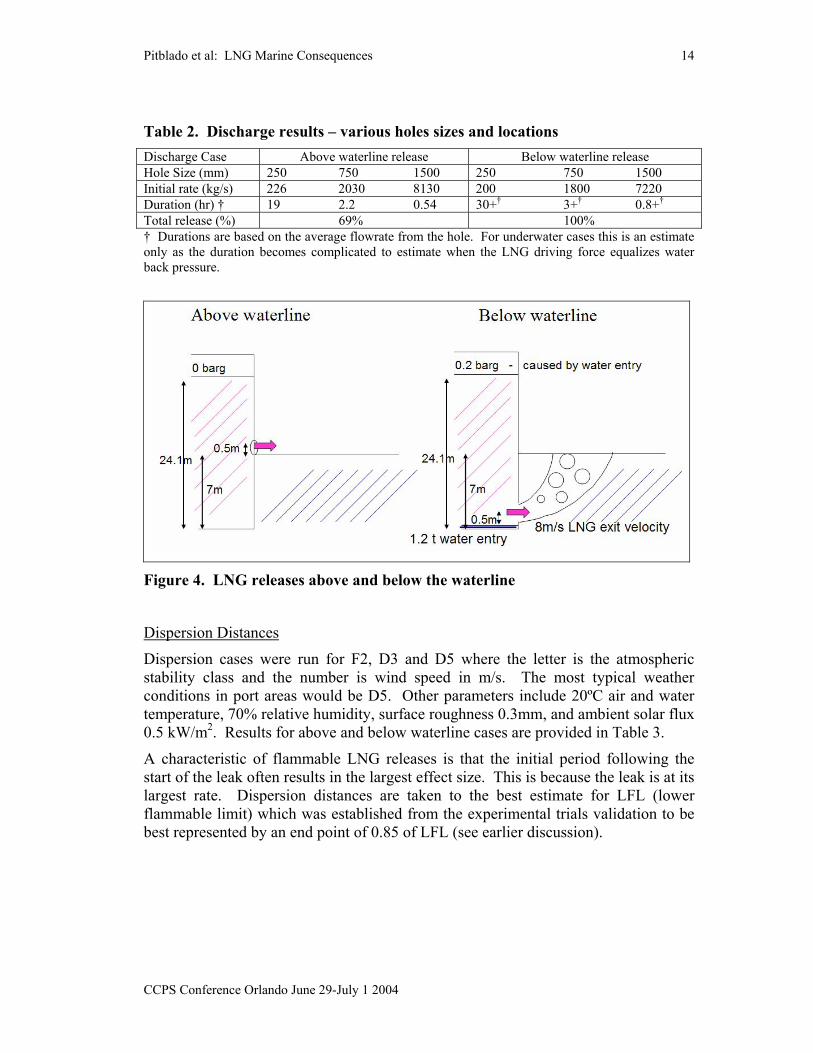
Table 3. Downwind flammable atmosphere distances estimated by PHAST for maximum credible LNG release scenarios for pure methane
(in this table the darker the shading the less credible the scenario) Release case
Above waterline cases:
Credible Scenarios Highly Uncertain Scenarios a)
Non-credible Scenarios b)
250 mm Release Above Sea
D 3.0m/s = 370m D 5.0m/s = 380m
F 2.0m/s = 830m
750 mm Release Above Sea
D 3.0m/s = 910m D 5.0m/s = 920m
F 2.0m/s = 1400m
1500 mm Release hAbove Sea
D 3.0m/s = 1800m D 5.0m/s = 2000m F 2.0m/s = 3100m
Below waterline cases
250 mm Release Below Sea
D 3.0m/s = 310m D 5.0m/s = 320m
F 2.0m/s = 430m
750 mm Release Below Sea
D 3.0m/s = 810m D 5.0m/s = 840m
F 2.0m/s = 900m
1500 mm Release Below Sea
D 3.0m/s = 1700m D 5.0m/s = 1900m F 2.0m/s = 3000m
Notes: a) F 2m/s weather dispersion distance has greater uncertainty than other weathers due to lack of validation data,
also the duration and speed of the cloud are such that contact times with the sea are long (e.g. 30+ minutes) and plume warmup may be sufficient for liftoff to occur, eliminating the downwind risk from that point.
b) 1500mm case is included to account for terrorism threats and at this hole size these events will almost certainly have associated immediate ignition. Given immediate ignition, the flammable cloud predicted by the model is not relevent. The actual consequence in this case will be a pool fire (see Table 5). They are reported here for completeness and to compare with other authors.
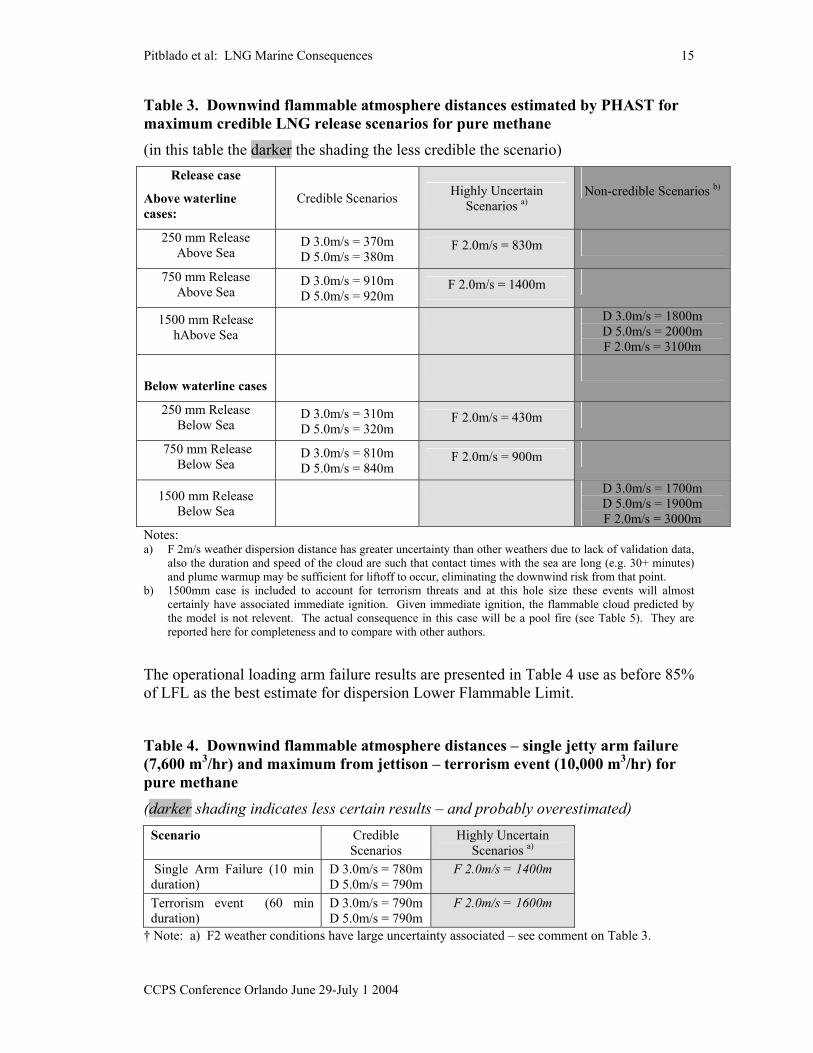
The operational loading arm failure results are presented in Table 4 use as before 85% of LFL as the best estimate for dispersion Lower Flammable Limit.
Table 4. Downwind flammable atmosphere distances – single jetty arm failure (7,600 m3/hr) and maximum from jettison – terrorism event (10,000 m3/hr) for pure methane
(darker shading indicates less certain results – and probably overestimated) Scenario Credible
Scenarios Highly Uncertain
Scenarios a) Single Arm Failure (10 min duration)
D 3.0m/s = 780m D 5.0m/s = 790m
F 2.0m/s = 1400m
Terrorism event (60 min duration)
D 3.0m/s = 790m D 5.0m/s = 790m
F 2.0m/s = 1600m
† Note: a) F2 weather conditions have large uncertainty associated – see comment on Table 3.
Pitblado et al: LNG Marine Consequences 16
CCPS Conference Orlando June 29-July 1 2004
The effect of different LNG compositions on the LFL hazard zone distances was also investigated. LNG typically has a methane composition of between 92-99%. The remainder of the LNG is mainly ethane and propane. There are other gases such as butane and nitrogen but their proportion is small typically (less than 1%).
In order to investigate the effect of non-methane components in the vapor on LFL hazard zone distances, a sensitivity analysis was performed using a vapor composition of 94% methane and 6% ethane. It was found that using this mixture the predicted LFL hazard zone distance could increase by up to 16% for the stable weather condition (F stability and 2m/s) and by around 10% for the neutral weather condition cases (D stability). The methane, being more volatile, will evaporate preferentially and the ethane enrichment of the vapor occurs later in the vaporization. As the maximum distance for the LFL excursion typically occurs as a result of vaporization earlier in the sequence of events, the distance is dominated by the nearly pure methane content. Thus there could be some increase in distances expected, but it will be less than with the assumption that the vapor has the same composition as the LNG. In any case, an increase if any would not be significant.
Flash Fire Results
It is generally assumed in risk assessments that large flash fires of the type involved here will burn back from the point of ignition to the source at relatively low speed and low emitted thermal radiation. The thermal hazard to exposed people within the flammable envelope is very serious, but it is very limited beyond the envelope. Therefore hazard zones for flash fire are those presented in Table 3 and Table 4.
Pool Fire Results
Pool fire results were calculated using the PHAST Model, recognizing that this model provides a conservative estimate for pool diameter as presented earlier. It does allow the LNG pool, initially 100mm thick to ultimately spread to a thickness of 1mm. The burning rate used on water is 2.5x the burning rate on land, which is 0.141kg/m2s. Multiplying by 2.5 and dividing by the density of 425kg/m3 gives the burning rate of 0.8mm/s. DNV believes the pool fire cannot sustain itself at its full evaporating diameter and 1mm thick burning at 0.8mm/s. A separate calculation balancing the discharge rate to the steady burning rate shows the sustainable pool fire diameter to be 43% to 48% of the initial evaporating pool. The outer thin portions of the initial pool will be consumed in seconds before the flame reaches the rear portion of the pool and it would be hard to differentiate this short combustion from the flash fire event which initiates it. The sustainable pool fire will be quite different to the flash fire and it will generate a large amount of thermal radiation. Pool fire thermal hazard zones to 5kW/m2 are presented in Table 5. This thermal flux is serious to unprotected people who cannot find shelter in 40 seconds.
Pitblado et al: LNG Marine Consequences 17
CCPS Conference Orlando June 29-July 1 2004
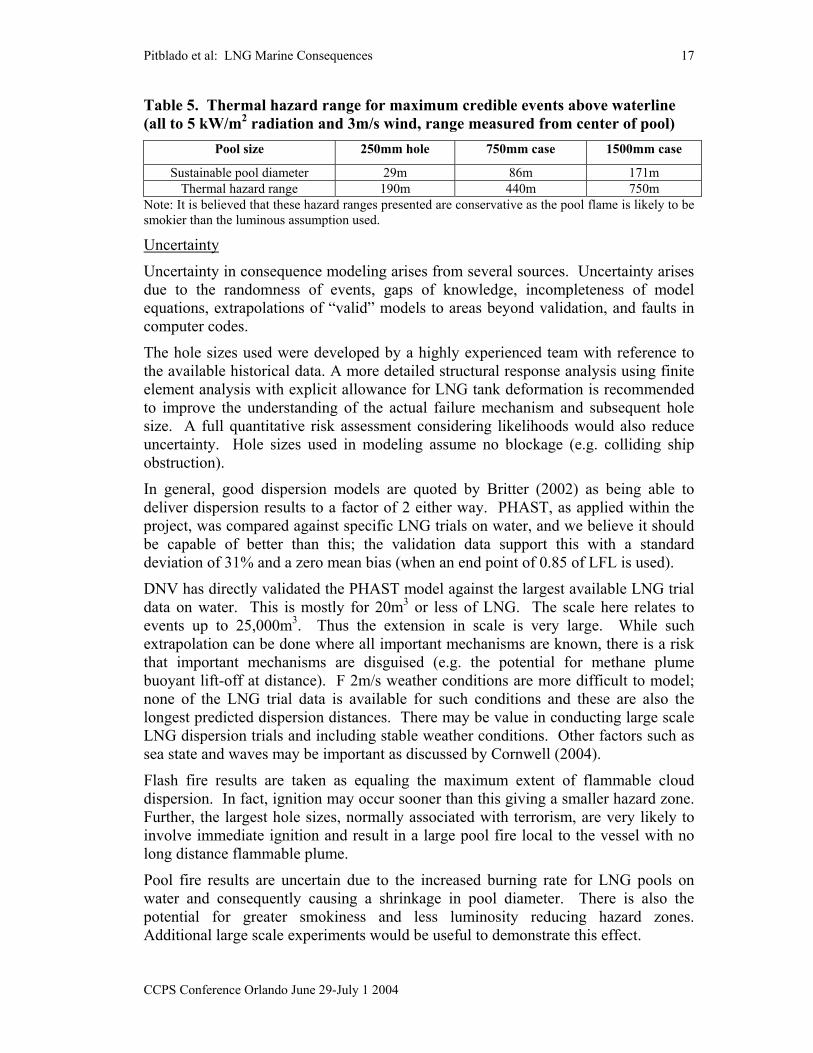
Table 5. Thermal hazard range for maximum credible events above waterline (all to 5 kW/m2 radiation and 3m/s wind, range measured from center of pool)
Pool size 250mm hole 750mm case 1500mm case
Sustainable pool diameter 29m 86m 171m Thermal hazard range 190m 440m 750m
Note: It is believed that these hazard ranges presented are conservative as the pool flame is likely to be smokier than the luminous assumption used.
Uncertainty
Uncertainty in consequence modeling arises from several sources. Uncertainty arises due to the randomness of events, gaps of knowledge, incompleteness of model equations, extrapolations of “valid” models to areas beyond validation, and faults in computer codes.
The hole sizes used were developed by a highly experienced team with reference to the available historical data. A more detailed structural response analysis using finite element analysis with explicit allowance for LNG tank deformation is recommended to improve the understanding of the actual failure mechanism and subsequent hole size. A full quantitative risk assessment considering likelihoods would also reduce uncertainty. Hole sizes used in modeling assume no blockage (e.g. colliding ship obstruction).
In general, good dispersion models are quoted by Britter (2002) as being able to deliver dispersion results to a factor of 2 either way. PHAST, as applied within the project, was compared against specific LNG trials on water, and we believe it should be capable of better than this; the validation data support this with a standard deviation of 31% and a zero mean bias (when an end point of 0.85 of LFL is used).
DNV has directly validated the PHAST model against the largest available LNG trial data on water. This is mostly for 20m3 or less of LNG. The scale here relates to events up to 25,000m3. Thus the extension in scale is very large. While such extrapolation can be done where all important mechanisms are known, there is a risk that important mechanisms are disguised (e.g. the potential for methane plume buoyant lift-off at distance). F 2m/s weather conditions are more difficult to model; none of the LNG trial data is available for such conditions and these are also the longest predicted dispersion distances. There may be value in conducting large scale LNG dispersion trials and including stable weather conditions. Other factors such as sea state and waves may be important as discussed by Cornwell (2004).
Flash fire results are taken as equaling the maximum extent of flammable cloud dispersion. In fact, ignition may occur sooner than this giving a smaller hazard zone. Further, the largest hole sizes, normally associated with terrorism, are very likely to involve immediate ignition and result in a large pool fire local to the vessel with no long distance flammable plume.
Pool fire results are uncertain due to the increased burning rate for LNG pools on water and consequently causing a shrinkage in pool diameter. There is also the potential for greater smokiness and less luminosity reducing hazard zones. Additional large scale experiments would be useful to demonstrate this effect.
Pitblado et al: LNG Marine Consequences 18
CCPS Conference Orlando June 29-July 1 2004
The hole sizes are very large considering the history of LNG activities and the degree of safeguards now applied. Dispersion distances are well validated but the longest distances are predicted for F2 weather which has the greatest uncertainty. Pool fire modeling is likely to be conservative.
6. CONCLUSIONS DNV has carried out a consequence analysis for marine events associated with the transport of LNG. The historical record of LNG shipping suggests that a large scale release is unlikely to occur in the foreseeable future of the LNG trade in the US.
Hazard zones have been developed for a range of maximum credible events due to puncture, normal accidents, terrorism, and jetty loading arm failure. For the most part they are less than some of the hazard zones previously presented at public meetings and LNG hearings.
Hazard zones include benefits associated with the current vessel designs and safe operations procedures adopted by operators, port authorities and the US Coast Guard. Results were calculated for all the cases, but this can create decision paralysis with many tables of numbers and it is helpful to place these into a context of what is most probable as many of the consequence outcomes are very unlikely to occur in the future expected LNG operations in the USA for the next 30 years.
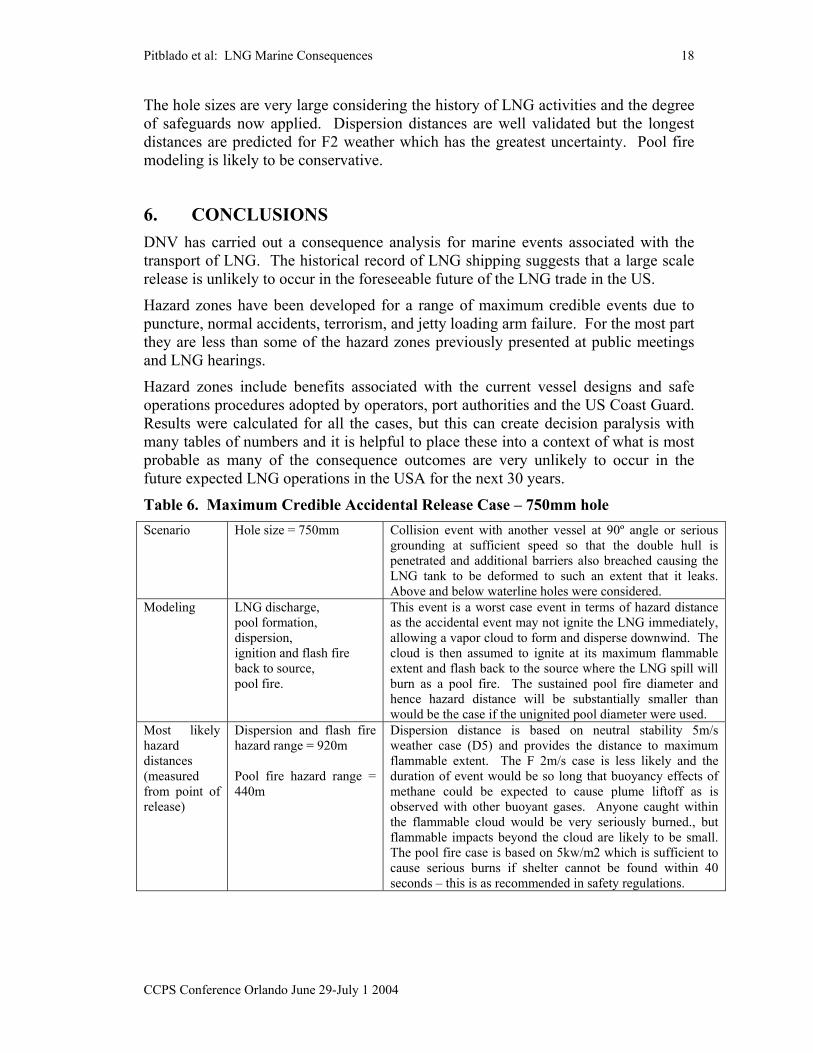
Table 6. Maximum Credible Accidental Release Case – 750mm hole Scenario Hole size = 750mm Collision event with another vessel at 90º angle or serious
grounding at sufficient speed so that the double hull is penetrated and additional barriers also breached causing the LNG tank to be deformed to such an extent that it leaks. Above and below waterline holes were considered.
Modeling LNG discharge, pool formation, dispersion, ignition and flash fire back to source, pool fire.
This event is a worst case event in terms of hazard distance as the accidental event may not ignite the LNG immediately, allowing a vapor cloud to form and disperse downwind. The cloud is then assumed to ignite at its maximum flammable extent and flash back to the source where the LNG spill will burn as a pool fire. The sustained pool fire diameter and hence hazard distance will be substantially smaller than would be the case if the unignited pool diameter were used.
Most likely hazard distances (measured from point of release)
Dispersion and flash fire hazard range = 920m Pool fire hazard range = 440m
Dispersion distance is based on neutral stability 5m/s weather case (D5) and provides the distance to maximum flammable extent. The F 2m/s case is less likely and the duration of event would be so long that buoyancy effects of methane could be expected to cause plume liftoff as is observed with other buoyant gases. Anyone caught within the flammable cloud would be very seriously burned., but flammable impacts beyond the cloud are likely to be small. The pool fire case is based on 5kw/m2 which is sufficient to cause serious burns if shelter cannot be found within 40 seconds – this is as recommended in safety regulations.
Pitblado et al: LNG Marine Consequences 19
CCPS Conference Orlando June 29-July 1 2004
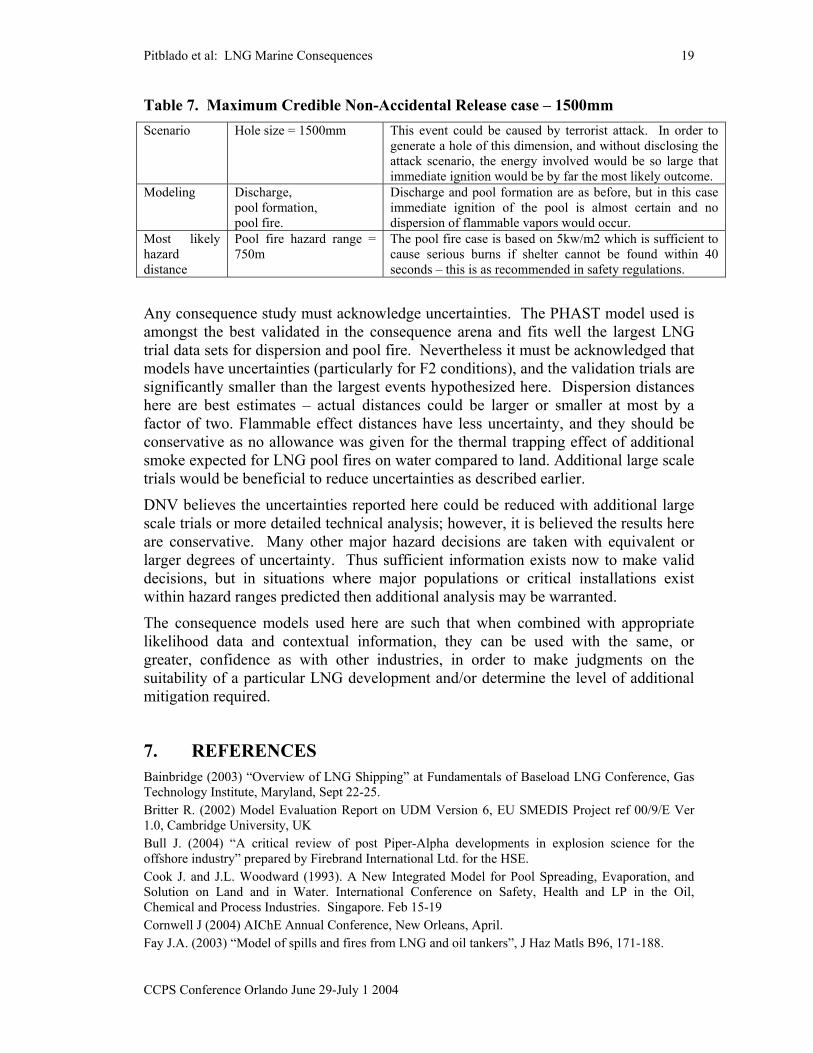
Table 7. Maximum Credible Non-Accidental Release case – 1500mm Scenario Hole size = 1500mm This event could be caused by terrorist attack. In order to
generate a hole of this dimension, and without disclosing the attack scenario, the energy involved would be so large that immediate ignition would be by far the most likely outcome.
Modeling Discharge, pool formation, pool fire.
Discharge and pool formation are as before, but in this case immediate ignition of the pool is almost certain and no dispersion of flammable vapors would occur.
Most likely hazard distance
Pool fire hazard range = 750m
The pool fire case is based on 5kw/m2 which is sufficient to cause serious burns if shelter cannot be found within 40 seconds – this is as recommended in safety regulations.
Any consequence study must acknowledge uncertainties. The PHAST model used is amongst the best validated in the consequence arena and fits well the largest LNG trial data sets for dispersion and pool fire. Nevertheless it must be acknowledged that models have uncertainties (particularly for F2 conditions), and the validation trials are significantly smaller than the largest events hypothesized here. Dispersion distances here are best estimates – actual distances could be larger or smaller at most by a factor of two. Flammable effect distances have less uncertainty, and they should be conservative as no allowance was given for the thermal trapping effect of additional smoke expected for LNG pool fires on water compared to land. Additional large scale trials would be beneficial to reduce uncertainties as described earlier.
DNV believes the uncertainties reported here could be reduced with additional large scale trials or more detailed technical analysis; however, it is believed the results here are conservative. Many other major hazard decisions are taken with equivalent or larger degrees of uncertainty. Thus sufficient information exists now to make valid decisions, but in situations where major populations or critical installations exist within hazard ranges predicted then additional analysis may be warranted.
The consequence models used here are such that when combined with appropriate likelihood data and contextual information, they can be used with the same, or greater, confidence as with other industries, in order to make judgments on the suitability of a particular LNG development and/or determine the level of additional mitigation required.
7. REFERENCES Bainbridge (2003) “Overview of LNG Shipping” at Fundamentals of Baseload LNG Conference, Gas Technology Institute, Maryland, Sept 22-25. Britter R. (2002) Model Evaluation Report on UDM Version 6, EU SMEDIS Project ref 00/9/E Ver 1.0, Cambridge University, UK Bull J. (2004) “A critical review of post Piper-Alpha developments in explosion science for the offshore industry” prepared by Firebrand International Ltd. for the HSE. Cook J. and J.L. Woodward (1993). A New Integrated Model for Pool Spreading, Evaporation, and Solution on Land and in Water. International Conference on Safety, Health and LP in the Oil, Chemical and Process Industries. Singapore. Feb 15-19 Cornwell J (2004) AIChE Annual Conference, New Orleans, April. Fay J.A. (2003) “Model of spills and fires from LNG and oil tankers”, J Haz Matls B96, 171-188.
Pitblado et al: LNG Marine Consequences 20
CCPS Conference Orlando June 29-July 1 2004
Feldbauer, G.F., J.J. Heigl, W. McQueen, R.H. Whipp, and W.G. May. Spills of LNG on water –vaporisation and downwind drift of combustible mixtures, Report No. EE61E-72, Esso Research and Engineering Company (1972) Hanna, S.R., J.C. Chang, D.G. Strimaitis (1993). Hazardous Gas Model Evaluation with Field Observations. Atmospheric Environment, Vol 27A, No 15, pp2265-2285. IMO (1995). Interim Guidelines for Approval of Alternative Methods of Design and Construction of Oil Tankers under Regulation 13F(5) of Annex I of MARPOL 73/78. Resolution MEPC.66(37), September 1995. Johnson AD (1992). A Model for Predicting Thermal Radiation Hazards from Large-Scale LNG Pool Fires, IChemE Symp. Series No. 130, pp. 507-524. Koopman, R.P., B.R. Bowman, and D.L. Ermak, Data and calculations of dispersion of 5 m3 LNG spill tests, Lawrence Livermore Laboratory. Koopman RP, J Baker, and others (1982). Burro Series Data Report, LLNL/NWC 1980 LNG Spills Tests. UCID-19075. Lawrence Livermore National Laboratory, Livermore, California. Mizner GA, and J.A. Eyer (1983), Radiation from Liquefied Gas Fires on Water, Comb. Sci. Techn. 35, p. 33. Nedelka D., J. Moorhouse and R.F. Tucker (1989). The Montoir 35m Diameter LNG Pool Fire Experiments, Proc. 9th Int. Conf. on LNG, Nice, 17-20 Oct. 1989 Nedelka D., V. Sauter, J. Goavic, R. Ohba.(2003). Last Developments in Rapid Phase Transition Knowledge and Modeling Techniques. Offshore Conference. OTC 15228 Paik J, I.H. Choe, A.K. Thayamballi (2001) On Accidental Limit State Design of Spherical Type LNG Carrier Structures Against Ship Collisions. 2nd International Collision and Grounding of Ships Conference. Copenhagen. Thyer A.M. (2003) “A review of data on spreading and vaporization of cryogenic liquid spills”, J Haz matls A99, 31-40. Whitlox H.W.M. and A. Holt (1999), A Unified Model for Jet, Heavy, and Passive Dispersion Including Droplet Rainout and Re-Evaporation, CCPS International Conference & Workshop on Modeling the Consequences of Accidental Releases of Hazardous Materials. Sept 28 Acknowledgements DNV acknowledges the support of the following sponsors from within the LNG industry; however, the results and opinions expressed are entirely those of DNV and not necessarily endorsed by the sponsors: Anadarko Petroleum, BHP Billiton, BP, Cheniere, ChevronTexaco, ConocoPhillips, Dominion Energy, ExxonMobil, Freeport McMoran, Marathon, Petrobras, Sound Energy Solutions, Shell, Statoil, Total. Tractabel and TransCanada. DNV would like to acknowledge support from Sandia National Laboratories, with the permission of the Department of Energy, who provided information and input to the cases used by DNV.