Embed Size (px)
Citation preview
High and lowadaptive
capability
445
Consequences of high and lowadaptive capability in UK
companiesMehmet Oktemgil
Birmingham Business School, University of Birmingham, Birmingham,UK and
Gordon GreenleyAston Business School, Aston University, Birmingham, UK
IntroductionThe ability of companies to adapt to markets is clearly fundamental to themarketing and strategic management literatures (David, 1993; Grant, 1991;Urban and Star, 1991; Walker et al., 1992). Adaptive capability can be defined asthe ability to identify and capitalize on emerging market opportunities(Chakravarthy, 1982; Hooley et al., 1992; Miles and Snow, 1978). Recentempirical evidence suggests that adaptive capability is a source of sustainablecompetitive advantage (Powell, 1992), and a source for developing lastingexchange relationships among suppliers and customers (Arndt, 1979;Hakansson, 1982; Hakansson and Ostberg, 1975; Hallen et al., 1991). However,adapting to market change is likely to be costly, as implementing adaptabilityrequires resource utilization, and there may be some loss of internal efficiencyas an outcome of adapting to markets (McKee et al., 1989).
Set against the costs of adaptability are the benefits to be gained. Althoughcontributions to sustainable competitive advantage are likely to be a benefit(Powell, 1992), so should a higher level of company performance (Bourgeois,1980; Snow and Hrebiniak, 1980). Also, Chakravarthy (1982) and Miles and Snow(1978) concluded that adaptive capability is a continuous rather than adichotomous construct. This suggests that firms can adopt different degrees ofadaptive capability, which will be associated with varying cost implications.Despite this problem of balancing the costs and benefits of adaptability, therehave been no empirical studies that have investigated variation in the degree ofadaptive capability and the potential implications for company performance. Theempirical study reported in this article addresses these issues, and is an extensionof the work of Chakravarthy (1982) and of Miles and Snow (1978). It examinesadaptive capability, and its consequences for performance, across a diverse set ofmarkets and environments in 407 UK companies, by investigating a combinationof adaptive capability variables that has not been previously researched.
Background to the studyThe concept of adaptive capability seems to focus around organizationalabilities for adapting to particular product-market scopes (Ansoff, 1965; Miles
European Journal of Marketing,Vol. 31 No. 7, 1997, pp. 445-466.
© MCB University Press, 0309-0566
Revised July 1996
EuropeanJournalof Marketing31,7
446
and Snow, 1978). A low capability features an internal focus, which results in anarrow scope as product-market opportunities will not have been pursued, andan accompanying risk of failure as a consequence of lack of focus on externalchange. A high level of capability features an external focus, which results in awider scope as a consequence of exploiting product-market opportunities, andan accompanying ability to adapt to further market changes (McKee et al.,1989), and/or to specific customers and suppliers (Williamson, 1979). However,while firms that have been designed to fit a specific market niche may be unableto adapt to change, firms that are designed for change may not be able tostabilize into a particular niche (Weick, 1979). Adaptive capability can also be atthe micro level, as adaptation to individual customers and suppliers, althoughthis level of adaptation may be more important in industrial markets (Ford,1982; Hakansson, 1982; Hallen et al., 1991; Turnbull and Valla, 1986). This levelof adaptation has been empirically studied in the International Marketing andPurchasing Project (IMP), which focused on industrial markets in severalEuropean countries (Hakansson, 1982). Specific adaptive capability may beneeded to customize products to individual customer requirements, or to adoptnew processes and routines, such as just-in-time, especially where there is anobjective of establishing and sustaining relationships.
It has been proposed by Zammuto (1982) that firms that are deliberatelydesigned for adaptability are inefficient. This is because efficiency is associatedwith narrow product-market scope activity, which requires little variation instandard practice, and because adaptive firms are characteristically“wandering” firms, in that they frequently change their products and marketsto pursue opportunities. Both these characteristics lead to excessive coststructures. Also, adaptive firms need changes in resource acquisition andallocation for developing new strategies for adapting to market change, and forthe subsequent implementation of these new strategies. Specialized adaptationat the micro level may also be expensive (Ford, 1982; Von Hippel, 1978; Frazieret al., 1988), such as when product specialization and new managementprocesses are needed, requiring transaction-specific investment (Pilling et al.,1994), sunk costs (Zaheer and Venkatraman, 1995), and opportunity costs (Ford,1982).Therefore, the level of adaptive capability that firms can achieve may beresource constrained.
Because achieving adaptive capability is expensive, McKee et al. (1989)proposed that the degree of market adaptability of companies will vary.Chakravarthy (1982) classified adaptive capability in terms of three differentstates of adaptation, which reflect this varying degree:
(1) An unstable state, where firms lessen their organization’s reaction withthe environment, by narrowing their product-market scope and adaptivecapability.
(2) A stable state, where firms react with the environment through marketmonitoring, but adapt by imitating the product and marketopportunities developed by other firms.
High and lowadaptive
capability
447
(3) A neutral state, where firms possess high adaptive capability, as theysearch for market opportunities and as they invest resources inmarketing activities to adapt to these opportunities speedily.
In the IMP literature adaptive capability at the micro level is explained in termsof customer-supplier relationships. Hakansson (1982) defines adaptivecapability in terms of problem-solving ability and transfer ability. Problem-solving ability is the supplier’s capability for solving difficult relationshipproblems, such as modifying products for specific customer requirements.Transfer ability is the capability to respond speedily to customers speedily; forexample, the capability to supply modified products to customers, once therelationship problems have been solved. Ford (1982) conceptualizes variation inadaptive capability in the customer-supplier relationship as the stage ofevolution of the relationship. In this conceptualization the adaptive capability ofsuppliers improves as the relationship evolves but, in the long term, therelationship can become routine and institutionalized, leading to reducedadaptive capability.
A search of the literature pertaining to adaptive capability has revealed thatthere are three areas of organizational activity that characterize adaptability:company response to product-market opportunities, marketing activities forresponding to these opportunities, and speed of response in pursuing theseopportunities.
Response to product-market opportunities. Several writers have concludedthat product-market scope reflects adaptive capability, as spread of markets andproducts results from the ability to respond to external opportunities(Chakravarthy, 1982; Hambrick, 1982; McKee, 1989; Miles and Snow, 1978). TheMiles and Snow (1978) strategy typology has been used to explain thischaracteristic of adaptability. Reactors lack adaptive capability as they do nothave internal processes for identifying and responding to product-marketopportunities. Defenders position in a narrow and stable product-market scope,as their adaptive capability is deliberately reduced. This is similar toChakravarthy’s unstable state classification. Analysers exhibit someadaptability as, although they tend to remain in relatively stable productmarkets, they monitor market changes with the aim of identifying and pursuingnew opportunities. This is similar to Chakravarthy’s stable state classification.Prospectors have the highest level of adaptive capability, as they continuouslysearch for new product-market opportunities, and as they develop they retaincapabilities for pursuing selected opportunities. This is similar toChakravarthy’s neutral-state classification. In the international marketingliterature this characteristic of adaptability relates to the ability to adapt toparticular product-market scopes, once they have been selected. Thisadaptability has been operationalized as specific product modifications, as theextent of product customization for specific customers or customer groups(Hakansson, 1982; Hallen et al., 1991). However, the adaptability of customers isalso taken into account in the literature, as the extent to which customers
EuropeanJournalof Marketing31,7
448
demand product modifications from their suppliers, and their willingness toadopt international product standards.
Marketing activities. A firm’s ability to adapt to changing markets willdepend on their market scanning, monitoring of customers and competitors,and allocation of the required resources to marketing activities (McKee et al.,1989; Walker and Ruekert, 1987; Walker et al., 1992). Chakravarthy (1982) andMiles and Cameron (1977) argue that, by investing in marketing activities, firmsare investing in the “requisite adaptive capability”. As the Miles and Snowreactor-defender-analyser-prospect typology inherently ranks these strategiesas increasingly adaptive types, the level of marketing activity is expected toincrease in this order.
These arguments are supported by a number of empirical studies. McDanieland Kolari (1987) found a positive correlation between the level of marketingactivities and the level of adaptive capability, and differences in marketingorientation among different degrees of adaptive capability. Hambrick (1983)noted that prospectors, with high adaptive capability, exhibit a significantlyhigher marketing effort, and that they devote more resources to their marketingactivities. Similarly, Walker and Ruekert (1987) argue that firms with higheradaptive capability allocate more resources to marketing. Hooley et al. (1992)found that firms with positive attitudes to marketing are better adapters, takemore risks and perform better.
Speed of response. The speed at which organizations respond to changingmarket conditions is one of the key characteristics of adaptability(Chakravarthy, 1982; Daniel and Kolari, 1987). Indeed, the high adaptivecapability of prospectors is characterized by the speed at which they respond toproduct-market opportunities. Central to this response is the speed of change ofthe marketing mix, where the aim is to maintain or improve alignment withchanging markets. The focus taken by Bonder (1976) and by Evans(1991) is thatadaptive capability is the ability to identify and respond swiftly to changebefore it takes place, or to respond quickly once change has occurred. Empiricalstudies by Bourgeois and Eisenhardt (1988), Collis (1991) and Powell (1992)show that quick response to change improves alignment between firms andtheir environments. According to Miles and Snow (1978) prospectors respond tomarket change much quicker than defenders and reactors, and they are moreresponsive to changing the marketing mix. At the micro level the speed atwhich companies respond to change in specific customer requirements is also akey characteristic of adaptive capability (Hakansson, 1982). As well as the needto respond to changes in customers’ product requirements speedily, throughproduct modification and customization, there may also be a need to modifymanagerial processes in line with customer requirements speedily, such as just-in-time management.
Adaptive capability and performanceAlthough it is argued that achieving and implementing adaptive capability iscostly (McKee et al., 1989; Zammuto, 1982), the main benefit of adaptability
High and lowadaptive
capability
449
should be improved performance (Bourgeois, 1980; Snow and Hrebiniak, 1980).Indeed, Hooley et al. (1992) found that prospectors, with high adaptivecapability, seem to perform better than other companies. However, Snow andHrebiniak (1980) concluded that analysers perform better than prospectors anddefenders, which suggests that market adaptability is positively associatedwith performance up to a point, but that at higher levels there is a negativeassociation. However, Miles and Snow (1978) hypothesized that there is nosignificant difference among the strategy types with respect to performance.This hypothesis was supported by the empirical study of Slater and Narver(1993), where no significant performance differences were found amongprospectors, analysers and defenders. Despite the conflict of evidence, the wholeaim of adaptability, through pursuing product-market opportunities,developing and enhancing marketing activities, and responding more speedilythan competitors, should be to enhance performance.
H1a: Firms with high adaptive capability will perform at a higher level thanfirms with lower adaptive capability.
Although particular organizational variables may have particular influences onperformance, these associations are likely to be affected by the externalenvironment (Hansen and Wernerfelt, 1989). For example, the influence ofmarket orientation on performance is seemingly moderated by environmentalturbulence (Greenley, 1995; Slater and Narver, 1994), as is the strategy-performance association (McArthur and Nystrom, 1991), and also the influenceof chief executive dominance in strategic decision making on performance(Haleblian and Finkelstein, 1993). McKee et al. (1989) hypothesized that theassociation between adaptive capability and performance will be moderated bythe environment. Their empirical testing suggested that the mediumadaptability of analysers may lead to better performance in a mildly volatileenvironment, but not in highly volatile environments.
H1b: The positive association between adaptive capability and performancewill be moderated by environmental turbulence.
Adaptive capability and the external environmentThe impact of influences from the external environment on severalorganizational issues has been the subject of various empirical studies.Venkatraman and Prescott (1990) concluded that, although the attainment of anappropriate match between the environment and strategy has systematicimplications for performance, the extent of empirical support is equivocal andis riddled with problems of conceptualization and testing. The impact of theexternal environment on marketing activities was researched by Davis et al.(1991). They found that environment turbulence is positively associated withmarketing activities, and concluded that marketing activity is dependent onparticular environmental circumstances.
Hrebiniak and Joyce (1985) concluded that firms with high adaptabilityreadily perceive the importance of their environments, which in turn will affect
EuropeanJournalof Marketing31,7
450
their choice of adaptation. Chakravarthy (1982) argues that firms with higheradaptive capability can cope with dynamic and complex environments becausethey have the ability to anticipate change ahead of time, which has beenempirically supported by Lant et al. (1992) and by Walker and Ruekert (1987).McKee et al. (1989) found that firms with moderate adaptive capability performbetter in mildly volatile markets, but this relationship was not evident forhighly adaptive firms in volatile high-growth markets.
H2a: Firms with high adaptive capabil ity will be associated with moreturbulent environments than firms with lower adaptive capability.
Hooley et al. (1992) found that adaptive capability improved in high growthmarkets. This result coincides with the Miles and Snow (1978) typology:prospectors will capitalize on their adaptive capabilities in growth markets,resulting in first-mover advantages to gain market share speedily as themarkets grow.
H2b: Firms with high adaptive capabil ity will be associated with highermarket growth than firms with lower adaptive capability.
Adaptive capability and the internal environmentAdaptive capability has been measured on the basis of an appropriate matchingof external contingency factors with internal response factors, whereeffectiveness of adaptability is dependent on both external and organizationalvariables (Hansen and Wernerfelt, 1989; Powell, 1992). Three internal responsefactors that have received recent attention in the literature are of particularrelevance to adaptive capability: market orientation, decision-making style andslack resources. Kohli et al. (1993) claim that market orientation improves theability of firms to perceive their environments objectively. Kohli and Jaworski(1990) and Narver and Slater (1990) argue that market orientation providesinternal co-ordination for assessing and addressing the external interests ofcustomers and competitors. Hakansson (1982) found that companies that areless willing to adapt their products to comply with international standards alsotend to have a low market orientation, compared with firms that exhibit ahigher level of compliance to international standards. Consequently, marketorientation should be an internal response factor that enhances the selection ofproduct-market opportunities, marketing activities and speed of response.
H3a: Firms with high adaptive capabil ity will exhibit higher marketorientation than firms with lower adaptive capability.
Recent research indicates that firms using comprehensive decision-makingstyle, such as market research, analytical techniques and brainstorming,achieve effective and speedy decisions under changing environmentalconditions (Bourgeouis and Eisenhardt, 1988; Eisenhardt, 1989; Lant et al.,1992). According to Eisenhardt (1989), decision-making style helps managers tomove quickly through several alternative decision-making scenarios, therebyreducing the feeling of “psychological trapping”. Therefore, comprehensive
High and lowadaptive
capability
451
decision-making style should also be an internal response factor that enhancesthe selection of product-market opportunities, marketing activities and speed ofresponse.
H3b: Firms with higher adaptive capability will exhibit a more comprehensivedecision-making style than firms with lower adaptive capability.
Some theorists also argue that firms are always in a given state of preparednessfor adapting to their environments, which can be measured by the extent oftheir slack resources (Chakravarthy, 1986; Cyert and March, 1963; Miles andCameron, 1977). The availability of slack resources provides the means foradapting to market changes, while increases in slack resources allow firms tomove to a higher state of adaptation (Andrews, 1971; Galbraith, 1973).Therefore, slack resources should also be an internal response factor thatenhances the selection of product-market opportunities, marketing activitiesand speed of response.
H3c: Firms with high adaptive capability will exhibit more slack resourcesthan firms with lower adaptive capability.
MethodOperationalization of the variablesFour sets of variables were operationalized in the current study: adaptivecapability, external variables, internal variables and performance. Details of theoperationalization of adaptive capability are given in Appendix I, and details ofthe external and internal variables are given in Appendix II. Performance hasbeen measured in previous studies with either a subjective approach (forexample, Golden, 1992; Verhage and Waarts, 1988), or an objective approach(for example, Chakravarthy, 1986; Cronin and Page, 1988). The subjectiveapproach is based on executive perceptions of performance, whereas theobjective approach is based on reported accounting measures. The subjectiveapproach has been used extensively in empirical studies, having been justifiedby several writers (Dess and Robinson, 1984; Doyle et al., 1989; Speed, 1991;Venkatraman and Ramanujam, 1986), whereas other researchers havequestioned the value of accounting measures in strategy research (Day andWensley, 1988; Fisher and McGowan, 1983). Consequently, performance wasoperationalized by asking the respondents to state how their return oninvestment, market share, sales growth and new product success rate compareto that of their competitors, in their principal markets. Scales were used thatconsist of percentage differences in performance compared to competitors.
Data collectionAs the theoretical framework of the study features little empirical evidence, andas the current combination of adaptive capability variables has not beenpreviously researched, this study reports initial findings within this domain ofenquiry. Given this background, the overall aim was initially to test the value ofthe theoretical concepts. The operationalized variables were incorporated into a
EuropeanJournalof Marketing31,7
452
self-completion questionnaire, which is the approach that has been used insimilar studies with the same objective (Greenley, 1995; Jaworski and Kohli,1992; McKee et al., 1989; Narver and Slater, 1992). The questionnaire was pilotedthrough personal interviews with 22 managing directors in companies ofdifferent sizes and in different industries. The aims were to test the contentvalidity of the measures, to identify any ambiguity in the questions, and toidentify any difficulties in answering the questions. The latter were modified asa consequence of the respondents’ comments, and the new questionnaire waspiloted with a further 13 managing directors, after which only minormodifications were made. Therefore, the results of the pilot study gave supportfor the use of a self-completion questionnaire.
A sample of 2,000 managing directors was randomly selected from the Dun& Bradstreet list of companies in the UK machine-tools industry, and aquestionnaire and personal letter were mailed to each managing director. Thisindustry was chosen because of its complex and dynamic environment, whichwould provide a basis for testing the value of the adaptive capability constructs(Wolfe, 1991). The respondents were not told about the purpose of the survey, toreduce respondent bias, but were told that the aim was to investigate UKbusiness practices. A total of 450 companies responded, of which 408 returnedfully completed questionnaires. The response rate of 21 per cent is consistentwith those of other published studies using a similar method. To test for non-respondent bias the results from the latter responses were compared with thoseof the earlier responses, but no significant differences were evident (Armstrongand Overton, 1977).
The resultsGiven that 16 variables were used to measure adaptive capability, there wasobviously potential for wide variation in the extent to which companies can usethese variables to establish their adaptive capability. To capture thesemultivariate measures of adaptive capability, cluster analysis was used toinvestigate tendencies within the sample for establishing variation in capability.This technique is appropriate because there was little a priori knowledge aboutthe number of different tendencies to be expected, and as the members of thesedifferent tendencies were unknown (Hair et al., 1995; Saunders, 1994).
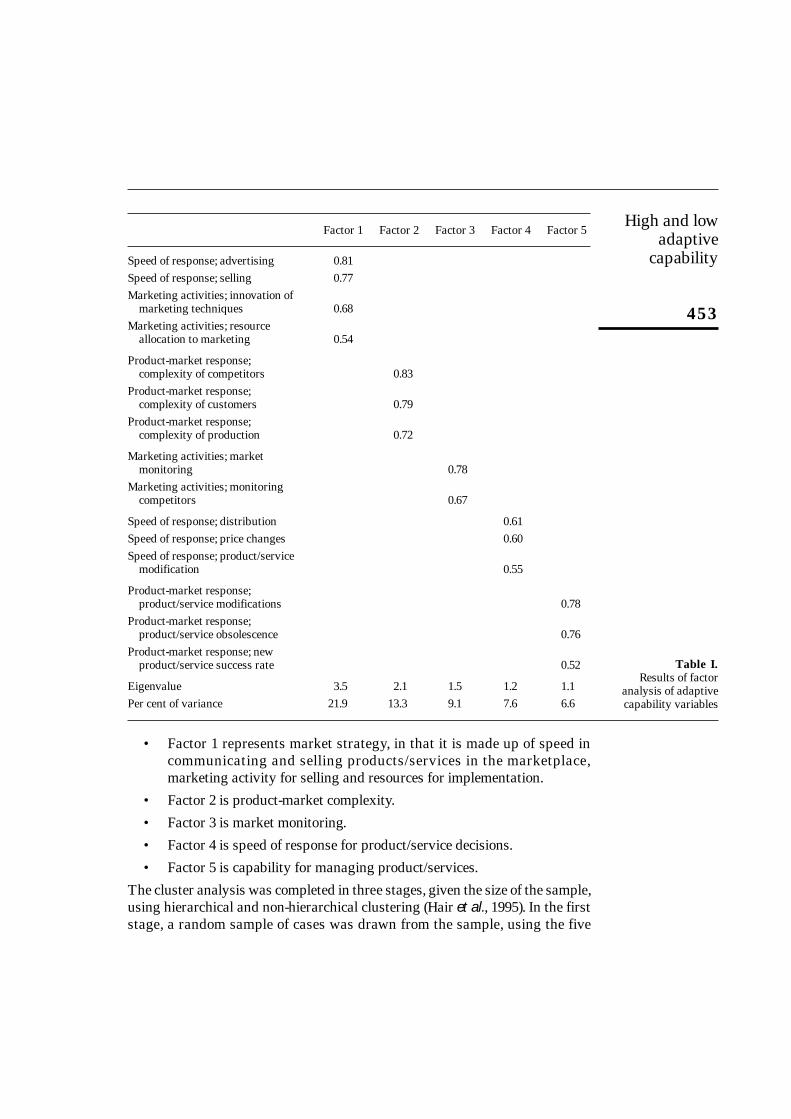
To input the data into the cluster analysis as relatively independent andparsimonious variables, the 16 adaptive capability variables were subject tofactor analysis, with principal components analysis and varimax rotation(Saunders, 1994). A five-factor solution was obtained by extracting factors witheigenvalues greater than 1, which explains 58.5 per cent of the variance (Kaiser-Meyer-Olkin statistic 0.77; Bartlett test of sphericity 1291.4; significance 0.000).The factor loadings are shown in Table I. Each of the variables loads heavily onto only one of the factors, and the loadings on each factor exceed 0.50. Thefactors are readily interpretable:
High and lowadaptive
capability
453
• Factor 1 represents market strategy, in that it is made up of speed incommunicating and selling products/services in the marketplace,marketing activity for selling and resources for implementation.
• Factor 2 is product-market complexity.
• Factor 3 is market monitoring.
• Factor 4 is speed of response for product/service decisions.
• Factor 5 is capability for managing product/services.
The cluster analysis was completed in three stages, given the size of the sample,using hierarchical and non-hierarchical clustering (Hair et al., 1995). In the firststage, a random sample of cases was drawn from the sample, using the five
Factor 1 Factor 2 Factor 3 Factor 4 Factor 5
Speed of response; advertising 0.81Speed of response; selling 0.77Marketing activities; innovation of
marketing techniques 0.68Marketing activities; resource
allocation to marketing 0.54
Product-market response;complexity of competitors 0.83
Product-market response;complexity of customers 0.79
Product-market response;complexity of production 0.72
Marketing activities; marketmonitoring 0.78
Marketing activities; monitoringcompetitors 0.67
Speed of response; distribution 0.61Speed of response; price changes 0.60Speed of response; product/service
modification 0.55
Product-market response;product/service modifications 0.78
Product-market response;product/service obsolescence 0.76
Product-market response; newproduct/service success rate 0.52
Eigenvalue 3.5 2.1 1.5 1.2 1.1Per cent of variance 21.9 13.3 9.1 7.6 6.6
Table I.Results of factor
analysis of adaptivecapability variables
EuropeanJournalof Marketing31,7
454
factors as the input variables. The agglomeration schedule suggested a two-cluster solution. The process was repeated using a different random sample, butagain a two-cluster solution was generated. In the second stage, the full samplewas subject to the SPSSpc+ quick cluster procedure, using the cluster centresfrom the hierarchical clustering as the initial seed points, to generate a two-cluster solution. In the third stage, the robustness of the clusters from the quickcluster procedure was tested in two ways. The significance of the differencesbetween the mean scores of the two clusters for the original 16 adaptabilityvariables was tested using t-tests. All but three of the pairs of means weresignificantly different. The second test of robustness used discriminantanalysis. The sample was randomly split into an analysis sample, which wasused to build the discriminant model, and a hold-out sample, which was used tovalidate the model. The model was built using stepwise variable entry and allthe variables entered in the model. The discriminant function proved to haveconsiderable discriminating power between the two clusters (Wilks’ lambda0.29; chi-square 225.6; significance 0.000; canonical correlation 0.85), while 95per cent of the cases were correctly classified in the hold-out sample.
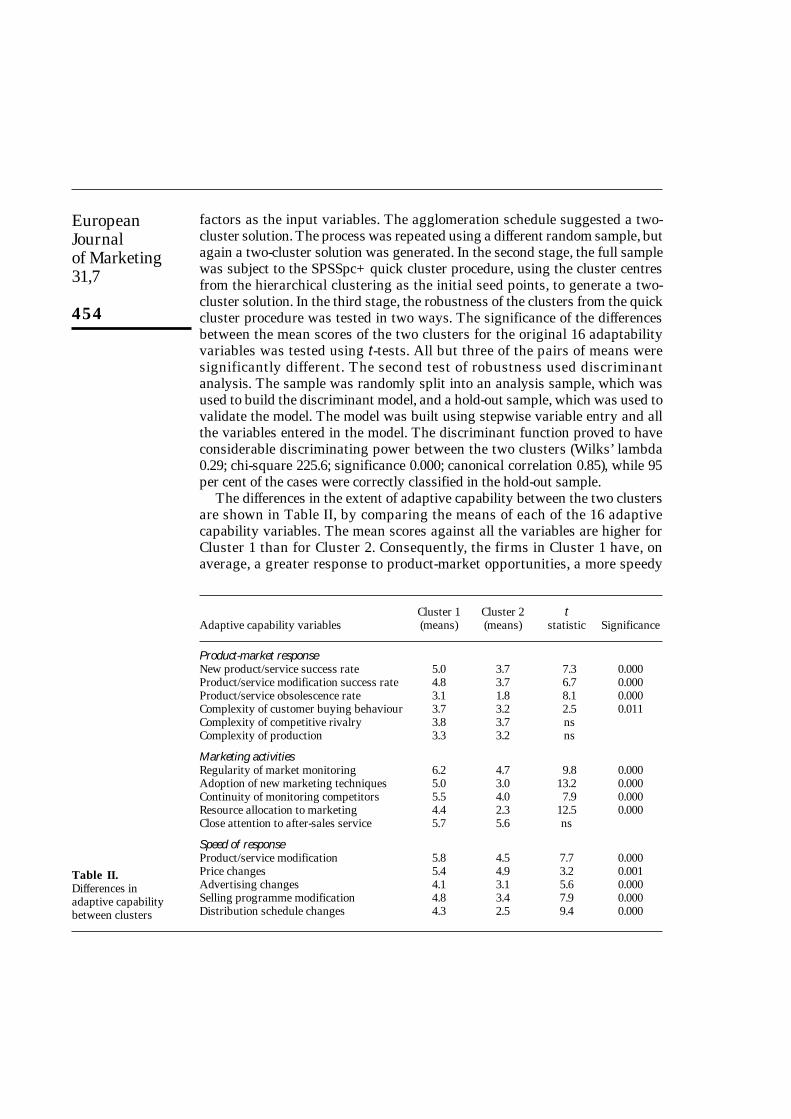
The differences in the extent of adaptive capability between the two clustersare shown in Table II, by comparing the means of each of the 16 adaptivecapability variables. The mean scores against all the variables are higher forCluster 1 than for Cluster 2. Consequently, the firms in Cluster 1 have, onaverage, a greater response to product-market opportunities, a more speedy
Cluster 1 Cluster 2 tAdaptive capability variables (means) (means) statistic Significance
Product-market responseNew product/service success rate 5.0 3.7 7.3 0.000Product/service modification success rate 4.8 3.7 6.7 0.000Product/service obsolescence rate 3.1 1.8 8.1 0.000Complexity of customer buying behaviour 3.7 3.2 2.5 0.011Complexity of competitive rivalry 3.8 3.7 nsComplexity of production 3.3 3.2 ns
Marketing activitiesRegularity of market monitoring 6.2 4.7 9.8 0.000Adoption of new marketing techniques 5.0 3.0 13.2 0.000Continuity of monitoring competitors 5.5 4.0 7.9 0.000Resource allocation to marketing 4.4 2.3 12.5 0.000Close attention to after-sales service 5.7 5.6 ns
Speed of responseProduct/service modification 5.8 4.5 7.7 0.000Price changes 5.4 4.9 3.2 0.001Advertising changes 4.1 3.1 5.6 0.000Selling programme modification 4.8 3.4 7.9 0.000Distribution schedule changes 4.3 2.5 9.4 0.000
Table II.Differences inadaptive capabilitybetween clusters
High and lowadaptive
capability
455
response and more sophisticated marketing activities than the companies inCluster 2. Therefore, Cluster 1 is made up of companies with, on average, asignificantly higher level of adaptive capability than the firms in Cluster 2.
H1a: Performance differencesDifferences in performance between the high and low adaptive capabilityclusters were investigated using univariate and multivariate analysis ofvariance, and discriminant analysis.
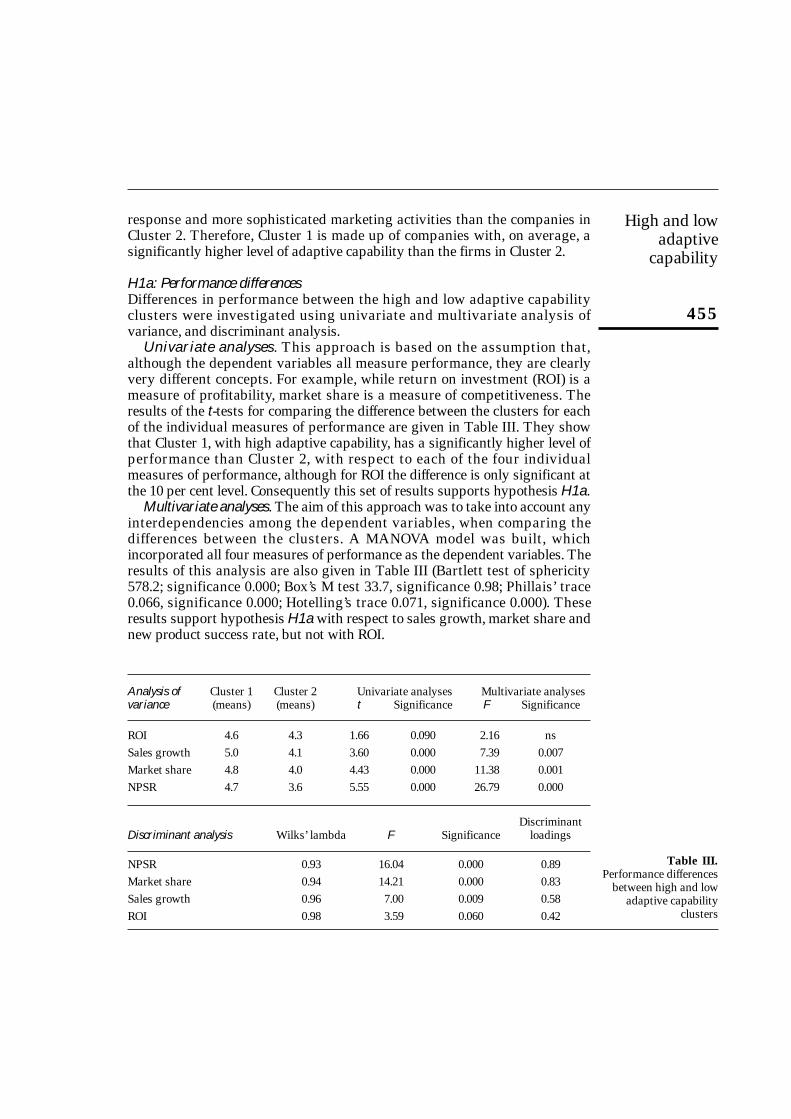
Univariate analyses. This approach is based on the assumption that,although the dependent variables all measure performance, they are clearlyvery different concepts. For example, while return on investment (ROI) is ameasure of profitability, market share is a measure of competitiveness. Theresults of the t-tests for comparing the difference between the clusters for eachof the individual measures of performance are given in Table III. They showthat Cluster 1, with high adaptive capability, has a significantly higher level ofperformance than Cluster 2, with respect to each of the four individualmeasures of performance, although for ROI the difference is only significant atthe 10 per cent level. Consequently this set of results supports hypothesis H1a.
Multivariate analyses. The aim of this approach was to take into account anyinterdependencies among the dependent variables, when comparing thedifferences between the clusters. A MANOVA model was built, whichincorporated all four measures of performance as the dependent variables. Theresults of this analysis are also given in Table III (Bartlett test of sphericity578.2; significance 0.000; Box’s M test 33.7, significance 0.98; Phillais’ trace0.066, significance 0.000; Hotelling’s trace 0.071, significance 0.000). Theseresults support hypothesis H1a with respect to sales growth, market share andnew product success rate, but not with ROI.
Analysis of Cluster 1 Cluster 2 Univariate analyses Multivariate analysesvariance (means) (means) t Significance F Significance
ROI 4.6 4.3 1.66 0.090 2.16 nsSales growth 5.0 4.1 3.60 0.000 7.39 0.007Market share 4.8 4.0 4.43 0.000 11.38 0.001NPSR 4.7 3.6 5.55 0.000 26.79 0.000
DiscriminantDiscriminant analysis Wilks’ lambda F Significance loadings
NPSR 0.93 16.04 0.000 0.89Market share 0.94 14.21 0.000 0.83Sales growth 0.96 7.00 0.009 0.58ROI 0.98 3.59 0.060 0.42
Table III.Performance differences
between high and lowadaptive capability
clusters
EuropeanJournalof Marketing31,7
456
Discriminant analysis. A discriminant analysis model was constructed, with theaim of testing the discriminating power of the performance variables indistinguishing between the two levels of adaptive capability (Hair et al., 1995).The total sample was randomly split into an analysis sample, which was usedto build the model, and a hold-out sample, which was used to validate themodel. As the aim was to test the discriminating power of the four measures ofperformance, all four variables were entered into the model simultaneously. Thetest statistics of the model are: Wilks’ lambda 0.91, and chi-square 19.4(significance 0.000). The validation statistics are: Press’s Q statistic 13.2(p < 0.001), while 63.2 per cent of the holdout sample was correctly classified,which marginally exceeds the 62.5 per cent level stipulated by Hair et al.(1995).The results of the model are also given in Table III. The univariatestatistics are all significant and all the loadings of the discriminant functionexceed the 0.30 level stipulated by Hair et al. (1995) for simultaneous variableentry. Therefore, the conclusion is that the measures of performance dodiscriminate between the two levels of adaptive capability, with the order ofimportance of discrimination being new product success rate, market share,sales growth and ROI. These results also support hypothesis H1a.
H1b: External moderator effects To test for interaction effects from external environmental turbulence onadaptive capability and performance, the univariate and multivariate analysesdescribed above were extended. In both cases market turbulence wasintroduced into the equation as a control variable, after being categorized ashigh, medium and low turbulence. However, in both the univariate andmultivariate analyses significant interaction effects from external turbulencewere not evident. Therefore, there is no support for hypothesis H1b.
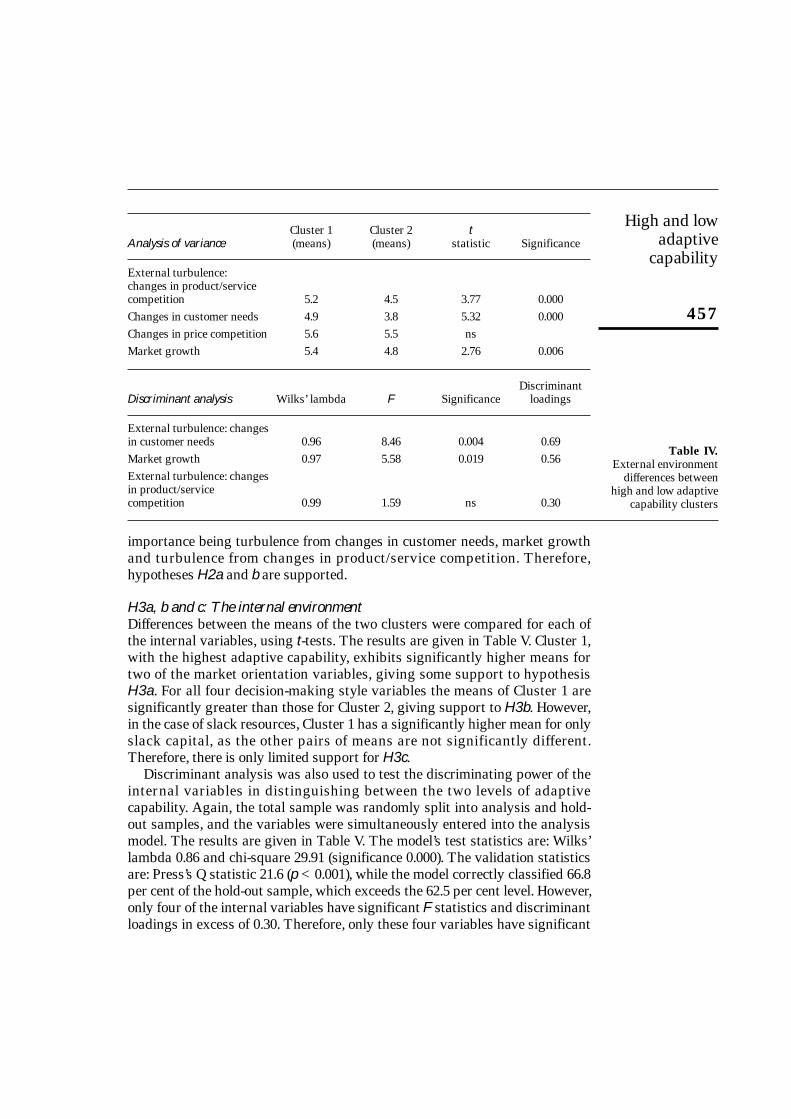
H2a and b: The external environmentDifferences between the mean scores of the two clusters, for the externalvariables, were compared using t-tests. The results are given in Table IV. Cluster1, with the higher adaptive capability, exhibits significantly higher externalturbulence with respect to changes in product/service competition and changesin customer needs. Companies in Cluster 1 have also experienced significantlyhigher market growth than the companies in Cluster 2.
Discriminant analysis was also used to test the discriminating power of thesevariables, in distinguishing between the two levels of adaptive capability.Again, the total sample was split into analysis and hold-out samples, and thevariables were simultaneously entered into the analysis model. The results aregiven in Table IV. The test statistics of the model are: Wilks’ lambda 0.92, andchi-square 16.87 (significance 0.000), while the discriminant loadings all exceed0.30. The validation statistics are: Press’s Q statistic 22.4 (p < 0.001), while themodel correctly classifies 67.2 per cent of the hold-out sample, which exceedsthe 62.5 per cent level stipulated by Hair et al. (1995). The model suggests thatthese external variables discriminate between the clusters, with the order of
High and lowadaptive
capability
457
importance being turbulence from changes in customer needs, market growthand turbulence from changes in product/service competition. Therefore,hypotheses H2a and b are supported.
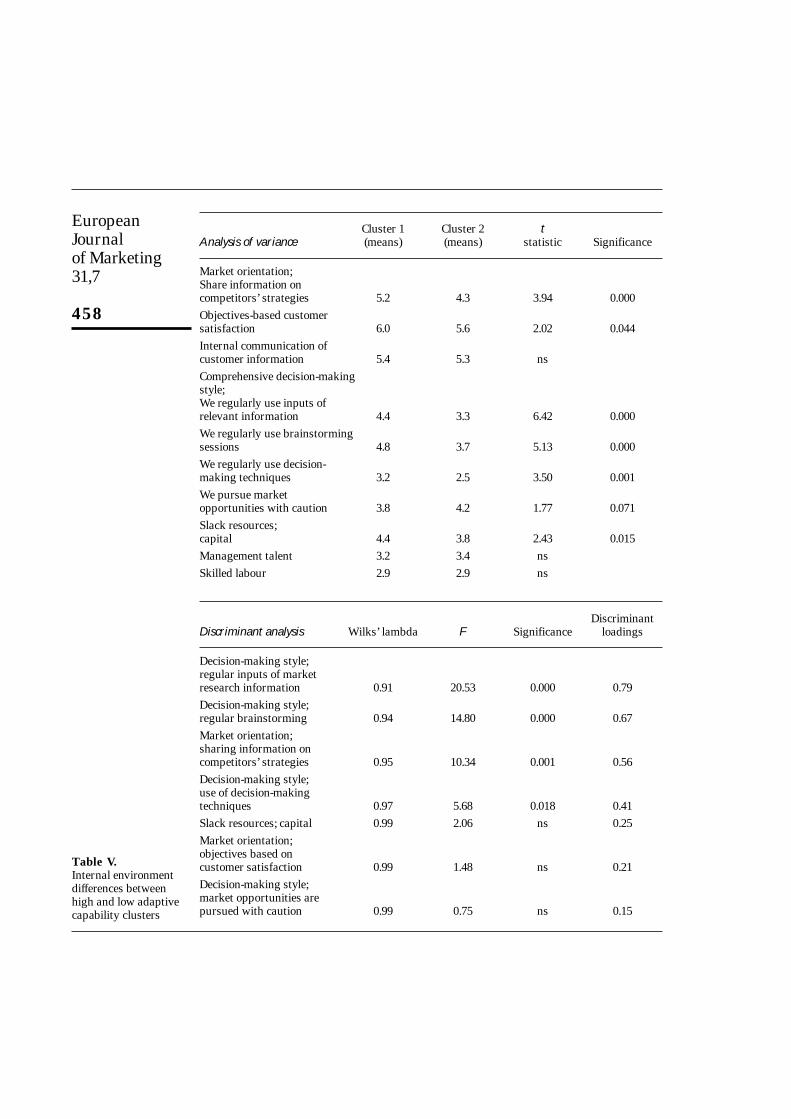
H3a, b and c: The internal environmentDifferences between the means of the two clusters were compared for each ofthe internal variables, using t-tests. The results are given in Table V. Cluster 1,with the highest adaptive capability, exhibits significantly higher means fortwo of the market orientation variables, giving some support to hypothesisH3a. For all four decision-making style variables the means of Cluster 1 aresignificantly greater than those for Cluster 2, giving support to H3b. However,in the case of slack resources, Cluster 1 has a significantly higher mean for onlyslack capital, as the other pairs of means are not significantly different.Therefore, there is only limited support for H3c.
Discriminant analysis was also used to test the discriminating power of theinternal variables in distinguishing between the two levels of adaptivecapability. Again, the total sample was randomly split into analysis and hold-out samples, and the variables were simultaneously entered into the analysismodel. The results are given in Table V. The model’s test statistics are: Wilks’lambda 0.86 and chi-square 29.91 (significance 0.000). The validation statisticsare: Press’s Q statistic 21.6 (p < 0.001), while the model correctly classified 66.8per cent of the hold-out sample, which exceeds the 62.5 per cent level. However,only four of the internal variables have significant F statistics and discriminantloadings in excess of 0.30. Therefore, only these four variables have significant
Cluster 1 Cluster 2 tAnalysis of variance (means) (means) statistic Significance
External turbulence:changes in product/service competition 5.2 4.5 3.77 0.000Changes in customer needs 4.9 3.8 5.32 0.000Changes in price competition 5.6 5.5 nsMarket growth 5.4 4.8 2.76 0.006
DiscriminantDiscriminant analysis Wilks’ lambda F Significance loadings
External turbulence: changesin customer needs 0.96 8.46 0.004 0.69Market growth 0.97 5.58 0.019 0.56External turbulence: changesin product/servicecompetition 0.99 1.59 ns 0.30
Table IV.External environment
differences betweenhigh and low adaptive
capability clusters
EuropeanJournalof Marketing31,7
458
Cluster 1 Cluster 2 tAnalysis of variance (means) (means) statistic Significance
Market orientation;Share information oncompetitors’ strategies 5.2 4.3 3.94 0.000Objectives-based customersatisfaction 6.0 5.6 2.02 0.044Internal communication ofcustomer information 5.4 5.3 nsComprehensive decision-makingstyle;We regularly use inputs ofrelevant information 4.4 3.3 6.42 0.000We regularly use brainstormingsessions 4.8 3.7 5.13 0.000We regularly use decision-making techniques 3.2 2.5 3.50 0.001We pursue marketopportunities with caution 3.8 4.2 1.77 0.071Slack resources;capital 4.4 3.8 2.43 0.015Management talent 3.2 3.4 nsSkilled labour 2.9 2.9 ns
DiscriminantDiscriminant analysis Wilks’ lambda F Significance loadings
Decision-making style;regular inputs of marketresearch information 0.91 20.53 0.000 0.79Decision-making style;regular brainstorming 0.94 14.80 0.000 0.67Market orientation;sharing information oncompetitors’ strategies 0.95 10.34 0.001 0.56Decision-making style;use of decision-makingtechniques 0.97 5.68 0.018 0.41Slack resources; capital 0.99 2.06 ns 0.25Market orientation;objectives based oncustomer satisfaction 0.99 1.48 ns 0.21Decision-making style;market opportunities arepursued with caution 0.99 0.75 ns 0.15
Table V.Internal environmentdifferences betweenhigh and low adaptivecapability clusters
High and lowadaptive
capability
459
discriminating power, with the order of importance being decision-makingstyle; regular inputs of relevant information and decision-making style; regularbrainstorming sessions and market orientation; sharing information oncompetitors’ strategies and decision-making style; use of decision-makingtechniques. These results support H3a and b, but not to H3c.
DiscussionTwo distinct levels of adaptive capability have been identified, which differ withrespect to organizational response to product-market opportunities, marketingactivities and speed of response. These two distinct levels of adaptability areassociated with different levels of performance; they have different externalenvironments and their internal environments feature different responsefactors. These results support and extend the work of Miles and Snow (1978)and Chakravarthy (1982), as they are based on a set of variables for measuringadaptive capability that have not been previously researched.
The two clusters that feature these different levels of adaptive capability alsopossess some characteristics of Miles and Snow’s strategy typology andChakravarthy’s states of adaptation. The high adapters of Cluster 1 are verysimilar to Miles and Snow’s prospectors. Both Cluster 1 companies andprospectors operate in a turbulent environment with high market growth. Theyadapt to this environment by using high levels of market monitoring to identifyproduct-market opportunities, which they swiftly and successfully exploit.Cluster 1 companies also equate to Chakravarthy’s neutral state. Consistentwith the latter, they have high adaptive capability, as they are highly responsiveto change, and they have some slack resources to enable them to respond. Thelower adapters of Cluster 2 are similar to Miles and Snow’s analysers. Bothoperate in a more stable environment, which requires less monitoring and lessexpenditure on marketing activities. They have pursued fewer product-marketopportunities, and therefore have a narrower resultant scope, although theybalance some of this lower adaptability through higher internal efficiency.Companies in Cluster 2 also equate to Chakravarthy’s stable state. In both cases,they lag behind external change and opportunities, to which they have only amoderate response.
The features of the two clusters that represent different levels of adaptivecapability also have implications at the micro level. The companies in Cluster 1also have a greater potential for product/service modification success,consistent with product customization for specific customers. They also featuremore intense marketing activities, which are clearly needed for problem solvingto achieve product customization and individual customer satisfaction. Cluster1 companies similarly feature greater speed of response, which should allow forprompt attention to change in particular customers’ requirements for productmodification, and for change in management processes. However, companieswith high adaptive capability seem to operate in turbulent but growingmarkets, which are likely to place several differing demands on them foradapting to customer-specific change. While their marketing and speed of
EuropeanJournalof Marketing31,7
460
response capabilities clearly provide a basis for addressing change in customerrequirements, they also seem to feature a high level of market orientation foraddressing their markets; comprehensive decision-making style for addressingcustomization; and slack financial capital for achieving adaptability.
Adaptive capability and performanceDespite the arguments in the literature about high adaptive capability leadingto inefficiency (McKee et al., 1989; Zammuto, 1982), the results suggest that thisincreased cost is outweighed by the benefit of higher performance (Bourgeois,1980; Snow and Hrebiniak, 1980). The results support those of Hooley et al.(1992), which are that prospectors do perform better, but are inconsistent withthose of Slater and Narver (1993), where performance differences betweenprospectors, analysers and defenders were not evident. The measure ofperformance that provides the least discrimination is ROI. This suggests thatperhaps cost structures do indeed have some effect in eroding the differentialbetween the levels of adaptability, with respect to some performance benefits.Nevertheless, it seems that higher adaptive capability is still likely to lead tohigher ROI, as a net benefit to be gained. It also seems that these performancebenefits are not moderated by some key variables from the externalenvironment. Consequently, the results do not support those of McKee et al.(1989), who found some evidence of external moderation.
Adaptive capability and the external environmentThe results support the general proposition that firms with high adaptivecapability operate in more turbulent environments, with higher growthmarkets, than firms with lower adaptability. This result is consistent withseveral propositions from the literature: high adapters have the ability to copewith dynamism and complexity (Chakravarthy, 1982), to anticipate changeahead of time (Lant et al., 1992; Walker and Ruekert, 1987), and they can achievefirst-mover advantages to gain market share in growth markets (Hooley et al.1992; Miles and Snow, 1978). Also, higher external turbulence is seeminglyassociated with more comprehensive marketing activities (Davis et al., 1991).However, this result reflects on an important issue of causation. Some theoristsargue that firms need to achieve an appropriate matching of their internalresponse factors with the contingency variables of the external environment(Hansen and Wernerfeldt, 1989; Powell, 1992). However, other theorists arguethat the adaptive capability of companies will influence the features of marketsand environments (Hrebiniak and Joyce, 1985; Weick, 1979; Zeithaml andZeithaml, 1984). This suggests that the marketing activities of high adapters,their speed of implementation and their spread across markets, contribute toexternal turbulence, by influencing customer buying behaviour and marketstructure, and by exacerbating competitive rivalry.
Adaptive capability and the internal environmentThe results suggest that firms with high adaptive capability have differentinternal response functions. They achieve a higher level of market orientation
High and lowadaptive
capability
461
than lower adapters. This is consistent with a requirement to understandmarkets objectively (Kohli et al., 1993), and to co-ordinate attention to customersand competitors internally (Kohli and Jaworski, 1990; Narver and Slater, 1990),to achieve effective adaptive capability. The results also suggest that adaptivecapability is associated with comprehensive decision-making style, whichincludes a high propensity to take risks in decision making. This is consistentwith empirical evidence which illustrated that more comprehensive decision-making style leads to more speedy and effective decisions, when environmentconditions are changing (Bourgeois and Eisenhardt, 1988; Eisenhardt, 1989;Lant et al., 1992). However, the results are not in full accord with the propositionthat adaptability can be adequately measured by the extent of slack resources(Chakravarthy, 1986; Cyert and March, 1963; Miles and Cameron, 1977). Indeed,the companies with high adaptive capability only have significantly higherslack capital. However, as resources are needed to achieve high adaptivecapability, it suggests that high adapters do generate more slack resources thanlow adapters.
The results do not, however, support the problem proposed in the literaturethat adaptive capability may be excessively costly. Although internalinefficiency may be a problem, it seems that the benefit of higher performanceoutweighs higher cost structures. It also suggests that adaptive capability maynot necessarily be resource constrained. Indeed, it is likely that adaptivecapability is a generator of slack resources, as the benefits of adaptabilityseemingly include greater new product/service success, market share and salesgrowth, all of which produce increased revenue, resulting in potential forgenerating capital slack. Consequently, the slack capital of high adapters wouldbe the difference between the resources used to gain adaptive capability, and theresources subsequently generated.
Implications and research directionsAs a consequence of this study, there are a number of issues that haveimplications for managers and for further research. First, despite the costimplications of adaptive capability, an implication for managers is that adaptivecapability seems to generate superior performance. However, managers shouldbe aware that high adaptive capability may not be associated with othermeasures of performance, and indeed investigating other quantitative andqualitative measures of performance is a direction for further research. Second,as this was a cross-sectional study it may be that the impact of adaptivecapability on performance includes lagged effects. The implication formanagers is that such effects should be taken into account when planningadaptive capability, while the investigation of lagged effects between adaptivecapability and performance should be the basis for further research. Third, ashigh adaptive capability seems to feature in turbulent environments, animplication for managers is that the benefit/cost advantage may not be achievedin stable environments. Further research should investigate adaptive capabilityand performance in a wide range of environments, measured with additional
EuropeanJournalof Marketing31,7
462
variables. Fourth, the study did not address the approach that companies takein balancing the costs of increasing adaptive capability with the performancebenefits to be gained. Further research should investigate whether particularlevels of adaptive capability are achieved in a planned or reactive fashion. Theimplication for managers is that developing adaptive capability may involveboth planned and reactive elements. Fifth, companies with high adaptivecapability may also be able to influence part of the external environment.Managers should be cognizant of this potential benefit, but the potential ofthese capabilities for influencing the external environment should be a directionfor further research. Sixth, managers should be aware that as high adapters arecomprehensive with respect to the adaptive capability measures, they may alsobe comprehensive in other organizational issues, which may have acontributing impact on performance. Therefore, further research shouldinvestigate additional organizational variables. Seventh, the usual caveats forcollecting data with a self-completion questionnaire apply, although thisapproach was supported through piloting to achieve content validity andthrough its use in similar studies. Further research could collect data throughpersonal interviews, from executives at different levels with different jobfunctions.
ReferencesAndrews, K. (1971), The Concept of Corporate Strategy, Dow Jones-Irwin, Homewood, IL.Ansoff, I. (1965), Corporate Strategy, McGraw-Hill, New York, NY.Armstrong, S.J. and Overton, T.S. (1977), “Estimating non-response from mailed surveys”, Journal
of Marketing Research, Vol. 18, pp. 263-4.Arndt, J. (1979), “Toward a concept of domesticated markets”, Journal of Marketing, Vol. 43,
pp. 69-75.Bonder, S. (1976), “Versatility: an objective for military planning”, Keynote address presented at
the 37th Operations Research Symposium, Texas.Bourgeois, L.J. (1980), “Strategy and environment: a conceptual integration”, Academy of
Management Review, Vol. 5, pp. 25-39.Bourgeois, L.J. and Eisenhardt, K.M. (1988), “Strategic decision processes in high velocity
environments: four cases in the computer industry”, Management Science, Vol. 34, pp. 816-35.Chakravarthy, B.J.(1982), “Adaptation: a promising metaphor for strategic management”,
Academy of Management Review, Vol. 7, pp. 35-44.Chakravarthy, B.J. (1986), “Measuring strategic performance”, Strategic Management Journal,
Vol. 7, pp. 437-58.Collis, D.J. (1991), “A resource based analysis of global competition: the case of the bearings
industry”, Strategic Management Journal, Vol. 12, pp. 49-68.Conant, J.S., Mokwa, M.P. and Varadarajan, P.R. (1990), “Strategic types, distinctive competencies
and organizational performance: a multiple measures-based study”, Strategic ManagementJournal, Vol. 11, pp. 365-83.
Cronin, J.J. and Page, T.J. (1988), “An examination of the relative impact of growth strategies onprofit performance”, European Journal of Marketing, Vol. 22 No. 1, pp. 57-68.
Cyert, R. and March, J. (1963), A Behavioral Theory of the Firm, Prentice-Hall, Englewood Cliffs,NJ.
David, F.R. (1993), Strategic Management (4th ed.), Merrill, Columbus, OH.
High and lowadaptive
capability
463
Davis, D., Morris, M. and Allen, J. (1991), “Perceived environmental turbulence and its effect onselected entrepreneurship, marketing and organizational characteristics in industrial firms”,Journal of the Academy of Marketing Science, Vol. 19 No. 1, pp. 43-51.
Day, G.S. and Wensley, R. (1988), “Assessing advantage: a framework for diagnosing competitivesuperiority”, Journal of Marketing, Vol. 52, pp. 1-20.
Dess, G.S. and Robinson, R.B. (1984), “Measuring organizational performance in the absence ofobjective measures”, Strategic Management Journal, Vol. 5, pp. 265-73.
Doyle, P., Saunders, J. and Wright, L. (1989), “A comparative study of US and Japanese marketingstrategies in British markets”, International Journal of Research in Marketing, Vol. 5 No. 3, pp. 171-84.
Eisenhardt, K.M. (1989), “Making fast strategic decisions in high velocity environments”,Academy of Management Journal, Vol. 32, pp. 543-76.
Evans, S. (1991), “Strategic flexibility for high technology manoeuvres: a conceptual framework”,Journal of Management Studies, Vol. 28, pp. 69-89.
Fisher, F.M. and McGowan, J.J. (1983), “On the issues of accounting rates of return to infermonopoly profits”, American Economic Review, March, pp. 82-97.
Ford, D. (1982), “The development of buyer-seller relationships in industrial markets”, inHakansson, H. (Ed.), International Marketing and Purchasing of Goods, Wiley, New York, NY.
Frazier, G.L., Spekman, R. and O’Neal, C.R. (1988), “Just-in-time exchange relationships inindustrial markets”, Journal of Marketing, Vol. 52, pp. 52-67.
Galbraith, J. (1973), Designing Complex Organizations, Addison-Wesley, Reading, MA.Golden, B.R. (1992), “SBU strategy and performance: the moderating effects of the corporate-SBU
relationship”, Strategic Management Journal, Vol. 13, pp. 145-58.Grant, R.M. (1991), Contemporary Strategy Analysis, Blackwell, Oxford.Greenley, G.E. (1995), “Market orientation and company performance: empirical evidence from
UK companies”, British Journal of Management, Vol. 6 No. 1, pp. 1-13.Hair, J.F., Anderson, R.E., Tatham, R.L. and Black, W.C. (1995), Multivariate Data Analysis (4th
ed.), Macmillan, New York, NY.Hakansson, H. (1982), International Marketing and Purchasing of Industrial Goods: An
Interaction Approach, Wiley, New York, NY.Hakansson, H. and Ostberg, C. (1975), “Industrial marketing – an organizational problem?”,
Industrial Marketing Management, Vol. 4, pp. 113-23.Haleblian, J. and Finkelstein, S. (1993), “Top management team size, CEO dominance, and firm
performance: the moderating roles of environmental turbulence and discretion”, Academy ofManagement Journal, Vol. 36 No. 4, pp. 844-63.
Hallen, I., Johanson, J. and Mohamed, N. (1991), “Interfirm adaptation in business relationships”,Journal of Marketing, Vol. 55, pp. 29-37.
Hambrick, D.C. (1982), “Environmental scanning and organizational strategy”, StrategicManagement Journal, Vol. 3, pp. 159-75.
Hambrick, D.C. (1983), “High profit strategies in mature capital goods industries: a contingencyapproach”, Academy of Management Journal, Vol. 26, pp. 697-707.
Hansen, G. and Wernerfelt, B. (1989), “Determinants of firm performance: the relative importanceof economic and organizational factors”, Strategic Management Journal, Vol. 10, pp. 399-411.
Hooley, G.J.,Lynch, J.E. and Jobber, D. (1992), “Generic marketing strategies”, InternationalJournal of Research in Marketing, Vol. 9, pp. 75-89.
Hrebiniak, L.G. and Joyce, W.F. (1985), “Organizational adaptation: strategic choice andenvironmental determinism”, Administrative Science Quarterly, Vol. 30, pp. 336-49.
Kohli, A.K. and Jaworski, B.J. (1990), “Market orientation: the research propositions andmanagerial implications”, Journal of Marketing, Vol. 54, pp. 1-18.
EuropeanJournalof Marketing31,7
464
Kohli, A.K., Jaworski, J.B. and Kumar, A. (1993), “MARKOR: a measure of market orientation”,Journal of Marketing Research, Vol. 30, pp. 467-77.
Lant, T.K., Milliken, F. and Batra, B. (1992), “The role of management learning and interpretationin strategic persistence and reorientation: an empirical exploration”, Strategic ManagementJournal, Vol. 13, pp. 585-608.
McArthur, A.W. and Nystrom, P. (1991), “Environment dynamism, complexity and munificence asmoderators of strategy-performance relationships”, Journal of Business Research, Vol. 23, pp. 349-61.
McDaniel, S.W. and Kolari, J.W. (1987), “Marketing strategy implications of the Miles & Snowtypology”, Vol. 4, October, pp. 19-30.
McKee, D.O., Varadarajan, P.R. and Pride, W.M. (1989), “Strategic adaptability and firmperformance: a market-contingent perspective”, Journal of Marketing, Vol. 53, pp. 21-35.
Miles, R.H. and Cameron, K.S. (1977), “Coffin nails and corporate strategies”, Working paper 3,Yale University.
Miles, R. and Snow, C. (1978), Organizational Strategy, Structure and Process, McGraw-Hill, NewYork, NY.
Miller, D. (1990), “Assessing paths to decline with strategic audits”, in Shrivastava, P. and Lamb,R. (Eds), Advances in Strategic Management, pp. 99-115.
Narver, J.C. and Slater, S.F. (1990), “The effect of market orientation on business profitability”,Journal of Marketing, Vol. 54, pp. 20-35.
Pilling, K., Crosby, A.L. and Jackson, D.W. (1994), “Relationship bonds in industrial exchange: anexperimental test of the transaction cost economic framework”, Journal of Business Research,Vol. 30, pp. 237-51.
Powell, T.C. (1992), “Organizational alignment as competitive advantage”, Strategic ManagementJournal, Vol. 13, pp. 119-34.
Saunders, J. (1994), “Cluster analysis”, Journal of Marketing Management, Vol. 10, pp. 13-28.Slater, S.F. and Narver, J.C. (1993), “Product-market strategy and performance: an analysis of the
Miles and Snow strategy types”, European Journal, Vol. 27 No. 10, pp. 33-51.Slater, S.F. and Narver, J.C. (1994), “Does competitive environment moderate the market
orientation-performance relationship?”, Journal of Marketing, Vol. 58, pp. 46-55.Snow, C.C. and Hrebiniak, L.G. (1980), “Strategy, distinctive competence and organizational
performance”, Administrative Science Quarterly, June 1980, pp. 317-36.Speed, R. (1991), “Marketing strategy and performance in UK retail financial services”,
unpublished PhD thesis, Loughborough University Business School, Loughborough.Turnbull, P. and Valla, J. (1986), Strategies for International Industrial Marketing, Croom Helm,
London.Urban, G.L. and Star, S.H. (1991), Advanced Marketing Strategy, Prentice Hall, Englewood-Cliffs,
NJ.Venkatraman, N. and Prescott, J.E. (1990), “Environment strategy coalignment: an empirical
examination of its performance implications”, Strategic Management Journal, Vol. 11, pp. 1-23.Venkatraman, N. and Ramanujam, V. (1986), “Measurement of business performance in strategic
research: a comparison of approaches”, Academy of Management Review, Vol. 11 No. 4, pp. 801-14.
Verhage, B.J. and Waarts, E. (1988), “Marketing planning for improved performance: acomparative analysis”, International Marketing Review, Vol. 5 No. 2, pp. 21-30.
Von Hippel, E. (1978), “A customer-active paradigm with evidence and implications”, Journal ofMarketing, Vol. 42, pp. 39-49.
High and lowadaptive
capability
465
Walker, O.C. and Ruekert, R.W. (1987), “Marketing’s role in the implementation of businessstrategies: a critical review and conceptual framework”, Journal of Marketing, Vol. 51, July, pp. 15-33.
Walker, O.C, Boyd, H.W. and Larreche, J.-C. (1992), Marketing Strategy: Planning andImplementation, Irwin, Homewood, IL.
Webster, F.E. (1992), “The changing role of marketing in the corporation”, Journal of Marketing,Vol. 56, pp. 1-17.
Weick, K.E. (1979), The Social Psychology of Organizing (2nd ed.), Addison-Wesley, Reading, MA.Williamson, O.E. (1975), Markets and Hierarchies: Analysis and Antitrust Implications, Free
Press, New York, NY.Wolfe, J. (1993), “Sepal machine tool company”, in Hendry, J. (Ed.), European Cases in Strategic
Management, Chapman & Hall, London.Zaheer, A. and Venkatraman, N. (1995), “Relational governance as an interorganizational
strategy: an empirical test of the role of trust in economic exchange”, Strategic ManagementJournal, Vol. 16, pp. 373-92.
Zammuto, R.F. (1982), Assessing Organizational Effectiveness, State University of New York Press,Albany, NY.
Zeithaml, C.P. and Zeithaml, V.A. (1984), “Environmental management: revising the marketingperspective”, Journal of Marketing, Vol. 48, pp. 46-53.
Appendix 1. Operationalization of the adaptive capability variablesAs explained in the text, adaptive capability is based on response to product-marketopportunities, marketing activities for responding to these opportunities, and speed of response.
Product-market responseThis activity was measured as product/service opportunities, and the complexity of the marketsin which they are positioned.
Product/service opportunities:• New product/service success rate (measured on a scale where 1 is not successful, through
to 7 very successful (Conant et al., 1990)).• Product/service modification success rate (measured on a scale where 1 is not successful,
through to 7 very successful (Conant et al., 1990)).• Product/service obsolescence rate (measured on a scale where 1 is very slow, through to
7 very quick (Miller, 1990)).
Market Complexity: the following aspects of complexity were measured on a scale where 1 isnot complex, through to 7 very complex:• Customer buying behaviour.• Competitive rivalry.• Production.
Marketing activities: key items from scales developed by McKee et al. (1989) and Anderson andZeithaml (1984) were adopted. The respondents were asked to give the extent of theiragreement with the following statements, using a scale where 1 is disagree, through to 7 fullyagree:• We regularly monitor changes in our markets.• We frequently adopt new marketing techniques.• We continuously monitor competitors’ actions.• We allocate a substantial part of our resources to marketing practices.• We give close attention to after-sales service.
EuropeanJournalof Marketing31,7
466
Speed of response: This activity was measured with respect to key elements of the marketingmix, as they are immediate actions that must be taken to adapt to market change (Day andWensley, 1988; Webster, 1992). The respondents were asked to state how quickly they modifythe following elements, using a scale where 1 is very slowly and is once a year, through to 7 isvery quickly and monthly:
• Product/service modifications.
• Pricing changes.
• Advertising campaigns.
• Selling programmes.
• Distribution schedules.
Appendix 2. Operationalization of the external and internal variablesExternal variables
Turbulence: this was measured as the severity of market conditions over the last three years inrelation to the following, using a scale where 1 is not severe through to 7 very severe (Miller,1990):
• Price competition.
• Product/service competition.
• Changes in customer needs.
Market growth: this was measured as the average annual percentage change of market sizeover the last three years (Narver and Slater, 1990).
Internal variablesMarket orientation: key items were selected from the scale developed by Narver and Slater(1990), as identified in a UK study by Greenley (1995). The respondents were asked to give theextent of their agreement with the following, using a scale where 1 is disagree through to 7fully agree:
• We regularly share information concerning competitors’ strategies.
• Our objectives are primarily driven by customer satisfaction.
• We freely communicate information about our customer experiences across ourcompany.
Comprehensive decision-making style: features of decision-making style from the scaledeveloped by Miller (1990) were operationalized. The respondents were asked to give theextent of their agreement with the following, using a scale where 1 is disagree through to 7fully agree:
• We regularly use inputs of relevant information.
• We regularly use brainstorming techniques.
• We regularly use decision-making techniques.
• We pursue market opportunities with caution.
Slack resources: this was operationalized by addressing the scarcity of three key resources:capital, managerial talent and skilled labour. They were measured on a scale where 1 is notscarce through to 7 very scarce.


![Online Thévenin Equivalent Determination Using Graphical ... · capability chart [8], estimating maximum power transfer limits [10], and developing an adaptive fault location algorithm](https://img.pdfslide.us/doc/110x75/6085ef21a28e1e7f06416b51/online-thvenin-equivalent-determination-using-graphical-capability-chart-8.jpg)