Embed Size (px)
Citation preview

Section IV CONSEQUENCES AND WAYS FORWARDThese chapters outline future projections of rising atmospheric carbon and its associated consequences. They detail how science can inform decision making at the federal, provincial, state, tribal, and local levels across North America, and how those decisions could affect the carbon cycle in the future.
Chapter 17Biogeochemical Effects of Rising Atmospheric Carbon Dioxide
Chapter 18Carbon Cycle Science in Support of Decision Making
Chapter 19Future of the North American Carbon Cycle

690
Lead AuthorsSarah R. Cooley, Ocean Conservancy; David J. P. Moore, University of Arizona
Contributing AuthorsSimone R. Alin, NOAA Pacific Marine Environmental Laboratory; David Butman, University of Washington; David W. Clow, U.S. Geological Survey; Nancy H. F. French, Michigan Technological University; Richard A. Feely, NOAA Pacific Marine Environmental Laboratory; Zackary I. Johnson, Duke University; Gretchen Keppel-Aleks, University of Michigan; Steven E. Lohrenz, University of Massachusetts, Dartmouth; Ilissa B. Ocko, Environmental Defense Fund; Elizabeth H. Shadwick, College of William & Mary; Adrienne J. Sutton, NOAA Pacific Marine Environmental Laboratory; Christopher S. Potter, NASA Ames Research Center; Yuki Takatsuka, Florida State University; Anthony P. Walker, Oak Ridge National Laboratory; Rita M. S. Yu, Univer-sity of Washington
AcknowledgmentsMelanie A. Mayes (Science Lead), Oak Ridge National Laboratory; Adam J. Terando (Review Editor), U.S. Geological Survey; Erica H. Ombres (Federal Liaison), NOAA Ocean Acidification Program; Kathy Tedesco (Federal Liaison), NOAA Ocean Observing and Monitoring Division and University Corporation for Atmo-spheric Research
Recommended Citation for ChapterCooley, S. R., D. J. P. Moore, S. R. Alin, D. Butman, D. W. Clow, N. H. F. French, R. A. Feely, Z. I. Johnson, G. Keppe l -Aleks, S. E. Lohrenz, I. B. Ocko, E. H. Shadwick, A. J. Sutton, C. S. Potter, Y. Takatsuka, A. P. Walker, and R. M. S. Yu, 2018: Chapter 17: Biogeochemical effects of rising atmospheric carbon dioxide. In Second State of the Carbon Cycle Report (SOCCR2): A Sustained Assessment Report [Cavallaro, N., G. Shrestha, R. Birdsey, M. A. Mayes, R. G. Najjar, S. C. Reed, P. Romero-Lankao, and Z. Zhu (eds.)]. U.S. Global Change Research Program, Washington, DC, USA, pp. 690-727, https://doi.org/10.7930/SOCCR2.2018.Ch17.
17 Biogeochemical Effects of Rising Atmospheric Carbon Dioxide

Chapter 17 | Biogeochemical Effects of Rising Atmospheric Carbon Dioxide
691Second State of the Carbon Cycle Report (SOCCR2)November 2018
KEY FINDINGS1. Rising carbon dioxide (CO2) has decreased seawater pH at long-term observing stations around the
world, including in the open ocean north of Oahu, Hawai‘i; near Alaska’s Aleutian Islands; on the Gulf of Maine shore; and on Gray’s Reef in the southeastern United States. This ocean acidification process has already affected some marine species and altered fundamental ecosystem processes, and further effects are likely (high confidence, likely).
2. While atmospheric CO2 rises at approximately the same rate all over the globe, its non-climate effects on land vary depending on climate and dominant species. In terrestrial ecosystems, rising atmospheric CO2 concentrations are expected to increase plant photosynthesis, growth, and water-use efficiency, though these effects are reduced when nutrients, drought, or other factors limit plant growth (very high confidence, very likely). Rising CO2 would likely change carbon storage and influence terrestrial hydrology and biogeochemical cycling, but concomitant effects on vegetation composition and nutrient feedbacks are challenging to predict, making decadal forecasts uncertain.
3. Consequences of rising atmospheric CO2 are expected to include difficult-to-predict changes in the ecosystem services that terrestrial and oceanic systems provide to humans. For instance, ocean acidi-fication resulting from rising CO2 has decreased the supply of larvae that sustains commercial shellfish production in the northwestern United States. In addition, CO2 fertilization (increases) plus warming (decreases) are changing terrestrial crop yields (high confidence, likely).
4. Continued persistence of uptake of carbon by the land and ocean is uncertain. Climate and environmen-tal changes create complex feedbacks to the carbon cycle; how these feedbacks modulate future effects of rising CO2 on carbon sinks is unclear. There are several mechanisms that would reduce the ability of land and ocean sinks to continue taking up a large proportion of rising CO2 (very high confidence).
Note: Confidence levels are provided as appropriate for quantitative, but not qualitative, Key Findings and statements.
17.1 IntroductionThe most central planetary outcome of rising atmo-spheric carbon dioxide (CO2), methane (CH4), and black carbon is their warming effect on Earth’s atmo-sphere, which influences weather and climate (IPCC 2013). The Climate Science Special Report (CSSR; USGCRP 2017) concludes with high confidence that Earth’s observed temperature increase in the last century results from human influence, especially from emissions of greenhouse gases including CO2 and CH4 and particulates such as black carbon. Furthermore, CSSR (USGCRP 2017) demonstrates that the consequences of atmospheric warming are profound and diverse, significantly altering plane-tary surface temperatures and overall climate and thus also directly or indirectly altering countless oceanic and terrestrial processes.
Increased global temperatures lead to extremes in temperature and precipitation (IPCC 2013), causing
heatwaves, droughts, floods, and changing storm system patterns (Melillo et al., 2014), with additional consequences for the carbon cycle. For instance, warming and changing weather melt polar ice cover and thaw Arctic permafrost, releasing CH4 and CO2 as stored organic matter is microbially respired (see Ch. 11: Arctic and Boreal Carbon, p. 428). Melting glaciers and seawater expansion will raise sea levels, changing ecosystem boundaries and affecting net carbon fluxes (IPCC 2013; USGCRP 2017). Heat-ing and ice melt will stratify the ocean, dampening the ability of vertical mixing to refresh surface waters with nutrients that support primary production (IPCC 2013). A warmer ocean will hold less car-bon, because warmer ocean temperatures decrease the solubility of CO2 in seawater (Zeebe and Wolf-Gladrow 2001). Both long-term increases in ocean temperature and short-term marine heatwaves may affect stocks of organic and inorganic carbon

Section IV | Consequences and Ways Forward
692 U.S. Global Change Research Program November 2018
contained in marine ecosystems and sediments (see Ch. 16: Coastal Ocean and Continental Shelves, p. 649). Changing snowpack dynamics will affect water availability significantly in riverine ecosystems. In midlatitudes, fire frequency and severity will change as a result of changes in temperature and pre-cipitation. These shifts and feedbacks are very likely to have widespread, interacting effects on human and natural systems that elicit a variety of responses.
Upon this backdrop of accumulating, thermally driven planetary climate change that impacts the carbon cycle, rising atmospheric CO2 is also affect-ing oceanic and terrestrial systems in nonthermal ways that have only begun to be understood since the First State of the Carbon Cycle Report (SOCCR1; CCSP 2007). The observed rise in atmospheric CO2 since the 1950s is lower than the contribu-tions from estimated emissions because both the ocean and land continue to take up a portion of the atmospheric CO2 from anthropogenic (i.e., human) activities, indicating both systems are carbon sinks (Ballantyne et al., 2012). Ocean uptake prevents some degree of atmospheric warming but results in ocean acidification (see Ch. 16: Coastal Ocean and Continental Shelves), which drives a host of chem-ical and biological impacts, as reviewed below. The terrestrial “CO2 fertilization effect” is the increased uptake of CO2 per unit land area caused by rising CO2, which is greater than could be expected from plant regrowth after land-use change and stimu-lation by increased nutrient availability. Global analysis suggests that CO2 fertilization is responsi-ble for up to 60% of the overall land sink (Schimel et al., 2015), but persistence of these benefits into the future is highly uncertain (Müller et al., 2014; Smith et al., 2016). Moreover, the thermal impacts of climate change will interact with, enhance, or in some cases overwhelm the nonthermal effects of rising atmospheric CO2 on ecosystems; these different future scenarios are explored elsewhere in this report (see Ch. 19: Future of the North Amer-ican Carbon Cycle, p. 760). These findings have important implications; the current partitioning of anthropogenic CO2 sinks among the ocean, atmo-sphere, and terrestrial biosphere, therefore, also will
change in the future. Because CO2 is involved in all aspects of growth in biological systems there also are important non-climate effects of increased atmo-spheric CO2 concentration.
To better explain the non-climate effects of rising CO2 on ecological systems, this chapter first reviews the historical context of rising CO2 and then exa mines its impact on ocean and terrestrial systems (see Figure 17.1, p. 693), including ocean acidification, produc-tivity and ecosystem changes, interactions with other environmental changes, and carbon cycle feedbacks. Also examined are changes in ecosystem services (or benefits to humans) resulting from chemical changes in Earth system processes and how those intersect with thermally driven changes. This examination is followed by a review of outstanding research needs for gaining greater clarity on the effects of rising CO2 on oceanic and terrestrial systems.
Such a comprehensive, collected examination of the effects of carbon cycle changes is new in the Second State of the Carbon Cycle Report (SOCCR2) and responds to the requirement in the Global Change Research Act that “analyzes the effect of global change on the natural environment, agriculture, energy production and use, land and water resources, transportation, human health and welfare, human social systems, and biological diversity” (Global Change Research Act 1990, Section 106). Since publication of SOCCR1 (CCSP 2007), many highly influential reports have assessed the consequences of carbon cycle changes on Earth systems, including the Third National Climate Assessment (Melillo et al., 2014), the Intergovernmental Panel on Climate Change Fifth Assessment Report (IPCC AR5; IPCC 2013), and the CSSR (USGCRP 2017). This chapter updates the conclusions of the reports cited above, with the most recent literature and with particular attention to North America. Those reports treat the direct and indirect effects of increasing CO2 in greater detail than does this chapter, which focuses to a greater extent on the direct and non-climatic effects of increased atmospheric CO2 concentrations.

Chapter 17 | Biogeochemical Effects of Rising Atmospheric Carbon Dioxide
693Second State of the Carbon Cycle Report (SOCCR2)November 2018
Figure 17.1. Study Sites Examining Terrestrial Ecosystem Responses to Elevated Carbon Dioxide (CO2). Proj-ects include 1) Soybean Free Air Concentration Enrichment (SoyFACE); 2) Biodiversity, CO2, and Nitrogen (BioCON); 3) Prairie Heating and CO2 Enrichment (PHACE); 4) Duke Forest Free-Air CO2 Enrichment (FACE) Experiment; 5) Jasper Ridge Global Change Experiment; 6) Maricopa, Ariz., FACE experiments; 7) Nevada Desert FACE Facility (NDFF); 8) Oak Ridge National Laboratory (ORNL) FACE; 9) Aspen FACE Experiment; and 10) Sky Oaks Long-term Carbon Flux Measurements. [Figure source: Christopher DeRolph, Oak Ridge National Laboratory.]
17.2 Atmospheric CO2 in Prior Geological AgesOver geological time (i.e., the last 500 million years), atmospheric CO2 levels have at times been well in excess of current CO2 concentrations (see Figure 17.2, p. 694). However, human civilization developed during the last 10,000 years, a time when atmospheric CO2 was never higher than it is today (Augustin et al., 2004). Once humans began exten-sively altering the landscape and burning fossil fuels,
atmospheric CO2 and CH4 began to rise rapidly and drive changes in atmospheric, terrestrial, and oceanic systems and processes (Olofsson and Hickler 2007).
Changes in atmospheric CO2 changed Earth’s climate and ocean pH and altered the course of plant evolution. Atmospheric CO2 was likely higher than 5,000 parts per million (ppm) at times during the last 540 million years (Phanerozoic Eon) and declined to current levels during the last 25 million years (Doney and Schimel 2007; Royer 2006; see

Section IV | Consequences and Ways Forward
694 U.S. Global Change Research Program November 2018
Figure 17.2, this page). During this eon, periods of frequent glaciation events in Earth’s history are asso-ciated with CO2 concentrations below 1,000 ppm (Royer 2006). A strong decline of atmospheric CO2 during the Carboniferous Period (359 million years ago) is associated with the proliferation of land plants. Extensive burial of plants from this period resulted in the massive deposits of fossil fuels now being mined. Declining atmospheric CO2 concentra-tions at the Eocene-Oligocene boundary (34 million years ago) induced dynamic ice sheet formation over Antarctica and ultimately led to substantial cooling of global climate over the subsequent 10 million years (DeConto and Pollard 2003). During the Qua-ternary Period (last 1 million years), ice core records
show that temperature increases of ~3°C were asso-ciated with CO2 increases of ~100 ppm (Petit et al., 1999). Recent analyses show that during the last deglaciation (from ~21,500 to ~11,500 years ago), observed increases in global temperature lagged behind observed increases in atmospheric CO2 (Shakun et al., 2012). The glacial-interglacial cycle in Earth’s climate during the Quaternary period is caused by a combination of changes in Earth’s orbit, atmospheric greenhouse gases, and ocean circula-tion (Rohling et al., 2018).
The evolution of different ways of performing photosynthesis has a strong influence on the non-climate consequences of rising CO2 on land. Fundamental to plant life on Earth, atmospheric CO2 concentrations and their dynamics over geo-logical time have played an important role in the evolution of photosynthesis and the distribution of different vegetation types (Beerling et al., 2001; Monson and Collatz 2011). RUBISCO ( ribulose-1, 5-bisphosphate carboxylase-oxygenase), the enzyme that catalyzes the transfer of atmospheric CO2 into plant sugars and biomass, evolved in early algae during a time of high CO2 at least 2.8 billion years ago (Doney and Schimel 2007), though perhaps much earlier (Allwood et al., 2006; Raven et al., 2012). Plants evolved different photosyn-thetic mechanisms and anatomies in response to the relatively low CO2 concentrations that persisted from about 300 million years ago, an environment which enabled C4 grasses (e.g., ancestors of maize, sugarcane, and sorghum) and the cactus family to dominate arid portions of the Earth because of their greater water-use efficiency and drought tolerance (Berner 1997; Osborne and Sack 2012; Pagani et al., 2005).
Prior geological eras also provide information about potential impacts of high atmospheric CO2 on ocean chemistry (Hönisch et al., 2012). Atmo-spheric CO2 dissolves in seawater and creates carbonic acid, which lowers pH and decreases the concentration of carbonate ions present in solu-tion. The closest analogs to present conditions may be the Paleocene-Eocene Thermal Maximum
Figure 17.2. Geological Context of Carbon Dioxide (CO2). (a) Paleoreconstruction of atmospheric CO2 in parts per million (ppm) versus time over the past 400 million years. The Geologic Carbon Cycle (GEOCARB) Model simulation is depicted by the black line; also shown (as dots) are publicly archived proxy data for paleosol carbon isotopes (red), phytoplankton carbon isotopes (green), stomatal indices (blue), marine boron isotopes (black), and liverwort carbon isotopes (cyan). (b) Ocean surface pH, shown in red, has increased over the last 50 million years as atmospheric CO2 declined. [Data sources: Panel (a) from Royer 2006. Data are publicly available at www.ncdc.noaa.gov/data-access/paleoclimatology-data/datasets/climate-forcing. Panel (b) proxy data from Hönisch et al., 2012.]
(a)
(b)

Chapter 17 | Biogeochemical Effects of Rising Atmospheric Carbon Dioxide
695Second State of the Carbon Cycle Report (SOCCR2)November 2018
(56 million years ago), Triassic-Jurassic mass extinc-tion (~200 million years ago), and Permo-Triassic mass extinction (252.3 million years ago; Hönisch et al., 2012). All these events are associated with evi-dence of detrimental impacts on calcifying organ-isms including, in some instances, their extinction. However, definitively attributing negative effects on calcifiers to acidification is not possible because of other factors (e.g., ocean circulation, warming, oxygenation, and asteroid impacts) that may have co-occurred or contributed to the decline or demise of these organisms. Moreover, geochemical proxies indicating pH or ocean carbonate chemistry condi-tions, particularly for times before the Cretaceous Period (>65 million years ago), are limited and have large uncertainties.
Since the start of the Industrial Revolution, anthro-pogenic emissions have resulted in increased atmo-spheric CO2 concentrations detectable by changes in the ratio of 13C and 12C isotopes in the biosphere (Keeling 1979; Suess 1955). Fossil fuels have less of the 13C isotope because they are composed of dead plants and animals, and burning them changes the isotope ratio in the atmosphere. Isotopic studies indicate some of the carbon released from fossil sources becomes incorporated into all organisms, including those as diverse as trees (Suess 1955), marine fish (Fraile et al., 2016), and penguins (Hilton et al., 2006). The decrease in ocean pH since the start of the Industrial Revolution matches or exceeds the pH levels observed for the Quater-nary glacial-interglacial period (Pelejero et al., 2010; Turley et al., 2006). Moreover, projected changes in ocean pH by 2100 well exceed those that occurred during the preindustrial period (Bijma et al., 2013; Turley et al., 2006). Recent global changes in upper ocean chemistry likely are occurring more rapidly than at any time over the past 300 million years (Doney et al., 2014; Hönisch et al., 2012). The rates and magnitude of change may soon move the ocean ecosystem into “uncharted territory,” with conditions unlike any that contemporary marine life have faced during their recent evolutionary history (Gattuso et al., 2015; Turley et al., 2006).
17.3 Aquatic Consequences of Rising CO217.3.1 Ocean AcidificationIncreased uptake of CO2 by the ocean from the beginning of the Industrial Revolution has led to decreased seawater pH and a lower calcium carbon-ate (CaCO3) mineral saturation state (see Ch. 16: Coastal Ocean and Continental Shelves, Section 16.4.2, p. 670). Average pH values for open-ocean surface water have decreased by approximately 0.11 units from a preindustrial mean value of 8.17, equivalent to an increase of about 28% in hydrogen ion concentration (Feely et al., 2004, 2009; Gattuso et al., 2015; Orr et al., 2005). As a result of ocean acidification, the oceanic average concentration of carbonate ion (CO3
2–) has declined about 16% from preindustrial values (Bopp et al., 2013; Doney et al., 2009; Gattuso et al., 2015). These changes in car-bonate chemistry caused by rising atmospheric CO2 have a variety of effects on aquatic life (e.g., Orr et al., 2005 and Kroeker et al., 2013), which is now an area of active research. Thirty-year ocean time-series datasets (e.g., Bates et al., 2014; Dore et al., 2009) provide direct evidence of this phenomenon world-wide (see Figure 17.3, p. 696). By the end of this century, surface ocean pH is expected to decline by another 0.1 to 0.4 units, and CO3
2– concentration is expected to decline by as much as 50% compared to preindustrial conditions (see Figure 17.4, p. 697).
Significant changes in ocean acidity are readily apparent in the subtropical open ocean (see Figure 17.3, p. 696) and in several coastal locations (Sutton et al., 2016). High-quality, long-term datasets in extremely nearshore locations are limited, but ocean acidification has been documented year-round at time-series observatories near Alaska’s Aleutian Islands and Oahu, Hawai‘i (both open-ocean sites), and the Gulf of Maine and Gray’s Reef off Georgia (both coastal ocean sites; Sutton et al., 2016). Conditions are more variable at coastal and nearshore time-series sites in the California Cur-rent and off Washington state (see Ch. 16: Coastal Ocean and Continental Shelves, Section 16.4.2), but they still confirm the presence of significantly

Section IV | Consequences and Ways Forward
696 U.S. Global Change Research Program November 2018
Figure 17.3. Evidence for Ocean Acidification from Ocean Time-Series Stations. (a) Mauna Loa, Hawai‘i; atmo-spheric carbon dioxide (CO2) in parts per million by volume (ppmv) versus time. (b) Surface ocean partial pressure of CO2 (pCO2) in microatmospheres (µatm) versus time for three ocean time-series monitoring stations: Bermuda Atlantic Time-series Study (BATS), A Long-Term Oligotrophic Habitat Assessment (ALOHA), and European Station for Time series in the Ocean at the Canary Islands (ESTOC). (c) Surface ocean pH versus time for BATS, ALOHA, and ESTOC. (d) Carbonate ion (CO32–) versus time for BATS, ALOHA, and ESTOC. (e) Map of BATS, ALOHA, and ESTOC monitoring station locations. [Figure sources: Panel (a) from Scripps Institution of Oceanography, NOAA Earth System Research Laboratory. Panels (b–d) adapted from Fig. 3.18 (updated with new time-series data) from Rhein et al., 2013; Copyright IPCC, used with permission. Panel (e) from Christopher DeRolph, Oak Ridge National Laboratory.]
(a)
(e)
(b)
(c) (d)

Chapter 17 | Biogeochemical Effects of Rising Atmospheric Carbon Dioxide
697Second State of the Carbon Cycle Report (SOCCR2)November 2018
acidified conditions during some portions of every year (Sutton et al., 2016). The pH values in coastal waters are much more variable than those in the open ocean (Friedrich et al., 2012; Hofmann et al., 2010; Johnson et al., 2013; Sutton et al., 2016) because of natural processes such as upwelling, biological consumption and release of CO2, tem-perature- and salinity-driven solubility changes in CO2, or local human inputs of acid-producing sub-stances (see Ch. 16: Coastal Ocean and Continental Shelves, Section 16.4.2, p. 670). Variable coastal pro-cesses make long-term pH trends somewhat harder
to discern (Sutton et al., 2016), but these processes can enhance acidification (Doney 2010; Feely et al., 2008; Kelly et al., 2011) far beyond global average projections. The projected long-term average global increase in acidity (decreasing pH values) in the next 20 to 40 years due to atmospheric CO2 (see Figure 17.4, this page) is much greater than the natural variability of pH values observed since moni-toring began, underscoring the idea that marine life will face unfamiliar seawater chemistry conditions in the near future.
Figure 17.4. Regional Differences in Acidification Projections. Changes in (a) surface ocean pH and (b) surface carbonate ion (CO32-) concentration (in micromoles per kg) through time for three ocean locations for the Intergovern-mental Panel on Climate Change (IPCC) Representative Concentration Pathway (RCP)8.5 and 2.6 scenarios based on the Coupled Model Intercomparison Project Phase 5 (CMIP5) analysis. See Ch. 19: Future of the North American Carbon Cycle, p. 760, for RCP explanations. [Figure source: Adapted from Figs. 6.28(a) and 6.29(a) from Ciais et al., 2013; Copyright IPCC, used with permission.]
(a)
(b)

Section IV | Consequences and Ways Forward
698 U.S. Global Change Research Program November 2018
Many coastal margins also suffer from excess anthropogenic nitrogen and phosphorus inputs, which cause algal overgrowth (eutrophication) and, in some cases, increased microbial digestion (remin-eralization) of organic matter in bottom waters (see Ch. 16: Coastal Ocean and Continental Shelves, p. 649). These processes further increase CO2 in water, reduce oxygen (i.e., deoxygenation) and pH, and decrease CaCO3 mineral saturation (Cai et al., 2011; Diaz and Rosenberg 2008; Feely et al., 2016; Rabalais et al., 2002). Multiple stresses to coastal zones (e.g., warming, ocean acidification, and deoxy-genation) can cause compounding harm to marine ecosystem health (Bijma et al., 2013; Wallace et al., 2014), complicating detection of individual organ-ism impacts and ecosystem trends from acidification (Duarte et al., 2013; Harvey et al., 2013). Future research about how to manage aquatic ecosys-tems under global change needs to account for the complexity of climate and non-climate drivers and responses in both coastal and ocean environments (Blackford 2010; Riebesell and Gattuso 2015).
17.3.2 Acidification of FreshwaterInland freshwater can dissolve excess atmospheric CO2 just as seawater does. However, the dearth of long-term, high-precision, high-accuracy carbonate chemistry datasets for even major freshwater bodies like the Laurentian Great Lakes precludes attributing a discernible acidification trend in freshwater bodies to atmospheric CO2 (Phillips et al., 2015). As in coastal waters, local processes also can significantly alter freshwater pH, complicating detection and attribution of changes driven by atmospheric CO2 in lakes and rivers. The effects of acidification-driven changes due to increasing atmospheric CO2 on lake ecosystems have not been determined (Hasler et al., 2015), but species-level studies suggest that, just as in ocean environments, impacts to freshwater organ-isms could be widespread and yet difficult to forecast (Weiss et al., 2018).
17.3.3 Changes in Ocean Biology and Ocean Biological ProcessesInvestigations of ocean acidification’s effect on marine life show evidence of a wide range of
sensitivities within and across diverse groups of organisms. Calcifying phytoplankton like cocco-lithophorids as well as multicellular organisms like scleractinian corals, pteropods, foraminifera, bivalves, crustaceans, and gastropods generally show negative but complex responses to ocean acidifica-tion, including altered biological processes such as growth, photosynthesis, calcification, and reproduc-tive success (Bednaršek et al., 2016; Hofmann et al., 2010; Kroeker et al., 2013; Riebesell and Tortell 2011; Meyer and Riebesell 2015). Several finfish and shark species display altered risk-taking and hunting behaviors (Hamilton et al., 2014; Munday et al., 2014; Dixson et al., 2014), responses which have been related to changes in olfaction and neurotrans-mitter levels that result from ocean acidification (Munday et al., 2009; Dixson et al., 2010). Devel-opmental changes in some harvested species such as summer flounder and tuna have also been noted (Chambers et al., 2014; Frommel et al., 2016). Con-versely, photosynthesis of phytoplankton (algae), seagrasses, and kelp generally increases (Fu et al., 2007; Hutchins et al., 2013; Riebesell et al., 2007; Mackey et al., 2015), although net responses are highly species-specific and limited by several cellular processes, including species’ carbon capture mech-anisms (Mackey et al., 2015). Species responsible for harmful algal blooms are stimulated by changing ocean temperatures, carbonate chemistry, and nutri-ent ratios, displaying higher growth rates and greater toxin production (Fu et al., 2012). Theory suggests that acidification also may affect bioavailability of nutrients and trace minerals and stoichiometry of biogeochemical processes (Millero et al., 2009), but experimental results are mixed (Breitbarth et al., 2010; Shi et al., 2010). Co-occurrence of elevated temperatures, excessive nutrient inputs, changes in light availability, and increased hypoxia are likely to exacerbate and complicate the effects of ocean acid-ification on marine organisms or ecosystems (Bijma et al., 2013; Kroeker et al., 2013).
Ocean acidification impacts at the ecosystem level are difficult to predict because of the complexity of species- and population-level responses, but that research is beginning. Population-scale projections

Chapter 17 | Biogeochemical Effects of Rising Atmospheric Carbon Dioxide
699Second State of the Carbon Cycle Report (SOCCR2)November 2018
of ocean acidification’s effects have been devel-oped for a few high-value, intensively managed single-species fisheries, including Tanner crab (Punt et al., 2016) and sea scallop (Cooley et al., 2015). More broadly, physiological and behavioral changes could alter predator-prey relationships and other species interactions, driving changes in species abundance and composition of ecological communities. Ocean acidification contributes to net loss of corals, and this loss destroys reef habi-tats and displaces associated marine communities (Hoegh-Guldberg et al., 2007). Ecosystem-scale projections incorporating ocean acidification and other environmental changes are only now being developed for select locations (e.g., California Current, Puget Sound, and northeastern United States; Busch et al., 2013; Fay et al., 2017; Kaplan et al., 2010). Much of the complexity in observed responses lies in 1) different timescales of response relative to the change in ocean acidification, 2) organisms’ abilities to acclimate or genetically adapt, and 3) linkages between ocean acidifica-tion and other environmental stressors. Observa-tional (Pespeni et al., 2013; Wootton et al., 2008), integrative (Boyd et al., 2014), and modeling (e.g., Dutkiewicz et al., 2015) studies emphasize the complexity of observed and predicted changes and suggest that future community and functional responses are likely to be more profound than the changes already observed.
17.3.4 Limits in Ocean CO2 Uptake CapacityAcidification varies with latitude because CO2 solubil-ity depends on temperature, with lower-temperature waters capable of holding more CO2 and thus becom-ing more readily acidified. Models show that the suite of ocean changes (e.g., circulation, biological productivity, and ventilation) associated with atmo-spheric CO2 absorption and the thermal effects of CO2 and other greenhouse gases on the ocean are likely to decrease the ocean’s future ability to take up atmospheric CO2 (see Ch. 19: Future of the North American Carbon Cycle, Section 19.6, p. 779). In the near future, polar ecosystems may change enough to
become undersaturated with respect to CaCO3 min-erals (Feely et al., 2009; Orr et al., 2005; Steinacher et al., 2010), owing to the large amount of CO2 already dissolved in high-latitude ocean areas. When waters are undersaturated, CaCO3 minerals will not precipitate. Even though low-latitude ocean areas will not become undersaturated with CaCO3 minerals in the future, pH conditions will exceed or have already exceeded the bounds of observed natural variability (see Figure 17.4, p. 697; Sutton et al., 2016), exposing low-latitude organisms such as warm-swater coral reefs to chemical conditions suboptimal for growth and calcification (Fabricius et al., 2011).
17.4 Terrestrial Consequences of Rising CO2The CO2 fertilization effect is defined in SOCCR1 as the “phenomenon in which plant growth increases (and agricultural crop yields increase) due to the increased rates of photosynthesis of plant species in response to elevated concentrations of CO2 in the atmosphere.” SOCCR1 concluded that the CO2 fertilization effect was widespread, but whether enhanced photosynthesis would translate into a per-sistent land carbon sink was unclear (CCSP 2007). The global land carbon sink, calculated as the differ-ence between human emissions and carbon accu-mulating in the atmosphere and ocean, has grown from 0.2 ± 0.5 petagrams of carbon (Pg C) per year in the 1960s to 3.0 ± 0.7 Pg C per year in 2014 (Le Quéré et al., 2015). This change consists of the effects of land-use change and the residual land sink (Le Quéré et al., 2016). The residual carbon sink is carbon that is stored on land but is calculated as the remainder of other observed carbon sinks rather than observed itself. Growth in the residual sink is attributed to global changes in CO2, nitrogen deposi-tion, and climate in both observational studies and modeling efforts (Ballantyne et al., 2012; Le Quéré et al., 2016; Schimel et al., 2015). However, predict-ing how the land carbon sink will respond to chang-ing atmospheric CO2 is challenging because the land sink is inferred by accounting rather than experimen-tal testing. The research community has evaluated the CO2 fertilization effect through experimental

Section IV | Consequences and Ways Forward
700 U.S. Global Change Research Program November 2018
Box 17.1 Short-Term Physiological Effects of CO2 on PlantsStudies lasting from weeks up to more than a decade show that the response of vegetation to rising car-bon dioxide (CO2) is influenced by climate and environmental changes, which create complex feedbacks to the carbon cycle. Carbon gains from CO2 fertilization lead to faster cycling or more carbon storage. The balance of the effects of climate and CO2 fertilization on terrestrial carbon storage is uncertain.
Physiological Adjustment to Rising CO2
Increased Photosynthesis per Leaf Area • More efficient plants lead to increased bio-
mass or increased rate of biomass cycling.• Faster plant growth leads to limitation by
nutrients or greater investment in roots (or both).
• Larger or faster-growing plants lead to greater carbon inputs into soil.
Decreased Water Conductance per Leaf Area• Increased photosynthesis and decreased water
use increase plant water-use efficiency.• Reduced investment in photosynthetic
enzymes increases plant nitrogen-use efficiency.
• Reduced investment in photosynthetic enzymes may result in total or partial loss of the fertilization effect.
Plant Species Responses• Plants with CO2-concentrating mechanisms
(i.e., C4 or crassulacean acid metabolism [CAM] plants) experience higher water-use efficiency but no direct effect on photosynthesis.
• Changing competition may result in new plant communities.
• Young, actively growing forests may represent an upper bound to increased productivity; there is little demonstrated enhancement of mature, slow-growing forests.
• Fast-growing species (e.g., weeds) may see more enhancement than slow-growing species.
Food and Crop Responses• Decreased plant enzymes mean that herbi-
vores need to harvest more leaf area to eat the same amount of protein.
• For the same input, crop yields likely will increase, while the protein content of crops probably will decrease.
• Pollen production may increase.
manipulations such as Free-Air CO2 Enrichment (FACE) projects (see Figure 17.1, p. 693), tree rings, observational networks, and modeling experiments.
Plants take up carbon through the process of photo-synthesis and synthesize biomass (e.g., leaves, wood, and roots) from simple, carbon-rich sugars derived from CO2. As CO2 increases in the atmosphere, plants can photosynthesize more quickly. Plants take up CO2 through the same pores (stomata) from which they lose water, leading to a balance between CO2 uptake and water loss. Rising CO2 increases carbon uptake per unit of water lost, allowing plants
to close their stomata and therefore become more efficient in water usage (see Box 17.1, Short-Term Physiological Effects of CO2 on Plants, this page). These physiological effects play out differently in different types of plants and under different environ-mental conditions. Twenty years of CO2-enrichment experiments have shown that elevated CO2 enhances photosynthetic carbon gain over the long term for certain ecosystem types but only over the short term for others (Leakey et al., 2009; Leuzinger et al., 2011; Norby and Zak 2011). Plant communities dominated by trees and grasses generally show greater stimula-tion of photosynthetic carbon uptake compared to

Chapter 17 | Biogeochemical Effects of Rising Atmospheric Carbon Dioxide
701Second State of the Carbon Cycle Report (SOCCR2)November 2018
that of legumes, shrubs, and nonleguminous crops (Ainsworth and Rogers 2007).
Net primary production (NPP) is calculated as either the balance between carbon gained through photosynthesis and lost through respiration or the sum of all growth over a year. With increased CO2, NPP is enhanced by ~23% across a broad range of early successional forests (Norby et al., 2005). These results probably are not indicative of all forests, and smaller responses have been observed in the limited number of studies carried out in old-growth temper-ate, boreal, and tropical forests (Hickler et al., 2008; Körner et al., 2005). Also clear is that the temporal pattern of NPP responses to elevated CO2 differs among forests (e.g., McCarthy et al., 2010; Norby et al., 2010).
Plants balance carbon gain and water loss. Stomatal conductance is depressed at elevated CO2, so plants may reduce water loss without reducing carbon gain, an observation which has been noted at the leaf and canopy scales (Keenan et al., 2013; Leakey et al., 2009; Peñuelas et al., 2011). Observations of decreased canopy evapotranspiration at elevated CO2 are therefore coupled with those of increased soil moisture. Crop carbon accumulation and water-use efficiency can be enhanced under drought conditions (Blum 2009; Morison et al., 2008), but extreme droughts may reduce or eliminate these enhancements (Gray et al., 2016).
Plant growth over years is not limited by CO2 alone (Körner 2015). If another environmental factor limits growth, then experimentally increasing CO2 causes diminished enhancement of photosynthe-sis and plant production (Ainsworth and Long 2005; Ainsworth and Rogers 2007). For example, nitrogen is sequestered in long-lived biomass and soil pools and may not always be readily available to plants. In this case, nitrogen limitation inhibits increases in plant production associated with ele-vated CO2, a process which is referred to as a neg-ative feedback. In systems where nitrogen cycling did not reduce sink strength, the effects of CO2 fertilization on increasing NPP persisted (Drake
et al., 2011; Finzi et al., 2006). The effects of rising CO2 on tree biomass may be inferred from tree-ring records, but results are mixed; some studies show no effect from changing CO2, and others show increased growth or water-use efficiency (Andreu-Hayles et al., 2011; Cole et al., 2009; Knapp and Soulé 2011; Koutavas 2013).
Because of these complications, whether rising CO2 will lead to larger standing biomass and carbon stor-age is unclear, in part because of the enormous com-plexity of the entire system (Norby and Zak 2011; Leuzinger and Hattenschwiler 2013). While instan-taneous and annual fluxes of carbon are well studied in the FACE literature, the allocation of carbon to stems, roots, and leaves, for example, varies among experiments (DeLucia et al., 2005), and enhance-ment of multidecadal carbon stocks (e.g., woody biomass and soil organic matter) is not well studied (Leuzinger and Hattenschwiler 2013; Norby and Zak 2011). Increased carbon supply from plants can lead to heightened activity of soil fauna and more rapid cycling of carbon rather than increased carbon storage in soils (Phillips et al., 2012; van Groenigen et al., 2011, 2014). Because observed changes in soil carbon were small over the timescale of the FACE studies (3 to 16 years), firm conclusions about the impact of elevated CO2 on soil carbon remain elu-sive (Luo et al., 2011). In general, research suggests that large effects of rising CO2 on carbon storage in soils are limited (Schlesinger and Lichter 2001), although the combined effects of CO2 and nitrogen deposition and rising temperatures may significantly affect soil carbon loss (Zhou et al., 2016).
17.5 Carbon Cycle Feedbacks of Rising CO2Climate and rising atmospheric CO2 can alter the amount of carbon taken up or released by ecosys-tems and the ocean. Rising temperatures influence the response of the carbon cycle to rising CO2 in diverse and complicated ways, yielding both pos-itive and negative feedbacks (Deryng et al., 2016; Dieleman et al., 2012; Holding et al., 2015). Positive feedbacks tend to be additive of the original effect,

Section IV | Consequences and Ways Forward
702 U.S. Global Change Research Program November 2018
negative feedbacks tend to counteract the original effect. Overall, rising temperatures tend to release more land and ocean carbon into the atmosphere, while rising CO2 is projected to increase land and ocean uptake (Friedlingstein et al., 2006). However, the importance of this positive feedback is variable according to different locations and time frames. Earth System Model assessments that incorporate carbon cycle feedbacks to projected climate change show that the combined effects of climate change result in an overall larger increase in CO2 concen-trations, thus contributing to additional climate warming (a positive feedback). However, this feed-back is highly uncertain due to its dependence on various factors, so different studies may report large ranges in predicted CO2 concentrations (Blok et al., 2010; Elberling et al., 2013; Hodgkins et al., 2014; McCalley et al., 2014; Schneider von Deimling et al., 2012; Schuur et al., 2009). Temperature also indi-rectly influences radiative CO2 effects. For example, increased evaporation from the ocean in a warmer world yields higher atmospheric water vapor con-centrations that further amplify the impact of CO2 on climate warming (Myhre et al., 2013). Another chapter in this report presents a broader discussion of the impacts of multiple environmental changes (see Ch. 19: Future of the North American Carbon Cycle, p. 760).
On land, the direct effect of rising CO2 on plant photosynthesis and growth interacts with rising temperature (Gray et al., 2016; Zhu et al., 2016). Rising CO2 increases the photosynthetic tempera-ture optimum (Long 1991) because of the decreas-ing relative solubility of CO2 versus oxygen at higher temperatures ( Jordan and Ogren 1984). While photosynthesis, respiration, and decomposition sensitivities to temperature act on short timescales of decades, chemical weathering sensitivities act over several hundred thousand years and are largely responsible for moderating CO2 levels throughout the geological record. Rising temperatures affect biogeochemical processes through enhanced NPP, faster microbial decomposition of organic matter and increased emissions of CO2 from microbial respiration in soils, and increased rates of chemical
weathering (Galloway et al., 2014). However, interactions between rising CO2 and temperature are complicated by nonuniform warming patterns, and research shows that climate warming can either stimulate or suppress plant productivity depending on the season and region (Xia et al., 2014). In the cryosphere, higher temperatures thaw permafrost and melt ice, processes which release stored CO2 and CH4 back into the atmosphere (Schneider von Deimling et al., 2012).
Chemical weathering of minerals, which consumes CO2 from the atmosphere, provides an important feedback mechanism for CO2 in the carbon cycle (Berner 1992; Colbourn et al., 2015; Kump et al., 2000; see Ch. 12: Soils, p. 469). Carbon dioxide is found in soils and surficial deposits because of plant and microbial respiration as well as chemical weathering of minerals. Carbonic acid, which is formed naturally when CO2 becomes dissolved into infiltrating rainwater, can dissolve primary minerals, a process that consumes CO2. Also, CaCO3 may precipitate in soils and surficial deposits if con-centrations are high enough, a process that may be enhanced by low soil moisture and in semiarid and arid climates (Berner 1992). The rates of mineral reactions depend on several factors, including tem-perature, pressure, and mineral saturation state, all of which are influenced by climate. As temperatures rise, weathering rates of most minerals increase, leading to greater CO2 consumption (Brady and Carroll 1994; Velbel 1993). Precipitation (e.g., rain and snowmelt) flushes solutes away, lowering the saturation state for primary minerals in solution, thereby promoting higher mineral weathering rates (Clow and Mast 2010; Kump et al., 2000). Thus, greater precipitation would lead to lower mineral saturation states, higher weathering rates, and greater CO2 consumption (Clow and Mast 2010). These feedback mechanisms have the potential to help mitigate the effects of rising atmospheric CO2 concentrations, but their effects will vary spatially and temporally in concert with changes in tem-perature and precipitation. For example, while the northeastern United States may see relatively strong increases in weathering rates because of increasing

Chapter 17 | Biogeochemical Effects of Rising Atmospheric Carbon Dioxide
703Second State of the Carbon Cycle Report (SOCCR2)November 2018
temperature and precipitation (IPCC 2013), the Southwest might experience more mixed impacts because of increasing temperature but decreasing precipitation (IPCC 2013).
17.6 Consequences for Ecosystem ServicesOceanic ecosystem services critical for human survival, such as the provision of fish and seafood, carbon storage, coastal protection by reefs, and climate modulation, face significant risks from the combined effects of ocean acidification, warming, and sea level rise (Gattuso et al., 2015). Under the current rate of CO2 emissions, most marine organ-isms evaluated to date will face a very high risk of impacts by 2100, and some, including coral reefs (Hughes et al., 2017; Ainsworth et al., 2016; Hughes et al., 2018) and bivalve shellfish (Kroeker et al., 2013), already face moderate to high risk today (Gattuso et al., 2015; see Figure 17.5, p. 704). For future scenarios without significant mitigation of CO2 emissions, predicted impacts to ocean ecosys-tem services are moderate for the early decades of this century but put all ecosystem services at high or very high risk by 2100 (Gattuso et al., 2015).
17.6.1 BiodiversityRising CO2 will affect species differentially. Described here are the direct effects of rising CO2 rather than the impacts of warming, which are discussed comprehensively in CSSR (USGCRP 2017). Acidification by CO2 has been associated with a decline in shell-bearing benthic organisms (Hall-Spencer et al., 2008; Kroeker et al., 2011). Declines in oyster spat survival at a commercial hatchery in the U.S. Pacific Northwest that temporar-ily jeopardized the region’s oyster aquaculture indus-try have been definitively attributed to ocean acidifi-cation (Barton et al., 2015). Laboratory studies and meta-analyses have provided evidence for and against detrimental effects on marine biodiversity (Bijma et al., 2013; Dupont et al., 2010; Hendriks and Duarte 2010; Hendriks et al., 2010). Foundational organisms such as microbial populations, while not deeply studied, also demonstrate a range of positive
to negative responses to ocean acidification (Bunse et al., 2016). The effects of ocean acidification on marine ecosystem structure are only now being identified. Models simulating ocean acidification’s impacts on bivalve shellfish have shown a restructur-ing of the entire California Current ecosystem by a combination of indirect predator-prey effects (Busch et al., 2013; Kaplan et al., 2010). Another model showed substantial restructuring of phytoplankton communities under ocean acidification and warming (Dutkiewicz et al., 2015), but studies still have not determined whether this restructuring would have significant effects on phytoplankton community function or food-web relationships.
On land, elevated atmospheric CO2 studies have demonstrated that seed yield can be increased (LaDeau and Clark 2001, 2006). In some crop species, increased seed production was accompa-nied by reduced quality (Ainsworth et al., 2002) but not in tree species (Way et al., 2010). Species show different growth responses to rising CO2 (Dawes et al., 2011), possibly giving dominant plants an advantage (McDonald et al., 2002; Moore et al., 2006) and leading to changes in forest structure. However, the impact on biodiversity will depend on ecological responses that will remain uncertain with-out long-term study of ecological responses to rising CO2 (Alin et al., 2015; Carey and Cottingham 2016; Elmendorf et al., 2016; Schimel et al., 2011).
17.6.2 Food and Fiber ProvisionOcean acidification is likely to have long-term effects on the population and diversity of fish and invertebrates, including economically and ecolog-ically important shellfish (Pörtner et al., 2004). Although difficult to untangle, the combined effects of resource competition, pollution, overfishing, habitat modification, acidification, water tempera-ture increases, and climate-driven changes on small-scale fisheries and aquaculture are likely to result in widespread changes in ocean ecosystems and in the fisheries themselves (HLPE 2014).
The impacts of ocean acidification on the food value, quality, and market value of marine species

Section IV | Consequences and Ways Forward
704 U.S. Global Change Research Program November 2018
have yet to be conclusively determined. One pre-liminary study (Dupont et al., 2014) notes that the taste and texture of pink shrimp (Pandalus borealis) were poorer when the shrimp had been raised under more acidified conditions. Assuming that ocean
acidification slows the growth of bivalve shellfish in the wild as it does in laboratory studies (Kroeker et al., 2013), harvest of the largest size class of sea scallop meat, which fetches a market price premium, is projected to decline under acidification (Cooley
Figure 17.5. Ocean Impacts Projected by High and Low Carbon Dioxide (CO2) Emissions Scenarios. Impacts on organisms and ecosystem services are shown—along with effects of acidification, warming, and sea level rise on ocean physics and chemistry—for both a low CO2 emissions scenario (Representative Concentration Pathway [RCP]2.6), and for a high CO2 scenario (RCP8.5). (See Ch. 19: Future of the North American Carbon Cycle for RCP explanations, p. 760.) Physical impacts on the ocean due to higher atmospheric CO2 levels are largely related to the climatic effects of CO2 and other radiatively active, anthropogenically released gases. These impacts include higher sea levels and shallower oceanic mixing (right-side water column, shown by a taller water level and shallower light aqua mixed layer). More severe risks of impacts from higher oceanic CO2 levels on ocean taxa (top group, black text) in higher CO2 emissions scenarios (center right) correspond to higher risks of impacts on ecosystem services (bottom group, white text, center right). Management options (i.e., activities that will mitigate, adapt, protect, or repair marine systems) are more numerous and more effective in lower CO2 scenarios (far left) compared with those in a higher CO2 world (far right). [Figure source: Adapted from Gattuso et al., 2015.]

Chapter 17 | Biogeochemical Effects of Rising Atmospheric Carbon Dioxide
705Second State of the Carbon Cycle Report (SOCCR2)November 2018
et al., 2015). The growth-retarding effects of acidifi-cation on king and Tanner crab as reported by Long et al. (2013a, 2013b) are projected to harm fishery revenues (Punt et al., 2016), but the implications of acidification for the market quality of Alaskan crabs (e.g., taste and texture) are not yet known. If the lab-oratory and model results reviewed above hold true in natural ecosystems, ocean acidification is likely to decrease the volume or quality of marine harvests beyond simply the impacts on oyster aquaculture observed to date. The larval production shortage in the mid-2000s experienced by the Pacific Northwest oyster aquaculture industry that was conclusively attributed to ocean acidification remains the bell-wether example of impacts to fisheries from rising CO2 (Barton et al., 2015).
Terrestrial provisioning services (e.g., crops and livestock) also are responding to rising CO2. For example, crop production increased in response to experimentally elevated CO2 (Leakey et al., 2009), but increases in crop yield were accompanied by decreases in seed quality (Myers et al., 2014). Phys-iological changes also led to increased herbivory in some crops (DeLucia et al., 2012; Dermody et al., 2008). The effects of rising CO2 on crop yield are tempered by other global changes. Corresponding increases in ground ozone decreases productivity (Morgan et al., 2006), and increased drought may remove the positive effects of rising CO2 entirely (Gray et al., 2016). Carbon dioxide fertilization can have either direct or indirect consequences on agriculture. At higher levels of atmospheric warm-ing and at low latitudes, model simulations show significant reductions in yields for all major crops, even with the positive benefits of CO2 fertilization (Challinor et al., 2014). Indirect effects of rising CO2 include the reduction in nutrient content and digestibility of pasture for livestock (Tubiello et al., 2007) and reductions in protein content by 10% to 14% in the edible portions of wheat, rice, barley, and potato and by 1.5% in soybeans (Müller et al., 2014; Taub et al., 2008).
Terrestrial food and fiber production over the next century may be more profoundly influenced by
climate change than by rising CO2 itself. Climate changes could include heatwaves during growing seasons, droughts and lengthening of dry spells, and rising sea levels (Melillo et al., 2014; Nelson et al., 2014; Wiebe et al., 2015). The greater the green-house gas concentrations, the greater the change in the climate and climate-associated risks for agricul-ture and food security (Brown et al., 2015).
17.6.3 Carbon Storage in Vegetation and SoilsVegetated coastal ecosystems store CO2 in sea-grasses, marshes, kelp, and mangroves at rates com-parable with those of forest ecosystems (McLeod et al., 2011). This “blue carbon” is believed to be an important sink for atmospheric CO2, but coastal habitats are under strong human-driven pressures worldwide including habitat destruction, rising ocean temperatures, sea level rise, and sediment star-vation (see Ch. 15: Tidal Wetlands and Estuaries, p. 596). For example, erosion of coastal wetlands or thawing of coastal Arctic permafrost exposes buried organic carbon, which can either be respired in situ to release CH4 or CO2, exacerbating atmospheric warming, or be released to nearshore waters and respired there, contributing to local acidification (Aufdenkampe et al., 2011; see Ch. 11: Arctic and Boreal Carbon, p. 428). Seagrasses may help mit-igate ocean acidification locally (Hendriks et al., 2014), underscoring the double benefit of protect-ing blue carbon habitats.
Carbon on land is stored in vegetation and soils. Forests account for approximately 66% of the land carbon sink (see Ch. 2: North American Carbon Budget, p. 71, and Ch. 9: Forests, p. 365), a per-centage which could increase if strategies were applied to minimize forest losses from deforesta-tion. However, carbon sinks change with the age of forest regrowth—the rate of carbon accumulation is rapid in young forests but typically quite low in old-growth forests. Restoring the organic content of agricultural and natural soils also can increase soil carbon storage (Lal 2003). Historically, soils have lost vast amounts of carbon when transitioning from natural to human-modified landscapes (e.g.,

Section IV | Consequences and Ways Forward
706 U.S. Global Change Research Program November 2018
through urbanization and forest and agricultural management; see also Ch. 5: Agriculture, p. 229, and Ch. 12: Soils, p. 469), but gauging the effect of land management on carbon storage is challenging. The land carbon sink is calculated using bookkeeping methods that sum together carbon into different respective ecosystem compartments (e.g., land, ocean, and atmosphere) at a variety of scales. The carbon sink is typically inferred by the existence of a residual (i.e., unaccounted) sink in the global carbon budget. Therefore, the effects of land management can be difficult to detect and attribute using carbon balance accounting methods (Erb et al., 2013).
17.6.4 Coastal Protection by CoralsIn low-latitude areas around the world, coral reefs are particularly important for protecting coastlines, but the combined effects of rising temperature and ocean acidification slow the growth of stony coral reefs (Muehllehner et al., 2016; Wong et al., 2014), hindering their ability to grow or recover from damage (Hughes et al., 2017; Ainsworth et al., 2016; Hughes et al., 2018). Carbonate sediments also are being dissolved by ocean acidification, while sea level also rises; the net effect has accelerated the rel-ative rate of sea level rise near Florida, Hawai‘i, and the U.S. Virgin Islands, exposing those coastal com-munities to heightened risk of flooding (Yates et al., 2017). Globally, the loss of the three-dimensional structure of the reef could expose 200 million peo-ple to greater effects of storms and tsunamis (Fer-rario et al., 2014). People living in the low-elevation coastal zone (LECZ), below 10 m in elevation (Vafeidis et al., 2011), face a higher risk of coastal hazards such as flooding and sea level rise due to climate change (Lichter and Felsenstein 2012). In the United States, population in the LECZ is fore-cast to increase by 188% from 23 million in 2000 to 44 million in 2060 (Neumann et al., 2015), so losses of coral reefs that protect coastlines heighten overall coastal community risk.
17.6.5 Water AvailabilityReduced transpiration due to increased plant water-use efficiency (Leakey et al., 2009; Norby and Zak
2011) may allow more water to pass through soils and enter freshwater ecosystems. As discussed in Ch. 13: Terrestrial Wetlands, p. 507, and Ch. 14: Inland Waters, p. 568, inland waters act as hotspots for the degradation and outgassing of carbon orig-inating from both terrestrial and aquatic sources. Increases in precipitation events, along with reduc-tions in transpiration (Charney et al., 2016; van der Sleen et al., 2014), may facilitate the movement of materials from the landscape into water systems, altering ecosystem structure and function as seen extensively on Lake Erie (Smith et al., 2015). Conversely, the drying of systems that receive less precipitation will dramatically influence the timing of rainfed and snowmelt-driven ecosystems and municipalities reliant on surface waters for agricul-ture, fisheries, industry, and drinking water (Clow et al., 2010; Rao et al., 2004).
17.7 Synthesis, Knowledge Gaps, and Outlook17.7.1 Current State of KnowledgeThe rise of atmospheric CO2—attributable pri-marily to human-caused fossil fuel emissions and land-use change—has been dampened by carbon uptake by the ocean and terrestrial biosphere. Nevertheless, today’s atmospheric CO2 levels are higher than at any time in at least the past 800,000 years (Hönisch et al., 2012). Uptake of this fossil fuel CO2 has caused documented direct and indi-rect effects on terrestrial and oceanic systems and processes in different regions of North America and the rest of the planet. The capacity of these systems to continue to act as carbon sinks is not certain because the systems are dynamic and influenced by feedbacks related to CO2 levels (see Section 17.3, p. 695). Another major set of consequences stems from the atmospheric warming caused by rising CO2; weather and climate changes affect nearly every terrestrial and oceanic process (see Section 17.3–17.5) and often lead to additional feedbacks. Although reviewed in detail in other reports, including the IPCC AR5 (IPCC 2013) and CSSR (USGCRP 2017), these consequences deserve mention here because of their combined effects

Chapter 17 | Biogeochemical Effects of Rising Atmospheric Carbon Dioxide
707Second State of the Carbon Cycle Report (SOCCR2)November 2018
with CO2 on systems and processes throughout the land and ocean domains.
17.7.2 Key Knowledge Gaps and OpportunitiesResearch has uncovered many of the direct and indirect responses of natural systems to rising CO2, but mechanisms often remain unclear. Since the SOCCR1 report, increasing computational power has enabled the development of complex models to examine the consequences of rising CO2 and a changing carbon cycle. Observational and mod-eling studies, such as the new generation of FACE experiments now underway, are being planned in concert to enable strategic data collection. Some of these approaches allow for limitations of mul-tiple resources (e.g., nitrogen and phosphorus), which could lead to more realistic projections of the terrestrial carbon sink’s response to rising CO2. As Figure 17.1, p. 693, illustrates, there are current FACE experiments in the Northwest, Northeast, Southern Plains, or any tropical ecosystem within the U.S. territories. While most experiments are in mesic (wet) or temperate ecosystems (see Figure 17.6, p. 708), understanding the response of tropi-cal forests or coniferous boreal forests is critical to account for carbon cycle feedbacks. Oceanic models are providing insight into ecosystem relationships and dynamics under global change and into the biophysical underpinnings of ocean-atmosphere interactions. Despite these insights, knowledge of how multiple global change factors affect modeled processes would greatly improve model forecast abil-ity. In contrast, most experimental manipulations are single-factor experiments in which only one variable is manipulated.
Disentangling the impacts of rising CO2 and other concurrent changes in climate, land use, nutrient cycles, and atmospheric chemistry across all eco-systems likely requires long-term, sustained carbon cycle observations and monitoring of ecosystem and socioeconomic consequences. Long-term observing networks are critical to managing ecosys-tems sustainably and adaptively (e.g., Schindler and Hilborn 2015), and a focus on data management and interoperability across data platforms would improve understanding of long-term responses to rising CO2 (Ciais et al., 2014). Few experiments on land or in the ocean extend to a decade in length, and therefore the long-term ecosystem responses are not clear.
Pörtner et al. (2014) conclude that there is medium to high agreement that ecosystem services will change. However, the effects of rising CO2 on bio-diversity and vegetation changes after disturbance remain poorly understood and could result in altered ecosystem function and different ecosystem services. This lack of understanding also limits the ability to anticipate recovery from acute disturbances such as storms, fires, disease, or insect outbreaks.
As forecasts of future conditions improve, investi-gating past conditions on Earth is still important. Over short timescales, historical terrestrial work is limited to studies that involve reconstructions of plant growth (e.g., tree rings). Exploring historical conditions decades or centuries before via ice core analysis, seafloor sediment core studies, and geo-logical research will continue to uncover aspects of prior ages that are analogous to today, aiding the anticipation of potential changes in the Earth system as global change continues.

Section IV | Consequences and Ways Forward
708 U.S. Global Change Research Program November 2018
Figure 17.6. Hypothesized Ecosystem Responses to Elevated Carbon Dioxide (CO2) Relative to Nutrient and Water Availability. Field studies, including Free-Air CO2 Enrichment (FACE) experiments, have been conducted in desert, grasslands, chaparral, alpine, and temperate deciduous forests but not in tropical forests or coniferous boreal forests. Increasingly darker green indicates greater relative response to CO2, based on the assumptions that response increases with drought stress and with nutrient availability. [Figure source: Reprinted from Norby et al., 2016 (originally adapted from Mooney et al., 1991).]

Supporting Evidence | Chapter 17 | Biogeochemical Effects of Rising Atmospheric Carbon Dioxide
709Second State of the Carbon Cycle Report (SOCCR2)November 2018
SUPPORTING EVIDENCE
KEY FINDING 1Rising carbon dioxide (CO2) has decreased seawater pH at long-term observing stations around the world, including in the open ocean north of Oahu, Hawai‘i; near Alaska’s Aleutian Islands; on the Gulf of Maine shore; and on Gray’s Reef in the southeastern United States. This ocean acid-ification process has already affected some marine species and altered fundamental ecosystem processes, and further effects are likely (high confidence, likely).
Description of evidence baseThe atmospheric record indicates that both the ocean and land carbon sinks have increased as CO2 has risen (Le Quéré et al., 2016). Modern-day ocean observations have confirmed that seawater pH is decreasing because of atmospheric CO2 uptake (Feely et al., 2004, 2009; Gattuso et al., 2015; Orr et al., 2005). Time-series stations around North America (near Hawai‘i, Alaska, Washington, California, Georgia, and Maine) have documented decreased pH below prein-dustrial levels for some or all of the annual cycle (Sutton et al., 2016). Effects on marine life and fundamental ecosystem processes or characteristics, including calcification, biodiversity, growth rates, and nitrogen fixation, are reviewed in this chapter; they are documented in detail in Bijma et al. (2013), Bunse et al. (2016), Dupont et al. (2010), Fu et al. (2007, 2012), Hendriks and Duarte (2010), Hendriks et al. (2010), Hofmann et al. (2010), Hutchins et al. (2013), Kroeker et al. (2013), Meyer and Riebesell (2015), Riebesell and Tortell (2011), and Riebesell et al. (2007), among others. Future effects are projected by observational (Pespeni et al., 2013; Wootton et al., 2008), integrative (Boyd et al., 2014), and modeling (Dutkiewicz et al., 2015) studies.
Major uncertaintiesIn most cases, observed biological effects have not been mechanistically attributed to pH or car-bonate and bicarbonate ion concentration changes. Laboratory studies may not perfectly repro-duce the responses of organisms in nature, where environments and drivers are more complex and numerous. Genetic, behavioral, and phenotypic plasticity (flexibility) have not been evalu-ated for most of the species investigated in laboratory studies.
Estimated likelihood of impact or consequence, including short description of basis of estimateVariation within populations (plasticity) and the existence of many competing environmental drivers could offset the effects of ocean acidification on some marine populations, but to an uncertain extent. Research has demonstrated effects on large groups of marine organisms (e.g., bivalve shellfish and stony corals) unambiguously enough to ascertain that continuing negative impacts to these communities are likely.
Summary sentence or paragraph that integrates the above information Rising CO2 has decreased seawater pH (very high confidence). This process of ocean acidifica-tion has affected some marine species (very high confidence) and altered fundamental ecosystem processes (high confidence), with further effects likely (high confidence). Continuing impacts are probable, but plasticity and the existence of other environmental drivers could offset the effects of ocean acidification on some marine populations to an uncertain extent.
Section IV | Consequences and Ways Forward
710 U.S. Global Change Research Program November 2018
KEY FINDING 2While atmospheric CO2 rises at approximately the same rate all over the globe, its non-climate effects on land vary depending on climate and dominant species. In terrestrial ecosystems, rising atmospheric CO2 concentrations are expected to increase plant photosynthesis, growth, and water-use efficiency, though these effects are reduced when nutrients, drought, or other factors limit plant growth (very high confidence, very likely). Rising CO2 would likely change carbon storage and influence terrestrial hydrology and biogeochemical cycling, but concomitant effects on vegetation composition and nutrient feedbacks are challenging to predict, making decadal forecasts uncertain.
Description of evidence baseResearch definitively shows that the bodies of marine and terrestrial organisms have incorporated CO2 released from the burning of fossil fuels, based on the change in isotope ratios within their biological material (Fraile et al., 2016; Hilton et al., 2006; Suess 1955).
On land, the historical record of the impact of rising CO2 is more complex. Physiological theory suggests that, as CO2 rises, photosynthesis should increase. Using preserved plant specimens, isotopomer analysis appears to support this physiological prediction (Ehlers et al., 2015), though this is a novel technique. The effects of rising CO2 on tree biomass over multiple decades may be inferred from tree-ring records, but they provide mixed results (Andreu-Hayles et al., 2011; Cole et al., 2009; Knapp and Soulé 2011; Koutavas 2013). Studies from a wide range of forest types across broad geographic regions have observed changes in the ratio of the 13C isotope to the 12C isotope (δ13C), observations which imply trees have experienced increased water-use efficiency as CO2 has risen over the last two centuries, but growth was not clearly stimulated by rising CO2 (Peñuelas et al., 2011).
Rising CO2 tends to make plants close their stomata and thus use water more efficiently. The primary enzyme responsible for CO2 uptake, ribulose-1,5-bisphosphate carboxylase-oxygenase (RUBISCO), accounts for a substantial portion of every plant’s nitrogen requirement. As CO2 rises, less RUBISCO is required for the same carbon gain, so plants become more efficient in nutrient use. These physiological effects play out differently in various types of plants and under diverse environmental conditions. Plants that lack a CO2 concentration mechanism and pass a 3-carbon sugar molecule into the Benson-Calvin cycle (C3 plants) are more likely to show an instantaneous photosynthetic response than plants with a CO2 concentration mechanism like C4 plants (that pass a 4-carbon sugar molecule to the Benson-Calvin cycle) or those that use crassu-lacean acid metabolism (CAM).
Twenty years of CO2 enrichment experiments have shown that elevated CO2 enhances photo-synthetic carbon gain over the long term for certain ecosystem types but only over the short term for others (Leakey et al., 2009; Leuzinger et al., 2011; Norby and Zak 2011). Plant communities dominated by trees and grasses generally have shown greater stimulation of photosynthetic car-bon uptake compared to that of legumes, shrubs, and nonleguminous C3 crops (Ainsworth and Rogers 2007).
Net primary production (NPP) is calculated as either the balance between carbon gained through photosynthesis and lost through respiration or the sum of all growth over a year. NPP is

Supporting Evidence | Chapter 17 | Biogeochemical Effects of Rising Atmospheric Carbon Dioxide
711Second State of the Carbon Cycle Report (SOCCR2)November 2018
enhanced by ~23% across a broad range of early successional forests in response to elevated CO2 (Norby et al., 2005). These results are likely not indicative of all forests, and smaller responses have been observed in the limited number of studies carried out in old-growth temperate, boreal, and tropical forests (Hickler et al., 2008; Körner et al., 2005). Also clear is that the temporal pattern of NPP responses to elevated CO2 differs among forests. For example, McCarthy et al. (2010) reported that NPP in coniferous forests was enhanced by 22% to 30% and sustained over 10 years of exposure to 550 parts per million (ppm) of CO2. In contrast, Norby et al. (2010) found that NPP was significantly enhanced for 6 years in hardwood forest plots exposed to 550 ppm CO2 (compared with plots under current ambient CO2), after which time the enhancement of NPP under elevated CO2 declined from 24% to 9%.
Plants balance carbon gain and water loss. Stomatal conductance is depressed at elevated CO2, so plants may reduce water loss without reducing carbon gain. This physiological effect has been observed at the leaf and canopy scales (Keenan et al., 2013; Leakey et al., 2009; Peñuelas et al., 2011) and represents the major mechanism leading to observations of decreased canopy evapo-transpiration under elevated CO2. For the hydrological cycle, this mechanism results in increased soil moisture. Even plants with CO2 concentration mechanisms (i.e., C4 and CAM plants) may experience increased water-use efficiency without any direct stimulation in photosynthesis (Leakey et al., 2009). Under drought conditions, elevated CO2 may not directly stimulate photo-synthesis in C4 plants but can indirectly increase carbon gain by increasing water-use efficiency.
Physiological theory and experimental evidence indicate that rising CO2 increases the photosyn-thetic temperature optimum (Long 1991) because of the decreasing relative solubility of CO2 versus oxygen at higher temperatures ( Jordan and Ogren 1984). These results imply that biomes that experience high temperatures may experience disproportionately enhanced photosynthesis and growth. Interannual variation in the increased growth of Lobolly pine trees was dispropor-tionately enhanced by experimentally elevated CO2 in warmer years (Moore et al., 2006).
Plant growth is not limited by CO2 alone (Körner 2015). If, for example, another environmental factor limits growth, then experimentally increasing CO2 has reduced effects on photosynthesis and growth (Ainsworth and Rogers 2007). This outcome is called “sink limitation.” Research suggests that nitrogen limitation may be one mechanism leading to declining NPP responses to elevated CO2 in some ecosystems (Norby et al., 2010).
Nitrogen is sequestered in long-lived biomass and soil pools and may not be readily available to plants under some conditions. In this case, nitrogen limitation inhibits increases in plant produc-tion associated with elevated CO2, an effect which is referred to as a negative feedback. In systems where nitrogen supply was sufficient, CO2 fertilization effects on NPP persisted (Drake et al., 2011; Finzi et al., 2006). Nevertheless, elevated CO2 also increases photosynthetic nitrogen-use efficiency, defined as the net amount of CO2 assimilated per unit of leaf nitrogen (Ainsworth and Rogers 2007; Bader et al., 2010; Leakey et al., 2009).
Elevated atmospheric CO2 experiments have demonstrated that seed yield can be increased (LaDeau and Clark 2001, 2006). In some crop species, increased seed production was accompa-nied by reduced quality (Ainsworth et al., 2002), but this was not observed in tree species (Way et al., 2010). Species show different growth responses to rising CO2 (Dawes et al., 2011), and

Section IV | Consequences and Ways Forward
712 U.S. Global Change Research Program November 2018
dominant plants may have an advantage with rising CO2 (McDonald et al., 2002; Moore et al., 2006), leading to changes in forest structure.
Major uncertaintiesUnclear is whether rising CO2 will lead to larger standing biomass and carbon storage or sim-ply faster cycling of carbon (Norby and Zak 2011). While instantaneous and annual fluxes of carbon are well studied in the Free-Air CO2 Enrichment (FACE) literature, the allocation of carbon to different pools varies between experiments (DeLucia et al., 2005), and enhance-ment of multidecadal carbon stocks (e.g., woody biomass and soil organic matter) is not well studied (Leuzinger and Hattenschwiler 2013; Norby and Zak 2011). Plant growth is increased by CO2, but gross plant respiration is also stimulated (Leakey et al., 2009). Root growth and the incorporation of organic material below ground are observed in response to elevated CO2 but so too is enhanced soil respiration fueled by releases of carbon from root systems (Drake et al., 2011; Hoosbeek et al., 2007; Jackson et al., 2009; Lagomarsino et al., 2013; Selsted et al., 2012). Increased carbon supply from plants can lead to enhanced activity of soil fauna and more rapid cycling of carbon, rather than increased carbon storage in soils (Phillips et al., 2012; van Groenigen et al., 2011, 2014). Observed changes in soil carbon were small over the timescale of the FACE studies (3 to 16 years), and thus firm conclusions remain elusive (Luo et al., 2011). In general, large effects of rising CO2 on carbon storage in soils are not expected (Schlesinger and Lichter 2001).
The long-term effects of rising CO2 are uncertain because there is only one whole-ecosystem study (i.e., of a salt marsh) that extends to 20 years. Instantaneous physiological responses to CO2 (Farquhar et al., 1980) typically are modified by feedbacks in system-level studies (Leakey et al., 2009; Norby and Zak 2011). Long-term records from tree-ring analyses are limited to recon-structions of aboveground growth. These studies rarely account for changes in carbon allocation strategies (DeLucia et al., 2005; Norby et al., 2010) caused by rising CO2 or changes in nutrient limitation (Finzi et al., 2006; McCarthy et al., 2010; Zhu et al., 2016) or belowground carbon storage (Drake et al., 2011; Phillips et al., 2012; van Groenigen et al., 2014).
Summary sentence or paragraph that integrates the above information While CO2 is rising globally, there is high confidence that its effects on terrestrial ecosystems will vary across spatial scales because the effects of CO2 on plants vary by species and may be altered by nutrient and water availability. The long-term impacts of rising CO2 on carbon storage in terrestrial ecosystems are uncertain.
KEY FINDING 3Consequences of rising atmospheric CO2 are expected to include difficult-to-predict changes in the ecosystem services that terrestrial and oceanic systems provide to humans. For instance, ocean acidification resulting from rising CO2 has decreased the supply of larvae that sustains commercial shellfish production in the northwestern United States. In addition, CO2 fertilization (increases) plus warming (decreases) are changing terrestrial crop yields (high confidence, likely).
Description of evidence baseCommercial oyster larvae in the U.S. Pacific Northwest were significantly damaged by ocean acidification, which caused much higher than usual larval mortality for several years in the

Supporting Evidence | Chapter 17 | Biogeochemical Effects of Rising Atmospheric Carbon Dioxide
713Second State of the Carbon Cycle Report (SOCCR2)November 2018
mid-2000s (Barton et al., 2015). Harmful impacts on oysters by ocean acidification were well documented (e.g., Kroeker et al., 2013, and references therein). Crop production increased in response to experimentally elevated CO2 (Leakey et al., 2009), accompanied by decreases in seed quality. Decreased protein content has been documented in wheat, barley, rice, potatoes, and soybeans grown at high CO2 (Myers et al., 2014; Taub et al., 2008). Physiological changes also led to increased herbivory in some crops (DeLucia et al., 2012; Dermody et al., 2008). Additional effects are expected for human populations via changes in ocean services, as reviewed in Pörtner et al. (2014). Gattuso et al. (2015) completed a literature review, plus expert judgement assess-ment, to determine the risk that ocean ecosystem services face from the combined effects of ocean acidification and warming.
Major uncertaintiesUncertainty is related to how rising CO2 may have affected an array of marine and terrestrial har-vests and how they may be affected in the future. Evaluating ecosystem services is difficult, and forecasting changes to these services is even more challenging.
Assessment of confidence based on evidence and agreement, including short description of nature of evidence and level of agreementVery high confidence in the existence and attribution of impacts to increased atmospheric CO2; medium confidence about future projected impacts on ecosystem services.
Estimated likelihood of impact or consequence, including short description of basis of estimateStudies have already documented impacts to marine and terrestrial harvests. Whether rising CO2 will affect all marine and terrestrial harvests is uncertain.
Summary sentence or paragraph that integrates the above information Rising CO2 has affected commercial shellfish stocks (very high confidence) and changed crop production yields (very high confidence). Additional consequences expected for human pop-ulations include more changes to ecosystem services or changes to benefits that terrestrial and oceanic systems provide to humans (medium confidence). Uncertainty centers around the diffi-culty of evaluating all exploited species and all ecosystem services and projecting potential future impacts on all of them.
KEY FINDING 4Continued persistence of uptake of carbon by the land and ocean is uncertain. Climate and envi-ronmental changes create complex feedbacks to the carbon cycle; how these feedbacks modulate future effects of rising CO2 on carbon sinks is unclear. There are several mechanisms that would reduce the ability of land and ocean sinks to continue taking up a large proportion of rising CO2 (very high confidence).
Description of evidence baseAcidification varies depending on latitude because CO2 solubility depends on temperature, with lower-temperature waters holding more CO2. Polar ecosystems may become undersaturated with calcium carbonate (Ca3O2–) minerals in the near future (Orr et al., 2005; Steinacher et al., 2010) because of the large amount of CO2 already dissolved in cold high-latitude ocean areas. Even though low-latitude ocean areas will not become corrosive to Ca3O2– minerals in the future,

Section IV | Consequences and Ways Forward
714 U.S. Global Change Research Program November 2018
conditions will soon surpass the bounds of natural variability (see Figure 17.4, p. 697). In some places, conditions have already done so (Sutton et al., 2016), exposing low-latitude organisms, such as warm-water coral reefs, to chemical conditions that are considered suboptimal in regard to growth and calcification (Fabricius et al., 2011).
On land, the direct effect of rising CO2 on plant photosynthesis and growth interacts with rising temperature (Gray et al., 2016; Zhu et al., 2016). Rising CO2 increases the photosynthetic temperature optimum (Long 1991) because of the decreasing relative solubility of CO2 versus oxygen at higher temperatures ( Jordan and Ogren 1984). Although the sensitivities of photosyn-thesis, respiration, and decomposition to temperature act on short timescales of decades, chem-ical weathering sensitivities act over several hundred thousand years and are largely responsible for moderating CO2 levels throughout the geological record. Higher temperatures affect bio-geochemical processes through 1) enhanced NPP; 2) faster microbial decomposition of organic matter involving increased emissions of CO2 from microbial respiration in soils; and 3) increased rates of chemical weathering, which consumes CO2 from the atmosphere (Galloway et al., 2014). However, interactions between rising CO2 and temperatures are complicated by nonuniform climate warming patterns, and research shows that this warming can either stimulate or suppress productivity depending on the season and region (Xia et al., 2014). Higher temperatures and drought have been implicated in widespread tree mortality (Breshears et al., 2009; Allen et al., 2010, 2015), and increased aridity in recent years has had a substantially negative effect on forest growth (Allen et al., 2015); these effects are expected to continue (Ficklin and Novick 2017). While some amelioration of physiological stress might be caused by rising CO2 (Ainsworth and Rogers 2007; Blum 2009; Morison et al., 2008), extreme droughts may reduce or eliminate these benefits (Gray et al., 2016). There are very few experiments on tree mortality, but no evidence was found that elevated CO2 reduced drought mortality (Duan et al., 2014).
In the ocean, higher temperatures affect the carbon cycle by decreasing CO2 solubility in sea-water (Zeebe and Wolf-Gladrow 2001); a warmer ocean will hold less carbon. Also, increased surface ocean stratification from the warmer water will prevent CO2 absorbed by the surface ocean from penetrating into deeper water masses by reducing deep mixing, thereby decreasing overall oceanic carbon uptake and storage (IPCC 2013). In the cryosphere, higher temperatures thaw permafrost and melt ice, processes which release CO2 and methane (CH4) from microbial respiration back into the atmosphere (Schneider von Deimling et al., 2012).
Rising temperatures thus influence the response of the carbon cycle to rising CO2 in diverse and complicated ways, yielding both positive and negative feedbacks to atmospheric CO2 (Deryng et al., 2016; Dieleman et al., 2012; Holding et al., 2015). Overall, higher temperatures tend to release land and ocean carbon into the atmosphere, while rising CO2 is projected to increase land and ocean uptake (Friedlingstein et al., 2006), but magnitudes are variable and uncertain. Earth System Model assessments that include carbon cycle feedbacks to climate change show that the combined effects of environmental change yield an overall increase in CO2 concentrations and thus would likely contribute to more climate warming. The multimodel average CO2 concentra-tion in 2100 is 985 ± 97 ppm, compared to a concentration of 936 ppm in models lacking carbon cycle feedbacks (Collins et al., 2013). This feedback is highly uncertain because of its dependence on a variety of factors, and thus studies arrive at large ranges in responses (Blok et al., 2010; Elber-ling et al., 2013; Hodgkins et al., 2014; McCalley et al., 2014; Schneider von Deimling et al., 2012;

Supporting Evidence | Chapter 17 | Biogeochemical Effects of Rising Atmospheric Carbon Dioxide
715Second State of the Carbon Cycle Report (SOCCR2)November 2018
Schuur et al., 2009). Temperature also indirectly influences CO2 radiative effects. For example, enhanced evaporation from the ocean in a warmer world yields higher atmospheric water vapor concentrations that further amplify the impact of CO2 on climate warming (Myhre et al., 2013).
Major uncertaintiesThe source or sink status of coastal zones has been difficult to determine, but evidence points to weakening CO2 release from low-latitude coastal zones and strengthening CO2 uptake from mid- and high-latitude systems, leading to greater release of dissolved inorganic carbon to the ocean (Cai 2011).
The effect of rising CO2 on succession and biodiversity remains poorly understood and quanti-fied and could result in changed ecosystem function and different ecosystem services. This lack of understanding also limits the ability to anticipate recovery from acute disturbances such as storms, fires, disease, or insect outbreaks.
Disentangling the impacts of rising CO2 and other concurrent changes in climate, land use, nutrient cycles, and atmospheric chemistry across all ecosystems probably will require long-term, sustained carbon cycle observations and monitoring of ecosystem and socioeconomic conse-quences. Long-term observing networks are critical to managing ecosystems sustainably and adaptively (e.g., Schindler and Hilborn 2015), and a focus on data management and interopera-bility across data platforms would improve understanding of long-term responses to rising CO2 (Ciais et al., 2014). Few experiments on land or in the ocean extend to a decade, and the balance of conclusions from observational studies is not settled.
Summary sentence or paragraph that integrates the above information Both oceanic and terrestrial ecosystems are influenced by CO2 and a variety of environmental controls, including temperature. The effects of climate and CO2 are likely to interact with each other (i.e., the effect of changing CO2 depends on the climatic conditions). These interactions likely will cause complex feedbacks to climate.

Section IV | Consequences and Ways Forward
716 U.S. Global Change Research Program November 2018
REFERENCES
Ainsworth, E. A., and A. Rogers, 2007: The response of photosyn-thesis and stomatal conductance to rising CO2: Mechanisms and environmental interactions. Plant, Cell and Environment, 30(3), 258-270, doi: 10.1111/j.1365-3040.2007.01641.x.
Ainsworth, E. A., and S. P. Long, 2005: What have we learned from 15 years of free-air CO2 enrichment (FACE)? A meta-analytic review of the responses of photosynthesis, canopy properties and plant production to rising CO2. New Phytologist, 165(2), 351-371, doi: 10.1111/j.1469-8137.2004.01224.x.
Ainsworth, E. A., P. A. Davey, C. J. Bernacchi, O. C. Dermody, E. A. Heaton, D. J. Moore, P. B. Morgan, S. L. Naidu, H.-S. Yoo Ra, X.-G. Zhu, P. S. Curtis, and S. P. Long, 2002: A meta-analysis of elevated CO2 effects on soybean (Glycine max) physiology, growth and yield. Global Change Biology, 8(8), 695-709, doi: 10.1046/j.1365-2486.2002.00498.x.
Ainsworth, T. D., S. F. Heron, J. C. Ortiz, P. J. Mumby, A. Grech, D. Ogawa, C. M. Eakin, and W. Leggat, 2016: Climate change disables coral bleaching protection on the Great Barrier Reef. Science, 352(6283), 338-342, doi: 10.1126/science.aac7125.
Alin, S., R. Brainard, N. Price, J. Newton, A. Cohen, W. Peterson, E. DeCarlo, E. Shadwick, S. Noakes, and N. Bednaršek, 2015: Characterizing the natural system: Toward sustained, integrated coastal ocean acidification observing networks to facilitate resource management and decision support. Oceanography, 25(2), 92-107, doi: 10.5670/oceanog.2015.34.
Allen, C. D., A. K. Macalady, H. Chenchouni, D. Bachelet, N. McDowell, M. Vennetier, T. Kitzberger, A. Rigling, D. D. Breshears, E. H. Hogg, P. Gonzalez, R. Fensham, Z. Zhang, J. Castro, N. Demidova, J.-H. Lim, G. Allard, S. W. Running, A. Semerci, and N. Cobb, 2010: A global overview of drought and heat-induced tree mortality reveals emerging climate change risks for forests. Forest Ecology and Management, 259(4), 660-684, doi: 10.1016/j.foreco.2009.09.001.
Allen, C. D., D. D. Breshears, and N. G. McDowell, 2015: On underestimation of global vulnerability to tree mortality and forest die-off from hotter drought in the Anthropocene. Ecosphere, 6(8), art129, doi: 10.1890/es15-00203.1.
Allwood, A. C., M. R. Walter, B. S. Kamber, C. P. Marshall, and I. W. Burch, 2006: Stromatolite reef from the Early Archaean era of Australia. Nature, 441(7094), 714-718, doi: 10.1038/nature04764.
Andreu-Hayles, L., O. Planells, E. Gutiérrez, E. Muntan, G. Helle, K. J. Anchukaitis, and G. H. Schleser, 2011: Long tree-ring chronologies reveal 20th century increases in water-use efficiency but no enhancement of tree growth at five Iberian pine forests. Global Change Biology, 17(6), 2095-2112, doi: 10.1111/j.1365-2486.2010.02373.x.
Aufdenkampe, A. K., E. Mayorga, P. A. Raymond, J. M. Melack, S. C. Doney, S. R. Alin, R. E. Aalto, and K. Yoo, 2011: Riverine coupling of biogeochemical cycles between land, oceans, and atmosphere. Frontiers in Ecology and the Environment, 9(1), 53-60, doi: 10.1890/100014.
Augustin, L., C. Barbante, P. R. Barnes, J. M. Barnola, M. Bigler, E. Castellano, O. Cattani, J. Chappellaz, D. Dahl-Jensen, B. Delmonte, G. Dreyfus, G. Durand, S. Falourd, H. Fischer, J. Fluckiger, M. E. Hansson, P. Huybrechts, G. Jugie, S. J. Johnsen, J. Jouzel, P. Kaufmann, J. Kipfstuhl, F. Lambert, V. Y. Lipenkov, G. C. Littot, A. Longinelli, R. Lorrain, V. Maggi, V. Masson-Delmotte, H. Miller, R. Mulvaney, J. Oerlemans, H. Oerter, G. Orombelli, F. Parrenin, D. A. Peel, J. R. Petit, D. Raynaud, C. Ritz, U. Ruth, J. Schwander, U. Siegenthaler, R. Souchez, B. Stauffer, J. P. Steffensen, B. Stenni, T. F. Stocker, I. E. Tabacco, R. Udisti, R. S. Van De Wal, M. Van Den Broeke, J. Weiss, F. Wilhelms, J. G. Winther, E. W. Wolff, M. Zucchelli, and EPICA Community Members, 2004: Eight glacial cycles from an Antarctic ice core. Nature, 429(6992), 623-628, doi: 10.1038/nature02599.
Bader, M. K., R. Siegwolf, and C. Korner, 2010: Sustained enhancement of photosynthesis in mature deciduous forest trees after 8 years of free air CO2 enrichment. Planta, 232(5), 1115-1125, doi: 10.1007/s00425-010-1240-8.
Ballantyne, A. P., C. B. Alden, J. B. Miller, P. P. Tans, and J. W. White, 2012: Increase in observed net carbon dioxide uptake by land and oceans during the past 50 years. Nature, 488(7409), 70-72, doi: 10.1038/nature11299.
Barton, A., G. Waldbusser, R. Feely, S. Weisberg, J. Newton, B. Hales, S. Cudd, B. Eudeline, C. Langdon, I. Jefferds, T. King, A. Suhrbier, and K. McLauglin, 2015: Impacts of coastal acidification on the Pacific Northwest shellfish industry and adaptation strate-gies implemented in response. Oceanography, 25(2), 146-159, doi: 10.5670/oceanog.2015.38.
Bates, N., Y. Astor, M. Church, K. Currie, J. Dore, M. González-Dávila, L. Lorenzoni, F. Muller-Karger, J. Olafsson, and M. San-ta-Casiano, 2014: A time-series view of changing ocean chemistry due to ocean uptake of anthropogenic CO2 and ocean acidification. Oceanography, 27(1), 126-141, doi: 10.5670/oceanog.2014.16.
Bednaršek, N., C. J. Harvey, I. C. Kaplan, R. A. Feely, and J. Možina, 2016: Pteropods on the edge: Cumulative effects of ocean acidification, warming, and deoxygenation. Progress in Oceanogra-phy, 145, 1-24, doi: 10.1016/j.pocean.2016.04.002.
Beerling, D. J., C. P. Osborne, and W. G. Chaloner, 2001: Evolu-tion of leaf-form in land plants linked to atmospheric CO2 decline in the Late Palaeozoic era. Nature, 410(6826), 352-354, doi: 10.1038/35066546.
Berner, R. A., 1992: Weathering, plants, and the long-term carbon cycle. Geochimica et Cosmochimica Acta, 56(8), 3225-3231, doi: 10.1016/0016-7037(92)90300-8.

Chapter 17 | Biogeochemical Effects of Rising Atmospheric Carbon Dioxide
717Second State of the Carbon Cycle Report (SOCCR2)November 2018
Berner, R. A., 1997: Geochemistry and geophysics: The rise of plants and their effect on weathering and atmospheric CO2. Science, 276(5312), 544-546, doi: 10.1126/science.276.5312.544.
Bijma, J., H. O. Portner, C. Yesson, and A. D. Rogers, 2013: Climate change and the oceans — What does the future hold? Marine Pollution Bulletin, 74(2), 495-505, doi: 10.1016/j.marpol-bul.2013.07.022.
Blackford, J. C., 2010: Predicting the impacts of ocean acidifica-tion: Challenges from an ecosystem perspective. Journal of Marine Systems, 81(1-2), 12-18, doi: 10.1016/j.jmarsys.2009.12.016.
Blok, D., M. M. P. D. Heijmans, G. Schaepman-Strub, A. V. Kononov, T. C. Maximov, and F. Berendse, 2010: Shrub expan-sion may reduce summer permafrost thaw in Siberian tundra. Global Change Biology, 16(4), 1296-1305, doi: 10.1111/j.1365-2486.2009.02110.x.
Blum, A., 2009: Effective use of water (EUW) and not water-use efficiency (WUE) is the target of crop yield improvement under drought stress. Field Crops Research, 112(2-3), 119-123, doi: 10.1016/j.fcr.2009.03.009.
Bopp, L., L. Resplandy, J. C. Orr, S. C. Doney, J. P. Dunne, M. Gehlen, P. Halloran, C. Heinze, T. Ilyina, R. Séférian, J. Tjiputra, and M. Vichi, 2013: Multiple stressors of ocean ecosystems in the 21st century: Projections with CMIP5 models. Biogeosciences Dis-cussions, 10(2), 3627-3676, doi: 10.5194/bgd-10-3627-2013.
Boyd, P. W., S. T. Lennartz, D. M. Glover, and S. C. Doney, 2014: Biological ramifications of climate-change-mediated oceanic multi-stressors. Nature Climate Change, 5(1), 71-79, doi: 10.1038/nclimate2441.
Brady, P. V., and S. A. Carroll, 1994: Direct effects of CO2 and tem-perature on silicate weathering: Possible implications for climate control. Geochimica et Cosmochimica Acta, 58(7), 1853-1856, doi: 10.1016/0016-7037(94)90543-6.
Breitbarth, E., R. J. Bellerby, C. C. Neill, M. V. Ardelan, M. Meyerhöfer, E. Zöllner, P. L. Croot, and U. Riebesell, 2010: Ocean acidification affects iron speciation during a coastal seawater meso-cosm experiment. Biogeosciences, 7(3), 1065-1073, doi: 10.5194/bg-7-1065-2010.
Breshears, D. D., O. B. Myers, C. W. Meyer, F. J. Barnes, C. B. Zou, C. D. Allen, N. G. McDowell, and W. T. Pockman, 2009: Tree die-off in response to global change-type drought: Mortality insights from a decade of plant water potential measurements. Frontiers in Ecology and the Environment, 7(4), 185-189, doi: 10.1890/080016.
Brown, M. E., J. M. Antle, P. Backlund, E. R. Carr, W. E. Easterling, M. K. Walsh, C. Ammann, W. Attavanich, C. B. Barrett, M. F. Belle-mare, V. Dancheck, C. Funk, K. Grace, J. S. I. Ingram, H. Jiang, H. Maletta, T. Mata, A. Murray, M. Ngugi, D. Ojima, B. O’Neill, and C. Tebaldi, 2015: Climate Change, Global Food Security, and the U.S. Food System. 146 pp. [http://www.usda.gov/oce/climate_change/FoodSecurity2015Assessment/FullAssessment.pdf]
Bunse, C., D. Lundin, C. M. G. Karlsson, M. Vila-Costa, J. Palovaara, N. Akram, L. Svensson, K. Holmfeldt, J. M. González, E. Calvo, C. Pelejero, C. Marrasé, M. Dopson, J. M. Gasol, and J. Pinhassi, 2016: Response of marine bacterioplankton pH homeo-stasis gene expression to elevated CO2. Nature Climate Change, 6, 483-487, doi: 10.1038/nclimate2914.
Busch, D. S., C. J. Harvey, and P. McElhany, 2013: Potential impacts of ocean acidification on the Puget Sound food web. ICES Journal of Marine Science, 70(4), 823-833, doi: 10.1093/icesjms/fst061.
Cai, W. J., 2011: Estuarine and coastal ocean carbon para-dox: CO2 sinks or sites of terrestrial carbon incineration? Annual Review of Marine Science, 3, 123-145, doi: 10.1146/annurev-marine-120709-142723.
Cai, W.-J., X. Hu, W.-J. Huang, M. C. Murrell, J. C. Lehrter, S. E. Lohrenz, W.-C. Chou, W. Zhai, J. T. Hollibaugh, Y. Wang, P. Zhao, X. Guo, K. Gundersen, M. Dai, and G.-C. Gong, 2011: Acidification of subsurface coastal waters enhanced by eutro-phication. Nature Geoscience, 4(11), 766-770, doi: 10.1038/ngeo1297.
Carey, C. C., and K. L. Cottingham, 2016: Cross-scale perspec-tives: Integrating long-term and high-frequency data into our understanding of communities and ecosystems. The Bulletin of the Ecological Society of America, 97(1), 129-132, doi: 10.1002/bes2.1205.
CCSP, 2007: First State of the Carbon Cycle Report (SOCCR): The North American Carbon Budget and Implications for the Global Carbon Cycle. A Report by the U.S. Climate Change Science Program and the Subcommittee on Global Change Research. [A. W. King, L. Dilling, G. P. Zimmerman, D. M. Fairman, R. A. Hough-ton, G. Marland, A. Z. Rose, and T. J. Wilbanks (eds.)]. National Oceanic and Atmospheric Administration, National Climatic Data Center, Asheville, NC, USA, 242 pp.
Challinor, A. J., J. Watson, D. B. Lobell, S. M. Howden, D. R. Smith, and N. Chhetri, 2014: A meta-analysis of crop yield under climate change and adaptation. Nature Climate Change, 4(4), 287-291, doi: 10.1038/nclimate2153.
Chambers, R. C., A. C. Candelmo, E. A. Habeck, M. E. Poach, D. Wieczorek, K. R. Cooper, C. E. Greenfield, and B. A. Phelan, 2014: Effects of elevated CO2 in the early life stages of summer floun-der, Paralichthys dentatus, and potential consequences of ocean acidification. Biogeosciences, 11(6), 1613-1626, doi: 10.5194/bg-11-1613-2014.
Charney, N. D., F. Babst, B. Poulter, S. Record, V. M. Trouet, D. Frank, B. J. Enquist, and M. E. Evans, 2016: Observed forest sensitivity to climate implies large changes in 21st century North American forest growth. Ecology Letters, 19(9), 1119-1128, doi: 10.1111/ele.12650.

Section IV | Consequences and Ways Forward
718 U.S. Global Change Research Program November 2018
Ciais, P., C. Sabine, G. Bala, L. Bopp, V. Brovkin, J. Canadell, A. Chhabra, R. DeFries, J. Galloway, M. Heimann, C. Jones, C. Le Quere, R. B. Myneni, S. Piao, and P. Thornton, 2013: Carbon and other biogeochemical cycles. In Climate Change 2013: The Physical Science Basis. Contribution of Working Group I to the Fifth Assessment Report of the Intergovernmental Panel on Climate Change. [T. F. Stocker, D. Qin, G.-K. Plattner, M. Tignor, S. K. Allen, J. Boschung, A. Nauels, Y. Xia, V. Bex and P. M. Midgley (eds.)]. Cambridge University Press, Cambridge, UK, and New York, NY, USA.
Ciais, P., A. J. Dolman, A. Bombelli, R. Duren, A. Peregon, P. J. Rayner, C. Miller, N. Gobron, G. Kinderman, G. Marland, N. Gru-ber, F. Chevallier, R. J. Andres, G. Balsamo, L. Bopp, F. M. Bréon, G. Broquet, R. Dargaville, T. J. Battin, A. Borges, H. Bovensmann, M. Buchwitz, J. Butler, J. G. Canadell, R. B. Cook, R. DeFries, R. Engelen, K. R. Gurney, C. Heinze, M. Heimann, A. Held, M. Henry, B. Law, S. Luyssaert, J. Miller, T. Moriyama, C. Moulin, R. B. Myneni, C. Nussli, M. Obersteiner, D. Ojima, Y. Pan, J. D. Paris, S. L. Piao, B. Poulter, S. Plummer, S. Quegan, P. Raymond, M. Reichstein, L. Rivier, C. Sabine, D. Schimel, O. Tarasova, R. Val-entini, R. Wang, G. van der Werf, D. Wickland, M. Williams, and C. Zehner, 2014: Current systematic carbon-cycle observations and the need for implementing a policy-relevant carbon observing system. Biogeosciences, 11(13), 3547-3602, doi: 10.5194/bg-11-3547-2014.
Clow, D. W., and M. A. Mast, 2010: Mechanisms for chemostatic behavior in catchments: Implications for CO2 consumption by mineral weathering. Chemical Geology, 269(1-2), 40-51, doi: 10.1016/j.chemgeo.2009.09.014.
Clow, D. W., L. Nanus, and B. Huggett, 2010: Use of regression-based models to map sensitivity of aquatic resources to atmospheric depo-sition in Yosemite National Park, USA. Water Resources Research, 46(9), doi: 10.1029/2009wr008316.
Colbourn, G., A. Ridgwell, and T. M. Lenton, 2015: The time scale of the silicate weathering negative feedback on atmo-spheric CO2. Global Biogeochemical Cycles, 29(5), 583-596, doi: 10.1002/2014gb005054.
Cole, C. T., J. E. Anderson, R. L. Lindroth, and D. M. Waller, 2009: Rising concentrations of atmospheric CO2 have increased growth in natural stands of quaking Aspen (Populus tremuloides). Global Change Biology, 16(8), 2186-2197, doi: 10.1111/j.1365-2486.2009.02103.x.
Collins, M., R. Knutti, J. Arblaster, J.-L. Dufresne, T. Fichefet, P. Friedlingstein, X. Gao, W. J. Gutowski, T. Johns, G. Krinner, M. Shongwe, C. Tebaldi, A. J. Weaver and M. Wehner, 2013: Long-term climate change: Projections, commitments and irreversibility. In: Climate Change 2013: The Physical Science Basis. Contribution of Working Group I to the Fifth Assessment Report of the Intergovernmen-tal Panel on Climate Change. [T. F. Stocker, D. Qin, G. K. Plattner, M. Tignor, S. K. Allen, J. Boschung, A. Nauels, Y. Xia, V. Bex and P. M. Midgley (eds.)]. Cambridge University Press, Cambridge, UK, and New York, NY, USA, 1029-1136 pp.
Cooley, S. R., J. E. Rheuban, D. R. Hart, V. Luu, D. M. Glover, J. A. Hare, and S. C. Doney, 2015: An integrated assessment model for helping the United States sea scallop (Placopecten magellanicus) fishery plan ahead for ocean acidification and warming. PLOS One, 10(5), e0124145, doi: 10.1371/journal.pone.0124145.
Dawes, M. A., S. Hättenschwiler, P. Bebi, F. Hagedorn, I. T. Handa, C. Körner, and C. Rixen, 2011: Species-specific tree growth responses to 9 years of CO2 enrichment at the alpine treeline. Journal of Ecology, 99(2), 383–394, doi: 10.1111/j.1365-2745.2010.01764.x.
DeConto, R. M., and D. Pollard, 2003: Rapid Cenozoic glaciation of Antarctica induced by declining atmospheric CO2. Nature, 421(6920), 245-249, doi: 10.1038/nature01290.
DeLucia, E. H., D. J. Moore, and R. J. Norby, 2005: Contrasting responses of forest ecosystems to rising atmospheric CO2: Impli-cations for the global C cycle. Global Biogeochemical Cycles, 19(3), doi: 10.1029/2004gb002346.
DeLucia, E. H., P. D. Nabity, J. A. Zavala, and M. R. Berenbaum, 2012: Climate change: Resetting plant-insect interactions. Plant Physiology, 160(4), 1677-1685, doi: 10.1104/pp.112.204750.
Dermody, O., B. F. O’Neill, A. R. Zangerl, M. R. Berenbaum, and E. H. DeLucia, 2008: Effects of elevated CO2 and O3 on leaf damage and insect abundance in a soybean agroecosystem. Arthropod-Plant Interactions, 2(3), 125-135, doi: 10.1007/s11829-008-9045-4.
Deryng, D., J. Elliott, C. Folberth, C. Müller, T. A. M. Pugh, K. J. Boote, D. Conway, A. C. Ruane, D. Gerten, J. W. Jones, N. Khabarov, S. Olin, S. Schaphoff, E. Schmid, H. Yang, and C. Rosenzweig, 2016: Regional disparities in the beneficial effects of rising CO2 concentrations on crop water productivity. Nature Climate Change, 6(8), 786-790, doi: 10.1038/nclimate2995.
Diaz, R. J., and R. Rosenberg, 2008: Spreading dead zones and consequences for marine ecosystems. Science, 321(5891), 926-929, doi: 10.1126/science.1156401.
Dieleman, W. I., S. Vicca, F. A. Dijkstra, F. Hagedorn, M. J. Hovenden, K. S. Larsen, J. A. Morgan, A. Volder, C. Beier, J. S. Dukes, J. King, S. Leuzinger, S. Linder, Y. Luo, R. Oren, P. De Ange-lis, D. Tingey, M. R. Hoosbeek, and I. A. Janssens, 2012: Simple additive effects are rare: A quantitative review of plant biomass and soil process responses to combined manipulations of CO2 and temperature. Global Change Biology, 18(9), 2681-2693, doi: 10.1111/j.1365-2486.2012.02745.x.
Dixson, D. L., A. R. Jennings, J. Atema, and P. L. Munday, 2014: Odor tracking in sharks is reduced under future ocean acidifica-tion conditions. Global Change Biology, 21(4), 1454-1462, doi: 10.1111/gcb.12678.

Chapter 17 | Biogeochemical Effects of Rising Atmospheric Carbon Dioxide
719Second State of the Carbon Cycle Report (SOCCR2)November 2018
Dixson, D. L., P. L. Munday, and G. P. Jones, 2010: Ocean acidification disrupts the innate ability of fish to detect predator olfactory cues. Ecology Letters, 13(1), 68-75, doi: 10.1111/j.1461-0248.2009.01400.x.
Doney, S. C., 2010: The growing human footprint on coastal and open-ocean biogeochemistry. Science, 328(5985), 1512-1516, doi: 10.1126/science.1185198.
Doney, S. C., and D. S. Schimel, 2007: Carbon and climate system coupling on timescales from the Precambrian to the Anthropo-cene. Annual Review of Environment and Resources, 32(1), 31-66, doi: 10.1146/annurev.energy.32.041706.124700.
Doney, S. C., L. Bopp, and M. C. Long, 2014: Historical and future trends in ocean climate and biogeochemistry. Oceanography, 27(1), 108-119, doi: 10.5670/oceanog.2014.14.
Doney, S., W. Balch, V. Fabry, and R. Feely, 2009: Ocean acidifica-tion: A critical emerging problem for the ocean sciences. Oceanog-raphy, 22(4), 16-25, doi: 10.5670/oceanog.2009.93.
Dore, J. E., R. Lukas, D. W. Sadler, M. J. Church, and D. M. Karl, 2009: Physical and biogeochemical modulation of ocean acidi-fication in the central North Pacific. Proceedings of the National Academy of Sciences USA, 106(30), 12235-12240, doi: 10.1073/pnas.0906044106.
Drake, J. E., A. Gallet-Budynek, K. S. Hofmockel, E. S. Bern-hardt, S. A. Billings, R. B. Jackson, K. S. Johnsen, J. Lichter, H. R. McCarthy, M. L. McCormack, D. J. Moore, R. Oren, S. Palmroth, R. P. Phillips, J. S. Pippen, S. G. Pritchard, K. K. Treseder, W. H. Schlesinger, E. H. Delucia, and A. C. Finzi, 2011: Increases in the flux of carbon belowground stimulate nitrogen uptake and sustain the long-term enhancement of forest productivity under elevated CO2. Ecology Letters, 14(4), 349-357, doi: 10.1111/j.1461-0248.2011.01593.x.
Duan, H. L., R. A. Duursma, G. M. Huang, R. A. Smith, B. Choat, A. P. O’Grady, and D. T. Tissue, 2014: Elevated CO2 does not ameliorate the negative effects of elevated temperature on drought-induced mortality in Eucalyptus radiata seedlings. Plant Cell and Environment, 37(7), 1598-1613, doi: 10.1111/pce.12260.
Duarte, C. M., I. E. Hendriks, T. S. Moore, Y. S. Olsen, A. Steck-bauer, L. Ramajo, J. Carstensen, J. A. Trotter, and M. McCulloch, 2013: Is ocean acidification an open-ocean syndrome? Under-standing anthropogenic impacts on seawater pH. Estuaries and Coasts, 36(2), 221-236, doi: 10.1007/s12237-013-9594-3.
Dupont, S., E. Hall, P. Calosi, and B. Lundve, 2014: First evidence of altered sensory quality in a shellfish exposed to decreased pH relevant to ocean acidification. Journal of Shellfish Research, 33(3), 857-861, doi: 10.2983/035.033.0320.
Dupont, S., N. Dorey, and M. Thorndyke, 2010: What meta-analysis can tell us about vulnerability of marine biodiversity to ocean acid-ification? Estuarine, Coastal and Shelf Science, 89(2), 182-185, doi: 10.1016/j.ecss.2010.06.013.
Dutkiewicz, S., J. J. Morris, M. J. Follows, J. Scott, O. Levitan, S. T. Dyhrman, and I. Berman-Frank, 2015: Impact of ocean acidifica-tion on the structure of future phytoplankton communities. Nature Climate Change, 5(11), 1002-1006, doi: 10.1038/nclimate2722.
Ehlers, I., A. Augusti, T. R. Betson, M. B. Nilsson, J. D. Marshall, and J. Schleucher, 2015: Detecting long-term metabolic shifts using isotopomers: CO2-driven suppression of photorespiration in C3 plants over the 20th century. Proceedings of the National Academy of Sciences USA, 112(51), 15585-15590, doi: 10.1073/pnas.1504493112.
Elberling, B., A. Michelsen, C. Schädel, E. A. G. Schuur, H. H. Christiansen, L. Berg, M. P. Tamstorf, and C. Sigsgaard, 2013: Long-term CO2 production following permafrost thaw. Nature Climate Change, 3(10), 890-894, doi: 10.1038/nclimate1955.
Elmendorf, S. C., K. D. Jones, B. I. Cook, J. M. Diez, C. A. F. Enquist, R. A. Hufft, M. O. Jones, S. J. Mazer, A. J. Miller-Rushing, D. J. P. Moore, M. D. Schwartz, J. F. Weltzin, and E. L. Hinckley, 2016: The plant phenology monitoring design for The National Ecological Observatory Network. Ecosphere, 7(4), doi: 10.1002/ecs2.1303.
Erb, K.-H., T. Kastner, S. Luyssaert, R. A. Houghton, T. Kuemmerle, P. Olofsson, and H. Haberl, 2013: Bias in the attribution of forest carbon sinks. Nature Climate Change, 3(10), 854-856, doi: 10.1038/nclimate2004.
Fabricius, K. E., C. Langdon, S. Uthicke, C. Humphrey, S. Noonan, G. De’ath, R. Okazaki, N. Muehllehner, M. S. Glas, and J. M. Lough, 2011: Losers and winners in coral reefs acclimatized to elevated carbon dioxide concentrations. Nature Climate Change, 1(3), 165-169, doi: 10.1038/nclimate1122.
Farquhar, G. D., S. von Caemmerer, and J. A. Berry, 1980: A bio-chemical model of photosynthetic CO2 assimilation in leaves of C3 species. Planta, 149(1), 78-90, doi: 10.1007/BF00386231.
Fay, G., J. S. Link, and J. A. Hare, 2017: Assessing the effects of ocean acidification in the northeast U.S. using an end-to-end marine ecosystem model. Ecological Modelling, 347, 1-10, doi: 10.1016/j.ecolmodel.2016.12.016.
Feely, R. A., C. L. Sabine, J. M. Hernandez-Ayon, D. Ianson, and B. Hales, 2008: Evidence for upwelling of corrosive “acidified” water onto the continental shelf. Science, 320(5882), 1490-1492, doi: 10.1126/science.1155676.
Feely, R. A., C. L. Sabine, K. Lee, W. Berelson, J. Kleypas, V. J. Fabry, and F. J. Millero, 2004: Impact of anthropogenic CO2 on the CaCO3 system in the oceans. Science, 305(5682), 362-366, doi: 10.1126/science.1097329.
Feely, R. A., S. C. Doney, and S. R. Cooley, 2009: Ocean acidifica-tion: Present conditions and future changes in a high-CO2 world. Oceanography, 22(4), 36-47, doi: 10.5670/oceanog.2009.95.

Section IV | Consequences and Ways Forward
720 U.S. Global Change Research Program November 2018
Feely, R. A., S. R. Alin, B. Carter, N. Bednaršek, B. Hales, F. Chan, T. M. Hill, B. Gaylord, E. Sanford, R. H. Byrne, C. L. Sabine, D. Greeley, and L. Juranek, 2016: Chemical and biological impacts of ocean acidification along the west coast of North America. Estuarine, Coastal and Shelf Science, 183, 260-270, doi: 10.1016/j.ecss.2016.08.043.
Ferrario, F., M. W. Beck, C. D. Storlazzi, F. Micheli, C. C. Shepard, and L. Airoldi, 2014: The effectiveness of coral reefs for coastal hazard risk reduction and adaptation. Nature Communicatons, 5, 3794, doi: 10.1038/ncomms4794.
Ficklin, D. L., and K. A. Novick, 2017: Historic and projected changes in vapor pressure deficit suggest a continental-scale drying of the United States atmosphere. Journal of Geophysical Research: Atmospheres, 122(4), 2061-2079, doi: 10.1002/2016jd025855.
Finzi, A. C., D. J. P. Moore, E. H. DeLucia, J. Lichter, K. S. Hofmockel, R. B. Jackson, H.-S. Kim, R. Matamala, H. R. McCarthy, R. Oren, J. S. Pippen, and W. H. Schlesinger, 2006: Progressive nitrogen limitation of ecosystem processes under elevated CO2 in a warm-temperate forest. Ecology, 87(1), 15-25, doi: 10.1890/04-1748.
Fraile, I., H. Arrizabalaga, J. Groeneveld, M. Kölling, M. N. Santos, D. Macías, P. Addis, D. L. Dettman, S. Karakulak, S. Deguara, and J. R. Rooker, 2016: The imprint of anthropogenic CO2 emissions on Atlantic bluefin tuna otoliths. Journal of Marine Systems, 158, 26-33, doi: 10.1016/j.jmarsys.2015.12.012.
Friedlingstein, P., P. Cox, R. Betts, L. Bopp, W. von Bloh, V. Brovkin, P. Cadule, S. Doney, M. Eby, I. Fung, G. Bala, J. John, C. Jones, F. Joos, T. Kato, M. Kawamiya, W. Knorr, K. Lindsay, H. D. Matthews, T. Raddatz, P. Rayner, C. Reick, E. Roeckner, K. G. Schnitzler, R. Schnur, K. Strassmann, A. J. Weaver, C. Yoshikawa, and N. Zeng, 2006: Climate–carbon cycle feedback analysis: Results from the C4MIP model intercomparison. Journal of Cli-mate, 19(14), 3337-3353, doi: 10.1175/jcli3800.1.
Friedrich, T., A. Timmermann, A. Abe-Ouchi, N. R. Bates, M. O. Chikamoto, M. J. Church, J. E. Dore, D. K. Gledhill, M. Gonzalez-Davila, M. Heinemann, T. Ilyina, J. H. Jungclaus, E. McLeod, A. Mouchet, and J. M. Santana-Casiano, 2012: Detecting regional anthropogenic trends in ocean acidification against natural variability. Nature Climate Change, 2(3), 167-171, doi: 10.1038/Nclimate1372.
Frommel, A. Y., D. Margulies, J. B. Wexler, M. S. Stein, V. P. Scholey, J. E. Williamson, D. Bromhead, S. Nicol, and J. Havenhand, 2016: Ocean acidification has lethal and sub-lethal effects on larval development of yellowfin tuna, Thunnus albacares. Journal of Exper-imental Marine Biology and Ecology, 482, 18-24, doi: 10.1016/j.jembe.2016.04.008.
Fu, F. X., A. O. Tatters, and D. A. Hutchins, 2012: Global change and the future of harmful algal blooms in the ocean. Marine Ecology Progress Series, 470, 207-233, doi: 10.3354/meps10047.
Fu, F.-X., M. E. Warner, Y. Zhang, Y. Feng, and D. A. Hutchins, 2007: Effects of increased temperature and CO2 on photosyn-thesis, growth, and elemental ratios in marine Synechococcus and Prochlorococcus (cyanobacteria). Journal of Phycology, 43(3), 485-496, doi: 10.1111/j.1529-8817.2007.00355.x.
Galloway, J. N., W. H. Schlesinger, C. M. Clark, N. B. Grimm, R. B. Jackson, B. E. Law, P. E. Thornton, A. R. Townsend, and R. Martin, 2014: Biogeochemical cycles. In: Climate Change Impacts in the United States: the Third National Climate Assessment. [ J. M. Melillo, T. T. C. Richmond, and G. W. Yohe (eds.)]. U.S. Global Change Research Program, 350-368 pp.
Gattuso, J. P., A. Magnan, R. Bille, W. W. Cheung, E. L. Howes, F. Joos, D. Allemand, L. Bopp, S. R. Cooley, C. M. Eakin, O. Hoegh-Guldberg, R. P. Kelly, H. O. Portner, A. D. Rogers, J. M. Baxter, D. Laffoley, D. Osborn, A. Rankovic, J. Rochette, U. R. Sumaila, S. Treyer, and C. Turley, 2015: Contrasting futures for ocean and society from different anthropogenic CO2 emissions sce-narios. Science, 349(6243), aac4722, doi: 10.1126/science.aac4722.
Global Change Research Act, 1990. [https://www.congress.gov/bill/101st-congress/senate-bill/169/text]
Gray, S. B., O. Dermody, S. P. Klein, A. M. Locke, J. M. McGrath, R. E. Paul, D. M. Rosenthal, U. M. Ruiz-Vera, M. H. Siebers, R. Strell-ner, E. A. Ainsworth, C. J. Bernacchi, S. P. Long, D. R. Ort, and A. D. Leakey, 2016: Intensifying drought eliminates the expected benefits of elevated carbon dioxide for soybean. Nature Plants, 2(9), 16132, doi: 10.1038/nplants.2016.132.
Hall-Spencer, J. M., R. Rodolfo-Metalpa, S. Martin, E. Ransome, M. Fine, S. M. Turner, S. J. Rowley, D. Tedesco, and M. C. Buia, 2008: Volcanic carbon dioxide vents show ecosystem effects of ocean acidification. Nature, 454(7200), 96-99, doi: 10.1038/nature07051.
Hamilton, T. J., A. Holcombe, and M. Tresguerres, 2014: CO2-induced ocean acidification increases anxiety in rockfish via alteration of GABAA receptor functioning. Proceedings of the Royal Society B: Biological Sciences, 281(1775), 20132509, doi: 10.1098/rspb.2013.2509.
Harvey, B. P., D. Gwynn-Jones, and P. J. Moore, 2013: Meta-analysis reveals complex marine biological responses to the interactive effects of ocean acidification and warming. Ecology and Evolution, 3(4), 1016-1030, doi: 10.1002/ece3.516.
Hasler, C. T., D. Butman, J. D. Jeffrey, and C. D. Suski, 2015: Fresh-water biota and rising pCO2? Ecology Letters, 19(1), 98-108, doi: 10.1111/ele.12549.
Hendriks, I. E., and C. M. Duarte, 2010: Ocean acidification: Separating evidence from judgment – A reply to Dupont et al. Estuarine, Coastal and Shelf Science, 89(2), 186-190, doi: 10.1016/j.ecss.2010.06.007.

Chapter 17 | Biogeochemical Effects of Rising Atmospheric Carbon Dioxide
721Second State of the Carbon Cycle Report (SOCCR2)November 2018
Hendriks, I. E., C. M. Duarte, and M. Álvarez, 2010: Vulnerability of marine biodiversity to ocean acidification: A meta-analysis. Estuarine, Coastal and Shelf Science, 86(2), 157-164, doi: 10.1016/j.ecss.2009.11.022.
Hendriks, I. E., Y. S. Olsen, L. Ramajo, L. Basso, A. Steckbauer, T. S. Moore, J. Howard, and C. M. Duarte, 2014: Photosynthetic activity buffers ocean acidification in seagrass meadows. Biogeosciences, 11(2), 333-346, doi: 10.5194/bg-11-333-2014.
Hickler, T., B. Smith, I. C. Prentice, K. MjöFors, P. Miller, A. Arneth, and M. T. Sykes, 2008: CO2 fertilization in temperate FACE experiments not representative of boreal and tropical forests. Global Change Biology, 14(7), 1531-1542, doi: 10.1111/j.1365-2486.2008.01598.x.
Hilton, G. M., D. R. Thompson, P. M. Sagar, R. J. Cuthbert, Y. Cherel, and S. J. Bury, 2006: A stable isotopic investigation into the causes of decline in a sub-Antarctic predator, the rockhopper pen-guin Eudyptes chrysocome. Global Change Biology, 12(4), 611-625, doi: 10.1111/j.1365-2486.2006.01130.x.
HLPE, 2014: Sustainable Fisheries and Aquaculture for Food Secu-rity and Nutrition. A Report by the High Level Panel of Experts on Food Security and Nutrition of the Committee on World Food Security. United Nations Food and Agriculture Organization. [http://www.fao.org/3/a-i3844e.pdf]
Hodgkins, S. B., M. M. Tfaily, C. K. McCalley, T. A. Logan, P. M. Crill, S. R. Saleska, V. I. Rich, and J. P. Chanton, 2014: Changes in peat chemistry associated with permafrost thaw increase greenhouse gas production. Proceedings of the National Academy of Sciences USA, 111(16), 5819-5824, doi: 10.1073/pnas.1314641111.
Hoegh-Guldberg, O., P. J. Mumby, A. J. Hooten, R. S. Steneck, P. Greenfield, E. Gomez, C. D. Harvell, P. F. Sale, A. J. Edwards, K. Caldeira, N. Knowlton, C. M. Eakin, R. Iglesias-Prieto, N. Muthiga, R. H. Bradbury, A. Dubi, and M. E. Hatziolos, 2007: Coral reefs under rapid climate change and ocean acidification. Science, 318(5857), 1737-1742, doi: 10.1126/science.1152509.
Hofmann, G. E., J. P. Barry, P. J. Edmunds, R. D. Gates, D. A. Hutchins, T. Klinger, and M. A. Sewell, 2010: The effect of ocean acidification on calcifying organisms in marine ecosystems: An organism-to-ecosystem perspective. Annual Review of Ecology, Evolution, and Systematics, 41(1), 127-147, doi: 10.1146/annurev.ecolsys.110308.120227.
Holding, J. M., C. M. Duarte, M. Sanz-Martín, E. Mesa, J. M. Arrieta, M. Chierici, I. E. Hendriks, L. S. García-Corral, A. Regaudie-de-Gioux, A. Delgado, M. Reigstad, P. Wassmann, and S. Agustí, 2015: Temperature dependence of CO2-enhanced primary production in the European Arctic Ocean. Nature Climate Change, 5(12), 1079-1082, doi: 10.1038/nclimate2768.
Hönisch, B., A. Ridgwell, D. N. Schmidt, E. Thomas, S. J. Gibbs, A. Sluijs, R. Zeebe, L. Kump, R. C. Martindale, S. E. Greene, W. Kiessling, J. Ries, J. C. Zachos, D. L. Royer, S. Barker, T. M. Marchitto, R. Moyer, C. Pelejero, P. Ziveri, G. L. Foster, and B. Williams, 2012: The geological record of ocean acidification. Science, 335(6072), 1058, doi: 10.1126/science.1208277.
Hoosbeek, M. R., J. M. Vos, M. B. J. Meinders, E. J. Velthorst, and G. E. Scarascia-Mugnozza, 2007: Free atmospheric CO2 enrichment (FACE) increased respiration and humification in the mineral soil of a poplar plantation. Geoderma, 138(3-4), 204-212, doi: 10.1016/j.geoderma.2006.11.008.
Hughes, T. P., J. T. Kerry, M. Alvarez-Noriega, J. G. Alvarez-Romero, K. D. Anderson, A. H. Baird, R. C. Babcock, M. Beger, D. R. Bellwood, R. Berkelmans, T. C. Bridge, I. R. Butler, M. Byrne, N. E. Cantin, S. Comeau, S. R. Connolly, G. S. Cumming, S. J. Dalton, G. Diaz-Pulido, C. M. Eakin, W. F. Figueira, J. P. Gilmour, H. B. Harrison, S. F. Heron, A. S. Hoey, J. A. Hobbs, M. O. Hoogenboom, E. V. Kennedy, C. Y. Kuo, J. M. Lough, R. J. Lowe, G. Liu, M. T. McCulloch, H. A. Malcolm, M. J. McWilliam, J. M. Pandolfi, R. J. Pears, M. S. Pratchett, V. Schoepf, T. Simpson, W. J. Skirving, B. Sommer, G. Torda, D. R. Wachenfeld, B. L. Willis, and S. K. Wilson, 2017: Global warming and recurrent mass bleaching of corals. Nature, 543(7645), 373-377, doi: 10.1038/nature21707.
Hughes, T. P., K. D. Anderson, S. R. Connolly, S. F. Heron, J. T. Kerry, J. M. Lough, A. H. Baird, J. K. Baum, M. L. Berumen, T. C. Bridge, D. C. Claar, C. M. Eakin, J. P. Gilmour, N. A. J. Graham, H. Harrison, J. A. Hobbs, A. S. Hoey, M. Hoogenboom, R. J. Lowe, M. T. McCulloch, J. M. Pandolfi, M. Pratchett, V. Schoepf, G. Torda, and S. K. Wilson, 2018: Spatial and temporal patterns of mass bleaching of corals in the Anthropocene. Science, 359(6371), 80-83, doi: 10.1126/science.aan8048.
Hutchins, D. A., F.-X. Fu, E. A. Webb, N. Walworth, and A. Tagli-abue, 2013: Taxon-specific response of marine nitrogen fixers to elevated carbon dioxide concentrations. Nature Geoscience, 6(9), 790-795, doi: 10.1038/ngeo1858.
IPCC, 2013: Climate Change 2013: The Physical Science Basis. Contribution of Working Group I to the Fifth Assessment Report of the Intergovernmental Panel on Climate Change. [T. F. Stocker, D. Qin, G. K. Plattner, M. Tignor, S. K. Allen, J. Boschung, A. Nauels, Y. Xia, V. Bex and P. M. Midgley (eds.)]. Cambridge University Press, Cambridge, UK, and New York, NY, USA, 1535 pp.
Jackson, R. B., C. W. Cook, J. S. Pippen, and S. M. Palmer, 2009: Increased belowground biomass and soil CO2 fluxes after a decade of carbon dioxide enrichment in a warm-temperate forest. Ecology, 90(12), 3352-3366, doi: 10.1890/08-1609.1.
Johnson, Z. I., B. J. Wheeler, S. K. Blinebry, C. M. Carlson, C. S. Ward, and D. E. Hunt, 2013: Dramatic variability of the carbonate system at a temperate coastal ocean site (Beaufort, North Carolina, USA) is regulated by physical and biogeochemical processes on multiple timescales. PLOS One, 8(12), e85117, doi: 10.1371/journal.pone.0085117.

Section IV | Consequences and Ways Forward
722 U.S. Global Change Research Program November 2018
Jordan, D. B., and W. L. Ogren, 1984: The CO2/O2 specificity of ribulose 1,5-bisphosphate carboxylase/oxygenase. Planta, 161(4), 308-313, doi: 10.1007/bf00398720.
Kaplan, I. C., P. S. Levin, M. Burden, and E. A. Fulton, 2010: Fishing catch shares in the face of global change: A framework for integrating cumulative impacts and single species management. Canadian Journal of Fisheries and Aquatic Sciences, 67(12), 1968-1982, doi: 10.1139/f10-118.
Keeling, C. D., 1979: The Suess effect: 13Carbon-14Carbon interrelations. Environment International, 2(4-6), 229-300, doi: 10.1016/0160-4120(79)90005-9.
Keenan, T. F., D. Y. Hollinger, G. Bohrer, D. Dragoni, J. W. Munger, H. P. Schmid, and A. D. Richardson, 2013: Increase in forest water-use efficiency as atmospheric carbon dioxide concentrations rise. Nature, 499(7458), 324-327, doi: 10.1038/nature12291.
Kelly, R. P., M. M. Foley, W. S. Fisher, R. A. Feely, B. S. Halpern, G. G. Waldbusser, and M. R. Caldwell, 2011: Mitigating local causes of ocean acidification with existing laws. Science, 332(6033), 1036-1037, doi: 10.1126/science.1203815.
Knapp, P. A., and P. T. Soulé, 2011: Increasing water-use efficiency and age-specific growth responses of old-growth ponderosa pine trees in the northern Rockies. Global Change Biology, 17(1), 631-641, doi: 10.1111/j.1365-2486.2010.02209.x.
Körner, C., 2015: Paradigm shift in plant growth control. Current Opinion in Plant Biology, 25, 107-114, doi: 10.1016/j.pbi.2015.05.003.
Körner, C., R. Asshoff, O. Bignucolo, S. Hättenschwiler, S. G. Keel, S. Peláez-Riedl, S. Pepin, R. T. Siegwolf, and G. Zotz, 2005: Carbon flux and growth in mature deciduous forest trees exposed to elevated CO2. Science, 309(5739), 1360-1362, doi: 10.1126/science.1113977.
Koutavas, A., 2013: CO2 fertilization and enhanced drought resis-tance in Greek firs from Cephalonia Island, Greece. Global Change Biology, 19(2), 529-539, doi: 10.1111/gcb.12053.
Kroeker, K. J., F. Micheli, M. C. Gambi, and T. R. Martz, 2011: Divergent ecosystem responses within a benthic marine com-munity to ocean acidification. Proceedings of the National Acad-emy of Sciences USA, 108(35), 14515-14520, doi: 10.1073/pnas.1107789108.
Kroeker, K. J., R. L. Kordas, R. Crim, I. E. Hendriks, L. Ramajo, G. S. Singh, C. M. Duarte, and J. P. Gattuso, 2013: Impacts of ocean acidification on marine organisms: Quantifying sensitivities and interaction with warming. Global Change Biology, 19(6), 1884-1896, doi: 10.1111/gcb.12179.
Kump, L. R., S. L. Brantley, and M. A. Arthur, 2000: Chemical weathering, atmospheric CO2, and climate. Annual Review of Earth and Planetary Sciences, 28(1), 611-667, doi: 10.1146/annurev.earth.28.1.611.
LaDeau, S. L., and J. S. Clark, 2001: Rising CO2 levels and the fecundity of forest trees. Science, 292(5514), 95-98, doi: 10.1126/science.1057547.
LaDeau, S. L., and J. S. Clark, 2006: Elevated CO2 and tree fecun-dity: The role of tree size, interannual variability, and population heterogeneity. Global Change Biology, 12(5), 822-833, doi: 10.1111/j.1365-2486.2006.01137.x.
Lagomarsino, A., M. Lukac, D. L. Godbold, S. Marinari, and P. De Angelis, 2013: Drivers of increased soil respiration in a poplar coppice exposed to elevated CO2. Plant and Soil, 362(1-2), 93-106, doi: 10.1007/s11104-012-1261-0.
Lal, R., 2003: Offsetting global CO2 emissions by restoration of degraded soils and intensification of world agriculture and forestry. Land Degradation and Development, 14(3), 309-322, doi: 10.1002/ldr.562.
Le Quéré, C., R. M. Andrew, J. G. Canadell, S. Sitch, J. I. Kors-bakken, G. P. Peters, A. C. Manning, T. A. Boden, P. P. Tans, R. A. Houghton, R. F. Keeling, S. Alin, O. D. Andrews, P. Anthoni, L. Barbero, L. Bopp, F. Chevallier, L. P. Chini, P. Ciais, K. Currie, C. Delire, S. C. Doney, P. Friedlingstein, T. Gkritzalis, I. Harris, J. Hauck, V. Haverd, M. Hoppema, K. Klein Goldewijk, A. K. Jain, E. Kato, A. Körtzinger, P. Landschützer, N. Lefèvre, A. Lenton, S. Lienert, D. Lombardozzi, J. R. Melton, N. Metzl, F. Millero, P. M. S. Monteiro, D. R. Munro, J. E. M. S. Nabel, S.-i. Nakaoka, amp, apos, K. Brien, A. Olsen, A. M. Omar, T. Ono, D. Pierrot, B. Poulter, C. Rödenbeck, J. Salisbury, U. Schuster, J. Schwinger, R. Séférian, I. Skjelvan, B. D. Stocker, A. J. Sutton, T. Takahashi, H. Tian, B. Til-brook, I. T. van der Laan-Luijkx, G. R. van der Werf, N. Viovy, A. P. Walker, A. J. Wiltshire, and S. Zaehle, 2016: Global carbon budget 2016. Earth System Science Data, 8(2), 605-649, doi: 10.5194/essd-8-605-2016.
Le Quéré, C., R. Moriarty, R. M. Andrew, J. G. Canadell, S. Sitch, J. I. Korsbakken, P. Friedlingstein, G. P. Peters, R. J. Andres, T. A. Boden, R. A. Houghton, J. I. House, R. F. Keeling, P. Tans, A. Arneth, D. C. E. Bakker, L. Barbero, L. Bopp, J. Chang, F. Che-vallier, L. P. Chini, P. Ciais, M. Fader, R. A. Feely, T. Gkritzalis, I. Harris, J. Hauck, T. Ilyina, A. K. Jain, E. Kato, V. Kitidis, K. Klein Goldewijk, C. Koven, P. Landschützer, S. K. Lauvset, N. Lefèvre, A. Lenton, I. D. Lima, N. Metzl, F. Millero, D. R. Munro, A. Murata, J. E. M. S. Nabel, S. Nakaoka, Y. Nojiri, K. O’Brien, A. Olsen, T. Ono, F. F. Pérez, B. Pfeil, D. Pierrot, B. Poulter, G. Rehder, C. Röden-beck, S. Saito, U. Schuster, J. Schwinger, R. Séférian, T. Steinhoff, B. D. Stocker, A. J. Sutton, T. Takahashi, B. Tilbrook, I. T. van der Laan-Luijkx, G. R. van der Werf, S. van Heuven, D. Vandemark, N. Viovy, A. Wiltshire, S. Zaehle, and N. Zeng, 2015: Global carbon budget 2015. Earth System Science Data, 7(2), 349-396, doi: 10.5194/essd-7-349-2015.
Leakey, A. D., E. A. Ainsworth, C. J. Bernacchi, A. Rogers, S. P. Long, and D. R. Ort, 2009: Elevated CO2 effects on plant carbon, nitrogen, and water relations: Six important lessons from FACE. Journal of Experimental Botany, 60(10), 2859-2876, doi: 10.1093/jxb/erp096.

Chapter 17 | Biogeochemical Effects of Rising Atmospheric Carbon Dioxide
723Second State of the Carbon Cycle Report (SOCCR2)November 2018
Leuzinger, S., and S. Hattenschwiler, 2013: Beyond global change: Lessons from 25 years of CO2 research. Oecologia, 171(3), 639-651, doi: 10.1007/s00442-012-2584-5.
Leuzinger, S., Y. Luo, C. Beier, W. Dieleman, S. Vicca, and C. Körner, 2011: Do global change experiments overestimate impacts on terrestrial ecosystems? Trends in Ecology and Evolution, 26(5), 236-241, doi: 10.1016/j.tree.2011.02.011.
Lichter, M., and D. Felsenstein, 2012: Assessing the costs of sea-level rise and extreme flooding at the local level: A GIS-based approach. Ocean and Coastal Management, 59, 47-62, doi: 10.1016/j.ocecoaman.2011.12.020.
Long, S. P., 1991: Modification of the response of photosynthetic pro-ductivity to rising temperature by atmospheric CO2 concentrations: Has its importance been underestimated? Plant, Cell and Environment, 14(8), 729-739, doi: 10.1111/j.1365-3040.1991.tb01439.x.
Long, W. C., K. M. Swiney, and R. J. Foy, 2013a: Effects of ocean acidification on the embryos and larvae of red king crab, Paralith-odes camtschaticus. Marine Pollution Bulletin, 69(1-2), 38-47, doi: 10.1016/j.marpolbul.2013.01.011.
Long, W. C., K. M. Swiney, C. Harris, H. N. Page, and R. J. Foy, 2013b: Effects of ocean acidification on juvenile red king crab (Paralithodes camtschaticus) and tanner crab (Chionoecetes bairdi) growth, condition, calcification, and survival. PLOS One, 8(4), e60959, doi: 10.1371/journal.pone.0060959.
Luo, Y., J. Melillo, S. Niu, C. Beier, J. S. Clark, A. T. Classen, E. Davidson, J. S. Dukes, R. D. Evans, C. B. Field, C. I. Czimczik, M. Keller, B. A. Kimball, L. M. Kueppers, R. J. Norby, S. L. Pelini, E. Pendall, E. Rastetter, J. Six, M. Smith, M. G. Tjoelker, and M. S. Torn, 2011: Coordinated approaches to quantify long-term ecosys-tem dynamics in response to global change. Global Change Biology, 17(2), 843-854, doi: 10.1111/j.1365-2486.2010.02265.x.
Mackey, K., J. J. Morris, F. Morel, and S. Kranz, 2015: Response of photosynthesis to ocean acidification. Oceanography, 25(2), 74-91, doi: 10.5670/oceanog.2015.33.
McCalley, C. K., B. J. Woodcroft, S. B. Hodgkins, R. A. Wehr, E. H. Kim, R. Mondav, P. M. Crill, J. P. Chanton, V. I. Rich, G. W. Tyson, and S. R. Saleska, 2014: Methane dynamics regulated by microbial community response to permafrost thaw. Nature, 514(7523), 478-481, doi: 10.1038/nature13798.
McCarthy, H. R., R. Oren, K. H. Johnsen, A. Gallet-Budynek, S. G. Pritchard, C. W. Cook, S. L. Ladeau, R. B. Jackson, and A. C. Finzi, 2010: Re-assessment of plant carbon dynamics at the Duke Free-Air CO2 Enrichment site: Interactions of atmospheric [CO2] with nitrogen and water availability over stand development. New Phy-tologist, 185(2), 514-528, doi: 10.1111/j.1469-8137.2009.03078.x.
McDonald, E. P., E. L. Kruger, D. E. Riemenschneider, and J. G. Isebrands, 2002: Competitive status influences tree-growth responses to elevated CO2 and O3 in aggrading Aspen stands. Functional Ecology, 16(6), 792-801, doi: 10.1046/j.1365-2435.2002.00683.x.
McLeod, E., G. L. Chmura, S. Bouillon, R. Salm, M. Björk, C. M. Duarte, C. E. Lovelock, W. H. Schlesinger, and B. R. Silliman, 2011: A blueprint for blue carbon: Toward an improved under-standing of the role of vegetated coastal habitats in sequestering CO2. Frontiers in Ecology and the Environment, 9(10), 552-560, doi: 10.1890/110004.
Melillo, J. M., T. Richmond, and G. W. Yohe (eds.), 2014: Climate Change Impacts in the United States: The Third National Climate Assessment. U.S. Global Change Research Program, 841 pp. [http://nca2014.globalchange.gov]
Meyer, J., and U. Riebesell, 2015: Reviews and syntheses: Responses of coccolithophores to ocean acidification: A meta-anal-ysis. Biogeosciences, 12(6), 1671-1682, doi: 10.5194/bg-12-1671-2015.
Millero, F., R. Woosley, B. DiTrolio, and J. Waters, 2009: Effect of ocean acidification on the speciation of metals in seawater. Ocean-ography, 22(4), 72-85, doi: 10.5670/oceanog.2009.98.
Monson, R. K., and G. J. Collatz, 2011: The ecophysiology and global biology of C4 photosynthesis. In: Terrestrial Photosynthesis in a Changing Environment: A Molecular, Physiological and Ecologi-cal Approach, Cambridge University Press, 54-70 pp.
Mooney, H. A., B. G. Drake, R. J. Luxmoore, W. C. Oechel, and L. F. Pitelka, 1991: Predicting ecosystem responses to elevated CO2 concentrations. BioScience 41, 96-104, doi: 10.2307/1311562.
Moore, D. J. P., S. Aref, R. M. Ho, J. S. Pippen, J. G. Hamilton, and E. H. De Lucia, 2006: Annual basal area increment and growth duration of Pinus taeda in response to eight years of free-air carbon dioxide enrichment. Global Change Biology, 12(8), 1367-1377, doi: 10.1111/j.1365-2486.2006.01189.x.
Morgan, P. B., T. A. Mies, G. A. Bollero, R. L. Nelson, and S. P. Long, 2006: Season-long elevation of ozone concentration to projected 2050 levels under fully open-air conditions substantially decreases the growth and production of soybean. New Phytologist, 170(2), 333-343, doi: 10.1111/j.1469-8137.2006.01679.x.
Morison, J. I., N. R. Baker, P. M. Mullineaux, and W. J. Davies, 2008: Improving water use in crop production. Philosophical Transactions of the Royal Society B: Biological Sciences, 363(1491), 639-658, doi: 10.1098/rstb.2007.2175.
Muehllehner, N., C. Langdon, A. Venti, and D. Kadko, 2016: Dynamics of carbonate chemistry, production, and calcification of the Florida Reef Tract (2009-2010): Evidence for seasonal dissolution. Global Biogeochemical Cycles, 30(5), 661-688, doi: 10.1002/2015gb005327.

Section IV | Consequences and Ways Forward
724 U.S. Global Change Research Program November 2018
Müller, C., J. Elliott, and A. Levermann, 2014: Food security: Fer-tilizing hidden hunger. Nature Climate Change, 4(7), 540-541, doi: 10.1038/nclimate2290.
Munday, P. L., A. J. Cheal, D. L. Dixson, J. L. Rummer, and K. E. Fabricius, 2014: Behavioural impairment in reef fishes caused by ocean acidification at CO2 seeps. Nature Climate Change, 4(6), 487-492, doi: 10.1038/nclimate2195.
Munday, P. L., D. L. Dixson, J. M. Donelson, G. P. Jones, M. S. Pratchett, G. V. Devitsina, and K. B. Doving, 2009: Ocean acidi-fication impairs olfactory discrimination and homing ability of a marine fish. Proceedings of the National Academy of Sciences USA, 106(6), 1848-1852, doi: 10.1073/pnas.0809996106.
Myers, S. S., A. Zanobetti, I. Kloog, P. Huybers, A. D. Leakey, A. J. Bloom, E. Carlisle, L. H. Dietterich, G. Fitzgerald, T. Hasegawa, N. M. Holbrook, R. L. Nelson, M. J. Ottman, V. Raboy, H. Sakai, K. A. Sartor, J. Schwartz, S. Seneweera, M. Tausz, and Y. Usui, 2014: Increasing CO2 threatens human nutrition. Nature, 510(7503), 139-142, doi: 10.1038/nature13179.
Myhre, G., D. Shindell, F.-M. Bréon, W. Collins, J. Fuglestvedt, J. Huang, D. Koch, J.-F. Lamarque, D. Lee, B. Mendoza, T. Naka-jima, A. Robock, G. Stephens, T. Takemura, and H. Zhang, 2013: Anthropogenic and natural radiative forcing. In: Climate Change 2013: The Physical Science Basis. Contribution of Working Group I to the Fifth Assessment Report of the Intergovernmental Panel on Climate Change. [T. F. Stocker, D. Qin, G. K. Plattner, M. Tignor, S. K. Allen, J. Boschung, A. Nauels, Y. Xia, V. Bex and P. M. Midgley (eds.)]. Cambridge University Press, Cambridge, UK, and New York, NY, USA, 659-740 pp.
Nelson, G. C., H. Valin, R. D. Sands, P. Havlik, H. Ahammad, D. Deryng, J. Elliott, S. Fujimori, T. Hasegawa, E. Heyhoe, P. Kyle, M. Von Lampe, H. Lotze-Campen, D. Mason d’Croz, H. van Meijl, D. van der Mensbrugghe, C. Muller, A. Popp, R. Robertson, S. Robin-son, E. Schmid, C. Schmitz, A. Tabeau, and D. Willenbockel, 2014: Climate change effects on agriculture: Economic responses to biophysical shocks. Proceedings of the National Academy of Sciences USA, 111(9), 3274-3279, doi: 10.1073/pnas.1222465110.
Neumann, B., A. T. Vafeidis, J. Zimmermann, and R. J. Nicholls, 2015: Future coastal population growth and exposure to sea-level rise and coastal flooding–A global assessment. PLOS One, 10(3), e0118571, doi: 10.1371/journal.pone.0118571.
Norby, R. J., and D. R. Zak, 2011: Ecological lessons from Free-Air CO2 Enrichment (FACE) experiments. Annual Review of Ecology, Evolution, and Systematics, 42(1), 181-203, doi: 10.1146/annurev-ecolsys-102209-144647.
Norby, R. J., E. H. Delucia, B. Gielen, C. Calfapietra, C. P. Giardina, J. S. King, J. Ledford, H. R. McCarthy, D. J. Moore, R. Ceulemans, P. De Angelis, A. C. Finzi, D. F. Karnosky, M. E. Kubiske, M. Lukac, K. S. Pregitzer, G. E. Scarascia-Mugnozza, W. H. Schlesinger, and R. Oren, 2005: Forest response to elevated CO2 is conserved across a broad range of productivity. Proceedings of the National Academy of Sciences USA, 102(50), 18052-18056, doi: 10.1073/pnas.0509478102.
Norby, R. J., J. M. Warren, C. M. Iversen, B. E. Medlyn, and R. E. McMurtrie, 2010: CO2 enhancement of forest productivity con-strained by limited nitrogen availability. Proceedings of the National Academy of Sciences USA, 107(45), 19368-19373, doi: 10.1073/pnas.1006463107.
Norby, R. J., M. G. De Kauwe, T. F. Domingues, R. A Duursma, D. S. Ellsworth, D. S. Goll, R. Pavlick, A. Rammig, B. Smith, R. Thomas, K. Thonicke , A. P. Walker, X. Yang, and S. Zaehle, 2016: Model–data synthesis for the next generation of forest free‐air CO2 enrichment (FACE) experiments. New Phytologist, 209(1), 17-28, doi: 10.1111/nph.13593.
Olofsson, J., and T. Hickler, 2007: Effects of human land-use on the global carbon cycle during the last 6,000 years. Vegetation History and Archaeobotany, 17(5), 605-615, doi: 10.1007/s00334-007-0126-6.
Orr, J. C., V. J. Fabry, O. Aumont, L. Bopp, S. C. Doney, R. A. Feely, A. Gnanadesikan, N. Gruber, A. Ishida, F. Joos, R. M. Key, K. Lindsay, E. Maier-Reimer, R. Matear, P. Monfray, A. Mouchet, R. G. Najjar, G. K. Plattner, K. B. Rodgers, C. L. Sabine, J. L. Sarmiento, R. Schlitzer, R. D. Slater, I. J. Totterdell, M. F. Weirig, Y. Yamanaka, and A. Yool, 2005: Anthropogenic ocean acidification over the twenty-first century and its impact on calcifying organisms. Nature, 437(7059), 681-686, doi: 10.1038/nature04095.
Osborne, C. P., and L. Sack, 2012: Evolution of C4 plants: A new hypothesis for an interaction of CO2 and water relations medi-ated by plant hydraulics. Philosophical Transactions of the Royal Society B: Biological Sciences, 367(1588), 583-600, doi: 10.1098/rstb.2011.0261.
Pagani, M., J. C. Zachos, K. H. Freeman, B. Tipple, and S. Bohaty, 2005: Marked decline in atmospheric carbon dioxide concentra-tions during the Paleogene. Science, 309(5734), 600-603, doi: 10.1126/science.1110063.
Pelejero, C., E. Calvo, and O. Hoegh-Guldberg, 2010: Paleo- perspectives on ocean acidification. Trends in Ecology and Evolution, 25(6), 332-344, doi: 10.1016/j.tree.2010.02.002.
Peñuelas, J., J. G. Canadell, and R. Ogaya, 2011: Increased water-use efficiency during the 20th century did not translate into enhanced tree growth. Global Ecology and Biogeography, 20(4), 597-608, doi: 10.1111/j.1466-8238.2010.00608.x.

Chapter 17 | Biogeochemical Effects of Rising Atmospheric Carbon Dioxide
725Second State of the Carbon Cycle Report (SOCCR2)November 2018
Pespeni, M. H., E. Sanford, B. Gaylord, T. M. Hill, J. D. Hosfelt, H. K. Jaris, M. LaVigne, E. A. Lenz, A. D. Russell, M. K. Young, and S. R. Palumbi, 2013: Evolutionary change during experimental ocean acidification. Proceedings of the National Academy of Sciences USA, 110(17), 6937-6942, doi: 10.1073/pnas.1220673110.
Petit, J. R., J. Jouzel, D. Raynaud, N. I. Barkov, J. M. Barnola, I. Basile, M. Bender, J. Chappellaz, M. Davis, G. Delaygue, M. Delmotte, V. M. Kotlyakov, M. Legrand, V. Y. Lipenkov, C. Lorius, L. PÉpin, C. Ritz, E. Saltzman, and M. Stievenard, 1999: Climate and atmospheric history of the last 420,000 years from the Vostok Ice Core, Antarctica. Nature, 399(6735), 429-436, doi: 10.1038/20859.
Phillips, J., G. McKinley, V. Bennington, H. Bootsma, D. Pilcher, R. Sterner, and N. Urban, 2015: The potential for CO2-induced acidification in freshwater: A Great Lakes case study. Oceanography, 25(2), 136-145, doi: 10.5670/oceanog.2015.37.
Phillips, R. P., I. C. Meier, E. S. Bernhardt, A. S. Grandy, K. Wickings, and A. C. Finzi, 2012: Roots and fungi accelerate carbon and nitrogen cycling in forests exposed to elevated CO2. Ecology Letters, 15(9), 1042-1049, doi: 10.1111/j.1461-0248.2012.01827.x.
Pörtner, H. O., D. Karl, P. W. Boyd, W. Cheung, S. E. Lluch-Cota, Y. Nojiri, D. N. Schmidt, and P. Zavialov, 2014: Ocean systems. In: Climate Change 2014: Impacts, Adaptation, and Vulnerability. Part A: Global and Sectoral Aspects. Contribution of Working Group II to the Fifth Assessment Report of the Intergovernmental Panel on Climate Change. [C. B. Field, V. R. Barros, D. J. Dokken, K. J. Mach, M. D. Mastrandrea, T. E. Bilir, M. Chatterjee, K. L. Ebi, Y. O. Estrada, R. C. Genova, B. Girma, E. S. Kissel, A. N. Levy, S. MacCracken, P. R. Mastrandrea, and L. L. White (eds.)]. Cambridge University Press, Cambridge University Press, Cambridge, UK, and New York, NY, USA, 411-484 pp.
Pörtner, H. O., M. Langenbuch, and A. Reipschläger, 2004: Biological impact of elevated ocean CO2 concentrations: Lessons from animal physiology and Earth history. Journal of Oceanography, 60(4), 705-718, doi: 10.1007/s10872-004-5763-0.
Punt, A. E., R. J. Foy, M. G. Dalton, W. C. Long, and K. M. Swiney, 2016: Effects of long-term exposure to ocean acidification condi-tions on future southern tanner crab (Chionoecetes bairdi) fisheries management. ICES Journal of Marine Science: Journal du Conseil, 73(3), 849-864, doi: 10.1093/icesjms/fsv205.
Rabalais, N. N., R. E. Turner, Q. Dortch, D. Justic, V. J. Bierman Jr, and W. J. Wiseman Jr, 2002: Nutrient-enhanced productivity in the northern Gulf of Mexico: Past, present and future. Hydrobiologia, 475/476, 39-63, doi: 10.1023/a:1020388503274.
Rao, S. C., J. Ryan, B. A. Stewart, and P. Koohafkan, 2004: Dryland agriculture: Long neglected but of worldwide importance. In: Chal-lenges and Strategies of Dryland Agriculture, 11-23 pp.
Raven, J. A., M. Giordano, J. Beardall, and S. C. Maberly, 2012: Algal evolution in relation to atmospheric CO2: Carboxylases, carbon-concentrating mechanisms and carbon oxidation cycles. Philosophical Transactions of the Royal Society B: Biological Sciences, 367(1588), 493-507, doi: 10.1098/rstb.2011.0212.
Rhein, M., S. R. Rintoul, S. Aoki, E. Campos, D. Chambers, R. A. Feely, S. Gulev, G. C. Johnson, S. A. Josey, A. Kostianoy, C. Mauritzen, D. Roemmich, L. D. Talley and F. Wang, 2013: Obser-vations: Ocean. In Climate Change 2013: The Physical Science Basis. Contribution of Working Group I to the Fifth Assessment Report of the Intergovernmental Panel on Climate Change. [T. F. Stocker, D. Qin, G.-K. Plattner, M. Tignor, S. K. Allen, J. Boschung, A. Nauels, Y. Xia, V. Bex, and P.M. Midgley (eds.)]. Cambridge University Press, Cambridge, UK, and New York, NY, USA.
Riebesell, U., and J.-P. Gattuso, 2015: Lessons learned from ocean acidification research. Nature Climate Change, 5(1), 12-14, doi: 10.1038/nclimate2456.
Riebesell, U., and P. D. Tortell, 2011: Effects of ocean acidification on pelagic organisms and ecosystems. In: Ocean Acidification. [ J.-P. Gattuso and L. Hansson (eds.)]. Oxford University Press, 99-121 pp.
Riebesell, U., K. G. Schulz, R. G. Bellerby, M. Botros, P. Fritsche, M. Meyerhofer, C. Neill, G. Nondal, A. Oschlies, J. Wohlers, and E. Zollner, 2007: Enhanced biological carbon consumption in a high CO2 ocean. Nature, 450(7169), 545-548, doi: 10.1038/nature06267.
Rohling, E. J., G. Marino, G. L. Foster, P. A. Goodwin, A. S. von der Heydt, and P. Kohler, 2018: Comparing climate sensitivity, past and present. Annual Review of Marine Science, 10, 261-288, doi: 10.1146/annurev-marine-121916-063242.
Royer, D. L., 2006: CO2-forced climate thresholds during the Pha-nerozoic. Geochimica et Cosmochimica Acta, 70(23), 5665-5675, doi: 10.1016/j.gca.2005.11.031.
Schimel, D., B. B. Stephens, and J. B. Fisher, 2015: Effect of increasing CO2 on the terrestrial carbon cycle. Proceedings of the National Academy of Sciences USA, 112(2), 436-441, doi: 10.1073/pnas.1407302112.
Schimel, D., M. Keller, S. Berukoff, R. Kao, H. W. Loescher, H. Powell, T. Kampe, D. Moore, and W. Gram, 2011: NEON Science Strategy: Enabling Continental-Scale Ecological Forecasting. National Ecological Observatory Network.
Schindler, D. E., and R. Hilborn, 2015: Prediction, precaution, and policy under global change. Science, 347(6225), 953-954, doi: 10.1126/science.1261824.
Schlesinger, W. H., and J. Lichter, 2001: Limited carbon storage in soil and litter of experimental forest plots under increased atmospheric CO2. Nature, 411(6836), 466-469, doi: 10.1038/35078060.

Section IV | Consequences and Ways Forward
726 U.S. Global Change Research Program November 2018
Schneider von Deimling, T., M. Meinshausen, A. Levermann, V. Huber, K. Frieler, D. M. Lawrence, and V. Brovkin, 2012: Estimat-ing the near-surface permafrost-carbon feedback on global warm-ing. Biogeosciences, 9(2), 649-665, doi: 10.5194/bg-9-649-2012.
Schuur, E. A., J. G. Vogel, K. G. Crummer, H. Lee, J. O. Sickman, and T. E. Osterkamp, 2009: The effect of permafrost thaw on old carbon release and net carbon exchange from tundra. Nature, 459(7246), 556-559, doi: 10.1038/nature08031.
Selsted, M. B., L. Linden, A. Ibrom, A. Michelsen, K. S. Larsen, J. K. Pedersen, T. N. Mikkelsen, K. Pilegaard, C. Beier, and P. Ambus, 2012: Soil respiration is stimulated by elevated CO2 and reduced by summer drought: Three years of measurements in a multifactor ecosystem manipulation experiment in a temperate heathland (CLIMAITE). Global Change Biology, 18(4), 1216-1230, doi: 10.1111/j.1365-2486.2011.02634.x.
Shakun, J. D., P. U. Clark, F. He, S. A. Marcott, A. C. Mix, Z. Liu, B. Otto-Bliesner, A. Schmittner, and E. Bard, 2012: Global warming preceded by increasing carbon dioxide concentrations during the last deglaciation. Nature, 484(7392), 49-54, doi: 10.1038/nature10915.
Shi, D., Y. Xu, B. M. Hopkinson, and F. M. Morel, 2010: Effect of ocean acidification on iron availability to marine phytoplankton. Science, 327(5966), 676-679, doi: 10.1126/science.1183517.
Smith, D. R., K. W. King, L. Johnson, W. Francesconi, P. Rich-ards, D. Baker, and A. N. Sharpley, 2015: Surface runoff and tile drainage transport of phosphorus in the midwestern United States. Journal of Environmental Quality, 44(2), 495-502, doi: 10.2134/jeq2014.04.0176.
Smith, W. K., S. C. Reed, C. C. Cleveland, A. P. Ballantyne, W. R. L. Anderegg, W. R. Wieder, Y. Y. Liu, and S. W. Running, 2016: Large divergence of satellite and Earth system model estimates of global terrestrial CO2 fertilization. Nature Climate Change, 6(3), 306-310, doi: 10.1038/nclimate2879.
Steinacher, M., F. Joos, T. L. Frölicher, L. Bopp, P. Cadule, V. Cocco, S. C. Doney, M. Gehlen, K. Lindsay, J. K. Moore, B. Schneider, and J. Segschneider, 2010: Projected 21st century decrease in marine productivity: A multi-model analysis. Biogeosci-ences, 7(3), 979-1005, doi: 10.5194/bg-7-979-2010.
Suess, H. E., 1955: Radiocarbon concentration in modern wood. Science, 122(3166), 415-417, doi: 10.1126/science.122.3166.415-a.
Sutton, A. J., C. L. Sabine, R. A. Feely, W.-J. Cai, M. F. Cronin, M. J. McPhaden, J. M. Morell, J. A. Newton, J.-H. Noh, S. R. Ólafsdóttir, J. E. Salisbury, U. Send, D. C. Vandemark, and R. A. Weller, 2016: Using present-day observations to detect when anthropogenic change forces surface ocean carbonate chemistry outside prein-dustrial bounds. Biogeosciences, 13(17), 5065-5083, doi: 10.5194/bg-13-5065-2016.
Taub, D. R., B. Miller, and H. Allen, 2008: Effects of elevated CO2 on the protein concentration of food crops: A meta-analysis. Global Change Biology, 14(3), 565-575, doi: 10.1111/j.1365-2486.2007.01511.x.
Tubiello, F. N., J. F. Soussana, and S. M. Howden, 2007: Crop and pasture response to climate change. Proceedings of the National Academy of Sciences USA, 104(50), 19686-19690, doi: 10.1073/pnas.0701728104.
Turley, C., J. Blackford, S. Widdicombe, D. Lowe, P. Nightingale, and A. Rees, 2006: Reviewing the impact of increased atmo-spheric CO2 on oceanic pH and the marine ecosystem. In: Avoid-ing Dangerous Climate Change Vol. 8, Cambridge University Press.
USGCRP, 2017: Climate Science Special Report: Fourth National Climate Assessment, Volume I. [D. J. Wuebbles, D. W. Fahey, K. A. Hibbard, D. J. Dokken, B. C. Stewart, and T. K. Maycock (eds.)]. U.S. Global Change Research Program, Washington, DC, 666 pp. [https://science2017.globalchange.gov]
Vafeidis, A., B. Neumann, J. Zimmerman, and R. J. Nicholls, 2011: MR9: Analysis of Land Area and Population in the Low-Elevation Coastal Zone (LECZ) London, GB Foresight, Government Office for Science. [https://eprints.soton.ac.uk/207617/]
van der Sleen, P., P. Groenendijk, M. Vlam, N. P. R. Anten, A. Boom, F. Bongers, T. L. Pons, G. Terburg, and P. A. Zuidema, 2014: No growth stimulation of tropical trees by 150 years of CO2 fertilization but water-use efficiency increased. Nature Geoscience, 8(1), 24-28, doi: 10.1038/ngeo2313.
van Groenigen, K. J., C. W. Osenberg, and B. A. Hungate, 2011: Increased soil emissions of potent greenhouse gases under increased atmospheric CO2. Nature, 475(7355), 214-216, doi: 10.1038/nature10176.
van Groenigen, K. J., X. Qi, C. W. Osenberg, Y. Luo, and B. A. Hun-gate, 2014: Faster decomposition under increased atmospheric CO2 limits soil carbon storage. Science, 344(6183), 508-509, doi: 10.1126/science.1249534.
Velbel, M. A., 1993: Temperature dependence of silicate weather-ing in nature: How strong a negative feedback on long-term accu-mulation of atmospheric CO2 and global greenhouse warming? Geology, 21(12), 1059-1062.
Wallace, R. B., H. Baumann, J. S. Grear, R. C. Aller, and C. J. Gobler, 2014: Coastal ocean acidification: The other eutrophica-tion problem. Estuarine, Coastal and Shelf Science, 148, 1-13, doi: 10.1016/j.ecss.2014.05.027.
Way, D. A., S. L. Ladeau, H. R. McCarthy, J. S. Clark, R. A. M. Oren, A. C. Finzi, and R. B. Jackson, 2010: Greater seed produc-tion in elevated CO2 is not accompanied by reduced seed quality in Pinus taeda L. Global Change Biology, 16(3), 1046-1056, doi: 10.1111/j.1365-2486.2009.02007.x.

Chapter 17 | Biogeochemical Effects of Rising Atmospheric Carbon Dioxide
727Second State of the Carbon Cycle Report (SOCCR2)November 2018
Weiss, L. C., L. Potter, A. Steiger, S. Kruppert, U. Frost, and R. Tollrian, 2018: Rising pCO2 in freshwater ecosystems has the potential to negatively affect predator-induced defenses in Daphnia. Current Biology, 28(2), 327-332 e323, doi: 10.1016/j.cub.2017.12.022.
Wiebe, K., H. Lotze-Campen, R. Sands, A. Tabeau, D. van der Mensbrugghe, A. Biewald, B. Bodirsky, S. Islam, A. Kavallari, D. Mason-D’Croz, C. Müller, A. Popp, R. Robertson, S. Robinson, H. van Meijl, and D. Willenbockel, 2015: Climate change impacts on agriculture in 2050 under a range of plausible socioeconomic and emissions scenarios. Environmental Research Letters, 10(8), 085010, doi: 10.1088/1748-9326/10/8/085010.
Wong, P. P., I. J. Losada, J.-P. Gattuso, J. Hinkel, A. Khattabi, K. L. McInnes, Y. Saito, and A. Sallenger, 2014: Coastal systems and low-lying areas. In: Climate Change 2014: Impacts, Adaptation, and Vulnerability. Part A: Global and Sectoral Aspects. Contribution of Working Group II to the Fifth Assessment Report of the Intergov-ernmental Panel on Climate Change. [C. B. Field, V. R. Barros, D. J. Dokken, K. J. Mach, M. D. Mastrandrea, T. E. Bilir, M. Chatterjee, K. L. Ebi, Y. O. Estrada, R. C. Genova, B. Girma, E. S. Kissel, A. N. Levy, S. MacCracken, P. R. Mastrandrea, and L. L. White (eds.)]. Cambridge University Press, Cambridge, UK, and New York, NY, USA, 361-409 pp.
Wootton, J. T., C. A. Pfister, and J. D. Forester, 2008: Dynamic patterns and ecological impacts of declining ocean pH in a high-resolution multi-year dataset. Proceedings of the National Academy of Sciences USA, 105(48), 18848-18853, doi: 10.1073/pnas.0810079105.
Xia, J., J. Chen, S. Piao, P. Ciais, Y. Luo, and S. Wan, 2014: Terres-trial carbon cycle affected by non-uniform climate warming. Nature Geoscience, 7(3), 173-180, doi: 10.1038/ngeo2093.
Yates, K. K., D. G. Zawada, N. A. Smiley, and G. Tiling-Range, 2017: Divergence of seafloor elevation and sea level rise in coral reef ecosystems. Biogeosciences, 14(6), 1739-1772, doi: 10.5194/bg-14-1739-2017.
Zeebe, R. E., and D. Wolf-Gladrow, 2001: CO2 in Seawater: Equilib-rium, Kinetics, Isotopes. Elsevier Science.
Zhou, L., X. Zhou, J. Shao, Y. Nie, Y. He, L. Jiang, Z. Wu, and S. Hosseini Bai, 2016: Interactive effects of global change factors on soil respiration and its components: A meta-analysis. Global Change Biology, 22(9), 3157-3169, doi: 10.1111/gcb.13253.
Zhu, K., N. R. Chiariello, T. Tobeck, T. Fukami, and C. B. Field, 2016: Nonlinear, interacting responses to climate limit grass-land production under global change. Proceedings of the National Academy of Sciences USA, 113(38), 10589-10594, doi: 10.1073/pnas.1606734113.

728
Lead AuthorTristram O. West, DOE Office of Science
Contributing AuthorsNoel P. Gurwick, U.S. Agency for International Development; Molly E. Brown, University of Maryland; Riley Duren, NASA Jet Propulsion Laboratory; Siân Mooney, Arizona State University; Keith Paustian, Colo-rado State University; Emily McGlynn, University of California, Davis; Elizabeth L. Malone, Independent Researcher; Adam Rosenblatt, University of North Florida; Nathan Hultman, University of Maryland; Ilissa B. Ocko, Environmental Defense Fund
AcknowledgmentsPaty Romero-Lankao (Science Lead), National Center for Atmospheric Research (currently at National Renewable Energy Laboratory); Emily J. Pindilli (Review Editor), U.S. Geological Survey; Nancy Cavallaro (Federal Liaison), USDA National Institute of Food and Agriculture; Gyami Shrestha (Federal Liaison), U.S. Carbon Cycle Science Program and University Corporation for Atmospheric Research
Recommended Citation for ChapterWest, T. O., N. P. Gurwick, M. E. Brown, R. Duren, S. Mooney, K. Paustian, E. McGlynn, E. L. Malone, A. Rosenblatt, N. Hultman, and I. B. Ocko, 2018: Chapter 18: Carbon cycle science in support of decision making. In Second State of the Carbon Cycle Report (SOCCR2): A Sustained Assessment Report [Cavallaro, N., G. Shrestha, R. Birdsey, M. A. Mayes, R. G. Najjar, S. C. Reed, P. Romero-Lankao, and Z. Zhu (eds.)]. U.S. Global Change Research Program, Washington, DC, USA, pp. 728-759, https://doi.org/10.7930/SOCCR2.2018.Ch18.
Carbon Cycle Science in Support of Decision Making18
Chapter 18 | Carbon Cycle Science in Support of Decision Making
729Second State of the Carbon Cycle Report (SOCCR2)November 2018
KEY FINDINGS1. Co-production of knowledge via engagement and collaboration between stakeholder communi-
ties and scientific communities can improve the usefulness of scientific results by decision makers (high confidence).
2. Integrating data on human drivers of the carbon cycle into Earth system and ecosystem models improves representation of carbon-climate feedbacks and increases the usefulness of model output to decision makers (high confidence).
3. Attribution, accounting, and projections of carbon cycle fluxes increase the usefulness of carbon cycle science for decision-making purposes (very high confidence).
4. Developing stronger linkages among research disciplines for Earth system processes, carbon management, and carbon prediction, with a focus on consistent and scalable datasets as model inputs, will improve joint representation of natural and managed systems needed for decision making (high confidence).
18.1 IntroductionRecent decades have seen continually increased interest in how best to reduce net carbon emissions, including maintaining or augmenting natural and managed carbon stocks (Griscom et al., 2017) and decreasing anthropogenic carbon emissions. Deci-sions about carbon management extend from future energy production and technology planning to designs for urban infrastructure and refurbishment; transportation; and agriculture, forest, and natural resource management. Over this same time period, scientists have conducted extensive basic and applied research on biogeochemical cycles, land-cover change, watershed to Earth System Modeling, climate change, and energy efficiency, all of which inform the understanding of the efficacy of various carbon management options (CCSP 2007). However, the information needs of decision makers differ from the objectives that drive basic science to understand natu-ral carbon cycling. Explicitly identifying the informa-tion that various decision makers will use, including the form in which they need it, is critical for taking carbon cycle science from laboratory to management action. While much progress has been made in under-standing individual components of both fundamental and applied science contributing to decision-making frameworks (see Figure 18.1, p. 730), additional work
is needed to connect these components to address existing research and policy questions.
Methods for connecting and integrating basic and applied carbon cycle research take a number of forms. For example, researchers can 1) simplify complex models to provide mean estimates for given activities (e.g., a complex nitrogen cycle model providing mean and uncertainty estimates for nitrous oxide [N2O] emissions); 2) interpret biogeochemical model results to estimate net car-bon flux associated with particular activities (e.g., natural disturbance contributions to global carbon fluxes versus net emissions associated with the man-agement of natural disturbances); or 3) aggregate and analyze scientific data in a different manner to address specific questions (e.g., national emissions estimates versus attribution of net emissions asso-ciated with particular activities). These approaches to connect basic science and decision making have most often been employed post hoc, harvesting results from foundational research that already has been conducted to inform decisions, rather than designing and organizing large research programs around user-defined information needs (Lemos and Morehouse 2005). Post hoc methods often are used to synthesize, and sometimes simplify, fundamen-tal research findings for common applications and

Section IV | Consequences and Ways Forward
730 U.S. Global Change Research Program November 2018
decision making, including in the Intergovernmental Panel on Climate Change’s (IPCC) 2006 Guidelines for National Greenhouse Gas Inventories (IPCC 2006) and the U.S. Department of Agriculture’s (USDA) Methods for Entity-Scale Inventory (USDA 2014).
While organizations make decisions with what-ever information they have available, multiple,
competing interests are generally at play in setting priorities, so the quality and credibility of infor-mation can influence decisions about carbon management. Some decisions about carbon cycle management require only coarse-level estimates or discipline-specific knowledge, while others benefit from more nuanced analysis or multidisciplinary research. Multidisciplinary research is particularly
Figure 18.1. Primary Drivers of Carbon Stocks and Emissions. Carbon and carbon dioxide (CO2) estimates can be generated using observations, models of differing complexity, or both. To understand and estimate future carbon stocks and emissions, drivers of carbon stock changes and carbon emissions must be considered and represented. This schematic illustrates examples of components needed to represent carbon stock changes prior to addressing policy drivers.

Chapter 18 | Carbon Cycle Science in Support of Decision Making
731Second State of the Carbon Cycle Report (SOCCR2)November 2018
needed to inform economy-wide carbon manage-ment targets (e.g., to maintain atmospheric carbon dioxide [CO2] within a safe operating space for humanity; Rockstrom et al., 2009) and to under-stand links among sectors (e.g., soil carbon in the land sector associated with biofuel production in the energy sector). Collaborations between scientists and practitioners increase the chances that information intended to inform decisions is actually needed and delivered in a highly useful manner. For decisions affecting multiple sectors, collaborations among scientists of many disciplines tend to pro-duce knowledge that is more credible and practical in the eyes of multiple stakeholders compared to knowledge produced in more siloed environments (Weaver et al., 2014). Although collaborations have increased (Mooney et al., 2013), there remain lost opportunities for effective carbon cycle manage-ment that could be captured via more integration.
Federal, state, and local policymakers; company executives; energy managers; urban designers; natu-ral resource managers; families; and individuals make short- and long-term decisions that can influence the carbon cycle. These entities require adequate information from science-based analyses to inform their choices and to understand how management, technologies, or behavioral decisions can affect net carbon emissions or carbon stock changes. Mean-while, scientists are developing more sophisticated monitoring, data interpretation, and modeling meth-ods that could be relevant to these decision makers, providing more refined understanding. An import-ant but challenging part of carbon cycle science is ensuring that scientists have sufficient understanding of decision makers’ needs to produce information that actually is usable by decision makers and that funding organizations place sufficient priority on actionable science. To facilitate strategic, effective use of carbon cycle science in carbon management, as well as to provide insights about the opportunities and constraints that shape the availability of user-driven carbon cycle science now and in the future, this chapter provides information on national and international needs for carbon cycle information, current status of research to inform carbon cycle and
greenhouse gas (GHG) management, and future needs. It also focuses on the sectors of agriculture, forestry, and other land uses (AFOLU) and discusses energy and associated carbon sources in the context of integrated carbon cycle systems.
18.2 User Demand for Carbon Cycle ScienceDiverse institutions demand information about the carbon cycle that enables them to meet their partic-ular objectives and interests. For example, stakehold-ers wishing to prioritize actions for reducing emis-sions need to know the distribution among sectors (e.g., transportation, infrastructure, buildings, power generation, and land management), as well as the technical, economic, and behavioral potential for reducing these emissions in different sectors and locations. Illustrative questions that stakeholders including decision makers ask include:
1. How much can emissions be reduced from transportation versus power generation versus building sectors, and at what costs?
2. What actions are consumers likely to take, and which kinds of technologies (e.g., smart meters) and campaigns (e.g., foot-in-the-door models) are likely to result in behavioral change (Scott 1977; Mogles et al., 2017)?
3. How much methane (CH4) leaks into the atmo-sphere from natural gas wells and pipelines, and how does that leakage influence the attrac-tiveness of natural gas as a “bridge” fuel (Miller et al., 2013)?
4. How can carbon be managed from procurement through production and inventory management (Benjaafar et al., 2013)?
5. How fast will different agricultural practices build soil carbon or reduce CH4 emissions from cattle, and how will these rates vary geographi-cally (Olander et al., 2014)?

Section IV | Consequences and Ways Forward
732 U.S. Global Change Research Program November 2018
6. How will the consequences of different sets of agricultural and forest management practices on a single tract of land add up?
18.2.1 Variety in Types of Users and Their NeedsUsers of carbon cycle science to reduce emissions include 1) carbon registries and protocol developers (Gonzalez 2014; Climate Action Reserve 2018), 2) businesses that have made voluntary commit-ments to reducing GHG emissions from their supply chains (Christopher 2011; Tseng and Hung 2014; CISCO 2017; Walmart 2017), 3) utilities devel-oping strategies for reducing their GHG footprints (Consolidated Edison 2016), 4) state and munic-ipal governments committed to reducing GHG emissions in their public and private sectors (Car-bon Neutral Cities Alliance 2018; Elizondo et al., 2017), and 5) non-governmental organizations and research institutes producing roadmaps to achieve different atmospheric CO2 targets (UCS 2009). In addition, national governments and international organizations rely on carbon cycle science combined with policy and management practices to identify the primary socioeconomic drivers of carbon emis-sions (e.g., Fricko et al., 2017; Rogelj et al., 2018) and to understand how well science-based recom-mendations for carbon budgets align with global commitments for carbon management (Fricko et al., 2017; Burke et al., 2018; Rogelj et al., 2018). These users vary in the types of decisions they make about carbon cycle management; their capacity to support research or engage with research institutions; their maturity in defining their information needs; and their potential to impact regional, national, or global carbon pools. Mapping these capacities with an eye toward producing information in formats that align with standard business practices would be a valuable contribution for social science research.
18.2.2 Institutional Arrangements for Meeting User DemandDespite having identified numerous users of carbon cycle science and the deep knowledgebase summa-rized within this report, tailoring and synthesizing
carbon cycle science to make it truly useful to spe-cific institutions continue to present a challenge. In carbon management, as in numerous other realms of decision making that benefit from technical input, the traditional science supply paradigm for producing usable or socially robust knowledge (i.e., provide the research results, and somebody will eventually use them) remains problematic and usu-ally ineffective. The disconnect between knowledge production and consumption is particularly appar-ent when applying cross-disciplinary research to societies (Dilling 2007). In contrast, various initia-tives have demonstrated that beginning research by identifying user information demands, subsequently working intensively with users to understand those needs in detail, ultimately leads to science products that are actually used (Zell et al., 2012). User-driven science, however, thrives when institutions shift their priorities to meet user needs and set reward structures accordingly.
Co-Production of KnowledgeThe hybrid approach that has enabled user demand to take advantage of carbon cycle science within the confines of existing institutional structures has been referred to as the co-production of knowledge by scientists and the user community (Cash et al., 2006; Dilling and Lemos 2011). This coordination entails establishing a shared vision that a decision- making process requires, and ensuring that the decision makers receive information in a usable format and at an appropriate time (Brown and Escobar 2013). In addition to engaging stakehold-ers, co-production of knowledge also emphasizes collaboration across scientific disciplines. Although cross-disciplinary research has received considerable discussion over the past few decades, institutional cultures within a number of large organizations that have especially robust research capacity continue to impede collaborations in the absence of strong direction and leadership to do otherwise (Mooney et al., 2013; Weaver et al., 2014). Overcoming barriers between the sciences (see McGreavy et al., 2015) remains a challenge to producing infor-mation that effectively influences decision making.

Chapter 18 | Carbon Cycle Science in Support of Decision Making
733Second State of the Carbon Cycle Report (SOCCR2)November 2018
Examples of co-production and user-driven research in which carbon cycle science has informed man-agement action include development of the South-east Florida Regional Climate Change Compact (Georgetown Climate Center 2017), the Maryland Carbon Monitoring System (University of Maryland 2016), and methods for reducing emissions from deforestation and forest degradation plus (REDD+; see Section 18.3.2, p. 736) accounting in Mexico (Birdsey et al., 2013).
Boundary OrganizationsBoundary organizations facilitate interactions between science producers and users by helping to structure the flow of information from basic and applied research to decision making, enabling improved engagement and stronger relationships across disciplines (Kirchhoff et al., 2013; see Figure 18.2, this page). They focus on activities that engage all carbon cycle science disciplines and promote opportunities to foster interdisciplinary and intra-mural collaboration (Clark et al., 2016). Diverse non-governmental organizations have played a strong role engaging with carbon cycle research activities to understand and apply the science. A primary objective of these organizations is to sup-port and present science in ways that enable local and individual action that links science to decision making at a variety of scales.
The North American Carbon Program (NACP) is an example of a boundary program that sup-ports scientists’ efforts to engage in social, eco-nomic, and policy-relevant research to improve how carbon cycle science is conducted and ensure policy-relevant findings (NACP; Michalak et al., 2011). A co-authorship network analysis using data from publications of core NACP members indi-cates that the structure and collaborative pathways within the NACP community created an effective boundary organization (Brown et al., 2016). Results illustrate that the NACP community expanded its research on human and social impacts on the carbon cycle, contributing to a better understanding of how human and physical processes interact with one another. NACP has formed a tightly connected
community with many social pathways through which knowledge may flow, and it has expanded its network of institutions involved in carbon cycle research over the past several years (Brown et al., 2016). Further coordination of research in social science, economics, business management, and carbon cycle science should enable decision makers to understand the motivations for people’s actions that either directly or indirectly affect the carbon cycle (see Ch. 6: Social Science Perspectives on Carbon, p. 264) and the situations in which refined understanding of the biophysical carbon cycle can
Figure 18.2. Evolution in the Complexity of Knowl-edge Production and User Participation. On the vertical axis, the complexity of knowledge production increases from low (where production is predominately focused on increasing fundamental knowledge) to high (where production aims to help solve societal problems). On the horizontal axis, the complexity of user participa-tion changes from low to high as users become increas-ingly active in the knowledge-creation process. Mode 1 represents the concept that societal benefits accrue because of the separation of science from society, where science is separated from society to maintain objectivity and credibility. Mode 2 organizes science production at increasing levels of interaction and integration across disciplines (from multidisciplinary to transdisciplinary) and across the science-society divide. In postnormal science, scientific knowledge alone is not enough to solve societal problems; therefore, interaction between producers and users of science across the science- society interface entails specific involvement of stake-holders throughout the process. [Figure source: Redrawn from Kirchhoff et al., 2013, copyright Annual Reviews (www.annualreviews.org), used with permission.]

Section IV | Consequences and Ways Forward
734 U.S. Global Change Research Program November 2018
influence business decisions such as supplier selec-tion for creating low-carbon supply chains (Hsu et al., 2013).
18.3 Carbon Cycle Science Used for Decision MakingCarbon cycle science supports decisions in a num-ber of national and international contexts. For example, decisions about managing ecosystems such as national or state forests require integrating stakeholder perspectives with scientific input on the consequences or alternative policy approaches for ecosystems, emissions, and climate (BLM 2016). At the international level, as countries establish goals to stabilize carbon and GHG concentrations in the atmosphere, the scientific community should play an important role in assessing carbon budgets and developing the technologies, methods, and practices for reducing net GHG emissions and managing carbon stocks. Global efforts to slow deforestation, improve human health, and decrease global GHG emissions will be aided by substantial input from the international scientific community and respec-tive national agencies. In all of these examples, and many others, improvements in the quality and process of scientific input can help inform sound decision making. Recent research on CH4 emissions provides a notable example of fundamental carbon cycle science used in decision making. Reducing anthropogenic CH4 emissions has become a high priority for policymakers, given the potential for near-term climate benefits and the relative tracta-bility1 of monitoring and mitigating emissions from many sectors. Concerted effort to develop relation-ships among scientists and decision makers has enabled progress in identifying information needs,
1 Mitigation of methane (CH4) emissions—particularly point sources from the energy, waste, and some agricultural sectors—has strong near-term tractability because it involves detecting and repairing local fugitive emissions rather than economy-wide shifts in energy and transportation infrastructure associated with fossil fuel carbon dioxide (CO2) mitigation. Monitoring anthropogenic CH4 fluxes is generally more tractable (with existing technology) than monitoring CO2 fluxes, since the latter includes large, confounding fluxes from the biosphere. However, area sources of CH4 such as wetlands and some agricultural fluxes (e.g., rice and enteric livestock emissions) continue to present a challenge.
developing technology to provide needed informa-tion, and establishing science questions that evaluate existing knowledge. With respect to policy drivers, new laws and rules have been enacted to mitigate and measure CH4 emissions in California and other key regions and sectors in the United States (Federal Register 2016a, 2016b). Atmospheric or “top-down” scientific methods for detecting, quantifying, and attributing CH4 fluxes have dramatically improved. For example, satellite observations have enabled scientists to identify concentrated regions of CH4 emissions, information relevant to policy and man-agement that previously had not been well known or understood (Kort et al., 2014). Recent field studies have revealed evidence of a long-tail statistical distribution of emissions sources in the U.S. natural gas supply chain, where a relatively small number of superemitters dominate key regions and sectors (Brandt et al., 2014; Zavala-Araiza et al., 2015; Zimmerle et al., 2015). Some stakeholders (e.g., California Air Resources Board) already have applied the atmospheric and field research findings to make corrections to CH4 inventory estimates. Addition-ally, recent advances in remote sensing of CH4 point sources (Frankenberg et al., 2016; Thompson et al., 2016) demonstrate the potential to efficiently detect leaks from point sources.
Because the demand for tailored knowledge is often urgent, specific, and only weakly aligned with incen-tives that drive fundamental research, consulting firms and non-governmental organizations (NGOs) have often met this demand. These institutions have generated a great deal of user-driven science over the decades. For example, the World Wildlife Fund (WWF) and the Carbon Disclosure Project (CDP) partnered with multiple, large, U.S.-based corpora-tions to produce The 3% Solution, an analysis of the business case for businesses to achieve net savings of up to $190 billion by 2020 through measures to reduce carbon emissions (WWF and CDP 2013). Woods Hole Research Center, in collaboration with the U.S. Agency for International Development (USAID), produced a map of aboveground carbon stocks in Mexico. The map built on information already assembled by Mexico’s government for its

Chapter 18 | Carbon Cycle Science in Support of Decision Making
735Second State of the Carbon Cycle Report (SOCCR2)November 2018
National Forest Inventory and met a clear need to advance the estimates of Mexico’s forest carbon stocks at both national and municipal levels (Cartus et al., 2014; WHRC 2014). As these examples illustrate, contract-driven science is sometimes made publicly available, such as when governmental agen-cies provide funding to support projects in the pub-lic interest or when private-sector entities and NGOs partner to develop analyses of common interest. However, the private contract model has limitations. Many products of contract research remain outside the public domain, and users without the resources to purchase these goods cannot easily access tailored information for their decision-making needs. User institutions that lack these resources are typically smaller and also have less influence than their larger counterparts in a variety of forums. This imbalance in access to information has profound implications because, as many chapters in this report demon-strate, carbon management has consequences for all of society, not only the entity making a particular decision. Because user-driven science that does not enter the public domain is difficult to access, further characterization of its contributions or extent are not included in this chapter. In spite of this, significant effort should be placed on accessing relevant science that is outside the public domain in order to deter-mine whether this science has sufficient value to impact the decision-making process.
18.3.1. Use of Carbon Cycle Science for Land ManagementThe carbon research community performed a great deal of work in the past decade with the aim of improving decision making in agriculture, energy production and consumption, building infra-structure design and maintenance, transportation, and many other sectors that consume fossil fuels or generate land-based emissions. This research filled knowledge gaps that helped decision makers understand multiple impacts of land-management decisions. Research foci included, for example, ecosystem disturbance (e.g., fire and pest out-breaks), human health and risk, indirect land-use change, efficient production throughout commodity
supply chains, full life cycle energy and emissions impacts of ecosystems and production systems, and how these analyses change under alternative land-management scenarios. Federal guidance to U.S. agencies documents how full GHG accounting has been incorporated into environmental impact analyses under current and alternative scenarios (Federal Register 2016b). Briefly illustrated here is the potential impact of scientific input on land man-agement through examples of land-use policy and of terrestrial management on the carbon cycle.
The use of carbon cycle science for decisions on carbon emissions reductions in agriculture is rele-vant for a wide suite of societal and policy questions relating to the direct impacts of land-use decisions on energy, emissions, health, and ecosystems (see Ch. 5: Agriculture, p. 229). For example, carbon cycle science from multiple disciplines informs dialogue and decisions about the role biofuels can play in the energy economy. Biofuels can include dedicated energy crops, agricultural wastes and residues, and CH4 from agricultural wastes. The use of biofuels can decrease GHG emissions, depend-ing on net changes in biomass growth stocks across the landscape (e.g., harvest rates, deforestation, and indirect land-use change) and on the net efficiency of converting biomass to energy (see Ch. 3: Energy Systems, p. 110). Biofuel policy options have complex and highly variable implications for carbon emissions that are a function of energy expended in production, processing, and use of biofuels; indirect land-use change; and ecological and economic costs and benefits of biofuels (Paustian et al., 2001). In seeking solutions to energy, environmental, and food challenges, biofuels can either contribute positively or negatively to existing societal issues (Tilman et al., 2009). Full carbon cycle analysis and modeling are key to ensuring that policies and resulting actions actually lower carbon emissions instead of raising them. Such analyses continue to be used to ascertain the benefit of biomass to reduce net emissions, including biomass burning (Cherubini et al., 2011; Johnson 2009; Khanna and Crago 2012; Miner et al., 2014; Mitchell et al., 2012; Tian et al., 2018) and forest thinning to reduce

Section IV | Consequences and Ways Forward
736 U.S. Global Change Research Program November 2018
wildfire risks (Campbell et al., 2012; Mitchell et al., 2009). Analyses at different spatial scales (e.g., plot, national, and global) and temporal scales (e.g., years, decades, and centuries) can yield different conclusions for land-related carbon issues, indicat-ing the need to synthesize or integrate approaches used across scales (i.e., plant growth models, land-use change models, integrated assessment models (IAMs), and natural resource supply models).
18.3.2 Carbon Management StrategiesWhile some carbon management strategies are still being debated within the science community, a number of strategies have been well documented and quantified. Some of them are summarized from results in preceding chapters of this report (see Table 18.1, p. 737). Many land-based strategies are associated with changes in management. Humans have a long history of altering the landscape and associated carbon stocks around the world since initial settlement and population expansion (Sanderman et al., 2017; Köhl et al., 2015). People have changed forests to agricultural areas and vice versa; changed management of soils, forests, grass-lands, and other ecosystems; and developed urban and suburban areas. There is a robust literature of observations and carbon stock comparisons under different land uses and management regimes that provides guidance for managing natural resources, fossil resources, and renewables with regard to carbon. Potential sequestration rates have been esti-mated by aggregating data from hundreds of paired plots, and the data have been used for national scale estimates (U.S. EPA 2016) and global default values for numerous management practices across land, energy, and transportation sectors (IPCC 2006). Research has moved beyond estimating the influ-ence of management changes within a sector, to evaluating how change in one land or energy sector causes changes in other land or energy sectors.
The many land-management options available to reduce net GHG emissions or increase removal of GHGs from the atmosphere (see Table 18.1), taken together, could reduce net emissions by 100 to 500 teragrams of carbon (Tg C) per year, with co-effects
becoming highly significant in the high end of this range. Therefore, decisions about land-management policies must take into account the co-effects, which may be positive or negative, along with the potential benefits in terms of reducing GHGs. One of the most significant negative impacts of altering land management to increase carbon storage is a potential reduction in land area devoted to food production if the amount of additional land required exceeds the area of “marginal” (i.e., not productive for crops) land available. On the other hand, positive co-effects may result from management practices that increase soil fertility along with carbon storage, or those that increase protection of water quality or damage from storms and floods.
Although traditionally considered the province of biophysical science, the demand for actionable results has increasingly drawn attention to the need for research from sociology, psychology, and human behavior to inform carbon management. Research in these fields has identified obstacles to effective carbon management, and the approaches to over-come them, at individual to institutional scales (Ross et al., 2016). In researching the interests and understandings held by different actors in Mexico’s program for monitoring, reporting, and verifying (MRV) REDD+, Deschamps Ramírez and Larson (2017) found tension arising from poor understand-ing of international reporting requirements and the roles and responsibilities of subnational institutions. Weaknesses in understanding and social relations among key institutions limit the effectiveness of carbon management even when decision makers possess and understand strong biophysical analyses (Deschamps Ramírez and Larson 2017). Individuals respond strongly to default options and associated social norms, as demonstrated in comparisons of decisions about whether or not to participate in organ donor programs among different countries. Default settings on furnaces and other appliances to conserve energy, with the option for owners or users to change that setting, could produce widespread behavior shifts and associated changes in carbon emissions (Ross et al., 2016). Efforts to support the capacity of businesses to manage carbon involves research but

Chapter 18 | Carbon Cycle Science in Support of Decision Making
737Second State of the Carbon Cycle Report (SOCCR2)November 2018
Table 18.1. Summary of Options, Capacity, and Co-Effects for Reducing Greenhouse Gases (GHGs) in North Americaa
Activity Impact on GHGs Potential Reductionb Co-Effects
Afforestation and improved forest management (Ch. 9, 12)c
Increase in net removals from the atmosphere.
Reduction in emissions by avoiding the conversion of forests and grasslands to other cover types.
Increase in carbon removals from the atmosphere by promoting the conversion of other land covers to forests or grasslands.
30 to 330 teragrams of carbon (Tg C) per year (U.S. only)
Potential impacts on food production, biodiversity, net forest resources, and counter harvesting elsewhere (i.e., leakage), resulting from increased forestland area.
Managing grasslands (Ch. 10)c
Increase in net removals from the atmosphere and in biomass and soil carbon storage by improving grazing practices and grasslands management.
Tens of Tg C per year (U.S. only)
Shifts in species composition.
Reducing methane (CH4) emissions from livestock (Ch. 5)c
Reduction in net agriculture emissions by controlling livestock CH4 emissions.
13 to 19 Tg C per year Potential co-benefits such as improved feed efficiency or productivity in livestock.
Cropland management practices (Ch. 5, 12)c
Increase in organic residue inputs and soil carbon stocks by reducing tillage and summer fallow, implementing cover cropping, or managing nutrients to increase plant production.
Reduction in CH4 and nitrous oxide (N2O) emissions by optimizing nitrogen fertilization and water management.
Soil carbon stock increases of up to 3 megagrams of carbon per hectare; up to 80% reduction in CH4 (especially rice) and N2O, depending on crop, environment, and combination of practices.
Potential co-benefits such as improved soil productivity and lower costs for nitrogen fertilizers.
Increased organic carbon for improved buffering capacity, water holding capacity, soil fertility, and tilth.
Reduced water use (especially rice).
Reducing wetland and coastal ecosystem loss (Ch. 13, 15)c
Reduction in emissions by avoiding the loss of wetlands and coastal estuaries.
Increase in carbon sequestration by restoring drained wetlands, though possibly increasing CH4 emissions.
Based on the amount of wetlands converted to other land uses in Canada and the United States, restoring all wetland acreage, leading to a gross but highly unrealistic estimate of 43 Tg C per year.
Potential impacts on coastal zone development.
Increased protection of property from storms.
Reduced export of nutrients to the ocean.
Restored wetlands via improved flood abatement and water quality, but with only about 21% functional compared to functionality of undisturbed sites.
Continued on next page
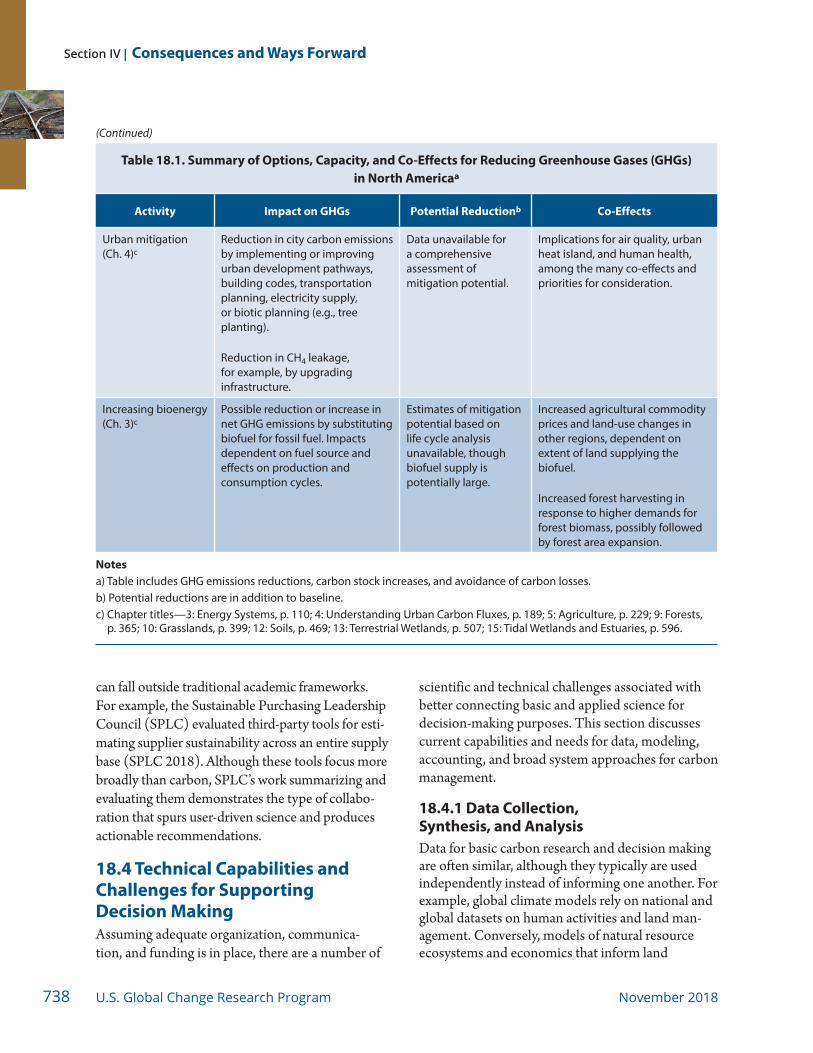
Section IV | Consequences and Ways Forward
738 U.S. Global Change Research Program November 2018
Table 18.1. Summary of Options, Capacity, and Co-Effects for Reducing Greenhouse Gases (GHGs) in North Americaa
Activity Impact on GHGs Potential Reductionb Co-Effects
Urban mitigation (Ch. 4)c
Reduction in city carbon emissions by implementing or improving urban development pathways, building codes, transportation planning, electricity supply, or biotic planning (e.g., tree planting).
Reduction in CH4 leakage, for example, by upgrading infrastructure.
Data unavailable for a comprehensive assessment of mitigation potential.
Implications for air quality, urban heat island, and human health, among the many co-effects and priorities for consideration.
Increasing bioenergy (Ch. 3)c
Possible reduction or increase in net GHG emissions by substituting biofuel for fossil fuel. Impacts dependent on fuel source and effects on production and consumption cycles.
Estimates of mitigation potential based on life cycle analysis unavailable, though biofuel supply is potentially large.
Increased agricultural commodity prices and land-use changes in other regions, dependent on extent of land supplying the biofuel.
Increased forest harvesting in response to higher demands for forest biomass, possibly followed by forest area expansion.
Notesa) Table includes GHG emissions reductions, carbon stock increases, and avoidance of carbon losses.b) Potential reductions are in addition to baseline.c) Chapter titles—3: Energy Systems, p. 110; 4: Understanding Urban Carbon Fluxes, p. 189; 5: Agriculture, p. 229; 9: Forests,
p. 365; 10: Grasslands, p. 399; 12: Soils, p. 469; 13: Terrestrial Wetlands, p. 507; 15: Tidal Wetlands and Estuaries, p. 596.
(Continued)
can fall outside traditional academic frameworks. For example, the Sustainable Purchasing Leadership Council (SPLC) evaluated third-party tools for esti-mating supplier sustainability across an entire supply base (SPLC 2018). Although these tools focus more broadly than carbon, SPLC’s work summarizing and evaluating them demonstrates the type of collabo-ration that spurs user-driven science and produces actionable recommendations.
18.4 Technical Capabilities and Challenges for Supporting Decision MakingAssuming adequate organization, communica-tion, and funding is in place, there are a number of
scientific and technical challenges associated with better connecting basic and applied science for decision-making purposes. This section discusses current capabilities and needs for data, modeling, accounting, and broad system approaches for carbon management.
18.4.1 Data Collection, Synthesis, and AnalysisData for basic carbon research and decision making are often similar, although they typically are used independently instead of informing one another. For example, global climate models rely on national and global datasets on human activities and land man-agement. Conversely, models of natural resource ecosystems and economics that inform land

Chapter 18 | Carbon Cycle Science in Support of Decision Making
739Second State of the Carbon Cycle Report (SOCCR2)November 2018
management require input on global changes in total land resources, commodity markets, and climate. A revised assessment of existing data, across disci-plines, could help basic and use-inspired research on carbon and also address interrelated climate and carbon research issues.
Inventory data on fossil fuel emissions and land emissions and sinks are estimated nationally (e.g., U.S. EPA 2016) and reported internationally under the United Nations Framework Convention on Climate Change (UNFCCC). Advances in carbon cycle science are reflected in carbon modeling and accounting used to produce the inventory data. For example, field experiments that collect data on fertilizer application methods and timing, livestock and manure management, soil management, and other activities can be incorporated into models that estimate GHG emissions, thereby refining the national carbon budget.
Inventory data provide information on emissions sources and sinks and how net emissions change with land management or fuel supplies. To be most useful for local and regional planning, these data often require spatial distribution (West et al., 2014) or additional information on land-cover, land-use, and ecosystem characteristics that may be provided by satellite remote-sensing or economic survey data. Integrating inventory and remote-sensing data can provide new data products to understand local and regional carbon dynamics (Huang et al., 2015) and to inform land-management and policy decisions. Using integrated data on land use and management in climate modeling activities may become increas-ingly important (Hurtt et al., 2011) to facilitate con-sideration of climate feedbacks in local and regional decision making.
Although inventory data often serve as the basis for understanding human-induced impacts on the carbon cycle and subsequent decision making on carbon mitigation strategies, other datasets can provide additional or complementary estimates. For example, fossil fuel emissions can be estimated by the production of fossil fuels (U.S. EPA 2016) or by the consumption of fossil fuels (Patarasuk
et al., 2016). The same is true for land-based emis-sions, which can be estimated using ground-level survey data from the Forest Inventory Analysis or the National Agricultural Statistics Service (West et al., 2011) or using atmospheric concentration data and modeled with atmospheric transport and inversion models (Schuh et al., 2013). The survey or inventory data represent “bottom-up” estimates while the atmospheric data represent a “top-down” approach. Reconciling data and approaches ben-efits both basic and applied science. Earth System Models (ESMs) require accurate base-level data and also need multiple ways to evaluate results. Sim-ilarly, inventory data used in models for decision making could benefit from alternative estimation approaches that evaluate existing inventory esti-mates ( Jacob et al., 2016). Also needed are contin-ued development and reconciling of data collection and modeling approaches to estimate carbon stocks and fluxes, requiring coordination among research-ers, decision makers, and funding sources (see Box 18.1, Key Data Needs for Decision Making on Terrestrial Carbon, p. 740).
18.4.2 Decision Support Tools for Carbon and Greenhouse Gas ManagementResearch models and decision support tools that can forecast future changes, as well as integrate and analyze current and past conditions, can provide solutions to challenges presented by climate change. At the broadest level, capabilities include assessment and decision-making tools that analyze feedbacks between human activities and the global carbon cycle. These capabilities can enable decision makers to 1) assess how changes in the carbon cycle will affect human activities and the ecosystems on which they depend and 2) evaluate how human activities—past, present, and future—impact the carbon cycle.
National GHG Inventories Critical for ModelingFor national-scale planning and in international agreements and negotiations, national GHG inven-tories have consistently been recognized as essential parts of the model-data system. Policy developments of the past few years have reinforced the global

Section IV | Consequences and Ways Forward
740 U.S. Global Change Research Program November 2018
recognition of the need for high-quality and regularly reported GHG inventories. Increasing numbers of developing (i.e., UNFCCC non-Annex 1) countries produce annual GHG inventories and submit them to the UNFCCC using an extensive set of guidelines for national GHG reporting based on IPCC GHG inventory reporting guidelines (IPCC 1996, 2003, 2006). Deforestation and forest degradation con-stitute a major source of carbon emissions in many developing countries; the Global Forest Observations Initiative (GFOI) has developed guidance for using remotely sensed and ground-based data for forest monitoring and reporting of reduced emissions from deforestation, forest degradation, and associated activities produced in cooperation with UN-REDD and Forest Carbon Partnership Facility (FCPF) ini-tiatives (http://www.gfoi.org/methods-guidance).
Most GHG inventories rest on estimates of the emissions associated with a particular activity (e.g., amount of CO2 emitted per amount of fuel com-busted). The factors that relate activities to emissions are called emissions factors. For sectors dominated by fossil fuels (e.g., power generation, transporta-tion, and manufacturing), emissions factors are well constrained (IPCC 2006). Therefore, the major limitation to estimating emissions accurately is the ability to collect, organize, and verify the activity data (e.g., numbers of transformers upgraded, hectares of perennial plants established for bioenergy, and num-ber of cattle raised on forage known to reduce CH4 production). For biogenic-driven GHG emissions, such as those associated with agriculture and for-estry, there is much greater variability in the emis-sions rate per unit of activity (e.g., N2O emissions per unit of fertilizer added) because of heterogeneity in climate and soil conditions and in management practices. Dynamic process-based models offer an alternative approach that can account for this heterogeneity (Del Grosso et al., 2002; Li 2007), but using these models requires sufficient capacity (e.g., trained staff, functioning institutions).
GHG inventories that use activity data and emis-sions factors (or activity-specific process modeling) are referred to as bottom-up approaches (see Sec-tion 18.4.1, p. 738). All national GHG inventories use this approach, which, by definition, attributes emissions sources and sinks to identifiable entities and activities and lends itself to policy applications to reduce emissions and incentivize sinks. Examples of spatially explicit, high-resolution model-data systems for major source categories include fossil fuel emissions (Gurney et al., 2012; Gurney et al., 2009), forest dynamics (USDA 2015), biofuels (Frank et al., 2011), and land-use change (Sleeter et al., 2012; Woodall et al., 2015). These data com-bine knowledge of biophysical processes with data on human activities and economics that can help municipalities or geopolitical regions understand and quantify carbon emissions and sinks, thereby informing decision making. Challenges to these bottom-up approaches, aside from improving data quality on both activities and emissions factors to
Box 18.1. Key Data Needs for Decision Making on Terrestrial Carbon• Collect and analyze inventory data that
observe and represent changes in carbon stocks associated with human drivers.
• Integrate inventory and remote-sensing data for inclusion in Earth System Models.
• Reconcile different carbon emissions and sink estimates to further improve inde-pendent and combined estimates.
• Explore and develop plausible scenarios for the influences of different demo-graphic, social, and geopolitical trends and developments in other sectors (e.g., energy) on terrestrial carbon.
• Refine and decrease uncertainty of esti-mates for land-based carbon emissions and stock changes.

Chapter 18 | Carbon Cycle Science in Support of Decision Making
741Second State of the Carbon Cycle Report (SOCCR2)November 2018
reduce uncertainties, include ensuring completeness and avoiding double-counting of sources.
Land-Use Emissions Projections and Examples of Sector-Specific ToolsIn addition to inventories, the carbon cycle science community develops projections that scale from local mitigation options to global impacts and, conversely, from global economic forces to local strategies. Many countries incorporate land-use emissions into their overall climate targets in some way, and these projections inform national and inter-national strategies to address CO2 emissions, carbon management options, and other sustainability goals. These estimates of future land-use sources and sinks are useful for decision making because they stem from a reliable, scientifically sound, and transparent process (U.S. Department of State 2016). Because this work reflects the development and use of new approaches in carbon cycle science, further work is widely acknowledged as being helpful to increasing the usefulness of land-use emissions projections.
Models and decision tools have also been designed to help industry, business, or other entities (e.g., universities, land-management agencies, farmers, and ranchers) assess their emissions and develop mitigation strategies. In a regulatory environment where emissions are in some way limited by law, models and decision tools are essential for planning, forecasting, and monitoring emissions reductions. These tools also are widely used in voluntary carbon accounting and reporting to generate and sell carbon credits from a variety of activities (CARB 2018).
Models and decision support tools for inventory and forecasting in the AFOLU sector at the scale of the farm, woodlot, or business have been developed and are increasingly deployed as tools to guide imple-mentation of government-sponsored conservation programs. These tools can help inform decisions to reduce the GHG footprint of agricultural commod-ities through supply-chain management by agricul-tural industries and to support agricultural offsets in carbon cap-and-trade systems (see examples below).
• COMET-Farm (cometfarm.nrel.colostate.edu; Paustian et al., 2018)—Helps farmers and other landowners estimate carbon benefits associ-ated with implementing practices supported by conservation programs of the USDA Natural Resources Conservation Service (Eve et al., 2014).
• Cool-Farm Tool (CFT; www.coolfarmtool.org/CoolFarmTool; Hillier et al., 2011)—A product of the Cool Farm Alliance, CFT is designed for use by farmers and is intended to support the Alliance’s global mission of enabling millions of growers to make more informed on-farm deci-sions that reduce their environmental impact.
• DNDC (Denitrification-Decomposition) process-based biogeochemical model (Li 2007)—Used by institutions like the California Air Resources Board to support CH4 reductions from rice farming as an agricultural GHG offset in California’s GHG emissions reduction pro-gram (Haya et al., 2016).
• ExACT (Ex-Ante Carbon balance Tool; www.fao.org/tc/exact/ex-act-home/en)—Estimates CO2 equivalent (CO2e)2 emissions based on a project’s implementation as compared to a “business-as-usual” scenario. Project designers can use ExACT as a planning tool to help priori-tize mitigation-activity terms.
• ALU (Agriculture and Land Use; www.nrel.colostate.edu/projects/ALUsoftware) national GHG inventory software—Assists countries in completing their national inventories. This tool was developed to meet a U.S. governmental priority of increasing the number of countries developing robust GHG inventories to create transparent, evidence-based understanding of global GHG emissions.
2 Carbon dioxide equivalent (CO2e): Amount of CO2 that would pro-duce the same effect on the radiative balance of Earth’s climate system as another greenhouse gas, such as methane (CH4) or nitrous oxide (N2O), on a 100-year timescale. For comparison to units of carbon, each kg CO2e is equivalent to 0.273 kg C (0.273 = 1/3.67). See Box P.2, p. 12, in the Preface for details.

Section IV | Consequences and Ways Forward
742 U.S. Global Change Research Program November 2018
• Climate Change, Agriculture, and Food Security–Mitigation Options Tool (CCAFS–MOT; ccafs.cgiar.org/mitigation-option-tool- agriculture)—Identifies practices in Africa, Asia, and Latin America that can reduce emis-sions and sequester carbon on agricultural lands. MOT prioritizes effective mitigation options for many different crops according to mitigation potential, considering current management practices, climate, and soil characteristics.
• National Oceanic and Atmospheric Administra-tion (NOAA) Annual Greenhouse Gas Index (toolkit.climate.gov/tool/annual-greenhouse-gas-index-aggi)—Compares the total combined warming effects of GHGs (including CO2, CH4, N2O, and chlorofluorocarbons) to their 1990 baseline levels.
• Bioenergy Atlas (toolkit.climate.gov/tool/biofuels-atlas)—Includes maps enabling the comparison of biomass feedstocks, biopower, and biofuels data from the U.S. Department of Energy (DOE), U.S. Environmental Protection Agency (EPA), and USDA. (Software hosted by DOE’s National Renewable Energy Laboratory.)
• Global Carbon Atlas (www.globalcarbonat-las.org)—Aggregates global carbon data to explore, visualize, and interpret global and regional carbon information and changes from both human activities and natural processes. (Supported by the Global Carbon Project, www.globalcarbonproject.org; and BNP Paribas.)
Comparable decision support tools for carbon management have been developed for other sectors. For example, USAID’s Clean Energy Emissions Reduction (CLEER) tool, based on internationally accepted methodologies, enables users to calculate changes in GHG emissions resulting from adoption of geothermal; wind; hydroelectric and solar energy generation; upgrades of transmission and distribu-tion systems; increases in building energy efficiency; heating, ventilation, and air conditioning system efficiency improvements; fuel switching; capture of
stranded natural gas by flaring; use of biomass for energy; and use of anaerobic digesters to capture CH4 from livestock manure (USAID 2018).
Complex, Multisector ModelingIntegrated Assessment Models merit particular attention because they constitute a distinct field of research and serve a unique role in decision support. Among decision support tools for carbon manage-ment, IAMs are unique in estimating economy-wide responses, including GHG emissions, to different management and policy options. The objective of these models is to capture the primary interactions and interdependencies between natural and human systems (e.g., economic sectors) through a series of scenarios that represent plausible policy inter-ventions (Weyent 2017). These models can help understand feedbacks among carbon sources and sinks at national and global scales (see Figure 18.3, p. 743), given specified emissions targets or imple-mentation of carbon strategies (Grassi et al., 2017; Iyer et al., 2015). Integrative modeling frameworks that include land sector, energy sector, transpor-tation, and other interconnected carbon sources and sinks have continued to develop more detailed model structures and higher-resolution data input (Kyle et al., 2011; Wise et al., 2014).
IAMs, designed to answer questions about carbon management, include 1) social and economic factors that drive GHG emissions as well as a representation of biogeochemical cycles that determine the fate of those emissions and 2) the effects on climate and human welfare. The dynamic interactions among sectors in these models mean that they can reveal nonintuitive outcomes. Actions in one sector or geography can influence those in another, and a common goal of carbon management policy is to limit the accumulation of CO2 in the atmosphere. Therefore, understanding the economy-wide influ-ences of policy choices is critical both to assess the actual consequences of a single policy on carbon accumulation in the atmosphere and to have a real-istic idea of the level of atmospheric CO2 that could be achieved with multiple countries and multiple policies.

Chapter 18 | Carbon Cycle Science in Support of Decision Making
743Second State of the Carbon Cycle Report (SOCCR2)November 2018
Continued efforts to integrate IAMs, ESMs, carbon accounting, and national-scale resource modeling will help develop consistency in data input across these modeling platforms. The combination of global IAMs, national and subnational natural resource economic models, carbon accounting methods, land-use change models, energy technol-ogy, and market analyses are all needed to estimate carbon management strategies in a comprehensive manner from the local to global scale (see Box 18.2, Carbon Modeling Needs for Decision Making, p. 744). As one example, a process using IAMs, global and national natural resource (i.e., timber) models, and inventory data (i.e., field surveys) was conducted in the development of the United States Mid-Century Strategy for Deep Decarbonization (White House 2016).
18.4.3 Carbon and Greenhouse Gas AccountingData and models that estimate changes in carbon flux often were not initially developed for estimating direct and indirect net carbon changes associated with given activities. This is true for country-level inventory data reported by sector (U.S. EPA 2016), biogeochemical cycle models (Del Grosso et al., 2002), and integrated climate models (Wise et al., 2009). In many cases, incorporating the influence of particular activities on upstream or downstream energy, land use, and associated GHG emissions significantly changes estimates of the realized car-bon savings. Full GHG accounting of all emissions related to a given activity can significantly augment or reduce reported emissions compared to partial or incomplete accounting.
Accounting of carbon fluxes and stock changes in ecosystems or industrial systems dates back to early work on energy input and output models and sys-tems modeling (Odum 1994) and has evolved rap-idly since then. A systems analysis can be developed to understand and quantify net carbon exchange associated with specific management activities (Schlamadinger and Marland 1996). Such analyses, for example, consider disturbance (e.g., widespread tree mortality and erosion from hurricanes or ice storms), forest regrowth over time, landscape area
boundary, and forest growth trends over time in the absence of disturbance (Lippke et al., 2011; Lippke et al., 2012). Fossil fuel offsets associated with har-vested wood and wood products are also included in these system-scale carbon budgets. These types of analyses often are conducted to illustrate the meth-ods and provide an averaged national answer. To be
Figure 18.3. Example of Results from a Global Inte-grated Assessment Model. The illustration considers (a) economic market dynamics, land-use change, land resources, and impacts on the carbon cycle that are associated with a high-biofuels mandate scenario. (b) Net change in cumulative emissions of carbon diox-ide (CO2) from land-use change and energy systems in high-biofuels scenarios is shown in comparison to the baseline. Key: EJ, exajoules; Pg, petagrams. [Figure source: Redrawn from Wise et al., 2014, copyright Else-vier, used with permission.]
(a)
(b)

Section IV | Consequences and Ways Forward
744 U.S. Global Change Research Program November 2018
useful for decision making, full carbon accounting would need to be conducted for regions that have obvious differences in ecosystem attributes, climate regimes, and social and economic drivers (see Box 18.3, Carbon Accounting Needs for Informing Deci-sion Making, this page).
Past development of carbon accounting methods suggests a number of basic carbon accounting guide-lines. Properly defining time and space boundaries of the system or activity of interest is an essential first step, and highlighted below are additional guidelines.
Stock Changes Are Less Prone to Error than Adding up All Biological Fluxes and Uptakes. This finding is currently guiding analyses by EPA’s Science Advisory Board Panel on Biogenic Emis-sions from Stationary Sources on net carbon emis-sions from the use of biomass for energy production (U.S. EPA 2014). The stock change approach also has been the chosen method for estimating net emissions from forests and agricultural soils (U.S. EPA 2016). Trying to simulate all fluxes in and out of a system is useful for understanding ecosystem processes and climate feedbacks, but the increased complexity may introduce additional error and uncertainty. In contrast, changes in carbon stocks inherently combine the net result of multiple fluxes into and out of a given stock entity. Differences in complex models and stock change methods are exemplified in an analysis by Hayes et al. (2012).
Accounting for Energy and Emissions One-Level Upstream and Downstream Is Often Sufficient to Capture Adequately the Total Flux Associated with an Activity of Interest. When estimating emissions associated with changes in fertilizer appli-cation rates, for example, the fuels used to process
Box 18.2. Carbon Modeling Needs for Decision Making• Link Integrated Assessment Models,
natural resource management models, and socioeconomic models for predic-tive capabilities such that regional scale analysis can be conducted while being informed and constrained by global eco-nomic market dynamics.
• Improve projections for national land-use emissions in the United States and other countries.
• Increase understanding of drivers of land-use change in different global regions.
• Evaluate model predictions through hind-casting, model diagnostics, and multi-model intercomparisons.
• Evaluate how scenario results change depending on the time step used (i.e., subannual to decadal), spatial resolution of model input data, and spatial extent of output.
• Assess and further develop uncertainty quantification methods for carbon-related modeling activities.
Box 18.3. Carbon Accounting Needs for Informing Decision Making• Elicit user needs for carbon accounting
through a two-way dialogue, and socialize the resulting needs and understanding in the carbon cycle science community.
• Conduct regionally specific carbon accounting for dominant activities in land management and fossil fuel management.
• Quantitatively understand how activities affect entire supply chains.
• Perform landscape-scale life cycle analysis that capture regional differences.

Chapter 18 | Carbon Cycle Science in Support of Decision Making
745Second State of the Carbon Cycle Report (SOCCR2)November 2018
the fertilizer (e.g., natural gas) should be considered (i.e., Level 1 upstream), but the energy used to mine the fuel (e.g., natural gas; Level 2 upstream) is often statistically insignificant (West and Marland 2002). Although exceptions should always be considered, accounting for emissions of both Level 1 upstream and downstream (e.g., transporting the fuel) of the activity of interest remains a good general rule.
Establishing the Proper Reference Point (System that Exists Prior to Changes in Management) Is Essential. The reference point is the current system, prior to a change in activity (see Figure 18.4, this page). The reference point should not be cho-sen at a time prior to the current activity (e.g., based on historical trends), nor should it be arbitrarily chosen before or after activities associated with the
new or alternative management. This issue is cur-rently debated in regard to some forest management techniques (Campbell et al., 2012; Hurteau and North 2009).
A Baseline Trajectory May Be Conceptually More Comprehensive Than a Reference Point But May Have More Uncertainty. Models that project changes in land use, fossil fuel combustion, or other GHG emissions can be particularly useful for understanding future scenarios. However, the trend line for the future trajectory can be uncer-tain, and using baselines to compare new or alter-native systems should only be done with caution (Buchholz et al., 2014). The use of a reference point or baseline should be decided based on the certainty associated with baseline projections (see Figure
Figure 18.4. Illustration of Basic Hypothetical Carbon Accounting Scenario. Accounting begins at (a) the refer-ence point and continues through time with the (b) reference line or the (c) estimated baseline, and the (d) observed or estimated impact of alternative management. Depending on the use of a reference line or baseline, the carbon savings in this hypothetical scenario would be comparatively (e) less or (f) greater, respectively.

Section IV | Consequences and Ways Forward
746 U.S. Global Change Research Program November 2018
18.4). For example, a baseline of forest growth (e.g., increased growth until forest maturation) is well established in forest growth curves, whereas future changes in land use based on commodity markets is less certain. There may also be policy considerations that influence whether baselines or reference points are more appropriate for a given context.
18.4.4 Systems Approach for Decision MakingCombining several of the aforementioned capabili-ties (e.g., data collection, modeling, and accounting) can help facilitate the use of research products for both decision making and the next generation of new relevant scientific analyses (West et al., 2013). Data assimilation systems have been under development to bring together inventory-based datasets, atmo-spheric modeling, global land models, and account-ing procedures. Integrating these research areas using data assimilation, where appropriate, can help researchers explore data similarities and differences, reconcile data differences, and potentially integrate datasets to attain enhanced data products or model results with reduced bias, reduced uncertainty, and improved agreement with observations. Past efforts include 1) a project in the midwestern United States (Ogle et al., 2006), 2) a North American continen-tal analysis (Hayes et al., 2012; Huntzinger et al., 2012), and 3) similar analyses in Europe (Le Quéré et al., 2015). Of these analyses, those for the mid-western United States and Europe resulted in little to no statistical difference between bottom-up and top-down emissions estimates, indicating promising capability in using one method to constrain another and in integrating methods for a more comprehen-sive and potentially more accurate estimate. There also is an indication that atmospheric inversion model estimates (i.e., top-down estimates) can be useful in smaller regions, but they are potentially less informative or accurate at continental or global scales (Lauvaux et al., 2012). Accounting issues also were identified and resolved between atmospheric estimates and terrestrial-based estimates so that the two methods could be compared and contrasted, contributing to a new lexicon that helped define land-based fluxes in a manner consistent with fluxes
observed from atmospheric measurements (Chapin et al., 2006; Hayes and Turner 2012).
Although reconciling bottom-up and top-down estimates can help build confidence in existing estimates, thereby forming a stronger foundation for decision making, other existing modeling systems could be combined to improve national and global decision making about carbon. Largely independent efforts continue for climate modeling, land-use modeling, global and regional economic modeling, and energy modeling. Coordinating these modeling activities so that, at a minimum, output from one model can be used as input for other models would help in coordinating decisions that inherently affect or are affected by climate, land use, and energy pro-duction and consumption (see Figure 18.1, p. 730). This effort would require high-level coordination among research organizations that support model-ing in different research fields covering fundamental, applied, and social sciences (see Box 18.4, Research Needs for Integrative Observation and Monitoring Systems, this page).
Box 18.4. Research Needs for Integrative Observation and Monitoring Systems• Couple life cycle analysis models with
Integrated Assessment Models to under-stand carbon impacts associated with specific activities.
• Use inventory-based land-cover and land-use data in Earth System Models, so that global and regional outputs from carbon-climate models are more useful for decision making.
• Continue research efforts on different methods of observing and modeling car-bon sinks and emissions so that existing inventory estimates can be improved and more complete.

Chapter 18 | Carbon Cycle Science in Support of Decision Making
747Second State of the Carbon Cycle Report (SOCCR2)November 2018
18.5 Pathways for Science to Support Decision MakingCarbon cycle science to date has made significant advancements in understanding carbon dynamics and feedbacks between global carbon and climate. For these advances to be more useful in decision making, increased understanding and quantifica-tion are needed regarding how individual activities affect carbon sinks and emissions, both directly and indirectly. This information would aid accounting of energy consumption, fossil fuel combustion, as well as land-related emissions and sinks (see Table 18.2, this page). Science-based estimates of net emissions associated with activities, complete with statistical uncertainty, may then be scaled up using relatively high resolution data on environmental conditions and human activities. This information then can be used to better understand how decisions under
consideration by public and private entities may impact carbon sources and sinks.
Many land-management decisions at the U.S. Fed-eral and state level (i.e., conservation programs) over the past decade could not have been made without the previous generation of work on carbon cycle science and efforts that supported basic research, fostered co-production of knowledge, and linked scientific inputs with the needs for inventories, assessments, projections, and decision making. Yet, with the evolving interests of communities and policymakers, as well as new policy requirements for implementing and setting national goals, new needs have emerged that emphasize input from the scientific community at the international, national, and subnational levels. Establishing strong partner-ships among scientists, stakeholders, and funding sources may be essential for making effective use of carbon-related research over the coming years.
Table 18.2. Research to Support Carbon Cycle Decision Making
Decision-Making Goal Information Gap Research Activity Need
Prioritize activities and geographic regions for soil carbon sequestration and net greenhouse gas (GHG) emissions reductions.
Predict changes in soil carbon based on regional changes in land-management practices.
Calibrate existing soil models with field data and develop multivariate meta-analyses of field data.
Consider carbon stock changes in private and public forest management plans.
Understand net carbon stock changes associated with land-management strategies.
Assess forest carbon stocks and net changes in stocks at the regional and landscape levels associated with fire, regrowth, harvesting, thinning, and wildfire management.
Consider carbon stock changes in land-use planning and in legislation and policies that affect national and global land use.
Understand the connections between direct and indirect land-use change and national and global changes in population, diet, affluence, technology, energy, and water use.
Integrate science-based carbon stock and flux estimates, including uncertainty estimates, with global and regional socioeconomic models.
Increase the use of bioenergy, bioproducts, and renewable energy.
Compare net emissions of alternative technologies to existing technologies and capture regional differences, if warranted.
Conduct life cycle analyses (LCAs) for all proposed bioenergy, bioproducts, and renewable technologies and compare these analyses with LCAs for fossil fuel technologies.
Continued on next page

Section IV | Consequences and Ways Forward
748 U.S. Global Change Research Program November 2018
Table 18.2. Research to Support Carbon Cycle Decision Making
Decision-Making Goal Information Gap Research Activity Need
Incentivize sustainable bioenergy. Develop accurate bioenergy emissions accounting at individual facilities.
Calibrate existing forestry models to accurately reflect forest owner planting responses to market signals.
Protect vulnerable high-carbon landscapes.
Identify land areas at high risk of settlement conversion.
Project trends in urban development and land-management choices.
Maximize carbon mitigation on lands at risk of natural disturbance.
Project natural disturbances and their carbon impacts.
Develop region-specific carbon accounting protocols and management guidance.
Optimize national gross domestic production (GDP), its factors, and GHG emissions.
Understand factors of GDP and emissions and how those factors can be used to decrease emissions while positively affecting GDP.
Include GHG emissions in analyses of GDP and national economic growth.
Optimize energy production and consumption for reduced carbon emissions.
Understand fuel mixes, substitutes, combustion efficiencies, energy intensity, and carbon intensity associated with energy production and use.
Develop and integrate models that investigate carbon intensity of fuel use at local to national scales, with feedbacks to other related sectors (e.g., land resources and bioenergy).
(Continued)

749Second State of the Carbon Cycle Report (SOCCR2)November 2018
Supporting Evidence | Chapter 18 | Carbon Cycle Science in Support of Decision Making
SUPPORTING EVIDENCE
KEY FINDING 1Co-production of knowledge via engagement and collaboration between stakeholder communi-ties and scientific communities can improve the usefulness of scientific results by decision makers (high confidence).
Description of evidence baseUnderstanding what is useful for decision making can help guide development of science more effectively (Lemos and Morehouse 2005; Moser 2009). In many cases, this development requires little extra time or funding and can be as simple as understanding the formatting of information. For example, experimental data on carbon emissions may be generated daily and at a local level, but information on an annual timescale and at the geopolitical level often is needed to inform decisions. In other cases, matching model results with existing decision-making processes will take time and changes to models and processes. Stakeholder engagement has resulted in the use of science results to support decision making for a number of activities, including 1) new modeling capabilities to estimate national forest carbon and attribution of carbon stock changes (Woodall et al., 2015), 2) methods for estimating methane (CH4) emissions (Turner et al., 2016), and 3) policy-relevant soil management (Paustian et al., 2016). Boundary organizations that bring together a cross-section of disciplines have been successful in promoting fundamental science that is useful to decision makers (Brown et al., 2016). Inherent in the communication and coordination of science and decision makers regarding Key Finding 1 will be the need to revisit, understand, and define the boundaries among science, policy, and management, as well as fundamental science, use-inspired science, and applied science (Moser 2009). Defining these boundaries will help guide and support the co-production of knowledge.
Major uncertaintiesThe co-production of knowledge is limited by the success and effectiveness of communication, and the certainty of success depends on the process of engagement.
Assessment of confidence based on evidence and agreement, including short description of nature of evidence and level of agreementCommunicating information and data formatting needs for carbon stock changes, estimates of net emissions associated with specific activities, and projections of carbon stock and net emis-sions with uncertainty estimates has helped guide field work, observations, and modeling to meet these needs.
Summary sentence or paragraph that integrates the above information Carbon-related research that is co-produced by scientists and decision makers helps ensure that science results address questions posed by decision makers. The result for Key Finding 1 is robust science that is useful for addressing societal issues. The likelihood of success is high, based on past successes, and the effectiveness is often determined by the level of participation.

750 U.S. Global Change Research Program November 2018
Section IV | Consequences and Ways Forward
KEY FINDING 2Integrating data on human drivers of the carbon cycle into Earth system and ecosystem models improves representation of carbon-climate feedbacks and increases the usefulness of model out-put to decision makers (high confidence).
Description of evidence baseFor Key Finding 2, the impacts of human management activities on carbon stocks have been ana-lyzed and documented for entity-scale greenhouse gas estimation of agricultural activities (Eve et al., 2014). This information is being integrated into models for use by agricultural land managers. For U.S. forests, attribution of human and natural influences (e.g., harvesting, natural disturbance, and forest age) has been successfully disaggregated using field data and models (Woodall et al., 2015) to help inform decision makers. Finally, to better represent human drivers on climate, car-bon stocks, and commodity production and consumption at the global scale, human drivers rep-resenting land management are being integrated into Earth System Models (ESMs); Drewniak et al., 2013), and the management of land, energy, and fossil fuels is included in Integrated Assessment Models (IAMs; Chaturvedi et al., 2013; Le Page et al., 2016). As human drivers con-tinue to be included in scientific research models, these models will continue to better represent actual local and global dynamics, thereby becoming more useful for decision making.
Major uncertaintiesWhile inclusion of human drivers in estimates of carbon cycle fluxes and stock changes often results in more useful information for decision making, it also can result in a higher number of model parameters, which can increase statistical uncertainty and variability of model results. However, this increased statistical uncertainty does not necessarily reduce the usefulness of find-ings for decision making, particularly if the uncertainty is a uniform bias or a broader confidence interval surrounding a stable trend.
Assessment of confidence based on evidence and agreement, including short description of nature of evidence and level of agreementContinued inclusion of human drivers within ecosystem models and ESMs will better represent the influence of human activities on the carbon cycle, thereby improving the usefulness of results to decision makers.
Summary sentence or paragraph that integrates the above information Inclusion of human drivers in carbon cycle models increases the accuracy of models and gener-ates model output that is more useful for decision making. For Key Finding 2, statistical uncer-tainty may increase or decrease based on the change in model complexity.
KEY FINDING 3Attribution, accounting, and projections of carbon cycle fluxes increase the usefulness of carbon cycle science for decision-making purposes (very high confidence).
Description of evidence baseCarbon cycle fluxes by themselves, both observed and estimated, are useful to understand carbon cycle processes but not particularly useful for decision making. Changes in net emissions asso-ciated with changes in human activities in the past, present, and future are particularly useful.

751Second State of the Carbon Cycle Report (SOCCR2)November 2018
Supporting Evidence | Chapter 18 | Carbon Cycle Science in Support of Decision Making
Placing emissions in the context of a baseline or business-as-usual scenario, compared to alterna-tive or new management, is necessary. For Key Finding 3, it is the relative change in carbon stocks and emissions associated with activities, along with tracing these activities to their functions in human well-being, that is most needed by decision makers (see Ch. 6: Social Science Perspec-tives on Carbon, p. 264). This information often is embedded in science-based models, but to be useful it must be aggregated or synthesized using established carbon accounting protocols.
Carbon accounting of direct and indirect impacts of bioenergy production and consumption has been analyzed (Adler et al., 2007) and included in energy and natural resource economic models (Frank et al., 2011; Mu et al., 2015). While carbon accounting in forestry has a long history of development (Schlamadinger and Marland 1996), there remain issues and debate around the effects of wildfire management on net emissions (Campbell et al., 2012; Hurteau and North 2009) and the use of wood products to offset emissions (Lippke et al., 2011; McKinley et al., 2011). Much of the debate surrounds a relatively new finding that conducting carbon accounting and life cycle analysis at the landscape scale is more representative of the net impact of policies and practices on carbon stocks than doing so at a field or plot scale (Galik and Abt 2012; Johnson 2009). Skog et al. (2014) provides a recent summary of practices that are most effective for reducing net emissions. Developing consistency in accounting and projections across the energy and land sector, along with the tools needed to represent upstream, downstream, and landscape-scale impacts, would be useful for decision making.
Major uncertaintiesRepresentation of net carbon fluxes will become more accurate with the inclusion of established carbon accounting methods. This is evident in the science publication record that illustrates con-vergence of net emissions estimates associated with changes in management.
Assessment of confidence based on evidence and agreement, including short description of nature of evidence and level of agreementEstimating net carbon emissions using established and state-of-the-art carbon accounting meth-ods will increase the usefulness of carbon cycle science results for decision makers. Conducting more research in this area, particularly among researchers involved in carbon accounting and basic carbon cycle science, will be essential to generating science-based findings useful for deci-sion making.
Estimated likelihood of impact or consequence, including short description of basis of estimateImprovements in projection capabilities very likely will help guide decisions associated with energy, land use, and the carbon cycle. Increased use and development of accounting and attribu-tion methods also are highly likely to improve the understanding of changes in carbon stocks and emissions and the application of this understanding to decision making.
Summary sentence or paragraph that integrates the above information For Key Finding 3, different methods of carbon accounting result in different estimates of carbon stocks and emissions, thereby resulting in inconsistent science results. Use of established carbon accounting methods by researchers in carbon cycle science research will increase consistency in carbon emissions estimates associated with given activities, thereby providing more useful informa-tion to decision makers and more useful metrics for comparison within the research community.

752 U.S. Global Change Research Program November 2018
Section IV | Consequences and Ways Forward
KEY FINDING 4Developing stronger linkages among research disciplines for Earth system processes, carbon man-agement, and carbon prediction, with a focus on consistent and scalable datasets as model inputs, will improve joint representation of natural and managed systems needed for decision making (high confidence).
Description of evidence baseIntegration and coordination among global climate models, land models, and IAMs are occur-ring. National land management models and natural resource economic models also are becom-ing increasingly integrated. However, there remains a gap between global climate and IAMs and national land-use and economic models. The latter are used more often for decision making, but the former are critical in understanding global feedbacks among carbon, climate, economics, and land-use change. For Key Finding 4, increased communication and links between global drivers and subnational dynamics that impact carbon (Beach et al., 2015; de Vries et al., 2013; Kraucunas et al., 2014; Verburg et al., 2009) could help develop comprehensive science-based systems to better inform decision making. Efforts like this will depend on cross-sectoral and cross-scale research to better understand how to integrate or link needed components and scales.
Major uncertaintiesUncertainties exist in successful development of models across scales (e.g., local, regional, conti-nental, and global).
Assessment of confidence based on evidence and agreement, including short description of nature of evidence and level of agreementA more complete picture of carbon dynamics across scales, using more realistic representation of actual stocks and emissions, will increase the accuracy of carbon models and their use by deci-sion makers.
Estimated likelihood of impact or consequence, including short description of basis of estimateThe likelihood of impacts is high, although developing links between national- and global-scale data and models can be challenging, and success is less certain.
Summary sentence or paragraph that integrates the above information For Key Finding 4, connections between global biogeochemistry and climate models with subnational land management models will be useful to understand the feedbacks between global carbon cycles and carbon management activities. Linking models or model output and input is often challenging and includes a level of inherent uncertainty.

Chapter 18 | Carbon Cycle Science in Support of Decision Making
753Second State of the Carbon Cycle Report (SOCCR2)November 2018
REFERENCES
Adler, P. R., S. J. Del Grosso, and W. J. Parton, 2007: Life-cycle assessment of net greenhouse-gas flux for bioenergy cropping systems. Ecological Applications, 17(3), 675-691, doi: 10.1890/05-2018.
Beach, R. H., Y. Cai, A. Thomson, X. Zhang, R. Jones, B. A. McCarl, A. Crimmins, J. Martinich, J. Cole, S. Ohrel, B. DeAngelo, J. McFarland, K. Strzepek, and B. Boehlert, 2015: Climate change impacts on US agriculture and forestry: Benefits of global climate stabilization. Environmental Research Letters, 10(9), 095004, doi: 10.1088/1748-9326/10/9/095004.
Benjaafar, S., Y. Li, and M. Daskin, 2013: Carbon footprint and the management of supply chains: Insights from simple models. IEEE Transactions on Automation Science and Engineering, 10(1), doi: 10.1109/TASE.2012.2203304.
Birdsey, R., G. Angeles-Perez, W. A. Kurz, A. Lister, M. Olguin, Y. Pan, C. Wayson, B. Wilson, and K. Johnson, 2013: Approaches to monitoring changes in carbon stocks for REDD+. Carbon Manage-ment, 4, 519–537, doi: 10.4155/cmt.13.49.
BLM, 2016: Proposed Resource Management Plan/Final Environmen-tal Impact Statement for the Resource Management Plans for Western Oregon. U.S. Department of Interior, Bureau of Land Management. [https://www.blm.gov/or/plans/rmpswesternoregon/feis/]
Brandt, A. R., G. A. Heath, E. A. Kort, F. O’Sullivan, G. Petron, S. M. Jordaan, P. Tans, J. Wilcox, A. M. Gopstein, D. Arent, S. Wofsy, N. J. Brown, R. Bradley, G. D. Stucky, D. Eardley, and R. Har-riss, 2014: Energy and environment. Methane leaks from North American natural gas systems. Science, 343(6172), 733-735, doi: 10.1126/science.1247045.
Brown, M. E., and V. M. Escobar, 2013: Professional review of the pre-launch smap mission applications user community. IEEE Journal of Special Topics and Applied Remote Sensing, 7(1), 277-283, doi: 10.1109/JSTARS.2013.2261473.
Brown, M. E., M. Ihli, O. Hendrick, S. Delgado-Arias, V. M. Escobar, and P. Griffith, 2016: Social network and content analysis of the North American carbon program as a scientific community of practice. Social Networks, 44, 226-237, doi: 10.1016/j.soc-net.2015.10.002.
Buchholz, T., S. Prisley, G. Marland, C. Canham, and N. Sampson, 2014: Uncertainty in projecting GHG emissions from bioenergy. Nature Climate Change, 4(12), 1045-1047, doi: 10.1038/ncli-mate2418.
Burke, M., W. M. Dais, and N. S. Diffenbaugh, 2018: Large poten-tial reduction in economic damages under UN mitigation targets. Nature, 557, 549-553, doi: 10.1038/s41586-018-0071-9.
Campbell, J. L., M. E. Harmon, and S. R. Mitchell, 2012: Can fuel-reduction treatments really increase forest carbon storage in the Western U.S. by reducing future fire emissions? Frontiers in Ecology and the Environment, 10(2), 83-90, doi: 10.1890/110057.
CARB, 2018: Compliance Offset Program. California Air Resources Board. [https://www.arb.ca.gov/cc/capandtrade/offsets/offsets.htm]
Carbon Neutral Cities Alliance, 2018: [http://carbonneutralcities.org]
Cartus, O., J. Kellndorfer, W. Walker, C. Franco, J. Bishop, L. Santos, and J. M. M. Fuentes, 2014: A national, detailed map of forest aboveground carbon stocks in Mexico. Remote Sensing, 6(6), 5559-5588, doi: 10.3390/rs6065559.
Cash, D. W., W. N. Adger, F. Berkes, P. Garden, L. Lebel, P. Olsson, L. Pritchard, and O. Young, 2006: Scale and cross-scale dynamics: Governance and information in a multilevel world. Ecology and Society, 11(2), 1-8.
CCSP, 2007: First State of the Carbon Cycle Report (SOCCR): The North American Carbon Budget and Implications for the Global Carbon Cycle. A Report by the U.S. Climate Change Science Program and the Subcommittee on Global Change Research. [A. W. King, L. Dilling, G. P. Zimmerman, D. M. Fairman, R. A. Houghton, G. Marland, A. Z. Rose, and T. J. Wilbanks (eds.)]. National Oceanic and Atmospheric Administration, National Climatic Data Center, Asheville, NC, USA, 242 pp.
Chapin, F. S., G. M. Woodwell, J. T. Randerson, E. B. Rastetter, G. M. Lovett, D. D. Baldocchi, D. A. Clark, M. E. Harmon, D. S. Schimel, R. Valentini, C. Wirth, J. D. Aber, J. J. Cole, M. L. Goulden, J. W. Harden, M. Heimann, R. W. Howarth, P. A. Matson, A. D. McGuire, J. M. Melillo, H. A. Mooney, J. C. Neff, R. A. Houghton, M. L. Pace, M. G. Ryan, S. W. Running, O. E. Sala, W. H. Schlesinger, and E. D. Schulze, 2006: Reconciling carbon-cycle concepts, terminology, and methods. Ecosystems, 9(7), 1041-1050, doi: 10.1007/s10021-005-0105-7.
Chaturvedi, V., S. Kim, S. J. Smith, L. Clarke, Y. Y. Zhou, P. Kyle, and P. Patel, 2013: Model evaluation and hindcasting: An exper-iment with an integrated assessment model. Energy, 61, 479-490, doi: 10.1016/j.energy.2013.08.061.
Cherubini, F., G. P. Peters, T. Berntsen, A. H. Stromman, and E. Hertwich, 2011: CO2 emissions from biomass combustion for bioenergy: Atmospheric decay and contribution to global warming. Global Change Biology Bioenergy, 3(5), 413-426, doi: 10.1111/j.1757-1707.2011.01102.x.
Christopher, M., 2011: Logistics and Supply Chain Management, 4th Ed. Prentice Hall. London. 276 pp.
CISCO, 2017: Corporate Social Responsibility Report. CISCO. [https://www.cisco.com/c/dam/assets/csr/pdf/CSR-Report-2017.pdf]
Clark, W. C., T. P. Tomich, M. van Noordwijk, D. Guston, D. Catacutan, N. M. Dickson, and E. McNie, 2016: Boundary work for sustainable development: Natural resource management at the Consultative Group on International Agricultural Research. Proceedings of the National Academy of Sciences USA, 113(17), 4615-4622, doi: 10.1073/pnas.0900231108.

Section IV | Consequences and Ways Forward
754 U.S. Global Change Research Program November 2018
Climate Action Reserve, 2018: Protocols. [http://www.climateac-tionreserve.org/how/protocols/]
Consolidated Edison, 2016: Sustainability Report. [https://www.conedison.com/ehs/2016-sustainability-report/index.html]
de Vries, F. T., E. Thebault, M. Liiri, K. Birkhofer, M. A. Tsiafouli, L. Bjornlund, H. Bracht Jorgensen, M. V. Brady, S. Christensen, P. C. de Ruiter, T. d’Hertefeldt, J. Frouz, K. Hedlund, L. Hemerik, W. H. Hol, S. Hotes, S. R. Mortimer, H. Setala, S. P. Sgardelis, K. Uteseny, W. H. van der Putten, V. Wolters, and R. D. Bardgett, 2013: Soil food web properties explain ecosystem services across European land use systems. Proceedings of the National Academy of Sciences USA, 110(35), 14296-14301, doi: 10.1073/pnas.1305198110.
Del Grosso, S., D. Ojima, W. Parton, A. Mosier, G. Peterson, and D. Schimel, 2002: Simulated effects of dryland cropping intensifi-cation on soil organic matter and greenhouse gas exchanges using the DAYCENT ecosystem model. Environmental Pollution, 116, S75-S83, doi: 10.1016/s0269-7491(01)00260-3.
Deschamps Ramírez, P., and A. M. Larson, 2017: The Politics of REDD+ MRV in Mexico: The Interplay of the National and Subna-tional Levels. CGIAR Program on Forests, Trees, and Agroforestry. [http://www.cifor.org/publications/pdf_files/OccPapers/OP-171.pdf]
Dilling, L., 2007: Towards science in support of decision making: Characterizing the supply of carbon cycle science. Environmental Science and Policy, 10(1), 48-61, doi: 10.1016/j.envsci.2006.10.008.
Dilling, L., and M. C. Lemos, 2011: Creating usable science: Opportunities and constraints for climate knowledge use and their implications for science policy. Global Environment Change, 21(2), 680-689.
Drewniak, B., J. Song, J. Prell, V. R. Kotamarthi, and R. Jacob, 2013: Modeling agriculture in the community land model. Geoscientific Model Development, 6(2), 495-515, doi: 10.5194/gmd-6-495-2013.
Elizondo, A., V. Pérez-Cirera, A. Strapasson, J. C. Fernández, and D. Cruz-Cano, 2017: Mexico’s low carbon futures: An integrated assessment for energy planning and climate change mitigation by 2050. Futures 93, 14-26, doi: 10.1016/j.futures.2017.08.003.
Eve, M., D. Pape, M. Flugge, R. Steele, D. Man, M. Riley-Gilbert, and S. Biggar, 2014: Quantifying Greenhouse Gas Fluxes in Agricul-ture and Forestry: Methods for Entity-Scale Inventory. USDA Office of the Chief Economist, Climate Change Program Office. USDA Technical Bulletin 1939. [http://www.usda.gov/oce/climate_change/estimation.htm]
Federal Register, 2016a: Oil and natural gas sector: Emissions standards for new, reconstructed, and modified sources. U.S. Envi-ronmental Protection Agency 40 CFR part 60. Federal Register 81(107), 35824-35942. [https://www.federalregister.gov/docu-ments/2016/06/03/2016-11971/oil-and-natural-gas-sector-emis-sion-standards-for-new-reconstructed-and-modified-sources]
Federal Register, 2016b: Waste prevention, production subject to royalties, and resource conservation. Bureau of Land Man-agement 43 CFR parts 3100, 3160, and 3170. Federal Register 81(25): 6616-6686. [https://www.federalregister.gov/docu-ments/2016/11/18/2016-27637/waste-prevention-produc-tion-subject-to-royalties-and-resource-conservation]
Frank, E. D., J. Han, I. Palou-Rivera, A. Elgowainy, and M. Q. Wang, 2011: Life-cycle Analysis of Algal Lipid Fuels with the GREET Model. Center for Transportation Research, Argonne National Laboratory. ANL/ESD/11-5. [https://greet.es.anl.gov/publication-algal-lip-id-fuels]
Frankenberg, C., A. K. Thorpe, D. R. Thompson, G. Hulley, E. A. Kort, N. Vance, J. Borchardt, T. Krings, K. Gerilowski, C. Sweeney, S. Conley, B. D. Bue, A. D. Aubrey, S. Hook, and R. O. Green, 2016: Airborne methane remote measurements reveal heavy-tail flux distribution in four corners region. Proceedings of the National Academy of Sciences USA, 113(35), 9734-9739, doi: 10.1073/pnas.1605617113.
Fricko, O., P. Hvlik, J. Rogelj, Z. Klimont, M. Gusti, N. Johnson, P. Kolp, M. Strubegger, H. Vali, M. Amann, T. Ermolieva, N. Forsell, M. Herroro, C. Heyes, G. Kindermann, V. Krey, D. L. McCollum, M. Obersteiner, S. Pachauri, S. Rao, E. Schmid, W. Schoepp, and K. Riahi, 2017: The marker quantification of the Shared Socio-economic Pathway 2: A middle-of-the-road scenario for the 21st century. Global Environmental Change, 42, 251-267.
Galik, C. S., and R. C. Abt, 2012: The effect of assessment scale and metric selection on the greenhouse gas benefits of woody biomass. Biomass and Bioenergy, 44, 1-7, doi: 10.1016/j.biom-bioe.2012.04.009.
Georgetown Climate Center, 2017: Lessons in Regional Resilience: The Southeast Florida Regional Climate Change Compact. [https://www.georgetownclimate.org/files/report/GCC-Lessons-in-Re-gional-Resilience-SE_FL_Compact-Jan_2017-v2.pdf]
Gonzalez, G., 2014: VCS Sees REDD in California Carbon. Ecosys-tem Marketplace. [https://www.forest-trends.org/ecosystem_mar-ketplace/vcs-sees-redd-in-california-carbon/]
Grassi, G., J. House, F. Dentener, S. Federici, M. den Elzen, and J. Penman, 2017: The key role of forests in meeting climate targets requires science for credible mitigation. Nature Climate Change, 7 220-228, doi: 10.1038/NCLIMATE3227.
Griscom, B. W., J. Adams, P. W. Ellis, R. A. Housghton, G. Lomax, D. A. Miteva, W. H. Schlesinger, D. Shock, J. V. Siikamaki, P. Smith, P. Woodbury, C. Zganjar, A. Blackman, J. Campri, R. T. Conant, C. Delgado, P. Elias, T. Gopalakrishna, M. R. Hamsik, M. Herrero, J. Kiesecker, E. Landis, L. Laestadius, S. M. Leavitt, S. Minnemeyer, S. Polasky, P. Potapov, F. E. Putz, J. Sanderman, M. Silvius, E. Wollenberg, and J. Fargione, 2017: Natural Climate Solutions. Proceedings of the National Academy of Sciences USA, 114, 11645-11650, doi: 10.1073/pnas.1710465114.

Chapter 18 | Carbon Cycle Science in Support of Decision Making
755Second State of the Carbon Cycle Report (SOCCR2)November 2018
Gurney, K. R., D. L. Mendoza, Y. Y. Zhou, M. L. Fischer, C. C. Miller, S. Geethakumar, and S. D. Du Can, 2009: High resolution fossil fuel combustion CO2 emission fluxes for the United States. Environmental Science and Technology, 43(14), 5535-5541, doi: 10.1021/es900806c.
Gurney, K. R., I. Razlivanov, Y. Song, Y. Zhou, B. Benes, and M. Abdul-Massih, 2012: Quantification of fossil fuel CO2 emissions on the building/street scale for a large U.S. city. Environmental Science and Technology, 46(21), 12194-12202, doi: 10.1021/es3011282.
Haya, B., A. Strong, E. Grubert, and D. Cullenward, 2016: Carbon offsets in California: Science in the policy development process. In: Communicating Climate-Change and Natural Hazard Risk and Cultivating Resilience, [ J. L. Drake, Y. Y. Kontar, J. C. Eichelberger, S. T. Rupp, and K. M. Taylor (eds.)]. Springer, pp. 241-254.
Hayes, D. J., D. P. Turner, G. Stinson, A. D. McGuire, Y. Wei, T. O. West, L. S. Heath, B. Jong, B. G. McConkey, R. A. Birdsey, W. A. Kurz, A. R. Jacobson, D. N. Huntzinger, Y. Pan, W. M. Post, and R. B. Cook, 2012: Reconciling estimates of the contemporary North American carbon balance among terrestrial biosphere models, atmospheric inversions, and a new approach for esti-mating net ecosystem exchange from inventory-based data. Global Change Biology, 18(4), 1282-1299, doi: 10.1111/j.1365-2486.2011.02627.x.
Hayes, D., and D. Turner, 2012: The need for “apples-to-apples” comparisons of carbon dioxide source and sink estimates. Eos, Transactions American Geophysical Union, 93(41), 404-405, doi: 10.1029/2012eo410007.
Hillier, J., C. Walter, D. Malin, T. Garcia-Suarez, L. Mila-i-Canals, and P. Smith, 2011: A farm-focused calculator for emissions from crop and livestock production. Environmental Modelling and Soft-ware, 26(9), 1070-1078, doi: 10.1016/j.envsoft.2011.03.014.
Hsu, C.-W., T.-C. Juo, S.-H. Chen, and A. H. Hu, 2013: Using DEMATEL to develop a carbon management model of supplier selection in green supply chain management. Journal of Cleaner Production, 56, 164-172, doi: 10.1016/j.jclepro.2011.09.012.
Huang, W., A. Swatantran, K. Johnson, L. Duncanson, H. Tang, J. O’Neil Dunne, G. Hurtt, and R. Dubayah, 2015: Local discrepan-cies in continental scale biomass maps: A case study over forested and non-forested landscapes in Maryland, USA. Carbon Balance and Management, 10, 19, doi: 10.1186/s13021-015-0030-9.
Huntzinger, D. N., W. M. Post, Y. Wei, A. M. Michalak, T. O. West, A. R. Jacobson, I. T. Baker, J. M. Chen, K. J. Davis, D. J. Hayes, F. M. Hoffman, A. K. Jain, S. Liu, A. D. McGuire, R. P. Neilson, C. Potter, B. Poulter, D. Price, B. M. Raczka, H. Q. Tian, P. Thornton, E. Tomelleri, N. Viovy, J. Xiao, W. Yuan, N. Zeng, M. Zhao, and R. Cook, 2012: North American Carbon Program regional interim synthesis: Terrestrial biospheric model intercomparison. Ecological Modelling, 232, 144-157, doi: 10.1016/j.ecolmodel.2012.02.004.
Hurteau, M., and M. North, 2009: Fuel treatment effects on tree-based forest carbon storage and emissions under modeled wildfire scenarios. Frontiers in Ecology and the Environment, 7(8), 409-414, doi: 10.1890/080049.
Hurtt, G. C., L. P. Chini, S. Frolking, R. A. Betts, J. Feddema, G. Fischer, J. P. Fisk, K. Hibbard, R. A. Houghton, A. Janetos, C. D. Jones, G. Kindermann, T. Kinoshita, K. K. Goldewijk, K. Riahi, E. Shevliakova, S. Smith, E. Stehfest, A. Thomson, P. Thornton, D. P. van Vuuren, and Y. P. Wang, 2011: Harmonization of land-use scenarios for the period 1500-2100: 600 years of global gridded annual land-use transitions, wood harvest, and resulting secondary lands. Climatic Change, 109(1-2), 117-161, doi: 10.1007/s10584-011-0153-2.
IPCC, 1996: 1996 IPCC Guidelines for National Greenhouse Gas Inventories. Intergovernmental Panel on Climate Change. [http://www.ipcc-nggip.iges.or.jp/public/gl/invs1.html]
IPCC, 2003: Good Practice Guidance for Land Use, Land-Use Change and Forestry. [ J. Penman, M. Gytarsky, T. Hiraishi, T. Krug, D. Kruger, R. Pipatti, L. Buendia, K. Miwa, T. Ngara, K. Tanabe, and F. Wagner (eds.)]. Intergovernmental Panel on Climate Change (IPCC) Institute for Global Environmental Strategies, Hayama, Japan.
IPCC, 2006: IPCC Guidelines for National Greenhouse Gas Inven-tories. Prepared by the National Greenhouse Gas Inventories Pro-gramme, Institute for Global Environmental Strategies. [https://www.ipcc-nggip.iges.or.jp/public/2006gl/]
Iyer, G. C., J. A. Edmonds, A. A. Fawcett, N. E. Hultman, J. Alsalam, G. R. Asrar, K. V. Calvin, L. E. Clarke, J. Creason, M. Jeong, 2015: The contribution of Paris to limit global warming to 2°C. Environmental Research Letters, 10, 125002, doi: 10.1088/1748-9326/10/12/125002.
Jacob, D. J., A. J. Turner, J. D. Maasakkers, J. Sheng, K. Sun, X. Liu, K. Chance, I. Aben, J. McKeever, and C. Frankenberg, 2016: Satellite observations of atmospheric methane and their value for quantifying methane emissions. Atmospheric Chemistry and Physics Discussions, 1-41, doi: 10.5194/acp-2016-555.
Johnson, E., 2009: Goodbye to carbon neutral: Getting biomass footprints right. Environmental Impact Assessment Review, 29(3), 165-168, doi: 10.1016/j.eiar.2008.11.002.
Khanna, M., and C. L. Crago, 2012: Measuring indirect land use change with biofuels: Implications for policy. Annual Review of Resource Economics, 4(1), 161-184, doi: 10.1146/annurev-re-source-110811-114523.
Kirchhoff, C. J., M. C. Lemos, and S. Dessai, 2013: Actionable knowl-edge for environmental decision making: Broadening the usability of climate science. Annual Review of Environment and Resources, 38, 393-414, doi: 10.1146/annurev-environ-022112-112828.
Section IV | Consequences and Ways Forward
756 U.S. Global Change Research Program November 2018
Köhl, M., R. Lasco, M. Cifuentes, Ö. Jonsson, K. T. Korhonen, P. Mundhenk, J. de Jeses Navar, and G. Stinson, 2015: Changes in forest production, biomass and carbon: Results from the 2015 UN FAO Global Forest Resource Assessment. Forest Ecology and Management, 352, 21-34, doi: 10.1016/j.foreco.2015.05.036.
Kort, E. A., C. Frankenberg, K. R. Costigan, R. Lindenmaier, M. K. Dubey, and D. Wunch, 2014: Four corners: The largest U.S. methane anomaly viewed from space. Geophysical Research Letters, 41(19), 6898-6903, doi: 10.1002/2014gl061503.
Kraucunas, I., L. Clarke, J. Dirks, J. Hathaway, M. Hejazi, K. Hibbard, M. Huang, C. Jin, M. Kintner-Meyer, K. K. van Dam, R. Leung, H.-Y. Li, R. Moss, M. Peterson, J. Rice, M. Scott, A. Thomson, N. Voisin, and T. West, 2014: Investigating the nexus of climate, energy, water, and land at decision-relevant scales: The Platform for Regional Integrated Modeling and Analysis (PRIMA). Climatic Change, 129(3-4), 573-588, doi: 10.1007/s10584-014-1064-9.
Kyle, P., P. Luckow, K. V. Calvin, B. Emanuel, M. Nathan, and Y. Zhou, 2011: GCAM 3.0. Agriculture and Land Use: Data Sources and Methods. PNNL-21025. Pacific Northwest National Labora-tory, Richland, WA.
Lauvaux, T., A. E. Schuh, M. Bocquet, L. Wu, S. Richardson, N. Miles, and K. J. Davis, 2012: Network design for mesoscale inversions of CO2 sources and sinks. Tellus B: Chemical and Physical Meteorology, 64, doi: 10.3402/tellusb.v64i0.17980.
Le Page, Y., T. O. West, R. Link, and P. Patel, 2016: Downscaling land use and land cover from the Global Change Assessment Model for coupling with Earth system models. Geoscientific Model Development, 9(9), 3055-3069, doi: 10.5194/gmd-9-3055-2016.
Le Quéré, C., R. Moriarty, R. M. Andrew, J. G. Canadell, S. Sitch, J. I. Korsbakken, P. Friedlingstein, G. P. Peters, R. J. Andres, T. A. Boden, R. A. Houghton, J. I. House, R. F. Keeling, P. Tans, A. Arneth, D. C. E. Bakker, L. Barbero, L. Bopp, J. Chang, F. Che-vallier, L. P. Chini, P. Ciais, M. Fader, R. A. Feely, T. Gkritzalis, I. Harris, J. Hauck, T. Ilyina, A. K. Jain, E. Kato, V. Kitidis, K. Klein Goldewijk, C. Koven, P. Landschützer, S. K. Lauvset, N. Lefèvre, A. Lenton, I. D. Lima, N. Metzl, F. Millero, D. R. Munro, A. Murata, J. E. M. S. Nabel, S. Nakaoka, Y. Nojiri, K. O’Brien, A. Olsen, T. Ono, F. F. Pérez, B. Pfeil, D. Pierrot, B. Poulter, G. Rehder, C. Rödenbeck, S. Saito, U. Schuster, J. Schwinger, R. Séférian, T. Steinhoff, B. D. Stocker, A. J. Sutton, T. Takahashi, B. Tilbrook, I. T. van der Laan-Luijkx, G. R. van der Werf, S. van Heuven, D. Vandemark, N. Viovy, A. Wiltshire, S. Zaehle, and N. Zeng, 2015: Global carbon budget 2015. Earth System Science Data, 7(2), 349-396, doi: 10.5194/essd-7-349-2015.
Lemos, M. C., and B. J. Morehouse, 2005: The co-production of science and policy in integrated climate assessments. Global Envi-ronmental Change—Human and Policy Dimensions, 15(1), 57-68, doi: 10.1016/j.gloenvcha.2004.09.004.
Li, C., 2007: Quantifying greenhouse gas emissions from soils: Sci-entific basis and modeling approach. Soil Science and Plant Nutri-tion, 53(4), 344-352, doi: 10.1111/j.1747-0765.2007.00133.x.
Lippke, B., E. Oneil, R. Harrison, K. Skog, L. Gustavsson, and R. Sathre, 2011: Life cycle impacts of forest management and wood utilization on carbon mitigation: Knowns and unknowns. Carbon Management, 2(3), 303-333, doi: 10.4155/Cmt.11.24.
Lippke, B., R. Gustafson, R. Venditti, P. Steele, T. A. Volk, E. Oneil, L. Johnson, M. E. Puettmann, and K. Skog, 2012: Comparing life-cycle carbon and energy impacts for biofuel, wood product, and forest management alternatives. Forest Products Journal, 62(4), 247-257, doi: 10.13073/fpj-d-12-00017.1.
McGreavy, B., L. Lindenfeld, K. Hutchins Bieluch, L. Silka, J. Leahy, and B. Zoellick, 2015: Communication and sustainability science teams as complex systems. Ecology and Society, 20(1), doi: 10.5751/es-06644-200102.
McKinley, G., N. Urban, V. Bennington, D. Pilcher, and C. McDon-ald, 2011: Preliminary carbon budgets for the Laurentian Great Lakes. Ocean Carbon and Biogeochemistry News, 4(2), Spring/Summer 2001. [https://web.whoi.edu/ocb/wp-content/uploads/sites/43/2016/12/OCB_NEWS_SPR_SUM11.pdf]
Michalak, A. M., R. Jackson, G. Marland, C. Sabine, and Carbon Cycle Science Working Group, 2011: A U.S. Carbon Cycle Science Plan. University Corporation for Atmospheric Research. [https://www.carboncyclescience.us/USCarbonCycleSciencePlan-Au-gust2011]
Miller, S. M., S. C. Wofsy, A. M. Michalak, E. A. Kort, A. E. Andrews, S. C. Biraud, E. J. Dlugokencky, J. Eluszkiewicz, M. L. Fischer, G. Janssens-Maenhout, B. R. Miller, J. B. Miller, S. A. Montzka, T. Nehrkorn, and C. Sweeney, 2013: Anthropogenic emissions of methane in the United States. Proceedings of the National Academy of Sciences USA, doi: 10.1073/pnas.1314392110.
Miner, R. A., R. C. Abt, J. L. Bowyer, M. A. Buford, R. W. Malmsheimer, J. O’Laughlin, E. E. Oneil, R. A. Sedjo, and K. E. Skog, 2014: Forest carbon acconting considerations in US bio-energy policy. Journal of Forestry, 112(6), 591-606, doi: 10.5849/jof.14-009.
Mitchell, S. R., M. E. Harmon, and K. E. B. O’Connell, 2012: Carbon debt and carbon sequestration parity in forest bioenergy production. Global Change Biology Bioenergy, 4(6), 818-827, doi: 10.1111/j.1757-1707.2012.01173.x.
Mitchell, S. R., M. E. Harmon, and K. E. O’Connell, 2009: Forest fuel reduction alters fire severity and long-term carbon storage in three Pacific Northwest ecosystems. Ecological Applications, 19(3), 643-655, doi: 10.1890/08-0501.
Mogles, N., I. Walker, A. P. Ramallo-González, J. H. Lee, S. Natara-jan, J. Padget, E. Gabe-Thomas, T. Lovett, G. Ren, S. Hyniewska, E. O’Neill, R. Hourizi, and D. Coley, 2017: How smart do smart meters need to be? Building and Environment, 125(15), 439-450, doi: 10.1016/j.buildenv.2017.09.008.
Mooney, H. A., A. Duraiappah, and A. Larigauderie, 2013: Evo-lution of natural and social science interactions in global change research programs. Proceedings of the National Academy of Sciences USA, 110 (Suppl 1), 3665-3672, doi: 10.1073/pnas.1107484110.

Chapter 18 | Carbon Cycle Science in Support of Decision Making
757Second State of the Carbon Cycle Report (SOCCR2)November 2018
Moser, S., 2009: Making a difference on the ground: The challenge of demonstrating the effectiveness of decision support. Climatic Change, 95(1-2), 11-21, doi: 10.1007/s10584-008-9539-1.
Mu, J. E., A. M. Wein, and B. A. McCarl, 2015: Land use and man-agement change under climate change adaptation and mitigation strategies: A U.S. case study. Mitigation and Adaptation Strategies for Global Change, 20(7), 1041-1054, doi: 10.1007/s11027-013-9514-7.
Odum, H. T., 1994: Ecological and General Systems — An Introduc-tion to Systems Ecology. University Press of Colorado, Niwot, CO, 659 pp.
Ogle, S., K. Davis, A. Andrews, K. Gurney, T. O. West, R. B. Cooke, T. Parkin, J. Morisette, S. Verma, and S. Wofsy, 2006: Science Plan: Mid-Continent Intensive Campaign of the North American Carbon Program. NACP. [http://www.nacarbon.org/nacp/documents/NACP_MCI_SciPlan_8-06.pdf]
Olander, L. P., E. Wollenberg, F. N. Tubiello, and M. Herold, 2014: Synthesis and Review: Advancing agricultural greenhouse gas quantification. Environmental Research Letters, 9(7), doi: 10.1088/1748-9326/9/7/075003
Patarasuk, R., K. R. Gurney, D. O’Keeffe, Y. Song, J. H. Huang, P. Rao, M. Buchert, J. C. Lin, D. Mendoza, and J. R. Ehleringer, 2016: Urban high-resolution fossil fuel CO2 emissions quantification and exploration of emission drivers for potential policy applications. Urban Ecosystems, 19(3), 1013-1039, doi: 10.1007/s11252-016-0553-1.
Paustian, K., M. Easter, K. Brown, A. Chambers, M. Eve, A. Huber, E. Marx, M. Layer, M. Stermer, B. Sutton, A. Swan, C. Toureene, S. Verlayudhan, and S. Williams, 2018: Field- and farm-scale assessment of soil greenhouse gas mitigation using COMET-Farm. In: Precision Conservation: Geospatial Techniques for Agricultural and Natural Resources Conservation, Agronomy Monograph 59 [ J. A. Delgado, G. F. Sassenrath, and T. Mueller (eds.)]. ASA/CSSA/SSSA, Madison, WI, USA, pp. 341-359, doi: 10.2134/agron-monogr59.2013.0033.
Paustian, K., J. Lehmann, S. Ogle, D. Reay, G. P. Robertson, and P. Smith, 2016: Climate-smart soils. Nature, 532(7597), 49-57, doi: 10.1038/nature17174.
Paustian, L., B. Babcock, J. L. Hatfield, R. Lal, B. A. McCarl, S. McLaughlin, A. Mosier, C. Rice, G. P. Roberton, N. Rosenberg, and C. Rosenzweig, 2001: Agricultural mitigation of greenhouse gases: Science and policy options. First National Conference on Carbon Sequestration.
Rockstrom, J., W. Steffen, K. Noone, Asa Persson, F. S. Chapin III, E. F. Lambin, T. M. Lenton, M. Scheffer, C. Folke, H. Joachim Schellnhuber, B. Nykvist, C. A. de Wit, T. Hughes, S. van der Leeuw, H. Rodhe, S. Sorlin, P. K. Snyder, R. Costanza, U. Svedin, M. Falkenmark, L. Karlberg, R. W. Corell, V. J. Fabry, J. Hansen, B. Walker, D. Liverman, K. Richardson, P. Crutzen, and J. A. Foley, 2009: A safe operating space of humanity. Nature, 461, 472-475.
Rogelj, J., A. Popp, K. V. Calvin, G. Luderer, J. Emmerling, D. Gernaat, S. Fujimori, J. Srefler, T. Hasegawa, G. Marangoni, V. Krey, E. Kriegler, K. Riahi, D. P. van Vurren, J. Doelman, L. Drouet, J. Edmonds, O. Fricko, M. Harmsen, P. Havlik, F. Humpenoder, E. Stehfest, and M. Tavoni, 2018: Scenarios towards limiting global mean temperature increase below 1.5°C. Nature Climate Change, doi: 10.1038/s41558-018-0091-3.
Ross, L., K. Arrow, R. Cialdini, N. Diamond-Smith, J. Diamond, J. Dunne, M. Feldman, R. Horn, D. Kennedy, C. Murphy, D. Pirages, K. Smith, R. York, and P. Ehrlick, 2016: The climate change challenge and barriers to the exercise of foresight intelligence. BioScience, 66, 363-370, doi: 10.1093/biosci/biw025.
Sanderman, J., T. Hengl, and G. J. Fiske, 2017: Soil carbon debt of 12,000 years of human land use. Proceedings of the National Academy of Sciences USA, 114, 9575-95, doi: 10.1073/pnas.1706103114.
Schlamadinger, B., and G. Marland, 1996: The role of forest and bioenergy strategies in the global carbon cycle. Biomass and Bioen-ergy, 10(5-6), 275-300, doi: 10.1016/0961-9534(95)00113-1.
Schuh, A. E., T. Lauvaux, T. O. West, A. S. Denning, K. J. Davis, N. Miles, S. Richardson, M. Uliasz, E. Lokupitiya, D. Cooley, A. Andrews, and S. Ogle, 2013: Evaluating atmospheric CO2 inver-sions at multiple scales over a highly inventoried agricultural land-scape. Global Change Biology, 19(5), 1424-1439, doi: 10.1111/gcb.12141.
Scott, C.A., 1977: Modifying socially-conscious behavior: The foot-in-the-door technique. Journal of Consumer Research, 4(3), 156-164, doi: 10.1086/208691.
Skog, K. E., D. C. McKinley, R. A. Birdsey, S. J. Hines, C. W. Woodall, E. D. Reinhardt, and J. M. Vose, 2014: Managing carbon. In: Climate Change and United States Forests. [D. L. Peterson, J. M. Vose, and T. Patel-Weynand (eds.)]. Springer, pp. 151-182.
Sleeter, B. M., T. L. Sohl, M. A. Bouchard, R. R. Reker, C. E. Soulard, W. Acevedo, G. E. Griffith, R. R. Sleeter, R. F. Auch, K. L. Sayler, S. Prisley, and Z. L. Zhu, 2012: Scenarios of land use and land cover change in the conterminous United States: Utilizing the special report on emission scenarios at ecoregional scales. Global Environmental Change-Human and Policy Dimensions, 22(4), 896-914, doi: 10.1016/j.gloenvcha.2012.03.008.
SPLC, 2018: Supplier Sustainability Ratings. [https://www.sustainablepurchasing.org/splc-insight-guide-to-supplier-sustain-ability-raters/]
Thompson, D. R., A. K. Thorpe, C. Frankenberg, R. O. Green, R. Duren, L. Guanter, A. Hollstein, E. Middleton, L. Ong, and S. Ungar, 2016: Space-based remote imaging spectroscopy of the Aliso Canyon CH4 superemitter. Geophysical Research Letters, 43(12), 6571-6578, doi: 10.1002/2016gl069079.
Tian, X., B. Sohngen, J. Baker, S. Ohrel, and A. A. Fawcett, 2018: Will U.S. forests continue to be a carbon sink? Land Economics 94(1), 97-113, doi: 10.3368/le.94.1.97.

Section IV | Consequences and Ways Forward
758 U.S. Global Change Research Program November 2018
Tilman, D., R. Socolow, J. A. Foley, J. Hill, E. Larson, L. Lynd, S. Pacala, J. Reilly, T. Searchinger, C. Somerville, and R. Williams, 2009: Energy. Beneficial biofuels—the food, energy, and envi-ronment trilemma. Science, 325(5938), 270-271, doi: 10.1126/science.1177970.
Tseng, S. and S. Hung, 2014: A strategic decision-making model considering the social costs of carbon dioxide emissions for sus-tainable supply chain management. Journal of Environmental Man-agement, 133(15), 315-322, doi: 10.1016/j.jenvman.2013.11.023.
Turner, A. J., D. J. Jacob, J. Benmergui, S. C. Wofsy, J. D. Maa-sakkers, A. Butz, O. Hasekamp, and S. C. Biraud, 2016: A large increase in U.S. methane emissions over the past decade inferred from satellite data and surface observations. Geophysical Research Letters, 43(5), 2218-2224, doi: 10.1002/2016gl067987.
U.S. Department of State, 2016: Second Biennial Report of the United States of America Under the United Nations Framework Convention on Climate Change. [https://unfccc.int/files/national_reports/biennial_reports_and_iar/submitted_biennial_reports/application/pdf/2016_second_biennial_report_of_the_united_states_.pdf]
U.S. EPA, 2014: Framework for Assessing Biogenic CO2 Emissions from Stationary Sources. U.S. Environmental Protection Agency, Office of Atmospheric Programs, Climate Change Division. [https://yosemite.epa.gov/sab/sabproduct.nsf/0/3235DAC-747C16FE985257DA90053F252?OpenDocument]
U.S. EPA, 2016: Inventory of U.S. Greenhouse Gas Emissions and Sinks: 1990-2014. U.S. Environmental Protection Agency. EPA 430-R-16-002. [https://www.epa.gov/sites/production/files/2016-04/documents/us-ghg-inventory-2016-main-text.pdf]
UCS, 2009: Climate 2030: A National Blueprint for a Clean Energy Economy. Union of Concerned Scientists, Washington, DC.
University of Maryland, 2016: Maryland Carbon Monitoring System. [http://carbonmonitoring.umd.edu/data.html]
USAID, 2018. Clearn Energy Emissions Reduction Tool. [https://www.cleertool.org]
USDA, 2014: Quantifying Greenhouse Gas Fluxes in Agriculture and Forestry: Methods for Entity-Scale Inventory. Technical Bulletin 1939. U.S. Department of Agriculture, Office of the Chief Economist, Washington, DC.
USDA, 2015: The U.S. Forest Carbon Accounting Framework: Stocks and Stock Change, 1990-2016. U.S. Department of Agriculture, Forest Service. General Technical Report NRS-154.
Verburg, P. H., J. van de Steeg, A. Veldkamp, and L. Willemen, 2009: From land cover change to land function dynamics: A major challenge to improve land characterization. Journal of Environmental Management, 90(3), 1327-1335, doi: 10.1016/j.jenvman.2008.08.005.
Walmart, 2017: Walmart Launches Project Gigaton to Reduce Emissions in Company’s Supply Chain. [https://news.walmart.com/2017/04/19/walmart-launches-project-gigaton-to-reduce-emissions-in-companys-supply-chain]
Weaver, C. P., S. Mooney, D. Allen, N. Beller-Simms, T. Fish, A. E. Grambsch, W. Hohenstein, K. Jacobs, M. A. Kenney, M. A. Lane, L. Langner, E. Larson, D. L. McGinnis, R. H. Moss, L. G. Nichols, C. Nierenberg, E. A. Seyller, P. C. Stern, and R. Winthrop, 2014: From global change science to action with social sciences. Nature Climate Change, 4(8), 656-659, doi: 10.1038/nclimate2319.
West, T. O., and G. Marland, 2002: A synthesis of carbon seques-tration, carbon emissions, and net carbon flux in agriculture: Comparing tillage practices in the United States. Agriculture, Ecosystems and Environment, 91(1-3), 217-232, doi: 10.1016/S0167-8809(01)00233-X.
West, T. O., M. E. Brown, R. M. Duren, S. M. Ogle, and R. H. Moss, 2013: Definition, capabilities and components of a terrestrial carbon monitoring system. Carbon Management, 4(4), 413-422, doi: 10.4155/Cmt.13.36.
West, T. O., V. Bandaru, C. C. Brandt, A. E. Schuh, and S. M. Ogle, 2011: Regional uptake and release of crop carbon in the United States. Biogeosciences, 8(8), 2037-2046, doi: 10.5194/bg-8-2037-2011.
West, T. O., Y. Le Page, M. Y. Huang, J. Wolf, and A. M. Thomson, 2014: Downscaling global land cover projections from an inte-grated assessment model for use in regional analyses: Results and evaluation for the U.S. From 2005 to 2095. Environmental Research Letters, 9(6), doi: 10.1088/1748-9326/9/6/064004.
Weyant, J., 2017: Some contributions of integrated assessment models of global climate change. Review of Environmental Econom-ics and Policy, 11, 115–137, doi: 10.1093/reep/rew018.
White House, 2016: United States Mid-Century Strategy for Deep Decarbonization, 110 pp. [https://unfccc.int/files/focus/long-term_strategies/application/pdf/us_mid_century_strategy.pdf]
WHRC, 2014: Aboveground Forest Carbon Stocks in Mexico. Woods Hole Research Center. [http://whrc.org/publications-data/data-sets/aboveground-forest-carbon-stocks-in-mexico/]
Wise, M., K. Calvin, A. Thomson, L. Clarke, B. Bond-Lamberty, R. Sands, S. J. Smith, A. Janetos, and J. Edmonds, 2009: Implications of limiting CO2 concentrations for land use and energy. Science, 324(5931), 1183-1186, doi: 10.1126/science.1168475.
Wise, M., K. Calvin, P. Kyle, P. Luckow, and J. Edmonds, 2014: Economic and physical modeling of land use in GCAM 3.0 and an application to agricultural productivity, land, and terrestrial carbon. Climate Change Economics, 5, 1450003, doi: 10.1142/S2010007814500031.

Chapter 18 | Carbon Cycle Science in Support of Decision Making
759Second State of the Carbon Cycle Report (SOCCR2)November 2018
Woodall, C. W., B. F. Walters, J. W. Coulston, A. W. D’Amato, G. M. Domke, M. B. Russell, and P. A. Sowers, 2015: Monitoring net-work confirms land use change is a substantial component of the forest carbon sink in the Eastern United States. Scientific Reports, 5, 17028, doi: 10.1038/srep17028.
WWF and CDP, 2013: The 3% Solution: Driving Profits Through Carbon Reductions. World Wildlife Fund and Carbon Disclo-sure Project. [https://c402277.ssl.cf1.rackcdn.com/publica-tions/575/files/original/The_3_Percent_Solution_-_June_10.pdf?1371151781]
Zavala-Araiza, D., D. R. Lyon, R. A. Alvarez, K. J. Davis, R. Harriss, S. C. Herndon, A. Karion, E. A. Kort, B. K. Lamb, X. Lan, A. J. Marchese, S. W. Pacala, A. L. Robinson, P. B. Shepson, C. Sweeney, R. Talbot, A. Townsend-Small, T. I. Yacovitch, D. J. Zimmerle, and S. P. Hamburg, 2015: Reconciling divergent estimates of oil and gas methane emissions. Proceedings of the National Academy of Sciences USA, 112(51), 15597-15602, doi: 10.1073/pnas.1522126112.
Zell, E., A. K. Huff, A. T. Carpenter, and L.A. Friedl, 2012: A User-Driven Approach to Determining Critical Earth Observation Priorities for Societal Benefit. IEEE Journal of Selected Topics in Applied Earth Observations and Remote Sensing, 5(6), 1594-1602, doi: 10.1109/JSTARS.2012.2199467.
Zimmerle, D. J., L. L. Williams, T. L. Vaughn, C. Quinn, R. Subramanian, G. P. Duggan, B. Willson, J. D. Opsomer, A. J. Marchese, D. M. Martinez, and A. L. Robinson, 2015: Methane emissions from the natural gas transmission and storage system in the United States. Environmental Science and Technology, 49(15), 9374-9383, doi: 10.1021/acs.est.5b01669.

760
Future of the North American Carbon Cycle
19Lead AuthorsDeborah N. Huntzinger, Northern Arizona University; Abhishek Chatterjee, Universities Space Research Association and NASA Global Modeling and Assimilation Office
Contributing AuthorsDavid J. P. Moore, University of Arizona; Sara Ohrel, U.S. Environmental Protection Agency; Tristram O. West, DOE Office of Science; Benjamin Poulter, NASA Goddard Space Flight Center; Anthony P. Walker, Oak Ridge National Laboratory; John Dunne, NOAA Geophysical Fluid Dynamics Laboratory; Sarah R. Cooley, Ocean Conservancy; Anna M. Michalak, Carnegie Institution for Science and Stanford University; Maria Tzortziou, City University of New York; Lori Bruhwiler, NOAA Earth System Research Laboratory; Adam Rosenblatt, University of North Florida; Yiqi Luo, Northern Arizona University; Peter J. Marcotullio, Hunter College, City University of New York; Joellen Russell, University of Arizona
AcknowledgmentsMelanie A. Mayes (Science Lead), Oak Ridge National Laboratory; Tara Hudiburg (Review Editor), University of Idaho; Elisabeth Larson (Federal Liaison), North American Carbon Program and NASA Goddard Space Flight Center, Science Systems and Applications Inc.; John Schade (Federal Liaison), National Science Foundation; Karina V. R. Schäfer (former Federal Liaison), National Science Foundation
Recommended Citation for ChapterHuntzinger, D. N., A. Chatterjee, D. J. P. Moore, S. Ohrel, T. O. West, B. Poulter, A. P. Walker, J. Dunne, S. R. Cooley, A. M. Michalak, M. Tzortziou, L. Bruhwiler, A. Rosenblatt, Y. Luo, P. J. Marcotullio, and J. Russell, 2018: Chapter 19: Future of the North American carbon cycle. In Second State of the Carbon Cycle Report (SOCCR2): A Sustained Assessment Report [Cavallaro, N., G. Shrestha, R. Birdsey, M. A. Mayes, R. G. Najjar, S. C. Reed, P. Romero-Lankao, and Z. Zhu (eds.)]. U.S. Global Change Research Program, Washington, DC, USA, pp. 760-809, https://doi.org/10.7930/SOCCR2.2018.Ch19.

Chapter 19 | Future of the North American Carbon Cycle
761Second State of the Carbon Cycle Report (SOCCR2)November 2018
KEY FINDINGS1. Emissions from fossil fuel combustion in the North American energy sector are a source of carbon
to the atmosphere. Projections suggest that by 2040, total North American fossil fuel emissions will range from 1,504 to 1,777 teragrams of carbon (Tg C) per year, with most coming from the United States (~80%, or 1,259 to 1,445 Tg C per year). Compared to 2015 levels, these projections represent either a 12.8% decrease or a 3% increase in absolute emissions (high confidence).
2. Land, ocean, coastal, and freshwater systems are currently net sinks of carbon from the atmosphere, taking up more carbon annually than they release. However, emerging understanding suggests that the future carbon uptake capacity of these systems may decline, depending on different emissions scenarios, with some reservoirs switching from a net sink to a net source of carbon to the atmosphere (high confidence).
3. Human-driven changes in land cover and land use will continue to be key contributors to carbon cycle changes into the future, both globally and in North America. Globally, land-use change is projected to contribute 10 to 100 petagrams of carbon (Pg C) to the atmosphere by 2050 and between 19 and 205 Pg C by 2100. Conversely, in the United States, land use and land-use change activities are projected to increase carbon stocks in terrestrial ecosystems by about 4 Pg C from 2015 to 2030. This projected increase is primarily driven by the growth of existing forests and management activities that promote ecosystem carbon uptake, often in response to changes in market, policy, and climate (high confidence).
4. The enhanced carbon uptake capacity of ocean and terrestrial systems in response to rising atmospheric carbon dioxide (CO2) will likely diminish in the future. In the ocean, warmer and more CO2-enriched waters are expected to take up less additional CO2. On land, forest maturation, nutrient limitations, and decreased carbon residence time in soils will likely constrain terrestrial ecosystem response to rising CO2 (high confidence).
5. Soil carbon losses in a warming climate will be a key determinant of the future North American carbon cycle. An important region of change will be the Arctic, where thawing permafrost and the release of previously frozen carbon will likely shift this region from a net sink to a net source of carbon to the atmosphere by the end of the century (very high confidence).
6. Carbon storage in both terrestrial and aquatic systems is vulnerable to natural and human-driven disturbances. This vulnerability is likely to increase as disturbance regimes shift and disturbance severity increases with changing climatic conditions (high confidence).
Note: Confidence levels are provided as appropriate for quantitative, but not qualitative, Key Findings and statements.
19.1 Introduction The physical climate system and the carbon cycle are tightly coupled. Each is sensitive to changes in the other, leading to complex feedbacks between the two (Ciais et al., 2013). A core goal of carbon cycle research is to understand how the carbon cycle will interact with and influence future climate (Michalak et al., 2011). In addition to changing cli-mate (e.g., changing temperature and precipitation patterns), the carbon cycle is sensitive to changing atmospheric composition (e.g., ozone and nutrient
deposition), extreme events such as droughts and floods, disturbances including fire and insects, and human activities such as fossil fuel emissions and land-management decisions. Land, ocean, coastal, and freshwater systems currently are net “sinks” of carbon from the atmosphere (e.g., Le Quéré et al., 2016), meaning that they annually take up more atmospheric carbon than they release, but emerg-ing understanding of these systems (e.g., Raupach et al., 2014) suggests the possibility of a decline in their future carbon uptake capacity. Furthermore,

Section IV | Consequences and Ways Forward
762 U.S. Global Change Research Program November 2018
some reservoirs could switch from a net sink to a net “source” of carbon to the atmosphere (e.g., Canadell et al., 2010; Schimel et al., 2015). Projecting future carbon cycle changes thus requires the ability to estimate the response of land and aquatic systems to numerous, often competing, drivers. Equally important to identifying the vulnerability of specific carbon reservoirs is understanding the processes controlling their behavior to better inform manage-ment and policy decisions (Canadell et al., 2010).
This chapter reviews current understanding of poten-tial changes in the carbon budget of major global and North American carbon reservoirs. Also exam-ined are the drivers of future carbon cycle changes including carbon-climate feedbacks, atmospheric composition, nutrient availability, human activity, and resource management decisions. Not all carbon reservoirs are equally vulnerable or resilient to chang-ing climate, nor will they have the same response to these drivers. The majority of work examining future carbon cycle changes and potential feedbacks with climate has been conducted at the global scale as part of coupled carbon-climate model intercomparison efforts, including the Coupled Model Intercompar-ison Project Phase 5 (CMIP5; Friedlingstein 2015; Friedlingstein et al., 2014). These global projec-tions are summarized in Sections 19.3–19.6, p. 763. However, projections of future carbon cycle changes specific to North America remain limited. Where possible, this chapter includes projected changes in net carbon uptake and release by the North Amer-ican land surface out to 2100 (see Section 19.4, p. 771). Also examined are the likely drivers of future changes in the North American carbon cycle as they relate to terrestrial, ocean and coastal, and freshwater systems (see Sections 19.4–19.6). Finally, this chap-ter highlights ongoing knowledge gaps and research needs critical for improving understanding of future carbon cycle changes (see Section 19.7, p. 780).
Such a discussion of future carbon cycle changes is new in the Second State of the Carbon Cycle Report (SOCCR2). Since the First State of the Carbon Cycle Report (SOCCR1; CCSP 2007), progress has been made at identifying the vulnerability of key carbon
pools, including high-latitude permafrost (see Ch. 11: Arctic and Boreal Carbon, p. 428), soils and peat-lands (see Ch. 12: Soils, p. 469), temperate forests (see Ch. 9: Forests, p. 365), and freshwater wetlands (see Ch. 13: Terrestrial Wetlands, p. 507). Other progress includes greater understanding of potential carbon losses in terrestrial ecosystems subject to disturbance events, such as insects, fire, and drought (see Ch. 9: Forests), as well as the impact of increas-ing atmospheric carbon dioxide (CO2) on terrestrial and aquatic systems (see Ch. 17: Biogeochemical Effects of Rising Atmospheric Carbon Dioxide, p. 690). Synthesizing and building on this previous information, this chapter focuses on potential future changes to the North American carbon cycle while putting it in a global context. Finally, this chapter covers multiple carbon stocks and flows, each with different standard conventions in terms of units and metrics. Any change in unit from mass of carbon (e.g., teragrams of carbon [Tg C] or petagrams of carbon [Pg C]) to mass of CO2 or methane (CH4) or CO2 equivalent (CO2e) has been clearly marked.
19.2 Overview of the Global Carbon CycleIn Earth’s past and over geological time, the global carbon cycle and Earth’s climate have changed as a result of external factors and complex interactions within the Earth system (see Ch. 1: Overview of the Global Carbon Cycle, p. 42, for more details). In addition, carbon cycle feedbacks with the climate system can both amplify and dampen the effects of these external forcings (Graven 2016).
The global carbon cycle can be viewed as a system of reservoirs (e.g., atmosphere, ocean, and land). A reservoir’s size (or pool) depends on the balance of carbon flowing into and out of it (i.e., the net flux; see Ch. 1: Overview of the Global Carbon Cycle, p. 42). Because Earth’s carbon cycle is a closed sys-tem in which outputs from one reservoir are inputs to another, knowing how and why the amount of carbon stored in a reservoir is changing requires understanding the different processes affecting the reservoir’s carbon inputs and outputs. In addition, the processes that affect the size of carbon flows

Chapter 19 | Future of the North American Carbon Cycle
763Second State of the Carbon Cycle Report (SOCCR2)November 2018
(fluxes) are often influenced by the amount of carbon stored in the reservoir (i.e., the reservoir’s size). For the amount of carbon stored in these vast reservoirs to shift noticeably, a net change in the balance of inputs and outputs (i.e., the net flux) must be either large or sustained long enough for the change to accumulate.
The amount of atmospheric CO2 depends on the balance between CO2 emissions to the atmosphere and carbon uptake by the land and ocean (see Ch. 8: Observations of Atmospheric Carbon Dioxide and Methane, p. 337). Since the dawn of the Industrial Revolution around 1750, fossil fuel extraction and burning have transferred a net 375 ± 30 Pg C from geological reservoirs to the atmosphere (Ciais et al., 2013). In addition, increasing conversion of forests to agricultural land, growing demand for wood, and other factors of land-use change have transferred carbon from vegetation and soil reservoirs to the atmosphere. Only about half of the CO2 emitted from fossil fuel burning, industry (e.g., cement man-ufacturing), and land-use change has accumulated in the atmosphere. The rest has been taken up by the land and the ocean. The current strength of land and ocean carbon uptake from the atmosphere is the result of complex interactions among many factors (Ciais et al., 2013). Details about these processes and their current budget, at both global and North American scales, are provided in detail in Ch. 1: Overview of the Global Carbon Cycle and Ch. 2: The North American Carbon Budget, p. 71.
19.3 Major Drivers of Carbon Cycle Changes and Their Future ProjectionsDuring the coming decades and centuries, human-driven CO2 emissions are expected to continue to drive changes in climate (Gregory et al., 2009) and thus the carbon cycle. Model projections of how the future may evolve with respect to climate change and the carbon cycle are commonly driven by a set of plausible future scenarios. These scenarios are useful in helping to inform decision making by offering insights into possible tradeoffs related to different
types of actions or policies. While these scenarios often are not an exhaustive treatment of all mitigation or energy resource options, they do consider plausi-ble changes to market structures and energy produc-tion capacity, as well as technological advancements and existing and potential policies to reduce CO2 and other greenhouse gas (GHG) emissions (e.g., EIA 2016; Mohr et al., 2015; van Vuuren et al., 2011).
At the global scale, a series of Representative Con-centration Pathways (RCPs) was created for CMIP5 using different integrated assessment models. These RCPs consider alternate socioeconomic pathways that result in different emissions levels for both fossil fuel use and land-use change, and thus different potential atmospheric GHG concentrations ( Jones et al., 2013; van Vuuren et al., 2011). These RCPs are used to drive Earth System Models (e.g., CMIP5; Friedlingstein 2015; Friedlingstein et al., 2014) in order to project potential climate and carbon cycle changes at global and regional scales. The set of four pathways used by CMIP5 and similar studies are representative of the range of scenarios presented in the literature and include one mitigation scenario leading to very low radiative forcing (RCP2.6), two medium stabilization scenarios (RCP4.5 and RCP6.0), and one high baseline emissions scenario (RCP8.5; van Vuuren et al., 2011). Each RCP is named after its target radiative forcing, measured in watts per square meter (W/m2), in the year 2100. A general description of the RCPs is provided next and in Figure 19.1, p. 764, and Figure 19.2, p. 765. More details on the characteristics of each RCP are available in van Vuuren et al. (2011).
1. RCP8.5 High Emissions Scenario. Projects increasing CO2 and CH4 emissions over time due to increased energy intensity as a result of high population growth and lower rates of tech-nology development leading to radiative forcing of 8.5 W/m2 by 2100. This scenario assumes an increase in cropland and grassland area driven by the demands of population growth.
2. RCP6.0 Stabilization Scenario. Projects a range of technologies and strategies to reduce

Section IV | Consequences and Ways Forward
764 U.S. Global Change Research Program November 2018
to stabilize radiative forcing at 4.5 W/m2 in 2100. This scenario assumes a decrease in crop-land and grassland area due to climate policies that value carbon in natural vegetation.
4. RCP2.6 Low Emissions Scenario. Projects an increased use of bioenergy and carbon capture and storage, which leads to a substantial reduc-tion in CO2 emissions after 2020. This reduc-tion coupled with declining CH4 emissions from energy production, transportation, and livestock leads to a peak in radiative forcing of
Figure 19.1. Projected Global Energy Consumption and Emissions. Projections of (a) primary energy consump-tion in exajoules (EJ) by source and emissions of (b) carbon dioxide measured in gigatons of carbon (Gt C) and (c) methane (CH4) measured in megatons (Mt) under the four different Representative Concentration Pathways (RCPs). [Figure source: Adapted from van Vuuren et al., 2011, used with permission under a Creative Commons Attribution Noncommercial License.]
CO2 emissions after the year 2080, coupled with fairly steady CH4 emissions throughout the century to stabilize radiative forcing at 6 W/m2 in 2100. This scenario assumes an increase in cropland area, but a decline in pasture area due to aggressive implementation of intensive animal husbandry.
3. RCP4.5 Stabilization Scenario. Projects a range of technologies and strategies to reduce CO2 emissions after 2040, coupled with fairly steady CH4 emissions throughout the century
(a)
(b)
(c)

Chapter 19 | Future of the North American Carbon Cycle
765Second State of the Carbon Cycle Report (SOCCR2)November 2018
3 W/m2, followed by a decline to 2.6 W/m2 by 2100. Cropland area increases, but largely as a result of bioenergy production. Grassland area remains relatively constant as the increase in animal production is offset by more intensive animal husbandry.
These RCPs describe a range of plausible global emissions and land-use scenarios that will drive changes in global climate. Later in this chapter, CMIP5 projections driven by these scenarios will be used to discuss projected changes in the North American land and coastal ocean carbon cycles. Sec-tion 19.3.1, this page, summarizes projected trends of human-driven emissions from fossil fuel use, and Section 19.3.2, p. 766, summarizes land-use manage-ment and change specific to North America. Also described is how climate is projected to change in North America according to different projections of future global emissions (see Section 19.3.3, p. 770). Even though the following sections primarily focus on changes over North America, these changes have been placed in a global context as necessary.
19.3.1 Fossil Fuel EmissionsFossil fuels are vital to current North American energy needs, accounting for about 80% of global energy consumption (Mohr et al., 2015). Emis-sions from fossil fuel combustion in North Amer-ica’s energy sector currently represent a source of carbon (mostly as CO2) to the atmosphere and will continue to be a source into the future. Projections suggest that by 2040, total North American fossil fuel emissions will range from 1,504 to 1,777 Tg C per year (see Table 19.1, p. 766). Compared to 2015, this range represents either a 12.8% decrease or a 3% increase in absolute emissions. These estimates are based on a range of projections for each country and provide “high” and “low” bounds for potential future North American carbon emissions from fossil fuel burning.
Energy market projections, and subsequently fossil fuel emissions futures, are subject to large uncertain-ties because many of the factors that shape energy decisions and future developments in technologies,
Figure 19.2. Projections of Future Land-Use Area and Land-Use Emissions. Projections of land-use area in hectares (ha) for (a) croplands and (b) grass-lands, along with (c) carbon dioxide emissions related to land use measured in gigatons of carbon (Gt C)under the four Representative Concentration Pathways (RCPs). [Figure and data sources: Panels (a) and (b) are adapted from van Vuuren et al., 2011, used with permission under a Creative Commons Attribution Noncommercial License. Panel (c) is derived from data in Meinshausen et al., 2011.]
(a)
(b)
(c)
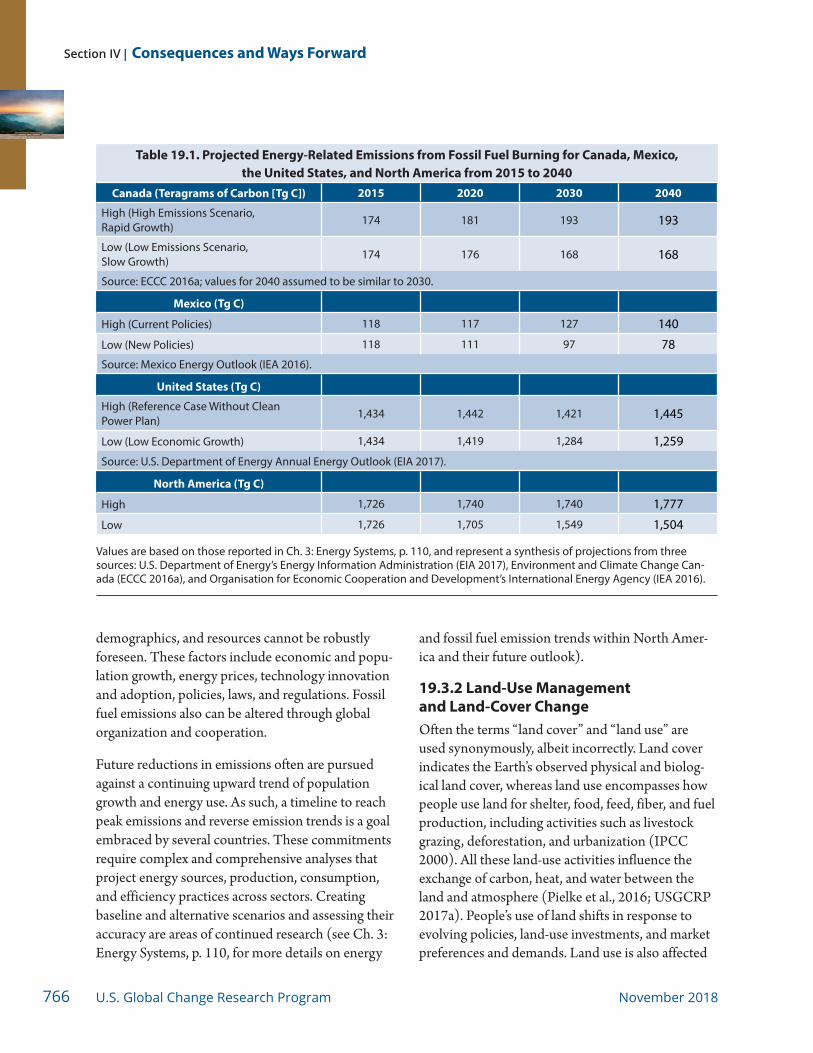
Section IV | Consequences and Ways Forward
766 U.S. Global Change Research Program November 2018
demographics, and resources cannot be robustly foreseen. These factors include economic and popu-lation growth, energy prices, technology innovation and adoption, policies, laws, and regulations. Fossil fuel emissions also can be altered through global organization and cooperation.
Future reductions in emissions often are pursued against a continuing upward trend of population growth and energy use. As such, a timeline to reach peak emissions and reverse emission trends is a goal embraced by several countries. These commitments require complex and comprehensive analyses that project energy sources, production, consumption, and efficiency practices across sectors. Creating baseline and alternative scenarios and assessing their accuracy are areas of continued research (see Ch. 3: Energy Systems, p. 110, for more details on energy
and fossil fuel emission trends within North Amer-ica and their future outlook).
19.3.2 Land-Use Management and Land-Cover ChangeOften the terms “land cover” and “land use” are used synonymously, albeit incorrectly. Land cover indicates the Earth’s observed physical and biolog-ical land cover, whereas land use encompasses how people use land for shelter, food, feed, fiber, and fuel production, including activities such as livestock grazing, deforestation, and urbanization (IPCC 2000). All these land-use activities influence the exchange of carbon, heat, and water between the land and atmosphere (Pielke et al., 2016; USGCRP 2017a). People’s use of land shifts in response to evolving policies, land-use investments, and market preferences and demands. Land use is also affected
Table 19.1. Projected Energy-Related Emissions from Fossil Fuel Burning for Canada, Mexico, the United States, and North America from 2015 to 2040
Canada (Teragrams of Carbon [Tg C]) 2015 2020 2030 2040
High (High Emissions Scenario, Rapid Growth)
174 181 193 193
Low (Low Emissions Scenario, Slow Growth)
174 176 168 168
Source: ECCC 2016a; values for 2040 assumed to be similar to 2030.
Mexico (Tg C)
High (Current Policies) 118 117 127 140
Low (New Policies) 118 111 97 78Source: Mexico Energy Outlook (IEA 2016).
United States (Tg C)
High (Reference Case Without Clean Power Plan)
1,434 1,442 1,421 1,445
Low (Low Economic Growth) 1,434 1,419 1,284 1,259Source: U.S. Department of Energy Annual Energy Outlook (EIA 2017).
North America (Tg C)
High 1,726 1,740 1,740 1,777
Low 1,726 1,705 1,549 1,504
Values are based on those reported in Ch. 3: Energy Systems, p. 110, and represent a synthesis of projections from three sources: U.S. Department of Energy’s Energy Information Administration (EIA 2017), Environment and Climate Change Can-ada (ECCC 2016a), and Organisation for Economic Cooperation and Development’s International Energy Agency (IEA 2016).

Chapter 19 | Future of the North American Carbon Cycle
767Second State of the Carbon Cycle Report (SOCCR2)November 2018
by environmental and socioeconomic conditions including population and economic growth. The land-use decisions emerging from these changing conditions affect ecosystem functioning and the land carbon cycle. As a result, land use and land-cover change will play a large role in determining how the future carbon cycle, and thus global cli-mate, will function and change (Barker et al., 2007; Brovkin et al., 2006; Gitz and Ciais 2004). High-lighted next are some recent trends in emissions from land use and land-cover change to provide context for projected future changes. See Ch. 2: The North American Carbon Budget, p. 71, for a more detailed discussion on emissions from current land use and land-cover change.
In 2014, land use and land-use change involving forests in Canada and Mexico resulted in net annual emissions of 72 Tg CO2e1 (ECCC 2016a). Most of these emissions resulted from forest fire and insect disturbance (Canada). In the United States and Mexico, however, land use, land-use change, and forestry (LULUCF) activities resulted in overall net carbon sequestration of 763 Tg CO2e (U.S. EPA 2016) in 2014 and 142 Tg CO2e in 2013 (SEMARNAT-INECC 2016), respectively. The most prominent changes in U.S. land use and land cover in recent decades involve the amount and type of forest cover (Brown et al., 2014) affected through logging and development in the Southeast and Northwest, as well as urban expansion in the North-east and Southwest. Although total carbon seques-tration by LULUCF has increased about 4.5% from 1990 to 2014 (U.S. EPA 2016), this trend—which largely depends on forest area, health, and prod-uct markets—is not guaranteed to persist into the future. Some studies estimate a significant decrease in the rate of future carbon uptake by forests result-ing from changes in both forest age and land use as a result of increasing population and subsequent
1 Carbon dioxide equivalent (CO2e): Amount of CO2 that would produce the same effect on the radiative balance of Earth’s climate system as another greenhouse gas, such as methane (CH4) or nitrous oxide (N2O), on a 100-year timescale. For comparison to units of carbon, each kg CO2e is equivalent to 0.273 kg C (0.273 = 1/3.67). See Box P.2, p. 12, in the Preface for more details.
demand for agricultural commodities (see Ch. 9: Forests, p. 365). However, other studies suggest U.S. forests will remain a large carbon sink because of investments in the forest sector (Tian et al., 2018) and CO2 fertilization (e.g., Tian et al., 2016) that will bolster future forest carbon stocks. The range of potential future changes in these stocks is captured in the diverging (e.g., increasing and decreasing) confidence bands associated with projected forest carbon stocks after 2020 in U.S. land-use projections (U.S. Department of State 2016). Nevertheless, future changes in forest carbon stocks will vary geographically and depend on environmental condi-tions including water availability (Beach et al., 2015; U.S. EPA 2015).
Agricultural emissions, including non-CO2 gases like CH4 (see Box 19.1, Future Methane Cycle, p. 768) and nitrous oxide (N2O), associated with cropland and livestock management also play an important role in overall emissions levels (see Ch. 5: Agriculture, p. 229). U.S. agricultural production resulted in GHG emissions totaling 516 Tg CO2e in 2013. These emissions are projected to decline slightly to 494 Tg CO2e by 2030 (U.S. Department of State 2016). Although total cropland area has remained fairly stable over the past 30 years (USDA 2017), cropland could slowly expand with popula-tion increases and economic growth. Furthermore, urban land cover could increase by 73% to 98% by 2050 in the lower 48 states (Bierwagen et al., 2010; Wear 2011). Future increases in cropland and urban areas may result in grassland and forest area losses, but the extent of increased cropland area will depend largely on environmental policies, changes in international trade of agricultural commodities, and advancements in agricultural technologies. Also, crop yield improvements consistent with historical trends could deliver an approximately 50% increase in global primary crop production by 2050 (Ray et al., 2013). More intense cropland management could decrease the need for croplands and, in turn, reduce forest and grassland losses.
Projecting the influence of land use and land-use change on future land carbon cycle dynamics is

Section IV | Consequences and Ways Forward
768 U.S. Global Change Research Program November 2018
Box 19.1 Future Methane Cycle Methane (CH4) is a potent greenhouse gas and precursor for tropospheric ozone formation. Quantifying CH4 emissions is critical for pro-jecting future climate and air quality changes and essential for developing strategies to mitigate emissions. CH4 is emitted into the atmosphere from a variety of biogenic, thermogenic, and pyrogenic sources and is removed from the atmosphere predominately by reaction with hydroxyl radicals (OH). Measurement of air trapped in glacial ice suggests that the preindus-trial abundance of atmospheric CH4 was about 720 parts per billion (ppb; Ciais et al., 2013). The contemporary atmospheric CH4 abundance is about 1,800 ppb, a 2.5-fold increase since prein-dustrial times. Most of the CH4 increase in the last century is believed to be a result of increased emissions from human-driven activities, including rice cultivation, ruminant livestock (enteric fer-mentation and waste management), landfills, and fossil fuel extraction and use. The rate of increase in atmospheric CH4 concentration decreased in the mid-1980s, approached a near-zero growth rate from 2000 to 2006, and in 2007 resumed an abrupt increase (Dlugokencky et al., 2009; Kai et al., 2011; Rigby et al., 2008). The recent changes in CH4 concentration growth rates have received much attention (Nisbet et al., 2014; Saunois et al., 2016), although the ultimate cause of these changes remains uncertain and highly debated within the scientific community.
Among anthropogenic sources, the United States reports sectoral projections through its National Communications every 4 years, and every 2 years through its Biennial Reports issued by the Department of State to the United Nations Framework Convention on Climate Change (NASEM 2018). Accurate projections of anthro-pogenic CH4 emissions are a key foundation for planning national policies or goals, but these
projections are dependent on many factors that are difficult to predict, including future energy and agricultural policies, CH4 mitigation policies, natural resource development, and population migration. The most recent national projections are presented in the Second Biennial Report of the United States of America (U.S. Department of State 2016), which includes projections of total U.S. CH4 in 2020 (26.8 teragrams [Tg] of CH4), 2025 (26.96 Tg CH4), and 2030 (27.28 Tg CH4), as well as emissions by major source category. The 2025 and 2030 values are about 1% to 2% lower than 2015 emissions values.
Among natural sources, wetland emissions repre-sent the largest and most uncertain natural source of CH4 emissions, with current estimates ranging from 127 to 227 Tg CH4 per year (Saunois et al., 2016). An important aspect of the atmospheric CH4 budget is the sensitivity of natural wetland emissions to climate change (e.g., future soil temperature and moisture) and to atmospheric CO2 concentrations. Higher soil temperature can lead to increased microbial activity and CH4 production but also increased soil consumption of CH4. Increased drought and drying of wet-land soils likewise can lead to reduced emissions. Melton et al. (2013) analyzed the response of wetland models to projected changes in air temperature, precipitation, and atmospheric CO2 abundance over the next century. They found that many models show increased emissions in response to higher levels of CO2 (via substrate availability) and temperature. However, models with prognostic wetland dynamics project that wetland extent will be reduced in the future, potentially leading to smaller emissions, especially at low latitudes. Using climate scenarios from the Intergovernmental Panel on Climate Change Fifth Assessment Report, Stocker et al. (2013) found that wetland CH4 emissions may increase from
Continued on next page

Chapter 19 | Future of the North American Carbon Cycle
769Second State of the Carbon Cycle Report (SOCCR2)November 2018
challenging because of uncertainties in projecting market interactions, potential extent of land-use change, and the associated effect of these changes on terrestrial ecosystems (U.S. Department of State 2016). This uncertainty is reflected in the range of future estimates. Globally, land-use change contrib-uted 180 ± 80 Pg C to the atmosphere from 1750 to 2011 (Ciais et al., 2013). Depending on different scenarios in response to increasing population and management and policy choices, land use and land-cover change are projected to contribute an addi-tional 10 to 100 Pg C to the atmosphere by 2050 and 19 to 205 Pg C by 2100 (Brovkin et al., 2013). These projections account for both carbon loss from vegetation clearing (e.g., for agricultural use, bioenergy crops, and wood products) and carbon
gain from vegetation regrowth. Canada’s official 2016 emissions projections to 2030 do not include LULUCF emissions or sequestrations. However, according to Canada’s Midcentury Strategy, “anal-yses show that a substantial reduction in emissions and increase in removals by 2050 is possible through measures such as changes in how we manage forests, greater domestic use of long-lived wood products, greater use of bioenergy from waste wood, and afforestation” (ECCC 2016b). Within the contermi-nous United States, land use, land management, and climate change are projected, on average, to increase carbon stocks by 17 Pg C (368 Tg C per year) from 2005 to 2050 under different future emissions sce-narios (Tan et al., 2015). Other estimates, however, indicate less carbon sequestration (3.7 Pg C from
228 to 245 Tg CH4 per year in Representative Concentration Pathway (RCP) 2.6 and from 303 to 343 Tg CH4 per year in RCP8.5. Overall, the future response of wetland emissions to climate change remains highly uncertain but is likely to be a positive feedback in terms of radiative forcing effects (Arneth et al., 2010).
Emissions from the Arctic, in particular, have the potential to increase significantly as tem-peratures rise and the vast stores of soil carbon thaw (Harden et al., 2012; Schuur and Abbott 2011). The mass of carbon frozen in Arctic per-mafrost down to 20 m is estimated to be about 1,700 petagrams of carbon (Pg C; Tarnocai et al., 2009), roughly double the approximately 830 Pg C currently in the atmosphere and more than three times what already has been emitted to the atmosphere from fossil fuel use since pre-industrial times. As the Arctic warms and per-mafrost thaws, this ancient carbon may be mobi-lized to the atmosphere, and a small fraction (about 3%) may be emitted as CH4 (Schuur and Abbott 2011). Current understanding suggests that approximately146 to 160 Pg C could be released over the next century, primarily as CO2
(see Key Findings in Ch. 11: Arctic and Boreal Carbon, p. 428). Release of carbon from perma-frost is likely to be gradual and occur on century timescales (Schuur et al., 2015). Annually, if this amount of carbon were released at a constant rate, emissions would be far lower than annual fossil fuel emissions (about 9 Pg C per year) but comparable to land-use change (0.9 Pg C
per year). Schaefer et al. (2011) pointed out that potential carbon emissions from the Arctic could have important implications for policies aimed at reducing or stabilizing emissions, clearly highlighting the importance of maintain-ing long-term measurements of atmospheric CH4 in the Arctic.
Considerable CH4 is also stored in the ocean as clathrates that may be susceptible to release into the ocean and subsequently into the atmo-sphere. While there is no conclusive proof that hydrate-derived CH4 is reaching the atmosphere now, more observational data and improved numerical models will better characterize the climate-hydrate synergy in the future (Ruppel and Kessler 2017).
(Continued)

Section IV | Consequences and Ways Forward
770 U.S. Global Change Research Program November 2018
2015 to 2030, or 246 Tg C per year) and higher uncertainty after 2030 (U.S. Department of State 2016). The primary drivers of carbon uptake arising from land-use and land-cover change activities within the United States are growth of existing forests and activities focused on increased carbon uptake such as forest management and tree planting (U.S. Department of State 2016). Uncertainties in future projections of land use, land-use change, and associated impacts on the North American carbon cycle largely stem from uncertainty in population growth and its effects on forest and agricultural land area, particularly after 2030.
Globally, through carbon sequestration and avoided emissions, effective land-based carbon mitigation strategies could prevent up to 38 Pg C from enter-ing the atmosphere by 2050 (Canadell and Schulze 2014). Land-based emission mitigation strategies include avoided deforestation or conversion, affor-estation or reforestation, improved land manage-ment and livestock practices, new harvested wood product technologies, and bioenergy (Canadell and Raupach 2008; Luyssaert et al., 2014; Van Winkle et al., 2017). However, additional future land-use goals (e.g., food, fiber, and feed production; wildlife management; and other ecosystem services) must be reconciled with strategies for increasing land carbon uptake.
19.3.3 ClimateSince the Third National Climate Assessment (Melillo et al., 2014), new observations and research have increased understanding of past, current, and pro-jected changes in climate, both globally and within North America. The current state of knowledge in climate trends and projections for the United States is summarized in the Climate Science Special Report (CSSR; USGCRP 2017a). This section summarizes some of these key findings. For more detailed infor-mation about the observational evidence and mech-anistic explanations for past and projected climate changes, see the full CSSR (USGCRP 2017a).
Global average annual temperatures over both land and ocean have increased by 1.8°F from 1901
to 2016. Similar warming has been observed over the conterminous United States, with the greatest temperature increase (more than 1.5°F in the past 30 years) seen in Alaska, the Northwest, Southwest, and northern Great Plains (USGCRP 2017a). For example, over the past 50 years, the average annual temperature across Alaska has increased at a rate more than twice as fast as the global average. Multi-ple lines of evidence point to human-driven activity as the dominant cause of the observed warming (USGCRP 2017a). Average annual temperatures across the United States are projected to continue to rise throughout this century, with near-term increases of at least 2.5°F over the coming decades. Much larger increases in temperature (5.8°F to 11.9°F) are projected in the United States by late century under higher human-driven emissions sce-narios (USGCRP 2017a).
As the global climate warms, high-latitude regions (e.g., Alaska and Canada) are projected to become wetter, while the subtropical zone (e.g., southern United States) is projected to become drier. In addi-tion, the tropical belt may widen while the subtrop-ical region may shift poleward (Seidel et al., 2008). Within the United States, projected changes in sea-sonal average precipitation vary and depend on loca-tion and season (USGCRP 2017a). Northern parts of the country are expected to become wetter in the winter and spring as global temperatures increase. In the near term, this precipitation increase is likely to fall as snow. However, as average annual temperature continues to rise and conditions become too warm for snow production, wintertime precipitation will mostly fall as rain (USGCRP 2017a). Conversely, the southwestern United States is projected to become drier with less winter and springtime pre-cipitation (USGCRP 2017b). In many regions of the country, however, changes in future average seasonal precipitation are smaller than or consistent with natural historical variations (USGCRP 2017a).
Along with changes in average annual tempera-ture and seasonal precipitation, the frequency and intensity of extreme heat and heavy precipitation events are likely to increase (USGCRP 2017a). For

Chapter 19 | Future of the North American Carbon Cycle
771Second State of the Carbon Cycle Report (SOCCR2)November 2018
example, under “business-as-usual” human-driven emissions scenarios (e.g., RCP8.5), the number of heavy precipitation events is projected to be two to three times greater than the historical average in every region of the United States by the end of the century (USGCRP 2017a). Additionally, the number of extremely warm days is projected to increase signifi-cantly, along with an increase in heatwave intensity.
Combined, these changes in annual mean tem-perature and seasonal precipitation, as well as the frequency and intensity of extreme events, can drive changes in the water cycle and, by extension, water quality and availability. Expected water cycle changes also are likely to lead to more intense and prolonged droughts within the United States, partic-ularly in the Southwest. The increasing occurrence and severity of droughts can affect plant and agricul-tural productivity, carbon uptake, and the likelihood of disturbance events such as fire.
Projected climate change in North America is expected to affect carbon cycling in both land and ocean ecosystems. On land, the processes of photo-synthesis, respiration, and decomposition strongly depend on temperature and moisture availability, and changes in either can alter the balance of carbon uptake and release across ecosystems ( Jung et al., 2017; Luo 2007; Zscheischler et al., 2014). Simi-larly, because of the temperature sensitivity of gas solubility in water, warmer temperatures caused by climate change also affect the rate and extent to which atmospheric CO2 is exchanged with ocean and freshwater systems. Although most physical and biogeochemical drivers of the ocean carbon cycle favor a decrease of global oceanic CO2 uptake due to climate change, there are significant differences in regional responses and their underlying mechanisms (Crueger et al., 2007; Landschützer et al., 2016). Ultimately, it is this balance between the response of land and ocean systems to future climate that will determine the strength and extent of carbon uptake by these systems and whether they might become a net source of CO2 to the atmosphere.
19.4 Future Land Carbon Cycle The land carbon cycle is sensitive to atmospheric composition, temperature and precipitation changes, disturbances such as fire and disease outbreaks, and land-use and land-cover changes. Future projections of the North American land carbon sink were examined using simulations from a nine-member ensemble of coupled carbon-climate models, forced with the four different future scenar-ios (i.e., RCPs) as described in Section 19.3, p. 763. These are the same models and RCPs that informed the Intergovernmental Panel on Climate Change Fifth Assessment Report (IPCC; Ciais et al., 2013).
Models estimate the strength of the mean North American net land sink from 1990 to 1999 to be 0.36 ± 0.09 Pg C per year (median ± interquartile range), which is consistent with estimates from other methods (see Ch. 2: The North American Carbon Budget, p. 71). Depending on the future scenario, model projections of net land carbon sink strength range from a slight decrease (0.21 ± 0.42 Pg C per year with RCP2.6) to a doubling (0.61 ± 0.60 Pg C per year with RCP4.5) of the current sink strength by midcentury. However, in all scenar-ios, the strength of the net land sink within North America is projected to either remain near current levels (e.g., RCP4.5 and RCP8.5) or decline sig-nificantly (e.g., RCP2.6 and RCP6.0) by the end of the century (see Figure 19.3, p. 772). The higher human-driven emission scenarios and/or the longer the time horizon for the projections, the more uncertain the future of the North American carbon cycle. In fact, models project that the land could be either a net sink (of up to 1.5 Pg C per year) or a net source of carbon (of up to 0.6 Pg C per year) to the atmosphere by 2100 (see Figure 19.3).
Geographically, under the two stabilization sce-narios (i.e., RCP4.5 and RCP6.0), most of North America’s terrestrial biosphere is projected to remain a net sink for atmospheric CO2 through the end of the century (see Figure 19.4, p. 773). However, the strength of carbon uptake could weaken in the East and parts of the U.S. Great Plains. Under both the

Section IV | Consequences and Ways Forward
772 U.S. Global Change Research Program November 2018
low and high human-driven emissions scenarios (RCP2.6 and RCP8.5), the strength of terrestrial carbon uptake is projected to weaken in much of the southern United States and in parts of northern Canada, with some temperate and northern regions turning from a net sink to a net source of CO2 to the atmosphere (see Figure 19.4). With the exception of RCP6.0, under all scenarios, models project that both rising CO2 and climate warming will lead to a strengthening of net carbon uptake in Alaska (see Figure 19.4). This projected net increase in car-bon sink strength is due to increased net primary production in upland alpine ecosystems (Zhu and McGuire 2016), which many models project will offset increased emissions from climate warming and more frequent wildfires. However, results from a synthesis of soil warming experiments (Crowther et al., 2016) contradict these model projections, adding to the already existing large uncertainty (see Section 19.5.2, p. 778, for more details).
The combined and uncertain effects of rising CO2, climate change, and land-use management contribute to the large range of model projections (Arora et al., 2013; Ciais et al., 2013). As discussed in Section 19.3.2, p. 766, land-use change is a key driver of carbon uptake and loss in the terrestrial biosphere. Globally, emissions related to land-use change are projected to decline with all RCPs (see Figure 19.2, p. 765), but the spatial pattern and distribution of land-use changes and their projected impacts on the North American carbon sink are not clear. In addi-tion, local and regional ecosystems will vary consid-erably in their responses to changes in climate and atmospheric composition. Discussed in the next sec-tions are key factors that will influence the sensitivity of the land carbon sink to both a warming climate and rising CO2 and thus influence the future trajectory of North American land carbon stocks and flows.
19.4.1 Response of the Land Carbon Cycle to Rising Atmospheric CO2 Land carbon uptake and storage are projected to increase with rising atmospheric CO2 (via CO2 fer-tilization), both globally and within North America (Ciais et al., 2013). While models tend to agree on
Figure 19.3. Projected Cumulative and Net Land Carbon Sink for North America Based on Four Future Scenarios. (a) Historic and projected cumu-lative North American land carbon sinks are shown in petagrams of carbon (Pg C) from 1980 to 2099 for the ensemble median under each Representative Concen-tration Pathway (RCP). (b) The decadal average net land carbon sink is given based on historic projections (1990 to 1999) and on two snapshots in time for each RCP: 2050 to 2059 (lighter bars on left) and 2090 to 2099 (darker bars on right). Bars show ensemble median; gray circles represent individual model pro-jections. The number of models varies across RCP based on availability. RCP2.6 models were CanESM2, HadGEM2–ES, MIROC-ESM, MPI–ESM–LR, and NorESM1–ME. RCP4.5 and RCP8.5 models were CanESM2, GFDL-ESM2G, GFDL-ESM2M, HadGEM2–ES, IPSL–CM5A-LR, MIROC-ESM, MPI–ESM–LR, NorESM1–ME, and INMCM4. RCP6.0 models were HadGEM2–ES, MIROC-ESM, and NorESM1–ME. All models used are consistent with those from Ch. 6 of the Intergovernmental Panel on Climate Change Fifth Assessment Report (Ciais et al., 2013).
(a)
(b)

Chapter 19 | Future of the North American Carbon Cycle
773Second State of the Carbon Cycle Report (SOCCR2)November 2018
Atmospheric Carbon Dioxide, p. 690). Ecosystem CO2-enrichment experiments in North American forests tend to show that, in the short term (e.g., up to 10 years), CO2 fertilization increases forest produc-tion by 20% to 25% (McCarthy et al., 2010; Norby et al., 2005; Talhelm et al., 2014). However, most of these forest experiments are located in young forests that also were accumulating biomass under ambient CO2 concentrations. The few experiments conducted on individual trees in more mature forests tend to show little or no growth response (Bader et al., 2013; Klein et al., 2016). Accurately projecting future CO2 fertilization effects will likely require accounting for both the forests that already are accumulating biomass and the more established ones that are not. The different responses observed across the range of forest ages probably are related to forest interactions with other factors that limit plant production such as nitrogen availability and perhaps water.
Figure 19.4. Projected Decadal Median Net Land Carbon Sink for North America Based on Four Future Scenarios. (a–d) Projected decadal median land carbon sink in grams of carbon (g C) for North America from 2090 to 2099 under each Representative Concentration Pathway (RCP) scenario: (a) RCP2.6, (b) RCP4.5, (c) RCP6.0, and (d) RCP8.5. (e–h) The difference between the projected net sink for each RCP and the 2000 to 2009 historic baseline, with red (negative) representing areas where the projected strength of the net sink is weaker than the historic base-line, and blue (positive) indicating areas where net carbon uptake is projected to increase compared to historic condi-tions. The number of models varies across RCP based on availability. RCP2.6 models were CanESM2, HadGEM2–ES, MIROC-ESM, MPI–ESM–LR, and NorESM1–ME. RCP4.5 and RCP8.5 models were CanESM2, GFDL-ESM2G, GFDL-ESM2M, HadGEM2–ES, IPSL–CM5A-LR, MIROC-ESM, MPI–ESM–LR, NorESM1–ME, and INMCM4. RCP6.0 models were HadGEM2–ES, MIROC-ESM, and NorESM1–ME. All models used are consistent with those from Ch. 6 of the Intergovernmental Panel on Climate Change Fifth Assessment Report (Ciais et al., 2013).
(a) (b) (c) (d)
(e) (f) (g) (h)
the direction of the carbon uptake response to rising CO2, they show low agreement on the magnitude (size) of this response (see Figure 19.5, p. 775). Figure 19.6, p. 776, shows the spatial distribution of the modeled carbon sink’s response to an increase in atmospheric CO2 (see Ciais et al., 2013). The response is largest in more humid regions (e.g., U.S. Midwest and East Coast) with forested areas and greater amounts of vegetation. Whether models are correct in their projections of a sustained increase in photosynthesis by rising CO2 (i.e., the CO2 fertiliza-tion effect) is uncertain for a number of reasons.
First, the degree to which rising CO2 leads to enhanced plant growth likely depends on the age distribution of trees within a forested ecosystem. Much of the evidence for a CO2-based enhancement of ecosystem carbon storage comes from experi-ments (see Ch. 17: Biogeochemical Effects of Rising

Section IV | Consequences and Ways Forward
774 U.S. Global Change Research Program November 2018
Second, nutrients will likely constrain the land carbon cycle’s response to rising CO2 (e.g., Norby et al., 2010). Nitrogen is a key nutrient for plant growth and can limit or stimulate plant produc-tivity and carbon uptake, depending on nitrogen availability. Nitrogen acquisition and availability probably will be a controlling factor in the strength and persistence of CO2 fertilization (see Ch. 17: Biogeochemical Effects of Rising Atmospheric Carbon Dioxide). However, many current models do not consider nutrient cycling (Ciais et al., 2013; Hoffman et al., 2014), and models that do consider nutrient cycling exhibit substantial uncertainty in responses of terrestrial ecosystems to increased atmospheric CO2 (Walker et al., 2015; Zaehle and Dalmonech 2011). Insights into nitrogen’s com-plex interaction with carbon uptake are only now beginning to emerge with sufficient detail to model computationally (Drake et al., 2011; McCarthy et al., 2010; Norby et al., 2010; Terrer et al., 2016; Walker et al., 2015; Zaehle et al., 2014).
Third, the response of soil carbon stocks to rising CO2 is uncertain. Results from some studies suggest that even if rising CO2 does not lead to increased carbon storage in forest biomass, it may increase carbon storage in soils (e.g., Iversen et al., 2012). However, increased soil carbon input also may accelerate microbial decomposition of carbon and thus soil carbon turnover, leading to less overall soil carbon storage (Hungate et al., 2013; van Groenigen et al., 2014). The strength and magnitude of soil carbon losses, therefore, remains highly uncertain (Georgiou et al., 2015; Walker et al., 2015).
Consequently, it is unclear whether land ecosystems will truly sequester more carbon under elevated CO2. The potential for increased photosynthesis from rising CO2 to enhance long-term carbon storage in North American terrestrial ecosystems depends on 1) whether rising CO2 simply intensifies the rate of short-term carbon cycling (i.e., shorter carbon residence time) or 2) whether the additional carbon is used by plants to build more wood and tissue or is stored as long-lived soil organic matter. Furthermore, variations across biomes and climatic regimes are
likely, and localized extreme weather events, such as droughts or fires, can lead to a decrease in regional ecosystem carbon uptake and thus negate any expected general increases (Reichstein et al., 2013).
19.4.2 Response of the Land Carbon Cycle to a Warming ClimateClimate change is projected to partially negate expected increases in land carbon sinks caused by rising atmospheric CO2 concentrations (see Figure 19.5, p. 775; Ciais et al., 2013; Friedlingstein 2015). Model projections of reductions in carbon storage due to climate change are primarily driven by increased decomposition of organic matter in soils in a warmer world (Friedlingstein 2015; see Ch. 12: Soils, p. 469). However, the magnitude and direction of the global and North American land carbon cycle’s response to a changing climate are uncertain because of other climate warming effects. For example, warmer temperatures are projected to reduce land carbon uptake in temperate North America due to heat stress in plants and increased respiration in soils, both of which could lead to carbon losses (see Figure 19.6, p. 776). Conversely, at higher latitudes where temperature is a limiting factor, a warming climate could lengthen the grow-ing season, leading to increased carbon storage in northern ecosystems. In addition, a warming climate can alter the water cycle through changes in precipi-tation patterns, snowpack, and extreme events such as droughts and floods. All these factors can alter ecosystem function and carbon cycle dynamics.
Globally, soils store 1,500 to 2,400 Pg C, more than twice the amount of carbon in the atmosphere (Bradford et al., 2016). Models project that as the climate warms, carbon losses from soils could range from minimal to significant, with up to one-third of the global soil carbon stock lost by 2100 (Bradford et al., 2016). The low confidence in these projected changes arises from several factors, including outdated assumptions about the controls on soil carbon turnover in models (i.e., model structure), uncertainty in the parameter values used to con-trol the rate of soil carbon decomposition (i.e., model parameterization), and lack of empirical

Chapter 19 | Future of the North American Carbon Cycle
775Second State of the Carbon Cycle Report (SOCCR2)November 2018
observations to capture long-term soil carbon dynamics (Bradford et al., 2016; Crowther et al., 2016; see Ch.12: Soils). As a result, changes in soil carbon resulting from a warming climate cannot be reliably predicted (Bradford et al., 2016). A recent study by Crowther et al. (2016) synthesized obser-vations of warming-induced changes in soil carbon stocks from several field experiments worldwide. Their results suggest that, under business-as-usual emissions and expected climate change (i.e., 2°C
increase over the next 35 years), warming could lead to a net loss of 55 ± 50 Pg C globally from surface soils by 2050. The effect of warming on soil carbon stocks varied across sites, depending on the size of the soil carbon pool and the extent and duration of warming. Their results suggest that soil carbon losses will be greatest in northern latitudes (e.g., the north-eastern United States and Arctic and boreal regions of North America; see Figure 19.7, p. 777) due to the region’s large soil carbon stocks and rapid rates of
Figure 19.5. Land and Ocean Carbon Cycle Feedbacks from Two Generations of Coupled Carbon-Climate Models. The large uncertainty in carbon cycle response to climate and rising atmospheric carbon dioxide (CO2) is shown, particularly for the land carbon cycle. Uncertainty in the response of the ocean carbon cycle to climate and rising CO2 has decreased with model development (e.g., Coupled Climate–Carbon Cycle Model Intercomparison Project [C4MIP] and Coupled Model Intercomparison Project Phase 5 [CMIP5]), but the same cannot be said for the land carbon cycle. Key: K, Kelvin; ppm, parts per million; Pg C, petagrams of carbon. [Figure source: Reprinted from Ciais et al., 2013, copyright IPCC, used with permission.]

Section IV | Consequences and Ways Forward
776 U.S. Global Change Research Program November 2018
Schuur et al., 2015). However, many models do not explicitly account for permafrost dynamics and the potential carbon loss from thawing permafrost soils (Bradford et al., 2016; see Section 19.7.2, p. 780, for more details). In addition, inadequate understanding of interactive soil and plant processes and ecosystem response to climate change impedes accurate repre-sentation of soil carbon processes in current models.
19.5 Future Ocean and Coastal Carbon Cycle The ocean continues to play a key role in mitigating climate warming by taking up most of the additional heat in the Earth system and about a third of CO2 emissions (Gleckler et al., 2016; Frölicher et al., 2015). Short- and long-term changes in the ocean carbon cycle depend on the influences of future atmospheric CO2, ocean temperature, and pH on CO2 solubility, changes in ocean circulation, and carbon inputs from land, as well as the response of marine ecosystems to changes in temperature, pH,
Figure 19.6. Simulated Spatial Distribution of Land and Ocean Carbon Sink Sensitivity to (a) Rising Atmo-spheric Carbon Dioxide (CO2) and (b) a Warming Climate. Shows the change in land carbon storage and air-sea carbon exchange based on a quadrupling of atmospheric CO2 concentrations relative to global CO2 and temperature change. Based on seven models from the Coupled Model Intercomparison Project Phase 5 (CMIP5): BCC-ESM1, CanESM2, CESM1-BGC, HadGEM2-ES, IPSL-CM5a-LR, MIP-ESM-lR, and NorESM1-ME. Key: Kg C, kilograms of carbon; ppm, parts per million; K, Kelvin. [Figure source: Adapted from Figure 6.22 from Ciais et al., 2013, copyright IPCC, used with permission.]
projected warming (Crowther et al., 2016; see also USGCRP 2017a and Section 19.3.3, p. 770). The spatial distribution of potential soil carbon losses derived by Crowther et al. (2016) contradicts pro-jections from coupled carbon-climate models used to inform the latest IPCC report (see Figure 19.6, this page). Models project that warmer temperatures and an extended growing season in high-latitude areas of North America will lead to increased plant carbon inputs to soil that will more than offset increases in soil carbon decomposition rates under warmer temperatures. However, results from warm-ing experiments suggest the opposite—losses con-siderably outweigh any potential positive vegetation responses (Bradford et al., 2016; Crowther et al., 2016). The difference in modeled and experimental results could be related to how soil carbon models are configured (see Ch. 12: Soils). A number of studies point to organic-rich soils (such as wetlands and permafrost) as the carbon pools most vulnerable to climate warming (Bradford et al., 2016; Grosse et al., 2016; Koven et al., 2015; Ringeval et al., 2011;

Chapter 19 | Future of the North American Carbon Cycle
777Second State of the Carbon Cycle Report (SOCCR2)November 2018
and nutrient concentrations (Graven 2016; Matear and Hirst 1999; Sabine et al., 2004).
Under the United Nations Convention on the Law of the Sea (United Nations General Assembly 1982), all ocean areas within 200 nautical miles from the coast are considered exclusive economic zones (EEZs; see Ch. 16: Coastal Ocean and Continen-tal Shelves, p. 649). Taken together, coastal areas (including EEZs) account for 41% of the global ocean area, with North America making up 10% of global coasts. Including all U.S.-inhabited territories in this estimate increases the fraction to 13% (see Ch. 16: Coastal Ocean and Continental Shelves). Connecting terrestrial and oceanic systems, coastal areas are major components of the global carbon cycle (Bauer et al., 2013; Liu et al., 2010; Regnier et al., 2013). The coastal ocean includes rivers, estuaries, tidal wetlands, and the continental shelf; carbon flows within and between these coastal subsystems are substantial (Bauer et al., 2013). Over the past 50 to 100 years, a variety of human activities have shifted the global coastal ocean from being a
net source to a net sink of carbon (approximately 0.45 Pg C annually) from the atmosphere (Bauer et al., 2013). However, because carbon processing within coastal systems varies widely in space and time, estimates of carbon flows within and between coastal subsystems are uncertain (Bauer et al., 2013).
Projections from three CMIP5 models—GFDL-ESM2M (Dunne et al., 2013), HadGEM-ESM (Martin et al., 2011), and MIROC-ESM (Watanabe et al., 2011)— were used to estimate a range of historical (1870 to 1995) and future anthropogenic carbon uptake within North American EEZs (about 22.5 × 10⁶ km2). Since 1870, North American EEZs have taken up 2.6 to 3.4 Pg C of anthropo-genic carbon. Under the highest emissions scenario (RCP8.5), these regions are projected to take up an additional 10 to 12 Pg C by 2050 and another 17 to 26 Pg C in the second half of this century (2050 to 2100). Climate warming, changing circulation, and acidification are expected to present new pressures for ocean and coastal carbon systems. Great uncer-tainty persists around projected changes in coastal carbon cycling as atmospheric CO2 rises, challeng-ing quantification of air-sea CO2 fluxes and efforts to detect and attribute these changing fluxes at the regional coastal scale (Lovenduski et al., 2016). Although coastal zones may be sinks for carbon in the postindustrial age, they are so heavily influenced by human activities and terrestrial processes that projecting their future carbon sink or source behav-ior is difficult (Bauer et al., 2013).
19.5.1 Response of the Ocean and Coastal Carbon Cycle to Rising Atmospheric CO2
Within North America, rising atmospheric CO2 is projected to increase ocean and coastal carbon uptake almost everywhere, particularly in the North Atlantic, which shows the strongest uptake response (see Figure 19.5, p. 775). Rising atmospheric CO2 concentrations have changed the chemical parti-tioning of CO2 between the atmosphere and ocean, driving more CO2 into the ocean. While the surface ocean (top 50 m) comes into CO2 equilibrium with the atmosphere on the timescale of years, equilib-rium with the deeper, interior ocean depends on
Figure 19.7. Potential Vulnerability of Soil Carbon Stocks to Climate Warming. This map, based on a meta-analysis of warming experiments, shows predicted changes in soil carbon stocks by 2050 using spatially explicit estimates of these stocks (measured in kilograms of carbon per square meter [kg C per m2]) and changes in soil surface temperature. Changes are for surface soil carbon stocks (0 to 15 cm in depth) under a 1ºC rise in global average soil surface temperature. [Figure source: Reprinted from Crowther et al., 2016, copyright Macmillan Publishers Ltd, used with permission.]

Section IV | Consequences and Ways Forward
778 U.S. Global Change Research Program November 2018
circulation and ventilation with the atmosphere, a process that varies from years to millennia. As such, most of the ocean is not in equilibrium with the present-day atmosphere. Thus, current rates of CO2 emissions from fossil fuel burning are guaranteed to continue ocean warming and acidification ( Joos et al., 2011) in the coming decades because of the imbalance between atmospheric CO2 levels and ocean CO2 uptake capacity.
As seawater takes up atmospheric CO2 and heat, its buffering capacity decreases as part of ocean acidification (Egleston et al., 2010; see also Ch. 17: Biogeochemical Effects of Rising Atmospheric Carbon Dioxide, p. 690). In the future, warmer and more CO2-enriched waters are expected to take up less additional CO2 and be less resistant to changes in pH (Ciais et al., 2013). Models proj-ect that under business-as-usual CO2 emissions (RCP8.5), seawater pH is likely to decrease 0.4 to 0.5 pH units by 2100 in the ocean basins bordering North America (Bopp et al., 2013). Conversely, with reduced human-driven CO2 emissions intended to limit global surface temperature increase to 2°C (RCP2.6), seawater pH in North America’s surrounding ocean basins would likely drop about 0.1 pH unit (Bopp et al., 2013). Furthermore, changes in ocean circulation (e.g., weakening of the Atlantic meridional overturning circulation; Stouffer et al., 2006) will reduce the vertical transport of carbon into deep ocean layers, thus decreasing the current level of uptake in the North Atlantic. Another mechanism of additional carbon sequestration may occur through enhancement of sinking organic carbon from the surface and sub-sequent remineralization of this carbon at depth. Under future conditions, models show that phyto-plankton and zooplankton populations are likely to shift toward groups that favor higher temperature, greater physical stratification, and elevated CO2 conditions (Bopp et al., 2013; Doney et al., 2009), both in terms of trait diversity within groups (e.g., Dutkiewicz et al., 2013) and in some groups being favored over others (e.g., slow growing, CO2-limited nitrogen fixers; Hutchins et al., 2007). However, knowledge is lacking on the total effects these
population shifts will have on mechanisms such as grazing and aggregation that create sinking material and other biogeochemical cycle changes that may indirectly influence carbon cycling and sequestra-tion (e.g., the nitrogen cycle).
19.5.2 Response of the Ocean and Coastal Carbon Cycle to Warming ClimateContrary to the effects of rising atmospheric CO2 alone, a warming climate is projected to reduce ocean and coastal carbon uptake in most regions within North America (see Figure 19.5, p. 775). Atmospheric and oceanic warming are projected to increase stratification and slow midlatitude ocean circulation (Vecchi and Soden 2007), decreasing CO2 uptake rates (Schwinger et al., 2014). For example, a reduction in ocean carbon uptake has been linked to a decrease of meridional ocean circulation, convective mixing, and increased stratification in the high latitudes (Matear and Hirst 1999). The impacts, however, are uniquely regional (Crueger et al., 2007), as exemplified in the California Current system where climate warming is expected to shift the upwelling region poleward (Rykaczewski et al., 2015). Along the eastern mid-Atlantic shelf, waters may preferentially warm with the poleward shift in winds and current intensification (Wu et al., 2012). These changes may modify the waters’ ability to take up carbon and modulate the latitudinal extent of natural CO2 out-gassing and uptake of atmospheric CO2 along the coast. Both the St. Lawrence estuary bottom waters (Gilbert et al., 2005) and Southern California Bight interior waters (Bograd et al., 2008) have experi-enced decreases in oxygen content and commensu-rate increases in the sequestration of remineralized carbon after it sunk from the surface in response to multidecadal climate change. Additional examples of changes in coastal carbon storage and processing and projected changes are provided in Ch. 15: Tidal Wetlands and Estuaries, p. 596.
Climate-driven warming and changes in precipita-tion also may have major impacts on the amount (Georgakakos et al., 2014) and composition (Tran-vik and Jansson 2002) of future river carbon fluxes

Chapter 19 | Future of the North American Carbon Cycle
779Second State of the Carbon Cycle Report (SOCCR2)November 2018
into coastal systems. Extreme rainfall and flooding events associated with a changing climate will likely lead to a shift in the timing of carbon delivery to the coastal ocean from terrestrial systems, affect-ing coastal carbon budgets in the future (Bauer et al., 2013). Enhanced physical erosion due to the increased occurrence of extreme precipitation events may export more particulate organic carbon to the coastal zone, and burial rates of this organic carbon will influence coastal carbon sequestra-tion (Galy et al., 2015). Enhanced erosion is also expected to result from rising sea levels, significantly altering carbon cycling in coastal estuaries in gen-eral and wetlands (Kirwan and Megonigal 2013), mangroves (Bouillon et al., 2008), and seagrass beds (Fourqurean et al., 2012) in particular.
Coral reef ecosystems are particularly sensitive to the combination of warming and acidification (Hoegh-Guldberg et al., 2007). In today’s ocean, the formation of calcium carbonate in coral reefs has resulted in a significant loss of alkalinity and buffering capacity. As coral calcification decreases, these ecosystems may shift from removing ocean buffering capacity to supplying it. Similarly, thaw-ing permafrost in the Arctic is expected to release organic carbon whose degradation by microbes is projected to create a positive feedback to climate change (Schuur et al., 2008; see also Ch. 11: Arctic and Boreal Carbon, p. 428).
Oceanic and coastal systems clearly are continuing to respond to myriad natural and human-driven changes, although long-term variations or the mech-anisms influencing them are unclear. These systems remain a high-priority study area for both the North American and global carbon science communities to better understand the vulnerability of the ocean carbon sink to rising levels of atmospheric CO2 and future climate change.
19.6 Future Freshwater Carbon Cycle Inland waters occupy a small fraction of Earth’s surface, yet they play a major role in the global car-bon cycle (Biddanda 2017; Buffam et al., 2011; see
Ch. 14: Inland Waters, p. 568). Intrinsically linked to human activities, inland water ecosystems are active, changing, and important regulators of carbon cycling and climate (e.g., Tranvik et al., 2009). These freshwater systems export considerable amounts of carbon from adjacent terrestrial environments to the ocean while also burying organic carbon in inland water sediments (Bauer et al., 2013). In fact, the global burial of organic carbon in these sediments exceeds organic carbon sequestration on the ocean floor (Aufdenkampe et al., 2011; Battin et al., 2009; Tranvik et al., 2009). A synthesis by Tranvik et al. (2009), with a particular focus on North America, demonstrated that global annual CO2 emissions from inland waters (e.g., lakes, impoundments, streams, and rivers) to the atmosphere are similar in magnitude to the amount of atmospheric CO2 taken up by the ocean annually. Although most lakes and rivers across a range of latitudes are reported sources of CO2 to the atmosphere (Alin and Johnson 2007; Cole et al., 2007), there is considerable regional and seasonal variability on the role of freshwater systems as net carbon sources or sinks due to differences in system size, total amount of biomass, carbon resi-dence time, and geological and geographical setting. In North America, most studies show that Lake Superior, Lake Michigan, and Lake Huron are CO2 sources annually, while Lake Erie and Lake Ontario are slight CO2 sinks (McKinley et al., 2011).
The role of freshwater systems in the carbon cycle and as climate regulators has changed dramati-cally over the years. There is high confidence that climate-induced changes in precipitation, hydrolog-ical patterns, flow and thermal regimes, and water-shed characteristics will significantly affect fresh-water ecosystems and their role in carbon cycling (Settele et al., 2014). Model projections of surface and bottom water temperatures of lakes, reservoirs, and rivers throughout North America consistently show an increase from 2°C to 7°C based on climate scenarios where CO2 doubles (e.g., Fang and Stefan 1999; Gooseff et al., 2005; Lehman 2002). This warming is likely to extend and intensify thermal stratification in lakes, resulting in oxygen deficiency and increasing organic carbon sequestration and

Section IV | Consequences and Ways Forward
780 U.S. Global Change Research Program November 2018
burial while favoring methanogenesis and enhanced CH4 emissions from lakes (Romero-Lankao et al., 2014; Tranvik et al., 2009; Wilhelm and Adrian 2007). Freshwater systems at high altitude and high latitude, including alpine and Arctic streams and lakes, are particularly vulnerable to direct climate effects, especially rising temperatures (Settele et al., 2014). Warming and decreased ice cover at high latitudes are expected to affect lake stratification and mixing regimes (Vincent 2009). These factors could shift some northern hardwater lakes from being substantial sources to net sinks of atmospheric CO2. Reduced ice cover also can decrease CO2 accumulation under the ice, increasing spring and summer pH and enhancing the chemical uptake of CO2 (Finlay et al., 2015). Campeau and Del Giorgio (2014) suggested that the current role of boreal fluvial networks as major landscape sources of carbon (CO2 and CH4) is likely to expand with climate change, mainly driven by large increases in fluvial CH4 emissions in response to changes in water temperature and in-stream metabolism. Based on CO2 doubling scenarios from several global circulation models, water levels in the Great Lakes are expected to decline and the frequency of intense storm events is expected to increase. These events, along with warmer water temperatures, are projected to alter the timing and quality of runoff and nutrient loading, change light conditions, and increase lake stratification (Angel and Kunkel 2010; Jiménez Cisneros et al., 2014; Watson et al., 2000), consequently affecting primary production and respiration rates.
19.7 Synthesis, Knowledge Gaps, and Key Research Needs By absorbing atmospheric CO2, the land and ocean play an important role in slowing the buildup of GHGs in the atmosphere, thereby slowing the pace of climate change. As mentioned at the outset of this chapter, an important question in carbon cycle science is whether ocean and land systems will con-tinue to provide this service or whether the strength of the ocean and land carbon sink will decrease under changing climate conditions (Michalak et al.,
2011). Numerous vulnerabilities are associated with assessing current and projected carbon cycle con-ditions. Taking into account the magnitude, timing, and likelihood of projected carbon cycle changes discussed in this chapter, this section synthesizes current understanding, highlighting critical carbon cycle vulnerabilities, knowledge gaps, and key research needs related to the co-evolution of carbon cycle dynamics in a changing climate.
19.7.1 CO2 FertilizationCrucial to projecting future changes in the North American carbon cycle is the ability to project the response of land ecosystems to increasing atmo-spheric CO2. As discussed in Section 19.4.1, p. 772, three areas of incomplete understanding limit cur-rent efforts to project forest and terrestrial ecosystem responses to increasing CO2: 1) age distribution of forests, 2) nutrient interactions (particularly nitro-gen), and 3) soil carbon responses. These three areas are interrelated because of a lack of understanding about carbon-nitrogen coupling. More research is needed to understand what constitutes plant nitro-gen demand, carbon-allocation strategies used by plants to respond to nutrient demand, the carbon cost of nitrogen acquisition, factors that determine the capacity of soils to supply nitrogen, and soil carbon losses associated with increased soil nitrogen mineralization.
19.7.2 Permafrost Carbon–Climate FeedbackA primary uncertainty in carbon-climate feedback projections stems from limited understanding of the responses of carbon stocks in the northern high latitudes (≥60°N) to a changing climate. Estimates show that, globally, surface permafrost (0 to 3 m) contains about 33% of the overall surface soil carbon pool (1,035 ± 150 Pg C; Hugelius et al., 2014). Along with carbon deposits deeper than 3 m (including those within the Yedoma region) and subsea permafrost carbon, the total estimate of terrestrial permafrost carbon in the northern per-mafrost zone is 1,330 to 1,580 Pg C (Schuur et al., 2015). More recent simulations (McGuire et al.,

Chapter 19 | Future of the North American Carbon Cycle
781Second State of the Carbon Cycle Report (SOCCR2)November 2018
2018) estimate that between 2010 and 2299, losses of permafrost between 3 and 5 million km2 for the RCP4.5 climate and between 6 and 16 million km2 for the RCP8.5 climate may be possible.
The permafrost zone’s overall carbon budget is determined by the soil carbon as well as vegetation carbon dynamics and their interactions. For exam-ple, increased vegetation growth due to warming leads to greater soil carbon inputs, whereas perma-frost thawing accelerates carbon release (see Ch. 11: Arctic and Boreal Carbon, p. 428). The presence of large carbon stocks in a rapidly warming region raises concern about increased carbon emissions, as well as changes in global albedo, the hydrological cycle, and thermohaline circulation (Hinzman et al., 2013).
The primary challenge in projecting the trajectory of permafrost thawing is that the physical and bio-geochemical properties of permafrost vary widely depending on the characteristics of the parent mate-rial, ice and liquid water content, topography, biota, and climate ( Jorgenson et al., 2010). With contin-ued warming and large-scale losses of near-surface permafrost, almost all terrestrial carbon cycle models indicate that by the end of this century, the Arctic could shift from a net sink to a source of car-bon (Cox et al., 2000; Fisher et al., 2014b). Consid-erable debate remains, however, on the amplitude, timing, and form of the carbon release (e.g., Lenton et al., 2008; Schuur et al., 2015; Slater and Lawrence 2013). This disagreement is directly related to a lack of understanding of three key factors that determine the potential climate feedback of the permafrost carbon pool: 1) area and depth of permafrost vul-nerable to release, 2) the speed with which carbon will be released from thawing soils, and 3) the form of carbon (e.g., CO2 or CH4) that will be released (NRC 2014). Similar to land permafrost, questions have emerged about the stability of organic carbon sequestered in the marine permafrost of Alaska and Canada amid climate warming (see Section 19.7.4, p. 783). Combined, these limitations in understand-ing result in considerable uncertainty in how future climate change will affect northern high latitudes
and reshape traditional ways of life. Ongoing research efforts led by U.S., Canadian, and interna-tional partners have highlighted the need for long-term empirical observations to capture soil carbon dynamics to improve understanding of land carbon–climate feedbacks and evaluate model performance, thereby constraining future projections.
19.7.3 Disturbance Fire and DiseaseNatural and human-driven disturbances will influ-ence future vegetation carbon storage. Forest distur-bance is a fundamental driver of terrestrial carbon cycle dynamics (Hicke et al., 2012), and harvesting, fire, wind throw, storms, pathogen and pest out-breaks, and drought collectively lead to the removal of 200 Tg C from U.S. forests annually (Williams et al., 2016). Initially, most disturbances shift an ecosystem to a carbon source, while recovery from disturbance is commonly associated with greater net ecosystem carbon storage (Magnani et al., 2007; Odum 1969). Hence, disturbance effects on carbon balance in forests are both immediate and lagged and potentially long lasting. Given current management practices, climate change is likely to increase the frequency and intensity of ecological disturbances across multiple spatial and temporal scales (Running 2008). For example, reduced water availability resulting from decreased precipitation and snowpack probably will increase forest suscep-tibility to fire and insect attack (Allen and Breshears 1998; Breshears et al., 2009; Westerling et al., 2006).
Fire activity is largely expected to increase (Sommers et al., 2014; Westerling et al., 2006) in many regions, with fire seasons starting earlier and ending later compared to previous decades ( Jolly et al., 2015). Uncertain, however, is whether regional fire severity will decrease or increase (Collins 2014; Fried et al., 2004; Parks et al., 2016; Stavros et al., 2014) by mid-century. In the western United States specifically, projected increases in fire activity (Westerling et al., 2006) imply a decrease in biomass accumulation between successive fires, resulting in less biomass available for combustion and, thus, a reduction in fire severity. A recent study by Parks et al. (2016)

Section IV | Consequences and Ways Forward
782 U.S. Global Change Research Program November 2018
also points out that projected increases in water stress will decrease productivity in the generally water-limited western United States, which may also feedback to further reduce the amount of biomass available to burn. However, since changes in fire–carbon cycle linkages are highly ecosystem specific, temperature-limited forests (e.g., northern high latitudes)—unlike the water-limited forests of the western United States—will likely experi-ence increased fire frequency and severity under a warmer climate (Kasischke et al., 2010).
The extent and severity of forest insect disturbances has increased with changing climate conditions (Kurz et al., 2008). As climate warms, the range of insects (e.g., mountain pine beetle) has expanded into higher elevations and latitudes, putting previ-ously unaffected forests at risk (Bentz et al., 2010; Kurz et al., 2008). Combined, these changes in disturbance regime and severity may result in significant loss of forest carbon sinks, particularly in North America as live carbon stocks transition to dead (Hicke et al., 2012; Kurz et al., 2008). However, the timing of carbon release associated with forest insect disturbances is unclear because of uncertainty surrounding respiration suppression or enhancement (Borkhuu et al., 2015; Levy-Varon et al., 2014; Moore et al., 2013); specific biogeo-chemical, microbial, and hydrological responses (Edburg et al., 2012; Maurer et al., 2016; Trahan et al., 2015); and the overall ecosystem carbon bal-ance (Ghimire et al., 2015). Losses of carbon stocks caused by disturbance are mediated by interactions among climate, vegetation type, and productivity, with changing forest management practices resulting in reduced potential fuel loads and thus reductions in fire severity (Parks et al., 2016).
DroughtSimilar to fire and insect infestations, droughts can trigger immediate and time-lagged effects on car-bon stocks and flows (van der Molen et al., 2011). Both seasonal short-term observations and model-ing studies have documented the effects of drought on ecosystem carbon fluxes (Anderegg et al., 2012, 2015; Ciais et al., 2005; Doughty et al., 2015;
Keenan et al., 2009; Zeng et al., 2005). Over the last decade, midlatitudes in the United States have experienced frequent drought events, and similar events are expected to increase in area, frequency, intensity, and duration (e.g., Blunden et al., 2011; Kogan et al., 2013; USGCRP 2017a). Although early prediction and detection of water-induced vegetation stress are critical for agribusiness and food security ( Jones et al., 2011), the exact cou-pling between the carbon and hydrological cycles remains unclear, as does the response of different vegetation types to short-term water stress. For example, the impact of the 2012 summer drought in the United States was compensated by increased spring carbon uptake due to earlier vegetation activity (Wolf et al., 2016); these two opposing effects mitigated the impact on the net annual carbon uptake for 2012. Is the response observed in 2012 representative of what can be expected under future climate change? The answer to this question remains highly uncertain. Climate projec-tions from the CMIP5 ensemble of model simula-tions show warmer spring and drier summer mean conditions across the United States similar to those observed in 2012. Additionally, drought-induced near-term changes in plant water content can have a longer-term impact by increasing an ecosystem’s vulnerability to other disturbances, such as wild-fire and insect outbreaks (Arnone et al., 2008; Reichstein et al., 2013; van Mantgem et al., 2009). Thus, future projections of carbon cycle vulnerabil-ity due to drought need to adopt a holistic model-ing framework to assess the full range of responses to climate extremes.
Land-Use and Land-Cover ChangesUnderstanding the carbon cycle effects of changes in land-use and land-cover (LULC) management requires insights into diverse issues and processes. These include the socioeconomic factors (e.g., technological change and market incentives) driving human use of land, as well as the biophysi-cal (e.g., albedo, evaporation, and heat flux), bio-geochemical (e.g., carbon and nutrient cycling), and biogeographical processes (e.g., location and

Chapter 19 | Future of the North American Carbon Cycle
783Second State of the Carbon Cycle Report (SOCCR2)November 2018
movement of species) affected by land-use choices. For example, intensive agriculture in the western United States appears to have caused abrupt losses of Arctic ecosystem structure and soil erosion (carbon cycling) due to increased populations of migrating snow geese supported by agricultural food supplies ( Jefferies et al., 2006; MacDonald et al., 2014). Such dynamic interconnectivity and coupling between natural and human-driven activities at different space-time regimes demonstrate the challenge in projecting long-term feedbacks between the carbon cycle and land use.
As discussed in Section 19.3.2, p. 766, generating estimates of future potential LULC management and change is challenging because of the diffi-culty in projecting not only dynamics within and between complex terrestrial ecosystems, but also future potential climate, macroeconomic, and social conditions. Moreover, many of these conditions can vary significantly, depending on location and the temporal and spatial scales of the analysis. Policies and programs can significantly affect land use, especially on public lands, whereas market signals can have a large impact on how private lands are used. For example, the role of markets is import-ant as landowners make decisions affecting LULC management, which in turn affects GHG emission levels, ensuing climate change, and thus carbon cycles. As a result, there is relatively high variabil-ity in projected estimates of land-cover change and associated impacts on carbon stocks and net emissions (Buchholz et al., 2014). Additional research is needed to model existing trends in land management and to develop scenarios of future land management and associated changes in carbon stocks and emissions (USGCRP 2017b).
19.7.4 Ocean and Coastal Carbon CyclesKey uncertainties in processes that affect carbon cycling in the ocean and coastal zones limit the ability to project future system responses. Often highly populated, coastal zones have diverse uses as residential, urban, industrial, shipping, and recreational areas, resulting in a complex interplay of management drivers. Management of coastal
wetlands, mangroves, and seagrass beds amid sea level rise, in particular, will have important carbon cycle consequences because these systems sequester carbon with extremely high efficiency and would be replaced by other systems whose sequestration efficiency is much lower. Natural disturbances com-monly responsible for the loss of carbon-intensive ecosystems include hurricanes, earthquakes, disease, and herbivore grazing. The human activities most affecting these coastal ocean ecosystems are nutri-ent and sediment loading from runoff and sewage disposal, dredging and filling, pollution, upland development, and certain fishing practices such as trawling (Short and Wyllie-Echeverria 1996). Although activities such as dredging of shipping channels and erosion-control measures can have locally strong implications, more regionally expan-sive activities such as bottom trawling may have important coastal carbon cycle effects, depending on trawling intensity and bottom biogeography (e.g., Duplisea et al., 2001).
Changes in sedimentary carbon processing due to warming, acidification, or deoxygenation will alter the source and sink status of coastal zones, which already are insufficiently understood. Continued human disturbance of coastal zones represents an added perturbation to biological production and res-piration both in the water column and in sediments, with the potential to substantially alter existing and also poorly understood coastal carbon cycling. Microbial regeneration of organic matter under warming, deoxygenation, and acidification may change as well, altering the timing, magnitude, or locations of CO2 release back into seawater. Vertical export of carbon via the creation of sinking material such as fecal pellets and marine snow (Alldredge and Silver 1988) is still poorly understood and parame-terized in many models. In addition, the physiologi-cal and ecosystem impacts previously outlined (e.g., changes in grazing or recycling) also may influence how much carbon is sequestered to the deep ocean by vertical export (Marsay et al., 2015). Finally, compared to terrestrial systems, there is only rudi-mentary understanding of ocean and coastal system resilience to climate- or carbon-driven perturbations

Section IV | Consequences and Ways Forward
784 U.S. Global Change Research Program November 2018
and the speed with which they may recover from short-term disturbances under climate change.
High-latitude coastal ecosystems are among those most likely to experience an amplification of global change (e.g., Serreze and Francis 2006). Along with significant increases in river discharges in the past century, most of the coastline in the northern high latitudes is receding at an unprecedented rate due to coastal erosion, mobilizing large quantities of sediments and carbon. Estimates of the biogeo-chemical processes, interactions, and exchanges across the land-ocean interface in this region are still poorly constrained. Detailed studies have examined specific aspects of individual northern, high-latitude rivers including the Yukon (Dornblaser and Striegl 2009; Spencer et al., 2008) and Mackenzie (e.g., Emmerton et al., 2008). However, only a few studies have assessed how these riverine fluxes directly affect the coastal ecosystems from river deltas to estuaries on larger regional scales (e.g., Dittmar and Kattner 2003) and longer-term decadal timescales (e.g., Overeem and Syvitski 2010).
19.7.5 Freshwater Carbon CycleFreshwater ecosystems are particularly vulnerable to anthropogenic disturbances and are considered to be among the most threatened ecosystems on the planet (Vorosmarty et al., 2010). Human activities such as water management, river fragmentation by dams, alteration of natural flow, construction of water impoundments, and changes in land use have a major impact on freshwater ecology, biology, and carbon cycling. There is high confidence that direct human impacts will continue to dominate the threats to most freshwater ecosystems globally over the next three decades as urbanization increases, irrigated agriculture expands, and human demand for water resources grows (Settele et al., 2014). The high connectivity between lakes and their catch-ments suggests that future CO2 concentrations in lakes and exchanges with the atmosphere will be highly sensitive to altered catchment manage-ment and effects of climate change on catchment characteristics (Maberly et al., 2012). Projected increases in human-driven nutrient inputs, from
either watershed or airshed processes (Rabalais et al., 2009), are expected to enhance inland water primary production and biological uptake of atmo-spheric CO2 (Pacheco et al., 2014). Acidification may put additional ecological pressure on freshwa-ters (Hasler et al., 2016; Phillips et al., 2015; Weiss et al., 2018), thus further confounding the impacts. Similarly, concomitant increases in organic carbon inputs and intensification of mineralization could offset increased CO2 uptake in many of these sys-tems ( Jansson et al., 2008).
Projecting the response of freshwater systems to future environmental change will require accounting for differences across systems and climatic regimes. Also needed are projections that include the complex interactions between climate change and the many natural and human-driven stressors that affect inland ecosystems. Key uncertainties exist in the mechanistic under-standing of carbon sources, lability, and transfor-mations taking place in inland waters. To better predict freshwater systems, improved coupled hydrodynamic-biogeochemical models are needed, along with new remote-sensing tools and sen-sors with high spatial and spectral resolution for capturing the broad spatiotemporal variability that characterizes freshwater carbon fluxes.
Finally, it is worth underscoring that significant knowledge gaps remain in current understanding of the future trajectory of North American car-bon storage in terrestrial and aquatic ecosystems, permafrost carbon-climate linkages, and the role of natural and human-driven disturbance on carbon cycling dynamics. These and other impacts, vulnera-bilities, and risks are recognized as meriting atten-tion and research. For all these emerging research areas, a combination of observational, experimental, synthesis, and modeling activities is needed to gain a predictive understanding of these processes (see Box 19.2, Improving Model Projections of Future Carbon Cycle Changes, p. 785), and thereby better constrain the future of the North American (and global) carbon cycle.

Chapter 19 | Future of the North American Carbon Cycle
785Second State of the Carbon Cycle Report (SOCCR2)November 2018
Box 19.2 Improving Model Projections of Future Carbon Cycle ChangesLaboratory and controlled field experiments, along with satellite remote sensing and inten-sive airborne observations, provide clues about carbon-climate interactions and guide understand-ing of potential future responses of the carbon cycle to changing atmospheric and climate condi-tions. However, climate and carbon cycle interac-tions are more temporally dynamic and spatially diverse than field studies can adequately sample. Furthermore, carbon cycle feedbacks with climate cannot be directly observed or measured due to the long timescales involved (Friedlingstein 2015). As a result, projections of future carbon cycle behavior amid changing climate and environmen-tal conditions rely mostly on information available from a variety of carbon and Earth System Models.
Models are integral components of carbon cycle science. One value of using models to simulate the carbon cycle and its response to environmental drivers and human factors is that models can sim-ulate not only current conditions, but also a range of potential future conditions or realities (Fisher et al., 2014a). Models can be used to project poten-tial carbon cycle changes resulting from different human-caused emission pathways (see Section 19.3.1, p. 765), different management or policy choices (see Section 19.3.2, p. 766), and different climate scenarios (see Section 19.3.3, p. 770). Thus, models can be used to improve understand-ing of the potential land and ocean ecosystem response to changing environmental conditions and to identify potential tipping points or thresh-olds in the carbon cycle.
Modeling carbon cycle dynamics poses a variety of challenges, however, which lead to uncertain-ties in projections. Three key sources of error are discussed that contribute to uncertainties in carbon cycle projections:
1. Model Inputs. Carbon cycle processes are highly sensitive to environmental change. Thus, uncertainty in these external forcings or future scenarios can lead to biases in model projections (Luo et al., 2015). In historic simulations (e.g., up to the present day), the choice of data used as input to a model can influence model results. For example, Poulter et al. (2011) found that the choice of land cover and climate data selection impacted simulated net primary production by up to 13% and soil respiration by up to 19%. In addition, Huntzinger et al. (2013) found that using consistent environmental driver data among models could lower model spread considerably. In future model projections, uncertainties in the forcing scenarios and time evolution of greenhouse gas emissions, land use, and other human-driven activities can lead to considerable uncertainty or vari-ability in forecasts (Bonan and Doney 2018), particularly in predictions of future ocean carbon cycling.
2. Model Structure. To simulate carbon cycle responses to global change as realistically as possible, models have incorporated increas-ingly relevant processes (e.g., Fisher et al., 2014b). Continued improvements to the model structure are critical to advance both theoretical understanding of the driving biogeochemical processes and the accuracy of carbon cycle projections (Anav et al., 2013). However, the more processes a model incor-porates to realistically simulate real-world phenomena, the more difficult it becomes to understand or evaluate the model’s complex behaviors and the interplay among processes. As a result, uncertainty in projections among models cannot be easily diagnosed and
Continued on next page

Section IV | Consequences and Ways Forward
786 U.S. Global Change Research Program November 2018
attributed to underlying sources (e.g., Luo et al., 2009). Model intercomparison efforts are an effective way to help diagnose differ-ences among groups of sophisticated models (e.g., Multi-scale Synthesis and Terrestrial Model Intercomparison Project [MsTMIP; Huntzinger et al., 2013, 2017], TRENDY [Piao et al., 2013], and Vegetation/Ecosystem Modeling and Analysis Project [VEMAP; Melillo et al., 1995]). Despite these advances, the current generation of models still clearly suffers from incomplete process represen-tation, especially related to carbon dioxide fertilization response (see Section 19.7.1, p. 780); permafrost (see Section 19.7.2, p. 780); disturbance-related carbon dynamics (see Section 19.7.3, p. 781); and interactions among tidal wetlands, estuaries, sediments, and shelf waters (Benway et al., 2016; see also Ch. 15: Tidal Wetlands and Estuaries, p. 596).
3. Model Parameterization. The ways in which processes are represented within models are informed by carbon cycle observations. Exist-ing observations span only a limited subset of spatial and temporal scales, however, lead-ing to additional uncertainties. Developing approaches for using a broader array of avail-able observational datasets (see Appendix C: Selected Carbon Cycle Research Obser-vations and Measurement Programs, p. 821) could help in revising current modeling approaches and informing model parameter-izations. For example, optimized calibration of model parameters with common databases through data assimilation (Forkel et al., 2014; Hararuk et al., 2014; MacBean et al., 2016; Smith et al., 2013) could substantially reduce systematic biases among models and provide information about underlying processes that control carbon dynamics. Achieving these advancements requires a) improving the availability and use of global databases (Bloom and Williams 2015), b) developing
carbon cycle data systems that can effec-tively assimilate both flux- and pool-based datasets into global carbon cycle models (Bacour et al., 2015), c) understanding subgrid-scale variability of model parameters, and d) increasing the overall computational efficiency of the optimization process.
Combined, model structure and model param-eterization constitute what is termed “model uncertainty,” or uncertainty in the model itself, whereas uncertainty from input data, forcing scenario, or natural variability are external to the model’s representation of the biosphere. The contribution of each of these uncertainty sources to a given projection depends on the spatial scale, time horizon, and quantity of interest (Bonan and Doney 2018; see Figure 19.8, p. 787). In projec-tions of cumulative global carbon uptake from 2006 to 2100, model uncertainty and scenario uncertainty contributed most to the spread of projections across the ensemble of models (see Figure 19.8). Projections of the future ocean car-bon cycle are dominated by scenario uncertainty by the end of the century, whereas projections of the land carbon cycle are attributed mostly to model structure.
To reduce model uncertainty related to the model itself (i.e., model structure and parameterization), model performance must be critically evaluated against observations. A host of recent studies (e.g., De Kauwe et al., 2013, 2014; Luo et al., 2012; Medlyn et al., 2015; Sulman et al., 2012; Walker et al., 2015; Zaehle et al., 2014) offer a promising set of techniques for diagnosing model variability (e.g., the International Land Model Benchmark-ing project [ILAMB; Hoffman et al., 2017] for the land carbon cycle and the Coastal CARbon Synthesis [CCARS; Benway et al. 2016] for North American estuarine and tidal wetlands). To enable more comprehensive model evaluations in the next few years, both the list of output variables and focus areas (e.g., ocean and coastal carbon
(Continued)
Continued on next page

Chapter 19 | Future of the North American Carbon Cycle
787Second State of the Carbon Cycle Report (SOCCR2)November 2018
cycle components) being examined must be expanded. The availability of long-term, sustained observations of environmental variables also
remains key to reducing model uncertainty and thereby improving the accuracy and robustness of the model projections.
(Continued)
Figure 19.8. Ocean and Land Carbon Cycle Uncertainty. The percentage of total model variance or spread attributed to internal variability, model uncertainty, and scenario uncertainty in projections of cumulative global carbon uptake differs widely between (a) ocean and (b) land. The ocean carbon cycle is dominated by sce-nario uncertainty by the middle of the century, but uncertainty in the land carbon cycle is mostly from model structure. Data are from 12 Earth System Models using four different scenarios. [Figure source: Reprinted from Bonan and Doney 2018, used with permission from AAAS.]
(a) (b)

788 U.S. Global Change Research Program November 2018
Section IV | Consequences and Ways Forward
SUPPORTING EVIDENCE
KEY FINDING 1Emissions from fossil fuel combustion in the North American energy sector are a source of carbon to the atmosphere. Projections suggest that by 2040, total North American fossil fuel emissions will range from 1,504 to 1,777 teragrams of carbon (Tg C) per year, with most com-ing from the United States (~80%, or 1,259 to 1,445 Tg C per year). Compared to 2015 levels, these projections represent either a 12.8% decrease or a 3% increase in absolute emissions (high confidence).
Description of evidence base The projections used in this analysis are from three sources: the U.S. Department of Energy’s Energy Information Administration (EIA 2017), Environment and Climate Change Canada (ECCC 2016b), and the Organisation for Economic Cooperation and Development’s Interna-tional Energy Agency (IEA 2016).
EIA publishes projections in Annual Energy Outlook, which uses the National Energy Modeling System, an integrated model that aims to capture various interactions of economic changes and energy supply, demand, and prices. Typically, reference cases are built with assumptions about known technologies; current laws, regulations, and standards; and views of economic and demo-graphic trends that conform to leading economic forecasters and demographers. These cases are compared to a series of side cases. In the case of EIA, these side scenarios include high and low prices of oil, high and low economic growth, and whether or not the U.S. Environmental Protec-tion Agency’s Clean Power Plan (www.epa.gov/sites/production/files/2015-08/documents/cpp-final-rule.pdf) is implemented.
The ECCC model includes 1) a reference case “with current measures;” 2) actions taken by governments, consumers, and businesses up to 2013; and 3) future impacts of existing policies and measures put in place as of September 2015. The high emissions scenario uses high oil and gas prices and higher-than-average annual growth in gross domestic product (GDP). The low emissions scenario uses low world oil and gas price projections and slower GDP growth. ECCC also uses the Energy, Emissions and Economy Model for Canada (E3MC). E3MC has two com-ponents: 1) Energy 2020, which incorporates Canada’s energy supply and demand structure, and 2) the in-house macroeconomic model of the Canadian economy. Modeling estimates are subject to consultations with various stakeholders (including provincial and territorial governments) to review modeling assumptions, implemented policies and measures, and emissions estimates. The modeling assumptions also undergo a periodic external review process.
IEA (2016) produced a special report on Mexico’s energy outlook in light of the energy reform efforts (Reforma Energetica) that Mexico initiated in 2013, which brought an end to long-standing monopolies within the energy sector. According to IEA (2016), total energy demand has grown by 25% since 2000 and electricity consumption by 50%. IEA uses three scenarios for its global projections and deployed them for the Mexican study: 1) “New Policies,” 2) “Current Policies,” and 3) “450,” which is largely aspirational. The New Policies scenario is the central case informed by an approximately 20% increase in energy demand and a growth rate averaging 0.7% per year. As

789Second State of the Carbon Cycle Report (SOCCR2)November 2018
Supporting Evidence | Chapter 19 | Future of the North American Carbon Cycle
in the other scenarios, IEA decouples energy demand growth from economic growth, reflecting a structure shift in economies, a growing service sector, and energy-efficiency improvements.
Major uncertainties Energy market projections and fossil fuel emissions futures are subject to uncertainty because many factors that shape energy decisions and future developments in technologies, demograph-ics, and resources cannot be foreseen with certainty. These factors include economic and demo-graphic growth, energy prices, technological innovation and adoption, government policies, laws and regulations, and international conditions. In addition, while attempts were made to standard-ize the sources and gases in inventories across nations, differences in greenhouse gas protocols (see Appendix E: Fossil Fuel Emissions Estimates for North America, p. 839) prevented com-plete consistency.
Assessment of confidence based on evidence and agreement, including short description of nature of evidence and level of agreement Although there is uncertainty in individual projections and in projecting trends in energy mar-kets, all estimates agree that emissions from fossil fuel combustion in North America are a source of carbon to the atmosphere and will continue to be a source into the future.
Summary sentence or paragraph that integrates the above information Emissions from fossil fuel combustion in the North American energy sector currently serve as a source of carbon to the atmosphere and will continue to do so into the future. Uncertainty in projections arises from the influence of policies, technologies, prices, economic growth, demand, and other difficult-to-predict variables.
KEY FINDING 2Land, ocean, coastal, and freshwater systems are currently net sinks of carbon from the atmo-sphere, taking up more carbon annually than they release. However, emerging understanding sug-gests that the future carbon uptake capacity of these systems may decline, depending on different emissions scenarios, with some reservoirs switching from a net sink to a net source of carbon to the atmosphere (high confidence).
Description of evidence base Most work examining future carbon cycle changes and potential feedbacks with climate and ris-ing atmospheric carbon dioxide (CO2) has been conducted at the global scale as part of coupled carbon-climate model intercomparison efforts including the Coupled Model Intercomparison Project Phase 5 (CMIP5; Friedlingstein 2015; Friedlingstein et al., 2014). As a result, published estimates of projections specific to both the land carbon sink and coastal ocean carbon uptake in North America are lacking.
To provide an estimate of future land carbon sink evolution in North America, this chapter relied on the globally gridded net biome productivity simulated by nine CMIP5 models (Ciais et al., 2013; Friedlingstein 2015). With the exception of CESM1-BGC, which was not available on the CMIP5 data download page, the models and set of simulations used here (and in Figures 19.3, p. 772, and 19.4, p. 773) are the same as those used in Ch. 6 of the Intergovernmental Panel on Climate Change Fifth Assessment Report (IPCC; Table 6.11): CanESM2, GFDL-ESM2G, GFDL-ESM2M, HadGEM2–ES, IPSL–CM5A-LR, MIROC-ESM, MPI–ESM–LR, NorESM1–ME,

790 U.S. Global Change Research Program November 2018
Section IV | Consequences and Ways Forward
and INMCM4. The simulation output was placed into a consistent 0.5° grid and trimmed to North America (10° to 70°N and 50° to 170°E). Projected land sink estimates were evaluated for all four of the Representative Concentration Pathways (RCPs; van Vuuren et al., 2011) used in the latest IPCC report:
1. RCP8.5 High Emissions Scenario. Projects increasing CO2 and methane (CH4) emis-sions over time due to increased energy intensity as a result of high population growth and lower rates of technology development leading to radiative forcing of 8.5 watts per square meter (W/m2) by 2100. This scenario assumes an increase in cropland and grass-land area driven by the demands of population growth.
2. RCP6.0 Stabilization Scenario. Projects a range of technologies and strategies to reduce CO2 emissions after the year 2080, coupled with fairly steady CH4 emissions throughout the century to stabilize radiative forcing at 6 W/m2 in 2100. This scenario assumes an increase in cropland area, but a decline in pasture area due to aggressive implementation of intensive animal husbandry.
3. RCP4.5 Stabilization Scenario. Projects a range of technologies and strategies to reduce CO2 emissions after 2040, coupled with fairly steady CH4 emissions throughout the century to stabilize radiative forcing at 4.5 W/m2 in 2100. This scenario assumes a decrease in cropland and grassland area due to climate policies that value carbon in natural vegetation.
4. RCP2.6 Low Emissions Scenario. Projects an increased use of bioenergy and carbon capture and storage, which leads to substantial reduction in CO2 emissions after 2020. This reduction coupled with declining CH4 emissions from energy production, trans-portation, and livestock leads to a peak in radiative forcing of 3 W/m2, followed by a decline to 2.6 W/m2 by 2100. Cropland area increases, but largely as a result of bioen-ergy production. Grassland area remains relatively constant as the increase in animal production is offset by more intensive animal husbandry.
For the North American coastal ocean, this report used three CMIP5 models (GFDL-ESM2M [Dunne et al., 2013], HadGEM-ESM [Martin et al., 2011], and MIROC-ESM [Watanabe et al., 2011]) to estimate a range of historical (1870 to 1995) and future carbon uptake within the exclu-sive economic zones (EEZs) of North America (approximately 22.5 × 10⁶ km2). Since 1870, North American EEZs have taken up 2.6 to 3.4 petagrams of carbon (Pg C). These regions are projected to take up an additional 10 to 12 Pg C by 2050 and another 17 to 26 Pg C in the second half of this century (2050 to 2100). Global projections of ocean carbon uptake vary depending on emissions scenarios (Ciais et al., 2013). Under lower future emissions scenarios (e.g., RCP2.6 and RCP4.5), the strength of the ocean carbon sink starts to level off toward the end of the century. For the North American Pacific Coast, the combined effect of multiple factors (e.g., increasing atmospheric CO2, surface warming, less vertical mixing with greater vertical stratification, and increases in horizontal temperature gradients) may lead to greater and more persistent CO2 outgassing nearshore and lower productivity offshore (see Ch. 16: Coastal Ocean and Continental Shelves, p. 649).
791Second State of the Carbon Cycle Report (SOCCR2)November 2018
Supporting Evidence | Chapter 19 | Future of the North American Carbon Cycle
Major uncertainties The balance between positive and negative influences of climate and atmospheric CO2 on the global carbon cycle is not well constrained in models (see Figure 19.5, p. 775; Ciais et al., 2013; Graven 2016). Although models tend to agree on the direction of the carbon uptake response to both climate warming and rising CO2, they show low agreement on the magnitude (size) of this response (Ciais et al., 2013). In land carbon cycling, many current models do not consider nutrient cycle processes or the coupling of the nitrogen and carbon cycles (Ciais et al., 2013). In addition, model response to climate warming is highly uncertain. Climate warming could lead to an increase or decrease in carbon uptake, depending on a number of factors that will vary by region and the species present within a given ecosystem (Graven 2016). Major sources of uncer-tainty in models are projected changes in permafrost and soil carbon storage (see Section 19.7.2, p. 780). Many models do not explicitly account for permafrost dynamics and include outdated representations of soil carbon turnover that are inconsistent with emerging scientific understand-ing (Bradford et al., 2016).
Assessment of confidence based on evidence and agreement, including short description of nature of evidence and level of agreement Land, ocean, coastal, and freshwater systems are currently net sinks of carbon from the atmo-sphere. Although projections vary depending on future climate and carbon emissions scenarios, it is likely that under some future climate and CO2 emissions scenarios these systems will turn from a net sink to a net source of carbon.
Summary sentence or paragraph that integrates the above information It is the balance between the response of land and ocean systems to future climate and rising atmospheric CO2 that will ultimately determine the strength and extent of carbon uptake by these systems and whether they continue to be net sink of carbon from the atmosphere or switch to being a net source.
KEY FINDING 3Human-driven changes in land cover and land use will continue to be key contributors to carbon cycle changes into the future, both globally and in North America. Globally, land-use change is projected to contribute 10 to 100 Pg C to the atmosphere by 2050 and between 19 and 205 Pg C by 2100. Conversely, in the United States, land use and land-use change activities are projected to increase carbon stocks in terrestrial ecosystems by about 4 Pg C from 2015 to 2030. This projected increase is primarily driven by the growth of existing forests and management activi-ties that promote ecosystem carbon uptake, often in response to changes in market, policy, and climate (high confidence).
Description of evidence base Global estimates are based on Brovkin et al. (2013), who examined the difference in land carbon storage between the ensemble averages of simulations with and without land-use changes using RCP2.6 and RCP8.5. The RCP2.6 scenario assumes that climate change mitigation is partially achieved by increasing the use of bioenergy crops. Under this scenario, the global land area used for pastures is more or less constant over the simulation period, and increases in produc-tion (animal-based products) are achieved through changes in approaches to animal husbandry (Brovkin et al., 2013). In the RCP8.5 scenario, food demands and increasing population drive

792 U.S. Global Change Research Program November 2018
Section IV | Consequences and Ways Forward
the expansion of croplands and pastures (and the loss of forested lands). The model ensemble includes six CMIP5 models for the projections: CanESM2, EC-Earth, HadGEM2-ES, IPSL-CM5A-LR, MIROC-ESM, and MPI-ESM-LR. Across all models, Brovkin et al. (2013) found a robust signal showing a loss of global land carbon storage because of projected land-use and land-cover change activities.
There is a lack of projections of emissions and sink trends for land use, land-use change, and forestry (LULUCF) activities specific to North America as a whole. U.S. estimates are based on the Second Biennial Report of the United States of America (U.S. Department of State 2016). That report presents a range in carbon sequestration estimates (689 to 1,118 teragrams [Tg] of CO2 equivalent [CO2e] per year by 2030) associated with U.S. land-use change and forestry activities. Also estimated is that emissions from forestry and land use will be 28 Tg CO2e in 2030.
To project cumulative carbon uptake from 2015 to 2030, the emissions estimate associated with forestry and land use (28 Tg CO2e) is subtracted from the low and high estimates of sequestra-tion associated with forestry and land use (689 to 1,118 Tg CO2e). These values are then com-bined and divided by 2 to arrive at an average projected net uptake per year in 2030 of 875.5 Tg CO2e per year. This value is converted to teragrams of carbon (239 Tg C per year) and multiplied by 15 to arrive at a cumulative uptake of 3.6 Pg C from 2015 to 2030.
Major uncertainties Uncertainties arise from how land use and land-use change information is implemented into the carbon cycle representation of ecosystem models (i.e., the inclusion or exclusion of specific land-use processes such as wood harvest; Brovkin et al., 2013). In global projections, uncertainty also arises from the lack of coupled carbon-nitrogen (and phosphorus) dynamics in models. The models in this study do not account for the effect of nitrogen or phosphorus limitation on land ecosystems or CO2 fertilization.
For both the global and North American projections, there is also uncertainty in estimates of population growth and its potential impact on forest and agricultural land area. Moreover, there is general uncertainty in the potential future magnitude and timing of land-use change impacts on the land carbon cycle because of the difficulty in projecting the outcome of complex and interact-ing environmental, climate, and socioeconomic systems.
Assessment of confidence based on evidence and agreement, including short description of nature of evidence and level of agreement Several studies generally agree with high confidence that direct human influence on land use and land-cover change is a large driver of future potential carbon cycle changes. Model projections for North America agree that U.S. LULUCF activities will continue to result in net carbon uptake (i.e., carbon sequestration) to 2030. However, uncertainty in population growth and its impact on forests and agricultural land leads to considerable uncertainty in carbon uptake projections beyond 2030 associated with land-use change and forestry activities.
Summary sentence or paragraph that integrates the above information There is high confidence that land use, land-use change, and management play important roles in both the global and North American carbon cycles. However, the future magnitude and timing of carbon cycle changes emerging from land use and land-use change depend on a number of factors

793Second State of the Carbon Cycle Report (SOCCR2)November 2018
Supporting Evidence | Chapter 19 | Future of the North American Carbon Cycle
that are difficult to project, including population growth and environmental and economic poli-cies, all of which will drive changes in land use.
KEY FINDING 4The enhanced carbon uptake capacity of ocean and terrestrial systems in response to rising atmospheric CO2 will likely diminish in the future. In the ocean, warmer and more CO2-enriched waters are expected to take up less additional CO2. On land, forest maturation, nutrient limita-tions, and decreased carbon residence time in soils will likely constrain terrestrial ecosystem response to rising CO2 (high confidence).
Description of evidence base Although models tend to agree on the direction of the carbon uptake response to rising CO2, they show low agreement on the magnitude (i.e., size) of this response, particularly for terrestrial ecosys-tems (see Figure 19.5, p. 775). However, some factors potentially important for limiting the CO2 fertilization response of terrestrial ecosystems are not currently represented in models, including 1) the age distribution of forest trees, 2) nutrient limitation, and 3) soil carbon turnover rates.
Forest Age. Ecosystem CO2 enrichment experiments in North American forests tend to show that, in the short term (e.g., up to 10 years), CO2 fertilization increases forest production by 20% to 25% (McCarthy et al., 2010; Norby et al., 2010; Talhelm et al., 2014). However, most of these forest experiments were conducted in young forests that also were accumulating biomass under ambient CO2 concentrations. The few experiments that have been conducted on individual trees in more mature forests tend to show little or no growth response (Bader et al., 2013; Klein et al., 2016).
Nutrient Limitation. Nutrients will likely constrain land carbon cycle response to rising CO2 (e.g., Norby et al., 2010). Many current models do not consider nutrient cycle processes (Ciais et al., 2013; Hoffman et al., 2014), contributing substantial uncertainty to the overall accuracy of CO2–carbon cycle feedback estimates. Even models that do consider nutrient cycling exhibit substantial uncertainty in responses of terrestrial ecosystems to increased atmospheric CO2 (Walker et al., 2015; Zaehle and Dalmonech 2011).
Soil Carbon Turnover Rates. Results from some studies suggest that soil carbon storage may increase with rising atmospheric CO2 (e.g., Iversen et al., 2012), even if the latter does not lead to increased carbon storage in forest biomass. However, soil carbon input may change microbial decomposition rates and the rate of soil carbon turnover, leading to less overall soil carbon stor-age (Hungate et al., 2013; van Groenigen et al., 2014).
In the ocean, warmer and more CO2-enriched waters are expected to take up less additional CO2 and be less resistant to changes in pH (Ciais et al., 2013). Several studies (Gattuso et al., 2015; Randerson et al., 2015; Bopp et al., 2013; Doney et al., 2009) have investigated in detail the impacts of contrasting emissions scenarios on ocean dynamics and marine and coastal ecosys-tems, including the goods and services that they provide. Alongside changes in ocean dynamics and a slowing of the ocean sink, these studies also highlight the fact that phytoplankton and zooplankton populations are likely to shift toward groups that favor higher temperature, greater physical stratification, and elevated CO2 conditions, both in terms of trait diversity within groups

794 U.S. Global Change Research Program November 2018
Section IV | Consequences and Ways Forward
(e.g., Dutkiewicz et al., 2013) and in some groups being favored over others (e.g., slow growing, CO2-limited nitrogen fixers; Hutchins et al., 2007).
Major uncertainties See previous section describing the evidence base.
Assessment of confidence based on evidence and agreement, including short descrip-tion of nature of evidence and level of agreement Models tend to agree on the direction of land and ocean carbon uptake response to rising CO2, but they show less agreement on the magnitude of this response. However, multiple points of evidence suggest that the strength of net carbon uptake in response to rising CO2 will decrease into the future.
Summary sentence or paragraph that integrates the above informationThe recent increase in the carbon uptake capacity of ocean and terrestrial systems in response to rising atmospheric CO2 from human-driven emissions will likely diminish in the future. Warmer and more CO2-enriched ocean waters are expected to take up less CO2 as climate warms due to a number of factors. Such factors, including forest maturation, nutrient limitations, and decreased carbon residence time in soils, will likely constrain terrestrial ecosystem response to rising CO2.
KEY FINDING 5Soil carbon losses in a warming climate will be a key determinant of the future North American carbon cycle. An important region of change will be the Arctic, where thawing permafrost and the release of previously frozen carbon will likely shift this region from a net sink to a net source of carbon to the atmosphere by the end of the century (very high confidence).
Description of evidence base A meta-analysis of results from soil warming experiments indicates that soil carbon stock response to climate warming is variable but predictable and depends on the size of the soil carbon pool and the extent and duration of warming (Crowther et al., 2016). As a result, projected soil carbon losses are greatest at northern latitudes (e.g., Arctic and subarctic; see Figure 19.7, p. 777, which have large soil carbon stocks and some of the most rapid rates of projected warming (Crowther et al., 2016; see also USGCRP 2017a and Section 19.3.3, p. 770). With continued warming and large-scale losses of near-surface permafrost, almost all terrestrial carbon cycle mod-els indicate that, by the end of this century, the Arctic could shift from a sink to a source of carbon (Cox et al., 2000; Fisher et al., 2014b).
Major uncertainties Although there is considerable agreement that climate warming will lead to carbon loss from per-mafrost regions, the amplitude, timing, and form of carbon release remain topics of debate (e.g., McGuire et al., 2018; Lenton et al., 2008; Schuur et al., 2015; Slater and Lawrence 2013). This disagreement stems from a lack of understanding of three key factors that determine the potential climate feedback of the permafrost carbon pool: 1) the area and depth of permafrost vulnerable to release, 2) the speed with which carbon will be released from thawing soils, and 3) the form of carbon (e.g., CO2 and CH4) that will be released (Schuur et al., 2013, 2015).

795Second State of the Carbon Cycle Report (SOCCR2)November 2018
Supporting Evidence | Chapter 19 | Future of the North American Carbon Cycle
Assessment of confidence based on evidence and agreement, including short description of nature of evidence and level of agreementWhile some uncertainty remains about the timing, speed, and form of carbon release from permafrost thaw, there is strong agreement across multiple studies that climate warming will result in carbon loss from permafrost soils. Over time, under increased rates of warming in the Arctic, the carbon loss from permafrost thaw will likely cause high northern latitudes to switch from a net sink to a net source of carbon to the atmosphere.
Summary sentence or paragraph that integrates the above information Although the amplitude, timing, and form of carbon released from thawing permafrost are still under study, there is very high confidence that warming will lead to soil carbon loss from perma-frost regions.
KEY FINDING 6Carbon storage in both terrestrial and aquatic systems is vulnerable to natural and human-driven disturbances. This vulnerability is likely to increase as disturbance regimes shift and disturbance severity increases with changing climatic conditions (high confidence).
Description of evidence base Natural and human-driven disturbances will influence future vegetation carbon storage. Forest disturbance is a fundamental driver of terrestrial carbon cycle dynamics (Hicke et al., 2012). Harvesting, fire, wind throw, storms, pathogen and pest outbreaks, and drought collectively lead to the removal of 200 Tg C from U.S. forests annually (Williams et al., 2016). Initially, most dis-turbances shift an ecosystem to a carbon source, while recovery from disturbance is commonly associated with greater net ecosystem carbon storage (Magnani et al., 2007; Odum 1969). Hence, the effects of disturbance on carbon balance in forests are both immediate and lagged, and poten-tially long lasting. Given current management practices, climate change is likely to increase distur-bance frequency and intensity across multiple spatial and temporal scales (Running 2008). Fire activity generally is expected to increase (Sommers et al., 2014; Westerling et al., 2006) in many regions, with fire seasons starting earlier and ending later compared to previous decades ( Jolly et al., 2015). With climate warming, the range of insects (e.g., mountain pine beetle) is expected to expand into higher elevations and latitudes, putting previously unaffected forests at risk (Bentz et al., 2010; Kurz et al., 2008). Evidence suggests that the extent and severity of forest insect dis-turbances also are increasing with changing climate conditions (Kurz et al., 2008).
Freshwater ecosystems are particularly vulnerable to anthropogenic disturbances and are con-sidered to be among the most threatened ecosystems on the planet (Vorosmarty et al., 2010). Human activities such as water management, river fragmentation by dams, alteration of natu-ral flow, construction of water impoundments, and land-use changes have a major impact on freshwater ecology, biology, and carbon cycling. There is high confidence that direct human impacts—including increasing urbanization, expansion of irrigated agriculture, and growing demand for water resources—will continue to dominate the threats to most freshwater ecosys-tems globally over the next three decades (Settele et al., 2014).
Major uncertainties Projections of future carbon cycle processes are highly sensitive to the ability of models to sim-ulate external forcings. When projecting future carbon responses to natural and human-driven

796 U.S. Global Change Research Program November 2018
Section IV | Consequences and Ways Forward
disturbances, there is a great deal of uncertainty (and intrinsic difficulty) in modeling disturbance events, particularly their timing, extent, and severity (Luo et al., 2015). Also, understanding and pre-dicting the impacts of natural and human-driven disturbances on the carbon cycle require insights into and the ability to project management decisions, human use of land and aquatic systems, and the dynamic coupling and interconnectivity between natural and human-driven activities.
Assessment of confidence based on evidence and agreement, including short description of nature of evidence and level of agreementWhile uncertainties remain in the ability to project the exact magnitude of carbon cycle impacts due to future disturbance events, the trajectory of land and aquatic carbon storage and loss is vulnerable to both natural and human-driven disturbances. As climate conditions change and the occurrence of extreme weather events increases, the impacts of disturbances on ecosystem carbon storage is likely to increase.
Summary sentence or paragraph that integrates the above information Natural and human-driven disturbance will influence future vegetation carbon storage. Carbon storage in terrestrial and aquatic systems is vulnerable to disturbance events, and this vulnera-bility is likely to increase as disturbance regimes shift and disturbance severity increases with changing climatic conditions. However, the intrinsic predictability of disturbance events and their drivers is challenging.

Chapter 19 | Future of the North American Carbon Cycle
797Second State of the Carbon Cycle Report (SOCCR2)November 2018
REFERENCES
Alin, S. R., and T. C. Johnson, 2007: Carbon cycling in large lakes of the world: A synthesis of production, burial, and lake-atmosphere exchange estimates. Global Biogeochemical Cycles, 21(3), doi: 10.1029/2006gb002881.
Alldredge, A. L., and M. W. Silver, 1988: Characteristics, dynamics and significance of marine snow. Progress in Oceanography, 20(1), 41-82, doi: 10.1016/0079-6611(88)90053-5.
Allen, C. D., and D. D. Breshears, 1998: Drought-induced shift of a forest-woodland ecotone: Rapid landscape response to climate variation. Proceedings of the National Academy of Sciences USA, 95(25), 14839-14842.
Anav, A., P. Friedlingstein, M. Kidston, L. Bopp, P. Ciais, P. Cox, C. Jones, M. Jung, R. Myneni, and Z. Zhu, 2013: Evaluating the land and ocean components of the global carbon cycle in the CMIP5 Earth system models. Journal of Climate, 26(18), 6801-6843, doi: 10.1175/jcli-d-12-00417.1.
Anderegg, W. R., C. Schwalm, F. Biondi, J. J. Camarero, G. Koch, M. Litvak, K. Ogle, J. D. Shaw, E. Shevliakova, A. P. Williams, A. Wolf, E. Ziaco, and S. Pacala, 2015: Forest ecology. Pervasive drought legacies in forest ecosystems and their implications for carbon cycle models. Science, 349(6247), 528-532, doi: 10.1126/science.aab1833.
Anderegg, W. R., J. A. Berry, D. D. Smith, J. S. Sperry, L. D. Anderegg, and C. B. Field, 2012: The roles of hydraulic and carbon stress in a widespread climate-induced forest die-off. Proceedings of the National Academy of Sciences USA, 109(1), 233-237, doi: 10.1073/pnas.1107891109.
Angel, J. R., and K. E. Kunkel, 2010: The response of Great Lakes water levels to future climate scenarios with an emphasis on Lake Michigan-Huron. Journal of Great Lakes Research, 36, 51-58, doi: 10.1016/j.jglr.2009.09.006.
Arneth, A., S. P. Harrison, S. Zaehle, K. Tsigaridis, S. Menon, P. J. Bartlein, J. Feichter, A. Korhola, M. Kulmala, D. O’Donnell, G. Schurgers, S. Sorvari, and T. Vesala, 2010: Terrestrial biogeo-chemical feedbacks in the climate system. Nature Geoscience, 3(8), 525-532, doi: 10.1038/ngeo905.
Arnone, J. A., 3rd, P. S. Verburg, D. W. Johnson, J. D. Larsen, R. L. Jasoni, A. J. Lucchesi, C. M. Batts, C. von Nagy, W. G. Coulombe, D. E. Schorran, P. E. Buck, B. H. Braswell, J. S. Coleman, R. A. Sherry, L. L. Wallace, Y. Luo, and D. S. Schimel, 2008: Prolonged suppres-sion of ecosystem carbon dioxide uptake after an anomalously warm year. Nature, 455(7211), 383-386, doi: 10.1038/nature07296.
Arora, V. K., G. J. Boer, P. Friedlingstein, M. Eby, C. D. Jones, J. R. Christian, G. Bonan, L. Bopp, V. Brovkin, P. Cadule, T. Hajima, T. Ilyina, K. Lindsay, J. F. Tjiputra, and T. Wu, 2013: Carbon–concentration and carbon–climate feedbacks in CMIP5 Earth sys-tem models. Journal of Climate, 26(15), 5289-5314, doi: 10.1175/jcli-d-12-00494.1.
Aufdenkampe, A. K., E. Mayorga, P. A. Raymond, J. M. Melack, S. C. Doney, S. R. Alin, R. E. Aalto, and K. Yoo, 2011: Riverine coupling of biogeochemical cycles between land, oceans, and atmosphere. Frontiers in Ecology and the Environment, 9(1), 53-60, doi: 10.1890/100014.
Bacour, C., P. Peylin, N. MacBean, P. J. Rayner, F. Delage, F. Chevallier, M. Weiss, J. Demarty, D. Santaren, F. Baret, D. Berveiller, E. Dufrêne, and P. Prunet, 2015: Joint assimilation of eddy covariance flux measurements and fapar products over tem-perate forests within a process-oriented biosphere model. Journal of Geophysical Research: Biogeosciences, 120(9), 1839-1857, doi: 10.1002/2015jg002966.
Bader, M. K. F., S. Leuzinger, S. G. Keel, R. T. W. Siegwolf, F. Hagedorn, P. Schleppi, C. Körner, and J. Lee, 2013: Central European hardwood trees in a high-CO2 future: Synthesis of an 8-year forest canopy CO2 enrichment project. Journal of Ecology, 101(6), 1509-1519, doi: 10.1111/1365-2745.12149.
Barker T., I. Bashmakov, L. Bernstein, J. E. Bogner, P. R. Bosch, R. Dave, O. R. Davidson, B. S. Fisher, S. Gupta, K. Halsnæs, G. J. Heij, S. Kahn Ribeiro, S. Kobayashi, M. D. Levine, D. L. Martino, O. Masera, B. Metz, L. A. Meyer, G.-J. Nabuurs, A. Najam, N. Nakicenovic, H. -H. Rogner, J. Roy, J. Sathaye, R. Schock, P. Shukla, R. E. H. Sims, P. Smith, D. A. Tirpak, D. Urge-Vorsatz, and D. Zhou, 2007: Technical summary. In: Climate change 2007: Mitigation. Contribution of working group III to the fourth assessment report of the Intergovernmental Panel on Climate Change, [B. Metz, O. R. David-son, P. R. Bosch, R. Dave, and L. A. Meyer (eds.)]. Cambridge, UK, and New York, NY, USA.
Battin, T. J., S. Luyssaert, L. A. Kaplan, A. K. Aufdenkampe, A. Richter, and L. J. Tranvik, 2009: The boundless carbon cycle. Nature Geoscience, 2(9), 598-600, doi: 10.1038/ngeo618.
Bauer, J. E., W. J. Cai, P. A. Raymond, T. S. Bianchi, C. S. Hopkinson, and P. A. Regnier, 2013: The changing carbon cycle of the coastal ocean. Nature, 504(7478), 61-70, doi: 10.1038/nature12857.
Beach, R. H., Y. Cai, A. Thomson, X. Zhang, R. Jones, B. A. McCarl, A. Crimmins, J. Martinich, J. Cole, S. Ohrel, B. DeAngelo, J. McFarland, K. Strzepek, and B. Boehlert, 2015: Climate change impacts on US agriculture and forestry: Benefits of global climate stabilization. Environmental Research Letters, 10(9), 095004, doi: 10.1088/1748-9326/10/9/095004.
Bentz, B. J., J. Régnière, C. J. Fettig, E. M. Hansen, J. L. Hayes, J. A. Hicke, R. G. Kelsey, J. F. Negrón, and S. J. Seybold, 2010: Climate change and bark beetles of the Western United States and Canada: Direct and indirect effects. BioScience, 60(8), 602-613, doi: 10.1525/bio.2010.60.8.6.
Benway, H., S. Alin, E. Boyer, W.-J. Cai, P. Coble, J. Cross, M. Friedrichs, M. Goñi, P. Griffith, M. Herrmann, S. Lohrenz, J. Mathis, G. McKinley, R. G. Najjar, C. Pilskaln, S. Siedlecki, and R. L. Smith, 2016: A Science Plan For Carbon Cycle Research In North American Coastal Waters. Report of the Coastal Carbon Synthesis (CCARS) Community Workshop, August 19-21, 2014. Ocean Car-bon and Biogeochemistry Program and North American Carbon Program, 84 pp. [https://www.us-ocb.org/coastal-carbon-synthe-sis-ccars/]

Section IV | Consequences and Ways Forward
798 U.S. Global Change Research Program November 2018
Biddanda, B., 2017: Global significance of the changing fresh-water carbon cycle. Earth and Space Science News, 98, doi: 10.1029/2017eo069751.
Bierwagen, B. G., D. M. Theobald, C. R. Pyke, A. Choate, P. Groth, J. V. Thomas, and P. Morefield, 2010: National housing and imper-vious surface scenarios for integrated climate impact assessments. Proceedings of the National Academy of Sciences USA, 107(49), 20887-20892, doi: 10.1073/pnas.1002096107.
Bloom, A. A., and M. Williams, 2015: Constraining ecosystem carbon dynamics in a data-limited world: Integrating ecological “common sense” in a model–data fusion framework. Biogeosciences, 12(5), 1299-1315, doi: 10.5194/bg-12-1299-2015.
Blunden, J., D. S. Arndt, and M. O. Baringer, 2011: State of the cli-mate in 2010. Bulletin of the American Meteorological Society, 92(6), S1-S236, doi: 10.1175/1520-0477-92.6.s1.
Bograd, S. J., C. G. Castro, E. Di Lorenzo, D. M. Palacios, H. Bailey, W. Gilly, and F. P. Chavez, 2008: Oxygen declines and the shoaling of the hypoxic boundary in the California current. Geophysical Research Letters, 35(12), doi: 10.1029/2008gl034185.
Bonan, G. B., and S. C. Doney, 2018: Climate, ecosystems, and planetary futures: The challenge to predict life in Earth system models. Science, 359(6375), eaam8328, doi: 10.1126/science.aam8328.
Bopp, L., L. Resplandy, J. C. Orr, S. C. Doney, J. P. Dunne, M. Gehlen, P. Halloran, C. Heinze, T. Ilyina, R. Séférian, J. Tjiputra, and M. Vichi, 2013: Multiple stressors of ocean ecosystems in the 21st century: Projections with CMIP5 models. Biogeosciences, 10(10), 6225-6245, doi: 10.5194/bg-10-6225-2013.
Borkhuu, B., S. D. Peckham, B. E. Ewers, U. Norton, and E. Pendall, 2015: Does soil respiration decline following bark beetle induced forest mortality? Evidence from a lodgepole pine forest. Agricul-tural and Forest Meteorology, 214-215, 201-207, doi: 10.1016/j.agrformet.2015.08.258.
Bouillon, S., A. V. Borges, E. Castañeda-Moya, K. Diele, T. Dittmar, N. C. Duke, E. Kristensen, S. Y. Lee, C. Marchand, J. J. Middelburg, V. H. Rivera-Monroy, T. J. Smith, and R. R. Twilley, 2008: Mangrove production and carbon sinks: A revision of global budget estimates. Global Biogeochemical Cycles, 22(2), doi: 10.1029/2007gb003052.
Bradford, M. A., W. R. Wieder, G. B. Bonan, N. Fierer, P. A. Raymond, and T. W. Crowther, 2016: Managing uncertainty in soil carbon feedbacks to climate change. Nature Climate Change, 6(8), 751-758, doi: 10.1038/nclimate3071.
Breshears, D. D., O. B. Myers, C. W. Meyer, F. J. Barnes, C. B. Zou, C. D. Allen, N. G. McDowell, and W. T. Pockman, 2009: Tree die-off in response to global change-type drought: Mortality insights from a decade of plant water potential measurements. Frontiers in Ecology and the Environment, 7(4), 185-189, doi: 10.1890/080016.
Brovkin, V., L. Boysen, V. K. Arora, J. P. Boisier, P. Cadule, L. Chini, M. Claussen, P. Friedlingstein, V. Gayler, B. J. J. M. van den Hurk, G. C. Hurtt, C. D. Jones, E. Kato, N. de Noblet-Ducoudré, F. Pacifico, J. Pongratz, and M. Weiss, 2013: Effect of anthropo-genic land-use and land-cover changes on climate and land carbon storage in CMIP5 projections for the twenty-first century. Journal of Climate, 26(18), 6859-6881, doi: 10.1175/jcli-d-12-00623.1.
Brovkin, V., M. Claussen, E. Driesschaert, T. Fichefet, D. Kicklighter, M. F. Loutre, H. D. Matthews, N. Ramankutty, M. Schaeffer, and A. Sokolov, 2006: Biogeophysical effects of historical land cover changes simulated by six Earth system models of intermediate complexity. Climate Dynamics, 26(6), 587-600, doi: 10.1007/s00382-005-0092-6.
Brown, D. G., C. Polsky, P. Bolstad, S. D. Brody, D. Hulse, R. Kroh, T. R. Loveland, and A. Thomson, 2014: Land use and land cover change. In: Climate Change Impacts in the United States: The Third National Climate Assessment. [ J. M. Melillo, T. T. C. Richmond, and G. W. Yohe (eds.)]. U.S. Global Change Research Program, 318-332 pp
Buchholz, T., S. Prisley, G. Marland, C. Canham, and N. Sampson, 2014: Uncertainty in projecting GHG emissions from bioenergy. Nature Climate Change, 4(12), 1045-1047, doi: 10.1038/ nclimate2418.
Buffam, I., M. G. Turner, A. R. Desai, P. C. Hanson, J. A. Rusak, N. R. Lottig, E. H. Stanley, and S. R. Carpenter, 2011: Integrating aquatic and terrestrial components to construct a complete carbon budget for a north temperate lake district. Global Change Biology, 17(2), 1193-1211, doi: 10.1111/j.1365-2486.2010.02313.x.
Campeau, A., and P. A. Del Giorgio, 2014: Patterns in CH4 and CO2 concentrations across boreal rivers: Major drivers and implications for fluvial greenhouse emissions under climate change scenarios. Global Change Biology, 20(4), 1075-1088, doi: 10.1111/gcb.12479.
Canadell, J. G., and E. D. Schulze, 2014: Global potential of biospheric carbon management for climate mitigation. Nature Communications, 5, 5282, doi: 10.1038/ncomms6282.
Canadell, J. G., and M. R. Raupach, 2008: Managing forests for climate change mitigation. Science, 320(5882), 1456-1457, doi: 10.1126/science.1155458.
Canadell, J. G., P. Ciais, S. Dhakal, H. Dolman, P. Friedlingstein, K. R. Gurney, A. Held, R. B. Jackson, C. Le Quéré, E. L. Malone, D. S. Ojima, A. Patwardhan, G. P. Peters, and M. R. Raupach, 2010: Interactions of the carbon cycle, human activity, and the climate system: A research portfolio. Current Opinion in Environmental Sustainability, 2(4), 301-311, doi: 10.1016/j.cosust.2010.08.003.
CCSP, 2007: First State of the Carbon Cycle Report (SOCCR): The North American Carbon Budget and Implications for the Global Carbon Cycle. A Report by the U.S. Climate Change Science Program and the Subcommittee on Global Change Research. [A. W. King, L. Dilling, G. P. Zimmerman, D. M. Fairman, R. A. Houghton, G. Marland, A. Z. Rose, and T. J. Wilbanks (eds.)]. National Oceanic and Atmospheric Administration, National Climatic Data Center, Asheville, NC, USA, 242 pp.

Chapter 19 | Future of the North American Carbon Cycle
799Second State of the Carbon Cycle Report (SOCCR2)November 2018
Ciais, P., C. Sabine, G. Bala, L. Bopp, V. Brovkin, J. Canadell, A. Chhabra, R. DeFries, J. Galloway, M. Heimann, C. Jones, C. Le Quéré, R. B. Myneni, S. Piao, and P. Thornton, 2013: Carbon and other biogeochemical cycles. In: Climate Change 2013: The Physical Science Basis. Contribution of Working Group I to the Fifth Assessment Report of the Intergovernmental Panel on Climate Change. [T. F. Stocker, D. Qin, G. K. Plattner, M. Tignor, S. K. Allen, J. Boschung, A. Nauels, Y. Xia, V. Bex and P. M. Midgley (eds.)]. Cambridge University Press, Cambridge, UK, and New York, NY, USA, 465-570 pp.
Ciais, P., M. Reichstein, N. Viovy, A. Granier, J. Ogee, V. Allard, M. Aubinet, N. Buchmann, C. Bernhofer, A. Carrara, F. Chevallier, N. De Noblet, A. D. Friend, P. Friedlingstein, T. Grunwald, B. Heinesch, P. Keronen, A. Knohl, G. Krinner, D. Loustau, G. Manca, G. Matteucci, F. Miglietta, J. M. Ourcival, D. Papale, K. Pilegaard, S. Rambal, G. Seufert, J. F. Soussana, M. J. Sanz, E. D. Schulze, T. Vesala, and R. Valentini, 2005: Europe-wide reduction in primary productivity caused by the heat and drought in 2003. Nature, 437(7058), 529-533, doi: 10.1038/nature03972.
Cole, J. J., Y. T. Prairie, N. F. Caraco, W. H. McDowell, L. J. Tranvik, R. G. Striegl, C. M. Duarte, P. Kortelainen, J. A. Downing, J. J. Middelburg, and J. Melack, 2007: Plumbing the global carbon cycle: Integrating inland waters into the terrestrial carbon budget. Ecosystems, 10(1), 172-185, doi: 10.1007/s10021-006-9013-8.
Collins, B. M., 2014: Fire weather and large fire potential in the northern Sierra Nevada. Agricultural and Forest Meteorology, 189-190, 30-35, doi: 10.1016/j.agrformet.2014.01.005.
Cox, P. M., R. A. Betts, C. D. Jones, S. A. Spall, and I. J. Totterdell, 2000: Acceleration of global warming due to carbon-cycle feed-backs in a coupled climate model. Nature, 408(6809), 184-187, doi: 10.1038/35041539.
Crowther, T. W., K. E. Todd-Brown, C. W. Rowe, W. R. Wieder, J. C. Carey, M. B. Machmuller, B. L. Snoek, S. Fang, G. Zhou, S. D. Allison, J. M. Blair, S. D. Bridgham, A. J. Burton, Y. Carrillo, P. B. Reich, J. S. Clark, A. T. Classen, F. A. Dijkstra, B. Elberling, B. A. Emmett, M. Estiarte, S. D. Frey, J. Guo, J. Harte, L. Jiang, B. R. Johnson, G. Kroel-Dulay, K. S. Larsen, H. Laudon, J. M. Lavallee, Y. Luo, M. Lupascu, L. N. Ma, S. Marhan, A. Michelsen, J. Mohan, S. Niu, E. Pendall, J. Penuelas, L. Pfeifer-Meister, C. Poll, S. Reinsch, L. L. Reynolds, I. K. Schmidt, S. Sistla, N. W. Sokol, P. H. Templer, K. K. Treseder, J. M. Welker, and M. A. Bradford, 2016: Quan-tifying global soil carbon losses in response to warming. Nature, 540(7631), 104-108, doi: 10.1038/nature20150.
Crueger, T., E. Roeckner, T. Raddatz, R. Schnur, and P. Wetzel, 2007: Ocean dynamics determine the response of oceanic CO2 uptake to climate change. Climate Dynamics, 31(2-3), 151-168, doi: 10.1007/s00382-007-0342-x.
De Kauwe, M. G., B. E. Medlyn, S. Zaehle, A. P. Walker, M. C. Dietze, T. Hickler, A. K. Jain, Y. Luo, W. J. Parton, I. C. Prentice, B. Smith, P. E. Thornton, S. Wang, Y. P. Wang, D. Warlind, E. Weng, K. Y. Crous, D. S. Ellsworth, P. J. Hanson, H. Seok Kim, J. M. Warren, R. Oren, and R. J. Norby, 2013: Forest water use and water use efficiency at elevated CO2 : A model-data intercompari-son at two contrasting temperate forest FACE sites. Global Change Biology, 19(6), 1759-1779, doi: 10.1111/gcb.12164.
De Kauwe, M. G., B. E. Medlyn, S. Zaehle, A. P. Walker, M. C. Dietze, Y. P. Wang, Y. Luo, A. K. Jain, B. El-Masri, T. Hickler, D. Warlind, E. Weng, W. J. Parton, P. E. Thornton, S. Wang, I. C. Prentice, S. Asao, B. Smith, H. R. McCarthy, C. M. Iversen, P. J. Hanson, J. M. Warren, R. Oren, and R. J. Norby, 2014: Where does the carbon go? A model-data intercomparison of vegetation carbon allocation and turnover processes at two temperate forest Free-Air CO2 Enrichment sites. New Phytologist, 203(3), 883-899, doi: 10.1111/nph.12847.
Dittmar, T., and G. Kattner, 2003: The biogeochemistry of the river and shelf ecosystem of the Arctic Ocean: A review. Marine Chemis-try, 83(3-4), 103-120, doi: 10.1016/s0304-4203(03)00105-1.
Dlugokencky, E. J., L. Bruhwiler, J. W. C. White, L. K. Emmons, P. C. Novelli, S. A. Montzka, K. A. Masarie, P. M. Lang, A. M. Crotwell, J. B. Miller, and L. V. Gatti, 2009: Observational constraints on recent increases in the atmospheric CH4 burden. Geophysical Research Letters, 36(18), doi: 10.1029/2009gl039780.
Doney, S. C., V. J. Fabry, R. A. Feely, and J. A. Kleypas, 2009: Ocean acidification: The other CO2 problem. Annual Review of Marine Science, 1, 169-192, doi: 10.1146/annurev.marine.010908.163834.
Dornblaser, M. M., and R. G. Striegl, 2009: Suspended sediment and carbonate transport in the Yukon River Basin, Alaska: Fluxes and potential future responses to climate change. Water Resources Research, 45(6), doi: 10.1029/2008wr007546.
Doughty, C. E., D. B. Metcalfe, C. A. Girardin, F. F. Amezquita, D. G. Cabrera, W. H. Huasco, J. E. Silva-Espejo, A. Araujo-Murakami, M. C. da Costa, W. Rocha, T. R. Feldpausch, A. L. Mendoza, A. C. da Costa, P. Meir, O. L. Phillips, and Y. Malhi, 2015: Drought impact on forest carbon dynamics and fluxes in Amazonia. Nature, 519(7541), 78-82, doi: 10.1038/nature14213.
Drake, J. E., A. Gallet-Budynek, K. S. Hofmockel, E. S. Bernhardt, S. A. Billings, R. B. Jackson, K. S. Johnsen, J. Lichter, H. R. McCarthy, M. L. McCormack, D. J. Moore, R. Oren, S. Palmroth, R. P. Phillips, J. S. Pippen, S. G. Pritchard, K. K. Treseder, W. H. Schlesinger, E. H. Delucia, and A. C. Finzi, 2011: Increases in the flux of carbon belowground stimulate nitrogen uptake and sustain the long-term enhancement of forest productivity under elevated CO2. Ecology Letters, 14(4), 349-357, doi: 10.1111/j.1461-0248.2011.01593.x.
Dunne, J. P., J. G. John, E. Shevliakova, R. J. Stouffer, J. P. Krasting, S. L. Malyshev, P. C. D. Milly, L. T. Sentman, A. J. Adcroft, W. Cooke, K. A. Dunne, S. M. Griffies, R. W. Hallberg, M. J. Harrison, H. Levy, A. T. Wittenberg, P. J. Phillips, and N. Zadeh, 2013: GFDL’s ESM2 global coupled climate–carbon Earth system mod-els. Part II: Carbon system formulation and baseline simulation characteristics. Journal of Climate, 26(7), 2247-2267, doi: 10.1175/jcli-d-12-00150.1.
Duplisea, D. E., S. Jennings, S. J. Malcolm, R. Parker, and D. B. Sivyer, 2001: Modelling potential impacts of bottom trawl fisheries on soft sediment biogeochemistry in the North Sea. Geochemical Transactions, 2(1), 112, doi: 10.1186/1467-4866-2-112.

Section IV | Consequences and Ways Forward
800 U.S. Global Change Research Program November 2018
Dutkiewicz, S., J. R. Scott, and M. J. Follows, 2013: Winners and losers: Ecological and biogeochemical changes in a warming ocean. Global Biogeochemical Cycles, 27(2), 463-477, doi: 10.1002/gbc.20042.
ECCC, 2016a: National Inventory Report 1990-2014: Greenhouse Gas Sources and Sinks in Canada. Environment and Climate Change Canada. [http://ec.gc.ca/ges-ghg/default.asp?lang=En&n=83A34A7A-1]
ECCC, 2016b: Canada’s Mid-Century Long-Term Low-Greenhouse Gas Development Strategy. Environment and Climate Change Can-ada. [http://unfccc.int/files/focus/long-term_strategies/applica-tion/pdf/canadas_mid-century_long-term_strategy.pdf]
Edburg, S. L., J. A. Hicke, P. D. Brooks, E. G. Pendall, B. E. Ewers, U. Norton, D. Gochis, E. D. Gutmann, and A. J. H. Meddens, 2012: Cascading impacts of bark beetle-caused tree mortality on coupled biogeophysical and biogeochemical processes. Frontiers in Ecology and the Environment, 10(8), 416-424, doi: 10.1890/110173.
Egleston, E. S., C. L. Sabine, and F. M. M. Morel, 2010: Revelle revisited: Buffer factors that quantify the response of ocean chem-istry to changes in DIC and alkalinity. Global Biogeochemical Cycles, 24(1), doi: 10.1029/2008gb003407.
EIA, 2016: Annual Energy Outlook 2016 with Projections to 2040. U.S. Energy Information Administration. [https://www.eia.gov/outlooks/aeo/pdf/0383(2016).pdf]
EIA, 2017: Annual Energy Outlook 2017 with Projections to 2050. U.S. Energy Information Administration. [http://www.eia.gov/outlooks/aeo/pdf/0383(2017).pdf]
Emmerton, C. A., L. F. W. Lesack, and W. F. Vincent, 2008: Mackenzie River nutrient delivery to the Arctic Ocean and effects of the Mackenzie Delta during open water conditions. Global Bio-geochemical Cycles, 22(1), doi: 10.1029/2006gb002856.
Fang, X., and H. G. Stefan, 1999: Projections of climate change effects on water temperature characteristics of small lakes in the contiguous U.S. Climatic Change, 42(2), 377-412, doi: 10.1023/a:1005431523281.
Finlay, K., R. J. Vogt, M. J. Bogard, B. Wissel, B. M. Tutolo, G. L. Simpson, and P. R. Leavitt, 2015: Decrease in CO2 efflux from northern hardwater lakes with increasing atmospheric warming. Nature, 519(7542), 215-218, doi: 10.1038/nature14172.
Fisher, J. B., D. N. Huntzinger, C. R. Schwalm, and S. Sitch, 2014a: Modeling the terrestrial biosphere. Annual Review of Environment and Resources, 39(1), 91-123, doi: 10.1146/annurev-environ-012913-093456.
Fisher, J. B., M. Sikka, W. C. Oechel, D. N. Huntzinger, J. R. Melton, C. D. Koven, A. Ahlstrom, M. A. Arain, I. Baker, J. M. Chen, P. Ciais, C. Davidson, M. Dietze, B. El-Masri, D. Hayes, C. Huntingford, A. K. Jain, P. E. Levy, M. R. Lomas, B. Poulter, D. Price, A. K. Sahoo, K. Schaefer, H. Tian, E. Tomelleri, H. Verbeeck, N. Viovy, R. Wania, N. Zeng, and C. E. Miller, 2014b: Carbon cycle uncertainty in the Alaskan Arctic. Biogeosciences, 11(15), 4271-4288, doi: 10.5194/bg-11-4271-2014.
Forkel, M., N. Carvalhais, S. Schaphoff, W. v. Bloh, M. Migliavacca, M. Thurner, and K. Thonicke, 2014: Identifying environmental controls on vegetation greenness phenology through model–data integration. Biogeosciences, 11(23), 7025-7050, doi: 10.5194/bg-11-7025-2014.
Fourqurean, J. W., C. M. Duarte, H. Kennedy, N. Marbà, M. Holmer, M. A. Mateo, E. T. Apostolaki, G. A. Kendrick, D. Krause-Jensen, K. J. McGlathery, and O. Serrano, 2012: Seagrass ecosystems as a globally significant carbon stock. Nature Geoscience, 5(7), 505-509, doi: 10.1038/ngeo1477.
Fried, J. S., M. S. Torn, and E. Mills, 2004: The impact of climate change on wildfire severity: A regional forecast for Northern California. Climatic Change, 64(1/2), 169-191, doi: 10.1023/B:CLIM.0000024667.89579.ed.
Friedlingstein, P., 2015: Carbon cycle feedbacks and future climate change. Philosophical Transactions of the Royal Society A: Mathemat-ical, Physical and Engineering Sciences, 373(2054), doi: 10.1098/rsta.2014.0421.
Friedlingstein, P., M. Meinshausen, V. K. Arora, C. D. Jones, A. Anav, S. K. Liddicoat, and R. Knutti, 2014: Uncertainties in CMIP5 climate projections due to carbon cycle feedbacks. Journal of Climate, 27(2), 511-526, doi: 10.1175/jcli-d-12-00579.1.
Frölicher, T. L., J. L. Sarmiento, D. J. Paynter, J. P. Dunne, J. P. Krasting, and M. Winton, 2015: Dominance of the Southern Ocean in anthropogenic carbon and heat uptake in CMIP5 models. Journal of Climate, 28(2), 862-886, doi: 10.1175/JCLI-D-14-00117.1.
Galy, V., B. Peucker-Ehrenbrink, and T. Eglinton, 2015: Global carbon export from the terrestrial biosphere controlled by erosion. Nature, 521(7551), 204-207, doi: 10.1038/nature14400.
Gattuso, J.-P., A. Magnan, R. Billé, W. W. L. Cheung, E. L. Howes, F. Joos, D. Allemand, L. Bopp, S. R. Cooley, C. M. Eakin, O. Hoegh-Guldberg, R. P. Kelly, H.-O. Pörtner, A. D. Rogers, J. M. Baxter, D. Laffoley, D. Osborn, A. Rankovic, J. Rochette, U. R. Sumaila, S. Treyer, and C. Turley, 2015: Contrasting futures for ocean and society from different anthropogenic CO2 emissions scenarios. Science, 349(6243), doi: 10.1126/science.aac4722.
Georgakakos, A., P. Fleming, M. Dettinger, C. Peters-Lidard, T. T. C. Richmond, K. Reckhow, K. White, and D. Yates, 2014: Water resources. In: Climate Change Impacts in the United States: The Third National Climate Assessment. [ J. M. Melillo, T. T. C. Richmond, and G. W. Yohe (eds.)]. U.S. Global Change Research Program, 69-112 pp.
Georgiou, K., C. D. Koven, W. J. Riley, and M. S. Torn, 2015: Toward improved model structures for analyzing priming: Poten-tial pitfalls of using bulk turnover time. Global Change Biology, 21(12), 4298-4302, doi: 10.1111/gcb.13039.
Ghimire, B., C. A. Williams, G. J. Collatz, M. Vanderhoof, J. Rogan, D. Kulakowski, and J. G. Masek, 2015: Large carbon release legacy from bark beetle outbreaks across Western United States. Global Change Biology, 21(8), 3087-3101, doi: 10.1111/gcb.12933.
Chapter 19 | Future of the North American Carbon Cycle
801Second State of the Carbon Cycle Report (SOCCR2)November 2018
Gilbert, D., B. Sundby, C. Gobeil, A. Mucci, and G.-H. Tremblay, 2005: A seventy-two-year record of diminishing deep-water oxygen in the St. Lawrence Estuary: The northwest Atlantic connection. Limnology and Oceanography, 50(5), 1654-1666, doi: 10.4319/lo.2005.50.5.1654.
Gitz, V., and P. Ciais, 2004: Future expansion of agriculture and pasture acts to amplify atmospheric CO2 levels in response to fossil-fuel and land-use change emissions. Climatic Change, 67(2-3), 161-184, doi: 10.1007/s10584-004-0065-5.
Gleckler, P. J., P. J. Durack, R. J. Stouffer, G. C. Johnson, and C. E. Forest, 2016: Industrial-era global ocean heat uptake doubles in recent decades. Nature Climate Change, 6, 394, doi: 10.1038/nclimate2915.
Gooseff, M. N., K. Strzepek, and S. C. Chapra, 2005: Modeling the potential effects of climate change on water temperature down-stream of a shallow reservoir, Lower Madison River, MT. Climatic Change, 68(3), 331-353, doi: 10.1007/s10584-005-9076-0.
Graven, H. D., 2016: The carbon cycle in a changing climate. Physics Today, 69(11), 48-54, doi: 10.1063/pt.3.3365.
Gregory, J. M., C. D. Jones, P. Cadule, and P. Friedlingstein, 2009: Quantifying carbon cycle feedbacks. Journal of Climate, 22(19), 5232-5250, doi: 10.1175/2009jcli2949.1.
Grosse, G., S. Goetz, A. D. McGuire, V. E. Romanovsky, and E. A. G. Schuur, 2016: Changing permafrost in a warming world and feedbacks to the Earth system. Environmental Research Letters, 11(4), 040201, doi: 10.1088/1748-9326/11/4/040201.
Hararuk, O., J. Xia, and Y. Luo, 2014: Evaluation and improve-ment of a global land model against soil carbon data using a Bayesian Markov chain Monte Carlo method. Journal of Geophysical Research: Biogeosciences, 119(3), 403-417, doi: 10.1002/2013jg002535.
Harden, J. W., C. D. Koven, C.-L. Ping, G. Hugelius, A. David McGuire, P. Camill, T. Jorgenson, P. Kuhry, G. J. Michaelson, J. A. O’Donnell, E. A. G. Schuur, C. Tarnocai, K. Johnson, and G. Grosse, 2012: Field information links permafrost carbon to physi-cal vulnerabilities of thawing. Geophysical Research Letters, 39(15), doi: 10.1029/2012gl051958.
Hasler, C. T., D. Butman, J. D. Jeffrey, and C. D. Suski, 2016: Fresh-water biota and rising pCO2? Ecology Letters, 19(1), 98-108, doi: 10.1111/ele.12549.
Hicke, J. A., C. D. Allen, A. R. Desai, M. C. Dietze, R. J. Hall, E. H. Ted Hogg, D. M. Kashian, D. Moore, K. F. Raffa, R. N. Sturrock, and J. Vogelmann, 2012: Effects of biotic disturbances on forest carbon cycling in the United States and Canada. Global Change Biology, 18(1), 7-34, doi: 10.1111/j.1365-2486.2011.02543.x.
Hinzman, L. D., C. J. Deal, A. D. McGuire, S. H. Mernild, I. V. Polyakov, and J. E. Walsh, 2013: Trajectory of the Arctic as an integrated system. Ecological Applications, 23(8), 1837-1868, doi: 10.1890/11-1498.1.
Hoegh-Guldberg, O., P. J. Mumby, A. J. Hooten, R. S. Steneck, P. Greenfield, E. Gomez, C. D. Harvell, P. F. Sale, A. J. Edwards, K. Caldeira, N. Knowlton, C. M. Eakin, R. Iglesias-Prieto, N. Muthiga, R. H. Bradbury, A. Dubi, and M. E. Hatziolos, 2007: Coral reefs under rapid climate change and ocean acidification. Science, 318(5857), 1737-1742, doi: 10.1126/science.1152509.
Hoffman, F. M., C. D. Koven, G. Keppel-Aleks, D. M. Lawrence, W. J. Riley, J. T. Randerson, A. Ahlström, G. Abramowitz, D. D. Baldocchi, M. J. Best, B. Bond-Lamberty, M. G. De Kauwe, A. S. Denning, A. R. Desai, V. Eyring, J. B. Fisher, R. A. Fisher, P. J. Gleckler, M. Huang, G. Hugelius, A. K. Jain, N. Y. Kiang, H. Kim, R. D. Koster, S. V. Kumar, H. Li, Y. Luo, J. Mao, N. G. McDowell, U. Mishra, P. R. Moorcroft, G. S. H. Pau, D. M. Ricciuto, K. Schaefer, C. R. Schwalm, S. P. Serbin, E. Shevliakova, A. G. Slater, J. Tang, M. Williams, J. Xia, C. Xu, R. Joseph, and D. Koch, 2017: International Land Model Benchmarking (ILAMB) 2016 Workshop Report. Tech-nical Report DOE/SC-0186. U.S. Department of Energy, Office of Science, Germantown, Maryland, USA. doi:10.2172/1330803.
Hoffman, F. M., J. T. Randerson, V. K. Arora, Q. Bao, P. Cadule, D. Ji, C. D. Jones, M. Kawamiya, S. Khatiwala, K. Lindsay, A. Obata, E. Shevliakova, K. D. Six, J. F. Tjiputra, E. M. Volodin, and T. Wu, 2014: Causes and implications of persistent atmo-spheric carbon dioxide biases in Earth system models. Journal of Geophysical Research: Biogeosciences, 119(2), 141-162, doi: 10.1002/2013jg002381.
Hugelius, G., J. Strauss, S. Zubrzycki, J. W. Harden, E. A. G. Schuur, C. L. Ping, L. Schirrmeister, G. Grosse, G. J. Michaelson, C. D. Koven, J. A. O’Donnell, B. Elberling, U. Mishra, P. Camill, Z. Yu, J. Palmtag, and P. Kuhry, 2014: Estimated stocks of circumpolar permafrost carbon with quantified uncertainty ranges and identi-fied data gaps. Biogeosciences, 11(23), 6573-6593, doi: 10.5194/bg-11-6573-2014.
Hungate, B. A., P. Dijkstra, Z. Wu, B. D. Duval, F. P. Day, D. W. Johnson, J. P. Megonigal, A. L. Brown, and J. L. Garland, 2013: Cumulative response of ecosystem carbon and nitrogen stocks to chronic CO2 exposure in a subtropical oak woodland. New Phytolo-gist, 200(3), 753-766, doi: 10.1111/nph.12333.
Huntzinger, D. N., A. M. Michalak, C. Schwalm, P. Ciais, A. W. King, Y. Fang, K. Schaefer, Y. Wei, R. B. Cook, J. B. Fisher, D. Hayes, M. Huang, A. Ito, A. K. Jain, H. Lei, C. Lu, F. Maignan, J. Mao, N. Parazoo, S. Peng, B. Poulter, D. Ricciuto, X. Shi, H. Tian, W. Wang, N. Zeng, and F. Zhao, 2017: Uncertainty in the response of terrestrial carbon sink to environmental drivers undermines carbon-climate feedback predictions. Scientific Reports, 7(1), 4765, doi: 10.1038/s41598-017-03818-2.
Huntzinger, D. N., C. Schwalm, A. M. Michalak, K. Schaefer, A. W. King, Y. Wei, A. Jacobson, S. Liu, R. B. Cook, W. M. Post, G. Berthier, D. Hayes, M. Huang, A. Ito, H. Lei, C. Lu, J. Mao, C. H. Peng, S. Peng, B. Poulter, D. Riccuito, X. Shi, H. Tian, W. Wang, N. Zeng, F. Zhao, and Q. Zhu, 2013: The North American carbon program multi-scale synthesis and terrestrial model intercomparison project – Part 1: Overview and experimental design. Geoscientific Model Development, 6(6), 2121-2133, doi: 10.5194/gmd-6-2121-2013.

Section IV | Consequences and Ways Forward
802 U.S. Global Change Research Program November 2018
Hutchins, D. A., F. X. Fu, Y. Zhang, M. E. Warner, Y. Feng, K. Portune, P. W. Bernhardt, and M. R. Mulholland, 2007: CO2 control of trichodesmium n2 fixation, photosynthesis, growth rates, and elemental ratios: Implications for past, present, and future ocean biogeochemistry. Limnology and Oceanography, 52(4), 1293-1304, doi: 10.4319/lo.2007.52.4.1293.
IEA, 2016: World Energy Outlook-2016 Special Report: Mexico Energy Outlook. International Energy Agency. [https://www.iea.org/publications/freepublications/publication/mexico-ener-gy-outlook.html]
IPCC, 2000: IPCC’s Special Report: Land Use, Land Use Change and Forestry. [R. T. Watson, I. R. Noble, B. Bolin, N. H. Ravindranath, D. J. Verardo, and D. J. Dokken (eds.)]. Cambridge University Press, UK, 375 pp.
Iversen, C. M., J. K. Keller, C. T. Garten, and R. J. Norby, 2012: Soil carbon and nitrogen cycling and storage throughout the soil profile in a sweetgum plantation after 11 years of CO2 enrichment. Global Change Biology, 18(5), 1684-1697, doi: 10.1111/j.1365-2486.2012.02643.x.
Jansson, M., T. Hickler, A. Jonsson, and J. Karlsson, 2008: Links between terrestrial primary production and bacterial production and respiration in lakes in a climate gradient in Subarctic Sweden. Ecosystems, 11(3), 367-376, doi: 10.1007/s10021-008-9127-2.
Jefferies, R. L., A. P. Jano, and K. F. Abraham, 2006: A biotic agent promotes large-scale catastrophic change in the coastal marshes of Hudson Bay. Journal of Ecology, 94(1), 234-242, doi: 10.1111/j.1365-2745.2005.01086.x.
Jiménez Cisneros, B. E., T. Oki, N. W. Arnell, G. Benito, J. G. Cogley, P. Döll, T. Jiang, and S. S. Mwakalila, 2014: Freshwater resources. In: Climate Change 2014: Impacts, Adaptation, and Vulnerability. Part A: Global and Sectoral Aspects. Contribution of Working Group II to the Fifth Assessment Report of the Intergovern-mental Panel on Climate Change. [C. B. Field, V. R. Barros, D. J. Dokken, K. J. Mach, M. D. Mastrandrea, T. E. Bilir, M. Chatterjee, K. L. Ebi, Y. O. Estrada, R. C. Genova, B. Girma, E. S. Kissel, A. N. Levy, S. MacCracken, P. R. Mastrandrea, and L. L. White (eds.)]. Cambridge University Press.
Jolly, W. M., M. A. Cochrane, P. H. Freeborn, Z. A. Holden, T. J. Brown, G. J. Williamson, and D. M. Bowman, 2015: Climate-induced variations in global wildfire danger from 1979 to 2013. Nature Communications, 6, 7537, doi: 10.1038/ncomms8537.
Jones, C., E. Robertson, V. Arora, P. Friedlingstein, E. Shevliakova, L. Bopp, V. Brovkin, T. Hajima, E. Kato, M. Kawamiya, S. Liddicoat, K. Lindsay, C. H. Reick, C. Roelandt, J. Segschneider, and J. Tjiputra, 2013: Twenty-first-century compatible CO2 emissions and airborne fraction simulated by CMIP5 Earth system models under four representative concentration pathways. Journal of Climate, 26(13), 4398-4413, doi: 10.1175/jcli-d-12-00554.1.
Jones, D. D, S. Amosson, and G. Mayfield, 2011: State Drought Losses have Significant Impacts on Overall Economy. Publication PEF 2011-2. [https://agecoext.tamu.edu/wp-content/uploads/2013/07/RecentDrought.pdf]
Joos, F., T. F. Frölicher, M. Steinacher, and G. K. Plattner, 2011: Impact of climate change mitigation on projections. In: Ocean Acid-ification. [ J. P. Gattuso and L. Hansson (eds.)]. Oxford University Press.
Jorgenson, M. T., V. Romanovsky, J. Harden, Y. Shur, J. O’Donnell, E. A. G. Schuur, M. Kanevskiy, and S. Marchenko, 2010: Resilience and vulnerability of permafrost to climate change. This article is one of a selection of papers from the dynamics of change in Alaska’s boreal forests: Resilience and vulnerability in response to climate warming. Canadian Journal of Forest Research, 40(7), 1219-1236, doi: 10.1139/x10-060.
Jung, M., M. Reichstein, C. R. Schwalm, C. Huntingford, S. Sitch, A. Ahlstrom, A. Arneth, G. Camps-Valls, P. Ciais, P. Friedlingstein, F. Gans, K. Ichii, A. K. Jain, E. Kato, D. Papale, B. Poulter, B. Raduly, C. Rodenbeck, G. Tramontana, N. Viovy, Y. P. Wang, U. Weber, S. Zaehle, and N. Zeng, 2017: Compensatory water effects link yearly global land CO2 sink changes to temperature. Nature, 541(7638), 516-520, doi: 10.1038/nature20780.
Kai, F. M., S. C. Tyler, J. T. Randerson, and D. R. Blake, 2011: Reduced methane growth rate explained by decreased Northern Hemisphere microbial sources. Nature, 476(7359), 194-197, doi: 10.1038/nature10259.
Kasischke, E. S., D. L. Verbyla, T. S. Rupp, A. D. McGuire, K. A. Murphy, R. Jandt, J. L. Barnes, E. E. Hoy, P. A. Duffy, M. Calef, and M. R. Turetsky, 2010: Alaska’s changing fire regime — implications for the vulnerability of its boreal forests. Canadian Journal of Forest Research, 40(7), 1313-1324, doi: 10.1139/x10-098.
Keenan, T., R. García, A. D. Friend, S. Zaehle, C. Gracia, and S. Sabate, 2009: Improved understanding of drought controls on seasonal variation in Mediterranean forest canopy CO2 and water fluxes through combined in situ measurements and ecosystem modelling. Biogeosciences, 6(8), 1423-1444, doi: 10.5194/bg-6-1423-2009.
Kirwan, M. L., and J. P. Megonigal, 2013: Tidal wetland stability in the face of human impacts and sea-level rise. Nature, 504(7478), 53-60, doi: 10.1038/nature12856.
Klein, T., M. K. F. Bader, S. Leuzinger, M. Mildner, P. Schleppi, R. T. W. Siegwolf, C. Körner, and E. Lines, 2016: Growth and carbon relations of mature Picea abies trees under 5 years of free-air CO2 enrichment. Journal of Ecology, 104(6), 1720-1733, doi: 10.1111/1365-2745.12621.
Kogan, F., T. Adamenko, and W. Guo, 2013: Global and regional drought dynamics in the climate warming era. Remote Sensing Letters, 4(4), 364-372, doi: 10.1080/2150704x.2012.736033.

Chapter 19 | Future of the North American Carbon Cycle
803Second State of the Carbon Cycle Report (SOCCR2)November 2018
Koven, C. D., E. A. Schuur, C. Schadel, T. J. Bohn, E. J. Burke, G. Chen, X. Chen, P. Ciais, G. Grosse, J. W. Harden, D. J. Hayes, G. Hugelius, E. E. Jafarov, G. Krinner, P. Kuhry, D. M. Lawrence, A. H. MacDougall, S. S. Marchenko, A. D. McGuire, S. M. Natali, D. J. Nicolsky, D. Olefeldt, S. Peng, V. E. Romanovsky, K. M. Schaefer, J. Strauss, C. C. Treat, and M. Turetsky, 2015: A simplified, data-constrained approach to estimate the perma-frost carbon-climate feedback. Philosophical Transactions of the Royal Society A: Mathematical, Physical and Engineering Sciences, 373(2054), doi: 10.1098/rsta.2014.0423.
Kurz, W. A., C. C. Dymond, G. Stinson, G. J. Rampley, E. T. Neilson, A. L. Carroll, T. Ebata, and L. Safranyik, 2008: Mountain pine beetle and forest carbon feedback to climate change. Nature, 452(7190), 987-990, doi: 10.1038/nature06777.
Landschützer, P., N. Gruber, and D. C. E. Bakker, 2016: Decadal variations and trends of the global ocean carbon sink. Global Biogeochemical Cycles, 30(10), 1396-1417, doi: 10.1002/2015gb005359.
Le Quéré, C., R. M. Andrew, J. G. Canadell, S. Sitch, J. I. Korsbakken, G. P. Peters, A. C. Manning, T. A. Boden, P. P. Tans, R. A. Houghton, R. F. Keeling, S. Alin, O. D. Andrews, P. Anthoni, L. Barbero, L. Bopp, F. Chevallier, L. P. Chini, P. Ciais, K. Currie, C. Delire, S. C. Doney, P. Friedlingstein, T. Gkritzalis, I. Harris, J. Hauck, V. Haverd, M. Hoppema, K. Klein Goldewijk, A. K. Jain, E. Kato, A. Körtzinger, P. Landschützer, N. Lefèvre, A. Lenton, S. Lienert, D. Lombardozzi, J. R. Melton, N. Metzl, F. Millero, P. M. S. Monteiro, D. R. Munro, J. E. M. S. Nabel, S.-i. Nakaoka, K. Brien, A. Olsen, A. M. Omar, T. Ono, D. Pierrot, B. Poulter, C. Rödenbeck, J. Salisbury, U. Schuster, J. Schwinger, R. Séférian, I. Skjelvan, B. D. Stocker, A. J. Sutton, T. Takahashi, H. Tian, B. Tilbrook, I. T. van der Laan-Luijkx, G. R. van der Werf, N. Viovy, A. P. Walker, A. J. Wiltshire, and S. Zaehle, 2016: Global carbon budget 2016. Earth System Science Data, 8(2), 605-649, doi: 10.5194/essd-8-605-2016.
Lehman, J. T., 2002: Mixing patterns and plankton biomass of the St. Lawrence Great Lakes under climate change scenarios. Journal of Great Lakes Research, 28(4), 583-596, doi: 10.1016/s0380-1330(02)70607-2.
Lenton, T. M., H. Held, E. Kriegler, J. W. Hall, W. Lucht, S. Rahm-storf, and H. J. Schellnhuber, 2008: Tipping elements in the Earth’s climate system. Proceedings of the National Academy of Sciences USA, 105(6), 1786-1793, doi: 10.1073/pnas.0705414105.
Levy-Varon, J. H., W. S. Schuster, and K. L. Griffin, 2014: Rapid rebound of soil respiration following partial stand disturbance by tree girdling in a temperate deciduous forest. Oecologia, 174(4), 1415-1424, doi: 10.1007/s00442-013-2844-z.
Liu, K.-K., L. Atkinson, R. Quinones, and L. Talaue-McManus, 2010: Carbon and Nutrient Fluxes in Continental Margins: A Global Synthesis. Springer Science and Business Media, 744 pp.
Lovenduski, N. S., G. A. McKinley, A. R. Fay, K. Lindsay, and M. C. Long, 2016: Partitioning uncertainty in ocean carbon uptake projections: Internal variability, emission scenario, and model structure. Global Biogeochemical Cycles, 30(9), 1276-1287, doi: 10.1002/2016gb005426.
Luo, Y. Q., J. T. Randerson, G. Abramowitz, C. Bacour, E. Blyth, N. Carvalhais, P. Ciais, D. Dalmonech, J. B. Fisher, R. Fisher, P. Friedlingstein, K. Hibbard, F. Hoffman, D. Huntzinger, C. D. Jones, C. Koven, D. Lawrence, D. J. Li, M. Mahecha, S. L. Niu, R. Norby, S. L. Piao, X. Qi, P. Peylin, I. C. Prentice, W. Riley, M. Reichstein, C. Schwalm, Y. P. Wang, J. Y. Xia, S. Zaehle, and X. H. Zhou, 2012: A framework for benchmarking land models. Biogeosciences, 9(10), 3857-3874, doi: 10.5194/bg-9-3857-2012.
Luo, Y., 2007: Terrestrial carbon–cycle feedback to climate warm-ing. Annual Review of Ecology, Evolution, and Systematics, 38(1), 683-712, doi: 10.1146/annurev.ecolsys.38.091206.095808.
Luo, Y., E. Weng, X. Wu, C. Gao, X. Zhou, and L. Zhang, 2009: Parameter identifiability, constraint, and equifinality in data assimilation with ecosystem models. Ecological Applications, 19(3), 571-574, doi: 10.1890/08-0561.1.
Luo, Y., T. F. Keenan, and M. Smith, 2015: Predictability of the terrestrial carbon cycle. Global Change Biology, 21(5), 1737-1751, doi: 10.1111/gcb.12766.
Luyssaert, S., M. Jammet, P. C. Stoy, S. Estel, J. Pongratz, E. Ceschia, G. Churkina, A. Don, K. Erb, M. Ferlicoq, B. Gielen, T. Grünwald, R. A. Houghton, K. Klumpp, A. Knohl, T. Kolb, T. Kuemmerle, T. Laurila, A. Lohila, D. Loustau, M. J. McGrath, P. Meyfroidt, E. J. Moors, K. Naudts, K. Novick, J. Otto, K. Pilegaard, C. A. Pio, S. Rambal, C. Rebmann, J. Ryder, A. E. Suyker, A. Varlagin, M. Wattenbach, and A. J. Dolman, 2014: Land manage-ment and land-cover change have impacts of similar magnitude on surface temperature. Nature Climate Change, 4(5), 389-393, doi: 10.1038/nclimate2196.
Maberly, S. C., P. A. Barker, A. W. Stott, and M. M. De Ville, 2012: Catchment productivity controls CO2 emissions from lakes. Nature Climate Change, 3(4), 391-394, doi: 10.1038/nclimate1748.
MacBean, N., P. Peylin, F. Chevallier, M. Scholze, and G. Schürmann, 2016: Consistent assimilation of multiple data streams in a carbon cycle data assimilation system. Geoscientific Model Development, 9(10), 3569-3588, doi: 10.5194/gmd-9-3569-2016.
MacDonald, L. A., N. Farquharson, R. I. Hall, B. B. Wolfe, M. L. Macrae, and J. N. Sweetman, 2014: Avian-driven modification of seasonal carbon cycling at a tundra pond in the Hudson Bay Low-lands (northern Manitoba, Canada). Arctic, Antarctic, and Alpine Research, 46(1), 206-217, doi: 10.1657/1938-4246-46.1.206.
Magnani, F., M. Mencuccini, M. Borghetti, P. Berbigier, F. Ber-ninger, S. Delzon, A. Grelle, P. Hari, P. G. Jarvis, P. Kolari, A. S. Kowalski, H. Lankreijer, B. E. Law, A. Lindroth, D. Loustau, G. Manca, J. B. Moncrieff, M. Rayment, V. Tedeschi, R. Valentini, and J. Grace, 2007: The human footprint in the carbon cycle of temper-ate and boreal forests. Nature, 447(7146), 848-850, doi: 10.1038/nature05847.

Section IV | Consequences and Ways Forward
804 U.S. Global Change Research Program November 2018
Marsay, C. M., R. J. Sanders, S. A. Henson, K. Pabortsava, E. P. Achterberg, and R. S. Lampitt, 2015: Attenuation of sinking particulate organic carbon flux through the mesopelagic ocean. Proceedings of the National Academy of Sciences USA, 112(4), 1089-1094, doi: 10.1073/pnas.1415311112.
Martin, G. M., N. Bellouin, W. J. Collins, I. D. Culverwell, P. R. Halloran, S. C. Hardiman, T. J. Hinton, C. D. Jones, R. E. McDon-ald, A. J. McLaren, F. M. O’Connor, M. J. Roberts, J. M. Rodriguez, S. Woodward, M. J. Best, M. E. Brooks, A. R. Brown, N. Butchart, C. Dearden, S. H. Derbyshire, I. Dharssi, M. Doutriaux-Boucher, J. M. Edwards, P. D. Falloon, N. Gedney, L. J. Gray, H. T. Hewitt, M. Hobson, M. R. Huddleston, J. Hughes, S. Ineson, W. J. Ingram, P. M. James, T. C. Johns, C. E. Johnson, A. Jones, C. P. Jones, M. M. Joshi, A. B. Keen, S. Liddicoat, A. P. Lock, A. V. Maidens, J. C. Manners, S. F. Milton, J. G. L. Rae, J. K. Ridley, A. Sellar, C. A. Senior, I. J. Totterdell, A. Verhoef, P. L. Vidale, and A. Wiltshire, 2011: The HadGEM2 family of Met Office Unified Model climate configurations. Geoscientific Model Development, 4(3), 723-757, doi: 10.5194/gmd-4-723-2011.
Matear, R. J., and A. C. Hirst, 1999: Climate change feedback on the future oceanic CO2 uptake. Tellus B: Chemical and Physical Meteorology, 51(3), 722-733, doi: 10.3402/tellusb.v51i3.16472.
Maurer, G. E., A. M. Chan, N. A. Trahan, D. J. Moore, and D. R. Bowling, 2016: Carbon isotopic composition of forest soil respiration in the decade following bark beetle and stem girdling disturbances in the Rocky Mountains. Plant, Cell and Environment, 39(7), 1513-1523, doi: 10.1111/pce.12716.
McCarthy, H. R., R. Oren, K. H. Johnsen, A. Gallet-Budynek, S. G. Pritchard, C. W. Cook, S. L. Ladeau, R. B. Jackson, and A. C. Finzi, 2010: Re-assessment of plant carbon dynamics at the Duke Free-Air CO2 Enrichment site: Interactions of atmospheric CO2 with nitrogen and water availability over stand development. New Phy-tologist, 185(2), 514-528, doi: 10.1111/j.1469-8137.2009.03078.x.
McGuire, A. D., D. M. Lawrence, C. Koven, J. S. Clein, E. Burke, G. Chen, E. Jafarov, A. H. MacDougall, S. Marchenko, D. Nicolsky, S. Peng, A. Rinke, P. Ciais, I. Gouttevin, D. J. Hayes, D. Ji, G. Krin-ner, J. C. Moore, V. Romanovsky, C. Schädel, K. Schaefer, E. A. G. Schuur, and Q. Zhuang, 2018: Dependence of the evolution of car-bon dynamics in the northern permafrost region on the trajectory of climate change. Proceedings of the National Academy of Sciences USA, doi: 10.1073/pnas.1719903115.
McKinley, G., N. Urban, V. Bennington, D. Pilcher, and C. McDonald, 2011: Preliminary carbon budgets for the Laurentian Great Lakes. OCB News. [http://www.usocb.org/publications/OCB_NEWS_SPR_SUM11.pdf]
Medlyn, B. E., S. Zaehle, M. G. De Kauwe, A. P. Walker, M. C. Dietze, P. J. Hanson, T. Hickler, A. K. Jain, Y. Luo, W. Parton, I. C. Prentice, P. E. Thornton, S. Wang, Y.-P. Wang, E. Weng, C. M. Iversen, H. R. McCarthy, J. M. Warren, R. Oren, and R. J. Norby, 2015: Using ecosystem experiments to improve vegetation models. Nature Climate Change, 5(6), 528-534, doi: 10.1038/ nclimate2621.
Meinshausen, M., S. J. Smith, K. V. Calvin, J. S. Daniel, M. L. T. Kainuma, J.-F. Lamarque, K. Matsumoto, S. A. Montzka, S. C. B. Raper, K. Riahi, A. M. Thomson, G. J. M. Velders and D. van Vuuren, 2011: The RCP Greenhouse Gas Concentrations and their Extension from 1765 to 2300. Climatic Change (Special Issue), doi: 10.1007/s10584-011-0156-z.
Melillo, J. M., J. Borchers, J. Chaney, H. Fisher, S. Fox, A. Haxeltine, A. Janetos, D. W. Kicklighter, T. G. F. Kittel, A. D. McGuire, R. McKeown, R. Neilson, R. Nemani, D. S. Ojima, and T. Painter, 1995: Vegetation/ecosystem modeling and analysis project: Comparing biogeography and biogeochemistry models in a continental-scale study of terrestrial ecosystem responses to climate change and CO2 doubling. Global Biogeochemical Cycles, 9(4), 407-437, doi: 10.1029/95gb02746.
Melillo, J. M., T. Richmond, and G. W. Yohe, (eds.) 2014: Climate Change Impacts in the United States: The Third National Climate Assessment. U.S. Global Change Research Program, 841 pp. [http://nca2014.globalchange.gov]
Melton, J. R., R. Wania, E. L. Hodson, B. Poulter, B. Ringeval, R. Spahni, T. Bohn, C. A. Avis, D. J. Beerling, G. Chen, A. V. Eliseev, S. N. Denisov, P. O. Hopcroft, D. P. Lettenmaier, W. J. Riley, J. S. Singarayer, Z. M. Subin, H. Tian, S. Zürcher, V. Brovkin, P. M. van Bodegom, T. Kleinen, Z. C. Yu, and J. O. Kaplan, 2013: Present state of global wetland extent and wetland methane modelling: Conclusions from a model inter-comparison project (WET-CHIMP). Biogeosciences, 10(2), 753-788, doi: 10.5194/bg-10-753-2013.
Michalak, A. M., R. Jackson, G. Marland, C. Sabine, and Carbon Cycle Science Working Group, 2011: A U.S. Carbon Cycle Science Plan. University Corporation for Atmospheric Research. [https://www.carboncyclescience.us/USCarbonCycleSciencePlan-Au-gust2011]
Mohr, S. H., J. Wang, G. Ellem, J. Ward, and D. Giurco, 2015: Projection of world fossil fuels by country. Fuel, 141, 120-135, doi: 10.1016/j.fuel.2014.10.030.
Moore, D. J., N. A. Trahan, P. Wilkes, T. Quaife, B. B. Stephens, K. Elder, A. R. Desai, J. Negron, and R. K. Monson, 2013: Persistent reduced ecosystem respiration after insect disturbance in high elevation forests. Ecology Letters, 16(6), 731-737, doi: 10.1111/ele.12097.
NASEM, 2018: Improving Characterization of Anthropogenic Methane Emissions in the United States. National Academies of Sciences, Engineering, and Medicine, Washington, DC. The National Academies Press, 220 pp., doi: 10.17226/24987.
Nisbet, E. G., E. J. Dlugokencky, and P. Bousquet, 2014: Atmo-spheric science. Methane on the rise–again. Science, 343(6170), 493-495, doi: 10.1126/science.1247828.

Chapter 19 | Future of the North American Carbon Cycle
805Second State of the Carbon Cycle Report (SOCCR2)November 2018
Norby, R. J., E. H. Delucia, B. Gielen, C. Calfapietra, C. P. Giardina, J. S. King, J. Ledford, H. R. McCarthy, D. J. Moore, R. Ceulemans, P. De Angelis, A. C. Finzi, D. F. Karnosky, M. E. Kubiske, M. Lukac, K. S. Pregitzer, G. E. Scarascia-Mugnozza, W. H. Schlesinger, and R. Oren, 2005: Forest response to elevated CO2 is conserved across a broad range of productivity. Proceedings of the National Academy of Sciences, USA, 102(50), 18052-18056, doi: 10.1073/pnas.0509478102.
Norby, R. J., J. M. Warren, C. M. Iversen, B. E. Medlyn, and R. E. McMurtrie, 2010: CO2 enhancement of forest productivity con-strained by limited nitrogen availability. Proceedings of the National Academy of Sciences USA, 107(45), 19368-19373, doi: 10.1073/pnas.1006463107.
NRC, 2014: Opportunities to Use Remote Sensing in Understanding Permafrost and Related Ecological Characteristics: Report of a Workshop. National Research Council, National Academies Press, Washington, DC. [http://www.nap.edu/catalog/18711/opportu-nities-to-use-remote-sensing-in-understanding-permafrost-and-re-lated-ecological-characteristics]
Odum, E. P., 1969: The strategy of ecosystem development. Science, 164(3877), 262-270, doi: 10.1126/science.164.3877.262.
Overeem, I., and J. P. M. Syvitski, 2010: Shifting discharge peaks in Arctic rivers, 1977-2007. Geografiska Annaler: Series A, Physical Geography, 92(2), 285-296, doi: 10.1111/j.1468-0459.2010.00395.x.
Pacheco, F., F. Roland, and J. Downing, 2014: Eutrophication reverses whole-lake carbon budgets. Inland Waters, 4(1), 41-48, doi: 10.5268/iw-4.1.614.
Parks, S. A., C. Miller, J. T. Abatzoglou, L. M. Holsinger, M.-A. Parisien, and S. Z. Dobrowski, 2016: How will climate change affect wildland fire severity in the western US? Environmental Research Letters, 11(3), 035002, doi: 10.1088/1748-9326/11/3/035002.
Phillips, J., G. McKinley, V. Bennington, H. Bootsma, D. Pilcher, R. Sterner, and N. Urban, 2015: The potential for CO2-induced acidification in freshwater: A Great Lakes case study. Oceanography, 25(2), 136-145, doi: 10.5670/oceanog.2015.37.
Piao, S., S. Sitch, P. Ciais, P. Friedlingstein, P. Peylin, X. Wang, A. Ahlstrom, A. Anav, J. G. Canadell, N. Cong, C. Huntingford, M. Jung, S. Levis, P. E. Levy, J. Li, X. Lin, M. R. Lomas, M. Lu, Y. Luo, Y. Ma, R. B. Myneni, B. Poulter, Z. Sun, T. Wang, N. Viovy, S. Zaehle, and N. Zeng, 2013: Evaluation of terrestrial carbon cycle models for their response to climate variability and to CO2 trends. Global Change Biology, 19(7), 2117-2132, doi: 10.1111/gcb.12187.
Pielke, R. A., R. Mahmood, and C. McAlpine, 2016: Land’s complex role in climate change. Physics Today, 69(11), 40-46, doi: 10.1063/pt.3.3364.
Poulter, B., D. C. Frank, E. L. Hodson, and N. E. Zimmermann, 2011: Impacts of land cover and climate data selection on understanding terrestrial carbon dynamics and the CO2 airborne fraction. Biogeosciences, 8(8), 2027-2036, doi: 10.5194/bg-8-2027-2011.
Rabalais, N. N., R. E. Turner, R. J. Diaz, and D. Justic, 2009: Global change and eutrophication of coastal waters. ICES Journal of Marine Science, 66(7), 1528-1537, doi: 10.1093/icesjms/fsp047.
Randerson, J. T., K. Lindsay, E. Munoz, W. Fu, J. K. Moore, F. M. Hoffman, N. M. Mahowald, and S. C. Doney, 2015: Multicentury changes in ocean and land contributions to the climate‐carbon feedback. Global Biogeochemical Cycles, 29(6), 744-759, doi: 10.1002/2014GB005079.
Raupach, M. R., M. Gloor, J. L. Sarmiento, J. G. Canadell, T. L. Frölicher, T. Gasser, R. A. Houghton, C. Le Quéré, and C. M. Trudinger, 2014: The declining uptake rate of atmospheric CO2 by land and ocean sinks. Biogeosciences, 11(13), 3453-3475, doi: 10.5194/bg-11-3453-2014.
Ray, D. K., N. D. Mueller, P. C. West, and J. A. Foley, 2013: Yield trends are insufficient to double global crop production by 2050. PLOS One, 8(6), e66428, doi: 10.1371/journal.pone.0066428.
Regnier, P., P. Friedlingstein, P. Ciais, F. T. Mackenzie, N. Gruber, I. A. Janssens, G. G. Laruelle, R. Lauerwald, S. Luyssaert, A. J. Andersson, S. Arndt, C. Arnosti, A. V. Borges, A. W. Dale, A. Gallego-Sala, Y. Godderis, N. Goossens, J. Hartmann, C. Heinze, T. Ilyina, F. Joos, D. E. LaRowe, J. Leifeld, F. J. R. Meysman, G. Munhoven, P. A. Raymond, R. Spahni, P. Suntharalingam, and M. Thullner, 2013: Anthropogenic perturbation of the carbon fluxes from land to ocean. Nature Geoscience, 6(8), 597-607, doi: 10.1038/Ngeo1830.
Reichstein, M., M. Bahn, P. Ciais, D. Frank, M. D. Mahecha, S. I. Seneviratne, J. Zscheischler, C. Beer, N. Buchmann, D. C. Frank, D. Papale, A. Rammig, P. Smith, K. Thonicke, M. van der Velde, S. Vicca, A. Walz, and M. Wattenbach, 2013: Climate extremes and the carbon cycle. Nature, 500(7462), 287-295, doi: 10.1038/nature12350.
Rigby, M., R. G. Prinn, P. J. Fraser, P. G. Simmonds, R. L. Langenfelds, J. Huang, D. M. Cunnold, L. P. Steele, P. B. Krum-mel, R. F. Weiss, S. O’Doherty, P. K. Salameh, H. J. Wang, C. M. Harth, J. Mühle, and L. W. Porter, 2008: Renewed growth of atmospheric methane. Geophysical Research Letters, 35(22), doi: 10.1029/2008gl036037.
Ringeval, B., P. Friedlingstein, C. Koven, P. Ciais, N. de Noblet- Ducoudré, B. Decharme, and P. Cadule, 2011: Climate-CH4 feedback from wetlands and its interaction with the climate-CO2 feedback. Biogeosciences, 8(8), 2137-2157, doi: 10.5194/bg-8-2137-2011.
Romero-Lankao, P., J. B. Smith, D. J. Davidson, N. S. Diffenbaugh, P. L. Kinney, P. Kirshen, P. Kovacs, and L. Villers Ruiz, 2014: North America. In: Climate Change 2014: Impacts, Adaptation, and Vulner-ability. Part B: Regional Aspects. Contribution of Working Group II to the Fifth Assessment Report of the Intergovernmental Panel on Climate Change, [V. R. Barros, C. B. Field, D. J. Dokken, M. D. Mastrandrea, K. J. Mach, T. E. Bilir, M. Chatterjee, K. L. Ebi, Y. O. Estrada, R. C. Genova, B. Girma, E. S. Kissel, A. N. Levy, S. MacCracken, P. R. Mastrandrea, and L. L. White (eds.)]. Cambridge University Press, 439-1498 pp.
Section IV | Consequences and Ways Forward
806 U.S. Global Change Research Program November 2018
Running, S. W., 2008: Climate change. Ecosystem disturbance, carbon, and climate. Science, 321(5889), 652-653, doi: 10.1126/science.1159607.
Ruppel, C. D. and J. D. Kessler, 2017: The interaction of climate change and methane hydrates. Reviews of Geophysics, 55(1), 126-168, doi: 10.1002/2016RG000534.
Rykaczewski, R. R., J. P. Dunne, W. J. Sydeman, M. García-Reyes, B. A. Black, and S. J. Bograd, 2015: Poleward displacement of coastal upwelling-favorable winds in the ocean’s Eastern boundary currents through the 21st century. Geophysical Research Letters, 42(15), 6424-6431, doi: 10.1002/2015gl064694.
Sabine, C. L., R. A. Feely, N. Gruber, R. M. Key, K. Lee, J. L. Bullister, R. Wanninkhof, C. S. Wong, D. W. Wallace, B. Tilbrook, F. J. Millero, T. H. Peng, A. Kozyr, T. Ono, and A. F. Rios, 2004: The oceanic sink for anthropogenic CO2. Science, 305(5682), 367-371, doi: 10.1126/science.1097403.
Saunois, M., R. B. Jackson, P. Bousquet, B. Poulter, and J. G. Canadell, 2016: The growing role of methane in anthropogenic climate change. Environmental Research Letters, 11(12), 120207, doi: 10.1088/1748-9326/11/12/120207.
Schaefer, K., T. Zhang, L. Bruhwiler, and A. P. Barrett, 2011: Amount and timing of permafrost carbon release in response to climate warming. Tellus B: Chemical and Physical Meteorology, 63(2), 165-180, doi: 10.1111/j.1600-0889.2011.00527.x.
Schimel, D., B. B. Stephens, and J. B. Fisher, 2015: Effect of increasing CO2 on the terrestrial carbon cycle. Proceedings of the National Academy of Sciences, USA, 112(2), 436-441, doi: 10.1073/pnas.1407302112.
Schuur, E. A. G., B. W. Abbott, W. B. Bowden, V. Brovkin, P. Camill, J. G. Canadell, J. P. Chanton, F. S. Chapin, T. R. Christensen, P. Ciais, B. T. Crosby, C. I. Czimczik, G. Grosse, J. Harden, D. J. Hayes, G. Hugelius, J. D. Jastrow, J. B. Jones, T. Kleinen, C. D. Koven, G. Krinner, P. Kuhry, D. M. Lawrence, A. D. McGuire, S. M. Natali, J. A. O’Donnell, C. L. Ping, W. J. Riley, A. Rinke, V. E. Romanovsky, A. B. K. Sannel, C. Schädel, K. Schaefer, J. Sky, Z. M. Subin, C. Tarnocai, M. R. Turetsky, M. P. Waldrop, K. M. Walter Anthony, K. P. Wickland, C. J. Wilson, and S. A. Zimov, 2013: Expert assessment of vulnerability of permafrost carbon to climate change. Climatic Change, 119(2), 359-374, doi: 10.1007/s10584-013-0730-7.
Schuur, E. A. G., J. Bockheim, J. G. Canadell, E. Euskirchen, C. B. Field, S. V. Goryachkin, S. Hagemann, P. Kuhry, P. M. Lafleur, H. Lee, G. Mazhitova, F. E. Nelson, A. Rinke, V. E. Romanovsky, N. Shiklomanov, C. Tarnocai, S. Venevsky, J. G. Vogel, and S. A. Zimov, 2008: Vulnerability of permafrost carbon to climate change: Implications for the global carbon cycle. BioScience, 58(8), 701, doi: 10.1641/b580807.
Schuur, E. A., A. D. McGuire, C. Schadel, G. Grosse, J. W. Harden, D. J. Hayes, G. Hugelius, C. D. Koven, P. Kuhry, D. M. Lawrence, S. M. Natali, D. Olefeldt, V. E. Romanovsky, K. Schaefer, M. R. Turetsky, C. C. Treat, and J. E. Vonk, 2015: Climate change and the permafrost carbon feedback. Nature, 520(7546), 171-179, doi: 10.1038/nature14338.
Schuur, E. A., and B. Abbott, 2011: Climate change: High risk of permafrost thaw. Nature, 480(7375), 32-33, doi: 10.1038/480032a.
Schwinger, J., J. F. Tjiputra, C. Heinze, L. Bopp, J. R. Christian, M. Gehlen, T. Ilyina, C. D. Jones, D. Salas-Melia, J. Segschneider, R. Seferian, and I. Totterdell, 2014: Nonlinearity of ocean carbon cycle feedbacks in CMIP5 Earth system models. Journal of Climate, 27(11), 3869-3888, doi: 10.1175/Jcli-D-13-00452.1.
Seidel, D. J., Qiang Fu, W. J. Randel, T. J. Reichler, 2008: Widening of the tropical belt in a changing climate. Nature Geoscience, 1, 21-24, doi: 10.1038/ngeo.2007.38.
SEMARNAT-INECC, 2016: Mexico’s Climate Change Mid-Century Strategy. Ministry of Environment and Natural Resources and National Institute of Ecology and Climate Change, Mexico City, Mexico, 100 pp.
Serreze, M. C., and J. A. Francis, 2006: The Arctic amplification debate. Climatic Change, 76(3-4), 241-264, doi: 10.1007/s10584-005-9017-y.
Settele, J., R. Scholes, R. Betts, S. E. Bunn, P. Leadley, D. Nepstad, J. T. Overpeck, and M. A. Taboada, 2014: Terrestrial and inland water systems. In: Climate Change 2014: Impacts, Adaptation, and Vulnerability. Part A: Global and Sectoral Aspects. Contribution of Working Group II to the Fifth Assessment Report of the Intergovern-mental Panel on Climate Change. [C. B. Field, V. R. Barros, D. J. Dokken, K. J. Mach, M. D. Mastrandrea, T. E. Bilir, M. Chatterjee, K. L. Ebi, Y. O. Estrada, R. C. Genova, B. Girma, E. S. Kissel, A. N. Levy, S. MacCracken, P. R. Mastrandrea, and L. L. White (eds.)]. Cambridge University Press, 271-359 pp.
Short, F. T., and S. Wyllie-Echeverria, 1996: Natural and human- induced disturbance of seagrasses. Environmental Conservation, 23(01), 17, doi: 10.1017/s0376892900038212.
Slater, A. G., and D. M. Lawrence, 2013: Diagnosing present and future permafrost from climate models. Journal of Climate, 26(15), 5608-5623, doi: 10.1175/jcli-d-12-00341.1.
Smith, P., H. Haberl, A. Popp, K. H. Erb, C. Lauk, R. Harper, F. N. Tubiello, A. de Siqueira Pinto, M. Jafari, S. Sohi, O. Masera, H. Bottcher, G. Berndes, M. Bustamante, H. Ahammad, H. Clark, H. Dong, E. A. Elsiddig, C. Mbow, N. H. Ravindranath, C. W. Rice, C. Robledo Abad, A. Romanovskaya, F. Sperling, M. Herrero, J. I. House, and S. Rose, 2013: How much land-based greenhouse gas mitigation can be achieved without compromising food security and environmental goals? Global Change Biology, 19(8), 2285-2302, doi: 10.1111/gcb.12160.
Sommers, W. T., R. A. Loehman, and C. C. Hardy, 2014: Wild-land fire emissions, carbon, and climate: Science overview and knowledge needs. Forest Ecology and Management, 317, 1-8, doi: 10.1016/j.foreco.2013.12.014.

Chapter 19 | Future of the North American Carbon Cycle
807Second State of the Carbon Cycle Report (SOCCR2)November 2018
Spencer, R. G. M., G. R. Aiken, K. P. Wickland, R. G. Striegl, and P. J. Hernes, 2008: Seasonal and spatial variability in dis-solved organic matter quantity and composition from the Yukon River Basin, Alaska. Global Biogeochemical Cycles, 22(4), doi: 10.1029/2008gb003231.
Stavros, E. N., J. T. Abatzoglou, D. McKenzie, and N. K. Larkin, 2014: Regional projections of the likelihood of very large wildland fires under a changing climate in the contiguous western United States. Climatic Change, 126(3-4), 455-468, doi: 10.1007/s10584-014-1229-6.
Stocker, B. D., R. Roth, F. Joos, R. Spahni, M. Steinacher, S. Zaehle, L. Bouwman, R. Xu, and I. C. Prentice, 2013: Multiple greenhouse-gas feedbacks from the land biosphere under future climate change scenarios. Nature Climate Change, 3(7), 666-672, doi: 10.1038/nclimate1864.
Stouffer, R. J., J. Yin, J. M. Gregory, K. W. Dixon, M. J. Spelman, W. Hurlin, A. J. Weaver, M. Eby, G. M. Flato, H. Hasumi, A. Hu, J. H. Jungclaus, I. V. Kamenkovich, A. Levermann, M. Montoya, S. Murakami, S. Nawrath, A. Oka, W. R. Peltier, D. Y. Robitaille, A. Sokolov, G. Vettoretti, and S. L. Weber, 2006: Investigating the causes of the response of the thermohaline circulation to past and future climate changes. Journal of Climate 19, 1365-1387, doi: 10.1175/JCLI3689.1.
Sulman, B. N., A. R. Desai, N. M. Schroeder, D. Ricciuto, A. Barr, A. D. Richardson, L. B. Flanagan, P. M. Lafleur, H. Tian, G. Chen, R. F. Grant, B. Poulter, H. Verbeeck, P. Ciais, B. Ringeval, I. T. Baker, K. Schaefer, Y. Luo, and E. Weng, 2012: Impact of hydrological variations on modeling of peatland CO2 fluxes: Results from the North American carbon program site synthesis. Journal of Geophysical Research: Biogeosciences, 117(G1), doi: 10.1029/2011jg001862.
Talhelm, A. F., K. S. Pregitzer, M. E. Kubiske, D. R. Zak, C. E. Campany, A. J. Burton, R. E. Dickson, G. R. Hendrey, J. G. Isebrands, K. F. Lewin, J. Nagy, and D. F. Karnosky, 2014: Elevated carbon dioxide and ozone alter productivity and ecosystem carbon content in northern temperate forests. Global Change Biology, 20(8), 2492-2504, doi: 10.1111/gcb.12564.
Tan, Z., S. Liu, T. L. Sohl, Y. Wu, and C. J. Young, 2015: Ecosys-tem carbon stocks and sequestration potential of federal lands across the conterminous United States. Proceedings of the National Academy of Sciences USA, 112(41), 12723-12728, doi: 10.1073/pnas.1512542112.
Tarnocai, C., J. G. Canadell, E. A. G. Schuur, P. Kuhry, G. Mazhitova, and S. Zimov, 2009: Soil organic carbon pools in the northern circumpolar permafrost region. Global Biogeochemical Cycles, 23(2), doi: 10.1029/2008gb003327.
Terrer, C., S. Vicca, B. A. Hungate, R. P. Phillips, and I. C. Prentice, 2016: Mycorrhizal association as a primary control of the CO2 fertilization effect. Science, 353(6294), 72-74, doi: 10.1126/sci-ence.aaf4610.
Tian, X., B. Sohngen, J. B. Kim, S. Ohrel, and J. Cole, 2016: Global climate change impacts on forests and markets. Envi-ronmental Research Letters, 11(3), 035011, doi: 10.1088/1748-9326/11/3/035011.
Tian, X., B. Sohngen, J. Baker, S. Ohrel, and A. A. Fawcett., 2018: Will U.S. forests continue to be a carbon sink? Land Economics, 94(1), 97-113. doi: 10.3368/le.94.1.97
Trahan, N. A., E. L. Dynes, E. Pugh, D. J. Moore, and R. K. Mon-son, 2015: Changes in soil biogeochemistry following disturbance by girdling and mountain pine beetles in subalpine forests. Oecolo-gia, 177(4), 981-995, doi: 10.1007/s00442-015-3227-4.
Tranvik, L. J., and M. Jansson, 2002: Climate change (Commu-nication arising): Terrestrial export of organic carbon. Nature, 415(6874), 861-862, doi: 10.1038/415861b.
Tranvik, L. J., J. A. Downing, J. B. Cotner, S. A. Loiselle, R. G. Striegl, T. J. Ballatore, P. Dillon, K. Finlay, K. Fortino, L. B. Knoll, P. L. Kortelainen, T. Kutser, S. Larsen, I. Laurion, D. M. Leech, S. L. McCallister, D. M. McKnight, J. M. Melack, E. Overholt, J. A. Porter, Y. Prairie, W. H. Renwick, F. Roland, B. S. Sherman, D. W. Schindler, S. Sobek, A. Tremblay, M. J. Vanni, A. M. Verschoor, E. von Wachen-feldt, and G. A. Weyhenmeyer, 2009: Lakes and reservoirs as regu-lators of carbon cycling and climate. Limnology and Oceanography, 54(6:2), 2298-2314, doi: 10.4319/lo.2009.54.6_part_2.2298.
U.S. Department of State, 2016: Second Biennial Report of the United States of America Under the United Nations Framework Convention On Climate Change. [https://unfccc.int/files/national_reports/biennial_reports_and_iar/submitted_biennial_reports/application/pdf/2016_second_biennial_report_of_the_united_states_.pdf]
U.S. EPA, 2015: Climate Change in the United States: Benefits of Global Action. U.S. Environmental Protection Agency. EPA 430-R-15-001, Office of Atmospheric Programs. [https://www.epa.gov/cira]
U.S. EPA, 2016: Inventory of U.S. Greenhouse Gas Emissions and Sinks: 1990-2014. U.S. Environmental Protection Agency. EPA 430-R-16-002. [https://www.epa.gov/sites/production/files/2016-04/documents/us-ghg-inventory-2016-main-text.pdf]
United Nations General Assembly, 1982: Convention on the Law of the Sea. 1833 U.N.T.S. 397. [http://legal.un.org/avl/ha/uncls/uncls.html]
USDA, 2017: Major Land Uses of the United States. U.S. Depart-ment of Agriculture Economic Research Service, Washington, DC. [https://www.ers.usda.gov/data-products/major-land-uses/major-land-uses/#Cropland]
USGCRP, 2017a: Climate Science Special Report: Fourth National Climate Assessment, Volume I. [D. J. Wuebbles, D. W. Fahey, K. A. Hibbard, D. J. Dokken, B. C. Stewart, and T. K. Maycock (eds.)]. U.S. Global Change Research Program, Washington, DC, 666 pp. [https://science2017.globalchange.gov]
USGCRP, 2017b: The National Global Change Research Plan 2012-2021: A Triennial Update.

Section IV | Consequences and Ways Forward
808 U.S. Global Change Research Program November 2018
van der Molen, M. K., A. J. Dolman, P. Ciais, T. Eglin, N. Gobron, B. E. Law, P. Meir, W. Peters, O. L. Phillips, M. Reichstein, T. Chen, S. C. Dekker, M. Doubková, M. A. Friedl, M. Jung, B. J. J. M. van den Hurk, R. A. M. de Jeu, B. Kruijt, T. Ohta, K. T. Rebel, S. Plummer, S. I. Seneviratne, S. Sitch, A. J. Teuling, G. R. van der Werf, and G. Wang, 2011: Drought and ecosystem carbon cycling. Agricultural and Forest Meteorology, 151(7), 765-773, doi: 10.1016/j.agrformet.2011.01.018.
van Groenigen, K. J., X. Qi, C. W. Osenberg, Y. Luo, and B. A. Hungate, 2014: Faster decomposition under increased atmospheric CO2 limits soil carbon storage. Science, 344(6183), 508-509, doi: 10.1126/science.1249534.
van Mantgem, P. J., N. L. Stephenson, J. C. Byrne, L. D. Daniels, J. F. Franklin, P. Z. Fule, M. E. Harmon, A. J. Larson, J. M. Smith, A. H. Taylor, and T. T. Veblen, 2009: Widespread increase of tree mortality rates in the western United States. Science, 323(5913), 521-524, doi: 10.1126/science.1165000.
van Vuuren, D. P., J. Edmonds, M. Kainuma, K. Riahi, A. Thomson, K. Hibbard, G. C. Hurtt, T. Kram, V. Krey, J.-F. Lamarque, T. Masui, M. Meinshausen, N. Nakicenovic, S. J. Smith, and S. K. Rose, 2011: The representative concentration pathways: An overview. Climatic Change, 109(1-2), 5-31, doi: 10.1007/s10584-011-0148-z.
van Winkle, C., J. S. Baker, D. Lapidus, S. Ohrel, J. Steller, G. Latta, and D. Birur, 2017: U.S. Forest Sector Greenhouse Mitigation Poten-tial and Implications for Nationally Determined Contributions. RTI Press Publication No. OP-0033-1705. Research Triangle Park, NC: RTI Press, doi: 10.3768/rtipress.2017.op.0033.1705
Vecchi, G. A., and B. J. Soden, 2007: Global warming and the weakening of the tropical circulation. Journal of Climate, 20(17), 4316-4340, doi: 10.1175/jcli4258.1.
Vincent, W. F., 2009: Effects of climate change on lakes. In: Encyclo-pedia of Inland Waters. [G. E. Liken (ed.)]. Elsevier Oxford, 55-60 pp.
Vorosmarty, C. J., P. B. McIntyre, M. O. Gessner, D. Dudgeon, A. Prusevich, P. Green, S. Glidden, S. E. Bunn, C. A. Sullivan, C. R. Liermann, and P. M. Davies, 2010: Global threats to human water security and river biodiversity. Nature, 467(7315), 555-561, doi: 10.1038/nature09440.
Walker, A. P., S. Zaehle, B. E. Medlyn, M. G. De Kauwe, S. Asao, T. Hickler, W. Parton, D. M. Ricciuto, Y.-P. Wang, D. Wårlind, and R. J. Norby, 2015: Predicting long-term carbon sequestration in response to CO2 enrichment: How and why do current ecosystem models differ? Global Biogeochemical Cycles, 29(4), 476-495, doi: 10.1002/2014gb004995.
Watanabe, S., T. Hajima, K. Sudo, T. Nagashima, T. Takemura, H. Okajima, T. Nozawa, H. Kawase, M. Abe, T. Yokohata, T. Ise, H. Sato, E. Kato, K. Takata, S. Emori, and M. Kawamiya, 2011: MIROC-ESM 2010: Model description and basic results of CMIP5-20c3m experiments. Geoscientific Model Development, 4(4), 845-872, doi: 10.5194/gmd-4-845-2011.
Watson, R. T., I. R. Noble, B. Bolin, N. H. Ravindranath, D. J. Verardo, and D. J. Dokken, 2000: Land Use, Land-Use Change, and Forestry – A Special Report of the Intergovernmental Panel On Climate Change, 377 pp. [http://www.ipcc.ch/ipccreports/sres/land_use/003.htm]
Wear, D. N., 2011: Forecasts of County-Level Land Uses Under Three Future Scenarios: A Technical Document Supporting the Forest Service 2010 RPA Assessment. General Technical Report SRS-141, F. S. U.S. Department of Agriculture, 41 pp. [https://www.fs.usda.gov/treesearch/pubs/39404]
Weiss, L. C., L. Potter, A. Steiger, S. Kruppert, U. Frost, and R. Tollrian, 2018: Rising pCO2 in freshwater ecosystems has the potential to negatively affect predator-induced defenses in Daphnia. Current Biology, 28(2), 327-332 e323, doi: 10.1016/j.cub.2017.12.022.
Westerling, A. L., H. G. Hidalgo, D. R. Cayan, and T. W. Swetnam, 2006: Warming and earlier spring increase western U.S. forest wildfire activity. Science, 313(5789), 940-943, doi: 10.1126/science.1128834.
Wilhelm, S., and R. Adrian, 2007: Impact of summer warming on the thermal characteristics of a polymictic lake and consequences for oxygen, nutrients and phytoplankton. Freshwater Biology, 53(2), 226-237, doi: 10.1111/j.1365-2427.2007.01887.x.
Williams, C. A., H. Gu, R. MacLean, J. G. Masek, and G. J. Collatz, 2016: Disturbance and the carbon balance of US forests: A quantitative review of impacts from harvests, fires, insects, and droughts. Global and Planetary Change, 143, 66-80, doi: 10.1016/j.gloplacha.2016.06.002.
Wolf, S., T. F. Keenan, J. B. Fisher, D. D. Baldocchi, A. R. Desai, A. D. Richardson, R. L. Scott, B. E. Law, M. E. Litvak, N. A. Brunsell, W. Peters, and I. T. van der Laan-Luijkx, 2016: Warm spring reduced carbon cycle impact of the 2012 US summer drought. Proceedings of the National Academy of Sciences USA, 113(21), 5880-5885, doi: 10.1073/pnas.1519620113.
Wu, L., W. Cai, L. Zhang, H. Nakamura, A. Timmermann, T. Joyce, M. J. McPhaden, M. Alexander, B. Qiu, M. Visbeck, P. Chang, and B. Giese, 2012: Enhanced warming over the global subtropical Western boundary currents. Nature Climate Change, 2(3), 161-166, doi: 10.1038/nclimate1353.
Zaehle, S., and D. Dalmonech, 2011: Carbon–nitrogen interac-tions on land at global scales: Current understanding in modelling climate biosphere feedbacks. Current Opinion in Environmental Sustainability, 3(5), 311-320, doi: 10.1016/j.cosust.2011.08.008.
Zaehle, S., B. E. Medlyn, M. G. De Kauwe, A. P. Walker, M. C. Dietze, T. Hickler, Y. Luo, Y. P. Wang, B. El-Masri, P. Thornton, A. Jain, S. Wang, D. Warlind, E. Weng, W. Parton, C. M. Iversen, A. Gallet-Budynek, H. McCarthy, A. Finzi, P. J. Hanson, I. C. Prentice, R. Oren, and R. J. Norby, 2014: Evaluation of 11 terrestrial carbon-nitrogen cycle models against observations from two tem-perate Free-Air CO2 Enrichment studies. New Phytologist, 202(3), 803-822, doi: 10.1111/nph.12697.

Chapter 19 | Future of the North American Carbon Cycle
809Second State of the Carbon Cycle Report (SOCCR2)November 2018
Zeng, N., H. Qian, C. Roedenbeck, and M. Heimann, 2005: Impact of 1998-2002 midlatitude drought and warming on terrestrial ecosystem and the global carbon cycle. Geophysical Research Letters, 32(22), L22709, doi: 10.1029/2005gl024607.
Zhu, Z., and A. D. McGuire, 2016: Baseline and Projected Future Carbon Storage and Greenhouse-Gas Fluxes in Ecosystems of Alaska. U.S. Geological Survey Professional Paper 1826. [Z. Zhu and A. D. McGuire (eds.)]. 196 pp. [https://pubs.er.usgs.gov/publication/pp1826]
Zscheischler, J., A. M. Michalak, C. Schwalm, M. D. Mahecha, D. N. Huntzinger, M. Reichstein, G. Berthier, P. Ciais, R. B. Cook, B. El-Masri, M. Huang, A. Ito, A. Jain, A. King, H. Lei, C. Lu, J. Mao, S. Peng, B. Poulter, D. Ricciuto, X. Shi, B. Tao, H. Tian, N. Viovy, W. Wang, Y. Wei, J. Yang, and N. Zeng, 2014: Impact of large-scale climate extremes on biospheric carbon fluxes: An intercomparison based on MsTMIP data. Global Biogeochemical Cycles, 28(6), 585-600, doi: 10.1002/2014gb004826.