Embed Size (px)
Citation preview
Review
Connectomic approaches before the connectome
Marco Catani a,⁎, Michel Thiebaut de Schotten a,b, David Slater c, Flavio Dell'Acqua c,d
a Natbrainlab, King's College London, Institute of Psychiatry, Department of Forensic and Neurodevelopmental Sciences, London SE5 8AF, UKb UMR_S 975, CNRS UMR 7225, Centre de Recherche de l'Institut du Cerveau et de la Moelle épinière, Groupe Hospitalier Pitié-Salpêtrière, 75013 Paris, Francec Natbrainlab, King's College London, Institute of Psychiatry, Department of Neuroimaging, London SE5 8AF, UKd NIHR Biomedical Research Centre for Mental Health at South London and Maudsley NHS Foundation Trust and Institute of Psychiatry, King's College London, UK
a b s t r a c ta r t i c l e i n f o
Article history:Accepted 20 May 2013Available online xxxx
Keywords:ConnectomeConnectionDiffusionTractographyHodologyNetworks
Connectome is a term with a short history but a long past. Since the origins of neuroscience the concept of a‘map of neural connections’ has been a constant inspiring idea for those who believed the brain as the organof intellect. A myriad of proto-connectome maps have been produced throughout the centuries, each onereflecting the theory and method of investigation that prevailed at the time. Even contemporary definitionsof the connectome rest upon the formulation of a neuronal theory that has been proposed over a hundredyears ago. So, what is new? In this article we attempt to trace the development of certain anatomical andphysiological concepts at the origins of modern definitions of the connectome. We argue that compared toprevious attempts current connectomic approaches benefit from a wealth of imaging methods that in partcould justify the enthusiasm for finally succeeding in achieving the goal. One of the unique advantages of con-temporary approaches is the possibility of using quantitative methods to define measures of connectivitywhere structure, function and behaviour are integrated and correlated. We also argue that many contempo-rary maps are inaccurate surrogates of the true anatomy and a comprehensive connectome of the humanbrain remains a far distant point in the history to come.
© 2013 Elsevier Inc. All rights reserved.
Contents
Introduction . . . . . . . . . . . . . . . . . . . . . . . . . . . . . . . . . . . . . . . . . . . . . . . . . . . . . . . . . . . . . . . . . 0Early proto-connectome maps (Table 1) . . . . . . . . . . . . . . . . . . . . . . . . . . . . . . . . . . . . . . . . . . . . . . . . . . . . 0Modern cartography (Table 2) . . . . . . . . . . . . . . . . . . . . . . . . . . . . . . . . . . . . . . . . . . . . . . . . . . . . . . . . . 0Contemporary and future connectomes between macroscopic metaphors and microscopic myths . . . . . . . . . . . . . . . . . . . . . . . . . 0Acknowledgments . . . . . . . . . . . . . . . . . . . . . . . . . . . . . . . . . . . . . . . . . . . . . . . . . . . . . . . . . . . . . . 0References . . . . . . . . . . . . . . . . . . . . . . . . . . . . . . . . . . . . . . . . . . . . . . . . . . . . . . . . . . . . . . . . . . 0
Introduction
The pattern of scientific investigation cannot be understood inisolation: it must be set against the background of wider trends inthe sciences, methodological advancements, and general culture ofthe time (Clarke and Jacyna, 1987). Social, biological, and technologicalnetwork models dominate contemporary approaches to complexity(Egerstedt, 2011). Telecommunications, social networks, transportationlogistics, molecular interactions, and metabolic pathways are just someexamples in which network analysis is used to described complexdynamics (Sporns, 2011; Strogatz, 2001).
The same approach has been proposed to describe the complexity ofthe nervous system. Here, interactions between 86 billion of neuronscould be defined using nodes, hubs, connections and their propertiesquantified in terms of efficiency, centrality, global and local integration,etc. (Bullmore and Sporns, 2009). There is also a general perceptionthat network analysis could bring us closer to a true understandingof the real working of the human brain and its disorders. Tworecent multicentre research projects testify to the interest andcommitment of the international scientific community to this endeav-our. The Human Connectome Project (http://www.humanconnectome.org) is a $40 million NIH funded study to map the human connectomein 1200 healthy subjects using large scale functional and structural im-aging. The Human Brain Project (http://www.humanbrainproject.eu) isone of the flagship projects of the European Commission that is likely toreceive funding in the region of €1 billion for the ‘simulation of the
NeuroImage xxx (2013) xxx–xxx
⁎ Corresponding author at: Natbrainlab, PO50 Department of Forensic and Neurodevel-opmental Sciences, Institute of Psychiatry, King's College London, London SE5 8AF, UK.
E-mail address: [email protected] (M. Catani).
YNIMG-10548; No. of pages: 12; 4C: 5, 6, 8
1053-8119/$ – see front matter © 2013 Elsevier Inc. All rights reserved.http://dx.doi.org/10.1016/j.neuroimage.2013.05.109
Contents lists available at SciVerse ScienceDirect
NeuroImage
j ourna l homepage: www.e lsev ie r .com/ locate /yn img
Please cite this article as: Catani, M., et al., Connectomic approaches before the connectome, NeuroImage (2013), http://dx.doi.org/10.1016/j.neuroimage.2013.05.109
entire human brain connectivity at a neuronal level and emulation of itscomputational capabilities’. With the recent announcement of PresidentObama of a budget of possibly $100 million a year for the Brain Researchthrough Advancing Innovative Neurotechnologies (BRAIN) Initiative,this field of research will see an even greater expansion.
This unprecedented support is in large part due to the developmentof new methods to image networks in the living human brain and thecomputational capability of processing and storing large amounts ofdata. The connectome approach, although new in its overarching con-ception, represents the culmination of converging lines of research,each of which have developed over the course of many centuries(Tables 1 and 2). In this paperwe attempt to trace timelines of those an-atomical (both at the macro- and microscopical scale), physiologicaland methodological advances that helped to generate brain maps andshape their evolution throughout history. Tables 1 and 2 describesome of the pivotal discoveries in neurosciences from the field of mi-croscopy, electrophysiology/computational sciences, and anatomy/neuroimaging. These timelines are not intended to be exhaustivebut rather highlight only a number of key discoveries and develop-ments that have some relevance to contemporary connectomicapproaches. Our aim is to give credit to pioneers and put currentconnectome projects into a wider context. The figures reproducedin the article are examples of historical ‘brain maps’ that can beconsidered as possible forerunners of contemporary connectomes.In the final part we try to take advantage of our historical survey
to identify those steps needed to fill the gap between currentconnectome maps and the real underlying anatomy of the humanbrain.
Early proto-connectome maps (Table 1)
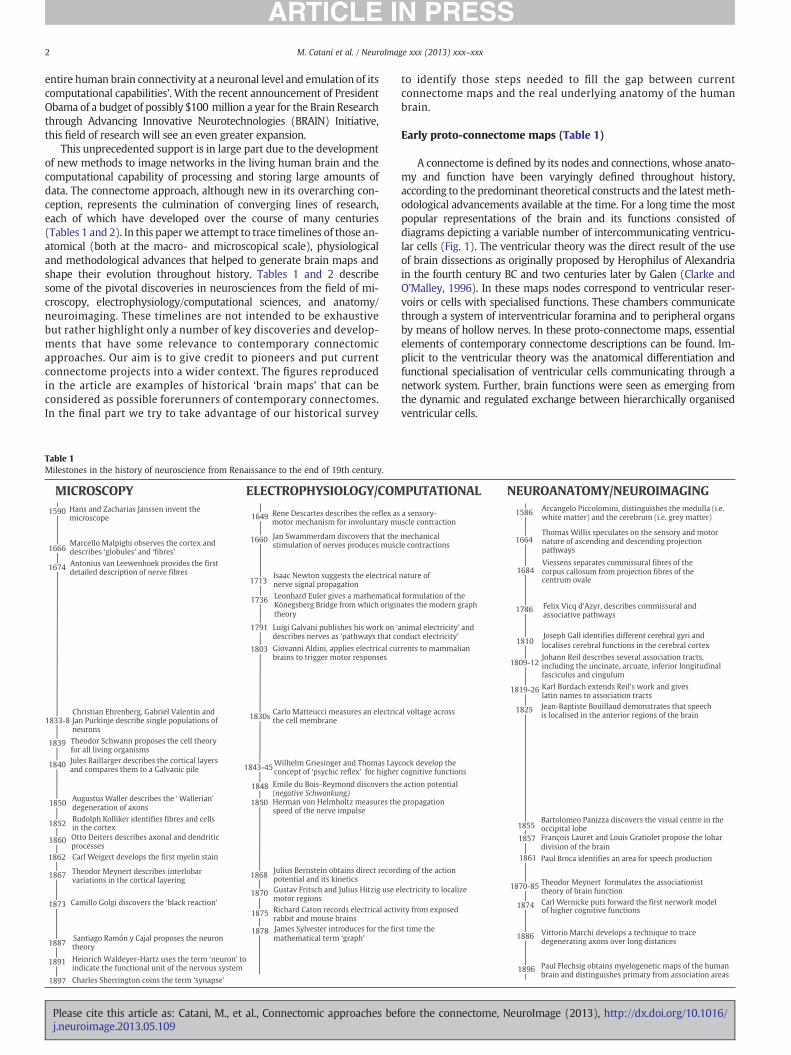
A connectome is defined by its nodes and connections, whose anato-my and function have been varyingly defined throughout history,according to the predominant theoretical constructs and the latestmeth-odological advancements available at the time. For a long time the mostpopular representations of the brain and its functions consisted ofdiagrams depicting a variable number of intercommunicating ventricu-lar cells (Fig. 1). The ventricular theory was the direct result of the useof brain dissections as originally proposed by Herophilus of Alexandriain the fourth century BC and two centuries later by Galen (Clarke andO'Malley, 1996). In these maps nodes correspond to ventricular reser-voirs or cells with specialised functions. These chambers communicatethrough a system of interventricular foramina and to peripheral organsby means of hollow nerves. In these proto-connectome maps, essentialelements of contemporary connectome descriptions can be found. Im-plicit to the ventricular theory was the anatomical differentiation andfunctional specialisation of ventricular cells communicating through anetwork system. Further, brain functions were seen as emerging fromthe dynamic and regulated exchange between hierarchically organisedventricular cells.
Table 1Milestones in the history of neuroscience from Renaissance to the end of 19th century.
1590 Hans and Zacharias Janssen invent the microscope
1666Marcello Malpighi observes the cortex and describes ‘globules’ and ‘fibres’
1674
MICROSCOPY
1833-8Christian Ehrenberg, Gabriel Valentin and Jan Purkinje describe single populations of neurons
1873 Camillo Golgi discovers the ‘black reaction’
1839 Theodor Schwann proposes the cell theory for all living organisms
1887 theory
1891 Heinrich Waldeyer-Hartz uses the term ‘neuron’ to indicate the functional unit of the nervous system
ELECTROPHYSIOLOGY/COMPUTATIONAL
1649motor mechanism for involuntary muscle contraction
1660 Jan Swammerdam discovers that the mechanical stimulation of nerves produces muscle contractions
1713Isaac Newton suggests the electrical nature of nerve signal propagation
1791 Luigi Galvani publishes his work on ‘animal electricity’ and describes nerves as ‘pathways that conduct electricity’
1803 Giovanni Aldini, applies electrical currents to mammalian brains to trigger motor responses
1848 Emile du Bois-Reymond discovers the action potential (negative Schwankung)
1868
Herman von Helmholtz measures the propagation speed of the nerve impulse
Julius Bernstein obtains direct recording of the action potential and its kinetics
NEUROANATOMY/NEUROIMAGING1586 Arcangelo Piccolomini, distinguishes the medulla (i.e.
white matter) and the cerebrum (i.e. grey matter)
1840 Jules Baillarger describes the cortical layers and compares them to a Galvanic pile
1664Thomas Willis speculates on the sensory and motor nature of ascending and descending projection pathways
1684centrum ovale
1809-12Johann Reil describes several association tracts, including the uncinate, arcuate, inferior longitudinal fasciculus and cingulum
1819-26 Karl Burdach extends Reil's work and giveslatin names to association tracts
1870-85 Theodor Meynert formulates the associationist theory of brain function
1874of higher cognitive functions
1870 Gustav Fritsch and Julius Hitzig use electricity to localizemotor regions
1875 Richard Caton records electrical activity from exposed rabbit and mouse brains
1862
1860 Otto Deiters describes axonal and dendritic processes
1850 degeneration of axons
1886 Vittorio Marchi develops a technique to trace degenerating axons over long distances
1897 Charles Sherrington coins the term ‘synapse’
1852 in the cortex
1867 Theodor Meynert describes interlobar variations in the cortical layering
1843-45 Wilhelm Griesinger and Thomas Laycock develop the concept of ‘psychic reflex’ for higher cognitive functions
1786 Felix Vicq d’Azyr, describes commissural and associative pathways
1810 localises cerebral functions in the cerebral cortex
1857 François Lauret and Louis Gratiolet propose the lobar division of the brain
1861
mathematical term ‘graph’ 1878
1855Bartolomeo Panizza discovers the visual centre in the occipital lobe
1830s Carlo Matteucci measures an electrical voltage across the cell membrane
1825 Jean-Baptiste Bouillaud demonstrates that speech is localised in the anterior regions of the brain
Paul Flechsig obtains myelogenetic maps of the human brain and distinguishes primary from association areas
1896
1736 Leonhard Euler gives a mathematical formulation of the
1850
Antonius van Leewenhoek provides the firstdetailed description of nerve fibres
Augustus Waller describes the ‘ Wallerian’
Rudolph Kolliker identifies fibres and cells
Carl Weigert develops the first myelin stain
Santiago Ramón y Cajal proposes the neuron
Rene Descartes describes the reflex as a sensory-
Könegsberg Bridge from which originates the modern graph
James Sylvester introduces for the first time the
Viessens separates commissural fibres of thecorpus callosum from projection fibres of the
Joseph Gall identifies different cerebral gyri and
Paul Broca identifies an area for speech production
Carl Wernicke puts forward the first nerwork model
theory
2 M. Catani et al. / NeuroImage xxx (2013) xxx–xxx
Please cite this article as: Catani, M., et al., Connectomic approaches before the connectome, NeuroImage (2013), http://dx.doi.org/10.1016/j.neuroimage.2013.05.109
The ventricular model had a long lasting influence despite the fact thatobvious experimental evidence of its fallacy emerged during the Renais-sance. Leonardo da Vinci, for example, obtained a wax cast of the ventri-cles that was clearly against the classical representation of theventricular system (Pevsner, 2002). Similarly, Vesalius showed that theventricular anatomy described by Galen was questionable and its doc-trine did not fit with the evidence from dissections (Vesalius, 1543).From the sixteenth century the ventricular theory co-existed with anew spirit in science based on the experimental method (Galilei, 1638)and the renewed belief of an intimate relationship between anatomyand function (Catani, 2007; Catani and Thiebaut de Schotten, 2012).Post-mortem dissection became the primary method of investigation ofthe nervous system and this led to important anatomical discoveries,among them the distinction between the ‘cerebrum’ (i.e. grey matteror cortex) and the ‘medulla’ (i.e. whitematter) by Arcangelo Piccolominiin 1586:
I call the cerebrum [grey matter] that whole ashen-colored body,darkening from white, which very closely encompasses the medulla.The medulla is the whole of the white and more solid body, which isconcealed within the ashen-colored one. Thus the cerebrum differs andis distinguished from the medulla by color, because the cerebrum isashen-colored but themedulla is white; in consistency, because the cere-brum is softer and themedulla a little harder andmore compact; in loca-tion, because the medulla is in the middle of the cerebrumwhich whollycovers it over; also the ashen-colored body is distinguished from the
white by certain lines. The cerebrum commences everywhere by convo-lutions and extends as far as the corpus callosum...
This distinction has direct relevance to modern connectomicswhere hubs are located in the grey matter and connections in thewhite matter. This is particularly true for those approaches that useneuroimaging and electrophysiological methods to map whole brainnetworks at the macroscopic level.
The study of thewhitematter anatomyexpanded in the seventeenthcentury whenmany scientists recognised thatwhitematter contains fi-bres whose trajectories could be followed and described if specimenswere carefully prepared ‘using all the necessary precautions’ (Steno,1669):
…fibres must be disposed in the most artful manner, since all thediversity of our sensations and movements depend upon them. We ad-mire the contrivance of the fibres in each muscle, and ought still moreto admire their disposition in the brain, where confined in a very smallspace, each execute their particular officeswithout confusion or disorder.
From these anatomical studies a new view of the white matteremerged; no more a homogenous support structure around the ven-tricles, but rather a complex medium composed of tubular filamentsfor the passage of fluid between central cells and peripheral nerves(Descartes, 1662). These connecting filaments were found to origi-nate from the cortex (Malpighi, 1666), specialise in motor and
Table 2Milestones in the history of neuroscience in the 20th century.
1927
Walter Dandy introduces ventriculography
Egas Moniz develops cerebral angiography
1935 Joseph Klinger describes a new procedure to perform blunt dissections of white matter tracts
Walle Nauta and Paul Gygax develop a new staining method for degenerating axons1951
Intra-axonal tract tracing compounds aredeveloped (e.g. horseradish peroxidase and radiolabeled amino acids )
1960-70
1977
1979
complete connectomme of the C. elegans (302 neurons)
1986
Ernst Ruska develops the electron microscope1938
1952 Alan Hodgkin and Andrew Huxley publish a mathematical model for nerve excitation
1959 David Hubel and Torsten Wiesel describe oriented
1969-71David Marr and James Albus develop a neurobiological and computational theory of cerebellar function
1943mathematical model of a neural network
1946 Donald Hebb proposes a theory for synaptic plasticity and learning process
1946Felix Block and Edward Purcell independently describe the NMR phenomenon for liquid and solid
1907
1927
1918
MICROSCOPY ELECTROPHYSIOLOGY/COMPUTATIONAL NEUROANATOMY/NEUROIMAGING
automatic form of learning1903
1937sensory homunculus in man
1905
Korbinian Brodmann produces cyto-architectonic maps of the brain1909
Oskar and Cecile Vogt work on myelo-architectonic maps of the human frontal lobe1910
Constantin Economo and Georg Koskinas publish the most comprehensive cytoarchitectonic maps
1925
1901 Joseph Dejerine describes the topographic
1986 Jay McClelland and David Rumelhart apply parallel distributed processing theories to cognitive psychology and cognitive neuroscience
Eduardo Macagno, uses a serial electron microscopy to map an isolated neuron in the First Clinical MRI scanner
1950sscanners are developed
1973
1970s
1980
Jean Talairach and Pierre Tournoux publish the 1988
Seiji Ogawa describes the BOLD effect 1990
Denis Le Bihan applies Diffusion MRI to the living human brain
1985
1960s David Cohen develops MEG
Julius Bernstein advances the hypothesis that the action potential results from a change in the permeability of the axonal membrane to ions
1902
Peter Basser develops diffusion tensor imaging1994First in-vivo human diffusion tractography reconstructions
1999
Gabriella Ugolini introduces the use of viruses as transneuronal tracers1987
and visualize patterns of interpersonal relationships1933
1995 Rabies virus are used to study polysynaptic neural networks
1942staining.
1989Tim Berners-Lee develops a new hypertext system that runs across the internet, the world wide web
1998Duncan Watts and Steven Strogatz present a mathematical model to describe small world networks
1959 Mountcastle and Powell identify the columnar organization of the cortex
Alfred Campbell publishes the first map of thebrain divided into 17 cortical fields
Albert Coons proposes immunoflurescence
Hans Kuypers uses fluorescent axonal tracers
water flea
Electron microscopy is used to describe the first
Ivan Pavlov discovers the conditioned reflex as an
Luis Lapicque publishes a model of integrate-and-fireneurons suggesting a threshold for firing
Hans Berger records the first human EEG
Jacob Moreno presents the first sociogram as a tool to study
Wilder Penfield and Edwin Boldrev describe the motor and
Warren McCulloch and Walter Pitts propose the first
receptive fields in the cat's primary visual contex
distribution of fibres within the internal capsule
The first Positron Emission Tomography
Godfrey Hounsfield produces Computerised Tomography
Paul Lauterbur publishes the first NMR image
first atlas in a common space of reference
3M. Catani et al. / NeuroImage xxx (2013) xxx–xxx
Please cite this article as: Catani, M., et al., Connectomic approaches before the connectome, NeuroImage (2013), http://dx.doi.org/10.1016/j.neuroimage.2013.05.109
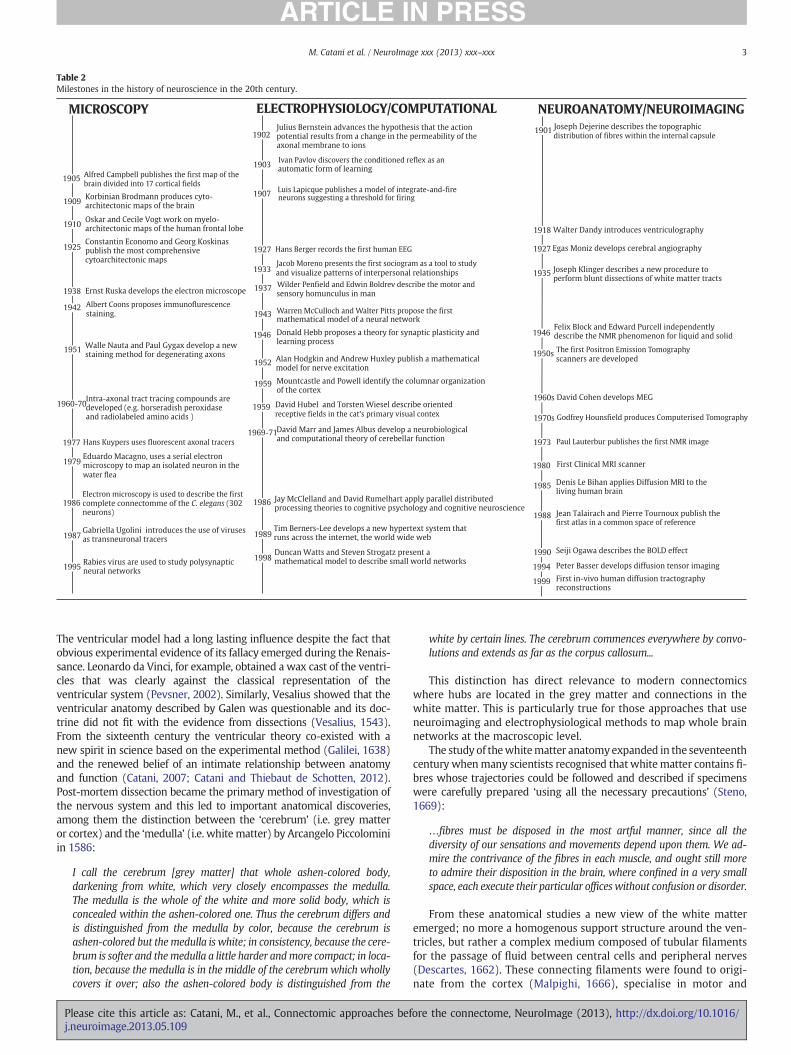
sensory functions (Willis, 1664), and coordinate a wide range of be-haviours, from simple reflex responses to cognition (Descartes,1664). Some of the maps of this period had little anatomical accuracy.The figure produced by Descartes to illustrate the complexity of whitematter connections, for example, was pictorial in its representation ofa philosophical concept rather than a faithful portrait of the real
anatomy (Fig. 2, left) (Descartes, 1664). Others produced images thathad the primary objective of displaying true anatomical findings(Fig. 2, right) (Vieussens, 1685). By now the concept of connectivitywas implicit in the idea of fibres and nerves.
Originally prompted by the ventricular theory, the study of thewhite matter pathways remained linked for a long time to a hydraulicphysiology of the brain. After all if, according to the ventricular theory,cogitation emerges from the flow and passage of fluid through hollowfibres, an exact description of these pathways could reveal the mecha-nisms of brain function. With the progressive accumulation of new an-atomical findings the ventricular theory evolved, with a shift fromcentral ventricular specialisation of function to a compartmentalisedsystem of individual gyri containing animal spirits (Willis, 1664):
But a no less important reason and necessity for the twistings [gyri] inthe brain arises from the distribution of the animal spirits. Since forthe various act of imagination and memory the animal spirits mustbe moved back and forth repeatedly within certain distinct limitsand through the same tracts or pathways, therefore numerous foldsand convolutions of the brain are required for these various arrange-ments of the animal spirits; that is, the appearance of perceptiblethings are stored in them, just as in various storerooms and ware-houses, and at given times can be called forth from them. Hence thesefolds or convolutions are far more numerous and larger in man thanin any other animal because of the variety and number of acts of thehigher faculties…
At the beginning of the nineteenth century brain maps of white mat-ter connections became gradually more refined with differentiation oftracts into callosal, projections and association pathways. Individual as-sociation tracts were also identified and their anatomy described in de-tail (Burdach, 1822; Reil, 1809, 1812). The convergence of anatomicaladvancements with the progressive ‘corticalisation of brain functions’culminated in Gall and Spurzheim's organology theory (Fig. 3). They be-lieved that the brain is theorgan of themind and itself ismade upofmul-tiple ‘organs’, to be identifiedwith the convolutions (Gall and Spurzheim,1810):
The convolutions, as far as they constitute an organ, receive their fi-bers from different regions… These fibres or fibre bundles have a con-stant and uniform direction, different however in each region; theyform their own expansions and their own convolutions; they develop
Fig. 2. The beginning of the modern study of white matter connections based on methods for fibre dissection. Left) Descartes' (1664) representation of the intricate system of whitematter passages in the human brain had little anatomical correspondence. Right) Vieussens (1684) used post-mortem dissections to identify white matter tracts and was the first toseparate the centrum ovale composed of projection fibres from the commissural fibres of the corpus callosum, in this figure partially removed in the midline.
Fig. 1. The ventricular system represented in a drawing dating from about 1310(reproduced from Clarke and Dewhurst, 1972). The five cells are named according totheir specialisation of function: the most anterior cells are the ‘sensus communis’ (e.g.common sense) and the ‘ymaginatio’ (e.g. visual sense) connected to the eyes throughthe optic nerves. Behind are the cell ‘estimativa’ and the cell ‘cogitativa’, the latterconnected to a fifth cell, the ‘vis memorativa’ located below the ‘vermis’ of the cerebel-lum. Cognitive processes result from the passage of ‘spirits’ from one cell to the other.Also note the hierarchical arrangement of the cells with the visual sense acting as amajor hub connected to three other cells and the eye, while the other cells are onlyconnected to either one or two cells.
4 M. Catani et al. / NeuroImage xxx (2013) xxx–xxx
Please cite this article as: Catani, M., et al., Connectomic approaches before the connectome, NeuroImage (2013), http://dx.doi.org/10.1016/j.neuroimage.2013.05.109
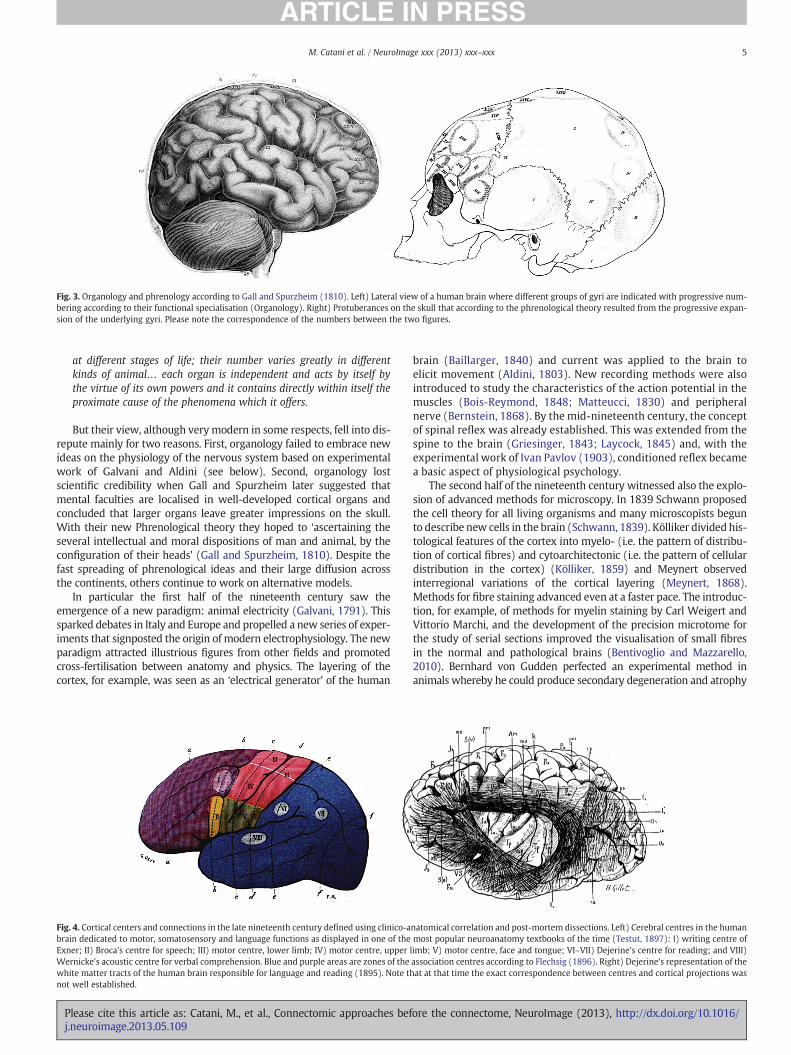
at different stages of life; their number varies greatly in differentkinds of animal… each organ is independent and acts by itself bythe virtue of its own powers and it contains directly within itself theproximate cause of the phenomena which it offers.
But their view, although verymodern in some respects, fell into dis-repute mainly for two reasons. First, organology failed to embrace newideas on the physiology of the nervous system based on experimentalwork of Galvani and Aldini (see below). Second, organology lostscientific credibility when Gall and Spurzheim later suggested thatmental faculties are localised in well-developed cortical organs andconcluded that larger organs leave greater impressions on the skull.With their new Phrenological theory they hoped to ‘ascertaining theseveral intellectual and moral dispositions of man and animal, by theconfiguration of their heads’ (Gall and Spurzheim, 1810). Despite thefast spreading of phrenological ideas and their large diffusion acrossthe continents, others continue to work on alternative models.
In particular the first half of the nineteenth century saw theemergence of a new paradigm: animal electricity (Galvani, 1791). Thissparked debates in Italy and Europe and propelled a new series of exper-iments that signposted the origin of modern electrophysiology. The newparadigm attracted illustrious figures from other fields and promotedcross-fertilisation between anatomy and physics. The layering of thecortex, for example, was seen as an ‘electrical generator’ of the human
brain (Baillarger, 1840) and current was applied to the brain toelicit movement (Aldini, 1803). New recording methods were alsointroduced to study the characteristics of the action potential in themuscles (Bois-Reymond, 1848; Matteucci, 1830) and peripheralnerve (Bernstein, 1868). By the mid-nineteenth century, the conceptof spinal reflex was already established. This was extended from thespine to the brain (Griesinger, 1843; Laycock, 1845) and, with theexperimental work of Ivan Pavlov (1903), conditioned reflex becamea basic aspect of physiological psychology.
The second half of the nineteenth century witnessed also the explo-sion of advanced methods for microscopy. In 1839 Schwann proposedthe cell theory for all living organisms and many microscopists begunto describe new cells in the brain (Schwann, 1839). Kölliker divided his-tological features of the cortex into myelo- (i.e. the pattern of distribu-tion of cortical fibres) and cytoarchitectonic (i.e. the pattern of cellulardistribution in the cortex) (Kölliker, 1859) and Meynert observedinterregional variations of the cortical layering (Meynert, 1868).Methods for fibre staining advanced even at a faster pace. The introduc-tion, for example, of methods for myelin staining by Carl Weigert andVittorio Marchi, and the development of the precision microtome forthe study of serial sections improved the visualisation of small fibresin the normal and pathological brains (Bentivoglio and Mazzarello,2010). Bernhard von Gudden perfected an experimental method inanimals whereby he could produce secondary degeneration and atrophy
Fig. 4. Cortical centers and connections in the late nineteenth century defined using clinico-anatomical correlation and post-mortem dissections. Left) Cerebral centres in the humanbrain dedicated to motor, somatosensory and language functions as displayed in one of the most popular neuroanatomy textbooks of the time (Testut, 1897): I) writing centre ofExner; II) Broca's centre for speech; III) motor centre, lower limb; IV) motor centre, upper limb; V) motor centre, face and tongue; VI–VII) Dejerine's centre for reading; and VIII)Wernicke's acoustic centre for verbal comprehension. Blue and purple areas are zones of the association centres according to Flechsig (1896). Right) Dejerine's representation of thewhite matter tracts of the human brain responsible for language and reading (1895). Note that at that time the exact correspondence between centres and cortical projections wasnot well established.
Fig. 3. Organology and phrenology according to Gall and Spurzheim (1810). Left) Lateral view of a human brain where different groups of gyri are indicated with progressive num-bering according to their functional specialisation (Organology). Right) Protuberances on the skull that according to the phrenological theory resulted from the progressive expan-sion of the underlying gyri. Please note the correspondence of the numbers between the two figures.
5M. Catani et al. / NeuroImage xxx (2013) xxx–xxx
Please cite this article as: Catani, M., et al., Connectomic approaches before the connectome, NeuroImage (2013), http://dx.doi.org/10.1016/j.neuroimage.2013.05.109
of the nerve nuclei and their connections by removing the peripheralsense organs, such as the eyes, ears, or various cranial nerves (vonGudden, 1870). Constantin vonMonakow an assistant of Gudden, contin-ued the work of his mentor on the thalamic and motor projection fibres(von Monakow, 1897). Following ‘extirpation’ of circumscribed areas ofthe cortex he was able to follow retrogradely the degenerating tract tothe thalamic nuclei and other subcortical nuclei. Von Monakow wasalso the first to draw attention to the effects of a lesion on other distantregions of the brain, a mechanism that he called diaschisis (vonMonakow, 1914). Paul Emile Flechsig studied the developing pathwayswith his myelogenetic method consisting of staining myelin in brainsof foetuses or newborns and mapping a chronological maturational
sequence of the white matter pathways in the human brain. Consideringthat the projection tracts are among the first to myelinate, he was ableto trace the origin and course of the corticospinal tract and describe forthe first time asymmetry in its crossing (i.e. decussation) at the level ofthe medulla (Flechsig, 1876). For many a true understanding of the ner-vous system was possible only through a precise depiction of its connec-tions (Dejerine andDejerine-Klumpke, 1895, 1901; vonBechterew, 1900).
At the same time clinicians begun to apply their neuroanatomical in-sights to patients (Catani et al., 2012a). The clinical–anatomical correla-tion method replaced phrenology and became a popular investigationto infer possible functional correlates of cortical areas (Bouillaud, 1825;Broca, 1861). Disorders of the nervous system were explained in terms
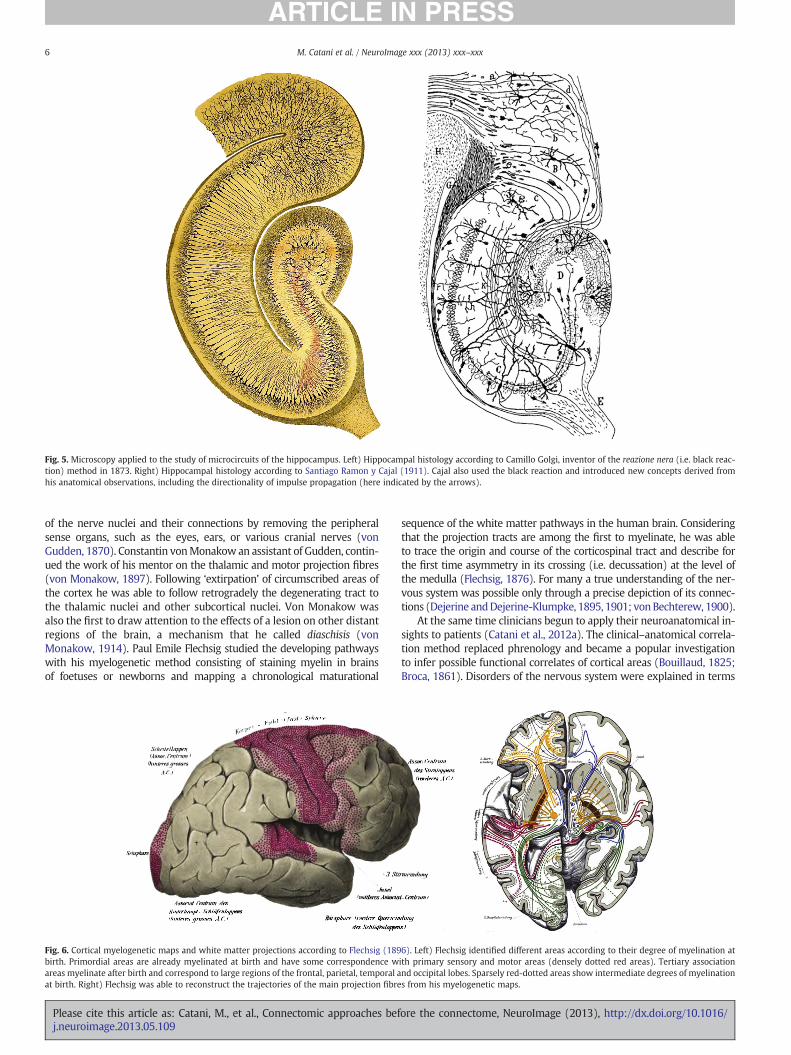
Fig. 5. Microscopy applied to the study of microcircuits of the hippocampus. Left) Hippocampal histology according to Camillo Golgi, inventor of the reazione nera (i.e. black reac-tion) method in 1873. Right) Hippocampal histology according to Santiago Ramon y Cajal (1911). Cajal also used the black reaction and introduced new concepts derived fromhis anatomical observations, including the directionality of impulse propagation (here indicated by the arrows).
Fig. 6. Cortical myelogenetic maps and white matter projections according to Flechsig (1896). Left) Flechsig identified different areas according to their degree of myelination atbirth. Primordial areas are already myelinated at birth and have some correspondence with primary sensory and motor areas (densely dotted red areas). Tertiary associationareas myelinate after birth and correspond to large regions of the frontal, parietal, temporal and occipital lobes. Sparsely red-dotted areas show intermediate degrees of myelinationat birth. Right) Flechsig was able to reconstruct the trajectories of the main projection fibres from his myelogenetic maps.
6 M. Catani et al. / NeuroImage xxx (2013) xxx–xxx
Please cite this article as: Catani, M., et al., Connectomic approaches before the connectome, NeuroImage (2013), http://dx.doi.org/10.1016/j.neuroimage.2013.05.109
of either cortical damage or disconnection syndromes (Fig. 4) (Dejerineand Dejerine-Klumpke, 1895, 1901). Behind these maps was the ideathat brain should be understood as a whole, a system of integrated andinterconnected areas. This approach required a good degree of approxi-mation, often resulting in a trivialised transposition of complex anatom-ical details into simplified diagrams (Catani and ffytche, 2005; Catani andMesulam, 2008).
Modern cartography (Table 2)
By the end of the nineteenth century two lines of investigationemerged from the field ofmicroscopy. The first important developmentwas the detailed description ofmicrocircuits (Fig. 5) (Golgi, 1873; Cajal,1893). Ramon y Cajal championed this approach and introduced impor-tant concepts in neurosciences, including a set of fundamental biologi-cal laws of neuronal organisation. He described, for example, how theshape of axons and dendrites are constrained bybiophysical parameterssuch as cytoplasmic volume, space and conduction time. He also intro-duced the law of dynamic polarisation that identifies dendrites andcell body as themain receiving structures of the action potential and ax-onal terminations as the main output. The existence of these laws en-abled him to formulate the neuron doctrine and to infer directionalityin signal flow between neurons (Cajal, 1911).
The second line of investigation attempted to produce whole-brainmaps based on the study of interregional variations of the cyto- andmyeloarchitecture of the cortex. The development of new stainingmethods combined with painstaking observations of large numbers ofbrain slices led to important landmark discoveries, including the identi-fication of primary and associative areas of the brain (Fig. 6) (Flechsig,
1896), delineation of maturational trajectories of the long white matterprojection tracts (Flechsig, 1896) and improved localisation of functionsand associated symptoms (Campbell, 1905; von EconomoandKoskinas,1925). However, cartographers differed among them in the ultimateobjective of their work and disputed on whether it could be possibleto understand brain function from their cortical maps. Two schools ofthought emerged.
For many, cortical maps were primarily anatomical divisions withoutany inference on function. Surprisingly, among them was KorbinianBrodmann who was clearly disdainful of any functional localisation inspecific cortical areas (Brodmann, 1909):
In reality there is only one psychic centre: the brain as a whole withall its organs activated for every complex psychic event, either all to-gether or most at the same time, and so widespread over the differentparts of the cortical surface that one can never justify any separatespecially differentiated ‘psychic’ centres within this whole.
Paradoxically, in contemporary cognitive neurosciences, Brodmann'smaps have become the lingua franca of cortical localisation — numbersused universally as shorthand for a precise cortical locus and, in somecortical fields, a precise functional role (Fig. 7). Brodmann's approachto clinico-anatomical correlation was shared by many other influentialfigures of his time and had long lasting consequences, especially in thefield of psychology. Those who insisted on approaching the brain func-tion from an anatomical point of view were disparagingly referred to asthe ‘diagram makers’ and localisation theory were given very little im-portance (Head, 1926; Lashley, 1950).
The second approach was based on the assumption that corticaldivisions derived from cytoarchitectonic or myeloarchitectonic could
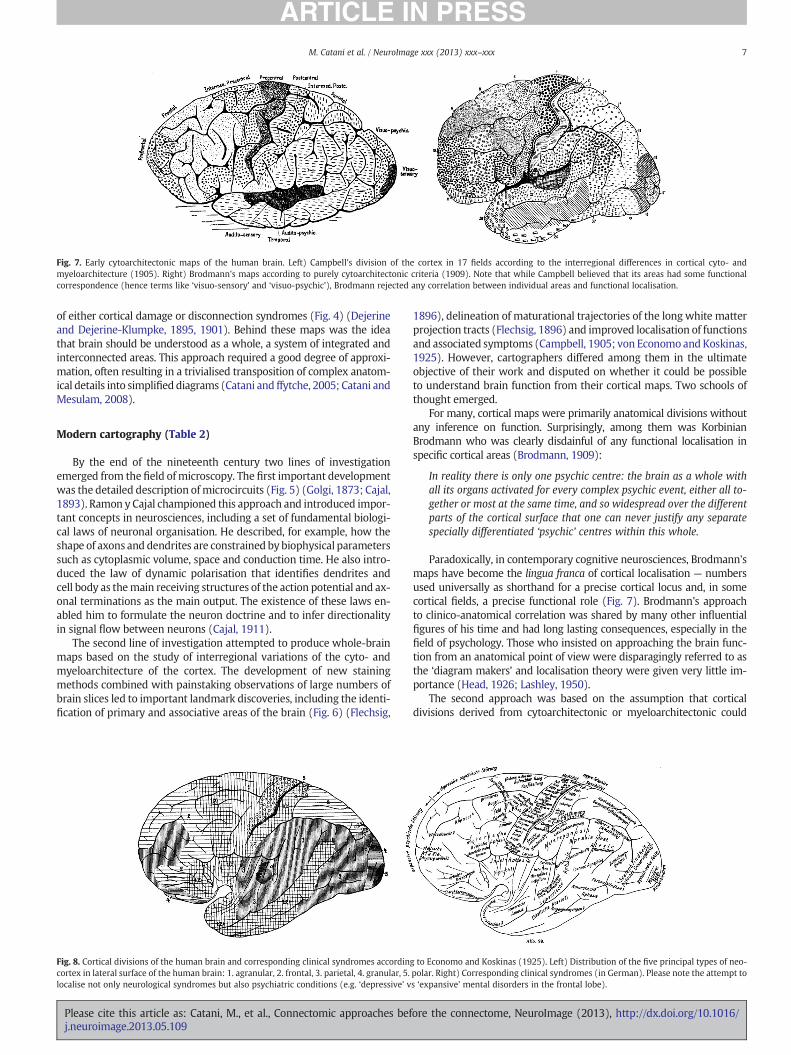
Fig. 7. Early cytoarchitectonic maps of the human brain. Left) Campbell's division of the cortex in 17 fields according to the interregional differences in cortical cyto- andmyeloarchitecture (1905). Right) Brodmann's maps according to purely cytoarchitectonic criteria (1909). Note that while Campbell believed that its areas had some functionalcorrespondence (hence terms like ‘visuo-sensory’ and ‘visuo-psychic’), Brodmann rejected any correlation between individual areas and functional localisation.
Fig. 8. Cortical divisions of the human brain and corresponding clinical syndromes according to Economo and Koskinas (1925). Left) Distribution of the five principal types of neo-cortex in lateral surface of the human brain: 1. agranular, 2. frontal, 3. parietal, 4. granular, 5. polar. Right) Corresponding clinical syndromes (in German). Please note the attempt tolocalise not only neurological syndromes but also psychiatric conditions (e.g. ‘depressive’ vs ‘expansive’ mental disorders in the frontal lobe).
7M. Catani et al. / NeuroImage xxx (2013) xxx–xxx
Please cite this article as: Catani, M., et al., Connectomic approaches before the connectome, NeuroImage (2013), http://dx.doi.org/10.1016/j.neuroimage.2013.05.109
reveal important functional divisions. This approach, pioneered byBaillarger, Meynert, Wernicke and many others, had as ultimate goalthe establishment of solid scientific bases for an anatomically-basedclassification of psychiatric disorders (Baillarger, 1840; Meynert, 1868;Wernicke, 1906). The work of these psychiatrists had a great influ-ence on future generations. In Germany Paul Flechsig developed amethod for staining myelinated fibres and was able to distinguishareas according to the order of myelination during the perinataldevelopment (Fig. 6). In England, Alfred Campbell combined cyto-and myeloarchitectonic observations with histological studies ofpatients with various disorders to produce a map of distinctive corti-cal fields in the brain of Homo sapiens and other primate species(Fig. 7) (Campbell, 1905). Campbell's monographwas amonumentalachievement for several reasons, the most important being the empha-sis given to function. Campbell's project went beyond cytoarchitectoniccartography, attempting to integrate clinical, anatomical, and physio-logical evidence to provide a guide to function (ffytche and Catani,2005). Indeed, Campbell's 17 cortical fields are labelled not by numbersbut by function (e.g. ‘visuo-sensory’, ‘audito-psychic’, ‘olfactory’, ‘pre-central motor’, and ‘post-central somatosensory’).
The era of cortical mapping culminated with the work of Cecile andOskar Vogt and EconomoandKoskinas. By studying the variation of cor-tical myeloarchitectonic, the Vogt's tandem identified more than 200areas, many of which represent subdivisions of the cytoarchitectonicareas of Brodmann (Vogt and Vogt, 1926). Despite working four-handedly on the project and relying on the help of other assistants,they never finished their monumental project and their anatomicalendeavourhas remained incomplete formost of the temporal andoccipitalcortex (Nieuwenhuys, 2013). In 1925 EconomoandKoskinas succeeded inpublishing a prodigious atlas containing the cytoarchitectonic analysis of107 cortical areas, for each of which quantitative measurements wererecorded for variations in cortical thickness and volume, form, size,
number of cells, their density, grouping in stripes and layers (Fig. 8).The atlas is a monumental work, which, despite being considered bymany the definitive text on cortical cartography, never met the favourof the scientific community. This is probably in part due to its encyclo-paedic proportions, the lack of clear boundaries between some of thesmallest areas and possibly the general feeling against the ‘crazy paving’school of cortical research, which peaked shortly after (Le Gros Clark,1952).
By the mid-twentieth century the combination of histologicalmethods with neurophysiological techniques applied to the animalbrain provided cortical architecture with a precise functional meaning.This approach, as exemplified in the work of Mountcastle and Powell(1959) on the somatosensory cortex of the monkey and of Hubel andWiesel (1962) on the visual cortex of the cat, was based on the use ofsingle- or multi-unit recording, axonal tracing by means of microlesionor dye injection and combined with the cytoarchitectural description ofsections later cut from the same brain. Key principles of cellular organi-sation and neuronal physiology were discovered, such as columnar or-ganisation of the cortex and oriented receptor fields. At the same timethe use of disconnection procedures in the monkey, combined with be-havioural studies, intracortical recording, and axonal tracing revitaliseda network approach to brain functions (Fig. 9) (Mishkin, 1966). Newmethods became available for the identification of single axons andtheir exact cortical projection and termination (Fink and Heimer,1967; Nauta and Gygax, 1951). By the end of 1960s novel powerfultracers were developed based on the active transport of proteins andother elements along the axonal fibres. Thesemethods require injectionof tract tracers into a predetermined cortical or subcortical region of thenervous system. Once injected, the tracers enter the neuron and aretransported from the body of the neuron to its terminations (i.e. anter-ograde direction) or in the opposite direction (i.e. retrograde direction)(Morecraft et al., 2009). Tracer compounds would differ for their ability
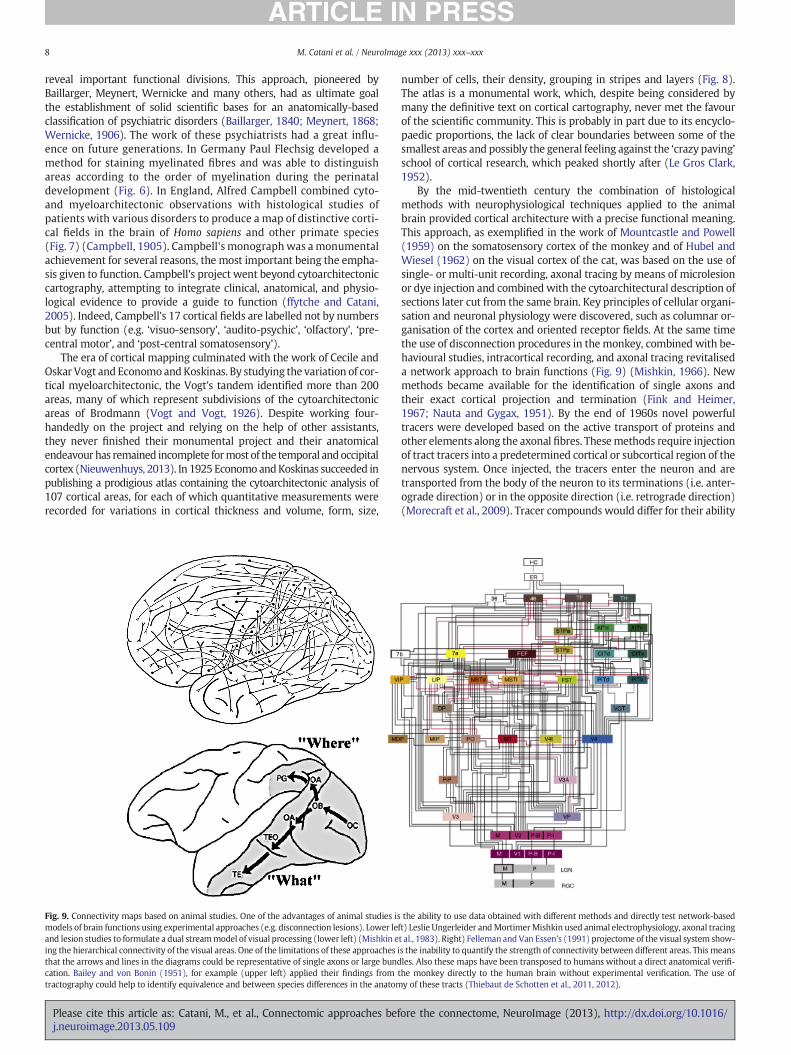
Fig. 9. Connectivity maps based on animal studies. One of the advantages of animal studies is the ability to use data obtained with different methods and directly test network-basedmodels of brain functions using experimental approaches (e.g. disconnection lesions). Lower left) Leslie Ungerleider andMortimerMishkin used animal electrophysiology, axonal tracingand lesion studies to formulate a dual streammodel of visual processing (lower left) (Mishkin et al., 1983). Right) Felleman and Van Essen's (1991) projectome of the visual system show-ing the hierarchical connectivity of the visual areas. One of the limitations of these approaches is the inability to quantify the strength of connectivity between different areas. This meansthat the arrows and lines in the diagrams could be representative of single axons or large bundles. Also these maps have been transposed to humans without a direct anatomical verifi-cation. Bailey and von Bonin (1951), for example (upper left) applied their findings from the monkey directly to the human brain without experimental verification. The use oftractography could help to identify equivalence and between species differences in the anatomy of these tracts (Thiebaut de Schotten et al., 2011, 2012).
8 M. Catani et al. / NeuroImage xxx (2013) xxx–xxx
Please cite this article as: Catani, M., et al., Connectomic approaches before the connectome, NeuroImage (2013), http://dx.doi.org/10.1016/j.neuroimage.2013.05.109
to follow a predominantly anterograde or retrograde direction althoughmost classical tracers are bidirectional (Glover et al., 1986; Kuypers etal., 1977; Mesulam, 1982). The field evolved further with methodsthat combined different tracers (e.g. several conventional compoundsor conventional with viral transneuronal tracers) and multiple sites ofinjection (Morecraft et al., 2009). These methods led to a greaterunderstanding of the main features of many cortico-cortical andcortico-subcortical pathways, such as feedback and forward organisa-tion, hierarchical arrangement, and parallel organisation (Fellemanand Van Essen, 1991;Mesulam, 1998). They also provided solid founda-tions for computational approaches to brain function. One limitation ofthese approaches to connectivity is the general assumption that find-ings from animals can be directly translated to humans. This viewmay be valid for sensory and motor functions but there is some doubtthat it may hold true for other aspects of cognition such as language.
Post-mortemmethods for corticalmapping of the human brain havealso evolved significantly in the last two decades. Karl Zilles and collab-orators, for example, have developed a number of methods for auto-matic cytoarchitectonic and receptor mapping of post-mortem humanbrains (Zilles and Amunts, 2009). The advantage of these maps is thatthey are provided within a standard template of reference and can beused to guide, complement and integrate other in vivo imagingmethods (Caspers et al., this issue).
In contemporary neuroscience neuroimagingmethods have inaugu-rated a new era in the study of functional and anatomical connectivityin the living human brain. Although manymethods are still in develop-ment and their use is limited, especially in the clinical settings, someprinciples of brain function are emerging from their application tolarge population of subjects. PET and fMRI studies for example, showedthe existence of a ‘default mode network’ consisting a group of medialand lateral regions that is active during the ‘resting state’, a conditionin which the majority of the subjects engage in an introspective,self-directed stream of thought (i.e. similar to daydreaming) (Raichleet al., 2001; Raichle and Snyder, 2007). A synchronous deactivation ofthe default network areas is observed in the transition between the ‘rest-ing state’ and the execution of goal directed tasks, including workingmemory, focusing attention to sensorially driven activities, understand-ing other people's intention (mentalising or theory ofmind), prospectivethinking (envisioning the future) and memory for personal events(autobiographic memory) (Raichle and Snyder, 2007). Alteration of thedefault network activation has been reported in functional imagingstudies of patients with neuropsychiatric disorders, such as autism andschizophrenia (Broyd et al., 2009).
Another significant contribution from neuroimaging is the possibil-ity of measuring cortical thickness in healthy subjects and patientswith neurological and psychiatric disorders. The use of this method onpatients with progressive loss of language due to a primary neurode-generative disorder (i.e. Primary Progressive Aphasia), for example,has significantly contributed to expand the classical model of languagenetworks based on stroke studies to regions of the anterior temporallobe and medial frontal cortex (Rogalski et al., 2011). Similarlytractography studies based on diffusion tensor imaging and sphericaldeconvolution are revealing the existence of novel tracts underlyingfrontal lobe functions (Catani et al., 2012b) and language (Cataniet al., 2005; Catani et al., in press). A fundamental contribution of con-temporary neuroimaging is related to the description of interindividualdifferences in brain connectivity and the possibility of quantifyingparameters that give indirect measurements of the functional and ana-tomical strength of connections between regions (Catani et al., 2007;Thiebaut de Schotten et al., 2011). The above examples are indicativeof the far reaching potential of neuroimaging methods and their abilityto give answers to questions that were not possible to address before.With the introduction of the concept of a brain ‘connectome’ the fieldmoved a step farther (Sporns et al., 2005; Hagmann et al., 2007). Herethe ambition is to define the overall structural and functional brain ar-chitecture to understand how anatomical networks influence neuronal
dynamics (Sporns, 2013). A popular approach uses network analysisframeworks based on graph theory (Fornito et al., 2013; Hagmann etal., 2010). This special issue is entirely dedicated to neuroimagingmethods for mapping the connectome and we refer to other papersfor an in depth illustration of the advantages and limitations of thisapproach.
However, it is important to bear in mind that neuroimaging is onlyone of many methods for mapping the connectome and an importantdistinction should be made between those approaches that adoptneuroimaging for mapping whole brain networks and other methodsthat characterise the most detailed features of microconnections usingadvanced microscopy technology (Lichtman and Denk, 2011; Seung,2012; Sporns, 2011). Clearly for the two approaches the suffix -omerefers to different concepts, one related to the totality of the brain (i.e.the ‘connectome’ as a map of the entire brain connections), the otherto the totality of all its constituents (the ‘connectome’ as the most de-tailed description of the elements that form neuronal connections).Hence, the first approach provides a global overview (whole-brain) ofthe principal brain networks at a macroscopic level (i.e. large-scale con-nections or bundles), the second aspires to themost detailed descriptionof local networks at a micro- and nano-scale (e.g. single axons and den-drites). While the first approach can only be achieved through data re-duction and oversimplification (i.e. connectome as a metaphor), thesecond may never realise for the entire brain (i.e. connectome as amyth). In the last paragraph we argue that the two approaches couldconverge at the mesoscale level, at least for post-mortem studies in thenear future and perhaps in vivo in the long term.
Contemporary and future connectomes between macroscopicmetaphors and microscopic myths
Current approaches to brain mapping result from the coalescenceof fast paced advancements in computing (data processing and stor-age, software development, etc.), quantitative and statistical neuro-psychological testing, MRI capability (higher resolutions, plethora ofsequences for structural and functional imaging) and computationaltheories (Lichtman and Denk, 2011; Seung, 2012; Sporns, 2011;Dell'Acqua and Catani 2012). In post-mortem brains the use of auto-mated histological analysis combined with transmitter receptordistribution and microarray profiling is beginning to delineate anew landscape of human cartography where multiple information isavailable for each area (e.g. cytoarchitectonic, receptor and geneexpression) (Hawrylycz et al., 2012; Zilles and Amunts, 2009). Thisinformation can be applied to in vivo imaging using atlas-basedapproaches and correlated with differences in functional activity, dif-fusion connectivity and behaviour. This could lead for the first time tomultimodal brain maps that define interindividual variability amongthe general population and help in understanding not only neuralmechanisms of normal cognition, but also identify vulnerable connec-tivity patterns in those at risk for mental illness, and predict treat-ment response and recovery after injury (Bullmore and Sporns,2009; Jbabdi et al., 2007; Stephan et al., 2009).
Nevertheless, contemporary approaches based on brain imaging arenot without limitations. One risk of contemporary connectomemaps isto divert from the real functional anatomy of the brain and to follow in-stead a path of their own as it happened before in other disciplines. Thefield of artificial neural networks, for example, just after McCulloch andPitts proposed the first mathematical model for a neural network in1943, quickly evolved into statistical and pattern recognition tools farremoved from the action of complex neurophysiological mechanismssubserving their biological counterparts (Rosenblatt, 1958). In thecase of the connectome there are several factors that may contributeto a similar outcome. Mapping methods, for example, are typicallybased on data acquired at low resolution (a fewmillimeters)with severaldistortions due to high background noise and field dishomogeneity.Signal derived from the MRI scans reflects an average information,
9M. Catani et al. / NeuroImage xxx (2013) xxx–xxx
Please cite this article as: Catani, M., et al., Connectomic approaches before the connectome, NeuroImage (2013), http://dx.doi.org/10.1016/j.neuroimage.2013.05.109
which derives from the combination of complex biological features of theunderlying tissue, thus making any interpretation of the resultsunspecific and often speculative. Further the number of passages relatedto the data processing introduces artifacts and distortions that aredifficult to distinguish from the real structural and functional anatomy.This is particularly true for connectomes based on diffusion imagingwhere the limitations of both the tensor model and more advancedmethods (e.g. Diffusion Spectrum Imaging and High Angular ResolutionDiffusion Imaging) (Dell'Acqua et al., 2010; Dell'Acqua et al., in press-a;Descoteaux et al., 2009; Tournier et al., 2007; Wedeen et al., 2012) mayproduce connectivity maps that do not reflect the real underlying anato-my (Catani et al., 2012c; Hagmann et al., 2010; Jones et al., 2013;Wedeenet al., 2012).
With diffusion datasets acquired at higher spatial resolution (cur-rently ~1mm) some of these limitations may reduce. In post-mortemsamples even higher resolutions can be obtained (Kleinnijenhuis etal., 2012; Leuze et al., 2013; McNab et al., 2009) with the advantageof direct validation with histology of tractography reconstructions(Takahashi et al., 2013; Dell'Acqua et al., in press-b).
Another risk is that the language used today in contemporary map-ping and analysis techniques can be ambiguous at times as it uses a ter-minology that alludes to anatomical properties when in fact it reflectsonly features of the derived maps or graphs. Thus, a distance betweentwo nodes in a network described using graph theory is not equivalentto the axonal length between the neurons that constitute those nodesbut is the minimum number of steps required to connect the twonodes, regardless of their physical distances (Bullmore and Sporns,2009; Fornito et al., 2013). Similarly, the average length of streamlinesin tractography is not equivalent to the average length of the connectingtracts. Moreover, many apparently functional properties of the neuro-imaging networks (e.g. connectivity, synchrony, etc.) are mathematicaland statistical concepts rather than physiological. Therefore, concludingthat the brains of certain groups of patients have reduced connectivitybecause of the reduced fMRI co-activation or shorter length of theirtractography streamlines calculated from DTI scans could be incorrect.
Today we are certainly in a better position to effectively integratedifferent neuroimaging modalities and complement structural andfunctional findings. There is, however, an inevitable tension in contem-porarymapmaking between the desire to cram inmore andmore infor-mation and the need to keep things clear. This happened before in thehistory of neuroscience and history tends to repeat itself. Our currentconnectomes too often reflect a distorted image of the real architectureof the brain andwe tend to see in our connectomes patterns of neuronalorganisation that may just represent a biased view of the real anatomy.Here again validation is paramount (Mesulam, 2012) perhaps not onlyusing post-mortem approaches but also in vivo studies in animalmodels (Lee et al., 2012).
At the microscopic level the use of advanced imaging methodsbased on fluorescent protein staining, electron microscopy andsuper-resolution light microscopy provides more confidence for theinterpretation of the connectome results (Lichtman and Sanes,2008; Denk et al., 2012). Here the problem is of a different natureand mainly related to its gargantuan scale. The realisation of the com-plete connectome of the 302 neurons and 5000 synapses that formthe nervous system of the Caenorhabditis elegans (White et al., 1986)was certainly an encouraging result that gave hope for similar achieve-ments in larger brains. Completing the connectome of the Drosophilacould also represent a significant leap forward in the phylogeny scale.When we deal with the human brain the problem is related not onlyto the 86 billion neurons and 100 trillion synapses that form our net-works but to the ever changing anatomy of its constituents. Wheneverwe engage in an action or thought we reshape our connectome byforming new synapses and pruning neuronal dendritic trees. In otherwords wewake upwith one connectome and go to bedwith a differentone. Even reading this paper could have an impact on the anatomy ofthe reader's connectome. It is this dynamic nature of our connectomes
that holds the key to the real working of the brain and only aconnectome map ‘of the brain in action’ will capture the anatomical,electrophysiological and computational elements of those networksthat characterise human cognition and behaviour. Although this mayseem a distant point, at the time of the submission of this paper a reportpublished in NatureMethods reawakened our optimism. Researchers atthe Howard Hughes Medical Institute's Janelia Farm Research Campusin Ashburn, Virginia have been able to record activity across awhole lar-val fish brain, detecting 80% of its 100,000 neurons (Ahrens and Keller,2013). The imaging system relies on a genetically engineered zebrafishwhose neurons make a protein that fluoresces in response to fluctua-tions in the concentration of calcium ions, which occur when nervecells fire. A system composed of a microscope and detectors records ac-tivity from the full brain. The neurons are visible thanks to the transpar-ency of almost the entire non-neuronal tissue of the zebrafish.Potentially this system could show the dynamics throughout thenervous system while the zebrafish engages in different behavioursand during learning paradigms. Certainly the journey from here to ap-plication of similarmethods in the human brain (perhapswith high res-olution functional diffusion imaging) is a long one in the history tocome. In the meantime setting up combined imaging and post-mortem histology studies of the white matter, perhaps using cutting-edge methods for network analysis at the axonal level (e.g. PolarisedLight Imaging or Clarity) (Axer et al., 2011; Chung et al., 2013) couldhelp us to validate our current structural methods and move more se-cure steps on the steep ascent of the connectome science.
Acknowledgments
We would like to thank Richard Joules, Stefano Sandrone and theother members of the NatBrainLab (http://www.natbrainlab.com)for their helpful advice on the manuscript. This work was supportedby Guy's and St Thomas Charity and the NIHR Biomedical ResearchCentre for Mental Health at the South London and Maudsley NHSFoundation Trust.
References
Ahrens, M.B., Keller, P.J., 2013. Whole-brain functional imaging at cellular resolutionusing light-sheet microscopy. Nat. Methods 10, 413–420.
Aldini, G., 1803. An Account of the Late Improvements in Galvanism …: To which isAdded, an Appendix, Containing … Experiments on the Body of a Malefactor.Cuthell & Martin.
Axer, M., Amunts, K., Grässel, D., Palm, C., Dammers, J., Axer, H., Pietrzyk, U., Zilles, K.,2011. A novel approach to the human connectome: ultra-high resolution mappingof fiber tracts in the brain. Neuroimage 54, 1091–1101.
Bailey, P., von Bonin, G., 1951. The Isocortex of Man. University of Illinois Press, Urbana.Baillarger, J.G.F., 1840. Recherches sur la structure de la couche corticale des
circonvolutions du cerveau. J.-B. Baillière.von Bechterew, W., 1900. Les voies de conduction du cerveau et de la moelle. Storck
and Doin.Bentivoglio, M., Mazzarello, P., 2010. The anatomical foundations of clinical neurology.
In: Finger, S., Boller, F., Tyler, K.L. (Eds.), Handbook of Clinical Neurology, vol. 95,pp. 149–168 (3rd series).
Bernstein, J., 1868. Ueber den zeitlichen Verlauf der negativen Schwankung desNervenstroms. Pflugers Arch. 1, 173–207.
Bois-Reymond, E.H.D., 1848. Untersuchungen über thierische elektricität. G. Reimer.Bouillaud, J., 1825. Traité clinique et physiologique de l'encéphalite. J.B. Baillière, Paris.Broca, P., 1861. Nouvelle observation d'aphémie produite par une lesion de la partie
postérieure des deuxième et troisième circonvolutions frontales. Bull. Soc. Anat.Paris 36, 398–407.
Brodmann, K., 1909. Vergleichende Localisationslehre der Grosshirnrinde in ihrenPrinzipien dargestellt auf Grund des Zellenbaues. Barth, Leipzig.
Broyd, S.J., Demanuele, C., Debener, S., Helps, S.K., James, C.J., Sonuga-Barke, E.J.S., 2009.Default-mode brain dysfunction in mental disorders: a systematic review. Neurosci.Biobehav. Rev. 33, 279–296.
Bullmore, E., Sporns, O., 2009. Complex brain networks: graph theoretical analysis ofstructural and functional systems. Nat. Rev. Neurosci. 10, 186–198.
Burdach, K., 1822. Vom Baue und Leben des Gehirns. In der Dyk'schen Buchhandlung,Leipzig.
Cajal, S.R. y, 1893. Manual de histología normal y técnica micrográfica. Libreria dePascual Aguilar.
Cajal, S., 1911. Histologie du Systeme nerveux. A. Maloine, Paris.Campbell, A.W., 1905. Histological Studies on the Localisation of Cerebral Function.
University Press.
10 M. Catani et al. / NeuroImage xxx (2013) xxx–xxx
Please cite this article as: Catani, M., et al., Connectomic approaches before the connectome, NeuroImage (2013), http://dx.doi.org/10.1016/j.neuroimage.2013.05.109
Caspers, S., Eickhoff, S.B., Zilles, K., Amunts, K., 2013. Microstructural grey matterparcellation and its relevance for connectome analyses. Neuroimage (S1053-8119(13)00319-4) (this issue).
Catani, M., 2007. From hodology to function. Brain 130, 602–605.Catani, M., ffytche, D.H., 2005. The rises and falls of disconnection syndromes. Brain
128, 2224–2239.Catani, M., Mesulam, M.M., 2008. The arcuate fasciculus and the disconnection theme
in language and aphasia: history and current state. Cortex 44, 953–961.Catani, M., Thiebaut de Schotten, M., 2012. Atlas of Human Brain Connections. Oxford
University Press, Oxford.Catani, M., Allin, P.G.A., Husain, M., Pugliese, L., Mesulam, M.M., Murray, R.M., Jones,
D.K., 2007. Symmetries in human brain pathways predict verbal recall. Proc. Natl.Acad. Sci. U. S. A. 104, 17163–17168.
Catani, M., Jones, D.K., ffytche, D.H., 2005. Perisylvian language networks of the humanbrain. Ann. Neurol. 57, 8–16.
Catani, M., Dell'acqua, F., Bizzi, A., Forkel, S.J., Williams, S.C., Simmons, A., Murphy, D.G.,Thiebaut de Schotten, M., 2012a. Beyond cortical localization in clinico-anatomicalcorrelation. Cortex 48, 1262–1287.
Catani, M., Dell'acqua, F., Vergani, F., Malik, F., Hodge, H., Roy, P., Valabregue, R.,Thiebaut de Schotten, M., 2012b. Short frontal lobe connections of the humanbrain. Cortex 48, 273–291.
Catani, M., Bodi, I., Dell'Acqua, F., 2012c. Comment on “The geometric structure of thebrain fiber pathways”. Science 337, 1605.
Catani, M., Mesulam, M., Jakobsen, E., et al., 2013. A novel frontal pathway underliesverbal fluency in primary progressive aphasia. Brain (in press).
Chung, K., Wallace, J., Kim, S.Y., Kalyanasundaram, S., Andalman, A.S., Davidson, T.J., etal., 2013. Structural and molecular interrogation of intact biological systems. Na-ture 497 (7449), 332–337.
Clarke, E., Dewhurst, K., 1972. An Illustrated History of Brain Function. SandfordPublications.
Clarke, E., Jacyna, L.S., 1987. Nineteenth-century Origins of Neuroscientific Concepts.Diane Pub Co.
Clarke, E., O'Malley, C.D., 1996. The Human Brain and Spinal Cord: A Historical StudyIllustrated by Writings from Antiquity to the 20th Century. Norman Publishing.
Déjerine, J.J., Dejerine-Klumpke, A., 1895. Anatomie des centres nerveux, vol. 1. Rueff etCie, Paris.
Déjerine, J.J., Dejerine-Klumpke, A., 1901. Anatomie des centres nerveux, vol. 2. Rueff etCie, Paris.
Dell'Acqua, F., Catani, M., 2012. Structural human brain networks: hot topics in diffu-sion tractography. Curr. Opin. Neurol. 25, 375–383.
Dell'Acqua, F., Scifo, P., Rizzo, G., Catani, M., Simmons, A., Scotti, G., Fazio, F., 2010. Amodified damped Richardson-Lucy algorithm to reduce isotropic background ef-fects in spherical deconvolution. Neuroimage 49, 1446–1458.
Dell'Acqua, F., Simmons, A., Williams, S.C., Catani, M., 2013a. Can spherical deconvolutionprovide more information than fiber orientations? Hindrance modulated orienta-tional anisotropy, a true-tract specific index to characterize white matter diffusion.Hum. Brain Mapp. http://dx.doi.org/10.1002/hbm.22080 (in press) (Apr 5, Electronicpublication ahead of print).
Dell'Acqua, F., Bodi, I., Slater, D., Catani, M., Modo, M., 2013b. MR diffusion-based his-tology and micro-tractography reveal mesoscale features of the human cerebel-lum. Cerebellum. http://dx.doi.org/10.1007/s12311-013-0503-x (in press).
Denk, W., Briggman, K.L., Helmstaedter, M., 2012. Structural neurobiology: missing linkto a mechanistic understanding of neural computation. Nat. Rev. Neurosci. 13,351–358.
Descartes, R., 1664. L'Homme de René Descartes et un Traité de la formation du fœtus.Charles Angot, Paris.
Descartes, R., 1662. De homine. apud Franciscum Moyardum & Petrum Leffen.Descoteaux, M., Deriche, R., Knösche, T.R., Anwander, A., 2009. Deterministic and prob-
abilistic tractography based on complex fibre orientation distributions. IEEE Trans.Med. Imaging 28, 269–286.
Economo, C.F., Koskinas, G.N., 1925. Die Cytoarchitektonik der Hirnrinde des erwachsenenMenschen. J. Springer.
Egerstedt, M., 2011. Complex networks: degrees of control. Nature 473, 158–159.Felleman, D.J., Van Essen, D.C., 1991. Distributed hierarchical processing in the primate
cerebral cortex. Cereb. Cortex 1, 1–47.ffytche, D.H., Catani, M., 2005. Beyond localization: from hodology to function. Philos.
Trans. R. Soc. Lond. B. Biol. Sci. 360, 767–779.Fink, R.P., Heimer, L., 1967. Twomethods for selective silver impregnation of degenerating
axons and their synaptic endings in the central nervous system. Brain Res. 4, 369–374.Flechsig, P.E., 1876. Die Leitungsbahnen im Gehirn und Rückenmark des Menschen auf
Grund entwicklungsgeschichtlicher Untersuchungen. Engelmann, Leipzig.Flechsig, P.E., 1896. Gehirn und seele. Verlag von Veit & Comp, Leipzig.Fornito, A., Zalesky, A., Breakspear, M., 2013. Graph analysis of the human connectome:
promise, progress, and pitfalls. Neuroimage (this issue).Galilei, G., 1638. Discorsi e dimostrazioni matematiche: intorno a due nuove scienze,
attenenti alla mecanica e i movimenti locali … Con una appendice del centro digravità d'alcuni solidi. Appresso gli Elsevirii.
Gall, F., Spurzheim, G., 1810. Anatomie et physiologie du système nerveux en général etsur celui du cerveau en particulier. Schoell, Paris.
Galvani, L., 1791. De viribus electricitatis in motu musculari: Commentarius.Glover, J.C., Petursdottir, G., Jansen, J.K., 1986. Fluorescent dextran-amines used as axonal
tracers in the nervous system of the chicken embryo. J. Neurosci. Methods 18, 243–254.Golgi, C., 1873. Sulla struttura della sostanza grigia del cervello. Gazz. Med. Ital. (Lomb.)
33, 244–246.Griesinger, W., 1843. Über psychische Reflexaktionen. Mit einem Blick auf das Wesen
der psychischen Krankheiten. Arch. Physiol. Heilk. 2, 76–113.
Gudden, B.A., 1870. Experimentaluntersuchungen bei das peripherischer und centraleNervensystem. Arch. Psychiatr. Nervenkr. 2, 693–723.
Hagmann, P., et al., 2007.Mapping humanwhole-brain structural networkswith diffusionMRI. PLoS One 2 (7), e597.
Hagmann, P., et al., 2010. MR connectomics: principles and challenges. J. Neurosci.Methods 194, 34–45.
Hawrylycz, M.J., Lein, E.S., Guillozet-Bongaarts, A.L., Shen, E.H., Ng, L., Miller, J.A., et al.,2012. An anatomically comprehensive atlas of the adult human brain transcriptome.Nature 489, 391–399.
Head, H., 1926. Aphasia and Kindred Disorders of Speech. The University Press.Hubel, D.H., Wiesel, T.N., 1962. Receptive fields, binocular interaction and functional
architecture in the cat's visual cortex. J. Physiol. (Lond.) 160, 106–154.Jbabdi, S., Woolrich, M.W., Andersson, J.L., Behrens, T.E., et al., 2007. A Bayesian frame-
work for global tractography. Neuroimage 37 (1), 116–129.Jones, D.K., Knösche, T.R., Turner, R., 2013. White matter integrity, fiber count,
and other fallacies: the do's and don'ts of diffusion MRI. Neuroimage 73,239–254.
Kleinnijenhuis, M., Zerbi, V., Küsters, B., Slump, C.H., Barth, M., van Cappellen vanWalsum, A.M., 2012. Layer-specific diffusion weighted imaging in human primaryvisual cortex in vitro. Cortex (doi:pii: S0010-9452(12)00334-6) (this issue).
Kölliker, A., 1859. Handbuch der Gewebelehre des Menschen. Wilhelm Engelmann.Kuypers, H.G., Catsman-Berrevoets, C.E., Padt, R.E., 1977. Retrograde anoxal transport
of fluorescent substances in the rat's forebrain. Neurosci. Lett. 6 (2–3), 127–133.Lashley, K.S., 1950. In search of the engram. Symp. Soc. Exp. Biol. 4, 454–482.Laycock, T., 1845. On the reflex function of the brain. BFMR 19, 298–311.Le Gros Clark, W.E., 1952. A note on cortical cyto-architectonics. Brain 75, 96–104.Lee, H.J., Yoo, S.J., Lee, S., Song, H.J., Huh, M.I., Jin, S.U., Lee, K.Y., Lee, J., Cho, J.H., Chang,
Y., 2012. Functional activity mapping of rat auditory pathway after intratympanicmanganese administration. Neuroimage 60, 1046–1054.
Leuze, C.W., Anwander, A., Bazin, P.L., Dhital, B., Stüber, C., Reimann, K., Geyer, S., Turner,R., 2013. Layer-specific intracortical connectivity revealed with diffusion MRI. Cereb.Cortex (in press).
Lichtman, J.W., Denk, W., 2011. The big and the small: challenges of imaging the brain'scircuits. Science 334, 618–623.
Lichtman, J.W., Sanes, J.R., 2008. Ome sweet ome: what can the genome tell us aboutthe connectome? Curr. Opin. Neurobiol. 18, 346–353.
Malpighi, M., 1666. De cerebri cortice. Montius, Bologna.Matteucci, C., 1830. Sulla contrazione provata dagli animali all'aprirsi del circolo
elettrico in che trovansi. Casali, Forlì, Italy.McCulloch, W.S., Pitts, W.H., 1943. A logical calculus of the ideas immanent in nervous
activity. Bull. Math. Biophys. 5, 115–133.Mcnab, J.A., Jbabdi, S., Deoni, S.C.L., Douaud, G., Behrens, T.E.J., Miller, K.L., 2009. High
resolution diffusion-weighted imaging in fixed human brain using diffusion-weighted steady state free precession. Neuroimage 46, 775–785.
Mesulam, M., 1982. Tracing Neural Connections with Horseradish Peroxidase. Wiley,New York.
Mesulam, M., 1998. From sensation to cognition. Brain 121, 1013–1052.Mesulam, M., 2012. The evolving landscape of human cortical connectivity: facts and
inferences. Neuroimage 62, 2182–2189.Meynert, T., 1868. Neue Untersuchungen über den Bau der Grosshirnrinde und seine
örtlichen. Verschiedenheiten, Vortrag.Mishkin, M., 1966. Visual mechanisms beyond the striate cortex. In: Russel, R. (Ed.),
Frontiers in Physiological Psychology. Academic Press, New York.Mishkin, M., Ungerleider, L.G., Macko, K.A., 1983. Object vision and spatial vision: two
cortical pathways. Trends Neurosci. 6, 414–417.Monakow, C., 1897. Gehirnpathologie. A. Hölder, Vienna.Monakow, C., 1914. Die Lokalisation im Grosshirn und der Abbau der Funktion durch
kortikale Herde. JF Bergmann, Wiesbaden.Morecraft, R.J., Ugolini, G., Lanciego, J.L., Wouterlood, F.G., Pandya, D.N., 2009. Classic and
contemporary neural tract tracing techniques. In: Johansen-Berg, H., Behrens, T.E.J.(Eds.), Diffusion MRI. Elsevier, pp. 273–308.
Mountcastle, V.B., Powell, T.P., 1959. Neural mechanisms subserving cutaneous sensi-bility, with special reference to the role of afferent inhibition in sensory perceptionand discrimination. Bull. Johns Hopkins Hosp. 105, 201–232.
Nauta, W.J., Gygax, P.A., 1951. Silver impregnation of degenerating axon terminals in thecentral nervous system: (1) technic. (2) Chemical notes. Stain Technol. 26 (1), 5–11.
Nieuwenhuys, R., 2013. The myeloarchitectonic studies on the human cerebral cortexof the Vogt-Vogt school, and their significance for the interpretation of functionalneuroimaging data. Brain Struct. Funct. 218, 303–352.
Pavlov, I.D., 1903. The experimental psychology and psychopathology of animals. The14th International Medical Congress, Madrid, Spain.
Pevsner, J., 2002. Leonardo da Vinci's contributions to neuroscience. Trends Neurosci.25, 217–220.
Piccolomini, A., 1586. Anatomicae Praelectiones, explicantes mirificam corporis humanifabricam. Bonfadini.
Raichle, M.E., Snyder, A.Z., 2007. A default mode of brain function: a brief history of anevolving idea. Neuroimage 37, 1083–1090 (discussion 1097–1099).
Raichle, M.E.,MacLeod, A.M., Snyder, A.Z., Powers,W.J., Gusnard, D.A., Shulman, G.L., 2001.A default mode of brain function. Proc. Natl. Acad. Sci. U. S. A. 98, 676–682.
Reil, J.C., 1809. Die Sylvische Grube oder das Thal, das gestreifte große Hirnganglium,dessen Kapsel und die Seitentheile des großen Gehirns. Arch. Physiol. 9,195–208.
Reil, J.C., 1812. Die vördere Commissur im großen Gehirn. Arch. Physiol. 11, 89–100.Rogalski, E., Cobia, D., Harrison, T.M., Wieneke, C., Thompson, C.K., Weintraub, S.,
Mesulam, M.-M., 2011. Anatomy of language impairments in Primary ProgressiveAphasia. J. Neurosci. 31, 3344–3350.
11M. Catani et al. / NeuroImage xxx (2013) xxx–xxx
Please cite this article as: Catani, M., et al., Connectomic approaches before the connectome, NeuroImage (2013), http://dx.doi.org/10.1016/j.neuroimage.2013.05.109
Rosenblatt, Frank, 1958. The perceptron: a probabilistic model for information storageand organization in the brain, Cornell Aeronautical Laboratory. Psychol. Rev. 65,386–408.
Schwann, T., 1839. Mikroskopische Untersuchungen Über Die Übereinstimmungin Der Struktur und Dem Wachstum Der Tiere und Pflanzen. G. E. Reimer,Berlin.
Seung, S., 2012. Connectome: How the Brain's Wiring Makes Us Who We Are.Houghton Mifflin Harcourt Trade.
Sporns, O., 2011. Networks of the Brain. MIT Press.Sporns, O., 2013. The human connectome: origins and challenges. Neuroimage
S1053–S8119.Sporns, O., Tononi, G., Kotter, R., 2005. The human connectome: a structural description
of the human brain. PLoS Comput. Biol. 1, e42.Steno, N., 1669. Discours de Monsieur Stenon, sur l'anatomie du cerveau àMessieurs de
l'Assemblée, qui se fait chez Monsieur Theuenot. chez Robert de Ninuille.Stephan, K.E., et al., 2009. Tractography-based priors for dynamic causal models.
Neuroimage 47, 1628–1638.Strogatz, S.H., 2001. Exploring complex networks. Nature 410, 268–276.Takahashi, E., Song, J.W., Folkerth, R.D., Grant, P.E., Schmahmann, J.D., 2013. Detection
of postmortem human cerebellar cortex and white matter pathways using highangular resolution diffusion tractography: a feasibility study. Neuroimage 68,105–111.
Testut, L., 1897. Traité d'anatomie humaine: anatomie descriptive, histologie,développement. O. Doin.
Thiebaut de Schotten, M., Dell'Acqua, F., Forkel, S., Simmons, A., Murphy, D.G., Catani,M., 2011. A lateralized brain network for visuospatial attention. Nat. Neurosci.14, 1245–1246.
Thiebaut de Schotten, M., Dell'Acqua, F., Valabregue, R., Catani, M., 2012. Monkey tohuman comparative anatomy of the frontal lobe association tracts. Cortex 48,82–96.
Tournier, T.J.D., Calamante, F., Connelly, A., 2007. Robust determination of the fibre ori-entation distribution in diffusion MRI: non-negativity constrained superresolvedspherical deconvolution. Neuroimage 35, 1459–1472.
Vesalius, A., 1543. De Humani Corporis Fabrica. Oporini, Basel.Vieussens, R., 1685. Neurographia universalis. Jean Certe, Lyon.Vogt, C., Vogt, O., 1926. Die vergleichend-architektonische und vergleichend-
reizphysiologische Felderung der Grosshirnrinde unter besonderer Berücksichtigungder menschlichen. Naturwissenschaften 14, 1190–1194.
Wedeen, V.J., Rosene, D.L., Wang, R., Dai, G., Mortazavi, F., Hagmann, P., Kaas, J.H.,Tseng, W.-Y.I., 2012. The geometric structure of the brain fiber pathways. Science335, 1628–1634.
Wernicke, C., 1906. Grundrisse der Psychiatrie. Thieme, Leipzig, Germany.White, J.G., Southgate, E., Thomson, J.N., Brenner, S., 1986. The structure of the nervous sys-
tem of the nematode Caenorhabditis elegans. Philos. Trans. R. Soc. Lond. B 314, 1–340.Willis, T., 1664. Cerebri anatome: cui accessit nervorum descriptio et usus. typis Ja. Flescher,
impensis Jo. Martyn & Ja. Allestry apud insigne Campanae in Coemeterio D. Pauli.Zilles, K., Amunts, K., 2009. Receptor mapping: architecture of the human cerebral
cortex. Curr. Opin. Neurol. 22, 331–339.
12 M. Catani et al. / NeuroImage xxx (2013) xxx–xxx
Please cite this article as: Catani, M., et al., Connectomic approaches before the connectome, NeuroImage (2013), http://dx.doi.org/10.1016/j.neuroimage.2013.05.109


![Neuroinformatics and Analysis of Connectomic Alterations ...acm-paper].pdfNeuroinformatics and Analysis of Connectomic Alterations Due to Cerebral Microhemorrhages in Geriatric Mild](https://img.pdfslide.us/doc/110x75/5f7c9596fc19e924393f8ea8/neuroinformatics-and-analysis-of-connectomic-alterations-acm-paperpdf-neuroinformatics.jpg)