Embed Size (px)
Citation preview
Connecting Practice, Data and Connecting Practice, Data and Connecting Practice, Data and Connecting Practice, Data and ResearchResearchC i ’ C D C ll i SConnecticut’s Contractor Data Collection System
Maureen DeLude Barbara Pierce ParkerMaureen DeLudeProgram ManagerCT Judicial BranchCourt Support Services Division
Barbara Pierce ParkerManaging AssociateCrime and Justice Institute at CRJ
Introductions and Learning Introductions and Learning ObjectivesObjectives
By the end of the session, we hope you understand:◦ Why we invested in comprehensive statewide data
collection
◦ Key elements of correctional treatment data collection
Wh ’ l d l d h ◦ What’s involved in implementing a data system with a variety of contracted correctional treatment programs p g
A Little HistoryA Little HistoryA Little HistoryA Little History CT Judicial Branch Court Support Services Division
is under the leadership of the Chief Justice of the is under the leadership of the Chief Justice of the Supreme Court and the Chief Court Administrator
1,600 Employees Functions: Functions:◦ Adult Services – Bail and Probation◦ Juvenile Probation◦ Juvenile Detention◦ Family Relations – DV and Civil◦ Contracted Treatment Services◦ Administration
“The Mission of CSSD is to provide effective support services within the Judicial Branch by working collaboratively with system stakeholders to promote
compliance with court orders and instill positive change in individuals, families and communities.”and communities.
A Little HistoryA Little HistoryA Little HistoryA Little History
51,000 adult probationers supervised on p pany given day
On average, 16,000 probationers are O ave age, 6,000 p obat o e s a e involved in programming or treatment with private providersp p
These providers deliver more than 20 “program models” program models
A Little HistoryA Little HistoryA Little HistoryA Little History
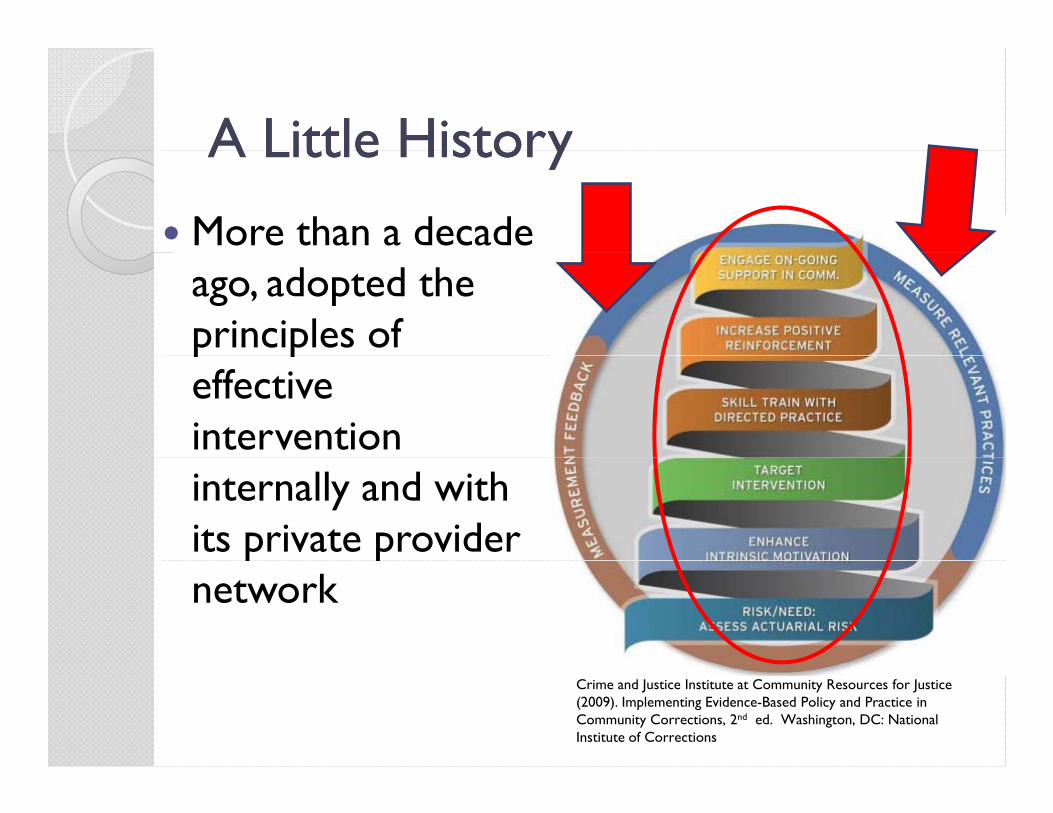
More than a decade ago, adopted the principles of p peffective intervention internally and with its private provider p pnetwork
Crime and Justice Institute at Community Resources for Justice (2009). Implementing Evidence-Based Policy and Practice in Community Corrections, 2nd ed. Washington, DC: National Institute of Corrections
A Little HistoryA Little HistoryA Little HistoryA Little History
In 2007, the Legislature’s Appropriations g pp pCommittee adopted Results Based Accountability (RBA)*y ( )
Critical planning tool for the budgetary processp
Provides a framework to determine a program’s impact on the citizens of the programs impact on the citizens of the State of Connecticut
*RBA was developed by Mark Friedman of the Fiscal Policy Studies Institute
A Little HistoryA Little HistoryA Little HistoryA Little History
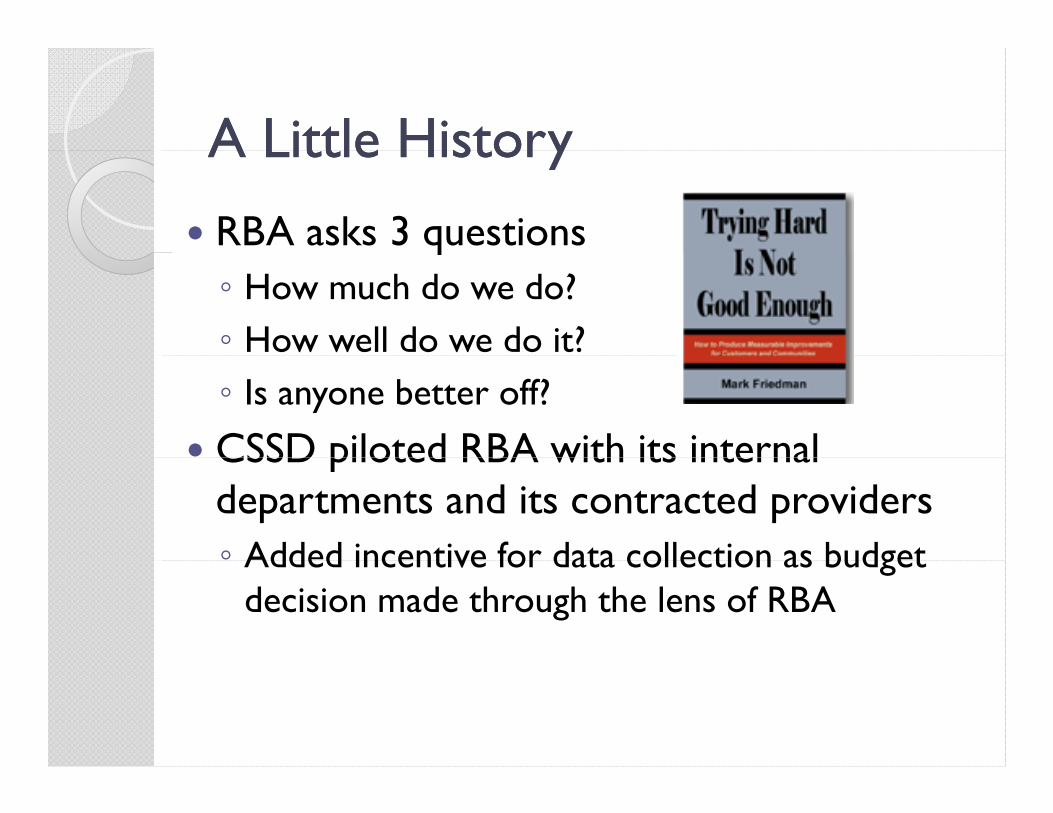
RBA asks 3 questionsq◦ How much do we do?◦ How well do we do it?◦ Is anyone better off?
CSSD piloted RBA with its internal CSSD piloted RBA with its internal departments and its contracted providers◦ Added incentive for data collection as budget Added incentive for data collection as budget
decision made through the lens of RBA
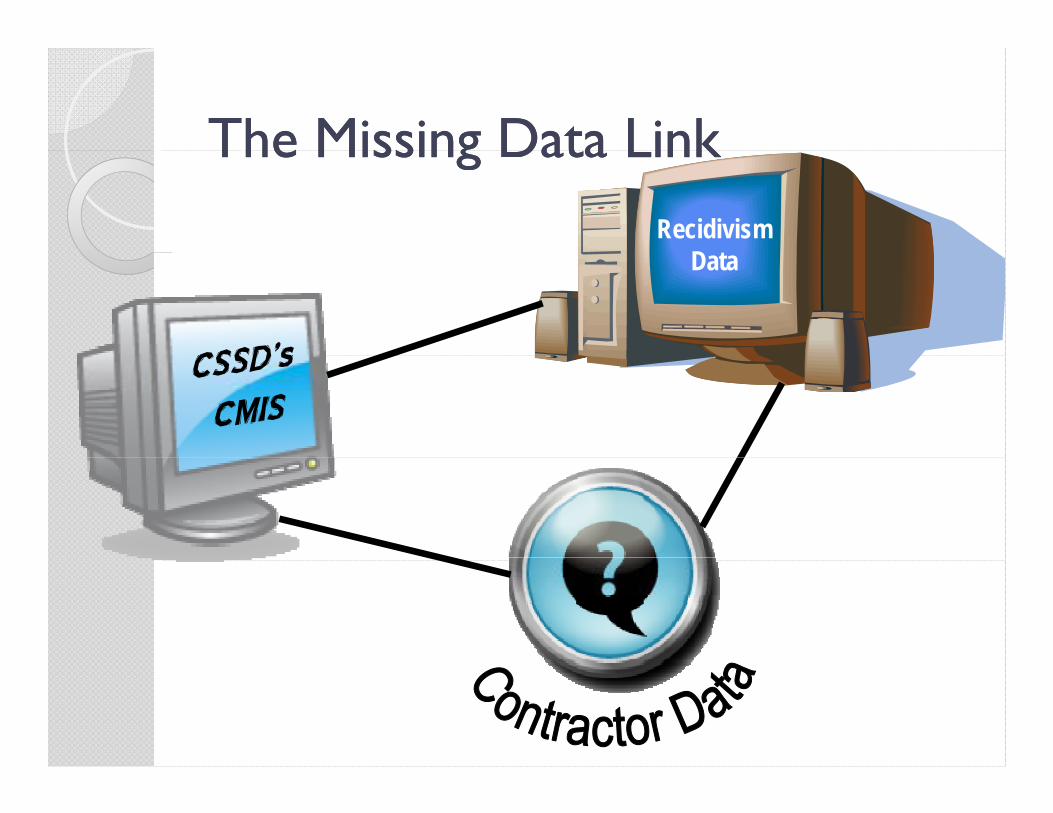
The Missing Data LinkThe Missing Data LinkThe Missing Data LinkThe Missing Data LinkRecidivism
D tData
What is CDCS?What is CDCS?What is CDCS?What is CDCS? Contractor Data Collection System◦ Web-based, secure system ◦ Specific to each program model
Collects client level data from CSSD’s network of private correctional treatment
idproviders
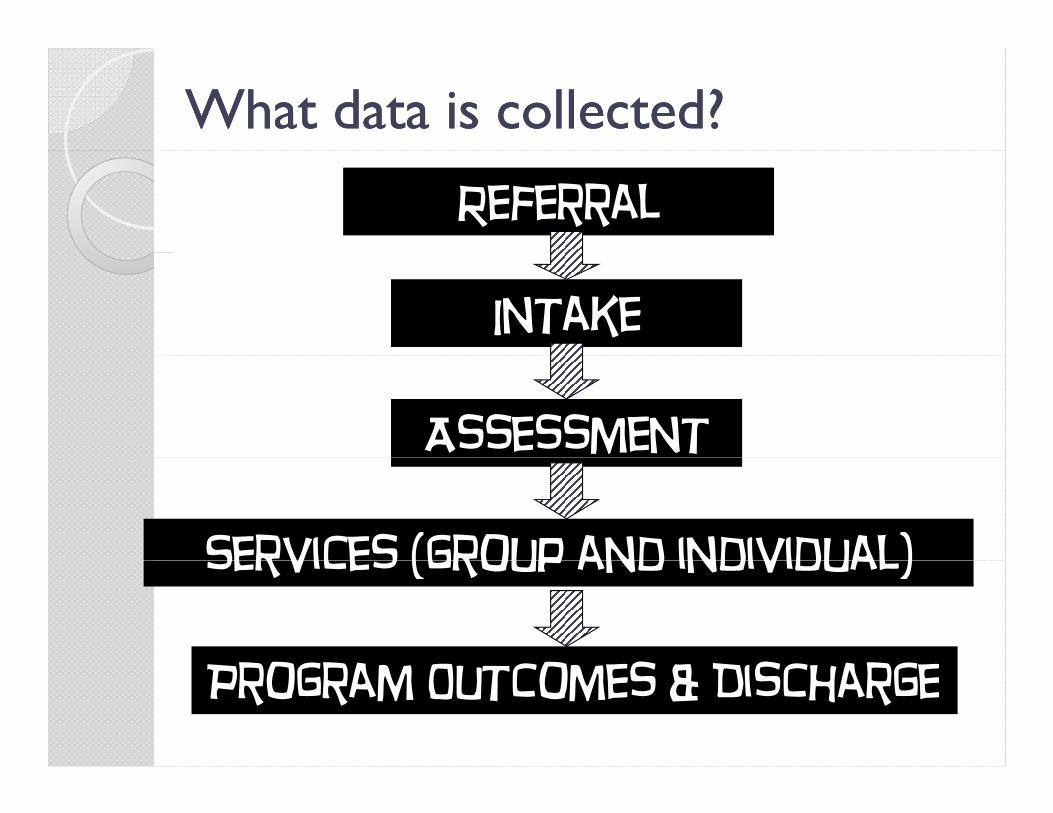
What data is collected?What data is collected?
Referral
Intake
Assessment
Services (group and individual)Services (group and individual)
rogra o s D s argProgram Outcomes & Discharge
CDCS DESIGNCDCS DESIGNCDCS DESIGNCDCS DESIGN
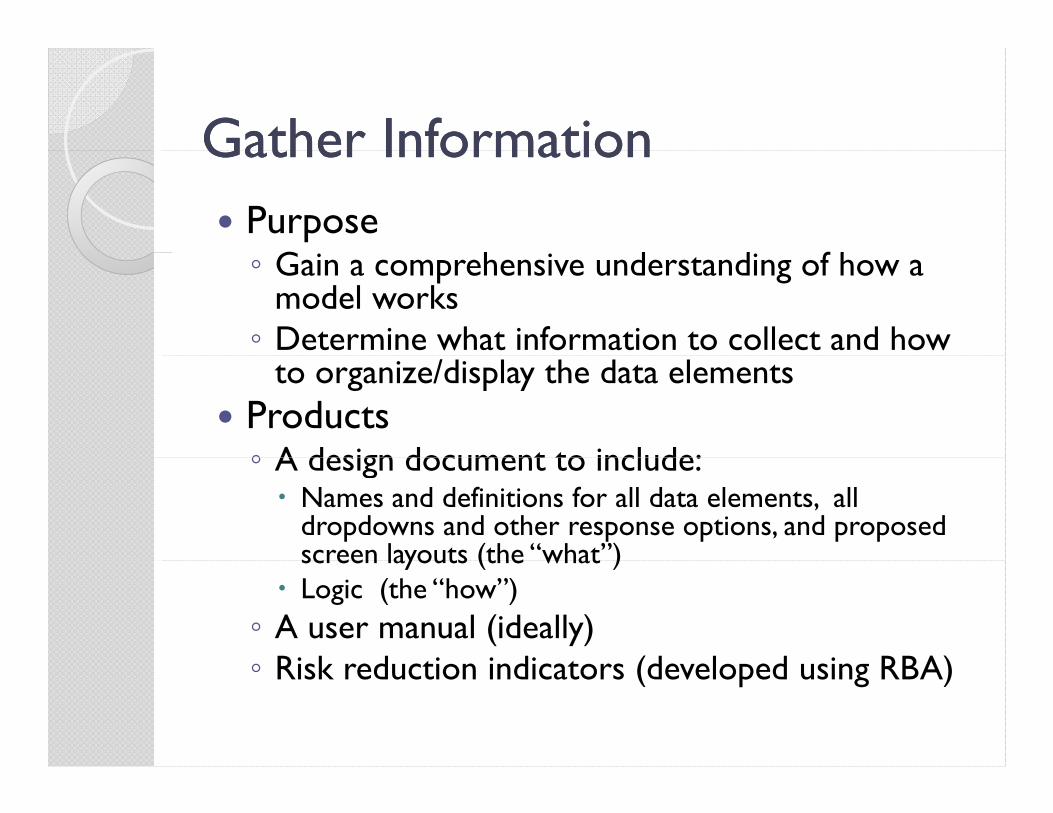
Gather InformationGather InformationGather InformationGather Information Purpose
G h d d f h ◦ Gain a comprehensive understanding of how a model works ◦ Determine what information to collect and how
to organize/display the data elements Products◦ A design document to include:◦ A design document to include: Names and definitions for all data elements, all
dropdowns and other response options, and proposed screen layouts (the “what”)screen layouts (the what )
Logic (the “how”)◦ A user manual (ideally)
Ri k d ti i di t (d l d i RBA)◦ Risk reduction indicators (developed using RBA)
Gather InformationGather InformationGather InformationGather Information
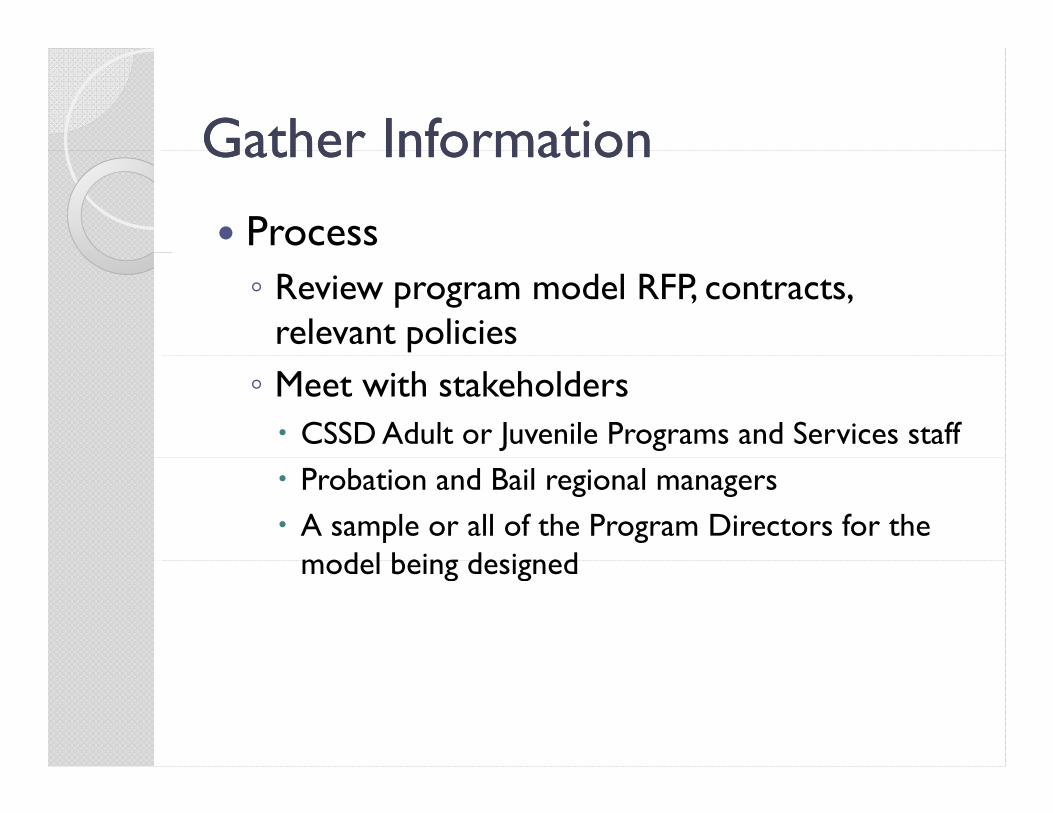
Process◦ Review program model RFP, contracts,
relevant policies◦ Meet with stakeholders CSSD Adult or Juvenile Programs and Services staff Probation and Bail regional managers A sample or all of the Program Directors for the
model being designedmodel being designed
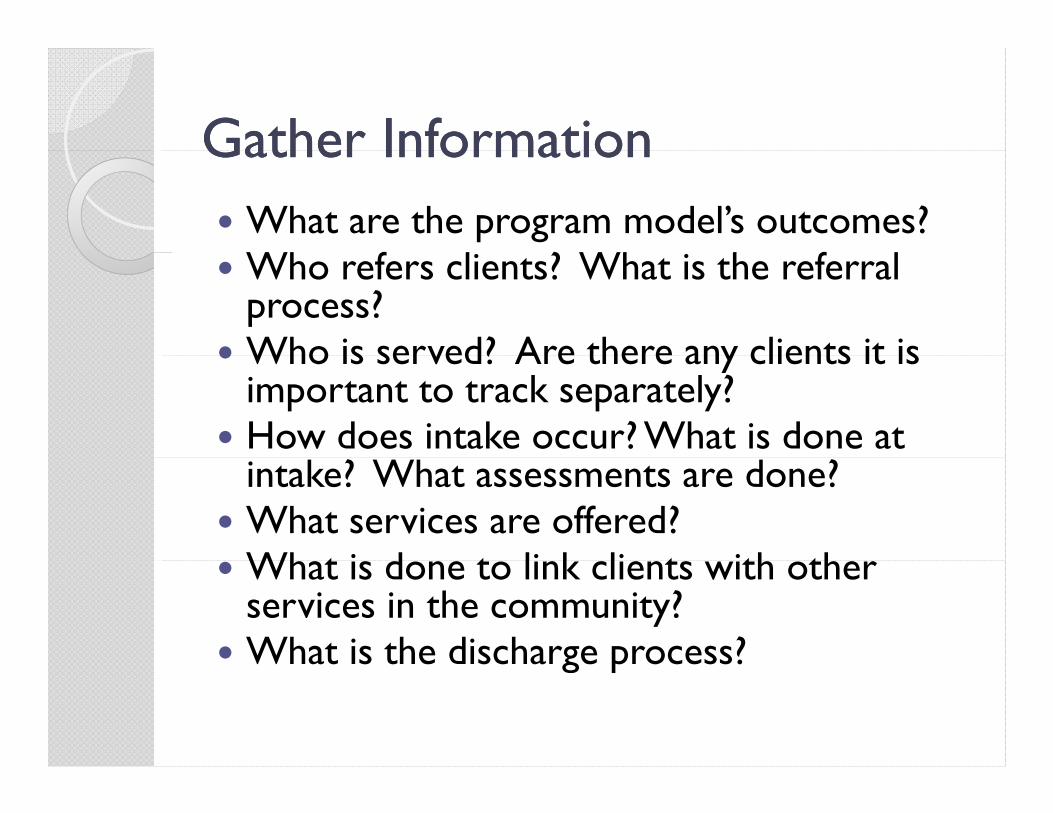
Gather InformationGather InformationGather InformationGather Information What are the program model’s outcomes?
Wh f l ? Wh h f l Who refers clients? What is the referral process?
Who is served? Are there any clients it is Who is served? Are there any clients it is important to track separately?
How does intake occur? What is done at intake? What assessments are done?
What services are offered?Wh t i d t li k li t ith th What is done to link clients with other services in the community?
What is the discharge process?What is the discharge process?
Program and TestProgram and TestProgram and TestProgram and Test
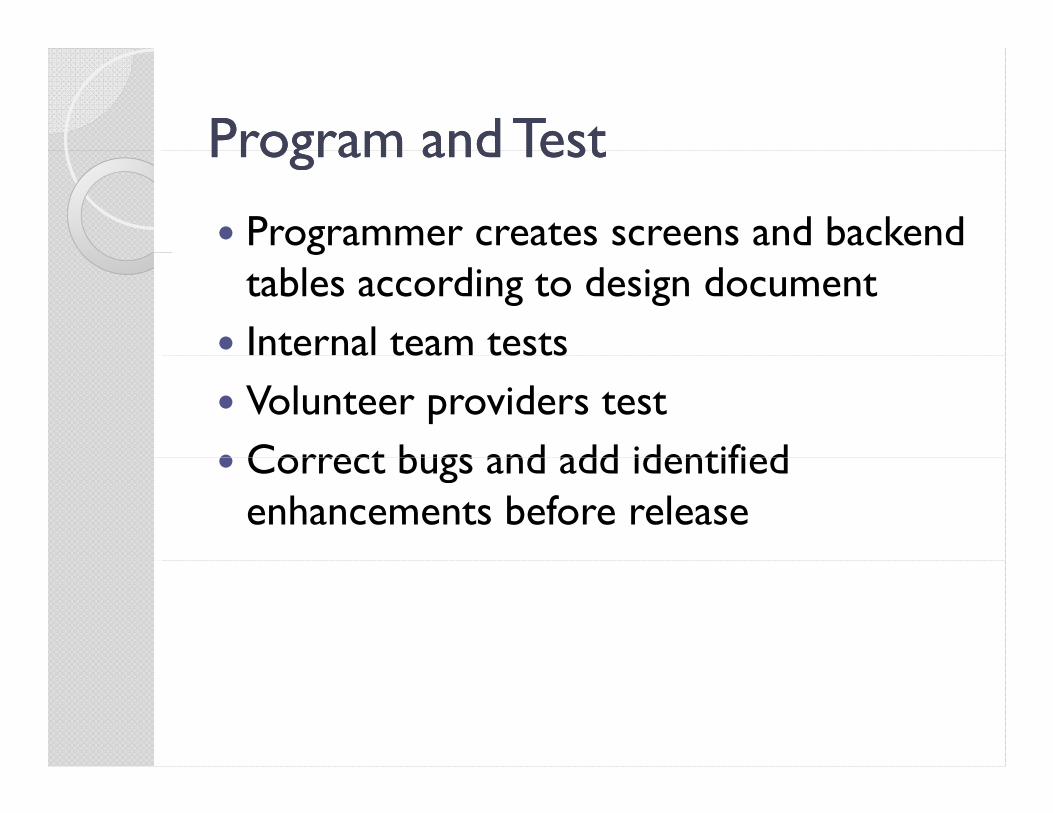
Programmer creates screens and backend gtables according to design document
Internal team testste a tea tests Volunteer providers test Correct bugs and add identified Correct bugs and add identified
enhancements before release
CDCS CDCS CDCS CDCS IMPLEMENTATIONIMPLEMENTATION
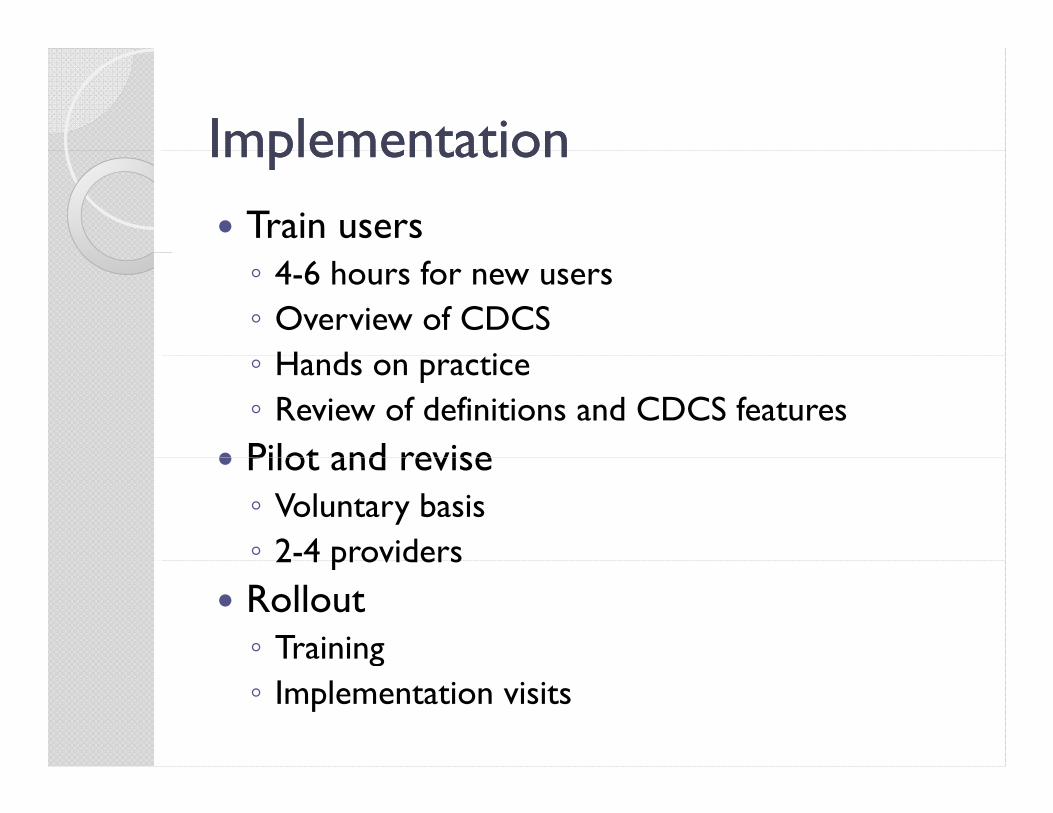
ImplementationImplementationImplementationImplementation Train users◦ 4-6 hours for new users◦ Overview of CDCS
H d i◦ Hands on practice◦ Review of definitions and CDCS features
Pilot and revise Pilot and revise◦ Voluntary basis◦ 2-4 providers2 4 providers
Rollout◦ Training g◦ Implementation visits
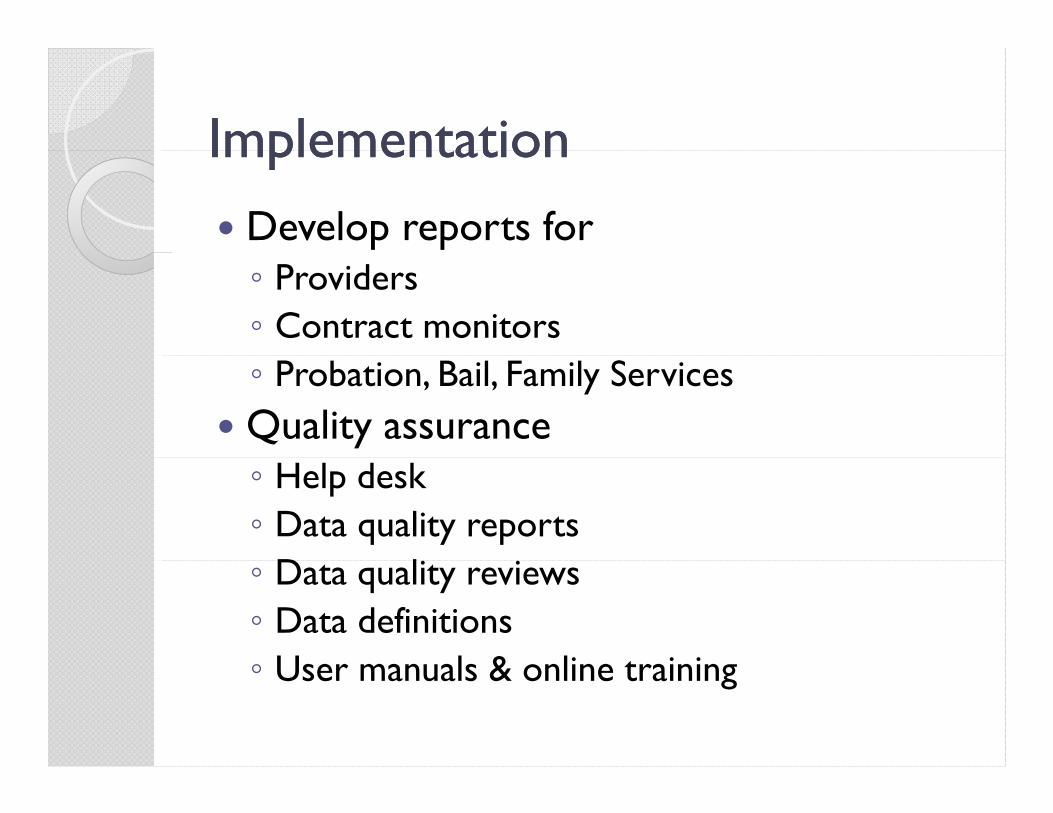
ImplementationImplementationImplementationImplementation Develop reports for◦ Providers◦ Contract monitors◦ Probation, Bail, Family Services
Quality assurance◦ Help desk◦ Data quality reports
D l ◦ Data quality reviews◦ Data definitions
U l & li t i i◦ User manuals & online training

A “DEMONSTRATION”A “DEMONSTRATION”A DEMONSTRATIONA DEMONSTRATION
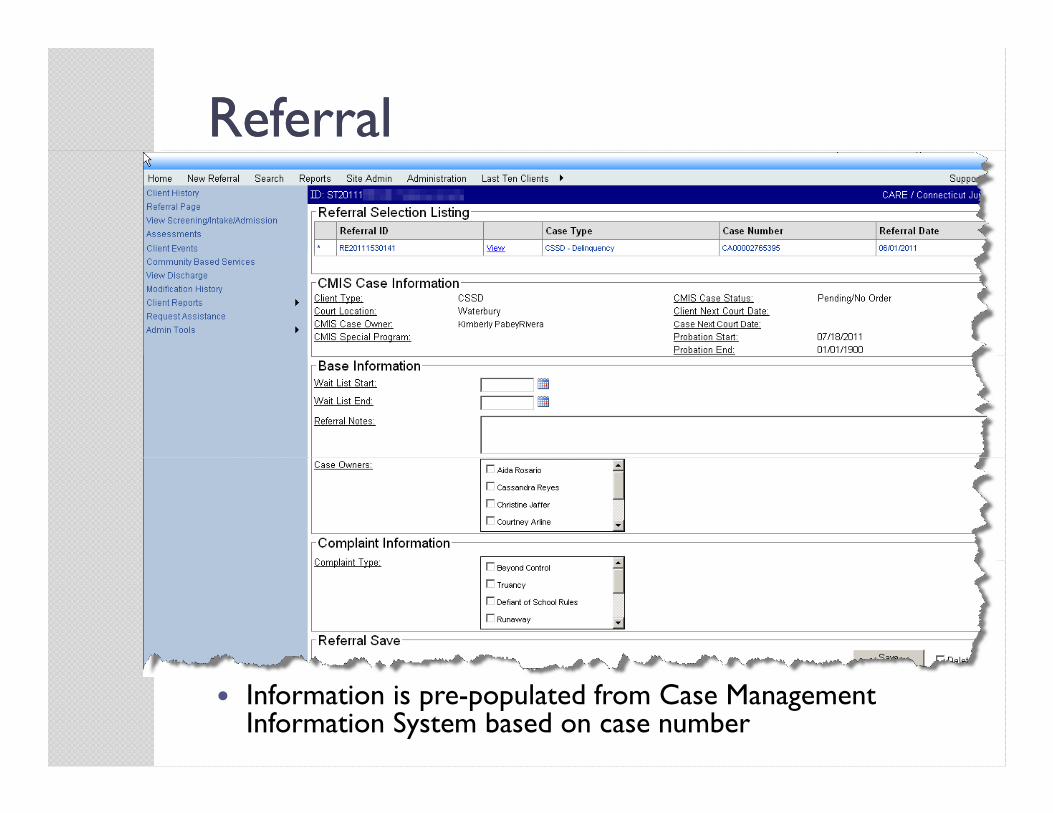
ReferralReferral
Information is pre-populated from Case Management Information System based on case number
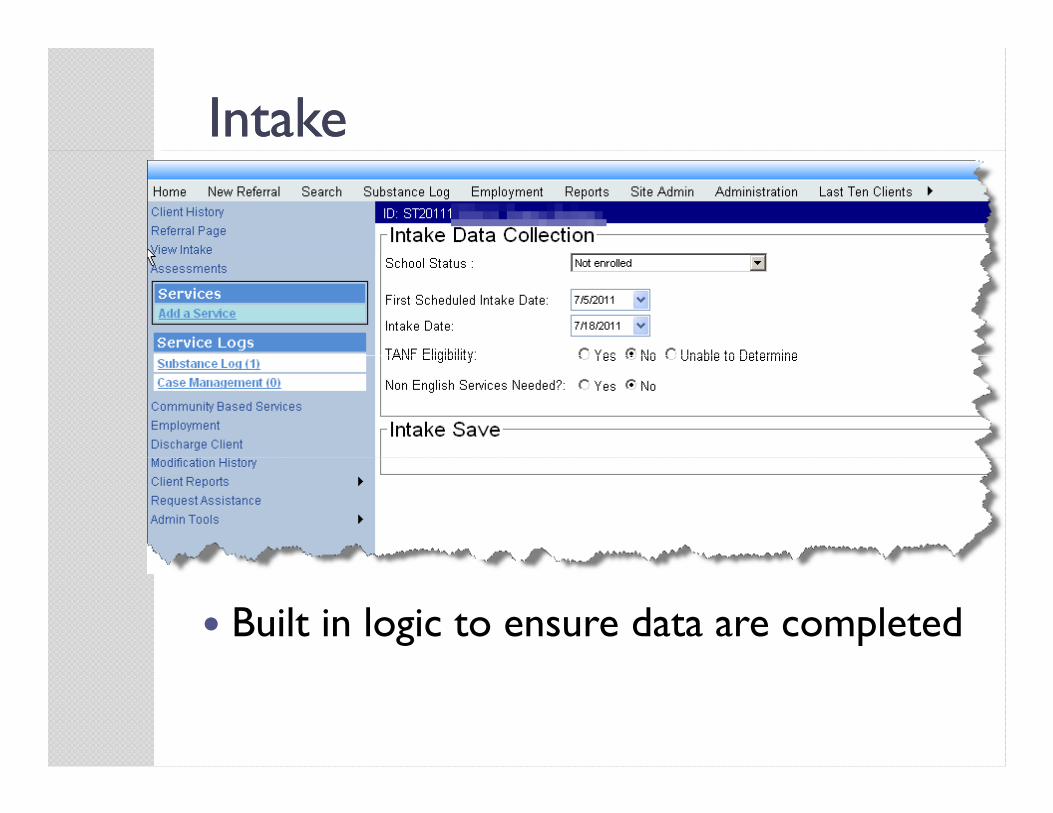
IntakeIntake
Built in logic to ensure data are completed
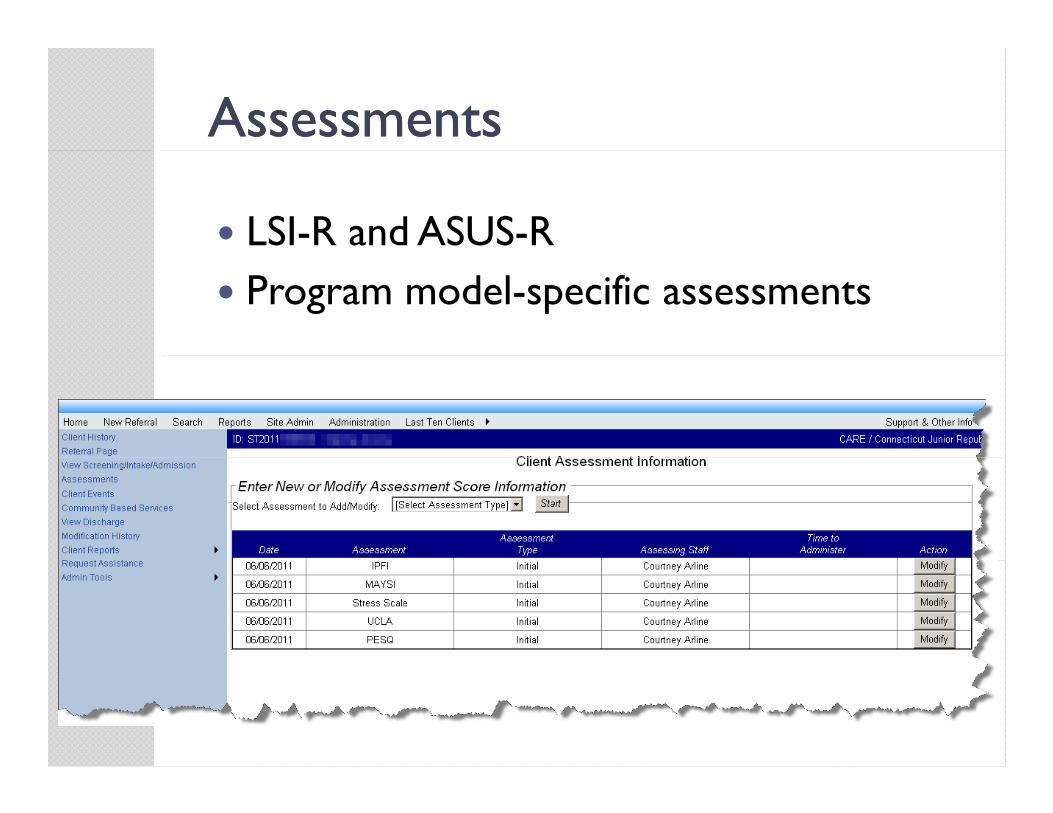
AssessmentsAssessments
LSI-R and ASUS-R Program model-specific assessments
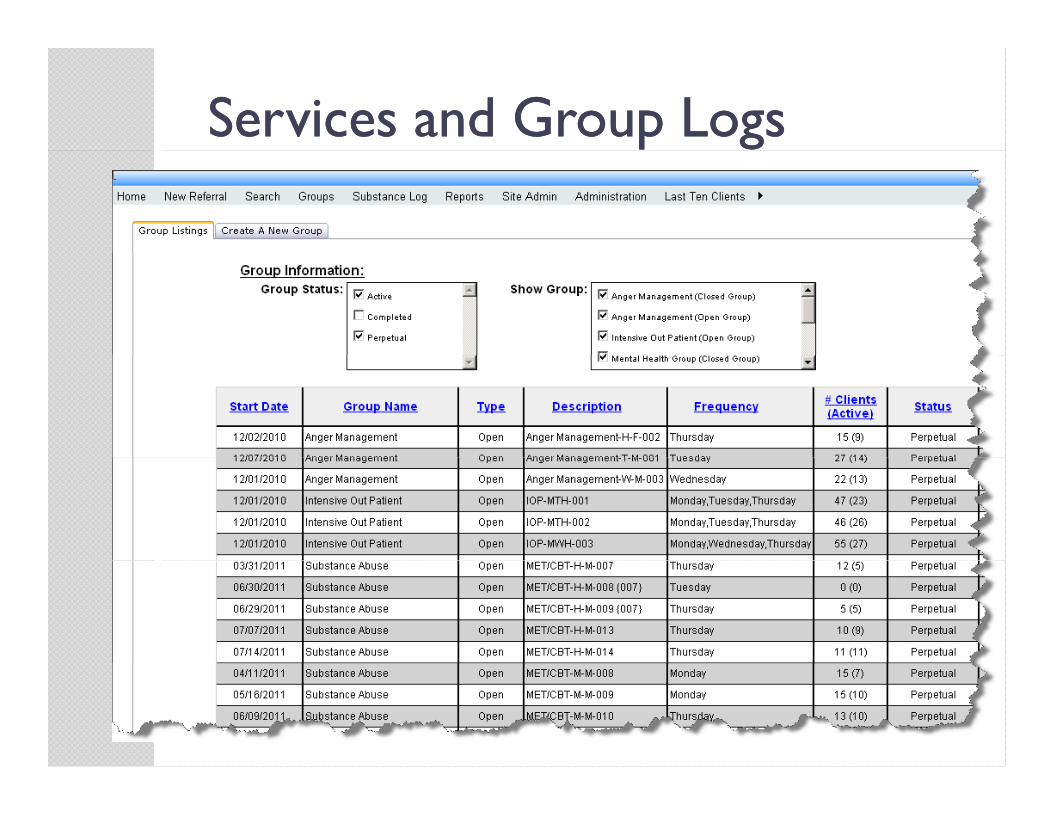
Services and GroupServices and Group LogsLogs
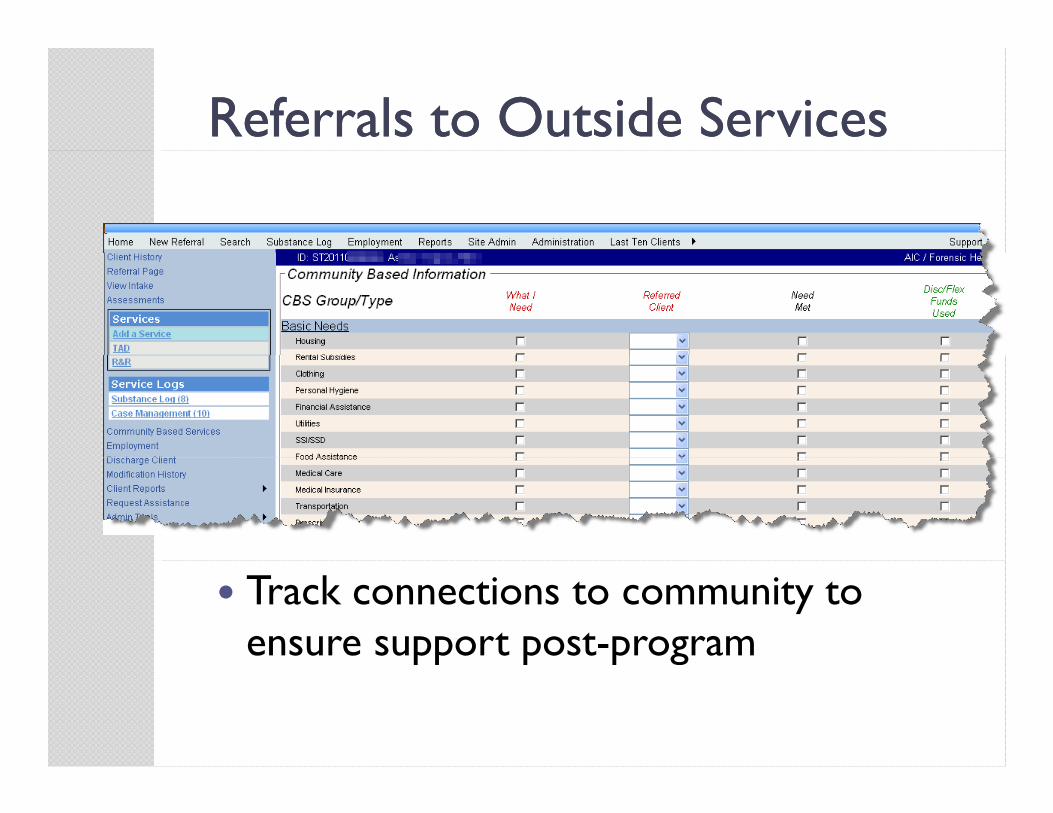
Referrals to Outside ServicesReferrals to Outside Services
Track connections to community to ensure support post-programpp p p g
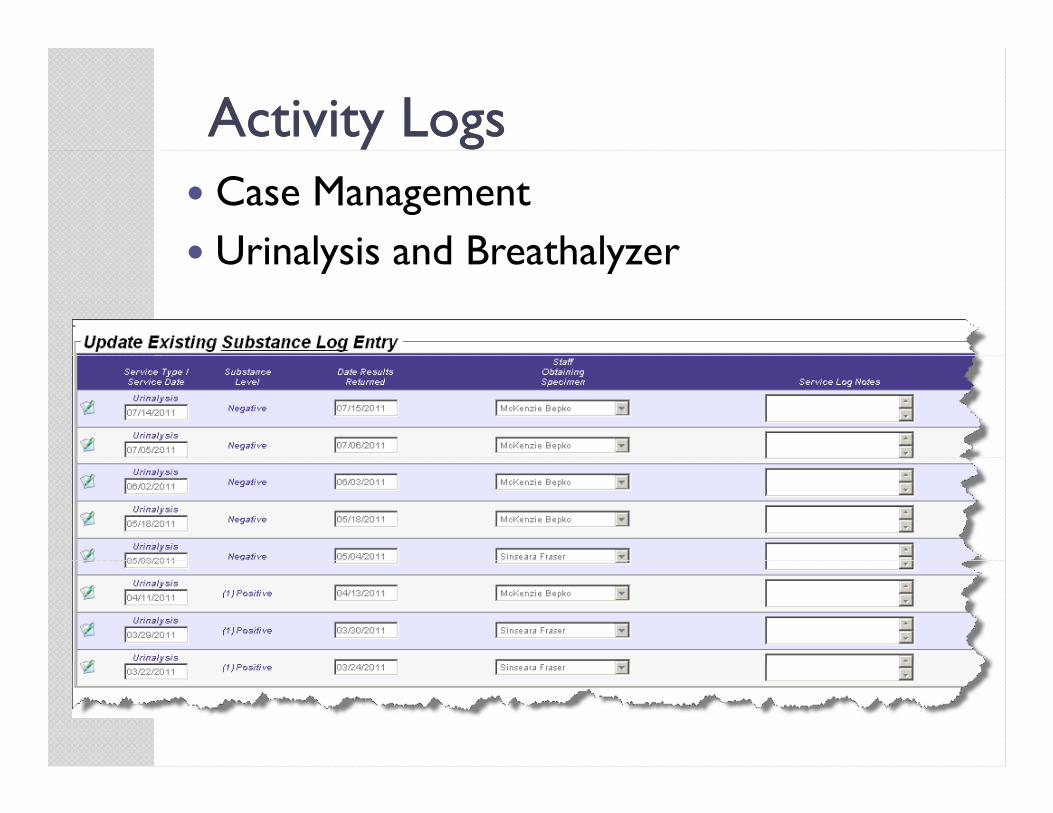
Activity LogsActivity Logs Case Management Urinalysis and Breathalyzer Urinalysis and Breathalyzer
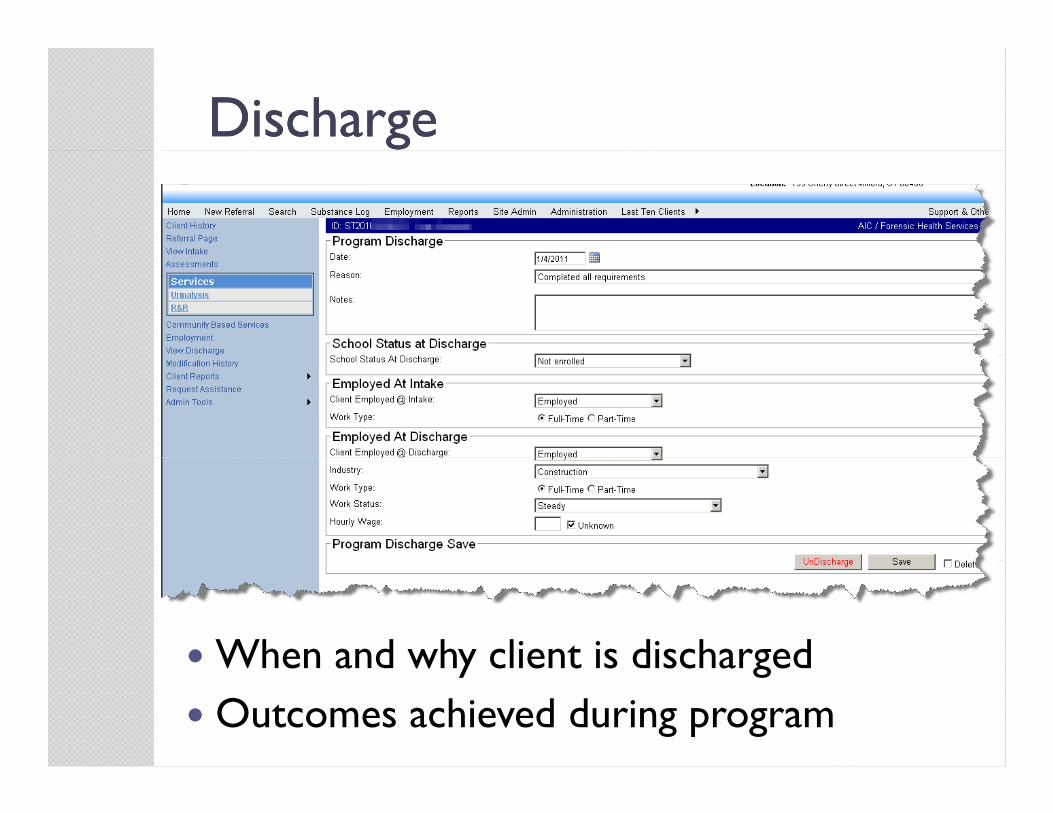
DischargeDischarge
When and why client is dischargedWhen and why client is discharged Outcomes achieved during program

REPORTS REPORTS REPORTS REPORTS
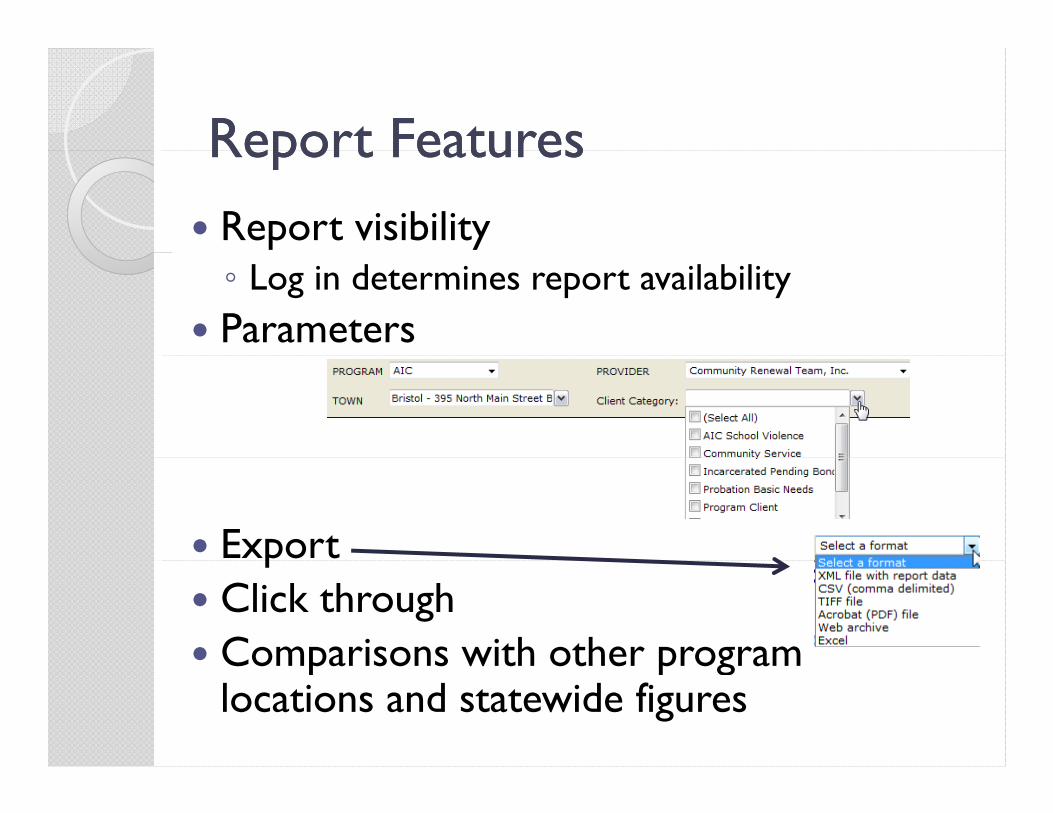
Report FeaturesReport FeaturesReport FeaturesReport Features Report visibility◦ Log in determines report availability
Parameters
Export p Click through Comparisons with other program Comparisons with other program
locations and statewide figures
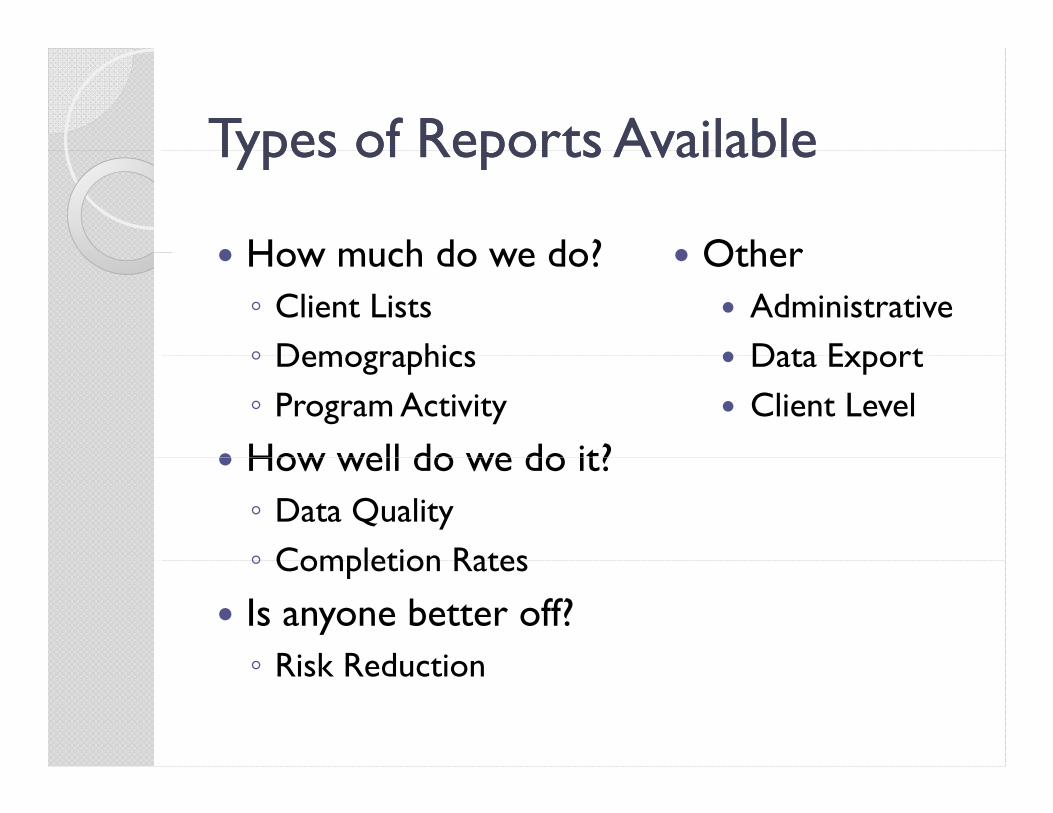
Types of Reports AvailableTypes of Reports AvailableTypes of Reports AvailableTypes of Reports Available
How much do we do? Other How much do we do?◦ Client Lists◦ Demographics
Other Administrative Data Export◦ Demographics
◦ Program Activity
How well do we do it?
Data Export Client Level
How well do we do it?◦ Data Quality◦ Completion Rates◦ Completion Rates
Is anyone better off?◦ Risk Reduction◦ Risk Reduction
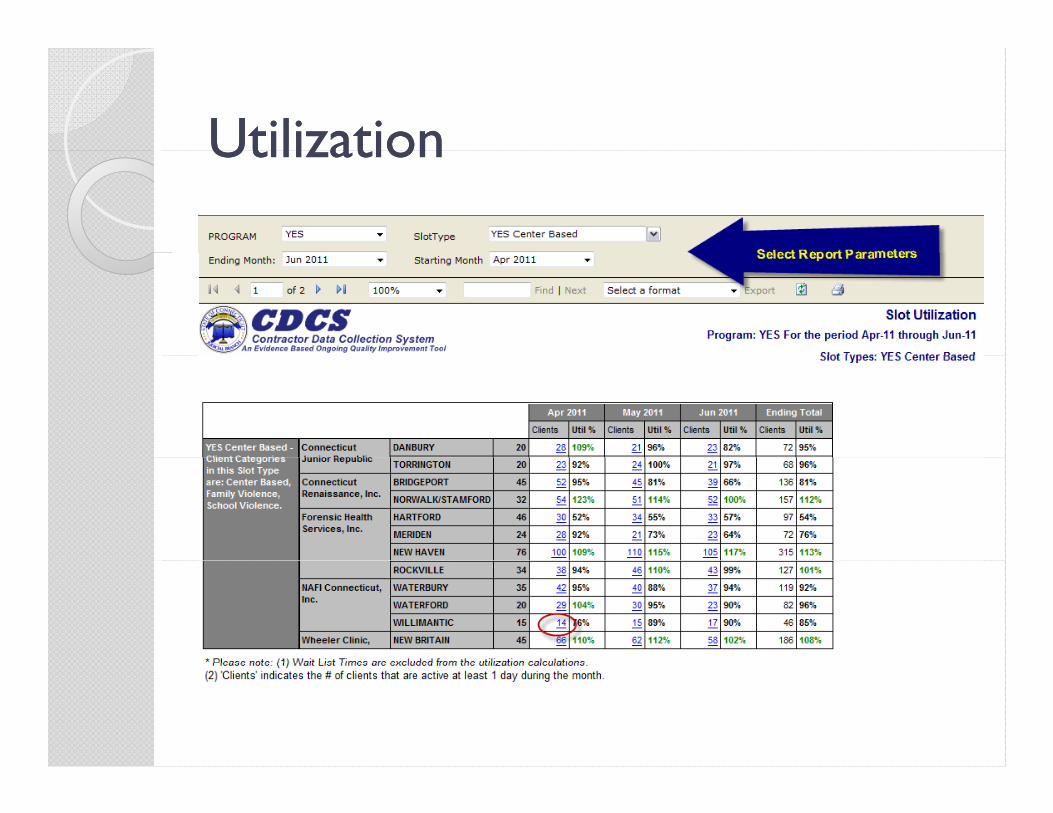
UtilizationUtilizationUtilizationUtilization
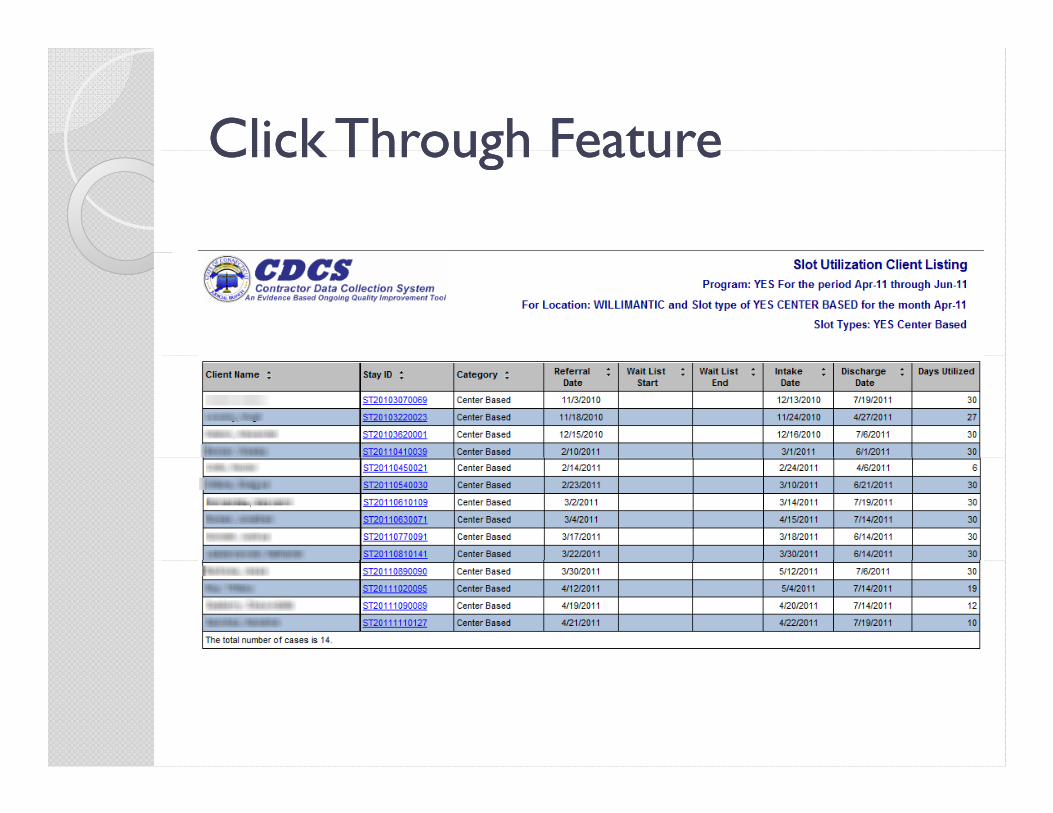
Click Through FeatureClick Through FeatureClick Through FeatureClick Through Feature
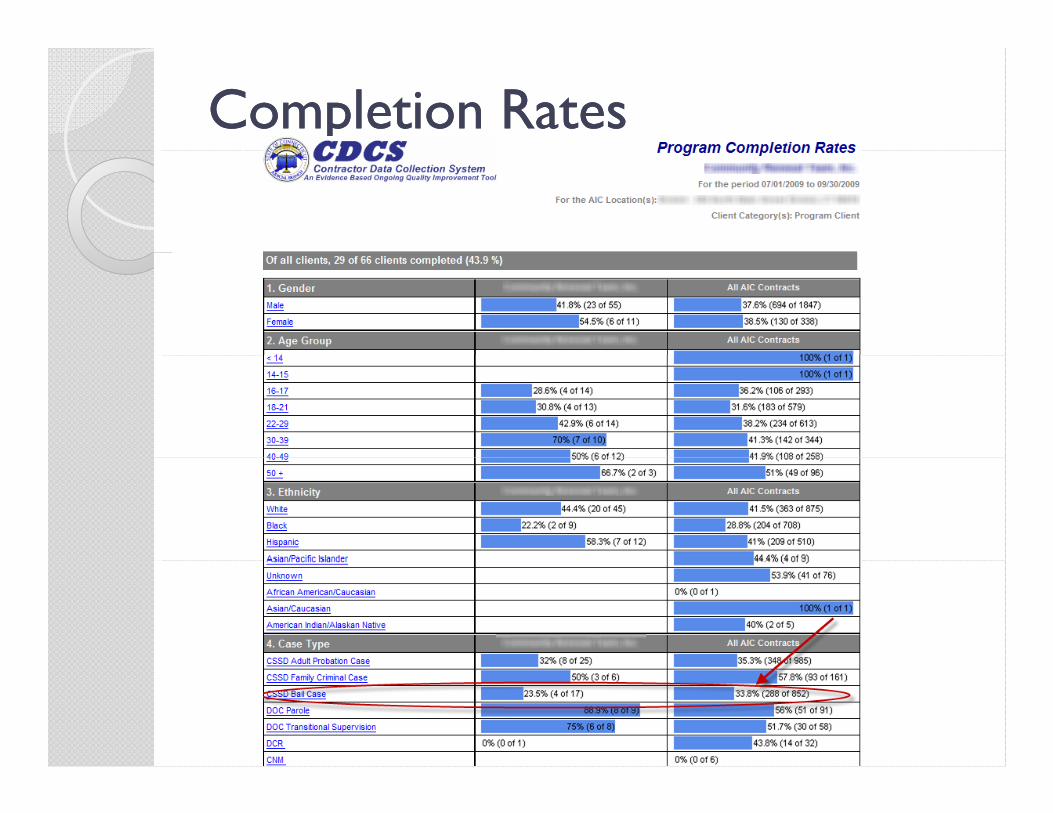
Completion RatesCompletion Rates
How We Use the Data: An ExampleHow We Use the Data: An Examplepp
Concern about low completion rates (33.8%) for bail clients at the Alternative in the Community programR t h i di h Ran report showing program discharge reasons Large percentage discharged because case Large percentage discharged because case
was disposed while clients were at the AICs
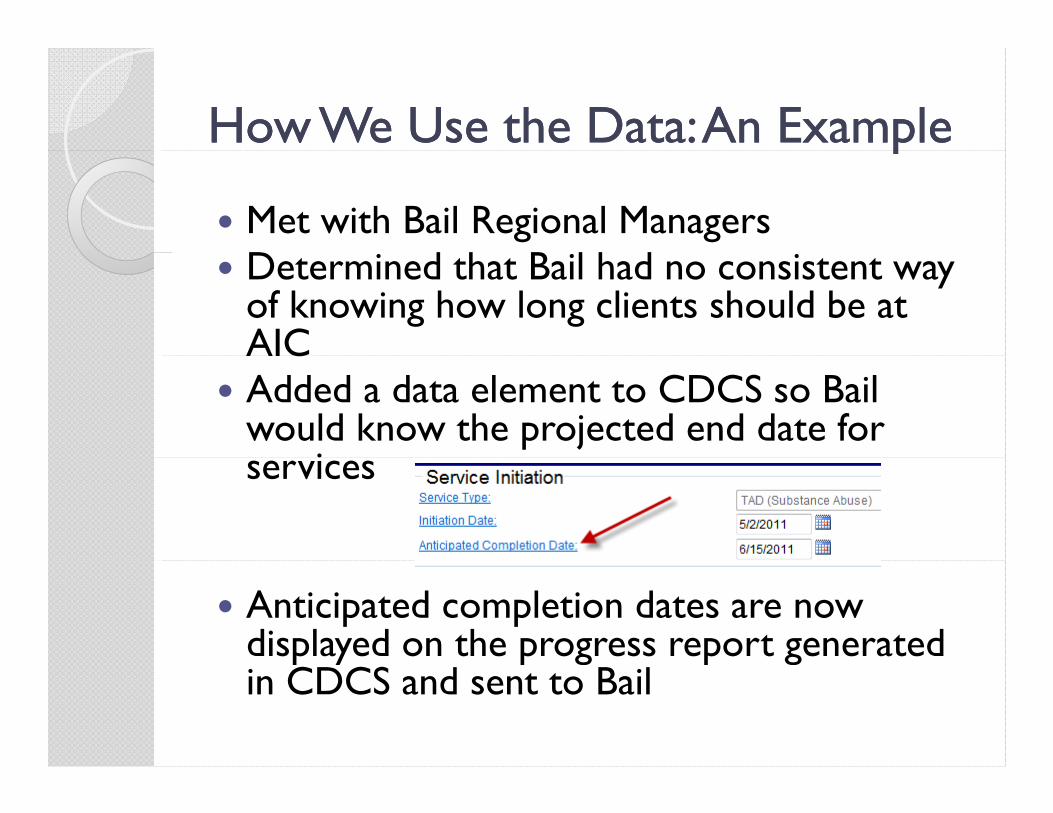
How We Use the Data: An ExampleHow We Use the Data: An Examplepp
Met with Bail Regional ManagersD d h B l h d Determined that Bail had no consistent way of knowing how long clients should be at AICAIC
Added a data element to CDCS so Bail would know the projected end date for
iservices
Anticipated completion dates are now displayed on the progress report generated p y p g p gin CDCS and sent to Bail
How We Use the Data: An ExampleHow We Use the Data: An Examplepp
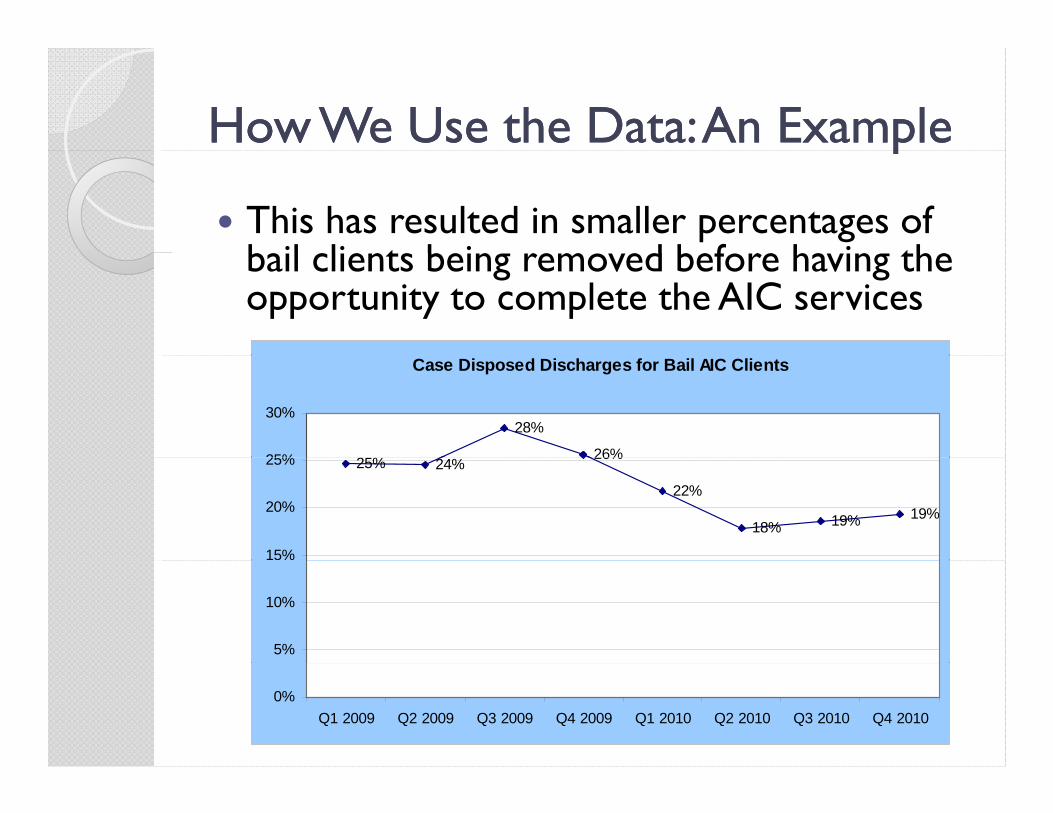
This has resulted in smaller percentages of b il li t b i d b f h i th bail clients being removed before having the opportunity to complete the AIC services
Case Disposed Discharges for Bail AIC Clients
25%
28%
26%25%
30%
25% 24%26%
22%
18% 19% 19%
15%
20%
25%
5%
10%
0%Q1 2009 Q2 2009 Q3 2009 Q4 2009 Q1 2010 Q2 2010 Q3 2010 Q4 2010
Risk Reduction IndicatorsRisk Reduction IndicatorsRisk Reduction IndicatorsRisk Reduction Indicators
Built set of reports for Probation, Bail and pFamily Service and contracted providers to measure agency performance and g y pclient/public safety outcomes
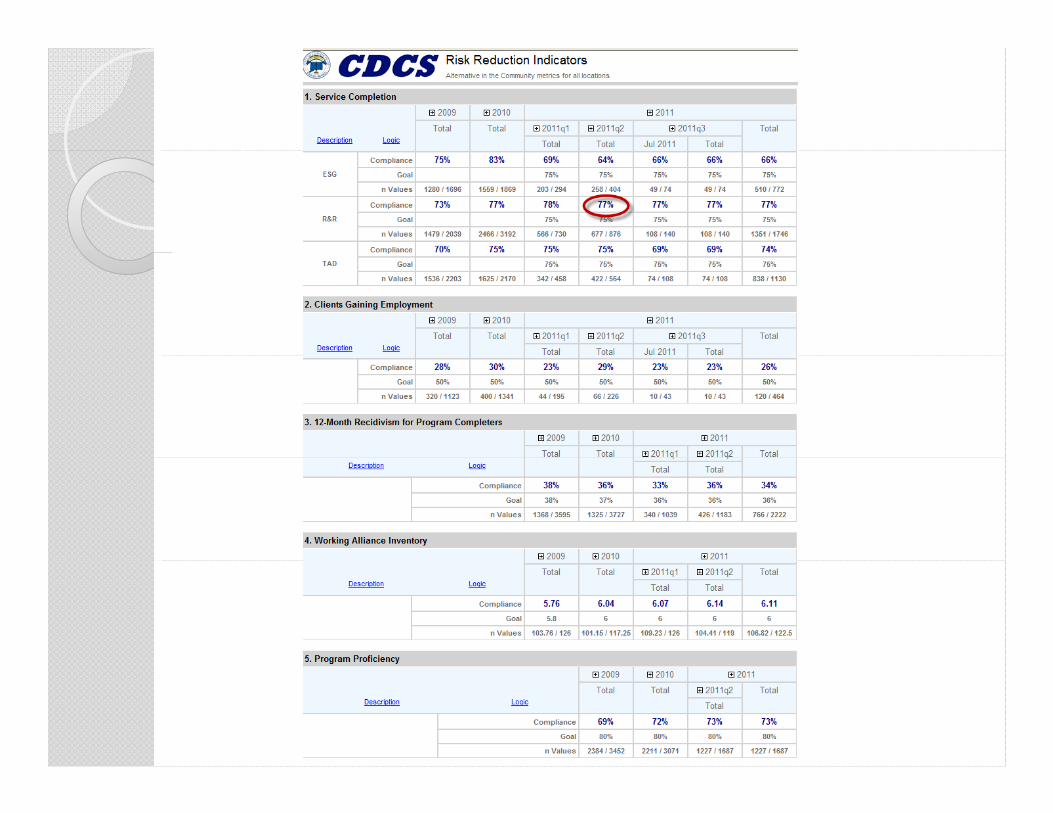
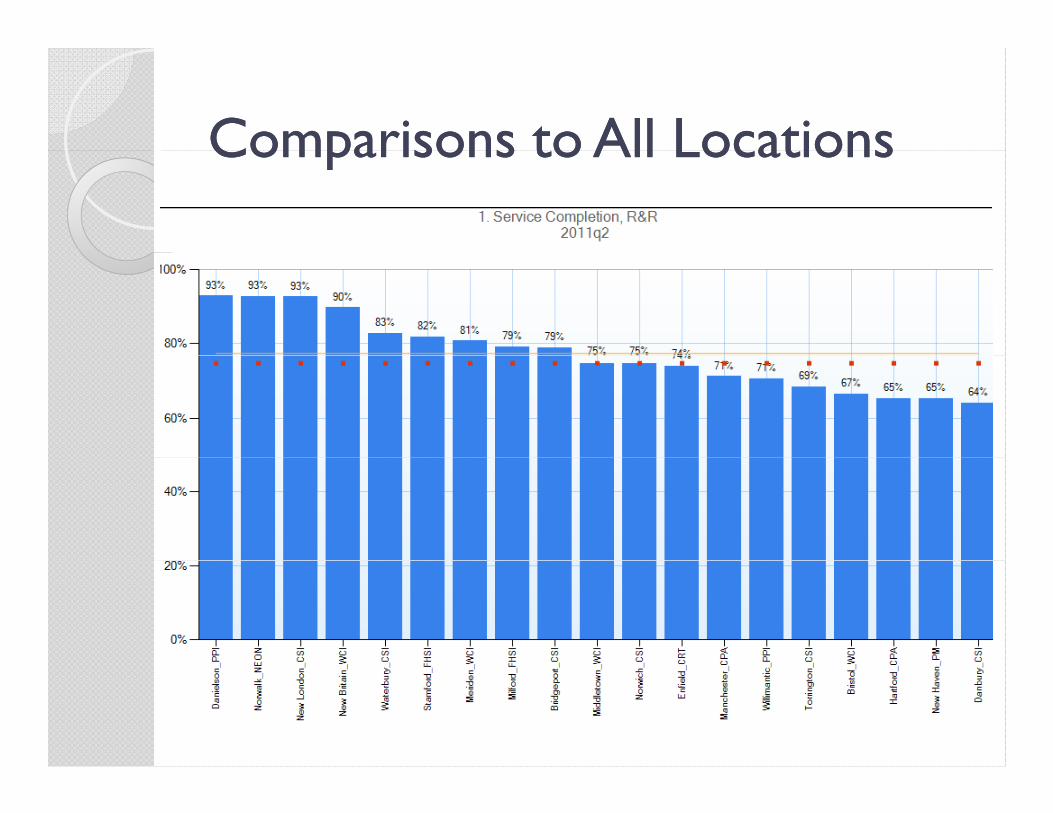
Comparisons to All LocationsComparisons to All LocationsComparisons to All LocationsComparisons to All Locations
Risk Reduction Indicators Risk Reduction Indicators –– How How We Use ThemWe Use Them Quarterly Adult Risk Reduction meetingsy g◦ Probation◦ Bail◦ Family Services◦ Adult Providers
Present and review all indicators Identify how each entity impacts and can Identify how each entity impacts and can
assist others
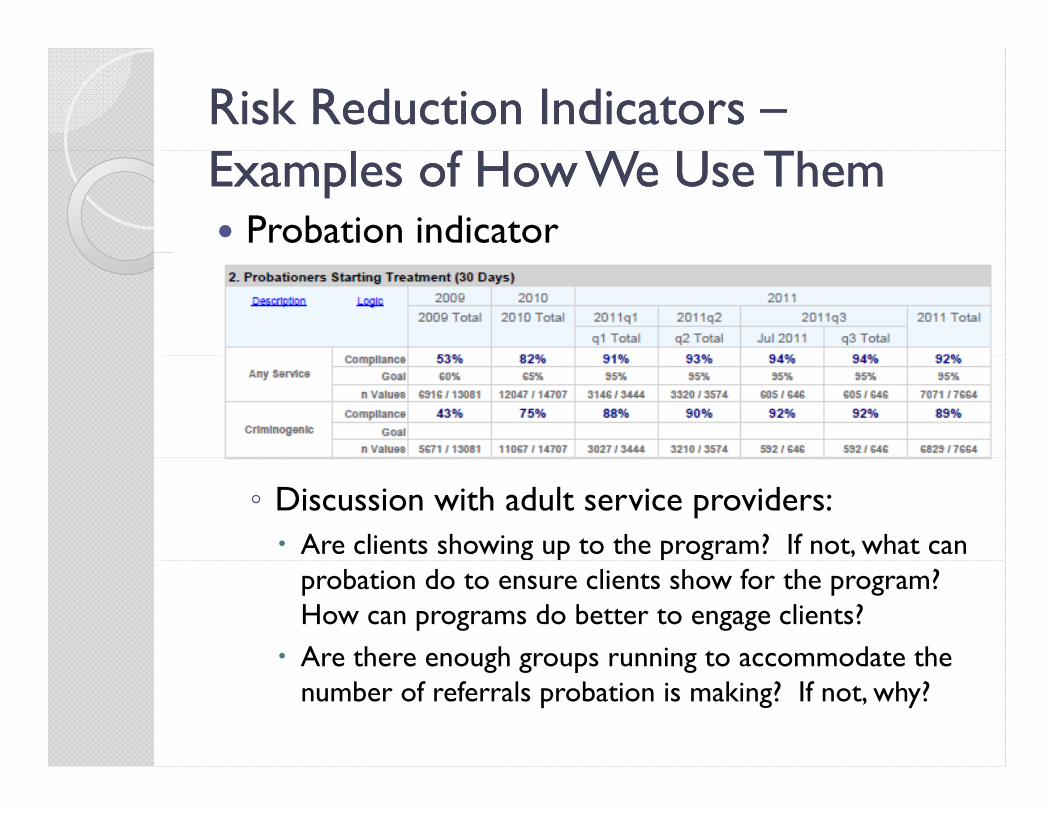
Risk Reduction Indicators Risk Reduction Indicators ––Examples of How We Use ThemExamples of How We Use Them Probation indicator
◦ Discussion with adult service providers: Are clients showing up to the program? If not, what can g p p g
probation do to ensure clients show for the program? How can programs do better to engage clients?
Are there enough groups running to accommodate the Are there enough groups running to accommodate the number of referrals probation is making? If not, why?
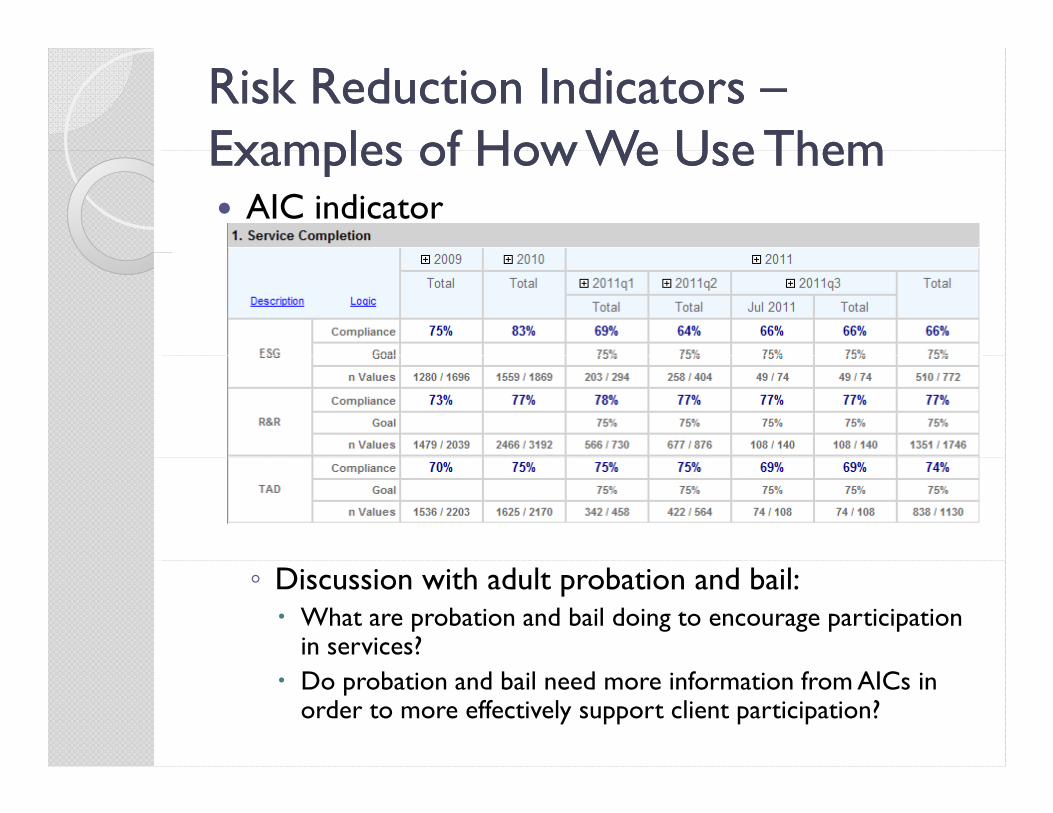
Risk Reduction Indicators Risk Reduction Indicators ––Examples of How We Use ThemExamples of How We Use ThemExamples of How We Use ThemExamples of How We Use Them AIC indicator
◦ Discussion with adult probation and bail: What are probation and bail doing to encourage participation
in services? Do probation and bail need more information from AICs in
order to more effectively support client participation?
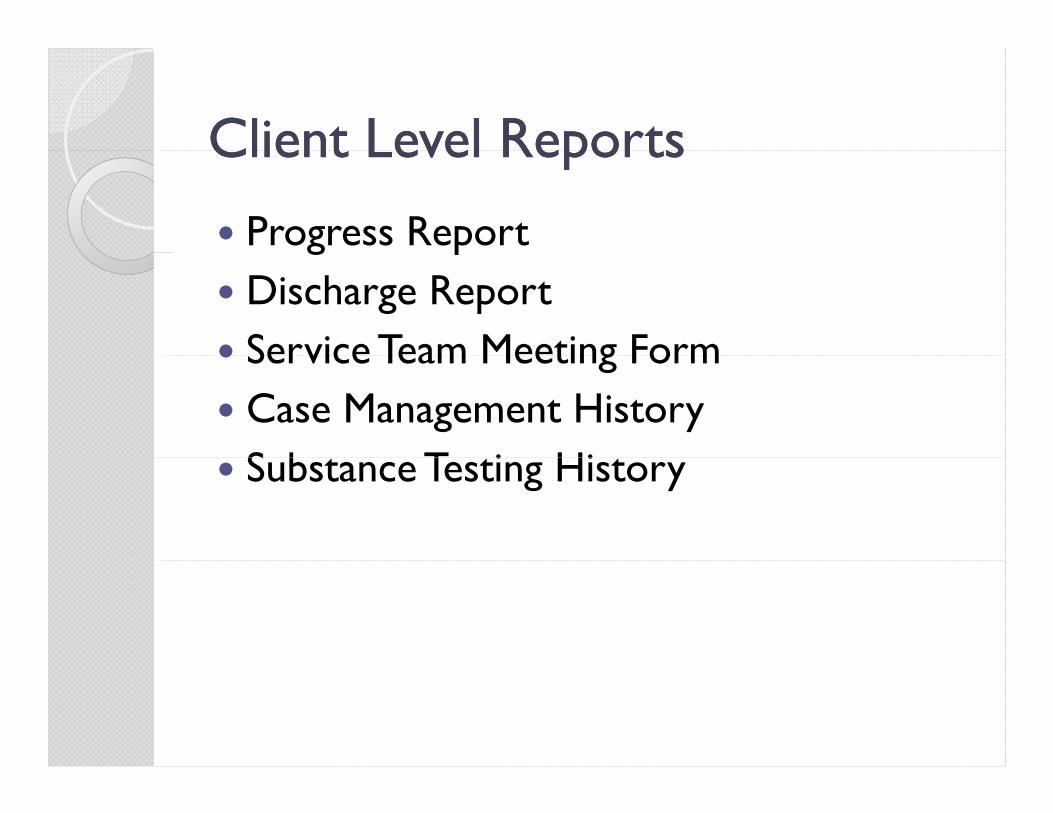
Client Level ReportsClient Level ReportsClient Level ReportsClient Level Reports
Progress Reportg p Discharge Report Service Team Meeting Form Service Team Meeting Form Case Management History
S b T i Hi Substance Testing History

LESSON LEARNEDLESSON LEARNEDLESSON LEARNEDLESSON LEARNED
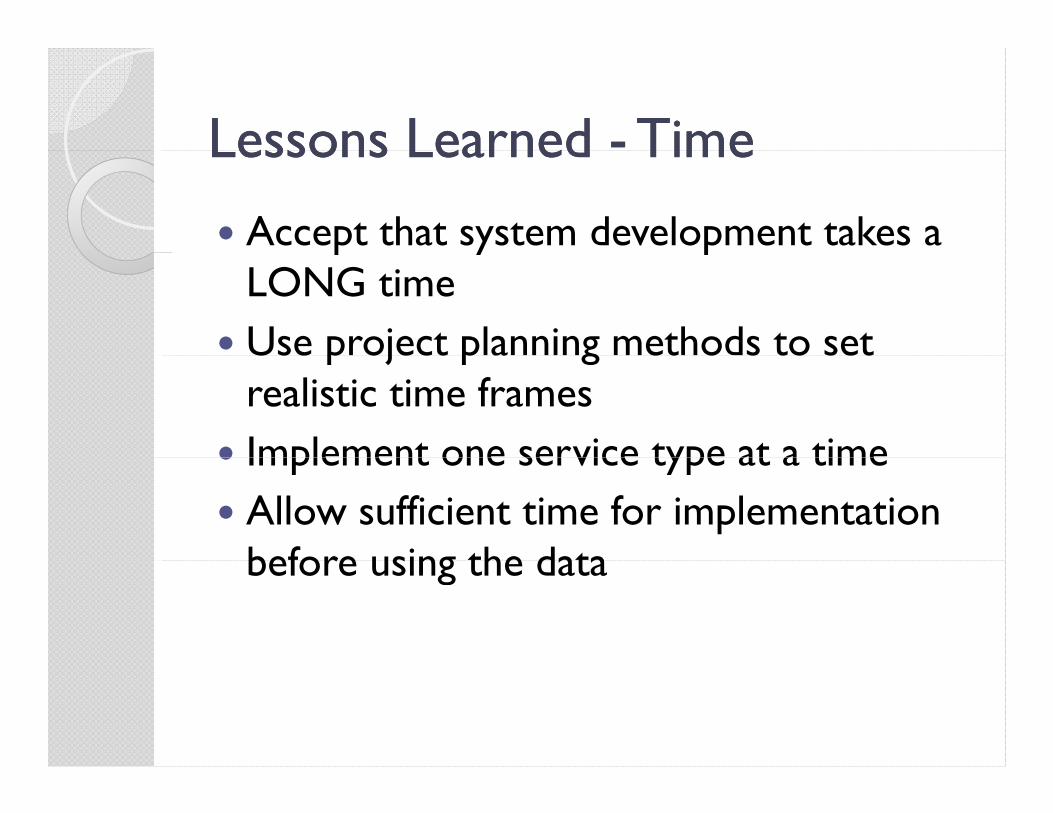
Lessons Learned Lessons Learned -- TimeTimeLessons Learned Lessons Learned TimeTime
Accept that system development takes a p y pLONG time
Use project planning methods to set Use p oject p a g et o s to set realistic time frames
Implement one service type at a time Implement one service type at a time Allow sufficient time for implementation
before using the databefore using the data
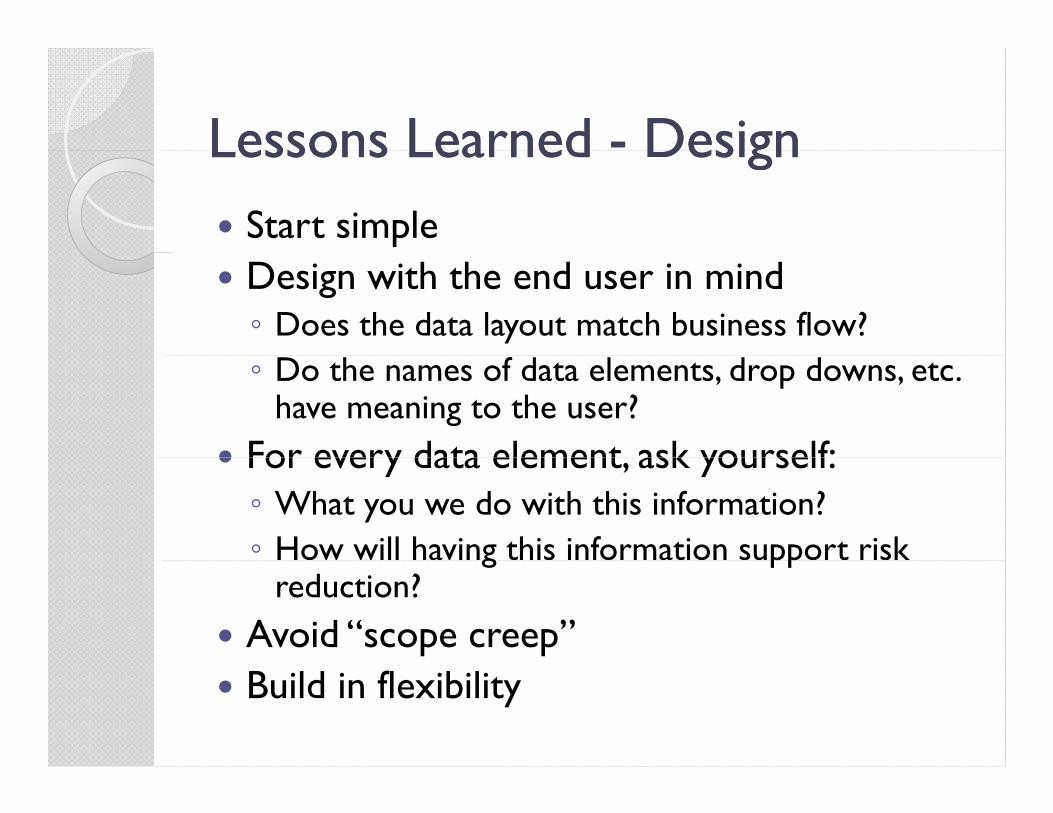
Lessons Learned Lessons Learned -- DesignDesignLessons Learned Lessons Learned DesignDesign Start simple Design with the end user in mind◦ Does the data layout match business flow?◦ Do the names of data elements, drop downs, etc.
have meaning to the user? For every data element ask yourself: For every data element, ask yourself:◦ What you we do with this information?◦ How will having this information support risk g pp
reduction? Avoid “scope creep” Build in flexibility
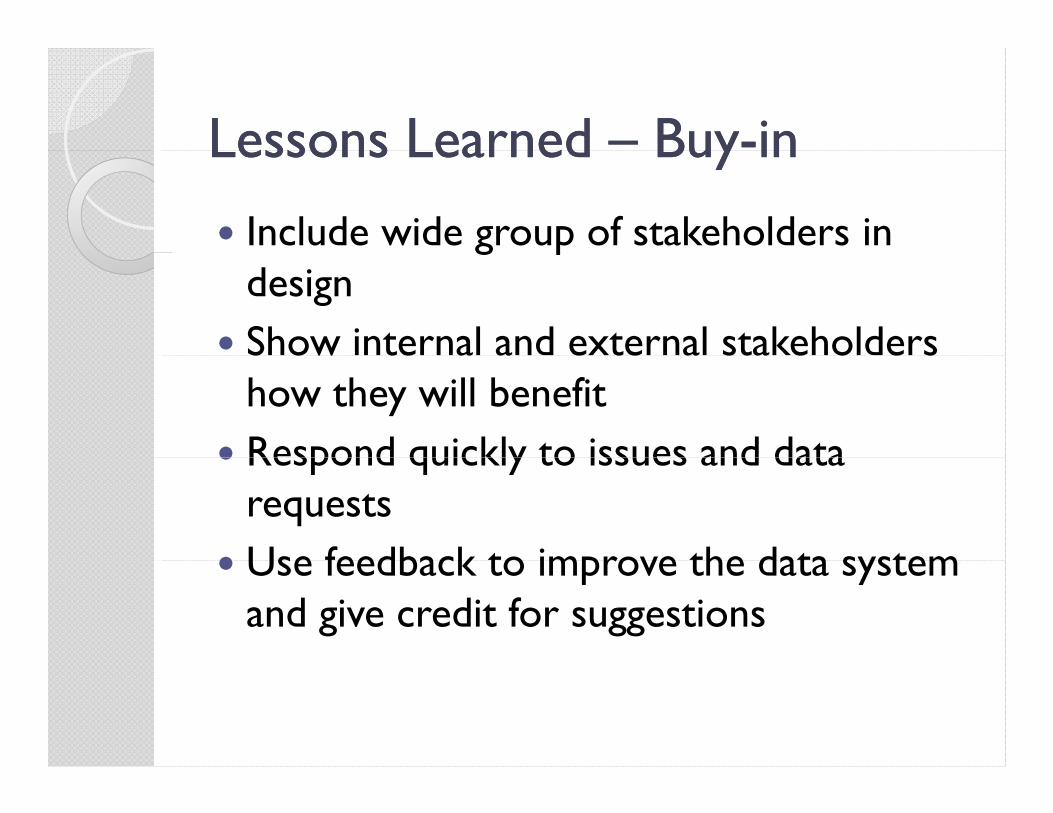
Lessons Learned Lessons Learned –– BuyBuy--ininLessons Learned Lessons Learned BuyBuy inin
Include wide group of stakeholders in g pdesign
Show internal and external stakeholders S ow te a a e te a sta e o e s how they will benefit
Respond quickly to issues and data Respond quickly to issues and data requests
Use feedback to improve the data system Use feedback to improve the data system and give credit for suggestions
Lessons Learned Lessons Learned –– ImplementationImplementationLessons Learned Lessons Learned ImplementationImplementation
Include both line staff and management in gthe implementation process
Provide hands on trainingov e a s o t a g Provide on-going support beyond training Be prepared to uncover programmatic Be prepared to uncover programmatic
issues – have mechanism to address
Lesson Learned Lesson Learned –– Data QualityData QualityLesson Learned Lesson Learned Data QualityData Quality Clearly define data elements and
t ti h ti f f d t expectations such as time frames for data entry
Ideally, QA will be done by both the service Ideally, QA will be done by both the service provider and the funder
Create tools such as exception reports and ti li ttimeliness reports
Develop a reward system for positive performanceperformance
Support poor performers by providing concrete feedback and helping them develop
i f istrategies for improvement
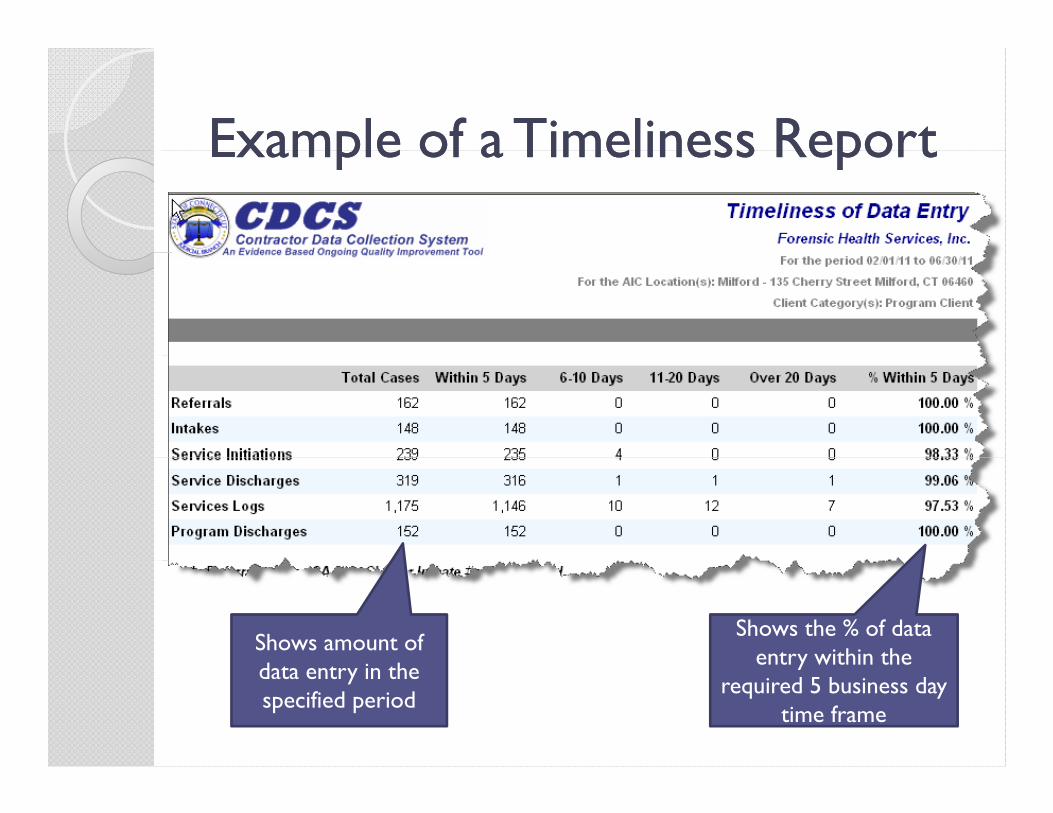
Example of a Timeliness ReportExample of a Timeliness ReportExample of a Timeliness ReportExample of a Timeliness Report
Shows amount of d h
Shows the % of data entry within the data entry in the
specified period
entry within the required 5 business day
time frame
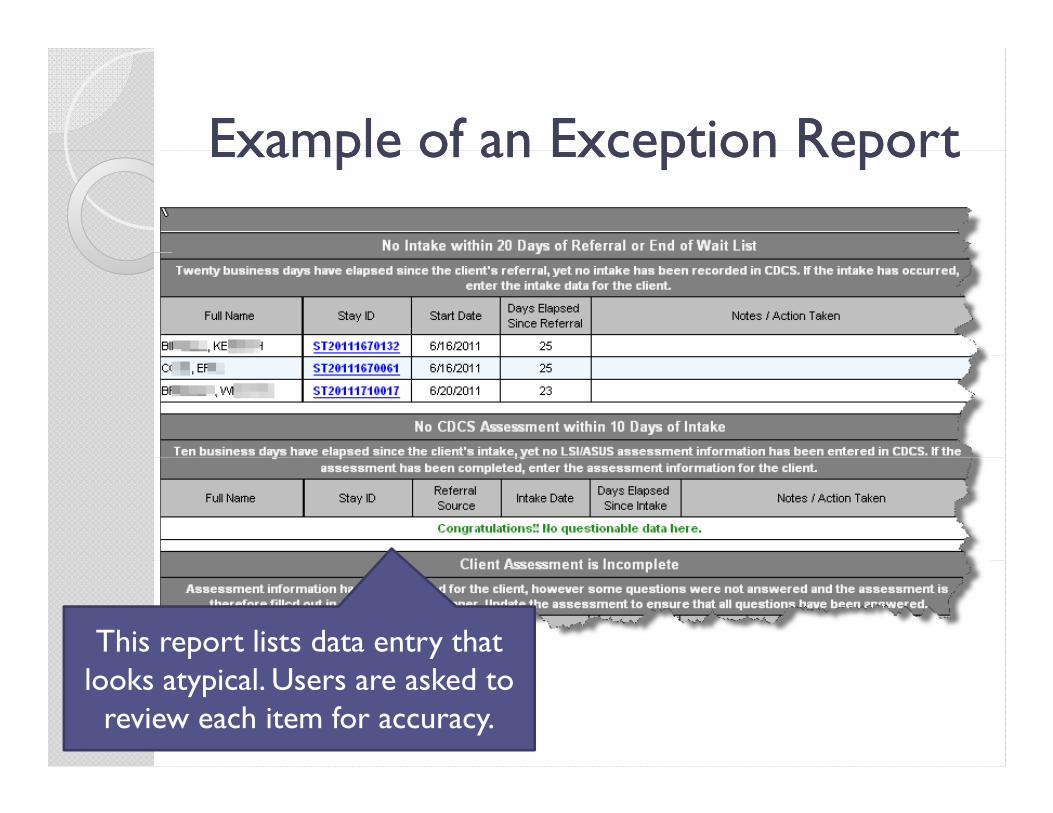
Example of an Exception ReportExample of an Exception ReportExample of an Exception ReportExample of an Exception Report
This report lists data entry that looks atypical. Users are asked to
review each item for accuracy.
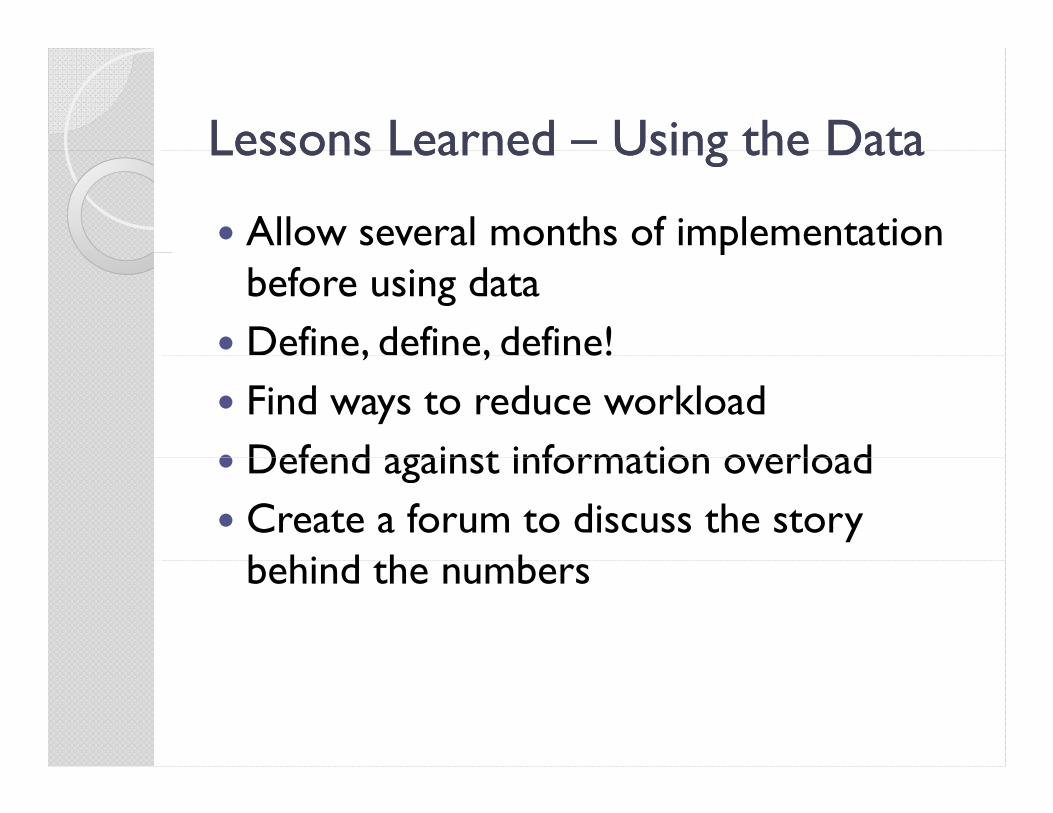
Lessons Learned Lessons Learned –– Using the DataUsing the DataLessons Learned Lessons Learned Using the DataUsing the Data
Allow several months of implementation pbefore using data
Define, define, define!e e, e e, e e! Find ways to reduce workload Defend against information overload Defend against information overload Create a forum to discuss the story
b hi d th bbehind the numbers
To sum it up in one word:To sum it up in one word:To sum it up in one word:To sum it up in one word:
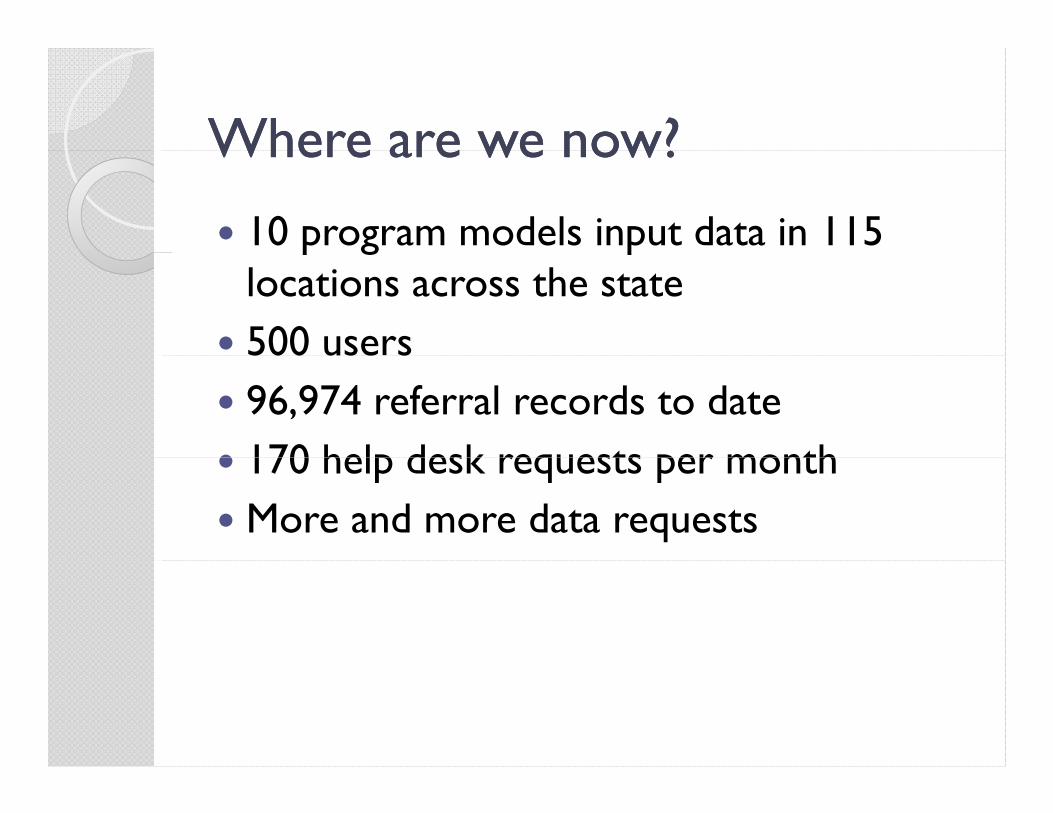
Where are we now?Where are we now?Where are we now?Where are we now?
10 program models input data in 115 p g plocations across the state
500 users500 use s 96,974 referral records to date 170 help desk requests per month 170 help desk requests per month More and more data requests
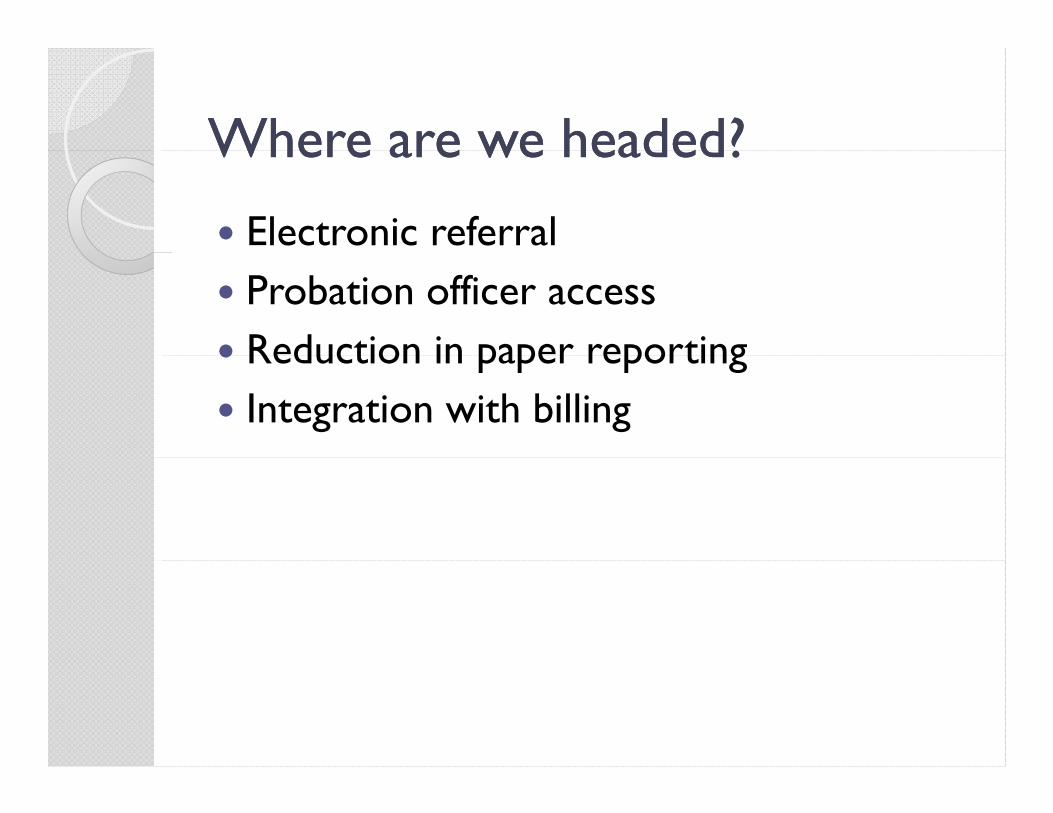
Where are we headed?Where are we headed?Where are we headed?Where are we headed?
Electronic referral Probation officer access Reduction in paper reporting Reduction in paper reporting Integration with billing

QUESTIONS?QUESTIONS?QUESTIONS?QUESTIONS?