Embed Size (px)
Citation preview
Connecting Neighbours - Engaging the World
Council for Scientific and Industrial Research (CSIR)
Through directed research, development and innovation, the CSIR
improves the competitiveness of industry and the quality of life of the
people of the country. South Africa’s CSIR was established as a science
council in 1945 by an Act of Parliament. It has a proud track record of
multidisciplinary research and a bright and challenging future through science,
engineering and technology (SET), undertaken by its innovative individuals
and teams.
The CSIR’s mandate is as stipulated in the Scientific Research Council Act (Act 46 of 1988, as amended by Act 71 of 1990), section 3.
Scientific editor: Nadia Viljoen (CSIR)
Contact details: CSIR Built Environment
Tel: +27 12 841 3455
E-mail: [email protected];
Website: www.csir.co.za
Downloadable versions available at: www.csir.co.za/sol
ISBN number: 978-0-7988-5609-6
© 2013
The State of LogisticsTM is a CSIR trade mark,
with trade mark applications filed.
Design and layout by Designwave, www.designwave.co.za
EXECUTIVE SUMMARY
Nadia Viljoen (CSIR), Scientific editor: 9th State of LogisticsTM survey
While growth prospects in the developed world are meagre at best, big
business turns its attention to developing regions such as southern Africa for
its next growth frontier. Multinational corporations, unlike governments, do
not see political boundaries when they consider a region, they regard the growth of
consumer populations, the development of economies, the discovery of raw materials,
the availability of labour and – of relevance to this survey – the ease with which products
and services can be moved into, out of and within that region. This ‘business mobility’
stretches further than the physical rail lines and highways between countries; it includes
the openness of governments to collaborate with one another and with the private
sector; the removal of regulatory and operational barriers in cross-border trade; the
availability of logistics services that penetrate the entire region, not just one country; and,
critically, the availability of appropriately skilled people who are the lifeblood of a vibrant
logistics sector.
Although Africa’s current participation in global trade is negligible – less than 5% – ,
governments and businesses agree unanimously that the potential of the continent,
southern Africa in particular, is palpable. This sentiment is evidenced by the increase in
foreign direct investment in sub-Saharan Africa from US $29 billion in 2010 to US $37 billion
in 20111. However, southern Africa still has many bridges to build before it represents a
coherent region of economic potential to investors. Intra-African trade is estimated at
only 10%, while regional trade in the developing markets of South America and Asia is
22% and 50%, respectively2.
The 9th State of LogisticsTM survey for South Africa 2012 delivers a message of action.
South Africa must make great strides in addressing critical issues relating to the road
freight sector, shifting freight from road to rail and addressing rampant skills shortages
and misalignment in the logistics sector. The Southern African Development Community
(SADC) needs to see governments and the private sector joining hands to realise
1 Albert, A. and Jali, P. Accessing Africa: What gate, which way? eThekwini Municipality. Economic Development and Investment Promotion Unit: Policy, Strategy, Information & Research.
2 Hasse, K. Non-tariff barriers choke African trade. Good Governance Africa. Available: http://gga.org/analysis/non-tariff-barriers-choke-african-trade
ambitious inland corridor initiatives and develop a world-class maritime transhipment
community that would open the region up for trade. Globally, the scales are tipping
that measure the trade-offs favouring economic specialisation, economies of scale
and growth in international trade at the cost of a higher demand for freight transport. A
reframing of the role of logistics in supporting truly sustainable economic development is
imminent.
SECTION 1: LOGISTICS COSTS
National logistics costs and global trends
This year’s survey takes a huge leap in the study and publication of South Africa’s national
logistics costs which is in its ninth consecutive year. Dedicated effort from researchers to
close the time-lag between data collection and publication has ensured that the 2013
edition reports on logistics costs and freight flows of both 2011 and 2012. Furthermore,
the calculation of the four components of logistics costs (transport costs, inventory
carrying costs, warehousing and management and administration) is now on par with
international benchmarks through on-going collaboration with a growing number of
global experts in the field. The calculation of externality costs in this year’s survey has also
been greatly refined. The focus of the study has been to dig deeper into the underlying
logistics behaviour that drives cost trends and to scrutinise the relationship between
logistics costs and the GDP.
Logistics costs as a percentage of total GDP have risen by 0.7% to 12.6% in 2011 and
are estimated to have risen to 12.8% in 2012. A starker reality is painted, however, when
considering logistics costs as a percentage of only the primary (extraction) and secondary
(beneficiation) sectors. Logistics costs as a percentage of the transportable GDP was 44%
in 2011 and 46% in 2012. The upward trend of transport costs was identified as a major risk
in previous surveys. Its contribution to overall logistics costs in 2012 is pinned at 61%, the
highest it has been in the past nine years and far higher than the global average. The
vulnerability of transport costs to a volatile exogenous cost driver – the price of crude oil
– and South Africa’s entrenched dependence on road transport does not bode well for
the economy if the future is to be business-as-usual.
Inland freight volumes have risen across the board in 2011 (+4.9% in tonnes, +10.1% in
tonne-km) and 2012 (+1.8% in tonnes, +2.1% in tonne-km) with the most significant growth
being on the KwaZulu-Natal–Gauteng and Western Cape–Gauteng corridors. Worth
noting is the slight increase in overall rail market share, from 11.1% in 2010 to 11.5% in 2012
in terms of tonnes, and from 29.3% in 2010 to 29.9% in 2012 in terms of tonne-km.
ii iii
Globally the opinion is growing that economic specialisation, economies of scale and
the resulting global trade have reached their peak and decades to come will see a
revolution in how economic growth will be characterised. These drastic changes in trade
will force a re-evaluation of the role of logistics, requiring innovative supply-side solutions
to drive efficiency and radical demand-side solutions to reduce the demand for logistics
services. GDP will no longer be the trumping development metric.
Investigation of road freight challenges and costs in South Africa
With 70.1% of South Africa’s inland tonne-km on road, challenges and cost escalations in
the road freight sector affect all South Africans – businesses and consumers alike. Data
gathered from a broad range of industry and government stakeholders identified the
key challenges and cost drivers in the South African road freight sector. Respondents felt
that poor road conditions (64%), the cost of fuel (52%) and a lack of law enforcement
and prevalent non-compliance (43%) are the top three challenges in the industry. The
condition of the country’s roads is also regarded as a critical cost driver by 73% of the
respondents, followed by the (un)availability of return loads and the costs associated
with empty runs (66%), congestion and its associated delays (52%), and theft (52%).
Compared to the United States of America (USA), the United Kingdom (UK) and
Australia, South Africa has the lowest per-lane construction cost at R30 million/lane-km
and the lowest per-lane maintenance cost at R300 000/lane-km. Lower labour costs in
South Africa and the fact that South Africa conducts significantly less maintenance on its
road network contribute to these figures. South Africa does, however, have the highest
percentage of road transport costs to GDP (4.7%) which is not surprising if one considers
the relatively low investment in maintenance and the cited contribution of poor road
conditions to road freight costs.
Basically, key challenges experienced by stakeholders in the sector are problems
linked to the country’s road infrastructure and government service delivery, as well as a
lack of policies and the implementation of these.
The potential effects of deteriorating road conditions in South Africa
The contrast between the state of South Africa’s primary road network, managed
and maintained by the South African National Road Agency Limited (SANRAL), and its
secondary network, provincial road networks managed and maintained by provincial
authorities, is blatant in this year’s analysis. If the 2011 road freight volumes on the 22
major freight corridors were transported on provincial roads instead of the primary road
network, there would have been an increase of R625 million in fuel, tyre and maintenance
and repair costs impacting operators directly. While SANRAL has done a good job of
maintaining the primary road network, the condition of provincial road networks has
deteriorated markedly.
The contribution of poor road conditions to fatal accidents shows, however, that the
effect of bad roads stretch much further than increased vehicle operating costs. Road-
related factors contribute to 5-15% of fatal road accidents, of which 28% can be attributed
to poor road surface conditions. The total cost of fatal accidents caused by poor road
conditions in 2010/2011 is estimated at between R207 million and R621 million. Hundreds of
deaths could have been prevented if roads were kept in acceptable conditions.
SECTION 2: REGIONAL CONNECTIVITY
Developing the SADC port community
There lies great opportunity for SADC in becoming a world-class transhipment community.
Firstly, the benefits to inland supply chains will be immense as frequent and reliable coastal
shipping and better connectivity to global markets propel operational efficiencies.
Secondly, SADC could earn tangible revenues by offering transhipment services for
maritime traffic currently passing by the continent on the Cape Route, not to mention the
volumes of transhipment cargo that could shift from the Suez Canal Route to the Cape
Route if SADC offered a globally competitive transhipment alternative.
Compared to three other established transhipment communities, namely South East
Asia, the Caribbean and the Mediterranean, SADC has much ground to cover in terms
of establishing intraregional connectivity and boosting its importance in the context
of the global maritime network. South Africa and Mauritius currently rank 39th and 50th,
respectively, out of 157 coastal countries in terms of maritime importance.
The comparison also shows that SADC is similar to the Mediterranean in that the
economies that play the most influential role in the port community structure are also
home to the port authorities. This contrasts with the South East Asian and Caribbean
communities that hinge on economies outside of the communities. Port authorities in
SADC thus have a decisive influence in driving the vision of a world-class transhipment
community. This vision requires port authorities to become facilitators that bring together
those private and public sector role players without which any SADC maritime strategy is
but wishful thinking.
In terms of developing a thriving port community, the key competitive elements that
require specific attention in SADC are the regional connectivity of its inland transport,
iv v
the quality of inland logistics services, cargo availability and good market structure.
Further competitive differentiators that could enhance SADC’s standing in the maritime
community are lowering port tariffs, especially for transhipment cargoes; enhancing the
availability of ship services at ports; and increasing the reliability of port operations and
scheduling. All these competitive differentiators are, however, moot points if infrastructure
constraints and operational capacity simply cannot handle increased business volumes
or larger vessels.
Inland connectivity in SADC
Immense potential and business opportunities exist in southern Africa in terms of natural
resources, low-cost labour and a rapidly growing consumer market. Three quarters of
business executives in South Africa have indicated that expanding into emerging
markets is one of their top five strategic objectives, with SADC being the most favoured
destination. However, the top three constraints to doing business in Africa are: Availability
of reliable service providers and partners; lack of adequate infrastructure; and transit
times and reliability3. The region aims to redress a legacy of extremely poor inland
connectivity through the development of strategic trade and logistics corridors that link
economic centres, countries and ports.
Various corridor initiatives are underway in SADC, some more advanced than
others. Corridors serving developed cargo bases are the Trans-Caprivi, Trans-Cunene
and Trans-Kalahari corridors stretching inland from Walvis Bay and the Maputo corridor,
linking Mozambique with South Africa. Corridors running south from Dar es Salaam are
earmarked as high-growth corridors while the Nacala, Beira, Mtwara and Lobito corridors
will become high-growth corridors in the long-term in response to the rapid development
of mining activities in SADC.
For the corridor initiatives to be successful, governments need to create an environment
conducive to lucrative public-private partnerships. The necessary collaborative platforms
and frameworks required to fast-track open discussion and negotiation between public
and private sectors are lacking and this must be redressed urgently. More generally, the
integrity and strength of political and regulatory institutions are still questionable in SADC
and corruption erodes competitiveness and broad-based socio-economic development.
Additional operational barriers that must be addressed are the cargo imbalances that
result in millions wasted on empty trips, and gross cross-border inefficiencies that increase
transit time and diminish reliability.
3 Barloworld Logistics. 2012. 2012 supplychainforesight: South Africa Inc.: Growth, Competitiveness and the Africa Question. Available: www.supplychainforesight.co.za.
SECTION 3: TOPICAL RESEARCH
Transport infrastructure and planning
Infrastructure – transport infrastructure in particular – is critical for the economic
development and growth of a country. The National Development Plan, now adopted
by the South African government as its development plan for the future, clearly states the
tremendous challenge the country faces in this regard by effectively missing a generation
of capital investment in infrastructure. South Africa is not unique; around the world,
inadequate or poorly maintained infrastructure presents major economic challenges,
competing for scarce resources from governments already struggling financially.
The latest report card published by the South African Institution of Civil Engineering
(SAICE) describes the state of freight transport infrastructure in the country. It highlights the
severe disparity in road conditions depending on the government authority responsible
for its upkeep. On the rail side, heavy-haul freight lines are well maintained and general
freight lines show a slight improvement, while branch networks are in a state of disrepair.
Ports show steady improvement and are reported to be fairly well-maintained. The
Airports Company of South Africa (ACSA) provides world-class aviation infrastructure at
most of the airports under its jurisdiction.
South Africa has a legacy of good, comprehensive transport infrastructure plans that
do not get implemented. The Moving South Africa Forward Strategy developed in 1998
was succeeded by the National Freight Logistics Strategy in 2005 and then the National
Transport Master Plan 2050 (NATMAP 2050). The first two plans had limited impact while it
is too early to judge the results of NATMAP 2050.
Renewed emphasis by government in 2012 on infrastructure development resulted
in the establishment of the Presidential Infrastructure Coordinating Commission (PICC),
headed by the President, to coordinate and oversee the implementation of strategic
infrastructure projects (SIPs) that stimulate social and economic growth. Public-sector
funding for all infrastructure projects is estimated at R844.5 billion for the 2012/2013–
2014/2015 period, with Transnet to invest a further R300 billion in rail and port developments
over seven years starting in 2012. However, private-sector involvement is non-negotiable
for the success of transport infrastructure projects – both from a funding and planning
point of view.
vi vii
Skills shortages and requirements in the logistics industry in South Africa
The unavailability of a skilled workforce is viewed as one of the key constraints to the
expansion of business operations in South Africa. This appears to be a global problem with
39% of businesses around the world struggling to recruit the appropriate people. Nearly
two in five businesses (37%) in the BRIC (Brazil, Russia, India and China) economies believe
an inability to get the right workers will dampen growth in 2013. It has thus become critical
to identify the logistics skills requirements in South Africa so that these acute shortages can
be addressed to the benefit of trade in and with South Africa and SADC.
Two surveys were conducted in 2011 and 2012 to ascertain the trends and statistics
with regard to the current logistics skills gaps in South Africa. The six primary skills groups
emanating from the surveys were: General management; Behavioural/Interpersonal
skills; Logistics awareness; Logistics analytical; Logistics information technology (IT); and
Environmental awareness. In both years Logistics awareness was rated as the most
important skills group, followed closely by General management. In 2012, Logistics
analytical skills moved from fourth to third position. Managers also indicated that those
skills regarded as most critical when recruiting people in the logistics sector comprise the
‘softer’ skills that fall under Behavioural/Interpersonal skills, General management and
Logistics awareness.
On operational level, South African businesses generally expect at least a high school
education, if not more. At tactical level, businesses generally expect some form of tertiary
education and at strategic level, this increases to a general minimum of a Bachelor’s
degree. Similar patterns are indicated regarding experience; it is generally expected that
some level of experience is required, even at operational level. This increases at tactical
level and even more at strategic level, where the majority of businesses require at least
five years of experience.
Although operational positions are relatively easy to fill, an average of 65% of South
African employers in the logistics sector have indicated that it was difficult to fill tactical-
level positions. Strategic-level positions are becoming more challenging to fill, with 63%
indicating difficulties in 2011 and 66% in 2012.
CONCLUSION
The 9th State of LogisticsTM survey covers a broad range of research topics contributed by
a variety of experts in the field. This executive summary is aimed at whetting your appetite
for interacting with the articles contained in the publication. This year’s edition marks a
milestone in the journey of the survey. Much effort went into preparing logistics costs and
freight flow results for 2011 and 2012, effectively closing the two-year time lag in previous
reporting. In addition, the research process was opened to industry feedback through a
pre-launch event which provided valuable input during the compilation of the articles.
ACKNOWLEDGEMENTS
The CSIR is proud to present the 9th State of Logistics™ survey in concert with IMPERIAL
Logistics and the Stellenbosch University Centre for Supply Chain Management.
Furthermore, this publication would not have been possible without the research
contributions by the University of Pretoria, the University of Johannesburg, Volition,
Taemané Blue, the Department of Transport and HWI Consulting.
viii ix
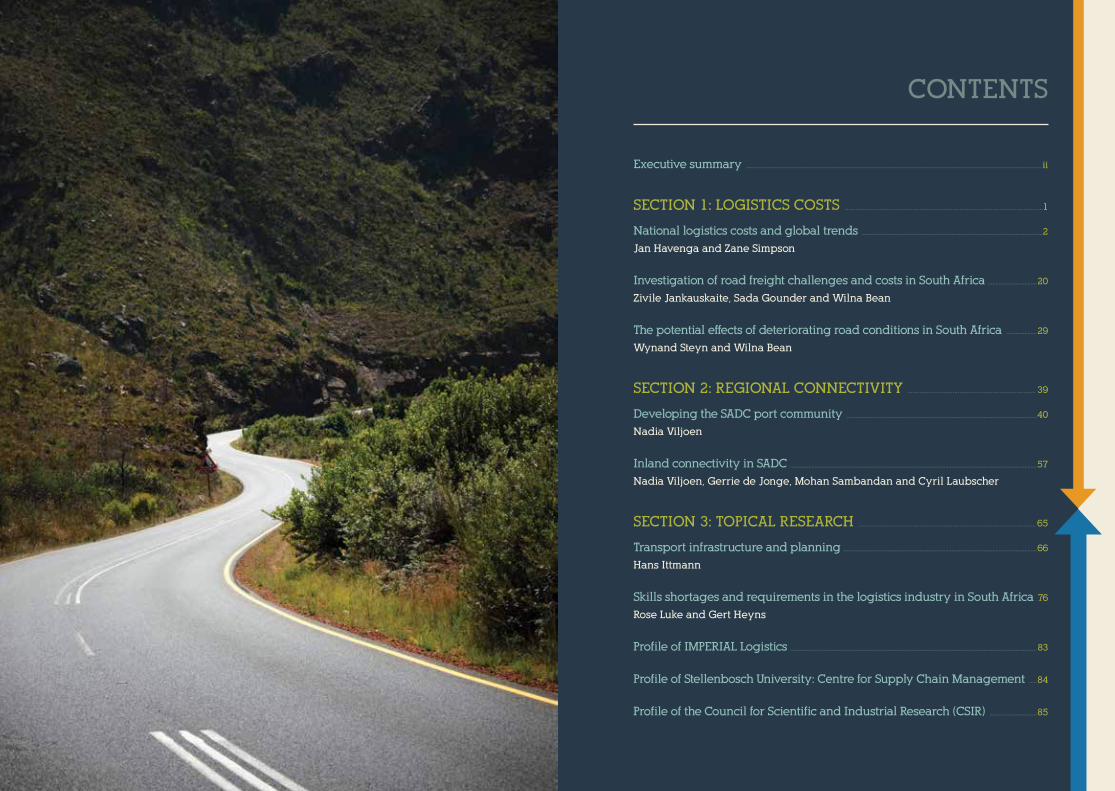
CONTENTS
Executive summary .................................................................................................................................................................................................. ii
SECTION 1: LOGISTICS COSTS ..................................................................................................................1
National logistics costs and global trends .......................................................................................................................2
Jan Havenga and Zane Simpson
Investigation of road freight challenges and costs in South Africa ................................20
Zivile Jankauskaite, Sada Gounder and Wilna Bean
The potential effects of deteriorating road conditions in South Africa ....................29
Wynand Steyn and Wilna Bean
SECTION 2: REGIONAL CONNECTIVITY ..........................................................................39
Developing the SADC port community .............................................................................................................................40
Nadia Viljoen
Inland connectivity in SADC ..................................................................................................................................................................57
Nadia Viljoen, Gerrie de Jonge, Mohan Sambandan and Cyril Laubscher
SECTION 3: TOPICAL RESEARCH ......................................................................................................65
Transport infrastructure and planning ...............................................................................................................................66
Hans Ittmann
Skills shortages and requirements in the logistics industry in South Africa .76
Rose Luke and Gert Heyns
Profile of IMPERIAL Logistics ..................................................................................................................................................................83
Profile of Stellenbosch University: Centre for Supply Chain Management .....84
Profile of the Council for Scientific and Industrial Research (CSIR) ...............................85
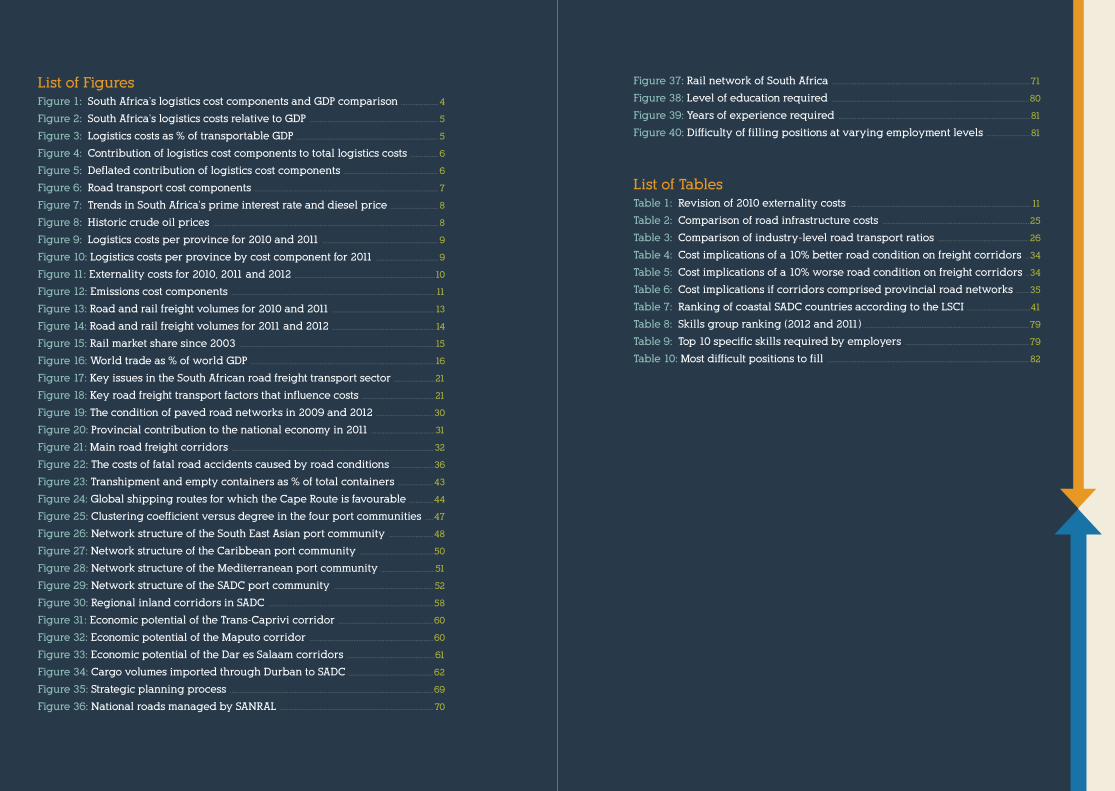
List of FiguresFigure 1: South Africa’s logistics cost components and GDP comparison .......................4
Figure 2: South Africa’s logistics costs relative to GDP ...............................................................................5
Figure 3: Logistics costs as % of transportable GDP .......................................................................................5
Figure 4: Contribution of logistics cost components to total logistics costs .................6
Figure 5: Deflated contribution of logistics cost components ..........................................................6
Figure 6: Road transport cost components .................................................................................................................7
Figure 7: Trends in South Africa’s prime interest rate and diesel price .............................8
Figure 8: Historic crude oil prices ..........................................................................................................................................8
Figure 9: Logistics costs per province for 2010 and 2011 .......................................................................9
Figure 10: Logistics costs per province by cost component for 2011 ......................................9
Figure 11: Externality costs for 2010, 2011 and 2012 ......................................................................................10
Figure 12: Emissions cost components .............................................................................................................................11
Figure 13: Road and rail freight volumes for 2010 and 2011 ...............................................................13
Figure 14: Road and rail freight volumes for 2011 and 2012 ...............................................................14
Figure 15: Rail market share since 2003 ........................................................................................................................15
Figure 16: World trade as % of world GDP .................................................................................................................16
Figure 17: Key issues in the South African road freight transport sector .........................21
Figure 18: Key road freight transport factors that influence costs .............................................21
Figure 19: The condition of paved road networks in 2009 and 2012 ...................................30
Figure 20: Provincial contribution to the national economy in 2011 .......................................31
Figure 21: Main road freight corridors ............................................................................................................................32
Figure 22: The costs of fatal road accidents caused by road conditions .........................36
Figure 23: Transhipment and empty containers as % of total containers ......................43
Figure 24: Global shipping routes for which the Cape Route is favourable ...............44
Figure 25: Clustering coefficient versus degree in the four port communities .....47
Figure 26: Network structure of the South East Asian port community ...........................48
Figure 27: Network structure of the Caribbean port community .............................................50
Figure 28: Network structure of the Mediterranean port community .................................51
Figure 29: Network structure of the SADC port community .............................................................52
Figure 30: Regional inland corridors in SADC .....................................................................................................58
Figure 31: Economic potential of the Trans-Caprivi corridor ..........................................................60
Figure 32: Economic potential of the Maputo corridor ............................................................................60
Figure 33: Economic potential of the Dar es Salaam corridors ......................................................61
Figure 34: Cargo volumes imported through Durban to SADC ....................................................62
Figure 35: Strategic planning process .............................................................................................................................69
Figure 36: National roads managed by SANRAL ..............................................................................................70
Figure 37: Rail network of South Africa ..........................................................................................................................71
Figure 38: Level of education required .........................................................................................................................80
Figure 39: Years of experience required ......................................................................................................................81
Figure 40: Difficulty of filling positions at varying employment levels ...........................81
List of TablesTable 1: Revision of 2010 externality costs ...............................................................................................................11
Table 2: Comparison of road infrastructure costs ..........................................................................................25
Table 3: Comparison of industry-level road transport ratios ........................................................26
Table 4: Cost implications of a 10% better road condition on freight corridors ..34
Table 5: Cost implications of a 10% worse road condition on freight corridors ..34
Table 6: Cost implications if corridors comprised provincial road networks ........35
Table 7: Ranking of coastal SADC countries according to the LSCI .......................................41
Table 8: Skills group ranking (2012 and 2011) .....................................................................................................79
Table 9: Top 10 specific skills required by employers ............................................................................79
Table 10: Most difficult positions to fill ............................................................................................................................82
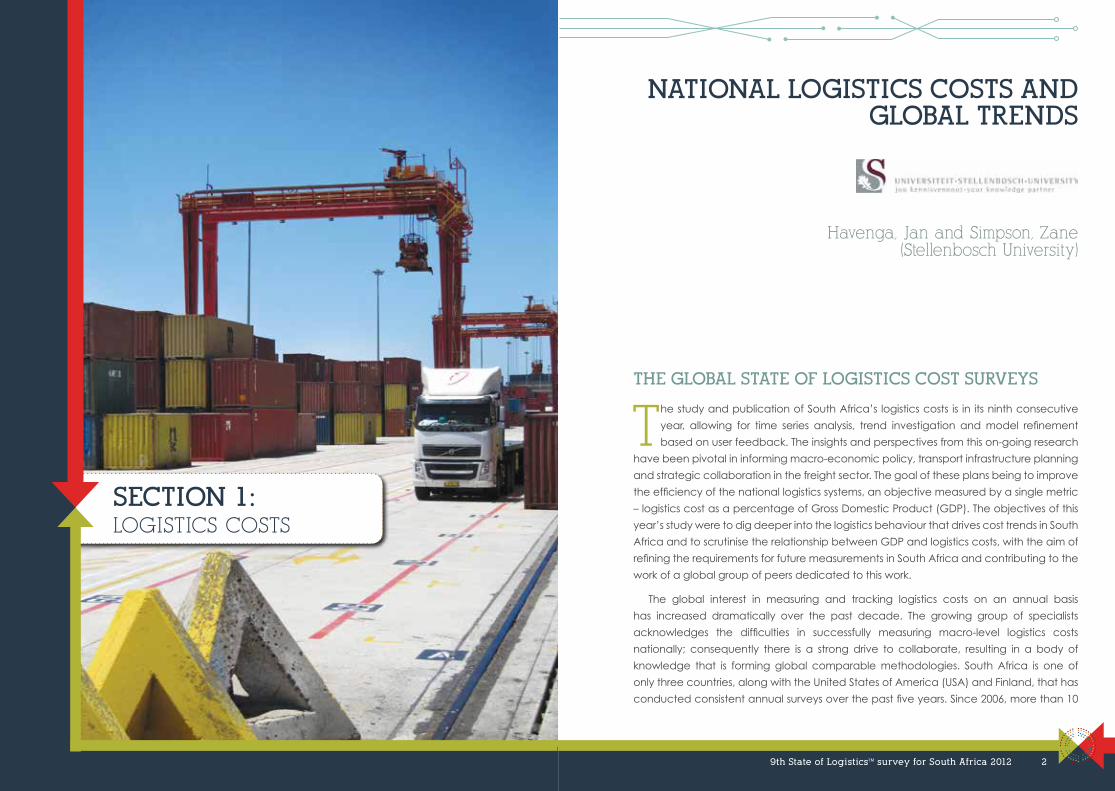
NATIONAL LOGISTICS COSTS AND GLOBAL TRENDS
Havenga, Jan and Simpson, Zane (Stellenbosch University)
THE GLOBAL STATE OF LOGISTICS COST SURVEYS
The study and publication of South Africa’s logistics costs is in its ninth consecutive
year, allowing for time series analysis, trend investigation and model refinement
based on user feedback. The insights and perspectives from this on-going research
have been pivotal in informing macro-economic policy, transport infrastructure planning
and strategic collaboration in the freight sector. The goal of these plans being to improve
the efficiency of the national logistics systems, an objective measured by a single metric
– logistics cost as a percentage of Gross Domestic Product (GDP). The objectives of this
year’s study were to dig deeper into the logistics behaviour that drives cost trends in South
Africa and to scrutinise the relationship between GDP and logistics costs, with the aim of
refining the requirements for future measurements in South Africa and contributing to the
work of a global group of peers dedicated to this work.
The global interest in measuring and tracking logistics costs on an annual basis
has increased dramatically over the past decade. The growing group of specialists
acknowledges the difficulties in successfully measuring macro-level logistics costs
nationally; consequently there is a strong drive to collaborate, resulting in a body of
knowledge that is forming global comparable methodologies. South Africa is one of
only three countries, along with the United States of America (USA) and Finland, that has
conducted consistent annual surveys over the past five years. Since 2006, more than 10
SECTION 1: LOGISTICS COSTS
9th State of LogisticsTM survey for South Africa 2012 2
countries set out to measure logistics costs every year, although none of these have been
successful in consistent annual measurements. Recent meta-analysis4 has established
that since 1995, 14 countries have attempted a survey-based measurement and 11
countries a statistics-based measurement. Overall, the number of consecutive national
surveys is growing, which will allow more robust time series analysis of logistics cost trends
in the near future.
The Logistics Performance Index Observatory (LPIO), a recent initiative driven by
the World Bank, has been convening global meetings since June 2010 to compare
the results and methodologies for measuring macro-level logistics costs. South African
researchers have been contributing to these meetings since their inception. At the most
recent meetings held in Finland and Washington in 2012, the contributions made by
researchers from Finland, Canada, Brazil, Germany, France, Korea and South Africa and
especially those contributions by Jean-Francois Arvis and Laurie Ojala, co-authors of the
Global Logistics Performance Index5, made great progress in pinning down standardised
methodologies for measurements. Following these discussions, certain methodological
improvements were made to the calculation of South African logistics costs and all
historical data were concordantly adjusted to reflect these changes. These improvements
reflect logistics costs more accurately and make the figures more comparable with
international benchmarks.
SOUTH AFRICAN LOGISTICS COSTS
A major difficulty in the annual statistics-based calculation of logistics costs is the
considerable lag in obtaining data from various sources and the time required to collate
these data. It is for this reason that previous editions of the State of LogisticsTM survey for
South Africa reported logistics cost data with a two-year time lag. In 2013, for the first time,
the researchers have succeeded in closing the gap. By taking into account the known
values of certain inputs such as the fuel price, interest rate and GDP during 2012, and the
estimated freight flow inputs based on 2011 data, estimated logistics costs for 2012 could
be calculated.
The two most notable methodological changes reflected in this year’s study was
removing profit as a cost element from the Management and administration cost
component and adapting the calculation of Storage and ports and renaming the
4 Rantasila, K. and Ojala L. 2012. Measurement of National-Level Logistics Costs and Performance: Discussion Paper 2012-04. Paris: International Transport Forum at the OECD.
5 Arvis, JF., Mustra, MA., Ojala, L., Shepherd, B., and Saslavsky, D. 2012. Connecting to Compete: Trade Logistics in the Global Economy: The Logistics Performance Index and Its Indicators. The World Bank. Washington, D.C.
cost component Warehousing. The calculation of these cost components now more
accurately reflects the international benchmark.
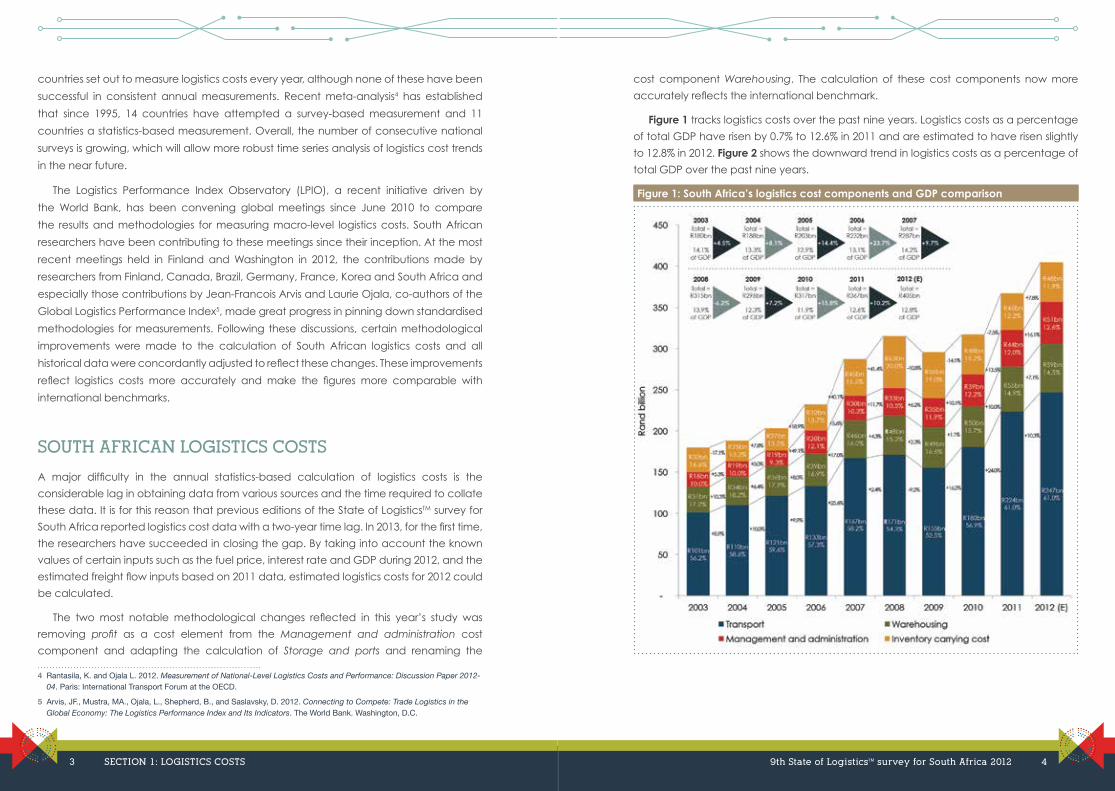
Figure 1 tracks logistics costs over the past nine years. Logistics costs as a percentage
of total GDP have risen by 0.7% to 12.6% in 2011 and are estimated to have risen slightly
to 12.8% in 2012. Figure 2 shows the downward trend in logistics costs as a percentage of
total GDP over the past nine years.
Figure 1: South Africa’s logistics cost components and GDP comparison
3 SECTION 1: LOGISTICS COSTS 9th State of LogisticsTM survey for South Africa 2012 4
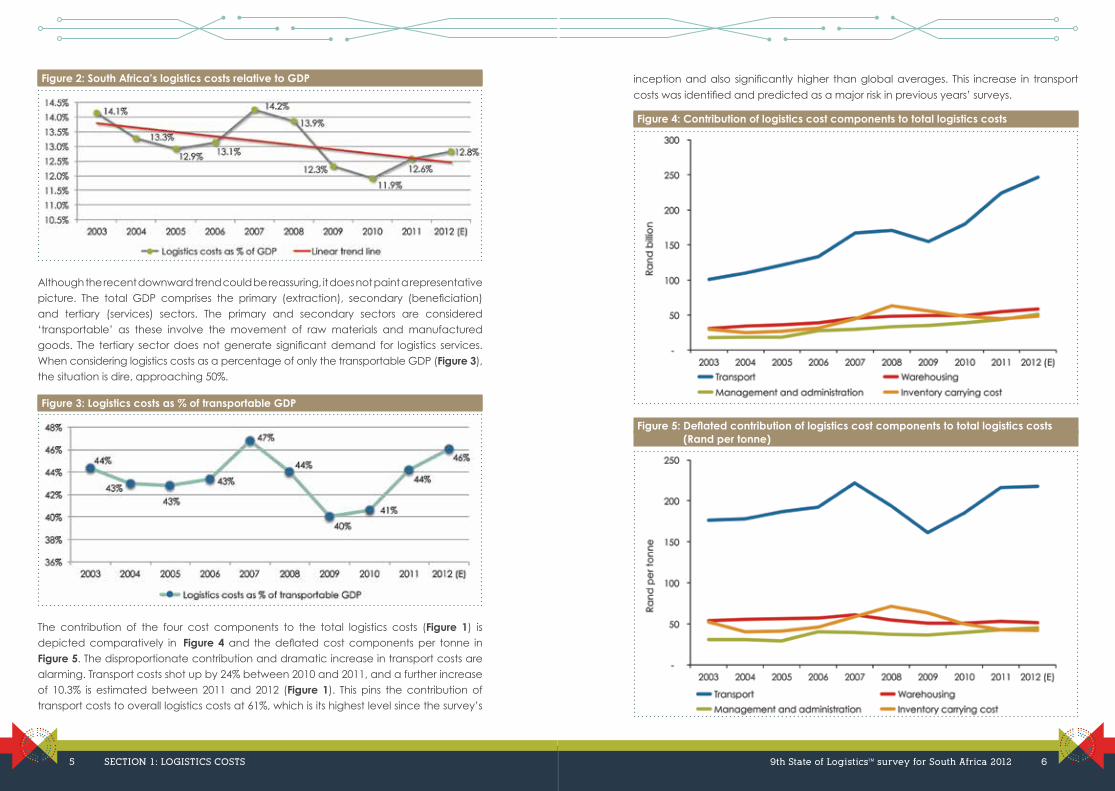
Figure 2: South Africa’s logistics costs relative to GDP
Although the recent downward trend could be reassuring, it does not paint a representative picture. The total GDP comprises the primary (extraction), secondary (beneficiation) and tertiary (services) sectors. The primary and secondary sectors are considered ‘transportable’ as these involve the movement of raw materials and manufactured goods. The tertiary sector does not generate significant demand for logistics services. When considering logistics costs as a percentage of only the transportable GDP (Figure 3), the situation is dire, approaching 50%.
Figure 3: Logistics costs as % of transportable GDP
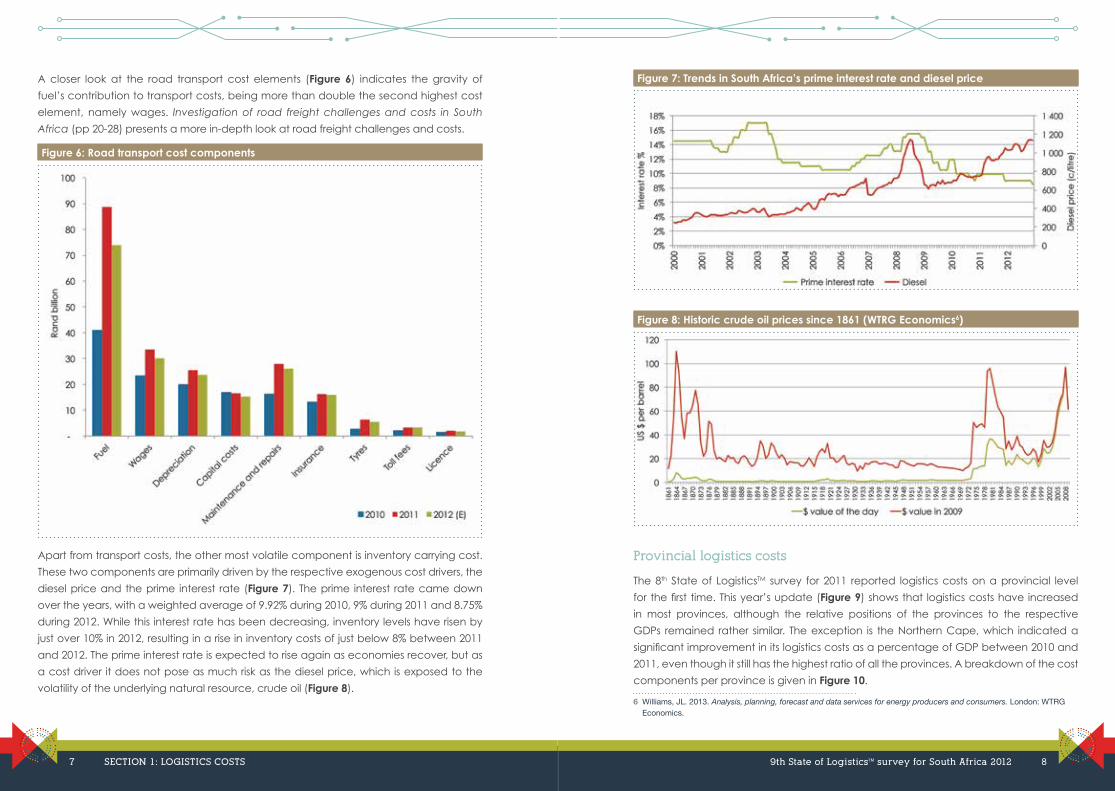
The contribution of the four cost components to the total logistics costs (Figure 1) is depicted comparatively in Figure 4 and the deflated cost components per tonne in Figure 5. The disproportionate contribution and dramatic increase in transport costs are alarming. Transport costs shot up by 24% between 2010 and 2011, and a further increase of 10.3% is estimated between 2011 and 2012 (Figure 1). This pins the contribution of transport costs to overall logistics costs at 61%, which is its highest level since the survey’s
inception and also significantly higher than global averages. This increase in transport
costs was identified and predicted as a major risk in previous years’ surveys.
Figure 4: Contribution of logistics cost components to total logistics costs
Figure 5: Deflated contribution of logistics cost components to total logistics costs (Rand per tonne)
5 SECTION 1: LOGISTICS COSTS 9th State of LogisticsTM survey for South Africa 2012 6
A closer look at the road transport cost elements (Figure 6) indicates the gravity of
fuel’s contribution to transport costs, being more than double the second highest cost
element, namely wages. Investigation of road freight challenges and costs in South
Africa (pp 20-28) presents a more in-depth look at road freight challenges and costs.
Figure 6: Road transport cost components
Apart from transport costs, the other most volatile component is inventory carrying cost.
These two components are primarily driven by the respective exogenous cost drivers, the
diesel price and the prime interest rate (Figure 7). The prime interest rate came down
over the years, with a weighted average of 9.92% during 2010, 9% during 2011 and 8.75%
during 2012. While this interest rate has been decreasing, inventory levels have risen by
just over 10% in 2012, resulting in a rise in inventory costs of just below 8% between 2011
and 2012. The prime interest rate is expected to rise again as economies recover, but as
a cost driver it does not pose as much risk as the diesel price, which is exposed to the
volatility of the underlying natural resource, crude oil (Figure 8).
Figure 7: Trends in South Africa’s prime interest rate and diesel price
Figure 8: Historic crude oil prices since 1861 (WTRG Economics6)
Provincial logistics costs
The 8th State of LogisticsTM survey for 2011 reported logistics costs on a provincial level
for the first time. This year’s update (Figure 9) shows that logistics costs have increased
in most provinces, although the relative positions of the provinces to the respective
GDPs remained rather similar. The exception is the Northern Cape, which indicated a
significant improvement in its logistics costs as a percentage of GDP between 2010 and
2011, even though it still has the highest ratio of all the provinces. A breakdown of the cost
components per province is given in Figure 10.
6 Williams, JL. 2013. Analysis, planning, forecast and data services for energy producers and consumers. London: WTRG Economics.
7 SECTION 1: LOGISTICS COSTS 9th State of LogisticsTM survey for South Africa 2012 8
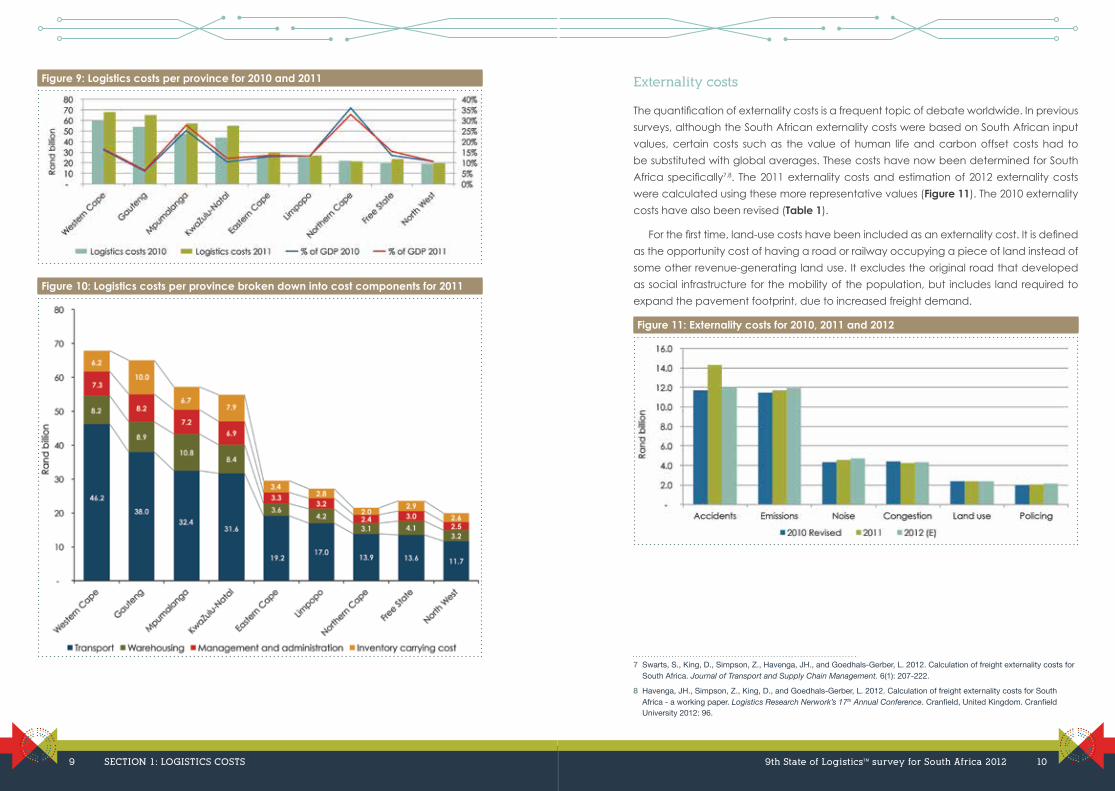
Figure 9: Logistics costs per province for 2010 and 2011
Figure 10: Logistics costs per province broken down into cost components for 2011
Externality costs
The quantification of externality costs is a frequent topic of debate worldwide. In previous
surveys, although the South African externality costs were based on South African input
values, certain costs such as the value of human life and carbon offset costs had to
be substituted with global averages. These costs have now been determined for South
Africa specifically7,8. The 2011 externality costs and estimation of 2012 externality costs
were calculated using these more representative values (Figure 11). The 2010 externality
costs have also been revised (Table 1).
For the first time, land-use costs have been included as an externality cost. It is defined
as the opportunity cost of having a road or railway occupying a piece of land instead of
some other revenue-generating land use. It excludes the original road that developed
as social infrastructure for the mobility of the population, but includes land required to
expand the pavement footprint, due to increased freight demand.
Figure 11: Externality costs for 2010, 2011 and 2012
7 Swarts, S., King, D., Simpson, Z., Havenga, JH., and Goedhals-Gerber, L. 2012. Calculation of freight externality costs for South Africa. Journal of Transport and Supply Chain Management. 6(1): 207-222.
8 Havenga, JH., Simpson, Z., King, D., and Goedhals-Gerber, L. 2012. Calculation of freight externality costs for South Africa - a working paper. Logistics Research Nerwork’s 17th Annual Conference. Cranfield, United Kingdom. Cranfield University 2012: 96.
9 SECTION 1: LOGISTICS COSTS 9th State of LogisticsTM survey for South Africa 2012 10
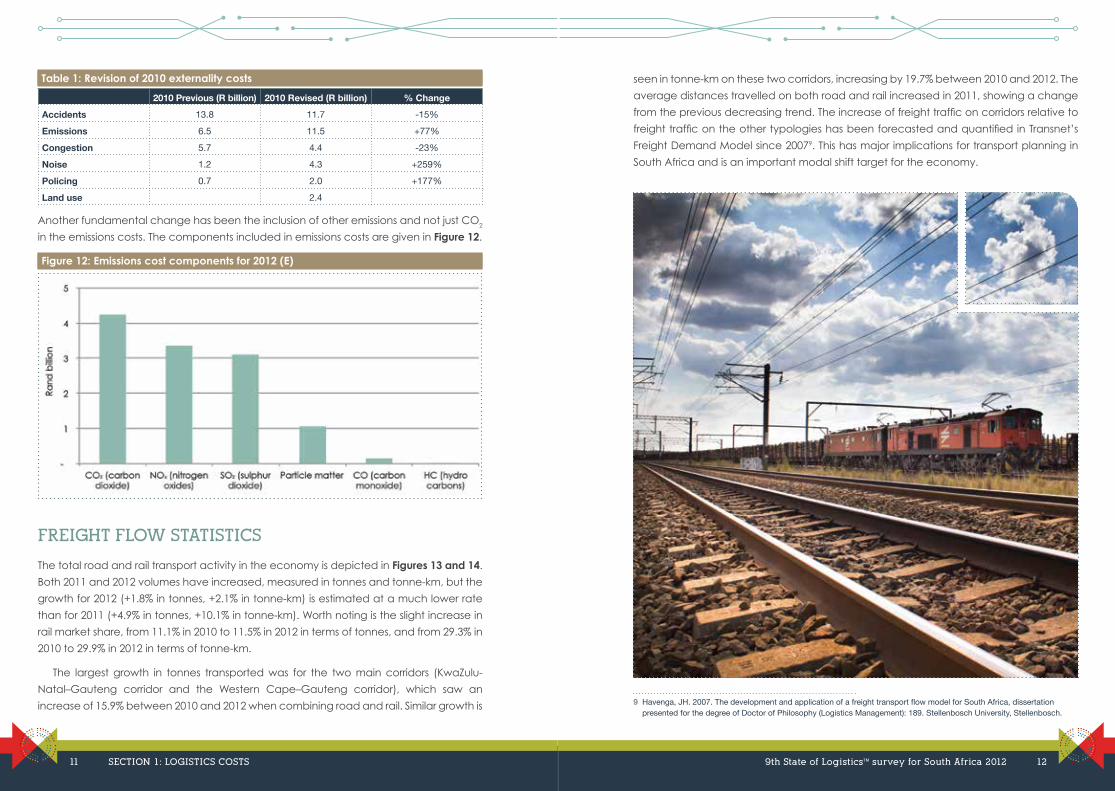
Table 1: Revision of 2010 externality costs
2010 Previous (R billion) 2010 Revised (R billion) % ChangeAccidents 13.8 11.7 -15%
Emissions 6.5 11.5 +77%
Congestion 5.7 4.4 -23%
Noise 1.2 4.3 +259%
Policing 0.7 2.0 +177%
Land use 2.4
Another fundamental change has been the inclusion of other emissions and not just CO2
in the emissions costs. The components included in emissions costs are given in Figure 12.
Figure 12: Emissions cost components for 2012 (E)
FREIGHT FLOW STATISTICS
The total road and rail transport activity in the economy is depicted in Figures 13 and 14.
Both 2011 and 2012 volumes have increased, measured in tonnes and tonne-km, but the
growth for 2012 (+1.8% in tonnes, +2.1% in tonne-km) is estimated at a much lower rate
than for 2011 (+4.9% in tonnes, +10.1% in tonne-km). Worth noting is the slight increase in
rail market share, from 11.1% in 2010 to 11.5% in 2012 in terms of tonnes, and from 29.3% in
2010 to 29.9% in 2012 in terms of tonne-km.
The largest growth in tonnes transported was for the two main corridors (KwaZulu-
Natal–Gauteng corridor and the Western Cape–Gauteng corridor), which saw an
increase of 15.9% between 2010 and 2012 when combining road and rail. Similar growth is
seen in tonne-km on these two corridors, increasing by 19.7% between 2010 and 2012. The
average distances travelled on both road and rail increased in 2011, showing a change
from the previous decreasing trend. The increase of freight traffic on corridors relative to
freight traffic on the other typologies has been forecasted and quantified in Transnet’s
Freight Demand Model since 20079. This has major implications for transport planning in
South Africa and is an important modal shift target for the economy.
9 Havenga, JH. 2007. The development and application of a freight transport flow model for South Africa, dissertation presented for the degree of Doctor of Philosophy (Logistics Management): 189. Stellenbosch University, Stellenbosch.
11 SECTION 1: LOGISTICS COSTS 9th State of LogisticsTM survey for South Africa 2012 12
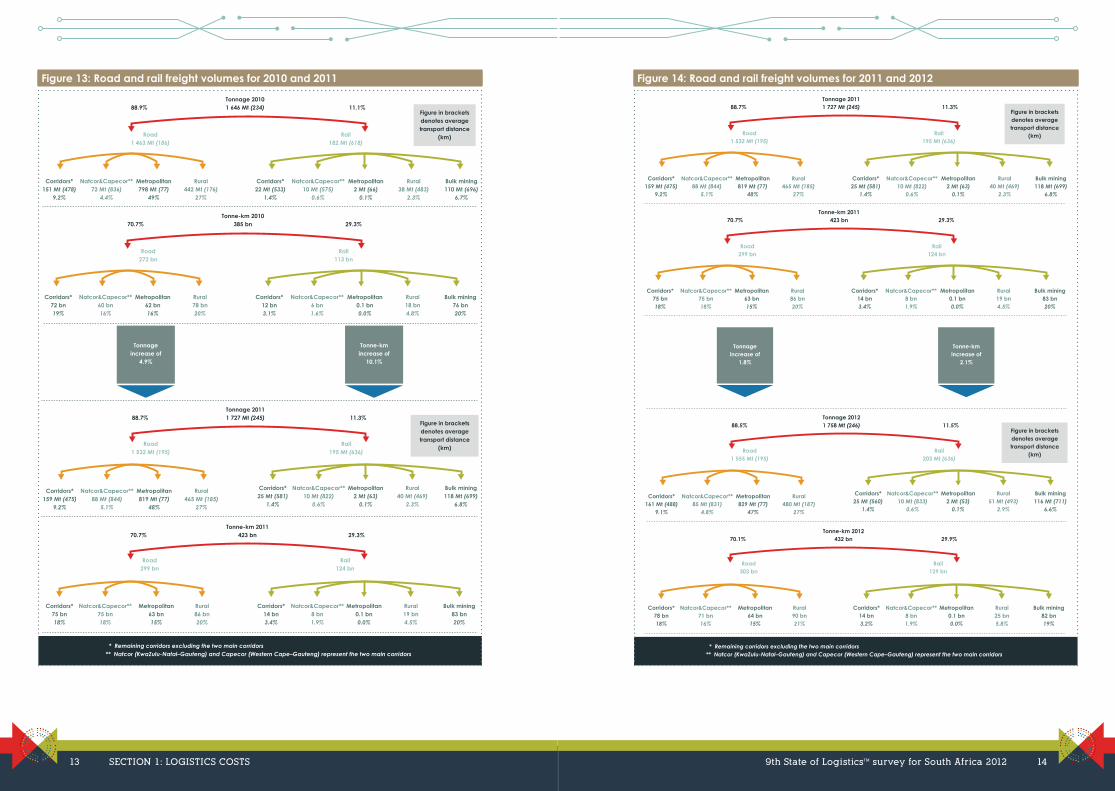
Figure 13: Road and rail freight volumes for 2010 and 2011
Figure in bracketsdenotes averagetransport distance
(km)
Rural442 Mt (176)
27%
Corridors*22 Mt (533)
1.4%
Corridors*151 Mt (478)
9.2%
Natcor&Capecor**72 Mt (836)
4.4%
Metropolitan798 Mt (77)
49%
Bulk mining110 Mt (696)
6.7%
Natcor&Capecor**10 Mt (575)
0.6%
Metropolitan2 Mt (66)
0.1%
Rural38 Mt (483)
2.3%
Road1 463 Mt (186)
Rail182 Mt (618)
88.9% 11.1%Tonnage 20101 646 Mt (234)
Rural78 bn20%
Corridors*12 bn3.1%
Corridors*72 bn19%
Natcor&Capecor**60 bn16%
Metropolitan62 bn16%
Bulk mining76 bn20%
Natcor&Capecor**6 bn1.6%
Metropolitan0.1 bn0.0%
Rural18 bn4.8%
Road272 bn
Rail113 bn
70.7% 29.3%Tonne-km 2010
385 bn
Rural465 Mt (185)
27%
Corridors*25 Mt (581)
1.4%
Corridors*159 Mt (475)
9.2%
Natcor&Capecor**88 Mt (844)
5.1%
Metropolitan819 Mt (77)
48%
Bulk mining118 Mt (699)
6.8%
Natcor&Capecor**10 Mt (822)
0.6%
Metropolitan2 Mt (63)
0.1%
Rural40 Mt (469)
2.3%
Road1 532 Mt (195)
Rail195 Mt (636)
88.7% 11.3%Tonnage 20111 727 Mt (245)
Rural86 bn20%
Corridors*14 bn3.4%
Corridors*75 bn18%
Natcor&Capecor**75 bn18%
Metropolitan63 bn15%
Bulk mining83 bn20%
Natcor&Capecor**8 bn1.9%
Metropolitan0.1 bn0.0%
Rural19 bn4.5%
Road299 bn
Rail124 bn
70.7% 29.3%Tonne-km 2011
423 bn
Tonnageincrease of
4.9%
Tonne-kmincrease of
10.1%
Figure in bracketsdenotes averagetransport distance
(km)
* Remaining corridors excluding the two main corridors** Natcor (KwaZulu-Natal–Gauteng) and Capecor (Western Cape–Gauteng) represent the two main corridors
Figure 14: Road and rail freight volumes for 2011 and 2012
Figure in bracketsdenotes averagetransport distance
(km)
Rural465 Mt (185)
27%
Corridors*25 Mt (581)
1.4%
Corridors*159 Mt (475)
9.2%
Natcor&Capecor**88 Mt (844)
5.1%
Metropolitan819 Mt (77)
48%
Bulk mining118 Mt (699)
6.8%
Natcor&Capecor**10 Mt (822)
0.6%
Metropolitan2 Mt (63)
0.1%
Rural40 Mt (469)
2.3%
Road1 532 Mt (195)
Rail195 Mt (636)
88.7% 11.3%Tonnage 20111 727 Mt (245)
Rural86 bn20%
Corridors*14 bn3.4%
Corridors*75 bn18%
Natcor&Capecor**75 bn18%
Metropolitan63 bn15%
Bulk mining83 bn20%
Natcor&Capecor**8 bn1.9%
Metropolitan0.1 bn0.0%
Rural19 bn4.5%
Road299 bn
Rail124 bn
70.7% 29.3%Tonne-km 2011
423 bn
Rural480 Mt (187)
27%
Corridors*25 Mt (560)
1.4%
Corridors*161 Mt (488)
9.1%
Natcor&Capecor**85 Mt (831)
4.8%
Metropolitan829 Mt (77)
47%
Bulk mining116 Mt (711)
6.6%
Natcor&Capecor**10 Mt (833)
0.6%
Metropolitan2 Mt (53)
0.1%
Rural51 Mt (493)
2.9%
Road1 555 Mt (195)
Rail203 Mt (636)
88.5% 11.5%Tonnage 20121 758 Mt (246)
Rural90 bn21%
Corridors*14 bn3.2%
Corridors*78 bn18%
Natcor&Capecor**71 bn16%
Metropolitan64 bn15%
Bulk mining82 bn19%
Natcor&Capecor**8 bn1.9%
Metropolitan0.1 bn0.0%
Rural25 bn5.8%
Road303 bn
Rail129 bn
70.1% 29.9%Tonne-km 2012
432 bn
Tonnageincrease of
1.8%
Tonne-kmincrease of
2.1%
Figure in bracketsdenotes averagetransport distance
(km)
* Remaining corridors excluding the two main corridors** Natcor (KwaZulu-Natal–Gauteng) and Capecor (Western Cape–Gauteng) represent the two main corridors
13 SECTION 1: LOGISTICS COSTS 9th State of LogisticsTM survey for South Africa 2012 14
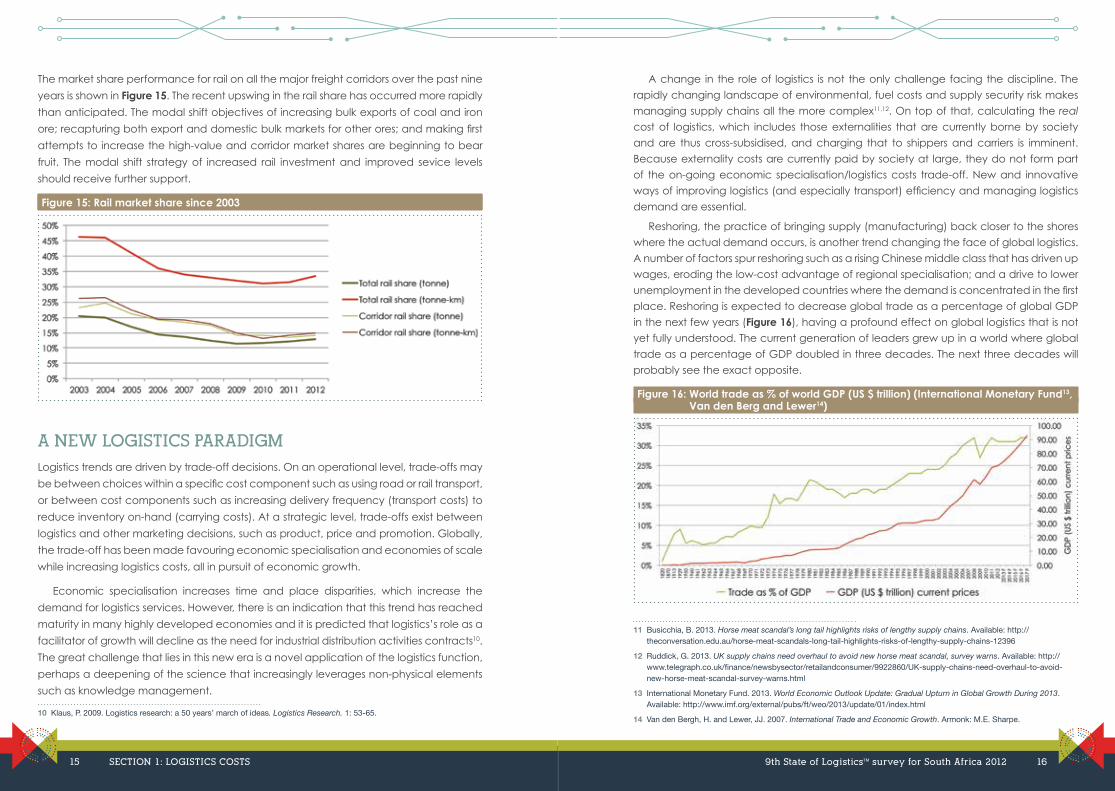
The market share performance for rail on all the major freight corridors over the past nine
years is shown in Figure 15. The recent upswing in the rail share has occurred more rapidly
than anticipated. The modal shift objectives of increasing bulk exports of coal and iron
ore; recapturing both export and domestic bulk markets for other ores; and making first
attempts to increase the high-value and corridor market shares are beginning to bear
fruit. The modal shift strategy of increased rail investment and improved sevice levels
should receive further support.
Figure 15: Rail market share since 2003
A NEW LOGISTICS PARADIGM
Logistics trends are driven by trade-off decisions. On an operational level, trade-offs may
be between choices within a specific cost component such as using road or rail transport,
or between cost components such as increasing delivery frequency (transport costs) to
reduce inventory on-hand (carrying costs). At a strategic level, trade-offs exist between
logistics and other marketing decisions, such as product, price and promotion. Globally,
the trade-off has been made favouring economic specialisation and economies of scale
while increasing logistics costs, all in pursuit of economic growth.
Economic specialisation increases time and place disparities, which increase the
demand for logistics services. However, there is an indication that this trend has reached
maturity in many highly developed economies and it is predicted that logistics’s role as a
facilitator of growth will decline as the need for industrial distribution activities contracts10.
The great challenge that lies in this new era is a novel application of the logistics function,
perhaps a deepening of the science that increasingly leverages non-physical elements
such as knowledge management.
10 Klaus, P. 2009. Logistics research: a 50 years’ march of ideas. Logistics Research. 1: 53-65.
A change in the role of logistics is not the only challenge facing the discipline. The
rapidly changing landscape of environmental, fuel costs and supply security risk makes
managing supply chains all the more complex11,12. On top of that, calculating the real
cost of logistics, which includes those externalities that are currently borne by society
and are thus cross-subsidised, and charging that to shippers and carriers is imminent.
Because externality costs are currently paid by society at large, they do not form part
of the on-going economic specialisation/logistics costs trade-off. New and innovative
ways of improving logistics (and especially transport) efficiency and managing logistics
demand are essential.
Reshoring, the practice of bringing supply (manufacturing) back closer to the shores
where the actual demand occurs, is another trend changing the face of global logistics.
A number of factors spur reshoring such as a rising Chinese middle class that has driven up
wages, eroding the low-cost advantage of regional specialisation; and a drive to lower
unemployment in the developed countries where the demand is concentrated in the first
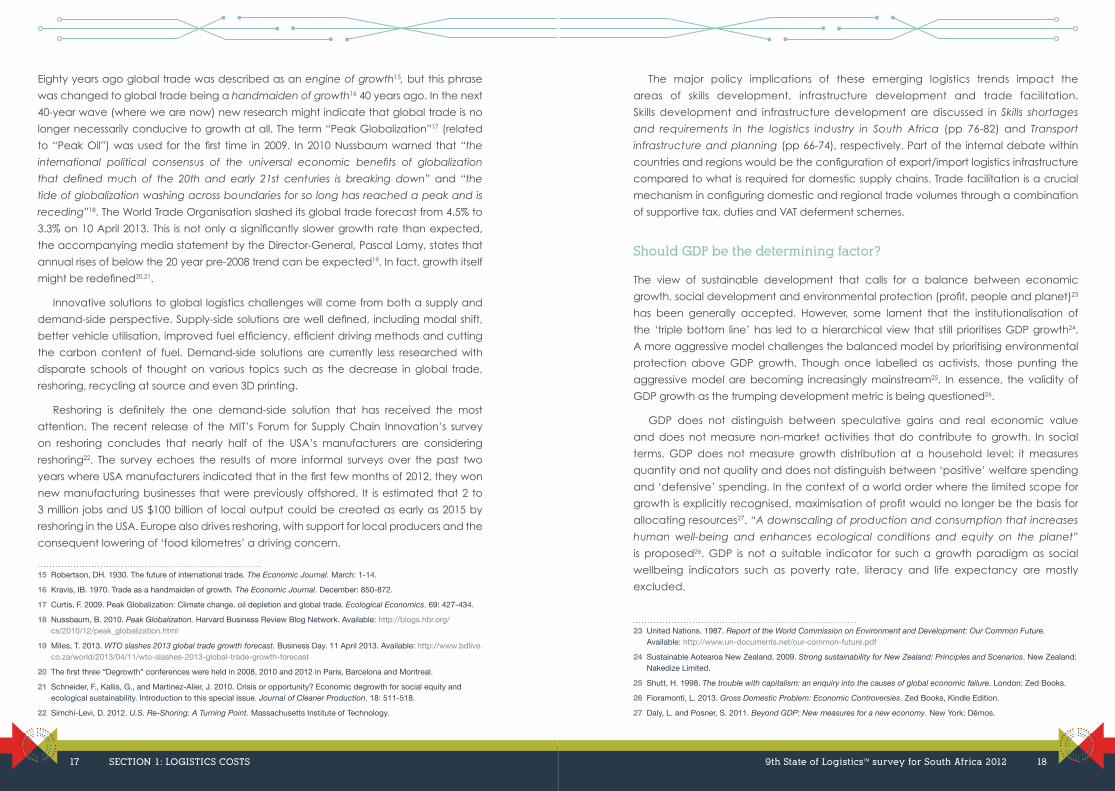
place. Reshoring is expected to decrease global trade as a percentage of global GDP
in the next few years (Figure 16), having a profound effect on global logistics that is not
yet fully understood. The current generation of leaders grew up in a world where global
trade as a percentage of GDP doubled in three decades. The next three decades will
probably see the exact opposite.
Figure 16: World trade as % of world GDP (US $ trillion) (International Monetary Fund13, Van den Berg and Lewer14)
11 Busicchia, B. 2013. Horse meat scandal’s long tail highlights risks of lengthy supply chains. Available: http://theconversation.edu.au/horse-meat-scandals-long-tail-highlights-risks-of-lengthy-supply-chains-12396
12 Ruddick, G. 2013. UK supply chains need overhaul to avoid new horse meat scandal, survey warns. Available: http://www.telegraph.co.uk/finance/newsbysector/retailandconsumer/9922860/UK-supply-chains-need-overhaul-to-avoid-new-horse-meat-scandal-survey-warns.html
13 International Monetary Fund. 2013. World Economic Outlook Update: Gradual Upturn in Global Growth During 2013. Available: http://www.imf.org/external/pubs/ft/weo/2013/update/01/index.html
14 Van den Bergh, H. and Lewer, JJ. 2007. International Trade and Economic Growth. Armonk: M.E. Sharpe.
15 SECTION 1: LOGISTICS COSTS 9th State of LogisticsTM survey for South Africa 2012 16
Eighty years ago global trade was described as an engine of growth15, but this phrase
was changed to global trade being a handmaiden of growth16 40 years ago. In the next
40-year wave (where we are now) new research might indicate that global trade is no
longer necessarily conducive to growth at all. The term “Peak Globalization”17 (related
to “Peak Oil”) was used for the first time in 2009. In 2010 Nussbaum warned that “the
international political consensus of the universal economic benefits of globalization
that defined much of the 20th and early 21st centuries is breaking down” and “the
tide of globalization washing across boundaries for so long has reached a peak and is
receding”18. The World Trade Organisation slashed its global trade forecast from 4.5% to
3.3% on 10 April 2013. This is not only a significantly slower growth rate than expected,
the accompanying media statement by the Director-General, Pascal Lamy, states that
annual rises of below the 20 year pre-2008 trend can be expected19. In fact, growth itself
might be redefined20,21.
Innovative solutions to global logistics challenges will come from both a supply and
demand-side perspective. Supply-side solutions are well defined, including modal shift,
better vehicle utilisation, improved fuel efficiency, efficient driving methods and cutting
the carbon content of fuel. Demand-side solutions are currently less researched with
disparate schools of thought on various topics such as the decrease in global trade,
reshoring, recycling at source and even 3D printing.
Reshoring is definitely the one demand-side solution that has received the most
attention. The recent release of the MIT’s Forum for Supply Chain Innovation’s survey
on reshoring concludes that nearly half of the USA’s manufacturers are considering
reshoring22. The survey echoes the results of more informal surveys over the past two
years where USA manufacturers indicated that in the first few months of 2012, they won
new manufacturing businesses that were previously offshored. It is estimated that 2 to
3 million jobs and US $100 billion of local output could be created as early as 2015 by
reshoring in the USA. Europe also drives reshoring, with support for local producers and the
consequent lowering of ‘food kilometres’ a driving concern.
15 Robertson, DH. 1930. The future of international trade. The Economic Journal. March: 1-14.
16 Kravis, IB. 1970. Trade as a handmaiden of growth. The Economic Journal. December: 850-872.
17 Curtis, F. 2009. Peak Globalization: Climate change, oil depletion and global trade. Ecological Economics. 69: 427-434.
18 Nussbaum, B. 2010. Peak Globalization. Harvard Business Review Blog Network. Available: http://blogs.hbr.org/cs/2010/12/peak_globalization.html
19 Miles, T. 2013. WTO slashes 2013 global trade growth forecast. Business Day. 11 April 2013. Available: http://www.bdlive.co.za/world/2013/04/11/wto-slashes-2013-global-trade-growth-forecast
20 The first three “Degrowth” conferences were held in 2008, 2010 and 2012 in Paris, Barcelona and Montreal.
21 Schneider, F., Kallis, G., and Martinez-Alier, J. 2010. Crisis or opportunity? Economic degrowth for social equity and ecological sustainability. Introduction to this special issue. Journal of Cleaner Production. 18: 511-518.
22 Simchi-Levi, D. 2012. U.S. Re-Shoring: A Turning Point. Massachusetts Institute of Technology.
The major policy implications of these emerging logistics trends impact the
areas of skills development, infrastructure development and trade facilitation.
Skills development and infrastructure development are discussed in Skills shortages
and requirements in the logistics industry in South Africa (pp 76-82) and Transport
infrastructure and planning (pp 66-74), respectively. Part of the internal debate within
countries and regions would be the configuration of export/import logistics infrastructure
compared to what is required for domestic supply chains. Trade facilitation is a crucial
mechanism in configuring domestic and regional trade volumes through a combination
of supportive tax, duties and VAT deferment schemes.
Should GDP be the determining factor?
The view of sustainable development that calls for a balance between economic
growth, social development and environmental protection (profit, people and planet)23
has been generally accepted. However, some lament that the institutionalisation of
the ‘triple bottom line’ has led to a hierarchical view that still prioritises GDP growth24.
A more aggressive model challenges the balanced model by prioritising environmental
protection above GDP growth. Though once labelled as activists, those punting the
aggressive model are becoming increasingly mainstream25. In essence, the validity of
GDP growth as the trumping development metric is being questioned26.
GDP does not distinguish between speculative gains and real economic value
and does not measure non-market activities that do contribute to growth. In social
terms, GDP does not measure growth distribution at a household level; it measures
quantity and not quality and does not distinguish between ‘positive’ welfare spending
and ‘defensive’ spending. In the context of a world order where the limited scope for
growth is explicitly recognised, maximisation of profit would no longer be the basis for
allocating resources27. “A downscaling of production and consumption that increases
human well-being and enhances ecological conditions and equity on the planet”
is proposed26. GDP is not a suitable indicator for such a growth paradigm as social
wellbeing indicators such as poverty rate, literacy and life expectancy are mostly
excluded.
23 United Nations. 1987. Report of the World Commission on Environment and Development: Our Common Future. Available: http://www.un-documents.net/our-common-future.pdf
24 Sustainable Aotearoa New Zealand. 2009. Strong sustainability for New Zealand: Principles and Scenarios. New Zealand: Nakedize Limited.
25 Shutt, H. 1998. The trouble with capitalism: an enquiry into the causes of global economic failure. London: Zed Books.
26 Fioramonti, L. 2013. Gross Domestic Problem: Economic Controversies. Zed Books, Kindle Edition.
27 Daly, L. and Posner, S. 2011. Beyond GDP: New measures for a new economy. New York: Dēmos.
17 SECTION 1: LOGISTICS COSTS 9th State of LogisticsTM survey for South Africa 2012 18
Nonetheless, the power of GDP to monitor short to medium-term fluctuations in
economic activity cannot be ignored. For a long time to come, it will be the best single
measure of how a market economy is performing. But its ability to measure longer-term
progress is more doubtful and a clear case exists for complementing it with more robust
long-term measures28. The implication is that new directions for measuring logistics costs in
relation to growth (not just GDP) could be required in future.
CONCLUSION
Very few national logistics costs time series exist. The USA’s and South Africa’s time series
indicate that transportation is becoming a larger portion of total logistics costs as the
key underlying cost driver, namely the fuel price, has increased significantly over the
past decade with no sign of respite in the upward volatility. In addition, ‘visible’ logistics
costs will escalate further due to the inclusion of externality charges which will force a
reduction in logistics’s environmental footprint. This implies that the paradigm needs
to be revisited where society, albeit not always consciously, has made the trade-off in
favour of high logistics demand to drive economic growth through specialisation and
economies of scale. From a logistics supply-side perspective, optimal modal balance
and efficiencies can be engineered, but research is increasingly pointing to the reality
that the most sustainable long-term approach would be to reduce the demand for
material logistics services through, ultimately, reducing the total demand for material
goods. This includes shifting the demand to locally available materials and produced
goods as well as reshoring production in many supply chains. The mainstream focus on
GDP as the key measure of national well-being is placed under scrutiny, implying that
new methods for the measurement and comparison of logistics costs relative to growth
will be required among nations.
28 Commission of the European Communities. 2009. Communication from the commission to the council and the European Parliament: GDP and beyond: Measuring progress in a changing world. Brussels, 20 August 2009. COM 433l.
INVESTIGATION OF ROAD FREIGHT CHALLENGES AND
COSTS IN SOUTH AFRICA
Jankauskaite, Zivile (Taemané Blue), Gounder, Sada (Taemané Blue) and Bean, Wilna L (CSIR)
Freight transportation is a major enabler of economic activity; an inefficient
freight transport system with high costs constrains the growth and competiveness
of a country. The South African freight transport sector relies heavily on road
transportation, with 70.1% of the total tonne-km in 2012 being on road. This article
identifies specific challenges that increase road-freight transport costs as experienced
by stakeholders in the freight transport sector of South Africa. In addition, the country’s
road freight cost components are compared with those of three developed countries
namely the United Kingdom (UK), the United States of America (USA) and Australia,
highlighting pertinent differences and similarities between the countries.
INDUSTRY PERSPECTIVE ON ROAD FREIGHT TRANSPORTATION
Key challenges and cost contributors
This section provides an overview of industry’s perspective on the key challenges that impact road freight costs in South Africa. Data used for this investigation were gathered through various stakeholder engagement sessions and a questionnaire targeted at a diverse set of stakeholders operating in the South African freight transport sector. In particular, the 48 survey respondents consisted of 30% road freight transporters, 30% consignee and consignors, 23% industry associations, 10% consultants and 7% government organisations or agencies. The main industries in South Africa represented by these respondents were manufacturing, mining, chemical, agriculture, petrochemical, retail and fast-moving consumer goods.
19 SECTION 1: LOGISTICS COSTS 9th State of LogisticsTM survey for South Africa 2012 20
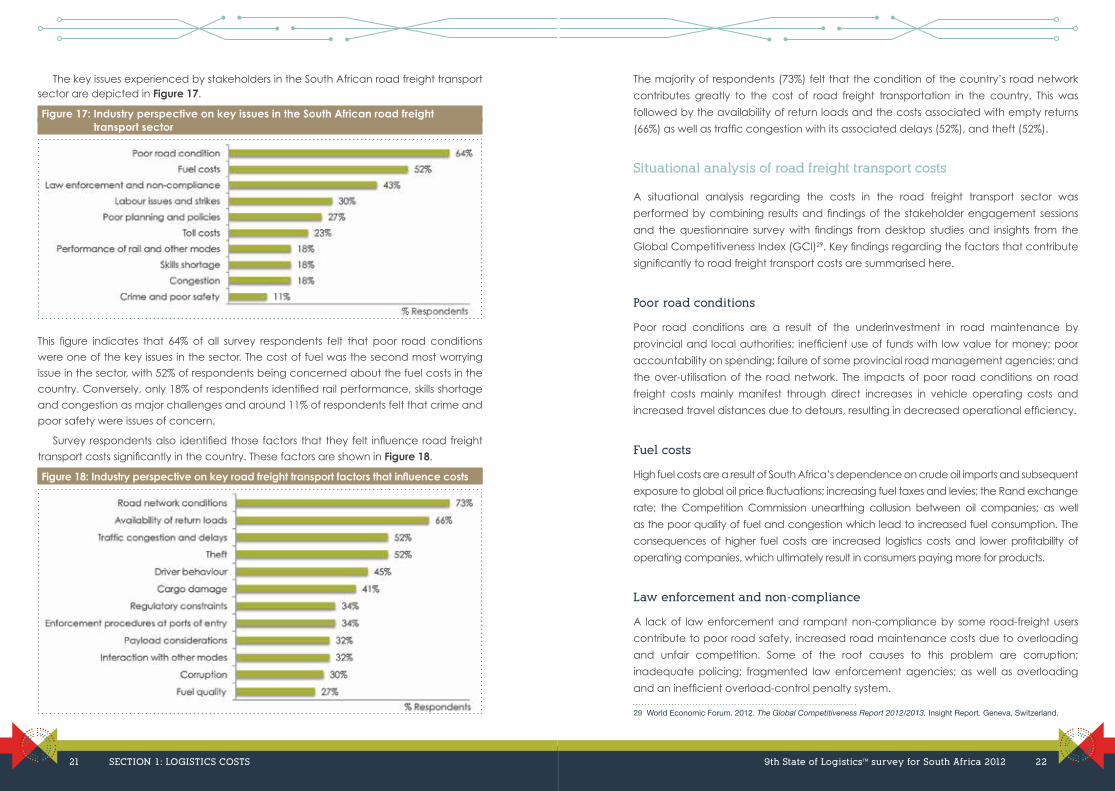
The key issues experienced by stakeholders in the South African road freight transport sector are depicted in Figure 17.
Figure 17: Industry perspective on key issues in the South African road freight transport sector
This figure indicates that 64% of all survey respondents felt that poor road conditions
were one of the key issues in the sector. The cost of fuel was the second most worrying
issue in the sector, with 52% of respondents being concerned about the fuel costs in the
country. Conversely, only 18% of respondents identified rail performance, skills shortage
and congestion as major challenges and around 11% of respondents felt that crime and
poor safety were issues of concern.
Survey respondents also identified those factors that they felt influence road freight
transport costs significantly in the country. These factors are shown in Figure 18.
Figure 18: Industry perspective on key road freight transport factors that influence costs
The majority of respondents (73%) felt that the condition of the country’s road network
contributes greatly to the cost of road freight transportation in the country. This was
followed by the availability of return loads and the costs associated with empty returns
(66%) as well as traffic congestion with its associated delays (52%), and theft (52%).
Situational analysis of road freight transport costs
A situational analysis regarding the costs in the road freight transport sector was
performed by combining results and findings of the stakeholder engagement sessions
and the questionnaire survey with findings from desktop studies and insights from the
Global Competitiveness Index (GCI)29. Key findings regarding the factors that contribute
significantly to road freight transport costs are summarised here.
Poor road conditions
Poor road conditions are a result of the underinvestment in road maintenance by
provincial and local authorities; inefficient use of funds with low value for money; poor
accountability on spending; failure of some provincial road management agencies; and
the over-utilisation of the road network. The impacts of poor road conditions on road
freight costs mainly manifest through direct increases in vehicle operating costs and
increased travel distances due to detours, resulting in decreased operational efficiency.
Fuel costs
High fuel costs are a result of South Africa’s dependence on crude oil imports and subsequent
exposure to global oil price fluctuations; increasing fuel taxes and levies; the Rand exchange
rate; the Competition Commission unearthing collusion between oil companies; as well
as the poor quality of fuel and congestion which lead to increased fuel consumption. The
consequences of higher fuel costs are increased logistics costs and lower profitability of
operating companies, which ultimately result in consumers paying more for products.
Law enforcement and non-compliance
A lack of law enforcement and rampant non-compliance by some road-freight users
contribute to poor road safety, increased road maintenance costs due to overloading
and unfair competition. Some of the root causes to this problem are corruption;
inadequate policing; fragmented law enforcement agencies; as well as overloading
and an inefficient overload-control penalty system.
29 World Economic Forum. 2012. The Global Competitiveness Report 2012/2013. Insight Report. Geneva, Switzerland.
21 SECTION 1: LOGISTICS COSTS 9th State of LogisticsTM survey for South Africa 2012 22
Labour strikes and instability
Labour strikes and their associated instability result in low productivity, and influence
customer service delivery negatively. In addition, inflexibility in wage determination leads
to high entry-level wages that discourage companies from hiring entry-level staff.
Government planning and policies
Inadequate coordination among government departments and agencies; skills
shortages; poor implementation of plans; poor institutional arrangements between
national, provincial and local government levels; data shortages; a lack of integrated
transport policies; and other policy decisions result in many challenges in South Africa’s
road freight sector. Some of the most notable impacts manifest through increased
operating costs; increased difficulty to import and export goods; higher greenhouse gas
emissions; and lower quality fuel due to inadequate legislation governing fuel quality in
the country.
Toll costs
The high toll costs in South Africa are a result of policy decisions on road infrastructure
provision and maintenance, resulting in higher operating costs and consequently higher
inflation rates.
Congestion
Increased congestion on the country’s road network is a result of unsophisticated load
and delivery scheduling and a lack of capacity, exacerbated by the inadequate
performance and coverage of rail transportation. These result in delays, a decrease in
reliability and a loss of productivity, which drives up product costs and eventually the
inflation rate.
Skills shortages
Although not a problem limited to the road freight sector, the sector experiences a huge
skills shortage in terms of qualified drivers and technicians. These shortages impact vehicle
repair and maintenance costs, accident rates, fuel consumption, vehicle lifespan and
vehicle downtime. Skills shortages in the freight transport sector also result in increased
wage pressures and cost of skills development.
Poor performance of rail
A large proportion of rail-friendly cargo is currently transported on road, increasing
transport costs, road deterioration rates and congestion. Industry cites poor service and
high pricing by the country’s rail operator as the main cause for this modal imbalance.
Crime and safety concerns
Increased insurance costs, increased transport costs due to the adoption of additional
safety measures and ultimately the reduced ability of companies to satisfy demand are
the consequences of crime and safety concerns in the sector.
INTERNATIONAL ROAD FREIGHT COST COMPARISONS
Investigating the challenges, solutions and comparative road transport cost
characteristics of different countries provides the opportunity to identify and propose
a set of measures and solutions for South Africa to improve the efficacy of road
transportation and, consequently, its global competitiveness. This section presents the
international benchmarking of road freight transport costs in South Africa with selected
globally competitive, developed countries that have relatively advanced road transport
infrastructure and systems. This comparison is done in terms of road infrastructure costs,
industry-level road freight costs, toll costs, and the company-level transport operating
costs.
For the purposes of this international cost benchmarking study the UK, the USA and
Australia were chosen. These countries were selected due to their advanced transport
systems, regulations and policies as well as their high rankings in the GCI where the USA
and the UK were rated in the top 10 and Australia in the top 20, compared to South Africa
in 52nd place.
Road infrastructure costs
A comparison between South Africa’s road construction and maintenance costs and
those of the other three countries is provided in Table 2. South Africa has the lowest per
lane-km road construction cost of R30 million, followed by Australia with R48.3 million, the
UK with R51.3 million and the USA with road construction cost of R56.3 million per lane-km.
Similarly, South Africa’s road maintenance costs are also the lowest between the four
countries at R0.3 million per lane-km, followed by Australia with R0.5 million, the USA with
R2.3 million and the UK with R2.4 million. South Africa’s construction to maintenance cost
23 SECTION 1: LOGISTICS COSTS 9th State of LogisticsTM survey for South Africa 2012 24
ratio is 100, which is similar to the ratio of 97 for Australia, whilst the UK and the USA are
similar to each other with ratios of 21 and 23, respectively.
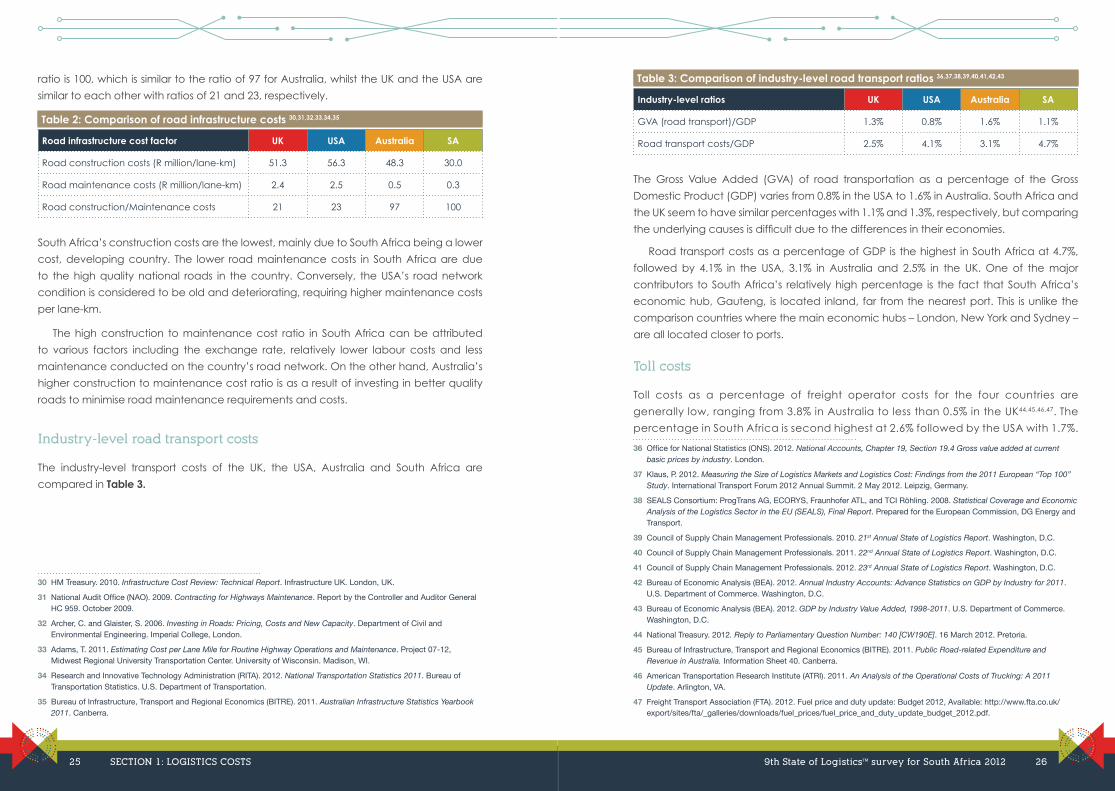
Table 2: Comparison of road infrastructure costs 30,31,32,33,34,35
Road infrastructure cost factor UK USA Australia SA
Road construction costs (R million/lane-km) 51.3 56.3 48.3 30.0
Road maintenance costs (R million/lane-km) 2.4 2.5 0.5 0.3
Road construction/Maintenance costs 21 23 97 100
South Africa’s construction costs are the lowest, mainly due to South Africa being a lower
cost, developing country. The lower road maintenance costs in South Africa are due
to the high quality national roads in the country. Conversely, the USA’s road network
condition is considered to be old and deteriorating, requiring higher maintenance costs
per lane-km.
The high construction to maintenance cost ratio in South Africa can be attributed
to various factors including the exchange rate, relatively lower labour costs and less
maintenance conducted on the country’s road network. On the other hand, Australia’s
higher construction to maintenance cost ratio is as a result of investing in better quality
roads to minimise road maintenance requirements and costs.
Industry-level road transport costs
The industry-level transport costs of the UK, the USA, Australia and South Africa are
compared in Table 3.
30 HM Treasury. 2010. Infrastructure Cost Review: Technical Report. Infrastructure UK. London, UK.
31 National Audit Office (NAO). 2009. Contracting for Highways Maintenance. Report by the Controller and Auditor General HC 959. October 2009.
32 Archer, C. and Glaister, S. 2006. Investing in Roads: Pricing, Costs and New Capacity. Department of Civil and Environmental Engineering. Imperial College, London.
33 Adams, T. 2011. Estimating Cost per Lane Mile for Routine Highway Operations and Maintenance. Project 07-12, Midwest Regional University Transportation Center. University of Wisconsin. Madison, WI.
34 Research and Innovative Technology Administration (RITA). 2012. National Transportation Statistics 2011. Bureau of Transportation Statistics. U.S. Department of Transportation.
35 Bureau of Infrastructure, Transport and Regional Economics (BITRE). 2011. Australian Infrastructure Statistics Yearbook 2011. Canberra.
Table 3: Comparison of industry-level road transport ratios 36,37,38,39,40,41,42,43
Industry-level ratios UK USA Australia SA
GVA (road transport)/GDP 1.3% 0.8% 1.6% 1.1%
Road transport costs/GDP 2.5% 4.1% 3.1% 4.7%
The Gross Value Added (GVA) of road transportation as a percentage of the Gross
Domestic Product (GDP) varies from 0.8% in the USA to 1.6% in Australia. South Africa and
the UK seem to have similar percentages with 1.1% and 1.3%, respectively, but comparing
the underlying causes is difficult due to the differences in their economies.
Road transport costs as a percentage of GDP is the highest in South Africa at 4.7%,
followed by 4.1% in the USA, 3.1% in Australia and 2.5% in the UK. One of the major
contributors to South Africa’s relatively high percentage is the fact that South Africa’s
economic hub, Gauteng, is located inland, far from the nearest port. This is unlike the
comparison countries where the main economic hubs – London, New York and Sydney –
are all located closer to ports.
Toll costs
Toll costs as a percentage of freight operator costs for the four countries are
generally low, ranging from 3.8% in Australia to less than 0.5% in the UK44,45,46,47. The
percentage in South Africa is second highest at 2.6% followed by the USA with 1.7%.
36 Office for National Statistics (ONS). 2012. National Accounts, Chapter 19, Section 19.4 Gross value added at current basic prices by industry. London.
37 Klaus, P. 2012. Measuring the Size of Logistics Markets and Logistics Cost: Findings from the 2011 European “Top 100” Study. International Transport Forum 2012 Annual Summit. 2 May 2012. Leipzig, Germany.
38 SEALS Consortium: ProgTrans AG, ECORYS, Fraunhofer ATL, and TCI Röhling. 2008. Statistical Coverage and Economic Analysis of the Logistics Sector in the EU (SEALS), Final Report. Prepared for the European Commission, DG Energy and Transport.
39 Council of Supply Chain Management Professionals. 2010. 21st Annual State of Logistics Report. Washington, D.C.
40 Council of Supply Chain Management Professionals. 2011. 22nd Annual State of Logistics Report. Washington, D.C.
41 Council of Supply Chain Management Professionals. 2012. 23rd Annual State of Logistics Report. Washington, D.C.
42 Bureau of Economic Analysis (BEA). 2012. Annual Industry Accounts: Advance Statistics on GDP by Industry for 2011. U.S. Department of Commerce. Washington, D.C.
43 Bureau of Economic Analysis (BEA). 2012. GDP by Industry Value Added, 1998-2011. U.S. Department of Commerce. Washington, D.C.
44 National Treasury. 2012. Reply to Parliamentary Question Number: 140 [CW190E]. 16 March 2012. Pretoria.
45 Bureau of Infrastructure, Transport and Regional Economics (BITRE). 2011. Public Road-related Expenditure and Revenue in Australia. Information Sheet 40. Canberra.
46 American Transportation Research Institute (ATRI). 2011. An Analysis of the Operational Costs of Trucking: A 2011 Update. Arlington, VA.
47 Freight Transport Association (FTA). 2012. Fuel price and duty update: Budget 2012, Available: http://www.fta.co.uk/export/sites/fta/_galleries/downloads/fuel_prices/fuel_price_and_duty_update_budget_2012.pdf.
25 SECTION 1: LOGISTICS COSTS 9th State of LogisticsTM survey for South Africa 2012 26

However, it is important to understand that a parallel can be drawn only between the
application of toll revenues in Australia, South Africa and the USA as these countries use
toll fees as a source of revenue. Conversely, the UK government does not really consider
toll fees as a major source of revenue as a greater share of revenue is generated through
fuel levies, which are considered to be the highest in Europe. Another important factor
to consider is that Australia and the USA use toll fees as congestion charges and these
values vary between peak and off-peak periods. On the contrary, South Africa applies
fixed toll fees per vehicle class irrespective of the time of day or congestion level, the
exception being the time-of-day48 discounts that SANRAL will allow on Gauteng Freeway
Improvement Project toll roads in Gauteng once these are implemented.
Company-level operating costs
A comparison between the various freight transport operating cost-drivers of the different
countries49,50,51,52,53,54,55,56,57 indicated that similar costing structures exist in the UK and the
USA, with some 30% fixed costs and 70% variable costs. Conversely, South Africa and
Australia have higher fixed costs at around 60% and lower variable costs of 40%. The
higher fixed-cost component in South Africa and Australia is due to these countries
having to import most of their trucks. In addition, security concerns in South Africa lead to
higher insurance costs in the country.
In all four countries the highest fixed-cost driver was the cost of truck drivers, followed
by vehicle depreciation costs. The highest variable cost-driver for all four countries was
fuel costs, followed by vehicle maintenance and repair costs. Combined, fuel costs and
truck driver costs varied between 55% and 70% of total company operating costs in the
four countries.
48 Government Gazette Vol 568. Pretoria, 25 October 2012. No.35756.
49 Road Haulage Association (RHA). 2010. Goods Vehicle Operating Costs RHA Cost Tables 2010. Prepared by DFF International.
50 Road Haulage Association (RHA). 2011. Goods Vehicle Operating Costs RHA Cost Tables 2011. Prepared by DFF International.
51 Road Haulage Association (RHA). 2012. Goods Vehicle Operating Costs RHA Cost Tables 2012. Prepared by DFF International.
52 American Transportation Research Institute (ATRI). 2011. An Analysis of the Operational Costs of Trucking: A 2011 Update. Arlington, VA.
53 American Trucking Associations (ATA). 2011. American Trucking Trends 2011. Arlington, VA.
54 TransEco. 2011. Road Freight Cost Outlook Quarterly Report. Melbourne. 1(1).
55 Bureau of Infrastructure, Transport and Regional Economics (BITRE). 2011a. Truck productivity: Sources, Trends and Future Prospects. Report 123. Canberra.
56 Bureau of Infrastructure, Transport and Regional Economics (BITRE). 2010. Road Freight Estimates and Forecasts in Australia: Interstate, Capital Cities and Rest of State. Report 121. Canberra.
57 FleetWatch. 2010, 2011 and 2012. Truck Operating Cost Benchmarks. Available: www.fleetwatch.co.za
CONCLUSION
The analysis of road freight transport challenges and costs indicate that there is
considerable scope for improvement and cost reduction in the road freight transport
sector of South Africa. The key challenges experienced by stakeholders in the sector
are primarily linked to the country’s road infrastructure, government service delivery, as
well as a lack of policies and the implementation of these to promote an efficient and
productive road transport sector. If South Africa can address some of the challenges
identified, the country’s freight transport costs will be reduced, resulting in increased
regional and global competitiveness.
27 SECTION 1: LOGISTICS COSTS 9th State of LogisticsTM survey for South Africa 2012 28

THE POTENTIAL EFFECTS OF DETERIORATING ROAD
CONDITIONS IN SOUTH AFRICA
Steyn, Wynand JvdM (University of Pretoria) and Bean, Wilna L (CSIR)
Having the required logistics infrastructure in place is a critical prerequisite to
successfully enable a country’s integration with its neighbours, thereby enhancing
its regional competitiveness. Even though South Africa is in a fortunate position
to have a relatively extensive logistics infrastructure network in place, maintaining and
upgrading this network generally seems problematic. This is particularly true for the South
African road network and as most freight is transported by road, it is imperative to keep
the network in a good condition.
The importance of a good quality road network is generally acknowledged and
various projects were undertaken by the South African National Road Agency Limited
(SANRAL) in the past decade to upgrade, improve and maintain South Africa’s
national road network. However, it still seems as if the maintenance and upgrading of
the country’s provincial road networks (secondary network) are far lower on the list of
priorities. This could be because most road freight is transported on the country’s national
road network, creating the perception that the condition of the secondary road network
is not as critical for efficient and cost-effective freight transport.
The reality is that a large proportion of freight is still transported on the secondary
network, especially in the agriculture, mining and forestry sectors. Poor road conditions
can have a significant impact on the logistics costs and the operations of businesses in
these sectors. In addition, a safety concern is associated with poor road condition as it
causes, or contributes to, many fatal accidents.
To put the spotlight on the importance of maintaining the country’s road networks
in a good condition, it is essential to get a handle on the effect that deteriorating
road conditions can have on the logistics operations and economy of South Africa.
Understanding that the benefit of maintaining a road far outweighs the costs of not doing
so, will be supported by knowledge of what it would cost the country when acceptable
road conditions are not maintained and what savings could accrue if they are.
This article builds on work published in the annual State of LogisticsTM survey since 2009
regarding the potential effect of deteriorating road conditions on the South African logistics
sector. It provides an overview of the current condition of the South African road network,
how it has changed since 2009 and how bad roads affect vehicle operating costs. In
addition, the cost of fatal road accidents caused by poor road conditions is quantified.
OVERVIEW OF THE SOUTH AFRICAN ROAD NETWORK CONDITION
Figure 19 shows a comparison of the condition of some of the paved road networks in
2009 and 2012. The primary road network includes all the national roads and is mainly
owned and maintained by SANRAL. Its condition improved significantly over the past
couple of years, due to various upgrade and maintenance projects. Based on the latest
available data it seems that the secondary road network was, in general, not maintained
adequately and had deteriorated since 2009.
Figure 19: Comparison of the condition of paved road networks in 2009 and 2012 (SANRAL58)
The most noticeable deterioration in road condition is in the Free State road network,
where the percentage of poor or very poor roads increased from around 6% to over 70%.
The Free State’s economy is highly dependent on the mining and agriculture sectors.
Mines and farms are often located far from metropolitan areas and are not always directly
connected to the national road network or railway lines, resulting in the need to transport
58 Road network condition data provided by Louw Kannemeyer. SANRAL.
29 SECTION 1: LOGISTICS COSTS 9th State of LogisticsTM survey for South Africa 2012 30
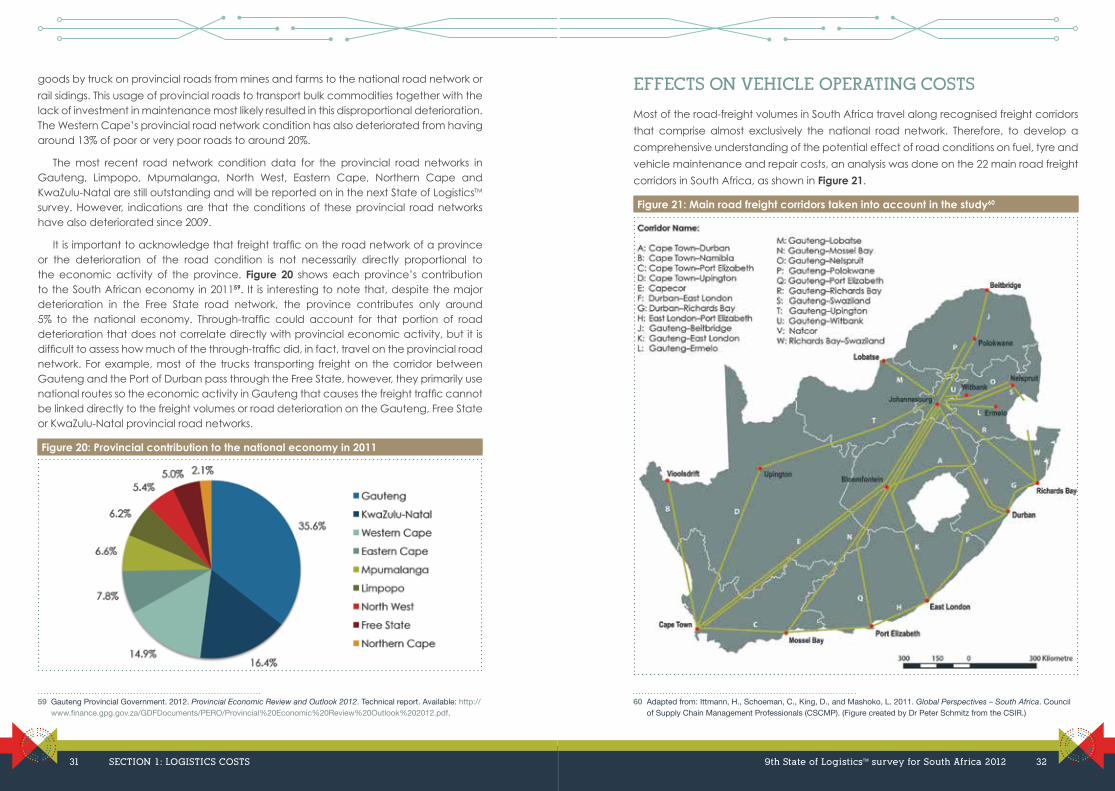
goods by truck on provincial roads from mines and farms to the national road network or
rail sidings. This usage of provincial roads to transport bulk commodities together with the lack of investment in maintenance most likely resulted in this disproportional deterioration. The Western Cape’s provincial road network condition has also deteriorated from having around 13% of poor or very poor roads to around 20%.
The most recent road network condition data for the provincial road networks in Gauteng, Limpopo, Mpumalanga, North West, Eastern Cape, Northern Cape and KwaZulu-Natal are still outstanding and will be reported on in the next State of LogisticsTM survey. However, indications are that the conditions of these provincial road networks have also deteriorated since 2009.
It is important to acknowledge that freight traffic on the road network of a province or the deterioration of the road condition is not necessarily directly proportional to the economic activity of the province. Figure 20 shows each province’s contribution to the South African economy in 201159. It is interesting to note that, despite the major deterioration in the Free State road network, the province contributes only around 5% to the national economy. Through-traffic could account for that portion of road deterioration that does not correlate directly with provincial economic activity, but it is difficult to assess how much of the through-traffic did, in fact, travel on the provincial road network. For example, most of the trucks transporting freight on the corridor between Gauteng and the Port of Durban pass through the Free State, however, they primarily use national routes so the economic activity in Gauteng that causes the freight traffic cannot be linked directly to the freight volumes or road deterioration on the Gauteng, Free State or KwaZulu-Natal provincial road networks.
Figure 20: Provincial contribution to the national economy in 2011
59 Gauteng Provincial Government. 2012. Provincial Economic Review and Outlook 2012. Technical report. Available: http://www.finance.gpg.gov.za/GDFDocuments/PERO/Provincial%20Economic%20Review%20Outlook%202012.pdf.
EFFECTS ON VEHICLE OPERATING COSTS
Most of the road-freight volumes in South Africa travel along recognised freight corridors
that comprise almost exclusively the national road network. Therefore, to develop a
comprehensive understanding of the potential effect of road conditions on fuel, tyre and
vehicle maintenance and repair costs, an analysis was done on the 22 main road freight
corridors in South Africa, as shown in Figure 21.
Figure 21: Main road freight corridors taken into account in the study60
60 Adapted from: Ittmann, H., Schoeman, C., King, D., and Mashoko, L. 2011. Global Perspectives – South Africa. Council of Supply Chain Management Professionals (CSCMP). (Figure created by Dr Peter Schmitz from the CSIR.)
31 SECTION 1: LOGISTICS COSTS 9th State of LogisticsTM survey for South Africa 2012 32
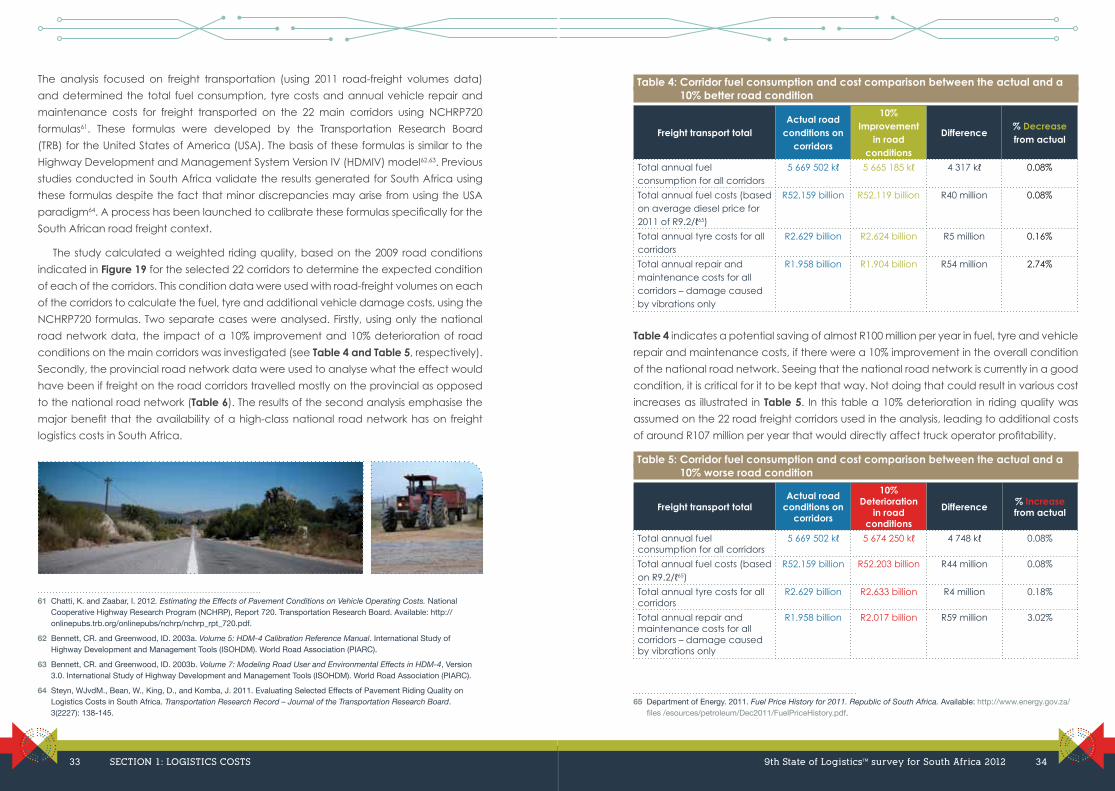
The analysis focused on freight transportation (using 2011 road-freight volumes data)
and determined the total fuel consumption, tyre costs and annual vehicle repair and
maintenance costs for freight transported on the 22 main corridors using NCHRP720
formulas61. These formulas were developed by the Transportation Research Board
(TRB) for the United States of America (USA). The basis of these formulas is similar to the
Highway Development and Management System Version IV (HDMIV) model62,63. Previous
studies conducted in South Africa validate the results generated for South Africa using
these formulas despite the fact that minor discrepancies may arise from using the USA
paradigm64. A process has been launched to calibrate these formulas specifically for the
South African road freight context.
The study calculated a weighted riding quality, based on the 2009 road conditions
indicated in Figure 19 for the selected 22 corridors to determine the expected condition
of each of the corridors. This condition data were used with road-freight volumes on each
of the corridors to calculate the fuel, tyre and additional vehicle damage costs, using the
NCHRP720 formulas. Two separate cases were analysed. Firstly, using only the national
road network data, the impact of a 10% improvement and 10% deterioration of road
conditions on the main corridors was investigated (see Table 4 and Table 5, respectively).
Secondly, the provincial road network data were used to analyse what the effect would
have been if freight on the road corridors travelled mostly on the provincial as opposed
to the national road network (Table 6). The results of the second analysis emphasise the
major benefit that the availability of a high-class national road network has on freight
logistics costs in South Africa.
61 Chatti, K. and Zaabar, I. 2012. Estimating the Effects of Pavement Conditions on Vehicle Operating Costs. National Cooperative Highway Research Program (NCHRP), Report 720. Transportation Research Board. Available: http://onlinepubs.trb.org/onlinepubs/nchrp/nchrp_rpt_720.pdf.
62 Bennett, CR. and Greenwood, ID. 2003a. Volume 5: HDM-4 Calibration Reference Manual. International Study of Highway Development and Management Tools (ISOHDM). World Road Association (PIARC).
63 Bennett, CR. and Greenwood, ID. 2003b. Volume 7: Modeling Road User and Environmental Effects in HDM-4, Version 3.0. International Study of Highway Development and Management Tools (ISOHDM). World Road Association (PIARC).
64 Steyn, WJvdM., Bean, W., King, D., and Komba, J. 2011. Evaluating Selected Effects of Pavement Riding Quality on Logistics Costs in South Africa. Transportation Research Record – Journal of the Transportation Research Board. 3(2227): 138-145.
Table 4: Corridor fuel consumption and cost comparison between the actual and a 10% better road condition
Freight transport totalActual road
conditions on corridors
10% Improvement
in road conditions
Difference% Decrease from actual
Total annual fuel consumption for all corridors
5 669 502 kℓ 5 665 185 kℓ 4 317 kℓ 0.08%
Total annual fuel costs (based on average diesel price for 2011 of R9.2/ℓ65)
R52.159 billion R52.119 billion R40 million 0.08%
Total annual tyre costs for all corridors
R2.629 billion R2.624 billion R5 million 0.16%
Total annual repair and maintenance costs for all corridors – damage caused by vibrations only
R1.958 billion R1.904 billion R54 million 2.74%
Table 4 indicates a potential saving of almost R100 million per year in fuel, tyre and vehicle
repair and maintenance costs, if there were a 10% improvement in the overall condition
of the national road network. Seeing that the national road network is currently in a good
condition, it is critical for it to be kept that way. Not doing that could result in various cost
increases as illustrated in Table 5. In this table a 10% deterioration in riding quality was
assumed on the 22 road freight corridors used in the analysis, leading to additional costs
of around R107 million per year that would directly affect truck operator profitability.
Table 5: Corridor fuel consumption and cost comparison between the actual and a 10% worse road condition
Freight transport totalActual road
conditions on corridors
10% Deterioration
in road conditions
Difference % Increase from actual
Total annual fuel consumption for all corridors
5 669 502 kℓ 5 674 250 kℓ 4 748 kℓ 0.08%
Total annual fuel costs (based on R9.2/ℓ65)
R52.159 billion R52.203 billion R44 million 0.08%
Total annual tyre costs for all corridors
R2.629 billion R2.633 billion R4 million 0.18%
Total annual repair and maintenance costs for all corridors – damage caused by vibrations only
R1.958 billion R2.017 billion R59 million 3.02%
65 Department of Energy. 2011. Fuel Price History for 2011. Republic of South Africa. Available: http://www.energy.gov.za/files /esources/petroleum/Dec2011/FuelPriceHistory.pdf.
33 SECTION 1: LOGISTICS COSTS 9th State of LogisticsTM survey for South Africa 2012 34
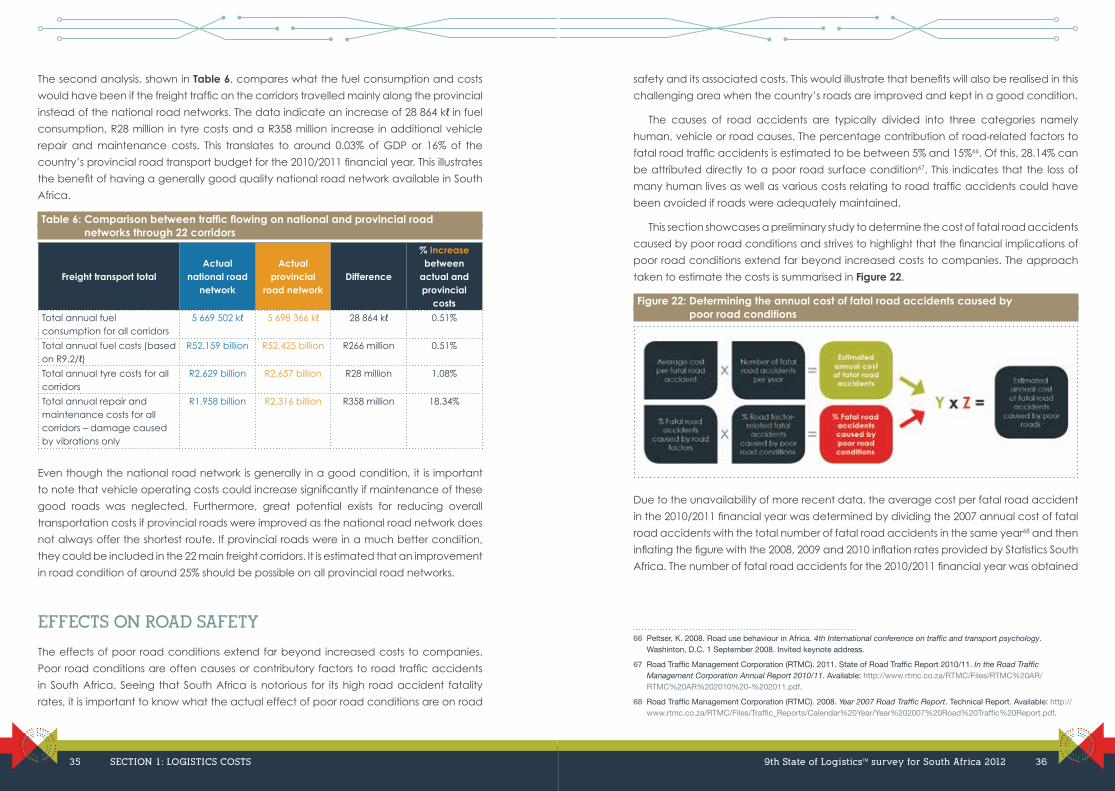
The second analysis, shown in Table 6, compares what the fuel consumption and costs
would have been if the freight traffic on the corridors travelled mainly along the provincial
instead of the national road networks. The data indicate an increase of 28 864 kℓ in fuel
consumption, R28 million in tyre costs and a R358 million increase in additional vehicle
repair and maintenance costs. This translates to around 0.03% of GDP or 16% of the
country’s provincial road transport budget for the 2010/2011 financial year. This illustrates
the benefit of having a generally good quality national road network available in South
Africa.
Table 6: Comparison between traffic flowing on national and provincial road networks through 22 corridors
Freight transport totalActual
national road network
Actual provincial
road networkDifference
% Increase between
actual and provincial
costs
Total annual fuel consumption for all corridors
5 669 502 kℓ 5 698 366 kℓ 28 864 kℓ 0.51%
Total annual fuel costs (based on R9.2/ℓ)
R52.159 billion R52.425 billion R266 million 0.51%
Total annual tyre costs for all corridors
R2.629 billion R2.657 billion R28 million 1.08%
Total annual repair and maintenance costs for all corridors – damage caused by vibrations only
R1.958 billion R2.316 billion R358 million 18.34%
Even though the national road network is generally in a good condition, it is important
to note that vehicle operating costs could increase significantly if maintenance of these
good roads was neglected. Furthermore, great potential exists for reducing overall
transportation costs if provincial roads were improved as the national road network does
not always offer the shortest route. If provincial roads were in a much better condition,
they could be included in the 22 main freight corridors. It is estimated that an improvement
in road condition of around 25% should be possible on all provincial road networks.
EFFECTS ON ROAD SAFETY
The effects of poor road conditions extend far beyond increased costs to companies.
Poor road conditions are often causes or contributory factors to road traffic accidents
in South Africa. Seeing that South Africa is notorious for its high road accident fatality
rates, it is important to know what the actual effect of poor road conditions are on road
safety and its associated costs. This would illustrate that benefits will also be realised in this
challenging area when the country’s roads are improved and kept in a good condition.
The causes of road accidents are typically divided into three categories namely
human, vehicle or road causes. The percentage contribution of road-related factors to
fatal road traffic accidents is estimated to be between 5% and 15%66. Of this, 28.14% can
be attributed directly to a poor road surface condition67. This indicates that the loss of
many human lives as well as various costs relating to road traffic accidents could have
been avoided if roads were adequately maintained.
This section showcases a preliminary study to determine the cost of fatal road accidents
caused by poor road conditions and strives to highlight that the financial implications of
poor road conditions extend far beyond increased costs to companies. The approach
taken to estimate the costs is summarised in Figure 22.
Figure 22: Determining the annual cost of fatal road accidents caused by poor road conditions
Due to the unavailability of more recent data, the average cost per fatal road accident
in the 2010/2011 financial year was determined by dividing the 2007 annual cost of fatal
road accidents with the total number of fatal road accidents in the same year68 and then
inflating the figure with the 2008, 2009 and 2010 inflation rates provided by Statistics South
Africa. The number of fatal road accidents for the 2010/2011 financial year was obtained
66 Peltser, K. 2008. Road use behaviour in Africa. 4th International conference on traffic and transport psychology. Washinton, D.C. 1 September 2008. Invited keynote address.
67 Road Traffic Management Corporation (RTMC). 2011. State of Road Traffic Report 2010/11. In the Road Traffic Management Corporation Annual Report 2010/11. Available: http://www.rtmc.co.za/RTMC/Files/RTMC%20AR/RTMC%20AR%202010%20-%202011.pdf.
68 Road Traffic Management Corporation (RTMC). 2008. Year 2007 Road Traffic Report. Technical Report. Available: http://www.rtmc.co.za/RTMC/Files/Traffic_Reports/Calendar%20Year/Year%202007%20Road%20Traffic%20Report.pdf.
35 SECTION 1: LOGISTICS COSTS 9th State of LogisticsTM survey for South Africa 2012 36
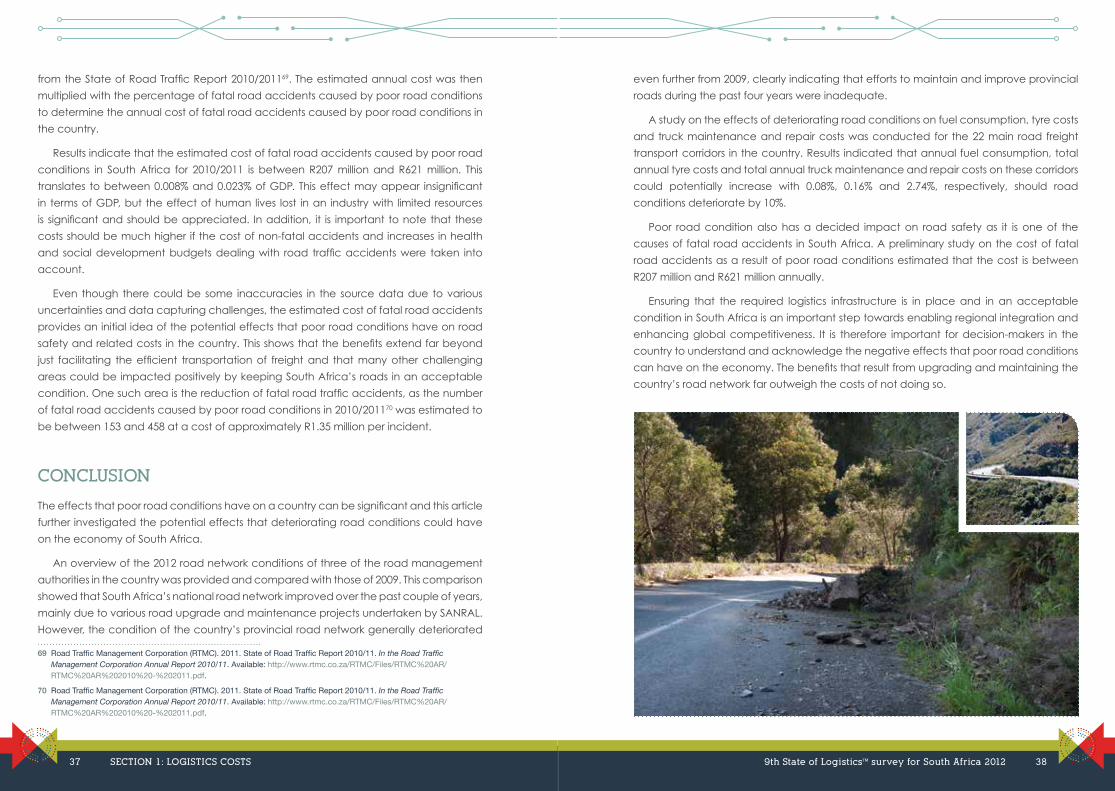
from the State of Road Traffic Report 2010/201169. The estimated annual cost was then
multiplied with the percentage of fatal road accidents caused by poor road conditions
to determine the annual cost of fatal road accidents caused by poor road conditions in
the country.
Results indicate that the estimated cost of fatal road accidents caused by poor road
conditions in South Africa for 2010/2011 is between R207 million and R621 million. This
translates to between 0.008% and 0.023% of GDP. This effect may appear insignificant
in terms of GDP, but the effect of human lives lost in an industry with limited resources
is significant and should be appreciated. In addition, it is important to note that these
costs should be much higher if the cost of non-fatal accidents and increases in health
and social development budgets dealing with road traffic accidents were taken into
account.
Even though there could be some inaccuracies in the source data due to various
uncertainties and data capturing challenges, the estimated cost of fatal road accidents
provides an initial idea of the potential effects that poor road conditions have on road
safety and related costs in the country. This shows that the benefits extend far beyond
just facilitating the efficient transportation of freight and that many other challenging
areas could be impacted positively by keeping South Africa’s roads in an acceptable
condition. One such area is the reduction of fatal road traffic accidents, as the number
of fatal road accidents caused by poor road conditions in 2010/201170 was estimated to
be between 153 and 458 at a cost of approximately R1.35 million per incident.
CONCLUSION
The effects that poor road conditions have on a country can be significant and this article
further investigated the potential effects that deteriorating road conditions could have
on the economy of South Africa.
An overview of the 2012 road network conditions of three of the road management
authorities in the country was provided and compared with those of 2009. This comparison
showed that South Africa’s national road network improved over the past couple of years,
mainly due to various road upgrade and maintenance projects undertaken by SANRAL.
However, the condition of the country’s provincial road network generally deteriorated
69 Road Traffic Management Corporation (RTMC). 2011. State of Road Traffic Report 2010/11. In the Road Traffic Management Corporation Annual Report 2010/11. Available: http://www.rtmc.co.za/RTMC/Files/RTMC%20AR/RTMC%20AR%202010%20-%202011.pdf.
70 Road Traffic Management Corporation (RTMC). 2011. State of Road Traffic Report 2010/11. In the Road Traffic Management Corporation Annual Report 2010/11. Available: http://www.rtmc.co.za/RTMC/Files/RTMC%20AR/RTMC%20AR%202010%20-%202011.pdf.
even further from 2009, clearly indicating that efforts to maintain and improve provincial
roads during the past four years were inadequate.
A study on the effects of deteriorating road conditions on fuel consumption, tyre costs
and truck maintenance and repair costs was conducted for the 22 main road freight
transport corridors in the country. Results indicated that annual fuel consumption, total
annual tyre costs and total annual truck maintenance and repair costs on these corridors
could potentially increase with 0.08%, 0.16% and 2.74%, respectively, should road
conditions deteriorate by 10%.
Poor road condition also has a decided impact on road safety as it is one of the
causes of fatal road accidents in South Africa. A preliminary study on the cost of fatal
road accidents as a result of poor road conditions estimated that the cost is between
R207 million and R621 million annually.
Ensuring that the required logistics infrastructure is in place and in an acceptable
condition in South Africa is an important step towards enabling regional integration and
enhancing global competitiveness. It is therefore important for decision-makers in the
country to understand and acknowledge the negative effects that poor road conditions
can have on the economy. The benefits that result from upgrading and maintaining the
country’s road network far outweigh the costs of not doing so.
37 SECTION 1: LOGISTICS COSTS 9th State of LogisticsTM survey for South Africa 2012 38
SECTION 2: REGIONAL CONNECTIVITY
DEVELOPING THE SADC PORT COMMUNITY
Viljoen, Nadia M (CSIR)
The author wishes to express her sincere appreciation to the Georgia Tech Logistics Innovation and Research Center (http://www.gatech.pa) for providing the database required for the connectivity analysis and to Pablo Achurra for key inputs on the maritime industry.
INTRODUCTION
Global cargo shipping is a complex network of interdependent, densely connected
port communities. One cannot, however, truly capture the regional or global role
that a specific port plays by merely using the port’s individual key performance
indicators (KPIs), or using statistical analyses of aggregate freight flows between ports.
Recently, experts have turned to complex network theory to analyse maritime connectivity
within the global cargo shipping network and to better understand how market dynamics
and political agendas impact this network71,72,73. Connectivity is the measure of a port’s
access to global liner services and consequently its access to global markets. Viljoen and
Bartholdi74 discuss two published connectivity metrics that calculate the centrality (or
relative importance) of nodes within the maritime network. The United Nations Conference
71 Ducruet, C. et al. 2010. Centrality and vulnerability in liner shipping networks: revisting the Northeast Asian Port hierarchy. Maritime Policy & Management. 37(1): 17–36.
72 Kaluza, P., Kölzsch, A., Gastner, MT., and Blasius, B. 2010. The complex network of global cargo shipping movements. Journal of the Royal Society Interface. 7:1093-1103.
73 Montes, C., Seoane,MJ., and Laxe, F. 2012. General cargo and containership emergent routes: A complex networks description. Transport Policy. 24 : 126–140.
74 Viljoen, NM. and Bartholdi, JJ. III. 2012. Maritime connectivity of South African ports. 8th State of LogisticsTM survey for South Africa 2011. CSIR. Pretoria. 68–77.
9th State of LogisticsTM survey for South Africa 2012 40
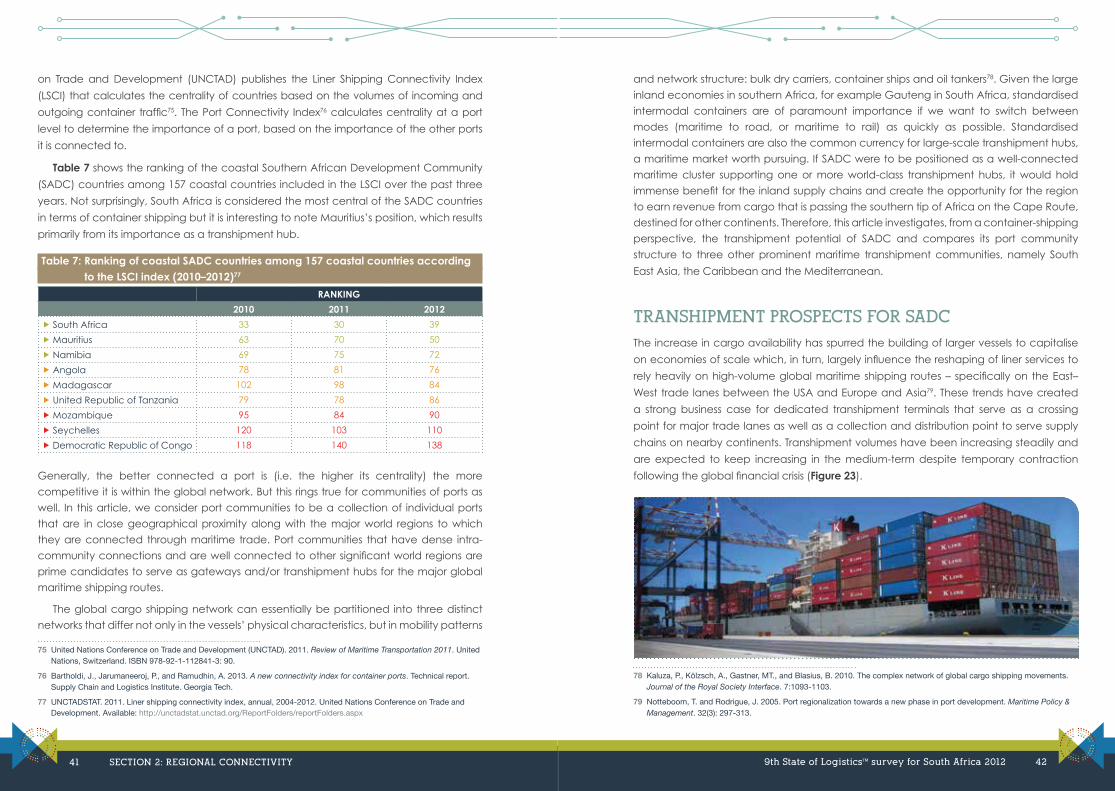
on Trade and Development (UNCTAD) publishes the Liner Shipping Connectivity Index
(LSCI) that calculates the centrality of countries based on the volumes of incoming and
outgoing container traffic75. The Port Connectivity Index76 calculates centrality at a port
level to determine the importance of a port, based on the importance of the other ports
it is connected to.
Table 7 shows the ranking of the coastal Southern African Development Community
(SADC) countries among 157 coastal countries included in the LSCI over the past three
years. Not surprisingly, South Africa is considered the most central of the SADC countries
in terms of container shipping but it is interesting to note Mauritius’s position, which results
primarily from its importance as a transhipment hub.
Table 7: Ranking of coastal SADC countries among 157 coastal countries according to the LSCI index (2010–2012)77
RANKING
2010 2011 2012
� South Africa 33 30 39
� Mauritius 63 70 50
� Namibia 69 75 72
� Angola 78 81 76
� Madagascar 102 98 84
� United Republic of Tanzania 79 78 86
� Mozambique 95 84 90
� Seychelles 120 103 110
� Democratic Republic of Congo 118 140 138
Generally, the better connected a port is (i.e. the higher its centrality) the more
competitive it is within the global network. But this rings true for communities of ports as
well. In this article, we consider port communities to be a collection of individual ports
that are in close geographical proximity along with the major world regions to which
they are connected through maritime trade. Port communities that have dense intra-
community connections and are well connected to other significant world regions are
prime candidates to serve as gateways and/or transhipment hubs for the major global
maritime shipping routes.
The global cargo shipping network can essentially be partitioned into three distinct
networks that differ not only in the vessels’ physical characteristics, but in mobility patterns
75 United Nations Conference on Trade and Development (UNCTAD). 2011. Review of Maritime Transportation 2011. United Nations, Switzerland. ISBN 978-92-1-112841-3: 90.
76 Bartholdi, J., Jarumaneeroj, P., and Ramudhin, A. 2013. A new connectivity index for container ports. Technical report. Supply Chain and Logistics Institute. Georgia Tech.
77 UNCTADSTAT. 2011. Liner shipping connectivity index, annual, 2004-2012. United Nations Conference on Trade and Development. Available: http://unctadstat.unctad.org/ReportFolders/reportFolders.aspx
and network structure: bulk dry carriers, container ships and oil tankers78. Given the large
inland economies in southern Africa, for example Gauteng in South Africa, standardised
intermodal containers are of paramount importance if we want to switch between
modes (maritime to road, or maritime to rail) as quickly as possible. Standardised
intermodal containers are also the common currency for large-scale transhipment hubs,
a maritime market worth pursuing. If SADC were to be positioned as a well-connected
maritime cluster supporting one or more world-class transhipment hubs, it would hold
immense benefit for the inland supply chains and create the opportunity for the region
to earn revenue from cargo that is passing the southern tip of Africa on the Cape Route,
destined for other continents. Therefore, this article investigates, from a container-shipping
perspective, the transhipment potential of SADC and compares its port community
structure to three other prominent maritime transhipment communities, namely South
East Asia, the Caribbean and the Mediterranean.
TRANSHIPMENT PROSPECTS FOR SADC
The increase in cargo availability has spurred the building of larger vessels to capitalise
on economies of scale which, in turn, largely influence the reshaping of liner services to
rely heavily on high-volume global maritime shipping routes – specifically on the East–
West trade lanes between the USA and Europe and Asia79. These trends have created
a strong business case for dedicated transhipment terminals that serve as a crossing
point for major trade lanes as well as a collection and distribution point to serve supply
chains on nearby continents. Transhipment volumes have been increasing steadily and
are expected to keep increasing in the medium-term despite temporary contraction
following the global financial crisis (Figure 23).
78 Kaluza, P., Kölzsch, A., Gastner, MT., and Blasius, B. 2010. The complex network of global cargo shipping movements. Journal of the Royal Society Interface. 7:1093-1103.
79 Notteboom, T. and Rodrigue, J. 2005. Port regionalization towards a new phase in port development. Maritime Policy & Management. 32(3): 297-313.
41 SECTION 2: REGIONAL CONNECTIVITY 9th State of LogisticsTM survey for South Africa 2012 42
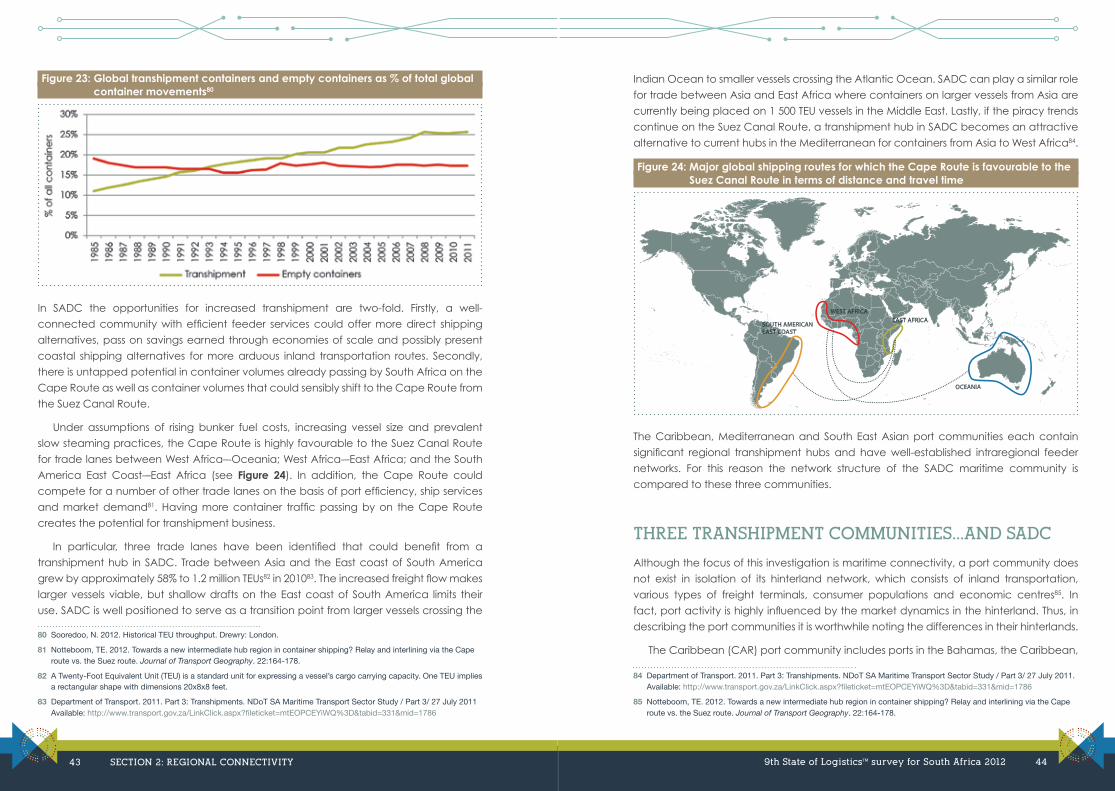
Figure 23: Global transhipment containers and empty containers as % of total global container movements80
In SADC the opportunities for increased transhipment are two-fold. Firstly, a well-
connected community with efficient feeder services could offer more direct shipping
alternatives, pass on savings earned through economies of scale and possibly present
coastal shipping alternatives for more arduous inland transportation routes. Secondly,
there is untapped potential in container volumes already passing by South Africa on the
Cape Route as well as container volumes that could sensibly shift to the Cape Route from
the Suez Canal Route.
Under assumptions of rising bunker fuel costs, increasing vessel size and prevalent
slow steaming practices, the Cape Route is highly favourable to the Suez Canal Route
for trade lanes between West Africa–-Oceania; West Africa-–East Africa; and the South
America East Coast-–East Africa (see Figure 24). In addition, the Cape Route could
compete for a number of other trade lanes on the basis of port efficiency, ship services
and market demand81. Having more container traffic passing by on the Cape Route
creates the potential for transhipment business.
In particular, three trade lanes have been identified that could benefit from a
transhipment hub in SADC. Trade between Asia and the East coast of South America
grew by approximately 58% to 1.2 million TEUs82 in 201083. The increased freight flow makes
larger vessels viable, but shallow drafts on the East coast of South America limits their
use. SADC is well positioned to serve as a transition point from larger vessels crossing the
80 Sooredoo, N. 2012. Historical TEU throughput. Drewry: London.
81 Notteboom, TE. 2012. Towards a new intermediate hub region in container shipping? Relay and interlining via the Cape route vs. the Suez route. Journal of Transport Geography. 22:164-178.
82 A Twenty-Foot Equivalent Unit (TEU) is a standard unit for expressing a vessel’s cargo carrying capacity. One TEU implies a rectangular shape with dimensions 20x8x8 feet.
83 Department of Transport. 2011. Part 3: Transhipments. NDoT SA Maritime Transport Sector Study / Part 3/ 27 July 2011 Available: http://www.transport.gov.za/LinkClick.aspx?fileticket=mtEOPCEYiWQ%3D&tabid=331&mid=1786
Indian Ocean to smaller vessels crossing the Atlantic Ocean. SADC can play a similar role
for trade between Asia and East Africa where containers on larger vessels from Asia are
currently being placed on 1 500 TEU vessels in the Middle East. Lastly, if the piracy trends
continue on the Suez Canal Route, a transhipment hub in SADC becomes an attractive
alternative to current hubs in the Mediterranean for containers from Asia to West Africa84.
Figure 24: Major global shipping routes for which the Cape Route is favourable to the Suez Canal Route in terms of distance and travel time
WEST AFRICA
SOUTH AMERICANEAST COAST
EAST AFRICA
OCEANIA
The Caribbean, Mediterranean and South East Asian port communities each contain
significant regional transhipment hubs and have well-established intraregional feeder
networks. For this reason the network structure of the SADC maritime community is
compared to these three communities.
THREE TRANSHIPMENT COMMUNITIES…AND SADC
Although the focus of this investigation is maritime connectivity, a port community does
not exist in isolation of its hinterland network, which consists of inland transportation,
various types of freight terminals, consumer populations and economic centres85. In
fact, port activity is highly influenced by the market dynamics in the hinterland. Thus, in
describing the port communities it is worthwhile noting the differences in their hinterlands.
The Caribbean (CAR) port community includes ports in the Bahamas, the Caribbean,
84 Department of Transport. 2011. Part 3: Transhipments. NDoT SA Maritime Transport Sector Study / Part 3/ 27 July 2011. Available: http://www.transport.gov.za/LinkClick.aspx?fileticket=mtEOPCEYiWQ%3D&tabid=331&mid=1786
85 Notteboom, TE. 2012. Towards a new intermediate hub region in container shipping? Relay and interlining via the Cape route vs. the Suez route. Journal of Transport Geography. 22:164-178.
43 SECTION 2: REGIONAL CONNECTIVITY 9th State of LogisticsTM survey for South Africa 2012 44

the Caribbean coast of Central America and the Northern coast of South America. This
community encompasses a number of small islands whose economies and populations
depend greatly on international trade, all conducted via maritime shipping. The lack
of a well-connected, efficient inland transport network to support most of the Central
American and South American ports also makes those economies highly dependent on
maritime shipping to connect intraregionally. The Caribbean ports are on the doorstep
of the Panama Canal and have quick access to the Gulf and East coasts of the USA
and the North and East coasts of South America, making it a region that experiences
incredible container through-traffic volumes.
The Mediterranean (MED) port community includes all West and East European, North
African and Middle Eastern ports bordering the Mediterranean Sea. The Western European
ports have well-established hinterland economies with good connectivity to Northern
Europe. The East European ports serve hinterlands riddled with political and cultural
barriers and a less well-connected inland transport system. The Middle Eastern ports serve
a geographically large hinterland and are positioned where the Suez Canal opens up
into the Mediterranean. The North African ports have poor inland transport connectivity
and serve far poorer consumer populations. The majority of container volumes on the
East–West trade lanes pass through this port community with a significant portion of that
volume destined for gateway ports in the western waters of the Mediterranean Sea.
The South East Asia (SEA) port community is famous for its transhipment hubs at the Port
of Singapore and Port Klang in Malaysia, two neighbouring island communities that have
made most of their strategic geographic position close to China and on the favourable
maritime route between the Americas and the Indian Ocean. The community also
includes a number of low-cost manufacturing economies such as the Phillipines, Vietnam,
Indonesia and Thailand and these economies are highly dependent on maritime shipping
due to their island status or poor inland transport networks.
SADC ports also enjoy a strategic geographical position on the Cape Route, which
is expected to see significantly increased container trade in the near future. SADC
represents large and growing consumer populations and economies. Compared to the
other three port communities, SADC does not have a strong, historical culture of regional
shipping, having previously depended on inland transport for limited freight flows between
countries (many of which are landlocked). Historically reliant on South Africa’s transport
infrastructure as a gateway to the region, SADC is only now proactively developing
inland corridors to connect regionally (see Inland connectivity in SADC, pp 57-64).
Despite its commonalities, SADC is not a fully-fledged transhipment community. Durban’s
position on the global container shipping stage notwithstanding, capacity issues and a
lack of regional connectivity prevent the Port of Durban from single-handedly driving the
maritime competitiveness of SADC. The remainder of this article uses complex network
analysis to characterise and compare the community structures of the four communities.
CONNECTED COMMUNITIES
Data for the connectivity analysis were supplied by the Georgia Tech Logistics Research
and Innovation Center. The database includes 463 commercial ports. Each record in
the database represents a direct link between any two of these ports (referred to as
a port pair). A direct link implies that one or more liner services visited these two ports
in sequence. The number of services directly linking these two ports, the number of
companies participating in these services, the number of vessels deployed on these
services and the weekly allocated TEUs on these services were recorded for each link
once a month for 11 consecutive months (November 2011 – September 2012).
Creating the individual community datasets from the global dataset was done as
follows: All ports that fell within the CAR, MED and SEA communities according to the
classification of the original maritime database, or within SADC (according to its accepted
political definition), were retained as individual nodes in their respective communities.
All links between ports in the same community were unchanged. All other ports that fell
outside of the community in question were combined and represented by regional nodes.
For example, all the ports on the East coasts of the USA, Canada and Mexico as well
as the Gulf coast of the USA were combined and represented as a single node labelled
East Coast of North America. The links a specific port within the community had with ports
that were combined into the East coast of North America node were also combined
and the values for the number of services, number of companies, number of vessels and
weekly allocated TEUs on those links were aggregated. Records in the database that
represented links between two ports that were both outside the community (for example
the link between Rotterdam and Antwerp) were deleted. The individual datasets for
the communities of CAR, MED, SEA and SADC were uploaded into Gephi86 wherein all
network analyses were conducted, using the number of services as the weight parameter
for each link.
The purpose of the analysis was to compare the community structure of the three
established transhipment communities with that of SADC. Two metrics were specifically
investigated, the centrality87 score and the clustering coefficient of the nodes in the
community. The centrality score captures the importance of a node based on the
importance of the nodes it is connected to as well as the weight of those connections.
Likening it to social networks, your importance is based on how many friends you have,
how important those friends are and how strong your relationships are with those friends.
The clustering coefficient of an individual node indicates what fraction of that node’s
neighbours is connected to each other – it’s a measure to determine how tightly knit a
network is.
86 Open source software available from https://gephi.org
87 A weighted PageRank centrality algorithm was used with parameters p=0.85 and ε=0.001
45 SECTION 2: REGIONAL CONNECTIVITY 9th State of LogisticsTM survey for South Africa 2012 46
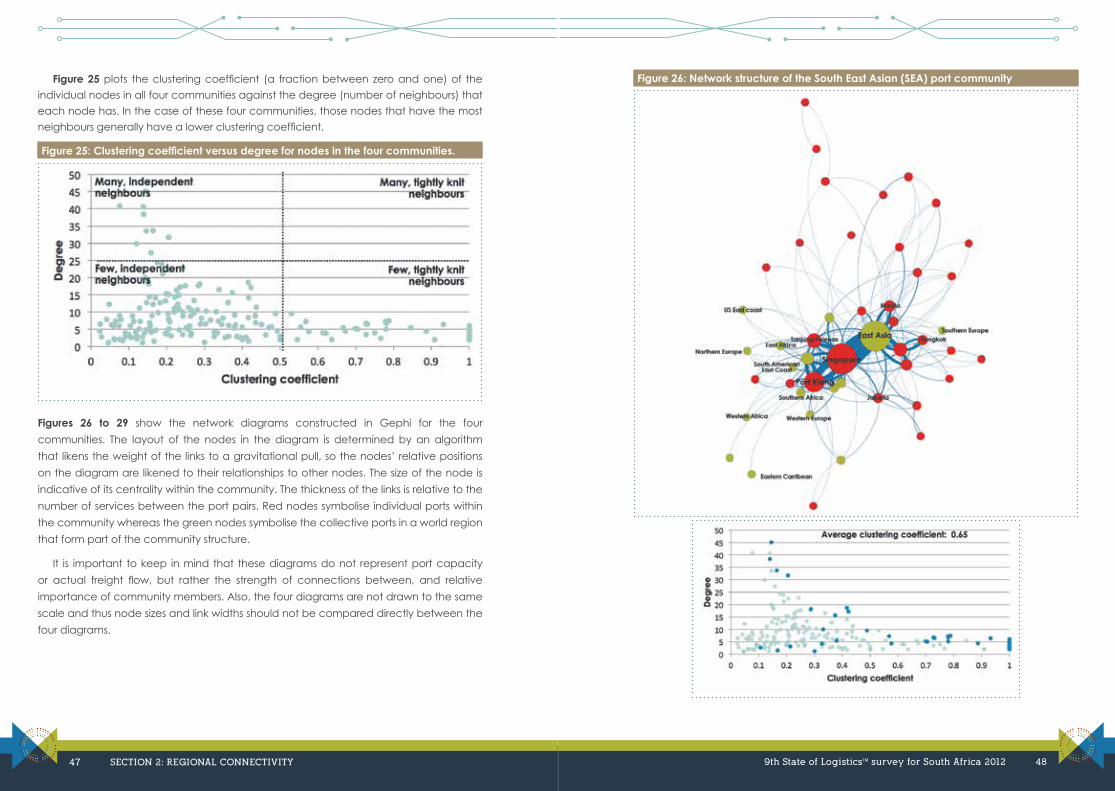
Figure 25 plots the clustering coefficient (a fraction between zero and one) of the
individual nodes in all four communities against the degree (number of neighbours) that
each node has. In the case of these four communities, those nodes that have the most
neighbours generally have a lower clustering coefficient.
Figure 25: Clustering coefficient versus degree for nodes in the four communities.
Figures 26 to 29 show the network diagrams constructed in Gephi for the four
communities. The layout of the nodes in the diagram is determined by an algorithm
that likens the weight of the links to a gravitational pull, so the nodes’ relative positions
on the diagram are likened to their relationships to other nodes. The size of the node is
indicative of its centrality within the community. The thickness of the links is relative to the
number of services between the port pairs. Red nodes symbolise individual ports within
the community whereas the green nodes symbolise the collective ports in a world region
that form part of the community structure.
It is important to keep in mind that these diagrams do not represent port capacity
or actual freight flow, but rather the strength of connections between, and relative
importance of community members. Also, the four diagrams are not drawn to the same
scale and thus node sizes and link widths should not be compared directly between the
four diagrams.
Figure 26: Network structure of the South East Asian (SEA) port community
47 SECTION 2: REGIONAL CONNECTIVITY 9th State of LogisticsTM survey for South Africa 2012 48

Figure 26 shows that SEA is a very tightly knit community centred around the economy of
China (East Asia world region) and the two transhipment hubs of the Port of Singapore,
Singapore and Port Klang, Malaysia. With an average clustering coefficient of 0.65, the
graph shows that overall, nodes in this community have a higher clustering coefficient
than in the other communities. Although a number of nodes are on the outskirts of the
network diagram, their neighbours are within the tightly knit core cluster of the network,
ensuring that the outlying nodes are still well-connected by association.
Figure 27 shows that the US East coast region plays the dominant role in the CAR
community with the Panamanian ports (Manzanillo, Balboa and Cristobal) and Kingston,
Jamaica being the most prominent of the community ports. This rings true as the US
economy and the Panama Canal are the key maritime business drivers in the Caribbean.
The relative sizes of the nodes indicate that only a few community ports have a higher–
than-average centrality score. The community, with an average clustering coefficient of
0.33, is not as densely clustered as SEA. The graph shows that the community structure
is much more dispersed with many ports having only a few neighbours that are greatly
independent of each other.
Figure 27: Network structure of the Caribbean (CAR) port community
49 SECTION 2: REGIONAL CONNECTIVITY 9th State of LogisticsTM survey for South Africa 2012 50
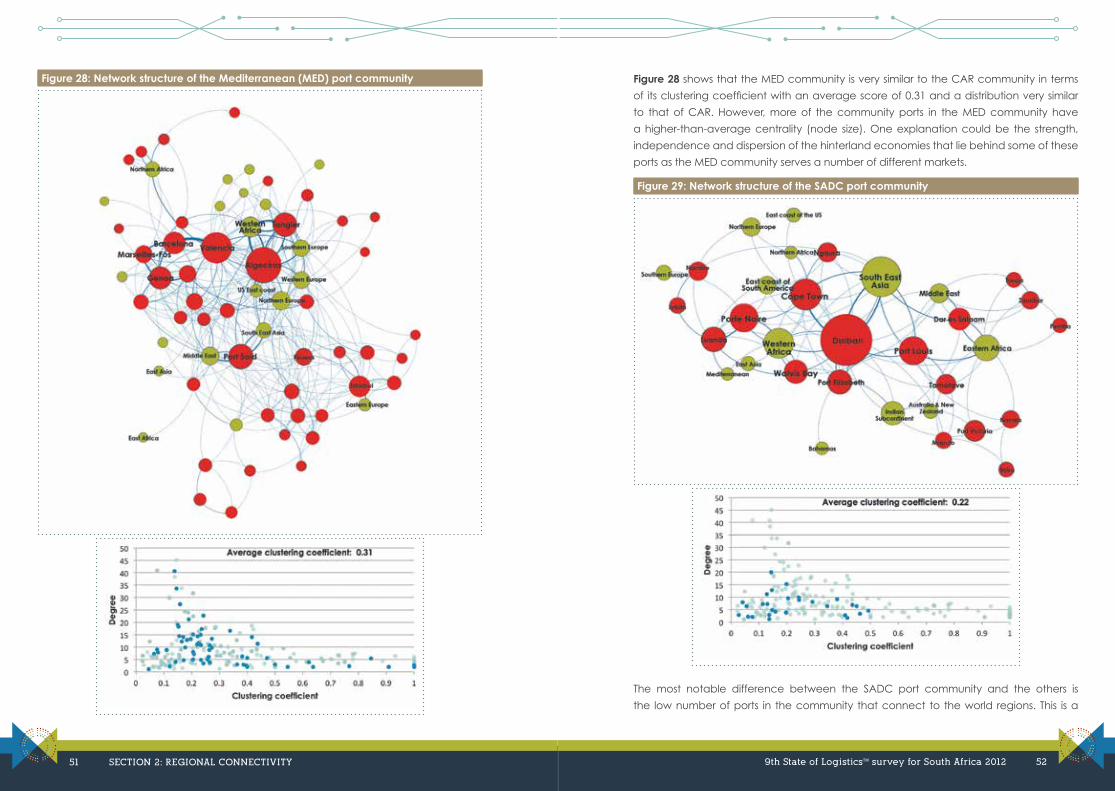
Figure 28: Network structure of the Mediterranean (MED) port community Figure 28 shows that the MED community is very similar to the CAR community in terms
of its clustering coefficient with an average score of 0.31 and a distribution very similar
to that of CAR. However, more of the community ports in the MED community have
a higher-than-average centrality (node size). One explanation could be the strength,
independence and dispersion of the hinterland economies that lie behind some of these
ports as the MED community serves a number of different markets.
Figure 29: Network structure of the SADC port community
The most notable difference between the SADC port community and the others is
the low number of ports in the community that connect to the world regions. This is a
51 SECTION 2: REGIONAL CONNECTIVITY 9th State of LogisticsTM survey for South Africa 2012 52
result of the continental geography and a lack of emphasis on maritime trade in the
past decades (Figure 29). The diagram echoes insights from the Port Connectivity Index,
showing Durban and Port Louis as prominent role players with Cape Town, Port Elizabeth
and Walvis Bay being well connected.
The importance of South East Asia in the community springs from the fact that many
container shipments bound for SADC from around the world must first be transhipped,
often onto smaller vessels, in SEA. Transhipment requirements may also be an explanation
of the relative importance of Eastern and Western Africa (apart from geographic
proximity). According to the average clustering coefficient (0.22), the community is
less tightly knit than the CAR, MED and SEA communities. From the distribution of the
clustering coefficient, all the ports have only a few neighbours that are independent of
one another. One of the causes of this sparse network is the shortage of frequent feeder
services between community ports.
The role of external world regions in these localised geographic communities is
also apparent from the network diagrams. Where the CAR and SEA communities are
anchored by economies outside of their community and thus political and economic
control, namely the American and Chinese economies, the communities in MED and
SADC are anchored by hinterland economies governed by the same political and
economic powers as those that govern the ports in the community. This emphasises the
role the SADC countries have to play collectively in developing the maritime community
– ultimately proactive change will have to come from inside SADC as it will not be a
reactive result of growth in external economies.
MAKING SADC A WORLD-CLASS TRANSHIPMENT COMMUNITY
Ultimately, the market power in the maritime industry lies with the shipping lines and the
freight forwarders who decide where and how cargo will be shipped88,89,90,91. The SADC
region cannot alter its geographic location, but two key competitive elements should be
pursued by the region as a whole:
88 Notteboom, TE. 2012. Towards a new intermediate hub region in container shipping? Relay and interlining via the Cape route vs. the Suez route. Journal of Transport Geography. 22:164-178.
89 Tongzon, JL. 2009. Port choice and freight forwarders. Transportation Research Part E. 45:186-195.
90 Tongzon, JL. and Sawant, L. 2007. Port choice in a competitive environment: from the shipping lines’ perspective. Applied Economics. 39:477-492.
91 Organisation for Economic Co-operation and Development (OECD) and International Transport Forum (ITF). 2008. Port Competition and Hinterland Connections. Joint Transport Research Centre. Discussion Paper No. 2008-19. Joint Transport Research Centre, Round Table. 10 -11 April 2008. Paris.
� Hinterland connectivity and quality of logistics services. The efficiency and
connectivity of inland transport systems is a crucial deciding factor. “The portion
of inland costs in the total costs of container shipping would range from 40% to
80%. Many shipping lines therefore consider inland logistics as the most vital area
still left to cut costs.” 92. Inland connectivity in SADC (pp 57-64) addresses inland
transport issues in SADC.
� Cargo availability and a good market structure. This implies developing a local
cargo base that attracts a critical mass of liner services based on gateway traffic.
Critical to a strong local cargo base are efficient strategies for dealing with empty
containers.
In addition, SADC ports can focus on the following competitive elements:
� Low port tariffs. Transhipment containers have a lower revenue margin because
of additional handling costs. SADC port tariffs need to be competitive with
transhipment hubs along the Cape and Suez Routes to attract transhipment
volumes. According to the Ports Regulator, the tariff for a unitary container vessel
at the Port of Durban in 2010 was US $180 000, more than double the global
average of US $65 00093. Tariffs could well become one of the leading reasons
why transhipment traffic is redirected away from SADC to other regions.
� Availability of ship services at ports. Currently the scope of ship services is limited
at SADC ports.
� High reliability of port operations and scheduling. “…smooth synchronization of
deepsea services requires a high schedule integrity” 94.
� Draft conditions that can accommodate increasing vessel size.
Of course, all of these competitive differentiators are moot points if infrastructure
constraints and operational capacity simply cannot handle increased business volumes
or larger vessels.
92 Notteboom, TE. and Rodrigue, J. 2005. Port regionalization towards a new phase in port development. Maritime Policy & Management. 32(3): 297-313.
93 Development Bank of Southern Africa. 2012. The State of South Africa’s Economic Infrastructure: Opportunities and Challenges 2012. Development Planning Division: Development Bank of Southern Africa. South Africa.
94 Notteboom, TE. 2012. Towards a new intermediate hub region in container shipping? Relay and interlining via the Cape route vs. the Suez route. Journal of Transport Geography. 22:164-178.
53 SECTION 2: REGIONAL CONNECTIVITY 9th State of LogisticsTM survey for South Africa 2012 54
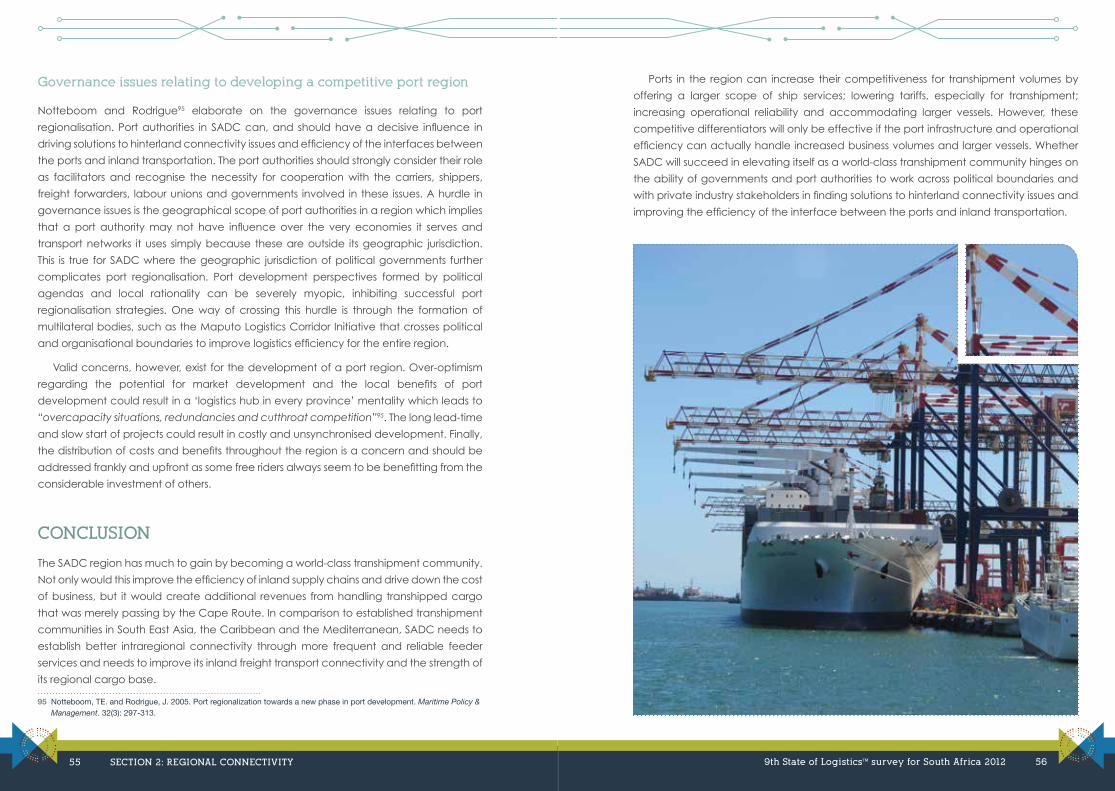
Governance issues relating to developing a competitive port region
Notteboom and Rodrigue95 elaborate on the governance issues relating to port
regionalisation. Port authorities in SADC can, and should have a decisive influence in
driving solutions to hinterland connectivity issues and efficiency of the interfaces between
the ports and inland transportation. The port authorities should strongly consider their role
as facilitators and recognise the necessity for cooperation with the carriers, shippers,
freight forwarders, labour unions and governments involved in these issues. A hurdle in
governance issues is the geographical scope of port authorities in a region which implies
that a port authority may not have influence over the very economies it serves and
transport networks it uses simply because these are outside its geographic jurisdiction.
This is true for SADC where the geographic jurisdiction of political governments further
complicates port regionalisation. Port development perspectives formed by political
agendas and local rationality can be severely myopic, inhibiting successful port
regionalisation strategies. One way of crossing this hurdle is through the formation of
multilateral bodies, such as the Maputo Logistics Corridor Initiative that crosses political
and organisational boundaries to improve logistics efficiency for the entire region.
Valid concerns, however, exist for the development of a port region. Over-optimism
regarding the potential for market development and the local benefits of port
development could result in a ‘logistics hub in every province’ mentality which leads to
“overcapacity situations, redundancies and cutthroat competition”95. The long lead-time
and slow start of projects could result in costly and unsynchronised development. Finally,
the distribution of costs and benefits throughout the region is a concern and should be
addressed frankly and upfront as some free riders always seem to be benefitting from the
considerable investment of others.
CONCLUSION
The SADC region has much to gain by becoming a world-class transhipment community.
Not only would this improve the efficiency of inland supply chains and drive down the cost
of business, but it would create additional revenues from handling transhipped cargo
that was merely passing by the Cape Route. In comparison to established transhipment
communities in South East Asia, the Caribbean and the Mediterranean, SADC needs to
establish better intraregional connectivity through more frequent and reliable feeder
services and needs to improve its inland freight transport connectivity and the strength of
its regional cargo base.
95 Notteboom, TE. and Rodrigue, J. 2005. Port regionalization towards a new phase in port development. Maritime Policy & Management. 32(3): 297-313.
Ports in the region can increase their competitiveness for transhipment volumes by
offering a larger scope of ship services; lowering tariffs, especially for transhipment;
increasing operational reliability and accommodating larger vessels. However, these
competitive differentiators will only be effective if the port infrastructure and operational
efficiency can actually handle increased business volumes and larger vessels. Whether
SADC will succeed in elevating itself as a world-class transhipment community hinges on
the ability of governments and port authorities to work across political boundaries and
with private industry stakeholders in finding solutions to hinterland connectivity issues and
improving the efficiency of the interface between the ports and inland transportation.
55 SECTION 2: REGIONAL CONNECTIVITY 9th State of LogisticsTM survey for South Africa 2012 56
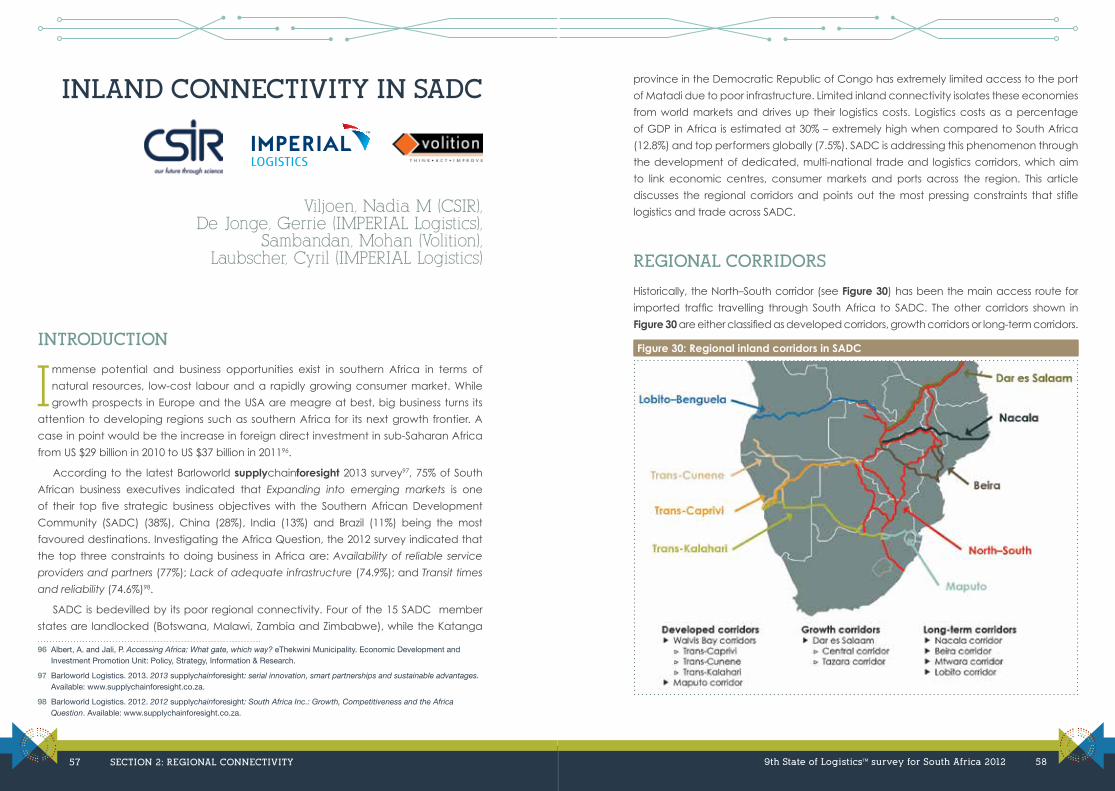
INLAND CONNECTIVITY IN SADC
Viljoen, Nadia M (CSIR), De Jonge, Gerrie (IMPERIAL Logistics),
Sambandan, Mohan (Volition), Laubscher, Cyril (IMPERIAL Logistics)
INTRODUCTION
Immense potential and business opportunities exist in southern Africa in terms of
natural resources, low-cost labour and a rapidly growing consumer market. While
growth prospects in Europe and the USA are meagre at best, big business turns its
attention to developing regions such as southern Africa for its next growth frontier. A
case in point would be the increase in foreign direct investment in sub-Saharan Africa
from US $29 billion in 2010 to US $37 billion in 201196.
According to the latest Barloworld supplychainforesight 2013 survey97, 75% of South
African business executives indicated that Expanding into emerging markets is one
of their top five strategic business objectives with the Southern African Development
Community (SADC) (38%), China (28%), India (13%) and Brazil (11%) being the most
favoured destinations. Investigating the Africa Question, the 2012 survey indicated that
the top three constraints to doing business in Africa are: Availability of reliable service
providers and partners (77%); Lack of adequate infrastructure (74.9%); and Transit times
and reliability (74.6%)98.
SADC is bedevilled by its poor regional connectivity. Four of the 15 SADC member
states are landlocked (Botswana, Malawi, Zambia and Zimbabwe), while the Katanga
96 Albert, A. and Jali, P. Accessing Africa: What gate, which way? eThekwini Municipality. Economic Development and Investment Promotion Unit: Policy, Strategy, Information & Research.
97 Barloworld Logistics. 2013. 2013 supplychainforesight: serial innovation, smart partnerships and sustainable advantages. Available: www.supplychainforesight.co.za.
98 Barloworld Logistics. 2012. 2012 supplychainforesight: South Africa Inc.: Growth, Competitiveness and the Africa Question. Available: www.supplychainforesight.co.za.
province in the Democratic Republic of Congo has extremely limited access to the port
of Matadi due to poor infrastructure. Limited inland connectivity isolates these economies
from world markets and drives up their logistics costs. Logistics costs as a percentage
of GDP in Africa is estimated at 30% – extremely high when compared to South Africa
(12.8%) and top performers globally (7.5%). SADC is addressing this phenomenon through
the development of dedicated, multi-national trade and logistics corridors, which aim
to link economic centres, consumer markets and ports across the region. This article
discusses the regional corridors and points out the most pressing constraints that stifle
logistics and trade across SADC.
REGIONAL CORRIDORS
Historically, the North–South corridor (see Figure 30) has been the main access route for
imported traffic travelling through South Africa to SADC. The other corridors shown in
Figure 30 are either classified as developed corridors, growth corridors or long-term corridors.
Figure 30: Regional inland corridors in SADC
57 SECTION 2: REGIONAL CONNECTIVITY 9th State of LogisticsTM survey for South Africa 2012 58
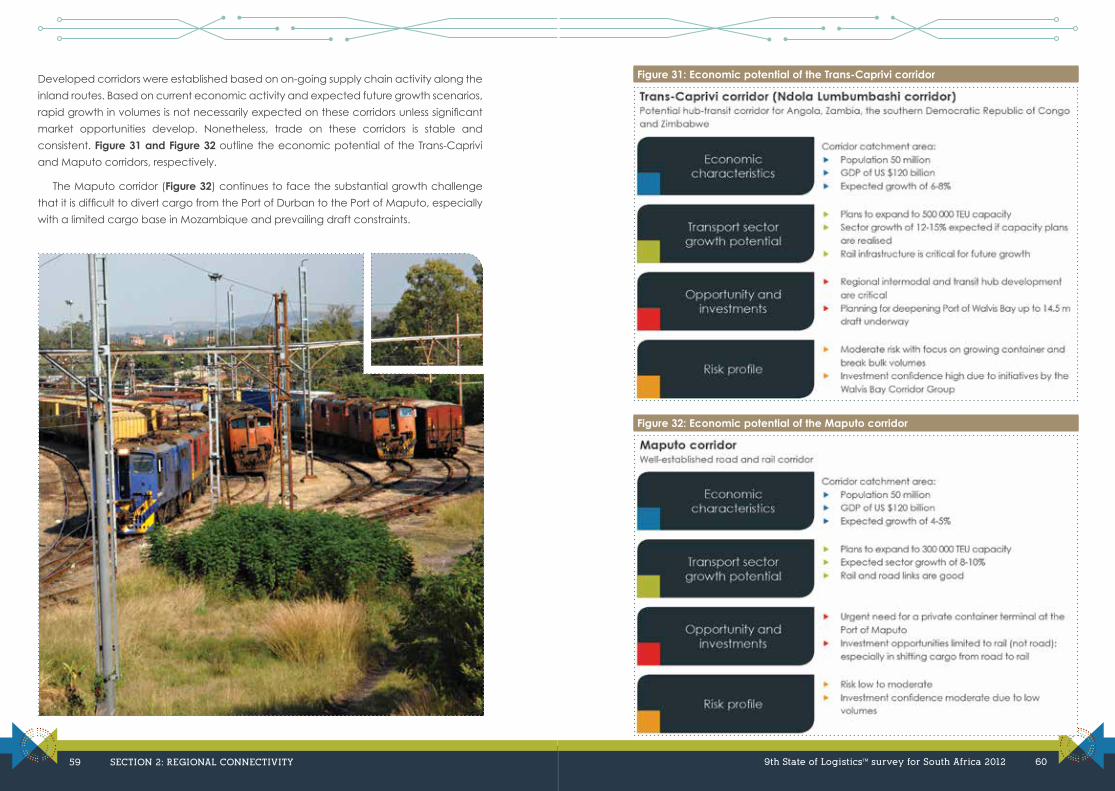
Developed corridors were established based on on-going supply chain activity along the
inland routes. Based on current economic activity and expected future growth scenarios,
rapid growth in volumes is not necessarily expected on these corridors unless significant
market opportunities develop. Nonetheless, trade on these corridors is stable and
consistent. Figure 31 and Figure 32 outline the economic potential of the Trans-Caprivi
and Maputo corridors, respectively.
The Maputo corridor (Figure 32) continues to face the substantial growth challenge
that it is difficult to divert cargo from the Port of Durban to the Port of Maputo, especially
with a limited cargo base in Mozambique and prevailing draft constraints.
Figure 31: Economic potential of the Trans-Caprivi corridor
Figure 32: Economic potential of the Maputo corridor
59 SECTION 2: REGIONAL CONNECTIVITY 9th State of LogisticsTM survey for South Africa 2012 60
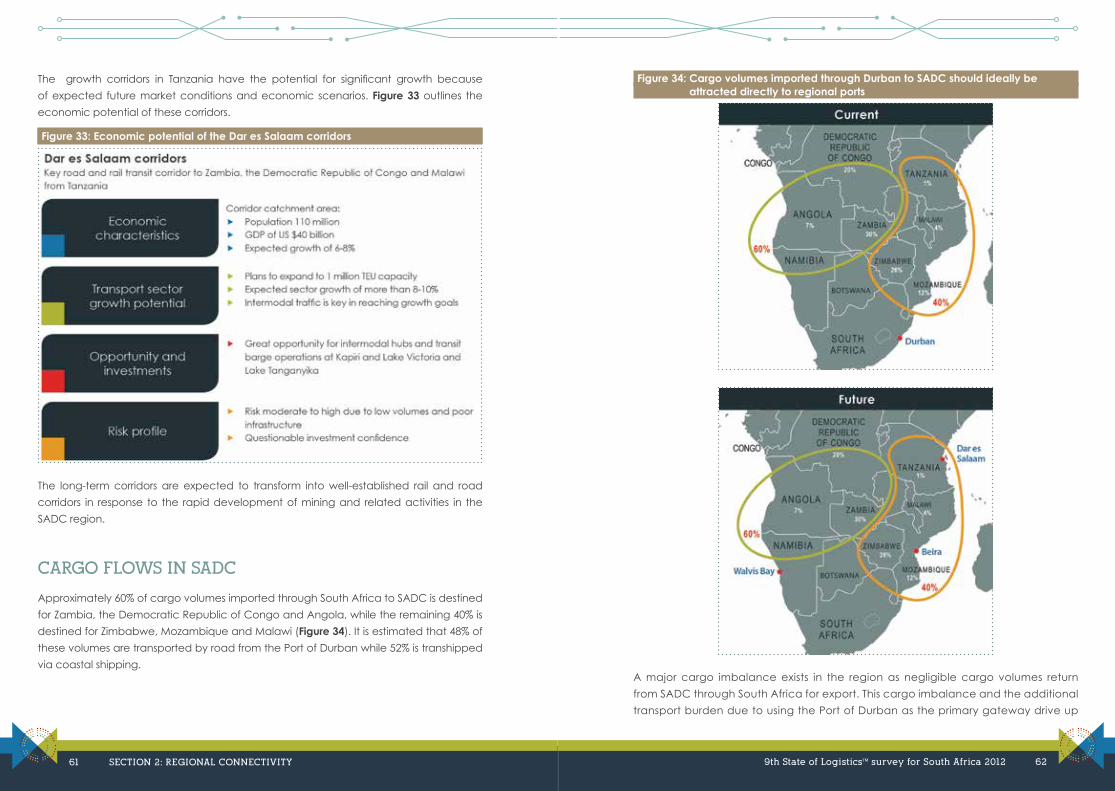
The growth corridors in Tanzania have the potential for significant growth because
of expected future market conditions and economic scenarios. Figure 33 outlines the
economic potential of these corridors.
Figure 33: Economic potential of the Dar es Salaam corridors
The long-term corridors are expected to transform into well-established rail and road
corridors in response to the rapid development of mining and related activities in the
SADC region.
CARGO FLOWS IN SADC
Approximately 60% of cargo volumes imported through South Africa to SADC is destined
for Zambia, the Democratic Republic of Congo and Angola, while the remaining 40% is
destined for Zimbabwe, Mozambique and Malawi (Figure 34). It is estimated that 48% of
these volumes are transported by road from the Port of Durban while 52% is transhipped
via coastal shipping.
Figure 34: Cargo volumes imported through Durban to SADC should ideally be attracted directly to regional ports
A major cargo imbalance exists in the region as negligible cargo volumes return
from SADC through South Africa for export. This cargo imbalance and the additional
transport burden due to using the Port of Durban as the primary gateway drive up
61 SECTION 2: REGIONAL CONNECTIVITY 9th State of LogisticsTM survey for South Africa 2012 62
the cost of logistics.
Attracting the international traffic directly to the regional ports of Walvis
Bay, Beira and Dar es Salaam seems like the best solution, but this requires that
adequate infrastructure be provided at those ports and that the regional corridors
are developed as expected.
REGIONAL CONSTRAINTS TO CONNECTIVITY AND COMPETITIVENESS
There are, however, a number of ubiquitous issues that SADC governments need to address
sternly before the envisioned strategic initiatives to build regional connectivity can be
realised. First and foremost, governments must create an environment conducive to lucrative
public-private partnerships (PPPs) that would attract the private sector. Unfortunately, the
necessary collaborative platforms and frameworks required to fast-track open discussion
and negotiation between public and private sectors are lacking. Globally competitive and
transparent trade facilitation, procedures for cross-border trade and corridor development
plans need to be underpinned by government commitment and investment.
Correcting the cargo imbalance in the region and having balanced two-way traffic
are also essential in driving down the considerable additional logistics costs incurred
through ‘empty trips’. However, correcting this imbalance is not only a transport issue but
an underlying trade and development one.
Cross-border movements in SADC are hampered by cumbersome and inefficient
paperwork and delays at border posts. Trade procedures and paperwork are vastly
duplicative with a lack of alignment between governments and trading agencies.
It has been recorded that in some cross-border movements up to 25 different parties
are involved, requiring 40 different documents. The design of information systems is
cumbersome, often having redundant data elements.
Human error in entering forms has resulted in the re-entering of data more than 80%
of the time at subsequent border posts. Border posts in SADC suffer from a dire lack of
human resources required to execute current trade procedures. The concept of the one-
stop border post has been implemented at some border posts in the region with varying
degrees of success, but by-and-large delays at border posts are still one of the key cost
drivers in logistics costs and present a road-block to trade facilitation.
More generally, the integrity and strength of political and regulatory institutions are still
questionable in SADC and corruption erodes competitiveness and broad-based socio-
economic development. A lack of socio-economic development is clearly apparent
in the high levels of unemployment, poor education systems, gender discrimination,
abysmal health care and the extreme reliance of the region on donor funding. A
shortage of skilled human resources and deficient infrastructure further exacerbates the
region’s logistics challenges.
CONCLUSION
SADC holds immense potential for business development and foreign direct investment
with many developed countries chomping at the bit to establish their markets in
southern Africa. The region aims to redress a legacy of extremely poor connectivity
through the development of strategic trade and logistics corridors that link economic
centres, countries and ports. Significant port expansion projects are also on the cards to
enable more direct shipping to destination markets in SADC. The strategic initiatives are
heartening and, if realised, would transform the region into a very attractive, globally
competitive economic region. However, these initiatives cannot succeed without the
governments of the member states getting serious about enabling lucrative PPPs and
addressing stifling operational inefficiencies in cross-border trade.
63 SECTION 2: REGIONAL CONNECTIVITY 9th State of LogisticsTM survey for South Africa 2012 64

SECTION 3: TOPICAL RESEARCH
TRANSPORT INFRASTRUCTURE AND PLANNING
Ittmann, Hans W (HWI Consulting)
INTRODUCTION
There is general agreement that infrastructure is the cornerstone of a stable and
productive society. The correct approach to constructing and maintaining
infrastructure, including transport infrastructure, is essential to create a strong and
competitive economy. Infrastructure not only presents huge challenges, it also provides
opportunities for both the public and private sectors. This article focuses on road, rail,
port, pipeline, and airport infrastructure within South Africa, all of which are essential and
very critical for supply chain management and logistics services within the country. In
addition, the planning and construction of infrastructure, which is a critical but more
complex aspect, are also discussed briefly. Planning of infrastructure is much more
challenging since it involves a high degree of uncertainty. Infrastructure is typically built
to last 20 to 30 years and in the case of rail infrastructure, even longer. Decisions regarding
where to construct new infrastructure and where to enhance capacity are dependent
on forecasting an uncertain future while the capital expenditure required for this kind of
infrastructure is enormous, leaving very little room for error.
IMPORTANCE OF TRANSPORT INFRASTRUCTURE AND PLANNING
Infrastructure – transport infrastructure in particular – is critical for the economic
development and growth of a country. The National Development Plan, now
adopted by the South African government as its development plan for the
future, clearly states the tremendous challenge the country faces in this regard:
9th State of LogisticsTM survey for South Africa 2012 66

“South Africa has missed a generation of capital investment in roads, rail, ports, electricity,
water, sanitation, public transport and housing”99.
The situation in South Africa is not unique; across the world, inadequate or poorly
performing infrastructure presents major economic challenges. All of this comes at a time
when most governments are heavily indebted while their scarce resources cannot meet
all the needs. McKinsey Global Insight100 estimates that US $57 trillion is required to invest
in infrastructure between now and 2030 worldwide, just to keep up with projected global
Gross Domestic Product (GDP) growth. The infrastructure referred to includes transport
(road, rail, ports and airports), water, energy, and telecommunications.
Kessides101 provides comprehensive evidence to illustrate the contribution of
infrastructure to economic development. Recent research on this aspect by the World
Bank102 shows that for every 10% increase in infrastructure provision, there is an increase of
approximately 1% in output over the long term. On the other hand, improved infrastructure
quality accounted for 30% of growth attributed to infrastructure in developing countries.
Clearly the impact of infrastructure on growth varies from country to country. For a
country such as Egypt, Loayza and Odawara103 found that the country has experienced
remarkable progress in the provision of infrastructure in all areas, including transportation.
They also suggest that an increase in infrastructure expenditure from 5-6% of GDP would
raise the annual per capita GDP rate by about 0.5 percentage points within a decade
and by 1 percentage point by the third decade. In their study of infrastructure in Latin-
America, Calderón and Servén104 conducted an empirical evaluation of the potential
contribution of infrastructure to growth in the region. They show that there is “robust
evidence that infrastructure development – measured by an increased volume of
infrastructure stocks and an improved quality of infrastructure services – has a positive
impact on long-run growth”.
Given the huge capital investment required internationally for transport infrastructure,
new and innovative ways to address the problem are being developed and
99 National Planning Commission 2011. Diagnostic Overview. Available: http://www.npconline.co.za/pebble.asp?relid=33
100 McKinsey Global Insight. 2013. Infrastructure productivity: How to save $1 trillion a year. January 2013.
101 Kessides, C. 1993. The contributions of infrastructure to economic development: A review of experience and policy implications. The World Bank. Washington, D.C.
102 World Bank. 2013. Can infrastructure investments generate growth? The World Bank. Washington, D.C. Available: http://web.worldbank.org/WBSITE/EXTERNAL/TOPICS/EXTINFRA/0,,contentMDK:23154473~pagePK:64168445~piPK:64168309~theSitePK:8430730,00.html
103 Loayza, N. and Odawara,R. 2010. Infrastructure and Economic Growth in Egypt. Policy Research Working Paper 5177. The World Bank. Washington, D.C.
104 Calderón, C. and Servén, L. 2010. Infrastructure in Latin America. Policy Research Working Paper 5317. The World Bank. Washington, D.C.
implemented, this also applies to planning processes. In Canada, the National
Transportation Policy105 is based on two key innovative principles namely:
1. Maximising the capacity of the transport network, this is achieved by:
� Improving the operations and efficiency of the existing system;
� Strategically expanding the capacity of the system by exploring new models of
funding;
� Ensuring the availability of a skilled labour pool to meet the industry’s needs;
� Ensuring statutory, regulatory and institutional regimes to support a strong system; and
� Proactively identifying and addressing emerging transportation needs.
2. Earning public support through socially responsible behaviour to minimise
environmental impact, to address safety and also to engage the public in
education.
McKinsey106 proposes three broad approaches to save up to US $1 trillion per annum on
worldwide infrastructure expenditure through:
� Optimising project portfolios by avoiding investments in projects that neither
address clearly defined needs nor deliver sufficient benefits;
� Streamlining delivery through speeding up the approval processes. This is
achieved by investing heavily in the early stages of project planning and design,
and structuring contracts to encourage time and cost savings; and
� Making the most of existing infrastructure through mechanisms such as boosting
asset utilisation and optimising maintenance planning.
It is clear that governments have a crucial role to play in implementing these approaches
to optimise infrastructure investment. A recurring theme is the increased participation of
the private sector in the planning and provision of infrastructure.
STRATEGIC PLANNING PROCESS
The objective of establishing transport infrastructure is to provide the necessary capacity
before the demand for transport is realised. Therefore development plans and long-term
planning are typified by, among others, forecasting an uncertain future, long lead times
and huge investments. The life-span of the infrastructure is also long term, in most cases
105 Framework for the National Transportation Policy 2008. Canada. Available: http://www.westac.com/pdfs/FrameworkNTP.pdf
106 McKinsey Global Insight 2013. Infrastructure productivity: How to save $1 trillion a year. January 2013.
67 SECTION 3: TOPICAL RESEARCH 9th State of LogisticsTM survey for South Africa 2012 68

this is typically 20-30 years whereas for rail it is much longer. Before detailed planning
can commence, a decision must be made regarding which portfolio of potential future
growth scenarios would materialise. This is no trivial task. Once decided, the planning
process indicated in Figure 35 should be followed. This process needs to be re-evaluated
on an almost annual basis and adapted as required. The aim of developing transport
infrastructure ahead of demand is, in essence, a response to economic and demographic
activity. For example, if there is very clear evidence that the demand for a commodity,
exported by rail, is going to grow over time, it makes sense to increase the capacity on
the rail line for it to meet the increased demand when it materialises. Another approach,
which has also been used in South Africa, is to encourage and stimulate economic
development through the establishment of infrastructure. An example is the Port of
Ngqura which was built with the clear intention of stimulating economic development
in that region. Road and rail infrastructure is now also in place and economic activity is
starting to realise.
Figure 35: Strategic planning process
THE STATUS QUO OF TRANSPORT INFRASTRUCTURE IN SOUTH AFRICA
The road and rail infrastructure in South Africa stretches across the entire country and
most areas are generally fairly well-connected, except specific remote areas. Roads
in the country fall under the jurisdiction of three spheres of government, namely,
national, provincial and municipal. The total proclaimed roads in the country amount
to approximately 535 000 km in length, of which 366 872 km are non-urban roads
and 168 000 km are urban roads107. Of the non-urban roads, 32 340 km fall under the
management of the South African National Road Agency Limited (SANRAL) – see the
map in Figure 36 – while just over 300 000 km of the proclaimed roads are gravel roads.
Figure 36: National roads managed by SANRAL108
107 SANRAL, 2013. SANRAL network. Available: http://www.nra.co.za/live/content.php?Category_ID=46
69 SECTION 3: TOPICAL RESEARCH 9th State of LogisticsTM survey for South Africa 2012 70
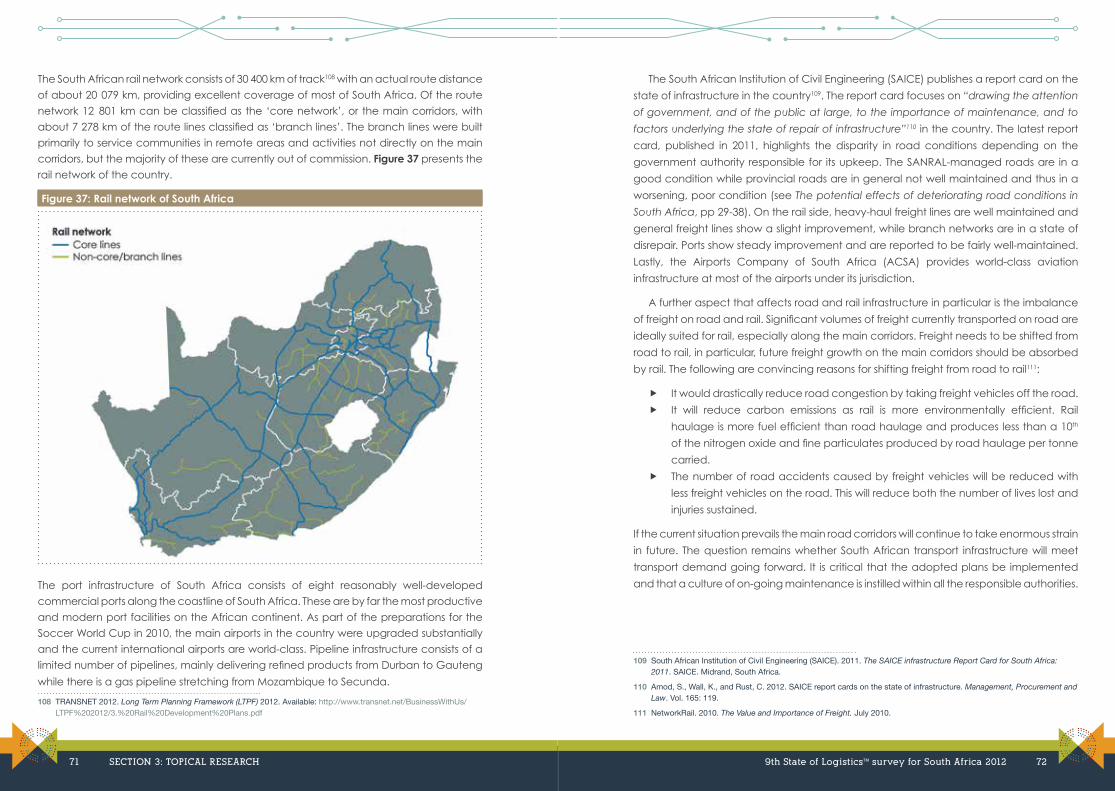
The South African rail network consists of 30 400 km of track108 with an actual route distance
of about 20 079 km, providing excellent coverage of most of South Africa. Of the route
network 12 801 km can be classified as the ‘core network’, or the main corridors, with
about 7 278 km of the route lines classified as ‘branch lines’. The branch lines were built
primarily to service communities in remote areas and activities not directly on the main
corridors, but the majority of these are currently out of commission. Figure 37 presents the
rail network of the country.
Figure 37: Rail network of South Africa
The port infrastructure of South Africa consists of eight reasonably well-developed
commercial ports along the coastline of South Africa. These are by far the most productive
and modern port facilities on the African continent. As part of the preparations for the
Soccer World Cup in 2010, the main airports in the country were upgraded substantially
and the current international airports are world-class. Pipeline infrastructure consists of a
limited number of pipelines, mainly delivering refined products from Durban to Gauteng
while there is a gas pipeline stretching from Mozambique to Secunda.
108 TRANSNET 2012. Long Term Planning Framework (LTPF) 2012. Available: http://www.transnet.net/BusinessWithUs/LTPF%202012/3.%20Rail%20Development%20Plans.pdf
The South African Institution of Civil Engineering (SAICE) publishes a report card on the
state of infrastructure in the country109. The report card focuses on “drawing the attention
of government, and of the public at large, to the importance of maintenance, and to
factors underlying the state of repair of infrastructure”110 in the country. The latest report
card, published in 2011, highlights the disparity in road conditions depending on the
government authority responsible for its upkeep. The SANRAL-managed roads are in a
good condition while provincial roads are in general not well maintained and thus in a
worsening, poor condition (see The potential effects of deteriorating road conditions in
South Africa, pp 29-38). On the rail side, heavy-haul freight lines are well maintained and
general freight lines show a slight improvement, while branch networks are in a state of
disrepair. Ports show steady improvement and are reported to be fairly well-maintained.
Lastly, the Airports Company of South Africa (ACSA) provides world-class aviation
infrastructure at most of the airports under its jurisdiction.
A further aspect that affects road and rail infrastructure in particular is the imbalance
of freight on road and rail. Significant volumes of freight currently transported on road are
ideally suited for rail, especially along the main corridors. Freight needs to be shifted from
road to rail, in particular, future freight growth on the main corridors should be absorbed
by rail. The following are convincing reasons for shifting freight from road to rail111:
� It would drastically reduce road congestion by taking freight vehicles off the road.
� It will reduce carbon emissions as rail is more environmentally efficient. Rail
haulage is more fuel efficient than road haulage and produces less than a 10th
of the nitrogen oxide and fine particulates produced by road haulage per tonne
carried.
� The number of road accidents caused by freight vehicles will be reduced with
less freight vehicles on the road. This will reduce both the number of lives lost and
injuries sustained.
If the current situation prevails the main road corridors will continue to take enormous strain
in future. The question remains whether South African transport infrastructure will meet
transport demand going forward. It is critical that the adopted plans be implemented
and that a culture of on-going maintenance is instilled within all the responsible authorities.
109 South African Institution of Civil Engineering (SAICE). 2011. The SAICE infrastructure Report Card for South Africa: 2011. SAICE. Midrand, South Africa.
110 Amod, S., Wall, K., and Rust, C. 2012. SAICE report cards on the state of infrastructure. Management, Procurement and Law. Vol. 165: 119.
111 NetworkRail. 2010. The Value and Importance of Freight. July 2010.
71 SECTION 3: TOPICAL RESEARCH 9th State of LogisticsTM survey for South Africa 2012 72
DEVELOPMENT PLANSThe Department of Transport published a White Paper on National Transport Policy in 1996 with the vision of integrating transport operations and infrastructure for both freight and passengers while meeting specific economic and social needs. To give impetus to this vision, the Moving South Africa Strategy (MSA) was developed in 1998. The MSA was not implemented mainly because projected freight volumes grew much faster than anticipated. A new strategy, the National Freight Logistics Strategy (NFLS)112 was developed in 2005, focusing much more on regulatory and institutional reform to ensure a more efficient freight system. Subsequent to the NFLS, the National Transport Master Plan (NATMAP 2050) has been developed to establish a “dynamic, long-term and sustainable land use/multi-modal transportation systems framework”113; the vision of this plan being: “continuously upgrading infrastructure and services ahead of demand”. The first two plans had limited impact and it is too early to judge what the outcome will be of NATMAP 2050.
CURRENT TRANSPORT INFRASTRUCTURE INVESTMENT PROCESS IN SOUTH AFRICAThe South African government is committed to addressing the infrastructure requirements in the country and has established several institutions to strengthen state capacity for infrastructure delivery114. In this regard a Presidential Infrastructure Coordinating Commission (PICC), headed by the President, has been established to coordinate and oversee the implementation of strategic infrastructure projects (SIPs) that stimulate social and economic growth. Eighteen SIPs have been identified and approved to support economic development and address service delivery in the poorest provinces115. Seven SIPs include a sizeable transport infrastructure component, including:
� SIP 1: Unlocking the northern mineral belt with Waterberg as the catalyst; � SIP 2: Durban–Free State–Gauteng logistics and industrial corridor; � SIP 3: South eastern node and corridor development; � SIP 4: Unlocking economic opportunities in North West; � SIP 5: Saldanha–Northern Cape development corridor; � SIP 11: Agri-logistics and rural infrastructure; and
� SIP 17: Regional integration for African cooperation and development.
112 Department of Transport. 2005. National Freight Logistics Strategy. Available: http://www.portsregulator.org/images/documents/National_Freight_Logistics_Strategy.pdf
113 Dyodo, S. 2011. National Transport Master Plan (NATMAP 2050). 13th African Renaissance Conference. Durban. Available: http://ebandla.co.za/uploads/SibuleleDyodo.pdf
114 Development Bank of Southern Africa. 2012. The State of South Africa’s Economic Infrastructure: Opportunities and Challenges 2012. Development Planning Division: Development Bank of Southern Africa. South Africa.
115 Presidential Infrastructure Coordinating Commission (PICC). 2012. A summary of the Infrastructure Plan. Presidential Planning Commission Coordinating Commission. Provincial and Local Government Conference. 13 April 2012. Available: www.info.gov.za/speeches/docs/2012/picc-presentation_120413.pdf
The individual SIPs are managed by a state-owned enterprise or state agency116.
There is no indication of direct private sector involvement in these SIPs. The Minister of
Economic Development did, however, indicate that the private sector was requested to
provide inputs regarding these infrastructure plans. Funding for infrastructure will remain
a challenge but government is unrealistic if it expects to satisfy all the infrastructure
development needs itself. In order to address this challenge, it is necessary to attract new
investors, mainly from the private sector. More involvement of the private sector in the
development and execution of infrastructure plans is a necessity.
The funds that are allocated for all infrastructure developments, including transport,
are substantial. For the period 2012/2013–2014/2015, public-sector funding is estimated
at a total of R844.5 billion. In addition, the Market Demand Strategy117 of Transnet entails
an investment in rail and port infrastructure of R300 billion over a seven-year period that
started in 2012. At a recent post-State of the Nation Address media briefing118, Economic
Development Minister Patel indicated that the PICC is monitoring progress on these SIP
projects on a quarterly basis. Speeding up government spending remains a challenge
but efforts are underway to streamline processes to address this. The Minister indicated
that government has introduced new practices and processes in legislation to address
these bottlenecks (for example the current bitumen shortage) and to ensure government
acts in a more integrated and coordinated manner.
CONCLUSION
No economy can operate efficiently without sufficient and well-maintained transport
infrastructure since this is a necessary requirement for competitive supply chains. Although
the National Development Plan stresses the importance of infrastructure development,
the need for a ‘National Logistics Infrastructure Plan’ remains. The importance of logistics
and supply chain management for a thriving, growing and competitive economy is
essential. The various players all need to jointly develop such a plan, and cooperate and
collaborate in making this happen in the interest of the country. Private sector involvement
in infrastructure development, specifically logistics infrastructure, is becoming non-
negotiable. This fact is recognised worldwide as governments find it increasingly difficult
to meet all the needs of their respective countries.
116 Maake, M. 2012. Infrastructure projects will ‘not come cheap’, Business Day. 21 October 2012. Available: http://www.bdlive.co.za/economy/2012/10/21/infrastructure-projects-will-not-come-cheap
117 Transnet. 2012. Market Demand Strategy. Available: http://www.transnet.net/PressOffice/Pages/Market-Demand-Strategy.aspx
118 Esterhuizen, I. 2013. Speeding up State Infrastructure spending a challenge. Engineering News. 7 March 2013.
73 SECTION 3: TOPICAL RESEARCH 9th State of LogisticsTM survey for South Africa 2012 74
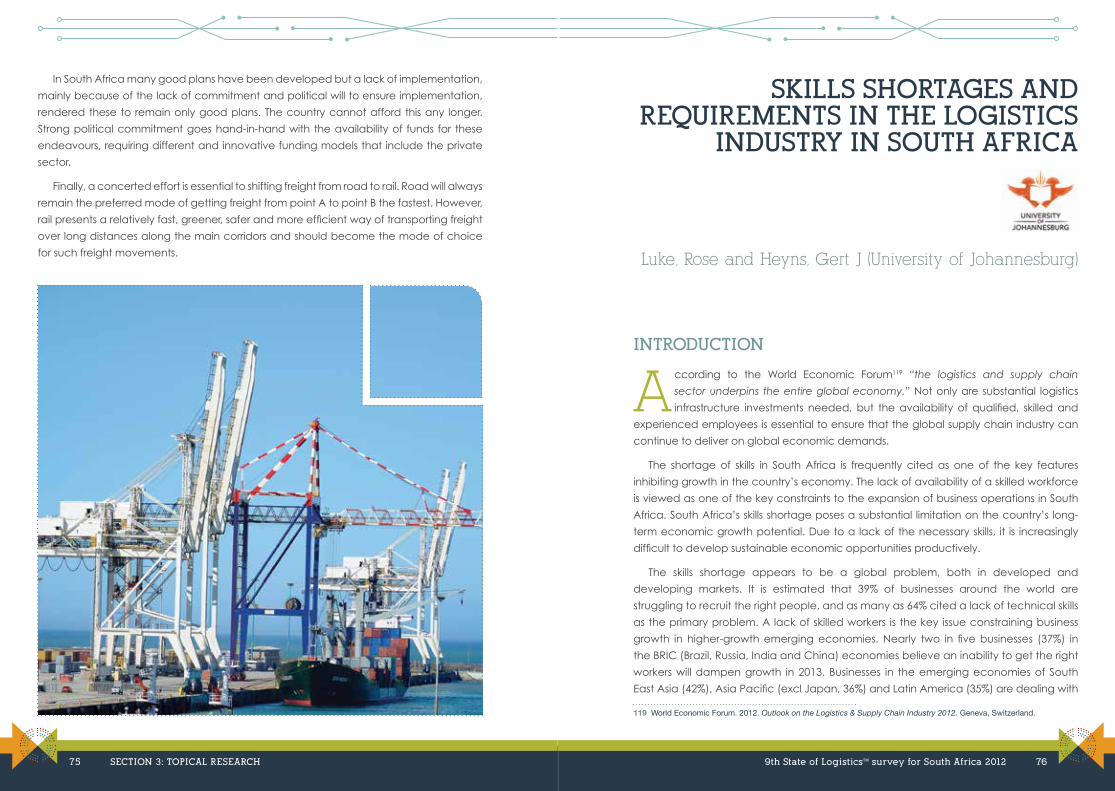
In South Africa many good plans have been developed but a lack of implementation,
mainly because of the lack of commitment and political will to ensure implementation,
rendered these to remain only good plans. The country cannot afford this any longer.
Strong political commitment goes hand-in-hand with the availability of funds for these
endeavours, requiring different and innovative funding models that include the private
sector.
Finally, a concerted effort is essential to shifting freight from road to rail. Road will always
remain the preferred mode of getting freight from point A to point B the fastest. However,
rail presents a relatively fast, greener, safer and more efficient way of transporting freight
over long distances along the main corridors and should become the mode of choice
for such freight movements.
SKILLS SHORTAGES AND REQUIREMENTS IN THE LOGISTICS
INDUSTRY IN SOUTH AFRICA
Luke, Rose and Heyns, Gert J (University of Johannesburg)
INTRODUCTION
According to the World Economic Forum119 “the logistics and supply chain
sector underpins the entire global economy.” Not only are substantial logistics
infrastructure investments needed, but the availability of qualified, skilled and
experienced employees is essential to ensure that the global supply chain industry can
continue to deliver on global economic demands.
The shortage of skills in South Africa is frequently cited as one of the key features
inhibiting growth in the country’s economy. The lack of availability of a skilled workforce
is viewed as one of the key constraints to the expansion of business operations in South
Africa. South Africa’s skills shortage poses a substantial limitation on the country’s long-
term economic growth potential. Due to a lack of the necessary skills, it is increasingly
difficult to develop sustainable economic opportunities productively.
The skills shortage appears to be a global problem, both in developed and
developing markets. It is estimated that 39% of businesses around the world are
struggling to recruit the right people, and as many as 64% cited a lack of technical skills
as the primary problem. A lack of skilled workers is the key issue constraining business
growth in higher-growth emerging economies. Nearly two in five businesses (37%) in
the BRIC (Brazil, Russia, India and China) economies believe an inability to get the right
workers will dampen growth in 2013. Businesses in the emerging economies of South
East Asia (42%), Asia Pacific (excl Japan, 36%) and Latin America (35%) are dealing with
119 World Economic Forum. 2012. Outlook on the Logistics & Supply Chain Industry 2012. Geneva, Switzerland.
75 SECTION 3: TOPICAL RESEARCH 9th State of LogisticsTM survey for South Africa 2012 76
similar talent shortages120. Europe reports that, although high levels of unemployment
are experienced, skills shortages and misalignments are also evident, with certain regions
or sectors lacking employees who fit their needs121. Businesses in Latin America and
Asia Pacific cite a lack of creativity and skilled human resources (62%) as their top two
workforce-related challenges. Similar challenges exist in North America122,123.
Skills shortages vary from country to country but it appears that all countries do not
produce the skills that their economies require. Business environments are becoming
more multifaceted and employers therefore require far more specific skills. As long as
the resulting mismatch between the supply and demand of skills continues to exist,
economies will struggle to achieve the growth and development that they require in
today’s global environment.
As the global talent crunch deepens, many countries will find it difficult to hold
onto their available human resources. Developed countries such as the United States
of America, the United Kingdom and Australia, with known skills shortages in particular
areas, have adjusted their immigration policies to ensure that not only is immigration of
persons with the relevant skills allowed, but encouraged. The implication for developing
countries such as South Africa is that it is increasingly difficult to retain our available skills,
guaranteeing that the well-documented ‘brain drain’ continues unabated.
One of the most problematic factors for doing business in South Africa is a workforce
without the adequate education. A basic requirement for global competitiveness is
primary education, where South Africa is ranked 132nd out of 144 countries. An efficiency
enhancer is higher education and training, where South Africa is ranked as 84th of 144
countries124. In terms of logistics performance, South Africa is currently ranked as number
23 in the world, however the ability to perform more effectively is largely hampered by a
lack of logistics competence125.
This clearly indicates that skills are an issue within the country, and logistics skills in
particular are hampering the country’s ability to trade both within the region as well as
with other countries and regions. “Africa’s share of world trade is tiny–only 3% in 2009,
according to the United Nations Conference on Trade and Development. Intra-African
trade made up only 10% of total African trade. This stands in stark contrast to 22%
120 Grant Thornton Business International Report. 2013. Global economy in 2013: uncertainty weighing on growth.
121 European Commission. 2013. Communication from the Commission: Annual Growth Survey 2013.
122 Global Intelligence Alliance. 2011. North American manufacturers concerned about skills shortage and government over-regulation.
123 Global Intelligence Alliance. 2012. Business Perspectives on Emerging Markets 2012-2017.
124 World Economic Forum. 2012. The Global Competitiveness Report 2012/2013. Insight Report. Geneva, Switzerland.
125 Arvis, JF., Mustra, MA., Ojala, L. Shepherd, B., and Saslavsky, D. 2012. Connecting to Compete: Trade Logistics in the Global Economy: The Logistics Performance Index and Its Indicators. The World Bank. Washington, D.C.
between developing countries in South America, and 50% between those in Asia.”126
It thus becomes critical to identify the logistics skills requirements in South Africa, so that
these acute shortages can be addressed to the benefit of trade in and with South Africa
and the Southern African Development Community (SADC).
The supply chain skills shortage is viewed as one of the top five constraints to South
African supply chains and the single biggest constraint of competitiveness127. Even though
unemployment in South Africa remains high, employers are finding it difficult to find the
right people for vacant positions. The South African economy therefore needs to be able
to identify the relevant skills shortages and apply urgent and relevant interventions to
resolve a situation that has now become a crisis.
RESEARCH OVERVIEW
To ascertain the trends and statistics with regard to the current logistics skills gaps in South
Africa, two surveys were conducted in 2011 and 2012128. Based on similar comparative
studies and further focus group analysis, a set of 38 skills were identified, which were then
clustered into six skills groups, namely General management; Behavioural/Interpersonal
skills; Logistics awareness; Logistics analytical; Logistics information technology (IT); and
Environmental awareness. The respondents were requested to rate the perceived
importance of the selected skills items typically required by managers in logistics and
supply chain organisations.
The majority of the respondents were from the manufacturing and the transport,
storage and communications sector, collectively representing 68.2% and 66.5% for
2011 and 2012, respectively. Just over 78% of the respondents were middle and senior
managers, indicating that the respondents can be viewed as decision-makers within their
respective organisations. The average years of work experience of all respondents in both
surveys were more than 16 years, with the average experience in the area of logistics and
supply chain management being over 10 years. More than 92% of the respondents held
tertiary qualifications.
126 Hasse, K. Non-tariff barriers choke African trade. Good Governance Africa. Available: http://gga.org/analysis/non-tariff-barriers-choke-african-trade
127 Barloworld Logistics. 2013. 2013 supplychainforesight: serial innovation, smart partnerships and sustainable advantages.
128 Surveys were conducted at the Annual SAPICS conference (Association for Operations Management in Southern Africa). The methodology used was convenience sampling.
77 SECTION 3: TOPICAL RESEARCH 9th State of LogisticsTM survey for South Africa 2012 78
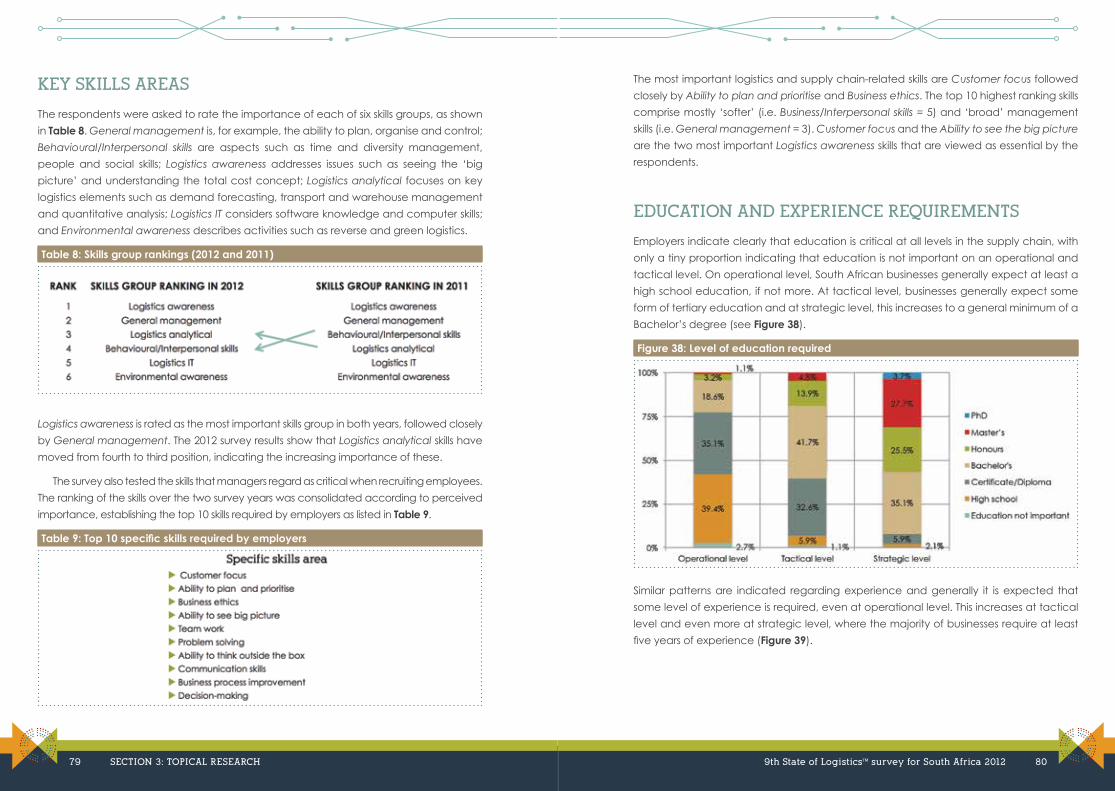
KEY SKILLS AREAS
The respondents were asked to rate the importance of each of six skills groups, as shown
in Table 8. General management is, for example, the ability to plan, organise and control;
Behavioural/Interpersonal skills are aspects such as time and diversity management,
people and social skills; Logistics awareness addresses issues such as seeing the ‘big
picture’ and understanding the total cost concept; Logistics analytical focuses on key
logistics elements such as demand forecasting, transport and warehouse management
and quantitative analysis; Logistics IT considers software knowledge and computer skills;
and Environmental awareness describes activities such as reverse and green logistics.
Table 8: Skills group rankings (2012 and 2011)
Logistics awareness is rated as the most important skills group in both years, followed closely
by General management. The 2012 survey results show that Logistics analytical skills have
moved from fourth to third position, indicating the increasing importance of these.
The survey also tested the skills that managers regard as critical when recruiting employees.
The ranking of the skills over the two survey years was consolidated according to perceived
importance, establishing the top 10 skills required by employers as listed in Table 9.
Table 9: Top 10 specific skills required by employers
The most important logistics and supply chain-related skills are Customer focus followed
closely by Ability to plan and prioritise and Business ethics. The top 10 highest ranking skills
comprise mostly ‘softer’ (i.e. Business/Interpersonal skills = 5) and ‘broad’ management
skills (i.e. General management = 3). Customer focus and the Ability to see the big picture
are the two most important Logistics awareness skills that are viewed as essential by the
respondents.
EDUCATION AND EXPERIENCE REQUIREMENTS
Employers indicate clearly that education is critical at all levels in the supply chain, with
only a tiny proportion indicating that education is not important on an operational and
tactical level. On operational level, South African businesses generally expect at least a
high school education, if not more. At tactical level, businesses generally expect some
form of tertiary education and at strategic level, this increases to a general minimum of a
Bachelor’s degree (see Figure 38).
Figure 38: Level of education required
Similar patterns are indicated regarding experience and generally it is expected that
some level of experience is required, even at operational level. This increases at tactical
level and even more at strategic level, where the majority of businesses require at least
five years of experience (Figure 39).
79 SECTION 3: TOPICAL RESEARCH 9th State of LogisticsTM survey for South Africa 2012 80
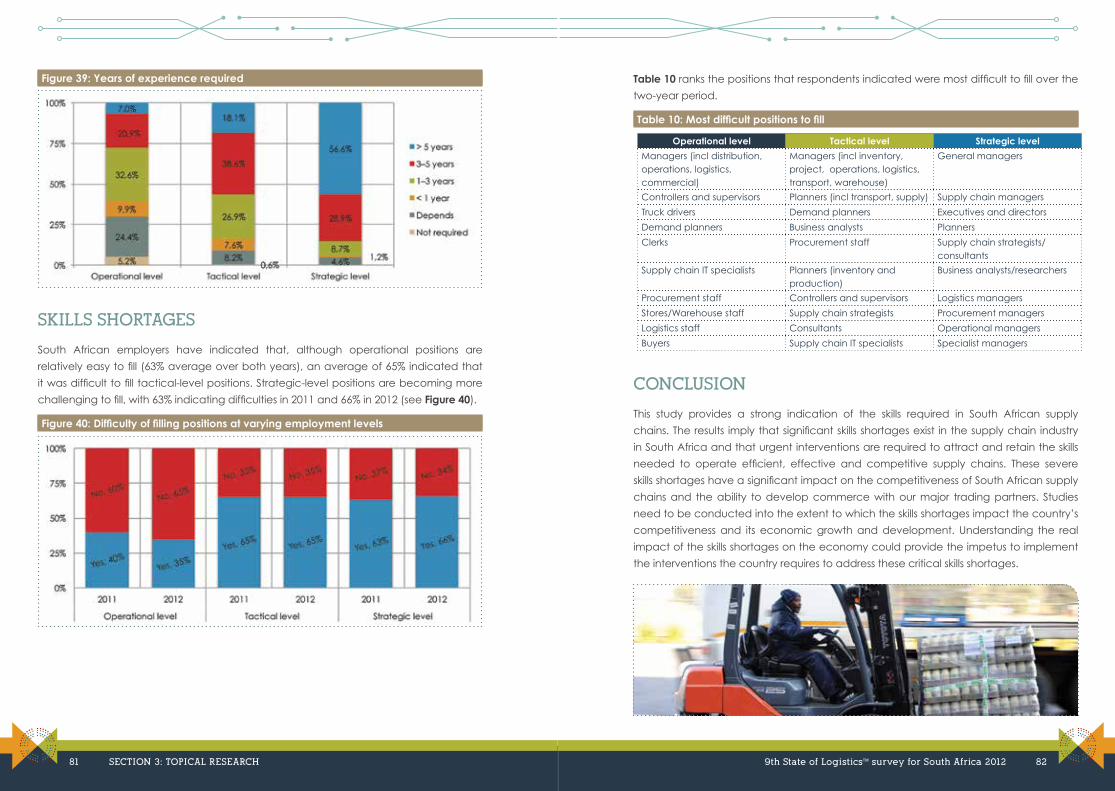
Figure 39: Years of experience required
SKILLS SHORTAGES
South African employers have indicated that, although operational positions are
relatively easy to fill (63% average over both years), an average of 65% indicated that
it was difficult to fill tactical-level positions. Strategic-level positions are becoming more
challenging to fill, with 63% indicating difficulties in 2011 and 66% in 2012 (see Figure 40).
Figure 40: Difficulty of filling positions at varying employment levels
Table 10 ranks the positions that respondents indicated were most difficult to fill over the
two-year period.
Table 10: Most difficult positions to fill
Operational level Tactical level Strategic level
Managers (incl distribution, operations, logistics, commercial)
Managers (incl inventory, project, operations, logistics, transport, warehouse)
General managers
Controllers and supervisors Planners (incl transport, supply) Supply chain managers
Truck drivers Demand planners Executives and directors
Demand planners Business analysts Planners
Clerks Procurement staff Supply chain strategists/consultants
Supply chain IT specialists Planners (inventory and production)
Business analysts/researchers
Procurement staff Controllers and supervisors Logistics managers
Stores/Warehouse staff Supply chain strategists Procurement managers
Logistics staff Consultants Operational managers
Buyers Supply chain IT specialists Specialist managers
CONCLUSION
This study provides a strong indication of the skills required in South African supply
chains. The results imply that significant skills shortages exist in the supply chain industry
in South Africa and that urgent interventions are required to attract and retain the skills
needed to operate efficient, effective and competitive supply chains. These severe
skills shortages have a significant impact on the competitiveness of South African supply
chains and the ability to develop commerce with our major trading partners. Studies
need to be conducted into the extent to which the skills shortages impact the country’s
competitiveness and its economic growth and development. Understanding the real
impact of the skills shortages on the economy could provide the impetus to implement
the interventions the country requires to address these critical skills shortages.
81 SECTION 3: TOPICAL RESEARCH 9th State of LogisticsTM survey for South Africa 2012 82
Profile of IMPERIAL Logistics
Driving client competitiveness
With extensive operations throughout Europe and Africa, IMPERIAL Logistics is
uniquely placed to partner companies in leveraging the value inherent in their
supply chains. By positioning ourselves as an extension of our clients’ business
- building our clients’ brands alongside our own – we are co-collaborators in unlocking
the competitive advantage contained in complex and dynamic logistics environments.
Our own differentiators lie in a combination of an extensive resource base of
transportation, warehousing and distribution operations and best-of-breed integrative
process and technology solutions. We apply our pre-eminent supply chain management
skills to manage operational processes across end-to-end value chains on behalf of our
clients. As a multi-branded business, we are in a position to optimise the benefits, scale
and synergies that are derived from large businesses, while retaining agility, customer
focus and an entrepreneurial flair that characterises smaller businesses. We recognise
that our clients’ requirements are unique and customise our service offerings accordingly,
whilst leveraging our experience to benefit each client.
In turbulent economic times – and in the face of growing complexity and risk – leading
companies need sustainable, resilient supply chains that support profitability and drive
industry leadership. By anticipating these dynamics rather than simply reacting to them,
IMPERIAL Logistics enables our clients’ businesses to grow in an efficient, proactive and
cost-effective manner. Ultimately, our reason for being is to contribute towards our clients’
revenue, their bottom-line and their return on investments.
For further information, please visit
www.imperiallogistics.co.za
Profile of Stellenbosch University: Centre for Supply Chain
Management
The Centre for Supply Chain Management (CSCM) is an academic, consultative
research centre within the Department of Logistics at Stellenbosch University. It
creates value for global and local organisations and businesses.
The Centre facilitates a symbiotic relationship between the academic development
of supply chain management theory and the practical application of the theory. It
provides clients and the community with cost-effective research solutions in the field,
while at the same time producing results that are publishable and contribute to the
discipline. The CSCM team (core staff and a complement of associates) has provided
successful consulting interventions to a number of leading South African and multinational
companies and provides continuous strategic guidance to various small and medium-
sized clients.
The core competencies provided are in the field of supply chain strategy, business
strategy and positioning, market and economic research, freight flow modelling and
transportation planning.
For more information
on our services, contact:
Dr Jan Havenga
Director
Centre for Supply Chain Management
Department of Logistics
Stellenbosch University
Tel: 021 808 3981
Email: [email protected]
83 84
Profile of the Council for Scientific and Industrial Research (CSIR)
Through directed research, development and innovation, the CSIR improves the
competitiveness of industry and the quality of life of the people of the country. South
Africa’s CSIR was established in 1945 as a science council by an Act of Parliament.
It has a proud track record of multidisciplinary research and a bright and challenging
future through science, engineering and technology (SET), undertaken by its innovative
individuals and teams.
Specific areas of focus for the CSIR are the built environment, health, energy, the natural
environment, defence and security, information and communications technology as
well as the needs of industry. These areas are underpinned by key enabling technologies
such as photonics, robotics, materials sciences, optronics and biotechnology, as well as
leading scientific infrastructure.
The CSIR’s main campus is in Pretoria while the organisation has regional offices in
proximity to applicable industries in other provinces of South Africa. The CSIR generates
knowledge and research outputs to be applied or transferred as proven technologies
through skilled people and projects that add commercial and social benefit. The CSIR
has a staff complement of about 2 400, of which close to two-thirds make up the science,
engineering and technology (SET) expertise base.
CSIR Built Environment
As an operating unit of the CSIR, CSIR Built Environment creates innovative, cost-effective,
sustainable solutions for uniquely South African and other global built environments. The
unit’s SET base is at the core of its multidisciplinary capabilities to deliver sustainable
infrastructure development, asset preservation, socio-economic growth and global
competitiveness in and for the built environment.
Environmentally sustainable and efficiently operated socio-economic infrastructure is
critically important for the development and well-being of our country. The fundamental
need for social development can be addressed only when people have access to
basic amenities such as electricity, water and sanitation, as well as housing, schools and
hospitals.
The impact of our track record resonates in energy-efficient buildings and sustainable
human settlements, where the quality of life continues to improve. Social facilities,
municipal infrastructure, transport and logistics networks, as well as coastal and port
developments are benefitting from more effective systems and greater efficiency in
service delivery.
Core focus
Within its mandate, the core focus of CSIR Built Environment is to:
� support the maintenance, upgrading and management of the country’s transport,
water and sanitation infrastructure and coastal and port developments
� support service delivery in the built environment
� assist city regions to plan and implement policy within the built environment
� create well-functioning, sustainable settlements and safer communities.
Competences at a glance
CSIR Built Environment is structured into six competence areas to deliver sustainable
infrastructure development, asset preservation, socio-economic growth and global
competitiveness in and for South Africa’s built environment. The areas and their research
capabilities are:
Transport Systems and Operations
� Logistics system analysis and supply chain engineering
� Transport economics
� Transport infrastructure management systems
� Public transport systems design
Transport Infrastructure Engineering
� Road engineering and materials
� Infrastructure engineering
Hydraulic Infrastructure Engineering
� Coastal engineering and ports
� Water supply and wastewater treatment infrastructure
85 86
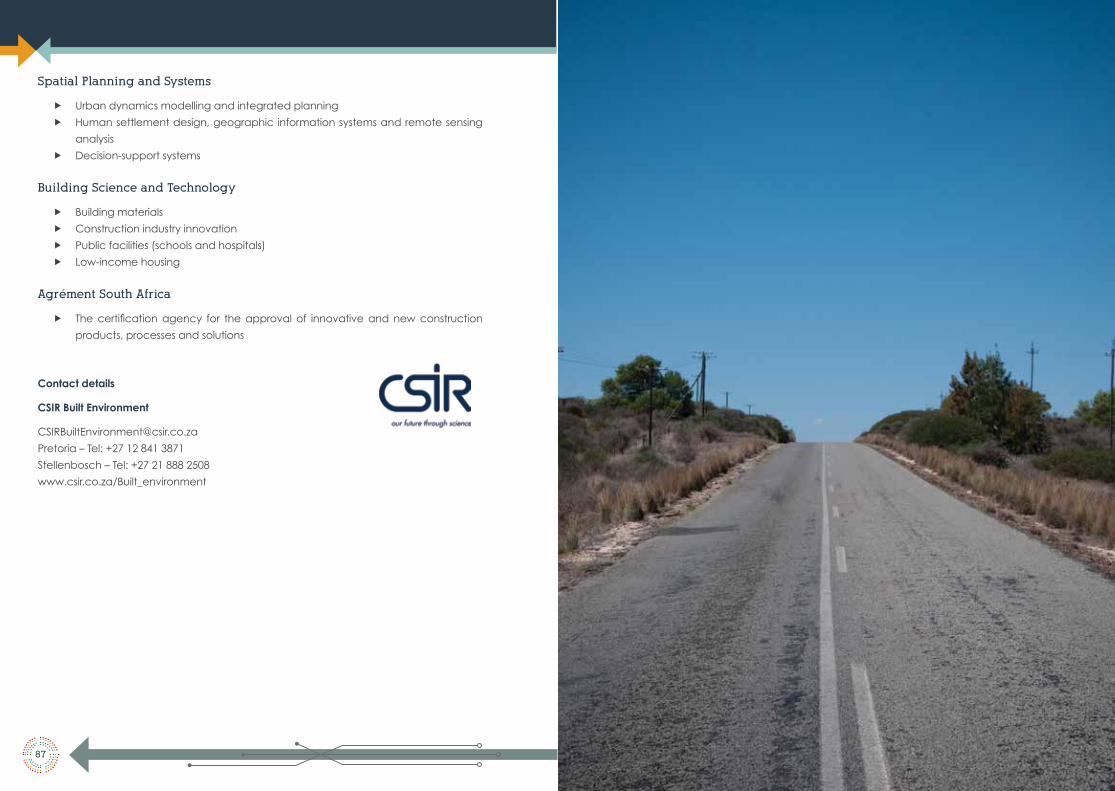
Spatial Planning and Systems
� Urban dynamics modelling and integrated planning
� Human settlement design, geographic information systems and remote sensing
analysis
� Decision-support systems
Building Science and Technology
� Building materials
� Construction industry innovation
� Public facilities (schools and hospitals)
� Low-income housing
Agrément South Africa
� The certification agency for the approval of innovative and new construction
products, processes and solutions
Contact details
CSIR Built Environment
Pretoria – Tel: +27 12 841 3871
Stellenbosch – Tel: +27 21 888 2508
www.csir.co.za/Built_environment
87

NotesNotes
89 90
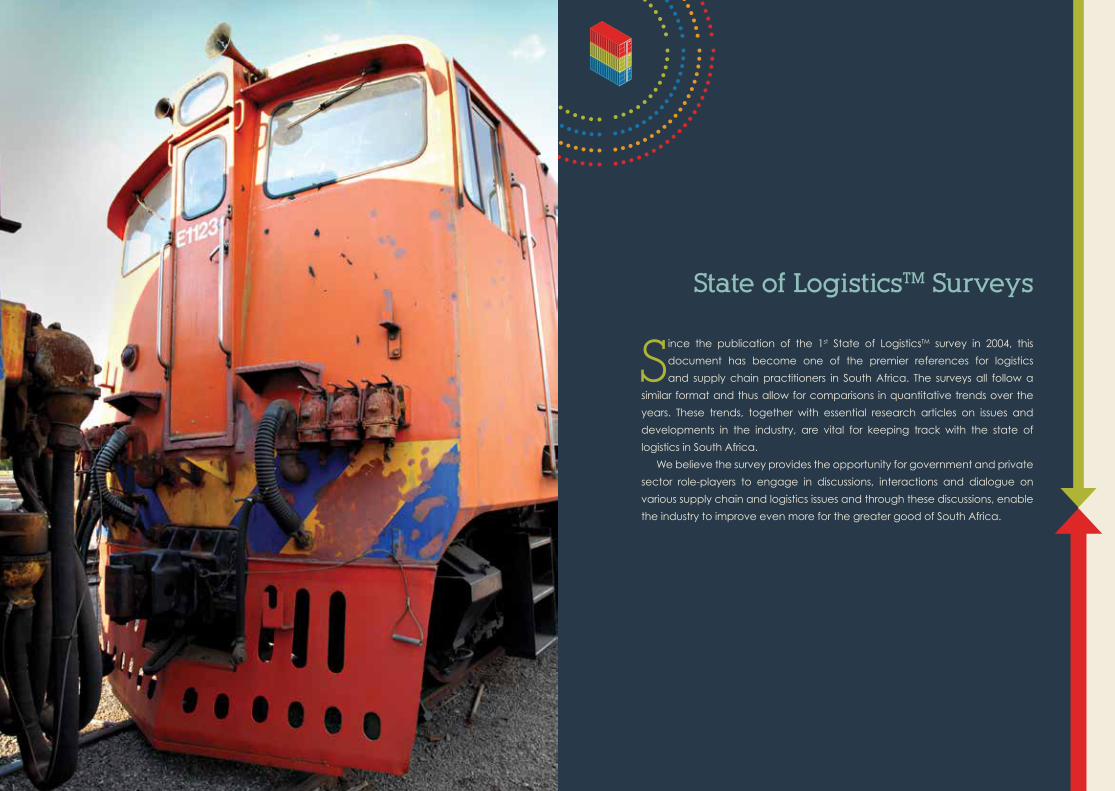
State of LogisticsTM Surveys
Since the publication of the 1st State of LogisticsTM survey in 2004, this
document has become one of the premier references for logistics
and supply chain practitioners in South Africa. The surveys all follow a
similar format and thus allow for comparisons in quantitative trends over the
years. These trends, together with essential research articles on issues and
developments in the industry, are vital for keeping track with the state of
logistics in South Africa.
We believe the survey provides the opportunity for government and private
sector role-players to engage in discussions, interactions and dialogue on
various supply chain and logistics issues and through these discussions, enable
the industry to improve even more for the greater good of South Africa.