Embed Size (px)
Citation preview

San Jose State University
From the SelectedWorks of Vimal Viswanathan
June, 2013
Connecting Design Problem Characteristics toPrototyping Choices to Form a PrototypingStrategy.Bradley A. Camburn, University of Texas, AustinBrock U. Dunlap, University of Texas, AustinVimal Viswanathan, Georgia Institute of TechnologyJulie S. Linsey, Georgia Institute of TechnologyDaniel D. Jensen, U.S. Air Force Academy, et al.
Available at: https://works.bepress.com/vimal-viswanathan/26/

Paper ID #6479
Connecting Design Problem Characteristics to Prototyping Choices to Forma Prototyping Strategy
Mr. Bradley Adam Camburn, University of Texas, Austin
PhD University of Texas at Austin, 2014 Expected M.S. University of Texas at Austin, 2010 B.S.M.ECarnegie Mellon University, 2008
Brock U Dunlap, University of Texas, AustinDr. Vimal Kumar Viswanathan, Georgia Institute of Technology
Dr. Vimal Viswanathan is a post-doctoral research associate at Georgia Institute of Technology, Atlanta,GA. He completed his PhD in Mechanical Engineering from Texas A&M University in 2012. His researchinterests are engineering design innovation, creativity and engineering education.
Dr. Julie S Linsey, Georgia Institute of TechnologyDr. Daniel D. Jensen, U.S. Air Force Academy
Dr. Dan Jensen is a Professor of Engineering Mechanics at the U.S. Air Force Academy where he hasbeen since 1997. He received his B.S. (Mechanical Engineering), M.S. (Applied Mechanics) and Ph.D.(Aerospace Engineering Science) from the University of Colorado at Boulder. He has worked for TexasInstruments, Lockheed Martin, NASA, University of the Pacific, Lawrence Berkeley National Lab andMSC Software Corp. His research includes design of Micro Air Vehicles, development of innovativedesign methodologies and enhancement of engineering education. Dr Jensen has authored approximately100 papers and has been awarded over $3 million of research grants.
Dr. Richard H. Crawford, University of Texas, Austin
Dr. Richard H. Crawford is a Professor of Mechanical Engineering at The University of Texas at Austinand is the Temple Foundation Endowed Faculty Fellow No. 3. He is also Director of the Design Projectsprogram in Mechanical Engineering. He received his BSME from Louisiana State University in 1982, andhis MSME in 1985 and Ph.D. in 1989, both from Purdue University. He teaches mechanical engineeringdesign and geometry modeling for design. Dr. Crawford’s research interests span topics in computer-aided mechanical design and design theory and methodology. Dr. Crawford is co-founder of the DTEAChprogram, a ”Design Technology” program for K-12, and is active on the faculty of the UTeachEngineeringprogram that seeks to educate teachers of high school engineering.
Prof. Kevin Otto, Singapore University of Technology and Design
Kevin Otto is an Associate Professor in the Engineering Product Design Pillar at the Singapore Universityof Technology and Design. He studies robust design of dynamic systems, verification and validation, andsystem modularity.
Prof. Kristin L. Wood, Singapore University of Technology and Design (SUTD)
Dr. Kristin L. Wood is currently a Professor, Head of Pillar, and co-Director of the International De-sign Center (IDC) at Singapore University of Technology and Design (SUTD). Dr. Wood completed hisM.S. and Ph.D. degrees in Mechanical Engineering (Division of Engineering and Applied Science) at theCalifornia Institute of Technology, where he was an AT&T Bell Laboratories Ph.D. Scholar. Dr. Woodwas formerly a Professor of Mechanical engineering at the University of Texas (1989-2011), where heestablished a computational and experimental laboratory for research in engineering design and manufac-turing. He was a National Science Foundation Young Investigator, the Cullen Trust for Higher EducationEndowed Professor in Engineering and University Distinguished Teaching Professor at The University ofTexas at Austin.
c©American Society for Engineering Education, 2013
Page 23.330.1

Using Design Problem Characteristics to Build a Prototyping Strategy
1. Introduction
Over the course of the last three decades, numerous methodologies have been created to enhance the design process with experimentation, particularly methodologies for concept generation[4,7,9,15] and manufacturing15. Particularly in the engineering educational context, such design experimentation is done with prototypes. There are several different types of prototypes: e.g. marketability prototypes, functionality (or engineering) prototypes, manufacturing prototypes, etc.[15]. However, there are relatively few structured approaches to organizing, sequencing, and bounding such experimental prototyping. Given that prototyping is pervasive to the design process through ideation, concept selection and design verification, it stands to reason that prototyping is a process worthy of scholarly attention. This research explores methodologies to enhance prototyping during concept development, particularly engineering prototypes, i.e. those used to verify or improve the functionality, performance and operation of a novel device or system. Based on design context variables such as the total allotted time for the prototyping effort, the methodologies introduced in this paper will provide practical planning for student prototyping efforts, including determination of how many parallel prototypes of which concepts are most effective, considering the sequential revision iterations on each such prototype. Current estimates are that only 60% of new products succeed[1,16]. As stated above, when compared to concept generation, testing, and manufacturing (all of which have experienced recent significant process enhancements[4,7,9,15] it becomes clear that prototyping process improvements can result with research and exploration. Exemplar problems a designer will encounter when prototyping are design process logistical concerns regarding: the number of prototypes which should be constructed, the nature of these prototypes in terms of material, fidelity and functionality, and the forms of testing which should be applied to the prototype.
These concerns are currently resolved either intuitionally by the designer without using a specific methodology or by project managers based either primarily on cost and schedule or on historical precedent (“that’s the way we’ve always done it”). Hence, a formalized and structured approach to prototyping is needed. It should have the goal of enhancing the efficiency and effectiveness of the prototyping process. Such a structured methodology could identify analytic and concrete, rather than intuited, strategies for distribution of time and resources as well as prescribe detailed methods regarding the formalities of constructing the prototypes themselves. Prototyping strategy methods are explored as a solution approach for increasing the breadth of scope of innovation processes. A prototyping strategy is defined here as: the set of choices that dictate what actions will be taken to accomplish the development of the prototype(s)[16]. It is a plan for parallel and sequential development of various prototypes. A prototyping strategy will include determination of the number of prototypes: developed in parallel (multiple concepts) and in serial (single concept). Further, the prototyping strategy will include consideration of efficiency characteristics of the instantiation including whether the device will be scaled (smaller cheaper prototype with scaling effect uncertainty), functionally relaxed, or functionally isolated (incomplete prototype with system level integration uncertainty). In short, a prototyping strategy method is a repeatable tool for translating between design context characteristics, such as
Page 23.330.2

available budget or the uncertainty in modeling accuracy, and the choices made during prototyping.
2. Background and literature review
Although the evidence suggests that prototyping is one of the most important aspects of new product development[6], there apparently little research work that translates presents clear strategy frameworks. In Otto and Wood’s text[15], prototyping is addressed in multiple chapters that cover various analytical modelling techniques, physical prototype development processes and suggestions, and proper testing strategies to ensure that physical models meet requirements. The authors recognize that while non-physical modelling is certainly important, designers must eventually move into the development and testing of physical prototypes[16]. There have been interesting reviews of the effects of prototyping on designers during the process[20-34,40]. Franck and Rosen[20] showed that, from cognition view point, ‘low fidelity’ prototypes encourage design teams in three distinct ways: (1) Failure is reframed as an opportunity for learning; (2) A sense of forward progress is fostered; and (3) Beliefs about creative ability are strengthened. Linsey et al.[23] examine the impact of design fixation in virtual versus virtual and physical environments to show that performance is significantly enhanced when physical construction and testing of a prototype is permitted[23]. These results were verified for both novices/non-designers and experienced designers. Yang and Epstein[39] show that prototyping early in the design process is correlated with better design performance. Additionally, Schunn[40] experimentally determined that successful design teams used prototypes more often throughout the design process to represent concepts and to communicate ideas[40]. Restriction against prototyping leads to fixation on initial concepts, regardless of technical faults that may exist in the concept[20].
In regards to the logistics of developing successful prototypes, Ulrich and Eppinger[17] present benefits of physical versus virtual prototypes, and focus on strategic approaches to prototyping. They consider general aspects to describe the prototyping process, such as the observation that a prototype may fall anywhere in a two axis field between fully physical and fully virtual design. They further stipulate that the design concept that is most cost effective should be pursued. A traditional approach to prototyping is to base the prototype selection on cost of parts. Ruffo et al. examine a make or buy approach based on resource scenarios[19]. Thomke, Schrage, and Drezner, suggest minimal, though useful, strategies such as “pursue parallel development of prototypes” or ‘iterate prototypes, instead of initially including all features”[8-10,14]. In addition, design prototyping teams should be composed of highly skilled individuals, and permitted to be self-directed. Resource management and expertise should likewise be synthesized when developing a successful prototyping effort[12,13].
Dahan[11] investigates a more analytical approach to the prototyping process based on an assumption of optimizing profit of the solution. He investigates the trade-offs of parallel concept testing based on the roles of profit distribution (uncertainty), cost of testing and total budget. Christie, et al. have explored the set of strategy choices that should be considered in the development of a prototyping strategy through literature and case study review[38], Table 1.
Page 23.330.3

Table 1. Choices in a Prototyping Strategy[38]. 1. Prototypes can be of a single subsystem, of a set of subsystems, or of the entire system 2. Prototyping multiple concepts in parallel vs. prototyping only a single concept 3. Iterative prototypes vs. only 1 prototype per concept 4. Prototypes can be virtual (analytical, CAD, FEA, CFD etc.) or physical 5. Prototype manufacturing can be outsourced, rapid prototyped or completed in-house 6. Prototypes can be physically scaled 7. Prototypes can be functionally scaled 8. Prototypes can use similar or different materials than the final design 9. Prototypes can use similar or different manufacturing and assembly techniques than the final design 10. Prototypes can be analytical 11. Prototypes can be a computer simulation 12. Prototypes can be made rapidly 13. Prototyping production can be outsourced 14. Prototyping budget can be allocated in different proportions to each iteration 15. Human resources for each prototype can be allocated in different proportions 16. The prototype may or may not meet the final design requirements 17. The prototype may or may not address interfacing
Viswanathan and Linsey developed a second set of heuristics that outline observed best practices[34]. Their study is based on observation and coding of the uses of physical prototypes. They are shown in Table 2. Overall, we find these prototyping strategy heuristics possibly beneficial, however, their effectiveness, as a forward-design tool, must be experimentally evaluated.
Table 2. Prototyping Strategy Heuristics from Viswanathan and Linsey[34]. 1 Support building with analytical calculations - use basic strength equations for calculations 2 Design the connections (interfaces of parts) before commencing construction 3 Plan the building process – in terms of time and budget 4 Combine superior features from multiple solutions (before/after building or both) 5 While scaling the model, scale loads accordingly 6 Be aware of unexpected phenomena during building 7 Wherever possible, use commonly available parts (available in the immediate environment) 8 Wherever possible, avoid complicated machining 9 Wherever possible, select materials that can be easily machined 10 If standardized parts are available, use them instead of building new ones 11 When using parts of standardized (fixed) length (e.g. LEGOs), make sure other parts will connect properly 12 Use simple measurements (e.g.: visual) if complicated measurement techniques are not necessary
3. Development of Prototyping Strategy Method This section will provide an overview of the approach taken to develop the strategy method used in this paper. One of the first steps in the process was to compose a list of all strategy choices encountered in the relevant literature. Table 3 shows a hierarchical synthesized list of variables for a generic prototyping strategy. This hierarchy provides a framework for managing the complexity, causality, and dynamic-nature of the prototyping strategy variables. These strategy choices are phrased using inclusive terminology to expand their applicability. Concepts from the literature are transformed from specifics such as ‘avoid complicated machining’ to general concepts like choose ‘ad-hoc or precise manufacture’. P
age 23.330.4

For the purpose of this study, we have chosen a set of five critical heuristics (or strategy choices which are dependent on the input variables), highlighted in Table 3.
Table 3: Hierarchical list of strategy choices for a broad prototyping strategy.
Scale Scaled or actual boundary conditions/parameters Scaled or actual-scale function Scaled or actual geometry (shape, dimensions, etc.)
Integration Physical integration or segmentation/subsystem isolation Functional integration or segmentation
Logistics Allocations Rigid or flexible scheduling
Rigid or flexible budgeting
Make Number of design concepts (in parallel) Number of iterations of each concept
Embodiment
COTS (Commercial Off-the-Shelf) or custom parts Material Actual or easily available materials to manufacture Method Ad-hoc or precise (formal or systematic) Virtual or physical Outsourced or in-house
Evaluation
Relaxed or stringent parametric design requirements Exploration or verification
Testing
Dynamic or static Standard or extreme run conditions Multiple test conditions or single condition Continuous or discrete variation of parameters
These five strategy choices are chosen as an initial foundation for developing the prototyping strategy methodology. They are chosen because it is likely that these are among the first choices made in a prototyping effort. Through examination and extension of the strategies proposed in the literature we propose six independent design context variables which are the quantitative inputs to our strategy method, See Table 4 for list and definitions:
Page 23.330.5

Table 4: Definitions of the independent design context variables
Variable Definition Example
Budget ($A) This is the allocation, in dollars, for developing prototypes for the project. $200
Time (TA) This is the total amount of time allocated to prototyping, in person hours.
210 hours (7 weeks, 6 teammates, 5 hours per week each)
Difficulty of Requirements (D)
This variable is assigned a value for the difficulty of meeting the requirements by taking into consideration: team experience, complexity etc.
8/10 (difficult): multi-objective UAV design
3/10 (simple): gear box design
Rigidity of Requirements (Req)
This variable is a measure of the rigidity of the design requirements on a linear scale, or the stringency of the design requirements in terms of precision, quantity etc. If it is necessary that the device function within very narrow parameters, then the Req value is high.
7/10 (very rigid): a formula SAE racer
2/10 (flexible): design a human to computer interface
Interactivity (Int)
This variable is the interactivity between subsystems in the system. A high value indicates that the system cannot demonstrate function without integrating all of the subsystems.
9/10 (very integrated): a four bar linkage
3/10 (segmented): Swiss army knife
Designer’s Experience (Ex)
This is the variable to represent the designer’s familiarity with designing systems like the present one.
9/10 (very experienced): 20 similar projects
1/10 (no experience): 0 similar projects
An important consideration in prototyping is the management of uncertainty, where the concept of iteration provides a means of mitigating inherent uncertainty during product development. Our uncertainty metric is the inverse of the designer’s certainty that an initial attempt to prototype the concept will succeed (meeting design requirements within cost and schedule constraints). When uncertainty is high, one should pursue multiple iterations, as it will likely take significant iteration until success is met. When uncertainty is low, or certainty is high, one should pursue more concepts in parallel as pressure to meet requirements is lower, and the designer has greater freedom to explore the design space. An equation for uncertainty may thus be expressed as[36]:
𝑈 = !!"!!
!!!
(1)
Where 𝐸! is the designer’s experience, 𝑅!" is the rigidity of the design requirements, and D is the anticipated difficulty in meeting the design requirements (with a particular design concept). Each of these variables is a dimensionless parameter on a scale of 1-10:
Equation (1) is motivated by a derivation of the certainty factor applied by Dahan and Mendelson[35] who originally derived the theory of the optimal number of alternative concept prototype tests based on maximizing profit. Our approach differs in two respects. First, Dahan
Page 23.330.6

and Mendelson consider evaluation of alternative prototypes on revenue potential. For a prototyping strategy applied across the product development process, revenue may be very difficult to estimate, especially in the early phases of design. Secondly, we consider practical heuristics to replace more difficult-to-measure variables in the initial analysis. For summary of the philosophical underpinnings of the formulation may be expressed as below: Each prototype instance (iteration) of a particular design of all concepts in the design space will have an uncertain performance. This uncertainty can be assigned a probability distribution. There is a marginal performance gain by expending additional time on the prototyping process. Therefore, if a target performance is desired and expected benefit (as a function of performance) is required, the optimal number of prototypes is a function of the marginal gain in performance of each iteration of a prototype, the uncertainty of performance in each instantiation, and the total time to develop each prototype. Since these values are impractical to calculate, more practical heuristic approximations of these values are taken. The uncertainty in performance is approximated through self-estimates of the designer’s experience. This approximation is developed based on the assumption that a more experienced designer will have a lower uncertainty in predicting the actual performance which will be achieved by a prototype instance. The time to develop a prototype is estimated by the rigidity of requirements and the difficulty of the design, as a more rigid design problem requires more time to achieve target performance, and correspondingly a design approach that is more difficult will also require more time to achieve target performance. The design problem (𝑅!") and design concept (D) time variables are taken as a linear sum and normalized. We argue that this approach makes intuitive sense. When uncertainty is high, concentrate on building one system as it may take many iterations to achieve target performance. If uncertainty is very low, explore a broader view of the design space. In other words, increase the probability of finding an excellent design by exploring many different design concepts. The approach for the second case should not over-extend budget as fewer iterations of each concept will be required to reach target performance. In summary, the dependent prototyping strategy choices are extracted from the extant literature on prototyping. Their relation to the external variables, such as budget, which are considered the independent variables, was determined through analysis and further literature review. The determination follows need, i.e. the designer’s experience must be estimated to predict the likelihood of constructing a successful design. The method is developed by considering several assumptions: (1) an effective and efficient initial prototyping strategy seeks to exhaust allocated resources, regardless of anticipated ease in meeting design requirements; (2) an effective and efficient prototyping strategy is one that seeks to maximizes profit or design performance; (3) the more iterations of a single concept, the more likely one of them will be successful at meeting the design requirements, and (4) the more concepts developed in parallel, the greater likelihood of determining the best concept. These assumptions are based on systematic review of the prototyping literature, and the extension of the appropriated theories of prototyping into practical application.
4. Prototyping Strategy Method
A prototyping strategy method provides a means of translating between design context variables and design strategy choices.
Page 23.330.7

There are six primary stages to applying the method:
1. Determine each of the independent design variables from Table 4, for the specific design problem.
2. Order concepts, this can be based on methods like the Pugh chart[15] or other relevant methods. Note that as the strategy develops, the order may change based on the uncertainty, number of iterations, or cost of prototyping.
3. Evaluate the uncertainty of each design concept using Equation (1). 4. Estimate the number of iterations required to achieve target performance, given the
uncertainty; i.e. a novice engineer designing a complex micro aerial vehicle with an uncertainty, U, value of 5 will probably need about 6 iterations to complete the design, while an experienced engineer designing a bottle opener with an uncertainty, U, value of 0.2 will probably need 1 iteration only.
5. Determine whether each iteration of each concept should include scaling, subsystem isolation, and requirement relaxation. Usage of the flowcharts is explained later in the section.
6. Estimate the cost, in terms of person hours and also dollars to complete each iteration of each concept, then determine which concepts to construct in parallel. The principles to this step are: (a) that the highest ranked concepts should be considered first, (b) as many concepts should be included as possible, (c) but a concept should not be pursued if the estimated cost of pursuing that concept exceeds available budget (i.e. the cost of all iterations).
A generalized view of this process can be seen in Figure 1.
Record strategy choices
Select concepts to build Estimate the cost of each
iteration (time and $)
Determine S. I. R.
Order Concepts
Evaluate Uncertainties
Estimate the number of Iterations of Each Concept
Page 23.330.8

Figure 1. Brief outline of the stages of the strategy method (S.I.R. stands for scaling, subsystem isolation and requirement relaxation)
Figure 2. An example of how to record a finalized prototyping strategy from the method (note
that concepts are evaluated after each iteration)
To complete step (4) a series of flowcharts is examined. The strategy flowcharts map between the independent design context variables and the choices of whether or not to scale the design, isolate some of the subsystems, or relax the parameters of the design requirements when prototyping. They represent one of the original contributions of this work. However, they are firmly grounded in the prototyping theories identified in previous research. These flowcharts are also based on application of assumptions 1-4, as stated in Section 3. Additionally, these flowcharts take into account the results from Viswanathan and Linsey[34], Christie, et al.[38] and Moe, et al.[16] for optimizing the prototyping process. These flowcharts can be applied to each concept. There are three independent flowcharts. The scaling flowchart encourages scaling only if it will simplify the problem, a scaling law is known or can be estimated, and sufficient accuracy exists to predict the design requirements. This approach works well when there is an uncertainty in the extrapolation that can be predicted[37]. If there is a higher uncertainty in the scaling extrapolation, then the directive is to not use scaled prototypes, or to scale them only to a reduced extent.
The second flowchart, subsystem isolation/integration, examines whether the designer should isolate a subsystem of the design, that is, build and analyze one particular subsystem or set of
Iteration I Iteration IIIIteration II
CONCEPT A
ISOLATE subsystemSCALE the designRELAX requirements
CONCEPT A
INTEGRATE systemsSCALE the designRELAX requirements
CONCEPT A
INTEGRATE systemsSCALE the designuse EXACT requirements
CONCEPT B
INTEGRATE subsystemsSCALE the designuse EXACT requirements
CONCEPT C
ISOLATE subsystemSCALE the designRELAX requirements
CONCEPT C
ISOLATE systemsDO NOT SCALE RELAX requirements
Page 23.330.9
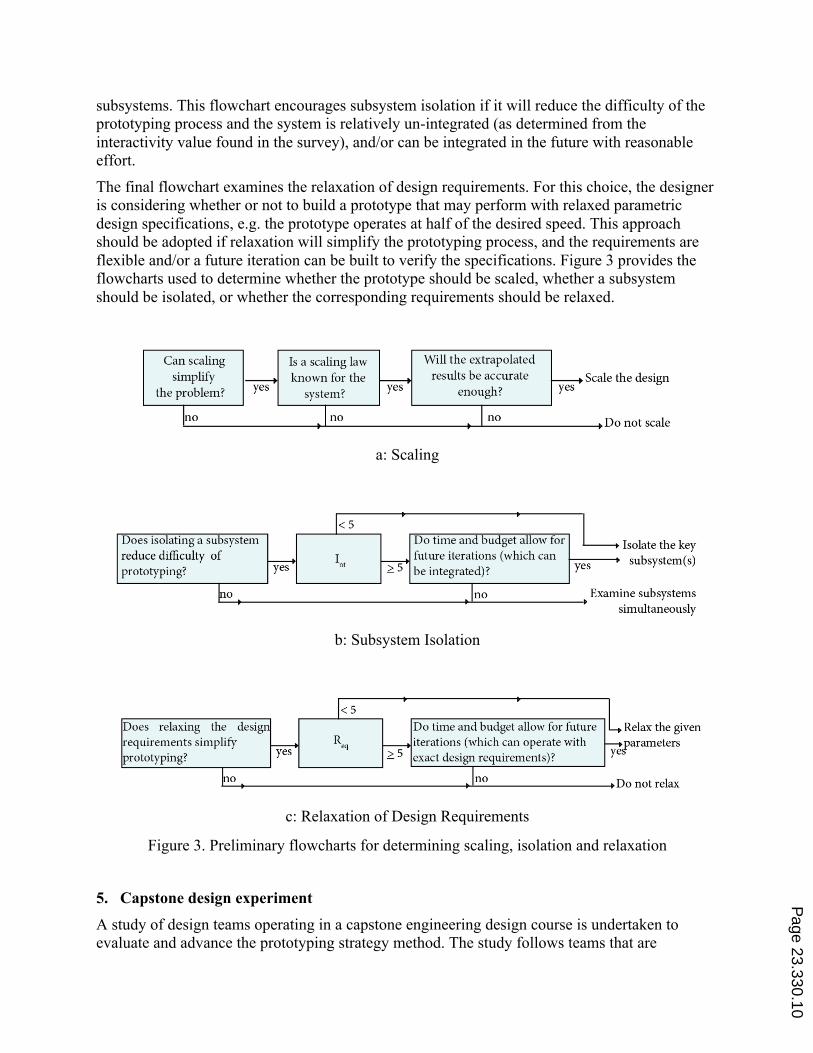
subsystems. This flowchart encourages subsystem isolation if it will reduce the difficulty of the prototyping process and the system is relatively un-integrated (as determined from the interactivity value found in the survey), and/or can be integrated in the future with reasonable effort.
The final flowchart examines the relaxation of design requirements. For this choice, the designer is considering whether or not to build a prototype that may perform with relaxed parametric design specifications, e.g. the prototype operates at half of the desired speed. This approach should be adopted if relaxation will simplify the prototyping process, and the requirements are flexible and/or a future iteration can be built to verify the specifications. Figure 3 provides the flowcharts used to determine whether the prototype should be scaled, whether a subsystem should be isolated, or whether the corresponding requirements should be relaxed.
a: Scaling
b: Subsystem Isolation
c: Relaxation of Design Requirements
Figure 3. Preliminary flowcharts for determining scaling, isolation and relaxation
5. Capstone design experiment
A study of design teams operating in a capstone engineering design course is undertaken to evaluate and advance the prototyping strategy method. The study follows teams that are
Page 23.330.10

exploring a broad range of design problems and have been provided with the method. This study investigates the quantitative influence of the method on prototyping strategy, and a qualitative assessment of its value. In the experiment, the prototyping strategy method was deployed to senior engineering design teams at the University of Texas at Austin, Texas A&M University, and the United States Air Force Academy. This experiment seeks to answer three questions:
1) Does exposure to the method cause a designer or design team to change their prototyping plan?
2) Do participants react positively to the method and do they apply the method? 3) Is there a positive correlation between adhering to the method and effectiveness of the
prototyping strategy taken?
5.1. Metrics There are several relevant metrics for the prototyping strategy experiment, in correspondence with the research questions:
1) The change between the pre- and post- method strategies that participants describe. 2) Assessment of the method:
a) How closely the participant followed the method (Likert scale of 1-10) b) How valuable the participant found the method to be (Likert scale of 1-10)
3) The value of the method in guiding the team towards a successful prototyping effort: a) Over-all effectiveness of the executed prototyping strategy (Likert scale response) b) Effectiveness of effort in terms of staying within budget (yes or no responses) c) Effectiveness of effort in terms of having sufficient build time (yes or no responses)
5.2. Experimental setup Three surveys are deployed for this method. These surveys examine the implementation of the strategy method as it was introduced at several universities in their respective capstone senior design courses in mechanical engineering. The method was deployed at several universities to broaden its exposure to differing contextual factors and types of design problems. Participants were volunteers from these capstone design courses. Responses are evaluated at the individual level. The same presentations and worksheets were employed at each location. Surveys were collected anonymously. The authors aggregated the data and hard copies are kept at the University of Texas at Austin. In the first survey, participants list their anticipated prototyping strategy (before they have seen the method). Then they are exposed to the prototyping strategy method. The method is demonstrated by walking through a case study of its application to various design problems. The participants are then asked to complete the second survey which walks them through the methodology and asks them to develop a new prototyping strategy, as instructed by the analytical process of the method. Finally, teams are permitted to complete their prototyping process, through development and testing. A third survey asks them to report the effectiveness of the approach to prototyping that they took, and how closely their executed process matched the process indicated by the method on a Likert 1-10 scale.
Page 23.330.11

These design teams were working on problems that range from development and testing of multi-objective micro-aerial vehicles (MAVs) to conceptual designs for solutions to needs in the developing world. Typically each team is given a design problem by an industry or government partner that is restricted to something which can be ideated and prototyped in a two-semester course. Budgets and the level of detail of the design requirements vary drastically by institution and design problem. The resulting prototypes of these projects range from physical prototypes, analysis methods, or even test-beds.
6. Results and Discussion Results include the aggregated data from various surveys across twelve design teams at the three universities. Each team has a unique design problem. Assessments in Tables 5-8 are based on the three surveys conducted: (1) before seeing the method; (2) after seeing the method but before prototyping; and (3) after prototyping. For the metric “change between pre- and post- method strategy” results of the first two surveys are examined. These are the surveys that ask individuals to report their intended prototyping strategy before and then after applying the method. Each choice element in the entire reported strategy for each individual is examined. For instance the choice to scale a certain prototype is one element, while the choice to relax the design requirements for that same prototype is a second element. Suppose an individual reports a plan to scale the third iteration of the second concept that they plan to prototype before using the method, then, after using the method, they plan to build a full size prototype for the third iteration of the second concept. This information is recorded as a single change. The number of elements and changes was measured and averaged across all participants. These results are summarized in Table 5. The average change, 8.9 elements, between pre- and post- method strategy across all participants has a significance of more than one standard error. The average number of prototypes across participants in which the participant planned to apply scaling, subsystem isolation and requirement relaxation, pre- and post- method was also evaluated. See Table 5. There was no significant trend, towards or away from scaling, subsystem isolation or requirement relaxation or even in the total number of prototypes planned.
Table 5. Changes to strategy from introducing method Average number of elements Standard error Average number of changes Standard error
16.21 1.50 8.90 1.29 Average number of prototypes:
before Standard error Average number of prototypes: after Standard error
6 0.98 6.22 1.02 Average number of prototypes to be
scaled: before Standard error Average number of prototypes to be scaled: after Standard error
1.37 0.23 1 0.16 Average number of prototypes to be
functionally isolated: before Standard error Average number of prototypes to be functionally isolated: after Standard error
1.60 0.26 1.66 0.27 Average number of prototypes with
relaxed requirements: before Standard error Average number of prototypes with relaxed requirements: after Standard error
1.60 0.26 1.37 0.23
Page 23.330.12

Participants’ reaction to the method on a Likert scale was also recorded in the third survey. These results are summarized in Table 6. There was statistical significance greater than one standard error to the observation that those who followed the suggestions made by the method also found the method to have been helpful. The criteria ‘followed the method’ is defined as those individuals who reported the degree to which they followed the method as greater than or equal to five on the Likert scale. Conversely, the criteria ‘diverged from the method’ is defined as those individuals who reported that the degree to which they followed the method was less than or equal to four on the Likert scale.
Table 6. Assessment of method on Likert scale (10 means followed the method exactly) Mean Standard
error Percent of individuals
Assessment of method by individuals who followed method 7.4 0.29 61% Assessment of method by individuals who used a different approach 2.3 0.56 39%
The results show, based on percentage, that the participants that followed the method realized the prototypes with sufficient time resources at a higher percentage than those that diverged from the method. The majority of participants in both experimental groups found that they had sufficient prototyping budget, at a similar percentage. Using the two proportions test, the sufficient time comparison of the participants are statistically significant for p < 0.10 but not for p < 0.05. Based on this finding, the results indicate the potential of the method for time to prototype and effective use of budget, where further experiments are called for to increase participant sample size and refine the statistical tests.
Table 7. Sufficiency of time to build and budget to build
Had sufficient time Had sufficient budget Percent of individuals
Followed the method 57% said yes 79% said yes 64% Diverged from the method 25% said yes 75% said yes 36% p - value 0.07 0.42
There is also a statistical significance greater than one standard error to the observation that those who adhered to the method perceived their entire prototyping effort to be more effective than those who did no apply the method. Table 8 shows the statistical quantities this observation.
Table 8. Correlation between effectiveness of prototyping effort and following the method on Likert scale (10 means the approach was very effective)
Mean Standard error
Percentage of individuals
Overall effectiveness of prototyping process - those who followed the method 7.9 0.28 64%
Overall effectiveness of prototyping process - those who used a different approach 6.0 0.82 36%
Behavioral and meta-data style observations were also recorded during and after the experiment. Application of the method took, on average, approximately 45 minutes to an hour. When given all the necessary documents and flowcharts, the prototyping strategy method is designed to
Page 23.330.13

require a minimal amount of training to implement. During execution of the method, participants asked a number of useful questions. One particular clarification which arose is the following: when evaluating the cost of a second concept that consists of minor changes (or extensions) to an initial concept, then the secondary systems should be evaluated by the additional budget costs of the add-on rather than re-computing the entire cost. During the experiment, we found it useful to allow the participants to first work the method individually and then collaborate as a team. This allowed each team member to think through the method and be prepared to discuss as a team and reach a consensus. If teams were allowed to reach a consensus from the start, there was a risk of an extroverted, dominate team member making all of the choices.
From discussion with the participants, as well as the self-reported Likert scale results, the method was well received by the majority of participants. It also had a positive effect on the perceived effectiveness of the prototyping process executed as a whole when the method is followed. Participants using the method reported an overall higher satisfaction with their approach to prototyping. It is likely that there was no significant difference in ‘having enough budget’ between the participants who followed and diverged from the method, as budget is typically not a driving constraint for these in-class design problems. Very few to no teams ever actually exceeded their budget for these particular classes.
7. Conclusions
Prototyping choices and strategies are critical to design. They can effectively ‘make or break’ a design effort. Several studies have shown that one approach to prototyping can enhance creativity or while another may instill fixation. Prototypes can help a designer to communicate ideas, explore the design space, and refine design concepts. The many studies that explore prototyping have provided novel insights into how to approach the prototyping process[3,4,5]. This paper integrates these heuristics into a concrete methodology for setting specific goals or making distinct choices about certain options in the prototyping process, such as whether or not to scale a prototype. Many experts in the field of design research, as well as practitioners of design, have shown great enthusiasm regarding such methods. This paper begins with a preliminary overview of literature relevant to developing a method for strategically approaching the prototyping process. This literature is critically examined. A methodology is then discussed which is based on this critical examination. The approaches by which the method was developed are then outlined. Next, the method itself is presented. The prototyping strategy method provided in this paper has been experimentally evaluated through its deployment to a set of design teams across three universities. This deployment was executed alongside a survey-based evaluation of the effectiveness of the method and correlations to outcomes of the prototyping process. The results from the experiments show that: (1) the prototyping strategy method strongly affects the anticipated prototyping plan that a team will implement, compared to a plan developed without the method; (2) effective use of a prototyping stategy is associated with a positive reflection on the design process by designers; and (3) design teams using a prototyping strategy execute prototyping with effective use of budget and improved use of time resources.
Page 23.330.14

This prototyping strategy method is detailed in the paper so that other design science researchers and educators can explore this methodology in their own practice, and hopefully continue this line of research. The method has been explored for classroom level design problems. Should this method be adopted for industrial applications, further detail regarding quantification of the independent design context variables, and calculations of uncertainty should be considered in future research.
The global intention of our approach is to explore one of the most exciting and critical aspects of design engineering in a scientific way. Such exploration can lead to a deeper understanding of the phenomenology of prototyping. This understanding then provides the basis for structured methods. The goal of such methodologies is to explore the opportunities present during prototyping. A well-designed method integrates the intuition and creativity of the designer, while guiding and clarifying the over-all process.
Acknowledgements
This material is based on research sponsored by the United Sates Air Force Academy under agreement number FA7000-12-2-2005. The US Government is authorized to reproduce and distribute reprints for Government purposes notwithstanding any copyright notation thereon. The research is also supported in part by the Singapore University of Technology and Design, and Massachusetts Institute of Technology International Design Centre (SUTD-MIT IDC) (http://www.sutd.edu.sg/idc.aspx).
The views and conclusions contained herein are those of the authors and should not be interpreted as necessarily representing the official policies or endorsements, either expressed or implied, of the United States Air Force Academy, the US government, or other affiliations of the authors.
Bibliography 1. Cooper, R. G., Winning at New Products: Accelerating the Process from Idea to Launch, Cambridge, MA:
Perseus, 1993 2. Barczak, G., Griffin, A. and Kahn, K. B., “PERSPECTIVE: Trends and Drivers of Success in NPD Practices:
Results of the 2003 PDMA Best Practices Study,” Journal of Product Innovation Management, Vol. 26: 3–23, 2009
3. Christensen, and Clayton M, The Innovator’s Dilemma, Harper Business, 2003 4. Dodgson, M., Think, Play, Do: Technology, Innovation, and Organization, OUP Oxford, 2005 5. Verganti, R., Design-Driven Innovation: Changing the Rules of Competition by Radically Innovating What
Things Mean, Harvard Business Press, 2009 6. Martin, R., The Design of Business: Why Design Thinking Is the Next Competitive Advantage, Harvard
Business Press, 2009 7. Kelley, T., The Art of Innovation: Lessons in Creativity from IDEO, America's Leading Design Firm, random
House Digital, inc., 2001 8. Thomke, S. H., Experimentation Matters: Unlocking the Potential of New Technologies for Innovation,
Harvard Business Press, 2003
Page 23.330.15

9. Schrage, M., Serious Play: How the World's Best Companies Simulate to Innovate, Harvard Business Press, 2000
10. Clark, K., Fujimoto, T., 1991, Product Development Performance: Strategy, Organization, and Management in the World Auto Industry. Boston: Harvard Business School Press.
11. Dahan, E., and Mendelson, H., “Optimal parallel and sequential prototyping in product design,” working paper, Stanford University Graduate School of Business, Stanford, CA., 1998
12. Thomke, S.H., and Bell, D., “Optimal testing in product development,” working paper, Harvard Business School, Cambridge, MA, 1999
13. Thomke, S.H., “Managing experimentation in the design of new products,” Management Science, 44(June) 743–762, 1998
14. Drezner, J., “On Prototyping”, RAND Corp., 29th March 2013, Web, <http://www.rand.org> 15. Otto, K.N., and Wood, K.L., Product Design: Techniques in Reverse Engineering and New Product
Development, Upper Saddle River, N.J. Prentice-Hall, 2001 16. Moe, R., Jensen, D., and Wood, K., "Prototype partitioning based on requirement flexibility,” American
Society of Mechanical Engineers, Design Engineering Technical Conference - Design Theory and Methodology section, 2004
17. Ulrich, K. T., and Eppinger S. D., Product Design and Development, NY: Mc Graw-Hill., ., 29th March 2013, Web, <http://www.industryweek.com/articles/visualize_this_20809.aspx>
18. Banga, K., and Takai, S., “Effects of design parameters in cost estimation and cost uncertainty modelling,” American Society of Mechanical Engineers, Design Engineering Technical Conference, Washington D.C., 2011
19. Ruffo, M., Tuck, C., and Hague, R., “Make or buy analysis for rapid manufacturing”, Rapid Prototyping Journal, Vol. 13 Iss: 1, pp.23 - 29, 2007
20. Franck, C., Rosen, D., “Measuring value of prototypes during product development,” American Society of Mechanical Engineers, Design Engineering Technical Conference, Baltimore, Maryland, 2000
21. Bernard, A., Deglin, A., and Ris, G., “An original approach for the memorisation and the generation of rapid product development processes,” Rapid Prototyping Journal, Vol. 9 Iss: 2, pp.58 – 67, 2003
22. Gerber, E., and Maureen, C., “The psychological experience of prototyping,” Design Studies, In Press: 1-21. , 2011
23. Linsey, J., Tseng, I., Fu, K., Cagan, J., Wood, K., and Schunn, C., "A Study of Design Fixation, Its Mitigation and Perception in Engineering Design Faculty," ASME Transactions: Journal of Mechanical Design, 132 pp. 041003, 2010
24. Jansson, D., and Smith, S., "Design Fixation," Design Studies, 12 (1), pp. 3-11,1991 25. Kershaw, Trina, Holtta-Otto, and Lee, Yoon Soo, 2011, “The Effect of Prototyping and Critical Feedback on
Fixation in Engineering Design,” Cognitive Science Society, CogSci Conference, Boston, Massachusetts, 2011 26. Collins, A. M., and Loftus, E. F., "A Spreading-Activation Theory of Semantic Processing," Psychological
review, 82 (6), pp. 407-428,1975 27. Anderson, J. R., "A Spreading Activation Theory of Memory," Journal of Verbal Learning and Verbal
Behavior, 22 (3), pp. 261-295,1983 28. Matlin, M. W. ,"Cognition. Hoboken.," (2005): 66-85. 29. Ward, A., Liker, J. K., Cristiano, J. J., and Sobek, D. K., "The Second Toyota Paradox: How Delaying
Decisions Can Make Better Cars Faster," Sloan Management Review, 38 pp. 43-43,1995 30. Luchins, A. S., and Luchins, E. H., Rigidity of Behavior: A Variational Approach to the Effect of Einstellung,
University of Oregon books Eugene, OR, 1959. 31. Kiriyama, T., and Yamamoto, T., "Strategic Knowledge Acquisition: A Case Study of Learning through
Prototyping," Knowledge-based Systems, 11 (7-8), pp. 399- 404,1998 32. Christensen, B. T., and Schunn, C. D., "The Relationship of Analogical Distance to Analogical Function and
Pre-Inventive Structure: The Case of Engineering Design," Creative Cognition: Analogy and Incubation, 35 (1), pp. 29-38,2005
33. Viswanathan, V. K., and Linsey, J. S., "Enhancing Student Innovation: Physical Models in the Idea Generation Process," ASEE/IEEE Frontiers in Education Conference, San Antonio, TX, 2009.
34. Viswanathan, K. “Cognitive effects of physical models in engineering data generation,” PhD. Thesis, Texas A&M University, 2012
35. Dahan, E., and Mendelson, H., “An extreme value model of concept testing,” Management Science, 2001 36. Camburn, B., Dunlap, B., Linsey, J., Viswanathan, V., Jensen, D., Crawford, R., Otto, K., and Wood, K.
“Prototyping strategy method: exploitation of design context for optimization of prototyping logistics,”
Page 23.330.16

American Society of Mechanical Engineers, International Design Engineering and Technology Conference, DETC-DTM Portland OR, 2013
37. Cho, U., Wood, K.L., and Crawford, R.H., “On-Line Functional Testing with Rapid Prototypes: A Novel Empirical Similarity Method,” International Rapid Prototyping Journal, Vol. 4, No. 3, pp. 128-138, 1998
38. Christie, E., Buckley, R. Ziegler, K., Jensen, D., and Wood, K., “Prototyping strategies: Literature review and critical variables,” American Society of Mechanical Engineers, International Design Engineering and Technology Conference, Chicago, IL, 2012
39. Yang, M., and Epstein, D., “A Study of Prototypes Design Activity and Design Outcome,” Design Studies, 2005 Vol 26. pp 649-669
40. Jang, J., and Schunn, C., “Physical Design Tools Support and Hinder Innovative Engineering Design,” Journal of Mechanical Design, Vol. 134, April 2012
Page 23.330.17