Embed Size (px)
Citation preview

Connecting data(and epidemiology)
with people
Uli Muellner 14 December 2017


Connecting data and epidemiology with people
Real-time
New data sources
User interfaces: information dashboards, infographics …
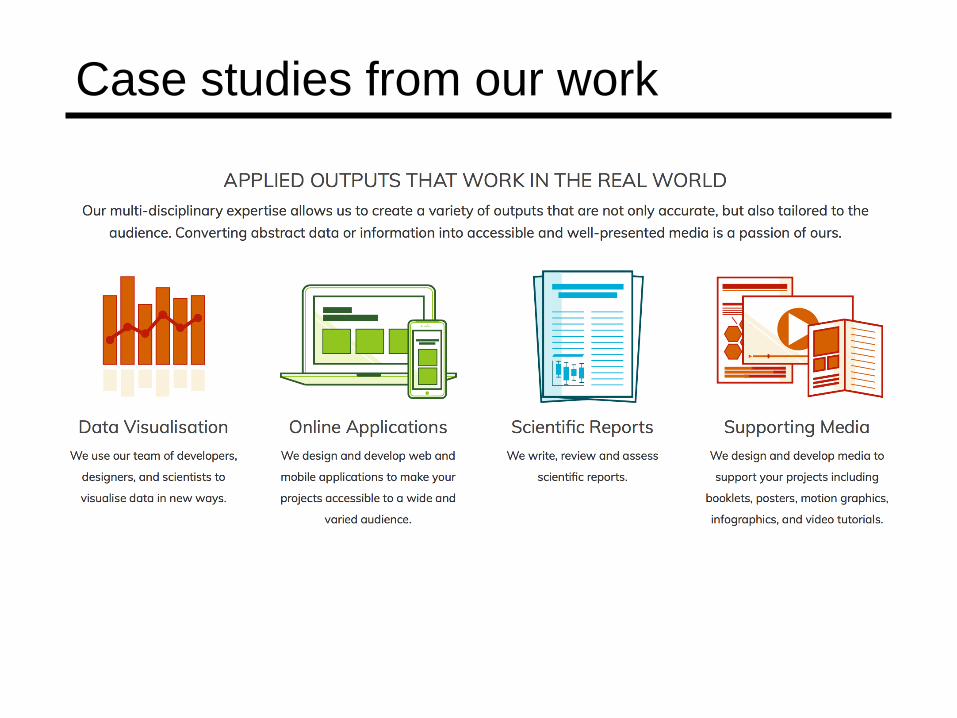
Case studies from our work
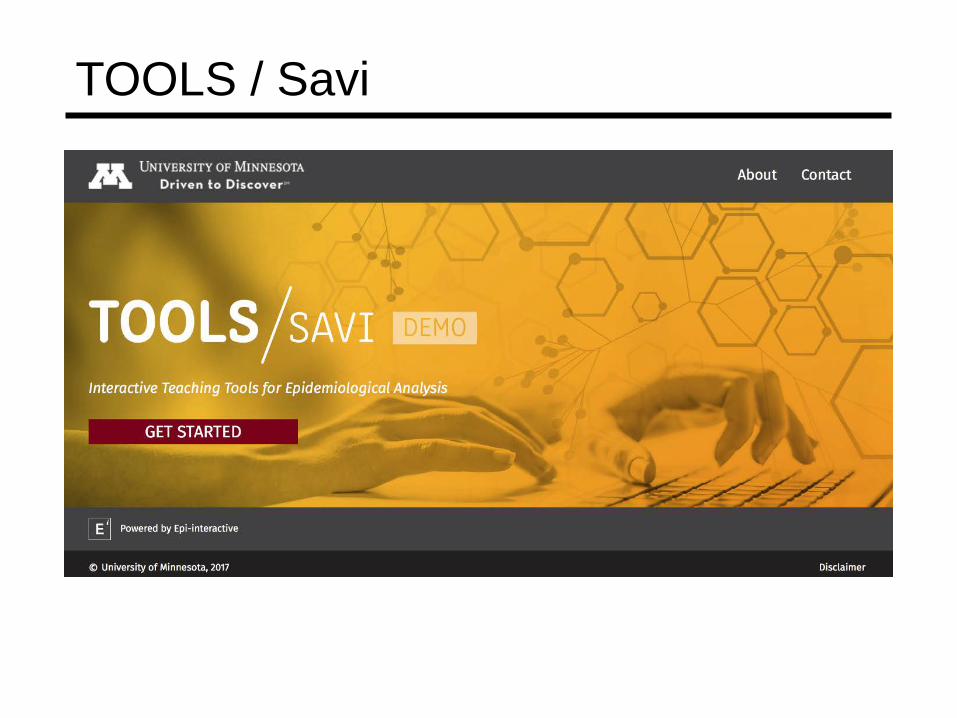
TOOLS / Savi


New data sources

New data sources – primary care data


… for vet clinics

Decision-support

Interactive & layering

Animation
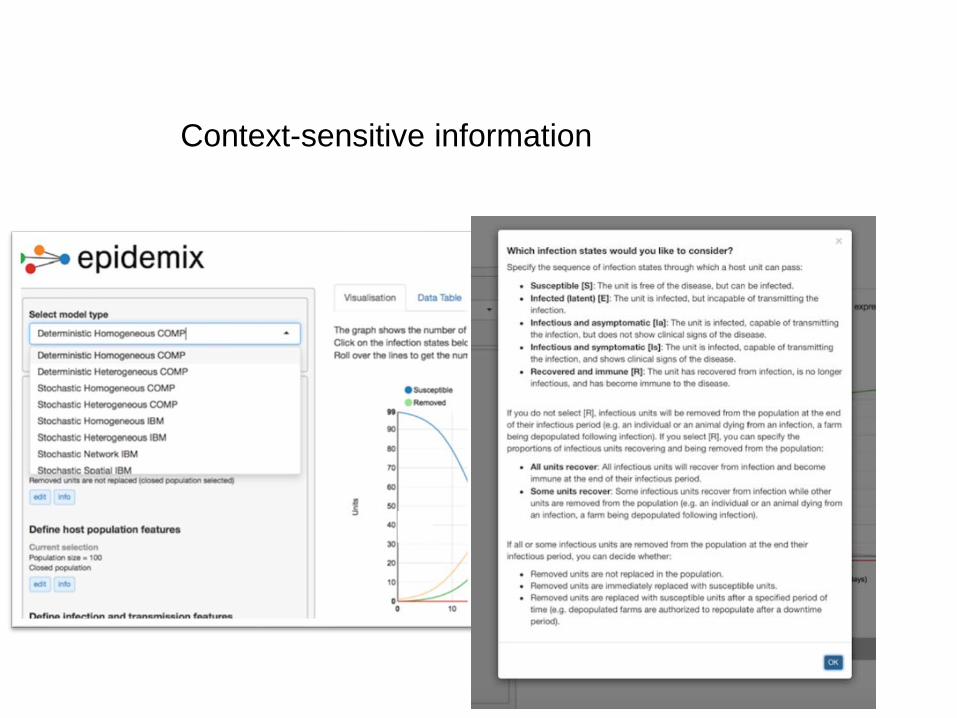
Context-sensitive information

Health data reporting


Infographics
• Providing a visual summary of technical reports, strategies…
• Lots of fun to make and often what people remember

Why are we struggling?
• Its complicated!• Easy is hard• Forest for the trees

Let go of the “Wolpertinger model”
• Don’t need “web-programming-epidemiologist-designer-veterinarians”
• Things are getting way to complex!
• In-depth collaboration / multidisciplinary approach needed
• Need connectors• Can be painful

Conclusion
• Try out new ways to communicate research
“We have interesting stories, beautiful information and above all information that holds the key to improving human and animal health and well being – let’s do a better job at getting the message across.”

Thank you for listening
[email protected]@epi-interactive.com
AcknowledgementsEpi-interactive team: Petra Muellner, Anna Poulin, Christina Ahlstrom, Geoff Longuett, Shanna Tervoort-McLeod, Kara Dawson


![Savi Episode 13[1]](https://img.pdfslide.us/doc/110x75/55cf8c9e5503462b138e4cd5/savi-episode-131.jpg)
![Savi Episode 12[1]](https://img.pdfslide.us/doc/110x75/55cf8c9e5503462b138e4d4b/savi-episode-121.jpg)


![Savi Episode 14[1]](https://img.pdfslide.us/doc/110x75/55cf8c9e5503462b138e4cd9/savi-episode-141.jpg)