Embed Size (px)
Citation preview
Technical Report NREL/TP-560-47334-2 January 2010
Connecticut Transit (CTTRANSIT) Fuel Cell Transit Bus: Third Evaluation Report – Appendices Kevin Chandler, Battelle Leslie Eudy, National Renewable Energy Laboratory Link to Report
Photo source: CTTRANSITPhoto source: CTTRANSIT
National Renewable Energy Laboratory 1617 Cole Boulevard, Golden, Colorado 80401-3393 303-275-3000 • www.nrel.gov
NREL is a national laboratory of the U.S. Department of Energy Office of Energy Efficiency and Renewable Energy Operated by the Alliance for Sustainable Energy, LLC
Contract No. DE-AC36-08-GO28308
Technical Report NREL/TP-560-47334-2 January 2010
Connecticut Transit (CTTRANSIT) Fuel Cell Transit Bus: Third Evaluation Report – Appendices Kevin Chandler, Battelle Leslie Eudy, National Renewable Energy Laboratory
Prepared under Task No. FC08.7820
NOTICE
This report was prepared as an account of work sponsored by an agency of the United States government. Neither the United States government nor any agency thereof, nor any of their employees, makes any warranty, express or implied, or assumes any legal liability or responsibility for the accuracy, completeness, or usefulness of any information, apparatus, product, or process disclosed, or represents that its use would not infringe privately owned rights. Reference herein to any specific commercial product, process, or service by trade name, trademark, manufacturer, or otherwise does not necessarily constitute or imply its endorsement, recommendation, or favoring by the United States government or any agency thereof. The views and opinions of authors expressed herein do not necessarily state or reflect those of the United States government or any agency thereof.
Available electronically at http://www.osti.gov/bridge
Available for a processing fee to U.S. Department of Energy and its contractors, in paper, from:
U.S. Department of Energy Office of Scientific and Technical Information P.O. Box 62 Oak Ridge, TN 37831-0062 phone: 865.576.8401 fax: 865.576.5728 email: mailto:[email protected]
Available for sale to the public, in paper, from: U.S. Department of Commerce National Technical Information Service 5285 Port Royal Road Springfield, VA 22161 phone: 800.553.6847 fax: 703.605.6900 email: [email protected] online ordering: http://www.ntis.gov/ordering.htm
Printed on paper containing at least 50% wastepaper, including 20% postconsumer waste
iii
Introduction to the Appendices
The National Renewable Energy Laboratory (NREL) has reported evaluation results for fuel cell buses since 2003. These reports include a broad range of background on the transit property, the buses, infrastructure, and overall experience operating fuel cell buses. Several reports are planned for each evaluation site. The first data report typically includes extensive background material plus an analysis of the first round of data. Update reports follow the initial publication, focusing on the newest data analysis and lessons learned since the previous report. The authors would like to provide more focus on the new data without depriving new readers of the background and context on the transit property and the technology. These appendices, referenced in the main report, are designed to provide the full background for the evaluation. They will be updated as new information is collected but will contain the original background material from the first report. Both parts can be downloaded separately. A Web link is provided on the cover to allow the reader to download the main report.
All NREL publications on hydrogen and fuel cell buses are available at: http://www.nrel.gov/hydrogen/proj_fc_bus_eval.html
iv
Table of Contents Appendix A: NREL Transit Bus Evaluation Activities .................................................................. 1
Overall Evaluation Objectives .................................................................................................... 3 Appendix B: CTTRANSIT Description ......................................................................................... 5
CTTRANSIT Profile ................................................................................................................... 5 CTTRANSIT’s Fuel Cell Demonstration Project ....................................................................... 6
Appendix C: Evaluation Bus Technology Descriptions ................................................................. 9 Fuel Cell and Diesel Buses ......................................................................................................... 9 Fuel Cell Bus Propulsion System Description .......................................................................... 10
Appendix D: Evaluation Infrastructure Description ..................................................................... 12 Facilities .................................................................................................................................... 12
Appendix E. Fleet Summary Statistics ......................................................................................... 14 Appendix F: Fleet Summary Statistics—SI Units ........................................................................ 20
1
Appendix A: NREL Transit Bus Evaluation Activities
Under funding from the Department of Energy (DOE) and in coordination with the Federal Transit Administration (FTA), the National Renewable Energy Laboratory (NREL) has been evaluating alternative fuel transit buses since the early 1990s. In 1996, DOE and NREL completed an evaluation of transit buses at eight transit agencies that included six different alternative fuels. As part of this alternative fuel transit bus evaluation, NREL and Battelle (NREL’s contractor for this effort) developed a customized data-collection and evaluation protocol. This protocol has evolved over time but is still based on the original effort.
NREL first began evaluating hydrogen-fueled transit buses in 2000 with SunLine Transit Agency. Since that time, NREL has published reports on fuel cell bus (FCB) performance and fleet experience for several transit agencies in the United States. These evaluations were funded under the Technology Validation activity within DOE’s Fuel Cell Technologies Program1
While DOE has not funded the direct development of fuel cell buses, it has provided funding to NREL to conduct data collection, analysis, and reporting of existing FCB projects under its Technology Validation activity. NREL’s current hydrogen transit bus evaluations include four active projects and five that were completed in the last few years.
, which is focused on addressing the technical challenges and accelerating the development and successful market introduction of fuel cells and related technologies. NREL supports DOE’s Technology Validation activity by evaluating fuel cell vehicles in parallel with hydrogen infrastructure to determine the current status of the technology and to assess the progress toward technology readiness.
In 2006, FTA initiated its newest development program, the National Fuel Cell Bus Program (NFCBP)2
The FTA is collaborating with DOE and NREL to ensure that data are collected on all fuel cell bus demonstrations under the program. FTA has tasked NREL with evaluating the fuel cell bus demonstrations for the NFCBP. NREL uses the standard data collection and analysis protocol established for DOE heavy-duty vehicle evaluations. In May 2008, NREL published Hydrogen and Fuel Cell Transit Bus Evaluations: Joint Evaluation Plan for the U.S. Department of Energy and the Federal Transit Administration, which outlines the methodology for these evaluations
. The NFCBP was established as part of the Safe, Accountable, Flexible, Efficient Transportation Equity Act: a Legacy for Users (SAFETEA-LU) transportation authorization. The NFCBP program designates $49 million in funding for 2006 through 2009 to help develop commercially viable fuel cell buses and technologies. The FTA competitively selected three nonprofit organizations—the Center for Transportation and the Environment (CTE), the Northeast Advanced Vehicle Consortium (NAVC), and CALSTART—to administer projects under the program. The FTA selected 14 separate projects in all, including eight planned demonstration projects.
3
1 DOE FCT Web site:
. Table A-1 provides an overview of all the FCB evaluation projects planned under both DOE and FTA funding. This overview is the estimated timing for NREL’s data collection and evaluation
www1.eere.energy.gov/hydrogenandfuelcells/ 2 FTA Bus Research and Testing Web site: www.fta.dot.gov/assistance/technology/research_4578.html 3 Hydrogen and Fuel Cell Transit Bus Evaluations: Joint Evaluation Plan for the U.S. Department of Energy and the Federal Transit Administration, NREL/MP-560-42781, May 2008, www.nrel.gov/hydrogen/pdfs/42781-1.pdf
2
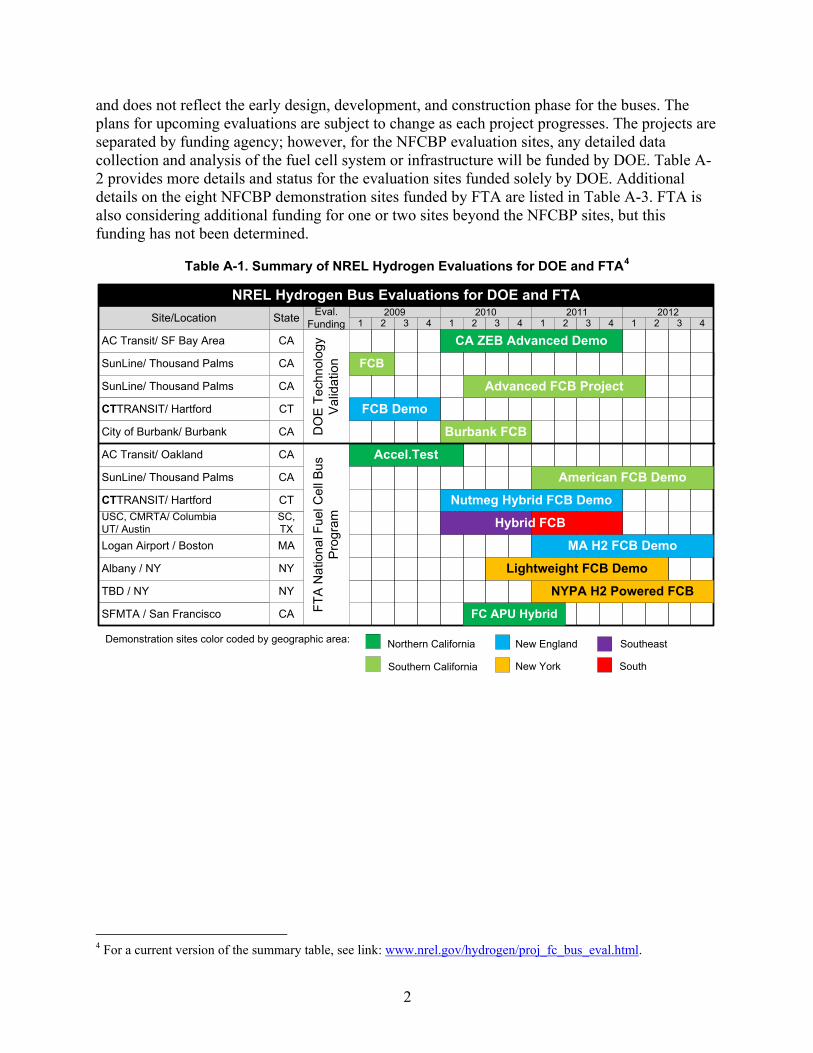
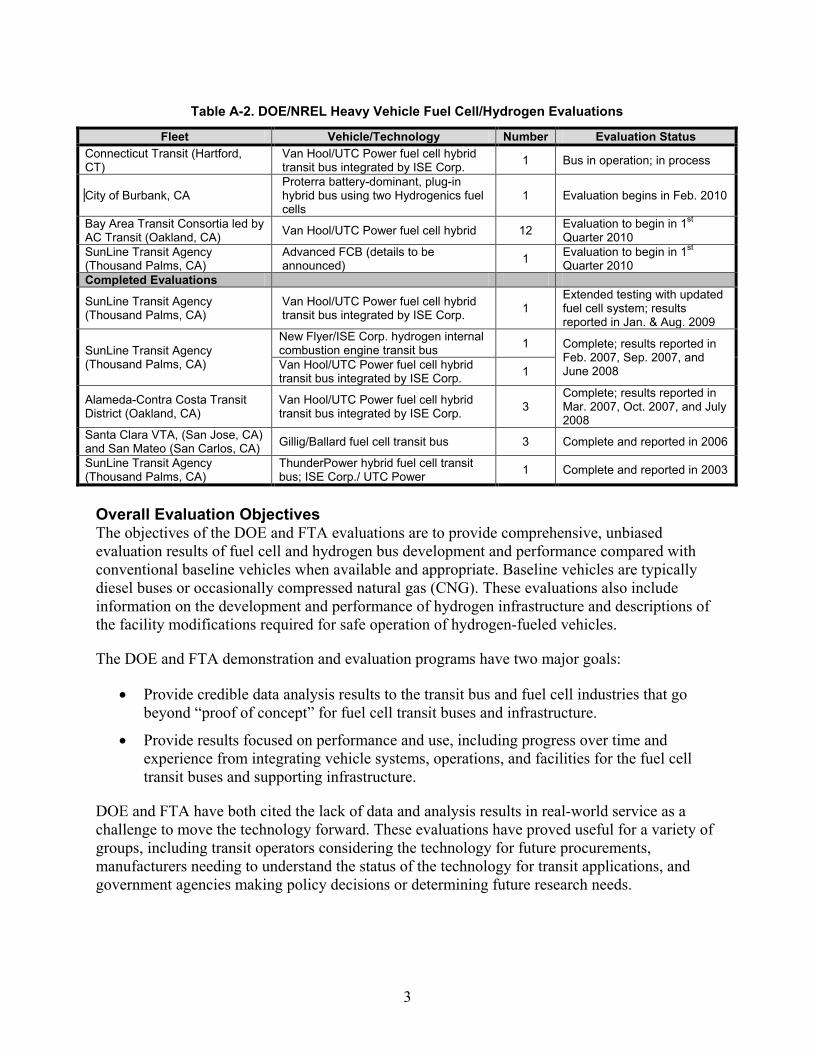
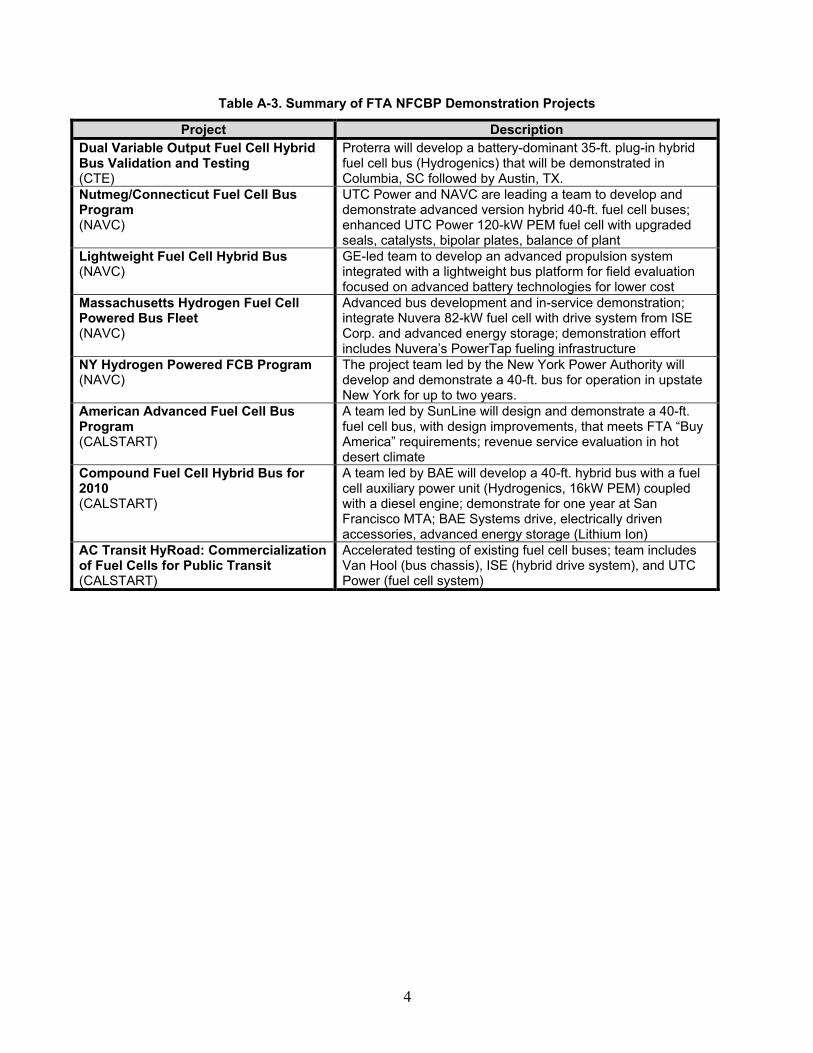
and does not reflect the early design, development, and construction phase for the buses. The plans for upcoming evaluations are subject to change as each project progresses. The projects are separated by funding agency; however, for the NFCBP evaluation sites, any detailed data collection and analysis of the fuel cell system or infrastructure will be funded by DOE. Table A-2 provides more details and status for the evaluation sites funded solely by DOE. Additional details on the eight NFCBP demonstration sites funded by FTA are listed in Table A-3. FTA is also considering additional funding for one or two sites beyond the NFCBP sites, but this funding has not been determined.
Table A-1. Summary of NREL Hydrogen Evaluations for DOE and FTA4
2009 2010 2011 2012NREL Hydrogen Bus Evaluations for DOE and FTA
Site/Location State Eval. Funding
DO
E T
echn
olog
y V
alid
atio
nFT
A N
atio
nal F
uel C
ell B
us
Pro
gram
AC Transit/ SF Bay Area
SunLine/ Thousand Palms
SunLine/ Thousand Palms
CTTRANSIT/ Hartford
City of Burbank/ Burbank
CTTRANSIT/ HartfordUSC, CMRTA/ ColumbiaUT/ Austin
AC Transit/ Oakland
SunLine/ Thousand Palms
Logan Airport / Boston
Albany / NY
TBD / NY
SFMTA / San Francisco
CA
CA
CA
CA
CT
CTSC, TXMA
NY
NY
CA
CA
CA
New York
SoutheastNew England
Southern California
Northern CaliforniaDemonstration sites color coded by geographic area:
1 2 3 4 1 2 3 4 1 2 3 4 1 2 3 4
CA ZEB Advanced Demo
FCB
FCB Demo
Accel.Test
Burbank FCB
Advanced FCB Project
American FCB Demo
Nutmeg Hybrid FCB Demo
MA H2 FCB Demo
Lightweight FCB Demo
NYPA H2 Powered FCB
FC APU Hybrid
Hybrid FCB
South
4 For a current version of the summary table, see link: www.nrel.gov/hydrogen/proj_fc_bus_eval.html.
3
Table A-2. DOE/NREL Heavy Vehicle Fuel Cell/Hydrogen Evaluations
Fleet Vehicle/Technology Number Evaluation Status Connecticut Transit (Hartford, CT)
Van Hool/UTC Power fuel cell hybrid transit bus integrated by ISE Corp. 1 Bus in operation; in process
City of Burbank, CA Proterra battery-dominant, plug-in hybrid bus using two Hydrogenics fuel cells
1 Evaluation begins in Feb. 2010
Bay Area Transit Consortia led by AC Transit (Oakland, CA) Van Hool/UTC Power fuel cell hybrid 12 Evaluation to begin in 1st
Quarter 2010 SunLine Transit Agency (Thousand Palms, CA)
Advanced FCB (details to be announced) 1 Evaluation to begin in 1st
Quarter 2010 Completed Evaluations
SunLine Transit Agency (Thousand Palms, CA)
Van Hool/UTC Power fuel cell hybrid transit bus integrated by ISE Corp. 1
Extended testing with updated fuel cell system; results reported in Jan. & Aug. 2009
SunLine Transit Agency (Thousand Palms, CA)
New Flyer/ISE Corp. hydrogen internal combustion engine transit bus 1 Complete; results reported in
Feb. 2007, Sep. 2007, and June 2008 Van Hool/UTC Power fuel cell hybrid
transit bus integrated by ISE Corp. 1
Alameda-Contra Costa Transit District (Oakland, CA)
Van Hool/UTC Power fuel cell hybrid transit bus integrated by ISE Corp. 3
Complete; results reported in Mar. 2007, Oct. 2007, and July 2008
Santa Clara VTA, (San Jose, CA) and San Mateo (San Carlos, CA) Gillig/Ballard fuel cell transit bus 3 Complete and reported in 2006
SunLine Transit Agency (Thousand Palms, CA)
ThunderPower hybrid fuel cell transit bus; ISE Corp./ UTC Power 1 Complete and reported in 2003
Overall Evaluation Objectives The objectives of the DOE and FTA evaluations are to provide comprehensive, unbiased evaluation results of fuel cell and hydrogen bus development and performance compared with conventional baseline vehicles when available and appropriate. Baseline vehicles are typically diesel buses or occasionally compressed natural gas (CNG). These evaluations also include information on the development and performance of hydrogen infrastructure and descriptions of the facility modifications required for safe operation of hydrogen-fueled vehicles.
The DOE and FTA demonstration and evaluation programs have two major goals:
• Provide credible data analysis results to the transit bus and fuel cell industries that go beyond “proof of concept” for fuel cell transit buses and infrastructure.
• Provide results focused on performance and use, including progress over time and experience from integrating vehicle systems, operations, and facilities for the fuel cell transit buses and supporting infrastructure.
DOE and FTA have both cited the lack of data and analysis results in real-world service as a challenge to move the technology forward. These evaluations have proved useful for a variety of groups, including transit operators considering the technology for future procurements, manufacturers needing to understand the status of the technology for transit applications, and government agencies making policy decisions or determining future research needs.
4
Table A-3. Summary of FTA NFCBP Demonstration Projects
Project Description Dual Variable Output Fuel Cell Hybrid Bus Validation and Testing (CTE)
Proterra will develop a battery-dominant 35-ft. plug-in hybrid fuel cell bus (Hydrogenics) that will be demonstrated in Columbia, SC followed by Austin, TX.
Nutmeg/Connecticut Fuel Cell Bus Program (NAVC)
UTC Power and NAVC are leading a team to develop and demonstrate advanced version hybrid 40-ft. fuel cell buses; enhanced UTC Power 120-kW PEM fuel cell with upgraded seals, catalysts, bipolar plates, balance of plant
Lightweight Fuel Cell Hybrid Bus (NAVC)
GE-led team to develop an advanced propulsion system integrated with a lightweight bus platform for field evaluation focused on advanced battery technologies for lower cost
Massachusetts Hydrogen Fuel Cell Powered Bus Fleet (NAVC)
Advanced bus development and in-service demonstration; integrate Nuvera 82-kW fuel cell with drive system from ISE Corp. and advanced energy storage; demonstration effort includes Nuvera’s PowerTap fueling infrastructure
NY Hydrogen Powered FCB Program (NAVC)
The project team led by the New York Power Authority will develop and demonstrate a 40-ft. bus for operation in upstate New York for up to two years.
American Advanced Fuel Cell Bus Program (CALSTART)
A team led by SunLine will design and demonstrate a 40-ft. fuel cell bus, with design improvements, that meets FTA “Buy America” requirements; revenue service evaluation in hot desert climate
Compound Fuel Cell Hybrid Bus for 2010 (CALSTART)
A team led by BAE will develop a 40-ft. hybrid bus with a fuel cell auxiliary power unit (Hydrogenics, 16kW PEM) coupled with a diesel engine; demonstrate for one year at San Francisco MTA; BAE Systems drive, electrically driven accessories, advanced energy storage (Lithium Ion)
AC Transit HyRoad: Commercialization of Fuel Cells for Public Transit (CALSTART)
Accelerated testing of existing fuel cell buses; team includes Van Hool (bus chassis), ISE (hybrid drive system), and UTC Power (fuel cell system)
5
Appendix B: CTTRANSIT Description
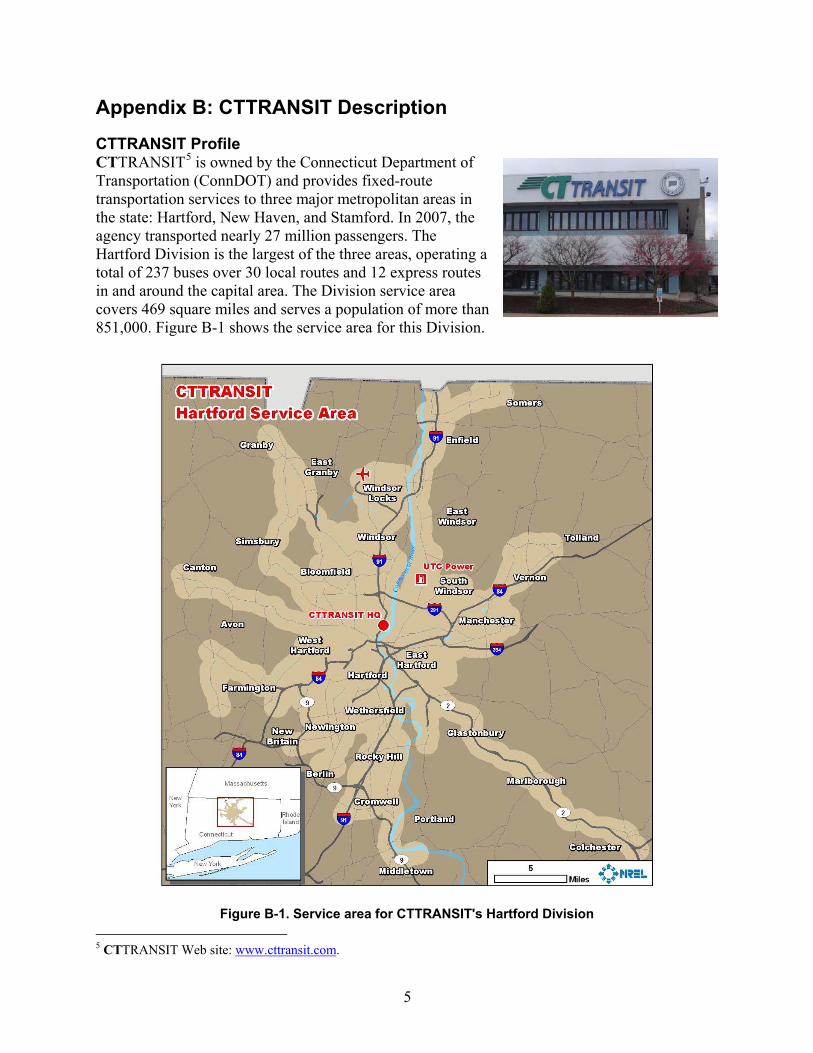
CTTRANSIT Profile CTTRANSIT5 is owned by the Connecticut Department of Transportation (ConnDOT) and provides fixed-route transportation services to three major metropolitan areas in the state: Hartford, New Haven, and Stamford. In 2007, the agency transported nearly 27 million passengers. The Hartford Division is the largest of the three areas, operating a total of 237 buses over 30 local routes and 12 express routes in and around the capital area. The Division service area covers 469 square miles and serves a population of more than 851,000. Figure B-1 shows the service area for this Division.
Figure B-1. Service area for CTTRANSIT's Hartford Division
5 CTTRANSIT Web site: www.cttransit.com.
6
CTTRANSIT has been investigating new technologies and fuels for its fleet that are more efficient and produce fewer emissions. In November 2006, the agency switched to ultra low–sulfur diesel fuel with 5% biodiesel in its bus fleet to reduce both emissions and petroleum consumption. All new buses procured by the agency are equipped with diesel particulate filters (DPF). To further reduce fleet emissions, CTTRANSIT completed a retrofit program in July 2009 that installed DPFs on most of its existing bus fleet.
CTTRANSIT also conducted a pilot program to evaluate the benefits of hybrid technology for potential future purchases. For this project, the agency procured two New Flyer 40-foot buses (model year 2003) with Allison diesel hybrid propulsion systems. The agency operated these two buses alongside two standard diesel buses for 18 months. Comparisons were made to evaluate emissions, fuel efficiency, reliability, and cost. The results of the project were reported in October 20056
CTTRANSIT’s Fuel Cell Demonstration Project
.
CTTRANSIT unveiled its new fuel cell bus in April 2007. This was not only a first for the agency, but also was the first fuel cell bus to be operated in New England. Prior to this demonstration, most fuel cell buses in the United States were used in demonstration projects in California. CTTRANSIT’s bus design was leveraged from an earlier procurement of four fuel cell buses now in operation at AC Transit and SunLine in California. Testing the bus in Connecticut provides the project partners the opportunity to understand how the system operates in a cold and hot/ humid climate. Table B-2 lists the partners involved in the project and their respective roles.
Table B-2. Fuel Cell Bus Demonstration Partners
Demonstration Partner Role Federal Transit Administration Project funding through a grant Greater Hartford Transit District Administration for FTA grant and UTC Power contract ConnDOT Funding for the bus operation Van Hool Bus of Belgium Manufacturer of the bus body and chassis UTC Power of Connecticut Manufacturer of the fuel cell power systems
ISE Corporation of San Diego Integrator of the fuel cell power systems and hybrid-electric drive systems
AC Transit of Oakland Provide hydrogen safety training and consulting
For several key reasons, CTTRANSIT is an important choice for demonstrating fuel cell technology. Nearly all of the previous fuel cell bus demonstrations in the United States have been in warm-weather climates, and Hartford, Connecticut, provides a colder climate. This climate can be an issue because of the potential for water in the fuel cell systems to freeze and other related issues, such as problems with propulsion system operation in adverse weather conditions. Past experience in demonstrating new technologies has given the agency an awareness of what to expect and insight regarding how these issues could arise in such projects.
6 Demonstration and Evaluation of Hybrid Diesel-Electric Transit Buses, Connecticut Academy of Science and Engineering, Oct. 2005, www.ctcase.org/reports/diesel-hybrid.pdf.
7
CTTRANSIT management and staff understand the need to work with the manufacturers to optimize and develop a product further.
One of the most significant reasons for its selection has been CTTRANSIT’s close proximity to the location of the fuel cell manufacturer, UTC Power. This proximity enabled easy and fast access to the bus as needed. UTC Power has enriched its fuel cell bus development program further by periodically collecting additional diagnostic data and evaluating possible design enhancements on the CTTRANSIT bus while at UTC Power’s facility. This approach is more cost effective and resulted in far fewer service disruptions than if the fuel cell power units from distant sites were sent back to the UTC Power facility for the same work. The only other option would be to complete all needed testing in the field—which is difficult, based on the complexity of fuel cell power systems and components integrated into the buses.
An extremely important reason for demonstrating fuel cell buses at CTTRANSIT is the support of the State of Connecticut. Environmental issues have been an important driver for transportation projects and programs in the state. Over the past few years, Connecticut has worked to exceed the federal regulations set by the Clean Air Act Amendments to address the concerns of poor air quality and climate change. The state’s efforts include the following:
• In 2001, the New England governors and Eastern Canadian premiers adopted a regional climate-change action plan to reduce greenhouse gasses.
• In 2004, Connecticut passed An Act Concerning Climate Change (Public Act 04-252) and became the first state to develop an action plan to address climate-change issues7
• In December 2004, the state adopted California LEV-II vehicle emissions regulations, set to begin with the 2008 model year.
.
• In 2005, established the Connecticut Hydrogen-Fuel Cell Coalition (www.chfcc.org/) to advance the development, manufacture, and deployment of fuel cell and hydrogen technologies and associated fueling systems in Connecticut.
• In May 2006, Public Act 06-1878
• In January 2008, the Fuel Cell Economic Development Plan—Hydrogen Roadmap
: The Roadmap to Connecticut’s Economic Future was signed into law. This Act requires the state to investigate the economic potential for hydrogen technology and to develop a roadmap to facilitate the commercialization of fuel cells and hydrogen-based technologies.
9
7 Connecticut Climate Change Action Plan,
was submitted to the Department of Economic and Community Development by the Connecticut Center for Advanced Technologies. The plan includes recommendations to increase the number of fuel cell buses in operation in the state. CTTRANSIT expects to participate in the activities from this plan.
http://ctclimatechange.com/StateActionPlan.html. 8 Public Act 06-187, The Roadmap to Connecticut’s Economic Future, www.cga.ct.gov/2006/ACT/PA/2006PA-00187-R00HB-05846-PA.htm. 9 Roadmap, www.ct.gov/ecd/cwp/view.asp?Q=410448&A=1105.
8
• In June 2008, Public Act 08-98: An Act Concerning Connecticut Global Warming Solutions was signed into law. This Act requires the state to create a program and schedule to reduce greenhouse gas emissions in the state.
9
Appendix C: Evaluation Bus Technology Descriptions
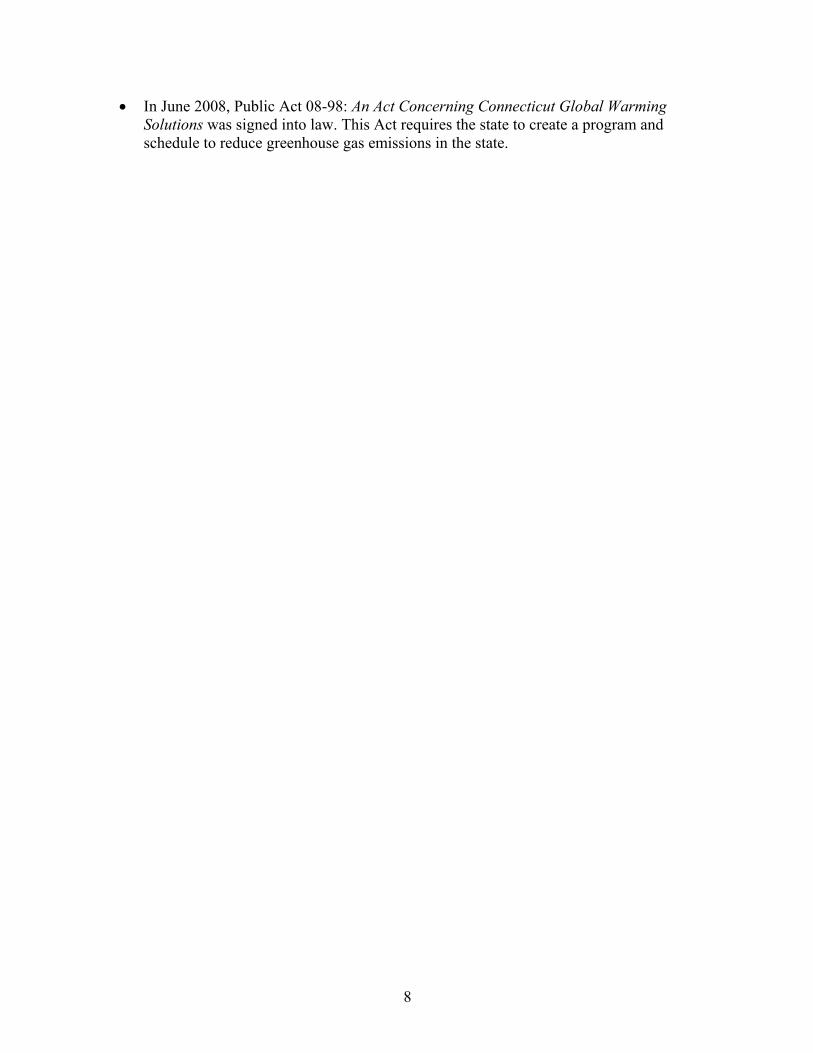
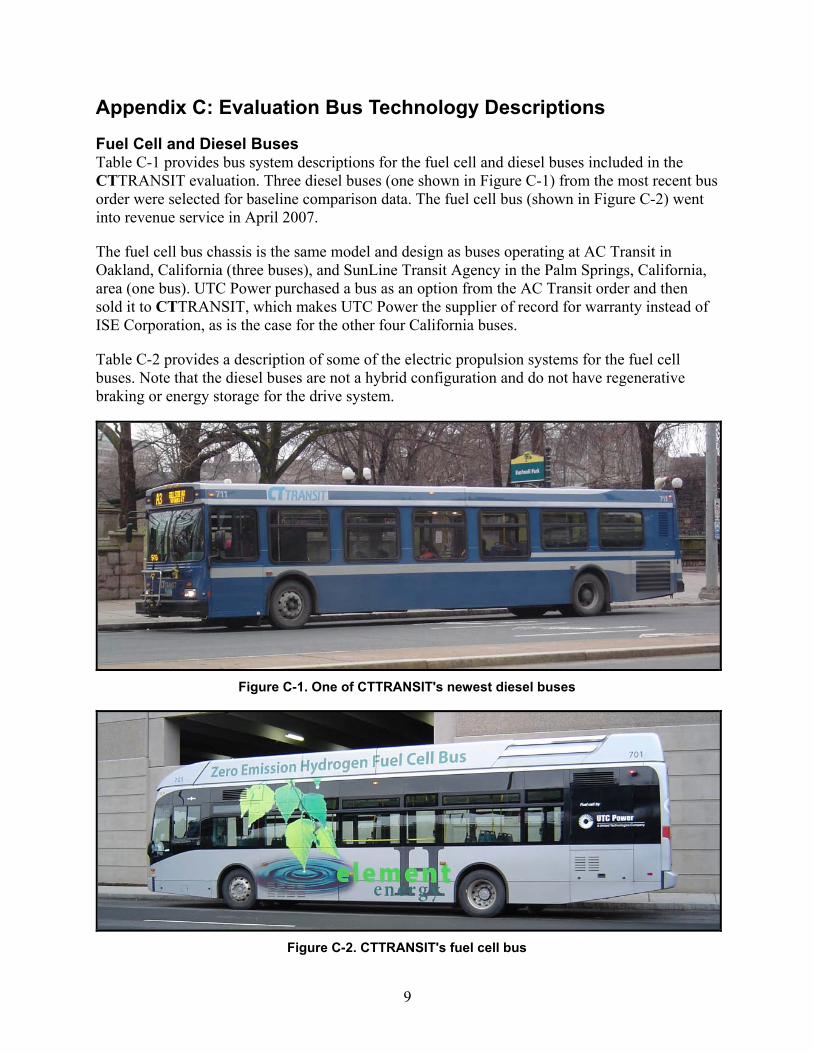
Fuel Cell and Diesel Buses Table C-1 provides bus system descriptions for the fuel cell and diesel buses included in the CTTRANSIT evaluation. Three diesel buses (one shown in Figure C-1) from the most recent bus order were selected for baseline comparison data. The fuel cell bus (shown in Figure C-2) went into revenue service in April 2007.
The fuel cell bus chassis is the same model and design as buses operating at AC Transit in Oakland, California (three buses), and SunLine Transit Agency in the Palm Springs, California, area (one bus). UTC Power purchased a bus as an option from the AC Transit order and then sold it to CTTRANSIT, which makes UTC Power the supplier of record for warranty instead of ISE Corporation, as is the case for the other four California buses.
Table C-2 provides a description of some of the electric propulsion systems for the fuel cell buses. Note that the diesel buses are not a hybrid configuration and do not have regenerative braking or energy storage for the drive system.
Figure C-1. One of CTTRANSIT's newest diesel buses
Figure C-2. CTTRANSIT's fuel cell bus
10
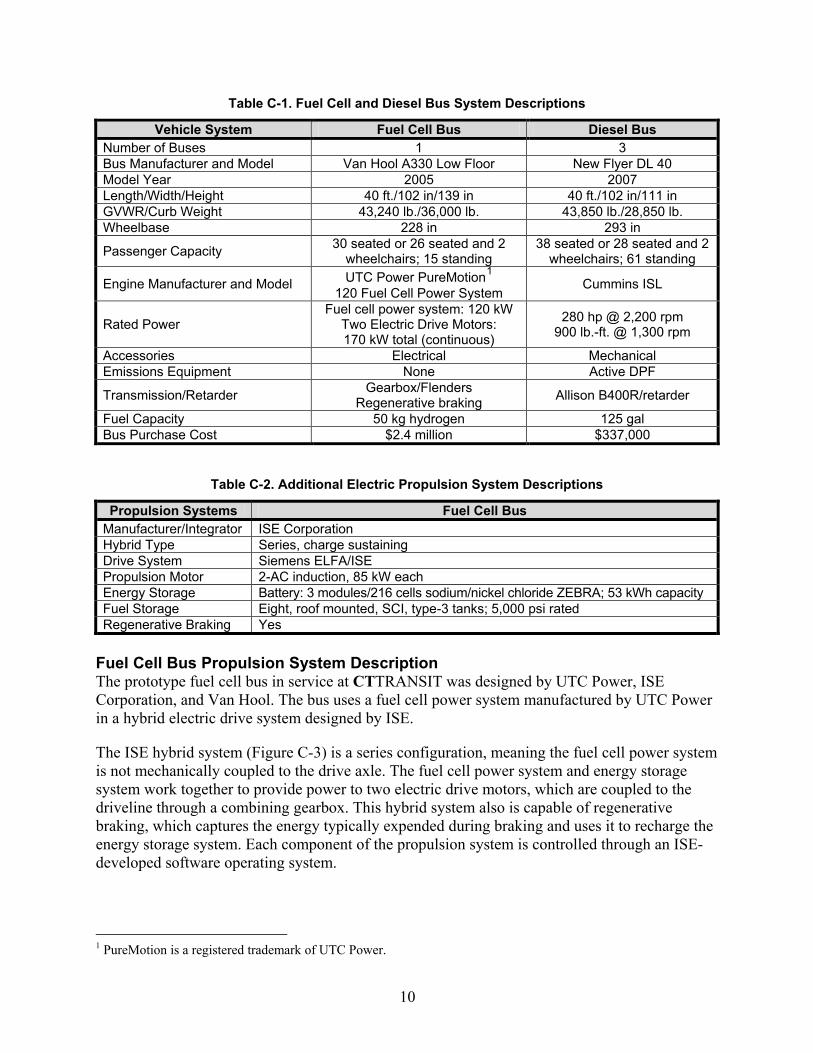
Table C-1. Fuel Cell and Diesel Bus System Descriptions
Vehicle System Fuel Cell Bus Diesel Bus Number of Buses 1 3 Bus Manufacturer and Model Van Hool A330 Low Floor New Flyer DL 40 Model Year 2005 2007 Length/Width/Height 40 ft./102 in/139 in 40 ft./102 in/111 in GVWR/Curb Weight 43,240 lb./36,000 lb. 43,850 lb./28,850 lb. Wheelbase 228 in 293 in
Passenger Capacity 30 seated or 26 seated and 2 wheelchairs; 15 standing
38 seated or 28 seated and 2 wheelchairs; 61 standing
Engine Manufacturer and Model UTC Power PureMotion1Cummins ISL
120 Fuel Cell Power System
Rated Power Fuel cell power system: 120 kW
Two Electric Drive Motors: 170 kW total (continuous)
280 hp @ 2,200 rpm 900 lb.-ft. @ 1,300 rpm
Accessories Electrical Mechanical Emissions Equipment None Active DPF
Transmission/Retarder Gearbox/Flenders Regenerative braking Allison B400R/retarder
Fuel Capacity 50 kg hydrogen 125 gal Bus Purchase Cost $2.4 million $337,000
Table C-2. Additional Electric Propulsion System Descriptions
Propulsion Systems Fuel Cell Bus Manufacturer/Integrator ISE Corporation Hybrid Type Series, charge sustaining Drive System Siemens ELFA/ISE Propulsion Motor 2-AC induction, 85 kW each Energy Storage Battery: 3 modules/216 cells sodium/nickel chloride ZEBRA; 53 kWh capacity Fuel Storage Eight, roof mounted, SCI, type-3 tanks; 5,000 psi rated Regenerative Braking Yes
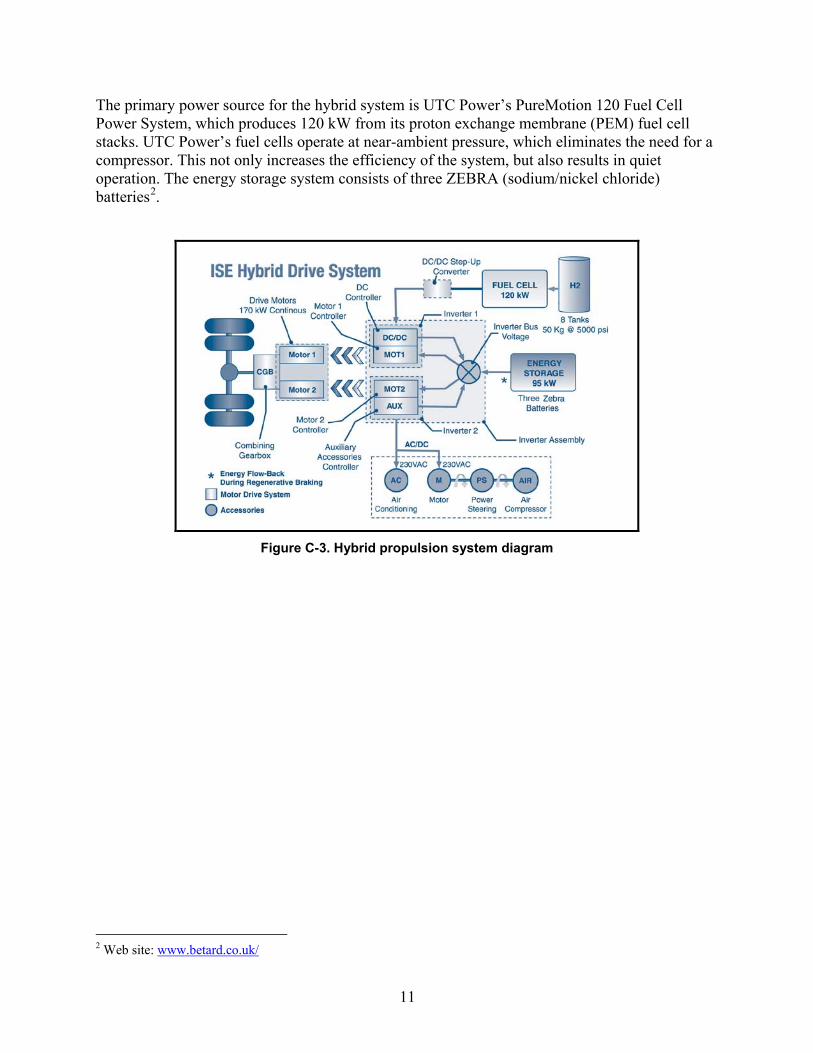
Fuel Cell Bus Propulsion System Description The prototype fuel cell bus in service at CTTRANSIT was designed by UTC Power, ISE Corporation, and Van Hool. The bus uses a fuel cell power system manufactured by UTC Power in a hybrid electric drive system designed by ISE.
The ISE hybrid system (Figure C-3) is a series configuration, meaning the fuel cell power system is not mechanically coupled to the drive axle. The fuel cell power system and energy storage system work together to provide power to two electric drive motors, which are coupled to the driveline through a combining gearbox. This hybrid system also is capable of regenerative braking, which captures the energy typically expended during braking and uses it to recharge the energy storage system. Each component of the propulsion system is controlled through an ISE-developed software operating system.
1 PureMotion is a registered trademark of UTC Power.
11
The primary power source for the hybrid system is UTC Power’s PureMotion 120 Fuel Cell Power System, which produces 120 kW from its proton exchange membrane (PEM) fuel cell stacks. UTC Power’s fuel cells operate at near-ambient pressure, which eliminates the need for a compressor. This not only increases the efficiency of the system, but also results in quiet operation. The energy storage system consists of three ZEBRA (sodium/nickel chloride) batteries2
.
Figure C-3. Hybrid propulsion system diagram
2 Web site: www.betard.co.uk/
12
Appendix D: Evaluation Infrastructure Description
Facilities CTTRANSIT manages the day-to-day operations for the Hartford Division buses from its facility located a few miles north of the downtown city center. The site includes offices for management and staff as well as maintenance bays, a bus wash, and indoor bus parking. To demonstrate the fuel cell bus, CTTRANSIT needed to address hydrogen fueling infrastructure and modifications to existing facilities for safe storage and maintenance of the bus. For past fuel cell bus projects, this has proved to be one of the most challenging aspects of the demonstration. CTTRANSIT’s ease in accomplishing this portion of the project is a striking contrast to other transit agency experience.
CTTRANSIT Maintenance Facility Modifications – At the onset of the project, CTTRANSIT hired a consultant to investigate what modifications were necessary to enable a hydrogen vehicle to be operated, maintained, and parked in the existing bus facility. Recommendations from the consultant included an upgraded ventilation system, fuel sensors, and alarms. Total cost for the upgrades (including the consultant’s fee) was $150,000. CTTRANSIT worked closely with local fire officials early in the process and was not required to make extensive electrical or ventilation upgrades. This fuel cell bus design includes the ability to move the bus on electric power only—the hydrogen and fuel cell system is temporarily disabled. Because of this, the upgrades required by local officials were simple and inexpensive, and the fuel cell bus must be operated in electric-only mode while inside the facility.
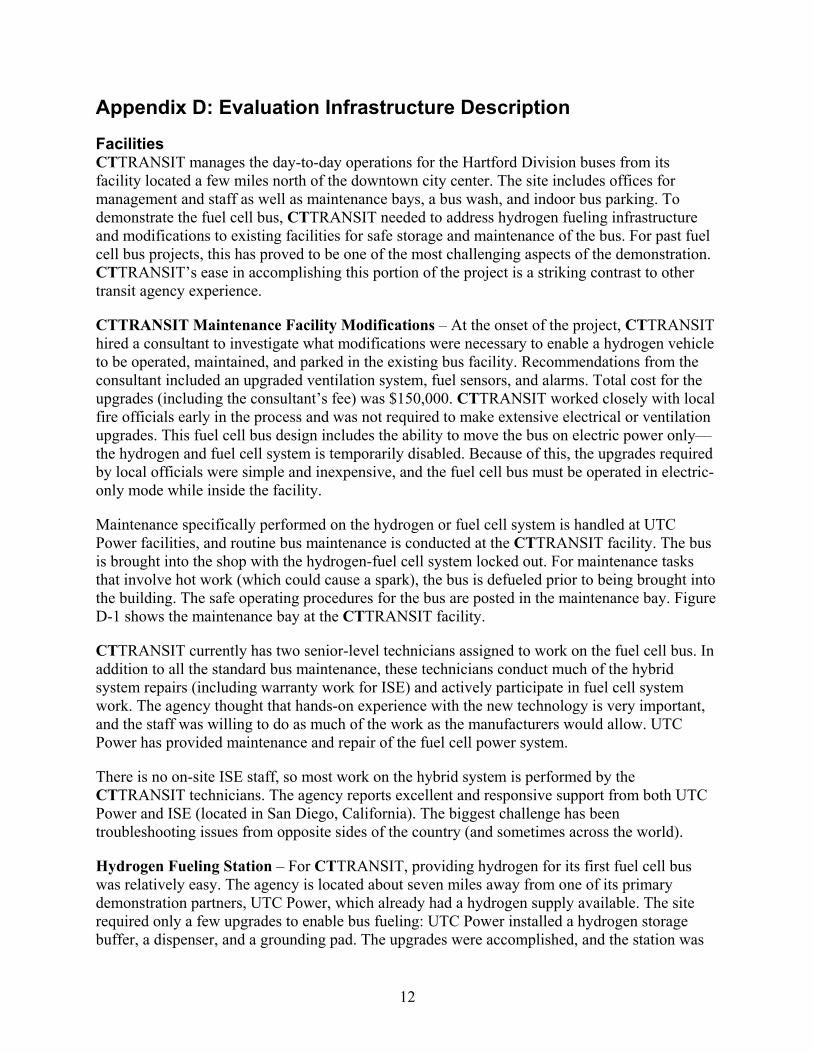
Maintenance specifically performed on the hydrogen or fuel cell system is handled at UTC Power facilities, and routine bus maintenance is conducted at the CTTRANSIT facility. The bus is brought into the shop with the hydrogen-fuel cell system locked out. For maintenance tasks that involve hot work (which could cause a spark), the bus is defueled prior to being brought into the building. The safe operating procedures for the bus are posted in the maintenance bay. Figure D-1 shows the maintenance bay at the CTTRANSIT facility.
CTTRANSIT currently has two senior-level technicians assigned to work on the fuel cell bus. In addition to all the standard bus maintenance, these technicians conduct much of the hybrid system repairs (including warranty work for ISE) and actively participate in fuel cell system work. The agency thought that hands-on experience with the new technology is very important, and the staff was willing to do as much of the work as the manufacturers would allow. UTC Power has provided maintenance and repair of the fuel cell power system.
There is no on-site ISE staff, so most work on the hybrid system is performed by the CTTRANSIT technicians. The agency reports excellent and responsive support from both UTC Power and ISE (located in San Diego, California). The biggest challenge has been troubleshooting issues from opposite sides of the country (and sometimes across the world).
Hydrogen Fueling Station – For CTTRANSIT, providing hydrogen for its first fuel cell bus was relatively easy. The agency is located about seven miles away from one of its primary demonstration partners, UTC Power, which already had a hydrogen supply available. The site required only a few upgrades to enable bus fueling: UTC Power installed a hydrogen storage buffer, a dispenser, and a grounding pad. The upgrades were accomplished, and the station was
13
ready for bus fueling by March 2007. The funding for the upgrade was provided through an FTA grant.
Figure D-1. CTTRANSIT fuel cell bus maintenance bay (lower left), operating procedures (upper
left), and alarm control system (right)
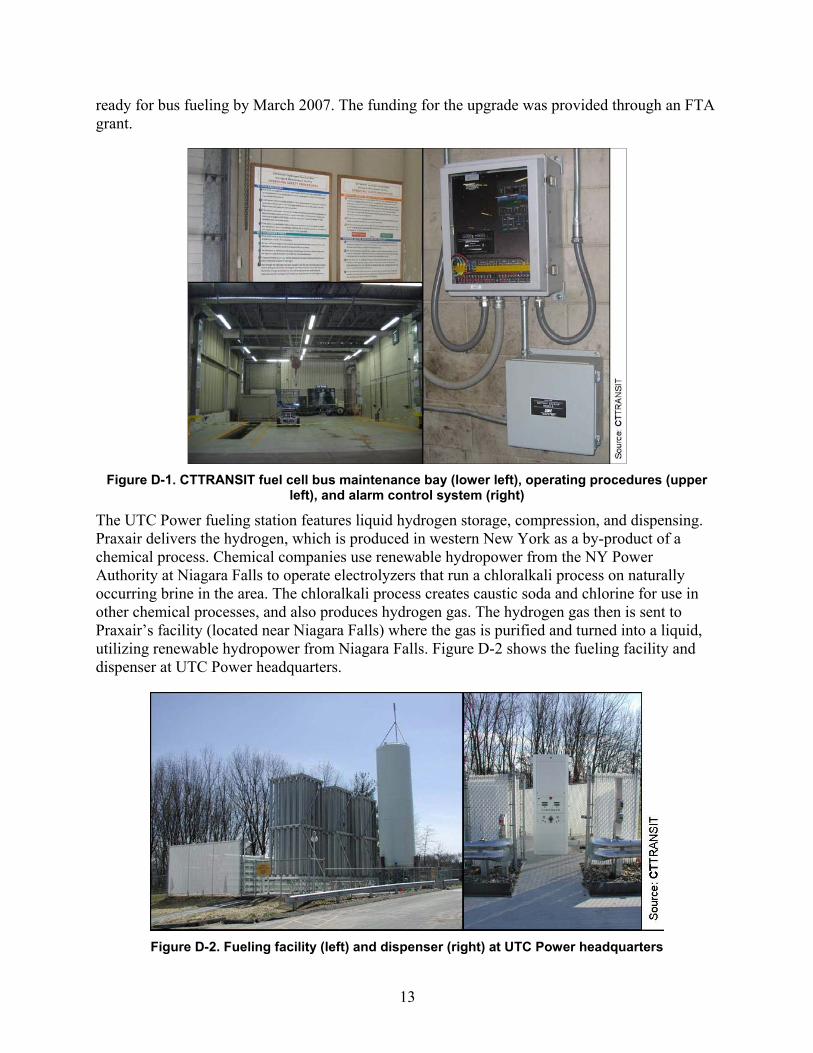
The UTC Power fueling station features liquid hydrogen storage, compression, and dispensing. Praxair delivers the hydrogen, which is produced in western New York as a by-product of a chemical process. Chemical companies use renewable hydropower from the NY Power Authority at Niagara Falls to operate electrolyzers that run a chloralkali process on naturally occurring brine in the area. The chloralkali process creates caustic soda and chlorine for use in other chemical processes, and also produces hydrogen gas. The hydrogen gas then is sent to Praxair’s facility (located near Niagara Falls) where the gas is purified and turned into a liquid, utilizing renewable hydropower from Niagara Falls. Figure D-2 shows the fueling facility and dispenser at UTC Power headquarters.
Figure D-2. Fueling facility (left) and dispenser (right) at UTC Power headquarters
14
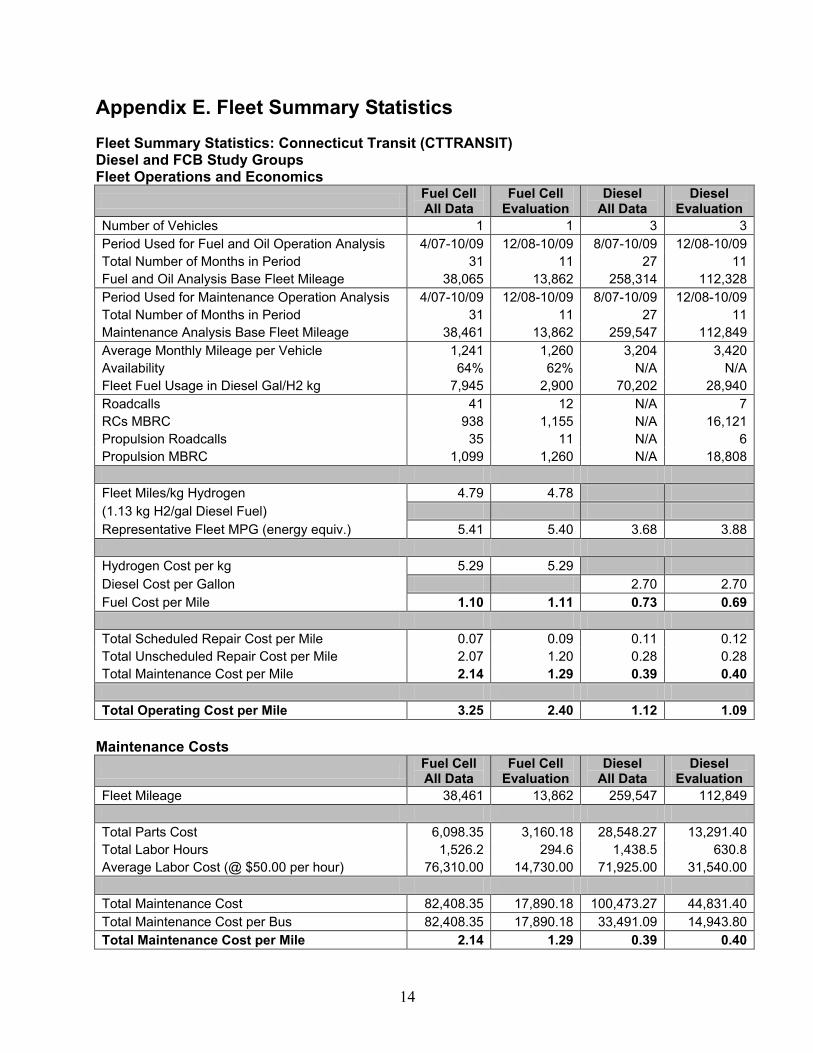
Appendix E. Fleet Summary Statistics Fleet Summary Statistics: Connecticut Transit (CTTRANSIT) Diesel and FCB Study Groups Fleet Operations and Economics Fuel Cell
All Data Fuel Cell
Evaluation Diesel
All Data Diesel
Evaluation Number of Vehicles 1 1 3 3 Period Used for Fuel and Oil Operation Analysis 4/07-10/09 12/08-10/09 8/07-10/09 12/08-10/09 Total Number of Months in Period 31 11 27 11 Fuel and Oil Analysis Base Fleet Mileage 38,065 13,862 258,314 112,328 Period Used for Maintenance Operation Analysis 4/07-10/09 12/08-10/09 8/07-10/09 12/08-10/09 Total Number of Months in Period 31 11 27 11 Maintenance Analysis Base Fleet Mileage 38,461 13,862 259,547 112,849 Average Monthly Mileage per Vehicle 1,241 1,260 3,204 3,420 Availability 64% 62% N/A N/A Fleet Fuel Usage in Diesel Gal/H2 kg 7,945 2,900 70,202 28,940 Roadcalls 41 12 N/A 7 RCs MBRC 938 1,155 N/A 16,121 Propulsion Roadcalls 35 11 N/A 6 Propulsion MBRC 1,099 1,260 N/A 18,808 Fleet Miles/kg Hydrogen 4.79 4.78 (1.13 kg H2/gal Diesel Fuel) Representative Fleet MPG (energy equiv.) 5.41 5.40 3.68 3.88 Hydrogen Cost per kg 5.29 5.29 Diesel Cost per Gallon 2.70 2.70 Fuel Cost per Mile 1.10 1.11 0.73 0.69 Total Scheduled Repair Cost per Mile 0.07 0.09 0.11 0.12 Total Unscheduled Repair Cost per Mile 2.07 1.20 0.28 0.28 Total Maintenance Cost per Mile 2.14 1.29 0.39 0.40 Total Operating Cost per Mile 3.25 2.40 1.12 1.09
Maintenance Costs Fuel Cell
All Data Fuel Cell
Evaluation Diesel
All Data Diesel
Evaluation Fleet Mileage 38,461 13,862 259,547 112,849 Total Parts Cost 6,098.35 3,160.18 28,548.27 13,291.40 Total Labor Hours 1,526.2 294.6 1,438.5 630.8 Average Labor Cost (@ $50.00 per hour) 76,310.00 14,730.00 71,925.00 31,540.00 Total Maintenance Cost 82,408.35 17,890.18 100,473.27 44,831.40 Total Maintenance Cost per Bus 82,408.35 17,890.18 33,491.09 14,943.80 Total Maintenance Cost per Mile 2.14 1.29 0.39 0.40
15
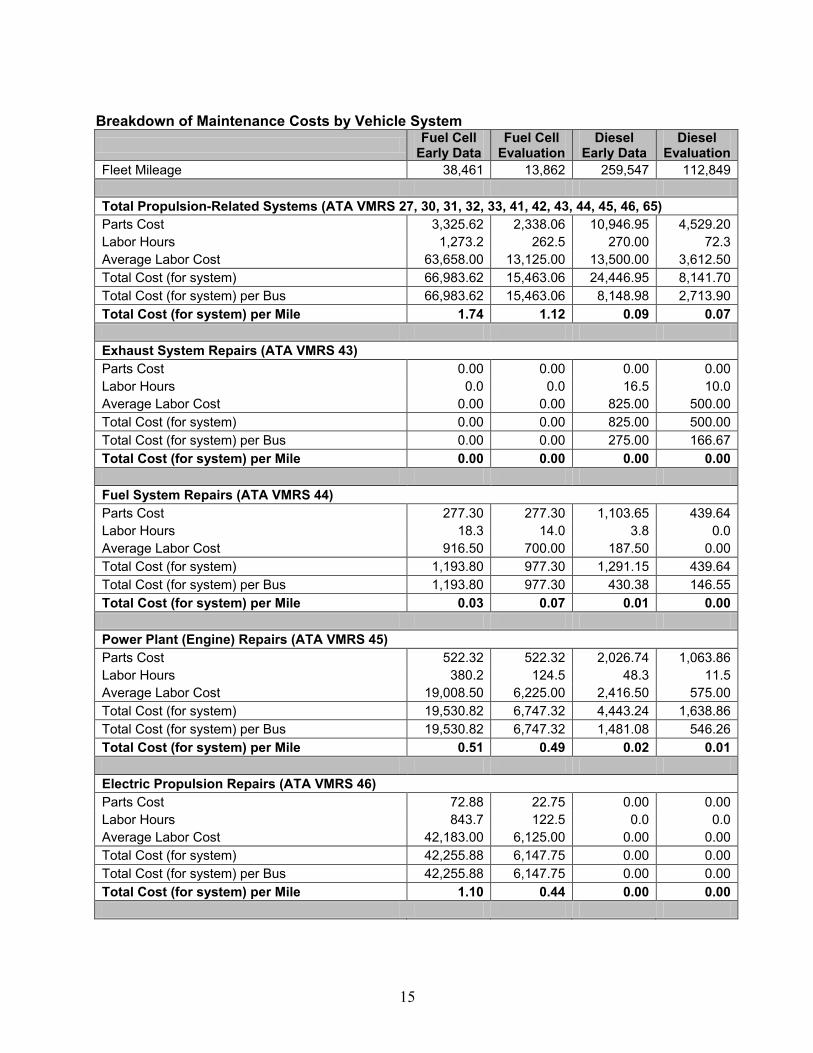
Breakdown of Maintenance Costs by Vehicle System Fuel Cell
Early Data Fuel Cell
Evaluation Diesel
Early Data Diesel
Evaluation Fleet Mileage 38,461 13,862 259,547 112,849 Total Propulsion-Related Systems (ATA VMRS 27, 30, 31, 32, 33, 41, 42, 43, 44, 45, 46, 65) Parts Cost 3,325.62 2,338.06 10,946.95 4,529.20 Labor Hours 1,273.2 262.5 270.00 72.3 Average Labor Cost 63,658.00 13,125.00 13,500.00 3,612.50 Total Cost (for system) 66,983.62 15,463.06 24,446.95 8,141.70 Total Cost (for system) per Bus 66,983.62 15,463.06 8,148.98 2,713.90 Total Cost (for system) per Mile 1.74 1.12 0.09 0.07 Exhaust System Repairs (ATA VMRS 43) Parts Cost 0.00 0.00 0.00 0.00 Labor Hours 0.0 0.0 16.5 10.0 Average Labor Cost 0.00 0.00 825.00 500.00 Total Cost (for system) 0.00 0.00 825.00 500.00 Total Cost (for system) per Bus 0.00 0.00 275.00 166.67 Total Cost (for system) per Mile 0.00 0.00 0.00 0.00 Fuel System Repairs (ATA VMRS 44) Parts Cost 277.30 277.30 1,103.65 439.64 Labor Hours 18.3 14.0 3.8 0.0 Average Labor Cost 916.50 700.00 187.50 0.00 Total Cost (for system) 1,193.80 977.30 1,291.15 439.64 Total Cost (for system) per Bus 1,193.80 977.30 430.38 146.55 Total Cost (for system) per Mile 0.03 0.07 0.01 0.00 Power Plant (Engine) Repairs (ATA VMRS 45) Parts Cost 522.32 522.32 2,026.74 1,063.86 Labor Hours 380.2 124.5 48.3 11.5 Average Labor Cost 19,008.50 6,225.00 2,416.50 575.00 Total Cost (for system) 19,530.82 6,747.32 4,443.24 1,638.86 Total Cost (for system) per Bus 19,530.82 6,747.32 1,481.08 546.26 Total Cost (for system) per Mile 0.51 0.49 0.02 0.01 Electric Propulsion Repairs (ATA VMRS 46) Parts Cost 72.88 22.75 0.00 0.00 Labor Hours 843.7 122.5 0.0 0.0 Average Labor Cost 42,183.00 6,125.00 0.00 0.00 Total Cost (for system) 42,255.88 6,147.75 0.00 0.00 Total Cost (for system) per Bus 42,255.88 6,147.75 0.00 0.00 Total Cost (for system) per Mile 1.10 0.44 0.00 0.00
16
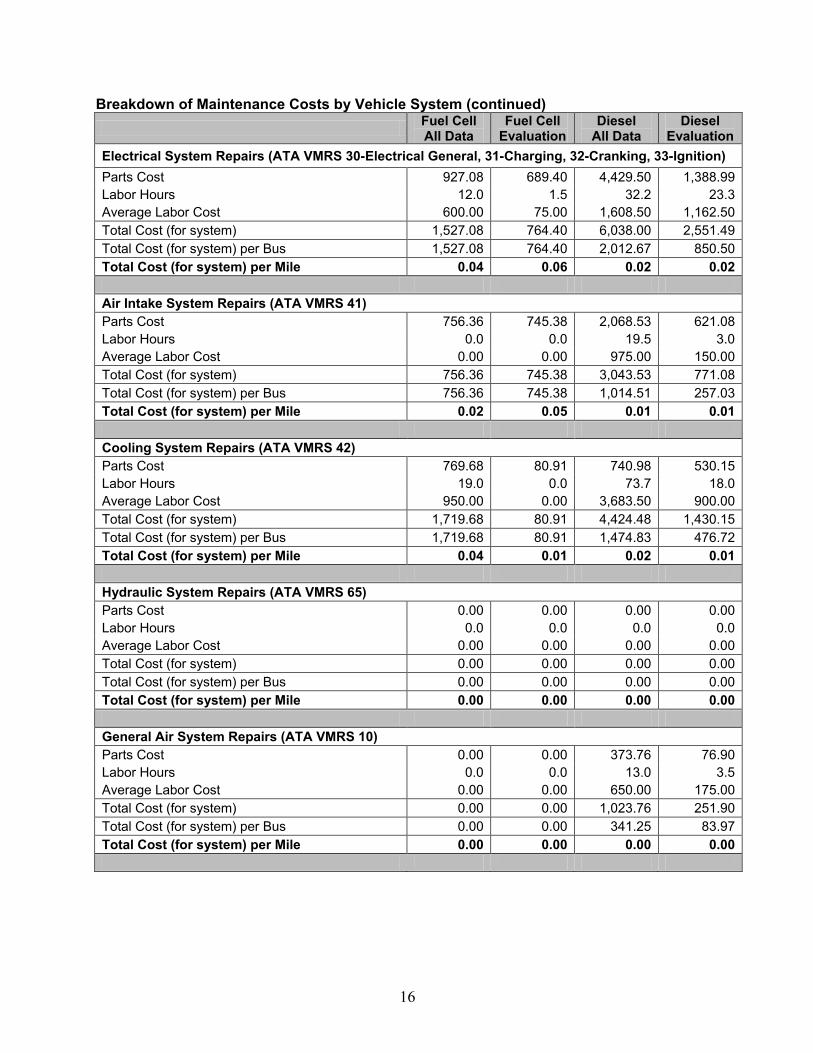
Breakdown of Maintenance Costs by Vehicle System (continued) Fuel Cell
All Data Fuel Cell
Evaluation Diesel
All Data Diesel
Evaluation Electrical System Repairs (ATA VMRS 30-Electrical General, 31-Charging, 32-Cranking, 33-Ignition) Parts Cost 927.08 689.40 4,429.50 1,388.99 Labor Hours 12.0 1.5 32.2 23.3 Average Labor Cost 600.00 75.00 1,608.50 1,162.50 Total Cost (for system) 1,527.08 764.40 6,038.00 2,551.49 Total Cost (for system) per Bus 1,527.08 764.40 2,012.67 850.50 Total Cost (for system) per Mile 0.04 0.06 0.02 0.02 Air Intake System Repairs (ATA VMRS 41) Parts Cost 756.36 745.38 2,068.53 621.08 Labor Hours 0.0 0.0 19.5 3.0 Average Labor Cost 0.00 0.00 975.00 150.00 Total Cost (for system) 756.36 745.38 3,043.53 771.08 Total Cost (for system) per Bus 756.36 745.38 1,014.51 257.03 Total Cost (for system) per Mile 0.02 0.05 0.01 0.01 Cooling System Repairs (ATA VMRS 42) Parts Cost 769.68 80.91 740.98 530.15 Labor Hours 19.0 0.0 73.7 18.0 Average Labor Cost 950.00 0.00 3,683.50 900.00 Total Cost (for system) 1,719.68 80.91 4,424.48 1,430.15 Total Cost (for system) per Bus 1,719.68 80.91 1,474.83 476.72 Total Cost (for system) per Mile 0.04 0.01 0.02 0.01 Hydraulic System Repairs (ATA VMRS 65) Parts Cost 0.00 0.00 0.00 0.00 Labor Hours 0.0 0.0 0.0 0.0 Average Labor Cost 0.00 0.00 0.00 0.00 Total Cost (for system) 0.00 0.00 0.00 0.00 Total Cost (for system) per Bus 0.00 0.00 0.00 0.00 Total Cost (for system) per Mile 0.00 0.00 0.00 0.00 General Air System Repairs (ATA VMRS 10) Parts Cost 0.00 0.00 373.76 76.90 Labor Hours 0.0 0.0 13.0 3.5 Average Labor Cost 0.00 0.00 650.00 175.00 Total Cost (for system) 0.00 0.00 1,023.76 251.90 Total Cost (for system) per Bus 0.00 0.00 341.25 83.97 Total Cost (for system) per Mile 0.00 0.00 0.00 0.00
17
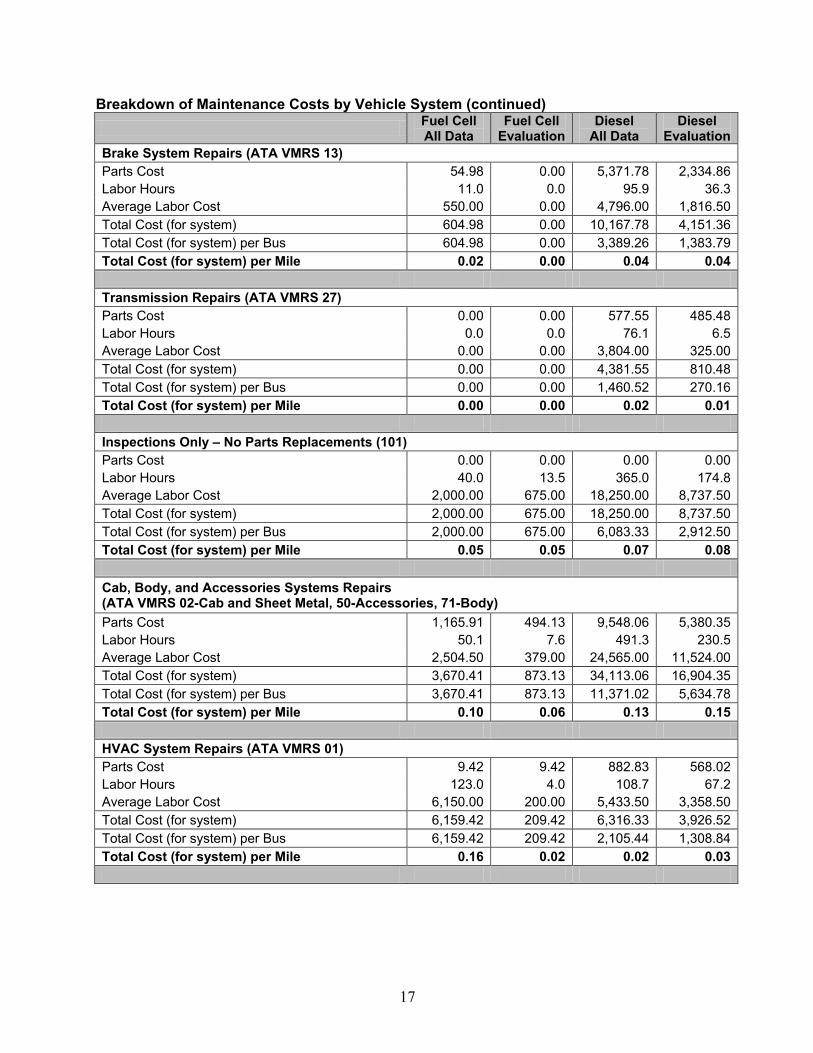
Breakdown of Maintenance Costs by Vehicle System (continued) Fuel Cell
All Data Fuel Cell
Evaluation Diesel
All Data Diesel
Evaluation Brake System Repairs (ATA VMRS 13) Parts Cost 54.98 0.00 5,371.78 2,334.86 Labor Hours 11.0 0.0 95.9 36.3 Average Labor Cost 550.00 0.00 4,796.00 1,816.50 Total Cost (for system) 604.98 0.00 10,167.78 4,151.36 Total Cost (for system) per Bus 604.98 0.00 3,389.26 1,383.79 Total Cost (for system) per Mile 0.02 0.00 0.04 0.04 Transmission Repairs (ATA VMRS 27) Parts Cost 0.00 0.00 577.55 485.48 Labor Hours 0.0 0.0 76.1 6.5 Average Labor Cost 0.00 0.00 3,804.00 325.00 Total Cost (for system) 0.00 0.00 4,381.55 810.48 Total Cost (for system) per Bus 0.00 0.00 1,460.52 270.16 Total Cost (for system) per Mile 0.00 0.00 0.02 0.01 Inspections Only – No Parts Replacements (101) Parts Cost 0.00 0.00 0.00 0.00 Labor Hours 40.0 13.5 365.0 174.8 Average Labor Cost 2,000.00 675.00 18,250.00 8,737.50 Total Cost (for system) 2,000.00 675.00 18,250.00 8,737.50 Total Cost (for system) per Bus 2,000.00 675.00 6,083.33 2,912.50 Total Cost (for system) per Mile 0.05 0.05 0.07 0.08 Cab, Body, and Accessories Systems Repairs (ATA VMRS 02-Cab and Sheet Metal, 50-Accessories, 71-Body) Parts Cost 1,165.91 494.13 9,548.06 5,380.35 Labor Hours 50.1 7.6 491.3 230.5 Average Labor Cost 2,504.50 379.00 24,565.00 11,524.00 Total Cost (for system) 3,670.41 873.13 34,113.06 16,904.35 Total Cost (for system) per Bus 3,670.41 873.13 11,371.02 5,634.78 Total Cost (for system) per Mile 0.10 0.06 0.13 0.15 HVAC System Repairs (ATA VMRS 01) Parts Cost 9.42 9.42 882.83 568.02 Labor Hours 123.0 4.0 108.7 67.2 Average Labor Cost 6,150.00 200.00 5,433.50 3,358.50 Total Cost (for system) 6,159.42 209.42 6,316.33 3,926.52 Total Cost (for system) per Bus 6,159.42 209.42 2,105.44 1,308.84 Total Cost (for system) per Mile 0.16 0.02 0.02 0.03
18
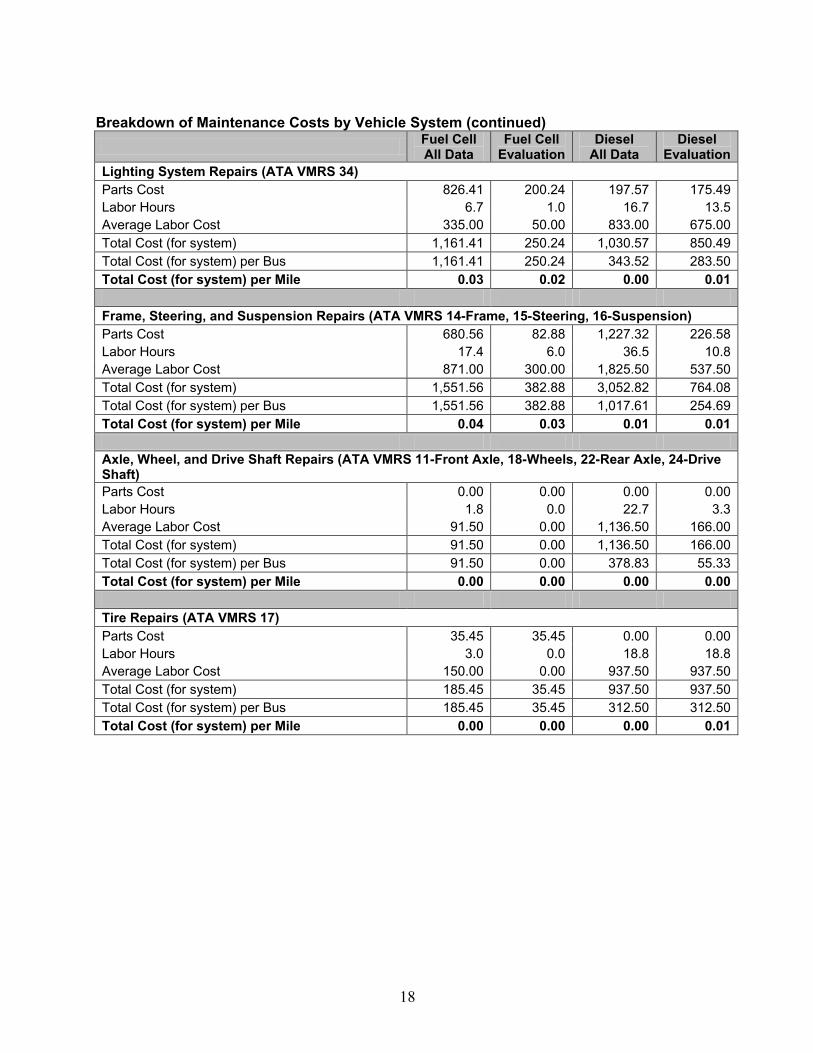
Breakdown of Maintenance Costs by Vehicle System (continued)
Fuel Cell All Data
Fuel Cell Evaluation
Diesel All Data
Diesel Evaluation
Lighting System Repairs (ATA VMRS 34) Parts Cost 826.41 200.24 197.57 175.49 Labor Hours 6.7 1.0 16.7 13.5 Average Labor Cost 335.00 50.00 833.00 675.00 Total Cost (for system) 1,161.41 250.24 1,030.57 850.49 Total Cost (for system) per Bus 1,161.41 250.24 343.52 283.50 Total Cost (for system) per Mile 0.03 0.02 0.00 0.01 Frame, Steering, and Suspension Repairs (ATA VMRS 14-Frame, 15-Steering, 16-Suspension) Parts Cost 680.56 82.88 1,227.32 226.58 Labor Hours 17.4 6.0 36.5 10.8 Average Labor Cost 871.00 300.00 1,825.50 537.50 Total Cost (for system) 1,551.56 382.88 3,052.82 764.08 Total Cost (for system) per Bus 1,551.56 382.88 1,017.61 254.69 Total Cost (for system) per Mile 0.04 0.03 0.01 0.01 Axle, Wheel, and Drive Shaft Repairs (ATA VMRS 11-Front Axle, 18-Wheels, 22-Rear Axle, 24-Drive Shaft) Parts Cost 0.00 0.00 0.00 0.00 Labor Hours 1.8 0.0 22.7 3.3 Average Labor Cost 91.50 0.00 1,136.50 166.00 Total Cost (for system) 91.50 0.00 1,136.50 166.00 Total Cost (for system) per Bus 91.50 0.00 378.83 55.33 Total Cost (for system) per Mile 0.00 0.00 0.00 0.00 Tire Repairs (ATA VMRS 17) Parts Cost 35.45 35.45 0.00 0.00 Labor Hours 3.0 0.0 18.8 18.8 Average Labor Cost 150.00 0.00 937.50 937.50 Total Cost (for system) 185.45 35.45 937.50 937.50 Total Cost (for system) per Bus 185.45 35.45 312.50 312.50 Total Cost (for system) per Mile 0.00 0.00 0.00 0.01
19
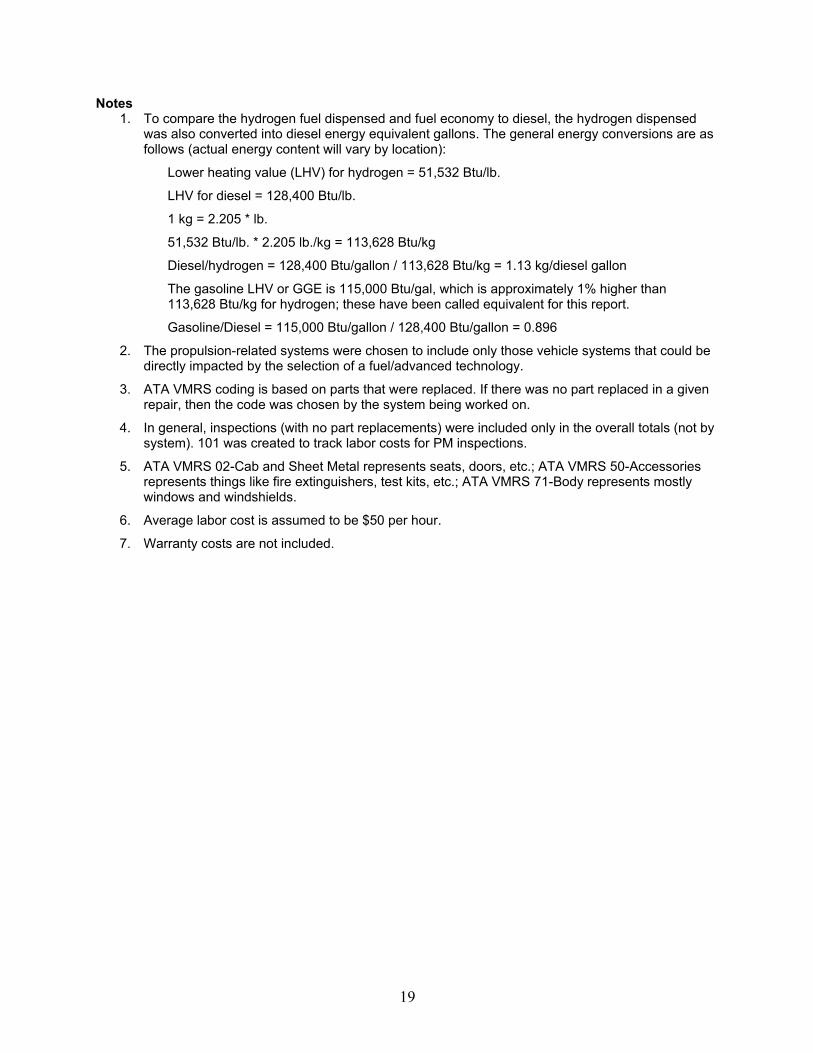
Notes 1. To compare the hydrogen fuel dispensed and fuel economy to diesel, the hydrogen dispensed
was also converted into diesel energy equivalent gallons. The general energy conversions are as follows (actual energy content will vary by location):
Lower heating value (LHV) for hydrogen = 51,532 Btu/lb.
LHV for diesel = 128,400 Btu/lb.
1 kg = 2.205 * lb.
51,532 Btu/lb. * 2.205 lb./kg = 113,628 Btu/kg
Diesel/hydrogen = 128,400 Btu/gallon / 113,628 Btu/kg = 1.13 kg/diesel gallon
The gasoline LHV or GGE is 115,000 Btu/gal, which is approximately 1% higher than 113,628 Btu/kg for hydrogen; these have been called equivalent for this report.
Gasoline/Diesel = 115,000 Btu/gallon / 128,400 Btu/gallon = 0.896
2. The propulsion-related systems were chosen to include only those vehicle systems that could be directly impacted by the selection of a fuel/advanced technology.
3. ATA VMRS coding is based on parts that were replaced. If there was no part replaced in a given repair, then the code was chosen by the system being worked on.
4. In general, inspections (with no part replacements) were included only in the overall totals (not by system). 101 was created to track labor costs for PM inspections.
5. ATA VMRS 02-Cab and Sheet Metal represents seats, doors, etc.; ATA VMRS 50-Accessories represents things like fire extinguishers, test kits, etc.; ATA VMRS 71-Body represents mostly windows and windshields.
6. Average labor cost is assumed to be $50 per hour.
7. Warranty costs are not included.
20
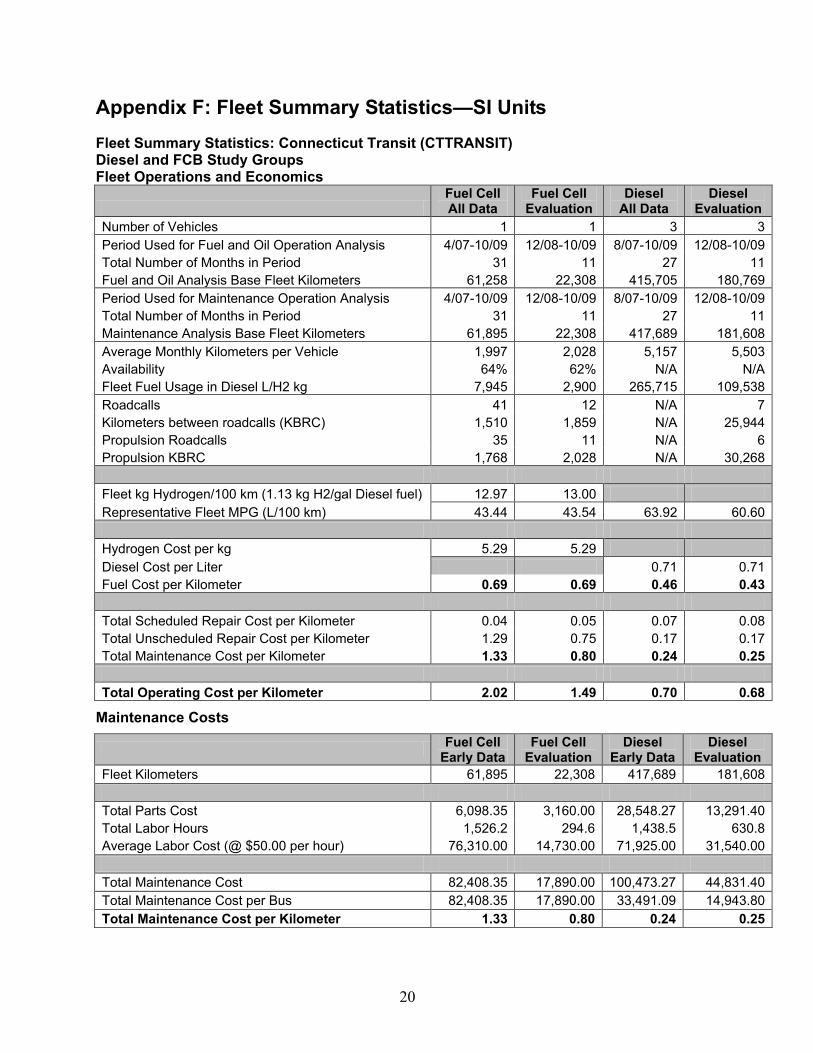
Appendix F: Fleet Summary Statistics—SI Units Fleet Summary Statistics: Connecticut Transit (CTTRANSIT) Diesel and FCB Study Groups Fleet Operations and Economics
Fuel Cell All Data
Fuel Cell Evaluation
Diesel All Data
Diesel Evaluation
Number of Vehicles 1 1 3 3 Period Used for Fuel and Oil Operation Analysis 4/07-10/09 12/08-10/09 8/07-10/09 12/08-10/09 Total Number of Months in Period 31 11 27 11 Fuel and Oil Analysis Base Fleet Kilometers 61,258 22,308 415,705 180,769 Period Used for Maintenance Operation Analysis 4/07-10/09 12/08-10/09 8/07-10/09 12/08-10/09 Total Number of Months in Period 31 11 27 11 Maintenance Analysis Base Fleet Kilometers 61,895 22,308 417,689 181,608 Average Monthly Kilometers per Vehicle 1,997 2,028 5,157 5,503 Availability 64% 62% N/A N/A Fleet Fuel Usage in Diesel L/H2 kg 7,945 2,900 265,715 109,538 Roadcalls 41 12 N/A 7 Kilometers between roadcalls (KBRC) 1,510 1,859 N/A 25,944 Propulsion Roadcalls 35 11 N/A 6 Propulsion KBRC 1,768 2,028 N/A 30,268 Fleet kg Hydrogen/100 km (1.13 kg H2/gal Diesel fuel) 12.97 13.00 Representative Fleet MPG (L/100 km) 43.44 43.54 63.92 60.60 Hydrogen Cost per kg 5.29 5.29 Diesel Cost per Liter 0.71 0.71 Fuel Cost per Kilometer 0.69 0.69 0.46 0.43 Total Scheduled Repair Cost per Kilometer 0.04 0.05 0.07 0.08 Total Unscheduled Repair Cost per Kilometer 1.29 0.75 0.17 0.17 Total Maintenance Cost per Kilometer 1.33 0.80 0.24 0.25 Total Operating Cost per Kilometer 2.02 1.49 0.70 0.68
Maintenance Costs
Fuel Cell Early Data
Fuel Cell Evaluation
Diesel Early Data
Diesel Evaluation
Fleet Kilometers 61,895 22,308 417,689 181,608 Total Parts Cost 6,098.35 3,160.00 28,548.27 13,291.40 Total Labor Hours 1,526.2 294.6 1,438.5 630.8 Average Labor Cost (@ $50.00 per hour) 76,310.00 14,730.00 71,925.00 31,540.00 Total Maintenance Cost 82,408.35 17,890.00 100,473.27 44,831.40 Total Maintenance Cost per Bus 82,408.35 17,890.00 33,491.09 14,943.80 Total Maintenance Cost per Kilometer 1.33 0.80 0.24 0.25
F1147-E(10/2008)
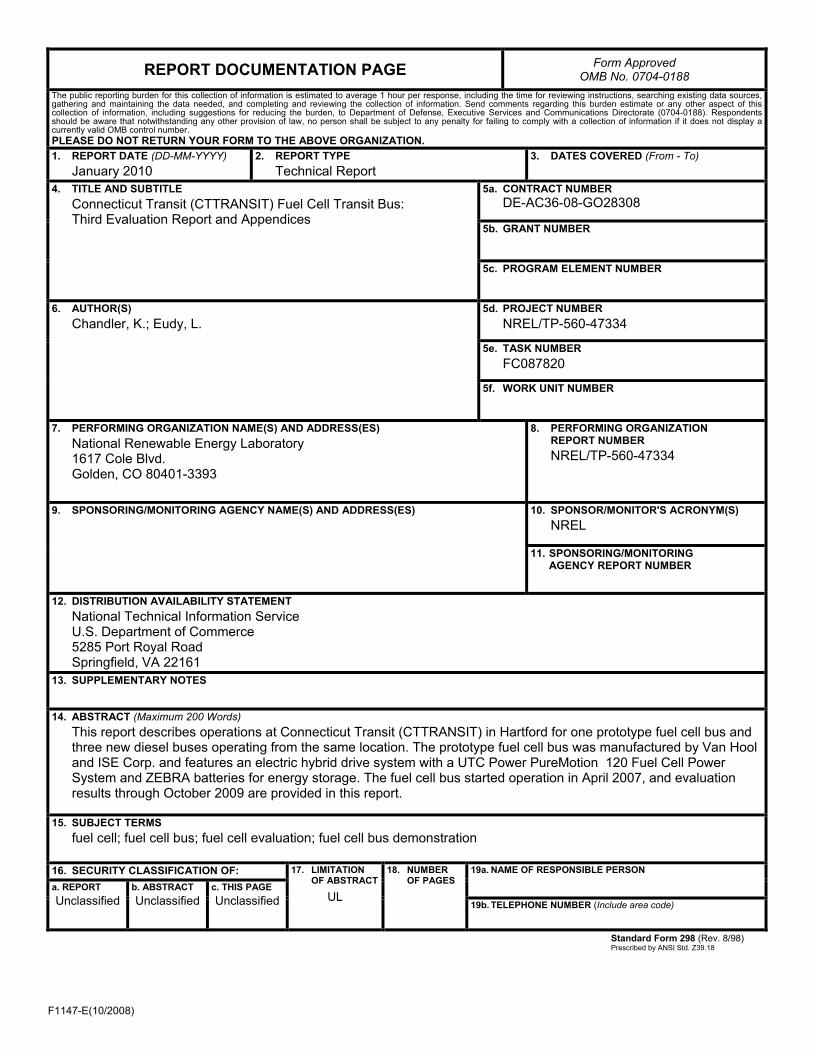
REPORT DOCUMENTATION PAGE Form Approved OMB No. 0704-0188
The public reporting burden for this collection of information is estimated to average 1 hour per response, including the time for reviewing instructions, searching existing data sources, gathering and maintaining the data needed, and completing and reviewing the collection of information. Send comments regarding this burden estimate or any other aspect of this collection of information, including suggestions for reducing the burden, to Department of Defense, Executive Services and Communications Directorate (0704-0188). Respondents should be aware that notwithstanding any other provision of law, no person shall be subject to any penalty for failing to comply with a collection of information if it does not display a currently valid OMB control number. PLEASE DO NOT RETURN YOUR FORM TO THE ABOVE ORGANIZATION. 1. REPORT DATE (DD-MM-YYYY)
January 2010 2. REPORT TYPE
Technical Report 3. DATES COVERED (From - To)
4. TITLE AND SUBTITLE
Connecticut Transit (CTTRANSIT) Fuel Cell Transit Bus: Third Evaluation Report and Appendices
5a. CONTRACT NUMBER DE-AC36-08-GO28308
5b. GRANT NUMBER
5c. PROGRAM ELEMENT NUMBER
6. AUTHOR(S) Chandler, K.; Eudy, L.
5d. PROJECT NUMBER NREL/TP-560-47334
5e. TASK NUMBER FC087820
5f. WORK UNIT NUMBER
7. PERFORMING ORGANIZATION NAME(S) AND ADDRESS(ES) National Renewable Energy Laboratory 1617 Cole Blvd. Golden, CO 80401-3393
8. PERFORMING ORGANIZATION REPORT NUMBER NREL/TP-560-47334
9. SPONSORING/MONITORING AGENCY NAME(S) AND ADDRESS(ES)
10. SPONSOR/MONITOR'S ACRONYM(S) NREL
11. SPONSORING/MONITORING AGENCY REPORT NUMBER
12. DISTRIBUTION AVAILABILITY STATEMENT National Technical Information Service U.S. Department of Commerce 5285 Port Royal Road Springfield, VA 22161
13. SUPPLEMENTARY NOTES
14. ABSTRACT (Maximum 200 Words) This report describes operations at Connecticut Transit (CTTRANSIT) in Hartford for one prototype fuel cell bus and three new diesel buses operating from the same location. The prototype fuel cell bus was manufactured by Van Hool and ISE Corp. and features an electric hybrid drive system with a UTC Power PureMotion 120 Fuel Cell Power System and ZEBRA batteries for energy storage. The fuel cell bus started operation in April 2007, and evaluation results through October 2009 are provided in this report.
15. SUBJECT TERMS fuel cell; fuel cell bus; fuel cell evaluation; fuel cell bus demonstration
16. SECURITY CLASSIFICATION OF: 17. LIMITATION OF ABSTRACT
UL
18. NUMBER OF PAGES
19a. NAME OF RESPONSIBLE PERSON a. REPORT
Unclassified b. ABSTRACT Unclassified
c. THIS PAGE Unclassified 19b. TELEPHONE NUMBER (Include area code)
Standard Form 298 (Rev. 8/98) Prescribed by ANSI Std. Z39.18