Embed Size (px)
Citation preview

ICID 21st Congress, Tehran, October 2011 R.56.5.17
209
CONJUNCTIVE USE PLANNING OF AN IRRIGATION PROJECT: SOFTWARE DEVELOPMENT
PLANIFICATION DE L’USAGE COMBINE DE L’EAU D’UN PROJET D’IRRIGATION: DEVELOPPEMENT
DU LOGICIEL
B. Das1, S.N Panda2*, H. Hollaender3 and M. Billib4
ABSTRACT
Conjunctive use of surface and groundwater is pursued in many regions to maximize water availability at the time of its need. Successful regional water management policies will identify the physical and legal constraints on these integrated supplies. To cope up with all the aforesaid constraints, a linear programming (LP) model has been developed for optimum water resources allocation and cropping pattern for effective management of land and water resources in the Hirakud Canal Command, a multi-purpose water resources project in India. The Decision Support System (DSS) incorporates the linear programming model in model base, data base, and knowledge base subsystems along with user interface. The model base subsystem includes the LP, groundwater balance and evapotranspiration models. The data base subsystem includes the meteorological, crop, and water resources data of the study area. The knowledge base subsystem was developed with the knowledge derived from the results of the aforementioned models. Sensitivity analysis of LP model parameters is carried out by varying the parameters that affect the optimal cropping pattern and groundwater allocation. The result indicates that conjunctive use of 87% surface water along with13% ground water appears to be the most viable water allocation level and 20% deviation in existing cropping pattern is selected as the best alternative as it considered socio-economic value and meets the entire food demand of the study area.
Key words: Conjunctive water use software, Hirakud dam canal command area, India, Optimization model, Sensitivity analysis.
1 Masters Student, Agricultural and Food Engineering Department, Indian Institute of Technology, Kharagpur –721 302, India E-mail: [email protected]
2 Professor and Head, School of Water Resources, Indian Institute of Technology, Kharagpur –721 302, India (*corresponding author); Phone: +91-3222-282212 E-mail: [email protected]
3 Scientist, State Authority of Mining, Energy and Geology Department 3.2: Groundwater and Waste Management, Brownfields of the GEOZENTRUM Hannover, Stilleweg 2, 30655 Hannover, Germany E-mail: [email protected]
4 Professor, Institute of Water Resources Management, Hydrology and Agricultural Hydraulic Engineering, Leibniz University Hannover, Hannover, Germany E-mail: [email protected]
ICID 21st International Congress on Irrigation and Drainage, 15-23 October 2011, Tehran, Iran

ICID 21st Congress, Tehran, October 2011 International Commission on Irrigation and Drainage
210
RESUME
L’usage combiné des eaux superficielles et souterraines est entrepris dans nombreuses régions pour maximiser la disponibilité de l’eau au moment de l’exigence. La réussite des politiques régionales de la gestion d’eau permettra d’identifier les contraintes physiques et juridiques de ces fournitures intégrées. Pour faire face à toutes ces contraintes, un modèle d’une programmation linéaire (PL) a été développé pour l’allocation optimale des ressources en eau et l’assolement pour une gestion efficace des ressources en eau et en terre du canal du périmètre irrigué de barrage Hirakud, projet des ressources en eau à but multiple en Inde. Le système d’aide à la décision (DSS) intègre le modèle de programmation linéaire dans le modèle de base, la base de données, et les sous-systèmes de base de connaissances avec l’interface de l’usager.
Le sous-système de base du modèle comprend les modèles LP, le bilan d’eau souterraine et l’évapotranspiration. Le sous-système de base de données comporte les données météorologiques, agricoles et hydriques de la zone d’étude. Le sous-système de base de connaissances a été développé avec l’information provenant des résultats des modèles mentionnés ci-dessus. L’analyse de sensibilité des paramètres du modèle LP est réalisée en utilisant les paramètres variés qui affectent l’assolement et l’allocation des eaux souterraines. Le résultat indique que l’usage combiné des eaux de surface de 87% avec les eaux souterraines de 13% semble le niveau le plus viable d’allocation d’eau et l’écart de 20% en assolement existant est retenu en tant que la meilleure alternative car il tient en compte la valeur socio-économique et répond à l’ensemble de la demande alimentaire de la zone d’étude.
Mots clés: Logiciel de l’usage combiné d’eau, canal du périmètre irrigué de barrage Hirakud, Inde, modèle d’optimisation, analyse de sensibilité.
1. INTRODUCTION
Groundwater is typically considered as a supplementary source for surface water. It has a smoothening effect on the fluctuations in surface water supplies and has a buffer value (Basagaoglu et al., 1999). During wet season, the surface reservoirs permit the capture of large flows when water cannot be used productively because of low irrigation demand or limited canal capacity. During dry season, the groundwater is used to offset the deficit in surface water supplies. Modeling in the field of water resources is of prime importance where some of the components cannot be measured accurately. As a result, use of software is found to be efficient and prominent in the field of water resources management (Simonovic, 1996 a, b; Bharatia et al., 2008). Labadie and Sullivan (1986) discussed the need to develop procedures to incorporate experience and subjective judgment of system managers and decision-makers in the softwarwe.
One of the recent trends for solution of water resources management problems is to aggregate several models into an integrated software that focuses on interaction between the user and the data, models and computers (Fredericks et al., 1998; Bouman et al., 2007). Software have been widely used for drought management (Raman et al., 1992), irrigation water management (Prajamwong et al., 1997), river basin planning, surface water planning in river basin (Ito et al., 2001), water-quality management (Arnold and Orlob, 1989), flood warning (Ford, 2001),

ICID 21st Congress, Tehran, October 2011 R.56.5.17
211
operation of reservoir systems (Arumugam and Mohan, 1997; Eschenbach et al., 2001) and conjunctive water use (Sethi et al., 2006; Marques et al., 2010).
Several researchers have applied number of simulation and optimization models to derive planning and operating strategies for irrigation reservoir systems (Gorantiwar and Smout, 2003) and integrated floodplain management plan. In irrigated agriculture, where various crops are competing for limited available land and water resources, linear programming is an ideal tool for optimal allocation of these resources (Paudyal and Gupta, 1990; Sethi et al., 2002).
A software for optimum cropping and water resources management was developed and applied to Hirakud canal command, Orissa State, India, so as to maximize the net annual return. The software includes the user interface along with data base, model base, and knowledge base subsystems. The validation and sensitivity analysis of the model assure its large-scale adoption. The objectives of the study were: (1) Development of software system for conjunctive use planning and management of a major irrigation project; (2) Application of the software to the Hirakud irrigation project for developing various scenarios of land and water resources allocation.
2. STUDY AREA
The Hirakud dam across the Mahanadi River is one of the longest earthen dam (3651 m) in the world and was completed in 1957 with main objective of flood control and irrigation to 1.57 lakh ha area. The cultivable command area is 157018 ha and irrigation intensity is 170% (100% Kharif (Monsoon) and 70% Rabi (Winter) seasons).The 444.44 km long canal network was completed in 1960 (CGWB, 1998).
The study area comprises of canal commands bounded by North Latitudes 200 53’ to 210 36’ and East Longitudes 830 25’ to 840 10’ (Fig. 1). The reservoir water provides irrigation to five blocks of Sambalpur, six blocks of Bargarh, two blocks of Suvarnapur, and one block of Bolangir districts either partly or fully. The elevation of land surface varies from 120 to 180 m amsl. The temperature during January is minimum (10.00 C) and during the month of May is maximum (42.40 C), Mean monthly daily temperature (of mean minimum and mean maximum) is lowest (9.30 C) during January and highest (34.50 C) during May.
Fig. 1. Location of study area

ICID 21st Congress, Tehran, October 2011 International Commission on Irrigation and Drainage
212
Maximum mean relative humidity 0700 h is 98% during rainy month and the minimum of mean relative humidity at 1400 h is 18.3% during April. Daily average evaporation is minimum (2.84 mm) during December and January while it is maximum (7.11 mm) in May. The average annual rainfall is 1169 mm with average monsoon rainfall of 1077 mm.
The major problems of the study area are: traditional farming (paddy after paddy); undulating topography and inequitable water distribution
3. METHODS
3.1 Model Formulation
The model consists of an objective function Z and a set of constraints.
∑∑∑∑∑= == = =
+−=4
1
2
1
4
1
2
1 1)(
i jij
GWijij
SWijijk
i j
n
kijki GWCSWCAaMaxZ
(1)
Where, i = index for sectors of command area; j = index for crop growing seasons; j =1 for Kharif (Monsoon) season and j = 2 for the Rabi (Winter)season; k = index for crops, 1, 2,…..,n (number of crops); aijk = net return for crop k in season j of sector i (Rs/ha); Aijk = area allocated to crop k in season j of sector i (ha); Cij
SW =unit cost of surface water in season j of sector i (Rs/Mm3); SWij = surface water allocated in season j for sector i (Mm3); GWij = groundwater pumped in season j for sector i (Mm3); Cij
GW and unit cost of groundwater (Rs/Mm3). The objective function is subjected to the following set of constraints.
3.1.1 Water allocation constraint:
The irrigation requirement of all the crops must be fully satisfied during all the seasons from the available surface and groundwater resources.
10-2 ( ) 01
4
11
4
1
≤+−∑∑∑===
ijiji
ijk
n
ikijk
iGWSWANIR βα ; ∀ j
(2)
Where, a1 = field water application efficiency; b1 = conveyance efficiency; and NIRijk = net irrigation requirement of crop k in season j of sector i (m).
3.1.2 Land area constraint:
ijn
k ijk TAA∑=
≤1
; ∀i&j
(3)
Where, TAij = total cultivable command area of sector i in season j (ha)

ICID 21st Congress, Tehran, October 2011 R.56.5.17
213
3.1.3 Water availability constraints:
(a) jiij TSWSW ≤ ; ∀i& j
(4)
Where, TSWij = total available surface water in sector i in season j (Mm3)
(b) ijij TGWGW ≤ ; ∀i& j
(5)
Where, TGWij = total available ground water in sector i in season j (Mm3)
3.2 Hydrologic balance of aquifer:
Hydrological balance of the groundwater aquifer will help in keeping the water table at pre-determined level,
{ } PMAGWSWARESWGW ijijijijiji j ij ≤+++−∑ ∑= =
)()( 12314
1
2
1βθθθ
(6)
Where, q1 = conveyance loss of surface water (fraction) = 0.35; q2 = field water application loss (fraction)= 0.3; b1 = (1-q1) = conveyance efficiency (fraction) = 0.65; q3 = rainfall (recharge fraction) = 0.14 (Rangarajan and Athavale, 2000); Rij = rainfall in sector i in season j (mm); PMA = permissible annual mining allowance (Mm3); and E( ) = expected operator.
The permissible annual mining allowance of the aquifer is determined by,
PMA = ∆h × A × Sy (7)
Where, ∆h = annual average groundwater table fluctuations (cm); and Sy = specific yield of the aquifer; and A = total command area (ha).
3.2.1 Minimum/ Maximum allowable area:
(a) For maximum area:
ijkijkijk TAA maxµ≤
(8)
(b) For minimum area:
ijkijkijk TAA minµ≥
(9)
Where, μijkmax = factor by which the existing area of crop k in season j and sector i can be
increased; and μijkmin = factor by which the existing area of crop k in season j and sector i
can be decreased.

ICID 21st Congress, Tehran, October 2011 International Commission on Irrigation and Drainage
214
3.2.2 Non- negativity:
;0≥ijkA ;0≥ijSW 0≥ijGW for all i, j, and k
(10)
3.3 Groundwater Balance Model:
The objective of the groundwater balance model is to regulate the groundwater flow system so as to prevent the watertable from rising too close and/or declining too far from the root zone of the crops. The groundwater balance model has been developed considering the mass balance approach for inflow and outflow components (Sethi et al., 2002). The simplest form of groundwater balance equation is given by:
dr TGDTGRS −=∆
(11)
Where, ∆S = change in groundwater storage (Mm3); TGRr = total groundwater recharge (Mm3); and TGDd = total groundwater draft (Mm3).
3.4 Groundwater Recharge:
Groundwater recharge includes recharge from rainfall, seepage from canals, and irrigation return flow from crop fields. The annual groundwater recharge is estimated using the following equation:
SFGRRTGR prr ++=
(12)
Where, GRp = GRpi + GRnpi
Where, Rr = recharge from rainfall (Mm3); GRp = recharge from crop fields (Mm3); SF = seepage flow from canals (Mm3); GRpi = recharge from paddy field (Mm3); and GRnpi = recharge from non-paddy field (Mm3).
3.4.1 Recharge from Rainfall:
Annual groundwater recharge from rainfall, Rr (mm) was calculated by using the following equation developed by Rangarajan and Athavale (2000).
Rr = 0.172 x Rf – 44.0 (13)
Where, Rr = recharge from rainfall (mm); and Rf = average annual rainfall (mm).
3.4.2 Seepage Flow from canals:
Seepage loss is estimated as proposed by CGWB using Eq. 14:

ICID 21st Congress, Tehran, October 2011 R.56.5.17
215
SF = (Average wetted area x seepage factor) (14)
Where, Seepage factor =20 ha-m / day/ 106 m2
3.4.3 Irrigation Return flow:
Water requirements of crops are met by rainfall, soil moisture contribution, and applied irrigation water. A part of the water applied to the crops is lost in meeting the crop consumptive use and the residual infiltrates to recharge the groundwater. The process of re-entry of a part of the water used for irrigation is called return flow. The recharge due to irrigation return flow may also be estimated, based on the source of irrigation, type of crop (paddy, non-paddy), using the norms provided by the Groundwater Resource Estimation Committee (1997).
3.5 Groundwater Discharge:
Groundwater discharge consists of draft from tubewells and upward flux from the groundwater, which is given by:
etd GDGDTGD +=
(15)
Where, GDt = groundwater draft through the existing structures (Mm3); and GDe = groundwater evapotranspiration (Mm3).
3.5.1 Groundwater Draft:
The annual groundwater draft is based on discharge rate, number of structures, and duration of operation of various structures in each season.
3.5.2 Evapotranspiration from Groundwater:
Evapotranspiration is the combined process of transpiration from vegetation and evaporation from both soil and free water surfaces. Potential evapotranspiration is the maximum loss of water through evapotranspiration. The evapotranspiration can be estimated based on the following equations:
Et = PEt x A if h > hs (16a)
Et = 0 if h < (hs - d) (16b)
Et = PEt x A (h - (hs - d))/d if (hs-d) ≤h ≤ hs (16c)
Where, Et = evapotranspiration in volume of water per unit time [L3 T-1]; PEt = maximum rate
of evapotranspiration in volume of water per unit area per unit time [L3L-2T-1]; A = surface area
[L2]; h = water table elevation [L]; hs = water table elevation at which the evapotranspiration loss reaches the maximum value [L]; and d = extinction depth [L]. When the distance between hs and h exceeds d, evapotranspiration from groundwater ceases [L].

ICID 21st Congress, Tehran, October 2011 International Commission on Irrigation and Drainage
216
3.6 Irrigation Requirement of Crops:
The net irrigation requirement (NIR) of a crop is the amount of water, in addition to rainfall, that must be applied to meet a crop’s evapotranspiration (ETc) needs without significant reduction in yield. To avoid crop water stress, rainfall and irrigation must be adequate to meet the crop’s ET requirement. The crop evapotranspiration is calculated using the following equation:
ETc = kc . ET0 (17)
Where, ETc = crop evapotranspiration (mm/day); kc = crop coefficient; and ET0 = reference evapotranspiration (mm/day).
The net irrigation requirement of crop can be estimated from the following equation:
NIR = ETc − ER (18)
Where, NIR = net irrigation requirement in a given month (mm/month); and ER = effective rainfall in a given month (mm/month).
The seasonal NIR of crops has been computed by adding the monthly NIR of crops corresponding to the months in the growing season.
3.6.1 Reference Evapotranspiration:
Various methods are available to estimate the reference crop evapotranspiration (ET0) (Doorenbos and Pruitt, 1977; Allen et al., 1998). Based on the availability of meteorological data of the study area, the Hargreaves method (Hargreaves and Samani, 1985) of estimating ET0 was selected as given below:
ET0 = 0.0023 (Tmean + 17.8) (Tmax – Tmin)0.5 Ra (19)
Where, ET0 = reference evapotranspiration in a given month (mm); Ra = extra-terrestrial solar radiation (mm/month); Tmean= mean monthly air temperature (Tmax + Tmin)/2(oC); Tmax = monthly maximum air temperature (oC); and Tmin = monthly minimum air temperature (oC).
3.6.2 Effective Rainfall:
The U.S. Department of Agriculture (USDA) Soil Conservation Service (SCS) method was used to determine the effective rainfall (ER).
3.7 Surface water Availability:
The entire command area has been divided into four sectors. In the Hirakud canal command, canal water is the only source of surface water for irrigation. The surface water availability is calculated by the following equation:

ICID 21st Congress, Tehran, October 2011 R.56.5.17
217
Water released from the reservoir (Mm3) = Discharge of the main canal (Mm3/s) x days of canal operation x 24 x 3600 And seepage losses is estimated by the equation given by central groundwater board as given below,
Water available for irrigation (Mm3) = volume of water released (Mm3) - seepage loss from canal system (Mm3)
3.8 Development of Software:
Typical phases of software development are:1) Identification of required software; 2) Analysis of the software requirements; 3) Detailed specification of the software requirements; 4) Software design; 5) Programming; 6) Testing; 7) Maintenance. In general, the development of commercial software is usually a result of demand in the marketplace, while enterprise software development generally arises from a need or a problem within the enterprise environment.
3.8.1 Subsystems in software:
Software has the following subsystems,
• Databasemanagementsubsystem(DBMS)
• Modelbasedmanagementsubsystem(MBMS)
• Dialoguegenerationandmanagementsubsystem(DGMS)
3.8.2 System Design:
The first step in designing software is to identify problems of the area in addition to aim of the study. In the present work, the considered objectives are optimal cropping pattern and water resources allocation.
The software consists of three subsystems such as DBMS, MBMS, and DGMS. These components are integrated for decision making. Temperature, rainfall, crop area and data related to water resources are stored in the DBMS. These historical data are used for optimal allocation of water resources. Estimation model determines inflow, evapotranspiration, and net return. These estimates form the input to the model subsystem to derive polices for analysis (Figure 2).

ICID 21st Congress, Tehran, October 2011 International Commission on Irrigation and Drainage
218
Fig. 2. Flow diagram of the software
As is customary with interactive software operation, the user interaction takes place through several windows showing instructions/options to the user to access specific data, process them, switch, give output, save, exit, etc. The main of such windows in the software (Figures not given, as they are routine) are: Main window for the estimation of crop water requirement; Annual groundwater balance window; Surface water availability estimation window; Window for simulation of seasonal net return of different crops; Optimization result window, etc.
4. RESULTS AND DISCUSSION
4.1 Net Return:
It was observed from the results that the variation of return excluding the irrigation water cost depends on the crop yield, market price, and cost of cultivation. Existing cropping pattern of the study area and its corresponding net returns for Kharif (Monsoon) and Rabi (Winter) seasons are given in Table 1and 2, respectively.

ICID 21st Congress, Tehran, October 2011 R.56.5.17
219
Table 1. Net return of Kharif (Monsoon) crops
Crops Cost of cultivation
(Rs/ha)
Market price (Rs/q)
Yield (q/ha) Net return (Rs/ha)
Paddy 12232 550 35 7018
Pulses 4912 2500 10 20088
Millets 8519 1000 14 5481
Oilseeds 9895 2000 8 6105
Condiments 51695 1000 150 98305
Vegetables 18248 500 90 26752
Sugarcane 24535 100 625 37965
Source: Orissa University of Agriculture and Technology, Bhubaneswar, Orissa, India
Table 2. Net return of Rabi (Winter) crops
Crops Cost of cultivation
(Rs/ha)
Market price (Rs/q)
Yield (q/ha) Net return (Rs/ha)
Paddy 13820 500 40 6180
Pulses 4912 2500 12 25088
Millets 9236 1000 15 5764
Oilseeds 10153 2000 10 9847
Condiments 51695 1000 150 98305
Vegetables 19749 450 100 25251
Wheat 9530 750 25 9220
Source: Orissa University of Agriculture and Technology, Bhubaneswar Orissa, India
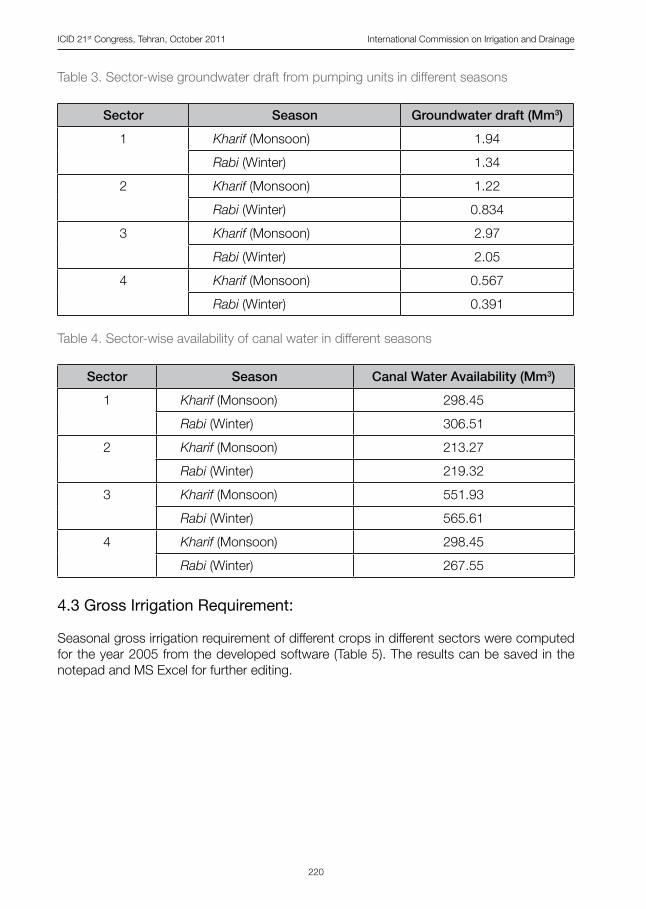
4.2 Water Availability:
Irrigation in the study area is mainly done by pumping from dug wells. The canal water and groundwater availability in the study area were computed from the database of water resources in the developed software (Table 3 and 4).
ICID 21st Congress, Tehran, October 2011 International Commission on Irrigation and Drainage
220
Table 3. Sector-wise groundwater draft from pumping units in different seasons
Sector Season Groundwater draft (Mm3)
1 Kharif (Monsoon) 1.94
Rabi (Winter) 1.34
2 Kharif (Monsoon) 1.22
Rabi (Winter) 0.834
3 Kharif (Monsoon) 2.97
Rabi (Winter) 2.05
4 Kharif (Monsoon) 0.567
Rabi (Winter) 0.391
Table 4. Sector-wise availability of canal water in different seasons
Sector Season Canal Water Availability (Mm3)
1 Kharif (Monsoon) 298.45
Rabi (Winter) 306.51
2 Kharif (Monsoon) 213.27
Rabi (Winter) 219.32
3 Kharif (Monsoon) 551.93
Rabi (Winter) 565.61
4 Kharif (Monsoon) 298.45
Rabi (Winter) 267.55
4.3 Gross Irrigation Requirement:
Seasonal gross irrigation requirement of different crops in different sectors were computed for the year 2005 from the developed software (Table 5). The results can be saved in the notepad and MS Excel for further editing.
ICID 21st Congress, Tehran, October 2011 R.56.5.17
221
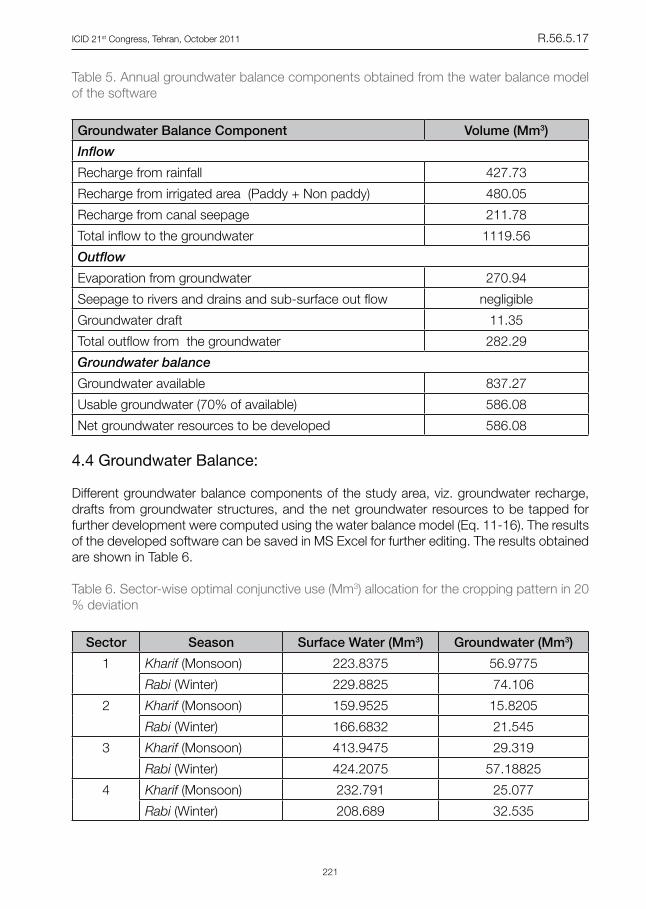
Table 5. Annual groundwater balance components obtained from the water balance model of the software
Groundwater Balance Component Volume (Mm3)
Inflow
Recharge from rainfall 427.73
Recharge from irrigated area (Paddy + Non paddy) 480.05
Recharge from canal seepage 211.78
Total inflow to the groundwater 1119.56
Outflow
Evaporation from groundwater 270.94
Seepage to rivers and drains and sub-surface out flow negligible
Groundwater draft 11.35
Total outflow from the groundwater 282.29
Groundwater balance
Groundwater available 837.27
Usable groundwater (70% of available) 586.08
Net groundwater resources to be developed 586.08
4.4 Groundwater Balance:
Different groundwater balance components of the study area, viz. groundwater recharge, drafts from groundwater structures, and the net groundwater resources to be tapped for further development were computed using the water balance model (Eq. 11-16). The results of the developed software can be saved in MS Excel for further editing. The results obtained are shown in Table 6.
Table 6. Sector-wise optimal conjunctive use (Mm3) allocation for the cropping pattern in 20 % deviation
Sector Season Surface Water (Mm3) Groundwater (Mm3)
1 Kharif (Monsoon) 223.8375 56.9775
Rabi (Winter) 229.8825 74.106
2 Kharif (Monsoon) 159.9525 15.8205
Rabi (Winter) 166.6832 21.545
3 Kharif (Monsoon) 413.9475 29.319
Rabi (Winter) 424.2075 57.18825
4 Kharif (Monsoon) 232.791 25.077
Rabi (Winter) 208.689 32.535

ICID 21st Congress, Tehran, October 2011 International Commission on Irrigation and Drainage
222
4.5 Optimization Model:
The different input parameters required for optimization model were estimated by the software. The model was then run for different levels of crop area and groundwater resources using the Quantitative Systems for Business (QSB) software package (Chang, 1993), which was incorporated in the model.
Initially, the linear optimization model was run without maximum/minimum area constraints. The results suggested that the entire canal command should be cultivated by the condiment crop (mustard etc.). To make the system realistic and fulfill the basic food requirements of local landholders, area constraints were introduced. The existing crop acreage was deviated at the rate of 20, 40, and 60% to satisfy the basic food targets of the basin .The result of optimal land allocation with different area constraints is tabulated (Table 7-9) and the optimal conjunctive use results for different cropping pattern is given in Table 10-12.The comparison of net annual return has been made between the existing cropping pattern and the optimal cropping pattern (Table 13).
Table 7. Sector-wise optimal conjunctive use (Mm3) allocation for the cropping pattern in 40 % deviation
Sector Season Surface Water (Mm3) Groundwater (Mm3)
1 Kharif (Monsoon) 208.915 0
Rabi (Winter) 214.557 65.872
2 Kharif (Monsoon) 149.289 0
Rabi (Winter) 153.524 40
3 Kharif (Monsoon) 413.9475 39.092
Rabi (Winter) 424.2075 38.798
4 Kharif (Monsoon) 223.8375 33.436
Rabi (Winter) 200.6625 33.914
Table 8. Sector-wise optimal conjunctive use (Mm3) allocation for the cropping pattern in 60 % deviation
Sector Season Surface Water (Mm3) Groundwater (Mm3)
1 Kharif (Monsoon) 177.7026 0
Rabi (Winter) 219.5534 54.3444
2 Kharif (Monsoon) 84.66435 0
Rabi (Winter) 104.6025 14.2197
3 Kharif (Monsoon) 184.491 32.2509
Rabi (Winter) 283.536 18.73245
4 Kharif (Monsoon) 78.597 27.5847
Rabi (Winter) 97.11 0

ICID 21st Congress, Tehran, October 2011 R.56.5.17
223
Table 9. Net annual return for different cropping pattern
Land allocation strategies Net annual return (Billion Rs.)
Existing 2.15
Optimal (20% deviation) 2.74
Optimal (40% deviation) 4.36
Optimal (60% deviation) 5.91
Table 10. Seasonal gross irrigation requirement (mm) of different crops grown in different sectors
Sector Season Paddy Millets Pulses Oil-seeds
Vege-tables
Condi-ments
Sugar-cane
Wheat
1 Monsoon 780.3 106.3 117 113 193.8 193.8 556.4 ---
Winter 1860 554.8 590.9 601.5 724.4 724.4 1448.7 706.9
2 Monsoon 628.2 96.3 107 103 183.8 183.8 546.4 --
Winter 1526 599.8 635.9 646.5 769.4 769.4 1493.7 751.9
3 Monsoon 658.2 136.3 147 143 223.8 223.8 586.4 ---
Winter 1952 609.8 645.9 656.5 779.4 779.4 1503.7 761.9
4 Monsoon 578.2 86.3 97 93 173.8 173.8 536.4 ---
Winter 1456 550.8 586.9 597.5 720.4 720.4 1444.7 702.9
Table 11. Sector-wise seasonal optimal cropping pattern (ha) with area constraint at 20% deviation
Sector Season Paddy Millet Pulses Oil-seed
Vege-table
Condi-ment
Sugar-cane
Wheat
1 Monsoon 28706 11 4560 287 1085 79 26 ---
Winter 15852 27 710 212 910 325 26 258
2 Monsoon 20269 5 198 260 758 470 52 --
Winter 13222 10 1921 1115 2321 530 52 58
3 Monsoon 60526 28 7399 806 503 352 309 ---
Winter 28954 40 2572 574 1010 2598 309 1572
4 Monsoon 24031 20 1006 806 503 352 120 ---
Winter 14953 20 586 453 2002 1356 120 2256

ICID 21st Congress, Tehran, October 2011 International Commission on Irrigation and Drainage
224
Table 12. Sector-wise seasonal optimal cropping pattern (ha) with area constraint at 40% deviation
Sector Season Paddy Millet Pulses Oil-seed
Vege-table
Condi-ment
Sugar-cane
Wheat
1 Monsoon 19280 19 1936 502 3224 2092 46 ---
Winter 16989 20 2058 1439 4095 1879 46 1655
2 Monsoon 31972 19 1398 1002 2643 2048 84 --
Winter 19151 8 1631 1261 1389 2635 84 1850
3 Monsoon 39205 47 857 1828 1774 2910 459 ---
Winter 18638 75 1786 2982 2975 3965 459 1723
4 Monsoon 14769 16 3006 2009 2274 2879 194 ---
Winter 12914 14 1309 1928 1975 3189 194 1653
Table 13. Sector-wise seasonal optimal cropping pattern (ha) with area constraint at 60 % deviation
Sector Season Paddy Millet Pulses Oil-seed
Vege-table
Condi-ment
Sugar-cane
Wheat
1 Monsoon 16066 22 2377 1338 3347 3298 50 ---
Winter 12337 16 2210 2134 2988 4353 50 129
2 Monsoon 34255 21 1820 1138 2725 3587 90 --
Winter 17625 6 2176 1634 2988 4537 90 291
3 Monsoon 32670 51 2623 1224 4883 4440 92 ---
Winter 15531 31 4200 1940 7695 5885 92 186
4 Monsoon 12307 12 3673 1424 3830 3440 208 ---
Winter 6928 11 3318 1440 3178 5475 208 127 4.6 Validation and Sensitivity Analysis:
Before transferring this software system to the decision makers at the field level, it was demonstrated to the professors and researchers at Indian Institute of Technology, Kharagpur, India. Based on their comments necessary modifications were made in the developed system and it has been seen that the result from the software matched with the published data. Hence the software is acceptable for further use and modification.
Sensitivity analysis was carried out for the area available for cropping and ground water availability. The groundwater balance of the basin reveals that the irrigation water requirement under the existing cropping pattern is more than the available water resources of the command area. Therefore, based on the present scenario of study area one should decide which crops are to be grown for satisfying all the demands. Future changes in climate, cropping pattern, and pumping schedule may adversely affect the water availability in the study area.

ICID 21st Congress, Tehran, October 2011 R.56.5.17
225
4.7 Possible Scenarios of Land and Water:
Linear programming optimization model was used to get the optimal land and water resource management scenarios from various land and water allocation strategies i.e. 20, 40, and 60% deviation from the existing crop acreage, so as to achieve the basic food targets of the basin. However, the water resources allocation strategies considered the variation of groundwater and surface water allocation (0–100% of available water resources) to maintain the system balance.
The land allocation strategies considered three ranges of the existing cropped area required for cultivating any crop, the ranges used for the study are: (1) 20% deviation from the existing area for each crop, i.e. μmin
ijk = 0.8 and μmaxijk = 1.2 for all i, j, and k; (2) 40% deviation, i.e. μmin
ijk = 0.6 and μmax
ijk = 1.4; and (3) 60% deviation, i.e. μminijk = 0.6 and μmax
ijk = 1.6. The different ranges of maximum/minimum area with respect to the existing cropping pattern were introduced to make the system more realistic and satisfying the basic food requirements of local landholders.
The optimal cropping pattern obtained from the optimization model indicated a wide variation in net annual return from the existing cropping by optimally utilizing the available water resources with three variable ranges of deviation as explained above. The possible scenarios obtained from various land allocation strategies showed an increase in net annual return with increase in ranges of deviation (Fig. 3). An increase in net annual return was obtained due to introduction of more area under high valued crops (pulses and vegetables), which is economically desirable but socially not acceptable.
2.15
2.74
4.36
5.91
0.00
1.00
2.00
3.00
4.00
5.00
6.00N
et Annual R
eturn(Billion)
Existing Optimal (20%deviation)
Optimal (40%deviation)
Optimal (60%deviation)
Cropping pattern
Fig. 3. Increase in net annual return at different ranges of cropping area coefficient with respect to the existing cropping pattern
The sensitivity analysis was performed with the variation of groundwater (GW) availability in the range from 0% to 100% with an increment of 5%.This sensitivity analysis was performed for the 20% deviation in the existing cropping pattern. The outcome of the model showed an increase in net annual return with decrease in groundwater allocation levels from 0% to 100% of available groundwater. Conjunctive use result for different cropping pattern is given in Figs. 4, 5 and 6. Seasonal surface and groundwater allocation with different ranges of cropping pattern (20, 40 and 60%) was estimated.

ICID 21st Congress, Tehran, October 2011 International Commission on Irrigation and Drainage
226
0
50
100
150
200
250
300
350
400
450
Kharif-1 Rabi-1 Kharif-2 Rabi-2 Kharif-3 Rabi-3 Kharif-4 Rabi-4Season-Sector
Wat
er(M
m3)
Surface WaterGroundwater
Fig. 4. Seasonal conjunctive use allocation with 20% deviation of cropping pattern
0
50
100
150
200
250
300
350
400
450
Kharif-1 Rabi-1 Kharif-2 Rabi-2 Kharif-3 Rabi-3 Kharif-4 Rabi-4
Season-Sector
Wat
er(M
m3)
Surface WaterGroundwater
Fig. 5. Seasonal conjunctive use allocation with 40% deviation of cropping pattern
0
50
100
150
200
250
300
Kharif-1 Rabi-1 Kharif-2 Rabi-2 Kharif-3 Rabi-3 Kharif-4 Rabi-4
Season-Sector
Wat
er (M
m3)
Surface WaterGroundwater
Fig. 6. Seasonal conjunctive use allocation with 60% deviation of cropping pattern

ICID 21st Congress, Tehran, October 2011 R.56.5.17
227
5. CONCLUSIONS
According to detailed analysis of the study area, the utilizable ground water resource during a year has been estimated approximately 586.08 MCM (million cubic meter).Similarly, availability of surface water during Kharif and Rabi season has been estimated as 1362.10 MCM and 1139.67 MCM, respectively.
A linear programming model has been formulated to optimize and allocate the surface and groundwater as per existing and deviation of existing cropping pattern for meeting the irrigation demand. During the Kharif (Monsoon) season paddy coverage is 98% and sugarcane is 2%. During Rabi season, five major crops like paddy, pulses, oil seeds, vegetable and sugarcane have been practiced at present but crop scheduling has been done with deviation of existing cropping pattern. Net return is high in case of 40% and 60% deviation in cropping pattern, but 20% deviation in existing cropping pattern has been preferred for best alternative as it considered socio economic value and meets entire food demand of the study area. Demand of water for 200% irrigation intensity can be met from surface and groundwater allocation for both the seasons. The surface water irrigation is cheaper than the groundwater. An attempt has been made to determine optimal cropping pattern for maximum use of available surface water in conjunction with groundwater to get maximum return. At the same time the socio-economic value was also inconsideration. Various possible conjunctive use strategies have been tested with the ground water simulation model and it has been found that87% surface water and 13% ground water use appears to be the most viable one. In Hirakud, command area development of groundwater is feasible through dug wells and borewells. Dugwells are the most suitable ground water structure in the area. For meeting the additional demand of water a total of 17,526 dugwells are required which should be installed in the identified area within a period of two years.
The validation and sensitivity analysis of the software were carried out for the study area. The developed software was demonstrated for evolving various scenarios of land and water management in the study area under different alternatives. The entire decision processes in the user friendly software support the land/water users to maintain the groundwater resources within the permissible mining allowance with the conjunctive use of surface and groundwater resources as well as shifting to other cropping patterns from the traditional paddy based cropping system.
The developed system is recommended for wide scale application in areas having similar problems. For crop planning and water resources management in different scenarios, the software can be generalized with little modification (i.e. by creating and updating the database and the knowledgebase subsystem) for its application to other areas. The inherent advantage in this approach is that the expert knowledge can be brought in a software package to the field engineers’ reach.
ACKNOWLEDGMENTS
The authors are thankful to the Department of Science and Technology (DST), Government of India and DAAD (Germany) for extending the financial support under Project Based Personal Exchange Programme (PPP).

ICID 21st Congress, Tehran, October 2011 International Commission on Irrigation and Drainage
228
REFERENCES
Allen, R.G., L.S. Pereira, D. Raes and M. Smith. 1998. Crop evapotranspiration: Guidelines for computing crop water requirements. Irrigation and Drainage Paper 56. UN-FAO, Rome, Italy, pp 300.
Arnold, U. and G.T. Orlob. 1989. Decision support for estuarine water quality management. Journal of Water Resources Planning and Management, ASCE. 115(6): 775-792.
Arumugam, N. and S. Mohan. 1997. Integrated decision support system for tank irrigation system operation. Journal of Water Resources Planning and Management, ASCE. 123(5): 266-273.
Basagaoglu, H., M.A. Marino and R.H. Shumway. 1999. Delta-form approximating problem for a conjunctive water resource management model. Advances in Water Resources. 23(1): 69–81.
Bharatia, L., C. Rodgers, T. Erdenberger, M. Plotnikova, S. Shumilov, P. Vlek, N. Martin. 2008. Integration of economic and hydrologic models: Exploring conjunctive irrigation water use strategies in the Volta basin. Agricultural Water Management. 95: 925-936.
Bouman, B.A.M., L. Feng, T.P. Tuong, G. Lu, H. Wang and Y. Feng. 2007. Exploring options to grow rice using less water in northern china using a modelling approach II: Quantifying yield, water balance components, and water productivity. Agricultural Water Management. 88: 23-33.
CGWB, 1998.. 1998. Studies on conjunctive use of surface and groundwater resources in Hirakud irrigation project. Central Ground Water Board Ministry of Water Resources. Government of India.
Doorenbos, J. and W.O. Pruitt. 1977. Guidelines for predicting crop water requirements. FAO, Rome, Irrigation and Drainage. Paper No. 24, pp 144.
Eschenbach, E.A., T. Magee, E. Zagona, M. Goranflo and R. Shane. 2001. Goal programming decision support system for multi-objective operation of reservoir systems. Journal of Water Resources Planning and Management, ASCE. 127(2): 108-120.
Fredericks, J.W., J.W. Labadie and J.M. Altenhofen. 1998. Decision support system for conjunctive stream-aquifer management. Journal of Water Resources Planning and Management, ASCE. 124(2): 69-77.
Ford, D.T. 2001. Flood-warning decision support system for Sacramento, California. Journal of Water Resources Planning and Management, ASCE. 127(4): 254-260.
Gorantiwar, S.D. and I.K. Smout. 2003. Allocation of scarce water resources using deficit irrigation in rotational systems. Journal of Irrigation and Drainage Engineering, ASCE. 129(3): 155-163.
Groundwater Resource Estimation Committee. 1997. Report of the groundwater resource estimation committee. Ministry of Water Resources, Government of India, New Delhi, India.
Hargreaves, G. and Z.A. Samani. 1985. Reference crop evapotranspiration from temperature. Applied Engineering in Agriculture, ASAE. 1(2): 96-99.

ICID 21st Congress, Tehran, October 2011 R.56.5.17
229
Ito, K., Z.X. Xu, T. Kojiri, A. Kawamura. 2001. Decision support system for surface water planning in river basins. Journal of Water Resources Planning and Management, ASCE. 127(4): 272-276.
Labadie, J.W. and C. Sullivan. 1986. Computerized decision support systems for water managers. Journal of Water Resources Planning and Management. ASCE. 112(3): 299-307.
Marques, G.F., J.R. Lund and R.E. Howitt. 2010. Modeling conjunctive use operations and farm decisions with two-stage stochastic quadratic programming. Journal of Water Resources Planning and Management. 136 (3): 386-394.
Paudyal, G.N. and A.D. Gupta. 1990. Irrigation planning by multilevel optimization. Journal of Irrigation and Drainage Engineering, ASCE. 116(2): 273-291.
Prajamwong, S., G.P. Markley and R.G. Allen. 1997. Decision support model for irrigation water management. Journal of Irrigation and Drainage Engineering, ASCE. 123(2): 106-113.
Raman, H., S. Mohan, N.C.V. Rangcharya. 1992. Decision support for crop planning during droughts. Journal of Irrigation and Drainage Engineering, ASCE. 118(2): 229-241.
Rangarajan, R. and R.N. Athavale. 2000. Annual replenishable ground water potential of India: An estimate based on injected tritium studies. Journal of Hydrology. 234(1-2): 38-53.
Simonovic, S.P. 1996 a. Decision support system for sustainable management of water resources: 1. General Principles. Water International. 21(4): 223-232.\
Simonovic, S.P. 1996 b. Decision support system for sustainable management of water resources: 2. Case Studies. Water International. 21(4): 233-244.
Sethi, L.N., D. Nagesh Kumar, S.N. Panda and B.C. Mal. 2002. Optimal crop planning and conjunctive use of water resources in a coastal river basin. Water Resources Management. 16(2): 145-169.
Sethi, L.N., S.N. Panda and M. K. Nayak. 2006. Optimal crop planning and water resources allocation in a coastal groundwater basin, Orissa, India. Agricultural Water Management. 83: 209-220.


![[Slide] Containment Conjunctive Queries](https://img.pdfslide.us/doc/110x75/5695d2de1a28ab9b029c044a/slide-containment-conjunctive-queries.jpg)