Embed Size (px)
Citation preview
ConjointAnalysisandMDSApproach toBrandImprovementofanAerosolProduct
Vincent Charles *CENTRUM Católica, Lima, Peru
Mukesh KumarCENTRUM Católica, Lima, Peru
Tulika AnandNational Institute of Entrepreneurship, Noida, India
Abstract
Consumers decide which aerosol product to purchase depending upon its different features or attributes. The importance that consumers give to each attribute, however, differs from one consumer to another. The ability to identify the importance of different attributes of aerosols from the consumers’ perspective is essential for improving an existing brand or launching a completely new brand of aerosol. The purpose of this study is to identify feasible offerings of aerosols from a company’s point of view and the positioning of a comparatively new brand of room air freshener among all other existing brands in the capital city of Bihar (Patna) in India. The study makes use of conjoint analysis and the multidimensional scaling technique to identify (a) the attributes of the room air freshener and their corresponding levels from the consumers’ perspective, (b) the importance of each attribute of the room air freshener and its contribution in influencing the consumers’ purchase decision, (c) the best and the worst combinations of attributes and their levels from the consumers’ point of view, and (d) the potential opportunities for the new brand of room air freshener in the perceptual map of the consumers’ mind.
Keywords: conjoint analysis, MDS, aerosol product
Ambient fragrances have, over the years, transitioned from being commodity level products to luxury products, driven largely by the evolving tendency of consumers towards spending increasing amounts of time and money to create the ideal atmosphere in the home. Room air fresheners no longer simply impart a pleasant fragrance; they are also touted by manufacturers to possess healing and curative properties, among other benefits. Adroit manufacturers promote room air fresheners as lifestyle products symbolic of the cultural and emotional uniqueness of the homeowners. The word aerosol refers to a complete, ready-to-use package incorporating a container with a valve and a product which is dispensed by controlled pressure when the valve is operated. Room air fresheners are aerosols, and they are also referred to as spray cans. The aerosol market in India, though small, is highly diversified and growing at a very rapid rate due to a liberalization policy and the entry of a number of multinational companies in the country. The Aerosol Promotion Council (APC) was
Journal of
CENTRUM
Cathedra
JCC
Journal of CENTRUM Cathedra ● Volume 4, Issue 1, 2011 ● 27-43
28 Conjoint Analysis and MDS Approach to Brand Improvement of an Aerosol Product
set up in 1984 with the objective of promoting aerosols as a popular option, and it has been actively involved since 2002 in promoting the Indian aerosol industry to a global audience.
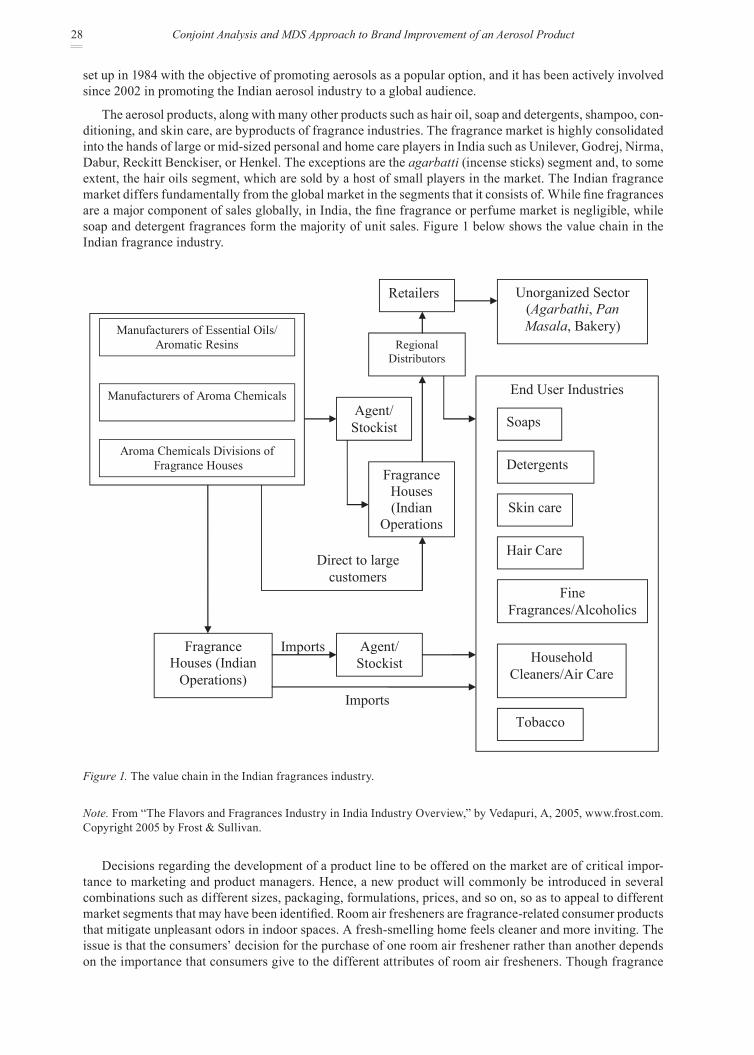
The aerosol products, along with many other products such as hair oil, soap and detergents, shampoo, con-ditioning, and skin care, are byproducts of fragrance industries. The fragrance market is highly consolidated into the hands of large or mid-sized personal and home care players in India such as Unilever, Godrej, Nirma, Dabur, Reckitt Benckiser, or Henkel. The exceptions are the agarbatti (incense sticks) segment and, to some extent, the hair oils segment, which are sold by a host of small players in the market. The Indian fragrance market differs fundamentally from the global market in the segments that it consists of. While fine fragrances are a major component of sales globally, in India, the fine fragrance or perfume market is negligible, while soap and detergent fragrances form the majority of unit sales. Figure 1 below shows the value chain in the Indian fragrance industry.
Figure 1. The value chain in the Indian fragrances industry.
Note. From “The Flavors and Fragrances Industry in India Industry Overview,” by
Vedapuri, A, 2005, www.frost.com. Copyright 2005 by the Frost & Sullivan.
Agent/ Stockist
Fragrance Houses (Indian
Operations
Regional Distributors
Retailers Unorganized Sector (Agarbathi, Pan Masala, Bakery)
End User Industries
Fragrance Houses (Indian
Operations)
Agent/ Stockist
Soaps
Detergents
Skin care
Hair Care
Fine Fragrances/Alcoholics
Household Cleaners/Air Care
Tobacco
Imports
Imports
Direct to large customers
Manufacturers of Essential Oils/ Aromatic Resins
Manufacturers of Aroma Chemicals
Aroma Chemicals Divisions of Fragrance Houses
Figure 1. The value chain in the Indian fragrances industry.
Note. From “The Flavors and Fragrances Industry in India Industry Overview,” by Vedapuri, A, 2005, www.frost.com. Copyright 2005 by Frost & Sullivan.
Decisions regarding the development of a product line to be offered on the market are of critical impor-tance to marketing and product managers. Hence, a new product will commonly be introduced in several combinations such as different sizes, packaging, formulations, prices, and so on, so as to appeal to different market segments that may have been identified. Room air fresheners are fragrance-related consumer products that mitigate unpleasant odors in indoor spaces. A fresh-smelling home feels cleaner and more inviting. The issue is that the consumers’ decision for the purchase of one room air freshener rather than another depends on the importance that consumers give to the different attributes of room air fresheners. Though fragrance

29Conjoint Analysis and MDS Approach to Brand Improvement of an Aerosol Product
is an important factor that influences the purchase decision, it is not the only factor. Thus, depending upon the importance of different attributes from the consumers’ perspective, the sets of feasible offerings can be suggested using conjoint analysis.
In this paper, we address a number of issues related to an aerosol product (room air freshener) produced by one of the leading manufacturing companies in India. The company ABC1 is known for creating distinct and unique fragrances, and it has the advantage of being the market leader in the production of agarbatti, a product composed of aromatic biotic materials that release fragrant smoke when burned. With the expansion of the Indian market and the increasing demand for export, the company stared diversifying through the produc-tion of aerosol products alongside agarbatti because of its base in developing different types of fragrance to meet the tastes of different market segments. Some of the well-established room air freshener brands offered on the market are Archies, Premium, Ambipur, Lomani, and Yarlay. The company ABC launched the new brand ZZZ2 in several fragrances such as primrose, lavender, sandalwood, and jasmine with the intention of becoming the market leader in this line of production. However, the new brand ZZZ failed to reach the expected target in some of the regions, including the capital city of Bihar. The purpose of the present study is to consider some of the problems related to the aerosol brand ZZZ from both the management’s and the consumers’ perspectives, as described below.
Management’s PerspectiveFrom management’s perspective, we aim • to understand the feasible offerings of the aerosol product (room air freshener);• to identify the position of the ZZZ room air freshener in the minds of consumers and to identify the
potential opportunities for the brand ZZZ.
Consumers’ PerspectiveFrom the potential consumers’ perspective, we aim • to identify the attributes of the aerosol product and their levels;• to identify the importance of each attribute and its corresponding levels;• to identify the consumers’ preferences from all possible combinations of attributes of the aerosol product;• to identify the brand positioning of current brands of room air fresheners available in the Patna region
on the selected dimensions;• to look for gaps in the spatial map in order to identify potential opportunities for the brand ZZZ room
air freshener.
In order to consider the problems of the brand ZZZ from the above two perspectives, we address the fol-lowing market research questions through conjoint analysis and multidimensional scaling (MDS):
1. What are the attributes of the room air freshener and their corresponding possible levels from the consumers’ perspectives?
2. Which attribute of the room air freshener is perceived as more important by consumers, hence influ-encing their purchase decision?
3. What is the contribution of each attribute and its corresponding levels in influencing the consumers’ purchase decision?
4. Which are the best and the worst combinations of attributes and their levels from the consumers’ point of view?
5. Where do consumers place ZZZ room air freshener in their minds in terms of the selected dimensions?6. Where do consumers place other brands of room air freshener in their minds in terms of the selected
dimensions?7. Where do the potential opportunities for ZZZ room air freshener lie in the perceptual map of con-
sumers’ mind?
30 Conjoint Analysis and MDS Approach to Brand Improvement of an Aerosol Product
LiteratureReviewIn marketing science, the concept of modeling consumer preferences among multi-attribute alternatives has
received extensive attention. A product is anything that can be offered in the market for attention, acquisition, use, or consumption in order to satisfy the wants or needs of consumers (Lilien & Rangaswamy, 1998). The marketer’s aim is to characterize a product into a bundle of attributes and assign levels for each attribute. A technique known as conjoint analysis is used to obtain the numerical values of the product. Conjoint analysis is a popular marketing research technique that breaks down attributes to derive the part-worth associated with each level of a product based on the overall preferences of choice alternatives by a group of respondents (Reutterer & Kotzab, 2000).
Since its introduction in 1971 (Green & Rao, 1971; Green & Srinivasan, 1990; Green, Wind & Rao, 1999), conjoint analysis has become one of the marketing research tools most widely adopted by researchers and practitioners (Baumgartner & Steiner, 2007; Camm, Cochran, Curry, & Kannan, 2006; Cattin & Wittink, 1982; Chen & Hausman, 2000; Jedidi & Zhang, 2002; Lynch, Buzas, & Berg, 1994; Vermeulen, Goos, & Vandebroek, 2008; Wittink & Cattin, 1989; Wittink, Vriens, & Burhenne, 1994; Wuyts, Verhoef, & Prins, 2009). Understanding its importance and wider applicability, researchers have made numerous attempts to develop new estimation techniques to improve conjoint analysis. Some of the resulting models are the hybrid model (Green & Krieger,1996), Bayesian estimation (Allenby & Ginter, 1995; Kim, Menzefricke, & Feinberg, 2007; Otter, Tuchler, & Fruhwirth-Schnatter, 2004), polyhedral methods (Toubia, Hauser, & Simester, 2004; Toubia, Simester, Hauser, & Dahan, 2003), partial conjoint profiles (Bradlow, Hu, & Ho, 2004), and more recently, incentive-align conjoint experiments (Dong, Ding, & Huber, 2010).
Conjoint analysis is used to study the factors that influence consumers’ purchasing decisions. Traditionally, marketers use conjoint analysis for conducting competitive analyses, segmenting markets, making product design decisions, and evaluating new product opportunities. In the discipline of marketing, conjoint analysis can be applied in health care (Ryan & Farrar, 2000; Van der Pol & Cairns, 1998), energy policies (Chen, 2001; Farber & Griner, 2000), investment decisions (Shepherd & Zacharakis, 1999; Charles, Shanmugam, & Idris, 2007 ) and educational institutions (Charles, 2007; Soutar & Turner, 2002), among many applications. Green and Srinivasan (1978; 1990) have explained its role in consumer and marketing research; in the field of engineer-ing, Grissom, Belegundu, Rangaswamy, and Koopmann (2006) have applied it to acoustic design. Marketing applications of conjoint analysis include, but are not confined to, market segmentation (Green & DeSarbo, 1979; Green & Krieger, 1991), product design (Green & Krieger, 1989; Green & Krieger, 1992), product line optimization (Green & Krieger, 1985; Page & Rosenbaum, 1987), and industrial and durable product concept testing (Acito & Hustad, 1981; Page & Rosenbaum, 1992). A survey of more than 1,000 commercial applica-tions enabled Cattin and Wittink (1982) and Wittink and Cattin (1989) to illustrate the wide use of conjoint analysis; they found that a majority of these applications are related to the new product development process.
The application of conjoint analysis in the United States has been paralleled in other parts of the world including Europe (Hair, Anderson, Tatham, & Black, 1998). Sudman and Blair (1998) have warned that it is not a data analysis procedure like factor analysis or cluster analysis. Instead, it must be regarded as a type of “thought experiment” (Sudman & Blair, 1998, pp. 229-230) designed to show how various elements of products or services, such as price, brand, or style, predict customer preferences for a product or service. Kotler (2000) defined conjoint analysis as “a method for deriving the utility values that consumers attach to varying levels of a product’s attributes” (p. 339). Churchill and Iacobucci (2002) referred to conjoint analysis as “conjoint measurement, which relies on the ability of respondents to make judgments about stimuli” (p. 748). These stimuli represent some predetermined combinations of attributes; during a laboratory experiment, respondents are asked to make judgments about their preferences for various attribute combinations. The basic aim of the procedure, therefore, is to determine the features respondents most prefer. From the definitions given above, it is clear that conjoint studies centre on certain attributes of products or services and various levels within each attribute.
Three types of maps are especially popular among professional marketing researchers who can use a variety of statistical techniques to generate each type of map. The three types of maps are the following:
1. Perceptual maps, which are used to identify the images of brands, products, services and so on; these maps are usually constructed via multidimensional scaling/multiple discriminant function/correspondence analysis.

31Conjoint Analysis and MDS Approach to Brand Improvement of an Aerosol Product
2. Preference maps, which estimate differences among segments or individuals in the appeal or at-tractiveness of brands, products, services, features. These maps are typically developed by a form of multidimensional unfolding.
3. Hybrid maps, which portray both images and appeal. These maps are composed by first devising a perceptual map and then inserting preferences as “ideal points” or as “vectors”.
Among these three types of maps, multidimensional scaling (MDS) is most widely used to portray a brand’s image or consumers’ reactions to product features. MDS is a set of data analysis techniques that display the structure of distance-like data as a geometrical picture. MDS has its origins in psychometrics, where it was proposed to help understand people’s judgments regarding the similarity of members of a set of objects. Torg-erson (1952) proposed the first MDS method, originally evolved from the work of Richardson (1938). MDS has now become a general data analysis technique used in a wide variety of fields3,4 (Schiffman, Reynolds, & Young, 1981). MDS shows the structure of a set of objects from data that approximate the distances between pairs of such objects. The data, which are called similarities, dissimilarities, distances, or proximities, must reflect the amount of dissimilarity between pairs of the object. Each object or event is represented by a point in a multidimensional space. The points are arranged in this space so that the distances between pairs of points have the strongest possible relation to the similarities among the pairs of objects. In other words, two similar objects are represented by two points that are close together, and two dissimilar objects are represented by two points that are far apart. The space is usually two- or three-dimensional Euclidean space, but may be non-Euclidean and may have more dimensions.
ResearchMethodology
Sampling Design Process
• Instrument In the process of developing the instrument, an exploratory research design was used to provide insight on
how to develop the attributes for conjoint analysis. We conducted interviews and group discussions with the officials of the company to obtain their insight on the attributes of the aerosol product from the consumers’ perspective. In addition, we conducted a qualitative interview with 25 randomly selected consumers of the aerosol product before finalizing the possible attributes and their levels, shown in Table 1.
• Target PopulationThe target population for the study was defined as follows:
1. Elements: Users of the aerosol product (room air freshener) in the Patna region;2. Sampling units: Consumers from commercial organizations located in the Patna region;3. Extent: The Patna region.
• Sampling TechniqueIn a strict sense, the use of probability sampling becomes difficult in practice when the population size is
unknown. Even if the population size is known, it is difficult to implement the probability sampling in prac-tice because (a) the population size is generally very large in consumer research, and (b) even if the target sampling units are identified by using probabilistic sampling, there is no guarantee that researchers can make them willing to participate in the survey. In addition, time, distance, and cost factors further discourage the choice of probability sampling. Thus, the convenient sampling technique, a nonprobability sampling method, was used to collect the data.
• Sample SizeGeneral guidelines indicate that the sample size is chosen according to a number of factors such as the
conjoint methodology to be used, the number of conjoint questions, whether subsets of respondents or results from the whole set are compared, and the homogeneity of the elements of the population. While traditional conjoint analysis has no sample size requirements and could be utilized for a single respondent (Hair et al., 1998), a larger sample size enhances the reliability of the results and allows researchers to make generalizations. Green and Srinavasan (1978) suggested a minimum sample of 100 respondents to provide reliable estimates.
32 Conjoint Analysis and MDS Approach to Brand Improvement of an Aerosol Product
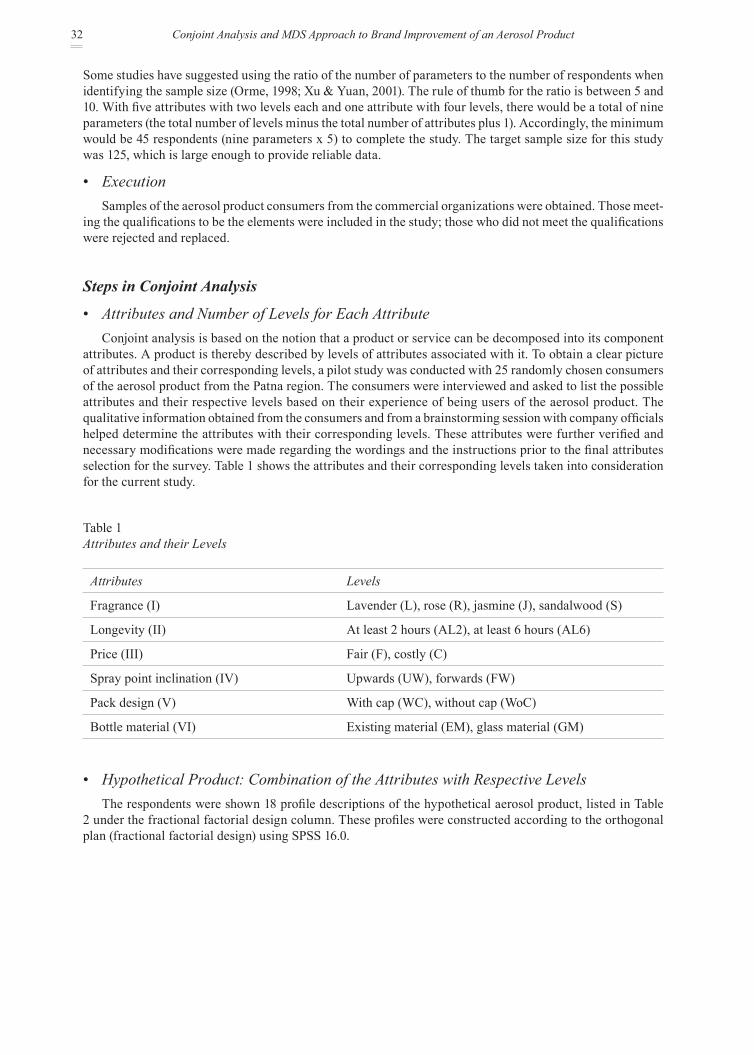
Some studies have suggested using the ratio of the number of parameters to the number of respondents when identifying the sample size (Orme, 1998; Xu & Yuan, 2001). The rule of thumb for the ratio is between 5 and 10. With five attributes with two levels each and one attribute with four levels, there would be a total of nine parameters (the total number of levels minus the total number of attributes plus 1). Accordingly, the minimum would be 45 respondents (nine parameters x 5) to complete the study. The target sample size for this study was 125, which is large enough to provide reliable data.
• ExecutionSamples of the aerosol product consumers from the commercial organizations were obtained. Those meet-
ing the qualifications to be the elements were included in the study; those who did not meet the qualifications were rejected and replaced.
Steps in Conjoint Analysis
• Attributes and Number of Levels for Each Attribute Conjoint analysis is based on the notion that a product or service can be decomposed into its component
attributes. A product is thereby described by levels of attributes associated with it. To obtain a clear picture of attributes and their corresponding levels, a pilot study was conducted with 25 randomly chosen consumers of the aerosol product from the Patna region. The consumers were interviewed and asked to list the possible attributes and their respective levels based on their experience of being users of the aerosol product. The qualitative information obtained from the consumers and from a brainstorming session with company officials helped determine the attributes with their corresponding levels. These attributes were further verified and necessary modifications were made regarding the wordings and the instructions prior to the final attributes selection for the survey. Table 1 shows the attributes and their corresponding levels taken into consideration for the current study.
Table 1Attributes and their Levels
Attributes Levels
Fragrance (I) Lavender (L), rose (R), jasmine (J), sandalwood (S)
Longevity (II) At least 2 hours (AL2), at least 6 hours (AL6)
Price (III) Fair (F), costly (C)
Spray point inclination (IV) Upwards (UW), forwards (FW)
Pack design (V) With cap (WC), without cap (WoC)
Bottle material (VI) Existing material (EM), glass material (GM)
• Hypothetical Product: Combination of the Attributes with Respective LevelsThe respondents were shown 18 profile descriptions of the hypothetical aerosol product, listed in Table
2 under the fractional factorial design column. These profiles were constructed according to the orthogonal plan (fractional factorial design) using SPSS 16.0.

33Conjoint Analysis and MDS Approach to Brand Improvement of an Aerosol Product
Table 2Design Matrix
Profile N° Status Fractional factorial design Profile N° Status Fractional factorial design
1 D S:AL6: F:FW: WC:GM 10 D S:AL6:F:FW:WC:EM
2 D R:AL2:C:UW:WoC:GM 11 H S:AL2:C:FW:WoC:EM
3 D J:AL2:F:FW:WC:GM 12 D J:AL2:F:UW:WoC:EM
4 D R:AL2:C::FW: WC:EM 13 D S:AL6:C:UW:WC:GM
5 D S:AL6:F:UW:WoC:EM 14 D R:AL6:F:UW:WC:EM
6 D J:AL6:C:FW:WoC:EM 15 D J:AL2:C:FW:WC:EM
7 D L:AL2:F:FW:WoC:GM 16 H L:AL6:C:FW:WC:EM
8 D R:AL6:F:FW:WoC:GM 17 D J:AL6:C:UW:WC:GM
9 D L:AL2:F:UW:WC:EM 18 D L:AL6:C:UW:WoC:GM
Note: D and H stand for design and holdout respectively
• Survey Design and ConductThere are several methods of eliciting preferences: customers may be asked to rank order all the products,
rate all the products on a scale (e.g., 0-100), or effect a pair comparison of the products. In the present study, the rank order (nonmetric) method was used. A sample of 125 respondents from commercial organizations was chosen from the Patna region based on the criteria that they must have used an aerosol product in the previous two months. The respondents were asked to rank the 18 hypothetical products shown in Table 2 according to their own preferences. On average, a respondent took 30 minutes to complete the entire survey designed for the conjoint study. The sample consisted of 30.4% female and 69.6% male respondents. The average age of the respondents was 42.5 years, and 73.6% of the respondents were in the 35-49 years age group. Respondents belonging to the 26-34 years age group contributed 13.6% of the sample. The rest of the sample belonged to the 50-59 years age group. On average, the respondents constituting the sample had been using room air fresheners for the previous 6 years. The sample was thus adequate for the present study.
• Estimating UtilitiesThere are two broad spectrums of techniques to estimate utilities: nonmetric and metric5. The part-worths
(marginal utilities) are estimated through the dummy variable regression with the respondents’ aggregated ranking as the dependent variable and the indicators of the various levels of the attributes as the independent variables. Then, the coefficient of each independent variable is the part-worth corresponding to that level of the attribute.
The mathematical expression of a 9 (number of levels – number of attributes +1 = 14-6+1) parameters dummy regression model is as follows:
0, f
f fl l
f F l lY u u X ε
∈ ∈
= + +∑
where F represents the set of attributes, lf represents the set of respective levels of the attribute f, Y is the respondent’s preference for the product concept, 0u is the constant or the intercept term, f
lu are weights (part-worth utilities) for the features, f
lX is the dummy variable for level l on attribute f, and ε is an error term. In this formulation of the model, coefficients for the reference levels are equal to 0. The solution minimizes the sum of squares of the errors in prediction over all the observations. The part-worth utilities of the reference levels 6( ; ; ; ; ; )I II III IV V VI
S AL C FW WoC GMu u u u u u are estimated by considering the concept that the condition of the sum of utilities is zero, that is,
0, .f
fl
l lu f F
∈
= ∈∑
34 Conjoint Analysis and MDS Approach to Brand Improvement of an Aerosol Product
• Calculating the Weight of Different Attributes (Averaged Importance) For each attribute, we computed the difference between the highest utility level and the lowest utility
level, that is, the range of the levels of each attribute. The weight of each attribute is its relative share of these numbers. The weight of the attributes can be calculated as
FflluMinlluMaxR ff
lff
lf ∈∈−∈= ),/()/(
This is a popular summary number of how important a particular attribute is for the consumers. The rela-tive importance of each attribute can be calculated as
100 /f f ff F
RI R R∈
= ∑
• Calculating Utilities for Specific Products We encoded the new product in terms of dummy variables and then plugged into the regression
equation, using the coefficients that were derived from the study.
Steps in MDS
• Formulating the ProblemFive well-established brands in the market, namely Archies, Premium, Ambipur, Lomani, and Yarlay,
were compared to the new brand of room air freshener, ZZZ, so as to determine the potential opportunities for ZZZ in the perceptual map of the consumers’ mind.
• Obtaining Input DataThe consumers were asked to rate the similarity of pairs of six brands (ZZZ, Archies, Premium, Ambi-
pur, Lomani and Yarlay) on a rating scale of 1 to 7, where a higher rating indicates more similarity between the brands. The first question related to the pair ZZZ/Archies, the second to ZZZ/Premium, and so on. The number of questions is a function of the number of brands and can be calculated as Q = N (N − 1) / 2 where Q is the number of questions and N is the number of brands. This approach is referred to as the perception data: direct approach.
• Running the MDS Statistical ProgramOften, there is a choice between metric MDS (which deals with interval or ratio level data), and nonmetric
MDS (which deals with ordinal data). We used SPSS 16.0 to run metric MDS. It is important to note that the greater number of dimensions, the better the statistical fit, but the more difficult it is to interpret the results.
• Mapping the Results and Defining the DimensionsThe map plots each product, usually in two-dimensional space. The proximity of products to each other
indicates how similar they are. Subjective judgment enables the labeling of the plot dimensions.
• Testing the Results for Reliability and ValidityThe Kruskal’s stress and R2 measures were used to test the reliability and validity of the MDS results;
Kruskal’s stress is the most commonly used measure for determining the MDS model’s goodness of fit. An R2 of 0.6 is considered the minimum acceptable level for the validity of the MDS analysis.
35Conjoint Analysis and MDS Approach to Brand Improvement of an Aerosol Product
Results and DiscussionThe data were entered into SPSS, cleaned for outliers and missing data, and analyzed using SPSS 16.0.
Conjoint utilities (part-worths) are scaled to an arbitrary additive constant within each attribute. The arbitrary origin on the scaling within each attribute results from the dummy coding in the design matrix (Table 2). In this study, the part-worth of one level within each attribute was arbitrarily set to zero to estimate the remain-ing levels as contrasts with respect to zero.
Table 3Model Summary (b, c)
R R2 Adjusted R2 Std. error of the estimate
0.987(a) 0.975 0.946 1.2662a Predictors: (Constant), Existing material, upwards, rose, with cap, fair, at least 2 hours, jasmine, lavender, b Dependent variable: Aggregate rank, c Status = design.
Table 4ANOVA(b, c)
Sum of squares df Mean square F Sig.
Regression 430.527 8 53.816 33.566 .000(a)
Residual 11.223 7 1.603
Total 441.750 15a Predictors: (Constant), Existing material, upwards, rose, with cap, fair, at least 2 hours, jasmine, lavender, b Dependent variable: Aggregate rank, c Status = design.
Table 5Estimates of Dummy Variables Regression Model
Unstandardized coefficients
Standardized coefficients t-value Sig.
B Std. error Beta(Constant) 8.516 0.786 10.835 0.000Lavender -5.800 0.678 -0.727 -8.552 0.000Rose -0.702 0.558 -0.094 -1.257 0.249Jasmine 1.515 0.557 0.215 2.719 0.030At least 2 hours -3.790 0.780 -0.358 -4.857 0.002Fair 2.670 0.681 0.252 3.918 0.006Upwards -0.101 0.665 -0.010 -0.152 0.884With cap 0.998 0.692 0.094 1.443 0.192Existing material -0.149 0.665 -0.014 -0.224 0.829

36 Conjoint Analysis and MDS Approach to Brand Improvement of an Aerosol Product
Table 6Residuals Statistics and Test of Normality
Minimum Maximum Mean SD nPredicted value 0.297 17.542 9.625 5.357 16Residual -1.443 1.378 0.000 0.865 16Std. predicted value -1.741 1.478 0.000 1.000 16Std. residual -1.139 1.088 0.000 0.683 16
Test of Normality Kolmogorov-Smirnov Shapiro-WilkStatistic df Sig. Statistic df Sig.
Unstandardized residual 0.134 16 0.200 0.951 16 0.509
Table 7Utilities for Conjoint Analysis
Factor Levels Utility estimate
Range utility
Relative importance
(%)
Rank
Fragrance
Lavender -5.800 10.787 39.283 1Rose -0.702Jasmine 1.515Sandalwood 4.987
LongevityAt least 2 hours -3.790 7.58 29.854 2At least 6 hours 3.790
PriceFair 2.670 5.34 21.032 3Costly -2.670
Spray point inclinationUpwards -0.101 0.202 0.796 6Forward 0.101
Pack designWith cap 0.998 1.996 7.861 4Without cap -0.998
Bottle materialExisting material -0.149 0.298 1.174 5Glass material 0.149
Constant 8.516 - - -Correlation Values Significance
Pearson’s R 0.987* 0.000Kendall’s tau 0.933* 0.000Kendall’s tau for 2 holdouts 1.000* 0.000
Note: *indicates that the coefficient is statistically significant at 99% level of confidence
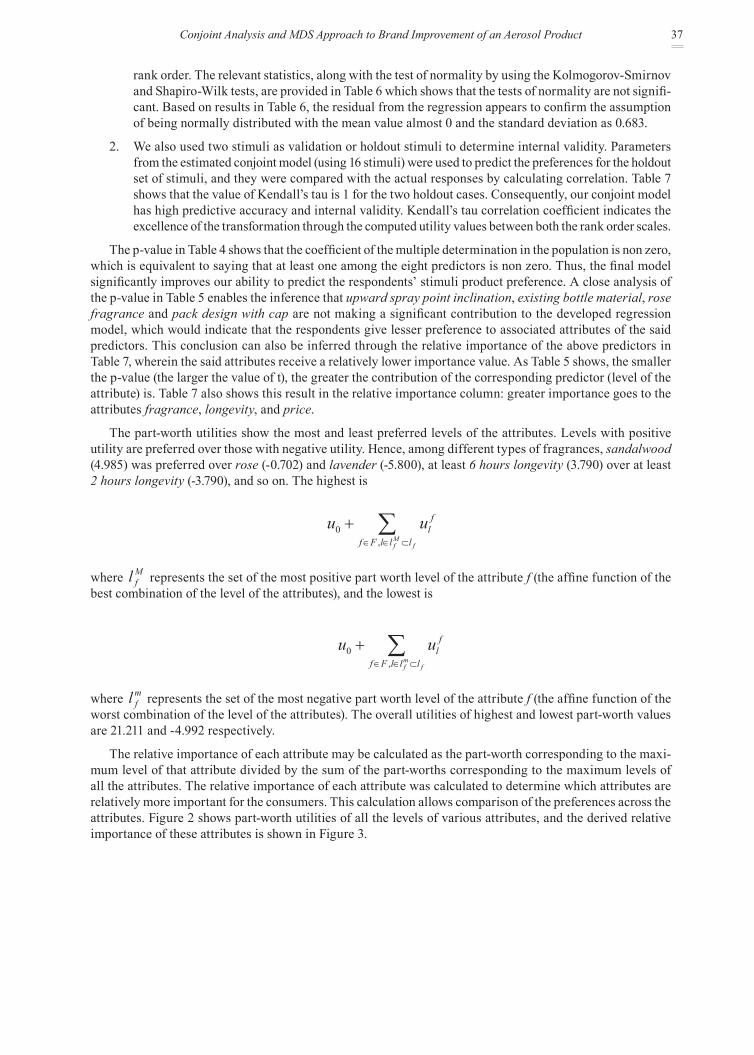
Tables 3 to 6 show the outputs for the dummy variables regression. The conjoint analysis results should be assessed for accuracy, reliability, and validity. The objective is to ascertain how consistently the model predicts the set of preference evaluations under different situations. Our results, derived from the conjoint analysis, are found to be reliable and valid for the following reasons:
1. While evaluating the goodness of fit of the estimated conjoint model, we found that the value of Ken-dall‘s tau is 0.933 (Table 7), the value of Pearson‘s R is 0.987 (Table 3), and the value of adjusted R2 is 0.946 (Table 3). These values are reasonably high and significant at 99% level of confidence (asymptotic significance =0.000). The Pearson’s correlation coefficient value indicates the excellence of the trans-formation through the computed part-worth utility and scores between overall utility and the actual
37Conjoint Analysis and MDS Approach to Brand Improvement of an Aerosol Product
rank order. The relevant statistics, along with the test of normality by using the Kolmogorov-Smirnov and Shapiro-Wilk tests, are provided in Table 6 which shows that the tests of normality are not signifi-cant. Based on results in Table 6, the residual from the regression appears to confirm the assumption of being normally distributed with the mean value almost 0 and the standard deviation as 0.683.
2. We also used two stimuli as validation or holdout stimuli to determine internal validity. Parameters from the estimated conjoint model (using 16 stimuli) were used to predict the preferences for the holdout set of stimuli, and they were compared with the actual responses by calculating correlation. Table 7 shows that the value of Kendall’s tau is 1 for the two holdout cases. Consequently, our conjoint model has high predictive accuracy and internal validity. Kendall’s tau correlation coefficient indicates the excellence of the transformation through the computed utility values between both the rank order scales.
The p-value in Table 4 shows that the coefficient of the multiple determination in the population is non zero, which is equivalent to saying that at least one among the eight predictors is non zero. Thus, the final model significantly improves our ability to predict the respondents’ stimuli product preference. A close analysis of the p-value in Table 5 enables the inference that upward spray point inclination, existing bottle material, rose fragrance and pack design with cap are not making a significant contribution to the developed regression model, which would indicate that the respondents give lesser preference to associated attributes of the said predictors. This conclusion can also be inferred through the relative importance of the above predictors in Table 7, wherein the said attributes receive a relatively lower importance value. As Table 5 shows, the smaller the p-value (the larger the value of t), the greater the contribution of the corresponding predictor (level of the attribute) is. Table 7 also shows this result in the relative importance column: greater importance goes to the attributes fragrance, longevity, and price.
The part-worth utilities show the most and least preferred levels of the attributes. Levels with positive utility are preferred over those with negative utility. Hence, among different types of fragrances, sandalwood (4.985) was preferred over rose (-0.702) and lavender (-5.800), at least 6 hours longevity (3.790) over at least 2 hours longevity (-3.790), and so on. The highest is
0,
,Mf f
fl
f F l l l
u u∈ ∈ ⊂
+ ∑
where Mfl represents the set of the most positive part worth level of the attribute f (the affine function of the
best combination of the level of the attributes), and the lowest is
0,
,mf f
fl
f F l l l
u u∈ ∈ ⊂
+ ∑
where mfl represents the set of the most negative part worth level of the attribute f (the affine function of the
worst combination of the level of the attributes). The overall utilities of highest and lowest part-worth values are 21.211 and -4.992 respectively.
The relative importance of each attribute may be calculated as the part-worth corresponding to the maxi-mum level of that attribute divided by the sum of the part-worths corresponding to the maximum levels of all the attributes. The relative importance of each attribute was calculated to determine which attributes are relatively more important for the consumers. This calculation allows comparison of the preferences across the attributes. Figure 2 shows part-worth utilities of all the levels of various attributes, and the derived relative importance of these attributes is shown in Figure 3.

38 Conjoint Analysis and MDS Approach to Brand Improvement of an Aerosol Product
Fragrance
6
4
2
0
-2
-4
-6
-8Longetivity Price
Spray point inclination
Pack DesignBottle
Material
Figure 2. Part-worth (utilities) of various attributes.
Fragrance
45
40
35
30
25
20
15
10
5
0
Longetivity Price Spray point inclination
Pack Design
Bottle Material
Figure 3. The relative importance of various attributes.
Perceptual mapping of the selected brands of the aerosol productThe determination of how many dimensions are actually represented in the data is generally reached through
one of three approaches: subjective evaluation, scree plots of the stress measures, or an overall index of fi t. We used scree plots of the stress measures; this approach uses stress measure, which indicates the proportion of the variance of the disparities not accounted for by the MDS model. Kruskal’s stress is the most commonly used measure for determining the goodness of fi t of the MDS model. Stress is minimized when the objects are placed in a confi guration so that the distances between the objects best match the original distances.
On the basis of the output of the MDS, we decided to use a three-dimensional solution for the interpretation as the stress value for a three-dimensional solution was less than the stress value for two- and one-dimensional solutions. Table 8 shows the stress values for all the dimensions, and Figure 4 shows the scree plots. The stress value of 5.2% for a three-dimensional solution indicates a good fi t as any value less than 10% is considered good. Table 9 shows the three-dimensional coordinates of the six brands of the aerosol product, including the brand ZZZ.
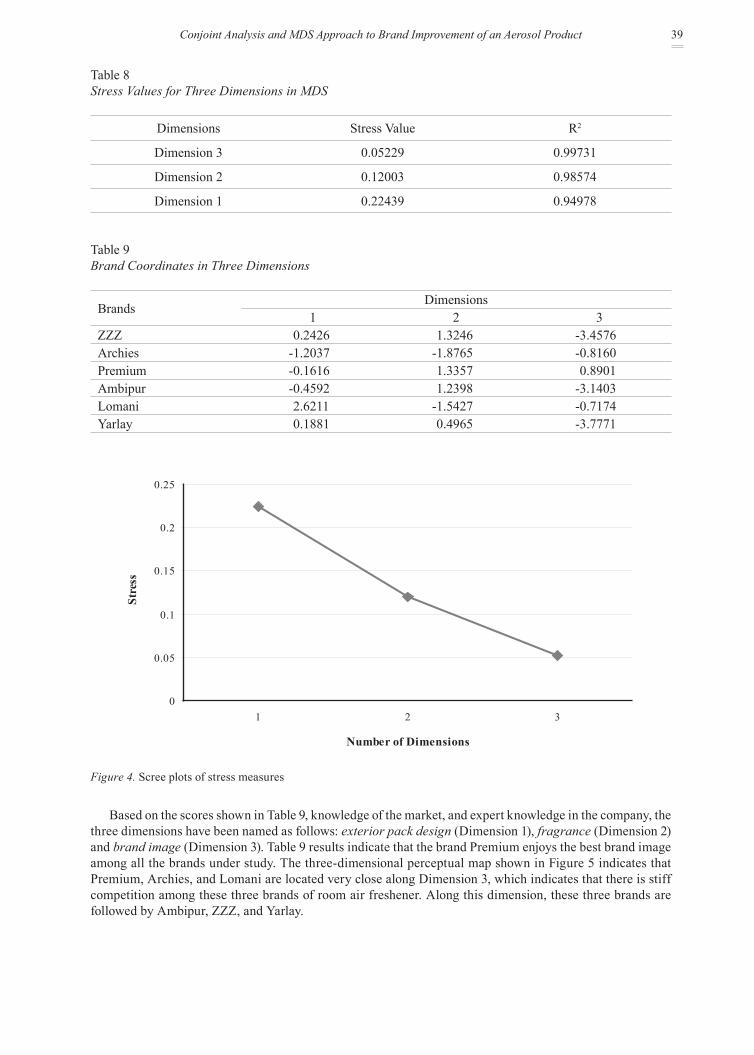
39Conjoint Analysis and MDS Approach to Brand Improvement of an Aerosol Product
Table 8Stress Values for Three Dimensions in MDS
Dimensions Stress Value R2
Dimension 3 0.05229 0.99731
Dimension 2 0.12003 0.98574
Dimension 1 0.22439 0.94978
Table 9Brand Coordinates in Three Dimensions
BrandsDimensions
1 2 3ZZZ 0.2426 1.3246 -3.4576Archies -1.2037 -1.8765 -0.8160Premium -0.1616 1.3357 0.8901Ambipur -0.4592 1.2398 -3.1403Lomani 2.6211 -1.5427 -0.7174Yarlay 0.1881 0.4965 -3.7771
0
0.05
0.1
0.15
0.2
0.25
1 2 3
Number of Dimensions
Stre
ss
Figure 4. Scree plots of stress measures
Based on the scores shown in Table 9, knowledge of the market, and expert knowledge in the company, the three dimensions have been named as follows: exterior pack design (Dimension 1), fragrance (Dimension 2) and brand image (Dimension 3). Table 9 results indicate that the brand Premium enjoys the best brand image among all the brands under study. The three-dimensional perceptual map shown in Figure 5 indicates that Premium, Archies, and Lomani are located very close along Dimension 3, which indicates that there is stiff competition among these three brands of room air freshener. Along this dimension, these three brands are followed by Ambipur, ZZZ, and Yarlay.
40 Conjoint Analysis and MDS Approach to Brand Improvement of an Aerosol Product
-1.00 0.00 1.00 2.00 3.00D1
-2.00
-1.00
0.00
1.00
2.00
D2
-4.00-3.00-2.00-1.000.001.00D3
1
2
3
4
5
6
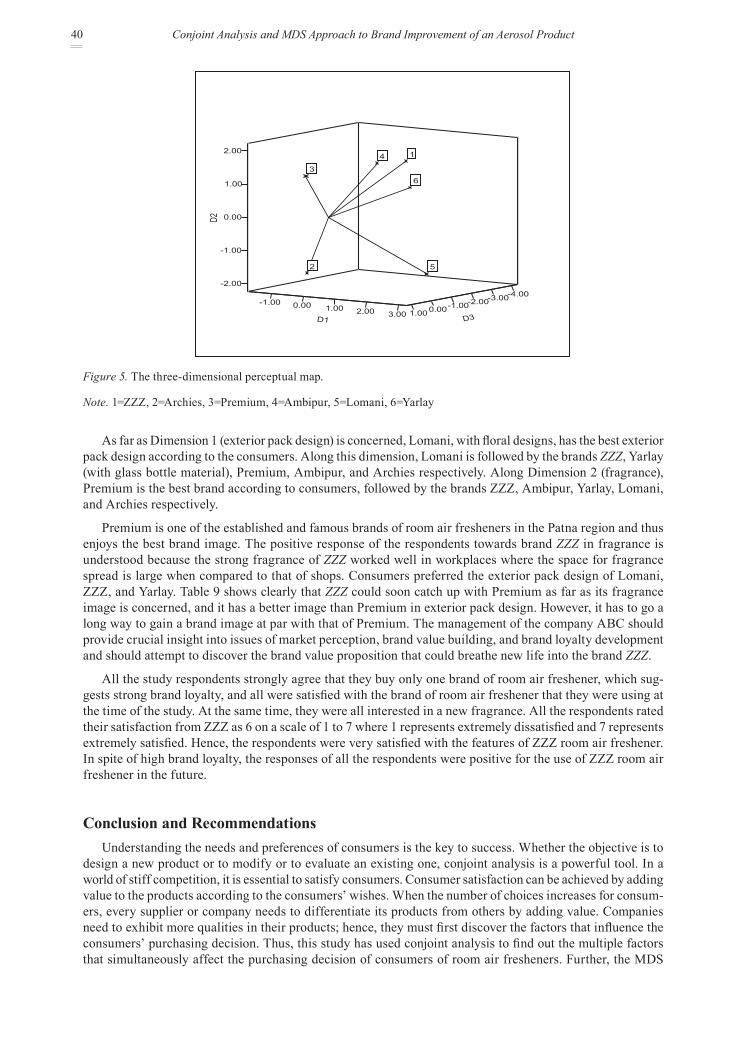
Figure 5. The three-dimensional perceptual map.
Note. 1=ZZZ, 2=Archies, 3=Premium, 4=Ambipur, 5=Lomani, 6=Yarlay
As far as Dimension 1 (exterior pack design) is concerned, Lomani, with floral designs, has the best exterior pack design according to the consumers. Along this dimension, Lomani is followed by the brands ZZZ, Yarlay (with glass bottle material), Premium, Ambipur, and Archies respectively. Along Dimension 2 (fragrance), Premium is the best brand according to consumers, followed by the brands ZZZ, Ambipur, Yarlay, Lomani, and Archies respectively.
Premium is one of the established and famous brands of room air fresheners in the Patna region and thus enjoys the best brand image. The positive response of the respondents towards brand ZZZ in fragrance is understood because the strong fragrance of ZZZ worked well in workplaces where the space for fragrance spread is large when compared to that of shops. Consumers preferred the exterior pack design of Lomani, ZZZ, and Yarlay. Table 9 shows clearly that ZZZ could soon catch up with Premium as far as its fragrance image is concerned, and it has a better image than Premium in exterior pack design. However, it has to go a long way to gain a brand image at par with that of Premium. The management of the company ABC should provide crucial insight into issues of market perception, brand value building, and brand loyalty development and should attempt to discover the brand value proposition that could breathe new life into the brand ZZZ.
All the study respondents strongly agree that they buy only one brand of room air freshener, which sug-gests strong brand loyalty, and all were satisfied with the brand of room air freshener that they were using at the time of the study. At the same time, they were all interested in a new fragrance. All the respondents rated their satisfaction from ZZZ as 6 on a scale of 1 to 7 where 1 represents extremely dissatisfied and 7 represents extremely satisfied. Hence, the respondents were very satisfied with the features of ZZZ room air freshener. In spite of high brand loyalty, the responses of all the respondents were positive for the use of ZZZ room air freshener in the future.
ConclusionandRecommendationsUnderstanding the needs and preferences of consumers is the key to success. Whether the objective is to
design a new product or to modify or to evaluate an existing one, conjoint analysis is a powerful tool. In a world of stiff competition, it is essential to satisfy consumers. Consumer satisfaction can be achieved by adding value to the products according to the consumers’ wishes. When the number of choices increases for consum-ers, every supplier or company needs to differentiate its products from others by adding value. Companies need to exhibit more qualities in their products; hence, they must first discover the factors that influence the consumers’ purchasing decision. Thus, this study has used conjoint analysis to find out the multiple factors that simultaneously affect the purchasing decision of consumers of room air fresheners. Further, the MDS
41Conjoint Analysis and MDS Approach to Brand Improvement of an Aerosol Product
technique was carried out to know the consumers’ perception of a few brands of room air fresheners and the potential opportunities for a new brand of room air freshener in the perceptual map of the consumers’ mind.
In this study, the room air freshener attributes identified as important in influencing the consumers’ pur-chase decision are fragrance, longevity of the fragrance stay, spray point inclination, price, pack design, and bottle material. Of these attributes, fragrance was found to be the most important attribute in influencing the purchase decision, followed by longevity, price, pack design, spray point inclination, and bottle material. The best combination of the attributes, according to the consumers, is the combination of Sandalwood fragrance, fair price, longevity of at least 6 hours, pack design with cap, forward spray point inclination, and glass bottle material. The study also revealed that fragrance, price, and longevity of the fragrance stay significantly influ-ence the consumers’ purchase decision while the other attributes do not significantly influence such purchase decision. The MDS analysis showed that ZZZ can improve its exterior pack design image to match that of its nearest peer, Lomani, and its fragrance image to match that of its closest peer, Premium. However, it has a long way to go to match the brand image with that of Premium, the dominating brand in the market.
ReferencesAcito, F., & Hustad, T. P. (1981). Industrial concept testing. Industrial Marketing Management, 10, 157-164. Allenby, G. M., & Ginter, J. L. (1995). Using extremes to design products and segment markets. Journal of Marketing
Research, 32(4), 392-403.Baumgartner, B., & Steiner, J. W. (2007). Are consumers heterogeneous in their preferences for odd and even prices?
Findings from a choice-based conjoint study. International Journal of Research in Marketing, 24(4), 312–323.Bradlow, E. T., Hu, Y., & Ho, T. H. (2004). A learning-based model for imputing missing levels in partial conjoint profiles.
Journal of Marketing Research, 41(4), 369–381. Camm, J. D., Cochran, J. J., Curry, D. J., & Kannan, S. (2006). Conjoint optimization: An exact branch and bound algo-
rithm for share-of-choice problem. Management Science, 52(3), 435–447.Cattin, P., & Wittink, D. R. (1982). Commercial use of conjoint analysis: A survey. Journal of Marketing, 46(3), 44-53.Charles, V. (2007, April-June). Decision of laptop configuration and brand through SPSS conjoint analysis. The SPSS
Analyst, 1-6.Charles, V., Shanmugam, M., & Idris, M. (2007). Conjoint analysis approach to investors’ preference for Islamic vs Non-
Islamic scrips: A pilot study. In B. Shanmugam (Ed.), The proceedings of the fifth international Islamic conference (pp. 1-14). Selangor Darul Ehsan, Malaysia: Monash University and Institut Bank-Bank Malaysia.
Chen, C. (2001). Design for the environment: A quality-based model for green product development. Management Science, 47(2), 250-263.
Chen, K. D., & Hausman, W. H. (2000). Mathematical properties of the optimal product line selection problem using choice-based conjoint analysis. Management Science, 46(2), 327–332.
Churchill, G. A., & Iacobucci, D. (2002). Marketing research: Methodological foundations. London, United Kingdom: Harcourt.
Davison, M. L. (1983). Multidimensional scaling. New York, NY: John Wiley.Dong, S., Ding, M., & Huber, J. (2010). A simple mechanism to incentive-align conjoint experiments. International
Journal of Research in Marketing, 27, 25-32. Farber, S., & Griner, B. (2000). Valuing watershed quality improvements using conjoint analysis. Ecological Economics,
34(1), 63-76. Green, P. E., & DeSarbo, W. S. (1979). Componential segmentation in the analysis of consumer tradeoffs. Journal of
Marketing Research, 43, 83-91.Green, P. E., & Krieger, A. M. (1985). Models and heuristics for product line selection. Marketing Science, 4, 1-19.Green, P. E., & Krieger, A. M. (1989). Recent contributions to optimal product positioning and buyer segmentation.
European Journal of Operations Research, 41, 127-141.Green, P. E., & Krieger, A. M. (1991). Optimal positioning with conjoint analysis. Journal of Product Innovation
Management, 8, 189-202.Green, P. E., & Krieger, A. M. (1992). An application of a product positioning model to pharmaceutical products. Marketing
Science, 11, 117-132.Green, P. E., & Krieger, A. M. (1996). Individualized hybrid models for conjoint analysis. Management Science, 42(6),
850–867.Green, P. E., & Rao, V. R. (1971). Conjoint measurement for quantifying judgmental data. Journal of Marketing Research,
8(3), 355-363.
42 Conjoint Analysis and MDS Approach to Brand Improvement of an Aerosol Product
Green, P. E., & Srinivasan, V. (1978). Conjoint analysis in consumer research; issues and outlook. The Journal of Consumer Research, 5, 103-123.
Green, P. E., & Srinivasan, V. (1990). Conjoint analysis in marketing: New developments with implications for research and practice. Journal of Marketing, 54(4), 3-19.
Green, P. E., Wind, J. & Rao, V. R. (1999). Conjoint analysis: Methods and applications. In R. Duff (Ed.), Handbook of Technology Management (pp. 65-72). Boca Raton, FL: CRC Press.
Grissom, M. D., Belegundu, A. D., Rangaswamy, A., & Koopmann, G. H. (2006). Conjoint-analysis-based multiattribute optimization: Application in acoustical design. Structural and Multidisciplinary Optimization, 31, 8-16.
Hair, J. F., Anderson, R. E., Tatham, R. L., & Black, W. C. (1998). Multivariate data analysis. Upper Saddle River, New Jersey: Prentice-Hall International.
Jedidi, K., & Zhang, Z. J. (2002). Augmenting conjoint analysis to estimate consumer reservation price. Management Science, 48(10), 1350-1368.
Kim, J. G., Menzefricke, U., & Feinberg, F. M. (2007). Capturing flexible heterogeneous utility curves: A Bayesian spline approach. Management Science, 53(2), 340-354.
Kotler, P. (2000). Marketing management. London, United Kingdom: Prentice-Hall.Kruskal, J. B., & Wish, M. (1977). Multidimensional scaling. Beverly Hills, CA: Sage.Lilien, G. L., & Rangaswamy, A. (1998). Marketing engineering: Computer-assisted marketing analysis and planning.
Reading, MA: Addison-Wesley.Lynch, J. G., Jr., Buzas, T. E., & Berg, S. V. (1994). Regulatory measurement and evaluation of telephone service quality.
Management Science, 40(2), 169-194.Orme, B. (1998). Sample size issues for conjoint analysis studies (Research Paper Series). Sequim, WA: Sawtooth
Software. Retrieved from http://business.nmsu.edu/~mhyman/M310_Articles/CA_and_Sample_Size.pdfOtter, T., Tuchler, R., & Fruhwirth-Schnatter, S. (2004). Capturing consumer heterogeneity in metric conjoint analysis us-
ing Bayesian mixture models. International Journal of Research in Marketing, 21(3), 285-297.Page, A. L., & Rosenbaum, H. F. (1987). Redesigning product lines with conjoint analysis: How Sunbeam does it. Journal
of Product Innovation Management, 4, 120-137.Page, A. L., & Rosenbaum, H. F. (1992). Developing an effective concept testing program for consumer durables. Journal
of Product Innovation Management, 9, 267-277.Reutterer, T., & Kotzab, H. W. (2000). The use of conjoint analysis for measuring preferences in supply chain design.
Industrial Marketing Management, 29, 27-35.Richardson, M. W. (1938). Multidimensional psychophysics. Psychological Bulletin, 35, 659-660.Ryan, M., & Farrar, S. (2000). Using conjoint analysis to elicit preferences for health care. British Medical Journal,
320(7248), 1530-1532. Schiffman, S. S., Reynolds, M. L., & Young, F. W. (1981). Introduction to multidimensional scaling. New York, NY:
Academic Press.Shepherd, D. A., & Zacharakis, A. (1999). Conjoint analysis: A new methodological approach for researching the decision
policies of venture capitalists. Venture Capital - An International Journal of Entrepreneurial Finance, 1(3), 197-217.Soutar, G. N., & Turner, J. P. (2002). Students’ preferences for university: A conjoint analysis. International Journal of
Educational Management, 16(1), 40-45.Sudman, S., & Blair, E. (1998). Marketing research. Boston, MA: McGraw Hill.Torgerson, W. S. (1952). Multidimensional scaling: 1 Theory and method. Psychometrika, 17, 401-419.Toubia, O., Hauser, J. R., & Simester, D. I. (2004). Polyhedral methods for adaptive choice-based conjoint analysis.
Journal of Marketing Research, 41(1), 116-131.Toubia, O., Simester, D. I., Hauser, J. R., & Dahan, E. (2003). Fast polyhedral adaptive conjoint estimation. Marketing
Science, 22(3), 273-303.Van der Pol, M., & Cairns J. (1998). Establishing preferences for blood transfusion support: An application of conjoint
analysis. Journal of Health Services Research Management, 3, 70-76.Vermeulen, B., Goos, P., & Vandebroek, M. (2008). Models and optimal designs for conjoint choice experiments including
a no-choice option. International Journal of Research in Marketing, 25(2), 94-103.Vedapuri, A. (2005). The Flavors and Fragrances Industry in India Industry Overview. www.frost.com. Frost & Sullivan
India.Young, F. W. (1984). Research methods for multimode data analysis in the behavioral sciences. In H. G. Law, C. W.
Snyder, J. Hattie, & R. P. MacDonald (Eds.), An advanced treatment of the most general models in MDS (pp. 440-469). New York: Praeger.
Young, F. W., & Hamer. R. M. (1994). Theory and applications of multidimensional scaling. Hillsdale, NJ: Erlbaum. Wittink, D. R., & Cattin, P. (1989). Commercial use of conjoint analysis: An update. Journal of Marketing, 53(3), 91-96.
43Conjoint Analysis and MDS Approach to Brand Improvement of an Aerosol Product
Wittink, D. R., Vriens, M., & Burhenne, W. (1994). Commercial use of conjoint analysis in Europe. International Journal of Research in Marketing, 11(1), 41-52.
Wuyts, S., Verhoef, P. C., & Prins, R. (2009). Partner selection in B2B information service markets. International Journal of Research in Marketing, 26(1), 41-51.
Xu, G., & Yuan, Y. (2001, June). Conjoint analysis in pharmaceutical marketing research. Quirk’s Marketing Research Review, 1-10.
Footnotes1 Following the ethical principles of the code of conduct, the name of the company has been replaced with the name ABC
in order to protect the privacy of the company.2 The name of the room air freshener brand under test is kept confidential; in this study, the brand is renamed as brand
ZZZ.3 The book on theory and applications of MDS by Young and Hamer (1994) presents applications of MDS in such diverse
fields as marketing, sociology, physics, political science, and biology.4 For a more complete, but still brief introduction to MDS, the reader should turn to Kruskal and Wish (1977). A complete
discussion of the topics of experimental design, data analysis, and interpretive procedures can be found in Schiffman et al. (1981). An intermediate-level mathematical treatment of some MDS algorithms is given in Davison (1983). An advanced treatment of the theory of MDS, illustrated with innovative applications, is presented in Young and Hamer (1994). Reviews of the current state of the art are presented in Young (1984).
5 In the metric conjoint, respondents rate various product configurations whereas in the nonmetric conjoint, respondents rank a set of product configurations.
AuthorNoteThe authors are thankful to AIMS International for awarding a consolation prize for a part of this project at the Fifth International Conference on Management, India. The authors are also grateful to the two anonymous referees and the editors for their valuable comments and suggestions on the previous drafts of this research paper.
Vincent Charles, obtained his Ph.D. at the National Institute of Technology, Warangal, India. He is currently a Professor at CENTRUM Católica.
Mukesh Kumar, obtained his Ph.D. at the Indian Institute of Technology, India. He is currently a Professor at CENTRUM Católica.
* Correspondence concerning this article should be addressed to: [email protected]