Embed Size (px)
Citation preview

CONGRESSIONAL BUDGET OFFICE Douglas W. Elmendorf, Director U.S. Congress Washington, DC 20515
March 2, 2009 Honorable Charles E. Grassley Ranking Member Committee on Finance United States Senate Washington, DC 20510 Dear Senator: At your request, the Congressional Budget Office (CBO) has prepared a year-by-year estimate of the economic effects of the American Recovery and Reinvestment Act of 2009 (ARRA, Public Law 111-5), which was enacted on February 17, 2009. Short-Run Effects The macroeconomic impacts of any economic stimulus program are very uncertain. Economic theories differ in their predictions about the effectiveness of stimulus. Furthermore, large fiscal stimulus is rarely attempted, so it is difficult to distinguish among alternative estimates of how large the macroeconomic effects would be. For those reasons, some economists remain skeptical that there will be any significant effects, while others expect very large ones. CBO has developed a range of estimates of the effects of stimulus legislation on gross domestic product (GDP) and employment that encompasses a majority of economists’ views. By CBO’s estimation, in the short run ARRA will raise GDP and increase employment by adding to aggregate demand and thereby boosting the utilization of labor and capital that would otherwise be unused because the economy is in recession. Most of the budgetary effects of the legislation are estimated to occur over the next few years, and as those effects diminish, the short-run impact on the economy will fade. Different provisions in the law differ in both the magnitude and timing of their effects on aggregate demand. To simplify analysis of the overall effects, CBO grouped the various provisions into a number of more general categories. Each category was assumed to have a range of effects on the economy that could by summarized by “multipliers”—the cumulative effect on output of a one-time increase in spending, or reduction in taxes, of one dollar. The numbers in Table 1 indicate the cumulative impact of the provisions in each category, on average, on GDP over several quarters. For example, a one-time increase in federal purchases of goods and services of $1.00 in the second quarter of this year would raise GDP by $1.00 to $2.50 in total over several quarters, with most of that effect in the first two quarters and little effect beyond a year.
www.cbo.gov
Honorable Charles E. Grassley Page 2
The multipliers are applied to outlays when they occur and to changes in taxes or transfer payments when they affect disposable income. CBO’s estimates therefore account for the different rates of spending for various types of appropriations and, similarly, for the timing of the different tax cuts or transfers. Table 1 also shows the categories to which CBO assigned the major provisions of ARRA. (In some cases, when different elements of a single provision were estimated to have different multipliers, the total cost of a provision was divided among more than one category. In those cases, the provision is shown in the table in the category to which most of its budgetary cost applied.) Provisions affecting outlays (including refundable tax provisions) are identified by the same names used in CBO’s cost estimate for the conference agreement on H.R. 1 (see Table 2). Provisions affecting revenues are identified by the names used in the Joint Committee on Taxation’s revenue estimate for the same legislation.1 Long-Run Effects In the long run, the economy produces close to its potential output on average, and that potential level is determined by the stock of productive capital, the supply of labor, and productivity. Short-run stimulative policies can affect long-run output by influencing those three factors, although such effects would generally be smaller than the short-run impact of those policies on demand. In contrast to its positive near-term macroeconomic effects, the legislation will reduce output slightly in the long run, CBO estimates. The principal channel for that effect, which would also arise from other proposals to provide short-term economic stimulus by increasing government spending or reducing revenues, is that the law will result in an increase in government debt. To the extent that people hold their wealth as government bonds rather than in a form that can be used to finance private investment, the increased debt will tend to reduce the stock of productive private capital. In economic parlance, the debt will “crowd out” private investment. (Crowding out is unlikely to occur in the short run under current conditions, because most firms are lowering investment in response to reduced demand, which stimulus can offset in part.) CBO’s basic assumption is that, in the long run, each dollar of additional debt crowds out about a third of a dollar’s worth of private domestic capital (with the remainder of the rise in debt offset by increases in private saving and inflows of foreign capital). Because of uncertainty about the degree of crowding out, however, CBO has incorporated both more and less crowding out into its range of estimates of the long-run effects of the stimulus legislation. The crowding-out effect will be offset somewhat by other factors. Some of the legislation’s provisions, such as funding for improvements to roads and highways, might add to the economy’s potential output in much the same way that private capital investment does. Other provisions, such as funding for grants to increase access to
1 See www.house.gov/jct/x-19-09.pdf.

Honorable Charles E. Grassley Page 3
college education, could raise long-term productivity by enhancing people’s skills. And some provisions will create incentives for increased private investment. According to CBO’s estimates, provisions that could add to long-term output account for between one-quarter and one-third of the legislation’s budgetary cost. The effect of individual provisions could vary greatly. For example, increased spending for basic research and education might affect output only after a number of years, but once those investments began to boost GDP, they might pay off over more years than would the average investment in physical capital (in economic terms, they have a low rate of depreciation). Therefore, in any one year, their contribution to output might be less than that of the average private investment, even if their overall contribution to productivity over their lifetime was just as high. Moreover, although some carefully chosen government investments might be as productive as private investment, other government projects would probably fall well short of that benchmark, particularly in an environment in which rapid spending is a significant goal. The response of state and local governments that receive federal stimulus grants will also affect their long-run impact; those governments might apply some of that money to investments they would have carried out anyway, thus lowering the long-run economic return on those grants. In order to encompass a wide range of potential effects, CBO used two assumptions in developing its estimates: first, that all of the relevant investments together will, on average, add as much to output as would a comparable amount of private investment, and second, that they will, on average, not add to output at all. In principle, the legislation’s long-run impact on output also will depend on whether it permanently changes incentives to work or save. However, according to CBO’s estimates, the legislation will not have any significant permanent effects on those incentives. Net Effects on Output and Employment Taking all of the short- and long-run effects into account, CBO estimates that the legislation implies an increase in GDP relative to the agency’s baseline forecast of between 1.4 percent and 3.8 percent by the fourth quarter of 2009, between 1.1 percent and 3.4 percent by the fourth quarter of 2010, between 0.4 percent and 1.2 percent by the fourth quarter of 2011, and declining amounts in later years (see Table 3). Beyond 2015, the legislation is estimated to reduce GDP by between zero and 0.2 percent. To illustrate the short- and long-run effects of the legislation on output, with CBO’s January baseline projection of potential GDP set as a reference point, Figure 1 shows three different projections of the economy’s actual output: CBO’s January baseline projection of GDP (which does not include the effects of ARRA), GDP using CBO’s high estimate of the effects of the legislation; and GDP using CBO’s low estimate of the effects of the legislation.2
2 For details of CBO’s January 2009 baseline, see Congressional Budget Office, The Budget and Economic Outlook: Fiscal Years 2009-2019 (January 2009).
Honorable Charles E. Grassley Page 4 Corresponding to the effects on output, CBO estimates that ARRA will increase employment by 0.9 million to 2.3 million by the fourth quarter of 2009, by 1.2 million to 3.6 million by the fourth quarter of 2010, by 0.6 million to 1.8 million by the fourth quarter of 2011, and by declining numbers in later years. The effect on employment is never estimated to be negative, despite lower GDP in later years, because CBO expects that the U.S. labor market will be at nearly full employment in the long run. The reduction in GDP is therefore estimated to be reflected in lower wages rather than lower employment, as workers will be slightly less productive because the capital stock is slightly smaller. These estimates differ only slightly from those presented in CBO’s letters to you, Senator Gregg, and Congressman Camp on February 11, 2009; at that time, the legislation had not yet been enacted, and CBO’s estimates were based on an average of the effects of two versions of H.R. 1: as passed by the House and as passed by the Senate. I hope this information is helpful to you. If you have any further questions, I would be glad to answer them. The staff contacts for the analysis are Ben Page and Robert Arnold, who may be reached at (202) 226-2750. Sincerely, Douglas W. Elmendorf Director Identical letter sent to the Honorable Dave Camp. cc: Honorable Max Baucus Chairman Senate Committee on Finance Honorable Kent Conrad Chairman Senate Committee on the Budget Honorable Daniel K. Inouye Chairman Senate Committee on Appropriations
Honorable Judd Gregg Ranking Member Senate Committee on the Budget Honorable Thad Cochran Ranking Member Senate Committee on Appropriations

Category Major Provisions
11-Year Budgetary
Cost of Provisionsa
High LowPurchases of Goods and Services by the Federal Government
2.5 1 Division A, Title II: Other; Title IV: Energy Efficiency and Renewable Energy; Title IV: Innovative Technology Loan Guarantee Program; Title IV: Other Energy Programs; Title V: Federal Buildings Fund; Title VIII: National Institutes of Health; Title VIII: Other Department of Health and Human Services
$88 billion
Transfers to State and Local Governments for Infrastructure
2.5 1 Division A, Title VII: Clean Water and Drinking Water State Revolving Funds; Title XII: Highway Construction; Title XII: Other Transportation; Title XII: Other Housing Assistance
$44 billion
Transfers to State and Local Governments Not for Infrastructure
1.9 0.7 Division A, Title VIII: Education for the Disadvantaged; Title VIII: Special Education; Title XIV: State Fiscal Stabilization Fund; Division B, Title V: State Fiscal Relief Fund
$215 billion
Transfers to Persons 2.2 0.8 Division A, Title I: Supplemental Nutrition Assistance Program; Title VIII: Student Financial Assistance; Division B, Title II: Unemployment Compensation; Title III: Health Insurance Assistance
$100 billion
One-Time Payments to Retirees
1.2 0.2 Division B, Title II: Economic Recovery Payments, Temporary Aid to Needy Families, and Child
Supportb
$18 billion
Two-Year Tax Cuts for Lower- and Middle-Income People
1.7 0.5 Division B, Title I: Refundable Tax
Credits; Making Work Pay Creditc;
American Opportunity Tax Creditc
$168 billion
One-Year Tax Cuts for Higher-Income People
0.5 0.1 Increase in Individual AMT
Exemption Amountc
$70 billion
Extension of First-Time Homebuyer Credit
1 0.2 Extension of First-Time Homebuyer
Creditc$7 billion
(continued)
Table 1. The Estimated Impact Of the American Recovery and Reinvestment Act of 2009 on Output and the Budgetary Costs, 2009 to 2019
Estimated Policy Multiplier
Category Major Provisions
11-Year Budgetary
Cost of Provisionsa
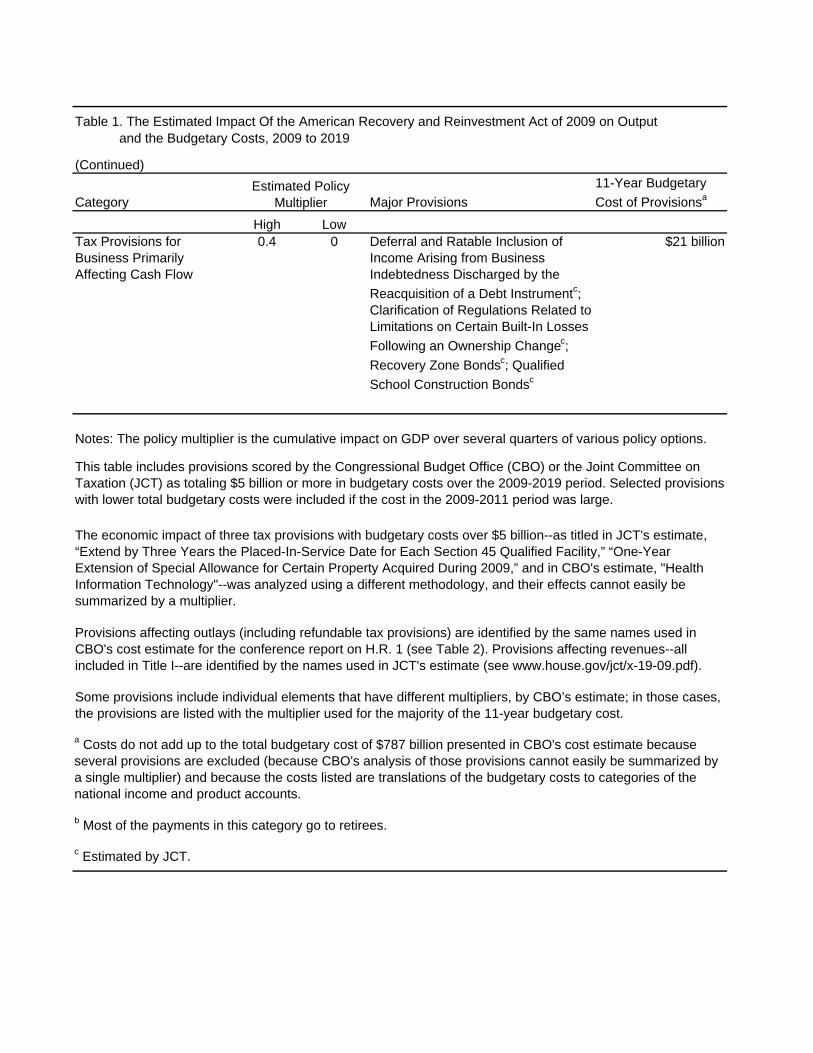
High LowTax Provisions for Business Primarily Affecting Cash Flow
0.4 0 Deferral and Ratable Inclusion of Income Arising from Business Indebtedness Discharged by the
Reacquisition of a Debt Instrumentc; Clarification of Regulations Related to Limitations on Certain Built-In Losses
Following an Ownership Changec;
Recovery Zone Bondsc; Qualified
School Construction Bondsc
$21 billion
Table 1. The Estimated Impact Of the American Recovery and Reinvestment Act of 2009 on Output
(Continued)
Estimated Policy Multiplier
The economic impact of three tax provisions with budgetary costs over $5 billion--as titled in JCT's estimate, “Extend by Three Years the Placed-In-Service Date for Each Section 45 Qualified Facility,” “One-Year Extension of Special Allowance for Certain Property Acquired During 2009,” and in CBO's estimate, "Health Information Technology"--was analyzed using a different methodology, and their effects cannot easily be summarized by a multiplier.
Notes: The policy multiplier is the cumulative impact on GDP over several quarters of various policy options.
b Most of the payments in this category go to retirees.
c Estimated by JCT.
This table includes provisions scored by the Congressional Budget Office (CBO) or the Joint Committee on Taxation (JCT) as totaling $5 billion or more in budgetary costs over the 2009-2019 period. Selected provisions with lower total budgetary costs were included if the cost in the 2009-2011 period was large.
Provisions affecting outlays (including refundable tax provisions) are identified by the same names used in CBO's cost estimate for the conference report on H.R. 1 (see Table 2). Provisions affecting revenues--all included in Title I--are identified by the names used in JCT's estimate (see www.house.gov/jct/x-19-09.pdf).
Some provisions include individual elements that have different multipliers, by CBO’s estimate; in those cases, the provisions are listed with the multiplier used for the majority of the 11-year budgetary cost.
and the Budgetary Costs, 2009 to 2019
a Costs do not add up to the total budgetary cost of $787 billion presented in CBO's cost estimate because several provisions are excluded (because CBO's analysis of those provisions cannot easily be summarized by a single multiplier) and because the costs listed are translations of the budgetary costs to categories of the national income and product accounts.

Table 2. Estimated Cost of the American Recovery and Reinvestment Act of 2009 (Public Law 111-5)
Total,2009 -
2009 2010 2011 2012 2013 2014 2015 2016 2017 2018 2019 2019
Division A
Title I - Agriculture, Rural Development, Food and DrugAdministration, and RelatedAgencies
Distance Learning, Telemedicine,and Broadband Program
Budget authority 2,500 0 0 0 0 0 0 0 0 0 0 2,500Estimated outlays 63 350 587 575 475 325 125 0 0 0 0 2,500
Supplemental Nutrition Assistance Program
Estimated budget authority 4,859 6,056 4,317 3,115 1,639 5 0 0 0 0 0 19,991Estimated outlays 4,812 6,058 4,362 3,115 1,639 5 0 0 0 0 0 19,991
OtherBudget authority 3,971 4 0 0 0 0 0 0 0 0 0 3,975Estimated outlays 816 1,623 736 421 172 138 34 0 0 0 0 3,940
Subtotal, Title IBudget authority 11,330 6,060 4,317 3,115 1,639 5 0 0 0 0 0 26,466Estimated outlays 5,691 8,031 5,685 4,111 2,286 468 159 0 0 0 0 26,431
Title II - Commerce, Justice, Science and Related Agencies
Broadband TechnologyOpportunities Program
Budget authority 4,700 0 0 0 0 0 0 0 0 0 0 4,700Estimated outlays 84 756 860 1,250 1,210 390 150 0 0 0 0 4,700
State and Local Law Enforcement Assistance
Budget authority 2,765 0 0 0 0 0 0 0 0 0 0 2,765Estimated outlays 415 830 553 415 552 0 0 0 0 0 0 2,765
National Science FoundationBudget authority 3,002 0 0 0 0 0 0 0 0 0 0 3,002Estimated outlays 342 1,266 794 349 162 63 12 0 0 0 0 2,988
OtherBudget authority 5,455 0 0 0 0 0 0 0 0 0 0 5,455Estimated outlays 1,697 2,148 654 521 298 39 0 0 0 0 0 5,357
Subtotal, Title IIBudget authority 15,922 0 0 0 0 0 0 0 0 0 0 15,922Estimated outlays 2,538 5,000 2,861 2,535 2,222 492 162 0 0 0 0 15,810
Title III - Department of DefenseBudget authority 4,555 0 0 0 0 0 0 0 0 0 0 4,555Estimated outlays 1,679 2,122 551 129 36 11 3 0 0 0 0 4,531
Title IV - Energy and WaterDevelopment
Energy Efficiency and Renewable Energy
Budget authority 16,800 0 0 0 0 0 0 0 0 0 0 16,800Estimated outlays 445 2,045 3,340 3,715 3,300 2,540 1,048 267 100 0 0 16,800
Innovative Technology Loan Guarantee Program
Budget authority 6,000 0 0 0 0 0 0 0 0 0 0 6,000Estimated outlays 60 1,200 1,500 1,500 1,200 540 0 0 0 0 0 6,000
Other Energy ProgramsBudget authority 15,935 175 275 475 875 1,050 1,050 1,050 1,050 490 0 22,425Estimated outlays 1,303 3,943 5,043 4,275 2,175 1,910 1,186 1,050 1,050 470 -30 22,375
(continued)
By Fiscal Year, Millions of Dollars
Discretionary Spendinga

Table 2. Estimated Cost of the American Recovery and Reinvestment Act of 2009 (Public Law 111-5)
(Continued)
Total,2009 -
2009 2010 2011 2012 2013 2014 2015 2016 2017 2018 2019 2019
Division A (continued)
Corps of Engineers Budget authority 4,600 0 0 0 0 0 0 0 0 0 0 4,600Estimated outlays 1,171 1,701 980 378 270 100 0 0 0 0 0 4,600
Other, Title IVBudget authority 1,000 0 0 0 0 0 0 0 0 0 0 1,000Estimated outlays 180 500 200 120 0 0 0 0 0 0 0 1,000
Subtotal, Title IVBudget authority 44,335 175 275 475 875 1,050 1,050 1,050 1,050 490 0 50,825Estimated outlays 3,159 9,389 11,063 9,988 6,945 5,090 2,234 1,317 1,150 470 -30 50,775
Title V - Financial Services and and General Government
Federal Buildings FundBudget authority 5,550 0 0 0 0 0 0 0 0 0 0 5,550Estimated outlays 400 900 1,000 1,100 1,000 500 300 150 50 0 0 5,400
OtherBudget authority 1,308 0 0 0 0 0 0 0 0 0 0 1,308Estimated outlays 220 662 339 67 19 0 0 0 0 0 0 1,307
Subtotal, Title VBudget authority 6,858 0 0 0 0 0 0 0 0 0 0 6,858Estimated outlays 620 1,562 1,339 1,167 1,019 500 300 150 50 0 0 6,707
Title VI - Homeland SecurityBudget authority 2,755 0 0 0 0 0 0 0 0 0 0 2,755Estimated outlays 506 591 857 457 230 93 10 0 0 0 0 2,744
Title VII - Interior, Environment, andRelated Agencies
Clean Water and Drinking Water State Revolving Funds
Budget authority 6,000 0 0 0 0 0 0 0 0 0 0 6,000Estimated outlays 180 1,380 1,800 1,240 600 320 120 68 36 42 0 5,786
OtherBudget authority 4,950 0 0 0 0 0 0 0 0 0 0 4,950Estimated outlays 988 2,118 897 531 183 9 9 9 9 6 0 4,759
Subtotal, Title VIIBudget authority 10,950 0 0 0 0 0 0 0 0 0 0 10,950Estimated outlays 1,168 3,498 2,697 1,771 783 329 129 77 45 48 0 10,545
Title VIII - Departments of Labor, Health and Human Services,and Education, and RelatedAgencies
National Institutes ofHealth
Budget authority 10,000 0 0 0 0 0 0 0 0 0 0 10,000Estimated outlays 855 3,286 3,703 1,505 249 118 27 0 0 0 0 9,743
National Coordinator for HealthInformation Technology
Budget authority 2,000 0 0 0 0 0 0 0 0 0 0 2,000Estimated outlays 300 1,280 360 40 0 0 0 0 0 0 0 1,980
Other Department of Healthand Human Services
Budget authority 9,897 0 0 0 0 0 0 0 0 0 0 9,897Estimated outlays 2,173 3,009 2,358 1,612 593 65 0 0 0 0 0 9,810
(continued)
Discretionary Spendinga (continued)
By Fiscal Year, Millions of Dollars

Table 2. Estimated Cost of the American Recovery and Reinvestment Act of 2009 (Public Law 111-5)
(Continued)
Total,2009 -
2009 2010 2011 2012 2013 2014 2015 2016 2017 2018 2019 2019
Division A (continued)
Employment and Training Administration
Budget authority 4,470 0 0 0 0 0 0 0 0 0 0 4,470Estimated outlays 613 2,226 1,224 242 0 0 0 0 0 0 0 4,305
Department of EducationEducation for theDisadvantaged
Budget authority 13,000 0 0 0 0 0 0 0 0 0 0 13,000Estimated outlays 494 6,210 5,776 520 0 0 0 0 0 0 0 13,000
Special EducationBudget authority 12,200 0 0 0 0 0 0 0 0 0 0 12,200Estimated outlays 732 5,734 5,124 610 0 0 0 0 0 0 0 12,200
Student Financial Assistance
Budget authority 16,483 831 0 0 0 0 0 0 0 0 0 17,314Estimated outlays 917 14,572 1,056 15 0 0 0 0 0 0 0 16,560
Other EducationBudget authority 2,124 0 0 0 0 0 0 0 0 0 0 2,124Estimated outlays 207 1,078 624 203 12 0 0 0 0 0 0 2,124
Other, Title VIII Budget authority 1,559 0 0 0 0 0 0 0 0 0 0 1,559Estimated outlays 540 324 283 237 155 4 4 2 0 0 0 1,549
Subtotal, Title VIIIBudget authority 71,733 831 0 0 0 0 0 0 0 0 0 72,564Estimated outlays 6,831 37,719 20,508 4,984 1,009 187 31 2 0 0 0 71,271
Title IX - Legislative BranchBudget authority 25 0 0 0 0 0 0 0 0 0 0 25Estimated outlays 8 15 2 0 0 0 0 0 0 0 0 25
Title X - Military Construction and Veterans Affairs andRelated Agencies
Budget authority 4,281 0 0 0 0 0 0 0 0 0 0 4,281Estimated outlays 448 1,564 1,229 638 241 93 33 0 0 0 0 4,246
Title XI - State, Foreign Operationsand Related Programs
Budget authority 602 0 0 0 0 0 0 0 0 0 0 602Estimated outlays 96 180 162 114 50 0 0 0 0 0 0 602
Title XII - Transportation and Housing and Urban Development
Highway ConstructionBudget authority 27,500 0 0 0 0 0 0 0 0 0 0 27,500Estimated outlays 2,750 6,875 5,500 4,125 3,025 2,750 1,925 550 0 0 0 27,500
Other TransportationBudget authority 20,620 0 0 0 0 0 0 0 0 0 0 20,620Estimated outlays 2,232 2,511 3,285 2,910 3,027 2,672 1,987 1,051 400 320 160 20,555
Public Housing Capital FundBudget authority 4,000 0 0 0 0 0 0 0 0 0 0 4,000Estimated outlays 80 1,200 1,200 800 640 40 40 0 0 0 0 4,000
Other Housing AssistanceBudget authority 9,662 13 0 0 0 0 0 0 0 0 0 9,675Estimated outlays 446 2,068 3,316 1,973 1,109 62 22 0 0 0 0 8,996
Subtotal, Title XIIBudget authority 61,782 13 0 0 0 0 0 0 0 0 0 61,795Estimated outlays 5,508 12,654 13,301 9,808 7,801 5,524 3,974 1,601 400 320 160 61,051
(continued)
By Fiscal Year, Millions of Dollars
Discretionary Spendinga (Continued)

Table 2. Estimated Cost of the American Recovery and Reinvestment Act of 2009 (Public Law 111-5)
(Continued)
Total,2009 -
2009 2010 2011 2012 2013 2014 2015 2016 2017 2018 2019 2019
Division A (continued)
Title XIV - State Fiscal Stabilization Fund
Budget authority 53,600 0 0 0 0 0 0 0 0 0 0 53,600Estimated outlays 6,540 28,377 16,070 2,363 250 0 0 0 0 0 0 53,600
Subtotal, Division ABudget authority 288,728 7,079 4,592 3,590 2,514 1,055 1,050 1,050 1,050 490 0 311,198Estimated outlays 34,792 110,702 76,325 38,065 22,872 12,787 7,035 3,147 1,645 838 130 308,338
Title XII - Transportation andHousing and Urban Development
HOME, Low-income Housing Tax -1 -3 -8 -12 -14 -16 -17 -18 -18 -18 -18 -143Credit Program
Net Increase or Decrease (-)in the Deficit, Division A 34,793 110,705 76,333 38,077 22,886 12,803 7,052 3,165 1,663 856 148 308,481
Division B
Title I - Tax ProvisionsRefundable Tax Credits
Estimated budget authority 1,528 32,027 30,105 726 706 686 666 646 634 622 610 68,955Estimated outlays 1,528 32,027 30,105 726 706 686 666 646 634 622 610 68,955
Other ProvisionsEstimated budget authority 3,580 844 434 21 10 0 0 0 0 0 0 4,889Estimated outlays 3,250 696 553 244 62 3 0 0 0 0 0 4,808
Subtotal, Title IEstimated budget authority 5,108 32,871 30,539 747 716 686 666 646 634 622 610 73,844Estimated outlays 4,778 32,723 30,658 970 768 689 666 646 634 622 610 73,763
Title II - Assistance for Unemployed Workers and Struggling Families
Unemployment CompensationEstimated budget authority 16,981 20,460 470 295 140 135 140 145 150 155 160 39,231Estimated outlays 16,976 20,465 470 295 140 135 140 145 150 155 160 39,231
Economic Recovery Payments,TANF, and Child Support
Estimated budget authority 19,530 962 -30 -12 -3 -1 0 0 0 0 0 20,447Estimated outlays 14,942 2,125 713 187 49 14 4 1 0 0 0 18,033
Subtotal, Title II Estimated budget authority 36,511 21,422 440 283 137 134 140 145 150 155 160 59,677
Estimated outlays 31,918 22,590 1,183 482 189 149 144 146 150 155 160 57,264
Title III - Health InsuranceAssistance
Estimated budget authority 14,302 9,206 1,493 67 0 0 0 0 0 0 0 25,069Estimated outlays 14,302 9,206 1,493 67 0 0 0 0 0 0 0 25,069
Title IV - Health Information Technology
Estimated budget authority 438 178 4,741 6,469 6,463 14,231 3,848 -5,546 -4,990 -2,780 -2,233 20,819Estimated outlays 417 178 4,741 6,469 6,463 14,231 3,848 -5,535 -4,980 -2,780 -2,233 20,819
Title V - State Fiscal ReliefEstimated budget authority 33,955 43,920 11,802 67 -8 33 44 56 57 59 59 90,044Estimated outlays 33,881 43,923 11,847 88 -6 35 44 56 57 59 59 90,042
Subtotal, Direct SpendingEstimated budget authority 90,314 107,597 49,015 7,633 7,308 15,084 4,698 -4,699 -4,149 -1,944 -1,404 269,454Estimated outlays 85,295 108,619 49,922 8,076 7,414 15,104 4,702 -4,687 -4,139 -1,944 -1,404 266,958
(continued)
Division A - Revenues
By Fiscal Year, Millions of Dollars
Direct Spending
Discretionary Spendinga (continued)

Table 2. Estimated Cost of the American Recovery and Reinvestment Act of 2009 (Public Law 111-5)
(Continued)
Total,2009 -
2009 2010 2011 2012 2013 2014 2015 2016 2017 2018 2019 2019
Division B (continued)
Title I - Tax Provisions -64,792 -179,893 -8,194 9,949 2,506 5,228 6,670 5,313 4,562 4,495 -408 -214,576
Title II - Assistance for UnemployedWorkers and Struggling Families -44 -261 -186 -263 -225 -139 -81 34 65 105 115 -879
Title III - Health InsuranceAssistance 0 52 86 93 75 46 29 10 1 0 0 392
Title IV - Health Information Technology 0 0 120 250 360 410 435 435 425 415 410 3,260
Subtotal, Revenues -64,836 -180,102 -8,174 10,029 2,716 5,545 7,053 5,792 5,053 5,015 117 -211,803
Net Increase or Decrease (-)in the Deficit, Division B 150,131 288,722 58,096 -1,953 4,698 9,558 -2,351 -10,480 -9,192 -6,959 -1,521 478,761
Net Increase or Decrease (-) in the Deficit 184,924 399,427 134,429 36,124 27,584 22,361 4,701 -7,315 -7,529 -6,103 -1,373 787,242
Memorandum
On-BudgetEstimated budget authority 379,042 114,676 53,618 11,248 9,857 16,176 5,787 -3,609 -3,086 -1,440 -1,391 580,879Estimated outlays 120,087 219,321 126,258 46,166 30,321 27,928 11,776 -1,500 -2,481 -1,092 -1,261 575,523Revenues -64,821 -180,075 -8,218 9,927 2,577 5,389 6,886 5,624 4,890 4,857 -41 -213,017Net impact on the deficit 184,908 399,396 134,476 36,239 27,744 22,539 4,890 -7,124 -7,371 -5,949 -1,220 788,540
Off-BudgetEstimated budget authority 0 0 -11 -25 -35 -37 -39 -40 -13 -14 -13 -227Estimated outlays 0 0 -11 -25 -35 -37 -39 -40 -13 -14 -13 -227Revenues -16 -30 36 90 125 140 150 150 145 140 140 1,071Net impact on the deficit 16 30 -47 -115 -160 -177 -189 -190 -158 -154 -153 -1,298
Unified BudgetEstimated budget authority 379,042 114,676 53,607 11,223 9,822 16,139 5,748 -3,649 -3,099 -1,454 -1,404 580,652Estimated outlays 120,087 219,321 126,247 46,141 30,286 27,891 11,737 -1,540 -2,494 -1,106 -1,274 575,296Revenues -64,837 -180,105 -8,182 10,017 2,702 5,529 7,036 5,774 5,035 4,997 99 -211,946Net impact on the deficit 184,924 399,427 134,429 36,124 27,584 22,361 4,701 -7,315 -7,529 -6,103 -1,373 787,242
Sources: Congressional Budget Office and Joint Committee on Taxation.
Notes: TANF = Temporary Assistance for Needy Families.
Positive revenue numbers reflect decreases in the deficit; negative revenue numbers reflect increases in the deficit.
Positive numbers for "net impact on the deficit" reflect an increase in the deficit; negative numbers reflect a decrease in the deficit.
Components may not sum to totals because of rounding.
a. Includes estimates for changes to mandatory programs contained in Division A.
Estimates in this table reflect an assumed enactment date in mid-February 2009. Outlays projected for 2009 would occur over a 7-1/2 month period.
By Fiscal Year, Millions of Dollars
Net Impact on the Deficit
Division B - Revenues

Table 3. Estimated Macroeconomic Impacts of the American Recovery and Reinvestment Act of 2009,
2019
Real GDP (Percentage change from baseline)Low estimate of effect 1.4 1.1 0.4 0.1 0.0 0.0 -0.1 -0.2 -0.2 -0.2 -0.2High estimate of effect 3.8 3.4 1.2 0.5 0.3 0.2 0.1 0.0 0.0 0.0 0.0
GDP Gapa (Percent)Baseline -7.4 -6.3 -4.1 -2.2 -0.7 -0.1 0.0 0.0 0.0 0.0 0.0Low estimate of effect -6.1 -5.3 -3.7 -2.0 -0.6 -0.1 0.0 0.0 0.0 0.0 0.0High estimate of effect -3.9 -3.2 -2.9 -1.7 -0.5 0.0 0.1 0.0 0.0 0.0 0.0
Unemployment Rate (Percent)Baseline 9.0 8.7 7.5 6.4 5.5 5.0 4.8 4.8 4.8 4.8 4.8Low estimate of effect 8.5 8.1 7.2 6.3 5.4 5.0 4.8 4.8 4.8 4.8 4.8High estimate of effect 7.8 6.8 6.6 6.0 5.3 4.9 4.8 4.8 4.8 4.8 4.8
Employment (Millions of jobs)Baseline 141.6 143.3 146.2 149.3 152.1 153.9 154.9 155.7 156.4 157.0 157.7Low estimate of effect 142.4 144.5 146.8 149.6 152.2 153.9 155.0 155.7 156.4 157.0 157.7High estimate of effect 143.9 146.9 148.0 150.0 152.4 154.1 155.0 155.7 156.4 157.0 157.7
2017 2018
Source: Congressional Budget Office.
2009 2010 2011
a. Real GDP is gross domestic product, excluding the effects of inflation. The GDP gap is the percentage difference between gross domestic product and CBO's estimate of potential GDP. Potential GDP is the estimated level of output that corresponds to a high level of resource--labor and capital--use. A negative gap indicates a high unemployment rate and low utilization rates for plant and equipment.
Fourth Quarters of Calendar Years 2009 Through 2019
2012 2013 2014 2015 2016

______________________________________________________________________ Figure 1. Difference Between Potential GDP in CBO’s Baseline and Actual GDP Without
and With the Impact of the American Recovery and Reinvestment Act of 2009 ______________________________________________________________________ (Percentage difference in the fourth quarter of each year)
2019201720152013201120092007
2
0
-2
-4
-6
-8
Reference Point (Potential GDP)
With ARRA: High
Low
Without ARRA (Baseline)
Source: Congressional Budget Office. Notes: CBO’s January 2009 baseline projection of potential gross domestic product (GDP) is set as a reference point. The projection of actual GDP without the effects of the American Recovery and Reinvestment Act of 2009 (ARRA) is CBO’s January 2009 estimate, as presented in The Budget and Economic Outlook: Fiscal Years 2009-2019. The projections of actual GDP with the effects of ARRA incorporated (the high and low estimates) reflect a range of assumptions. ___________________________________________________________________________