Embed Size (px)
Citation preview
Congressional Budget Office
Presentation for the Bipartisan Policy Center
Health Care: Capturing the Opportunity in the Nation's Core Fiscal Challenge
April 24, 2008
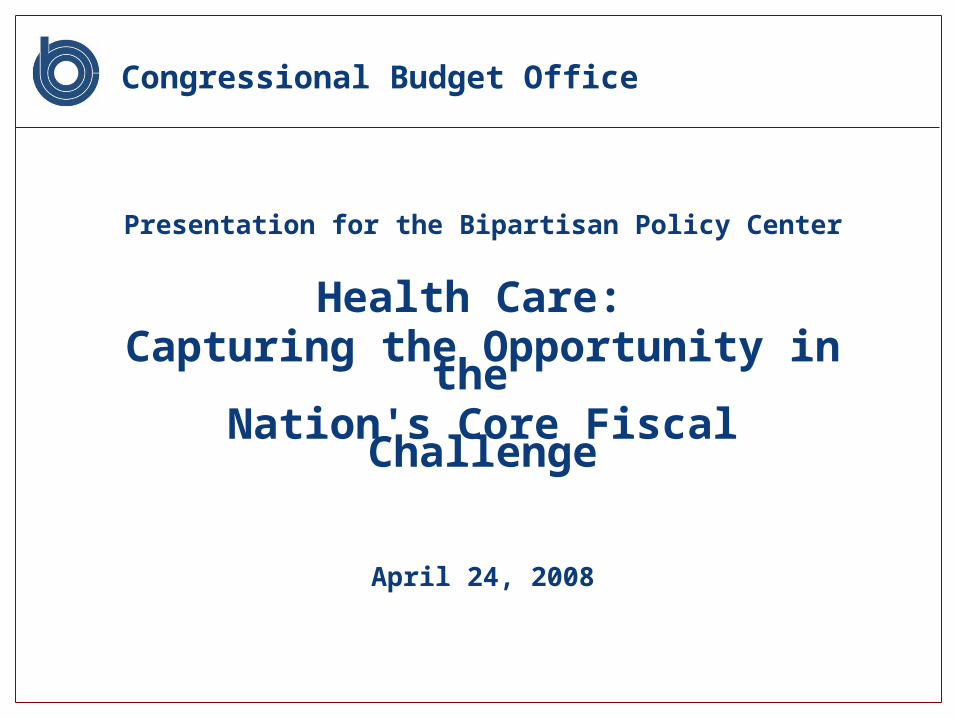
Federal Spending Under CBO’s AlternativeFiscal Scenario
Percentage of Gross Domestic Product
1962 1972 1982 1992 2002 2012 2022 2032 2042 2052 2062 2072 2082
0
10
20
30
40
Medicare and Medicaid
Actual Projected
Social Security
Other Spending (Excluding debt service)
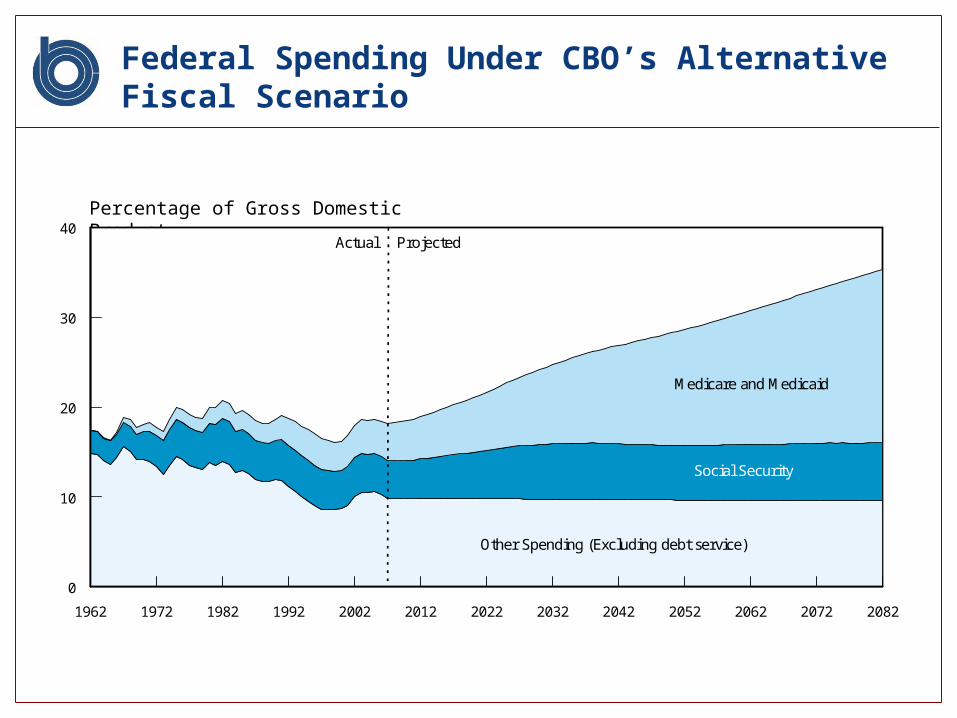
Excess Cost Growth in Medicare, Medicaid, and All Other Spending on Health Care
Medicare Medicaid All Other Total
1975 to 1990 2.9 2.9 2.4 2.6
1990 to 2005 1.8 1.3 1.4 1.5
1975 to 2005 2.4 2.2 2.0 2.1
Percentage Points
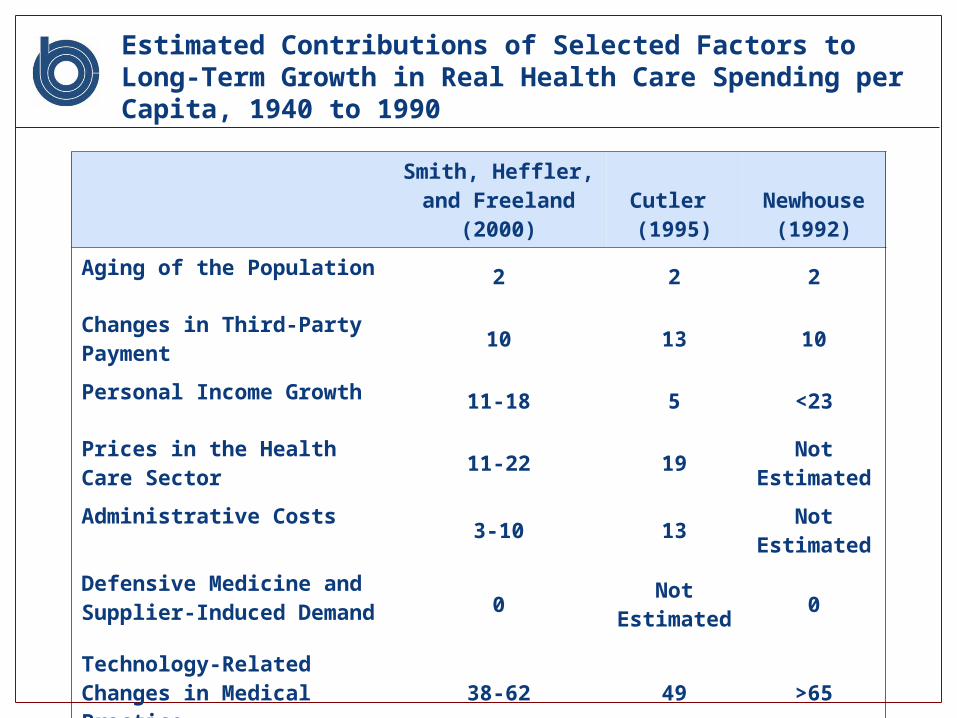
Estimated Contributions of Selected Factors to Long-Term Growth in Real Health Care Spending per Capita, 1940 to 1990
Smith, Heffler, and Freeland (2000)
Cutler (1995)
Newhouse (1992)
Aging of the Population2 2 2
Changes in Third-Party Payment 10 13 10
Personal Income Growth11-18 5 <23
Prices in the Health Care Sector 11-22 19 Not
Estimated
Administrative Costs3-10 13 Not
Estimated
Defensive Medicine and Supplier-Induced Demand 0 Not
Estimated 0
Technology-Related Changes in Medical Practice 38-62 49 >65
Misdiagnosing the problem
Most discussions in media: aging and demographics
Most of the fiscal problem: rising cost per beneficiary, not number or type of beneficiaries
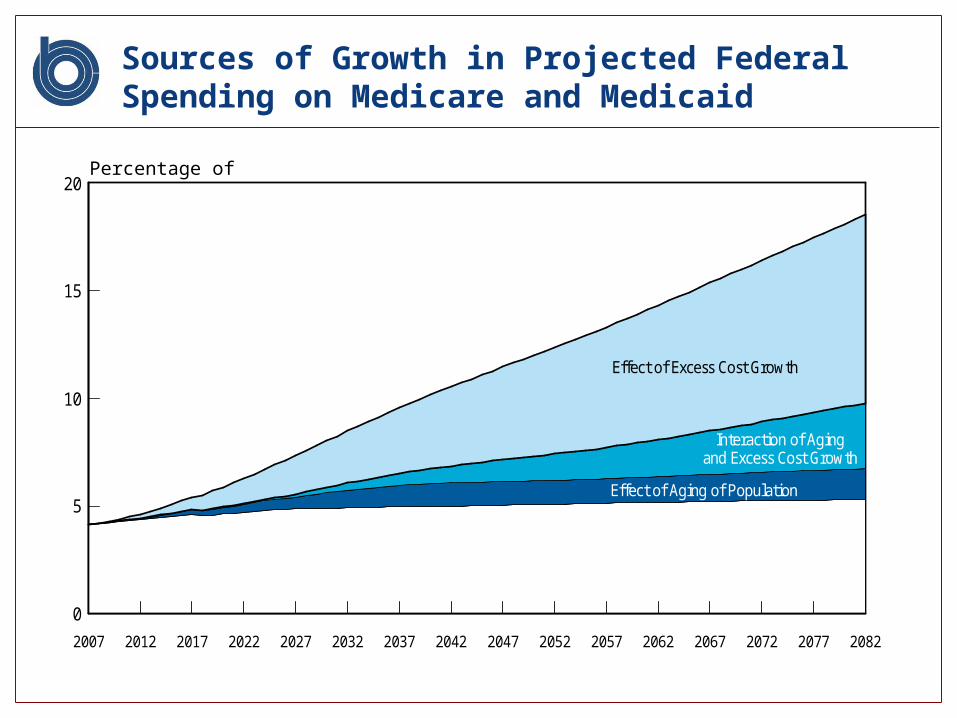
Sources of Growth in Projected Federal Spending on Medicare and Medicaid
Percentage of GDP
2007 2012 2017 2022 2027 2032 2037 2042 2047 2052 2057 2062 2067 2072 2077 2082
Effect of Excess Cost Growth
Effect of Aging of Population
Interaction of Agingand Excess Cost Growth
20
15
10
5
0
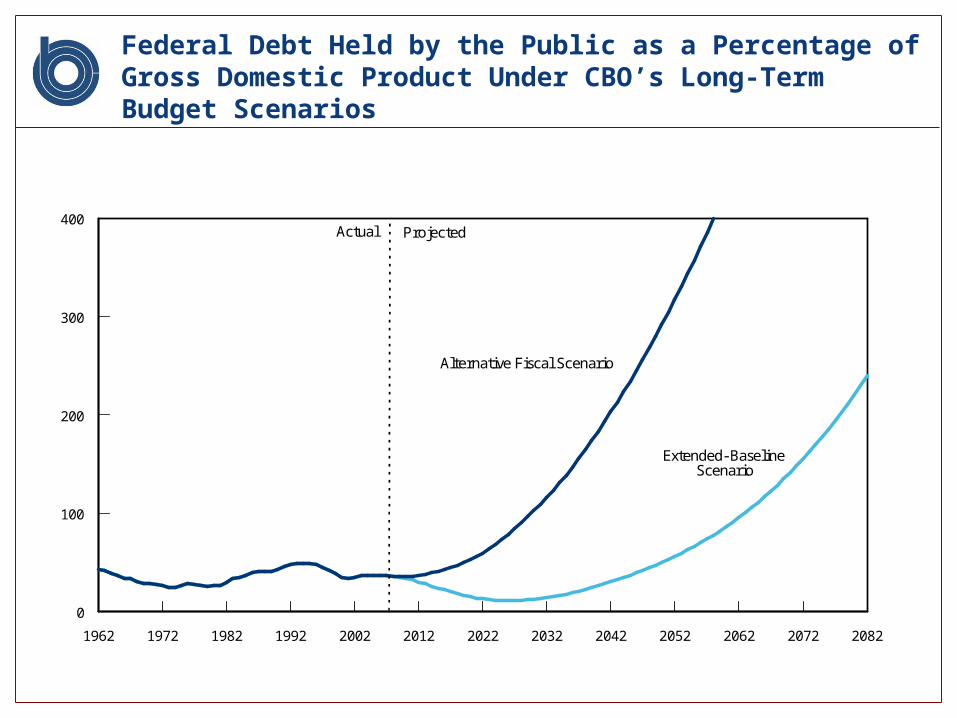
Federal Debt Held by the Public as a Percentage of Gross Domestic Product Under CBO’s Long-Term Budget Scenarios
1962 1972 1982 1992 2002 2012 2022 2032 2042 2052 2062 2072 2082
0
100
200
300
400
Alternative Fiscal Scenario
Extended-BaselineScenario
Actual Projected
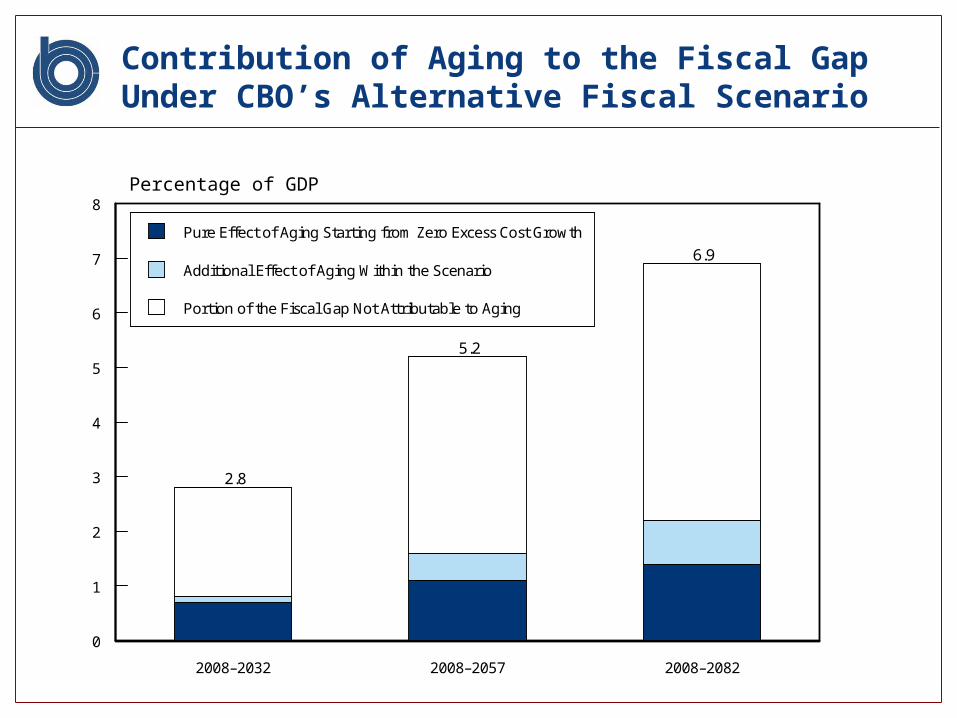
Contribution of Aging to the Fiscal Gap Under CBO’s Alternative Fiscal Scenario
Percentage of GDP
2008–2032 2008–2057 2008–2082
0
1
2
3
4
5
6
7
8
Pure Effect of Aging Starting from Zero Excess Cost Growth
Additional Effect of Aging Within the Scenario
Portion of the Fiscal Gap Not Attributable to Aging
2.8
5.2
6.9
Before we all get too depressed….
Embedded in the nation’s central long-term fiscal challenge appears to be a substantial opportunity:
Can we reduce health care costs without impairing health outcomes?
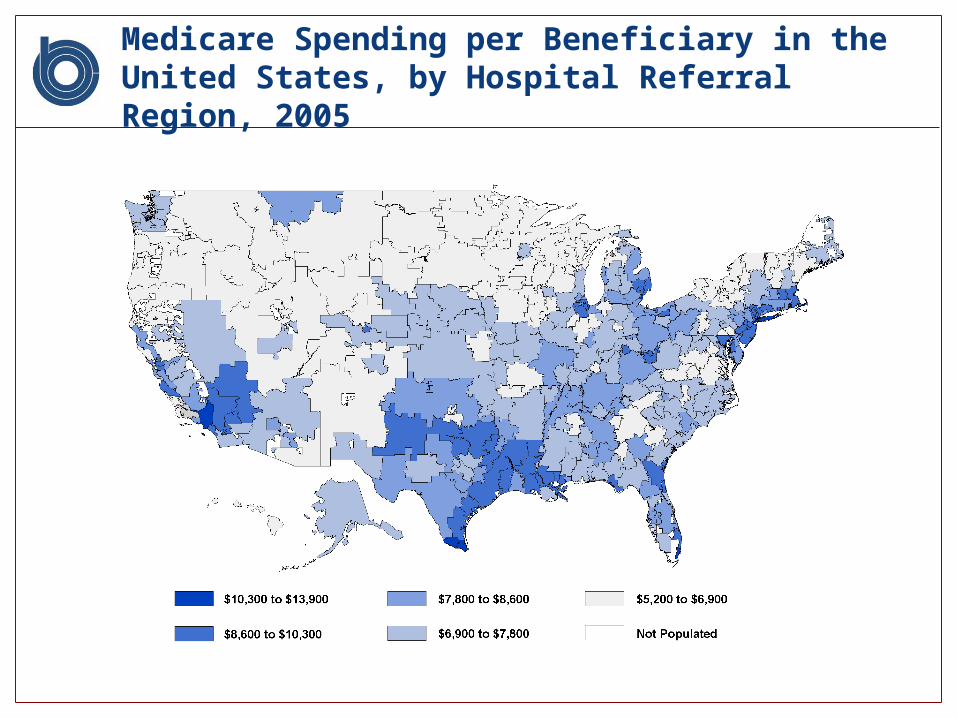
Medicare Spending per Beneficiary in the United States, by Hospital Referral Region, 2005
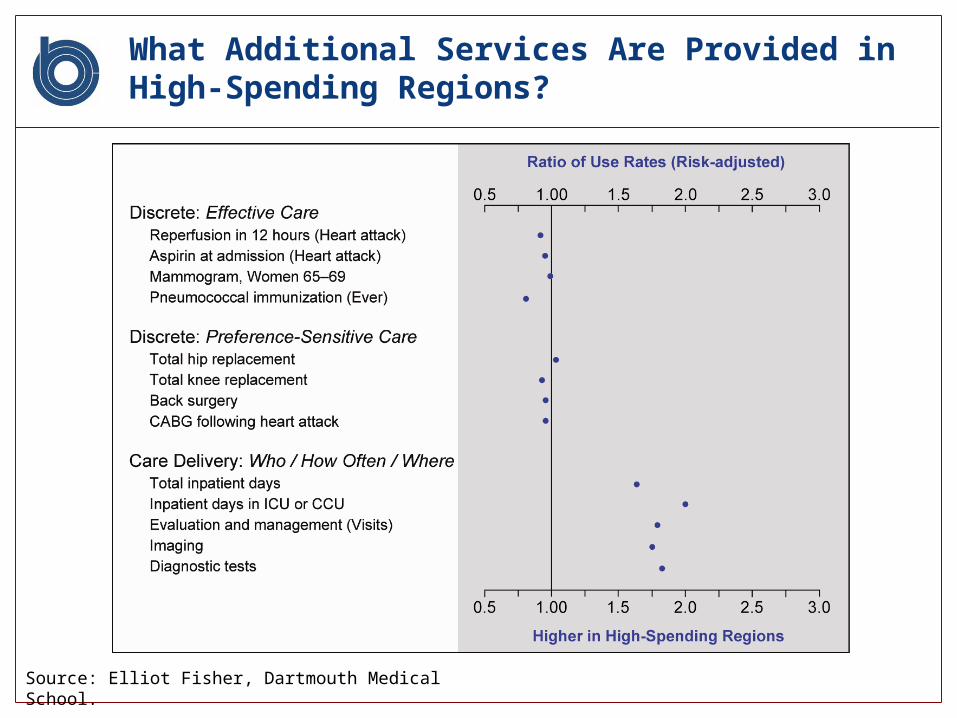
What Additional Services Are Provided in High-Spending Regions?
Source: Elliot Fisher, Dartmouth Medical School.
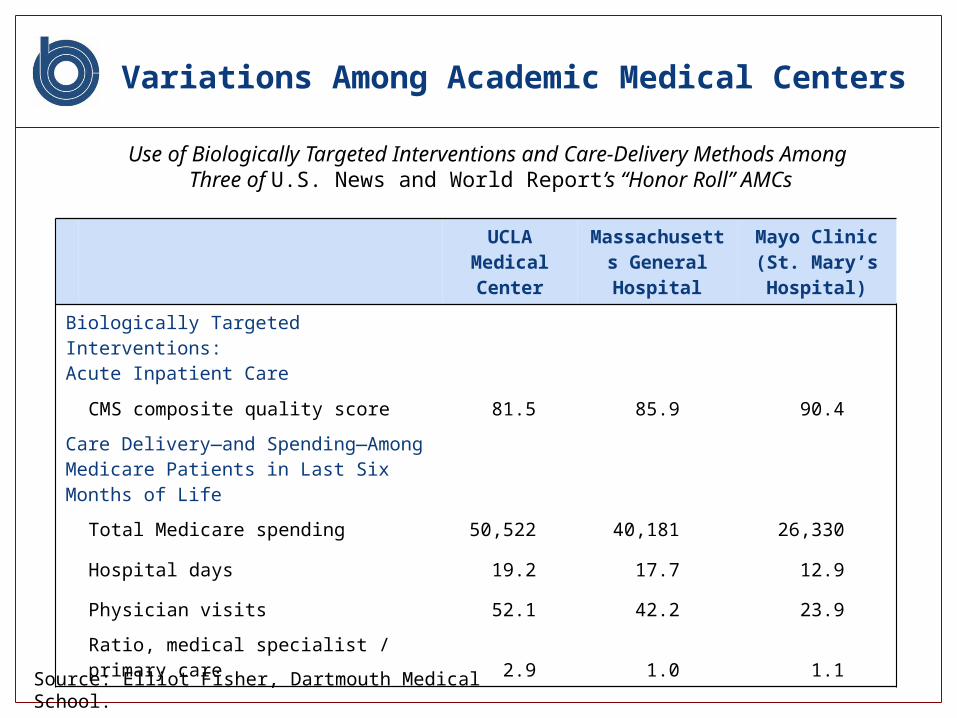
Variations Among Academic Medical Centers
UCLA Medical Center
Massachusetts General Hospital
Mayo Clinic(St. Mary’s Hospital)
Biologically Targeted Interventions: Acute Inpatient Care
CMS composite quality score 81.5 85.9 90.4
Care Delivery―and Spending―Among Medicare Patients in Last Six Months of Life
Total Medicare spending 50,522 40,181 26,330
Hospital days 19.2 17.7 12.9
Physician visits 52.1 42.2 23.9
Ratio, medical specialist / primary care 2.9 1.0 1.1
Use of Biologically Targeted Interventions and Care-Delivery Methods Among Three of U.S. News and World Report’s “Honor Roll” AMCs
Source: Elliot Fisher, Dartmouth Medical School.
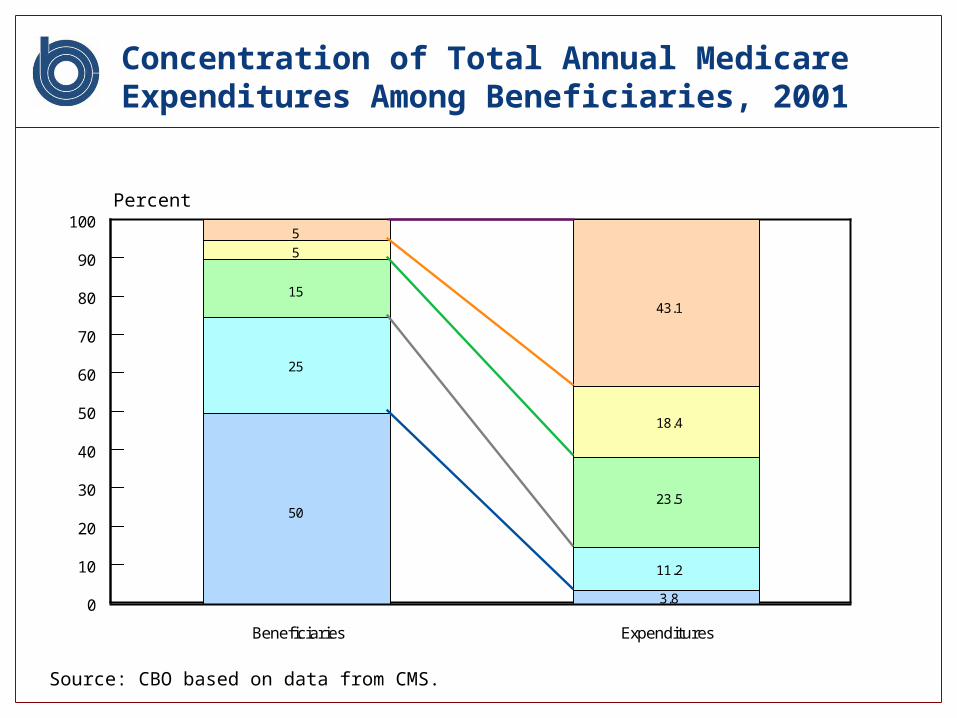
Concentration of Total Annual Medicare Expenditures Among Beneficiaries, 2001
Percent
Beneficiaries Expenditures
0
10
20
30
40
50
60
70
80
90
100
3.8
11.2
23.5
18.4
43.1
55
15
25
50
Source: CBO based on data from CMS.
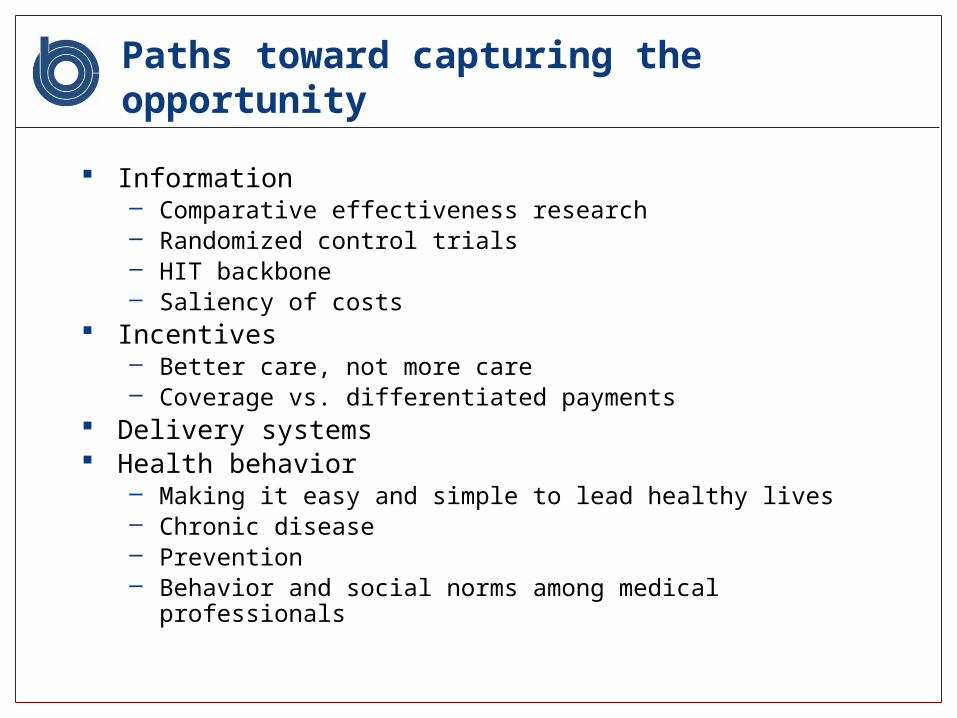
Paths toward capturing the opportunity
Information– Comparative effectiveness research– Randomized control trials– HIT backbone– Saliency of costs
Incentives– Better care, not more care– Coverage vs. differentiated payments
Delivery systems Health behavior
– Making it easy and simple to lead healthy lives– Chronic disease– Prevention– Behavior and social norms among medical professionals
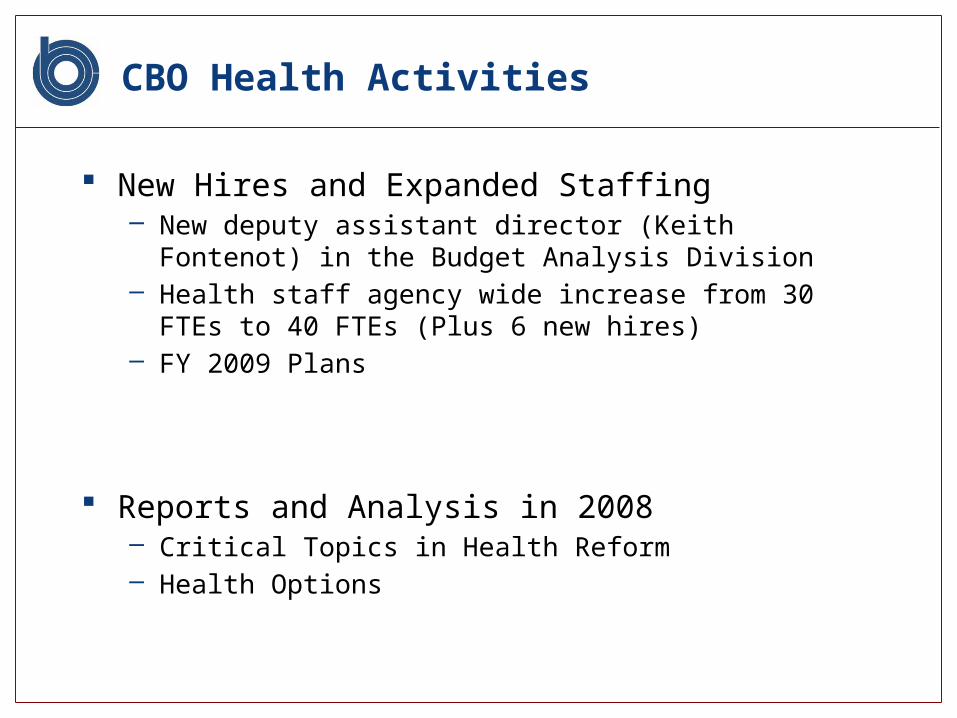
CBO Health Activities
New Hires and Expanded Staffing– New deputy assistant director (Keith Fontenot) in the Budget
Analysis Division– Health staff agency wide increase from 30 FTEs to 40 FTEs
(Plus 6 new hires)– FY 2009 Plans
Reports and Analysis in 2008– Critical Topics in Health Reform– Health Options
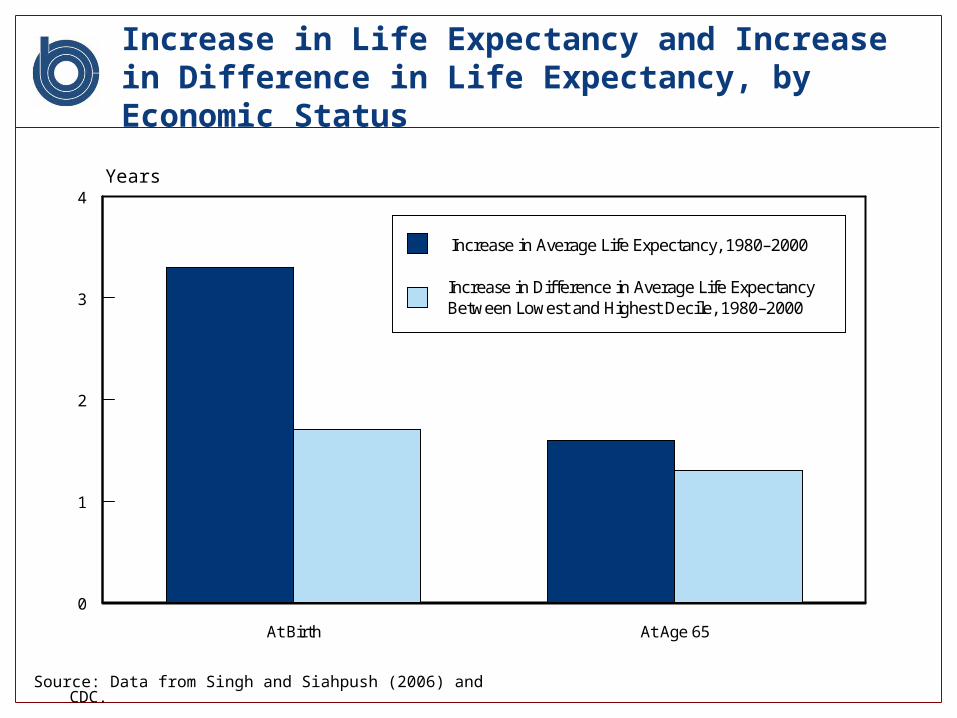
Increase in Life Expectancy and Increase in Difference in Life Expectancy, by Economic Status
Source: Data from Singh and Siahpush (2006) and CDC.
Years
At Birth At Age 65
0
1
2
3
4
Increase in Average Life Expectancy, 1980–2000
Increase in Difference in Average Life ExpectancyBetween Lowest and Highest Decile, 1980–2000