Embed Size (px)
Citation preview
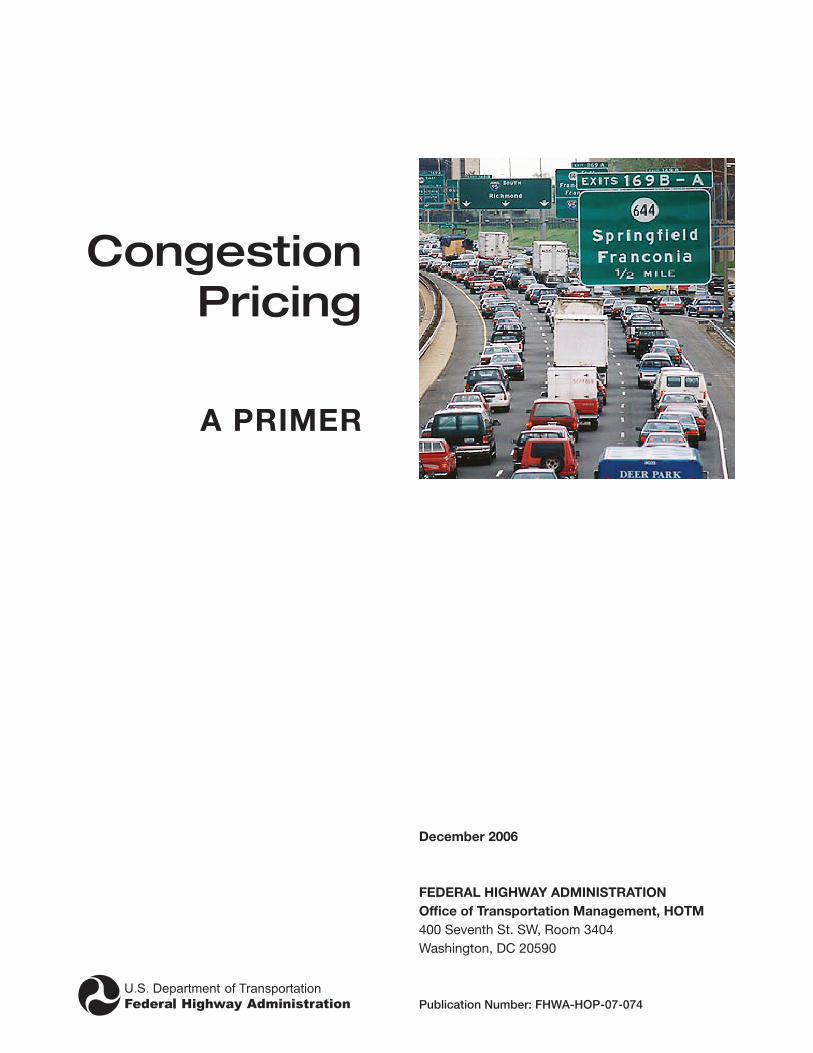
Congestion Pricing
A PRIMER
December 2006
FEDERAL HIGHWAY ADMINISTRATIONOffice of Transportation Management, HOTM400 Seventh St. SW, Room 3404Washington, DC 20590
Publication Number: FHWA-HOP-07-074
Table of Contents
I. THE CONGESTION PROBLEM .....................................................................................................................1
Costs of Congestion ........................................................................................................................................1
Alarming Trends ...............................................................................................................................................1
Causes of Congestion .....................................................................................................................................1
II. WHAT IS CONGESTION PRICING? ..............................................................................................................1
Technology for Congestion Pricing .................................................................................................................2
Variably Priced Lanes ......................................................................................................................................2
Variable Tolls on Roadways .............................................................................................................................3
Cordon Pricing .................................................................................................................................................4
Area-wide Pricing ............................................................................................................................................4
Use of Revenues from Pricing .........................................................................................................................4
III. BENEFITS OF CONGESTION PRICING ........................................................................................................5
Benefits to Transit Riders and Carpoolers ......................................................................................................5
Benefits to Drivers ...........................................................................................................................................5
Benefits to Businesses ...................................................................................................................................6
IV. EXAMPLES IN THE U.S .................................................................................................................................6
HOT Lanes on I-15 in San Diego, CA ..............................................................................................................6
SR 91 Express Lanes in Orange County, CA ...................................................................................................6
Bridge Pricing in Lee County, Florida ..............................................................................................................6
Oregon’s Mileage-Based Pricing Test .............................................................................................................6
V. EXAMPLES FROM ABROAD .........................................................................................................................7
Central London ................................................................................................................................................7
Singapore.........................................................................................................................................................7
Stockholm City Center ....................................................................................................................................7
Nationwide Truck Pricing in Germany .............................................................................................................8
VI. FEDERAL POLICY AND PROGRAMS ON PRICING ....................................................................................8
Federal Legislation ...........................................................................................................................................8
U.S. DOT’s Congestion Relief Initiative ...........................................................................................................8
VII. FREQUENTLY ASKED QUESTIONS .............................................................................................................9
How does electronic tolling work? ..................................................................................................................9
How does dynamic pricing work? ...................................................................................................................9
How do out-of-town motorists who don’t have a transponder pay? ..............................................................9
Wouldn’t electronic tolling invade a motorist’s privacy? ................................................................................9
How much is the charge? ................................................................................................................................9
Isn’t pricing inequitable towards low-income motorists? ................................................................................9
Isn’t congestion pricing “double taxation”? ..................................................................................................10
Won’t adjacent free roads get more congested due to diverted traffic? .......................................................10
Do people have flexibility to change the time when they travel? ..................................................................10
�
I. THE CONGESTION PROBLEM
Costs of Traffic Congestion Growing congestion in the U.S. transportation network poses a substantial threat to the U.S. economy and to the quality of life of millions of Americans. According to the Texas Transportation Institute (TTI), in 2003, con-gestion in the top 85 U.S. urban areas caused 3.7 billion hours of travel delay and 2.3 billions gallons of wasted fuel, for a total cost of $63 billion. This figure would be substantially higher (perhaps almost triple) if it account-ed for the significant cost of growing system unreliability and unpredictability to drivers and businesses, the en-vironmental impacts of idle-related auto emissions, or higher gasoline prices. In the 10 most congested areas, each rush hour traveler “pays” an annual “congestion tax” of between $850 and $1,600 in lost time and fuel and spends the equivalent of almost 8 workdays each year stuck in traffic.
Alarming TrendsHighway congestion has increased dramatically over the past two decades. Between 1982 and 2003, U.S. highway congestion has increased in extent, duration, and intensity. In 2003, in the largest U.S. cities, highway congestion:
• Impacted67%oftravel(upfrom33%in1982);
• Lasted7hoursperdayinduration(upfrom4.5hoursin1982);and
• Addedanadditional37%tothelengthoftheaveragerushhourdriver’strip(upfrom13%in1982).
Congestion is also growing rapidly in small and medium-sized metropolitan areas. Based on current trends, a medium-sized city should expect its congestion in 10 years to be as bad, or worse than, that currently experienced by a large city. The rate of congestion growth has been greater in rural than in urban areas, portending increased congestion in communities of all sizes.
Causes Of CongestionAt its most fundamental level, highway congestion is caused by the lack of a mechanism to efficiently manage use of capacity. When searching for a solution to the con-gestion problem, most people immediately think of add-ing a new lane to an overburdened highway. Construction costs for adding lanes in urban areas average $10 million per lane mile. Generally, the funding for this construction comes from the tax that drivers pay when buying gas for their vehicles. Overall, funds generated from gas taxes on an added lane during rush hours amount to only $60,000
a year. This amount is grossly insufficient to pay for the lane addition. The bargain price paid by motorists for use of expensive new capacity encourages more drivers to use the expanded highway. Introducing congestion pricing on highway facilities discourages overuse during rush hours by motivating people to travel by other modes such as car-pools or transit, or by traveling at other times of the day.
II. WHAT IS CONGESTION PRICING?
Congestion pricing – sometimes called value pricing – is a way of harnessing the power of the market to reduce the waste associated with traffic congestion. Congestion pric-ing works by shifting purely discretionary rush hour highway travel to other transportation modes or to off-peak periods, taking advantage of the fact that the majority of rush hour drivers on a typical urban highway are not commuters. By removing a fraction (even as small as 5%) of the vehicles from a congested roadway, pricing enables the system to flow much more efficiently, allowing more cars to move through the same physical space. Similar variable charges have been successfully utilized in other industries – for ex-ample, airline tickets, cell phone rates, and electricity rates. There is a consensus among economists that congestion pricing represents the single most viable and sustainable approach to reducing traffic congestion.
Although drivers unfamiliar with the concept initially have questions and concerns, surveys show that drivers more experienced with congestion pricing support it because it offers them a reliable trip time, which is very valuable es-pecially when they have to be somewhere on time. Transit and ridesharing advocates appreciate the ability of con-gestion pricing to generate both funding and incentives to make transit and ridesharing more attractive.
There are four main types of pricing strategies, each of which is discussed in more detail later in this section:
• Variably priced lanes,involvingvariabletollsonseparatedlaneswithinahighway,suchasExpressTollLanesorHOTLanes,i.e.HighOccupancyTolllanes
• Variable tolls on entire roadways – bothontollroadsandbridges,aswellasonexistingtoll-freefacilitiesduringrushhours
• Cordon charges – eithervariableorfixedchargestodrivewithinorintoacongestedareawithinacity
• Area-wide charges – per-milechargesonallroadswithinanareathatmayvarybylevelofcongestion
�
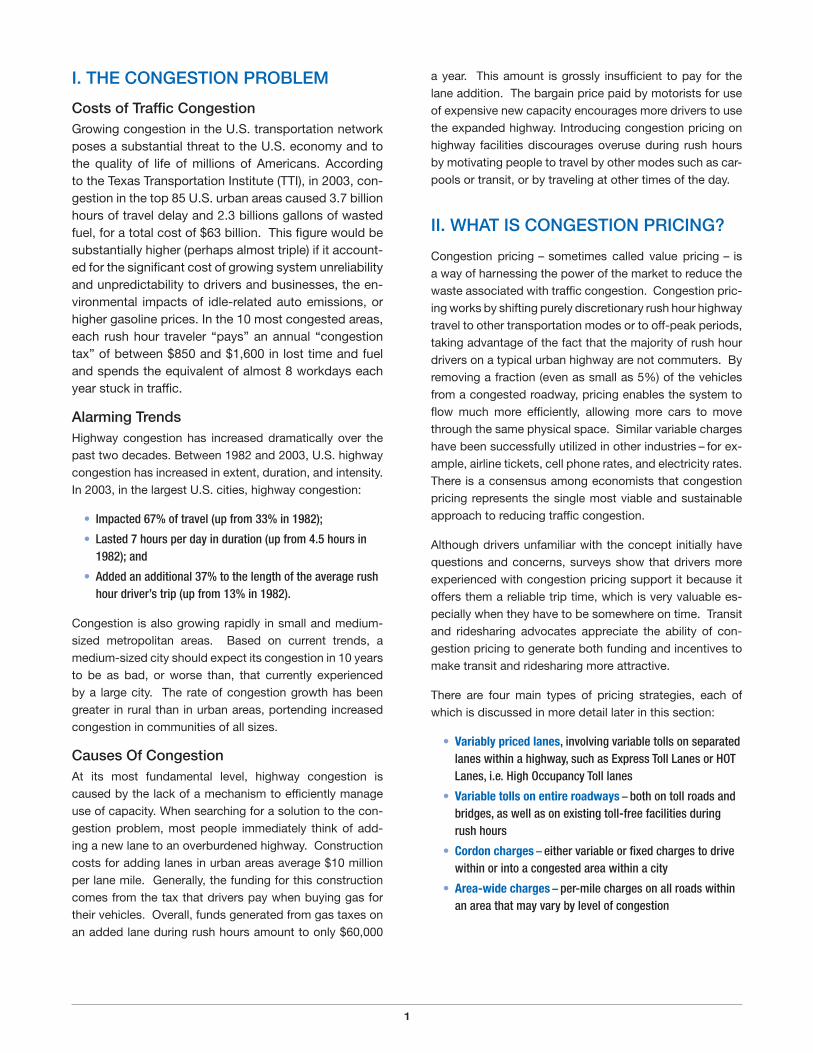
Technology for Congestion PricingWith congestion pricing, tolls typically vary by time of day and are collected at highway speeds using electronic toll collection technology. Traffic flows freely, and there are no toll booths. Vehicles are equipped with electronic devices called transponders or “tags”, which are read by overhead antennas. Toll rates for different time periods may be set in advance, or they may be set “dynamically” – hat is, they may be increased or decreased every few minutes to en-sure that the lanes are fully utilized without a breakdown in traffic flow.
Tags range from simple to highly sophisticated devices. Simple tags are “read-only,” meaning that they can provide an identification number to overhead readers using power from incoming radio frequency energy. More sophisticat-ed tags are battery-powered, and have processing power and memory. Tags are now the normal way tolls are col-lected from regular users – 70 to 80 percent of tolls are now collected this way on most urban commuter toll roads in peak hours. Simple “sticker” tags may be obtained for less than $10.
Global Positioning Systems (GPS) are used to collect truck tolls in Germany on the autobahns. In tests of such systems in the United States, an in-vehicle device records charges incurred based on its location as identified by the GPS unit in the vehicle. All location and payment information remains in the vehicle, and the vehicle owner periodically uploads the summary of charges to a processing cen-ter along with payments. The costs of such systems are currently high – as much as $500 per vehicle in Germany. Their high costs can be justified by additional services pro-vided by the systems, such as in-vehicle navigation and commercial fleet management. Also, the need for roadside equipment for toll collection is reduced.
Cameras are an essential complement to tags and GPS units to gain a record of the identity of vehicles that don’t have a working tag or GPS unit. Cameras can be used to deter toll violators. This is known as “video enforcement.” In cases where a tag is required for use of a facility, camera images allow a follow-up of violators and imposition of a penalty.
Use of a toll facility may be permitted without a tag or GPS unit. In this case, a camera-based system is used to collect what is termed a video toll. This toll includes the additional costs for administration. Cameras are being im-proved steadily in their capabilities and some believe that very soon toll operators could rely entirely on video tolling.
Variably Priced LanesVariably priced lanes include Express Toll lanes and HOT lanes. “HOT” is the acronym for “High Occupancy Toll.” On HOT lanes, low occupancy vehicles are charged a toll, while High Occupancy Vehicles (HOVs), public transit buses and emergency vehicles are allowed to use the lanes free of charge or at reduced rates. HOT lanes create an additional category of eligibility to use HOV lanes. People can meet the minimum vehicle pas-senger requirement – or they can choose to pay a toll to gain access to the HOV lane.
With citizens growing more frustrated with under-used HOV lanes, HOT lanes are increasingly being viewed as a solution that can reduce public opposition to HOV lanes. Surveys show that low-income commuters ex-press a high level of support for having a priced ex-press lane option. This is valuable when they absolutely must get somewhere on time. In places like San Diego, support from low-income travelers is over 70 percent. Low-income commuters also benefit from toll-financed transit improvements.
Express Toll lanes are similar to HOT lanes. The dif-ference is that all vehicles are required to pay a toll – HOVs do not get free service. This makes enforcement of toll-cheaters much easier. However, many travelers still have an incentive to carpool. By sharing the ride, each person in a two-person carpool pays only half the price, while each commuter in a four-person carpool only pays one-fourth.
Transponders are read by overhead antennas, allowing tolls to be paidwithoutstopping

�
Variable Tolls on RoadwaysWith this type of pricing, flat toll rates on existing toll roads are changed to a variable toll schedule so that the toll is higher during peak travel hours and lower dur-ing off-peak or shoulder hours. This encourages motor-ists to use the roadway during less congested periods, and allows traffic to flow more freely during peak times. Peak toll rates may be high enough to guarantee that traffic flow will not break down, thus offering motorists a reliable and congestion-free trip in exchange for the higher peak toll.
Variable tolls can also be introduced on existing toll-free facilities to manage traffic flow. Again, tolls vary by time of day and are charged only on congested highway seg-ments to manage traffic flow and recover the highway’s capacity to carry the number of vehicles it was designed for. The most efficient way to operate our freeways is to prevent congestion and keep traffic moving freely. When traffic flow collapses under congested condi-tions, capacity is lost (see box at right). By preventing congestion, pricing recovers this daily waste of public investment that occurs on congested highways.
Real life examples show the impacts of pricing. In Ft. Myers, Florida, a 50 percent discount on the toll was offered on the Midpoint and Cape Coral bridges for a short period of time before and after the rush hours. Survey data revealed that, among those eligible for the discount, there was an increase in traffic of as much as 20 percent during the discount period before the morn-ing rush hours, with corresponding drops in the rush hour itself.
Peakperiodvehiclethroughputduringthehourwithheaviesttraffic,StateRoute91—pricedvs.freelanes
Vehicles per lane per hour
1,600
1,200
800
400
0
Effects of Pricing on Vehicle ThroughputVehicle “throughput” on a freeway is the number of vehicles that get through over a short period such as an hour. Once freeway traffic exceeds a certain threshold level, both vehicle speed and vehicle throughput drop precipitously. Data show that maximum vehicle throughput occurs at free flow speeds ranging from 45 mph to 65 mph. The number of vehicles that get through per hour can drop by as much as 50 percent when severe con-gestion sets in. At high traffic levels, the freeway is kept in this condition of “collapse” for several hours after the rush of commuters has stopped. This causes further unnecessary delay for off-peak motorists who arrive after rush hour.
With peak-period highway pricing, a variable toll dissuades some motorists from entering freeways at those access points where traffic demand is high, and where such surges in demand may push the freeway over the critical threshold at which traf-fic flow collapses. Pricing prevents a breakdown of traffic flow in the first instance, and thus main-tains a high level of vehicle throughput throughout the rush hours. As shown in the graph above, each variably priced lane in the median of State Route 91 in Orange County, California, carries twice as many vehicles per lane as the free lanes during the hour with heaviest traffic. Pricing has allowed twice as many vehicles to be served per lane at three to four times the speed on the free lanes.
Priced Free
�
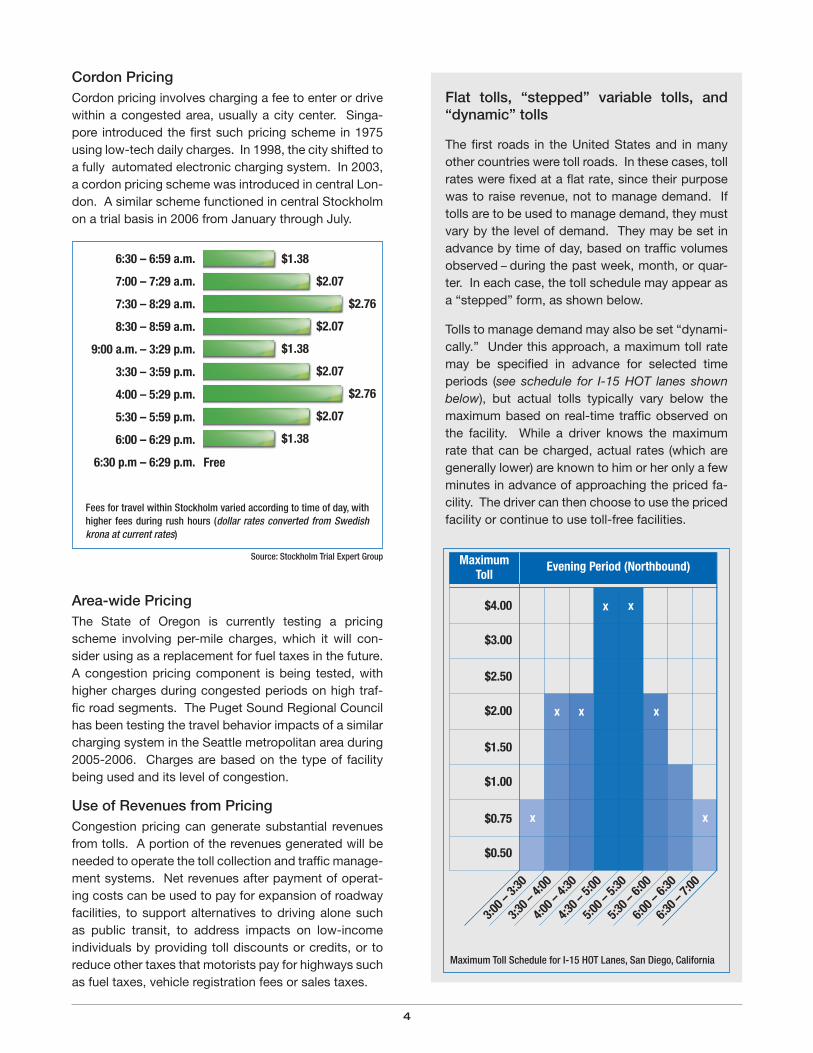
Cordon PricingCordon pricing involves charging a fee to enter or drive within a congested area, usually a city center. Singa-pore introduced the first such pricing scheme in 1975 using low-tech daily charges. In 1998, the city shifted to a fully automated electronic charging system. In 2003, a cordon pricing scheme was introduced in central Lon-don. A similar scheme functioned in central Stockholm on a trial basis in 2006 from January through July.
Area-wide PricingThe State of Oregon is currently testing a pricing scheme involving per-mile charges, which it will con-sider using as a replacement for fuel taxes in the future. A congestion pricing component is being tested, with higher charges during congested periods on high traf-fic road segments. The Puget Sound Regional Council has been testing the travel behavior impacts of a similar charging system in the Seattle metropolitan area during 2005-2006. Charges are based on the type of facility being used and its level of congestion.
Use of Revenues from PricingCongestion pricing can generate substantial revenues from tolls. A portion of the revenues generated will be needed to operate the toll collection and traffic manage-ment systems. Net revenues after payment of operat-ing costs can be used to pay for expansion of roadway facilities, to support alternatives to driving alone such as public transit, to address impacts on low-income individuals by providing toll discounts or credits, or to reduce other taxes that motorists pay for highways such as fuel taxes, vehicle registration fees or sales taxes.
Flat tolls, “stepped” variable tolls, and “dynamic” tolls
The first roads in the United States and in many other countries were toll roads. In these cases, toll rates were fixed at a flat rate, since their purpose was to raise revenue, not to manage demand. If tolls are to be used to manage demand, they must vary by the level of demand. They may be set in advance by time of day, based on traffic volumes observed – during the past week, month, or quar-ter. In each case, the toll schedule may appear as a “stepped” form, as shown below.
Tolls to manage demand may also be set “dynami-cally.” Under this approach, a maximum toll rate may be specified in advance for selected time periods (see schedule for I-15 HOT lanes shown below), but actual tolls typically vary below the maximum based on real-time traffic observed on the facility. While a driver knows the maximum rate that can be charged, actual rates (which are generally lower) are known to him or her only a few minutes in advance of approaching the priced fa-cility. The driver can then choose to use the priced facility or continue to use toll-free facilities.
FeesfortravelwithinStockholmvariedaccordingtotimeofday,withhigher feesduringrushhours (dollar rates converted from Swedish krona at current rates)
$1.38
$2.07
$2.76
$2.07
$1.38
$2.07
$2.76
$2.07
$1.38
6:30 – 6:59 a.m.
7:00 – 7:29 a.m.
7:30 – 8:29 a.m.
8:30 – 8:59 a.m.
9:00 a.m. – 3:29 p.m.
3:30 – 3:59 p.m.
4:00 – 5:29 p.m.
5:30 – 5:59 p.m.
6:00 – 6:29 p.m.
6:30 p.m – 6:29 p.m. Free
Source:StockholmTrialExpertGroup
MaximumTollScheduleforI-15HOTLanes,SanDiego,California
Maximum Toll
Evening Period (Northbound)
x x
x x x
x x
$4.00
$3.00
$2.50
$2.00
$1.50
$1.00
$0.75
$0.50
3:00 –
3:30
3:30 –
4:00
4:00 –
4:30
4:30 –
5:00
5:00 –
5:30
5:30 –
6:00
6:00 –
6:30
6:30 –
7:00
�
III. BENEFITS OF CONGESTION PRICING
Congestion pricing benefits drivers and businesses by reducing delays and stress, by increasing the predict-ability of trip times, and by allowing for more deliveries per hour. It benefits mass transit by improving transit speeds and the reliability of transit service, increasing transit ridership, and lowering costs for transit provid-ers. It benefits State and local governments by improv-ing the quality of transportation services without tax increases or large capital expenditures, by providing ad-ditional revenues for funding transportation, by retaining businesses and expanding the tax base, and by short-ening incident response times for emergency personnel and thus saving lives. By preventing the loss of vehicle throughput that results from a breakdown of traffic flow, pricing maximizes return on the public’s investment in highway facilities. And it benefits society as a whole by reducing fuel consumption and vehicle emissions, by allowing more efficient land use decisions, by reducing housing market distortions, and by expanding opportu-nities for civic participation.
Benefits to Transit Riders and CarpoolersPricing in combination with transit services provides bus riders with travel time savings equivalent to those for drivers, and reduces waiting time for express bus riders due to more frequent service. Introduction of pricing in central London and Stockholm has resulted in significant shifts of commuters to transit, particularly buses. Bus delays in central London dropped by 50 percent after the pricing scheme was introduced. There was a 7 percent increase in bus riders. In Stockholm, 200 new buses were put into service in August 2005, several months in advance of the pricing trial, which began in January 2006. After the pricing scheme was implemented, daily public transportation use compared to the same month in 2005 was up by 40,000 riders daily. Ridership on inner-city bus routes rose 9 percent compared with a year earlier.
Within three months of the opening of the priced ex-press lanes on California’s SR-91, a 40 percent jump occurred in the number of vehicles with more than three passengers. Ridership on buses and a nearby rail line have remained steady. On San Diego’s I-15 HOT lanes, revenues generated by toll-payers financed transit improvements that contributed to a 25 percent increase in bus ridership.
After the HOV lanes were converted into HOT lanes on I-15 in San Diego, carpooling increased significantly, even though there was no change in incentives to car-pool – carpoolers continued to use the lanes free of charge, as they did before the lanes were converted. Similar effects were observed when the HOV lanes on I-25 in Denver were converted to HOT lanes in June 2006. It’s not clear why carpooling increases – it could be a result of the extra publicity by the media.
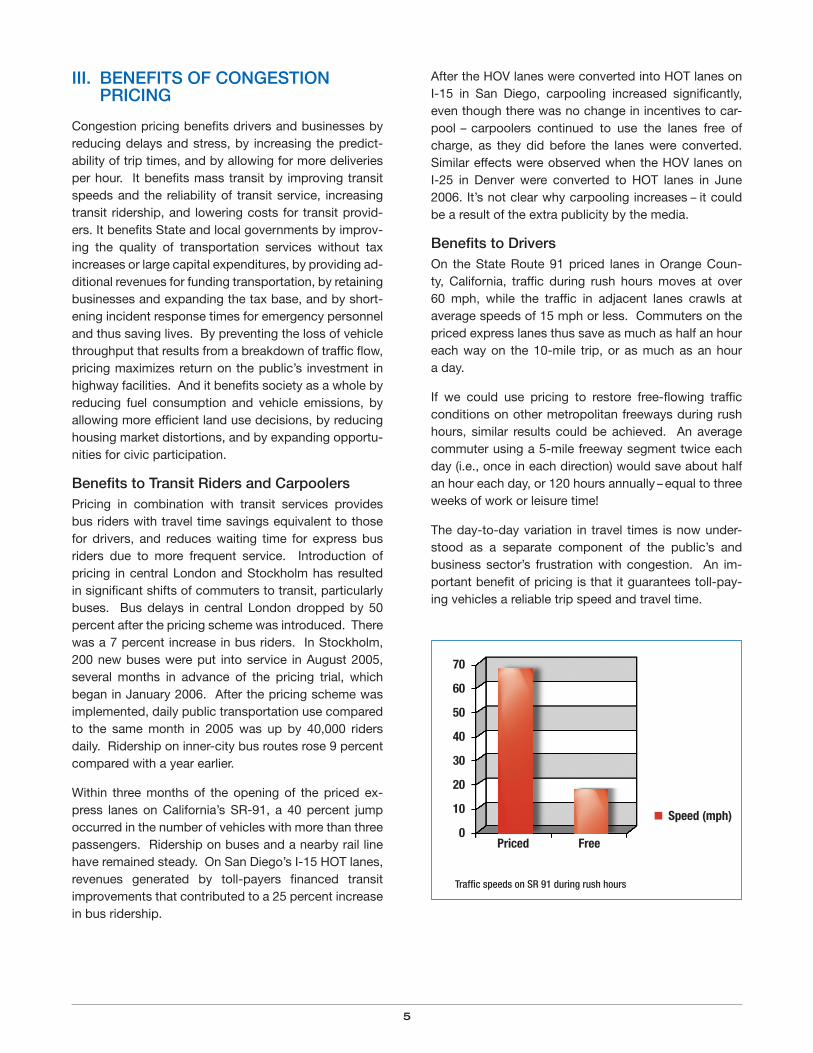
Benefits to DriversOn the State Route 91 priced lanes in Orange Coun-ty, California, traffic during rush hours moves at over 60 mph, while the traffic in adjacent lanes crawls at average speeds of 15 mph or less. Commuters on the priced express lanes thus save as much as half an hour each way on the 10-mile trip, or as much as an hour a day.
If we could use pricing to restore free-flowing traffic conditions on other metropolitan freeways during rush hours, similar results could be achieved. An average commuter using a 5-mile freeway segment twice each day (i.e., once in each direction) would save about half an hour each day, or 120 hours annually – equal to three weeks of work or leisure time!
The day-to-day variation in travel times is now under-stood as a separate component of the public’s and business sector’s frustration with congestion. An im-portant benefit of pricing is that it guarantees toll-pay-ing vehicles a reliable trip speed and travel time.
TrafficspeedsonSR91duringrushhours
Speed (mph)
70
60
50
40
0
30
20
10
Priced Free
�
Benefits to BusinessesGrowing congestion and unreliability threatens truck transportation productivity and ultimately the ability of sellers to deliver products to market. Additionally, when deliveries cannot be relied on to arrive on time, businesses must keep extra “buffer stock” inventory on hand. This can be expensive. Pricing of the nation’s major thoroughfares to guarantee free flow of traffic will ensure that reliability is restored to the transporta-tion system, keeping business and transportation costs low. Lower costs will increase the competitiveness of U.S. businesses in international markets and boost the U.S. economy.
IV. EXAMPLES IN THE U.S.
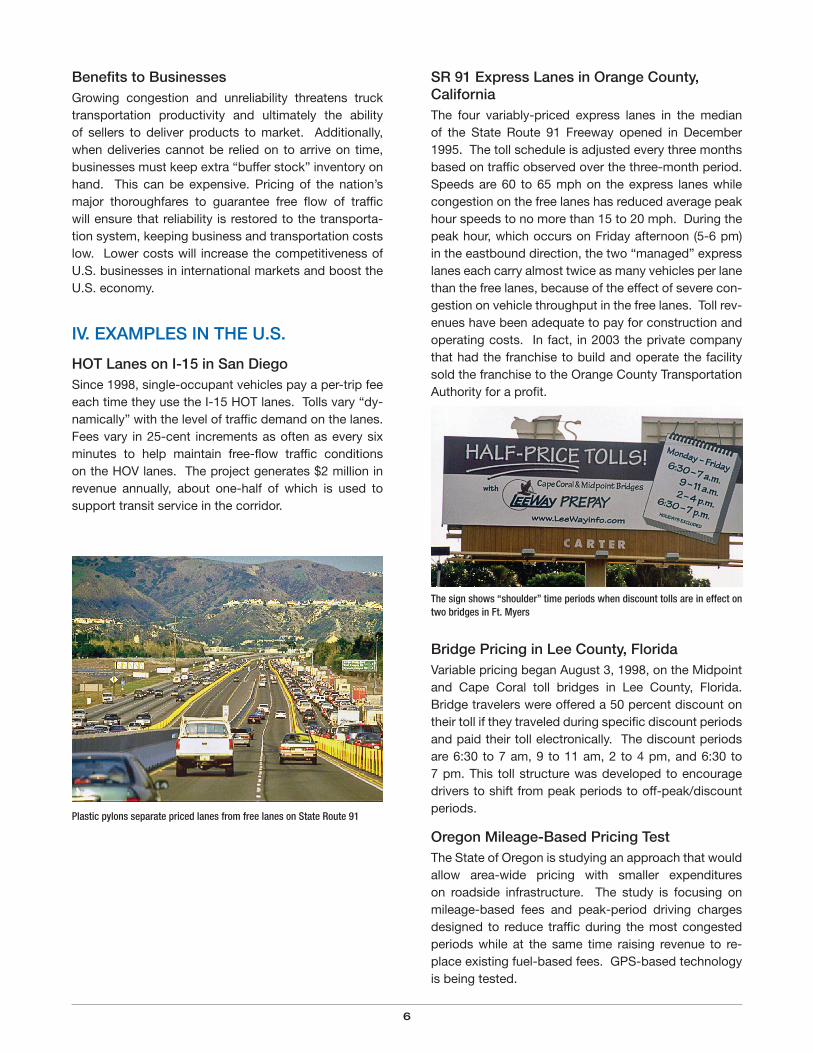
HOT Lanes on I-15 in San Diego Since 1998, single-occupant vehicles pay a per-trip fee each time they use the I-15 HOT lanes. Tolls vary “dy-namically” with the level of traffic demand on the lanes. Fees vary in 25-cent increments as often as every six minutes to help maintain free-flow traffic conditions on the HOV lanes. The project generates $2 million in revenue annually, about one-half of which is used to support transit service in the corridor.
SR 91 Express Lanes in Orange County, California The four variably-priced express lanes in the median of the State Route 91 Freeway opened in December 1995. The toll schedule is adjusted every three months based on traffic observed over the three-month period. Speeds are 60 to 65 mph on the express lanes while congestion on the free lanes has reduced average peak hour speeds to no more than 15 to 20 mph. During the peak hour, which occurs on Friday afternoon (5-6 pm) in the eastbound direction, the two “managed” express lanes each carry almost twice as many vehicles per lane than the free lanes, because of the effect of severe con-gestion on vehicle throughput in the free lanes. Toll rev-enues have been adequate to pay for construction and operating costs. In fact, in 2003 the private company that had the franchise to build and operate the facility sold the franchise to the Orange County Transportation Authority for a profit.
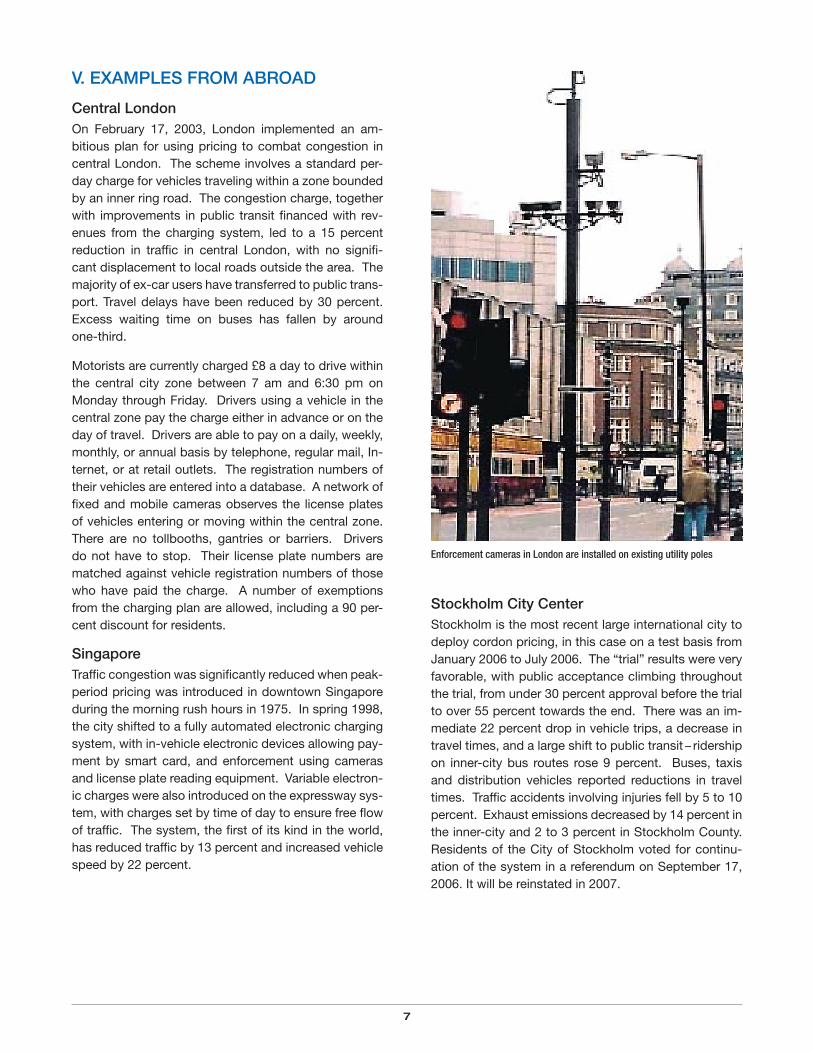
Bridge Pricing in Lee County, Florida Variable pricing began August 3, 1998, on the Midpoint and Cape Coral toll bridges in Lee County, Florida. Bridge travelers were offered a 50 percent discount on their toll if they traveled during specific discount periods and paid their toll electronically. The discount periods are 6:30 to 7 am, 9 to 11 am, 2 to 4 pm, and 6:30 to 7 pm. This toll structure was developed to encourage drivers to shift from peak periods to off-peak/discount periods.
Oregon Mileage-Based Pricing Test The State of Oregon is studying an approach that would allow area-wide pricing with smaller expenditures on roadside infrastructure. The study is focusing on mileage-based fees and peak-period driving charges designed to reduce traffic during the most congested periods while at the same time raising revenue to re-place existing fuel-based fees. GPS-based technology is being tested.
PlasticpylonsseparatepricedlanesfromfreelanesonStateRoute91
Thesignshows“shoulder”timeperiodswhendiscounttollsareineffectontwobridgesinFt.Myers
�
V. EXAMPLES FROM ABROAD
Central LondonOn February 17, 2003, London implemented an am-bitious plan for using pricing to combat congestion in central London. The scheme involves a standard per-day charge for vehicles traveling within a zone bounded by an inner ring road. The congestion charge, together with improvements in public transit financed with rev-enues from the charging system, led to a 15 percent reduction in traffic in central London, with no signifi-cant displacement to local roads outside the area. The majority of ex-car users have transferred to public trans-port. Travel delays have been reduced by 30 percent. Excess waiting time on buses has fallen by around one-third.
Motorists are currently charged £8 a day to drive within the central city zone between 7 am and 6:30 pm on Monday through Friday. Drivers using a vehicle in the central zone pay the charge either in advance or on the day of travel. Drivers are able to pay on a daily, weekly, monthly, or annual basis by telephone, regular mail, In-ternet, or at retail outlets. The registration numbers of their vehicles are entered into a database. A network of fixed and mobile cameras observes the license plates of vehicles entering or moving within the central zone. There are no tollbooths, gantries or barriers. Drivers do not have to stop. Their license plate numbers are matched against vehicle registration numbers of those who have paid the charge. A number of exemptions from the charging plan are allowed, including a 90 per-cent discount for residents.
Singapore Traffic congestion was significantly reduced when peak-period pricing was introduced in downtown Singapore during the morning rush hours in 1975. In spring 1998, the city shifted to a fully automated electronic charging system, with in-vehicle electronic devices allowing pay-ment by smart card, and enforcement using cameras and license plate reading equipment. Variable electron-ic charges were also introduced on the expressway sys-tem, with charges set by time of day to ensure free flow of traffic. The system, the first of its kind in the world, has reduced traffic by 13 percent and increased vehicle speed by 22 percent.
Stockholm City CenterStockholm is the most recent large international city to deploy cordon pricing, in this case on a test basis from January 2006 to July 2006. The “trial” results were very favorable, with public acceptance climbing throughout the trial, from under 30 percent approval before the trial to over 55 percent towards the end. There was an im-mediate 22 percent drop in vehicle trips, a decrease in travel times, and a large shift to public transit – ridership on inner-city bus routes rose 9 percent. Buses, taxis and distribution vehicles reported reductions in travel times. Traffic accidents involving injuries fell by 5 to 10 percent. Exhaust emissions decreased by 14 percent in the inner-city and 2 to 3 percent in Stockholm County. Residents of the City of Stockholm voted for continu-ation of the system in a referendum on September 17, 2006. It will be reinstated in 2007.
EnforcementcamerasinLondonareinstalledonexistingutilitypoles
�
Nationwide Truck Pricing in GermanyIn January 2005, Germany implemented a new system to toll trucks on the autobahns. An average user charge of Euro 0.15 per kilometer (about $0.31 per mile) re-placed the previous fees for time-based permits called “Euro Vignette.” All trucks with a permissible gross weight of 12 or more tons are charged electronically using Global positioning Systems (GPS). The tolls are based on distance traveled, number of axles, and the vehicle’s emissions class. Net toll revenues go toward funding for transportation infrastructure.
VI. FEDERAL POLICY AND PROGRAMS ON PRICING
Federal LegislationThere are three programs or provisions within the Federal-aid Highway Program that support congestion pricing:
Value Pricing Pilot Program: This program, initially authorized in the Intermodal Surface Transportation Efficiency Act (ISTEA) in 1991 as the Congestion Pricing Pilot Program, encourages implementation and evalu-ation of projects encompassing a variety of strategies to manage congestion on highways, including both toll-ing of highway facilities and other pricing strategies not involving tolls. This is the only program that provides funding.
High Occupancy Vehicle (HOV) Facilities: This program allows states to charge tolls to vehicles that do not meet the established occupancy requirements to use an HOV lane if the state establishes a program that addresses the selection of vehicles allowed in such lanes and procedures for enforcing the restrictions.
Express Lanes Demonstration Program: This program permits tolling on up to 15 selected demonstra-tion projects to manage congestion, reduce emissions in a non-attainment area, or finance new and existing In-terstate lanes for the purposes of reducing congestion.
In addition, there are three programs or provisions with-in the Federal-aid Highway Program that support tolling for the purpose of highway financing:
Interstate System Construction Toll Pilot Program: This program authorizes up to three facilities on the In-terstate System to be tolled for the purpose of financing the construction of new Interstate highways.
Interstate System Reconstruction and Rehabilita-tion Pilot Program: This program allows up to three existing Interstate facilities (highway, bridge, or tunnel) to be tolled to fund needed reconstruction or rehabilita-tion on Interstate corridors that could not otherwise be adequately maintained or functionally improved without the collection of tolls.
Title 23 United States Code Section 129 Tolling Agreements: Section 129 allows tolling of non-In-terstate highways as well as Interstate bridges and tunnels. There is no limit to the number of agreements that may be executed.
U.S. DOT’s Congestion Relief InitiativeThe U.S. Department of Transportation’s Congestion Initiative further focuses the above tolling programs toward the overall goal of relieving congestion. The Department seeks to enter into Urban Partnership Agreements with selected cities, pursuant to which the cities and Department will commit to the following actions:
• Implementingabroadcongestionpricingorvariabletolldemonstration;
• Creatingorexpandingexpressbusservices,whichwillbenefitfromfreeflowtrafficconditions;
• Securingagreementsfrommajorareaemployerstoestablishorexpandtelecommutingandflexschedulingprograms;
• Encouragingandsupportinguseoftechnologytoimprovetheefficiencyofoperationofthehighwaysystem;and
• Expeditingcompletionofthemostsignificanthighwaycapacityprojectscurrentlyunderwaythatholdthegreatestpotentialforreducingcongestionandbottlenecks.
To the maximum extent possible, the Department will commit discretionary resources and expertise to sup-port the above actions, including potentially transit Small Starts funds, Intelligent Transportation System (ITS) funds, and Value Pricing Pilot Program funds. The Department will work to expedite completion of capac-ity projects through:
• InclusionofsuchprojectsontheExecutiveOrderonEnvi-ronmentalStewardshipandTransportationInfrastructureProjectReviews;and
• Providingtollingflexibility,privateactivitybondborrowingauthority,andTransportationInfrastructureFinanceandIn-novationAct(TIFIA)programcreditassistance,ifnecessary.
�
VII. FREQUENTLY ASKED QUESTIONS
How does electronic tolling work?Typically, drivers simply put small electronic tags, called transponders, on the windshield inside their cars. In conjunction with using the transponder, they open an account with a toll operator. Tolls are then collected as the tag is read at normal highway speeds by electronic scanners suspended from gantries above the highway. Motorists ensure adequate funding is available in their accounts by linking their accounts to their credit card accounts or through a quick call, trip to a kiosk or office, or visit to a website. Tags may emit a signal warning consumers when their account is running low, or they are informed through messages beamed to them as they go by a toll collection point.
How does dynamic pricing work?With dynamic pricing, tolls are continually adjusted ac-cording to traffic conditions to maintain a free-flowing level of traffic. Under this system, prices increase when the tolled lane(s) get relatively full and decrease when the tolled lane(s) get less full. The current price is dis-played on electronic signs prior to the beginning of the tolled section. This system is more complex and less predictable than using a fixed-price table, but its flex-ibility helps to consistently maintain the optimal traffic flow. Motorists are usually guaranteed that they will not be charged more than a pre-set maximum price under any circumstances.
How do out-of-town motorists who don’t have a transponder pay?This is handled in several ways. Of course, clear sig-nage is used to show drivers which lane(s) or route to use to avoid the toll. This avoids most of these kinds of problems. Some systems also allow drivers to pay via credit card after-the-fact by calling a toll-free line. Some project sponsors simply let drivers use the tolled lane(s) at no charge the first few times. For instance, a letter may be sent to a non-paying driver identified based on matching of a photo of license plates with State vehicle registration databases. The letter would explain that if the driver wants to continue to use the facility, he or she should get a tag or risk a fine, but that initial usage is being allowed at no cost. The operator of an all-elec-tronic toll facility in Toronto, Canada, simply bills such motorists for the cost of the toll plus a $1 administra-tive fee. Through these kinds of steps, the chances of tourists, occasional visitors, or inadvertent users being penalized are minimized.
Wouldn’t electronic tolling invade a motorist’s privacy?All of the operating pricing projects in the United States and more than 250 other toll facilities across the coun-try use electronic toll collection (ETC). Tolling agencies have devised a method to protect the public’s privacy by linking the transponder and the driver’s personal in-formation with a generic, internal account number that does not reveal the driver’s identity and that is not dis-closed to other organizations. Also, a motorist can open an anonymous account if he or she so chooses.
How much is the charge?Prices will vary from project to project due to supply and demand, as well as other regional factors. If all lanes on an existing toll-free facility are priced, charges will be much lower, because there will be more “supply” of premium free-flowing traffic lanes, thus lowering the market-based price that must be charged to fully utilize the available capacity. Some projects do use a pre-set schedule of tolls. This has the advantage of being predictable and simple. With dynamic pricing, the toll fee is adjusted in real-time until optimal traffic flow is achieved. For example, the express lane fees for an 8-mile section in San Diego typically range from $1 to $4.
Isn’t pricing inequitable towards low-income motorists?Results from surveys conducted for projects in opera-tion show that drivers of all income levels use priced express lanes. Although many low-income users don’t choose to use the tolled facility every day, they support having the option. For instance, a low-income parent racing to avoid the financial penalty associated with be-ing late for pick-up at a day care facility, or for work, is often pleased to have the option of paying a fee to bypass gridlock in the regular lanes. In fact, a high level of support for San Diego’s HOT lanes comes from the lowest income users (70 percent support). Moreover, low-income bus riders may benefit significantly from toll-financed transit improvements. Finally, a well-de-signed value pricing plan can be less burdensome to low-income citizens than current systems that are based on regressive taxes, such as car registration fees, sales taxes and the gas tax. For example, a proposal for pricing the San Francisco-Oakland Bay Bridge included life-line discounts for low-income motorists. The Bridge also currently provides free service for carpool vehicles during rush hours.
�0
Isn’t congestion pricing “double taxation”?The prices road users currently face include only the value of their own travel time plus vehicle operating costs (including a small part that represents fuel taxes and occasional tolls). But the costs they impose during peak travel hours also include the value of the delays they impose on other users by slowing travel speeds. Speeds slow until the delays that vehicles impose on one another temporarily balance demand and supply, but only by deterring travelers (and shipments) whose time is most valuable, while wasting large amounts of others’ time. Besides wasting their own and others’ time, drivers sitting in congested traffic also impose pol-lution costs not covered by gas taxes.
Despite the magnitude of these costs imposed on oth-ers, rush hour vehicle users are currently not charged for these costs. Thus, separate congestion charges are appropriate. Gas taxes paid by a motorist amount to just two cents per mile driven. To avoid the claim of “double taxation,” gas taxes already paid can be tallied separately and reimbursed to the driver, as is already done for toll road users in a few States.
Won’t adjacent free roads get more congested due to diverted traffic?It is true that when toll rates are raised on tollways, some drivers do divert to free alternatives. However, when pricing is introduced on previously congested highways, some traffic may actually be reduced on par-allel arterials because certain travelers who were previ-ously deterred by freeway congestion may shift back to the priced highways once congestion is eliminated and throughput has increased (as explained in an earlier section). Also, introduction of tolls during rush hour will be accompanied by expansion of transit capacity and continued availability of HOV options, so that some solo drivers will use transit or carpool rather than divert to free roadways. And, if rush hour toll revenues are used to pay for freeway widening, the expanded freeway will be able to carry even more traffic, and will further reduce traffic on parallel free arterials.
Do people have flexibility to change the time when they travel?On average, over half of peak period drivers in metro-politan areas are not commuting. In other words, there is far more schedule flexibility than commonly under-stood. Moreover, the rise of the internet, pda’s and telecommuting are providing employees with unprec-edented flexibility to work outside the four corners of their offices. Giving people the option and incentive to shift trip times even 30-45 minutes can significantly reduce congestion. It is expected that employers would also respond to congestion pricing by offering employ-ees more work schedule options
For More Information Contact:Patrick DeCorla-Souza, Program Manager
FEDERAL HIGHWAY ADMINISTRATION Office of Transportation Management, HOTM
400 Seventh St. SW, Room 3404 Washington, DC 20590
Tel: (202) 366-4076 e-mail: [email protected]