Embed Size (px)
Citation preview
CONGESTION MANAGEMENT PROCESS PLAN
Prepared By: Okaloosa-Walton Transportation Planning Organization
Post Office Box 11399 Or 4081 E Olive Road, Suite A Pensacola, FL 32524 Pensacola, FL 32514
850-332-7976 (voice) 850-637-1923 (fax)
Staff Contact: Aries Little Transportation Planner www.wfrpc.org STAFF TO OKALOOSA-WALTON TPO Final: September 2010
This report was financed in part by the U.S. Department of Transportation, Federal Highway Administration, the Florida Department of Transportation and submitted in partial fulfillment of
FY2010/11 UPWP Task C.4
______________________________________________________________________________ Okaloosa - Walton CMP Report 1
TABLE OF CONTENTS Table of Contents .................................................................................................................1 List of Figures and List of Tables ........................................................................................2 Introduction ..........................................................................................................................3 Area of Application..............................................................................................................4 System Definition (Modes and Network) ........................................................................ 4-5 Performance Measure ..........................................................................................................6 Performance Monitoring Plan ..............................................................................................6 Identification and Evaluation of Strategies ...................................................................... 6-8 Monitoring Strategy Effectiveness ................................................................................ 8-10 Implementation and Management.................................................................................. 8-10 FDOT Level of Service Standards ............................................................................... 10-11 FDOT Generalized Level of Service Tables ......................................................................11 Development of the Generalized Tables ............................................................................11 How to use the Generalized Tables ............................................................................. 11-12 Level of Service Analysis Tables ................................................................................ 12-13 Congestion Trends, Causes and Impacts ..................................................................... 13-14 Intelligent Transportation Systems ....................................................................................14 Bicycle/Pedestrian Analysis......................................................................................... 14-15 Transit Analysis .................................................................................................................15 Congestion Management Process Public Involvement Process.........................................15 Safe Accountable Flexible Efficient Transportation Equity Act-A Legacy for Users 15-16 Conclusions ........................................................................................................................16

______________________________________________________________________________ Okaloosa - Walton CMP Report 2
LIST OF FIGURES Figure 1- Glossary Figure 2- Deficient Roadway Segments- (Derived Utilizing the Generalized Level of Service Tables from the Florida Department of Transportation) Figure 3- Past Study Team Recommendations- (Implementation Efforts Will Be Made Every Other Year- Potential Funding Sources are Federal, State, and Local) Figure 4- Analysis of Implemented Recommendations
LIST OF TABLES Table 1- 2009 Level of Service State and County Roads: Okaloosa County and Walton County Table 2- 2009 Multimodal Level of Service State and County Roads: Okaloosa County and Walton County Appendix A- Statewide Minimum Level of Service Standard F.A.C. Appendix B- 2009 Quality/Level of Service Handbook-Generalized Tables Appendix C-Maps Appendix D- Okaloosa County and Walton County CMP Roadway Technical Rankings
______________________________________________________________________________ Okaloosa - Walton CMP Report 3
Introduction The transportation planning process shall address congestion management through a process that provides for safe and effective integrated management and operation of the multimodal transportation system. This report documents levels of traffic congestion in the Okaloosa-Walton Urbanized Area. The report concludes with an analysis of selected congested segments, and a comprehensive set of strategies to relieve that congestion. This report will serve as the Congestion Management Process (CMP) report for the Okaloosa-Walton Transportation Planning Organization (TPO). The purpose of the CMP is to rate the performance of transportation facilities (roadways, bike lanes, sidewalks and transit services) and to suggest low-cost, short-term strategies to alleviate congestion. Level of service standards and easy to use measurement techniques are essential for transportation planning. Presented in this report are the levels of service standards for Okaloosa County and Walton County (based on State standards) as well as level of service analyses on state and county roadways using widely accepted techniques. This analysis is based on the standards and measurement techniques presented in the Florida Department of Transportation 2009 Quality/Level of Service Handbook, which is used throughout Florida. Traffic counts collected by the Florida Department of Transportation (FDOT), statewide level of service standards and the state’s generalized level of service tables, commonly referred to as the “generalized tables” have been utilized in this analysis. While the CMP is updated annually, the benefits of many identified congestion mitigation strategies will not necessarily be identified in the subsequent year’s plan. However, the projects identified are monitored and tracked. In order to further integrate the CMP into the established planning process, projects identified through the CMP Identification and Evaluation process receive recognition in the Traffic Operations Project Priority Criteria in the Transportation Improvement Program (TIP). For example, if a traffic operations candidate project was identified through the CMP process, it would be given additional points when ranked in the TPO’s Project Priorities. The CMP project priorities should also be given consideration in the development of Major Project Priorities when the Long Range Plan is updated. After each segment is discussed and studied by the CMP Review Team, staff will present the recommendations to the TPO. Staff will also provide reports to FDOT and local government staff regarding CMP Review Team recommendations. In order to ensure that recommendations are considered to the highest degree possible, staff will monitor and follow up on requests made through the CMP process by frequent consultation with FDOT and local government staff. The CMP relies upon technical criteria to determine the order in which deficient segments will be studied. Several areas are considered in the technical criteria, such as whether or not any major improvements are planned for the segment. The intent of the criteria is to rank the systems in an order that will allow staff and the CMP Review Team to focus their attention on the segments most in need of analysis. However, an important caveat must be noted: a segment can be ranked number 1, but if that segment is subject to review by a Corridor Management Plan the CMP may skip it and go to the next ranked segment.
______________________________________________________________________________ Okaloosa - Walton CMP Report 4
CMP Area of Application The Okaloosa-Walton Urbanized Area is located in Northwest Florida. The Okaloosa-Walton CMP Plan is developed for and implemented within portions of extreme southern Walton County, southern sections of Okaloosa County including Destin, Fort Walton Beach, Niceville, and central Okaloosa County in the vicinity of Crestview. The southern study area boundary is formed by the Gulf of Mexico. The northern border, including the small boundary encompassing the City of Crestview, is determined jointly by the TPO and FDOT after review of census population data. Significant geographic features include the Choctawhatchee River, Choctawhatchee Bay, Santa Rosa Sound and numerous smaller creeks and bayous. A major land use feature in this region is Eglin Air Force Base, including Hurlburt Field. Large portions of land in the Okaloosa-Walton Urbanized Area are devoted to military activity. The location of these military installations has had a significant impact on the development of the region and continues to significantly impact the transportation system not only in southern portions of the study area, but also in central Okaloosa County. System Definition (Modes and Network) The Okaloosa-Walton Urbanized Area includes an integrated system of limited access highways, a toll bridge, and multimodal and intermodal facilities. Regional roadway corridors serving the Fort Walton Beach Urbanized Area include, Interstate 10, US98, US90, SR85 and SR20. Other urban arterials include US 331, SR 89 (Beal Parkway/Lewis Turner Boulevard), SR123, and SR397 (John Sims Parkway). The SR85 corridor, including the SR123 cut-off, is the only major corridor linking Crestview with the southern urbanized sections of the TPO area. Bridges Major bridge facilities include the US331 Bridge over the Intercoastal Waterway at Freeport, the SR293 Mid-Bay Bridge, a toll bridge connecting areas east of Destin with Niceville, the US98 East Pass Bridge connecting Okaloosa Island with Destin, and the US98 Brooks Bridge connecting Fort Walton Beach with Okaloosa Island. Other, smaller bridges, including the SR85 Garnier and Cinco Bayou bridges, also exist within the urbanized area. Modal Connections The Okaloosa County Air Terminal, the Destin/ Fort Walton Beach Airport, the DeFuniak Springs Airport, the Bob Sikes Airport, and Greyhound Bus Service in Fort Walton Beach and Crestview provide multimodal and intermodal connections. Commission for Transportation Disadvantaged The Okaloosa Board of County Commission (BOCC) serves as the Community Transportation Coordinator (CTC) for Okaloosa County. The Commission for Transportation Disadvantaged appointed the Okaloosa BOCC as Okaloosa County CTC effective January 1, 2003 and has approved a new five year Memorandum of Agreement effective September 1, 2007. The CTC has retained Okaloosa County Transit to administer the program. The BOCC is also the transit
______________________________________________________________________________ Okaloosa - Walton CMP Report 5
agency and retains Okaloosa County Transit as the operator of the transit system. In 2009 the CTC provided 130,774 trips, a slight increase from the 129,611 trips provided in 2008. Tri-County Community Council has been providing transportation services in Walton County since 1983 and was designated as the Community Transportation Coordinator in 1990. In 2009 Tri-County Community Council completed 78,211 trips, a decrease from the 84,309 trips provided in 2008. Service is available by advanced registration 24 hours a day, 7 days a week. Service is available to clients of sponsoring agencies and non-sponsored transportation disadvantaged clients. Okaloosa County Transit Services In June 2000, Okaloosa Coordinated Transportation began offering fixed route bus service, called the WAVE, on two routes in Fort Walton Beach and one route in Crestview. The fare is $1.00 per ride, but seniors and the handicapped can ride for 25 cents. Transfers are 25 cents and are valid for one trip. In May 2001, a seasonal shuttle launched, which transported riders around Okaloosa Island and Destin. In 2004, this service went to year-round status. Presently the WAVE operates four fixed routes in Fort Walton Beach, two in Crestview, one Express route with limited stops connecting Fort Walton Beach and Crestview and four routes that service the Okaloosa Island, Destin area, and South Walton County. All WAVE routes operate year round. Commuter Assistance Program The West Florida Commuter Assistance Program, Ride On, is funded by the Florida Department of Transportation and staffed by the West Florida Regional Planning Council. Ride On offers employer-based programs to assist in reducing single occupant vehicle travel to work sites. The Commuter Assistance Program matches commuters on a computer database with mapping capabilities to assist in forming carpools and vanpools. In the past, Ride On Staff has worked with Eglin Air Force Base and helped establish their vanpool program, four vans commute to Eglin Air Force Base. At the Crestview Industrial Park, L-3 Communications surveyed their employees concerning the program. 149 commuters registered and 7 test vanpools were organized. L-3 employees commute 160 miles round trip. NEW Communications established an In-House Ride-On Program. Their Corporate Office sent an e-mail endorsing the carpool program and authorized changing shift times to accommodate employees wanting to carpool. Ride On Staff met with the City Manager of Crestview, Florida to design a draft transportation survey. The survey was approved and sent to all citizens of Crestview via their water bills for their response to transportation needs in the community. Bicycle and Pedestrian Access Since the CMP is a mobility management plan, it also considers bicycle and pedestrian facilities. The TPO’s Bicycle and Pedestrian Plan, which shows the location of existing and needed bicycle and pedestrian features, will serve as basis for this analysis.
______________________________________________________________________________ Okaloosa - Walton CMP Report 6
MEASURES OF CONGESTION & ROADWAY PERFORMANCE There are numerous ways to measure congestion. Examples include roadway and transit level of service (LOS), crash rates, transit headways, vehicle miles traveled, vehicle hours traveled and travel delay. Some of these measures require intricate data collection efforts, model simulations, or off-line calculations to develop accurate measurements. For this CMP, FDOT’s Level of Service Categories (A through F) for roadways are used as an initial indicator of vehicle congestion. The length of headways is used as the transit performance measure. The performance of bicycle/pedestrian features is analyzed based on their availability. It should be noted that economic factors such as the recent downturn experienced can influence traffic congestion. The generalized level of service tables are recommended for general planning applications in estimating highway level of service and assisting in implementing the level of service standards. These tables and planning computer models from which they were derived should not be used for corridor or intersection design where more refined techniques exist. Corridors with level of service deficiencies require the use of more sophisticated traffic operations models to identify specific improvements. A Freight Study was completed in 2010 focusing on “highways of commerce” in the TPO area and the region. This study can be utilized by the Review/Study Teams and be another enhancement strategy for the movement of goods. Review/Study Teams meet every other year to offer suggestions on reducing congestion on roadways and utilize the CMP in this endeavor. Past Review/Study Team recommendations are reviewed every other year for implementation. Identification and Evaluation of Congestion Mitigation Strategies/Technical Ranking
Criteria
In the Okaloosa-Walton Urbanized Area there are thirty-three congested segments of roadway. Since congestion mitigation strategies cannot be identified for all of these roadways simultaneously, a systematic method for determining which segments to study first had to be devised. Although this mechanism, the CMP Technical Ranking, results in a numerically ranked list, it does not overturn any project priority list approved by the TPO. The CMP Technical Ranking applies criteria deemed important by the TPO to determine which roadways to study first. Each segment is awarded points in nine categories. The points and categories are not only based on the severity of congestion, but also on the significance of the roadway to the community. These nine criteria and accompanying point structure are outlined below. Additional studies, such as Emergency Management Plans, can be utilized by the Study Team.

______________________________________________________________________________ Okaloosa - Walton CMP Report 7
Technical Ranking Criteria A. Programming Status • No phases funded in the Capital Improvement Program (CIP) or TIP 4 Points • PD&E scheduled for a project 3 Points • Design scheduled for a project 2 points • Right of way acquisition scheduled for a project 1 point • Construction of major project scheduled 0 points B. Existing Volume to Capacity Ratio • 1.00 to 1.24 1 point • 1.25 to 1.49 3 points • 1.50 or greater 5 points
C. Projected Volume to Capacity Ratio in 2014
• 1.00 to 1.24 1 point • 1.25 to 1.49 3 points • 1.50 or greater 5 points D. Projected Volume to Capacity Ratio in 2019 • 1.00 to 1.24 1 point • 1.25 to 1.49 3 points • 1.50 or greater 5 points E. Backlogged or Constrained Status • Not backlogged or constrained 0 points • Either Constrained or Backlogged 3 points F. Evacuation Route • Not designated an evacuation route 0 points • Designated an evacuation route 3 points

______________________________________________________________________________ Okaloosa - Walton CMP Report 8
G. Intermodal Connectivity Part A • Not designated as a National Highway System (NHS) route 0 points • Designated as an NHS route
4 points Part B • Not a designated Intermodal Connector to the NHS
0 points • A designated Intermodal Connector to the NHS 3 points H. Multi- Modal Connectivity Part A • Segment does contain existing bicycle or sidewalk facilities 0 points • Segment does not contain existing bicycle or sidewalk facilities 2 points Part B • Part of a fixed-route transit route 0 points • Not part of a fixed-route transit route 2 points I. Previous CMP Priority • Project was not on the previous CMP priority list 0 points • Project was on the previous CMP priority list 2 points Strategies to Reduce Congestion/Monitoring Strategy Effectiveness/Implementation and Management There are numerous technologies and economic and administrative policies that have been used internationally to manage congestion. These congestion management strategies improve the operating efficiency of the existing infrastructure, modes and services. Improvement is achieved in three ways:
______________________________________________________________________________ Okaloosa - Walton CMP Report 9
1. Increasing use of alternatives to Single Occupancy Vehicles (including public transit, carpooling, bicycling and walking).
2. Altering trip patterns through such measures as land-use policies, flexible work hours, telecommuting and congestion pricing.
3. Improving traffic flow by synchronizing signals, implementing Intelligent Transportation Systems (ITS) or intersection re-configuration.
There are two categories of congestion management strategies, those that focus on the demand-side and those that focus on the supply-side. Demand-side measures reduce the number of travelers using the system by increasing vehicle occupancy, increasing transit ridership and altering travel patterns (time of day facility is used). Supply-side measures increase the capacity (supply) of the transportation system by adding new lanes or roadways in order to improve traffic flow. Developing a comprehensive plan including both demand and supply-side strategies is the challenge undertaken by the Congestion Management Process Study Team. Examples of strategies the team might consider are: • Transportation demand management techniques • Intersection operational improvements, signing alterations • Access management issues • Transit options • Encouraging bicycle and pedestrian travel While the team identifies the most congested areas by specific location on the transportation network, many of the mitigation strategies they develop can be applied at the corridor or system-wide level. Many of the system-wide strategies, including ITS and Access Management recommendations are discussed in the Recommendations section of this report. This team will be responsible for making recommendations to the TPO and local governments, requesting studies be completed by FDOT and recommending methodology for implementing their recommendations. Membership of the CMP Review Team will include, Technical Coordinating Committee (TCC) members, Citizen’s Advisory Committee (CAC) members, and Florida Department of Transportation staff and any interested citizens. Representatives from local governments in areas surrounding the congested segments under consideration will also be invited to participate on the committee. In 2010/11 TPO Staff will analyze a new segment, with the aid of the Review/Study Team, and develop recommendations to try and reduce congestion.

______________________________________________________________________________ Okaloosa - Walton CMP Report 10
According to the Technical Ranking, the first five segments (there are seven due to a tie) to be studied are:
1) SR 30 (US 98) from Gulf Shore Dr. to Emerald Coast Parkway (Old US 98) 2) CR 20 (Hill Avenue) from Hollywood Boulevard to Lovejoy Road 3) SR 189 (Beal Parkway) from SR 393/Mary Esther Boulevard to SR 188/Racetrack Road 4) SR 30 (US 98) from Eastern Leg SR 85/Florida Place to Military Boundary/Beach Park
Entrance Okaloosa Island 5) SR 30 (US 98) from East Pass Bridge (west end)to Gulf Shore Drive) 5) SR 30 (US 98) from Okaloosa County Line to Old US 98/SR 30 5) P.J. Adams Parkway from CR 4 Antioch Road to SR 85 S Ferdon Boulevard
FDOT Level of Service Standards FDOT's minimum acceptable operating level of service standards for the State Highway System were adopted by Administrative Rule in 1992 and were modified in 2006. The rule chapter mutually supports the Department of Community Affairs Rule 9J-5 on Minimum Criteria for Review of Local Government Comprehensive Plans and Determination of Compliance. The standards are contained in the rule chapter appearing in Appendix A. The standards include the following major concepts:
· the different level of importance of the Florida Intrastate Highway System and other state roads,
· the different roles (i.e., mobility versus access) provided by state facilities (i.e., Florida Intrastate Highway System versus other state roads),
· the direct correlation between urban size and acceptance of some highway congestion as a tradeoff for other urban amenities,
· urban infill as a desirable objective, · the presence of infrastructure concurrent with the impact of development, · local flexibility in setting standards in and around Transportation Concurrency
Management Areas and Transportation Concurrency Exception Areas, · recognition of the interaction between highways and exclusive transit systems serving
commuters, · recognition that many state facilities are constrained because they cannot be expanded
because of physical or policy barriers, and · recognition that the operation of many state facilities do not meet the standards ( e.g.,
are backlogged) and are not programmed for improvement in FDOT's 5-Year Work Program.
The area and roadway types in the level of service standards match well with FDOT's Generalized Level of Service Tables appearing in Appendix B of this report; however, subtleties exist on delineation of areas, roadway characteristics, signalization characteristics, and maintaining conditions on constrained and backlogged facilities.
________________________________________________________________________ Okaloosa - Walton CMP Report 11
Please refer to the 2009 Quality/Level of Service Handbook, which deals with area types in the Generalized Level of Service Tables. The indicated levels of service designate the lowest quality operating conditions acceptable for the 100th highest volume hour of the year from the present through the planning horizon, generally up to 20 years. The 100th highest hour approximates the typical weekday peak hour during the peak season in developed areas. Thus, it can be thought of as the typical drive during "rush" hour in an area's peak season. FDOT Generalized Level of Service Tables The basic level of service analysis presented in this report was done using the 2009 Quality/Level of Service Handbook. FDOT's Generalized Level of Service Tables were developed based on the definitions and methodology of the 2000 Highway Capacity Manual (HCM) Update. They are believed to be the most thoroughly researched and state-of-the-art generalized level of service tables in the United States. They are the product of a significant effort by FDOT, its consultants and the professional community within the State of Florida. Development of the Generalized Tables Statewide default values were measured and applied to the basic planning analysis models to produce the Generalized Tables. The models have been periodically reviewed and updated when necessary. FDOT personnel have conducted numerous traffic and signalization studies and have modified the initial values to reflect average conditions in Florida. Daily and directional data were derived from FDOT's continuous traffic count stations throughout Florida. Signal timing data were obtained from analyses of traffic signal timings in Miami, Tampa, Tallahassee, Gainesville, DeLand and Lake City, as well as several rural developed areas. FDOT's intent has been to develop the most realistic numbers based on actual traffic, roadway and signalization data. It is important to recognize that generalized level of service tables are recommended for general planning applications in estimating highway level of service and assisting in implementing the level of service standards. The tables and planning computer models from which they were derived should not be used for corridor or intersection design where more refined techniques exist. The generalized tables represent a first cut at measuring level of service and are not standards, which must be used. Appendix B contains the FDOT generalized tables used for this analysis. How to use the Generalized Tables Listed below are the basic steps to follow to determine the level of service on a typical roadway segment using the FDOT generalized LOS tables.
________________________________________________________________________ Okaloosa - Walton CMP Report 12
Step 1 - Determine the geographic area type the roadway segment is located in (Urbanized Area, Transitioning Area, or Rural Area) and retrieve the appropriate table. Step 2 - Determine the type of roadway to be analyzed: State two-way arterial, freeway, or non-state roadway and go to the corresponding portion of the table. For the purpose of this report no roadways were analyzed as a non-state roadway. In other words, county roadways were analyzed as if they were state roadways. Step 3 - Determine the number of traffic signals per mile on the segment of roadway and appropriate class designation (Class I, II, etc.) on the table. Step 4 – Determine the number of through lanes on the segment and whether it is divided or undivided and find the appropriate row in the table under the proper class designation. Step 5 – Look up the Average Annual Daily Traffic (AADT) count two-way traffic volume for the roadway segment. Note: If more than one count station exists on a roadway segment, the median count should be used to represent the average conditions. Step 6 – Using the proper table, the appropriate Class designation, and the correct row, determine which LOS Classification the AADT count falls within.
Example:
State roadway segment A is a four lane divided facility with .20 signals per mile, located within an urbanized area with an AADT of 33,500. This roadway would be evaluated using the Urbanized Area table, under State Two-Way Arterial, Class I (> 0.00 to 1.99 signalized intersections per mile) for a 4 lane divided roadway. The level of service for State Roadway segment A would be “C” (between 29,300 and 35,500). Level of Service Analysis Tables This section presents the Level of Service (LOS) analysis tables for state roadways and selected county roadways located in Okaloosa County and Walton County. The analysis is based on the 2009 Quality/Level of Service Handbook and the generalized LOS tables contained within. For state roadway segments the tables provide historical counts for each segment beginning with 2002 (in most cases), the latest available counts and forecasts of traffic
_______________________________________________________________________ Okaloosa - Walton County LOS Report 13
to the years 2014 and 2019. Other information contained in the tables includes: the functional classification of the roadway, the facility type, the total number of signals on the segment, the number of signals per mile, the segment length, the LOS area, the LOS standard and corresponding maximum allowable volume for the segment, the FDOT count stations for the segment, the current Annual Average Daily Traffic (AADT) count for each station, the historical counts and corresponding LOS. All of the analysis information contained in these tables is based on the 2009 Quality/Level of Service Handbook. The tables provide year 2014 and 2019 traffic projections. These projections are based on one of two methodologies: historical growth or a simple two percent annual increase. In the cases where historical growth was used, data was entered into a spreadsheet developed by the FDOT Central Office. This spreadsheet is known as “Trends” and contains a series of built-in linear regression formulas that estimate the overall trend of the growth patterns. Based on this methodology, the 2014 and 2019 counts were determined. If these counts seemed unreasonable in relation to the historical growth rates, a simple two percent annual increase was applied instead. Two percent was used as the annual growth factor as it was determined to reflect the average annual increase of traffic volumes in Okaloosa and Walton Counties. Congestion Trends, Causes and Impacts Determining the exact causes of traffic congestion is difficult, but traffic and population growth patterns in Okaloosa County and Walton County mirror national trends leading to increases in traffic congestion. Causes of congestion are either recurring or non-recurring. Non-recurring congestion occurs as a result of unplanned or sporadic events. These events range from everyday traffic crashes, community events like festivals, or natural disasters like hurricanes. The CMP is primarily concerned with reducing recurring congestion. Recurring congestion is the predictable delay experienced by travelers on the same facilities at the same time each day. It results from the high volumes of vehicles using the same roadway or intersections at peak times of the day or year. Recurring congestion is often blamed on growth in population and employment and the trend toward smaller households. The Urbanized area is experiencing an increase in population while employment growth has slowed down from previous years. The slow down in employment and higher gas prices may be the predominant factor in traffic counts declining in this reporting year. In most years growth in traffic is outpacing population growth. First, like most Americans, travelers in northwest Florida prefer the automobile. Automobile preference has led to an increase in the number of single occupancy vehicle (SOV) trips. Second, since about 1950 the proportion of adults who drive to work has been increasing. This has led to an increase in trip making. In addition, the number of

________________________________________________________________________ Okaloosa - Walton CMP Report 14
drivers traveling further distances to work has been increasing. The increases in commute distance results from a lack of a jobs-housing balance and low-density development patterns. Intelligent Transportation Systems Intelligent Transportation Systems (ITS) is an application of management strategies and technologies to better increase the efficiency and safety of the surface transportation system. Some of the objectives of ITS can include, but are not limited to:
• Minimizing response time for incidents and accidents
• Reducing commercial vehicle safety violations
• Utilizing road-weather information systems to reduce weather-related incidents
• Improving emergency management communications by providing real-time traveler information
• Implementing technological solutions to improve transportation management
• Improving highway and transit security
• Minimizing highway-rail grade crossing accidents
• Improving travel demand management
Intelligent Transportation Systems (ITS) have been shown to be a very effective tool in managing congestion and delay. An integrated transportation system managed and operated more efficiently through the use of ITS technology can enhance quality of life by supporting a safer, more efficient, and sustainable transportation system. ITS improvements may also lower the amount of congestion experienced by users and preserve the existing capacity of the transportation system. The FY 2009-2010 Unified Planning Work Programs for the Florida-Alabama, Okaloosa-Walton, and Bay County TPOs have money dedicated toward the development of an ITS Plan. The funds are intended for the General Planning Consultant to develop a Regional ITS Plan for the combined TPO Planning Areas with areas of emphasis for each TPO. The plan provides a comprehensive evaluation of the existing network of ITS. In addition, major and minor projects to improve the regions ITS deployment will be evaluated and solutions to these items provided. This project is being presented to the TPOs as a Draft in August 2010 and for adoption in September 2010. Bicycle/Pedestrian Analysis Bicycle and pedestrian features are documented if they exist within a congested corridor. This information is derived from the TPO’s Long Range Plan. Although the TPO

________________________________________________________________________ Okaloosa - Walton CMP Report 15
recognizes that bicycle and pedestrian features will not in themselves solve the congestion problem, their existence increases the number of modal choices available. The more modes of travel available, then the mobility becomes greater within and along the corridor. Encouraging the use of these features along congested segments can often significantly reduce the number of short trips within the corridor. The Study Team utilizes the Bicycle/Pedestrian Plan when making recommendations. Transit Analysis On August 22, 2005, a major update was adopted to the 5 year Transit Development Plan (TDP). An update to the ten year planning horizon was adopted on September 22, 2006. As with every transit property in Florida that receives State Transit Block Grant funding, Okaloosa County is required to prepare a TDP. This requirement is intended to ensure that the provision of public transportation services is consistent with the travel needs and mobility goals of the local communities that are served by the transit system. By establishing a strategic focus and mission for transit services, the TDP serves as a guide in the future development of the transit system that will meet the needs of the community it serves. Congestion Management Process Public Involvement Process The TPO seeks to involve citizens in all its decision-making processes. This is especially important in the CMP process because congestion levels are largely related to driver perception and identifying projects to relieve congestion without adding capacity often requires significant creativity. As a result, the Okaloosa-Walton TPO has developed a process to involve citizens in different ways at several points in the process and at every level of decision-making. In an effort to further increase Public Involvement TPO Staff conducts field interviews with residents and business owners on each segment studied. Staff believes that such interviews more clearly reflect the perceived level of congestion, and will continue to conduct such interviews in future updates to this plan. Notification of the CMP and its segments are sent to a large database of community outreach organizations. Safe, Accountable, Flexible, Efficient, Transportation Equity Act: A Legacy for Users SAFETEA:LU is a federal transportation law that will provide federal funding for highway and transit improvements through 2009. This law was designed to provide aid to many challenges facing our communities such as improving safety, reducing traffic congestion, improving efficiency in freight movement, increasing intermodal connectivity, and protecting the environment. All SAFETEA-LU requirements will be adhered to in their entirety. The former Congestion Management System is now the Congestion Management Process (23 CFR 450.320)

________________________________________________________________________ Okaloosa - Walton CMP Report 16
SAFETEA-LU requires that, for the CMP:
- “The transportation planning process shall address congestion management through a process that provides for effective management and operation”
- for management and operations, LRTP’s shall contain “Operational and management strategies to improve the performance of existing transportation facilities” There are Seven Key CMP Components:
1. Area of Application 2. System Definition (Modes and Network) 3. Performance measures 4. Performance Monitoring Plan 5. Identification and Evaluation of Strategies 6. Monitoring Strategy Effectiveness 7. Implementation and Management
Conclusions As noted previously in this document, the CMP uses FDOT LOS standards as the measure for determining congestion. However, there are far more sophisticated measures for determining the nature and duration of traffic congestion. The CMP is a continually evolving process, and therefore in future updates to this plan staff hopes to include such tools as, intersection studies and Art Plan analysis in order to better define and rectify traffic congestion in the Okaloosa-Walton Urbanized Area. This Congestion Management Process Plan has identified the overall level of congestion in the urbanized area and has highlighted the most congested areas. The plan attempts to delineate some of the causes and impacts of congestion. The plan also defines a methodology for developing congestion management strategies. Attention is paid in this methodology to non-traditional activities like Transportation Demand Management or Land Use strategies. The methodology for strategy development includes a process for integrating these congestion mitigation strategies into the planning process through the Transportation Improvement Program and TPO Priorities. Thus, the 2010 update to the CMP constitutes a fully operational management system.

FIGURE 1
GLOSSARY
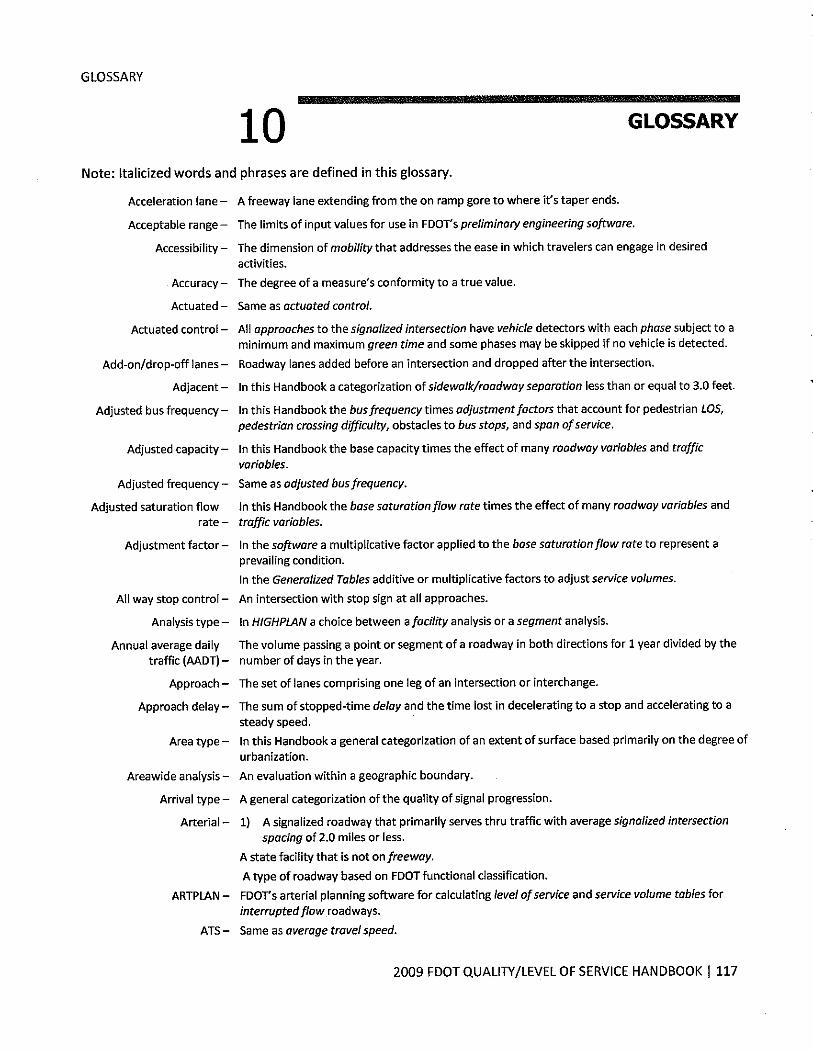
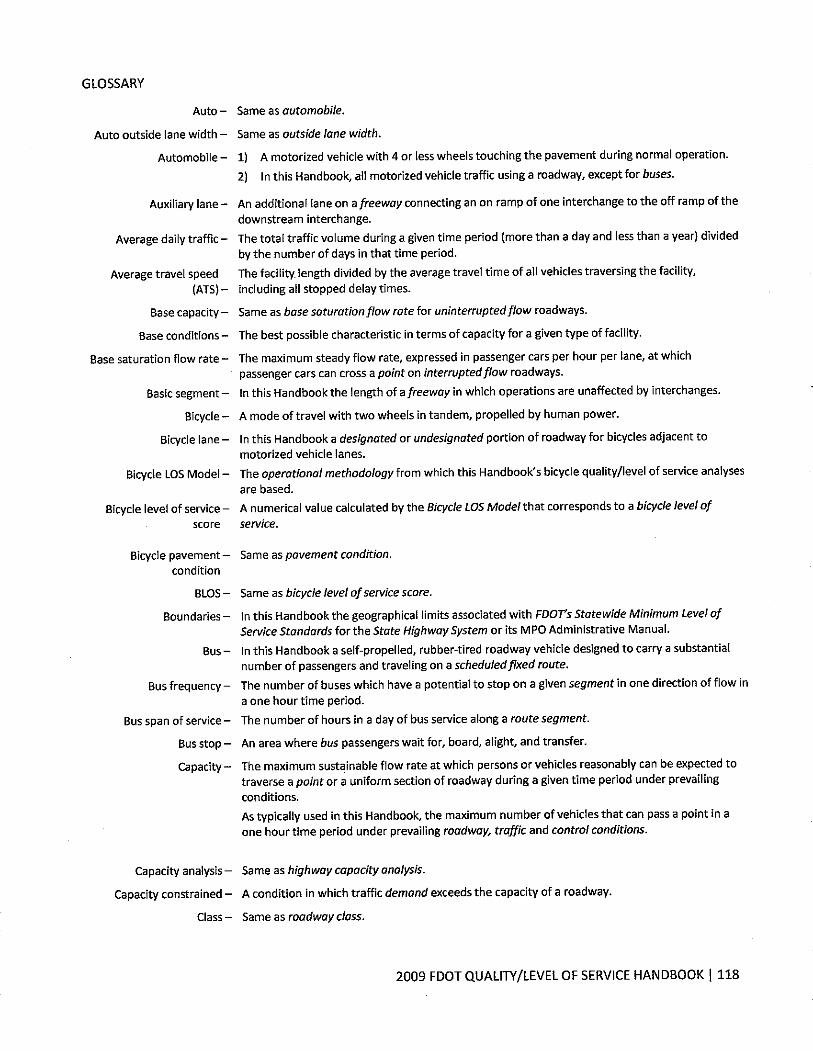

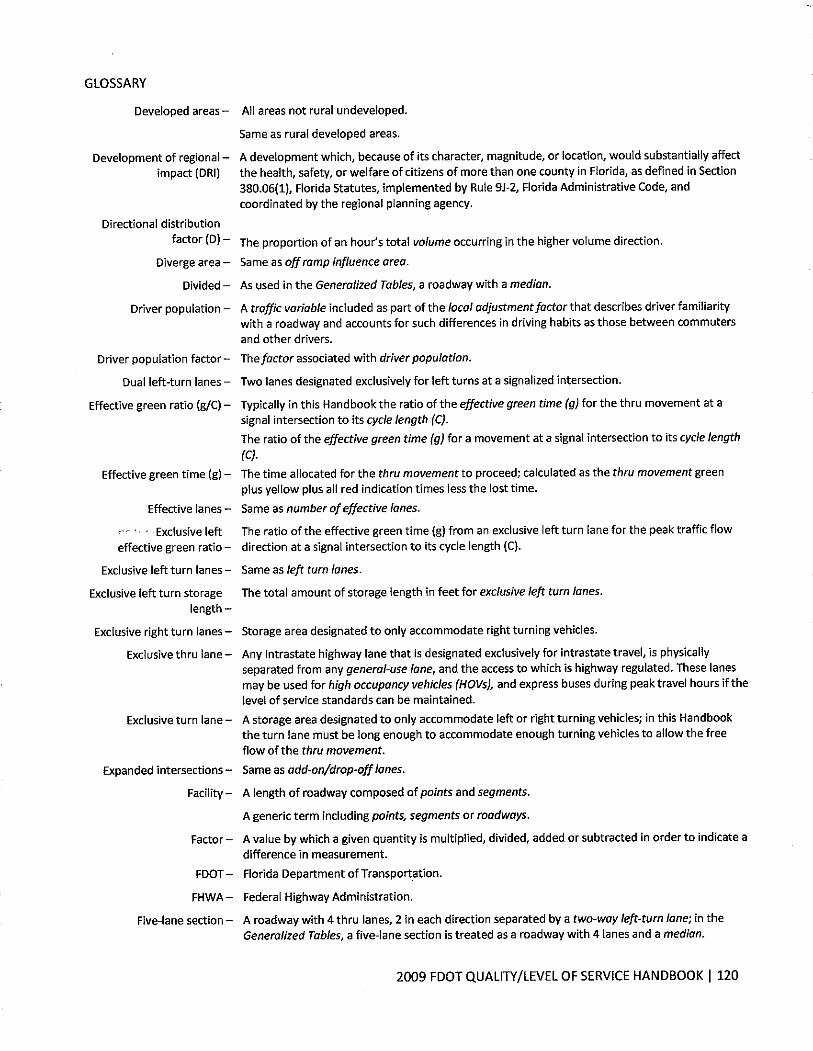
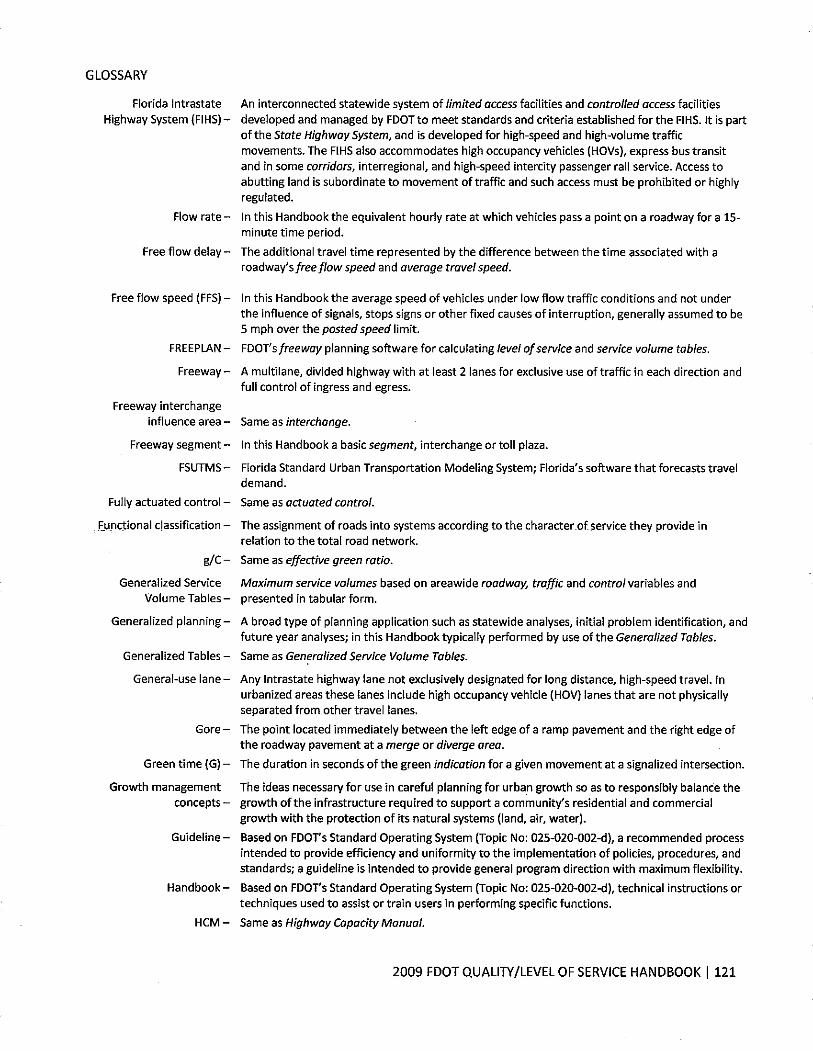
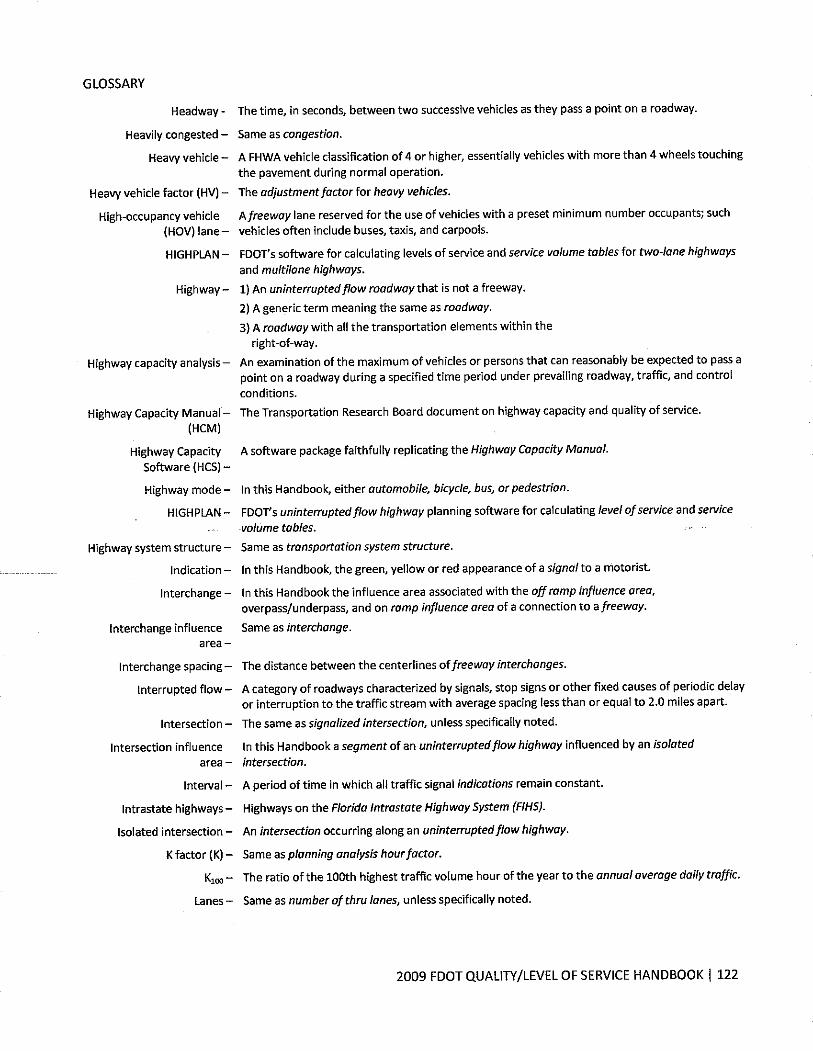
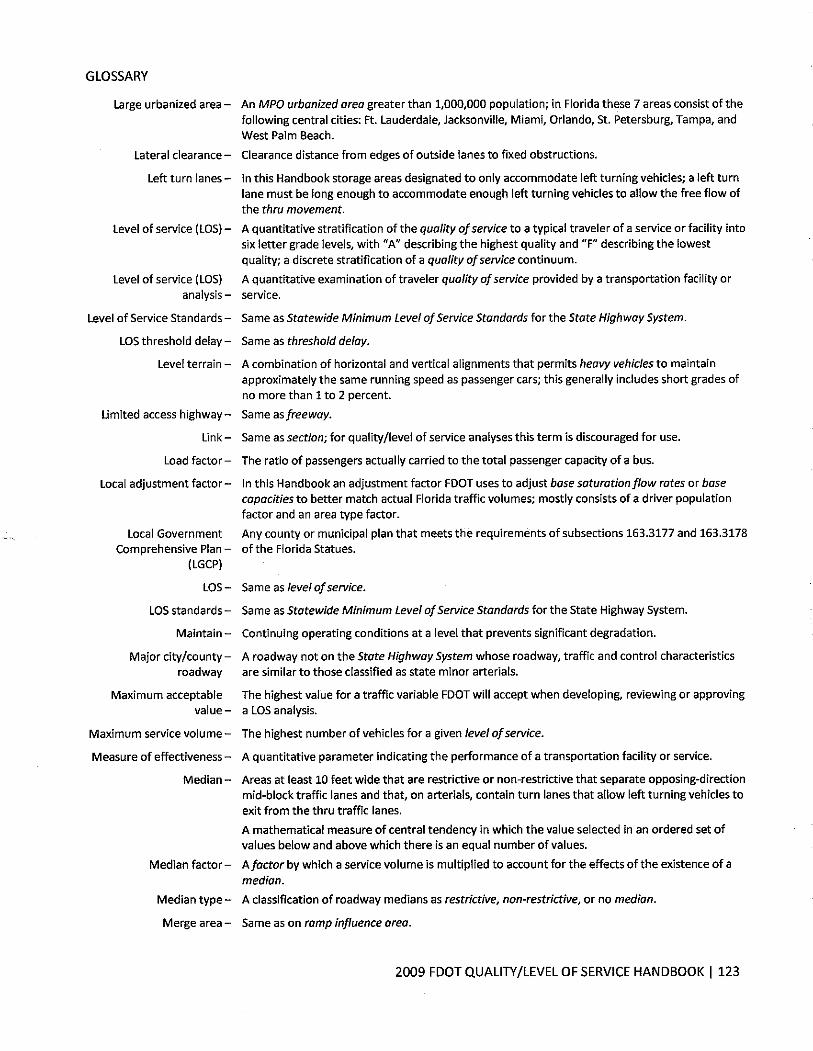
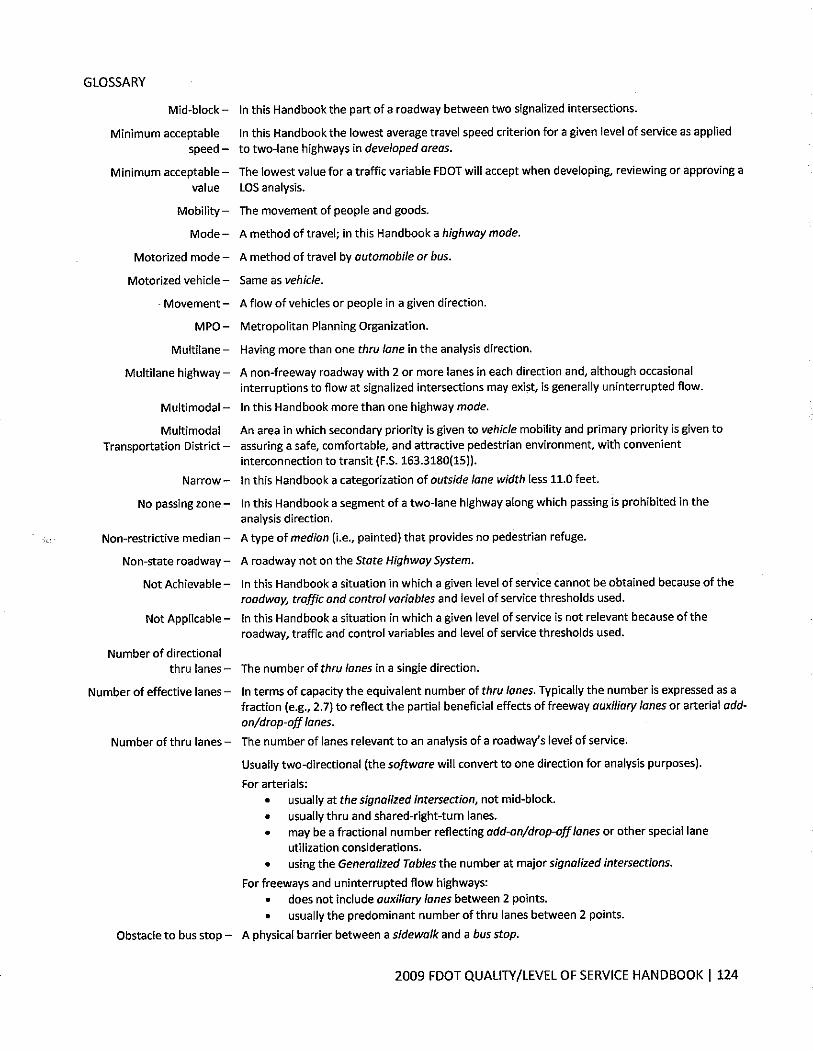

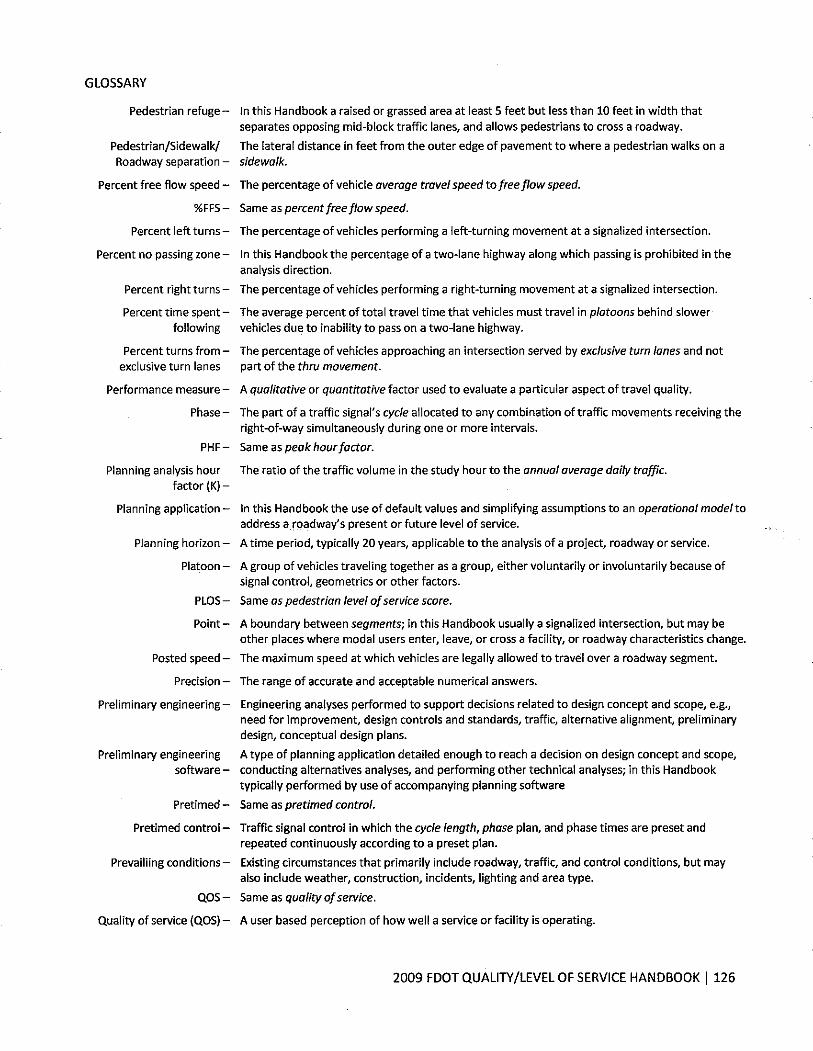

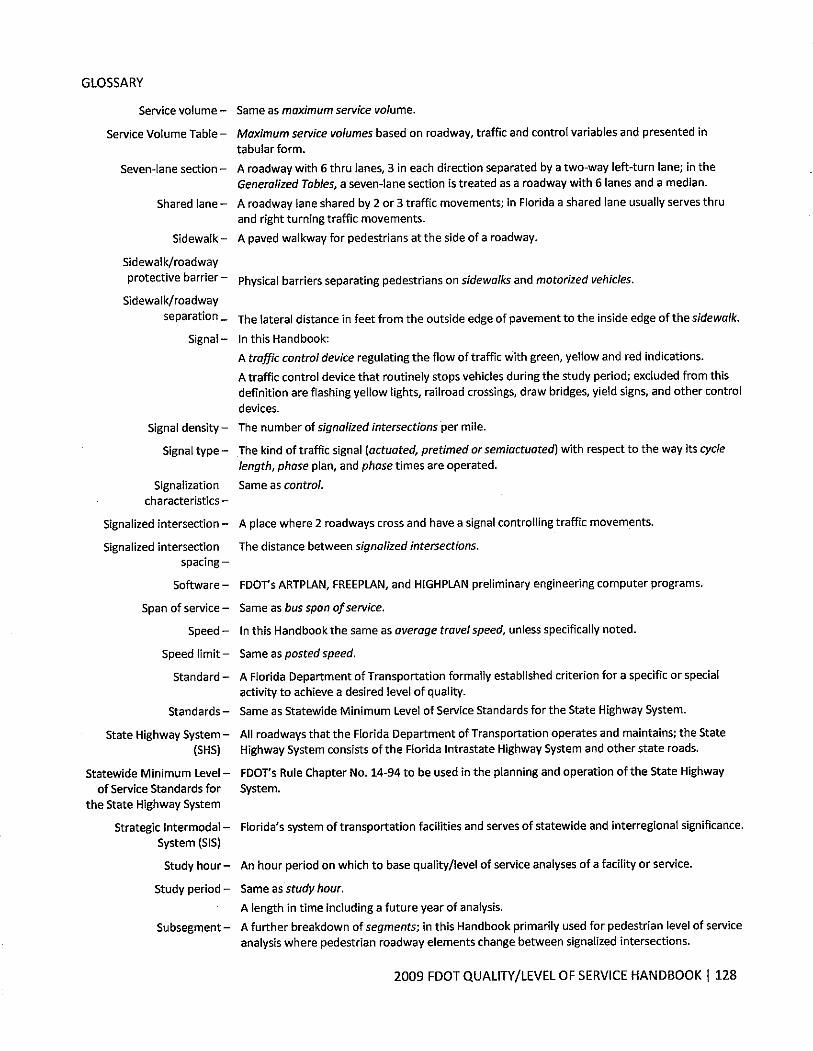
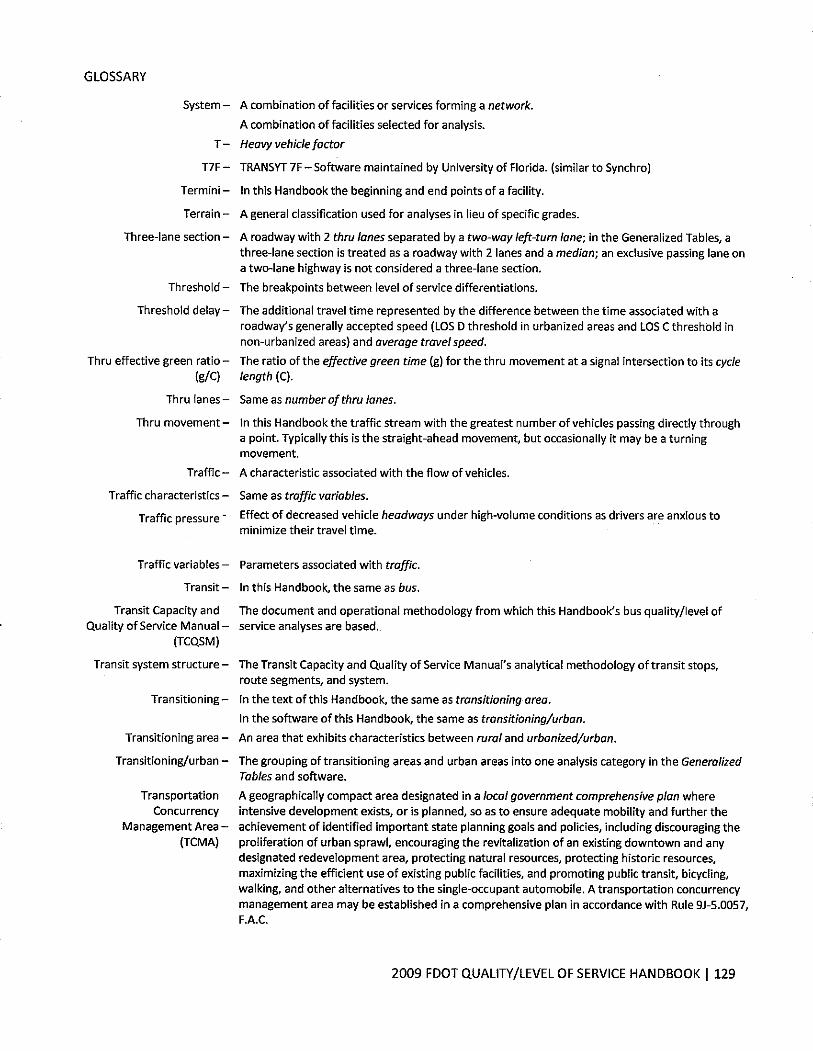

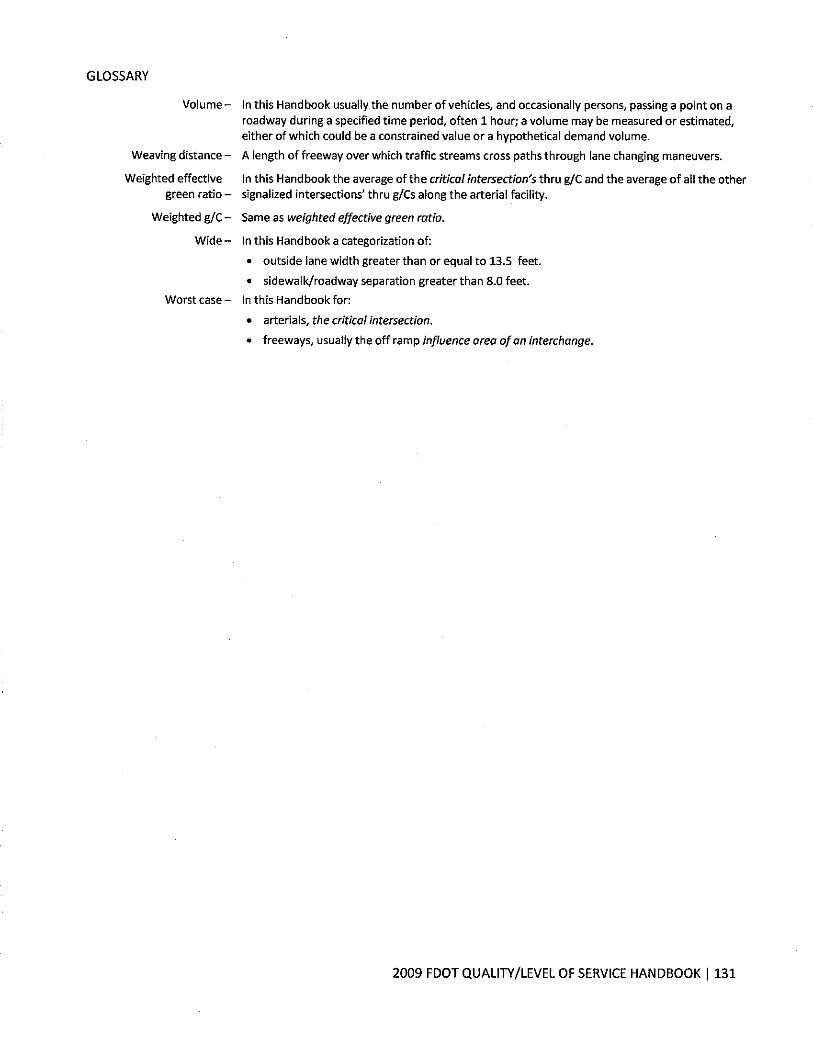

FIGURE 2
DEFICIENT ROADWAY SEGMENTS
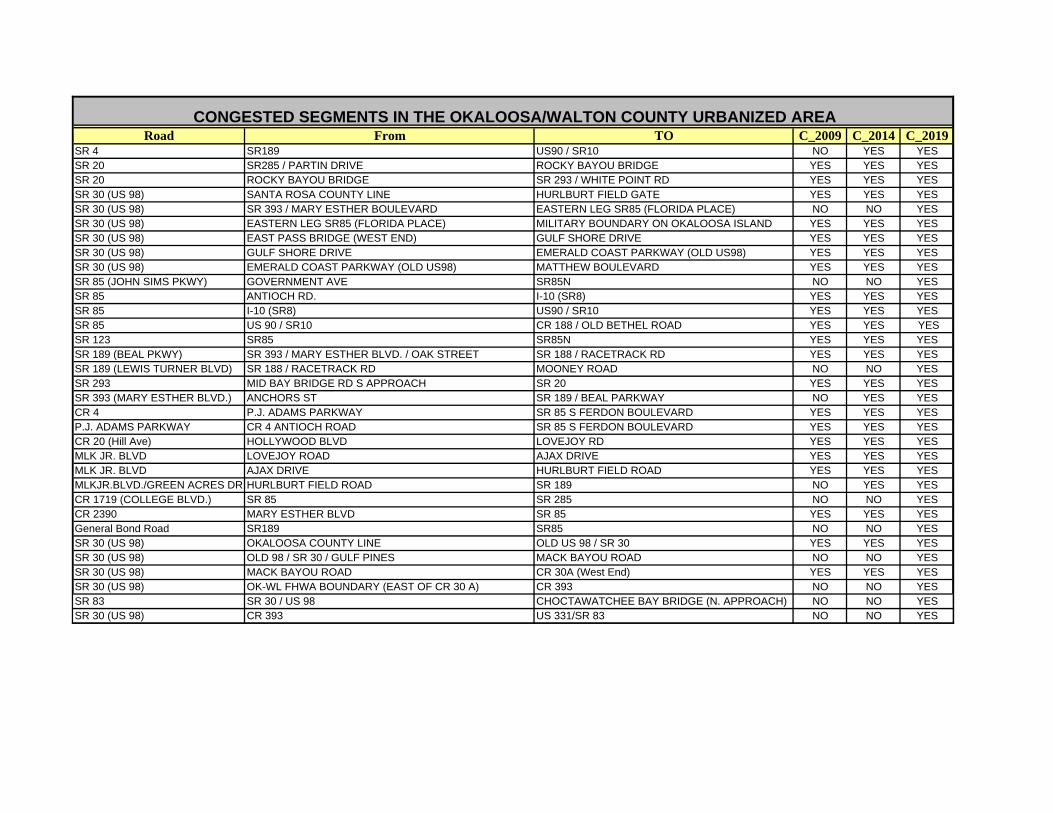
Road From TO C_2009 C_2014 C_2019SR 4 SR189 US90 / SR10 NO YES YESSR 20 SR285 / PARTIN DRIVE ROCKY BAYOU BRIDGE YES YES YESSR 20 ROCKY BAYOU BRIDGE SR 293 / WHITE POINT RD YES YES YESSR 30 (US 98) SANTA ROSA COUNTY LINE HURLBURT FIELD GATE YES YES YESSR 30 (US 98) SR 393 / MARY ESTHER BOULEVARD EASTERN LEG SR85 (FLORIDA PLACE) NO NO YESSR 30 (US 98) EASTERN LEG SR85 (FLORIDA PLACE) MILITARY BOUNDARY ON OKALOOSA ISLAND YES YES YESSR 30 (US 98) EAST PASS BRIDGE (WEST END) GULF SHORE DRIVE YES YES YESSR 30 (US 98) GULF SHORE DRIVE EMERALD COAST PARKWAY (OLD US98) YES YES YESSR 30 (US 98) EMERALD COAST PARKWAY (OLD US98) MATTHEW BOULEVARD YES YES YESSR 85 (JOHN SIMS PKWY) GOVERNMENT AVE SR85N NO NO YESSR 85 ANTIOCH RD. I-10 (SR8) YES YES YESSR 85 I-10 (SR8) US90 / SR10 YES YES YESSR 85 US 90 / SR10 CR 188 / OLD BETHEL ROAD YES YES YESSR 123 SR85 SR85N YES YES YESSR 189 (BEAL PKWY) SR 393 / MARY ESTHER BLVD. / OAK STREET SR 188 / RACETRACK RD YES YES YESSR 189 (LEWIS TURNER BLVD) SR 188 / RACETRACK RD MOONEY ROAD NO NO YESSR 293 MID BAY BRIDGE RD S APPROACH SR 20 YES YES YESSR 393 (MARY ESTHER BLVD.) ANCHORS ST SR 189 / BEAL PARKWAY NO YES YESCR 4 P.J. ADAMS PARKWAY SR 85 S FERDON BOULEVARD YES YES YESP.J. ADAMS PARKWAY CR 4 ANTIOCH ROAD SR 85 S FERDON BOULEVARD YES YES YESCR 20 (Hill Ave) HOLLYWOOD BLVD LOVEJOY RD YES YES YESMLK JR. BLVD LOVEJOY ROAD AJAX DRIVE YES YES YESMLK JR. BLVD AJAX DRIVE HURLBURT FIELD ROAD YES YES YESMLKJR.BLVD./GREEN ACRES DR HURLBURT FIELD ROAD SR 189 NO YES YESCR 1719 (COLLEGE BLVD.) SR 85 SR 285 NO NO YESCR 2390 MARY ESTHER BLVD SR 85 YES YES YESGeneral Bond Road SR189 SR85 NO NO YESSR 30 (US 98) OKALOOSA COUNTY LINE OLD US 98 / SR 30 YES YES YESSR 30 (US 98) OLD 98 / SR 30 / GULF PINES MACK BAYOU ROAD NO NO YESSR 30 (US 98) MACK BAYOU ROAD CR 30A (West End) YES YES YESSR 30 (US 98) OK-WL FHWA BOUNDARY (EAST OF CR 30 A) CR 393 NO NO YESSR 83 SR 30 / US 98 CHOCTAWATCHEE BAY BRIDGE (N. APPROACH) NO NO YESSR 30 (US 98) CR 393 US 331/SR 83 NO NO YES
CONGESTED SEGMENTS IN THE OKALOOSA/WALTON COUNTY URBANIZED AREA

FIGURE 3
PAST STUDY TEAM
RECOMMENDATIONS
CONGESTION MANAGEMENT PROCESS SUMMARY
REPORT
STUDY SEGMENT
U.S. 98: FROM NAVARRE TO HURLBURT FIELD
Background- Each year Congestion Management Process Plans are updated indicating
the Level of Service for roads in each of the Transportation Planning Organizations.
After these plans are approved by each TPO a Congestion Management Process
Review/Study Team is organized to study a particular segment for an analysis and to
discuss short-term solutions to alleviating congestion for that particular corridor.
Highway 98 is a vital corridor connecting Pensacola and Fort Walton and is increasingly
experiencing very heavy congestion. At the request of the Florida-Alabama TPO
Technical Coordinating Committee a request was made to the Okaloosa-Walton TPO
Advisory Committees asking if they would be willing to participate in a Joint
Review/Study Team meeting to focus study on U.S. 98 from Navarre to Hurlburt Field.
The Okaloosa-Walton TPO Advisory Committees agreed and meetings occurred in
January, February, March, and April to analyze this corridor.
Findings- The Joint Florida-Alabama TPO/Okaloosa-Walton TPO Review/Study Team
discussed a wide variety of concerns such as school buses stopping on the corridor,
clearing accidents off of the roadway, traffic signal timing, construction of new lanes,
carpooling and vanpooling, and flextime alternatives. It was decided that many parties
needed to be involved to create short-term solutions in addressing the congestion between
Navarre and Hurlburt Field. These parties were school officials, law enforcement, local
government leaders and technical staff, the Florida Department of Transportation, the
Military, the Northwest Florida Transportation Corridor Authority, and TPO Staff. All of
these organizations participated in the process along with concerned citizens and other
community groups and officials.
Recommendations- These recommendations are based on Review/Study Team
discussion and the completed Congestion Mitigation Strategy Evaluation Checklists that
were provided by TPO Staff. The primary focus of the Review/Study Team was short-
range solutions to alleviating congestion on the study segment. In addition, the Florosa
Elementary School brought safety concerns to the Review/Study Team and the Florida
Department of Transportation and TPO Staff worked with the School Advisory Council
and school officials to address the concerns that were raised. Considerations from FDOT
for addressing these safety concerns are also provided.
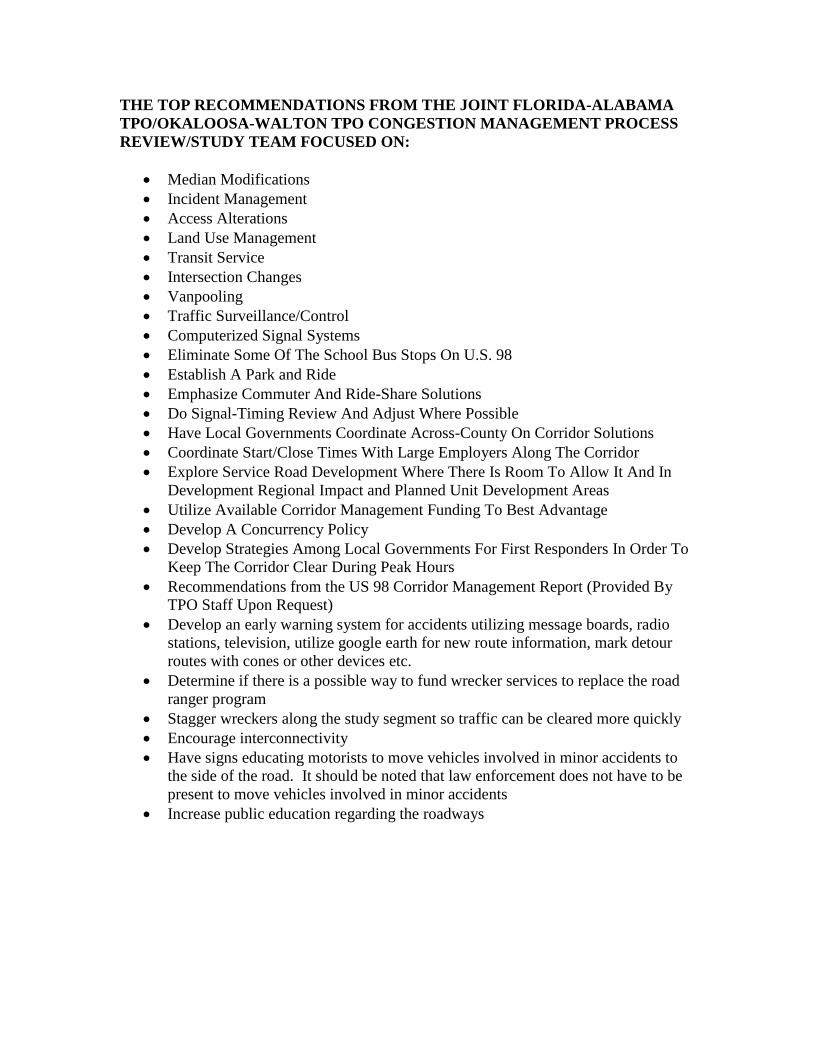
THE TOP RECOMMENDATIONS FROM THE JOINT FLORIDA-ALABAMA
TPO/OKALOOSA-WALTON TPO CONGESTION MANAGEMENT PROCESS
REVIEW/STUDY TEAM FOCUSED ON:
Median Modifications
Incident Management
Access Alterations
Land Use Management
Transit Service
Intersection Changes
Vanpooling
Traffic Surveillance/Control
Computerized Signal Systems
Eliminate Some Of The School Bus Stops On U.S. 98
Establish A Park and Ride
Emphasize Commuter And Ride-Share Solutions
Do Signal-Timing Review And Adjust Where Possible
Have Local Governments Coordinate Across-County On Corridor Solutions
Coordinate Start/Close Times With Large Employers Along The Corridor
Explore Service Road Development Where There Is Room To Allow It And In
Development Regional Impact and Planned Unit Development Areas
Utilize Available Corridor Management Funding To Best Advantage
Develop A Concurrency Policy
Develop Strategies Among Local Governments For First Responders In Order To
Keep The Corridor Clear During Peak Hours
Recommendations from the US 98 Corridor Management Report (Provided By
TPO Staff Upon Request)
Develop an early warning system for accidents utilizing message boards, radio
stations, television, utilize google earth for new route information, mark detour
routes with cones or other devices etc.
Determine if there is a possible way to fund wrecker services to replace the road
ranger program
Stagger wreckers along the study segment so traffic can be cleared more quickly
Encourage interconnectivity
Have signs educating motorists to move vehicles involved in minor accidents to
the side of the road. It should be noted that law enforcement does not have to be
present to move vehicles involved in minor accidents
Increase public education regarding the roadways

Implementation- In order for the recommendations in this summary report to be
effective there must be continued support and coordination with various local
governments and agencies. TPO Staff will continue to coordinate by telephone, email,
letters, meetings, and any other means available to ensure that these recommendations are
adhered to and have the opportunity to help reduce congestion on US 98. TPO Staff will
also develop a plan to implement as many of these recommendations as possible directly.
By utilizing all of these different mechanisms of implementation the levels of congestion
on the study segment can be impacted and decrease accordingly.

OKALOOSA-WALTON TPO
FINAL-ADOPTED APRIL 16, 2009
CONGESTION MANAGEMENT PROCESS
SUMMARY REPORT
STUDY SEGMENT
State Road 30 (US 98) from the Okaloosa County Line to Old US
98/State Road 30
And
SIGNAL TIMING COORDINATION REQUEST
State Road 20 from State Road 85 (Government Avenue) to State
Road 293 (White Point Road)
Background- Each year Congestion Management Process (CMP) Plans are updated
indicating the Level of Service for roads in each Transportation Planning Organization
planning area. After these plans are approved by each TPO a CMP Review/Study Team
is organized to study a particular segment for an analysis and to formulate short-term
solutions to alleviating congestion.
Findings- The Okaloosa-Walton TPO CMP Review/Study Team chose SR 30 (US 98)
from the Okaloosa County Line to Old US 98/SR 30 as the study segment for this year.
In addition to this segment, a request was made for signal timing coordination on SR 20
from SR 85 (Government Avenue) to SR 293 (White Point Road). Many different parties
were involved in the process including County and City governments, the Florida
Department of Transportation, citizens, and TPO staff. The CMP Review/Study Team
discussed a wide variety of concerns such as a park and ride lot at the Silver Sands
Shopping Outlet, traffic signal timing, requesting the Florida Department of
Transportation (FDOT) to conduct traffic operations studies, and carpooling and
vanpooling.

Recommendations For SR 30 (US 98) from the Okaloosa County Line to Old US
98/SR 30 Segment- These recommendations are based on CMP Review/Study Team
discussion and the completed “Man On the Street Interviews” conducted by TPO staff
with citizens and businesses along the study segment. The recommendations from the
Okaloosa-Walton TPO CMP Review/Study Team were:
Install a Park and Ride Lot at the Silver Sands Shopping Outlet at the CR 2378
intersection
Request the Florida Department of Transportation to conduct a traffic operations
study at the Forest Shore Drive intersection on US 98
Request the Florida Department of Transportation to send updates to the
improvements at the CR 2378 (Old US 98) intersection on US 98
Recommendations For SR 20 from SR 85 (Government Avenue) to SR 293 (White
Point Road) Segment/Signal Timing Coordination Request- These recommendations
are based on CMP Review/Study Team discussion. Representatives from Okaloosa
County and the City of Niceville, where the signal timing is in question, were present to
discuss this topic. The representatives stated that there is a plan to adjust the signal
timing on SR 20 but a timetable had not yet been set. The recommendations from the
Okaloosa-Walton TPO CMP Review/Study Team were:
Adjust the signal timing on SR 20 to improve traffic flow
Request the Florida Department of Transportation to determine if the speed limit
can be raised to 45 miles per hour on sections of SR 20
Implementation- In order for the recommendations in this summary report to be
effective there must be continued support and coordination with various local
governments and agencies. TPO Staff will develop an implementation plan next year
working with the counties, municipalities, and FDOT to complete as many of these
recommendations as possible. By utilizing all of these different mechanisms of
implementation the levels of congestion on the study segment can be impacted and
decrease accordingly.
FIGURE 4
ANALYSIS OF IMPLEMENTED
RECOMMENDATIONS
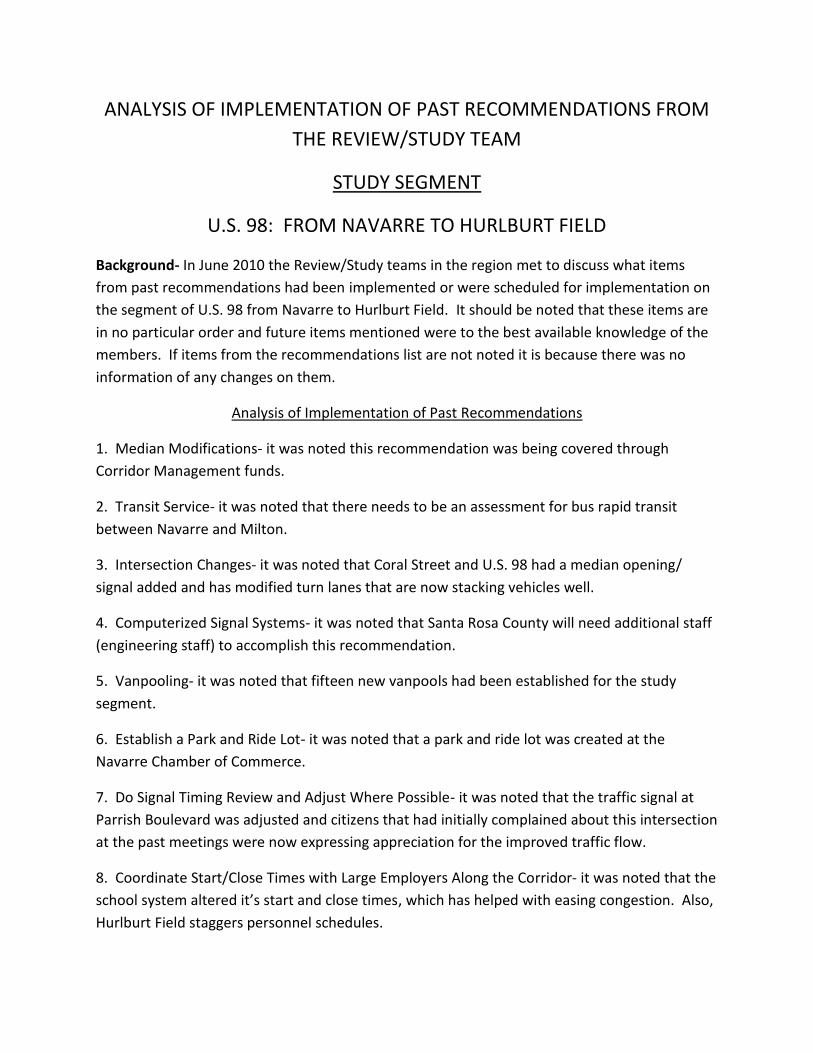
ANALYSIS OF IMPLEMENTATION OF PAST RECOMMENDATIONS FROM
THE REVIEW/STUDY TEAM
STUDY SEGMENT
U.S. 98: FROM NAVARRE TO HURLBURT FIELD
Background- In June 2010 the Review/Study teams in the region met to discuss what items
from past recommendations had been implemented or were scheduled for implementation on
the segment of U.S. 98 from Navarre to Hurlburt Field. It should be noted that these items are
in no particular order and future items mentioned were to the best available knowledge of the
members. If items from the recommendations list are not noted it is because there was no
information of any changes on them.
Analysis of Implementation of Past Recommendations
1. Median Modifications- it was noted this recommendation was being covered through
Corridor Management funds.
2. Transit Service- it was noted that there needs to be an assessment for bus rapid transit
between Navarre and Milton.
3. Intersection Changes- it was noted that Coral Street and U.S. 98 had a median opening/
signal added and has modified turn lanes that are now stacking vehicles well.
4. Computerized Signal Systems- it was noted that Santa Rosa County will need additional staff
(engineering staff) to accomplish this recommendation.
5. Vanpooling- it was noted that fifteen new vanpools had been established for the study
segment.
6. Establish a Park and Ride Lot- it was noted that a park and ride lot was created at the
Navarre Chamber of Commerce.
7. Do Signal Timing Review and Adjust Where Possible- it was noted that the traffic signal at
Parrish Boulevard was adjusted and citizens that had initially complained about this intersection
at the past meetings were now expressing appreciation for the improved traffic flow.
8. Coordinate Start/Close Times with Large Employers Along the Corridor- it was noted that the
school system altered it’s start and close times, which has helped with easing congestion. Also,
Hurlburt Field staggers personnel schedules.
9. Develop a Concurrency Policy- it was noted that Santa Rosa County and Okaloosa County
could coordinate on this item.
10. Develop Strategies Among Local Governments for First Responders In Order to Keep the
Corridor Clear During Peak Hours- it was recommended that a letter be sent to the appropriate
emergency responders and coordination take place in order to try and achieve this goal.
11. Develop an Early Warning System for Accidents Utilizing Message Boards, Radio Stations,
Television, Utilize Good Earth for new Route Information, Mark Detour Routes with Cones or
Other Devices Etc.- it was noted that the Intelligent Transportation Systems Plan is scheduled
for adoption in September 2010 and this plan can be utilized to try and achieve this
recommendation.
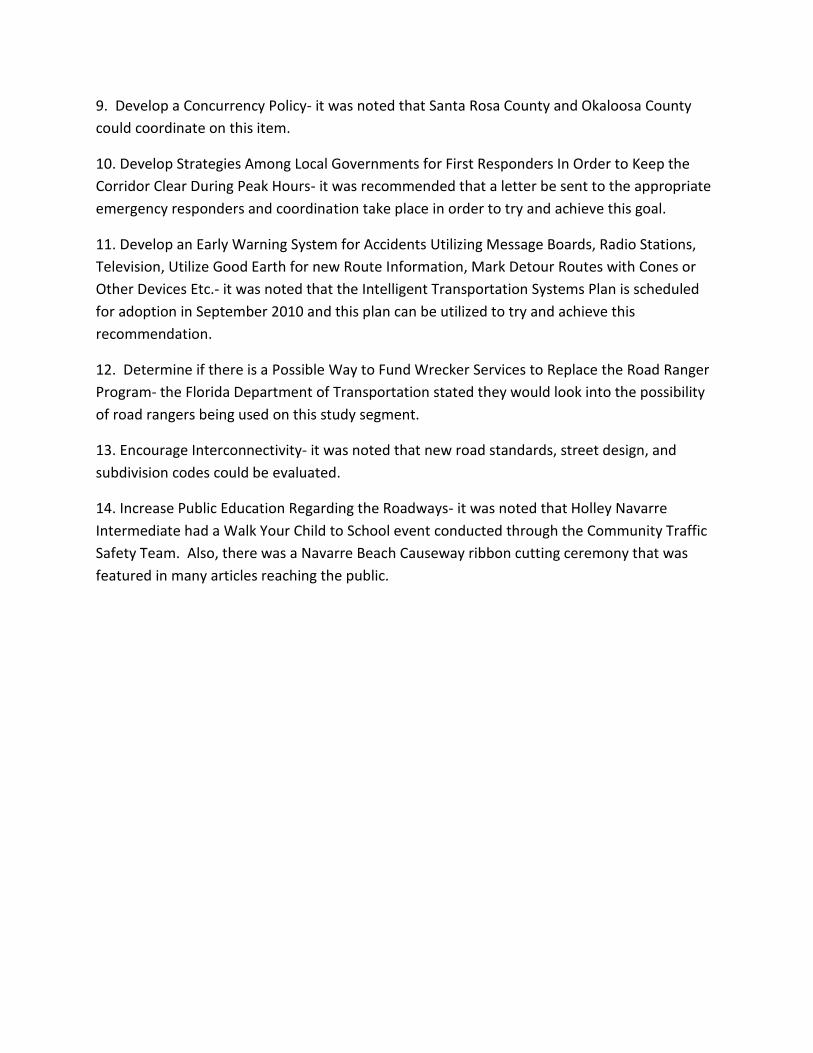
12. Determine if there is a Possible Way to Fund Wrecker Services to Replace the Road Ranger
Program- the Florida Department of Transportation stated they would look into the possibility
of road rangers being used on this study segment.
13. Encourage Interconnectivity- it was noted that new road standards, street design, and
subdivision codes could be evaluated.
14. Increase Public Education Regarding the Roadways- it was noted that Holley Navarre
Intermediate had a Walk Your Child to School event conducted through the Community Traffic
Safety Team. Also, there was a Navarre Beach Causeway ribbon cutting ceremony that was
featured in many articles reaching the public.
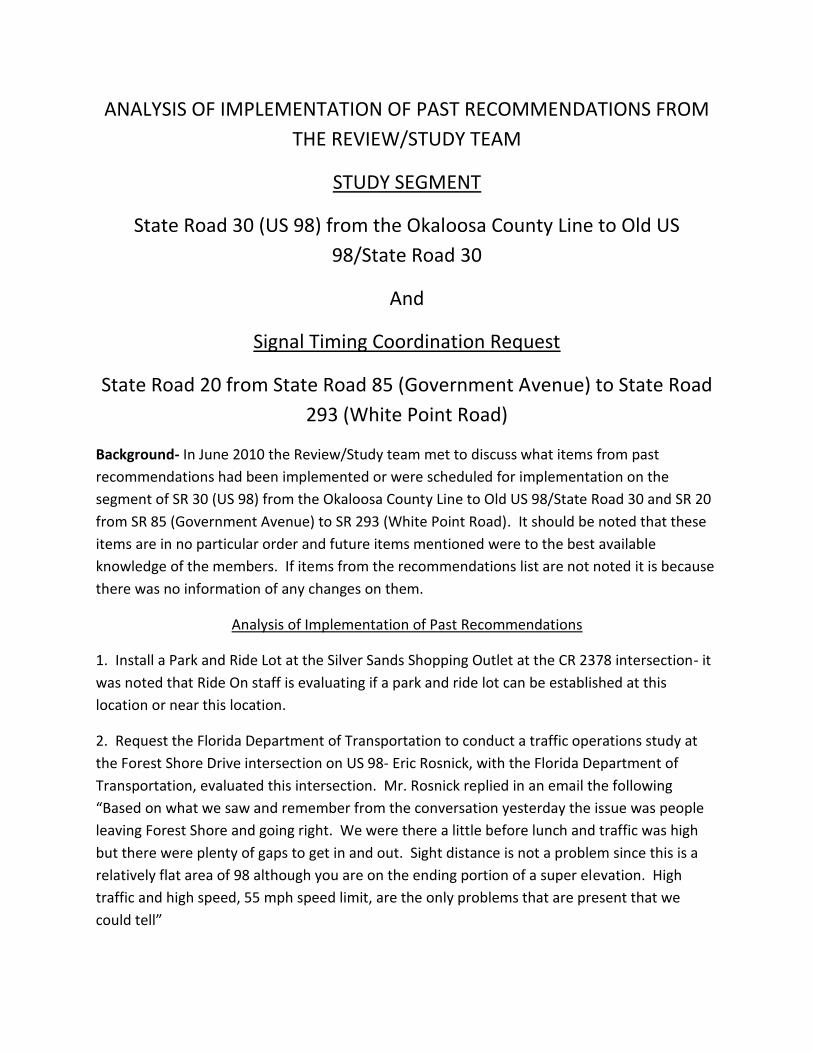
ANALYSIS OF IMPLEMENTATION OF PAST RECOMMENDATIONS FROM
THE REVIEW/STUDY TEAM
STUDY SEGMENT
State Road 30 (US 98) from the Okaloosa County Line to Old US
98/State Road 30
And
Signal Timing Coordination Request
State Road 20 from State Road 85 (Government Avenue) to State Road
293 (White Point Road)
Background- In June 2010 the Review/Study team met to discuss what items from past
recommendations had been implemented or were scheduled for implementation on the
segment of SR 30 (US 98) from the Okaloosa County Line to Old US 98/State Road 30 and SR 20
from SR 85 (Government Avenue) to SR 293 (White Point Road). It should be noted that these
items are in no particular order and future items mentioned were to the best available
knowledge of the members. If items from the recommendations list are not noted it is because
there was no information of any changes on them.
Analysis of Implementation of Past Recommendations
1. Install a Park and Ride Lot at the Silver Sands Shopping Outlet at the CR 2378 intersection- it
was noted that Ride On staff is evaluating if a park and ride lot can be established at this
location or near this location.
2. Request the Florida Department of Transportation to conduct a traffic operations study at
the Forest Shore Drive intersection on US 98- Eric Rosnick, with the Florida Department of
Transportation, evaluated this intersection. Mr. Rosnick replied in an email the following
“Based on what we saw and remember from the conversation yesterday the issue was people
leaving Forest Shore and going right. We were there a little before lunch and traffic was high
but there were plenty of gaps to get in and out. Sight distance is not a problem since this is a
relatively flat area of 98 although you are on the ending portion of a super elevation. High
traffic and high speed, 55 mph speed limit, are the only problems that are present that we
could tell”

3. Request the Florida Department of Transportation to send updates to the improvements at
the CR 2378 (Old US 98) intersection on US 98- the Florida Department of Transportation noted
they would send updates on improvements to this intersection.
4. Adjust the signal timing on SR 20 to improve traffic flow- correspondence on this item is
attached.
5. Request the Florida Department of Transportation to determine if the speed limit can be
raised to 45 miles per hour on sections of SR 20- correspondence on this item is attached.

TABLE 1
2009 LEVEL OF SERVICE STATE
AND COUNTY ROADS
OKALOOSA COUNTY
WALTON COUNTY

TOTAL SIG SEG. LOS (STD) FDOT PK HR. / PK DIR.
STATE ROAD FUNC. NO. FACILITY # OF PER LTH LOS & COUNT 2009 ANALYSIS AADT AADT LOS STD/
AND SEGMENT CLASS LNS. TYPE SIG. MI. (MI.) AREA MAX VOL STA # AADT YEAR VOLUME LOS MAX VOL VOLUME LOS
SR 4
Santa Rosa County Line Minor 2 Undivided 1 0.11 9.00 Rural (C) 6 1,550 2002 1,500 C (C) 81 C
to SR189 Arterial Undev 4,700 2003 1,400 C 260 75 C
2004 1,550 C 84 C
2005 1,500 C 81 C
2006 1,600 C 86 C
2007 1,750 C 94 C
2008 1,400 C 75 C
2009 1,550 C 84 C
2014 1,700 C 92 C
Roadway ID 57080000 2019 1,900 C 102 C
SR189 to US90 / SR 10 Minor 2 Undivided 0 0 3.74 Rural (C) 90 7,800 2002 7,200 C (C) 388 C
Arterial Undev 8,100 2003 6,900 C 430 372 C
2004 7,300 C 393 C
2005 7,900 C 426 C
2006 8,200 D 442 D
2007 7,800 C 420 C
2008 7,300 C 393 C
2009 7,800 C 420 C
2014 8,600 D 464 D
Roadway ID 57080000 2019 9,500 D 512 D
SR 8 (I-10)
Santa Rosa County Principal 4 Divided 0 0 8.93 Rural (B) 2001 NA 2002 NA NA (B) NA NA
Line to the OK-WL MPA Arterial Undev 37,100 2002 NA 2003 NA NA 1,410 NA NA
Boundary (1.7 miles east 318T 22,325 2004 NA NA NA NA
of Wilkinson Bluff) 2005 NA NA NA NA
2006 NA NA NA NA
Roadway ID 57002000 2007 22,792 B 1,228 B
Segment is on the Strategic Intermodal System 2008 21,307 B 1,207 B
2009 22,325 B 1,265 B
2014 24,600 B 1,394 B
2019 27,200 B 1,541 C
Updated 2010, using 2009 FDOT Generalized Q / LOS Tables. LOS Standards and Max Allowable Volumes are based on those established for State Roadways.
Not To Be Used For Concurrency Management Purposes. Prepared for the FY 2010/11 Transportation Planning Organization Congestion Management Process.
CONGESTION MANAGEMENT PROCESS 2010 LEVEL OF SERVICE ANALYSIS - OKALOOSA COUNTY STATE ROADS
E" following the count indicates an 'estimated count. "T" following the Count Station number indicated a Telemetered Traffic Monitoring Site. These Tables Are For General Planning Purposes Only.
AADT
Okaloosa County, State Roads
1

TOTAL SIG SEG. LOS (STD) FDOT PK HR. / PK DIR.
STATE ROAD FUNC. NO. FACILITY # OF PER LTH LOS & COUNT 2009 ANALYSIS AADT AADT LOS STD/
AND SEGMENT CLASS LNS. TYPE SIG. MI. (MI.) AREA MAX VOL STA # AADT YEAR VOLUME LOS MAX VOL VOLUME LOS
CONGESTION MANAGEMENT PROCESS 2010 LEVEL OF SERVICE ANALYSIS - OKALOOSA COUNTY STATE ROADS
AADT
SR 8 (I-10) (cont.)
OK-WL MPA Boundary Principal 4 Divided 0 0 15.56 Trans (C) 318T 22,325 2002 18,226 B (C) 942 B
(1.7 miles East of Wilkinson Arterial 57,600 2004 17,000 2003 19,150 B 2,980 990 B
Blvd) to Walton County Line 2004 21,150 B 1,093 B
2005 18,600 NA NA NA
2006 17,600 NA NA NA
Roadway ID 57002000 2007 20,846 B 1,124 B
Segment is on the Strategic Intermodal System 2008 19,804 B 1,024 B
2009 19,663 B 1,017 B
2014 18,800 B 972 B
2019 20,700 B 1,070 B
SR 10 (US 90)
Santa Rosa County Line Minor 2 Undivided 0 0 10.56 Rural (C) 98 3,000 2002 3,400 B (C) 183 B
to SR4 / Baker Highway Arterial Undev 8,100 128 5,200 2003 3,450 B 430 186 B
127 3,800 2004 3,575 B 193 B
9 4,900 2005 4,200 B 226 B
2006 4,500 B 243 C
2007 4,425 B 239 B
2008 3,900 B 210 B
2009 4,225 B 228 B
2014 4,700 C 253 C
Roadway ID 57010000 2019 5,200 C 280 C
SR4 / Baker Highway Minor 2 Undivided 0 0 0.6 Rural (C) 101 NA 2002 3,800 B (C) 209 B
to OK-WL MPA Arterial Developed 14,200 9 4,900 2003 4,100 B 780 226 B
Boundary (east of 2004 4,400 B 242 B
Ellis Road) 2005 5,300 B 292 B
2006 5,900 B 325 B
2007 5,300 B 292 B
2008 4,800 B 264 B
2009 4,900 B 270 B
2014 5,400 B 297 B
Roadway ID 57010000 2019 6,000 B 330 B
Updated 2010, using 2009 FDOT Generalized Q / LOS Tables. LOS Standards and Max Allowable Volumes are based on those established for State Roadways.
Not To Be Used For Concurrency Management Purposes. Prepared for the FY 2010/11 Transportation Planning Organization Congestion Management Process.
E" following the count indicates an 'estimated count. "T" following the Count Station number indicated a Telemetered Traffic Monitoring Site. These Tables Are For General Planning Purposes Only.
Okaloosa County, State Roads
2
TOTAL SIG SEG. LOS (STD) FDOT PK HR. / PK DIR.
STATE ROAD FUNC. NO. FACILITY # OF PER LTH LOS & COUNT 2009 ANALYSIS AADT AADT LOS STD/
AND SEGMENT CLASS LNS. TYPE SIG. MI. (MI.) AREA MAX VOL STA # AADT YEAR VOLUME LOS MAX VOL VOLUME LOS
CONGESTION MANAGEMENT PROCESS 2010 LEVEL OF SERVICE ANALYSIS - OKALOOSA COUNTY STATE ROADS
AADT
SR 10 (US 90) (cont.)
OK-WL MPA Minor 2 Undivided 0 0.00 0.22 Trans (C) 9 4,900 2002 7,328 B (C) 391 B
Boundary (east of Arterial 15,100 122 T 12,386 2003 7,789 B 800 416 B
Ellis Road) to 0.22 mi 2004 8,525 C 455 C
west of CR 4 / Antioch 2005 9,150 C 488 C
Road 2006 9,696 C 517 C
2007 9,327 C 498 C
2008 8,663 C 462 C
2009 8,643 C 461 C
2014 9,500 C 507 C
Roadway ID 57010000 2019 10,500 C 560 C
0.22 mi west of CR 4 to Minor 4 Divided 1 4.55 0.22 Trans (C) 9 4,900 2002 7,328 C (C) 391 C
CR 4 / Antioch Road Arterial 11,500 122 T 12,386 2003 7,789 C 610 416 C
2004 8,525 C 455 C
2005 9,150 C 488 C
2006 9,696 C 517 C
2007 9,327 C 498 C
2008 8,663 C 462 C
2009 8,643 C 461 C
2014 9,500 C 507 C
Roadway ID 57010000 2019 10,500 C 560 C
CR 4 / Antioch Road to Minor 4 Divided 1 0.613 1.63 Trans (C) 122 T 12,386 2002 10,856 B (C) 579 B
Old Bethel Road Arterial 32,100 2003 11,477 B 1,710 612 B
2004 12,649 B 675 B
2005 13,000 B 694 B
2006 13,491 B 720 B
2007 13,354 B 712 B
2008 12,526 B 668 B
2009 12,386 B 661 B
2014 13,700 B 731 B
Roadway ID 57010000 2019 15,100 B 806 B
Updated 2010, using 2009 FDOT Generalized Q / LOS Tables. LOS Standards and Max Allowable Volumes are based on those established for State Roadways.
Not To Be Used For Concurrency Management Purposes. Prepared for the FY 2010/11 Transportation Planning Organization Congestion Management Process.
E" following the count indicates an 'estimated count. "T" following the Count Station number indicated a Telemetered Traffic Monitoring Site. These Tables Are For General Planning Purposes Only.
Okaloosa County, State Roads
3
TOTAL SIG SEG. LOS (STD) FDOT PK HR. / PK DIR.
STATE ROAD FUNC. NO. FACILITY # OF PER LTH LOS & COUNT 2009 ANALYSIS AADT AADT LOS STD/
AND SEGMENT CLASS LNS. TYPE SIG. MI. (MI.) AREA MAX VOL STA # AADT YEAR VOLUME LOS MAX VOL VOLUME LOS
CONGESTION MANAGEMENT PROCESS 2010 LEVEL OF SERVICE ANALYSIS - OKALOOSA COUNTY STATE ROADS
AADT
SR 10 (US 90) (cont.)
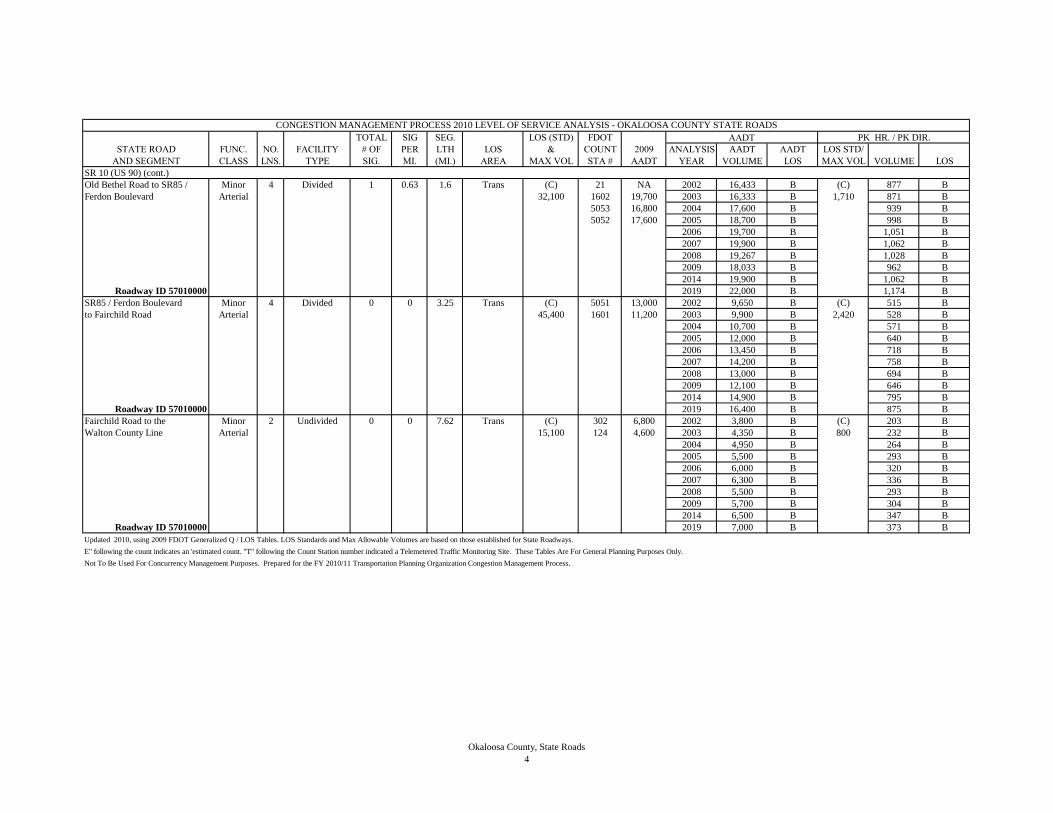
Old Bethel Road to SR85 / Minor 4 Divided 1 0.63 1.6 Trans (C) 21 NA 2002 16,433 B (C) 877 B
Ferdon Boulevard Arterial 32,100 1602 19,700 2003 16,333 B 1,710 871 B
5053 16,800 2004 17,600 B 939 B
5052 17,600 2005 18,700 B 998 B
2006 19,700 B 1,051 B
2007 19,900 B 1,062 B
2008 19,267 B 1,028 B
2009 18,033 B 962 B
2014 19,900 B 1,062 B
Roadway ID 57010000 2019 22,000 B 1,174 B
SR85 / Ferdon Boulevard Minor 4 Divided 0 0 3.25 Trans (C) 5051 13,000 2002 9,650 B (C) 515 B
to Fairchild Road Arterial 45,400 1601 11,200 2003 9,900 B 2,420 528 B
2004 10,700 B 571 B
2005 12,000 B 640 B
2006 13,450 B 718 B
2007 14,200 B 758 B
2008 13,000 B 694 B
2009 12,100 B 646 B
2014 14,900 B 795 B
Roadway ID 57010000 2019 16,400 B 875 B
Fairchild Road to the Minor 2 Undivided 0 0 7.62 Trans (C) 302 6,800 2002 3,800 B (C) 203 B
Walton County Line Arterial 15,100 124 4,600 2003 4,350 B 800 232 B
2004 4,950 B 264 B
2005 5,500 B 293 B
2006 6,000 B 320 B
2007 6,300 B 336 B
2008 5,500 B 293 B
2009 5,700 B 304 B
2014 6,500 B 347 B
Roadway ID 57010000 2019 7,000 B 373 B
Updated 2010, using 2009 FDOT Generalized Q / LOS Tables. LOS Standards and Max Allowable Volumes are based on those established for State Roadways.
Not To Be Used For Concurrency Management Purposes. Prepared for the FY 2010/11 Transportation Planning Organization Congestion Management Process.
E" following the count indicates an 'estimated count. "T" following the Count Station number indicated a Telemetered Traffic Monitoring Site. These Tables Are For General Planning Purposes Only.
Okaloosa County, State Roads
4

TOTAL SIG SEG. LOS (STD) FDOT PK HR. / PK DIR.
STATE ROAD FUNC. NO. FACILITY # OF PER LTH LOS & COUNT 2009 ANALYSIS AADT AADT LOS STD/
AND SEGMENT CLASS LNS. TYPE SIG. MI. (MI.) AREA MAX VOL STA # AADT YEAR VOLUME LOS MAX VOL VOLUME LOS
CONGESTION MANAGEMENT PROCESS 2010 LEVEL OF SERVICE ANALYSIS - OKALOOSA COUNTY STATE ROADS
AADT
SR 20
SR85N to 0.32 mi east of Principal 6 Divided 0 0 0.32 Urbanized (D) 5010 42,000 2002 42,000 B (D) 2,171 B
SR 85N Arterial 96,400 5008 T NA 2003 42,500 B 4,980 2,197 B
2004 43,550 B 2,252 B
2005 42,750 B 2,210 B
2006 45,250 B 2,339 B
2007 47,250 B 2,443 B
2008 48,000 B 2,482 B
2009 42,000 B 2,171 B
2014 46,400 B 2,399 B
Roadway ID 57040000 2019 51,200 B 2,647 B
SR85N to SR285/ Partin Principal 6 Divided 1 1.11 0.9 Urbanized (D) 5010 42,000 2002 42,000 B (D) 2,171 B
Drive Arterial 55,300 5008 T NA 2003 42,500 B 2,940 2,197 B
2004 43,550 B 2,252 B
2005 42,750 B 2,210 B
2006 45,250 C 2,339 B
2007 47,250 C 2,521 C
2008 48,000 C 2,561 C
2009 42,000 B 2,241 B
2014 46,400 C 2,475 C
Roadway ID 57040000 2019 51,200 C 2,732 C
SR285/ Partin Drive to Principal 4 Divided 5 1.92 2.6 Urbanized (D) 1502 36,500 2002 39,875 F (D) 2,127 F
Rocky Bayou Bridge Arterial 36,700 5076 34,500 2003 40,000 F 1,960 2,134 F
5073 37,500 2004 43,500 F 2,321 F
5009 43,000 2005 43,875 F 2,341 F
2006 42,750 F 2,281 F
2007 42,750 F 2,281 F
2008 40,500 F 2,161 F
2009 37,875 F 2,021 F
2014 41,800 F 2,230 F
Roadway ID 57040000 2019 46,200 F 2,465 F
Updated 2010 using 2009 FDOT Generalized Q / LOS Tables. LOS Standards and Max Allowable Volumes are based on those established for State Roadways.
Not To Be Used For Concurrency Management Purposes. Prepared for the FY 2010/11 Transportation Planning Organization Congestion Management Process.
E" following the count indicates an 'estimated count. "T" following the Count Station number indicated a Telemetered Traffic Monitoring Site. These Tables Are For General Planning Purposes Only.
Okaloosa County, State Roads
5
TOTAL SIG SEG. LOS (STD) FDOT PK HR. / PK DIR.
STATE ROAD FUNC. NO. FACILITY # OF PER LTH LOS & COUNT 2009 ANALYSIS AADT AADT LOS STD/
AND SEGMENT CLASS LNS. TYPE SIG. MI. (MI.) AREA MAX VOL STA # AADT YEAR VOLUME LOS MAX VOL VOLUME LOS
CONGESTION MANAGEMENT PROCESS 2010 LEVEL OF SERVICE ANALYSIS - OKALOOSA COUNTY STATE ROADS
AADT
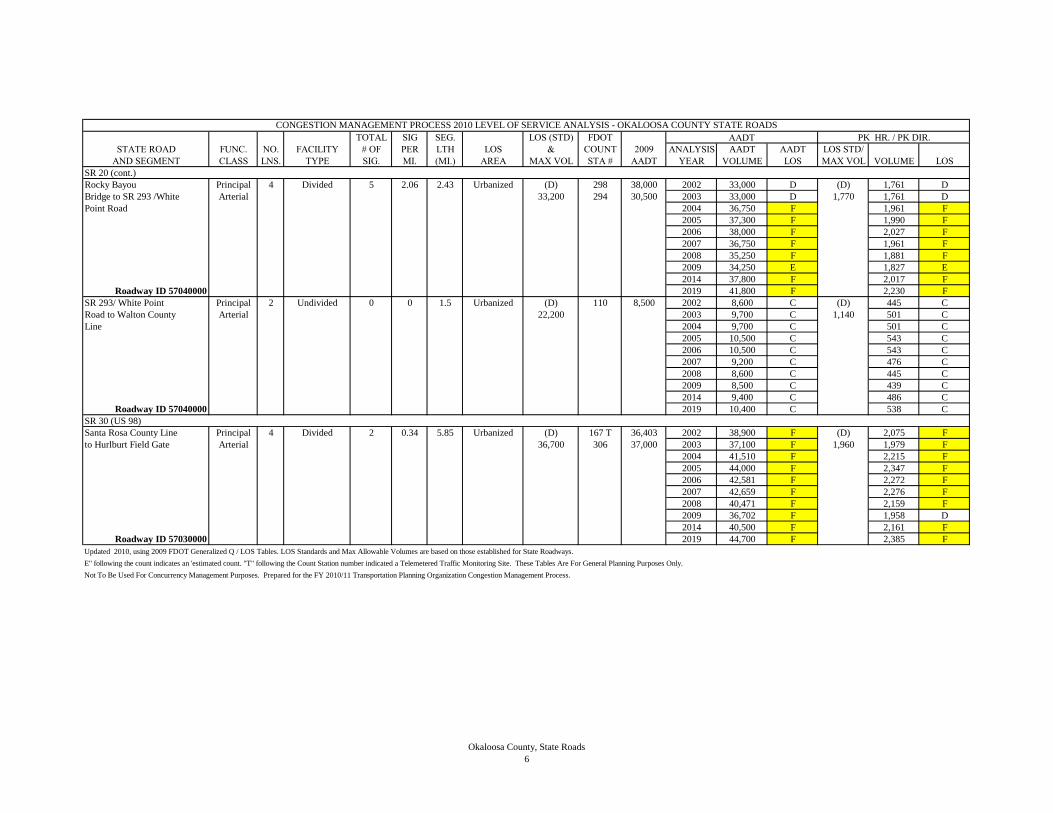
SR 20 (cont.)
Rocky Bayou Principal 4 Divided 5 2.06 2.43 Urbanized (D) 298 38,000 2002 33,000 D (D) 1,761 D
Bridge to SR 293 /White Arterial 33,200 294 30,500 2003 33,000 D 1,770 1,761 D
Point Road 2004 36,750 F 1,961 F
2005 37,300 F 1,990 F
2006 38,000 F 2,027 F
2007 36,750 F 1,961 F
2008 35,250 F 1,881 F
2009 34,250 E 1,827 E
2014 37,800 F 2,017 F
Roadway ID 57040000 2019 41,800 F 2,230 F
SR 293/ White Point Principal 2 Undivided 0 0 1.5 Urbanized (D) 110 8,500 2002 8,600 C (D) 445 C
Road to Walton County Arterial 22,200 2003 9,700 C 1,140 501 C
Line 2004 9,700 C 501 C
2005 10,500 C 543 C
2006 10,500 C 543 C
2007 9,200 C 476 C
2008 8,600 C 445 C
2009 8,500 C 439 C
2014 9,400 C 486 C
Roadway ID 57040000 2019 10,400 C 538 C
SR 30 (US 98)
Santa Rosa County Line Principal 4 Divided 2 0.34 5.85 Urbanized (D) 167 T 36,403 2002 38,900 F (D) 2,075 F
to Hurlburt Field Gate Arterial 36,700 306 37,000 2003 37,100 F 1,960 1,979 F
2004 41,510 F 2,215 F
2005 44,000 F 2,347 F
2006 42,581 F 2,272 F
2007 42,659 F 2,276 F
2008 40,471 F 2,159 F
2009 36,702 F 1,958 D
2014 40,500 F 2,161 F
Roadway ID 57030000 2019 44,700 F 2,385 F
Updated 2010, using 2009 FDOT Generalized Q / LOS Tables. LOS Standards and Max Allowable Volumes are based on those established for State Roadways.
Not To Be Used For Concurrency Management Purposes. Prepared for the FY 2010/11 Transportation Planning Organization Congestion Management Process.
E" following the count indicates an 'estimated count. "T" following the Count Station number indicated a Telemetered Traffic Monitoring Site. These Tables Are For General Planning Purposes Only.
Okaloosa County, State Roads
6

TOTAL SIG SEG. LOS (STD) FDOT PK HR. / PK DIR.
STATE ROAD FUNC. NO. FACILITY # OF PER LTH LOS & COUNT 2009 ANALYSIS AADT AADT LOS STD/
AND SEGMENT CLASS LNS. TYPE SIG. MI. (MI.) AREA MAX VOL STA # AADT YEAR VOLUME LOS MAX VOL VOLUME LOS
CONGESTION MANAGEMENT PROCESS 2010 LEVEL OF SERVICE ANALYSIS - OKALOOSA COUNTY STATE ROADS
AADT
SR 30 (US 98) (cont.)
Hurlburt Field Gate to Principal 4 Divided 3 1.09 2.75 Urbanized (D) 1705 T NA 2002 35,250 C (D) 1,881 C
SR 393 / Mary Esther Arterial 36,700 5080 30,000 2003 35,000 C 1,960 1,867 C
Boulevard 2004 38,539 F 2,056 F
2005 42,200 F 2,251 F
2006 40,500 F 2,161 F
2007 40,250 F 2,147 F
2008 35,000 C 1,867 C
2009 30,000 C 1,601 C
2014 33,100 C 1,766 C
Roadway ID 57030000 2019 36,600 D 1,953 D
SR 393 /Mary Esther Principal 4 Divided/ 4 1.333 3.0 Urbanized (D) 1702 28,500 2002 32,700 C (D) 1,745 C
Boulevard to Eastern Arterial Undivided 36,700 5038 NA 2003 31,700 C 1,960 1,691 C
Leg SR85/ Florida Place/ 5039 34,000 2004 33,834 C 1,805 C
(Undivided St. Mary to 5040 28,000 2005 34,500 C 1,841 C
Florida Place) 2006 33,667 C 1,796 C
2007 35,167 C 1,876 C
Roadway ID 57030000 2008 35,167 C 1,876 C
Segment is undivided from .05 miles east of SR85 to Florida Place 2009 30,167 C 1,609 C
2014 33,300 C 1,777 C
2019 36,800 F 1,963 F
Eastern Leg SR85 / Principal 4 Divided 3 2.6 1.17 Urbanized (D) 5104 39,000 2002 45,325 F (D) 2,418 F
Florida Place to Arterial 33,200 293 T 47,817 2003 45,800 F 1,770 2,443 F
Military Boundary / 5083 33,500 2004 45,890 F 2,448 F
Beach Park Entrance 2005 45,200 F 2,411 F
on Okaloosa Island 2006 45,180 F 2,410 F
2007 46,229 F 2,466 F
Roadway ID 57030000 2008 45,427 F 2,424 F
Backlogged Facility 2009 40,106 F 2,140 F
2014 44,300 F 2,363 F
2019 48,900 F 2,609 F
Updated 2010, using 2009 FDOT Generalized Q / LOS Tables. LOS Standards and Max Allowable Volumes are based on those established for State Roadways.
Not To Be Used For Concurrency Management Purposes. Prepared for the FY 2010/11 Transportation Planning Organization Congestion Management Process.
E" following the count indicates an 'estimated count. "T" following the Count Station number indicated a Telemetered Traffic Monitoring Site. These Tables Are For General Planning Purposes Only.
Okaloosa County, State Roads
7
TOTAL SIG SEG. LOS (STD) FDOT PK HR. / PK DIR.
STATE ROAD FUNC. NO. FACILITY # OF PER LTH LOS & COUNT 2009 ANALYSIS AADT AADT LOS STD/
AND SEGMENT CLASS LNS. TYPE SIG. MI. (MI.) AREA MAX VOL STA # AADT YEAR VOLUME LOS MAX VOL VOLUME LOS
CONGESTION MANAGEMENT PROCESS 2010 LEVEL OF SERVICE ANALYSIS - OKALOOSA COUNTY STATE ROADS
AADT
SR 30 (US 98) (cont.)
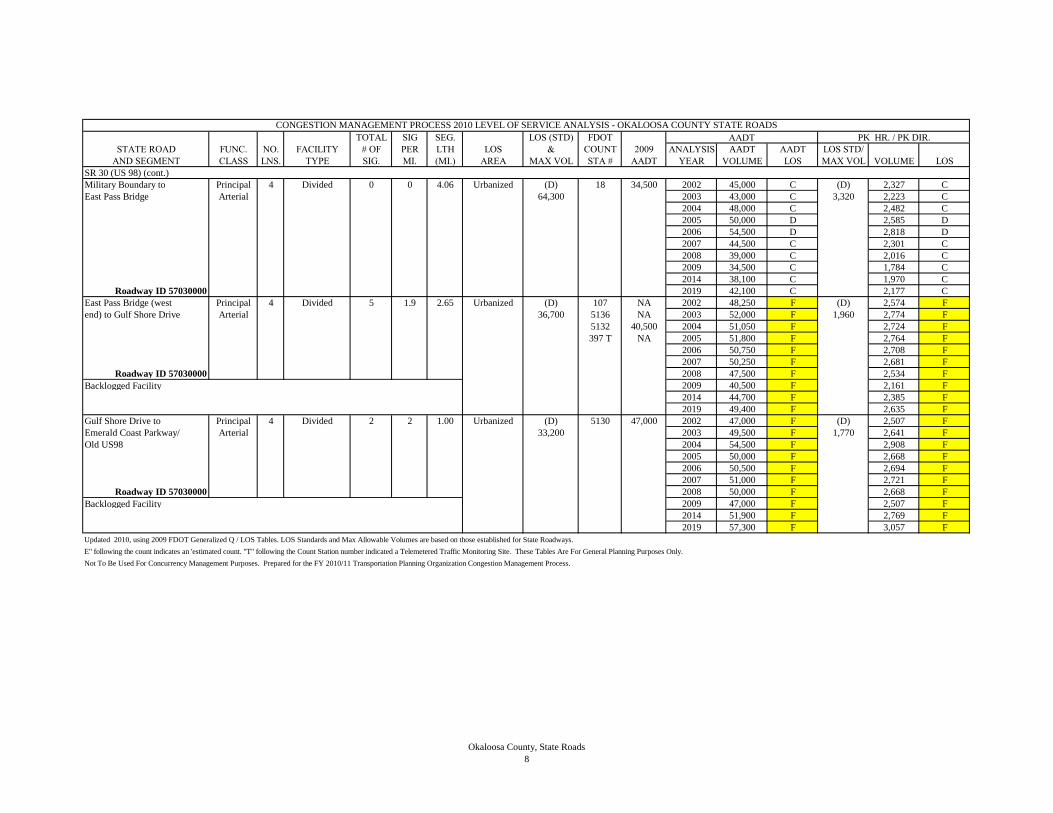
Military Boundary to Principal 4 Divided 0 0 4.06 Urbanized (D) 18 34,500 2002 45,000 C (D) 2,327 C
East Pass Bridge Arterial 64,300 2003 43,000 C 3,320 2,223 C
2004 48,000 C 2,482 C
2005 50,000 D 2,585 D
2006 54,500 D 2,818 D
2007 44,500 C 2,301 C
2008 39,000 C 2,016 C
2009 34,500 C 1,784 C
2014 38,100 C 1,970 C
Roadway ID 57030000 2019 42,100 C 2,177 C
East Pass Bridge (west Principal 4 Divided 5 1.9 2.65 Urbanized (D) 107 NA 2002 48,250 F (D) 2,574 F
end) to Gulf Shore Drive Arterial 36,700 5136 NA 2003 52,000 F 1,960 2,774 F
5132 40,500 2004 51,050 F 2,724 F
397 T NA 2005 51,800 F 2,764 F
2006 50,750 F 2,708 F
2007 50,250 F 2,681 F
Roadway ID 57030000 2008 47,500 F 2,534 F
Backlogged Facility 2009 40,500 F 2,161 F
2014 44,700 F 2,385 F
2019 49,400 F 2,635 F
Gulf Shore Drive to Principal 4 Divided 2 2 1.00 Urbanized (D) 5130 47,000 2002 47,000 F (D) 2,507 F
Emerald Coast Parkway/ Arterial 33,200 2003 49,500 F 1,770 2,641 F
Old US98 2004 54,500 F 2,908 F
2005 50,000 F 2,668 F
2006 50,500 F 2,694 F
2007 51,000 F 2,721 F
Roadway ID 57030000 2008 50,000 F 2,668 F
Backlogged Facility 2009 47,000 F 2,507 F
2014 51,900 F 2,769 F
2019 57,300 F 3,057 F
Updated 2010, using 2009 FDOT Generalized Q / LOS Tables. LOS Standards and Max Allowable Volumes are based on those established for State Roadways.
Not To Be Used For Concurrency Management Purposes. Prepared for the FY 2010/11 Transportation Planning Organization Congestion Management Process.
E" following the count indicates an 'estimated count. "T" following the Count Station number indicated a Telemetered Traffic Monitoring Site. These Tables Are For General Planning Purposes Only.
Okaloosa County, State Roads
8
TOTAL SIG SEG. LOS (STD) FDOT PK HR. / PK DIR.
STATE ROAD FUNC. NO. FACILITY # OF PER LTH LOS & COUNT 2009 ANALYSIS AADT AADT LOS STD/
AND SEGMENT CLASS LNS. TYPE SIG. MI. (MI.) AREA MAX VOL STA # AADT YEAR VOLUME LOS MAX VOL VOLUME LOS
CONGESTION MANAGEMENT PROCESS 2010 LEVEL OF SERVICE ANALYSIS - OKALOOSA COUNTY STATE ROADS
AADT
SR 30 (US 98) (cont.)
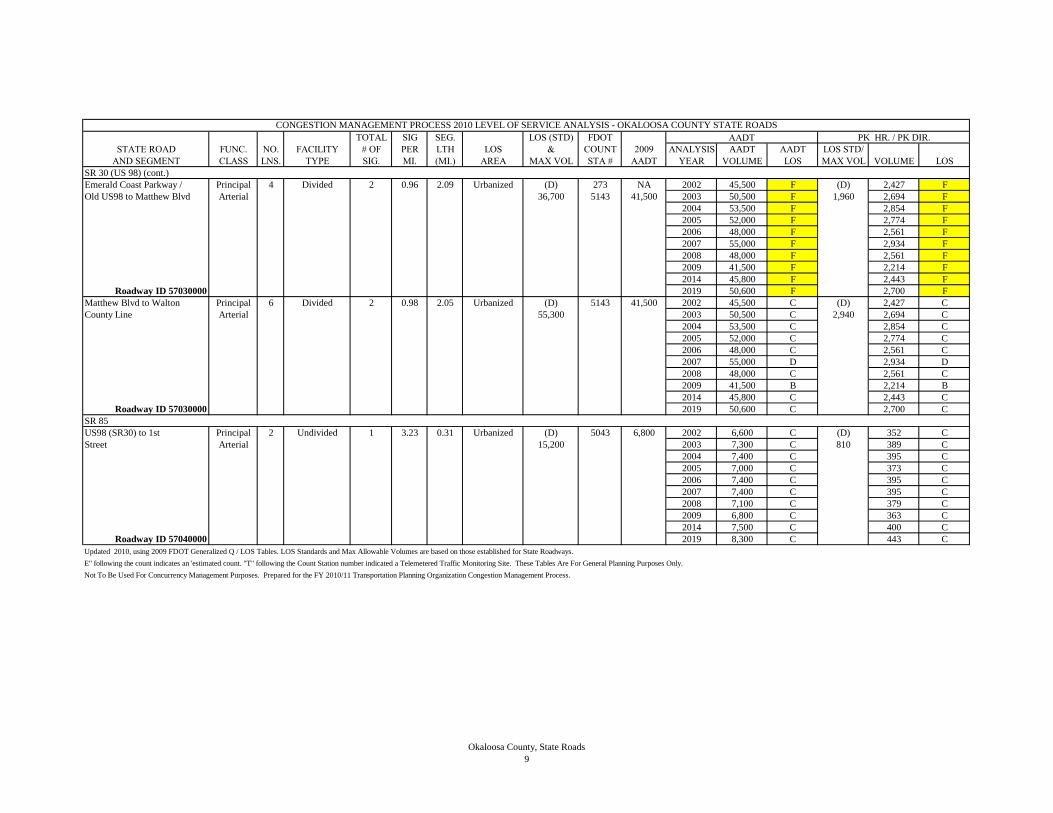
Emerald Coast Parkway / Principal 4 Divided 2 0.96 2.09 Urbanized (D) 273 NA 2002 45,500 F (D) 2,427 F
Old US98 to Matthew Blvd Arterial 36,700 5143 41,500 2003 50,500 F 1,960 2,694 F
2004 53,500 F 2,854 F
2005 52,000 F 2,774 F
2006 48,000 F 2,561 F
2007 55,000 F 2,934 F
2008 48,000 F 2,561 F
2009 41,500 F 2,214 F
2014 45,800 F 2,443 F
Roadway ID 57030000 2019 50,600 F 2,700 F
Matthew Blvd to Walton Principal 6 Divided 2 0.98 2.05 Urbanized (D) 5143 41,500 2002 45,500 C (D) 2,427 C
County Line Arterial 55,300 2003 50,500 C 2,940 2,694 C
2004 53,500 C 2,854 C
2005 52,000 C 2,774 C
2006 48,000 C 2,561 C
2007 55,000 D 2,934 D
2008 48,000 C 2,561 C
2009 41,500 B 2,214 B
2014 45,800 C 2,443 C
Roadway ID 57030000 2019 50,600 C 2,700 C
SR 85
US98 (SR30) to 1st Principal 2 Undivided 1 3.23 0.31 Urbanized (D) 5043 6,800 2002 6,600 C (D) 352 C
Street Arterial 15,200 2003 7,300 C 810 389 C
2004 7,400 C 395 C
2005 7,000 C 373 C
2006 7,400 C 395 C
2007 7,400 C 395 C
2008 7,100 C 379 C
2009 6,800 C 363 C
2014 7,500 C 400 C
Roadway ID 57040000 2019 8,300 C 443 C
Updated 2010, using 2009 FDOT Generalized Q / LOS Tables. LOS Standards and Max Allowable Volumes are based on those established for State Roadways.
Not To Be Used For Concurrency Management Purposes. Prepared for the FY 2010/11 Transportation Planning Organization Congestion Management Process.
E" following the count indicates an 'estimated count. "T" following the Count Station number indicated a Telemetered Traffic Monitoring Site. These Tables Are For General Planning Purposes Only.
Okaloosa County, State Roads
9

TOTAL SIG SEG. LOS (STD) FDOT PK HR. / PK DIR.
STATE ROAD FUNC. NO. FACILITY # OF PER LTH LOS & COUNT 2009 ANALYSIS AADT AADT LOS STD/
AND SEGMENT CLASS LNS. TYPE SIG. MI. (MI.) AREA MAX VOL STA # AADT YEAR VOLUME LOS MAX VOL VOLUME LOS
CONGESTION MANAGEMENT PROCESS 2010 LEVEL OF SERVICE ANALYSIS - OKALOOSA COUNTY STATE ROADS
AADT
SR 85 (cont.)
US98 (SR30) to 1st Principal 3 Undivided 1 7.69 0.13 Urbanized (D) 5074 6,100 2002 7,400 C (D) 395 C
Street Arterial 21,150 2003 7,700 C 1,125 411 C
2004 6,700 C 357 C
2005 7,100 C 379 C
2006 7,500 C 400 C
2007 7,300 C 389 C
2008 6,200 C 331 C
2009 6,100 C 325 C
2014 6,700 C 357 C
Roadway ID 57040024 2019 7,400 C 395 C
1st Street to SR 188 / Principal 6 Divided 9 3.15 2.85 Urbanized (D) 5108 42,000 2002 36,350 C (D) 1,939 C
Racetrack Road / 4th Arterial 50,300 1709 49,000 2003 37,950 C 2,680 2,025 C
Avenue 1704 38,000 2004 40,000 D 2,134 D
5106 37,000 2005 39,300 D 2,097 D
5045 31,000 2006 39,800 D 2,123 D
5079 12,500 2007 41,817 D 2,231 D
Roadway ID 57040000 2008 38,583 C 2,058 C
Perry Ave to 1st St is 3 lanes southbound and 2 lanes northbound 2009 34,916 C 1,863 C
2014 38,600 C 2,059 C
2019 42,600 D 2,273 D
SR 188 / Racetrack Road / Principal 6 Divided 4 2.55 1.57 Urbanized (D) 1707 38,500 2002 49,500 D (D) 2,641 D
4th Avenue to 12th Arterial 50,300 2003 50,500 E 2,680 2,694 E
Avenue 2004 52,500 E 2,801 E
2005 51,000 E 2,721 E
2006 48,000 D 2,561 D
2007 49,000 D 2,614 D
Roadway ID 57030000 2008 44,500 D 2,374 D
Backlogged Facility 2009 38,500 C 2,054 C
2014 42,500 D 2,267 D
2019 46,900 D 2,502 D
Updated 2010, using 2009 FDOT Generalized Q / LOS Tables. LOS Standards and Max Allowable Volumes are based on those established for State Roadways.
Not To Be Used For Concurrency Management Purposes. Prepared for the FY 2010/11 Transportation Planning Organization Congestion Management Process.
E" following the count indicates an 'estimated count. "T" following the Count Station number indicated a Telemetered Traffic Monitoring Site. These Tables Are For General Planning Purposes Only.
Okaloosa County, State Roads
10
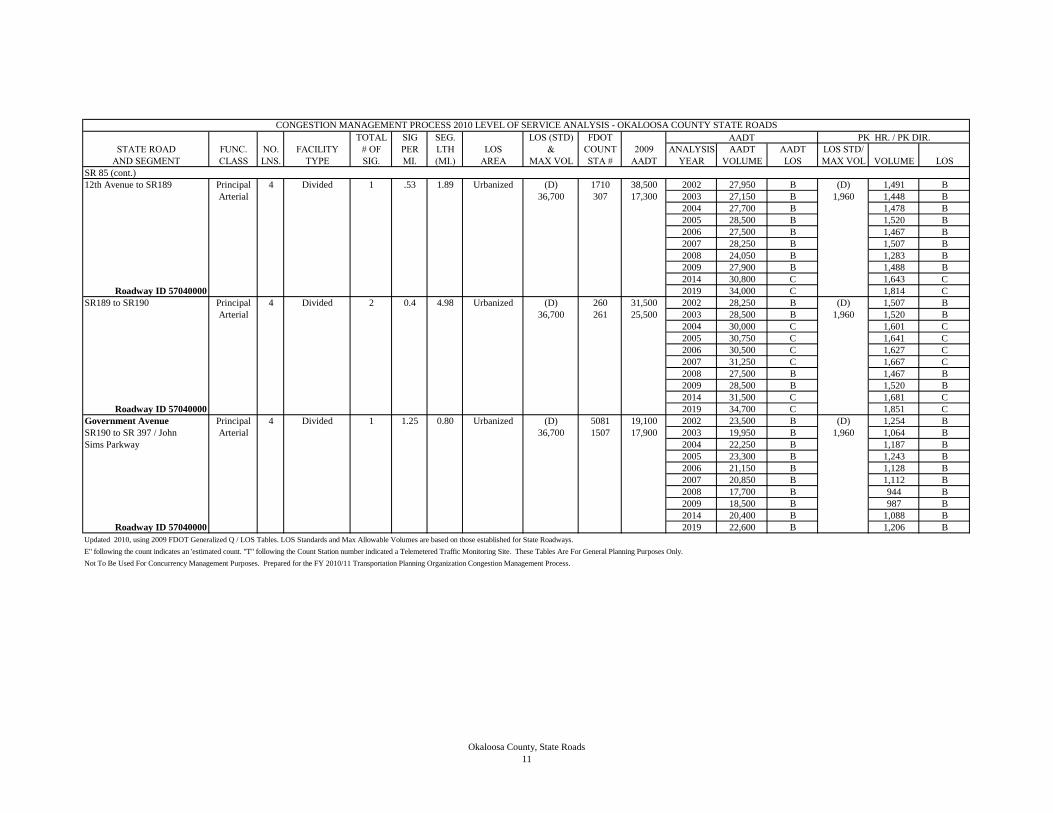
TOTAL SIG SEG. LOS (STD) FDOT PK HR. / PK DIR.
STATE ROAD FUNC. NO. FACILITY # OF PER LTH LOS & COUNT 2009 ANALYSIS AADT AADT LOS STD/
AND SEGMENT CLASS LNS. TYPE SIG. MI. (MI.) AREA MAX VOL STA # AADT YEAR VOLUME LOS MAX VOL VOLUME LOS
CONGESTION MANAGEMENT PROCESS 2010 LEVEL OF SERVICE ANALYSIS - OKALOOSA COUNTY STATE ROADS
AADT
SR 85 (cont.)
12th Avenue to SR189 Principal 4 Divided 1 .53 1.89 Urbanized (D) 1710 38,500 2002 27,950 B (D) 1,491 B
Arterial 36,700 307 17,300 2003 27,150 B 1,960 1,448 B
2004 27,700 B 1,478 B
2005 28,500 B 1,520 B
2006 27,500 B 1,467 B
2007 28,250 B 1,507 B
2008 24,050 B 1,283 B
2009 27,900 B 1,488 B
2014 30,800 C 1,643 C
Roadway ID 57040000 2019 34,000 C 1,814 C
SR189 to SR190 Principal 4 Divided 2 0.4 4.98 Urbanized (D) 260 31,500 2002 28,250 B (D) 1,507 B
Arterial 36,700 261 25,500 2003 28,500 B 1,960 1,520 B
2004 30,000 C 1,601 C
2005 30,750 C 1,641 C
2006 30,500 C 1,627 C
2007 31,250 C 1,667 C
2008 27,500 B 1,467 B
2009 28,500 B 1,520 B
2014 31,500 C 1,681 C
Roadway ID 57040000 2019 34,700 C 1,851 C
Government Avenue Principal 4 Divided 1 1.25 0.80 Urbanized (D) 5081 19,100 2002 23,500 B (D) 1,254 B
SR190 to SR 397 / John Arterial 36,700 1507 17,900 2003 19,950 B 1,960 1,064 B
Sims Parkway 2004 22,250 B 1,187 B
2005 23,300 B 1,243 B
2006 21,150 B 1,128 B
2007 20,850 B 1,112 B
2008 17,700 B 944 B
2009 18,500 B 987 B
2014 20,400 B 1,088 B
Roadway ID 57040000 2019 22,600 B 1,206 B
Updated 2010, using 2009 FDOT Generalized Q / LOS Tables. LOS Standards and Max Allowable Volumes are based on those established for State Roadways.
Not To Be Used For Concurrency Management Purposes. Prepared for the FY 2010/11 Transportation Planning Organization Congestion Management Process.
E" following the count indicates an 'estimated count. "T" following the Count Station number indicated a Telemetered Traffic Monitoring Site. These Tables Are For General Planning Purposes Only.
Okaloosa County, State Roads
11

TOTAL SIG SEG. LOS (STD) FDOT PK HR. / PK DIR.
STATE ROAD FUNC. NO. FACILITY # OF PER LTH LOS & COUNT 2009 ANALYSIS AADT AADT LOS STD/
AND SEGMENT CLASS LNS. TYPE SIG. MI. (MI.) AREA MAX VOL STA # AADT YEAR VOLUME LOS MAX VOL VOLUME LOS
CONGESTION MANAGEMENT PROCESS 2010 LEVEL OF SERVICE ANALYSIS - OKALOOSA COUNTY STATE ROADS
AADT
SR 85 (cont.)
John Sims Parkway Principal 6 Divided 1 1.53 0.65 Urbanized (D) 1510 46,000 2002 43,000 B (D) 2,294 B
Government Avenue to Arterial 55,300 2003 46,000 C 2,940 2,454 C
SR85N 2004 46,500 C 2,481 C
2005 52,000 C 2,774 C
2006 50,500 C 2,694 C
Roadway ID 57040000 2007 57,500 F 3,068 F
2008 52,000 C 2,774 C
2009 46,000 C 2,454 C
2014 50,800 C 2,710 C
2019 56,100 F 2,993 F
SR20 to College Principal 4 Divided 1 1.12 0.89 Urbanized (D) 5016 15,600 2002 14,950 B (D) 798 B
Boulevard Arterial 36,700 5015 15,700 2003 15,000 B 1,960 800 B
2004 16,850 B 899 B
2005 17,400 B 928 B
2006 18,400 B 982 B
2007 18,800 B 1,003 B
2008 15,350 B 819 B
2009 15,650 B 835 B
2014 17,300 B 923 B
Roadway ID 57050000 2019 19,100 B 1,019 B
College Boulevard to Principal 4 Divided 2 0.15 13.088 Trans (C) 1503 NA 2002 27,000 C (C) 1,440 C
Antioch Road Arterial 33,800 88 32,000 2003 31,000 C 1,710 1,654 C
219 T 14,295 2004 22,900 B 1,222 B
2005 24,800 B 1,323 B
2006 23,888 B 1,274 B
2007 24,019 B 1,281 B
Roadway ID 57050000 2008 22,937 B 1,224 B
2009 23,148 B 1,235 B
2014 25,600 B 1,366 B
2019 28,200 C 1,504 C
Updated 2010, using 2009 FDOT Generalized Q / LOS Tables. LOS Standards and Max Allowable Volumes are based on those established for State Roadways.
Not To Be Used For Concurrency Management Purposes. Prepared for the FY 2010/11 Transportation Planning Organization Congestion Management Process.
E" following the count indicates an 'estimated count. "T" following the Count Station number indicated a Telemetered Traffic Monitoring Site. These Tables Are For General Planning Purposes Only.
Segment is on the Strategic Intermodal System
Backlogged Facility Segment schedule to be 6-laned. Right-of-way currently being purchased FY
2006. No construction funds are currently programmed.
Okaloosa County, State Roads
12
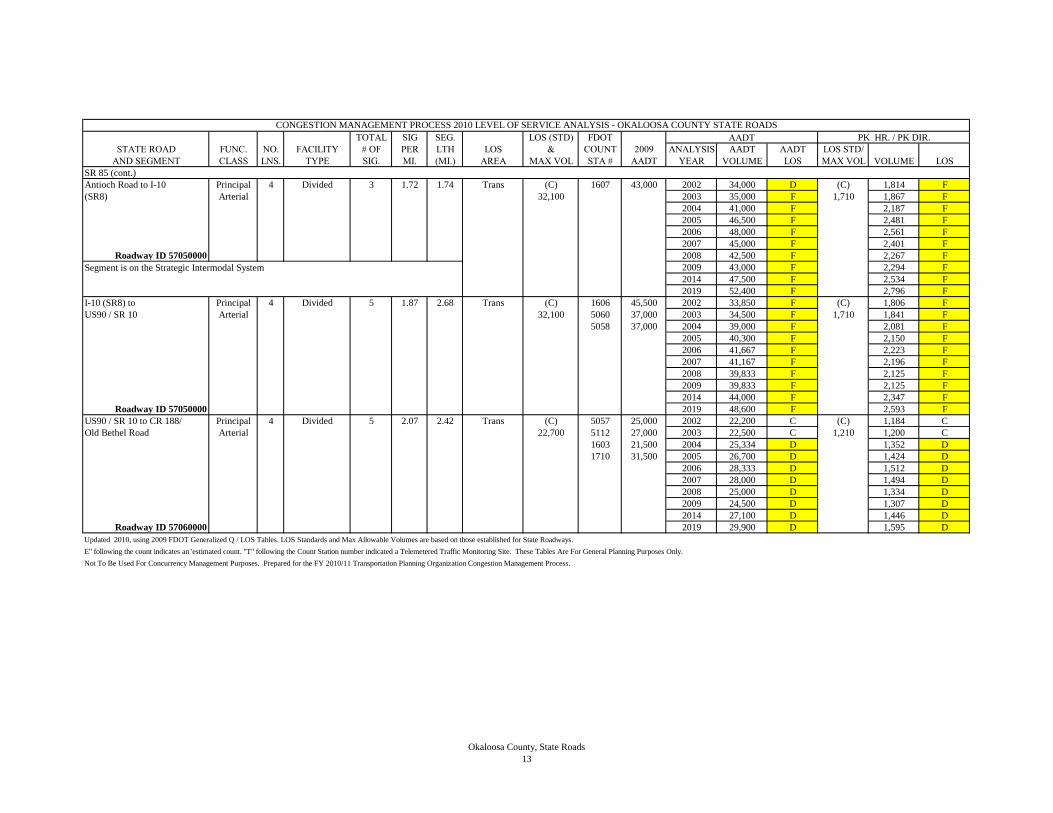
TOTAL SIG SEG. LOS (STD) FDOT PK HR. / PK DIR.
STATE ROAD FUNC. NO. FACILITY # OF PER LTH LOS & COUNT 2009 ANALYSIS AADT AADT LOS STD/
AND SEGMENT CLASS LNS. TYPE SIG. MI. (MI.) AREA MAX VOL STA # AADT YEAR VOLUME LOS MAX VOL VOLUME LOS
CONGESTION MANAGEMENT PROCESS 2010 LEVEL OF SERVICE ANALYSIS - OKALOOSA COUNTY STATE ROADS
AADT
SR 85 (cont.)
Antioch Road to I-10 Principal 4 Divided 3 1.72 1.74 Trans (C) 1607 43,000 2002 34,000 D (C) 1,814 F
(SR8) Arterial 32,100 2003 35,000 F 1,710 1,867 F
2004 41,000 F 2,187 F
2005 46,500 F 2,481 F
2006 48,000 F 2,561 F
2007 45,000 F 2,401 F
Roadway ID 57050000 2008 42,500 F 2,267 F
2009 43,000 F 2,294 F
2014 47,500 F 2,534 F
2019 52,400 F 2,796 F
I-10 (SR8) to Principal 4 Divided 5 1.87 2.68 Trans (C) 1606 45,500 2002 33,850 F (C) 1,806 F
US90 / SR 10 Arterial 32,100 5060 37,000 2003 34,500 F 1,710 1,841 F
5058 37,000 2004 39,000 F 2,081 F
2005 40,300 F 2,150 F
2006 41,667 F 2,223 F
2007 41,167 F 2,196 F
2008 39,833 F 2,125 F
2009 39,833 F 2,125 F
2014 44,000 F 2,347 F
Roadway ID 57050000 2019 48,600 F 2,593 F
US90 / SR 10 to CR 188/ Principal 4 Divided 5 2.07 2.42 Trans (C) 5057 25,000 2002 22,200 C (C) 1,184 C
Old Bethel Road Arterial 22,700 5112 27,000 2003 22,500 C 1,210 1,200 C
1603 21,500 2004 25,334 D 1,352 D
1710 31,500 2005 26,700 D 1,424 D
2006 28,333 D 1,512 D
2007 28,000 D 1,494 D
2008 25,000 D 1,334 D
2009 24,500 D 1,307 D
2014 27,100 D 1,446 D
Roadway ID 57060000 2019 29,900 D 1,595 D
Updated 2010, using 2009 FDOT Generalized Q / LOS Tables. LOS Standards and Max Allowable Volumes are based on those established for State Roadways.
Not To Be Used For Concurrency Management Purposes. Prepared for the FY 2010/11 Transportation Planning Organization Congestion Management Process.
Segment is on the Strategic Intermodal System
E" following the count indicates an 'estimated count. "T" following the Count Station number indicated a Telemetered Traffic Monitoring Site. These Tables Are For General Planning Purposes Only.
Okaloosa County, State Roads
13

TOTAL SIG SEG. LOS (STD) FDOT PK HR. / PK DIR.
STATE ROAD FUNC. NO. FACILITY # OF PER LTH LOS & COUNT 2009 ANALYSIS AADT AADT LOS STD/
AND SEGMENT CLASS LNS. TYPE SIG. MI. (MI.) AREA MAX VOL STA # AADT YEAR VOLUME LOS MAX VOL VOLUME LOS
CONGESTION MANAGEMENT PROCESS 2010 LEVEL OF SERVICE ANALYSIS - OKALOOSA COUNTY STATE ROADS
AADT
SR 85N (cont.)
Old Bethel Road to Principal 2 Undivided 0 0 3.842 Trans (C) 138 4,800 2002 4,100 B (C) 219 B
MPA Boundary (south of Arterial 15,100 2003 4,600 B 800 245 B
Jim Green Road) 2004 5,100 B 272 B
2005 4,700 B 251 B
2006 5,400 B 288 B
2007 5,200 B 277 B
2008 4,700 B 251 B
2009 4,800 B 256 B
2014 5,300 B 283 B
Roadway ID 57060000 2019 5,900 B 315 B
OK - WL MPA Principal 2 Undivided 0 0 14.74 Rural (C) 138 4,800 2002 3,570 B (C) 192 B
Boundary (S of Jim Arterial Undev 8,100 51 4,200 2003 3,810 B 430 205 B
Green Road) to 54 3,700 2004 4,140 B 223 B
Walton County Line 118 3,300 2005 3,940 B 212 B
9942T 3,800 2006 4,270 B 230 B
356T 4,080 2007 4,229 B 228 B
2008 3,843 B 207 B
2009 3,980 B 215 B
2014 4,400 B 237 B
Roadway ID 57060000 2019 4,900 C 264 C
SR 123
SR85 to SR85N Minor 2 Undivided 1 0.2 5.08 Trans (D) 299 16,400 2002 14,400 D (D) 768 D
Arterial 15,200 2003 14,100 C 800 752 D
2004 15,800 F 843 F
2005 17,200 F 918 F
2006 16,300 F 870 F
2007 16,800 F 896 F
2008 15,900 F 848 F
2009 16,400 F 875 F
2014 18,100 F 966 F
Roadway ID 57150000 2019 20,000 F 1,067 F
Updated 2010, using 2009 FDOT Generalized Q / LOS Tables. LOS Standards and Max Allowable Volumes are based on those established for State Roadways.
Not To Be Used For Concurrency Management Purposes. Prepared for the FY 2010/11 Transportation Planning Organization Congestion Management Process.
E" following the count indicates an 'estimated count. "T" following the Count Station number indicated a Telemetered Traffic Monitoring Site. These Tables Are For General Planning Purposes Only.
Okaloosa County, State Roads
14

TOTAL SIG SEG. LOS (STD) FDOT PK HR. / PK DIR.
STATE ROAD FUNC. NO. FACILITY # OF PER LTH LOS & COUNT 2009 ANALYSIS AADT AADT LOS STD/
AND SEGMENT CLASS LNS. TYPE SIG. MI. (MI.) AREA MAX VOL STA # AADT YEAR VOLUME LOS MAX VOL VOLUME LOS
CONGESTION MANAGEMENT PROCESS 2010 LEVEL OF SERVICE ANALYSIS - OKALOOSA COUNTY STATE ROADS
AADT
SR 145
Perry Street Minor 3 Undivided 2 3.92 0.51 Urbanized (D) 5128 21,100 2002 19,900 D (D) 1,062 D
US98(SR30) to SR85 / Arterial 24,900 5137 19,600 2003 21,600 D 1,328 1,152 D
Eglin Parkway 2004 22,550 D 1,203 D
2005 21,300 D 1,136 D
2006 22,300 D 1,190 D
2007 24,450 D 1,304 D
2008 20,050 D 1,070 D
2009 20,350 D 1,086 D
2014 22,500 D 1,200 D
Roadway ID 57040001 2019 24,800 D 1,323 D
SR 188
Racetrack Road Urban 4 Divided 5 1.93 2.59 Urbanized (D) 5091 29,500 2002 32,300 C (D) 1,723 C
SR 189 / Beal Parkway to Arterial 36,700 5126 29,000 2003 33,700 C 1,960 1,798 C
SR 85 / Eglin Parkway 5110 28,500 2004 33,667 C 1,796 C
2005 32,300 C 1,723 C
2006 33,500 C 1,787 C
2007 37,833 F 2,018 F
2008 34,500 C 1,841 C
2009 29,000 B 1,547 B
2014 32,000 C 1,707 C
Roadway ID 57003000 2019 35,400 C 1,889 C
SR 189
Beal Parkway Minor 4 Divided 3 2.3 1.3 Urbanized (D) 5102 13,400 2002 17,900 C (D) 955 C
SR 30 / US98 to CR 85-A / Arterial 33,200 5138 18,800 2003 19,050 C 1,770 1,016 C
Yacht Club Drive 2004 19,000 C 1,014 C
2005 18,300 C 976 C
2006 18,950 C 1,011 C
2007 18,450 C 984 C
2008 16,450 C 878 C
2009 16,100 C 859 C
2014 17,800 C 950 C
Roadway ID 57110000 2019 19,600 C 1,046 C
Updated 2010, using 2009 FDOT Generalized Q / LOS Tables. LOS Standards and Max Allowable Volumes are based on those established for State Roadways.
Not To Be Used For Concurrency Management Purposes. Prepared for the FY 2010/11 Transportation Planning Organization Congestion Management Process.
E" following the count indicates an 'estimated count. "T" following the Count Station number indicated a Telemetered Traffic Monitoring Site. These Tables Are For General Planning Purposes Only.
Okaloosa County, State Roads
15

TOTAL SIG SEG. LOS (STD) FDOT PK HR. / PK DIR.
STATE ROAD FUNC. NO. FACILITY # OF PER LTH LOS & COUNT 2009 ANALYSIS AADT AADT LOS STD/
AND SEGMENT CLASS LNS. TYPE SIG. MI. (MI.) AREA MAX VOL STA # AADT YEAR VOLUME LOS MAX VOL VOLUME LOS
CONGESTION MANAGEMENT PROCESS 2010 LEVEL OF SERVICE ANALYSIS - OKALOOSA COUNTY STATE ROADS
AADT
SR 189 (cont.)
Beal Parkway Minor 4 Divided 2 1.3 1.55 Urbanized (D) 5034 24,500 2002 26,250 B (D) 1,400 B
CR 85-A /Yacht Club Arterial 36,700 1701 27,500 2003 27,750 B 1,960 1,480 B
Drive to SR 393 / Mary 2004 29,750 C 1,587 C
Esther Boulevard / Oak 2005 30,000 C 1,601 C
Street 2006 29,750 C 1,587 C
2007 30,500 C 1,627 C
2008 25,750 B 1,374 B
2009 26,000 B 1,387 B
2014 28,700 B 1,531 B
Roadway ID 57110000 2019 31,700 C 1,691 C
SR 393 / Mary Esther Minor 4 Divided 4 2.7 1.46 Urbanized (D) 5095 47,500 2002 45,319 F (D) 2,418 F
Boulevard / Oak Street Arterial 33,200 5123 T NA 2003 44,200 F 1,770 2,358 F
to SR 188 / Racetrack 5113 42,500 2004 45,580 F 2,432 F
Road 2005 48,400 F 2,582 F
2006 48,667 F 2,596 F
2007 44,833 F 2,392 F
Roadway ID 57110000 2008 44,500 F 2,374 F
2009 45,000 F 2,401 F
2014 49,700 F 2,651 F
2019 54,900 F 2,929 F
Lewis Turner Minor 4 Divided 3 1.42 2.11 Urbanized (D) 5090 34,000 2002 33,700 C (D) 1,798 C
Boulevard Arterial 36,700 5089 NA 2003 35,200 C 1,960 1,878 C
SR 188 / Racetrack Road 250 T 28,828 2004 35,710 D 1,905 D
to Mooney Road 2005 38,600 F 2,059 F
2006 39,192 F 2,091 F
2007 39,034 F 2,082 F
2008 35,913 D 1,916 D
2009 31,414 C 1,676 C
2014 34,700 C 1,851 C
Roadway ID 57130000 2019 38,300 F 2,043 F
Updated 2010, using 2009 FDOT Generalized Q / LOS Tables. LOS Standards and Max Allowable Volumes are based on those established for State Roadways.
Not To Be Used For Concurrency Management Purposes. Prepared for the FY 2010/11 Transportation Planning Organization Congestion Management Process.
E" following the count indicates an 'estimated count. "T" following the Count Station number indicated a Telemetered Traffic Monitoring Site. These Tables Are For General Planning Purposes Only.
Backlogged Facility
Okaloosa County, State Roads
16

TOTAL SIG SEG. LOS (STD) FDOT PK HR. / PK DIR.
STATE ROAD FUNC. NO. FACILITY # OF PER LTH LOS & COUNT 2009 ANALYSIS AADT AADT LOS STD/
AND SEGMENT CLASS LNS. TYPE SIG. MI. (MI.) AREA MAX VOL STA # AADT YEAR VOLUME LOS MAX VOL VOLUME LOS
CONGESTION MANAGEMENT PROCESS 2010 LEVEL OF SERVICE ANALYSIS - OKALOOSA COUNTY STATE ROADS
AADT
SR 189 (cont.)
Lewis Turner Minor 4 Divided 1 .28 3.6 Urbanized (D) 1706 31,500 2002 27,650 B (D) 1,475 B
Boulevard Arterial 36,700 290 21,600 2003 29,500 C 1,960 1,574 C
Mooney Road to SR85 2004 30,350 C 1,619 C
2005 31,300 C 1,670 C
2006 29,400 C 1,568 C
2007 29,000 B 1,547 B
2008 26,250 B 1,400 B
2009 26,550 B 1,416 B
2014 29,300 B 1,563 C
Roadway ID 57130000 2019 32,400 C 1,729 C
SR85 to Eglin Minor 4 Divided 1 2 0.5 Urbanized (D) 291 11,300 2002 11,800 C (D) 630 C
Boulevard / SR 397 Arterial 33,200 2003 13,500 C 1,770 720 C
2004 13,300 C 710 C
2005 13,700 C 731 C
2006 12,900 C 688 C
2007 13,100 C 699 C
2008 11,700 C 624 C
2009 11,300 C 603 C
2014 12,500 C 667 C
Roadway ID 57130000 2019 13,800 C 736 C
SR 189
SR 4 / Georgia Avenue Minor 2 Undivided 0 0 14.4 Rural (C) 5 4,000 2002 2,338 B (C) 126 B
to Alabama State Line Arterial Undev 8,100 120 2,600 2003 2,400 B 430 129 B
121 2,100 2004 2,500 B 135 B
1 1,900 2005 2,800 B 151 B
2006 2,688 B 145 B
2007 2,538 B 137 B
2008 2,375 B 128 B
2009 2,650 B 143 B
2014 2,900 B 156 B
Roadway ID 57070000 2019 3,200 B 172 B
Updated 2010, using 2009 FDOT Generalized Q / LOS Tables. LOS Standards and Max Allowable Volumes are based on those established for State Roadways.
Not To Be Used For Concurrency Management Purposes. Prepared for the FY 2010/11 Transportation Planning Organization Congestion Management Process.
E" following the count indicates an 'estimated count. "T" following the Count Station number indicated a Telemetered Traffic Monitoring Site. These Tables Are For General Planning Purposes Only.
Okaloosa County, State Roads
17
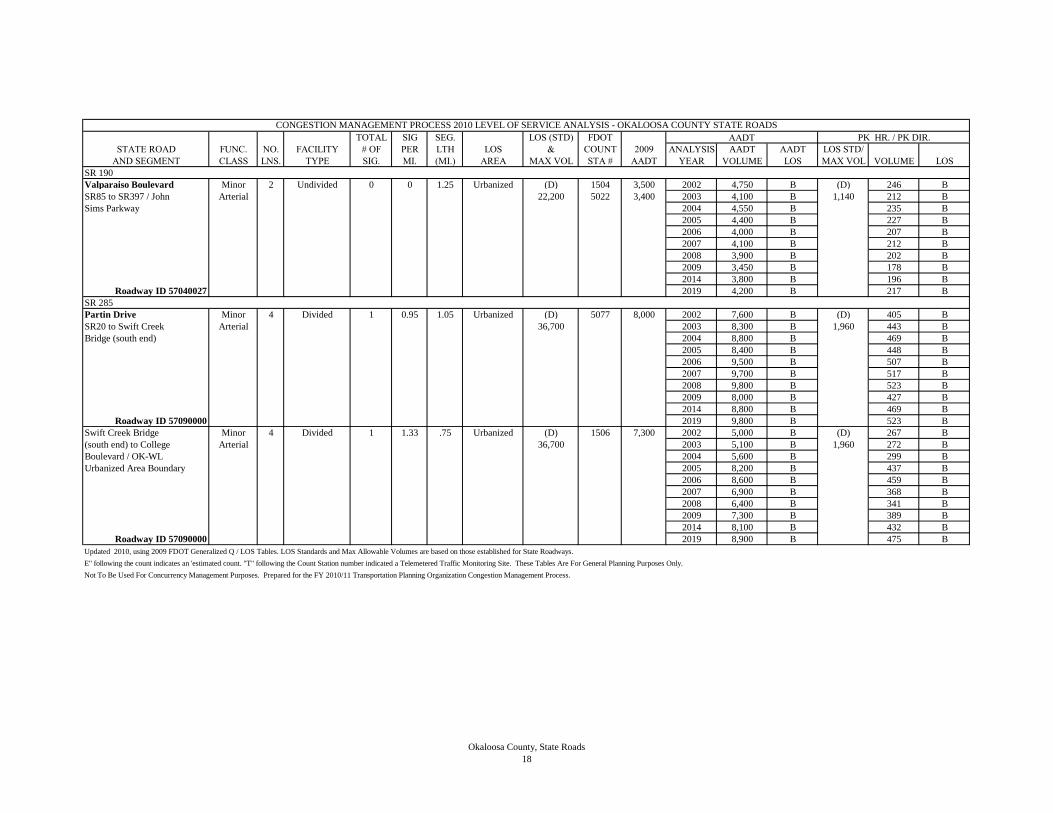
TOTAL SIG SEG. LOS (STD) FDOT PK HR. / PK DIR.
STATE ROAD FUNC. NO. FACILITY # OF PER LTH LOS & COUNT 2009 ANALYSIS AADT AADT LOS STD/
AND SEGMENT CLASS LNS. TYPE SIG. MI. (MI.) AREA MAX VOL STA # AADT YEAR VOLUME LOS MAX VOL VOLUME LOS
CONGESTION MANAGEMENT PROCESS 2010 LEVEL OF SERVICE ANALYSIS - OKALOOSA COUNTY STATE ROADS
AADT
SR 190
Valparaiso Boulevard Minor 2 Undivided 0 0 1.25 Urbanized (D) 1504 3,500 2002 4,750 B (D) 246 B
SR85 to SR397 / John Arterial 22,200 5022 3,400 2003 4,100 B 1,140 212 B
Sims Parkway 2004 4,550 B 235 B
2005 4,400 B 227 B
2006 4,000 B 207 B
2007 4,100 B 212 B
2008 3,900 B 202 B
2009 3,450 B 178 B
2014 3,800 B 196 B
Roadway ID 57040027 2019 4,200 B 217 B
SR 285
Partin Drive Minor 4 Divided 1 0.95 1.05 Urbanized (D) 5077 8,000 2002 7,600 B (D) 405 B
SR20 to Swift Creek Arterial 36,700 2003 8,300 B 1,960 443 B
Bridge (south end) 2004 8,800 B 469 B
2005 8,400 B 448 B
2006 9,500 B 507 B
2007 9,700 B 517 B
2008 9,800 B 523 B
2009 8,000 B 427 B
2014 8,800 B 469 B
Roadway ID 57090000 2019 9,800 B 523 B
Swift Creek Bridge Minor 4 Divided 1 1.33 .75 Urbanized (D) 1506 7,300 2002 5,000 B (D) 267 B
(south end) to College Arterial 36,700 2003 5,100 B 1,960 272 B
Boulevard / OK-WL 2004 5,600 B 299 B
Urbanized Area Boundary 2005 8,200 B 437 B
2006 8,600 B 459 B
2007 6,900 B 368 B
2008 6,400 B 341 B
2009 7,300 B 389 B
2014 8,100 B 432 B
Roadway ID 57090000 2019 8,900 B 475 B
Updated 2010, using 2009 FDOT Generalized Q / LOS Tables. LOS Standards and Max Allowable Volumes are based on those established for State Roadways.
Not To Be Used For Concurrency Management Purposes. Prepared for the FY 2010/11 Transportation Planning Organization Congestion Management Process.
E" following the count indicates an 'estimated count. "T" following the Count Station number indicated a Telemetered Traffic Monitoring Site. These Tables Are For General Planning Purposes Only.
Okaloosa County, State Roads
18
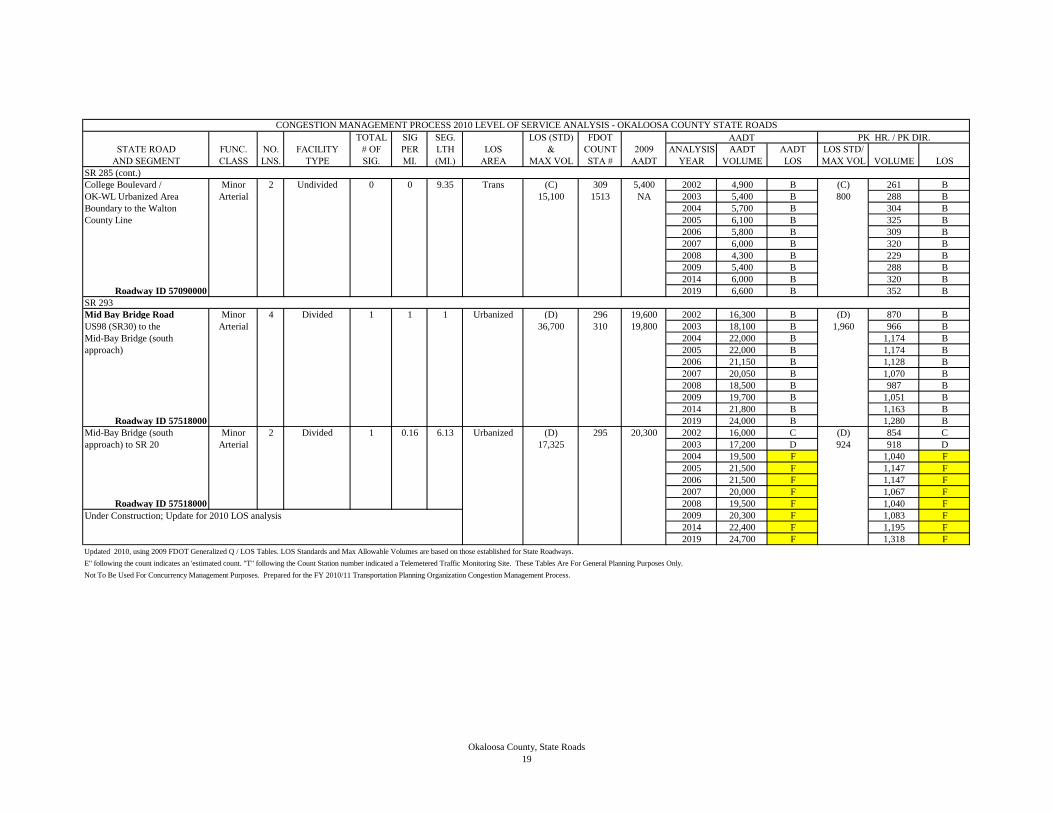
TOTAL SIG SEG. LOS (STD) FDOT PK HR. / PK DIR.
STATE ROAD FUNC. NO. FACILITY # OF PER LTH LOS & COUNT 2009 ANALYSIS AADT AADT LOS STD/
AND SEGMENT CLASS LNS. TYPE SIG. MI. (MI.) AREA MAX VOL STA # AADT YEAR VOLUME LOS MAX VOL VOLUME LOS
CONGESTION MANAGEMENT PROCESS 2010 LEVEL OF SERVICE ANALYSIS - OKALOOSA COUNTY STATE ROADS
AADT
SR 285 (cont.)
College Boulevard / Minor 2 Undivided 0 0 9.35 Trans (C) 309 5,400 2002 4,900 B (C) 261 B
OK-WL Urbanized Area Arterial 15,100 1513 NA 2003 5,400 B 800 288 B
Boundary to the Walton 2004 5,700 B 304 B
County Line 2005 6,100 B 325 B
2006 5,800 B 309 B
2007 6,000 B 320 B
2008 4,300 B 229 B
2009 5,400 B 288 B
2014 6,000 B 320 B
Roadway ID 57090000 2019 6,600 B 352 B
SR 293
Mid Bay Bridge Road Minor 4 Divided 1 1 1 Urbanized (D) 296 19,600 2002 16,300 B (D) 870 B
US98 (SR30) to the Arterial 36,700 310 19,800 2003 18,100 B 1,960 966 B
Mid-Bay Bridge (south 2004 22,000 B 1,174 B
approach) 2005 22,000 B 1,174 B
2006 21,150 B 1,128 B
2007 20,050 B 1,070 B
2008 18,500 B 987 B
2009 19,700 B 1,051 B
2014 21,800 B 1,163 B
Roadway ID 57518000 2019 24,000 B 1,280 B
Mid-Bay Bridge (south Minor 2 Divided 1 0.16 6.13 Urbanized (D) 295 20,300 2002 16,000 C (D) 854 C
approach) to SR 20 Arterial 17,325 2003 17,200 D 924 918 D
2004 19,500 F 1,040 F
2005 21,500 F 1,147 F
2006 21,500 F 1,147 F
2007 20,000 F 1,067 F
Roadway ID 57518000 2008 19,500 F 1,040 F
2009 20,300 F 1,083 F
2014 22,400 F 1,195 F
2019 24,700 F 1,318 F
Updated 2010, using 2009 FDOT Generalized Q / LOS Tables. LOS Standards and Max Allowable Volumes are based on those established for State Roadways.
Not To Be Used For Concurrency Management Purposes. Prepared for the FY 2010/11 Transportation Planning Organization Congestion Management Process.
E" following the count indicates an 'estimated count. "T" following the Count Station number indicated a Telemetered Traffic Monitoring Site. These Tables Are For General Planning Purposes Only.
Under Construction; Update for 2010 LOS analysis
Okaloosa County, State Roads
19

TOTAL SIG SEG. LOS (STD) FDOT PK HR. / PK DIR.
STATE ROAD FUNC. NO. FACILITY # OF PER LTH LOS & COUNT 2009 ANALYSIS AADT AADT LOS STD/
AND SEGMENT CLASS LNS. TYPE SIG. MI. (MI.) AREA MAX VOL STA # AADT YEAR VOLUME LOS MAX VOL VOLUME LOS
CONGESTION MANAGEMENT PROCESS 2010 LEVEL OF SERVICE ANALYSIS - OKALOOSA COUNTY STATE ROADS
AADT
SR 393
Mary Esther Boulevard Minor 4 Divided 4 4.6 0.87 Urbanized (D) 5105 18,100 2002 19,100 D (D) 1,019 D
US98/ SR 30 to Arterial 28,200 2003 20,500 D 1,500 1,094 D
Anchors Street 2004 21,000 D 1,120 D
2005 23,000 D 1,227 D
2006 22,500 D 1,200 D
2007 18,200 D 971 D
2008 19,900 D 1,062 D
2009 18,100 D 966 D
2014 20,000 D 1,067 D
Roadway ID 57110028 2019 22,100 D 1,179 D
Mary Esther Boulevard Minor 4 Divided 5 5.17 0.968 Urbanized (D) 1708 23,500 2002 32,250 F (D) 1,721 F
Anchors Street to SR 189/ Arterial 28,200 5098 31,000 2003 33,250 F 1,500 1,774 F
Beal Parkway 2004 34,000 F 1,814 F
2005 37,000 F 1,974 F
2006 36,500 F 1,947 F
2007 34,000 F 1,814 F
Roadway ID 57110028 2008 26,750 D 1,427 D
2009 27,250 D 1,454 D
2014 30,100 E 1,606 E
2019 33,200 F 1,771 F
SR 397
Eglin Boulevard Minor 4 Divided 0 0 0.71 Urbanized (D) 190 11,500 2002 18,300 B (D) 946 B
SR85 to Eglin West Gate Arterial 64,300 2003 13,300 B 3,320 688 B
2004 12,500 B 646 B
2005 12,800 B 662 B
2006 12,200 B 631 B
2007 12,700 B 657 B
2008 11,200 B 579 B
2009 11,500 B 595 B
2014 12,700 B 657 B
Roadway ID 57040026 2019 14,000 B 724 B
Updated 2010, using 2009 FDOT Generalized Q / LOS Tables. LOS Standards and Max Allowable Volumes are based on those established for State Roadways.
Not To Be Used For Concurrency Management Purposes. Prepared for the FY 2010/11 Transportation Planning Organization Congestion Management Process.
E" following the count indicates an 'estimated count. "T" following the Count Station number indicated a Telemetered Traffic Monitoring Site. These Tables Are For General Planning Purposes Only.
Backlogged Facility
Okaloosa County, State Roads
20

TOTAL SIG SEG. LOS (STD) FDOT PK HR. / PK DIR.
STATE ROAD FUNC. NO. FACILITY # OF PER LTH LOS & COUNT 2009 ANALYSIS AADT AADT LOS STD/
AND SEGMENT CLASS LNS. TYPE SIG. MI. (MI.) AREA MAX VOL STA # AADT YEAR VOLUME LOS MAX VOL VOLUME LOS
CONGESTION MANAGEMENT PROCESS 2010 LEVEL OF SERVICE ANALYSIS - OKALOOSA COUNTY STATE ROADS
AADT
SR 397 (cont.)
John Sims Parkway Principal 4 Divided 0 0 1.4 Urbanized (D) 5023 19,300 2002 20,000 B (D) 1,034 B
Eglin Gate to SR190 / Arterial 64,300 5024 18,600 2003 19,900 B 3,320 1,029 B
Broadway Avenue 2004 18,900 B 977 B
2005 18,800 B 972 B
2006 18,900 B 977 B
2007 19,550 B 1,011 B
2008 18,350 B 949 B
2009 18,950 B 980 B
2014 20,900 B 1,081 B
Roadway ID 57040025 2019 23,100 B 1,194 B
SR190 to SR85 Principal 4 Divided 2 2.27 0.88 Urbanized (D) 1505 24,500 2002 23,500 C (D) 1,254 C
Arterial 33,200 2003 24,000 C 1,770 1,280 C
2004 24,500 C 1,307 C
2005 27,000 D 1,440 D
2006 23,500 C 1,254 C
2007 23,000 C 1,227 C
2008 22,000 C 1,174 C
2009 24,500 C 1,307 C
2014 27,100 D 1,446 D
Roadway ID 57040027 2019 29,900 D 1,595 D
Updated 2010, using 2009 FDOT Generalized Q / LOS Tables. LOS Standards and Max Allowable Volumes are based on those established for State Roadways.
Not To Be Used For Concurrency Management Purposes. Prepared for the FY 2010/11 Transportation Planning Organization Congestion Management Process.
E" following the count indicates an 'estimated count. "T" following the Count Station number indicated a Telemetered Traffic Monitoring Site. These Tables Are For General Planning Purposes Only.
Okaloosa County, State Roads
21
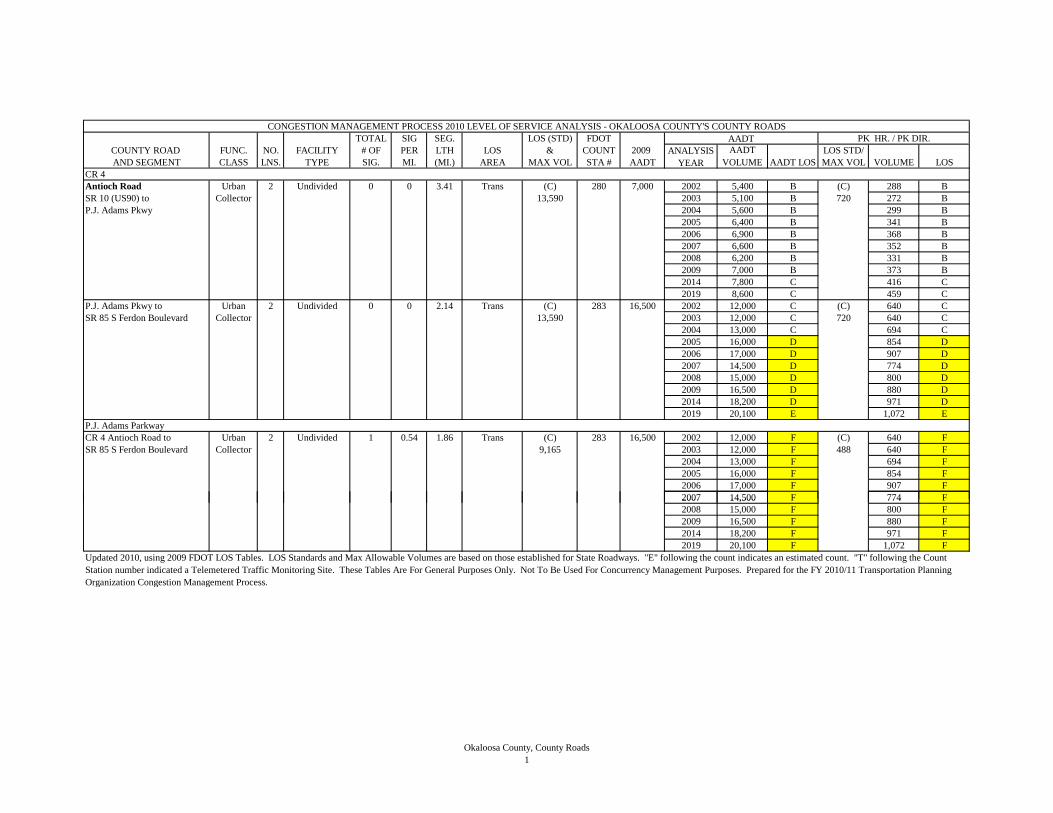
TOTAL SIG SEG. LOS (STD) FDOT PK HR. / PK DIR.COUNTY ROAD FUNC. NO. FACILITY # OF PER LTH LOS & COUNT 2009 LOS STD/AND SEGMENT CLASS LNS. TYPE SIG. MI. (MI.) AREA MAX VOL STA # AADT MAX VOL VOLUME LOS
CR 4 Antioch Road Urban 2 Undivided 0 0 3.41 Trans (C) 280 7,000 2002 5,400 B (C) 288 BSR 10 (US90) to Collector 13,590 2003 5,100 B 720 272 BP.J. Adams Pkwy 2004 5,600 B 299 B
2005 6,400 B 341 B2006 6,900 B 368 B2007 6,600 B 352 B2008 6,200 B 331 B2009 7,000 B 373 B2014 7,800 C 416 C2019 8,600 C 459 C
P.J. Adams Pkwy to Urban 2 Undivided 0 0 2.14 Trans (C) 283 16,500 2002 12,000 C (C) 640 CSR 85 S Ferdon Boulevard Collector 13,590 2003 12,000 C 720 640 C
2004 13,000 C 694 C2005 16,000 D 854 D2006 17,000 D 907 D2007 14,500 D 774 D2008 15,000 D 800 D2009 16,500 D 880 D2014 18,200 D 971 D2019 20,100 E 1,072 E
P.J. Adams ParkwayCR 4 Antioch Road to Urban 2 Undivided 1 0.54 1.86 Trans (C) 283 16,500 2002 12,000 F (C) 640 FSR 85 S Ferdon Boulevard Collector 9,165 2003 12,000 F 488 640 F
2004 13,000 F 694 F2005 16,000 F 854 F2006 17,000 F 907 F2007 14,500 F 774 F
CONGESTION MANAGEMENT PROCESS 2010 LEVEL OF SERVICE ANALYSIS - OKALOOSA COUNTY'S COUNTY ROADS
AADT VOLUME AADT LOS
AADTANALYSIS
YEAR
2007 14,500 F 774 F2008 15,000 F 800 F2009 16,500 F 880 F2014 18,200 F 971 F2019 20,100 F 1,072 F
Updated 2010, using 2009 FDOT LOS Tables. LOS Standards and Max Allowable Volumes are based on those established for State Roadways. "E" following the count indicates an estimated count. "T" following the Count Station number indicated a Telemetered Traffic Monitoring Site. These Tables Are For General Purposes Only. Not To Be Used For Concurrency Management Purposes. Prepared for the FY 2010/11 Transportation Planning Organization Congestion Management Process.
Okaloosa County, County Roads1

TOTAL SIG SEG. LOS (STD) FDOT PK HR. / PK DIR.COUNTY ROAD FUNC. NO. FACILITY # OF PER LTH LOS & COUNT 2009 LOS STD/AND SEGMENT CLASS LNS. TYPE SIG. MI. (MI.) AREA MAX VOL STA # AADT MAX VOL VOLUME LOS
CONGESTION MANAGEMENT PROCESS 2010 LEVEL OF SERVICE ANALYSIS - OKALOOSA COUNTY'S COUNTY ROADS
AADT VOLUME AADT LOS
AADTANALYSIS
YEARCR 20Hill Avenue Minor 2 Undivided 1 1.25 .8 Urbanized (D) 5142 15,500 2002 18,750 F (D) 1,000 FHollywood Boulevard Arterial 10,725 5097 18,000 2003 19,000 F 572 1,014 Fto Lovejoy Road 2004 19,500 F 1,040 F
2005 21,500 F 1,147 F2006 21,500 F 1,147 F2007 19,750 F 1,054 F2008 18,250 F 974 F2009 16,750 F 894 F2014 18,500 F 987 F2019 20,400 F 1,088 F
Martin Luther Minor 3 Undivided 0 0.00 0.16 Urbanized (D) 5141 26,000 2002 29,250 F (D) 1,512 FKing Jr. Boulevard Arterial 21,645 5101 24,500 2003 28,750 F 1,112 1,486 FLovejoy Road to 2004 29,500 F 1,525 FAjax Drive 2005 28,800 F 1,489 F
2006 27,250 F 1,409 F2007 28,750 F 1,486 F2008 26,500 E 1,370 E2009 25,250 E 1,305 E2014 27,900 F 1,442 F2019 30,800 F 1,592 F
Ajax Drive to Minor 4 Divided 1 0.50 2.02 Urbanized (D) 5141 26,000 2002 29,250 F (D) 1,512 FHurlburt Field Road Arterial 23,855 5101 24,500 2003 28,750 F 1,274 1,486 F
2004 29,500 F 1,525 F2005 28,800 F 1,489 F2006 27,250 F 1,409 F2007 28,750 F 1,486 F2008 26,500 F 1,414 F2008 26,500 F 1,414 F2009 25,250 F 1,347 F2014 27,900 F 1,488 F2019 30,800 F 1,643 F
Updated 2010, using 2009 FDOT LOS Tables. LOS Standards and Max Allowable Volumes are based on those established for State Roadways. "E" following the count indicates an estimated count. "T" following the Count Station number indicated a Telemetered Traffic Monitoring Site. These Tables Are For General Purposes Only. Not To Be Used For Concurrency Management Purposes. Prepared for the FY 2010/11 Transportation Planning Organization Congestion Management Process.
Okaloosa County, County Roads2

TOTAL SIG SEG. LOS (STD) FDOT PK HR. / PK DIR.COUNTY ROAD FUNC. NO. FACILITY # OF PER LTH LOS & COUNT 2009 LOS STD/AND SEGMENT CLASS LNS. TYPE SIG. MI. (MI.) AREA MAX VOL STA # AADT MAX VOL VOLUME LOS
CONGESTION MANAGEMENT PROCESS 2010 LEVEL OF SERVICE ANALYSIS - OKALOOSA COUNTY'S COUNTY ROADS
AADT VOLUME AADT LOS
AADTANALYSIS
YEARMartin Luther Minor 4 Divided 3 2 1.5 Urbanized (D) 5115 20,500 2002 22,000 E (D) 1,174 EKing Jr. Boulevard/ Arterial 21,580 2003 23,500 F 1,151 1,254 FGreen Acres Drive 2004 26,000 F 1,387 FHurlburt Field Road 2005 25,500 F 1,360 Fto SR189 2006 26,500 F 1,414 F
2007 29,500 F 1,574 F2008 26,500 F 1,414 F2009 20,500 D 1,094 D2014 22,600 E 1,206 E2019 25,000 F 1,334 F
CR 30BBenning Drive Urban 2 Undivided 1 2.5 0.4 Urbanized (D) 5135 4,500 2002 3,400 C (D) 181 CUS 98 (SR 30) to Collector 9,880 2003 4,000 C 527 213 CLegion Drive 2004 4,400 C 235 C(Destin) 2005 4,500 C 240 C
2006 4,100 C 219 C2007 4,100 C 219 C2008 4,400 C 235 C2009 4,500 C 240 C2014 5,000 C 267 C2019 5,500 C 293 C
CR 188 Old Bethel Road Urban 2 Undivided 0 0 0.2 Trans (C) 303 5,100 2002 5,700 B (C) 304 BJones Road to CB Drive Collector 13,590 2003 4,700 B 720 251 B
2004 5,100 B 272 B2005 5,600 B 299 B2006 5,600 B 299 B2007 5,000 B 267 B2007 5,000 B 267 B2008 5,000 B 267 B2009 5,100 B 272 B2014 5,600 B 299 B2019 6,200 B 331 B
Updated 2010, using 2009 FDOT LOS Tables. LOS Standards and Max Allowable Volumes are based on those established for State Roadways. "E" following the count indicates an estimated count. "T" following the Count Station number indicated a Telemetered Traffic Monitoring Site. These Tables Are For General Purposes Only. Not To Be Used For Concurrency Management Purposes. Prepared for the FY 2010/11 Transportation Planning Organization Congestion Management Process.
Okaloosa County, County Roads3
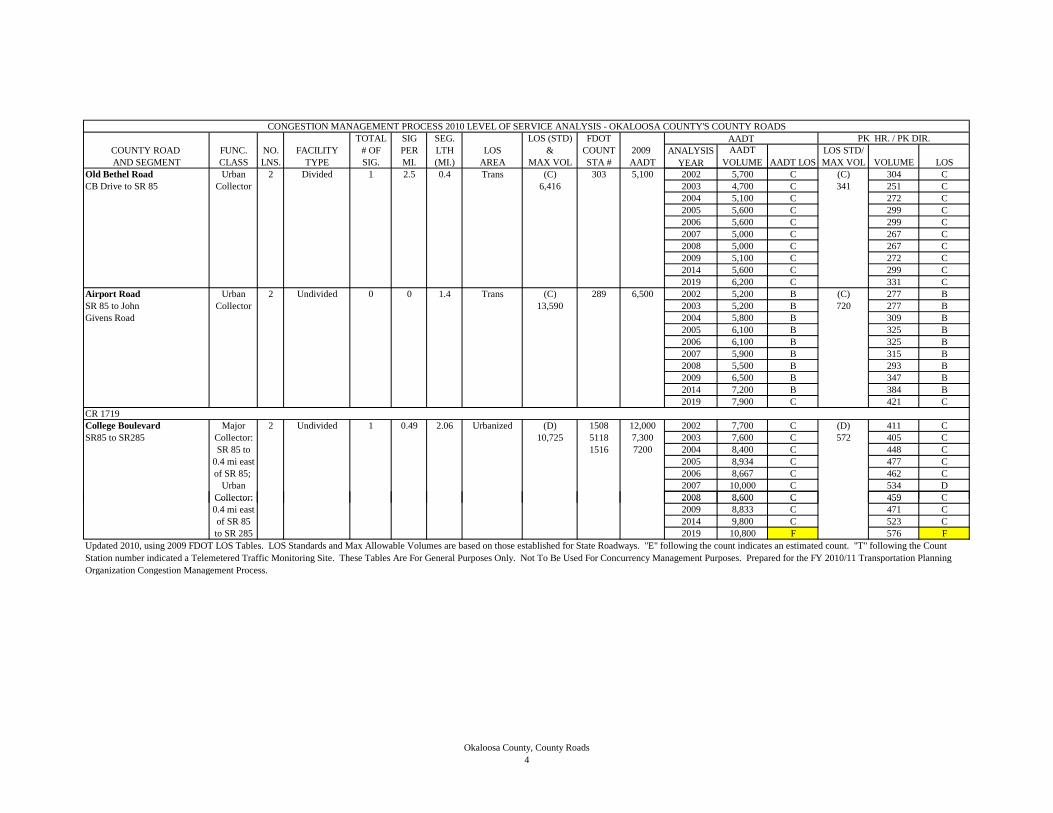
TOTAL SIG SEG. LOS (STD) FDOT PK HR. / PK DIR.COUNTY ROAD FUNC. NO. FACILITY # OF PER LTH LOS & COUNT 2009 LOS STD/AND SEGMENT CLASS LNS. TYPE SIG. MI. (MI.) AREA MAX VOL STA # AADT MAX VOL VOLUME LOS
CONGESTION MANAGEMENT PROCESS 2010 LEVEL OF SERVICE ANALYSIS - OKALOOSA COUNTY'S COUNTY ROADS
AADT VOLUME AADT LOS
AADTANALYSIS
YEAROld Bethel Road Urban 2 Divided 1 2.5 0.4 Trans (C) 303 5,100 2002 5,700 C (C) 304 CCB Drive to SR 85 Collector 6,416 2003 4,700 C 341 251 C
2004 5,100 C 272 C2005 5,600 C 299 C2006 5,600 C 299 C2007 5,000 C 267 C2008 5,000 C 267 C2009 5,100 C 272 C2014 5,600 C 299 C2019 6,200 C 331 C
Airport Road Urban 2 Undivided 0 0 1.4 Trans (C) 289 6,500 2002 5,200 B (C) 277 BSR 85 to John Collector 13,590 2003 5,200 B 720 277 BGivens Road 2004 5,800 B 309 B
2005 6,100 B 325 B2006 6,100 B 325 B2007 5,900 B 315 B2008 5,500 B 293 B2009 6,500 B 347 B2014 7,200 B 384 B2019 7,900 C 421 C
CR 1719College Boulevard Major 2 Undivided 1 0.49 2.06 Urbanized (D) 1508 12,000 2002 7,700 C (D) 411 CSR85 to SR285 Collector: 10,725 5118 7,300 2003 7,600 C 572 405 C
SR 85 to 1516 7200 2004 8,400 C 448 C0.4 mi east 2005 8,934 C 477 Cof SR 85; 2006 8,667 C 462 C
Urban 2007 10,000 C 534 DCollector: 2008 8,600 C 459 CCollector: 2008 8,600 C 459 C0.4 mi east 2009 8,833 C 471 Cof SR 85 2014 9,800 C 523 Cto SR 285 2019 10,800 F 576 F
Updated 2010, using 2009 FDOT LOS Tables. LOS Standards and Max Allowable Volumes are based on those established for State Roadways. "E" following the count indicates an estimated count. "T" following the Count Station number indicated a Telemetered Traffic Monitoring Site. These Tables Are For General Purposes Only. Not To Be Used For Concurrency Management Purposes. Prepared for the FY 2010/11 Transportation Planning Organization Congestion Management Process.
Okaloosa County, County Roads4
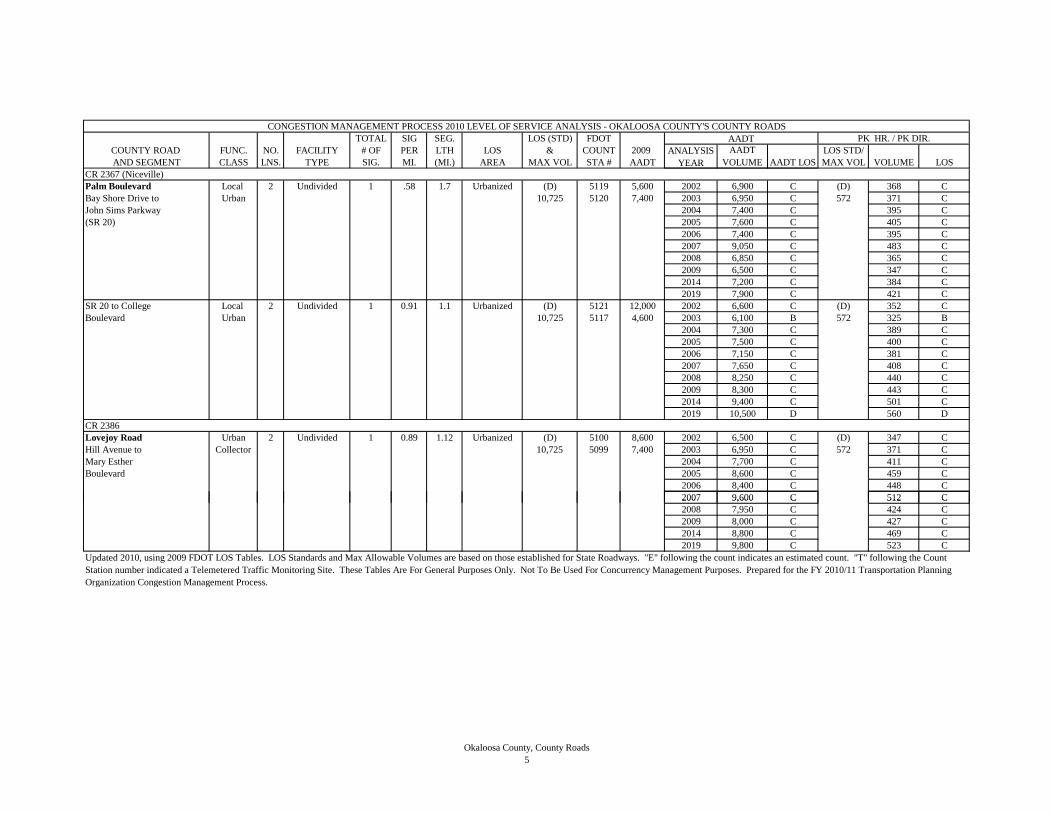
TOTAL SIG SEG. LOS (STD) FDOT PK HR. / PK DIR.COUNTY ROAD FUNC. NO. FACILITY # OF PER LTH LOS & COUNT 2009 LOS STD/AND SEGMENT CLASS LNS. TYPE SIG. MI. (MI.) AREA MAX VOL STA # AADT MAX VOL VOLUME LOS
CONGESTION MANAGEMENT PROCESS 2010 LEVEL OF SERVICE ANALYSIS - OKALOOSA COUNTY'S COUNTY ROADS
AADT VOLUME AADT LOS
AADTANALYSIS
YEARCR 2367 (Niceville)Palm Boulevard Local 2 Undivided 1 .58 1.7 Urbanized (D) 5119 5,600 2002 6,900 C (D) 368 CBay Shore Drive to Urban 10,725 5120 7,400 2003 6,950 C 572 371 CJohn Sims Parkway 2004 7,400 C 395 C(SR 20) 2005 7,600 C 405 C
2006 7,400 C 395 C2007 9,050 C 483 C2008 6,850 C 365 C2009 6,500 C 347 C2014 7,200 C 384 C2019 7,900 C 421 C
SR 20 to College Local 2 Undivided 1 0.91 1.1 Urbanized (D) 5121 12,000 2002 6,600 C (D) 352 CBoulevard Urban 10,725 5117 4,600 2003 6,100 B 572 325 B
2004 7,300 C 389 C2005 7,500 C 400 C2006 7,150 C 381 C2007 7,650 C 408 C2008 8,250 C 440 C2009 8,300 C 443 C2014 9,400 C 501 C2019 10,500 D 560 D
CR 2386Lovejoy Road Urban 2 Undivided 1 0.89 1.12 Urbanized (D) 5100 8,600 2002 6,500 C (D) 347 CHill Avenue to Collector 10,725 5099 7,400 2003 6,950 C 572 371 CMary Esther 2004 7,700 C 411 CBoulevard 2005 8,600 C 459 C
2006 8,400 C 448 C2007 9,600 C 512 C2007 9,600 C 512 C2008 7,950 C 424 C2009 8,000 C 427 C2014 8,800 C 469 C2019 9,800 C 523 C
Updated 2010, using 2009 FDOT LOS Tables. LOS Standards and Max Allowable Volumes are based on those established for State Roadways. "E" following the count indicates an estimated count. "T" following the Count Station number indicated a Telemetered Traffic Monitoring Site. These Tables Are For General Purposes Only. Not To Be Used For Concurrency Management Purposes. Prepared for the FY 2010/11 Transportation Planning Organization Congestion Management Process.
Okaloosa County, County Roads5
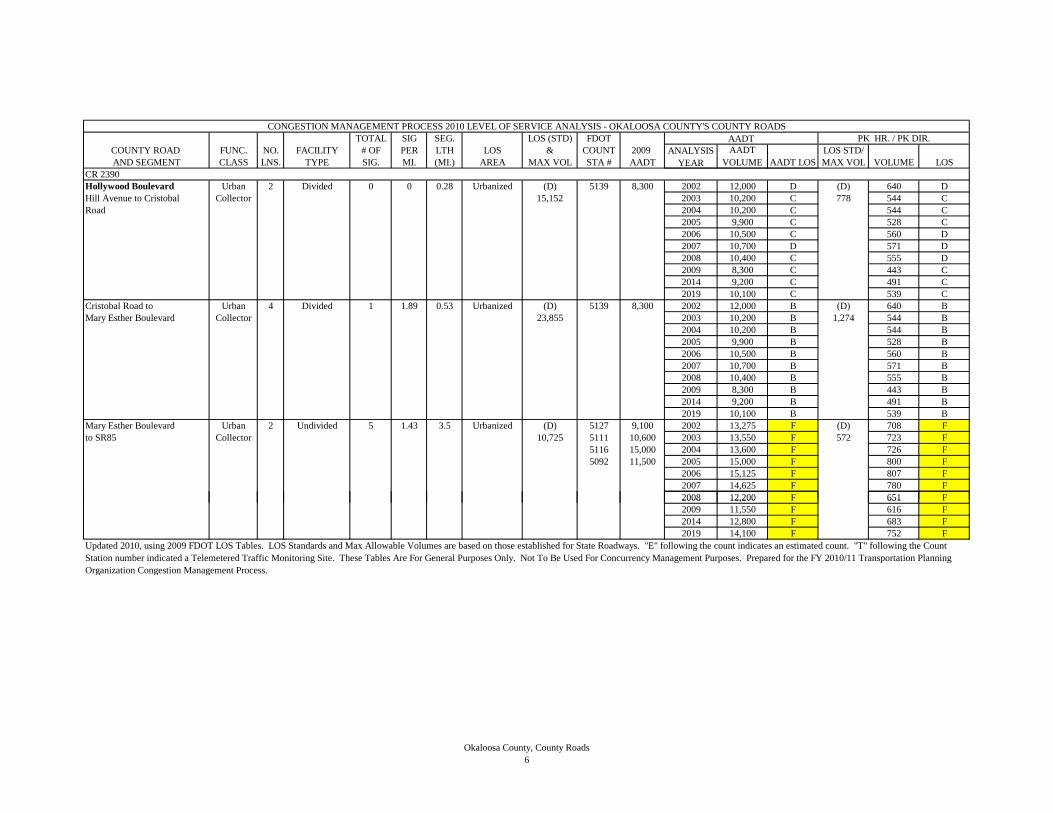
TOTAL SIG SEG. LOS (STD) FDOT PK HR. / PK DIR.COUNTY ROAD FUNC. NO. FACILITY # OF PER LTH LOS & COUNT 2009 LOS STD/AND SEGMENT CLASS LNS. TYPE SIG. MI. (MI.) AREA MAX VOL STA # AADT MAX VOL VOLUME LOS
CONGESTION MANAGEMENT PROCESS 2010 LEVEL OF SERVICE ANALYSIS - OKALOOSA COUNTY'S COUNTY ROADS
AADT VOLUME AADT LOS
AADTANALYSIS
YEARCR 2390Hollywood Boulevard Urban 2 Divided 0 0 0.28 Urbanized (D) 5139 8,300 2002 12,000 D (D) 640 DHill Avenue to Cristobal Collector 15,152 2003 10,200 C 778 544 CRoad 2004 10,200 C 544 C
2005 9,900 C 528 C2006 10,500 C 560 D2007 10,700 D 571 D2008 10,400 C 555 D2009 8,300 C 443 C2014 9,200 C 491 C2019 10,100 C 539 C
Cristobal Road to Urban 4 Divided 1 1.89 0.53 Urbanized (D) 5139 8,300 2002 12,000 B (D) 640 BMary Esther Boulevard Collector 23,855 2003 10,200 B 1,274 544 B
2004 10,200 B 544 B2005 9,900 B 528 B2006 10,500 B 560 B2007 10,700 B 571 B2008 10,400 B 555 B2009 8,300 B 443 B2014 9,200 B 491 B2019 10,100 B 539 B
Mary Esther Boulevard Urban 2 Undivided 5 1.43 3.5 Urbanized (D) 5127 9,100 2002 13,275 F (D) 708 Fto SR85 Collector 10,725 5111 10,600 2003 13,550 F 572 723 F
5116 15,000 2004 13,600 F 726 F5092 11,500 2005 15,000 F 800 F
2006 15,125 F 807 F2007 14,625 F 780 F2008 12,200 F 651 F2008 12,200 F 651 F2009 11,550 F 616 F2014 12,800 F 683 F2019 14,100 F 752 F
Updated 2010, using 2009 FDOT LOS Tables. LOS Standards and Max Allowable Volumes are based on those established for State Roadways. "E" following the count indicates an estimated count. "T" following the Count Station number indicated a Telemetered Traffic Monitoring Site. These Tables Are For General Purposes Only. Not To Be Used For Concurrency Management Purposes. Prepared for the FY 2010/11 Transportation Planning Organization Congestion Management Process.
Okaloosa County, County Roads6
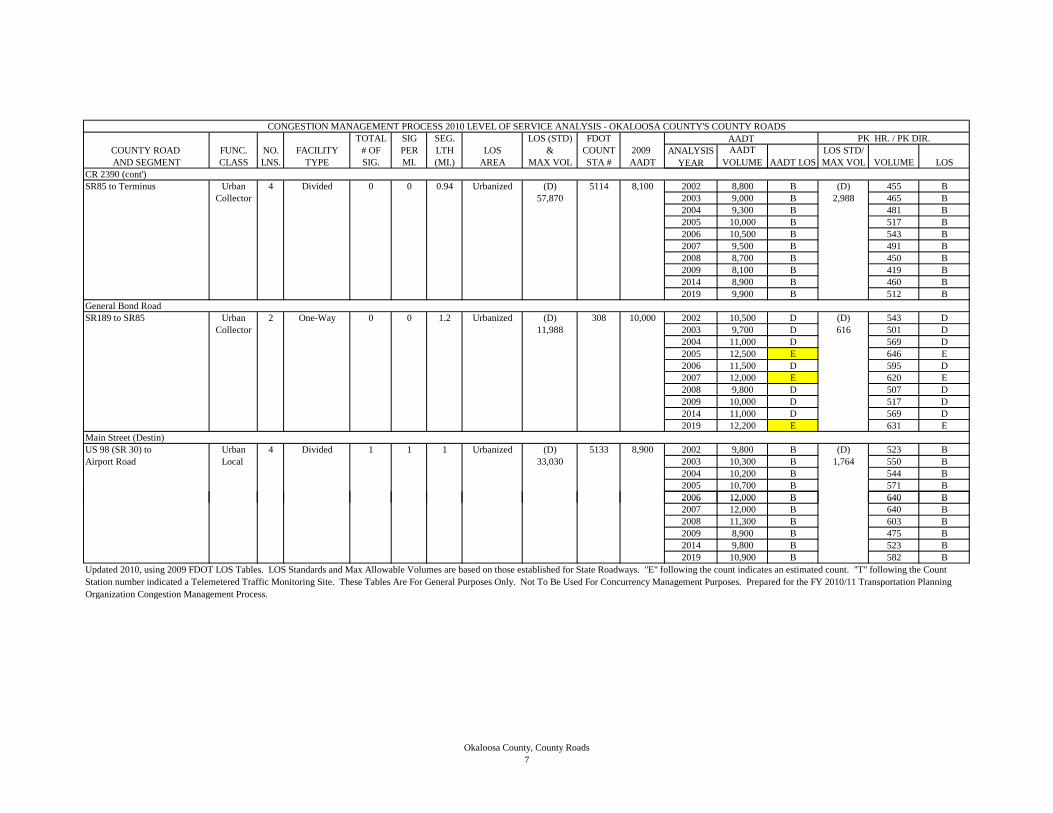
TOTAL SIG SEG. LOS (STD) FDOT PK HR. / PK DIR.COUNTY ROAD FUNC. NO. FACILITY # OF PER LTH LOS & COUNT 2009 LOS STD/AND SEGMENT CLASS LNS. TYPE SIG. MI. (MI.) AREA MAX VOL STA # AADT MAX VOL VOLUME LOS
CONGESTION MANAGEMENT PROCESS 2010 LEVEL OF SERVICE ANALYSIS - OKALOOSA COUNTY'S COUNTY ROADS
AADT VOLUME AADT LOS
AADTANALYSIS
YEARCR 2390 (cont')SR85 to Terminus Urban 4 Divided 0 0 0.94 Urbanized (D) 5114 8,100 2002 8,800 B (D) 455 B
Collector 57,870 2003 9,000 B 2,988 465 B2004 9,300 B 481 B2005 10,000 B 517 B2006 10,500 B 543 B2007 9,500 B 491 B2008 8,700 B 450 B2009 8,100 B 419 B2014 8,900 B 460 B2019 9,900 B 512 B
General Bond RoadSR189 to SR85 Urban 2 One-Way 0 0 1.2 Urbanized (D) 308 10,000 2002 10,500 D (D) 543 D
Collector 11,988 2003 9,700 D 616 501 D2004 11,000 D 569 D2005 12,500 E 646 E2006 11,500 D 595 D2007 12,000 E 620 E2008 9,800 D 507 D2009 10,000 D 517 D2014 11,000 D 569 D2019 12,200 E 631 E
Main Street (Destin)US 98 (SR 30) to Urban 4 Divided 1 1 1 Urbanized (D) 5133 8,900 2002 9,800 B (D) 523 BAirport Road Local 33,030 2003 10,300 B 1,764 550 B
2004 10,200 B 544 B2005 10,700 B 571 B2006 12,000 B 640 B2006 12,000 B 640 B2007 12,000 B 640 B2008 11,300 B 603 B2009 8,900 B 475 B2014 9,800 B 523 B2019 10,900 B 582 B
Updated 2010, using 2009 FDOT LOS Tables. LOS Standards and Max Allowable Volumes are based on those established for State Roadways. "E" following the count indicates an estimated count. "T" following the Count Station number indicated a Telemetered Traffic Monitoring Site. These Tables Are For General Purposes Only. Not To Be Used For Concurrency Management Purposes. Prepared for the FY 2010/11 Transportation Planning Organization Congestion Management Process.
Okaloosa County, County Roads7
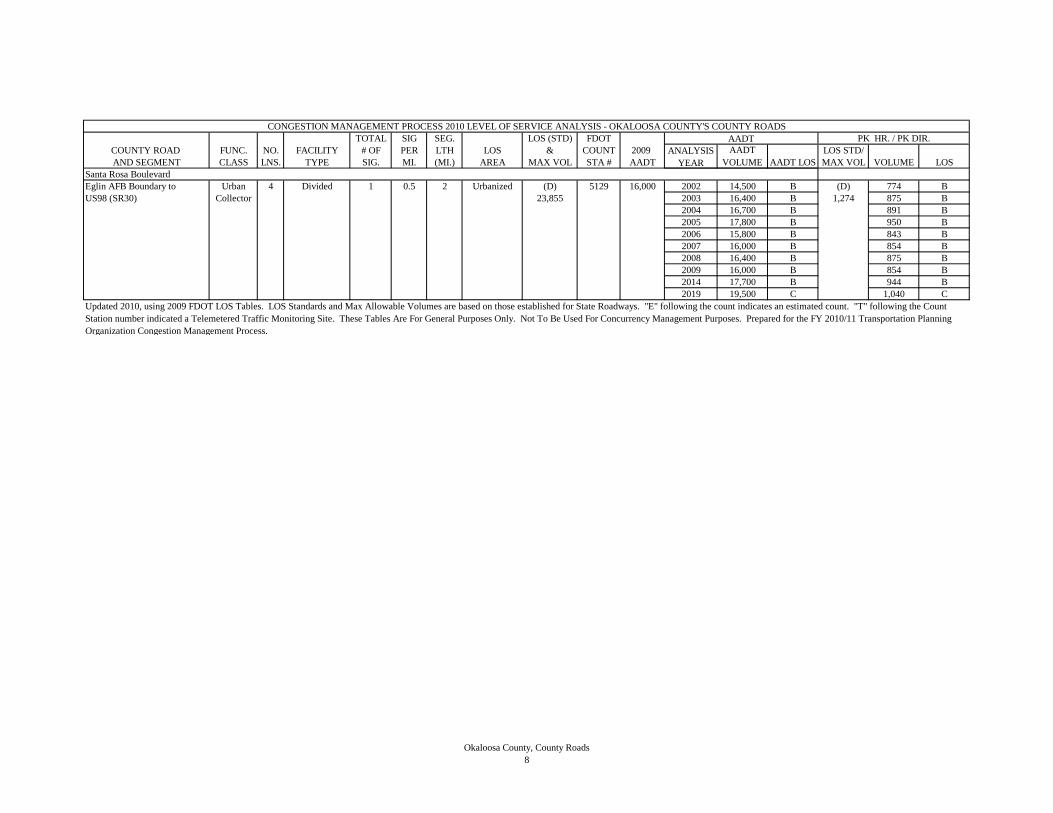
TOTAL SIG SEG. LOS (STD) FDOT PK HR. / PK DIR.COUNTY ROAD FUNC. NO. FACILITY # OF PER LTH LOS & COUNT 2009 LOS STD/AND SEGMENT CLASS LNS. TYPE SIG. MI. (MI.) AREA MAX VOL STA # AADT MAX VOL VOLUME LOS
CONGESTION MANAGEMENT PROCESS 2010 LEVEL OF SERVICE ANALYSIS - OKALOOSA COUNTY'S COUNTY ROADS
AADT VOLUME AADT LOS
AADTANALYSIS
YEARSanta Rosa BoulevardEglin AFB Boundary to Urban 4 Divided 1 0.5 2 Urbanized (D) 5129 16,000 2002 14,500 B (D) 774 BUS98 (SR30) Collector 23,855 2003 16,400 B 1,274 875 B
2004 16,700 B 891 B2005 17,800 B 950 B2006 15,800 B 843 B2007 16,000 B 854 B2008 16,400 B 875 B2009 16,000 B 854 B2014 17,700 B 944 B2019 19,500 C 1,040 C
Updated 2010, using 2009 FDOT LOS Tables. LOS Standards and Max Allowable Volumes are based on those established for State Roadways. "E" following the count indicates an estimated count. "T" following the Count Station number indicated a Telemetered Traffic Monitoring Site. These Tables Are For General Purposes Only. Not To Be Used For Concurrency Management Purposes. Prepared for the FY 2010/11 Transportation Planning Organization Congestion Management Process.
Okaloosa County, County Roads8

TOTAL SIG SEG. LOS (STD) FDOT PK HR. / PK DIR.
STATE ROAD FUNC. NO. FACILITY # OF PER LTH LOS & COUNT 2009 ANALYSIS AADT AADT LOS STD/
AND SEGMENT CLASS LNS. TYPE SIG. MI. (MI.) AREA MAX VOL STA # AADT YEAR VOLUME LOS MAX VOL VOLUME LOS
SR 8 (I-10)
Okaloosa County Line Principal 4 Divided 0 0 2.471 Trans (C) 2004 17,000 2002 15,600 B (C) 807 B
to SR 285 Arterial 57,600 (Oka. Co. 2003 16,800 B 2,980 869 B
Count 2004 19,800 B 1,024 B
Station) 2005 18,600 B 962 B
2006 17,600 B 910 B
Roadway ID 60002000 2007 18,900 B 977 B
Segment is on the Strategic Intermodal System 2008 18,300 B 946 B
2009 17,000 B 879 B
2014 18,769 B 970 B
2019 20,723 B 1,071 B
SR 285 to SR 83 (US 331) Principal 4 Divided 0 0 15.1 Trans (C) 9928 T 18,812 2002 19,116 B (C) 988 B
Arterial 57,600 2003 20,000 B 2,980 1,034 B
2004 20,112 B 1,040 B
2005 19,900 B 1,029 B
2006 19,717 B 1,019 B
Roadway ID 60002000 2007 19,802 B 1,024 B
Segment is on the Strategic Intermodal System 2008 19,100 B 987 B
2009 18,812 B 973 B
2014 20,770 B 1,074 B
2019 22,932 B 1,186 B
SR 83 (US 331) to the Principal 4 Divided 0 0 3.04 Trans (C) 287 T 19,335 2002 18,637 B (C) 964 B
OK-WL MPA Boundary Arterial 57,600 2003 19,334 B 2,980 1,000 B
(east of County 2004 19,919 B 1,030 B
Highway 280) 2005 20,200 B 1,044 B
2006 19,818 B 1,025 B
Roadway ID 60002000 2007 19,799 B 1,024 B
Segment is on the Strategic Intermodal System 2008 19,100 B 987 B
2009 19,335 B 1,000 B
2014 21,347 B 1,104 B
2019 23,569 B 1,219 B
Updated 2010, using 2009 FDOT Generalized Q / LOS Tables. LOS Standards and Max Allowable Volumes are based on those established for State Roadways.
Not To Be Used For Concurrency Management Purposes. Prepared for the FY 2010/11 Transportation Planning Organization Congestion Management System.
AADT
E" following the count indicates an 'estimated count. "T" following the Count Station number indicated a Telemetered Traffic Monitoring Site. These Tables Are For General Planning Purposes Only.
CONGESTION MANAGEMENT PROCESS 2010 LEVEL OF SERVICE ANALYSIS - WALTON COUNTY'S STATE ROADS
Walton County, State Roads
1

TOTAL SIG SEG. LOS (STD) FDOT PK HR. / PK DIR.
STATE ROAD FUNC. NO. FACILITY # OF PER LTH LOS & COUNT 2009 ANALYSIS AADT AADT LOS STD/
AND SEGMENT CLASS LNS. TYPE SIG. MI. (MI.) AREA MAX VOL STA # AADT YEAR VOLUME LOS MAX VOL VOLUME LOS
AADT
CONGESTION MANAGEMENT PROCESS 2010 LEVEL OF SERVICE ANALYSIS - WALTON COUNTY'S STATE ROADS
SR 8 (I-10) (cont.)
OK-WL MPA Boundary Principal 4 Divided 0 0 6.85 Rural (B) 287 T 19,335 2002 18,637 B (B) 1,056 B
(east of County Arterial Undev 37,100 2003 19,334 B 2,100 1,095 B
Highway 280) to the 2004 19,919 B 1,128 B
Holmes County Line 2005 20,200 B 1,144 B
2006 19,818 B 1,123 B
Roadway ID 60002000 2007 19,799 B 1,122 B
Segment is on the Strategic Intermodal System 2008 19,100 B 1,082 B
2009 19,335 B 1,095 B
2014 21,347 B 1,209 B
2019 23,569 B 1,335 B
SR10 (US90)
Okaloosa County Line Minor 2 Undivided 0 0 2.688 Trans (C) 6 6,100 2002 4,100 B (C) 219 B
to SR 285 Arterial 15,100 124 NA 2003 4,450 B 800 237 B
2004 4,950 B 264 B
2005 5,450 B 291 B
2006 5,450 B 291 B
2007 6,600 B 352 B
2008 6,200 B 331 B
2009 6,100 B 325 B
2014 8,163 C 436 C
Roadway ID 60010000 2019 10,924 C 583 C
SR 285 to SR 187 / US 331 Minor 2 Undivided 1 0.080 12.17 Trans (C) 101 7,200 2002 7,200 B (C) 384 B
Arterial 14,100 6 6,100 2003 6,350 B 750 339 B
2004 6,950 B 371 B
2005 7,300 B 389 B
2006 6,950 B 371 B
2007 7,750 B 413 B
2008 6,850 B 365 B
2009 6,650 B 355 B
2014 7,342 B 392 B
Roadway ID 60010000 2019 8,106 B 432 B
Updated 2010, using 2009 FDOT Generalized Q / LOS Tables. LOS Standards and Max Allowable Volumes are based on those established for State Roadways.
Not To Be Used For Concurrency Management Purposes. Prepared for the FY 2010/11 Transportation Planning Organization Congestion Management System.
E" following the count indicates an 'estimated count. "T" following the Count Station number indicated a Telemetered Traffic Monitoring Site. These Tables Are For General Planning Purposes Only.
Walton County, State Roads
2

TOTAL SIG SEG. LOS (STD) FDOT PK HR. / PK DIR.
STATE ROAD FUNC. NO. FACILITY # OF PER LTH LOS & COUNT 2009 ANALYSIS AADT AADT LOS STD/
AND SEGMENT CLASS LNS. TYPE SIG. MI. (MI.) AREA MAX VOL STA # AADT YEAR VOLUME LOS MAX VOL VOLUME LOS
AADT
CONGESTION MANAGEMENT PROCESS 2010 LEVEL OF SERVICE ANALYSIS - WALTON COUNTY'S STATE ROADS
SR10 (US90) (cont.)
SR 187 / US331 to Minor 4 Divided 2 0.673 2.97 Trans (C) 1502 8,700 2002 10,100 B (C) 539 B
Baldwin Avenue Arterial 32,100 1504 12,200 2003 10,360 B 1,710 553 B
5006 14,300 2004 10,760 B 574 B
5007 NA 2005 12,000 B 640 B
5008 6,600 2006 12,875 B 687 B
Roadway ID 60010000 2007 11,350 B 606 B
Segment is undivided from 5th Street to Baldwin Avenue 2008 12,050 B 643 B
2009 10,450 B 558 B
2014 12,700 B 678 B
2019 13,500 B 720 B
Baldwin Avenue to the Minor 2 Undivided 0 0 2.1 Trans (C) 1501 5,600 2002 5,150 B (C) 275 B
OK-WL MPA Boundary Arterial 15,100 10 3,200 2003 3,600 B 800 192 B
(County Highway 183) 5009 6,700 2004 4,500 B 240 B
2005 4,750 B 253 B
2006 5,933 B 317 B
2007 5,867 B 313 B
2008 5,333 B 285 B
2009 5,167 B 276 B
2014 6,400 B 341 B
Roadway ID 60010000 2019 7,300 B 389 B
OK-WL MPA Boundary Minor 2 Undivided 0 0 2.15 Rural (C) 10 3,200 2002 4,400 B (C) 242 B
(County Highway 183) Arterial Developed 14,200 2003 3,400 B 780 187 B
to the Holmes County 2004 3,600 B 198 B
Line 2005 3,800 B 209 B
2006 4,000 B 220 B
2007 3,700 B 204 B
2008 3,400 B 187 B
2009 3,200 B 176 B
2014 3,533 B 194 B
Roadway ID 60010000 2019 3,901 B 215 B
Updated 2010, using 2009 FDOT Generalized Q / LOS Tables. LOS Standards and Max Allowable Volumes are based on those established for State Roadways.
Not To Be Used For Concurrency Management Purposes. Prepared for the FY 2010/11 Transportation Planning Organization Congestion Management System.
E" following the count indicates an 'estimated count. "T" following the Count Station number indicated a Telemetered Traffic Monitoring Site. These Tables Are For General Planning Purposes Only.
Walton County, State Roads
3
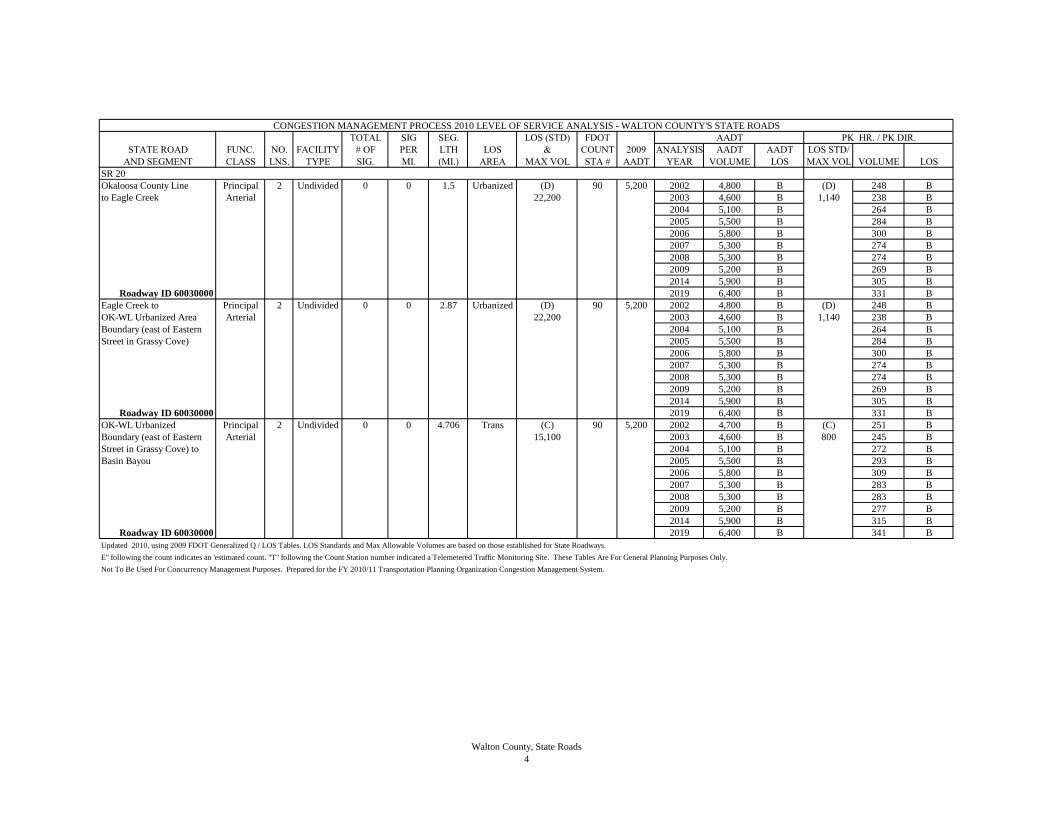
TOTAL SIG SEG. LOS (STD) FDOT PK HR. / PK DIR.
STATE ROAD FUNC. NO. FACILITY # OF PER LTH LOS & COUNT 2009 ANALYSIS AADT AADT LOS STD/
AND SEGMENT CLASS LNS. TYPE SIG. MI. (MI.) AREA MAX VOL STA # AADT YEAR VOLUME LOS MAX VOL VOLUME LOS
AADT
CONGESTION MANAGEMENT PROCESS 2010 LEVEL OF SERVICE ANALYSIS - WALTON COUNTY'S STATE ROADS
SR 20
Okaloosa County Line Principal 2 Undivided 0 0 1.5 Urbanized (D) 90 5,200 2002 4,800 B (D) 248 B
to Eagle Creek Arterial 22,200 2003 4,600 B 1,140 238 B
2004 5,100 B 264 B
2005 5,500 B 284 B
2006 5,800 B 300 B
2007 5,300 B 274 B
2008 5,300 B 274 B
2009 5,200 B 269 B
2014 5,900 B 305 B
Roadway ID 60030000 2019 6,400 B 331 B
Eagle Creek to Principal 2 Undivided 0 0 2.87 Urbanized (D) 90 5,200 2002 4,800 B (D) 248 B
OK-WL Urbanized Area Arterial 22,200 2003 4,600 B 1,140 238 B
Boundary (east of Eastern 2004 5,100 B 264 B
Street in Grassy Cove) 2005 5,500 B 284 B
2006 5,800 B 300 B
2007 5,300 B 274 B
2008 5,300 B 274 B
2009 5,200 B 269 B
2014 5,900 B 305 B
Roadway ID 60030000 2019 6,400 B 331 B
OK-WL Urbanized Principal 2 Undivided 0 0 4.706 Trans (C) 90 5,200 2002 4,700 B (C) 251 B
Boundary (east of Eastern Arterial 15,100 2003 4,600 B 800 245 B
Street in Grassy Cove) to 2004 5,100 B 272 B
Basin Bayou 2005 5,500 B 293 B
2006 5,800 B 309 B
2007 5,300 B 283 B
2008 5,300 B 283 B
2009 5,200 B 277 B
2014 5,900 B 315 B
Roadway ID 60030000 2019 6,400 B 341 B
Updated 2010, using 2009 FDOT Generalized Q / LOS Tables. LOS Standards and Max Allowable Volumes are based on those established for State Roadways.
Not To Be Used For Concurrency Management Purposes. Prepared for the FY 2010/11 Transportation Planning Organization Congestion Management System.
E" following the count indicates an 'estimated count. "T" following the Count Station number indicated a Telemetered Traffic Monitoring Site. These Tables Are For General Planning Purposes Only.
Walton County, State Roads
4

TOTAL SIG SEG. LOS (STD) FDOT PK HR. / PK DIR.
STATE ROAD FUNC. NO. FACILITY # OF PER LTH LOS & COUNT 2009 ANALYSIS AADT AADT LOS STD/
AND SEGMENT CLASS LNS. TYPE SIG. MI. (MI.) AREA MAX VOL STA # AADT YEAR VOLUME LOS MAX VOL VOLUME LOS
AADT
CONGESTION MANAGEMENT PROCESS 2010 LEVEL OF SERVICE ANALYSIS - WALTON COUNTY'S STATE ROADS
SR 20 (cont.)
Basin Bayou to CR 83A Principal 2 Undivided 0 0 5.554 Trans (C) 89 4,700 2002 4,600 B (C) 245 B
west end Arterial 15,100 2003 4,000 B 800 213 B
2004 5,300 B 283 B
2005 5,500 B 293 B
2006 5,400 B 288 B
2007 5,000 B 267 B
2008 4,200 B 224 B
2009 4,700 B 251 B
2014 5,189 B 277 B
Roadway ID 60030000 2019 5,729 B 306 B
CR 83A west end Principal 2 Undivided 1 0.474 2.108 Trans (C) 89 4,700 2002 4,600 B (C) 245 B
to US 331N / Arterial 14,100 2003 4,000 B 750 213 B
North Madison Street 2004 5,300 B 283 B
2005 5,500 B 293 B
2006 5,400 B 288 B
2007 5,000 B 267 B
2008 4,200 B 224 B
2009 4,700 B 251 B
2014 5,189 B 277 B
Roadway ID 60030000 2019 5,729 B 306 B
US 331N / Principal 2 Undivided 1 0.999 1.001 Trans (C) 107 7,400 2002 17,100 F (C) 912 F
Madison Street to Arterial 14,100 2003 10,300 C 750 550 C
US 331S / SR 83 2004 12,600 C 672 C
2005 14,700 D 784 D
2006 13,600 C 726 C
2007 13,800 C 736 C
2008 8,000 B 427 B
2009 7,400 B 395 B
2014 8,170 B 436 B
Roadway ID 60030000 2019 9,021 C 481 C
Updated 2010, using 2009 FDOT Generalized Q / LOS Tables. LOS Standards and Max Allowable Volumes are based on those established for State Roadways.
Not To Be Used For Concurrency Management Purposes. Prepared for the FY 2010/11 Transportation Planning Organization Congestion Management System.
E" following the count indicates an 'estimated count. "T" following the Count Station number indicated a Telemetered Traffic Monitoring Site. These Tables Are For General Planning Purposes Only.
Walton County, State Roads
5

TOTAL SIG SEG. LOS (STD) FDOT PK HR. / PK DIR.
STATE ROAD FUNC. NO. FACILITY # OF PER LTH LOS & COUNT 2009 ANALYSIS AADT AADT LOS STD/
AND SEGMENT CLASS LNS. TYPE SIG. MI. (MI.) AREA MAX VOL STA # AADT YEAR VOLUME LOS MAX VOL VOLUME LOS
AADT
CONGESTION MANAGEMENT PROCESS 2010 LEVEL OF SERVICE ANALYSIS - WALTON COUNTY'S STATE ROADS
SR 20 (cont.)
US 331S / SR 83 to the Principal 2 Undivided 0 0 14.25 Trans (C) 69 4,800 2002 5,100 B (C) 272 B
Washington County Line Arterial 15,100 2003 4,800 B 800 256 B
(OK-WL MPA Boundary) 2004 5,000 B 267 B
2005 5,100 B 272 B
2006 5,000 B 267 B
2007 4,600 B 245 B
2008 4,800 B 256 B
2009 4,800 B 256 B
2014 5,300 B 283 B
Roadway ID 60030000 2019 5,851 B 312 B
SR 30 (US 98)
Okaloosa County line Principal 4 Divided 4 1.263 3.168 Urbanized (C) 168 T 43,850 2002 40,045 F (C) 2,136 F
to Old US 98 / SR 30 Arterial 35,500 2003 44,200 F 1,890 2,358 F
2004 45,983 F 2,453 F
2005 47,400 F 2,529 F
2006 47,408 F 2,529 F
Roadway ID 60020001 2007 48,281 F 2,576 F
Segment is on the Strategic Intermodal System 2008 47,000 F 2,507 F
2009 43,850 F 2,339 F
2014 50,400 F 2,689 F
2019 53,300 F 2,844 F
Old 98 / SR 30/ Gulf Principal 6 Divided 3 1.124 2.67 Urbanized (C) 253 39,000 2002 34,000 B (C) 1,814 B
Pines to Mack Bayou Arterial 53,700 2003 33,000 B 2,860 1,761 B
Road 2004 35,000 B 1,867 B
2005 43,500 B 2,321 B
2006 44,500 B 2,374 B
Roadway ID 60020000 2007 45,000 B 2,401 C
Segment is on the Strategic Intermodal System 2008 44,000 B 2,347 B
2009 39,000 B 2,081 B
2014 52,000 C 2,774 C
2019 59,200 F 3,158 F
Updated 2010, using 2009 FDOT Generalized Q / LOS Tables. LOS Standards and Max Allowable Volumes are based on those established for State Roadways.
Not To Be Used For Concurrency Management Purposes. Prepared for the FY 2010/11 Transportation Planning Organization Congestion Management System.
E" following the count indicates an 'estimated count. "T" following the Count Station number indicated a Telemetered Traffic Monitoring Site. These Tables Are For General Planning Purposes Only.
Walton County, State Roads
6
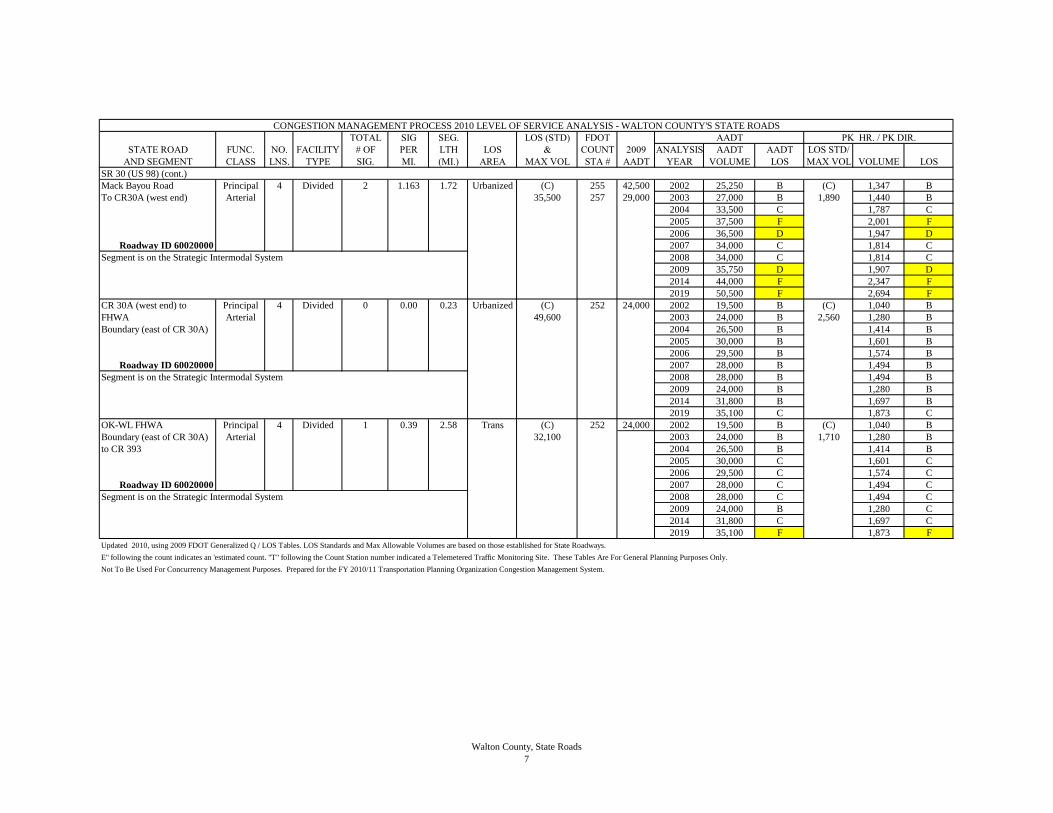
TOTAL SIG SEG. LOS (STD) FDOT PK HR. / PK DIR.
STATE ROAD FUNC. NO. FACILITY # OF PER LTH LOS & COUNT 2009 ANALYSIS AADT AADT LOS STD/
AND SEGMENT CLASS LNS. TYPE SIG. MI. (MI.) AREA MAX VOL STA # AADT YEAR VOLUME LOS MAX VOL VOLUME LOS
AADT
CONGESTION MANAGEMENT PROCESS 2010 LEVEL OF SERVICE ANALYSIS - WALTON COUNTY'S STATE ROADS
SR 30 (US 98) (cont.)
Mack Bayou Road Principal 4 Divided 2 1.163 1.72 Urbanized (C) 255 42,500 2002 25,250 B (C) 1,347 B
To CR30A (west end) Arterial 35,500 257 29,000 2003 27,000 B 1,890 1,440 B
2004 33,500 C 1,787 C
2005 37,500 F 2,001 F
2006 36,500 D 1,947 D
Roadway ID 60020000 2007 34,000 C 1,814 C
Segment is on the Strategic Intermodal System 2008 34,000 C 1,814 C
2009 35,750 D 1,907 D
2014 44,000 F 2,347 F
2019 50,500 F 2,694 F
CR 30A (west end) to Principal 4 Divided 0 0.00 0.23 Urbanized (C) 252 24,000 2002 19,500 B (C) 1,040 B
FHWA Arterial 49,600 2003 24,000 B 2,560 1,280 B
Boundary (east of CR 30A) 2004 26,500 B 1,414 B
2005 30,000 B 1,601 B
2006 29,500 B 1,574 B
Roadway ID 60020000 2007 28,000 B 1,494 B
Segment is on the Strategic Intermodal System 2008 28,000 B 1,494 B
2009 24,000 B 1,280 B
2014 31,800 B 1,697 B
2019 35,100 C 1,873 C
OK-WL FHWA Principal 4 Divided 1 0.39 2.58 Trans (C) 252 24,000 2002 19,500 B (C) 1,040 B
Boundary (east of CR 30A) Arterial 32,100 2003 24,000 B 1,710 1,280 B
to CR 393 2004 26,500 B 1,414 B
2005 30,000 C 1,601 C
2006 29,500 C 1,574 C
Roadway ID 60020000 2007 28,000 C 1,494 C
Segment is on the Strategic Intermodal System 2008 28,000 C 1,494 C
2009 24,000 B 1,280 C
2014 31,800 C 1,697 C
2019 35,100 F 1,873 F
Updated 2010, using 2009 FDOT Generalized Q / LOS Tables. LOS Standards and Max Allowable Volumes are based on those established for State Roadways.
Not To Be Used For Concurrency Management Purposes. Prepared for the FY 2010/11 Transportation Planning Organization Congestion Management System.
E" following the count indicates an 'estimated count. "T" following the Count Station number indicated a Telemetered Traffic Monitoring Site. These Tables Are For General Planning Purposes Only.
Walton County, State Roads
7

TOTAL SIG SEG. LOS (STD) FDOT PK HR. / PK DIR.
STATE ROAD FUNC. NO. FACILITY # OF PER LTH LOS & COUNT 2009 ANALYSIS AADT AADT LOS STD/
AND SEGMENT CLASS LNS. TYPE SIG. MI. (MI.) AREA MAX VOL STA # AADT YEAR VOLUME LOS MAX VOL VOLUME LOS
AADT
CONGESTION MANAGEMENT PROCESS 2010 LEVEL OF SERVICE ANALYSIS - WALTON COUNTY'S STATE ROADS
SR 30 (US 98) (cont.)
CR 393 to US 331 / Principal 4 Divided 1 0.335 2.984 Trans (C) 261 21,500 2002 15,400 B (C) 822 B
SR 83 Arterial 32,100 2003 17,000 B 1,710 907 B
2004 22,500 B 1,200 B
2005 23,000 B 1,227 B
2006 23,000 B 1,227 B
Roadway ID 60020000 2007 24,500 B 1,307 B
Segment is on the Strategic Intermodal System 2008 23,000 B 1,227 B
2009 21,500 B 1,147 B
2014 29,200 C 1,558 C
2019 33,900 F 1,809 F
US 331/SR 83 to CR 395 Principal 4 Divided 2 0.642 3.115 Trans. (C) 141 19,000 2002 12,500 B (C) 667 B
Arterial 32,100 265 14,300 2003 13,600 B 1,710 726 B
2004 18,150 B 968 B
2005 19,400 B 1,035 B
2006 20,000 B 1,067 B
Roadway ID 60020000 2007 18,950 B 1,011 B
Segment is on the Strategic Intermodal System 2008 17,950 B 958 B
2009 16,650 B 888 B
2014 22,700 B 1,211 B
2019 25,900 B 1,382 B
CR 395 to the Bay County Principal 4 Divided 0 0 8.06 Trans. (C) 270 10,200 2002 10,200 B (C) 544 B
Urbanized Area Boundary Arterial 45,400 265 14,300 2003 9,600 B 2,420 512 B
(Side Camp Road) 2004 13,150 B 702 B
2005 14,150 B 755 B
2006 15,600 B 832 B
Roadway ID 60020000 2007 14,850 B 792 B
Segment is on the Strategic Intermodal System 2008 14,250 B 760 B
2009 12,250 B 654 B
2014 16,393 B 875 B
2019 21,938 B 1,170 B
Updated 2010, using 2009 FDOT Generalized Q / LOS Tables. LOS Standards and Max Allowable Volumes are based on those established for State Roadways.
Not To Be Used For Concurrency Management Purposes. Prepared for the FY 2010/11 Transportation Planning Organization Congestion Management System.
E" following the count indicates an 'estimated count. "T" following the Count Station number indicated a Telemetered Traffic Monitoring Site. These Tables Are For General Planning Purposes Only.
Walton County, State Roads
8
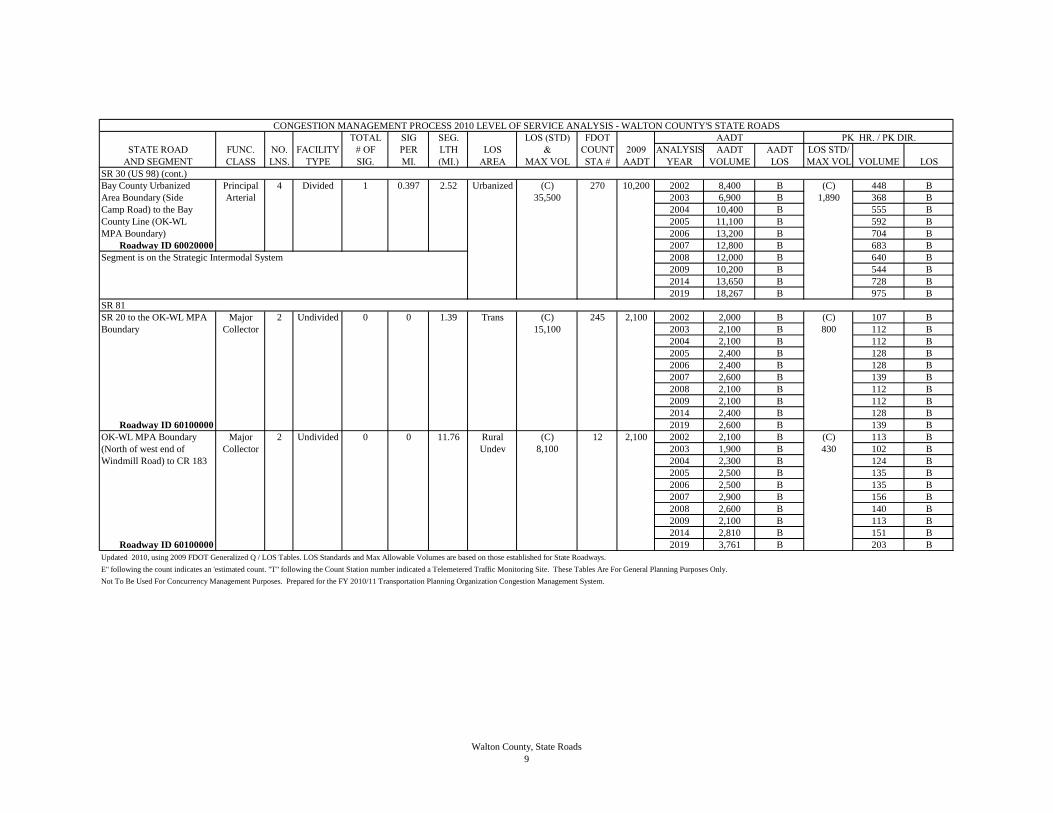
TOTAL SIG SEG. LOS (STD) FDOT PK HR. / PK DIR.
STATE ROAD FUNC. NO. FACILITY # OF PER LTH LOS & COUNT 2009 ANALYSIS AADT AADT LOS STD/
AND SEGMENT CLASS LNS. TYPE SIG. MI. (MI.) AREA MAX VOL STA # AADT YEAR VOLUME LOS MAX VOL VOLUME LOS
AADT
CONGESTION MANAGEMENT PROCESS 2010 LEVEL OF SERVICE ANALYSIS - WALTON COUNTY'S STATE ROADS
SR 30 (US 98) (cont.)
Bay County Urbanized Principal 4 Divided 1 0.397 2.52 Urbanized (C) 270 10,200 2002 8,400 B (C) 448 B
Area Boundary (Side Arterial 35,500 2003 6,900 B 1,890 368 B
Camp Road) to the Bay 2004 10,400 B 555 B
County Line (OK-WL 2005 11,100 B 592 B
MPA Boundary) 2006 13,200 B 704 B
Roadway ID 60020000 2007 12,800 B 683 B
Segment is on the Strategic Intermodal System 2008 12,000 B 640 B
2009 10,200 B 544 B
2014 13,650 B 728 B
2019 18,267 B 975 B
SR 81
SR 20 to the OK-WL MPA Major 2 Undivided 0 0 1.39 Trans (C) 245 2,100 2002 2,000 B (C) 107 B
Boundary Collector 15,100 2003 2,100 B 800 112 B
2004 2,100 B 112 B
2005 2,400 B 128 B
2006 2,400 B 128 B
2007 2,600 B 139 B
2008 2,100 B 112 B
2009 2,100 B 112 B
2014 2,400 B 128 B
Roadway ID 60100000 2019 2,600 B 139 B
OK-WL MPA Boundary Major 2 Undivided 0 0 11.76 Rural (C) 12 2,100 2002 2,100 B (C) 113 B
(North of west end of Collector Undev 8,100 2003 1,900 B 430 102 B
Windmill Road) to CR 183 2004 2,300 B 124 B
2005 2,500 B 135 B
2006 2,500 B 135 B
2007 2,900 B 156 B
2008 2,600 B 140 B
2009 2,100 B 113 B
2014 2,810 B 151 B
Roadway ID 60100000 2019 3,761 B 203 B
Updated 2010, using 2009 FDOT Generalized Q / LOS Tables. LOS Standards and Max Allowable Volumes are based on those established for State Roadways.
Not To Be Used For Concurrency Management Purposes. Prepared for the FY 2010/11 Transportation Planning Organization Congestion Management System.
E" following the count indicates an 'estimated count. "T" following the Count Station number indicated a Telemetered Traffic Monitoring Site. These Tables Are For General Planning Purposes Only.
Walton County, State Roads
9
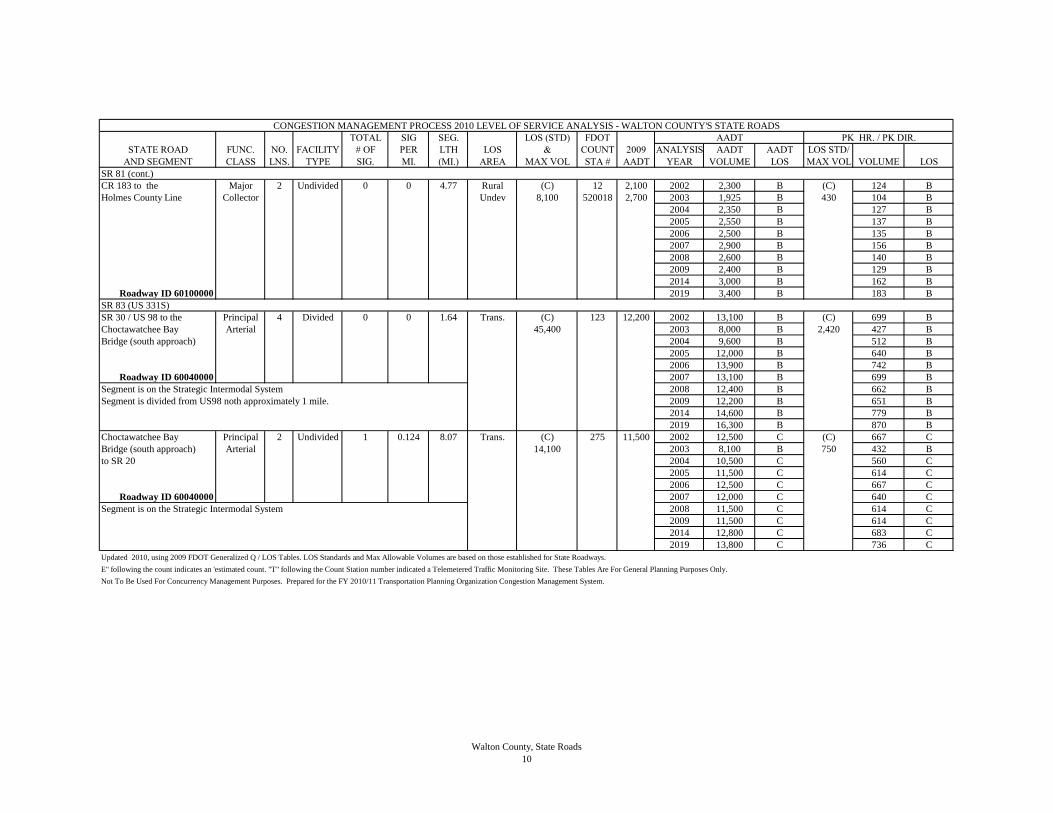
TOTAL SIG SEG. LOS (STD) FDOT PK HR. / PK DIR.
STATE ROAD FUNC. NO. FACILITY # OF PER LTH LOS & COUNT 2009 ANALYSIS AADT AADT LOS STD/
AND SEGMENT CLASS LNS. TYPE SIG. MI. (MI.) AREA MAX VOL STA # AADT YEAR VOLUME LOS MAX VOL VOLUME LOS
AADT
CONGESTION MANAGEMENT PROCESS 2010 LEVEL OF SERVICE ANALYSIS - WALTON COUNTY'S STATE ROADS
SR 81 (cont.)
CR 183 to the Major 2 Undivided 0 0 4.77 Rural (C) 12 2,100 2002 2,300 B (C) 124 B
Holmes County Line Collector Undev 8,100 520018 2,700 2003 1,925 B 430 104 B
2004 2,350 B 127 B
2005 2,550 B 137 B
2006 2,500 B 135 B
2007 2,900 B 156 B
2008 2,600 B 140 B
2009 2,400 B 129 B
2014 3,000 B 162 B
Roadway ID 60100000 2019 3,400 B 183 B
SR 83 (US 331S)
SR 30 / US 98 to the Principal 4 Divided 0 0 1.64 Trans. (C) 123 12,200 2002 13,100 B (C) 699 B
Choctawatchee Bay Arterial 45,400 2003 8,000 B 2,420 427 B
Bridge (south approach) 2004 9,600 B 512 B
2005 12,000 B 640 B
2006 13,900 B 742 B
Roadway ID 60040000 2007 13,100 B 699 B
Segment is on the Strategic Intermodal System 2008 12,400 B 662 B
Segment is divided from US98 noth approximately 1 mile. 2009 12,200 B 651 B
2014 14,600 B 779 B
2019 16,300 B 870 B
Choctawatchee Bay Principal 2 Undivided 1 0.124 8.07 Trans. (C) 275 11,500 2002 12,500 C (C) 667 C
Bridge (south approach) Arterial 14,100 2003 8,100 B 750 432 B
to SR 20 2004 10,500 C 560 C
2005 11,500 C 614 C
2006 12,500 C 667 C
Roadway ID 60040000 2007 12,000 C 640 C
Segment is on the Strategic Intermodal System 2008 11,500 C 614 C
2009 11,500 C 614 C
2014 12,800 C 683 C
2019 13,800 C 736 C
Updated 2010, using 2009 FDOT Generalized Q / LOS Tables. LOS Standards and Max Allowable Volumes are based on those established for State Roadways.
Not To Be Used For Concurrency Management Purposes. Prepared for the FY 2010/11 Transportation Planning Organization Congestion Management System.
E" following the count indicates an 'estimated count. "T" following the Count Station number indicated a Telemetered Traffic Monitoring Site. These Tables Are For General Planning Purposes Only.
Walton County, State Roads
10

TOTAL SIG SEG. LOS (STD) FDOT PK HR. / PK DIR.
STATE ROAD FUNC. NO. FACILITY # OF PER LTH LOS & COUNT 2009 ANALYSIS AADT AADT LOS STD/
AND SEGMENT CLASS LNS. TYPE SIG. MI. (MI.) AREA MAX VOL STA # AADT YEAR VOLUME LOS MAX VOL VOLUME LOS
AADT
CONGESTION MANAGEMENT PROCESS 2010 LEVEL OF SERVICE ANALYSIS - WALTON COUNTY'S STATE ROADS
SR 83 (US331) (cont.)
SR 20 to CR 883 / Madison Principal 2 Undivided 0 0.000 4.3 Trans. (C) 275 11,500 2002 11,350 C (C) 606 C
Street Arterial 15,100 1511 11,900 2003 8,600 C 800 459 C
2004 10,600 C 566 C
2005 12,550 C 670 C
2006 12,500 C 667 C
Roadway ID 60040000 2007 12,300 C 656 C
Segment is on the Strategic Intermodal System 2008 13,650 C 728 C
2009 11,700 C 624 C
2014 15,000 C 800 C
2019 16,900 D 902 D
CR 883 / Madison Street to Principal 2 Undivided 0 0.000 9.9 Trans. (C) 1511 11,900 2002 10,200 C (C) 544 C
I-10 Arterial 15,100 2003 9,100 C 800 485 C
2004 10,700 C 571 C
2005 13,600 C 726 C
2006 12,500 C 667 C
Roadway ID 60050000 2007 12,600 C 672 C
Segment is on the Strategic Intermodal System 2008 15,800 D 843 D
2009 11,900 C 635 C
2014 17,100 D 912 D
2019 20,100 D 1,072 D
I-10 / SR 8 to Principal 4 Divided 5 2.415 2.07 Trans. (C) 5001 16,100 2002 14,750 C (C) 787 C
US 90 / SR 10 Arterial 22,700 1503 17,500 2003 14,800 C 1,210 790 C
2004 16,950 C 904 C
2005 19,100 C 1,019 C
2006 19,050 C 1,016 C
Roadway ID 60050000 2007 18,050 C 963 C
Segment is on the Strategic Intermodal System 2008 17,750 C 947 C
Segment is 4-lane divided .2 miles south of I-10 to .3 miles north of I-10 2009 16,800 C 896 C
2014 20,500 C 1,094 C
2019 22,400 C 1,195 C
Updated 2010, using 2009 FDOT Generalized Q / LOS Tables. LOS Standards and Max Allowable Volumes are based on those established for State Roadways.
Not To Be Used For Concurrency Management Purposes. Prepared for the FY 2010/11 Transportation Planning Organization Congestion Management System.
E" following the count indicates an 'estimated count. "T" following the Count Station number indicated a Telemetered Traffic Monitoring Site. These Tables Are For General Planning Purposes Only.
Walton County, State Roads
11
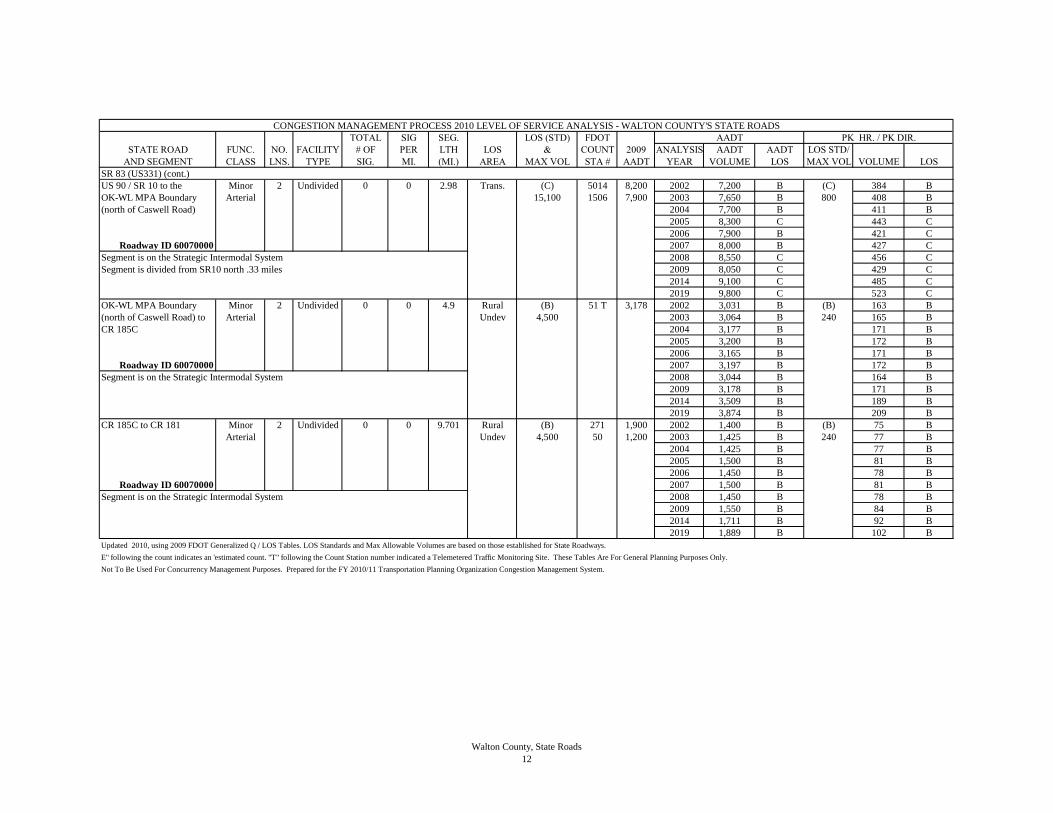
TOTAL SIG SEG. LOS (STD) FDOT PK HR. / PK DIR.
STATE ROAD FUNC. NO. FACILITY # OF PER LTH LOS & COUNT 2009 ANALYSIS AADT AADT LOS STD/
AND SEGMENT CLASS LNS. TYPE SIG. MI. (MI.) AREA MAX VOL STA # AADT YEAR VOLUME LOS MAX VOL VOLUME LOS
AADT
CONGESTION MANAGEMENT PROCESS 2010 LEVEL OF SERVICE ANALYSIS - WALTON COUNTY'S STATE ROADS
SR 83 (US331) (cont.)
US 90 / SR 10 to the Minor 2 Undivided 0 0 2.98 Trans. (C) 5014 8,200 2002 7,200 B (C) 384 B
OK-WL MPA Boundary Arterial 15,100 1506 7,900 2003 7,650 B 800 408 B
(north of Caswell Road) 2004 7,700 B 411 B
2005 8,300 C 443 C
2006 7,900 B 421 C
Roadway ID 60070000 2007 8,000 B 427 C
Segment is on the Strategic Intermodal System 2008 8,550 C 456 C
Segment is divided from SR10 north .33 miles 2009 8,050 C 429 C
2014 9,100 C 485 C
2019 9,800 C 523 C
OK-WL MPA Boundary Minor 2 Undivided 0 0 4.9 Rural (B) 51 T 3,178 2002 3,031 B (B) 163 B
(north of Caswell Road) to Arterial Undev 4,500 2003 3,064 B 240 165 B
CR 185C 2004 3,177 B 171 B
2005 3,200 B 172 B
2006 3,165 B 171 B
Roadway ID 60070000 2007 3,197 B 172 B
Segment is on the Strategic Intermodal System 2008 3,044 B 164 B
2009 3,178 B 171 B
2014 3,509 B 189 B
2019 3,874 B 209 B
CR 185C to CR 181 Minor 2 Undivided 0 0 9.701 Rural (B) 271 1,900 2002 1,400 B (B) 75 B
Arterial Undev 4,500 50 1,200 2003 1,425 B 240 77 B
2004 1,425 B 77 B
2005 1,500 B 81 B
2006 1,450 B 78 B
Roadway ID 60070000 2007 1,500 B 81 B
Segment is on the Strategic Intermodal System 2008 1,450 B 78 B
2009 1,550 B 84 B
2014 1,711 B 92 B
2019 1,889 B 102 B
Updated 2010, using 2009 FDOT Generalized Q / LOS Tables. LOS Standards and Max Allowable Volumes are based on those established for State Roadways.
Not To Be Used For Concurrency Management Purposes. Prepared for the FY 2010/11 Transportation Planning Organization Congestion Management System.
E" following the count indicates an 'estimated count. "T" following the Count Station number indicated a Telemetered Traffic Monitoring Site. These Tables Are For General Planning Purposes Only.
Walton County, State Roads
12
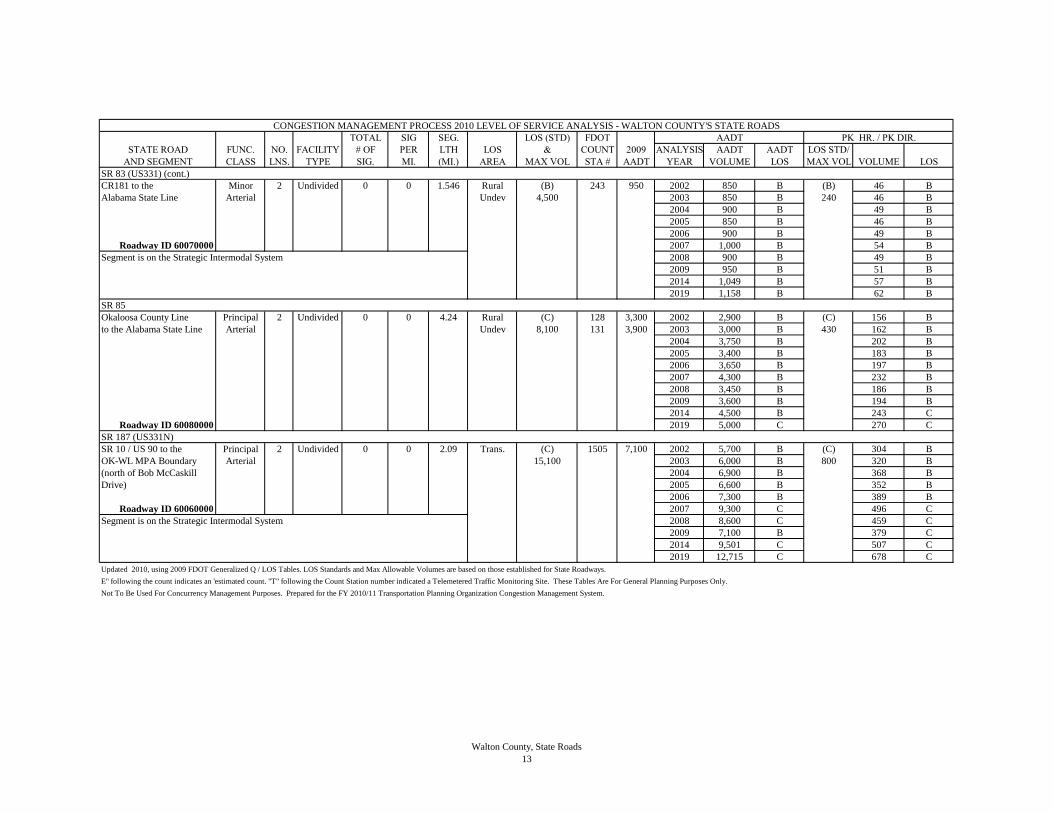
TOTAL SIG SEG. LOS (STD) FDOT PK HR. / PK DIR.
STATE ROAD FUNC. NO. FACILITY # OF PER LTH LOS & COUNT 2009 ANALYSIS AADT AADT LOS STD/
AND SEGMENT CLASS LNS. TYPE SIG. MI. (MI.) AREA MAX VOL STA # AADT YEAR VOLUME LOS MAX VOL VOLUME LOS
AADT
CONGESTION MANAGEMENT PROCESS 2010 LEVEL OF SERVICE ANALYSIS - WALTON COUNTY'S STATE ROADS
SR 83 (US331) (cont.)
CR181 to the Minor 2 Undivided 0 0 1.546 Rural (B) 243 950 2002 850 B (B) 46 B
Alabama State Line Arterial Undev 4,500 2003 850 B 240 46 B
2004 900 B 49 B
2005 850 B 46 B
2006 900 B 49 B
Roadway ID 60070000 2007 1,000 B 54 B
Segment is on the Strategic Intermodal System 2008 900 B 49 B
2009 950 B 51 B
2014 1,049 B 57 B
2019 1,158 B 62 B
SR 85
Okaloosa County Line Principal 2 Undivided 0 0 4.24 Rural (C) 128 3,300 2002 2,900 B (C) 156 B
to the Alabama State Line Arterial Undev 8,100 131 3,900 2003 3,000 B 430 162 B
2004 3,750 B 202 B
2005 3,400 B 183 B
2006 3,650 B 197 B
2007 4,300 B 232 B
2008 3,450 B 186 B
2009 3,600 B 194 B
2014 4,500 B 243 C
Roadway ID 60080000 2019 5,000 C 270 C
SR 187 (US331N)
SR 10 / US 90 to the Principal 2 Undivided 0 0 2.09 Trans. (C) 1505 7,100 2002 5,700 B (C) 304 B
OK-WL MPA Boundary Arterial 15,100 2003 6,000 B 800 320 B
(north of Bob McCaskill 2004 6,900 B 368 B
Drive) 2005 6,600 B 352 B
2006 7,300 B 389 B
Roadway ID 60060000 2007 9,300 C 496 C
Segment is on the Strategic Intermodal System 2008 8,600 C 459 C
2009 7,100 B 379 C
2014 9,501 C 507 C
2019 12,715 C 678 C
Updated 2010, using 2009 FDOT Generalized Q / LOS Tables. LOS Standards and Max Allowable Volumes are based on those established for State Roadways.
Not To Be Used For Concurrency Management Purposes. Prepared for the FY 2010/11 Transportation Planning Organization Congestion Management System.
E" following the count indicates an 'estimated count. "T" following the Count Station number indicated a Telemetered Traffic Monitoring Site. These Tables Are For General Planning Purposes Only.
Walton County, State Roads
13
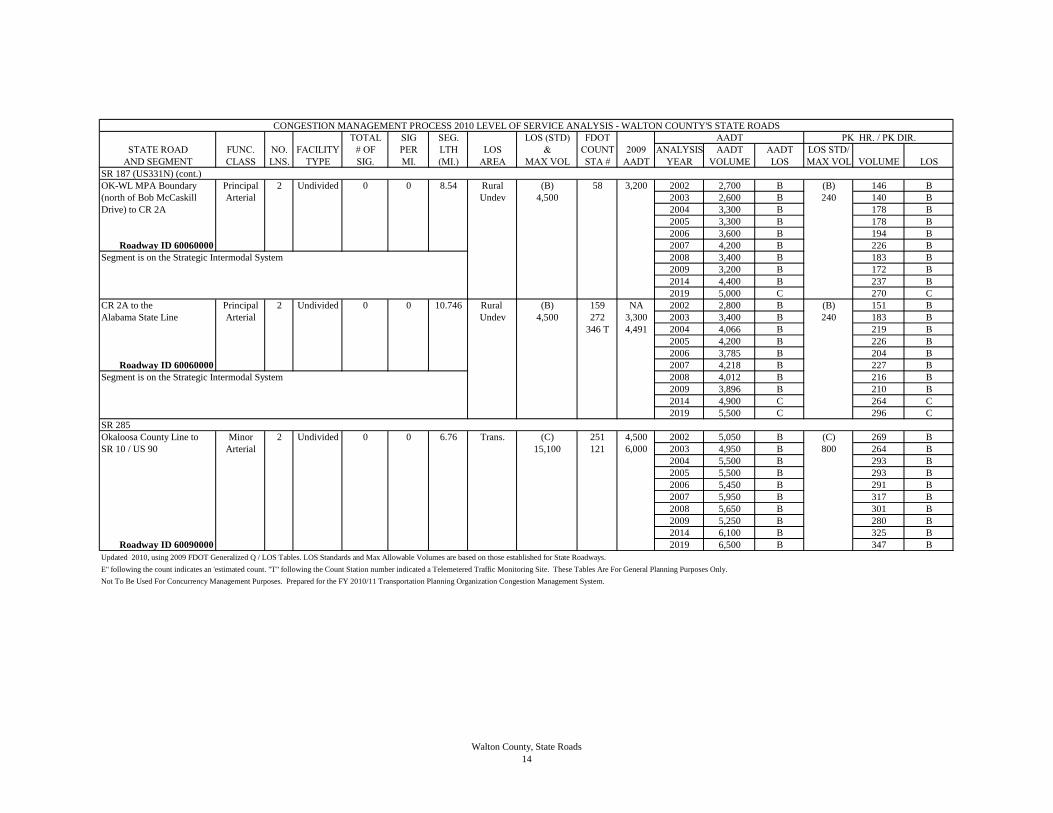
TOTAL SIG SEG. LOS (STD) FDOT PK HR. / PK DIR.
STATE ROAD FUNC. NO. FACILITY # OF PER LTH LOS & COUNT 2009 ANALYSIS AADT AADT LOS STD/
AND SEGMENT CLASS LNS. TYPE SIG. MI. (MI.) AREA MAX VOL STA # AADT YEAR VOLUME LOS MAX VOL VOLUME LOS
AADT
CONGESTION MANAGEMENT PROCESS 2010 LEVEL OF SERVICE ANALYSIS - WALTON COUNTY'S STATE ROADS
SR 187 (US331N) (cont.)
OK-WL MPA Boundary Principal 2 Undivided 0 0 8.54 Rural (B) 58 3,200 2002 2,700 B (B) 146 B
(north of Bob McCaskill Arterial Undev 4,500 2003 2,600 B 240 140 B
Drive) to CR 2A 2004 3,300 B 178 B
2005 3,300 B 178 B
2006 3,600 B 194 B
Roadway ID 60060000 2007 4,200 B 226 B
Segment is on the Strategic Intermodal System 2008 3,400 B 183 B
2009 3,200 B 172 B
2014 4,400 B 237 B
2019 5,000 C 270 C
CR 2A to the Principal 2 Undivided 0 0 10.746 Rural (B) 159 NA 2002 2,800 B (B) 151 B
Alabama State Line Arterial Undev 4,500 272 3,300 2003 3,400 B 240 183 B
346 T 4,491 2004 4,066 B 219 B
2005 4,200 B 226 B
2006 3,785 B 204 B
Roadway ID 60060000 2007 4,218 B 227 B
Segment is on the Strategic Intermodal System 2008 4,012 B 216 B
2009 3,896 B 210 B
2014 4,900 C 264 C
2019 5,500 C 296 C
SR 285
Okaloosa County Line to Minor 2 Undivided 0 0 6.76 Trans. (C) 251 4,500 2002 5,050 B (C) 269 B
SR 10 / US 90 Arterial 15,100 121 6,000 2003 4,950 B 800 264 B
2004 5,500 B 293 B
2005 5,500 B 293 B
2006 5,450 B 291 B
2007 5,950 B 317 B
2008 5,650 B 301 B
2009 5,250 B 280 B
2014 6,100 B 325 B
Roadway ID 60090000 2019 6,500 B 347 B
Updated 2010, using 2009 FDOT Generalized Q / LOS Tables. LOS Standards and Max Allowable Volumes are based on those established for State Roadways.
Not To Be Used For Concurrency Management Purposes. Prepared for the FY 2010/11 Transportation Planning Organization Congestion Management System.
E" following the count indicates an 'estimated count. "T" following the Count Station number indicated a Telemetered Traffic Monitoring Site. These Tables Are For General Planning Purposes Only.
Walton County, State Roads
14
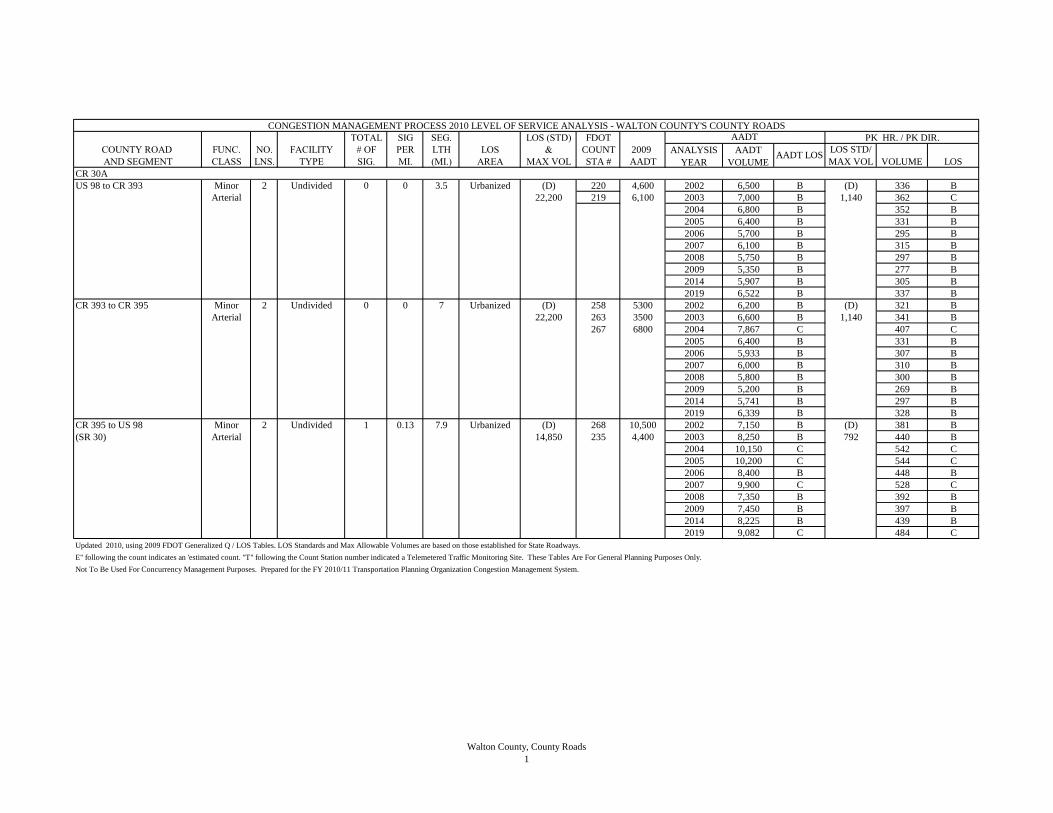
TOTAL SIG SEG. LOS (STD) FDOT PK HR. / PK DIR.
COUNTY ROAD FUNC. NO. FACILITY # OF PER LTH LOS & COUNT 2009
AND SEGMENT CLASS LNS. TYPE SIG. MI. (MI.) AREA MAX VOL STA # AADT
CR 30A
US 98 to CR 393 Minor 2 Undivided 0 0 3.5 Urbanized (D) 220 4,600 2002 6,500 B (D) 336 B
Arterial 22,200 219 6,100 2003 7,000 B 1,140 362 C
2004 6,800 B 352 B
2005 6,400 B 331 B
2006 5,700 B 295 B
2007 6,100 B 315 B
2008 5,750 B 297 B
2009 5,350 B 277 B
2014 5,907 B 305 B
2019 6,522 B 337 B
CR 393 to CR 395 Minor 2 Undivided 0 0 7 Urbanized (D) 258 5300 2002 6,200 B (D) 321 B
Arterial 22,200 263 3500 2003 6,600 B 1,140 341 B
267 6800 2004 7,867 C 407 C
2005 6,400 B 331 B
2006 5,933 B 307 B
2007 6,000 B 310 B
2008 5,800 B 300 B
2009 5,200 B 269 B
2014 5,741 B 297 B
2019 6,339 B 328 B
CR 395 to US 98 Minor 2 Undivided 1 0.13 7.9 Urbanized (D) 268 10,500 2002 7,150 B (D) 381 B
(SR 30) Arterial 14,850 235 4,400 2003 8,250 B 792 440 B
2004 10,150 C 542 C
2005 10,200 C 544 C
2006 8,400 B 448 B
2007 9,900 C 528 C
2008 7,350 B 392 B
2009 7,450 B 397 B
2014 8,225 B 439 B
2019 9,082 C 484 C
Updated 2010, using 2009 FDOT Generalized Q / LOS Tables. LOS Standards and Max Allowable Volumes are based on those established for State Roadways.
Not To Be Used For Concurrency Management Purposes. Prepared for the FY 2010/11 Transportation Planning Organization Congestion Management System.
ANALYSIS
YEAR
AADT
VOLUMEAADT LOS
E" following the count indicates an 'estimated count. "T" following the Count Station number indicated a Telemetered Traffic Monitoring Site. These Tables Are For General Planning Purposes Only.
CONGESTION MANAGEMENT PROCESS 2010 LEVEL OF SERVICE ANALYSIS - WALTON COUNTY'S COUNTY ROADS
LOS STD/
MAX VOL VOLUME LOS
AADT
Walton County, County Roads
1

TOTAL SIG SEG. LOS (STD) FDOT PK HR. / PK DIR.
COUNTY ROAD FUNC. NO. FACILITY # OF PER LTH LOS & COUNT 2009
AND SEGMENT CLASS LNS. TYPE SIG. MI. (MI.) AREA MAX VOL STA # AADT
ANALYSIS
YEAR
AADT
VOLUMEAADT LOS
CONGESTION MANAGEMENT PROCESS 2010 LEVEL OF SERVICE ANALYSIS - WALTON COUNTY'S COUNTY ROADS
LOS STD/
MAX VOL VOLUME LOS
AADT
CR 83
CR 30A to the Urbanized Local 2 Undivided 0 0 0.6 Urbanized (D) 262 1,800 2002 1,100 B (D) 57 B
Area Boundary Rural 22,200 2003 1,200 B 1,140 62 B
2004 1,500 B 78 B
2005 1,700 B 88 B
2006 1,800 B 93 B
2007 1,900 B 98 B
2008 1,700 B 88 B
2009 1,800 B 93 B
2014 2,409 B 125 B
2019 2,660 B 137 B
Urbanized Area Boundary Local 2 Undivided 0 0 1.4 Trans. (C) 262 1,800 2002 1,100 B (C) 59 B
to US 98 Rural 15,100 2003 1,200 B 800 64 B
2004 1,500 B 80 B
2005 1,700 B 91 B
2006 1,800 B 96 B
2007 1,900 B 101 B
2008 1,700 B 91 B
2009 1,800 B 96 B
2014 2,409 B 129 B
2019 2,660 B 142 B
CR 83A
SR 20 to SR 20 Minor 2 Undivided 0 0 8.6 Trans. (C) 240 1,300 2002 1,250 B (C) 67 B
Collector 15,100 223 1,700 2003 1,400 B 800 75 B
2004 1,400 B 75 B
2005 1,550 B 83 B
2006 1,550 B 83 B
2007 1,450 B 77 B
2008 1,500 B 80 B
2009 1,500 B 80 B
2014 1,700 B 91 B
2019 1,800 B 96 B
Updated 2010, using 2009 FDOT Generalized Q / LOS Tables. LOS Standards and Max Allowable Volumes are based on those established for State Roadways.
Not To Be Used For Concurrency Management Purposes. Prepared for the FY 2010/11 Transportation Planning Organization Congestion Management System.
E" following the count indicates an 'estimated count. "T" following the Count Station number indicated a Telemetered Traffic Monitoring Site. These Tables Are For General Planning Purposes Only.
Walton County, County Roads
2
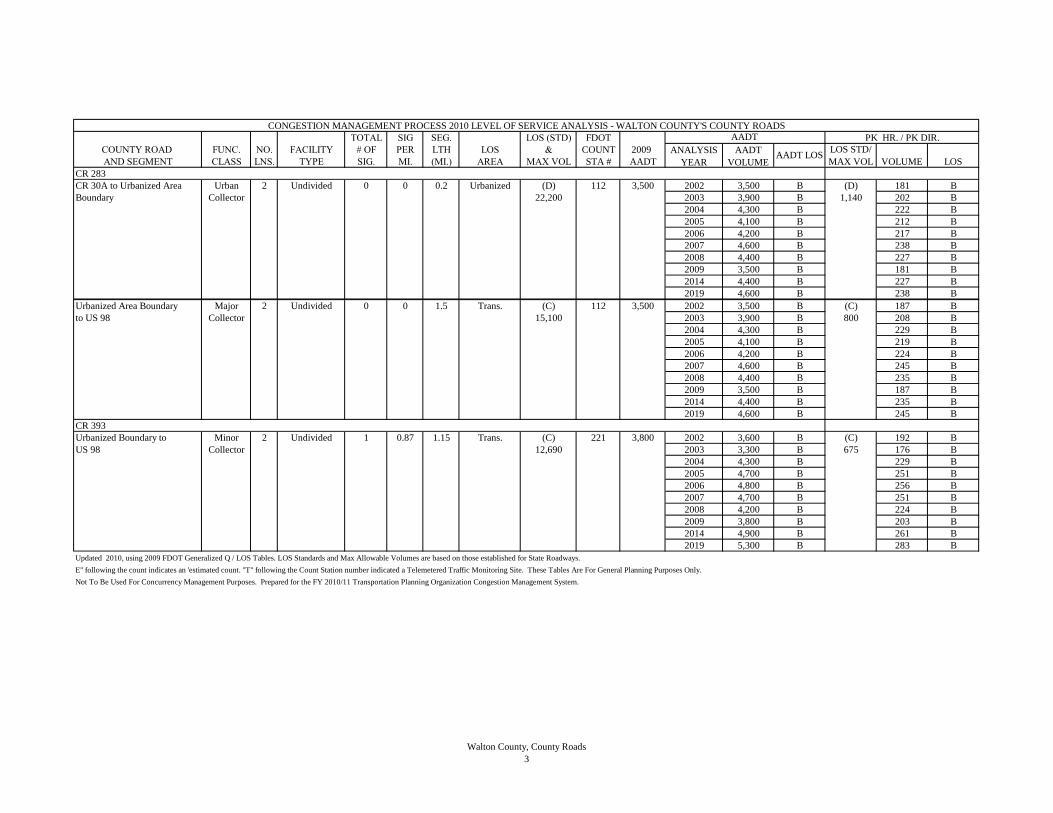
TOTAL SIG SEG. LOS (STD) FDOT PK HR. / PK DIR.
COUNTY ROAD FUNC. NO. FACILITY # OF PER LTH LOS & COUNT 2009
AND SEGMENT CLASS LNS. TYPE SIG. MI. (MI.) AREA MAX VOL STA # AADT
ANALYSIS
YEAR
AADT
VOLUMEAADT LOS
CONGESTION MANAGEMENT PROCESS 2010 LEVEL OF SERVICE ANALYSIS - WALTON COUNTY'S COUNTY ROADS
LOS STD/
MAX VOL VOLUME LOS
AADT
CR 283
CR 30A to Urbanized Area Urban 2 Undivided 0 0 0.2 Urbanized (D) 112 3,500 2002 3,500 B (D) 181 B
Boundary Collector 22,200 2003 3,900 B 1,140 202 B
2004 4,300 B 222 B
2005 4,100 B 212 B
2006 4,200 B 217 B
2007 4,600 B 238 B
2008 4,400 B 227 B
2009 3,500 B 181 B
2014 4,400 B 227 B
2019 4,600 B 238 BCR 393 0
Urbanized Area Boundary Major 2 Undivided 0 0 1.5 Trans. (C) 112 3,500 2002 3,500 B (C) 187 B
to US 98 Collector 15,100 2003 3,900 B 800 208 B
2004 4,300 B 229 B
2005 4,100 B 219 B
2006 4,200 B 224 B
2007 4,600 B 245 B
2008 4,400 B 235 B
2009 3,500 B 187 B
2014 4,400 B 235 B
2019 4,600 B 245 B
CR 393
Urbanized Boundary to Minor 2 Undivided 1 0.87 1.15 Trans. (C) 221 3,800 2002 3,600 B (C) 192 B
US 98 Collector 12,690 2003 3,300 B 675 176 B
2004 4,300 B 229 B
2005 4,700 B 251 B
2006 4,800 B 256 B
2007 4,700 B 251 B
2008 4,200 B 224 B
2009 3,800 B 203 B
2014 4,900 B 261 B
2019 5,300 B 283 B
Updated 2010, using 2009 FDOT Generalized Q / LOS Tables. LOS Standards and Max Allowable Volumes are based on those established for State Roadways.
Not To Be Used For Concurrency Management Purposes. Prepared for the FY 2010/11 Transportation Planning Organization Congestion Management System.
E" following the count indicates an 'estimated count. "T" following the Count Station number indicated a Telemetered Traffic Monitoring Site. These Tables Are For General Planning Purposes Only.
Walton County, County Roads
3
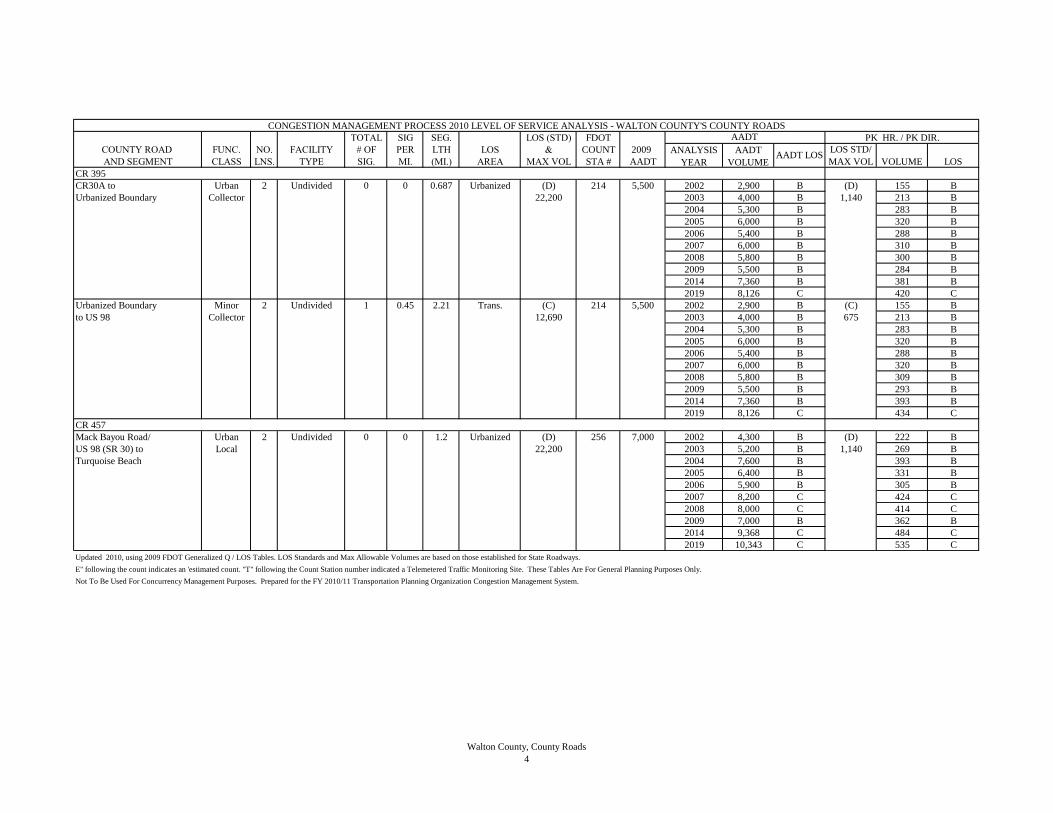
TOTAL SIG SEG. LOS (STD) FDOT PK HR. / PK DIR.
COUNTY ROAD FUNC. NO. FACILITY # OF PER LTH LOS & COUNT 2009
AND SEGMENT CLASS LNS. TYPE SIG. MI. (MI.) AREA MAX VOL STA # AADT
ANALYSIS
YEAR
AADT
VOLUMEAADT LOS
CONGESTION MANAGEMENT PROCESS 2010 LEVEL OF SERVICE ANALYSIS - WALTON COUNTY'S COUNTY ROADS
LOS STD/
MAX VOL VOLUME LOS
AADT
CR 395
CR30A to Urban 2 Undivided 0 0 0.687 Urbanized (D) 214 5,500 2002 2,900 B (D) 155 B
Urbanized Boundary Collector 22,200 2003 4,000 B 1,140 213 B
2004 5,300 B 283 B
2005 6,000 B 320 B
2006 5,400 B 288 B
2007 6,000 B 310 B
2008 5,800 B 300 B
2009 5,500 B 284 B
2014 7,360 B 381 B
2019 8,126 C 420 C
Urbanized Boundary Minor 2 Undivided 1 0.45 2.21 Trans. (C) 214 5,500 2002 2,900 B (C) 155 B
to US 98 Collector 12,690 2003 4,000 B 675 213 B
2004 5,300 B 283 B
2005 6,000 B 320 B
2006 5,400 B 288 B
2007 6,000 B 320 B
2008 5,800 B 309 B
2009 5,500 B 293 B
2014 7,360 B 393 B
2019 8,126 C 434 C
CR 457
Mack Bayou Road/ Urban 2 Undivided 0 0 1.2 Urbanized (D) 256 7,000 2002 4,300 B (D) 222 B
US 98 (SR 30) to Local 22,200 2003 5,200 B 1,140 269 B
Turquoise Beach 2004 7,600 B 393 B
2005 6,400 B 331 B
2006 5,900 B 305 B
2007 8,200 C 424 C
2008 8,000 C 414 C
2009 7,000 B 362 B
2014 9,368 C 484 C
2019 10,343 C 535 C
Updated 2010, using 2009 FDOT Generalized Q / LOS Tables. LOS Standards and Max Allowable Volumes are based on those established for State Roadways.
Not To Be Used For Concurrency Management Purposes. Prepared for the FY 2010/11 Transportation Planning Organization Congestion Management System.
E" following the count indicates an 'estimated count. "T" following the Count Station number indicated a Telemetered Traffic Monitoring Site. These Tables Are For General Planning Purposes Only.
Walton County, County Roads
4
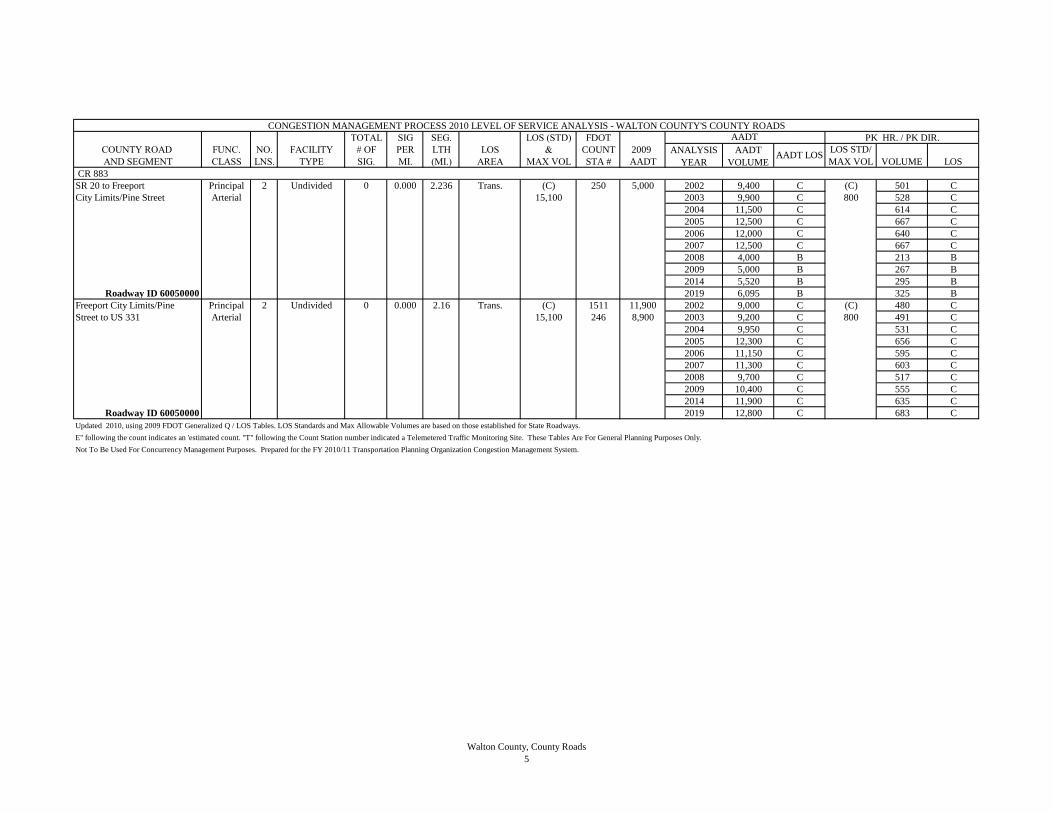
TOTAL SIG SEG. LOS (STD) FDOT PK HR. / PK DIR.
COUNTY ROAD FUNC. NO. FACILITY # OF PER LTH LOS & COUNT 2009
AND SEGMENT CLASS LNS. TYPE SIG. MI. (MI.) AREA MAX VOL STA # AADT
ANALYSIS
YEAR
AADT
VOLUMEAADT LOS
CONGESTION MANAGEMENT PROCESS 2010 LEVEL OF SERVICE ANALYSIS - WALTON COUNTY'S COUNTY ROADS
LOS STD/
MAX VOL VOLUME LOS
AADT
CR 883
SR 20 to Freeport Principal 2 Undivided 0 0.000 2.236 Trans. (C) 250 5,000 2002 9,400 C (C) 501 C
City Limits/Pine Street Arterial 15,100 2003 9,900 C 800 528 C
2004 11,500 C 614 C
2005 12,500 C 667 C
2006 12,000 C 640 C
2007 12,500 C 667 C
2008 4,000 B 213 B
2009 5,000 B 267 B
2014 5,520 B 295 B
Roadway ID 60050000 2019 6,095 B 325 B
Freeport City Limits/Pine Principal 2 Undivided 0 0.000 2.16 Trans. (C) 1511 11,900 2002 9,000 C (C) 480 C
Street to US 331 Arterial 15,100 246 8,900 2003 9,200 C 800 491 C
2004 9,950 C 531 C
2005 12,300 C 656 C
2006 11,150 C 595 C
2007 11,300 C 603 C
2008 9,700 C 517 C
2009 10,400 C 555 C
2014 11,900 C 635 C
Roadway ID 60050000 2019 12,800 C 683 C
Updated 2010, using 2009 FDOT Generalized Q / LOS Tables. LOS Standards and Max Allowable Volumes are based on those established for State Roadways.
Not To Be Used For Concurrency Management Purposes. Prepared for the FY 2010/11 Transportation Planning Organization Congestion Management System.
E" following the count indicates an 'estimated count. "T" following the Count Station number indicated a Telemetered Traffic Monitoring Site. These Tables Are For General Planning Purposes Only.
Walton County, County Roads
5
TABLE 2
2009 MULTIMODAL LEVEL OF
SERVICE STATE AND COUNTY
ROADS
OKALOOSA COUNTY
WALTON COUNTY
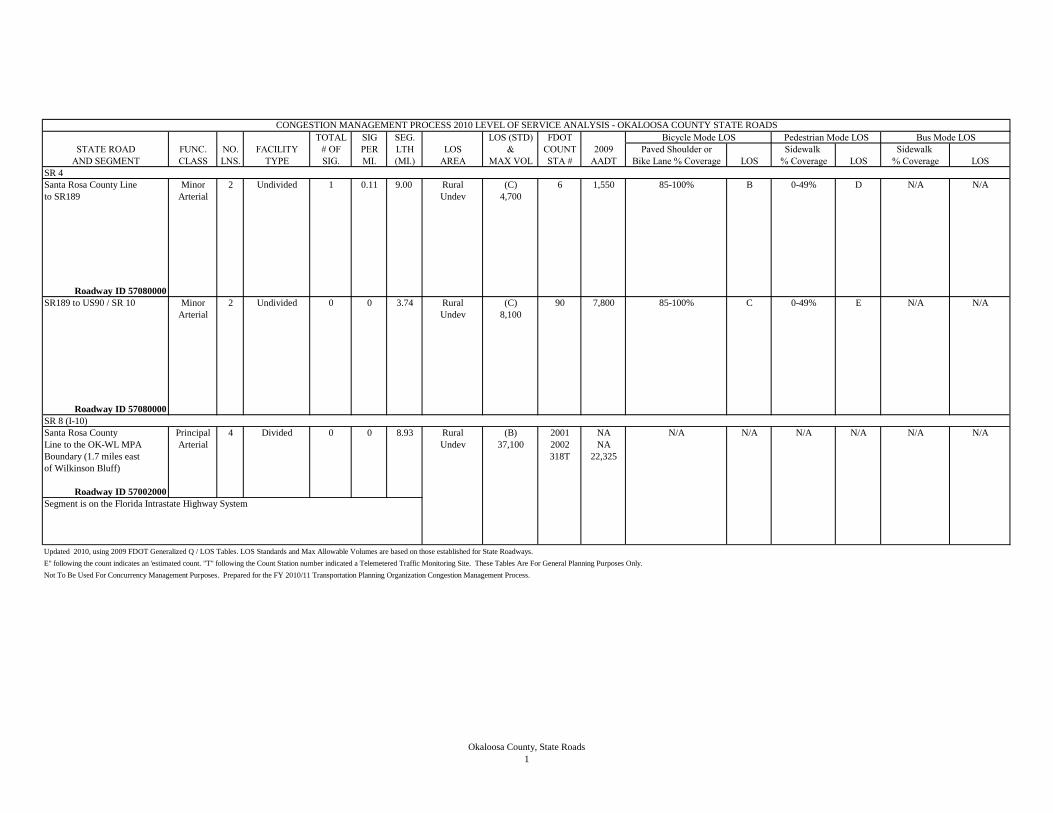
TOTAL SIG SEG. LOS (STD) FDOT
STATE ROAD FUNC. NO. FACILITY # OF PER LTH LOS & COUNT 2009 Paved Shoulder or Sidewalk Sidewalk
AND SEGMENT CLASS LNS. TYPE SIG. MI. (MI.) AREA MAX VOL STA # AADT Bike Lane % Coverage LOS % Coverage LOS % Coverage LOS
SR 4
Santa Rosa County Line Minor 2 Undivided 1 0.11 9.00 Rural (C) 6 1,550 85-100% B 0-49% D N/A N/A
to SR189 Arterial Undev 4,700
Roadway ID 57080000
SR189 to US90 / SR 10 Minor 2 Undivided 0 0 3.74 Rural (C) 90 7,800 85-100% C 0-49% E N/A N/A
Arterial Undev 8,100
Roadway ID 57080000
SR 8 (I-10)
Santa Rosa County Principal 4 Divided 0 0 8.93 Rural (B) 2001 NA N/A N/A N/A N/A N/A N/A
Line to the OK-WL MPA Arterial Undev 37,100 2002 NA
Boundary (1.7 miles east 318T 22,325
of Wilkinson Bluff)
Roadway ID 57002000
Segment is on the Florida Intrastate Highway System
Updated 2010, using 2009 FDOT Generalized Q / LOS Tables. LOS Standards and Max Allowable Volumes are based on those established for State Roadways.
Not To Be Used For Concurrency Management Purposes. Prepared for the FY 2010/11 Transportation Planning Organization Congestion Management Process.
Bicycle Mode LOS Pedestrian Mode LOS Bus Mode LOS
CONGESTION MANAGEMENT PROCESS 2010 LEVEL OF SERVICE ANALYSIS - OKALOOSA COUNTY STATE ROADS
E" following the count indicates an 'estimated count. "T" following the Count Station number indicated a Telemetered Traffic Monitoring Site. These Tables Are For General Planning Purposes Only.
Okaloosa County, State Roads
1
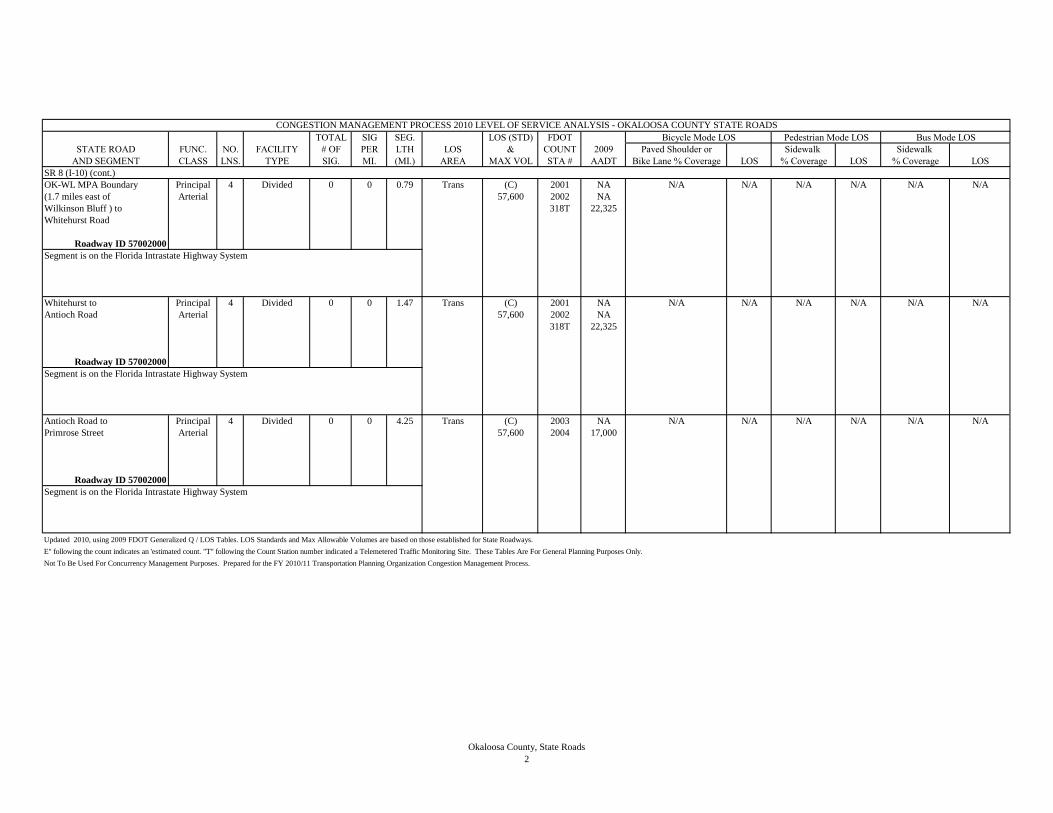
TOTAL SIG SEG. LOS (STD) FDOT
STATE ROAD FUNC. NO. FACILITY # OF PER LTH LOS & COUNT 2009 Paved Shoulder or Sidewalk Sidewalk
AND SEGMENT CLASS LNS. TYPE SIG. MI. (MI.) AREA MAX VOL STA # AADT Bike Lane % Coverage LOS % Coverage LOS % Coverage LOS
Bicycle Mode LOS Pedestrian Mode LOS Bus Mode LOS
CONGESTION MANAGEMENT PROCESS 2010 LEVEL OF SERVICE ANALYSIS - OKALOOSA COUNTY STATE ROADS
SR 8 (I-10) (cont.)
OK-WL MPA Boundary Principal 4 Divided 0 0 0.79 Trans (C) 2001 NA N/A N/A N/A N/A N/A N/A
(1.7 miles east of Arterial 57,600 2002 NA
Wilkinson Bluff ) to 318T 22,325
Whitehurst Road
Roadway ID 57002000
Segment is on the Florida Intrastate Highway System
Whitehurst to Principal 4 Divided 0 0 1.47 Trans (C) 2001 NA N/A N/A N/A N/A N/A N/A
Antioch Road Arterial 57,600 2002 NA
318T 22,325
Roadway ID 57002000
Segment is on the Florida Intrastate Highway System
Antioch Road to Principal 4 Divided 0 0 4.25 Trans (C) 2003 NA N/A N/A N/A N/A N/A N/A
Primrose Street Arterial 57,600 2004 17,000
Roadway ID 57002000
Segment is on the Florida Intrastate Highway System
Updated 2010, using 2009 FDOT Generalized Q / LOS Tables. LOS Standards and Max Allowable Volumes are based on those established for State Roadways.
Not To Be Used For Concurrency Management Purposes. Prepared for the FY 2010/11 Transportation Planning Organization Congestion Management Process.
E" following the count indicates an 'estimated count. "T" following the Count Station number indicated a Telemetered Traffic Monitoring Site. These Tables Are For General Planning Purposes Only.
Okaloosa County, State Roads
2
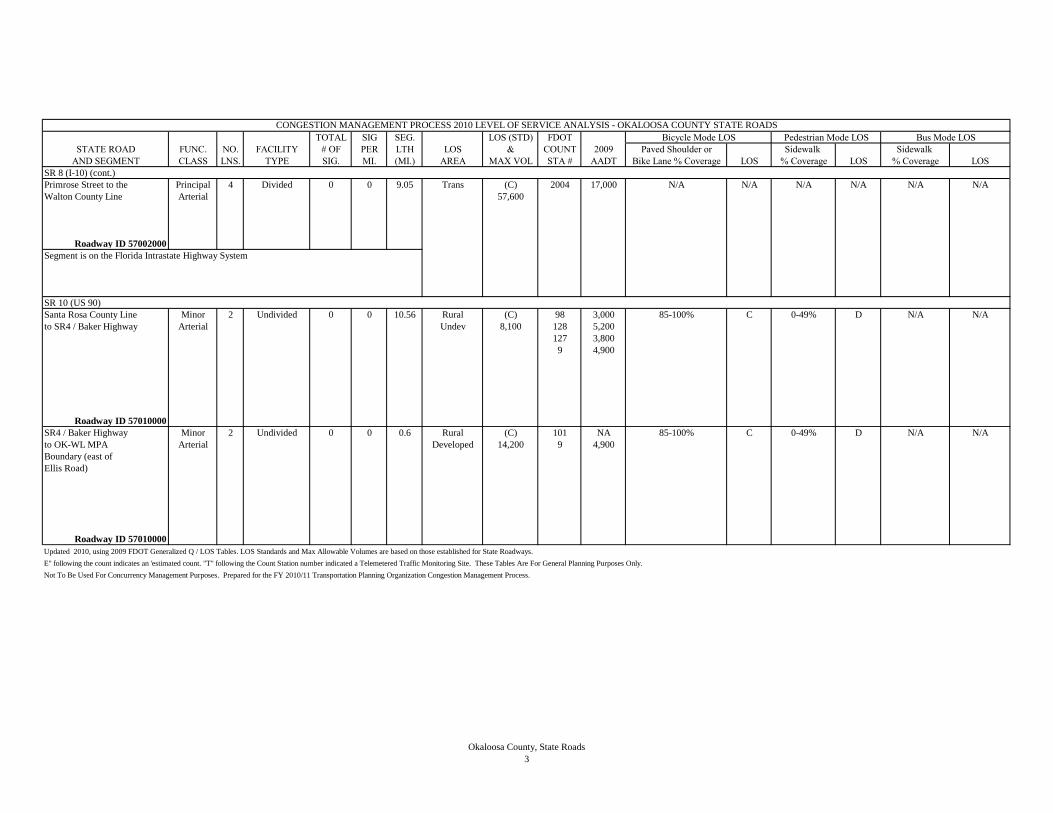
TOTAL SIG SEG. LOS (STD) FDOT
STATE ROAD FUNC. NO. FACILITY # OF PER LTH LOS & COUNT 2009 Paved Shoulder or Sidewalk Sidewalk
AND SEGMENT CLASS LNS. TYPE SIG. MI. (MI.) AREA MAX VOL STA # AADT Bike Lane % Coverage LOS % Coverage LOS % Coverage LOS
Bicycle Mode LOS Pedestrian Mode LOS Bus Mode LOS
CONGESTION MANAGEMENT PROCESS 2010 LEVEL OF SERVICE ANALYSIS - OKALOOSA COUNTY STATE ROADS
SR 8 (I-10) (cont.)
Primrose Street to the Principal 4 Divided 0 0 9.05 Trans (C) 2004 17,000 N/A N/A N/A N/A N/A N/A
Walton County Line Arterial 57,600
Roadway ID 57002000
Segment is on the Florida Intrastate Highway System
SR 10 (US 90)
Santa Rosa County Line Minor 2 Undivided 0 0 10.56 Rural (C) 98 3,000 85-100% C 0-49% D N/A N/A
to SR4 / Baker Highway Arterial Undev 8,100 128 5,200
127 3,800
9 4,900
Roadway ID 57010000
SR4 / Baker Highway Minor 2 Undivided 0 0 0.6 Rural (C) 101 NA 85-100% C 0-49% D N/A N/A
to OK-WL MPA Arterial Developed 14,200 9 4,900
Boundary (east of
Ellis Road)
Roadway ID 57010000
Updated 2010, using 2009 FDOT Generalized Q / LOS Tables. LOS Standards and Max Allowable Volumes are based on those established for State Roadways.
Not To Be Used For Concurrency Management Purposes. Prepared for the FY 2010/11 Transportation Planning Organization Congestion Management Process.
E" following the count indicates an 'estimated count. "T" following the Count Station number indicated a Telemetered Traffic Monitoring Site. These Tables Are For General Planning Purposes Only.
Okaloosa County, State Roads
3
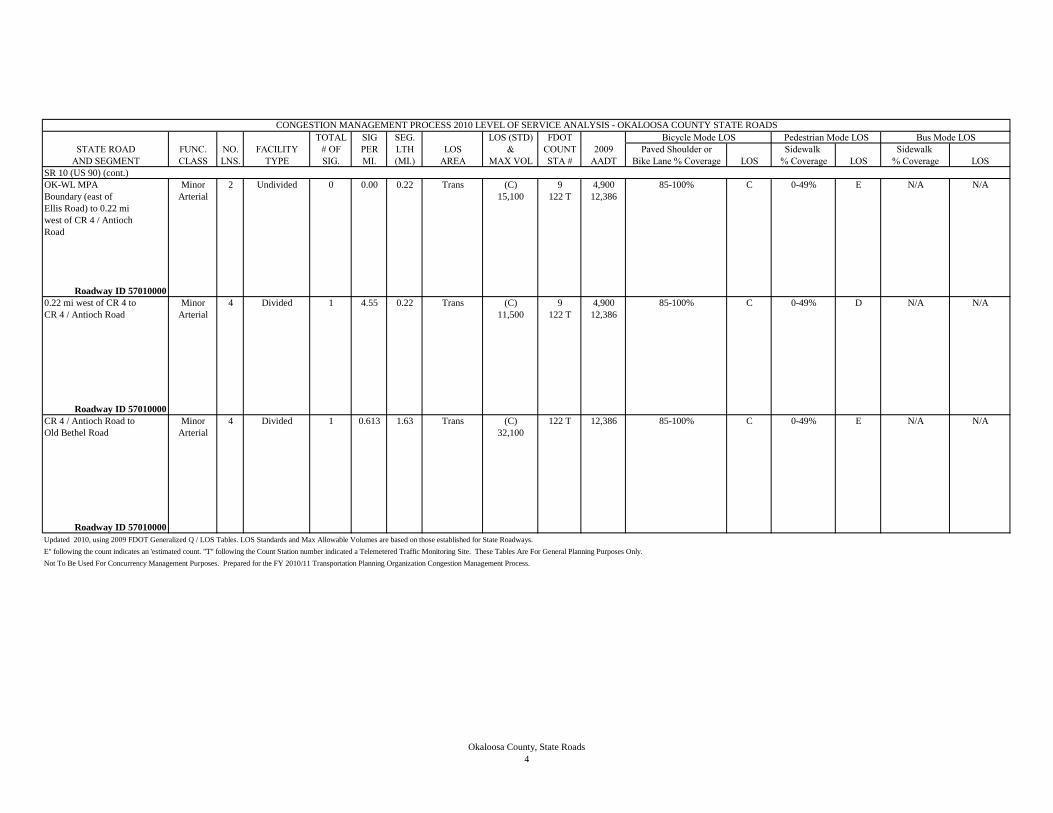
TOTAL SIG SEG. LOS (STD) FDOT
STATE ROAD FUNC. NO. FACILITY # OF PER LTH LOS & COUNT 2009 Paved Shoulder or Sidewalk Sidewalk
AND SEGMENT CLASS LNS. TYPE SIG. MI. (MI.) AREA MAX VOL STA # AADT Bike Lane % Coverage LOS % Coverage LOS % Coverage LOS
Bicycle Mode LOS Pedestrian Mode LOS Bus Mode LOS
CONGESTION MANAGEMENT PROCESS 2010 LEVEL OF SERVICE ANALYSIS - OKALOOSA COUNTY STATE ROADS
SR 10 (US 90) (cont.)
OK-WL MPA Minor 2 Undivided 0 0.00 0.22 Trans (C) 9 4,900 85-100% C 0-49% E N/A N/A
Boundary (east of Arterial 15,100 122 T 12,386
Ellis Road) to 0.22 mi
west of CR 4 / Antioch
Road
Roadway ID 57010000
0.22 mi west of CR 4 to Minor 4 Divided 1 4.55 0.22 Trans (C) 9 4,900 85-100% C 0-49% D N/A N/A
CR 4 / Antioch Road Arterial 11,500 122 T 12,386
Roadway ID 57010000
CR 4 / Antioch Road to Minor 4 Divided 1 0.613 1.63 Trans (C) 122 T 12,386 85-100% C 0-49% E N/A N/A
Old Bethel Road Arterial 32,100
Roadway ID 57010000
Updated 2010, using 2009 FDOT Generalized Q / LOS Tables. LOS Standards and Max Allowable Volumes are based on those established for State Roadways.
Not To Be Used For Concurrency Management Purposes. Prepared for the FY 2010/11 Transportation Planning Organization Congestion Management Process.
E" following the count indicates an 'estimated count. "T" following the Count Station number indicated a Telemetered Traffic Monitoring Site. These Tables Are For General Planning Purposes Only.
Okaloosa County, State Roads
4
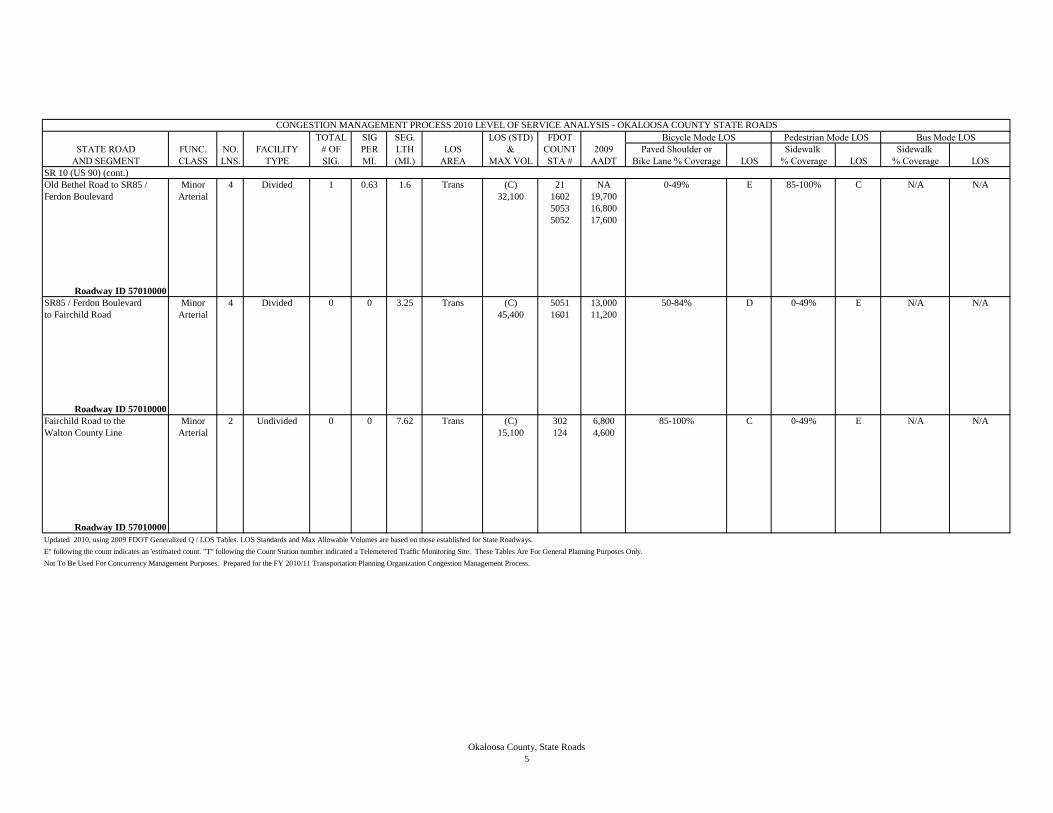
TOTAL SIG SEG. LOS (STD) FDOT
STATE ROAD FUNC. NO. FACILITY # OF PER LTH LOS & COUNT 2009 Paved Shoulder or Sidewalk Sidewalk
AND SEGMENT CLASS LNS. TYPE SIG. MI. (MI.) AREA MAX VOL STA # AADT Bike Lane % Coverage LOS % Coverage LOS % Coverage LOS
Bicycle Mode LOS Pedestrian Mode LOS Bus Mode LOS
CONGESTION MANAGEMENT PROCESS 2010 LEVEL OF SERVICE ANALYSIS - OKALOOSA COUNTY STATE ROADS
SR 10 (US 90) (cont.)
Old Bethel Road to SR85 / Minor 4 Divided 1 0.63 1.6 Trans (C) 21 NA 0-49% E 85-100% C N/A N/A
Ferdon Boulevard Arterial 32,100 1602 19,700
5053 16,800
5052 17,600
Roadway ID 57010000
SR85 / Ferdon Boulevard Minor 4 Divided 0 0 3.25 Trans (C) 5051 13,000 50-84% D 0-49% E N/A N/A
to Fairchild Road Arterial 45,400 1601 11,200
Roadway ID 57010000
Fairchild Road to the Minor 2 Undivided 0 0 7.62 Trans (C) 302 6,800 85-100% C 0-49% E N/A N/A
Walton County Line Arterial 15,100 124 4,600
Roadway ID 57010000
Updated 2010, using 2009 FDOT Generalized Q / LOS Tables. LOS Standards and Max Allowable Volumes are based on those established for State Roadways.
Not To Be Used For Concurrency Management Purposes. Prepared for the FY 2010/11 Transportation Planning Organization Congestion Management Process.
E" following the count indicates an 'estimated count. "T" following the Count Station number indicated a Telemetered Traffic Monitoring Site. These Tables Are For General Planning Purposes Only.
Okaloosa County, State Roads
5

TOTAL SIG SEG. LOS (STD) FDOT
STATE ROAD FUNC. NO. FACILITY # OF PER LTH LOS & COUNT 2009 Paved Shoulder or Sidewalk Sidewalk
AND SEGMENT CLASS LNS. TYPE SIG. MI. (MI.) AREA MAX VOL STA # AADT Bike Lane % Coverage LOS % Coverage LOS % Coverage LOS
Bicycle Mode LOS Pedestrian Mode LOS Bus Mode LOS
CONGESTION MANAGEMENT PROCESS 2010 LEVEL OF SERVICE ANALYSIS - OKALOOSA COUNTY STATE ROADS
SR 20
SR85N to 0.32 mi east of Principal 6 Divided 0 0 0.32 Urbanized (D) 5010 42,000 50-84% E 85-100% D 85-100% F
SR 85N Arterial 96,400 5008 T NA
Roadway ID 57040000
SR85N to SR285/ Partin Principal 6 Divided 1 1.11 0.9 Urbanized (D) 5010 42,000 0-49% E 85-100% D 85-100% F
Drive Arterial 55,300 5008 T NA
Roadway ID 57040000
SR285/ Partin Drive to Principal 4 Divided 5 1.92 2.6 Urbanized (D) 1502 36,500 0-49% E 85-100% E 85-100% F
Rocky Bayou Bridge Arterial 36,700 5076 34,500
5073 37,500
5009 43,000
Roadway ID 57040000
Updated 2010 using 2009 FDOT Generalized Q / LOS Tables. LOS Standards and Max Allowable Volumes are based on those established for State Roadways.
Not To Be Used For Concurrency Management Purposes. Prepared for the FY 2010/11 Transportation Planning Organization Congestion Management Process.
E" following the count indicates an 'estimated count. "T" following the Count Station number indicated a Telemetered Traffic Monitoring Site. These Tables Are For General Planning Purposes Only.
Okaloosa County, State Roads
6

TOTAL SIG SEG. LOS (STD) FDOT
STATE ROAD FUNC. NO. FACILITY # OF PER LTH LOS & COUNT 2009 Paved Shoulder or Sidewalk Sidewalk
AND SEGMENT CLASS LNS. TYPE SIG. MI. (MI.) AREA MAX VOL STA # AADT Bike Lane % Coverage LOS % Coverage LOS % Coverage LOS
Bicycle Mode LOS Pedestrian Mode LOS Bus Mode LOS
CONGESTION MANAGEMENT PROCESS 2010 LEVEL OF SERVICE ANALYSIS - OKALOOSA COUNTY STATE ROADS
SR 20 (cont.)
Rocky Bayou Principal 4 Divided 5 2.06 2.43 Urbanized (D) 298 38,000 50-84% D 85-100% D 85-100% F
Bridge to SR 293 /White Arterial 33,200 294 30,500
Point Road
Roadway ID 57040000
SR 293/ White Point Principal 2 Undivided 0 0 1.5 Urbanized (D) 110 8,500 85-100% C 0-49% E 0-49% F
Road to Walton County Arterial 22,200
Line
Roadway ID 57040000
SR 30 (US 98)
Santa Rosa County Line Principal 4 Divided 2 0.34 5.85 Urbanized (D) 167 T 36,403 85-100% C 0-49% F 0-49% F
to Hurlburt Field Gate Arterial 36,700 306 37,000
Roadway ID 57030000
Updated 2010, using 2009 FDOT Generalized Q / LOS Tables. LOS Standards and Max Allowable Volumes are based on those established for State Roadways.
Not To Be Used For Concurrency Management Purposes. Prepared for the FY 2010/11 Transportation Planning Organization Congestion Management Process.
E" following the count indicates an 'estimated count. "T" following the Count Station number indicated a Telemetered Traffic Monitoring Site. These Tables Are For General Planning Purposes Only.
Okaloosa County, State Roads
7
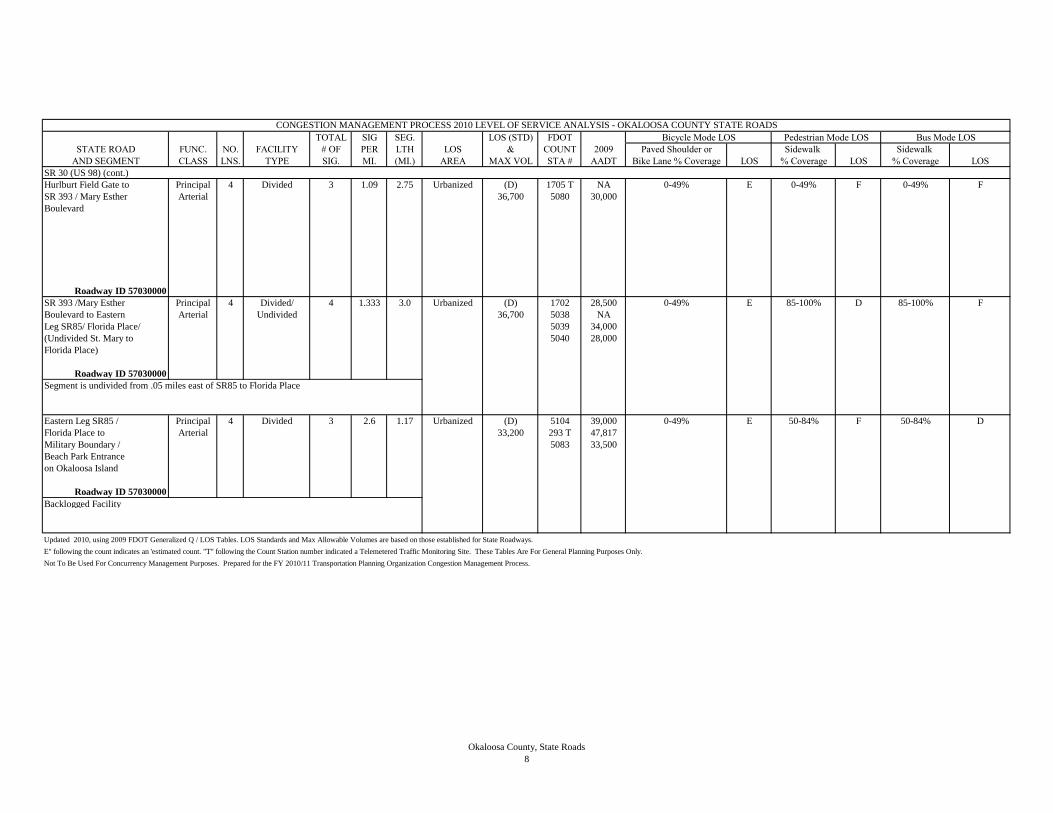
TOTAL SIG SEG. LOS (STD) FDOT
STATE ROAD FUNC. NO. FACILITY # OF PER LTH LOS & COUNT 2009 Paved Shoulder or Sidewalk Sidewalk
AND SEGMENT CLASS LNS. TYPE SIG. MI. (MI.) AREA MAX VOL STA # AADT Bike Lane % Coverage LOS % Coverage LOS % Coverage LOS
Bicycle Mode LOS Pedestrian Mode LOS Bus Mode LOS
CONGESTION MANAGEMENT PROCESS 2010 LEVEL OF SERVICE ANALYSIS - OKALOOSA COUNTY STATE ROADS
SR 30 (US 98) (cont.)
Hurlburt Field Gate to Principal 4 Divided 3 1.09 2.75 Urbanized (D) 1705 T NA 0-49% E 0-49% F 0-49% F
SR 393 / Mary Esther Arterial 36,700 5080 30,000
Boulevard
Roadway ID 57030000
SR 393 /Mary Esther Principal 4 Divided/ 4 1.333 3.0 Urbanized (D) 1702 28,500 0-49% E 85-100% D 85-100% F
Boulevard to Eastern Arterial Undivided 36,700 5038 NA
Leg SR85/ Florida Place/ 5039 34,000
(Undivided St. Mary to 5040 28,000
Florida Place)
Roadway ID 57030000
Segment is undivided from .05 miles east of SR85 to Florida Place
Eastern Leg SR85 / Principal 4 Divided 3 2.6 1.17 Urbanized (D) 5104 39,000 0-49% E 50-84% F 50-84% D
Florida Place to Arterial 33,200 293 T 47,817
Military Boundary / 5083 33,500
Beach Park Entrance
on Okaloosa Island
Roadway ID 57030000
Backlogged Facility
Updated 2010, using 2009 FDOT Generalized Q / LOS Tables. LOS Standards and Max Allowable Volumes are based on those established for State Roadways.
Not To Be Used For Concurrency Management Purposes. Prepared for the FY 2010/11 Transportation Planning Organization Congestion Management Process.
E" following the count indicates an 'estimated count. "T" following the Count Station number indicated a Telemetered Traffic Monitoring Site. These Tables Are For General Planning Purposes Only.
Okaloosa County, State Roads
8

TOTAL SIG SEG. LOS (STD) FDOT
STATE ROAD FUNC. NO. FACILITY # OF PER LTH LOS & COUNT 2009 Paved Shoulder or Sidewalk Sidewalk
AND SEGMENT CLASS LNS. TYPE SIG. MI. (MI.) AREA MAX VOL STA # AADT Bike Lane % Coverage LOS % Coverage LOS % Coverage LOS
Bicycle Mode LOS Pedestrian Mode LOS Bus Mode LOS
CONGESTION MANAGEMENT PROCESS 2010 LEVEL OF SERVICE ANALYSIS - OKALOOSA COUNTY STATE ROADS
SR 30 (US 98) (cont.)
Military Boundary to Principal 4 Divided 0 0 4.06 Urbanized (D) 18 34,500 85-100% C 0-49% F 0-49% D
East Pass Bridge Arterial 64,300
Roadway ID 57030000
East Pass Bridge (west Principal 4 Divided 5 1.9 2.65 Urbanized (D) 107 NA 0-49% E 85-100% E 85-100% C
end) to Gulf Shore Drive Arterial 36,700 5136 NA
5132 40,500
397 T NA
Roadway ID 57030000
Backlogged Facility
Gulf Shore Drive to Principal 4 Divided 2 2 1.00 Urbanized (D) 5130 47,000 0-49% E 85-100% E 85-100% C
Emerald Coast Parkway/ Arterial 33,200
Old US98
Roadway ID 57030000
Backlogged Facility
Updated 2010, using 2009 FDOT Generalized Q / LOS Tables. LOS Standards and Max Allowable Volumes are based on those established for State Roadways.
Not To Be Used For Concurrency Management Purposes. Prepared for the FY 2010/11 Transportation Planning Organization Congestion Management Process.
E" following the count indicates an 'estimated count. "T" following the Count Station number indicated a Telemetered Traffic Monitoring Site. These Tables Are For General Planning Purposes Only.
Okaloosa County, State Roads
9
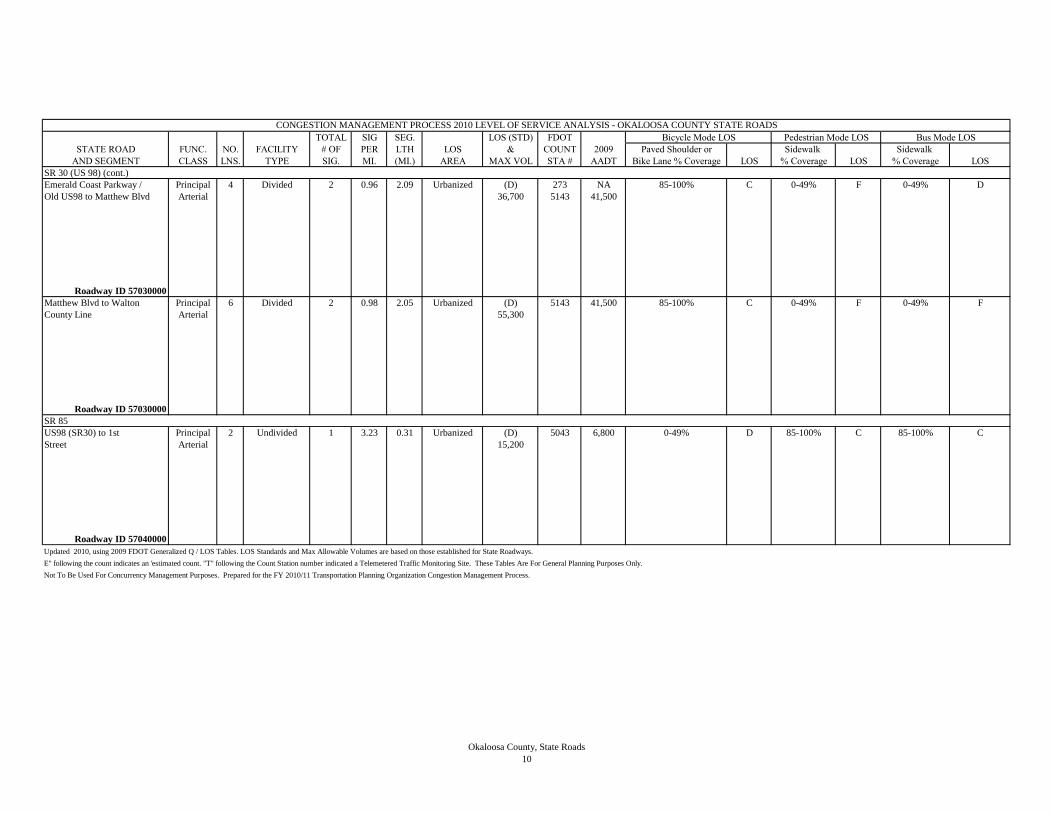
TOTAL SIG SEG. LOS (STD) FDOT
STATE ROAD FUNC. NO. FACILITY # OF PER LTH LOS & COUNT 2009 Paved Shoulder or Sidewalk Sidewalk
AND SEGMENT CLASS LNS. TYPE SIG. MI. (MI.) AREA MAX VOL STA # AADT Bike Lane % Coverage LOS % Coverage LOS % Coverage LOS
Bicycle Mode LOS Pedestrian Mode LOS Bus Mode LOS
CONGESTION MANAGEMENT PROCESS 2010 LEVEL OF SERVICE ANALYSIS - OKALOOSA COUNTY STATE ROADS
SR 30 (US 98) (cont.)
Emerald Coast Parkway / Principal 4 Divided 2 0.96 2.09 Urbanized (D) 273 NA 85-100% C 0-49% F 0-49% D
Old US98 to Matthew Blvd Arterial 36,700 5143 41,500
Roadway ID 57030000
Matthew Blvd to Walton Principal 6 Divided 2 0.98 2.05 Urbanized (D) 5143 41,500 85-100% C 0-49% F 0-49% F
County Line Arterial 55,300
Roadway ID 57030000
SR 85
US98 (SR30) to 1st Principal 2 Undivided 1 3.23 0.31 Urbanized (D) 5043 6,800 0-49% D 85-100% C 85-100% C
Street Arterial 15,200
Roadway ID 57040000
Updated 2010, using 2009 FDOT Generalized Q / LOS Tables. LOS Standards and Max Allowable Volumes are based on those established for State Roadways.
Not To Be Used For Concurrency Management Purposes. Prepared for the FY 2010/11 Transportation Planning Organization Congestion Management Process.
E" following the count indicates an 'estimated count. "T" following the Count Station number indicated a Telemetered Traffic Monitoring Site. These Tables Are For General Planning Purposes Only.
Okaloosa County, State Roads
10
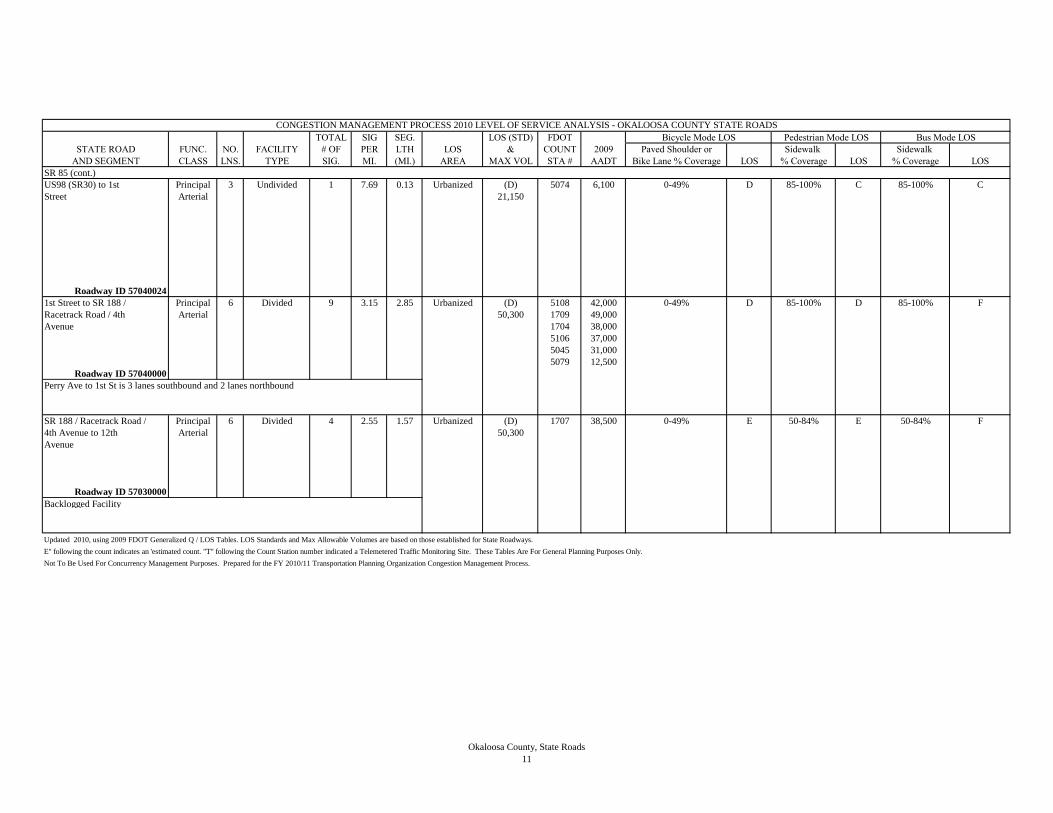
TOTAL SIG SEG. LOS (STD) FDOT
STATE ROAD FUNC. NO. FACILITY # OF PER LTH LOS & COUNT 2009 Paved Shoulder or Sidewalk Sidewalk
AND SEGMENT CLASS LNS. TYPE SIG. MI. (MI.) AREA MAX VOL STA # AADT Bike Lane % Coverage LOS % Coverage LOS % Coverage LOS
Bicycle Mode LOS Pedestrian Mode LOS Bus Mode LOS
CONGESTION MANAGEMENT PROCESS 2010 LEVEL OF SERVICE ANALYSIS - OKALOOSA COUNTY STATE ROADS
SR 85 (cont.)
US98 (SR30) to 1st Principal 3 Undivided 1 7.69 0.13 Urbanized (D) 5074 6,100 0-49% D 85-100% C 85-100% C
Street Arterial 21,150
Roadway ID 57040024
1st Street to SR 188 / Principal 6 Divided 9 3.15 2.85 Urbanized (D) 5108 42,000 0-49% D 85-100% D 85-100% F
Racetrack Road / 4th Arterial 50,300 1709 49,000
Avenue 1704 38,000
5106 37,000
5045 31,000
5079 12,500
Roadway ID 57040000
Perry Ave to 1st St is 3 lanes southbound and 2 lanes northbound
SR 188 / Racetrack Road / Principal 6 Divided 4 2.55 1.57 Urbanized (D) 1707 38,500 0-49% E 50-84% E 50-84% F
4th Avenue to 12th Arterial 50,300
Avenue
Roadway ID 57030000
Backlogged Facility
Updated 2010, using 2009 FDOT Generalized Q / LOS Tables. LOS Standards and Max Allowable Volumes are based on those established for State Roadways.
Not To Be Used For Concurrency Management Purposes. Prepared for the FY 2010/11 Transportation Planning Organization Congestion Management Process.
E" following the count indicates an 'estimated count. "T" following the Count Station number indicated a Telemetered Traffic Monitoring Site. These Tables Are For General Planning Purposes Only.
Okaloosa County, State Roads
11
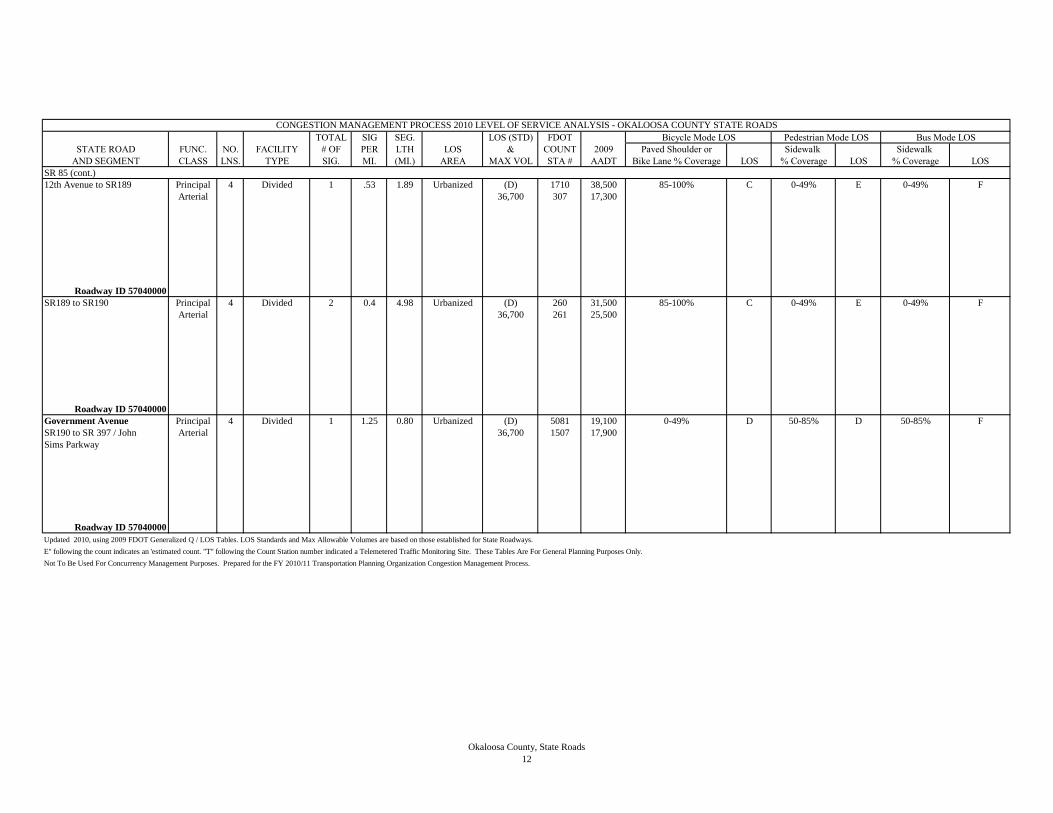
TOTAL SIG SEG. LOS (STD) FDOT
STATE ROAD FUNC. NO. FACILITY # OF PER LTH LOS & COUNT 2009 Paved Shoulder or Sidewalk Sidewalk
AND SEGMENT CLASS LNS. TYPE SIG. MI. (MI.) AREA MAX VOL STA # AADT Bike Lane % Coverage LOS % Coverage LOS % Coverage LOS
Bicycle Mode LOS Pedestrian Mode LOS Bus Mode LOS
CONGESTION MANAGEMENT PROCESS 2010 LEVEL OF SERVICE ANALYSIS - OKALOOSA COUNTY STATE ROADS
SR 85 (cont.)
12th Avenue to SR189 Principal 4 Divided 1 .53 1.89 Urbanized (D) 1710 38,500 85-100% C 0-49% E 0-49% F
Arterial 36,700 307 17,300
Roadway ID 57040000
SR189 to SR190 Principal 4 Divided 2 0.4 4.98 Urbanized (D) 260 31,500 85-100% C 0-49% E 0-49% F
Arterial 36,700 261 25,500
Roadway ID 57040000
Government Avenue Principal 4 Divided 1 1.25 0.80 Urbanized (D) 5081 19,100 0-49% D 50-85% D 50-85% F
SR190 to SR 397 / John Arterial 36,700 1507 17,900
Sims Parkway
Roadway ID 57040000
Updated 2010, using 2009 FDOT Generalized Q / LOS Tables. LOS Standards and Max Allowable Volumes are based on those established for State Roadways.
Not To Be Used For Concurrency Management Purposes. Prepared for the FY 2010/11 Transportation Planning Organization Congestion Management Process.
E" following the count indicates an 'estimated count. "T" following the Count Station number indicated a Telemetered Traffic Monitoring Site. These Tables Are For General Planning Purposes Only.
Okaloosa County, State Roads
12
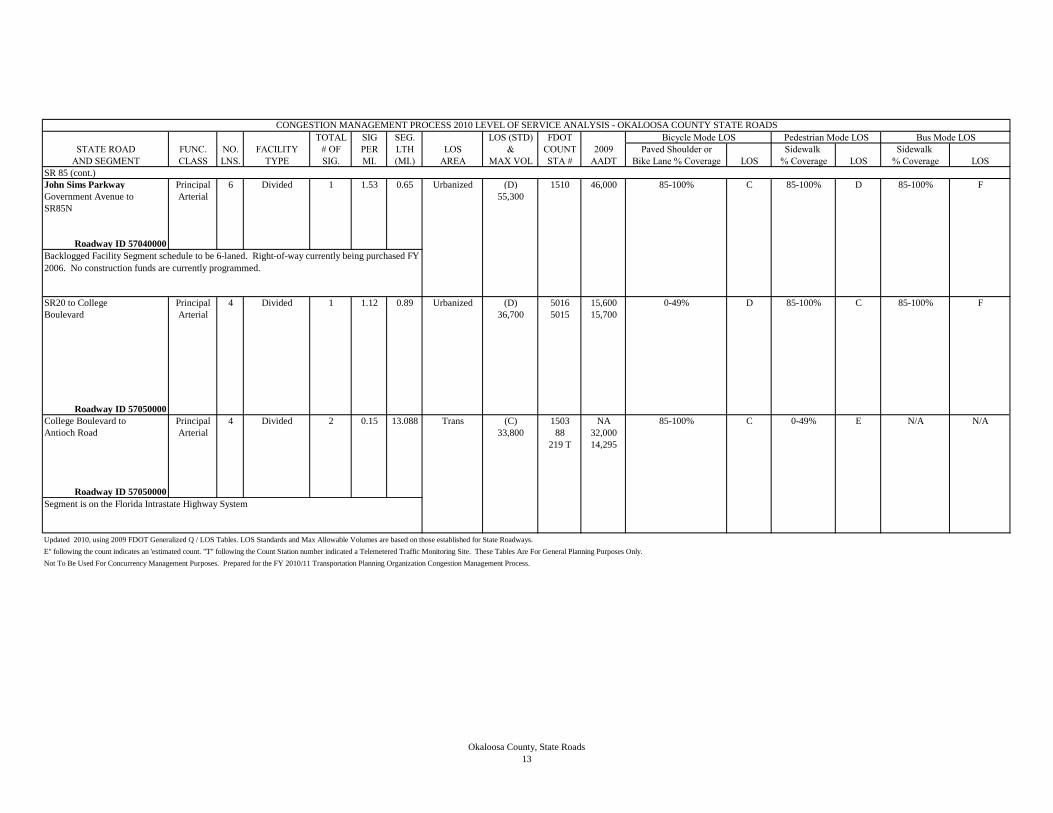
TOTAL SIG SEG. LOS (STD) FDOT
STATE ROAD FUNC. NO. FACILITY # OF PER LTH LOS & COUNT 2009 Paved Shoulder or Sidewalk Sidewalk
AND SEGMENT CLASS LNS. TYPE SIG. MI. (MI.) AREA MAX VOL STA # AADT Bike Lane % Coverage LOS % Coverage LOS % Coverage LOS
Bicycle Mode LOS Pedestrian Mode LOS Bus Mode LOS
CONGESTION MANAGEMENT PROCESS 2010 LEVEL OF SERVICE ANALYSIS - OKALOOSA COUNTY STATE ROADS
SR 85 (cont.)
John Sims Parkway Principal 6 Divided 1 1.53 0.65 Urbanized (D) 1510 46,000 85-100% C 85-100% D 85-100% F
Government Avenue to Arterial 55,300
SR85N
Roadway ID 57040000
SR20 to College Principal 4 Divided 1 1.12 0.89 Urbanized (D) 5016 15,600 0-49% D 85-100% C 85-100% F
Boulevard Arterial 36,700 5015 15,700
Roadway ID 57050000
College Boulevard to Principal 4 Divided 2 0.15 13.088 Trans (C) 1503 NA 85-100% C 0-49% E N/A N/A
Antioch Road Arterial 33,800 88 32,000
219 T 14,295
Roadway ID 57050000
Updated 2010, using 2009 FDOT Generalized Q / LOS Tables. LOS Standards and Max Allowable Volumes are based on those established for State Roadways.
Not To Be Used For Concurrency Management Purposes. Prepared for the FY 2010/11 Transportation Planning Organization Congestion Management Process.
Segment is on the Florida Intrastate Highway System
E" following the count indicates an 'estimated count. "T" following the Count Station number indicated a Telemetered Traffic Monitoring Site. These Tables Are For General Planning Purposes Only.
Backlogged Facility Segment schedule to be 6-laned. Right-of-way currently being purchased FY
2006. No construction funds are currently programmed.
Okaloosa County, State Roads
13

TOTAL SIG SEG. LOS (STD) FDOT
STATE ROAD FUNC. NO. FACILITY # OF PER LTH LOS & COUNT 2009 Paved Shoulder or Sidewalk Sidewalk
AND SEGMENT CLASS LNS. TYPE SIG. MI. (MI.) AREA MAX VOL STA # AADT Bike Lane % Coverage LOS % Coverage LOS % Coverage LOS
Bicycle Mode LOS Pedestrian Mode LOS Bus Mode LOS
CONGESTION MANAGEMENT PROCESS 2010 LEVEL OF SERVICE ANALYSIS - OKALOOSA COUNTY STATE ROADS
SR 85 (cont.)
Antioch Road to I-10 Principal 4 Divided 3 1.72 1.74 Trans (C) 1607 43,000 85-100% C 0-49% F N/A N/A
(SR8) Arterial 32,100
Roadway ID 57050000
I-10 (SR8) to Principal 4 Divided 5 1.87 2.68 Trans (C) 1606 45,500 0-49% E 85-100% E N/A N/A
US90 / SR 10 Arterial 32,100 5060 37,000
5058 37,000
Roadway ID 57050000
US90 / SR 10 to CR 188/ Principal 4 Divided 5 2.07 2.42 Trans (C) 5057 25,000 0-49% E 85-100% D N/A N/A
Old Bethel Road Arterial 22,700 5112 27,000
1603 21,500
1710 31,500
Roadway ID 57060000
Updated 2010, using 2009 FDOT Generalized Q / LOS Tables. LOS Standards and Max Allowable Volumes are based on those established for State Roadways.
Not To Be Used For Concurrency Management Purposes. Prepared for the FY 2010/11 Transportation Planning Organization Congestion Management Process.
Segment is on the Florida Intrastate Highway System
E" following the count indicates an 'estimated count. "T" following the Count Station number indicated a Telemetered Traffic Monitoring Site. These Tables Are For General Planning Purposes Only.
Okaloosa County, State Roads
14
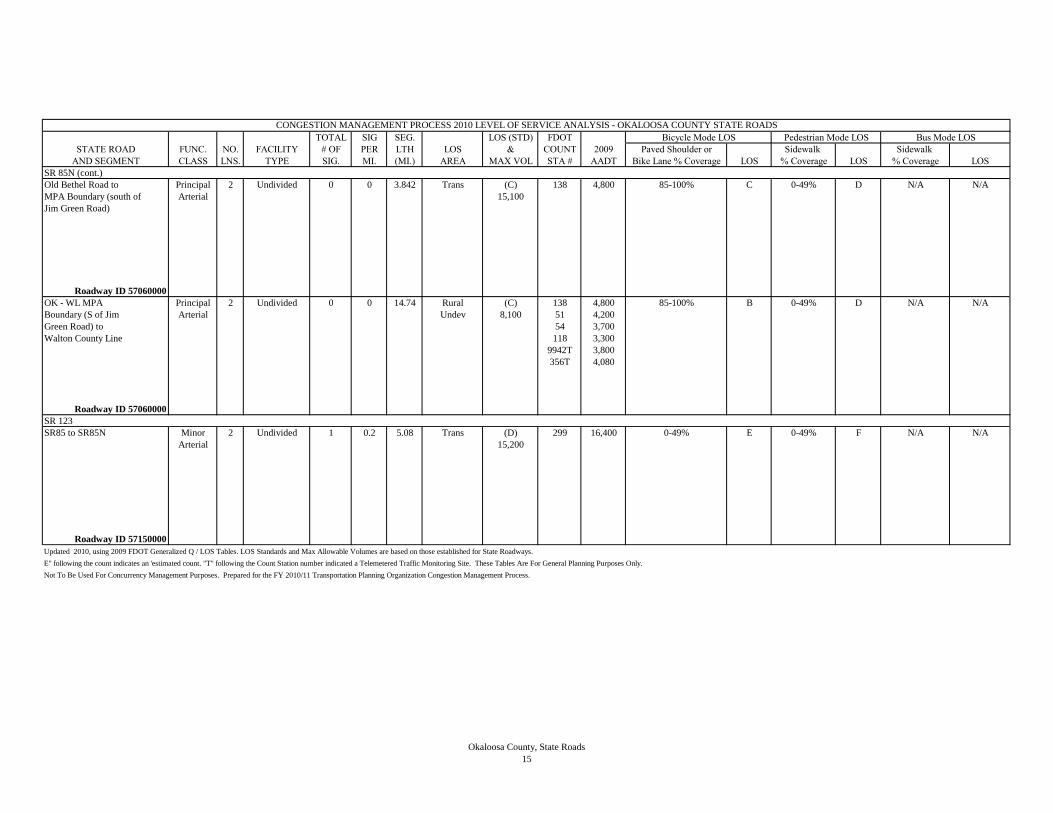
TOTAL SIG SEG. LOS (STD) FDOT
STATE ROAD FUNC. NO. FACILITY # OF PER LTH LOS & COUNT 2009 Paved Shoulder or Sidewalk Sidewalk
AND SEGMENT CLASS LNS. TYPE SIG. MI. (MI.) AREA MAX VOL STA # AADT Bike Lane % Coverage LOS % Coverage LOS % Coverage LOS
Bicycle Mode LOS Pedestrian Mode LOS Bus Mode LOS
CONGESTION MANAGEMENT PROCESS 2010 LEVEL OF SERVICE ANALYSIS - OKALOOSA COUNTY STATE ROADS
SR 85N (cont.)
Old Bethel Road to Principal 2 Undivided 0 0 3.842 Trans (C) 138 4,800 85-100% C 0-49% D N/A N/A
MPA Boundary (south of Arterial 15,100
Jim Green Road)
Roadway ID 57060000
OK - WL MPA Principal 2 Undivided 0 0 14.74 Rural (C) 138 4,800 85-100% B 0-49% D N/A N/A
Boundary (S of Jim Arterial Undev 8,100 51 4,200
Green Road) to 54 3,700
Walton County Line 118 3,300
9942T 3,800
356T 4,080
Roadway ID 57060000
SR 123
SR85 to SR85N Minor 2 Undivided 1 0.2 5.08 Trans (D) 299 16,400 0-49% E 0-49% F N/A N/A
Arterial 15,200
Roadway ID 57150000
Updated 2010, using 2009 FDOT Generalized Q / LOS Tables. LOS Standards and Max Allowable Volumes are based on those established for State Roadways.
Not To Be Used For Concurrency Management Purposes. Prepared for the FY 2010/11 Transportation Planning Organization Congestion Management Process.
E" following the count indicates an 'estimated count. "T" following the Count Station number indicated a Telemetered Traffic Monitoring Site. These Tables Are For General Planning Purposes Only.
Okaloosa County, State Roads
15
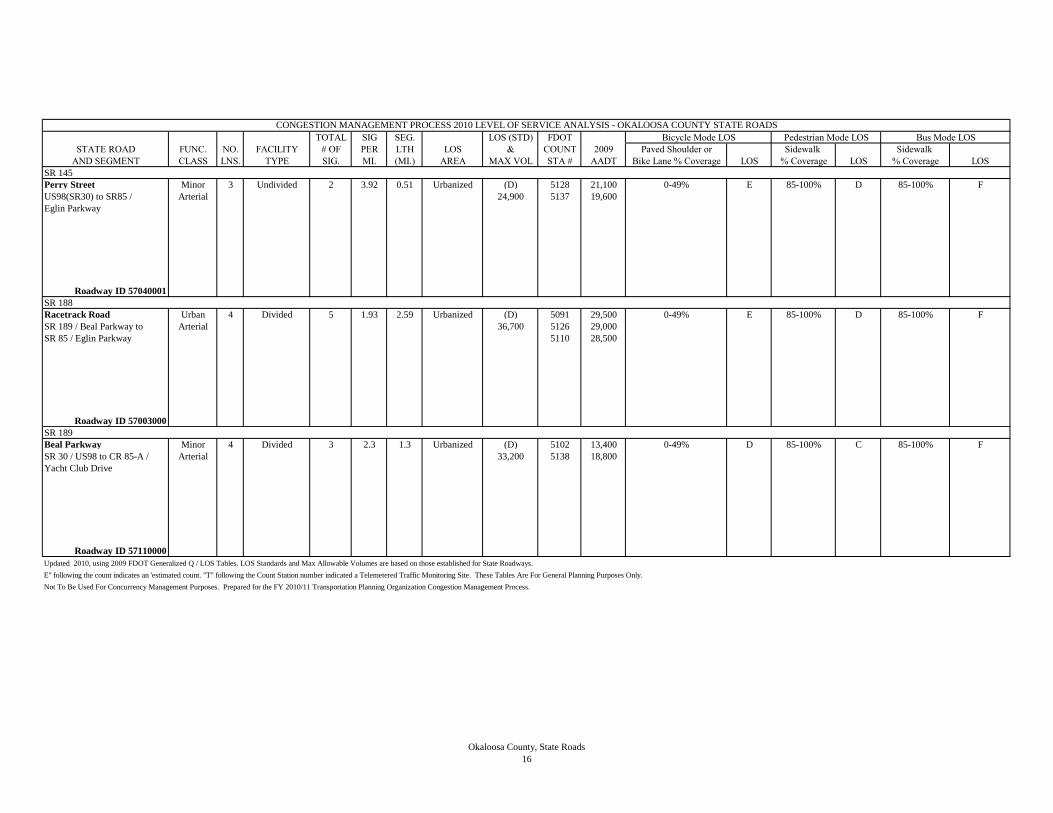
TOTAL SIG SEG. LOS (STD) FDOT
STATE ROAD FUNC. NO. FACILITY # OF PER LTH LOS & COUNT 2009 Paved Shoulder or Sidewalk Sidewalk
AND SEGMENT CLASS LNS. TYPE SIG. MI. (MI.) AREA MAX VOL STA # AADT Bike Lane % Coverage LOS % Coverage LOS % Coverage LOS
Bicycle Mode LOS Pedestrian Mode LOS Bus Mode LOS
CONGESTION MANAGEMENT PROCESS 2010 LEVEL OF SERVICE ANALYSIS - OKALOOSA COUNTY STATE ROADS
SR 145
Perry Street Minor 3 Undivided 2 3.92 0.51 Urbanized (D) 5128 21,100 0-49% E 85-100% D 85-100% F
US98(SR30) to SR85 / Arterial 24,900 5137 19,600
Eglin Parkway
Roadway ID 57040001
SR 188
Racetrack Road Urban 4 Divided 5 1.93 2.59 Urbanized (D) 5091 29,500 0-49% E 85-100% D 85-100% F
SR 189 / Beal Parkway to Arterial 36,700 5126 29,000
SR 85 / Eglin Parkway 5110 28,500
Roadway ID 57003000
SR 189
Beal Parkway Minor 4 Divided 3 2.3 1.3 Urbanized (D) 5102 13,400 0-49% D 85-100% C 85-100% F
SR 30 / US98 to CR 85-A / Arterial 33,200 5138 18,800
Yacht Club Drive
Roadway ID 57110000
Updated 2010, using 2009 FDOT Generalized Q / LOS Tables. LOS Standards and Max Allowable Volumes are based on those established for State Roadways.
Not To Be Used For Concurrency Management Purposes. Prepared for the FY 2010/11 Transportation Planning Organization Congestion Management Process.
E" following the count indicates an 'estimated count. "T" following the Count Station number indicated a Telemetered Traffic Monitoring Site. These Tables Are For General Planning Purposes Only.
Okaloosa County, State Roads
16

TOTAL SIG SEG. LOS (STD) FDOT
STATE ROAD FUNC. NO. FACILITY # OF PER LTH LOS & COUNT 2009 Paved Shoulder or Sidewalk Sidewalk
AND SEGMENT CLASS LNS. TYPE SIG. MI. (MI.) AREA MAX VOL STA # AADT Bike Lane % Coverage LOS % Coverage LOS % Coverage LOS
Bicycle Mode LOS Pedestrian Mode LOS Bus Mode LOS
CONGESTION MANAGEMENT PROCESS 2010 LEVEL OF SERVICE ANALYSIS - OKALOOSA COUNTY STATE ROADS
SR 189 (cont.)
Beal Parkway Minor 4 Divided 2 1.3 1.55 Urbanized (D) 5034 24,500 0-49% E 85-100% D 85-100% F
CR 85-A /Yacht Club Arterial 36,700 1701 27,500
Drive to SR 393 / Mary
Esther Boulevard / Oak
Street
Roadway ID 57110000
SR 393 / Mary Esther Minor 4 Divided 4 2.7 1.46 Urbanized (D) 5095 47,500 0-49% E 85-100% E 85-100% F
Boulevard / Oak Street Arterial 33,200 5123 T NA
to SR 188 / Racetrack 5113 42,500
Road
Roadway ID 57110000
Lewis Turner Minor 4 Divided 3 1.42 2.11 Urbanized (D) 5090 34,000 0-49% E 85-100% D 85-100% F
Boulevard Arterial 36,700 5089 NA
SR 188 / Racetrack Road 250 T 28,828
to Mooney Road
Roadway ID 57130000
Updated 2010, using 2009 FDOT Generalized Q / LOS Tables. LOS Standards and Max Allowable Volumes are based on those established for State Roadways.
Not To Be Used For Concurrency Management Purposes. Prepared for the FY 2010/11 Transportation Planning Organization Congestion Management Process.
E" following the count indicates an 'estimated count. "T" following the Count Station number indicated a Telemetered Traffic Monitoring Site. These Tables Are For General Planning Purposes Only.
Backlogged Facility
Okaloosa County, State Roads
17

TOTAL SIG SEG. LOS (STD) FDOT
STATE ROAD FUNC. NO. FACILITY # OF PER LTH LOS & COUNT 2009 Paved Shoulder or Sidewalk Sidewalk
AND SEGMENT CLASS LNS. TYPE SIG. MI. (MI.) AREA MAX VOL STA # AADT Bike Lane % Coverage LOS % Coverage LOS % Coverage LOS
Bicycle Mode LOS Pedestrian Mode LOS Bus Mode LOS
CONGESTION MANAGEMENT PROCESS 2010 LEVEL OF SERVICE ANALYSIS - OKALOOSA COUNTY STATE ROADS
SR 189 (cont.)
Lewis Turner Minor 4 Divided 1 .28 3.6 Urbanized (D) 1706 31,500 85-100% C 0-49% E 0-49% F
Boulevard Arterial 36,700 290 21,600
Mooney Road to SR85
Roadway ID 57130000
SR85 to Eglin Minor 4 Divided 1 2 0.5 Urbanized (D) 291 11,300 85-100% B 0-49% E 0-49% F
Boulevard / SR 397 Arterial 33,200
Roadway ID 57130000
SR 189
SR 4 / Georgia Avenue Minor 2 Undivided 0 0 14.4 Rural (C) 5 4,000 85-100% B 0-49% D N/A N/A
to Alabama State Line Arterial Undev 8,100 120 2,600
121 2,100
1 1,900
Roadway ID 57070000
Updated 2010, using 2009 FDOT Generalized Q / LOS Tables. LOS Standards and Max Allowable Volumes are based on those established for State Roadways.
Not To Be Used For Concurrency Management Purposes. Prepared for the FY 2010/11 Transportation Planning Organization Congestion Management Process.
E" following the count indicates an 'estimated count. "T" following the Count Station number indicated a Telemetered Traffic Monitoring Site. These Tables Are For General Planning Purposes Only.
Okaloosa County, State Roads
18

TOTAL SIG SEG. LOS (STD) FDOT
STATE ROAD FUNC. NO. FACILITY # OF PER LTH LOS & COUNT 2009 Paved Shoulder or Sidewalk Sidewalk
AND SEGMENT CLASS LNS. TYPE SIG. MI. (MI.) AREA MAX VOL STA # AADT Bike Lane % Coverage LOS % Coverage LOS % Coverage LOS
Bicycle Mode LOS Pedestrian Mode LOS Bus Mode LOS
CONGESTION MANAGEMENT PROCESS 2010 LEVEL OF SERVICE ANALYSIS - OKALOOSA COUNTY STATE ROADS
SR 190
Valparaiso Boulevard Minor 2 Undivided 0 0 1.25 Urbanized (D) 1504 3,500 85-100% B 50-85% D 50-85% F
SR85 to SR397 / John Arterial 22,200 5022 3,400
Sims Parkway
Roadway ID 57040027
SR 285
Partin Drive Minor 4 Divided 1 0.95 1.05 Urbanized (D) 5077 8,000 0-49% D 50-85% D 50-85% F
SR20 to Swift Creek Arterial 36,700
Bridge (south end)
Roadway ID 57090000
Swift Creek Bridge Minor 4 Divided 1 1.33 .75 Urbanized (D) 1506 7,300 0-49% D 0-49% D 0-49% F
(south end) to College Arterial 36,700
Boulevard / OK-WL
Urbanized Area Boundary
Roadway ID 57090000
Updated 2010, using 2009 FDOT Generalized Q / LOS Tables. LOS Standards and Max Allowable Volumes are based on those established for State Roadways.
Not To Be Used For Concurrency Management Purposes. Prepared for the FY 2010/11 Transportation Planning Organization Congestion Management Process.
E" following the count indicates an 'estimated count. "T" following the Count Station number indicated a Telemetered Traffic Monitoring Site. These Tables Are For General Planning Purposes Only.
Okaloosa County, State Roads
19
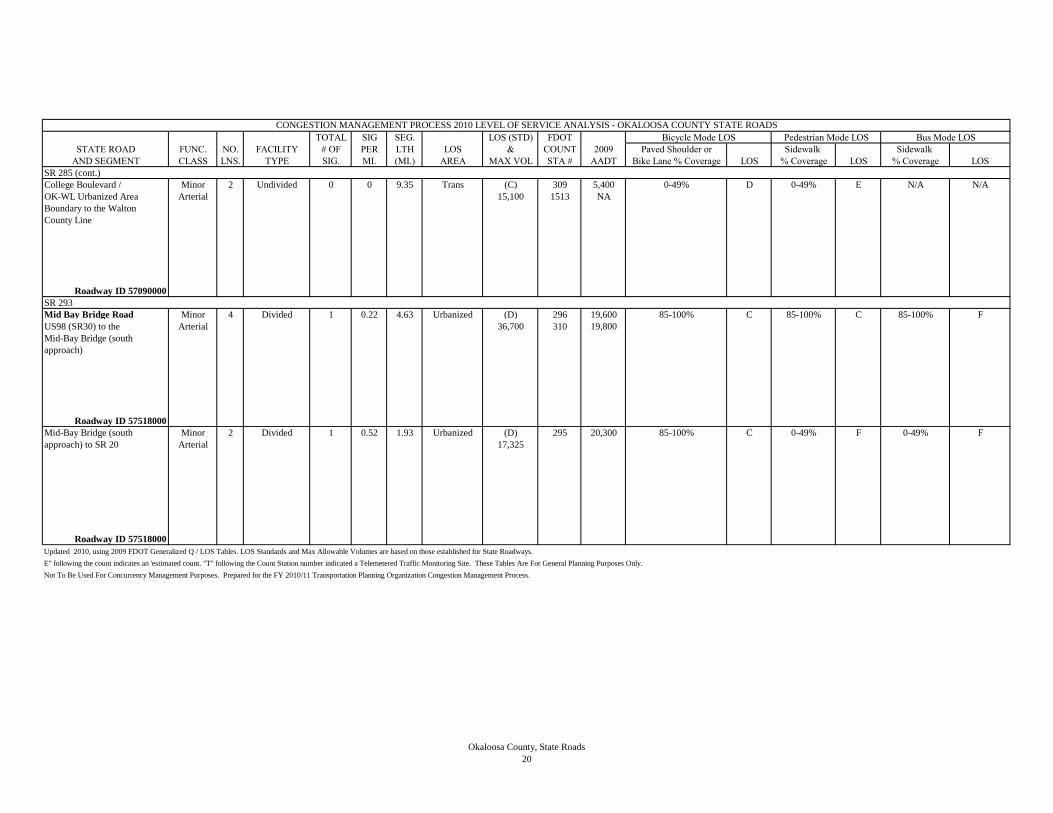
TOTAL SIG SEG. LOS (STD) FDOT
STATE ROAD FUNC. NO. FACILITY # OF PER LTH LOS & COUNT 2009 Paved Shoulder or Sidewalk Sidewalk
AND SEGMENT CLASS LNS. TYPE SIG. MI. (MI.) AREA MAX VOL STA # AADT Bike Lane % Coverage LOS % Coverage LOS % Coverage LOS
Bicycle Mode LOS Pedestrian Mode LOS Bus Mode LOS
CONGESTION MANAGEMENT PROCESS 2010 LEVEL OF SERVICE ANALYSIS - OKALOOSA COUNTY STATE ROADS
SR 285 (cont.)
College Boulevard / Minor 2 Undivided 0 0 9.35 Trans (C) 309 5,400 0-49% D 0-49% E N/A N/A
OK-WL Urbanized Area Arterial 15,100 1513 NA
Boundary to the Walton
County Line
Roadway ID 57090000
SR 293
Mid Bay Bridge Road Minor 4 Divided 1 0.22 4.63 Urbanized (D) 296 19,600 85-100% C 85-100% C 85-100% F
US98 (SR30) to the Arterial 36,700 310 19,800
Mid-Bay Bridge (south
approach)
Roadway ID 57518000
Mid-Bay Bridge (south Minor 2 Divided 1 0.52 1.93 Urbanized (D) 295 20,300 85-100% C 0-49% F 0-49% F
approach) to SR 20 Arterial 17,325
Roadway ID 57518000
Updated 2010, using 2009 FDOT Generalized Q / LOS Tables. LOS Standards and Max Allowable Volumes are based on those established for State Roadways.
Not To Be Used For Concurrency Management Purposes. Prepared for the FY 2010/11 Transportation Planning Organization Congestion Management Process.
E" following the count indicates an 'estimated count. "T" following the Count Station number indicated a Telemetered Traffic Monitoring Site. These Tables Are For General Planning Purposes Only.
Okaloosa County, State Roads
20

TOTAL SIG SEG. LOS (STD) FDOT
STATE ROAD FUNC. NO. FACILITY # OF PER LTH LOS & COUNT 2009 Paved Shoulder or Sidewalk Sidewalk
AND SEGMENT CLASS LNS. TYPE SIG. MI. (MI.) AREA MAX VOL STA # AADT Bike Lane % Coverage LOS % Coverage LOS % Coverage LOS
Bicycle Mode LOS Pedestrian Mode LOS Bus Mode LOS
CONGESTION MANAGEMENT PROCESS 2010 LEVEL OF SERVICE ANALYSIS - OKALOOSA COUNTY STATE ROADS
SR 393
Mary Esther Boulevard Minor 4 Divided 4 4.6 0.87 Urbanized (D) 5105 18,100 0-49% D 85-100% C 85-100% F
US98/ SR 30 to Arterial 28,200
Anchors Street
Roadway ID 57110028
Mary Esther Boulevard Minor 4 Divided 5 5.17 0.968 Urbanized (D) 1708 23,500 0-49% E 85-100% D 85-100% F
Anchors Street to SR 189/ Arterial 28,200 5098 31,000
Beal Parkway
Roadway ID 57110028
SR 397
Eglin Boulevard Minor 4 Divided 0 0 0.71 Urbanized (D) 190 11,500 50-85% D 85-100% C 85-100% F
SR85 to Eglin West Gate Arterial 64,300
Roadway ID 57040026
Updated 2010, using 2009 FDOT Generalized Q / LOS Tables. LOS Standards and Max Allowable Volumes are based on those established for State Roadways.
Not To Be Used For Concurrency Management Purposes. Prepared for the FY 2010/11 Transportation Planning Organization Congestion Management Process.
E" following the count indicates an 'estimated count. "T" following the Count Station number indicated a Telemetered Traffic Monitoring Site. These Tables Are For General Planning Purposes Only.
Backlogged Facility
Okaloosa County, State Roads
21

TOTAL SIG SEG. LOS (STD) FDOT
STATE ROAD FUNC. NO. FACILITY # OF PER LTH LOS & COUNT 2009 Paved Shoulder or Sidewalk Sidewalk
AND SEGMENT CLASS LNS. TYPE SIG. MI. (MI.) AREA MAX VOL STA # AADT Bike Lane % Coverage LOS % Coverage LOS % Coverage LOS
Bicycle Mode LOS Pedestrian Mode LOS Bus Mode LOS
CONGESTION MANAGEMENT PROCESS 2010 LEVEL OF SERVICE ANALYSIS - OKALOOSA COUNTY STATE ROADS
SR 397 (cont.)
John Sims Parkway Principal 4 Divided 0 0 1.4 Urbanized (D) 5023 19,300 50-85% D 85-100% C 85-100% F
Eglin Gate to SR190 / Arterial 64,300 5024 18,600
Broadway Avenue
Roadway ID 57040025
SR190 to SR85 Principal 4 Divided 2 2.27 0.88 Urbanized (D) 1505 24,500 0-49% E 85-100% D 85-100% F
Arterial 33,200
Roadway ID 57040027
Updated 2010, using 2009 FDOT Generalized Q / LOS Tables. LOS Standards and Max Allowable Volumes are based on those established for State Roadways.
Not To Be Used For Concurrency Management Purposes. Prepared for the FY 2010/11 Transportation Planning Organization Congestion Management Process.
E" following the count indicates an 'estimated count. "T" following the Count Station number indicated a Telemetered Traffic Monitoring Site. These Tables Are For General Planning Purposes Only.
Okaloosa County, State Roads
22

CONGESTION MANAGEMENT PROCESS 2010 LEVEL OF SERVICE ANALYSIS - OKALOOSA COUNTY'S COUNTY ROADS
TOTAL SIG SEG. LOS (STD) FDOT
COUNTY ROAD FUNC. NO. FACILITY # OF PER LTH LOS & COUNT 2009 Paved Shoulder or Sidewalk Sidewalk
AND SEGMENT CLASS LNS. TYPE SIG. MI. (MI.) AREA MAX VOL STA # AADT Bike Lane % Coverage LOS % Coverage LOS % Coverage LOS
CR 4
Antioch Road Urban 2 Undivided 0 0 3.41 Trans (C) 280 7,000 0-49% D 0-49% E N/A N/A
SR 10 (US90) to Collector 13,590
P.J. Adams Pkwy
P.J. Adams Pkwy to Urban 2 Undivided 0 0 2.14 Trans (C) 283 16,500 0-49% E 0-49% F N/A N/A
SR 85 S Ferdon Boulevard Collector 13,590
P.J. Adams Parkway
CR 4 Antioch Road to Urban 2 Undivided 1 0.54 1.86 Trans (C) 283 16,500 0-49% E 0-49% F N/A N/A
SR 85 S Ferdon Boulevard Collector 9,165
Updated 2010, using 2009 FDOT Generalized Q / LOS Tables. LOS Standards and Max Allowable Volumes are based on those established for State Roadways.
Not To Be Used For Concurrency Management Purposes. Prepared for the FY 2010/11 Transportation Planning Organization Congestion Management Process.
E" following the count indicates an 'estimated count. "T" following the Count Station number indicated a Telemetered Traffic Monitoring Site. These Tables Are For General Planning Purposes Only.
Bicycle Mode LOS Pedestrian Mode LOS Bus Mode LOS
Okaloosa County, County Roads
1
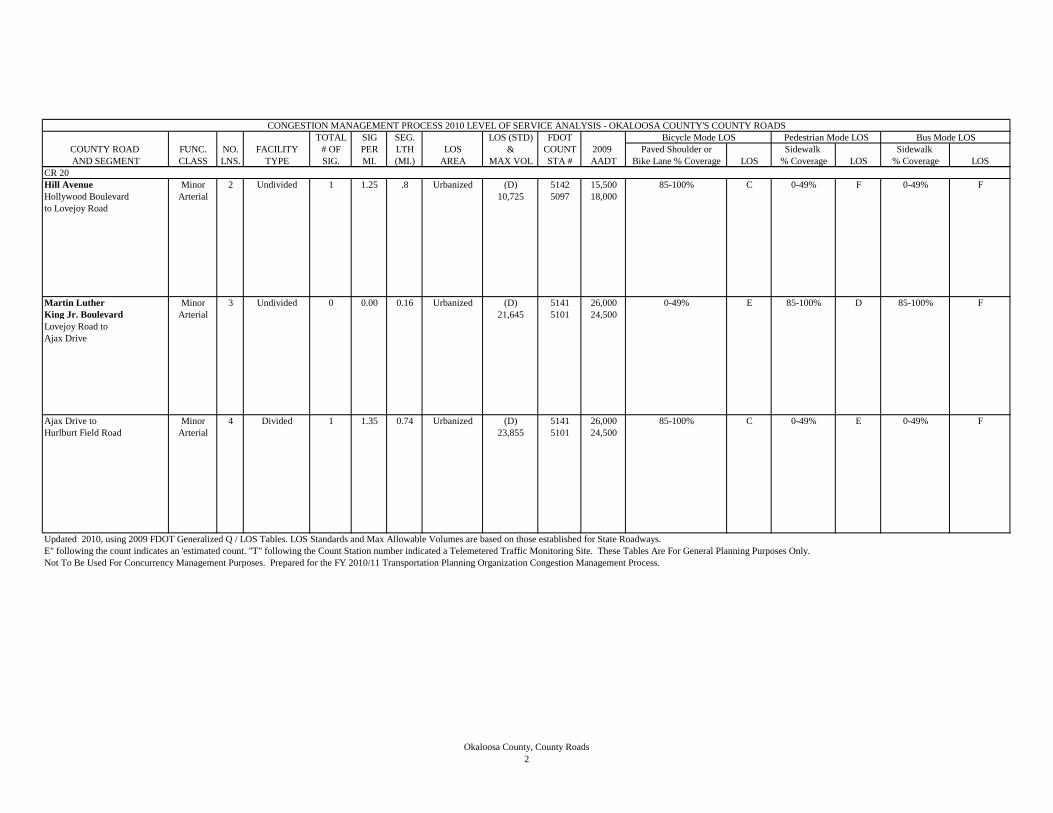
CONGESTION MANAGEMENT PROCESS 2010 LEVEL OF SERVICE ANALYSIS - OKALOOSA COUNTY'S COUNTY ROADS
TOTAL SIG SEG. LOS (STD) FDOT
COUNTY ROAD FUNC. NO. FACILITY # OF PER LTH LOS & COUNT 2009 Paved Shoulder or Sidewalk Sidewalk
AND SEGMENT CLASS LNS. TYPE SIG. MI. (MI.) AREA MAX VOL STA # AADT Bike Lane % Coverage LOS % Coverage LOS % Coverage LOS
Bicycle Mode LOS Pedestrian Mode LOS Bus Mode LOS
CR 20
Hill Avenue Minor 2 Undivided 1 1.25 .8 Urbanized (D) 5142 15,500 85-100% C 0-49% F 0-49% F
Hollywood Boulevard Arterial 10,725 5097 18,000
to Lovejoy Road
Martin Luther Minor 3 Undivided 0 0.00 0.16 Urbanized (D) 5141 26,000 0-49% E 85-100% D 85-100% F
King Jr. Boulevard Arterial 21,645 5101 24,500
Lovejoy Road to
Ajax Drive
Ajax Drive to Minor 4 Divided 1 1.35 0.74 Urbanized (D) 5141 26,000 85-100% C 0-49% E 0-49% F
Hurlburt Field Road Arterial 23,855 5101 24,500
Updated 2010, using 2009 FDOT Generalized Q / LOS Tables. LOS Standards and Max Allowable Volumes are based on those established for State Roadways.
Not To Be Used For Concurrency Management Purposes. Prepared for the FY 2010/11 Transportation Planning Organization Congestion Management Process.
E" following the count indicates an 'estimated count. "T" following the Count Station number indicated a Telemetered Traffic Monitoring Site. These Tables Are For General Planning Purposes Only.
Okaloosa County, County Roads
2

CONGESTION MANAGEMENT PROCESS 2010 LEVEL OF SERVICE ANALYSIS - OKALOOSA COUNTY'S COUNTY ROADS
TOTAL SIG SEG. LOS (STD) FDOT
COUNTY ROAD FUNC. NO. FACILITY # OF PER LTH LOS & COUNT 2009 Paved Shoulder or Sidewalk Sidewalk
AND SEGMENT CLASS LNS. TYPE SIG. MI. (MI.) AREA MAX VOL STA # AADT Bike Lane % Coverage LOS % Coverage LOS % Coverage LOS
Bicycle Mode LOS Pedestrian Mode LOS Bus Mode LOS
Martin Luther Minor 4 Divided 3 2 1.5 Urbanized (D) 5115 20,500 0-49% D 0-49% E 0-49% F
King Jr. Boulevard/ Arterial 21,580
Green Acres Drive
Hurlburt Field Road
to SR189
CR 30B
Benning Drive Urban 2 Undivided 1 2.5 0.4 Urbanized (D) 5135 4,500 85-100% B 85-100% C 85-100% F
US 98 (SR 30) to Collector 9,880
Legion Drive
(Destin)
CR 188
Old Bethel Road Urban 2 Undivided 0 0 0.2 Trans (C) 303 5,100 0-49% D 0-49% E N/A N/A
Jones Road to CB Drive Collector 13,590
Updated 2010, using 2009 FDOT Generalized Q / LOS Tables. LOS Standards and Max Allowable Volumes are based on those established for State Roadways.
Not To Be Used For Concurrency Management Purposes. Prepared for the FY 2010/11 Transportation Planning Organization Congestion Management Process.
E" following the count indicates an 'estimated count. "T" following the Count Station number indicated a Telemetered Traffic Monitoring Site. These Tables Are For General Planning Purposes Only.
Okaloosa County, County Roads
3
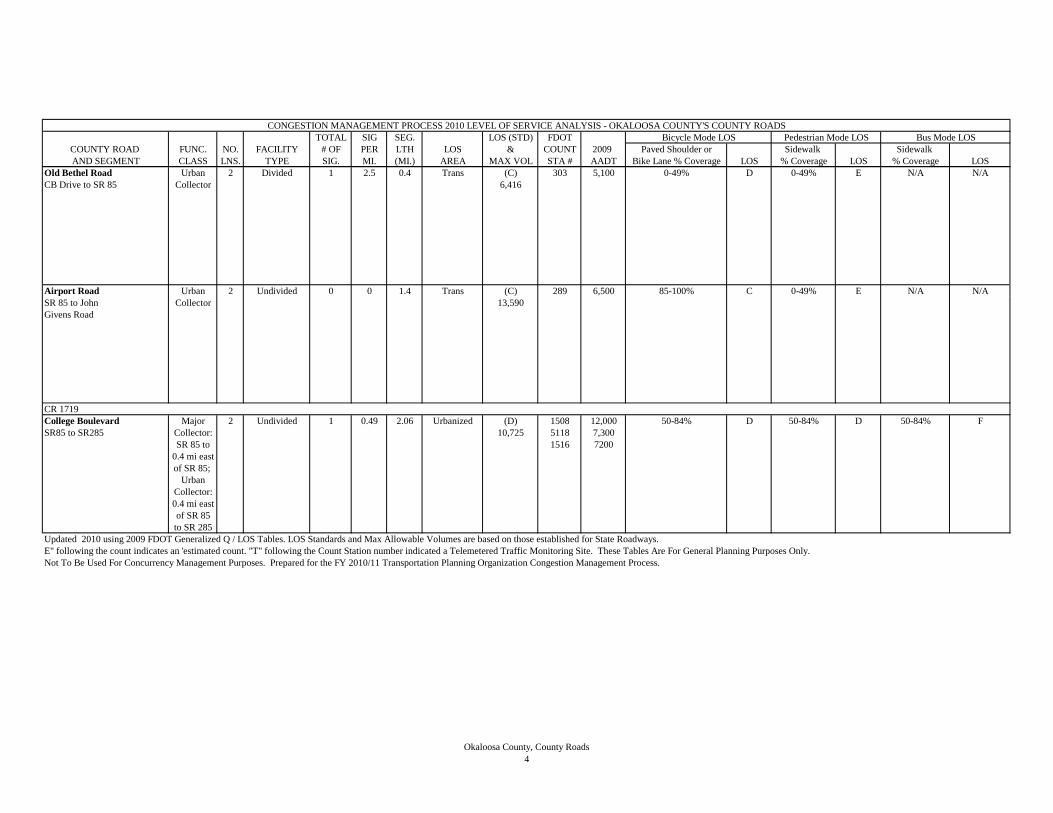
CONGESTION MANAGEMENT PROCESS 2010 LEVEL OF SERVICE ANALYSIS - OKALOOSA COUNTY'S COUNTY ROADS
TOTAL SIG SEG. LOS (STD) FDOT
COUNTY ROAD FUNC. NO. FACILITY # OF PER LTH LOS & COUNT 2009 Paved Shoulder or Sidewalk Sidewalk
AND SEGMENT CLASS LNS. TYPE SIG. MI. (MI.) AREA MAX VOL STA # AADT Bike Lane % Coverage LOS % Coverage LOS % Coverage LOS
Bicycle Mode LOS Pedestrian Mode LOS Bus Mode LOS
Old Bethel Road Urban 2 Divided 1 2.5 0.4 Trans (C) 303 5,100 0-49% D 0-49% E N/A N/A
CB Drive to SR 85 Collector 6,416
Airport Road Urban 2 Undivided 0 0 1.4 Trans (C) 289 6,500 85-100% C 0-49% E N/A N/A
SR 85 to John Collector 13,590
Givens Road
CR 1719
College Boulevard Major 2 Undivided 1 0.49 2.06 Urbanized (D) 1508 12,000 50-84% D 50-84% D 50-84% F
SR85 to SR285 Collector: 10,725 5118 7,300
SR 85 to 1516 7200
0.4 mi east
of SR 85;
Urban
Collector:
0.4 mi east
of SR 85
to SR 285
Updated 2010 using 2009 FDOT Generalized Q / LOS Tables. LOS Standards and Max Allowable Volumes are based on those established for State Roadways.
Not To Be Used For Concurrency Management Purposes. Prepared for the FY 2010/11 Transportation Planning Organization Congestion Management Process.
E" following the count indicates an 'estimated count. "T" following the Count Station number indicated a Telemetered Traffic Monitoring Site. These Tables Are For General Planning Purposes Only.
Okaloosa County, County Roads
4
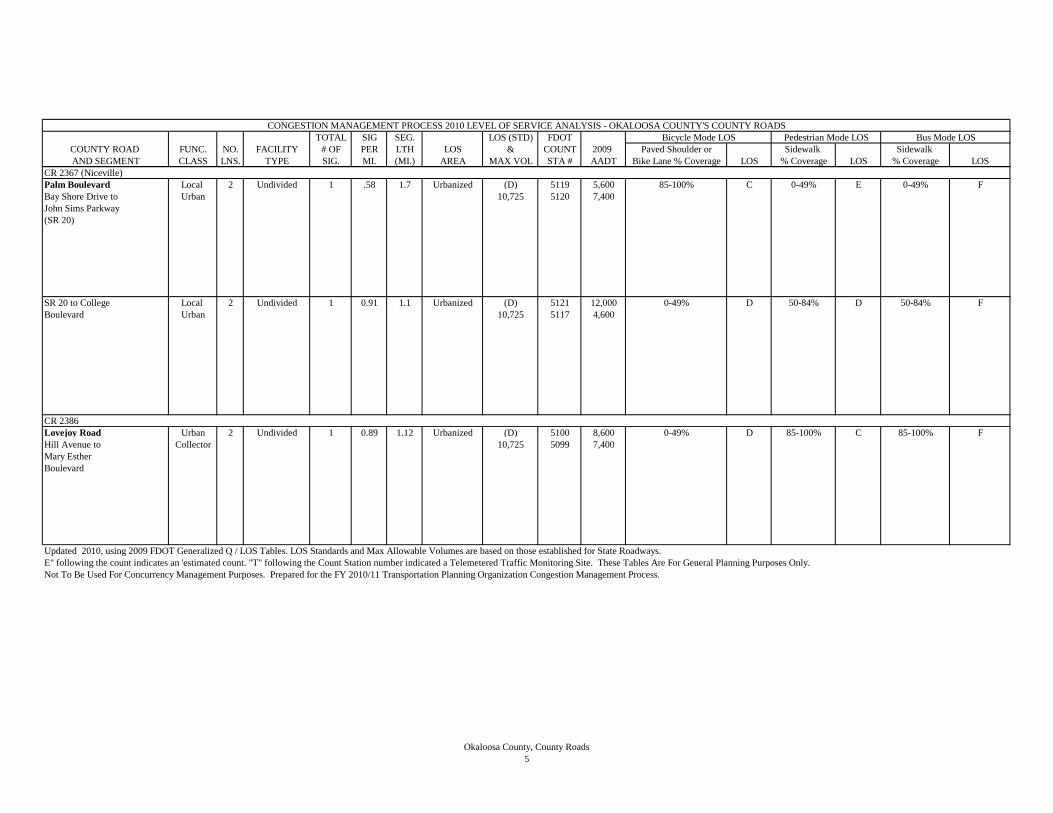
CONGESTION MANAGEMENT PROCESS 2010 LEVEL OF SERVICE ANALYSIS - OKALOOSA COUNTY'S COUNTY ROADS
TOTAL SIG SEG. LOS (STD) FDOT
COUNTY ROAD FUNC. NO. FACILITY # OF PER LTH LOS & COUNT 2009 Paved Shoulder or Sidewalk Sidewalk
AND SEGMENT CLASS LNS. TYPE SIG. MI. (MI.) AREA MAX VOL STA # AADT Bike Lane % Coverage LOS % Coverage LOS % Coverage LOS
Bicycle Mode LOS Pedestrian Mode LOS Bus Mode LOS
CR 2367 (Niceville)
Palm Boulevard Local 2 Undivided 1 .58 1.7 Urbanized (D) 5119 5,600 85-100% C 0-49% E 0-49% F
Bay Shore Drive to Urban 10,725 5120 7,400
John Sims Parkway
(SR 20)
SR 20 to College Local 2 Undivided 1 0.91 1.1 Urbanized (D) 5121 12,000 0-49% D 50-84% D 50-84% F
Boulevard Urban 10,725 5117 4,600
CR 2386
Lovejoy Road Urban 2 Undivided 1 0.89 1.12 Urbanized (D) 5100 8,600 0-49% D 85-100% C 85-100% F
Hill Avenue to Collector 10,725 5099 7,400
Mary Esther
Boulevard
Updated 2010, using 2009 FDOT Generalized Q / LOS Tables. LOS Standards and Max Allowable Volumes are based on those established for State Roadways.
Not To Be Used For Concurrency Management Purposes. Prepared for the FY 2010/11 Transportation Planning Organization Congestion Management Process.
E" following the count indicates an 'estimated count. "T" following the Count Station number indicated a Telemetered Traffic Monitoring Site. These Tables Are For General Planning Purposes Only.
Okaloosa County, County Roads
5
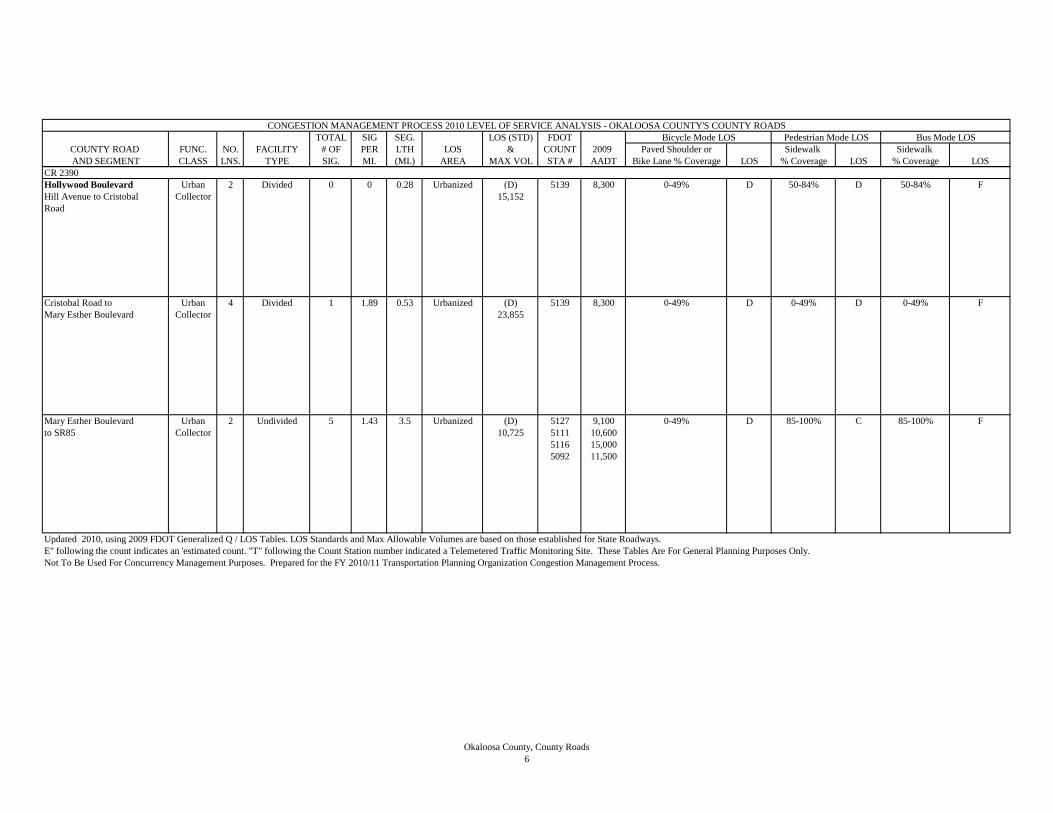
CONGESTION MANAGEMENT PROCESS 2010 LEVEL OF SERVICE ANALYSIS - OKALOOSA COUNTY'S COUNTY ROADS
TOTAL SIG SEG. LOS (STD) FDOT
COUNTY ROAD FUNC. NO. FACILITY # OF PER LTH LOS & COUNT 2009 Paved Shoulder or Sidewalk Sidewalk
AND SEGMENT CLASS LNS. TYPE SIG. MI. (MI.) AREA MAX VOL STA # AADT Bike Lane % Coverage LOS % Coverage LOS % Coverage LOS
Bicycle Mode LOS Pedestrian Mode LOS Bus Mode LOS
CR 2390
Hollywood Boulevard Urban 2 Divided 0 0 0.28 Urbanized (D) 5139 8,300 0-49% D 50-84% D 50-84% F
Hill Avenue to Cristobal Collector 15,152
Road
Cristobal Road to Urban 4 Divided 1 1.89 0.53 Urbanized (D) 5139 8,300 0-49% D 0-49% D 0-49% F
Mary Esther Boulevard Collector 23,855
Mary Esther Boulevard Urban 2 Undivided 5 1.43 3.5 Urbanized (D) 5127 9,100 0-49% D 85-100% C 85-100% F
to SR85 Collector 10,725 5111 10,600
5116 15,000
5092 11,500
Updated 2010, using 2009 FDOT Generalized Q / LOS Tables. LOS Standards and Max Allowable Volumes are based on those established for State Roadways.
Not To Be Used For Concurrency Management Purposes. Prepared for the FY 2010/11 Transportation Planning Organization Congestion Management Process.
E" following the count indicates an 'estimated count. "T" following the Count Station number indicated a Telemetered Traffic Monitoring Site. These Tables Are For General Planning Purposes Only.
Okaloosa County, County Roads
6

CONGESTION MANAGEMENT PROCESS 2010 LEVEL OF SERVICE ANALYSIS - OKALOOSA COUNTY'S COUNTY ROADS
TOTAL SIG SEG. LOS (STD) FDOT
COUNTY ROAD FUNC. NO. FACILITY # OF PER LTH LOS & COUNT 2009 Paved Shoulder or Sidewalk Sidewalk
AND SEGMENT CLASS LNS. TYPE SIG. MI. (MI.) AREA MAX VOL STA # AADT Bike Lane % Coverage LOS % Coverage LOS % Coverage LOS
Bicycle Mode LOS Pedestrian Mode LOS Bus Mode LOS
CR 2390 (cont')
SR85 to Terminus Urban 4 Divided 0 0 0.94 Urbanized (D) 5114 8,100 0-49% D 85-100% C 85-100% F
Collector 57,870
General Bond Road
SR189 to SR85 Urban 2 One-Way 0 0 1.2 Urbanized (D) 308 10,000 0-49% D 0-49% D 0-49% F
Collector 11,988
Main Street (Destin)
US 98 (SR 30) to Urban 4 Divided 1 1 1 Urbanized (D) 5133 8,900 0-49% D 85-100% C 85-100% F
Airport Road Local 33,030
Updated 2010, using 2009 FDOT Generalized Q / LOS Tables. LOS Standards and Max Allowable Volumes are based on those established for State Roadways.
Not To Be Used For Concurrency Management Purposes. Prepared for the FY 2010/11 Transportation Planning Organization Congestion Management Process.
E" following the count indicates an 'estimated count. "T" following the Count Station number indicated a Telemetered Traffic Monitoring Site. These Tables Are For General Planning Purposes Only.
Okaloosa County, County Roads
7
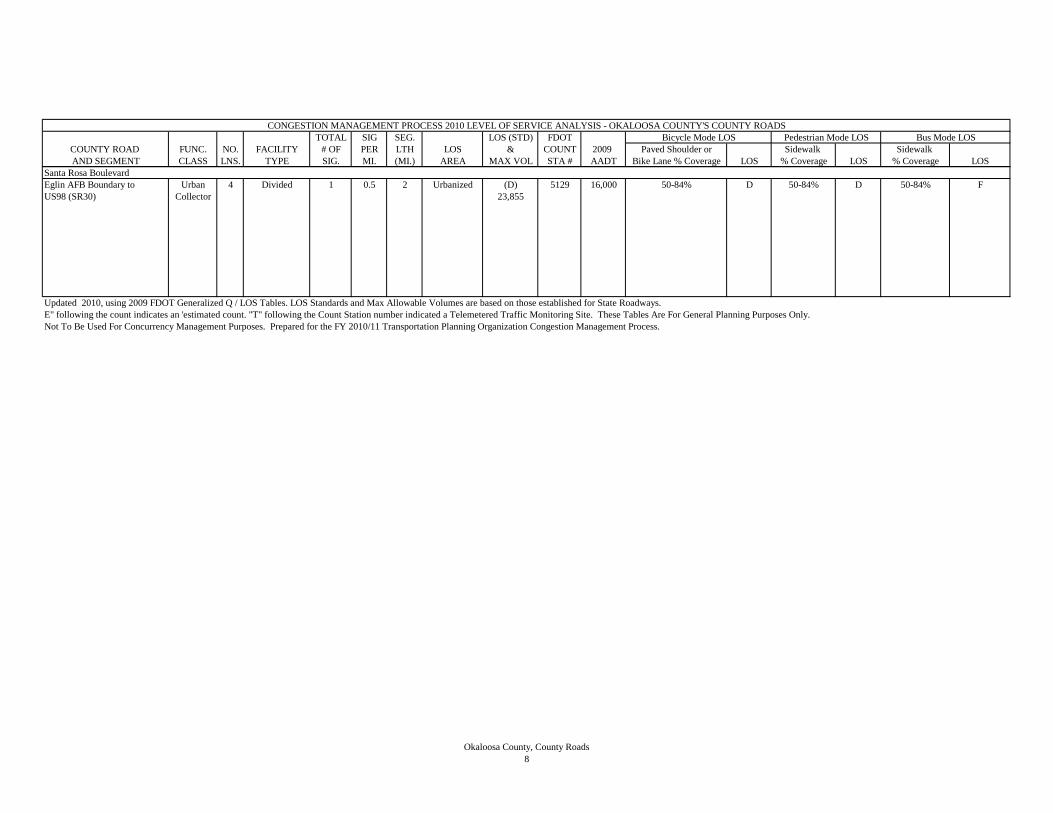
CONGESTION MANAGEMENT PROCESS 2010 LEVEL OF SERVICE ANALYSIS - OKALOOSA COUNTY'S COUNTY ROADS
TOTAL SIG SEG. LOS (STD) FDOT
COUNTY ROAD FUNC. NO. FACILITY # OF PER LTH LOS & COUNT 2009 Paved Shoulder or Sidewalk Sidewalk
AND SEGMENT CLASS LNS. TYPE SIG. MI. (MI.) AREA MAX VOL STA # AADT Bike Lane % Coverage LOS % Coverage LOS % Coverage LOS
Bicycle Mode LOS Pedestrian Mode LOS Bus Mode LOS
Santa Rosa Boulevard
Eglin AFB Boundary to Urban 4 Divided 1 0.5 2 Urbanized (D) 5129 16,000 50-84% D 50-84% D 50-84% F
US98 (SR30) Collector 23,855
Updated 2010, using 2009 FDOT Generalized Q / LOS Tables. LOS Standards and Max Allowable Volumes are based on those established for State Roadways.
Not To Be Used For Concurrency Management Purposes. Prepared for the FY 2010/11 Transportation Planning Organization Congestion Management Process.
E" following the count indicates an 'estimated count. "T" following the Count Station number indicated a Telemetered Traffic Monitoring Site. These Tables Are For General Planning Purposes Only.
Okaloosa County, County Roads
8
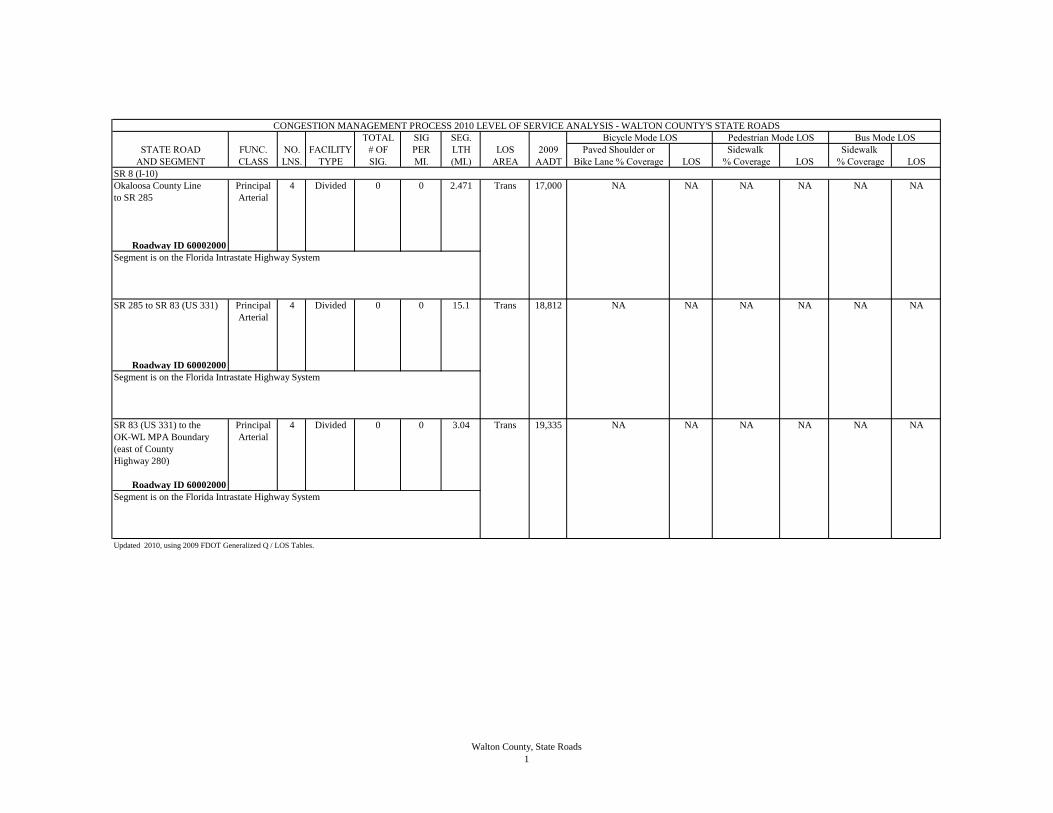
CONGESTION MANAGEMENT PROCESS 2010 LEVEL OF SERVICE ANALYSIS - WALTON COUNTY'S STATE ROADS
TOTAL SIG SEG.
STATE ROAD FUNC. NO. FACILITY # OF PER LTH LOS 2009 Paved Shoulder or Sidewalk Sidewalk
AND SEGMENT CLASS LNS. TYPE SIG. MI. (MI.) AREA AADT Bike Lane % Coverage LOS % Coverage LOS % Coverage LOS
SR 8 (I-10)
Okaloosa County Line Principal 4 Divided 0 0 2.471 Trans 17,000 NA NA NA NA NA NA
to SR 285 Arterial
Roadway ID 60002000
Segment is on the Florida Intrastate Highway System
SR 285 to SR 83 (US 331) Principal 4 Divided 0 0 15.1 Trans 18,812 NA NA NA NA NA NA
Arterial
Roadway ID 60002000
Segment is on the Florida Intrastate Highway System
SR 83 (US 331) to the Principal 4 Divided 0 0 3.04 Trans 19,335 NA NA NA NA NA NA
OK-WL MPA Boundary Arterial
(east of County
Highway 280)
Roadway ID 60002000
Segment is on the Florida Intrastate Highway System
Updated 2010, using 2009 FDOT Generalized Q / LOS Tables.
Bicycle Mode LOS Pedestrian Mode LOS Bus Mode LOS
Walton County, State Roads
1

CONGESTION MANAGEMENT PROCESS 2010 LEVEL OF SERVICE ANALYSIS - WALTON COUNTY'S STATE ROADS
TOTAL SIG SEG.
STATE ROAD FUNC. NO. FACILITY # OF PER LTH LOS 2009 Paved Shoulder or Sidewalk Sidewalk
AND SEGMENT CLASS LNS. TYPE SIG. MI. (MI.) AREA AADT Bike Lane % Coverage LOS % Coverage LOS % Coverage LOS
Bicycle Mode LOS Pedestrian Mode LOS Bus Mode LOS
SR 8 (I-10) (cont.)
OK-WL MPA Boundary Principal 4 Divided 0 0 6.85 Rural 19,335 NA NA NA NA NA NA
(east of County Arterial Undev
Highway 280) to the
Holmes County Line
Roadway ID 60002000
Segment is on the Florida Intrastate Highway System
SR10 (US90)
Okaloosa County Line Minor 2 Undivided 0 0 2.688 Trans 6,100 85-100% B 0-49% D NA NA
to SR 285 Arterial
Roadway ID 60010000
SR 285 to SR 187 / US 331 Minor 2 Undivided 1 0.080 12.17 Trans 6,650 85-100% B 0-49% D NA NA
Arterial
Roadway ID 60010000
Updated 2010, using 2009 FDOT Generalized Q / LOS Tables.
Walton County, State Roads
2
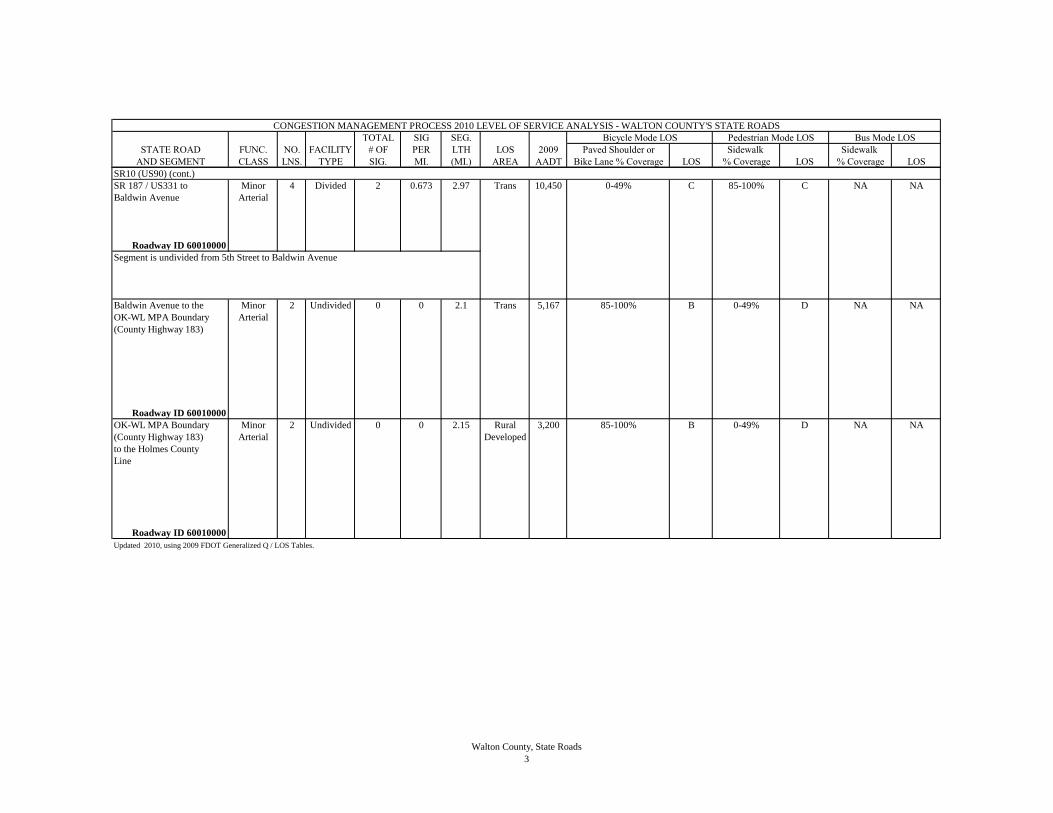
CONGESTION MANAGEMENT PROCESS 2010 LEVEL OF SERVICE ANALYSIS - WALTON COUNTY'S STATE ROADS
TOTAL SIG SEG.
STATE ROAD FUNC. NO. FACILITY # OF PER LTH LOS 2009 Paved Shoulder or Sidewalk Sidewalk
AND SEGMENT CLASS LNS. TYPE SIG. MI. (MI.) AREA AADT Bike Lane % Coverage LOS % Coverage LOS % Coverage LOS
Bicycle Mode LOS Pedestrian Mode LOS Bus Mode LOS
SR10 (US90) (cont.)
SR 187 / US331 to Minor 4 Divided 2 0.673 2.97 Trans 10,450 0-49% C 85-100% C NA NA
Baldwin Avenue Arterial
Roadway ID 60010000
Segment is undivided from 5th Street to Baldwin Avenue
Baldwin Avenue to the Minor 2 Undivided 0 0 2.1 Trans 5,167 85-100% B 0-49% D NA NA
OK-WL MPA Boundary Arterial
(County Highway 183)
Roadway ID 60010000
OK-WL MPA Boundary Minor 2 Undivided 0 0 2.15 Rural 3,200 85-100% B 0-49% D NA NA
(County Highway 183) Arterial Developed
to the Holmes County
Line
Roadway ID 60010000
Updated 2010, using 2009 FDOT Generalized Q / LOS Tables.
Walton County, State Roads
3
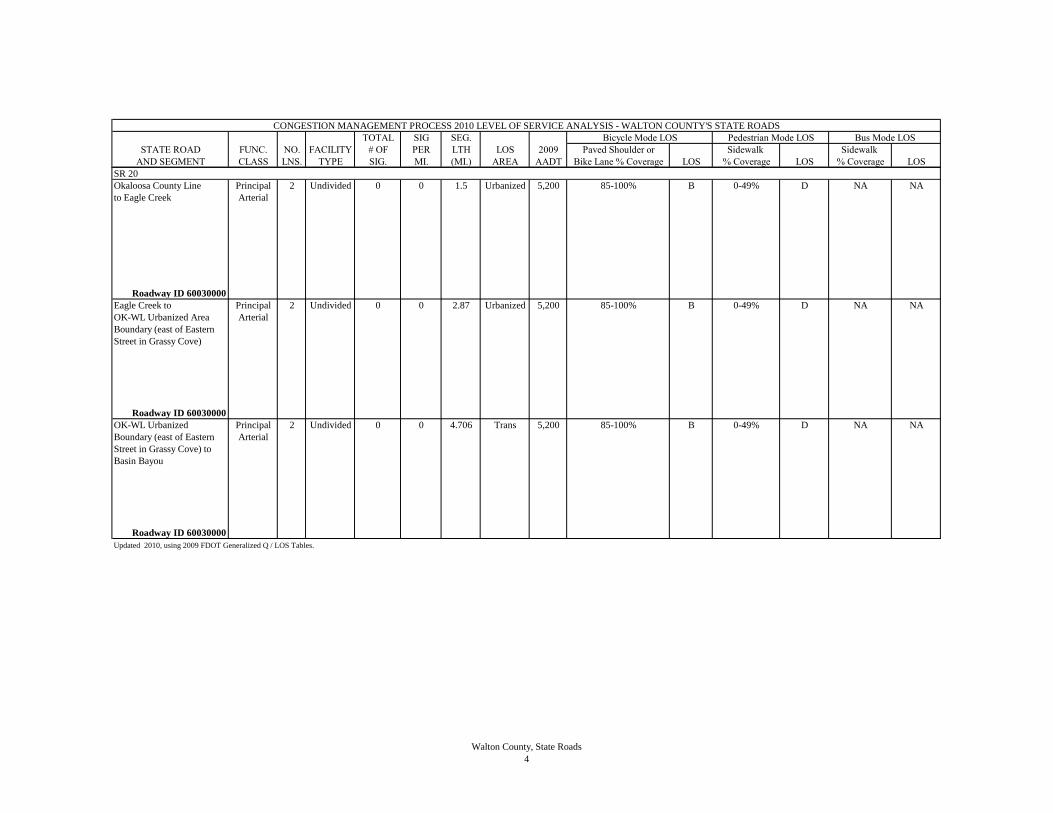
CONGESTION MANAGEMENT PROCESS 2010 LEVEL OF SERVICE ANALYSIS - WALTON COUNTY'S STATE ROADS
TOTAL SIG SEG.
STATE ROAD FUNC. NO. FACILITY # OF PER LTH LOS 2009 Paved Shoulder or Sidewalk Sidewalk
AND SEGMENT CLASS LNS. TYPE SIG. MI. (MI.) AREA AADT Bike Lane % Coverage LOS % Coverage LOS % Coverage LOS
Bicycle Mode LOS Pedestrian Mode LOS Bus Mode LOS
SR 20
Okaloosa County Line Principal 2 Undivided 0 0 1.5 Urbanized 5,200 85-100% B 0-49% D NA NA
to Eagle Creek Arterial
Roadway ID 60030000
Eagle Creek to Principal 2 Undivided 0 0 2.87 Urbanized 5,200 85-100% B 0-49% D NA NA
OK-WL Urbanized Area Arterial
Boundary (east of Eastern
Street in Grassy Cove)
Roadway ID 60030000
OK-WL Urbanized Principal 2 Undivided 0 0 4.706 Trans 5,200 85-100% B 0-49% D NA NA
Boundary (east of Eastern Arterial
Street in Grassy Cove) to
Basin Bayou
Roadway ID 60030000
Updated 2010, using 2009 FDOT Generalized Q / LOS Tables.
Walton County, State Roads
4
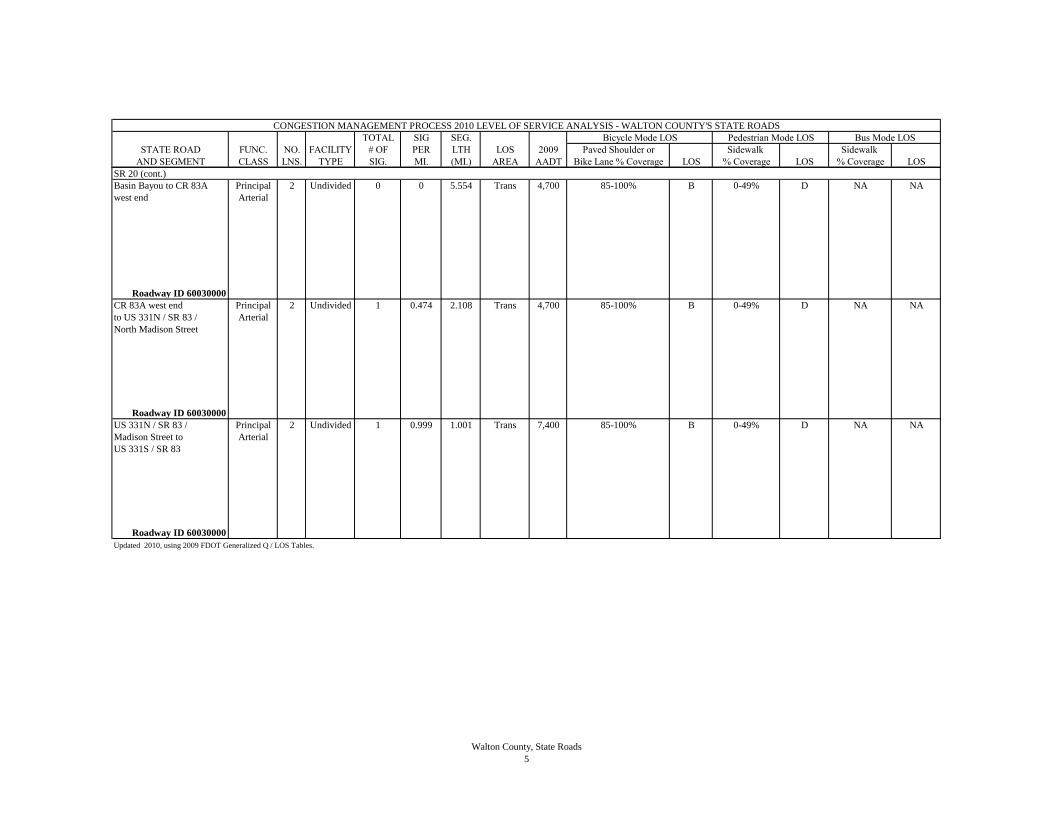
CONGESTION MANAGEMENT PROCESS 2010 LEVEL OF SERVICE ANALYSIS - WALTON COUNTY'S STATE ROADS
TOTAL SIG SEG.
STATE ROAD FUNC. NO. FACILITY # OF PER LTH LOS 2009 Paved Shoulder or Sidewalk Sidewalk
AND SEGMENT CLASS LNS. TYPE SIG. MI. (MI.) AREA AADT Bike Lane % Coverage LOS % Coverage LOS % Coverage LOS
Bicycle Mode LOS Pedestrian Mode LOS Bus Mode LOS
SR 20 (cont.)
Basin Bayou to CR 83A Principal 2 Undivided 0 0 5.554 Trans 4,700 85-100% B 0-49% D NA NA
west end Arterial
Roadway ID 60030000
CR 83A west end Principal 2 Undivided 1 0.474 2.108 Trans 4,700 85-100% B 0-49% D NA NA
to US 331N / SR 83 / Arterial
North Madison Street
Roadway ID 60030000
US 331N / SR 83 / Principal 2 Undivided 1 0.999 1.001 Trans 7,400 85-100% B 0-49% D NA NA
Madison Street to Arterial
US 331S / SR 83
Roadway ID 60030000
Updated 2010, using 2009 FDOT Generalized Q / LOS Tables.
Walton County, State Roads
5

CONGESTION MANAGEMENT PROCESS 2010 LEVEL OF SERVICE ANALYSIS - WALTON COUNTY'S STATE ROADS
TOTAL SIG SEG.
STATE ROAD FUNC. NO. FACILITY # OF PER LTH LOS 2009 Paved Shoulder or Sidewalk Sidewalk
AND SEGMENT CLASS LNS. TYPE SIG. MI. (MI.) AREA AADT Bike Lane % Coverage LOS % Coverage LOS % Coverage LOS
Bicycle Mode LOS Pedestrian Mode LOS Bus Mode LOS
SR 20 (cont.)
US 331S / SR 83 to the Principal 2 Undivided 0 0 14.25 Trans 4,800 85-100% B 0-49% D NA NA
Washington County Line Arterial
(OK-WL MPA Boundary)
Roadway ID 60030000
SR 30 (US 98)
Okaloosa County line Principal 4 Divided 4 1.263 3.168 Urbanized 43,850 85-100% C 0-49% E 0-84% D
to Old US 98 / SR 30 Arterial
Roadway ID 60020001
Segment is on the Florida Intrastate Highway System
Old 98 / SR 30/ Gulf Principal 6 Divided 3 1.124 2.67 Urbanized 39,000 0-49% C 85-100% C NA NA
Pines to Mack Bayou Arterial
Road
Roadway ID 60020000
Segment is on the Florida Intrastate Highway System
Updated 2010, using 2009 FDOT Generalized Q / LOS Tables.
Walton County, State Roads
6
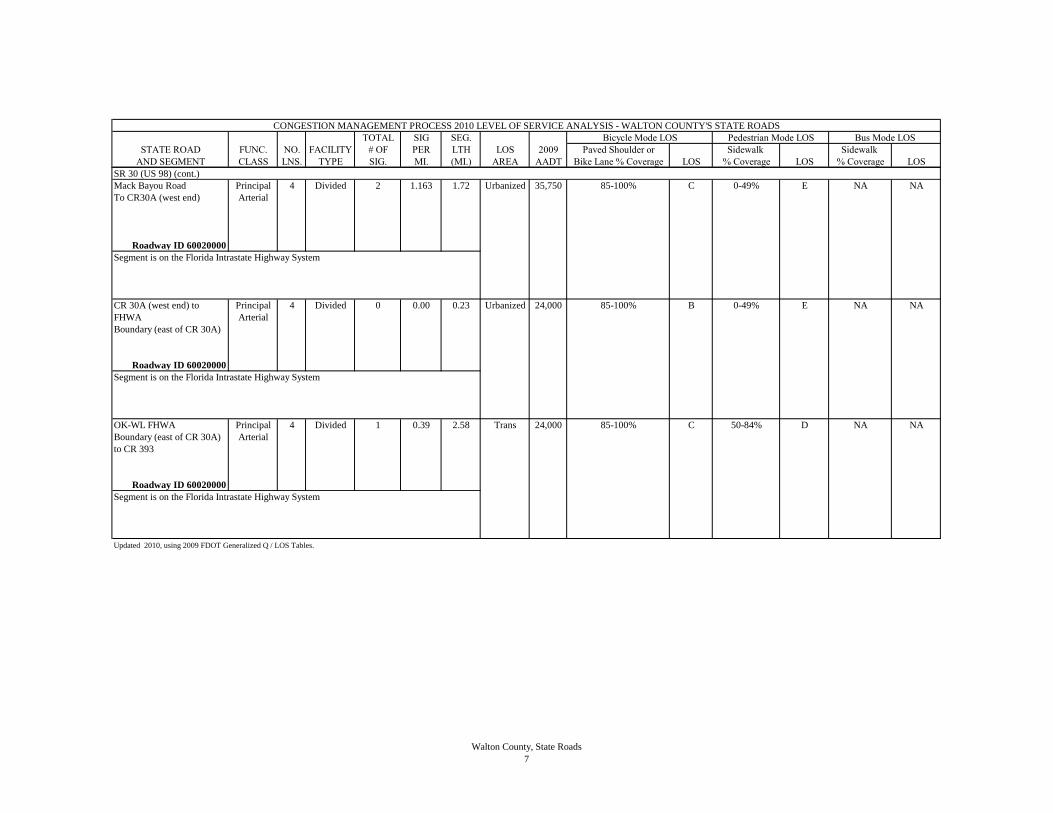
CONGESTION MANAGEMENT PROCESS 2010 LEVEL OF SERVICE ANALYSIS - WALTON COUNTY'S STATE ROADS
TOTAL SIG SEG.
STATE ROAD FUNC. NO. FACILITY # OF PER LTH LOS 2009 Paved Shoulder or Sidewalk Sidewalk
AND SEGMENT CLASS LNS. TYPE SIG. MI. (MI.) AREA AADT Bike Lane % Coverage LOS % Coverage LOS % Coverage LOS
Bicycle Mode LOS Pedestrian Mode LOS Bus Mode LOS
SR 30 (US 98) (cont.)
Mack Bayou Road Principal 4 Divided 2 1.163 1.72 Urbanized 35,750 85-100% C 0-49% E NA NA
To CR30A (west end) Arterial
Roadway ID 60020000
Segment is on the Florida Intrastate Highway System
CR 30A (west end) to Principal 4 Divided 0 0.00 0.23 Urbanized 24,000 85-100% B 0-49% E NA NA
FHWA Arterial
Boundary (east of CR 30A)
Roadway ID 60020000
Segment is on the Florida Intrastate Highway System
OK-WL FHWA Principal 4 Divided 1 0.39 2.58 Trans 24,000 85-100% C 50-84% D NA NA
Boundary (east of CR 30A) Arterial
to CR 393
Roadway ID 60020000
Segment is on the Florida Intrastate Highway System
Updated 2010, using 2009 FDOT Generalized Q / LOS Tables.
Walton County, State Roads
7
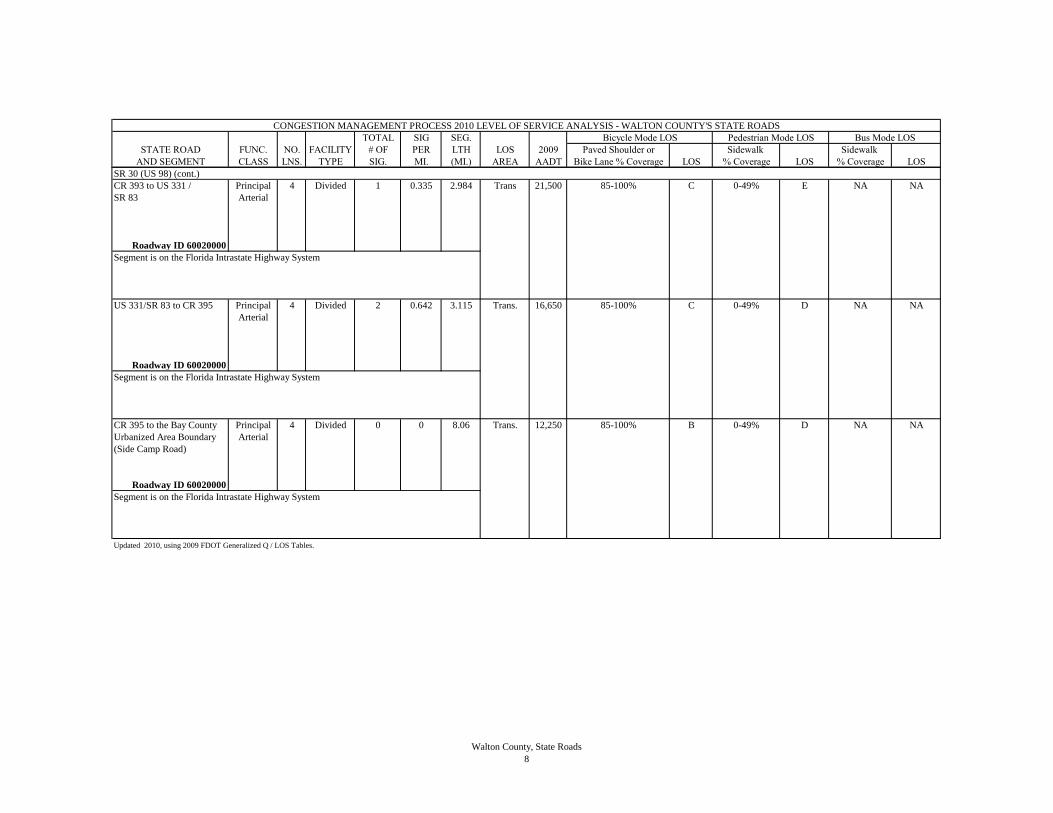
CONGESTION MANAGEMENT PROCESS 2010 LEVEL OF SERVICE ANALYSIS - WALTON COUNTY'S STATE ROADS
TOTAL SIG SEG.
STATE ROAD FUNC. NO. FACILITY # OF PER LTH LOS 2009 Paved Shoulder or Sidewalk Sidewalk
AND SEGMENT CLASS LNS. TYPE SIG. MI. (MI.) AREA AADT Bike Lane % Coverage LOS % Coverage LOS % Coverage LOS
Bicycle Mode LOS Pedestrian Mode LOS Bus Mode LOS
SR 30 (US 98) (cont.)
CR 393 to US 331 / Principal 4 Divided 1 0.335 2.984 Trans 21,500 85-100% C 0-49% E NA NA
SR 83 Arterial
Roadway ID 60020000
Segment is on the Florida Intrastate Highway System
US 331/SR 83 to CR 395 Principal 4 Divided 2 0.642 3.115 Trans. 16,650 85-100% C 0-49% D NA NA
Arterial
Roadway ID 60020000
Segment is on the Florida Intrastate Highway System
CR 395 to the Bay County Principal 4 Divided 0 0 8.06 Trans. 12,250 85-100% B 0-49% D NA NA
Urbanized Area Boundary Arterial
(Side Camp Road)
Roadway ID 60020000
Segment is on the Florida Intrastate Highway System
Updated 2010, using 2009 FDOT Generalized Q / LOS Tables.
Walton County, State Roads
8

CONGESTION MANAGEMENT PROCESS 2010 LEVEL OF SERVICE ANALYSIS - WALTON COUNTY'S STATE ROADS
TOTAL SIG SEG.
STATE ROAD FUNC. NO. FACILITY # OF PER LTH LOS 2009 Paved Shoulder or Sidewalk Sidewalk
AND SEGMENT CLASS LNS. TYPE SIG. MI. (MI.) AREA AADT Bike Lane % Coverage LOS % Coverage LOS % Coverage LOS
Bicycle Mode LOS Pedestrian Mode LOS Bus Mode LOS
SR 30 (US 98) (cont.)
Bay County Urbanized Principal 4 Divided 1 0.397 2.52 Urbanized 10,200 85-100% B 50-84% D NA NA
Area Boundary (Side Arterial
Camp Road) to the Bay
County Line (OK-WL
MPA Boundary)
Roadway ID 60020000
Segment is on the Florida Intrastate Highway System
SR 81
SR 20 to the OK-WL MPA Major 2 Undivided 0 0 1.39 Trans 2,100 85-100% B 0-49% D NA NA
Boundary Collector
Roadway ID 60100000
OK-WL MPA Boundary Major 2 Undivided 0 0 11.76 Rural 2,100 85-100% C NA NA NA NA
(North of west end of Collector Undev
Windmill Road) to CR 183
Roadway ID 60100000
Updated 2010, using 2009 FDOT Generalized Q / LOS Tables.
Walton County, State Roads
9

CONGESTION MANAGEMENT PROCESS 2010 LEVEL OF SERVICE ANALYSIS - WALTON COUNTY'S STATE ROADS
TOTAL SIG SEG.
STATE ROAD FUNC. NO. FACILITY # OF PER LTH LOS 2009 Paved Shoulder or Sidewalk Sidewalk
AND SEGMENT CLASS LNS. TYPE SIG. MI. (MI.) AREA AADT Bike Lane % Coverage LOS % Coverage LOS % Coverage LOS
Bicycle Mode LOS Pedestrian Mode LOS Bus Mode LOS
SR 81 (cont.)
CR 183 to the Major 2 Undivided 0 0 4.77 Rural 2,400 85-100% C NA NA NA NA
Holmes County Line Collector Undev
Roadway ID 60100000
SR 83 (US 331S)
SR 30 / US 98 to the Principal 2 Undivided 0 0 3.52 Trans. 12,200 85-100% C 0-49% E NA NA
Choctawatchee Bay Arterial
Bridge (north approach)
Roadway ID 60040000
Segment is on the Florida Intrastate Highway System
Segment is divided from US98 noth approximately 1 mile.
Choctawatchee Bay Principal 2 Undivided 1 0.163 6.14 Trans. 11,500 85-100% C 0-49% E NA NA
Bridge (north approach) Arterial
to SR 20
Roadway ID 60040000
Segment is on the Florida Intrastate Highway System
Updated 2010, using 2009 FDOT Generalized Q / LOS Tables.
Walton County, State Roads
10
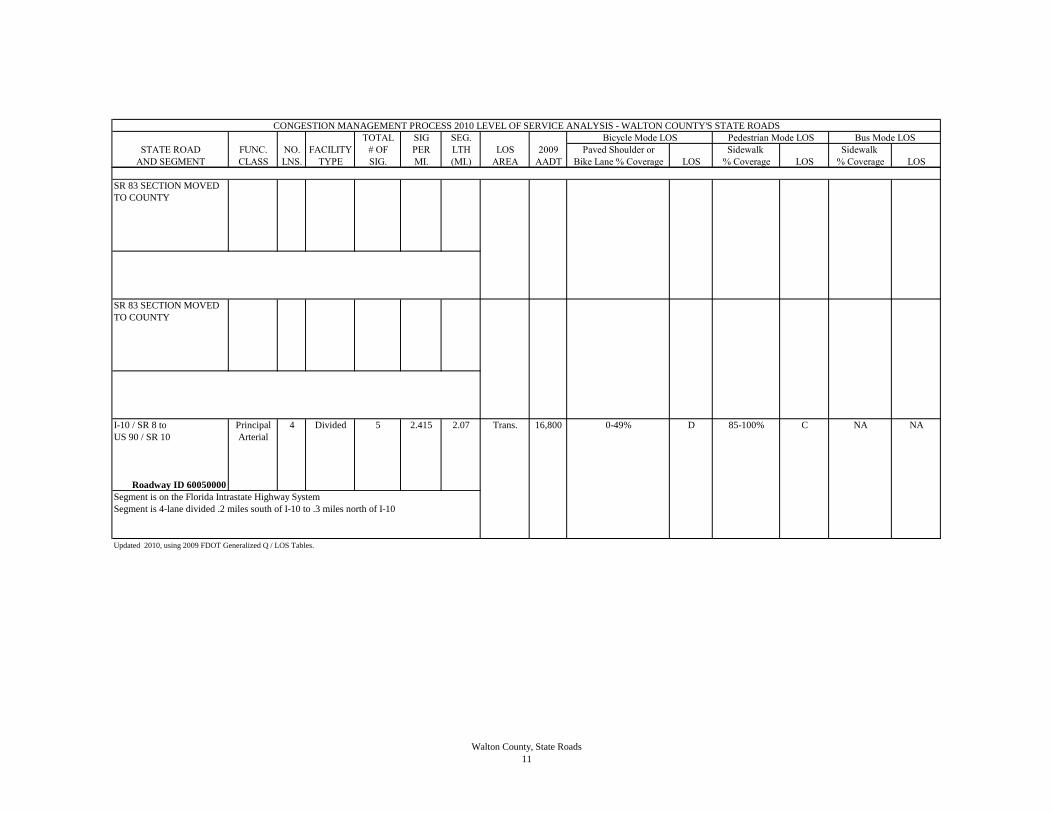
CONGESTION MANAGEMENT PROCESS 2010 LEVEL OF SERVICE ANALYSIS - WALTON COUNTY'S STATE ROADS
TOTAL SIG SEG.
STATE ROAD FUNC. NO. FACILITY # OF PER LTH LOS 2009 Paved Shoulder or Sidewalk Sidewalk
AND SEGMENT CLASS LNS. TYPE SIG. MI. (MI.) AREA AADT Bike Lane % Coverage LOS % Coverage LOS % Coverage LOS
Bicycle Mode LOS Pedestrian Mode LOS Bus Mode LOS
SR 83 SECTION MOVED
TO COUNTY
SR 83 SECTION MOVED
TO COUNTY
I-10 / SR 8 to Principal 4 Divided 5 2.415 2.07 Trans. 16,800 0-49% D 85-100% C NA NA
US 90 / SR 10 Arterial
Roadway ID 60050000
Segment is on the Florida Intrastate Highway System
Segment is 4-lane divided .2 miles south of I-10 to .3 miles north of I-10
Updated 2010, using 2009 FDOT Generalized Q / LOS Tables.
Walton County, State Roads
11

CONGESTION MANAGEMENT PROCESS 2010 LEVEL OF SERVICE ANALYSIS - WALTON COUNTY'S STATE ROADS
TOTAL SIG SEG.
STATE ROAD FUNC. NO. FACILITY # OF PER LTH LOS 2009 Paved Shoulder or Sidewalk Sidewalk
AND SEGMENT CLASS LNS. TYPE SIG. MI. (MI.) AREA AADT Bike Lane % Coverage LOS % Coverage LOS % Coverage LOS
Bicycle Mode LOS Pedestrian Mode LOS Bus Mode LOS
SR 83 (US331) (cont.)
US 90 / SR 10 to the Minor 2 Undivided 0 0 2.98 Trans. 8,050 85-100% B 0-49% D NA NA
OK-WL MPA Boundary Arterial
(north of Caswell Road)
Roadway ID 60070000
Segment is on the Florida Intrastate Highway System
Segment is divided from SR10 north .33 miles
OK-WL MPA Boundary Minor 2 Undivided 0 0 4.9 Rural 3,178 85-100% C NA NA NA NA
(north of Caswell Road) to Arterial Undev
CR 185C
Roadway ID 60070000
Segment is on the Florida Intrastate Highway System
CR 185C to CR 181 Minor 2 Undivided 0 0 9.701 Rural 1,550 85-100% C NA NA NA NA
Arterial Undev
Roadway ID 60070000
Segment is on the Florida Intrastate Highway System
Updated 2010, using 2009 FDOT Generalized Q / LOS Tables.
Walton County, State Roads
12

CONGESTION MANAGEMENT PROCESS 2010 LEVEL OF SERVICE ANALYSIS - WALTON COUNTY'S STATE ROADS
TOTAL SIG SEG.
STATE ROAD FUNC. NO. FACILITY # OF PER LTH LOS 2009 Paved Shoulder or Sidewalk Sidewalk
AND SEGMENT CLASS LNS. TYPE SIG. MI. (MI.) AREA AADT Bike Lane % Coverage LOS % Coverage LOS % Coverage LOS
Bicycle Mode LOS Pedestrian Mode LOS Bus Mode LOS
SR 83 (US331) (cont.)
CR181 to the Minor 2 Undivided 0 0 1.546 Rural 950 85-100% C NA NA NA NA
Alabama State Line Arterial Undev
Roadway ID 60070000
Segment is on the Florida Intrastate Highway System
SR 85
Okaloosa County Line Principal 2 Undivided 0 0 4.24 Rural 3,600 85-100% C NA NA NA NA
to the Alabama State Line Arterial Undev
Roadway ID 60080000
SR 187 (US331N)
SR 10 / US 90 to the Principal 2 Undivided 0 0 2.09 Trans. 7,100 85-100% B 0-49% D NA NA
OK-WL MPA Boundary Arterial
(north of Bob McCaskill
Drive)
Roadway ID 60060000
Segment is on the Florida Intrastate Highway System
Updated 2010, using 2009 FDOT Generalized Q / LOS Tables.
Walton County, State Roads
13

CONGESTION MANAGEMENT PROCESS 2010 LEVEL OF SERVICE ANALYSIS - WALTON COUNTY'S STATE ROADS
TOTAL SIG SEG.
STATE ROAD FUNC. NO. FACILITY # OF PER LTH LOS 2009 Paved Shoulder or Sidewalk Sidewalk
AND SEGMENT CLASS LNS. TYPE SIG. MI. (MI.) AREA AADT Bike Lane % Coverage LOS % Coverage LOS % Coverage LOS
Bicycle Mode LOS Pedestrian Mode LOS Bus Mode LOS
SR 187 (US331N) (cont.)
OK-WL MPA Boundary Principal 2 Undivided 0 0 8.54 Rural 3,200 85-100% C NA NA NA NA
(north of Bob McCaskill Arterial Undev
Drive) to CR 2A
Roadway ID 60060000
Segment is on the Florida Intrastate Highway System
CR 2A to the Principal 2 Undivided 0 0 10.746 Rural 3,896 85-100% C NA NA NA NA
Alabama State Line Arterial Undev
Roadway ID 60060000
Segment is on the Florida Intrastate Highway System
SR 285
Okaloosa County Line to Minor 2 Undivided 0 0 6.76 Trans. 5,250 85-100% B 0-49% D NA NA
SR 10 / US 90 Arterial
Roadway ID 60090000
Updated 2010, using 2009 FDOT Generalized Q / LOS Tables.
Walton County, State Roads
14

CONGESTION MANAGEMENT PROCESS 2010 LEVEL OF SERVICE ANALYSIS - WALTON COUNTY'S COUNTY ROADSTOTAL SIG SEG. LOS (STD)
COUNTY ROAD FUNC. NO. FACILITY # OF PER LTH LOS & 2009 Paved Shoulder or Sidewalk Sidewalk AND SEGMENT CLASS LNS. TYPE SIG. MI. (MI.) AREA MAX VOL AADT Bike Lane % Coverage LOS % Coverage LOS % Coverage LOS
CR 30AUS 98 to CR 393 Minor 2 Undivided 0 0 3.5 Urbanized (D) 5,350 85-100% B 85-100% C NA NA
Arterial 22,200
CR 393 to CR 395 Minor 2 Undivided 0 0 7 Urbanized (D) 5200 85-100% B 85-100% C NA NAArterial 22,200
CR 395 to US 98 Minor 2 Undivided 1 0.13 7.9 Urbanized (D) 7,450 85-100% B 85-100% C NA NA(SR 30) Arterial 14,850
Updated 2010, using 2009 FDOT Generalized Q / LOS Tables.
Bus Mode LOSBicycle Mode LOS Pedestrian Mode LOS
Walton County, County Roads1
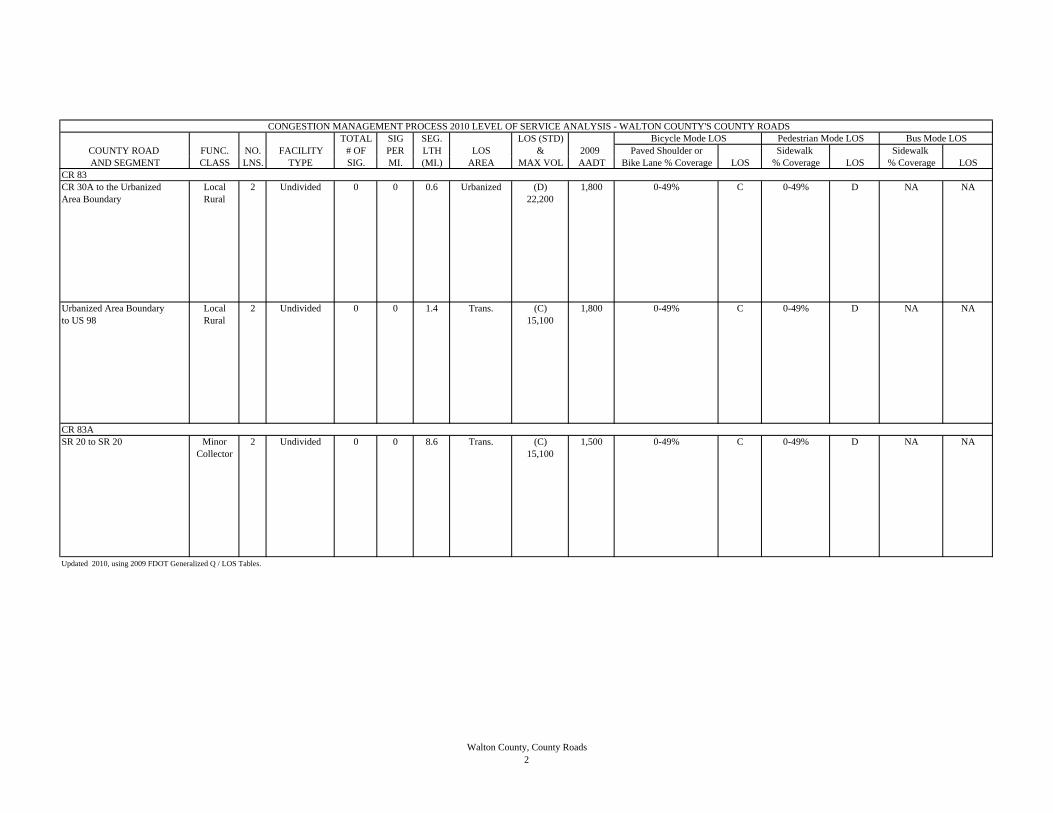
CONGESTION MANAGEMENT PROCESS 2010 LEVEL OF SERVICE ANALYSIS - WALTON COUNTY'S COUNTY ROADSTOTAL SIG SEG. LOS (STD)
COUNTY ROAD FUNC. NO. FACILITY # OF PER LTH LOS & 2009 Paved Shoulder or Sidewalk Sidewalk AND SEGMENT CLASS LNS. TYPE SIG. MI. (MI.) AREA MAX VOL AADT Bike Lane % Coverage LOS % Coverage LOS % Coverage LOS
Bus Mode LOSBicycle Mode LOS Pedestrian Mode LOS
CR 83CR 30A to the Urbanized Local 2 Undivided 0 0 0.6 Urbanized (D) 1,800 0-49% C 0-49% D NA NAArea Boundary Rural 22,200
Urbanized Area Boundary Local 2 Undivided 0 0 1.4 Trans. (C) 1,800 0-49% C 0-49% D NA NAto US 98 Rural 15,100
CR 83ASR 20 to SR 20 Minor 2 Undivided 0 0 8.6 Trans. (C) 1,500 0-49% C 0-49% D NA NA
Collector 15,100
Updated 2010, using 2009 FDOT Generalized Q / LOS Tables.
Walton County, County Roads2
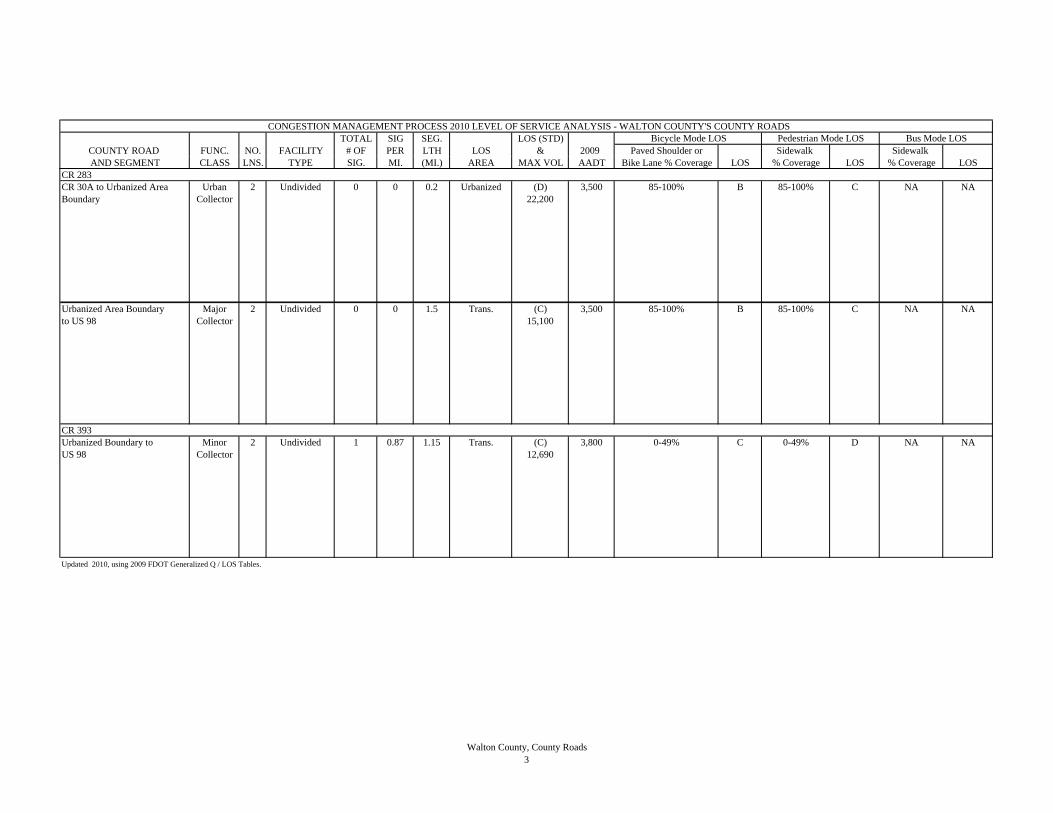
CONGESTION MANAGEMENT PROCESS 2010 LEVEL OF SERVICE ANALYSIS - WALTON COUNTY'S COUNTY ROADSTOTAL SIG SEG. LOS (STD)
COUNTY ROAD FUNC. NO. FACILITY # OF PER LTH LOS & 2009 Paved Shoulder or Sidewalk Sidewalk AND SEGMENT CLASS LNS. TYPE SIG. MI. (MI.) AREA MAX VOL AADT Bike Lane % Coverage LOS % Coverage LOS % Coverage LOS
Bus Mode LOSBicycle Mode LOS Pedestrian Mode LOS
CR 283CR 30A to Urbanized Area Urban 2 Undivided 0 0 0.2 Urbanized (D) 3,500 85-100% B 85-100% C NA NABoundary Collector 22,200
Urbanized Area Boundary Major 2 Undivided 0 0 1.5 Trans. (C) 3,500 85-100% B 85-100% C NA NAto US 98 Collector 15,100
CR 393Urbanized Boundary to Minor 2 Undivided 1 0.87 1.15 Trans. (C) 3,800 0-49% C 0-49% D NA NAUS 98 Collector 12,690
Updated 2010, using 2009 FDOT Generalized Q / LOS Tables.
Walton County, County Roads3

CONGESTION MANAGEMENT PROCESS 2010 LEVEL OF SERVICE ANALYSIS - WALTON COUNTY'S COUNTY ROADSTOTAL SIG SEG. LOS (STD)
COUNTY ROAD FUNC. NO. FACILITY # OF PER LTH LOS & 2009 Paved Shoulder or Sidewalk Sidewalk AND SEGMENT CLASS LNS. TYPE SIG. MI. (MI.) AREA MAX VOL AADT Bike Lane % Coverage LOS % Coverage LOS % Coverage LOS
Bus Mode LOSBicycle Mode LOS Pedestrian Mode LOS
CR 395CR30A to Urban 2 Undivided 0 0 0.687 Urbanized (D) 5,500 85-100% B 85-100% C NA NAUrbanized Boundary Collector 22,200
Urbanized Boundary Minor 2 Undivided 1 0.45 2.21 Trans. (C) 5,500 85-100% B 85-100% C NA NAto US 98 Collector 12,690
CR 457Mack Bayou Road/ Urban 2 Undivided 0 0 1.2 Urbanized (D) 7,000 85-100% B 0-49% D NA NAUS 98 (SR 30) to Local 22,200Turquoise Beach
Updated 2010, using 2009 FDOT Generalized Q / LOS Tables.
Walton County, County Roads4
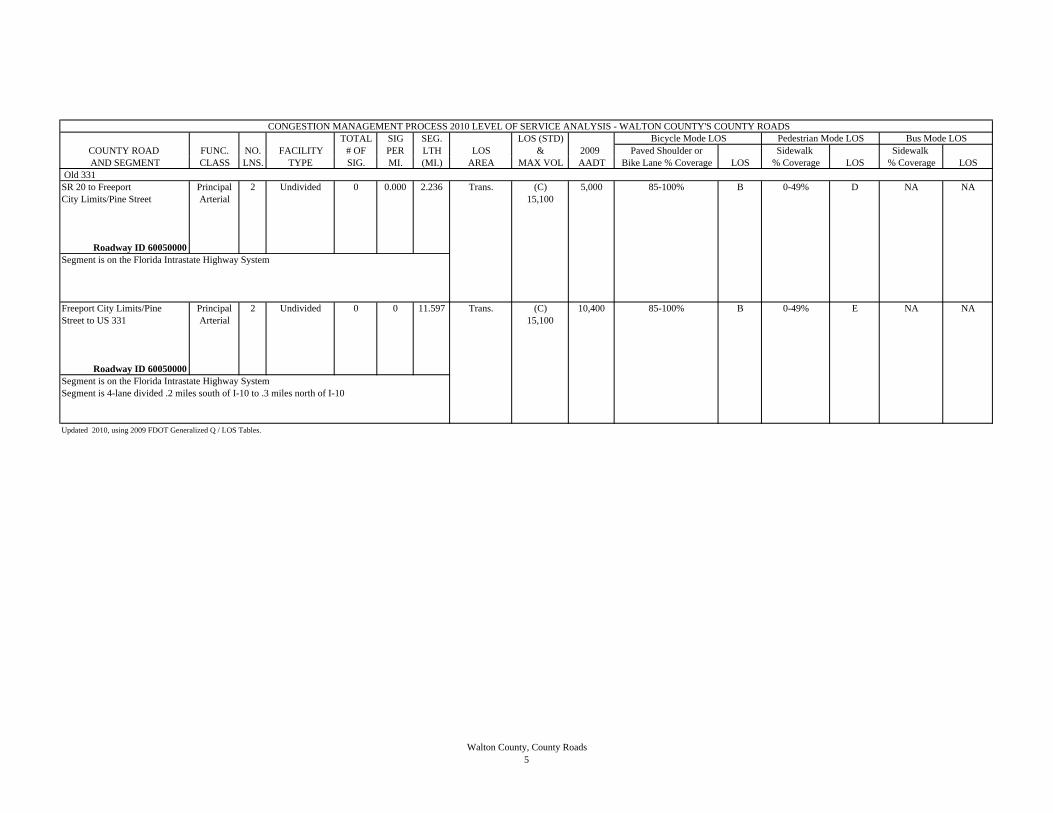
CONGESTION MANAGEMENT PROCESS 2010 LEVEL OF SERVICE ANALYSIS - WALTON COUNTY'S COUNTY ROADSTOTAL SIG SEG. LOS (STD)
COUNTY ROAD FUNC. NO. FACILITY # OF PER LTH LOS & 2009 Paved Shoulder or Sidewalk Sidewalk AND SEGMENT CLASS LNS. TYPE SIG. MI. (MI.) AREA MAX VOL AADT Bike Lane % Coverage LOS % Coverage LOS % Coverage LOS
Bus Mode LOSBicycle Mode LOS Pedestrian Mode LOS
Old 331SR 20 to Freeport Principal 2 Undivided 0 0.000 2.236 Trans. (C) 5,000 85-100% B 0-49% D NA NACity Limits/Pine Street Arterial 15,100
Roadway ID 60050000Segment is on the Florida Intrastate Highway System
Freeport City Limits/Pine Principal 2 Undivided 0 0 11.597 Trans. (C) 10,400 85-100% B 0-49% E NA NAStreet to US 331 Arterial 15,100
Roadway ID 60050000Segment is on the Florida Intrastate Highway SystemSegment is 4-lane divided .2 miles south of I-10 to .3 miles north of I-10
Updated 2010, using 2009 FDOT Generalized Q / LOS Tables.
Walton County, County Roads5

APPENDIX A
STATEWIDE MINIMUM LEVEL OF
SERVICE STANDARD F.A.C.
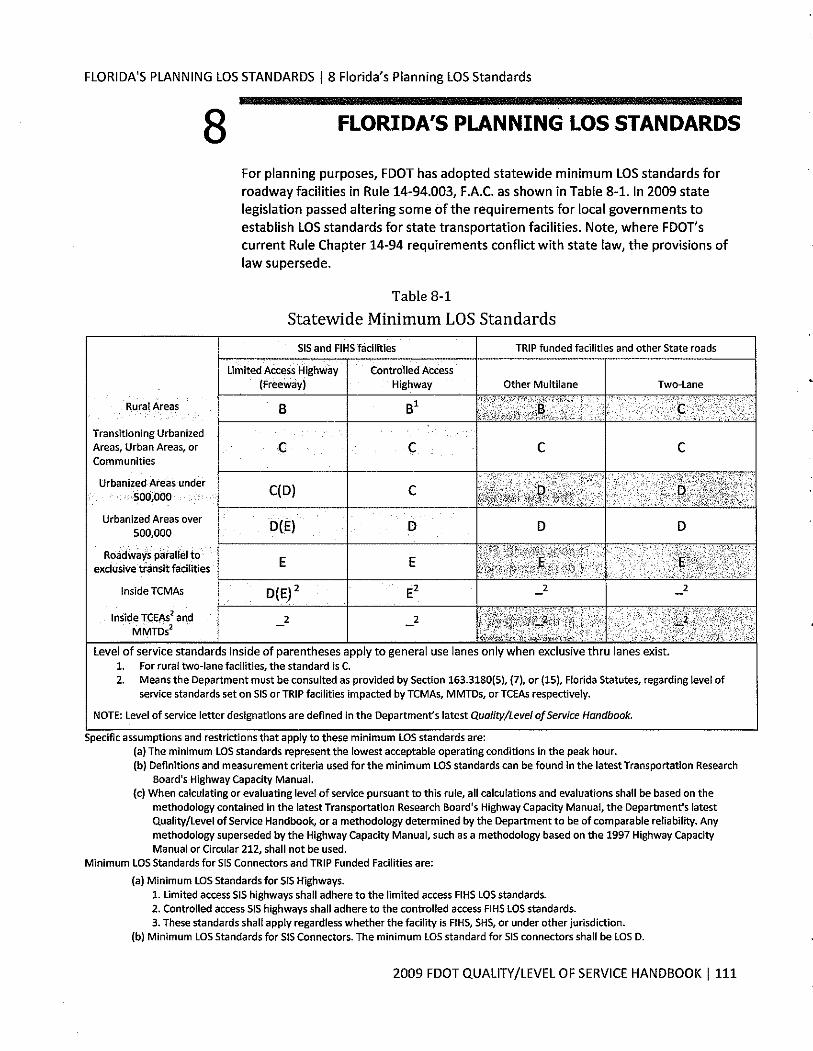


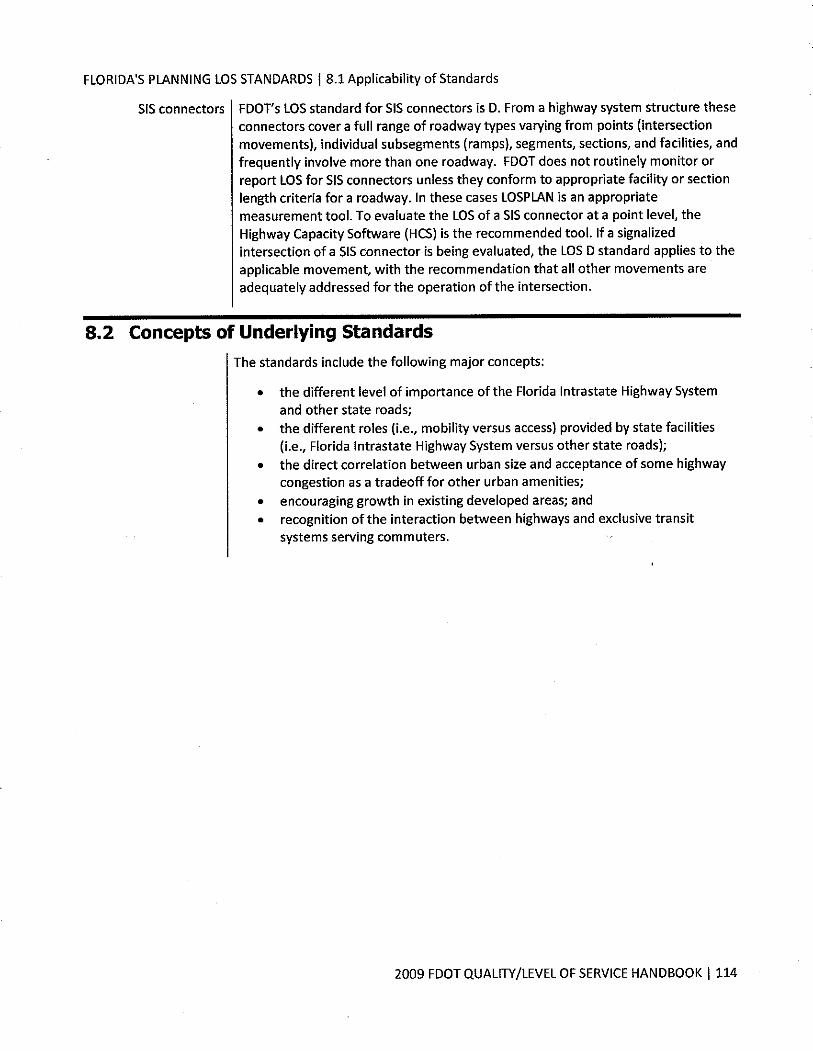
APPENDIX B
2009 QUALITY/LEVEL OF SERVICE
HANDBOOK-GENERALIZED
TABLES
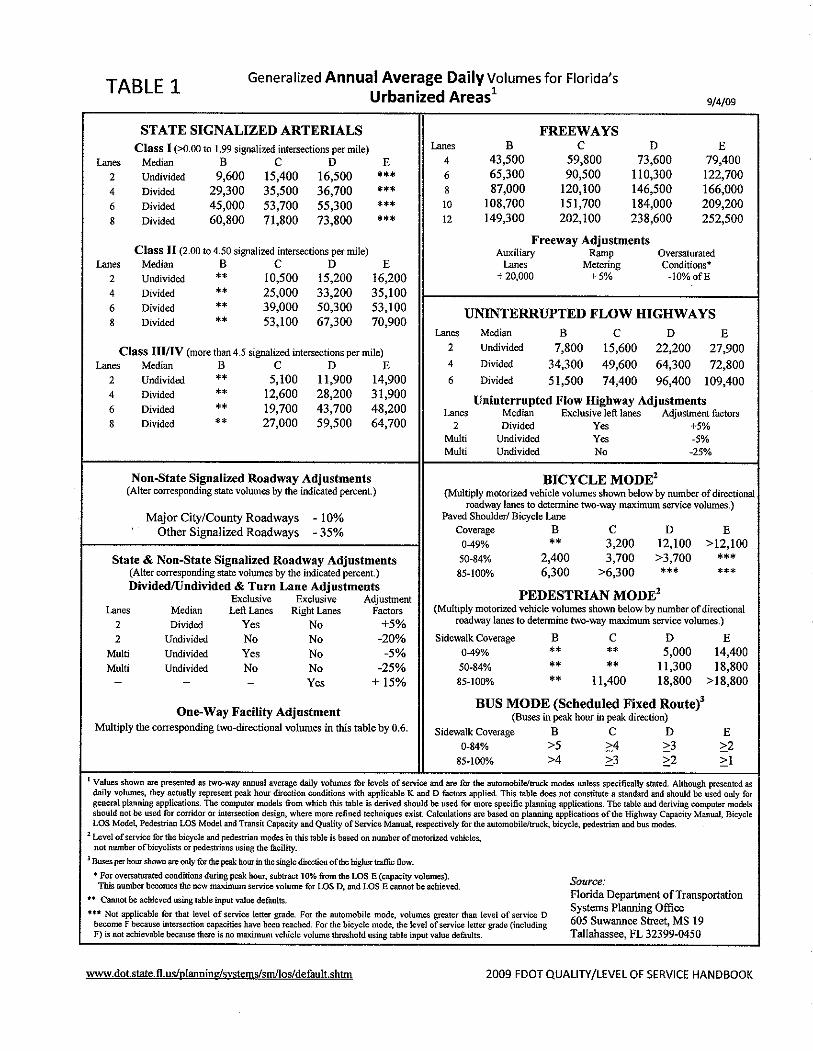
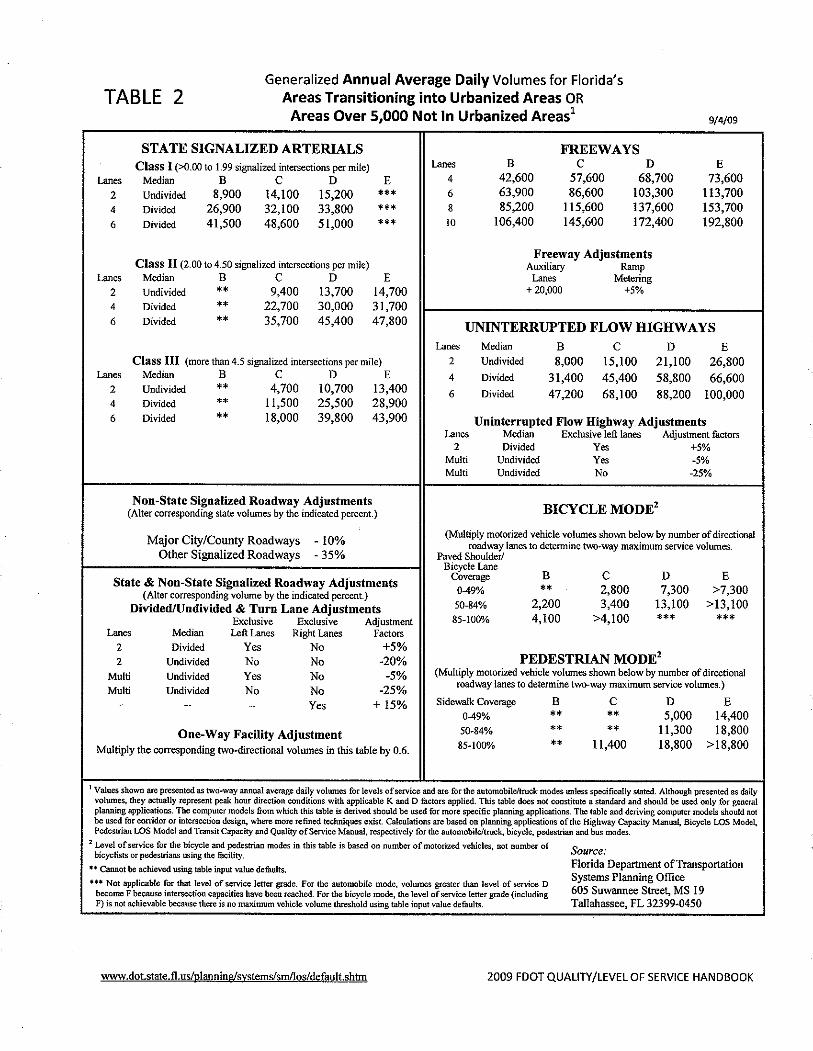


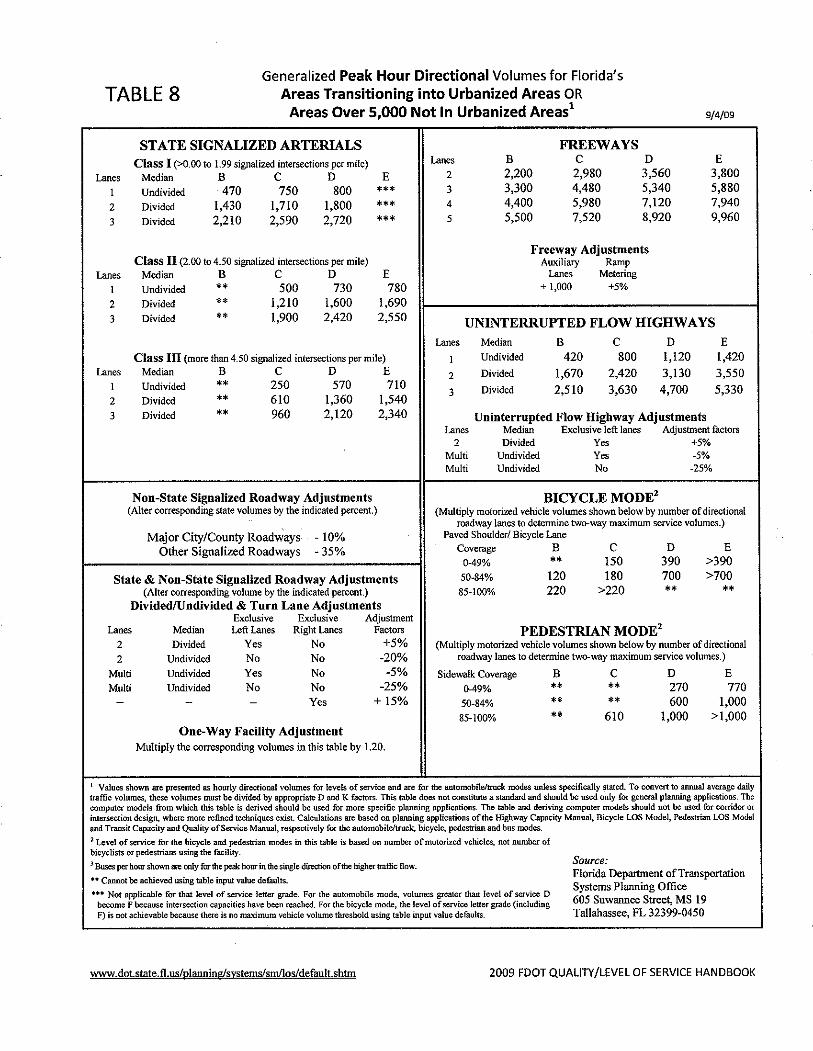


APPENDIX C
MAPS

£¤98
£¤98
UV123
UV293
UV20UV85
UV85
UV85
OW_cmp10.mxd July 19, 2010
®
0 2.5 51.25Miles
Okaloosa County
Choctawhatchee Bay
Gulf of Mexico
§̈¦10
UV4 UV85
£¤90UV4
£¤331
£¤98
UV20
South Walton County
Crestview Area
Deficient RoadwaySegments 2010-2011
Year Deficient20192014-20192009-2014-2019Metropolitan Planning Area Boundary
Eglin Air Force BaseNiceville
Valparaiso
Destin
Fort Walton Beach
Crestview
Freeport
Choctawhatchee Bay
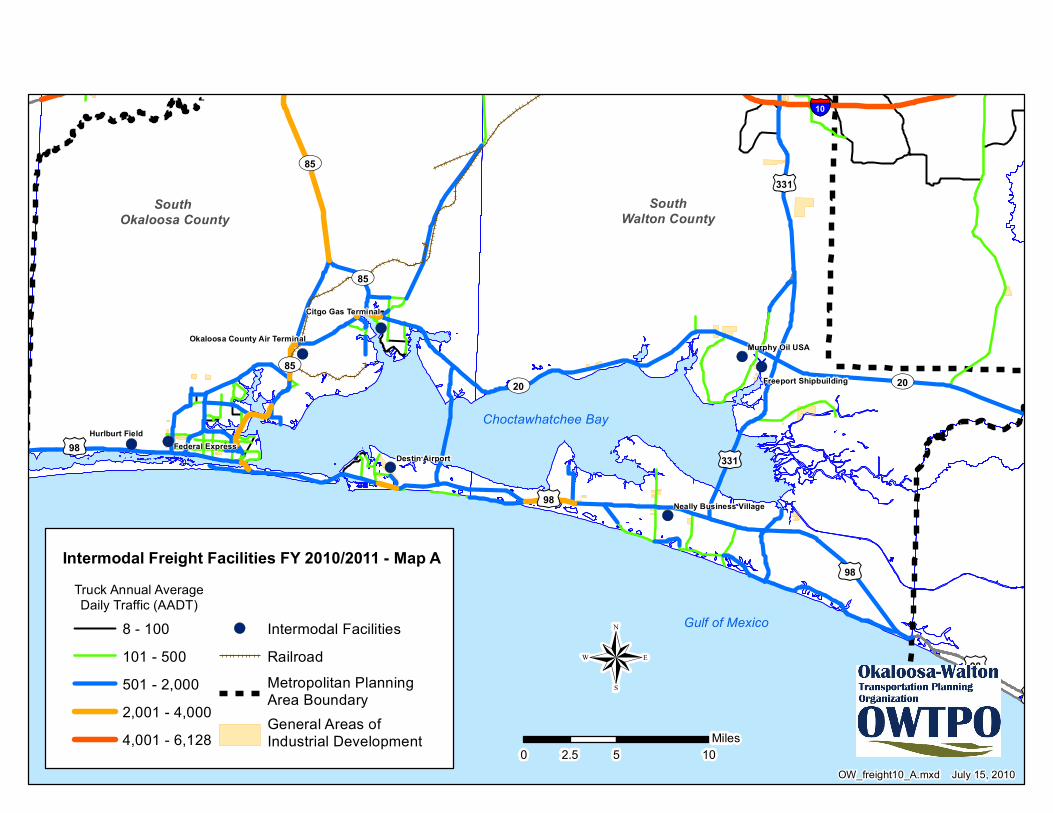
!(
!(
!(
!(
!(
!(
!(!(
!(
§̈¦10
§̈¦10
§̈¦10
§̈¦10
£¤331
£¤331
£¤98
£¤98£¤98
£¤98
£¤98
£¤98
£¤90
UV85
UV20 UV20
UV85
UV85Murphy Oil USA
Hurlburt Field
Destin AirportFederal Express
Citgo Gas Terminal
Freeport Shipbuilding
Neally Business Village
Okaloosa County Air Terminal
Amtrak Station
OW_freight10_A.mxd July 15, 2010
®0 5 102.5
Miles
SouthWalton County
South Okaloosa County
Intermodal Freight Facilities FY 2010/2011 - Map ATruck Annual AverageDaily Traffic (AADT)
8 - 100101 - 500501 - 2,0002,001 - 4,0004,001 - 6,128
!( Intermodal FacilitiesRailroadMetropolitan Planning Area BoundaryGeneral Areas of Industrial Development
Choctawhatchee Bay
Gulf of Mexico

!(
!(
!(
!(
!(
!(!(
!(
!(
§̈¦10
§̈¦10
§̈¦10
£¤331
UV85
£¤331
£¤90£¤90
£¤90
UV85
UV20
UV85
UV85Murphy Oil USA
Amtrak Station
Bob Sikes Airport
Citgo Gas Terminal
Crestview Aerospace
Freeport Shipbuilding
DeFuniak Springs Airport
Okaloosa County Air Terminal
Amtrak Station
®0 5 102.5
Miles
NorthWalton County
NorthOkaloosa County
OW_freight10_B.mxd July 15, 2010
Intermodal Freight Facilities FY 2010/2011 - Map BTruck Annual AverageDaily Traffic (AADT)
8 - 500501 - 1,0001,001 - 2,0002,001 - 4,0004,001 - 6,128
!( Intermodal FacilitiesRailroadMetropolitan Planning Area BoundaryGeneral Areas of Industrial Development

§̈¦10
§̈¦10
§̈¦10
§̈¦10
§̈¦10
§̈¦10
§̈¦10 §̈¦10
§̈¦10
£¤331
UV20
§̈¦10
§̈¦10
§̈¦10
£¤98
£¤331
£¤98
£¤98
£¤98
£¤90
£¤98£¤98
£¤90
£¤98
£¤98
£¤90
£¤98
£¤98
£¤98
£¤98
£¤98
£¤90
£¤98
£¤98
UV123
UV293
UV20UV85
UV85
UV85
UV85
UV4
UV20
OW_LOS_Boundaries.mxd September 1, 2010® 0 10 205
Miles
Level of Service AreasRuralTransitional (MetropolitanPlanning Area Boundary)Urban (FHWA Urbanized Area)MunicipalitiesMilitary
OkaloosaCounty Walton
County HolmesCounty
Santa RosaCounty
WashingtonCounty
BayCounty
TRANSITIONAL
RURAL
URBAN

APPENDIX D
OKALOOSA COUNTY AND
WALTON COUNTY CMP ROADWAY
TECHNICAL RANKINGS

Prog. 2009 2014 2019 Back. Evac. Intermodal Intermodal Multi-Modal Multi-Modal Prev. Total RankingCounty Road From....To Status V/C V/C V/C Constr. Route Part A Part B Part A Part B Priority Points
Okaloosa SR 30 (US 98) Gulf Shore Drive to Emerald Coast Parkway (Old US 98) 4 3 5 5 3 3 4 0 0 0 2 29 1Okaloosa CR 20 (Hill Avenue) Hollywood Boulevard to Lovejoy Road 4 5 5 5 0 3 0 0 0 2 2 26 2Okaloosa SR 189 (Beal Parkway) SR 393/Mary Esther Boulevard to SR 188/Racetrack Road 4 3 5 5 3 3 0 0 0 0 2 25 3Okaloosa SR 30 (US 98) Eastern Leg SR 85/Florida Place to Military Boundary/Beach Park Entrance Okal. Island 4 1 3 3 3 3 4 0 0 0 2 23 4Okaloosa SR 30 (US 98) East Pass Bridge (west end) to Gulf Shore Drive 4 1 1 3 3 3 4 0 0 0 2 21 5Walton SR 30 (US 98) Okaloosa County Line to Old US 98 / SR 30 3 1 3 5 0 3 4 0 0 0 2 21 5Okaloosa P.J. Adams Parkway CR 4 Antioch Road to SR 85 S Ferdon Boulevard 4 5 5 5 0 0 0 0 0 0 2 21 5Okaloosa SR 30 (US 98) Emerald Cost Parkway (Old US 98) to Matthew Boulevard 4 1 3 3 0 3 4 0 0 0 2 20 6Okaloosa SR 85 Antioch Road to I-10 (SR 8) 4 3 3 5 0 3 0 0 0 0 2 20 6Okaloosa CR 2390 Mary Esther Boulevard to SR 85 4 1 1 3 0 3 0 0 2 2 2 18 7Okaloosa SR 293 Mid Bay Bridge Road South Approach to SR 20 4 1 3 3 0 3 0 0 0 2 2 18 7Okaloosa SR 85 I-10 (SR 8) to US 90 / SR 10 4 1 3 5 0 3 0 0 0 0 2 18 7Walton SR 30 (US 98) Mack Bayou Road to CR 30A (West End) 4 1 1 3 0 3 4 0 0 0 2 18 7Okaloosa SR 30 (US 98) Santa Rosa County Line to Hurlburt Field Gate 4 1 1 1 0 3 4 0 0 0 2 16 8Okaloosa SR 123 SR 85 to SR 85N 4 1 1 3 0 3 0 0 0 2 2 16 8Okaloosa SR 20 Rocky Bayou Bridge to SR 293 / White Point Road 4 1 1 3 0 3 0 0 0 2 2 16 8Walton SR 30 (US 98) Old 98 / SR 30 / Gulf Pines to Mack Bayou Road 4 0 0 1 0 3 4 0 0 2 2 16 8Walton SR 83 (US 331 S) SR 30 / US 98 to Choctawatchee Bay Bridge (N. Approach) 0 0 0 1 0 3 4 0 0 2 2 16 8Okaloosa CR 4 P.J. Adams Parkway to SR 85 S. Ferdon Boulevard 4 1 3 3 0 0 0 0 0 2 2 15 9Okaloosa MLK Jr. Boulevard Lovejoy Road to Ajax Drive 4 1 3 3 0 0 0 0 0 2 2 15 9Okaloosa SR 20 SR 285 / Partin Drive to Rocky Bayou Bridge 4 1 1 3 0 3 0 0 0 0 2 14 10Okaloosa SR 30 (US 98) SR 393 / Mary Esther Boulevard to Eastern Leg SR 85 / Florida Place 4 0 0 1 0 3 4 0 0 0 2 14 10Okaloosa SR 85 US 90 / SR 10 to CR 188 / Old Bethel Road 4 1 1 3 0 3 0 0 0 0 2 14 10Walton SR 30 (US 98) CR 393 to US 331/SR 83 4 0 0 1 0 3 4 0 0 2 0 14 10Okaloosa MLKJr.Blvd/Green Acres Dr. Hurlburt Field Road to SR 189 4 0 1 1 0 3 0 0 0 2 2 13 11Okaloosa SR 85 (John Sims Parkway) Government Avenue (John Sims Parkway) to SR 85N 4 0 0 1 3 3 0 0 0 0 2 13 11Okaloosa SR 4 SR189 to US 90 / SR 10 4 0 1 1 0 3 0 0 0 2 2 13 11Okaloosa SR 189 (Lewis Turner Blvd.) SR 188/Racetrack Road to Mooney Road 4 0 0 1 0 3 0 0 0 2 2 12 12Okaloosa SR 393 (Mary Esther Blvd.) Anchors Street to SR 189 / Beal Parkway 4 0 1 1 3 0 0 0 0 0 2 11 13Walton SR 30 (US 98) Okaloosa-Walton FHWA Boundary (east of CR 30 A) to CR 393 3 0 0 1 0 3 0 0 0 2 2 11 13Okaloosa MLK Jr. Boulevard Ajax Drive to Hurlburt Field Road 4 1 1 3 0 0 0 0 0 0 2 11 13Okaloosa General Bond Road SR 189 to SR 85 4 0 0 1 0 0 0 0 0 2 2 9 14Okaloosa CR 1719 (College Blvd.) SR 85 to SR 285 4 0 0 1 0 0 0 0 0 2 2 9 14
Okaloosa County and Walton County CMP Roadway Technical Rankings