Embed Size (px)
Citation preview
Congenital Anomalies in Births
2004 to 2008
Contents
Background Information
Data Summary
Ongoing EMSYCAR activities
Anomaly Clusters and Trends
Tables 1 to 7 Table 1: Number and proportion of births with one (or more) confirmed congenital anomaly, by year of
birth 2004 – 2008 Entire EMSYCAR region
Table 2: Number and proportion of births with one (or more) confirmed congenital anomaly, by
plurality and year of birth 2004 – 2008 Entire EMSYCAR region
Table 3: Number and proportion of births with one (or more) confirmed congenital anomaly, by infant
sex and year of birth 2004 – 2008 Entire EMSYCAR region
Table 4: Birth status of cases reported to EMSYCAR with one (or more) confirmed congenital anomaly,
by year of delivery 2004 – 2008 Entire EMSYCAR region
Table 5: Number and rates of selected congenital anomalies and congenital anomaly groups per 10,000
total live + still births, by year of birth 2004 – 2008 Entire EMSYCAR region
Table 6: Anomalies by Birth Status 2004 – 2008 Entire EMSYCAR region
Table 7: Anomalies by Maternal Age 2004 – 2008 Entire EMSYCAR region
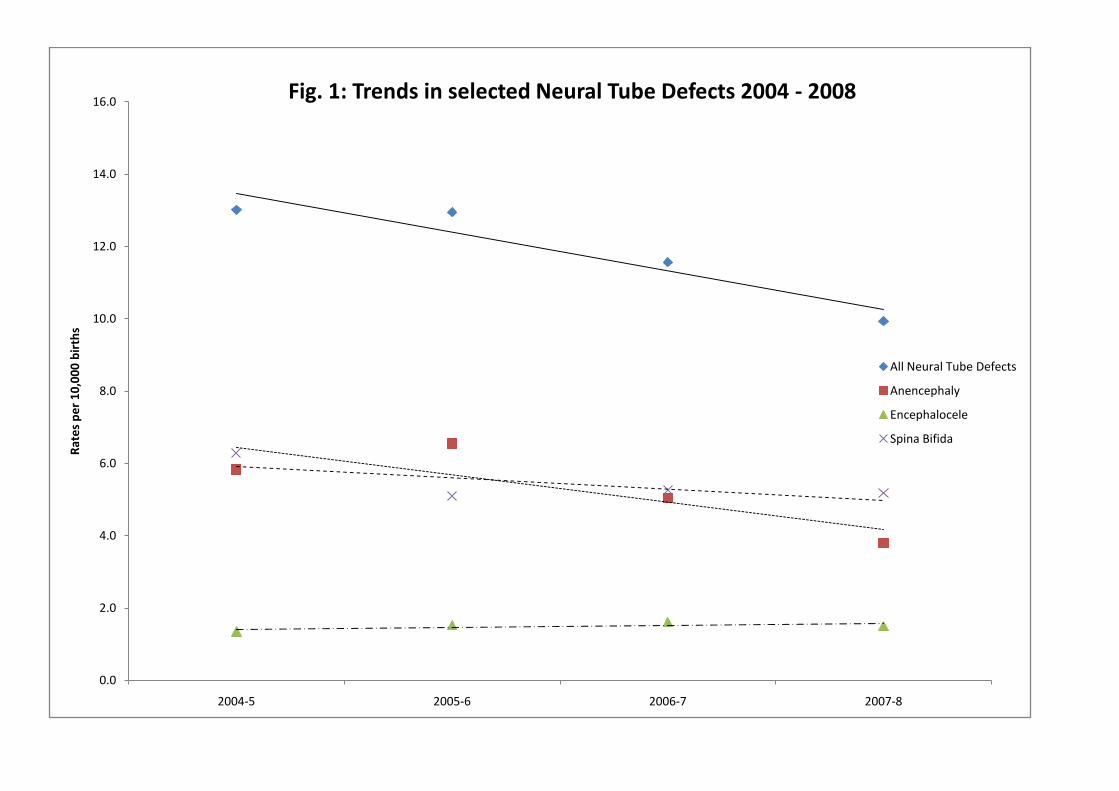
Figs. 1 to 6 Fig. 1: Trends in selected Neural Tube Defects 2004 – 2008
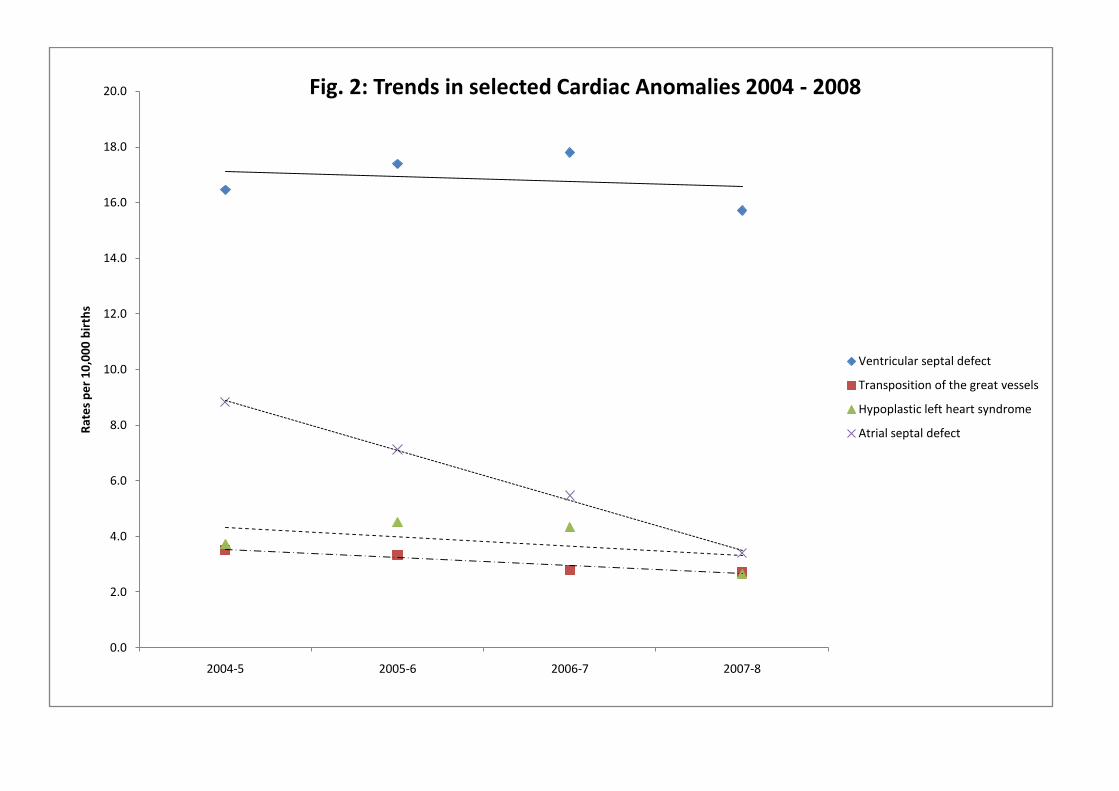
Fig. 2: Trends in selected Cardiac Anomalies 2004 – 2008
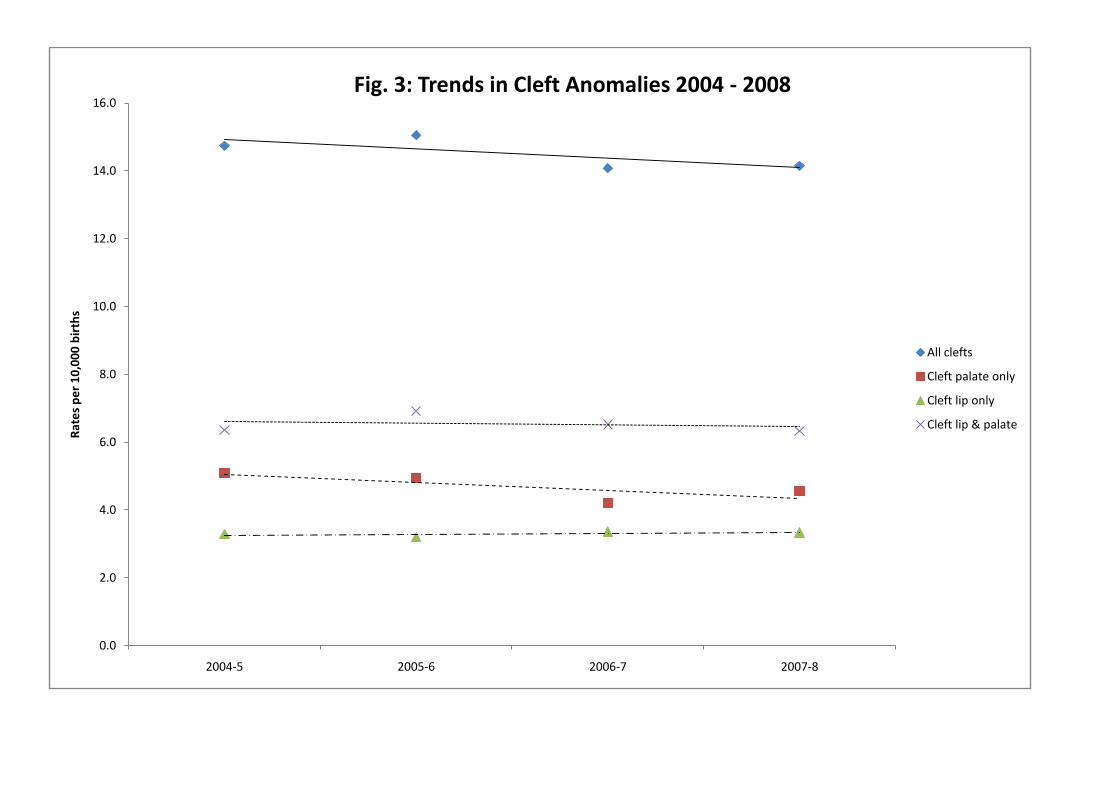
Fig. 3: Trends in Cleft Anomalies 2004 – 2008
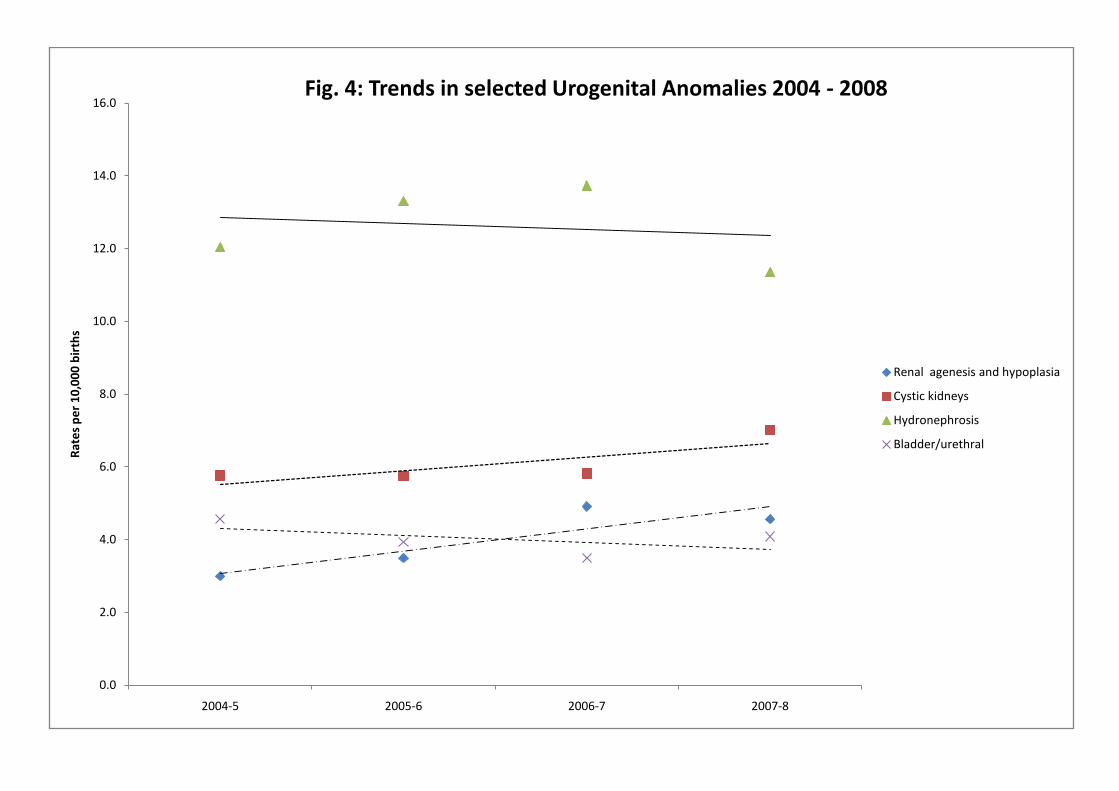
Fig. 4: Trends in selected Urogenital Anomalies 2004 – 2008
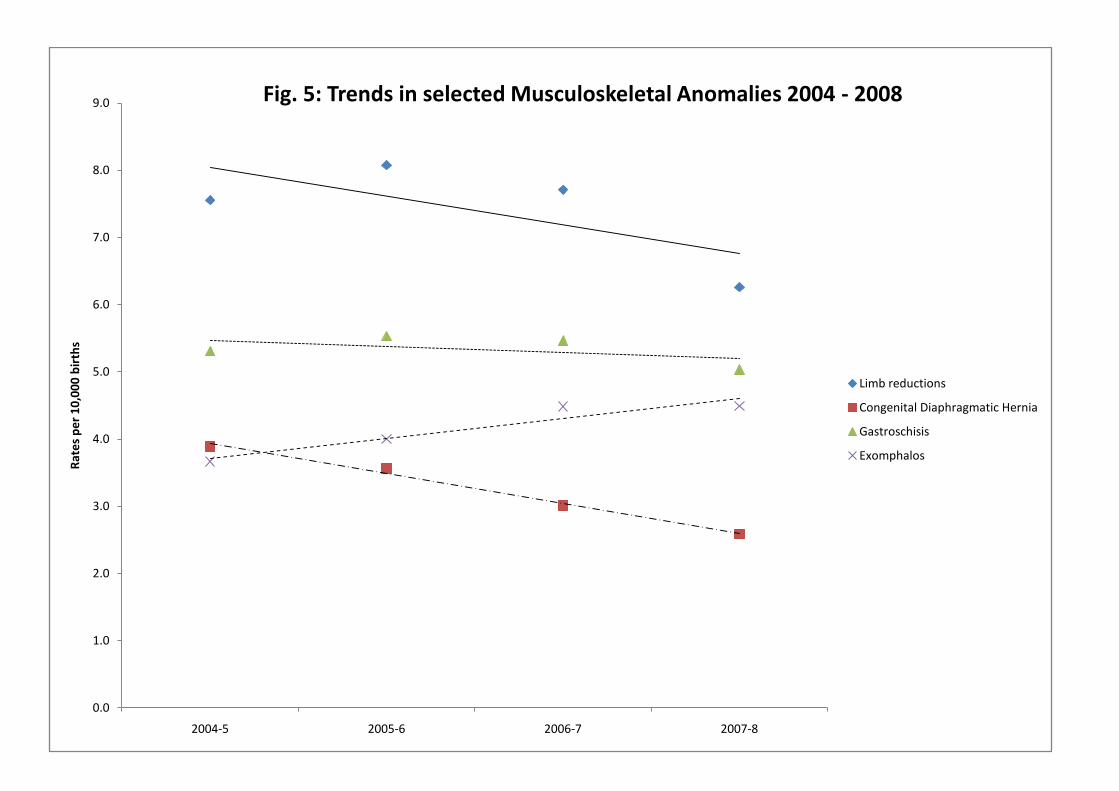
Fig. 5: Trends in selected Musculoskeletal Anomalies 2004 – 2008
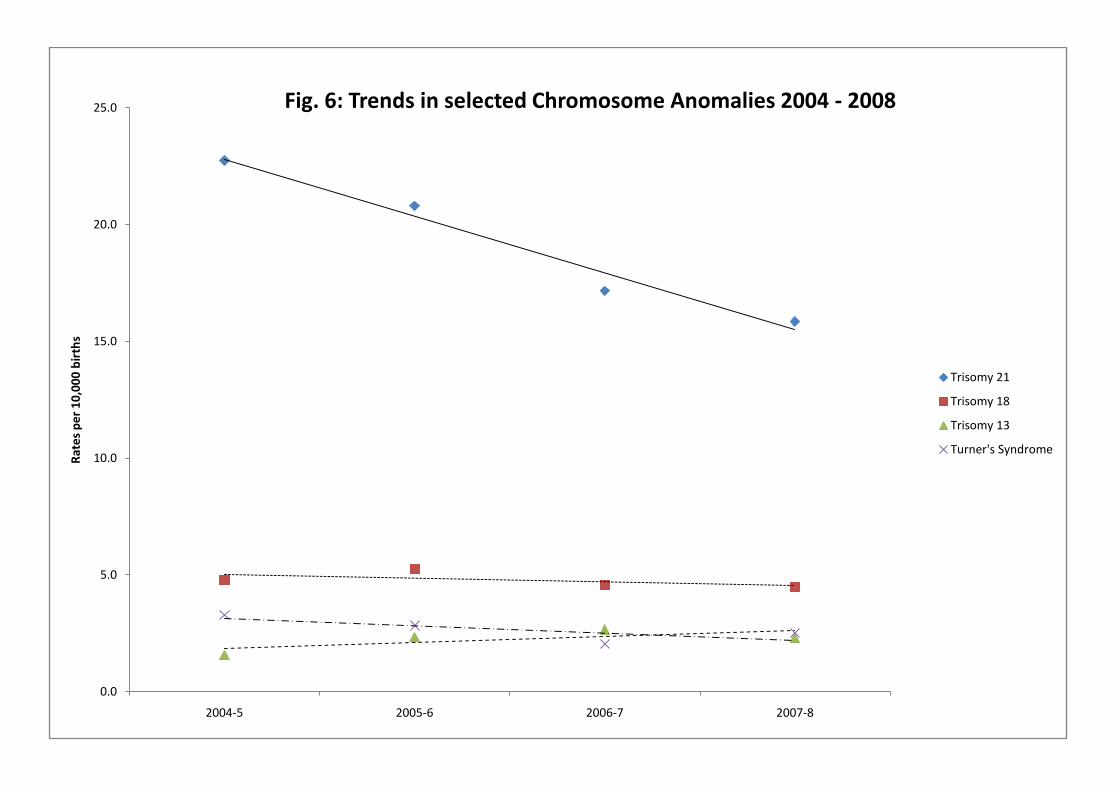
Fig. 6: Trends in selected Chromosome Anomalies 2004 – 2008
Tables 8 to 21 Table 8: Barnsley PCT: Rates of selected anomaly groups 2004 – 2008
Table 9: Bassetlaw PCT: Rates of selected anomaly groups 2004 – 2008
Table 10: Derby City PCT: Rates of selected anomaly groups 2004 – 2008
Table 11: Derbyshire County PCT: Rates of selected anomaly groups 2004 – 2008
Table 12: Doncaster PCT: Rates of selected anomaly groups 2004 – 2008
Table 13: Leicester City PCT: Rates of selected anomaly groups 2004 – 2008
Table 14: Leicestershire County & Rutland PCT: Rates of selected anomaly groups 2004 – 2008
Table 15: Lincolnshire Teaching PCT: Rates of selected anomaly groups 2004 - 2008
Table 16: North East Lincolnshire PCT: Rates of selected anomaly groups 2004 – 2008
Table 17: North Lincolnshire PCT: Rates of selected anomaly groups 2004 – 2008
Table 18: Northamptonshire PCT: Rates of selected anomaly groups 2004 – 2008
Table 19: Nottinghamshire County PCT: Rates of selected anomaly groups 2004 – 2008
Table 20: Rotherham PCT: Rates of selected anomaly groups 2004 – 2008
Table 21: Sheffield PCT: Rates of selected anomaly groups 2004 – 2008
Background information
Time period covered: These tables summarise congenital anomalies reported in pregnancies which ended between January 1st 2004 and December 31st 2008 inclusive in the East Midlands and South Yorkshire region.
EMSYCAR Geography: In 2006, the geography of the area covered by EMSYCAR changed substantially for a second time. The 39 PCTs, which had formed three separate SHAs and part of a fourth, and which had constituted the EMSYCAR area since 2002, were re-organised. Six of the original 39 remained unchanged; the rest were reformed into nine larger PCTs.
o The data presented here follows the boundaries of the fourteen ‘new’ PCTs and one Care Trust Plus which postdate October 2006. Data from 2004-2005 has been allocated to the relevant ‘new’ PCT.
Regional Coverage:. Between 2006-2009 a number of PCTs withdrew their funding for the Register.
o However, the Register attempted to continue data collection throughout its whole area, in order not to compromise data quality for those who remained. Available data has been backdated in this present report to cover the ‘missing’ years for those PCTs which have subsequently rejoined. All PCTs have now agreed to provide financial support to EMSYCAR from 2009 onwards.
Surveillance: No Congenital Anomaly data was sent to the National Congenital Anomaly System from PCTs which withdrew from the Register, and no surveillance of these areas was undertaken, either at regional or national level, between 2006 and 2009. Until the end of 2008, NCAS divided its published data between areas covered by Congenital Anomaly Registers, where reported rates are much higher and more accurate (and which includes those PCTs reported separately here) and areas of England which are not covered by Registers (including the non-contributing PCTs in the EMSYCAR region.)
o A consultation document is currently out for comment from NCAS who have now discontinued all routine anomaly surveillance from the beginning of 2009 onwards. Consequently, EMSYCAR is the only resource available to perform this essential public health function for its resident population. Computer software provided through the European Surveillance Network (EUROCAT) will be used initially for those PCTs contributing to EMSYCAR. The British Isles Network of Congenital Anomaly Registers (BINOCAR) is working to provide a timely standardised surveillance method for all areas covered by a Congenital Anomalies Register.
‘Minor’ Anomalies The BINOCAR Registers have continued to work with NCAS to refine the list of ‘minor’ anomalies for exclusion, to bring it into closer alignment with the EUROCAT list. The same working group has also addressed the issue of coding variability, both between different regional Registers, and between regional Registers and NCAS. All Registers have now adopted an agreed BINOCAR coding framework, which NCAS have used for all births from January 1st 2007. Some variation in reported anomaly rates in certain subgroups (particularly Musculoskeletal and Endocrine & Metabolic Disorders) is therefore to be expected from 2007 onwards.
Table Format: Anomaly rates are presented in the tables as a rate per 10,000 births. Individual PCTs requiring further information should contact EMSYCAR to request greater detail for their own area. This will be provided wherever possible, although it should be noted that, according to national guidelines, the number of anomaly cases in any given cell should always exceed a minimum of five in order that data confidentiality is not compromised and that there is no possibility of individual cases being identified. For small areas and/or rare anomalies, this criterion may frequently not be met.
o Since 2006, the Office for National Statistics has published figures relating to the number of maternities resulting in multiple births, rather than the number of multiple births per se. EMSYCAR rates in Table 2 therefore cannot be calculated for these years.
Further Information: A more detailed background to EMSYCAR and its data collection methods may be found in previous Reports available from EMSYCAR, Department of Health Sciences, University of Leicester, 22-28 Princess Road West, Leicester, LE1 6TP, or by emailing [email protected] with a request.
Data Summary
The total number of births occurring in the EMSYCAR region has been rising steadily since 2001. Initially, this was due to the entry of Northamptonshire into EMSYCAR in 2002-3, but since then the birth rate has continued to increase.
In any given year, about 2.4% of all births in the EMSYCAR region have serious, reportable anomalies. Slightly more males (2.6%) than females (1.9%) and more multiple (around 3%) than singleton (2.4%) births are affected.
As a result of the introduction of the electronic birth notification form in October 2002, the total number of cases reviewed annually by EMSYCAR (including those antenatally reporting false positives) fell by 13% between 2002 and 2004. However, numbers have risen steadily since then and have regained their pre-2002 level of around 2500 cases per annum.
Despite the problems for EMSYCAR caused by reduced funding, the number of cases reported to the European Surveillance System, EUROCAT, has also increased steadily, from 1331 in 2002 to 1575 in 2006. This reflects the huge amount of work, both by the EMSYCAR team and notifiers in the many maternity units, devoted to tracking cases and obtaining outcome data.
While anomaly rates have historically varied between PCTs, with those in Sheffield being traditionally above average as a result of a very well developed local reporting system, Table 5 demonstrates that the rates for individual anomalies have largely remained stable for EMSYCAR as a whole. Comparison with rates reported elsewhere in Europe can easily be made from the EUROCAT website (www.eurocat.ulster.ac.uk).
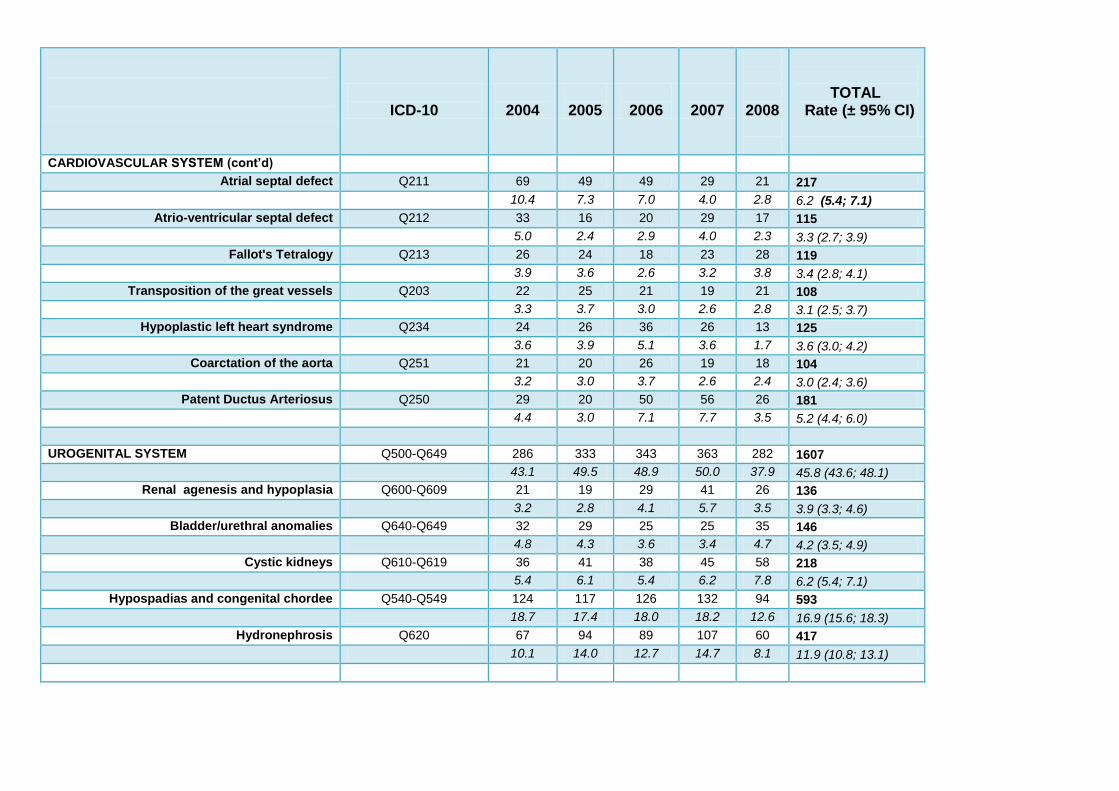
An exception lies within the cardiovascular group of anomalies, where efforts to secure data from the Regional Paediatric Cardiac Centre at Glenfield Hospital, Leicester eventually resulted in success during 2008, and surgical and cardiology notifications are being backdated for the cohort of children born in the EMSYCAR region since 1997.
This has resulted in an overall rise of approximately 20% in the notified rates of cardiac anomalies in this present Report. This is partly due to previously unknown cases being notified and also much improved diagnostic accuracy for cases already known to the register.
Ongoing EMSYCAR Activities
Audit and research activities have continued using Register data. EMSYCAR has joined several European-wide research initiatives, including a review of the Termination of Pregnancy for Fetal Anomaly, and is also contributing to a number of UK projects. One of these is attempting to test the feasibility of collecting follow-up data from parents of two-year-old children born with diaphragmatic hernia. Another is investigating the antenatal diagnosis of Schizencephaly. EMSYCAR has also contributed to a BINOCAR audit of Downs Syndrome cases between 2003 and 2006; we lead an audit of exomphalos cases over the past 10 years and continue to participate with an investigation into the rising incidence of gastroschisis.
Specific EMSYCAR research projects are investigating the appropriateness of treatment regimes for cases of Sexual Differentiation reported to the Register over a ten year period, and outcomes from antenatally detected cases of AVSD.
Recent EMSYCAR data has been used by the National Fetal Anomaly Screening Programme in a review of antenatal diagnosis rates for selected congenital anomalies. This data was also presented to the RCOG TOPFA Working Party. Data has been utilised by the Paediatric Stoma Nurses Group UK, to update their supporting literature. Data from EMSYCAR, and other BINOCAR Registers, has also been utilised by the National Perinatal Epidemiology Unit in Oxford to validate data obtained from BAPS-CASS (the British Association of Paediatric Surgeons Congenital Anomalies Surveillance System). This has attempted to evaluate the success of the BAPS-CASS data collection methods.
Other requests for data from the Register from local clinicians continue to be dealt with as appropriate. Regular data matching and cleaning is undertaken in conjunction with the North Trent Clinical Genetics Service, the National Down Syndrome Cytogenetic Register, together with local ultrasound , antenatal and fetal medicine units, mainly with a view to establishing antenatal detection rates. Training sessions have continued to be provided at the request of local clinicians.
Professor Elizabeth Draper continues in her role as Chair of the British Isles Network of Congenital Anomaly Registers (BINOCAR). Dr Judith Budd continues as a member of the EUROCAT Coding Issues Group and BINOCAR Coding Committee. Both attended the EUROCAT Annual Register Leaders’ Meeting in Bilbao in June 2009.
In March 2009, Dr Judith Budd represented BINOCAR and EMSYCAR as a witness in the High Court action brought by parents of children with congenital anomalies born between 1986 and 1999 having links to the town of Corby in Northamptonshire. This issue has been a major focus for the Register since Northamptonshire joined EMSYCAR in 2002, and, since the judgement is now the subject of an appeal, will remain so.
Anomaly Clusters and Trends
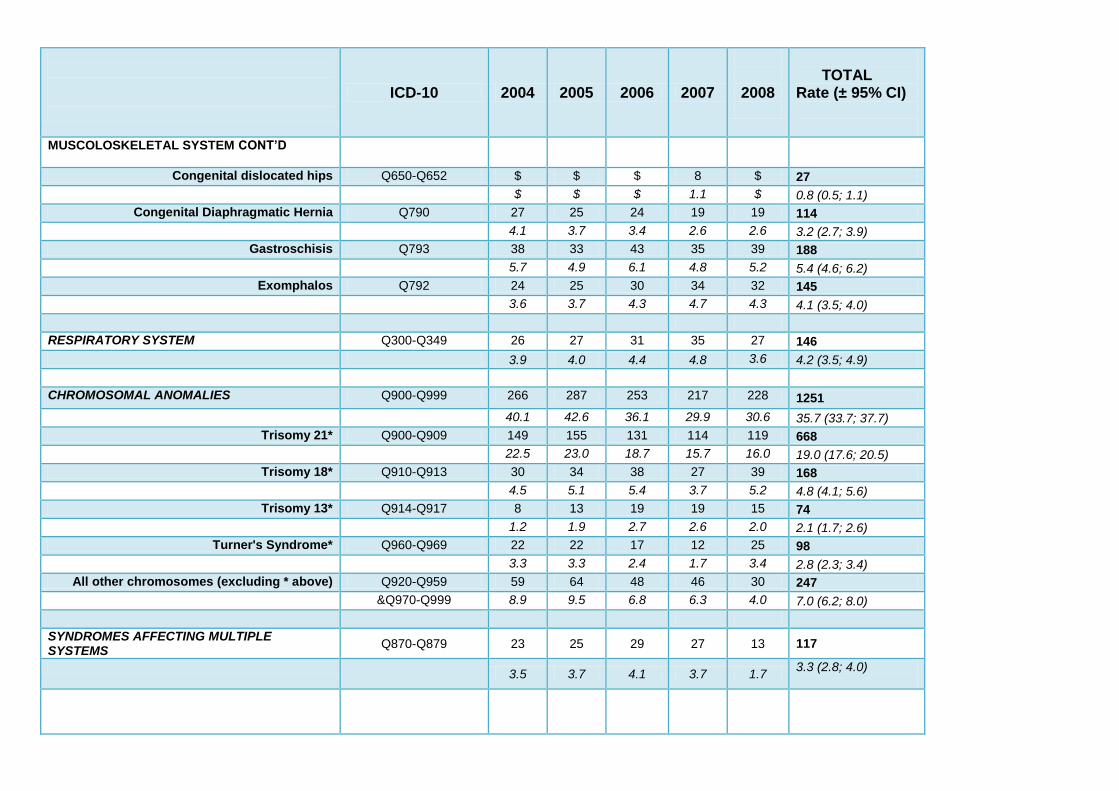
For the great majority of anomalies, trends have remained stable or show a slight decrease between 2003 and 2007, reflecting the time lag necessary for the more recently diagnosed anomalies to reach the Register. A few anomalies, however, appear to be increasing, such as anencephaly (although spina bifida continues to decrease), clefts, gastroschisis and exomphalos. These trends appear to be consistent with those appearing in other BINOCAR register areas, though they will be kept under review.
There is also some local concern over cases of skeletal dysplasia reported from PCTs which unfortunately were not funding surveillance of their population by EMSYCAR during the relevant years. We have continued to monitor the situation and will be investigating this issue further.
Routine surveillance of EMSYCAR data by EUROCAT highlighted 5 potential clusters in time during the years 2003-2007.
These were all investigated by EMSYCAR, with the following outcomes:
o 32 cases of Hydrocephalus in the period September 2006 – January 2007. One duplicate case had already been removed from the EMSYCAR database but not updated with EUROCAT. The suspected cluster therefore resolved.
o 8 cases of Common Arterial Truncus in the period August 2005 – January 2006. As above.
o 8 cases of Transposition of the Great Arteries between January 2006 and February 2006. Correct gestational ages of deliveries known to EMSYCAR had not been backdated with EUROCAT, which had used estimations. Once the appropriate amendments had been made, the suspected cluster resolved.
o 14 cases of VSD in the period December 2005 – January 2007. As with TGA.
o 8 cases of cleft palate in May 2005 All cases were verified 5 occurred in close proximity around Town A. 2 others were in very close
proximity in Town B (50 miles away). 1 further case occurred elsewhere in the EMSYCAR region.
Information provided by the local data notifiers indicated that the 2 cases in Town B were both known drug and alcohol abusers.
There was no such history for the other cases. Local contacts believed that no local concerns were raised by the media,
general public or health professionals. There was no evidence of other or similar clusters elsewhere in the
EMSYCAR region.
Regrettably, it was not possible to pursue any further investigations over this potential cluster since 7 of the
8 cases occurred in PCTs which had chosen to withdraw from EMSYCAR.
EMSYCAR also investigated four anomalies displaying increased trends over the 2003 – 2007 period, which were identified by EUROCAT surveillance software. These were Hypoplastic Left Heart Syndrome, Congenital Cystic Adenomatoid Malformation, Renal Dysplasia and Gastroschisis.
o In each of the first three anomalies, the increased trend was artefactual, as a result of cases occurring in earlier years not being notified to EMSYCAR in time for inclusion in the appropriate year’s dataset to EUROCAT.
o The increasing trend demonstrated by gastroschisis is real and already recognised
by other BINOCAR Registries. A number of projects are in progress to investigate possible explanations.
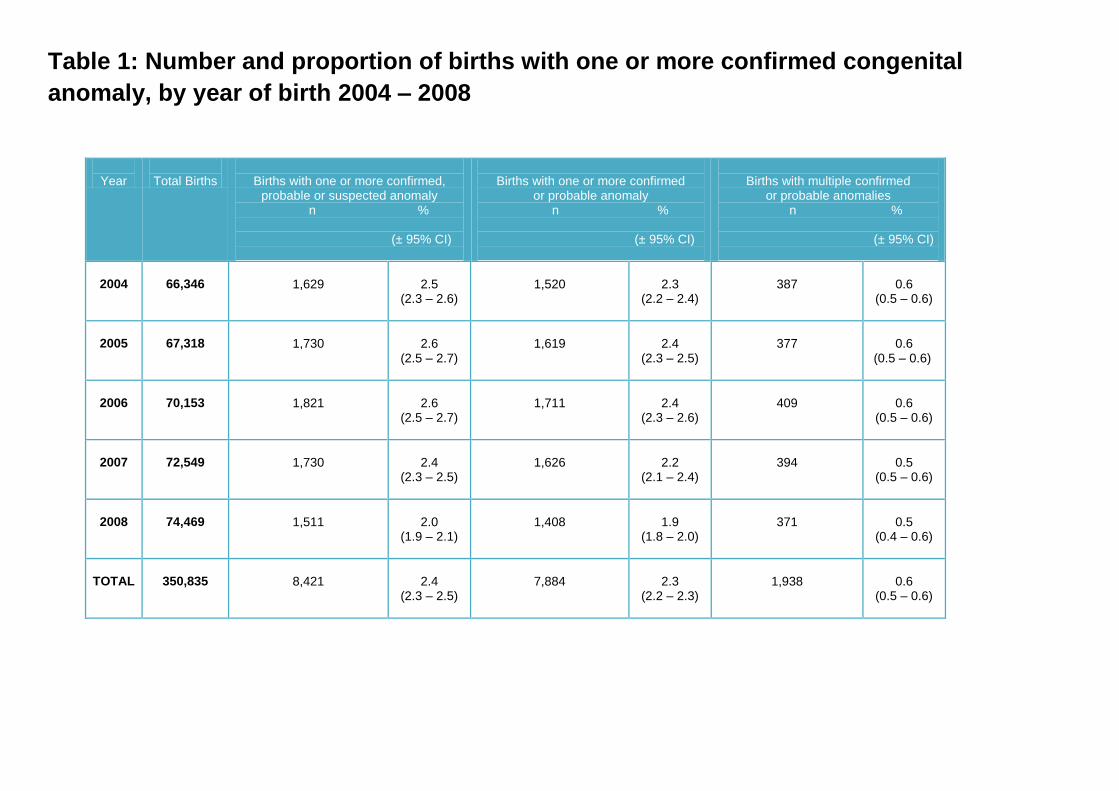
Table 1: Number and proportion of births with one or more confirmed congenital
anomaly, by year of birth 2004 – 2008
Year
Total Births
Births with one or more confirmed,
probable or suspected anomaly n %
(± 95% CI)
Births with one or more confirmed
or probable anomaly n %
(± 95% CI)
Births with multiple confirmed
or probable anomalies n %
(± 95% CI)
2004
66,346
1,629
2.5
(2.3 – 2.6)
1,520
2.3
(2.2 – 2.4)
387
0.6
(0.5 – 0.6)
2005
67,318
1,730
2.6
(2.5 – 2.7)
1,619
2.4
(2.3 – 2.5)
377
0.6
(0.5 – 0.6)
2006
70,153
1,821
2.6
(2.5 – 2.7)
1,711
2.4
(2.3 – 2.6)
409
0.6
(0.5 – 0.6)
2007
72,549
1,730
2.4
(2.3 – 2.5)
1,626
2.2
(2.1 – 2.4)
394
0.5
(0.5 – 0.6)
2008
74,469
1,511
2.0
(1.9 – 2.1)
1,408
1.9
(1.8 – 2.0)
371
0.5
(0.4 – 0.6)
TOTAL
350,835
8,421
2.4
(2.3 – 2.5)
7,884
2.3
(2.2 – 2.3)
1,938
0.6
(0.5 – 0.6)
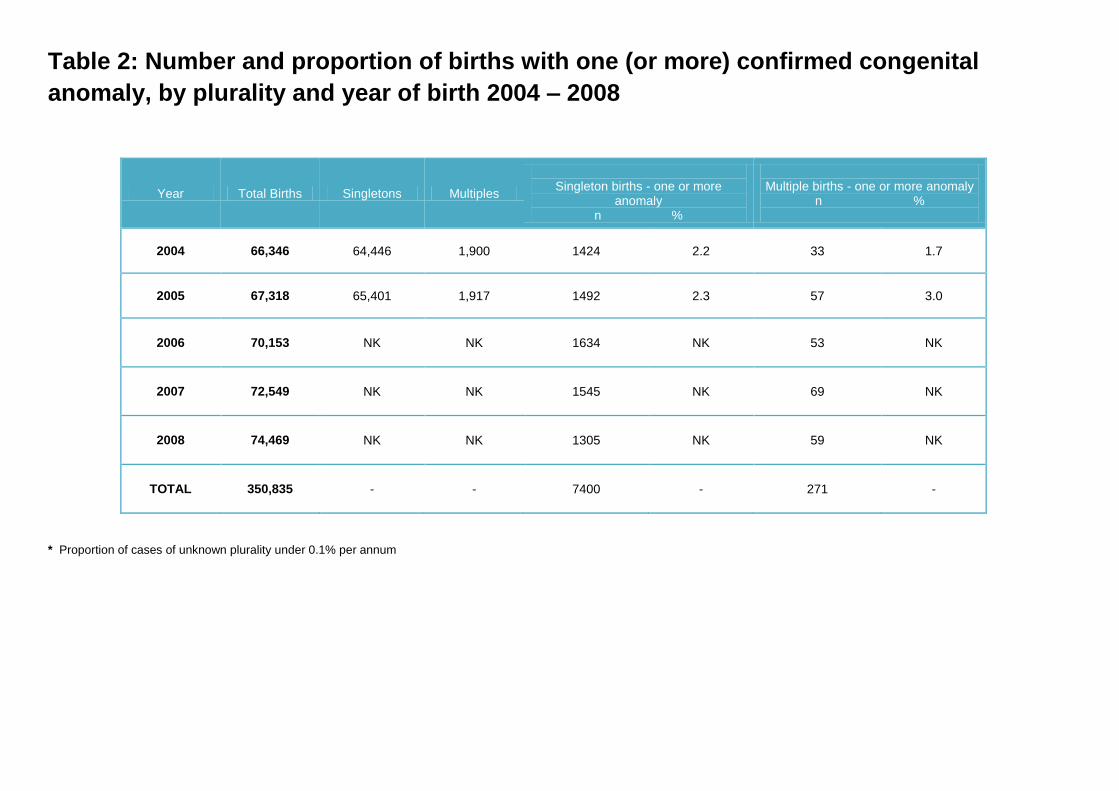
Table 2: Number and proportion of births with one (or more) confirmed congenital
anomaly, by plurality and year of birth 2004 – 2008
Year Total Births Singletons Multiples
Singleton births - one or more
anomaly n %
Multiple births - one or more anomaly
n %
2004
66,346 64,446 1,900 1424 2.2 33 1.7
2005
67,318 65,401 1,917 1492 2.3 57 3.0
2006 70,153 NK NK 1634 NK 53 NK
2007 72,549 NK NK 1545 NK 69 NK
2008 74,469 NK NK 1305 NK 59 NK
TOTAL 350,835 - - 7400 - 271 -
* Proportion of cases of unknown plurality under 0.1% per annum
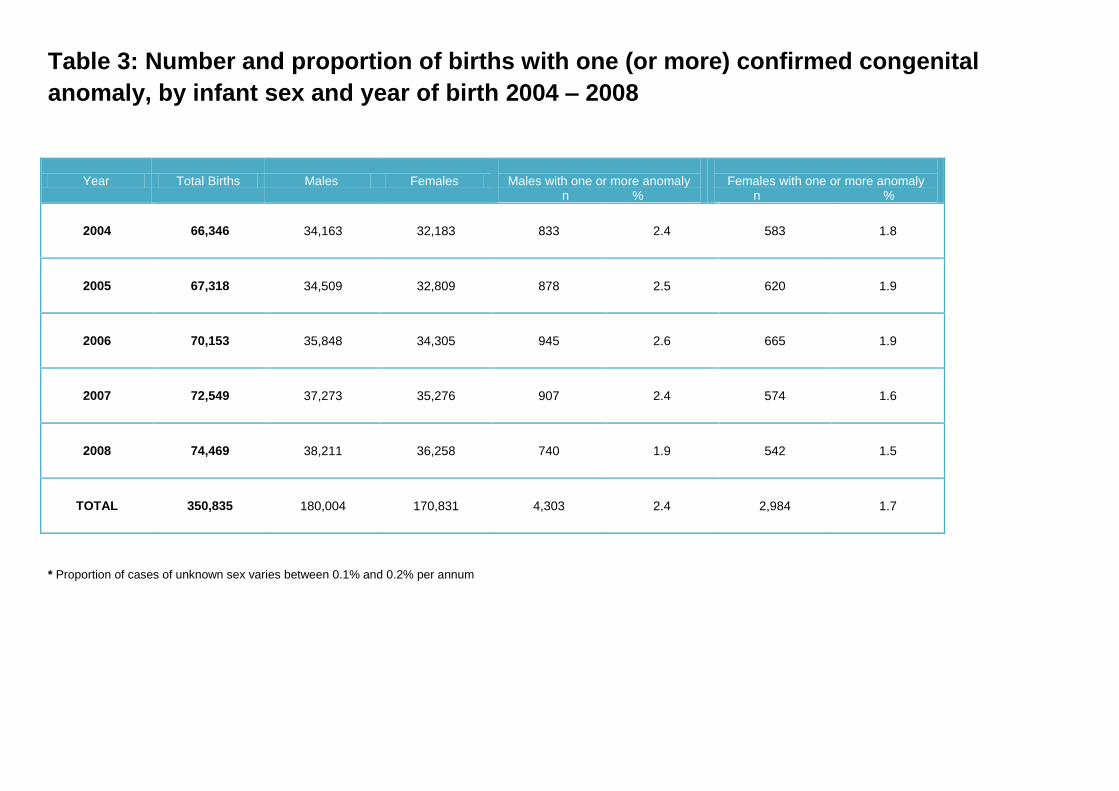
Table 3: Number and proportion of births with one (or more) confirmed congenital
anomaly, by infant sex and year of birth 2004 – 2008
Year Total Births Males Females
Males with one or more anomaly n %
Females with one or more anomaly
n %
2004
66,346 34,163 32,183 833 2.4 583 1.8
2005
67,318 34,509 32,809 878 2.5 620 1.9
2006
70,153 35,848 34,305 945 2.6 665 1.9
2007
72,549 37,273 35,276 907 2.4 574 1.6
2008 74,469 38,211 36,258 740 1.9 542 1.5
TOTAL 350,835 180,004 170,831 4,303 2.4 2,984 1.7
* Proportion of cases of unknown sex varies between 0.1% and 0.2% per annum
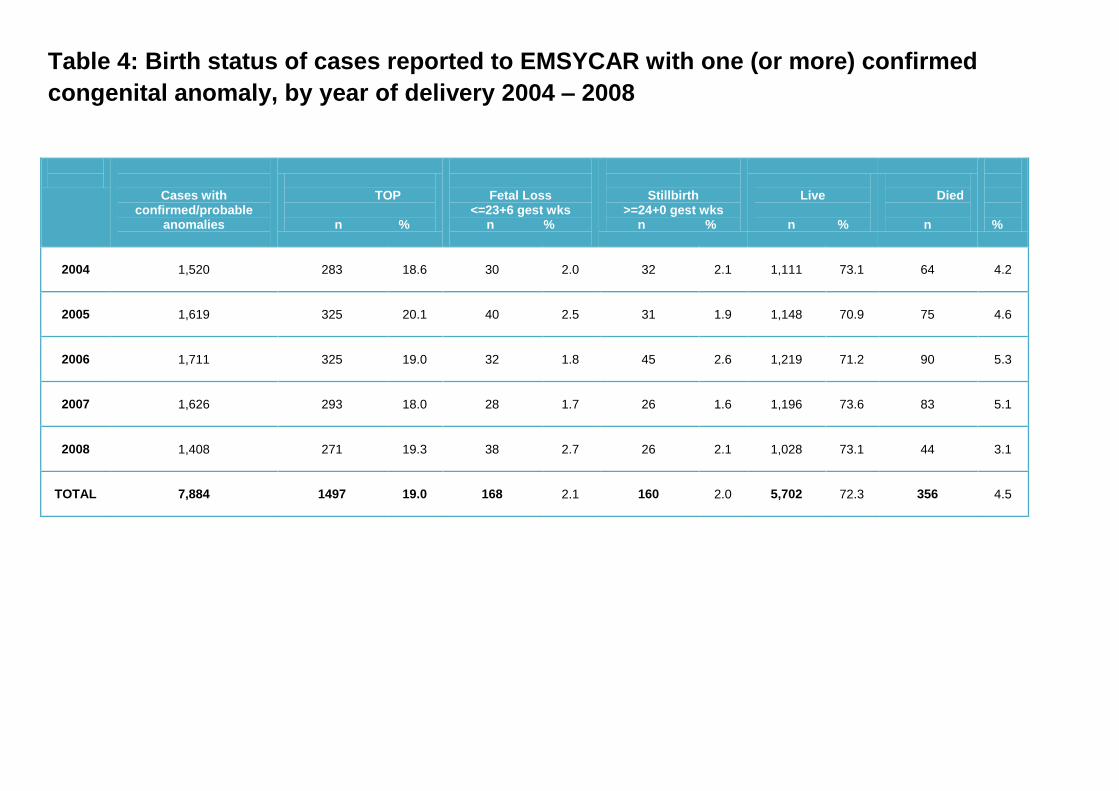
Table 4: Birth status of cases reported to EMSYCAR with one (or more) confirmed
congenital anomaly, by year of delivery 2004 – 2008
Cases with confirmed/probable
anomalies
TOP
n %
Fetal Loss <=23+6 gest wks
n %
Stillbirth >=24+0 gest wks
n %
Live
n %
Died
n
%
2004
1,520 283 18.6 30 2.0 32 2.1 1,111 73.1 64 4.2
2005
1,619 325 20.1 40 2.5 31 1.9 1,148 70.9 75 4.6
2006
1,711 325 19.0 32 1.8 45 2.6 1,219 71.2 90 5.3
2007
1,626
293 18.0 28 1.7 26 1.6 1,196 73.6 83 5.1
2008
1,408
271 19.3 38 2.7 26 2.1 1,028 73.1 44 3.1
TOTAL
7,884 1497 19.0 168 2.1 160 2.0 5,702 72.3 356 4.5
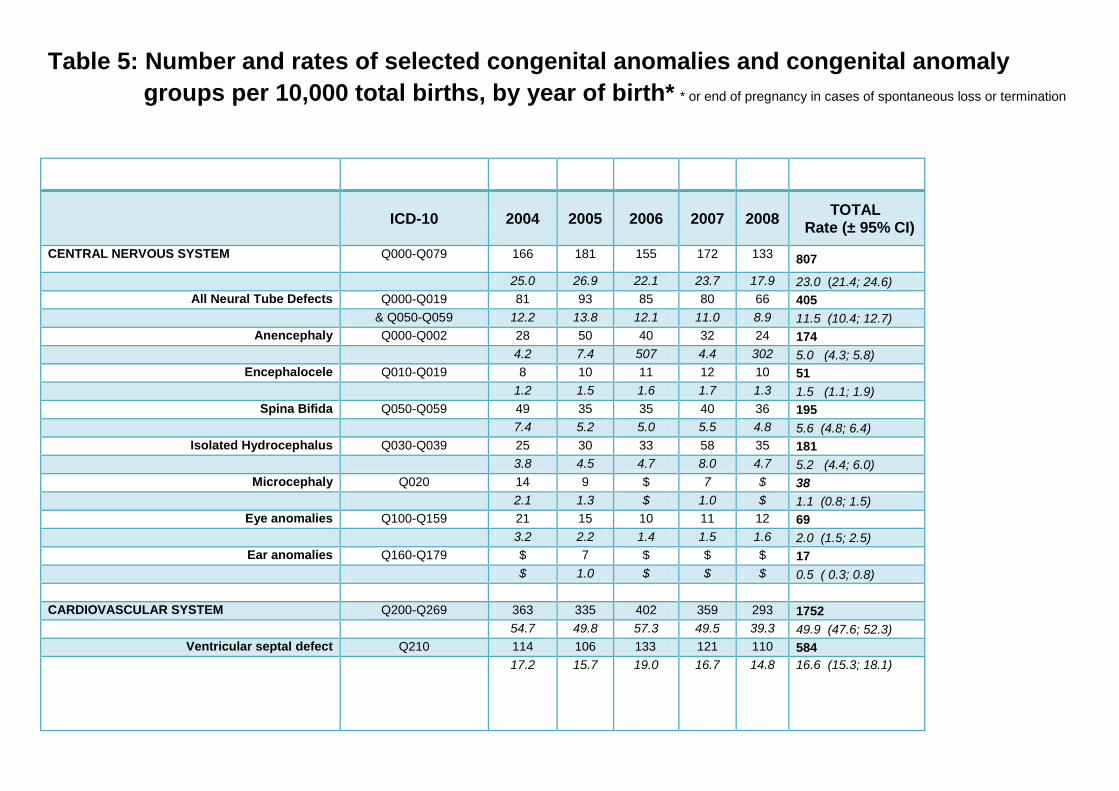
Table 5: Number and rates of selected congenital anomalies and congenital anomaly
groups per 10,000 total births, by year of birth* * or end of pregnancy in cases of spontaneous loss or termination
ICD-10 2004 2005 2006
2007
2008
TOTAL Rate (± 95% CI)
CENTRAL NERVOUS SYSTEM Q000-Q079 166 181 155 172 133 807
25.0 26.9 22.1 23.7 17.9 23.0 (21.4; 24.6)
All Neural Tube Defects Q000-Q019 81 93 85 80 66 405
& Q050-Q059 12.2 13.8 12.1 11.0 8.9 11.5 (10.4; 12.7)
Anencephaly Q000-Q002 28 50 40 32 24 174
4.2 7.4 507 4.4 302 5.0 (4.3; 5.8)
Encephalocele Q010-Q019 8 10 11 12 10 51
1.2 1.5 1.6 1.7 1.3 1.5 (1.1; 1.9)
Spina Bifida Q050-Q059 49 35 35 40 36 195
7.4 5.2 5.0 5.5 4.8 5.6 (4.8; 6.4)
Isolated Hydrocephalus Q030-Q039 25 30 33 58 35 181
3.8 4.5 4.7 8.0 4.7 5.2 (4.4; 6.0)
Microcephaly Q020 14 9 $ 7 $ 38
2.1 1.3 $ 1.0 $ 1.1 (0.8; 1.5)
Eye anomalies Q100-Q159 21 15 10 11 12 69
3.2 2.2 1.4 1.5 1.6 2.0 (1.5; 2.5)
Ear anomalies Q160-Q179 $ 7 $ $ $ 17
$ 1.0 $ $ $ 0.5 ( 0.3; 0.8)
CARDIOVASCULAR SYSTEM Q200-Q269 363 335 402 359 293 1752
54.7 49.8 57.3 49.5 39.3 49.9 (47.6; 52.3)
Ventricular septal defect Q210 114 106 133 121 110 584
17.2 15.7 19.0 16.7 14.8 16.6 (15.3; 18.1)
ICD-10
2004
2005
2006
2007
2008
TOTAL Rate (± 95% CI)
CARDIOVASCULAR SYSTEM (cont’d)
Atrial septal defect Q211 69 49 49 29 21 217
10.4 7.3 7.0 4.0 2.8 6.2 (5.4; 7.1)
Atrio-ventricular septal defect Q212 33 16 20 29 17 115
5.0 2.4 2.9 4.0 2.3 3.3 (2.7; 3.9)
Fallot's Tetralogy Q213 26 24 18 23 28 119
3.9 3.6 2.6 3.2 3.8 3.4 (2.8; 4.1)
Transposition of the great vessels Q203 22 25 21 19 21 108
3.3 3.7 3.0 2.6 2.8 3.1 (2.5; 3.7)
Hypoplastic left heart syndrome Q234 24 26 36 26 13 125
3.6 3.9 5.1 3.6 1.7 3.6 (3.0; 4.2)
Coarctation of the aorta Q251 21 20 26 19 18 104
3.2 3.0 3.7 2.6 2.4 3.0 (2.4; 3.6)
Patent Ductus Arteriosus Q250 29 20 50 56 26 181
4.4 3.0 7.1 7.7 3.5 5.2 (4.4; 6.0)
UROGENITAL SYSTEM Q500-Q649 286 333 343 363 282 1607
43.1 49.5 48.9 50.0 37.9 45.8 (43.6; 48.1)
Renal agenesis and hypoplasia Q600-Q609 21 19 29 41 26 136
3.2 2.8 4.1 5.7 3.5 3.9 (3.3; 4.6)
Bladder/urethral anomalies Q640-Q649 32 29 25 25 35 146
4.8 4.3 3.6 3.4 4.7 4.2 (3.5; 4.9)
Cystic kidneys Q610-Q619 36 41 38 45 58 218
5.4 6.1 5.4 6.2 7.8 6.2 (5.4; 7.1)
Hypospadias and congenital chordee Q540-Q549 124 117 126 132 94 593
18.7 17.4 18.0 18.2 12.6 16.9 (15.6; 18.3)
Hydronephrosis Q620 67 94 89 107 60 417
10.1 14.0 12.7 14.7 8.1 11.9 (10.8; 13.1)
ICD-10
2004
2005
2006
2007
2008
TOTAL Rate (± 95% CI)
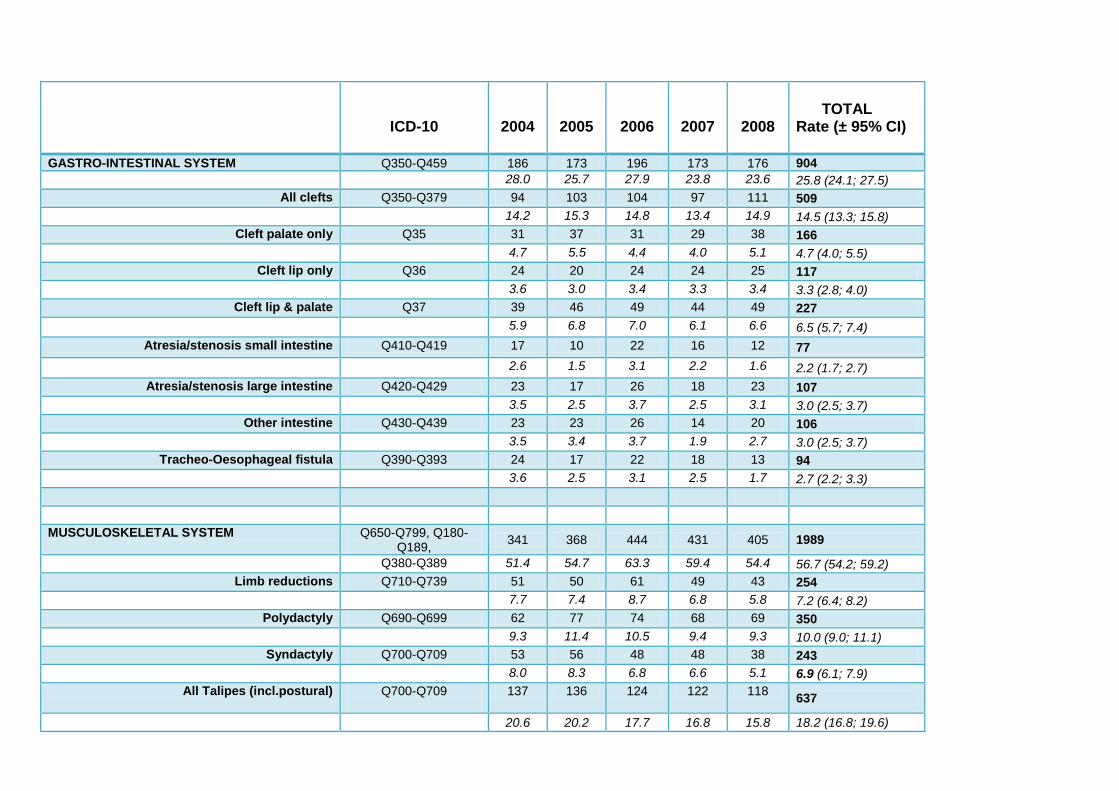
GASTRO-INTESTINAL SYSTEM Q350-Q459 186 173 196 173 176 904
28.0 25.7 27.9 23.8 23.6 25.8 (24.1; 27.5)
All clefts Q350-Q379 94 103 104 97 111 509
14.2 15.3 14.8 13.4 14.9 14.5 (13.3; 15.8)
Cleft palate only Q35 31 37 31 29 38 166
4.7 5.5 4.4 4.0 5.1 4.7 (4.0; 5.5)
Cleft lip only Q36 24 20 24 24 25 117
3.6 3.0 3.4 3.3 3.4 3.3 (2.8; 4.0)
Cleft lip & palate Q37 39 46 49 44 49 227
5.9 6.8 7.0 6.1 6.6 6.5 (5.7; 7.4)
Atresia/stenosis small intestine Q410-Q419 17 10 22 16 12 77
2.6 1.5 3.1 2.2 1.6 2.2 (1.7; 2.7)
Atresia/stenosis large intestine Q420-Q429 23 17 26 18 23 107
3.5 2.5 3.7 2.5 3.1 3.0 (2.5; 3.7)
Other intestine Q430-Q439 23 23 26 14 20 106
3.5 3.4 3.7 1.9 2.7 3.0 (2.5; 3.7)
Tracheo-Oesophageal fistula Q390-Q393 24 17 22 18 13 94
3.6 2.5 3.1 2.5 1.7 2.7 (2.2; 3.3)
MUSCULOSKELETAL SYSTEM Q650-Q799, Q180-Q189,
341 368 444 431 405 1989
Q380-Q389 51.4 54.7 63.3 59.4 54.4 56.7 (54.2; 59.2)
Limb reductions Q710-Q739 51 50 61 49 43 254
7.7 7.4 8.7 6.8 5.8 7.2 (6.4; 8.2)
Polydactyly Q690-Q699 62 77 74 68 69 350
9.3 11.4 10.5 9.4 9.3 10.0 (9.0; 11.1)
Syndactyly Q700-Q709 53 56 48 48 38 243
8.0 8.3 6.8 6.6 5.1 6.9 (6.1; 7.9)
All Talipes (incl.postural) Q700-Q709
137 136 124 122 118 637
20.6 20.2 17.7 16.8 15.8 18.2 (16.8; 19.6)
ICD-10 2004 2005 2006 2007
2008
TOTAL Rate (± 95% CI)
MUSCOLOSKELETAL SYSTEM CONT’D
Congenital dislocated hips Q650-Q652 $ $ $ 8 $ 27
$ $ $ 1.1 $ 0.8 (0.5; 1.1)
Congenital Diaphragmatic Hernia Q790 27 25 24 19 19 114
4.1 3.7 3.4 2.6 2.6 3.2 (2.7; 3.9)
Gastroschisis Q793 38 33 43 35 39 188
5.7 4.9 6.1 4.8 5.2 5.4 (4.6; 6.2)
Exomphalos Q792 24 25 30 34 32 145
3.6 3.7 4.3 4.7 4.3 4.1 (3.5; 4.0)
RESPIRATORY SYSTEM Q300-Q349 26 27 31 35 27 146
3.9 4.0 4.4 4.8 3.6 4.2 (3.5; 4.9)
CHROMOSOMAL ANOMALIES Q900-Q999 266 287 253 217 228 1251
40.1 42.6 36.1 29.9 30.6 35.7 (33.7; 37.7)
Trisomy 21* Q900-Q909 149 155 131 114 119 668
22.5 23.0 18.7 15.7 16.0 19.0 (17.6; 20.5)
Trisomy 18* Q910-Q913 30 34 38 27 39 168
4.5 5.1 5.4 3.7 5.2 4.8 (4.1; 5.6)
Trisomy 13* Q914-Q917 8 13 19 19 15 74
1.2 1.9 2.7 2.6 2.0 2.1 (1.7; 2.6)
Turner's Syndrome* Q960-Q969 22 22 17 12 25 98
3.3 3.3 2.4 1.7 3.4 2.8 (2.3; 3.4)
All other chromosomes (excluding * above) Q920-Q959 59 64 48 46 30 247
&Q970-Q999 8.9 9.5 6.8 6.3 4.0 7.0 (6.2; 8.0)
SYNDROMES AFFECTING MULTIPLE SYSTEMS
Q870-Q879 23 25 29 27 13 117
3.5 3.7 4.1 3.7 1.7
3.3 (2.8; 4.0)
ICD-10
2004
2005
2006
2007
2008
TOTAL Rate (± 95% CI)
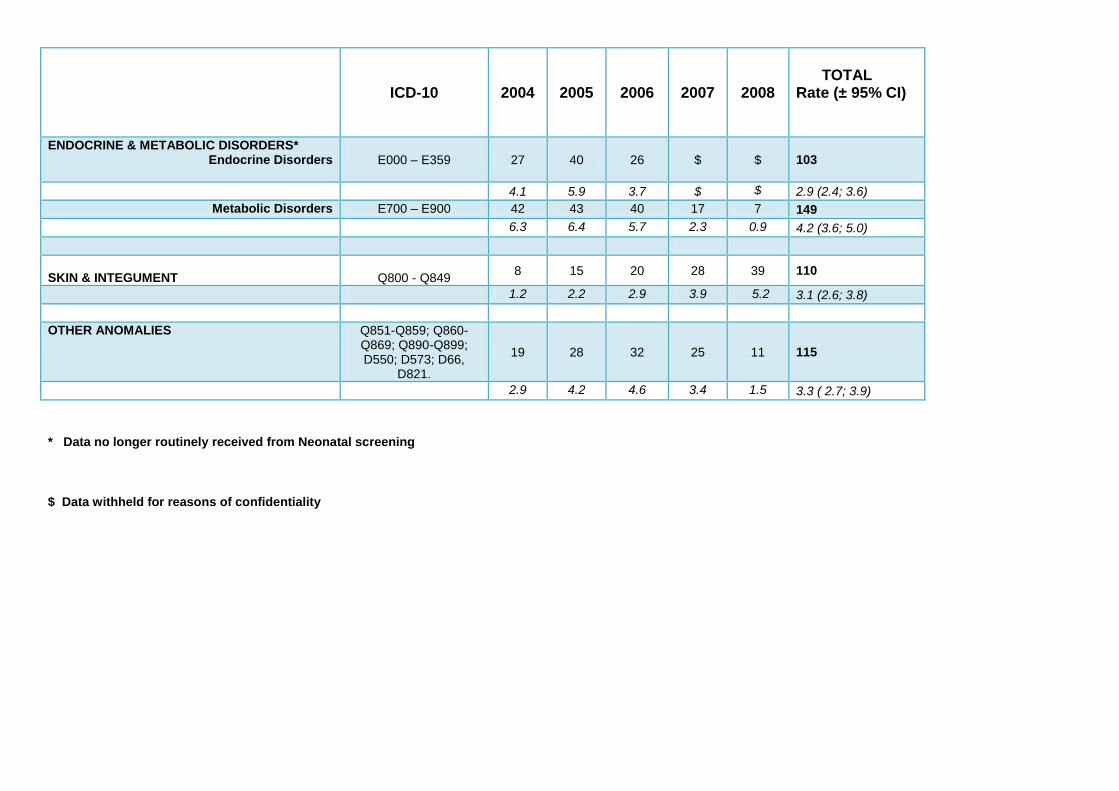
ENDOCRINE & METABOLIC DISORDERS* Endocrine Disorders
E000 – E359 27 40 26 $
$ 103
4.1 5.9 3.7 $ $ 2.9 (2.4; 3.6)
Metabolic Disorders E700 – E900 42 43 40 17 7 149
6.3 6.4 5.7 2.3 0.9 4.2 (3.6; 5.0)
SKIN & INTEGUMENT
Q800 - Q849
8 15 20 28 39 110
1.2 2.2 2.9 3.9 5.2 3.1 (2.6; 3.8)
OTHER ANOMALIES Q851-Q859; Q860-Q869; Q890-Q899; D550; D573; D66,
D821.
19 28 32 25 11 115
2.9 4.2 4.6 3.4 1.5 3.3 ( 2.7; 3.9)
* Data no longer routinely received from Neonatal screening
$ Data withheld for reasons of confidentiality
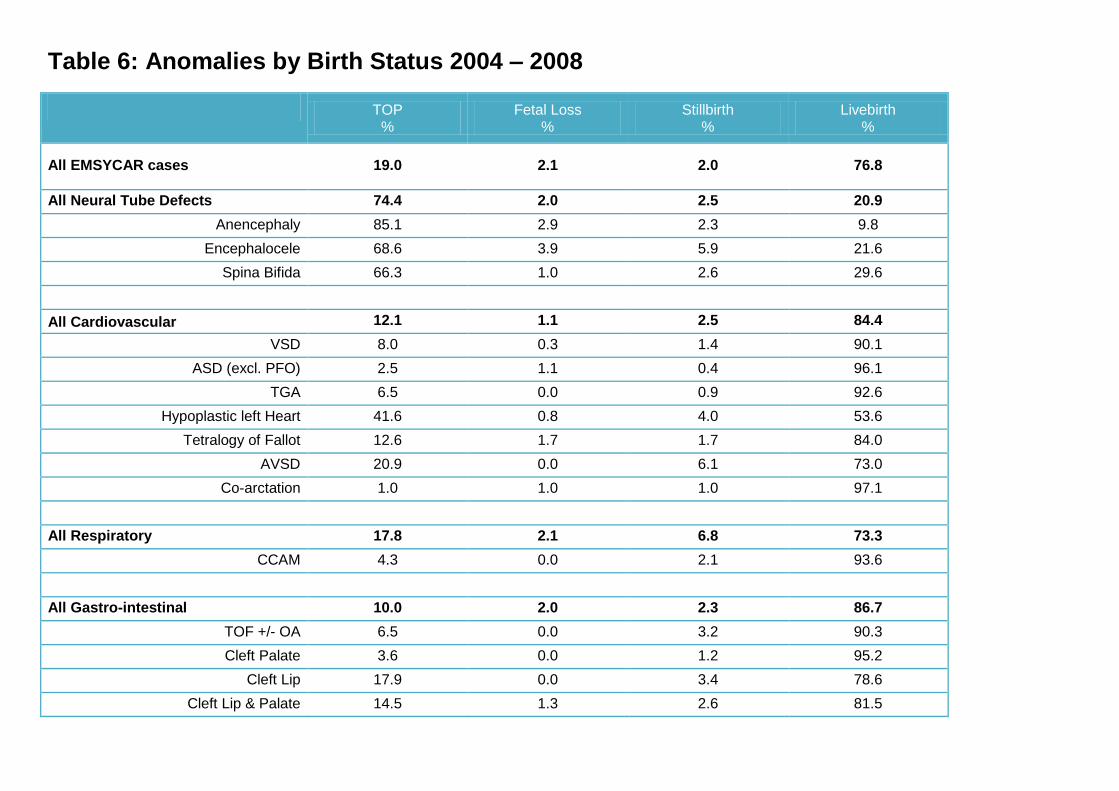
Table 6: Anomalies by Birth Status 2004 – 2008
TOP %
Fetal Loss %
Stillbirth %
Livebirth %
All EMSYCAR cases 19.0 2.1 2.0 76.8
All Neural Tube Defects 74.4 2.0 2.5 20.9
Anencephaly 85.1 2.9 2.3 9.8
Encephalocele 68.6 3.9 5.9 21.6
Spina Bifida 66.3 1.0 2.6 29.6
All Cardiovascular 12.1 1.1 2.5 84.4
VSD 8.0 0.3 1.4 90.1
ASD (excl. PFO) 2.5 1.1 0.4 96.1
TGA 6.5 0.0 0.9 92.6
Hypoplastic left Heart 41.6 0.8 4.0 53.6
Tetralogy of Fallot 12.6 1.7 1.7 84.0
AVSD 20.9 0.0 6.1 73.0
Co-arctation 1.0 1.0 1.0 97.1
All Respiratory 17.8 2.1 6.8 73.3
CCAM 4.3 0.0 2.1 93.6
All Gastro-intestinal 10.0 2.0 2.3 86.7
TOF +/- OA 6.5 0.0 3.2 90.3
Cleft Palate 3.6 0.0 1.2 95.2
Cleft Lip 17.9 0.0 3.4 78.6
Cleft Lip & Palate 14.5 1.3 2.6 81.5
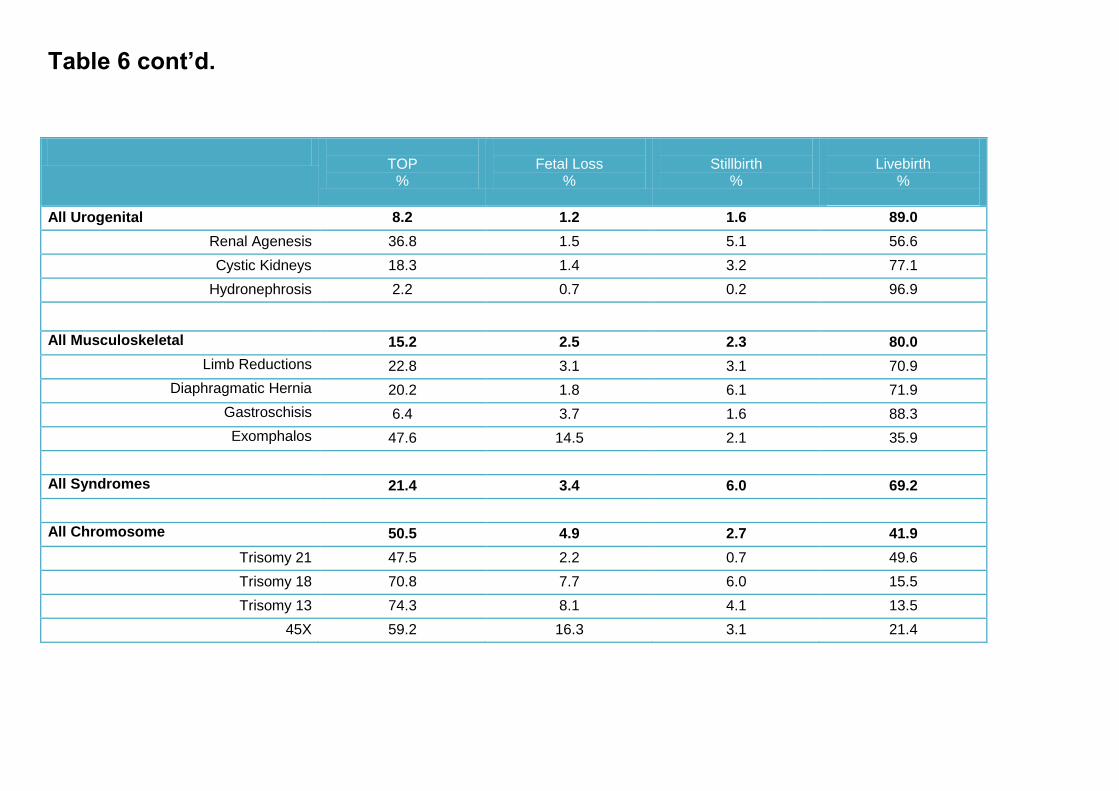
Table 6 cont’d.
TOP
%
Fetal Loss
%
Stillbirth
%
Livebirth
%
All Urogenital 8.2 1.2 1.6 89.0
Renal Agenesis 36.8 1.5 5.1 56.6
Cystic Kidneys 18.3 1.4 3.2 77.1
Hydronephrosis 2.2 0.7 0.2 96.9
All Musculoskeletal 15.2 2.5 2.3 80.0
Limb Reductions 22.8 3.1 3.1 70.9
Diaphragmatic Hernia 20.2 1.8 6.1 71.9
Gastroschisis 6.4 3.7 1.6 88.3
Exomphalos 47.6 14.5 2.1 35.9
All Syndromes 21.4 3.4 6.0 69.2
All Chromosome 50.5 4.9 2.7 41.9
Trisomy 21 47.5 2.2 0.7 49.6
Trisomy 18 70.8 7.7 6.0 15.5
Trisomy 13 74.3 8.1 4.1 13.5
45X 59.2 16.3 3.1 21.4
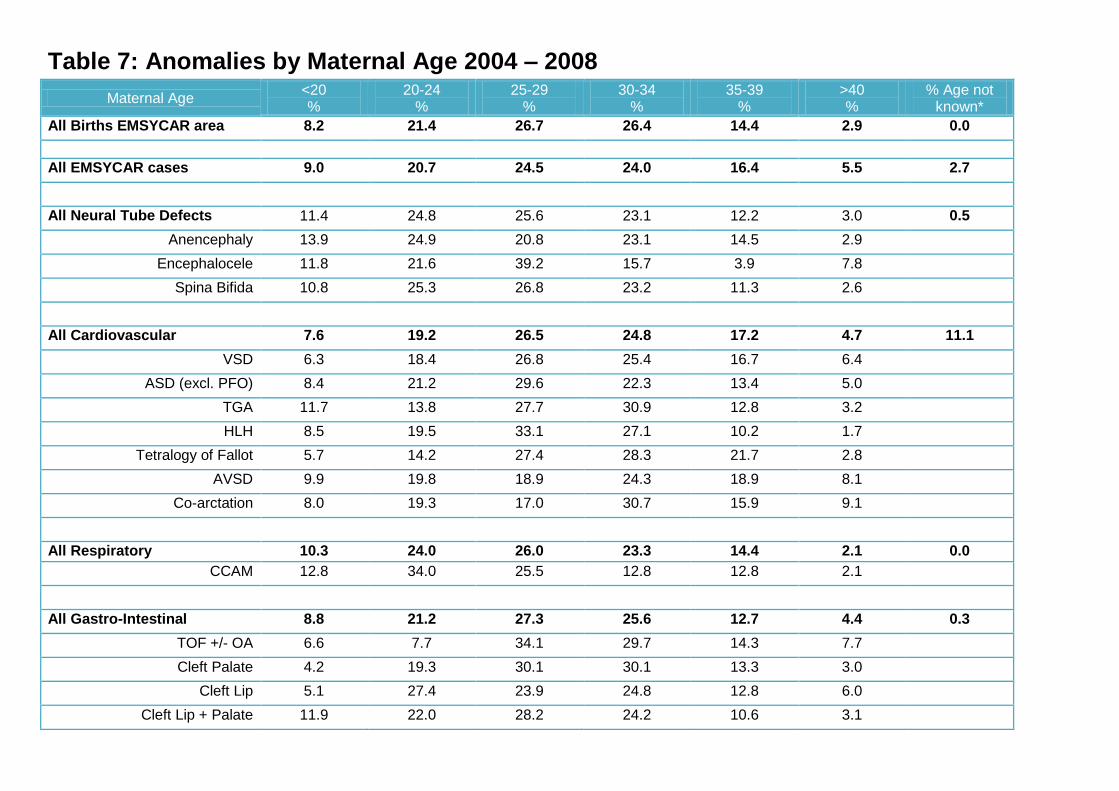
Table 7: Anomalies by Maternal Age 2004 – 2008
Maternal Age <20 %
20-24 %
25-29 %
30-34 %
35-39 %
>40 %
% Age not known*
All Births EMSYCAR area 8.2 21.4 26.7 26.4 14.4 2.9 0.0
All EMSYCAR cases 9.0 20.7 24.5 24.0 16.4 5.5 2.7
All Neural Tube Defects 11.4 24.8 25.6 23.1 12.2 3.0 0.5
Anencephaly 13.9 24.9 20.8 23.1 14.5 2.9
Encephalocele 11.8 21.6 39.2 15.7 3.9 7.8
Spina Bifida 10.8 25.3 26.8 23.2 11.3 2.6
All Cardiovascular 7.6 19.2 26.5 24.8 17.2 4.7 11.1
VSD 6.3 18.4 26.8 25.4 16.7 6.4
ASD (excl. PFO) 8.4 21.2 29.6 22.3 13.4 5.0
TGA 11.7 13.8 27.7 30.9 12.8 3.2
HLH 8.5 19.5 33.1 27.1 10.2 1.7
Tetralogy of Fallot 5.7 14.2 27.4 28.3 21.7 2.8
AVSD 9.9 19.8 18.9 24.3 18.9 8.1
Co-arctation 8.0 19.3 17.0 30.7 15.9 9.1
All Respiratory 10.3 24.0 26.0 23.3 14.4 2.1 0.0
CCAM 12.8 34.0 25.5 12.8 12.8 2.1
All Gastro-Intestinal 8.8 21.2 27.3 25.6 12.7 4.4 0.3
TOF +/- OA 6.6 7.7 34.1 29.7 14.3 7.7
Cleft Palate 4.2 19.3 30.1 30.1 13.3 3.0
Cleft Lip 5.1 27.4 23.9 24.8 12.8 6.0
Cleft Lip + Palate 11.9 22.0 28.2 24.2 10.6 3.1
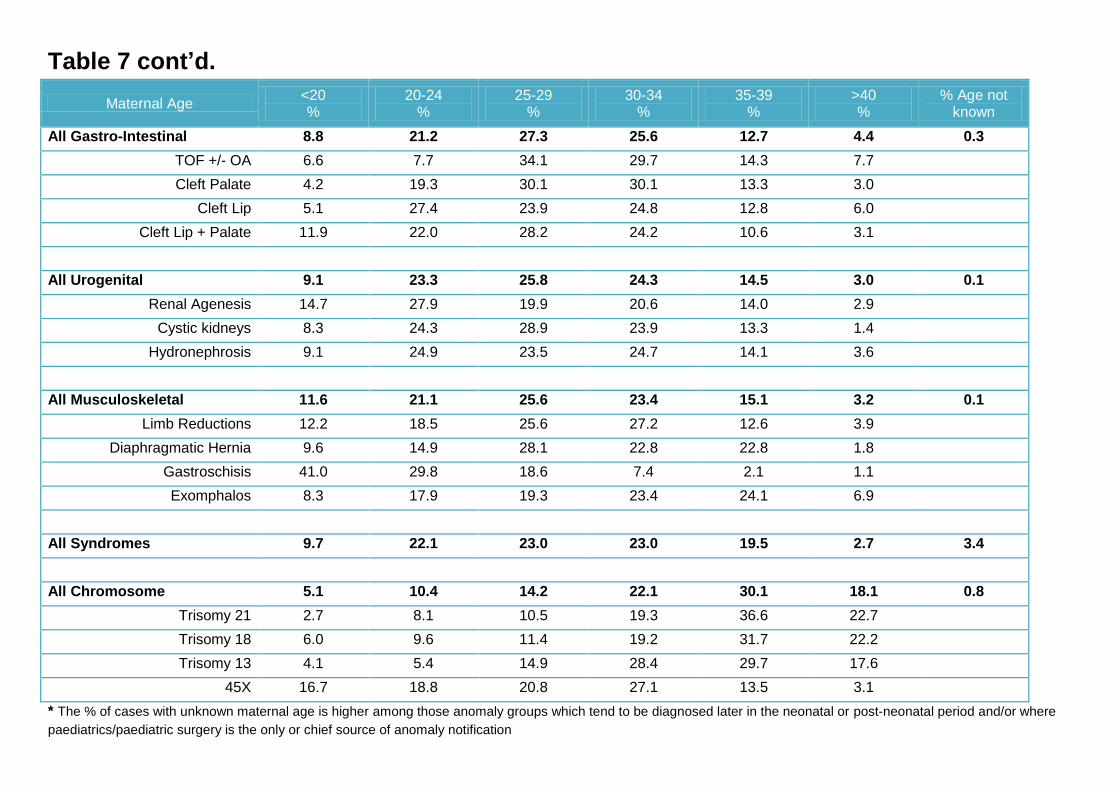
Table 7 cont’d.
Maternal Age <20 %
20-24 %
25-29 %
30-34 %
35-39 %
>40 %
% Age not known
All Gastro-Intestinal 8.8 21.2 27.3 25.6 12.7 4.4 0.3
TOF +/- OA 6.6 7.7 34.1 29.7 14.3 7.7
Cleft Palate 4.2 19.3 30.1 30.1 13.3 3.0
Cleft Lip 5.1 27.4 23.9 24.8 12.8 6.0
Cleft Lip + Palate 11.9 22.0 28.2 24.2 10.6 3.1
All Urogenital 9.1 23.3 25.8 24.3 14.5 3.0 0.1
Renal Agenesis 14.7 27.9 19.9 20.6 14.0 2.9
Cystic kidneys 8.3 24.3 28.9 23.9 13.3 1.4
Hydronephrosis 9.1 24.9 23.5 24.7 14.1 3.6
All Musculoskeletal 11.6 21.1 25.6 23.4 15.1 3.2 0.1
Limb Reductions 12.2 18.5 25.6 27.2 12.6 3.9
Diaphragmatic Hernia 9.6 14.9 28.1 22.8 22.8 1.8
Gastroschisis 41.0 29.8 18.6 7.4 2.1 1.1
Exomphalos 8.3 17.9 19.3 23.4 24.1 6.9
All Syndromes 9.7 22.1 23.0 23.0 19.5 2.7 3.4
All Chromosome 5.1 10.4 14.2 22.1 30.1 18.1 0.8
Trisomy 21 2.7 8.1 10.5 19.3 36.6 22.7
Trisomy 18 6.0 9.6 11.4 19.2 31.7 22.2
Trisomy 13 4.1 5.4 14.9 28.4 29.7 17.6
45X 16.7 18.8 20.8 27.1 13.5 3.1
* The % of cases with unknown maternal age is higher among those anomaly groups which tend to be diagnosed later in the neonatal or post-neonatal period and/or where
paediatrics/paediatric surgery is the only or chief source of anomaly notification
0.0
2.0
4.0
6.0
8.0
10.0
12.0
14.0
16.0
2004-5 2005-6 2006-7 2007-8
Rat
es
pe
r 1
0,0
00
bir
ths
Fig. 1: Trends in selected Neural Tube Defects 2004 - 2008
All Neural Tube Defects
Anencephaly
Encephalocele
Spina Bifida
0.0
2.0
4.0
6.0
8.0
10.0
12.0
14.0
16.0
18.0
20.0
2004-5 2005-6 2006-7 2007-8
Rat
es
pe
r 1
0,0
00
bir
ths
Fig. 2: Trends in selected Cardiac Anomalies 2004 - 2008
Ventricular septal defect
Transposition of the great vessels
Hypoplastic left heart syndrome
Atrial septal defect
0.0
2.0
4.0
6.0
8.0
10.0
12.0
14.0
16.0
2004-5 2005-6 2006-7 2007-8
Rat
es
pe
r 1
0,0
00
bir
ths
Fig. 3: Trends in Cleft Anomalies 2004 - 2008
All clefts
Cleft palate only
Cleft lip only
Cleft lip & palate
0.0
2.0
4.0
6.0
8.0
10.0
12.0
14.0
16.0
2004-5 2005-6 2006-7 2007-8
Rat
es
pe
r 1
0,0
00
bir
ths
Fig. 4: Trends in selected Urogenital Anomalies 2004 - 2008
Renal agenesis and hypoplasia
Cystic kidneys
Hydronephrosis
Bladder/urethral
0.0
1.0
2.0
3.0
4.0
5.0
6.0
7.0
8.0
9.0
2004-5 2005-6 2006-7 2007-8
Rat
es
pe
r 1
0,0
00
bir
ths
Fig. 5: Trends in selected Musculoskeletal Anomalies 2004 - 2008
Limb reductions
Congenital Diaphragmatic Hernia
Gastroschisis
Exomphalos
0.0
5.0
10.0
15.0
20.0
25.0
2004-5 2005-6 2006-7 2007-8
Rat
es
pe
r 1
0,0
00
bir
ths
Fig. 6: Trends in selected Chromosome Anomalies 2004 - 2008
Trisomy 21
Trisomy 18
Trisomy 13
Turner's Syndrome
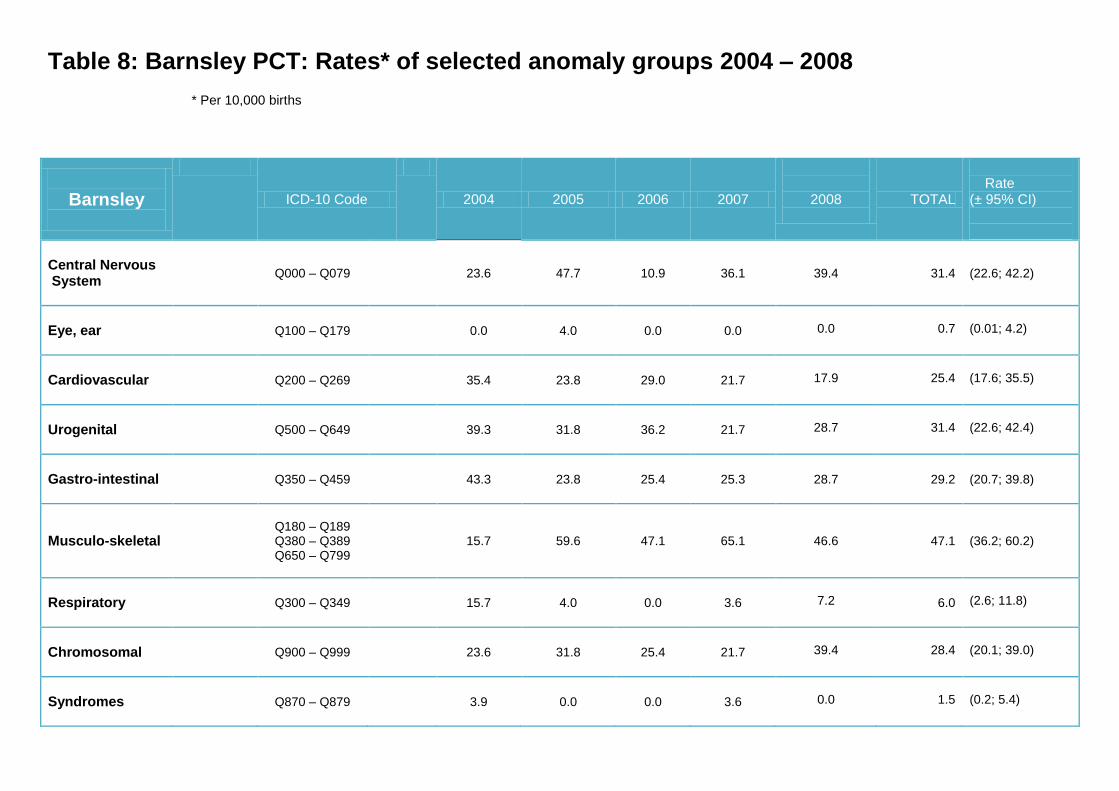
Table 8: Barnsley PCT: Rates* of selected anomaly groups 2004 – 2008
* Per 10,000 births
Barnsley
ICD-10 Code
2004 2005 2006 2007
2008
TOTAL
Rate (± 95% CI)
Central Nervous System
Q000 – Q079
23.6 47.7 10.9 36.1 39.4 31.4 (22.6; 42.2)
Eye, ear
Q100 – Q179
0.0 4.0 0.0 0.0
0.0
0.7
(0.01; 4.2)
Cardiovascular
Q200 – Q269
35.4 23.8 29.0 21.7
17.9
25.4
(17.6; 35.5)
Urogenital
Q500 – Q649
39.3 31.8 36.2 21.7
28.7
31.4
(22.6; 42.4)
Gastro-intestinal
Q350 – Q459
43.3 23.8 25.4 25.3 28.7 29.2 (20.7; 39.8)
Musculo-skeletal
Q180 – Q189 Q380 – Q389 Q650 – Q799
15.7 59.6 47.1 65.1
46.6
47.1
(36.2; 60.2)
Respiratory
Q300 – Q349
15.7 4.0 0.0 3.6
7.2
6.0
(2.6; 11.8)
Chromosomal
Q900 – Q999
23.6 31.8 25.4 21.7
39.4
28.4
(20.1; 39.0)
Syndromes
Q870 – Q879
3.9 0.0 0.0 3.6
0.0
1.5
(0.2; 5.4)
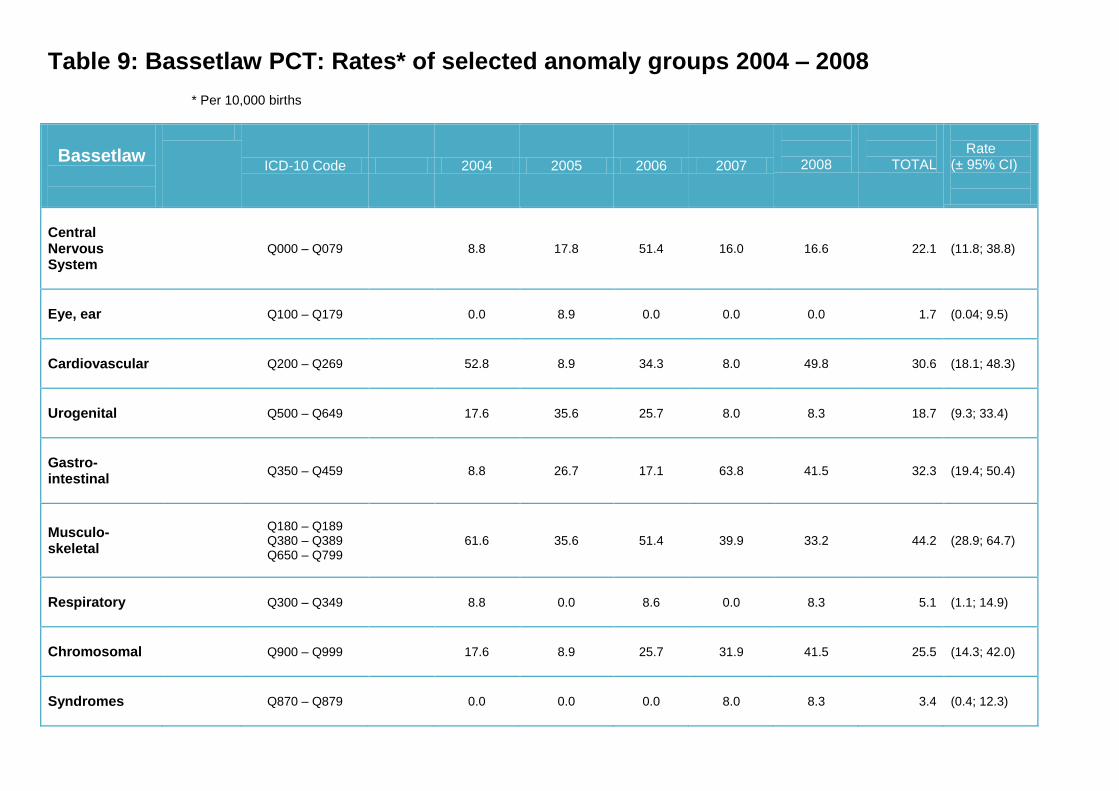
Table 9: Bassetlaw PCT: Rates* of selected anomaly groups 2004 – 2008
* Per 10,000 births
Bassetlaw
ICD-10 Code 2004 2005 2006 2007
2008
TOTAL
Rate (± 95% CI)
Central Nervous System
Q000 – Q079 8.8 17.8 51.4 16.0 16.6 22.1 (11.8; 38.8)
Eye, ear
Q100 – Q179 0.0 8.9 0.0 0.0 0.0 1.7 (0.04; 9.5)
Cardiovascular
Q200 – Q269 52.8 8.9 34.3 8.0 49.8 30.6 (18.1; 48.3)
Urogenital
Q500 – Q649 17.6 35.6 25.7 8.0 8.3 18.7 (9.3; 33.4)
Gastro-intestinal
Q350 – Q459 8.8 26.7 17.1 63.8 41.5 32.3 (19.4; 50.4)
Musculo-skeletal
Q180 – Q189 Q380 – Q389 Q650 – Q799
61.6 35.6 51.4 39.9 33.2 44.2 (28.9; 64.7)
Respiratory
Q300 – Q349 8.8 0.0 8.6 0.0 8.3 5.1 (1.1; 14.9)
Chromosomal
Q900 – Q999 17.6 8.9 25.7 31.9 41.5 25.5 (14.3; 42.0)
Syndromes
Q870 – Q879 0.0 0.0 0.0 8.0 8.3 3.4 (0.4; 12.3)
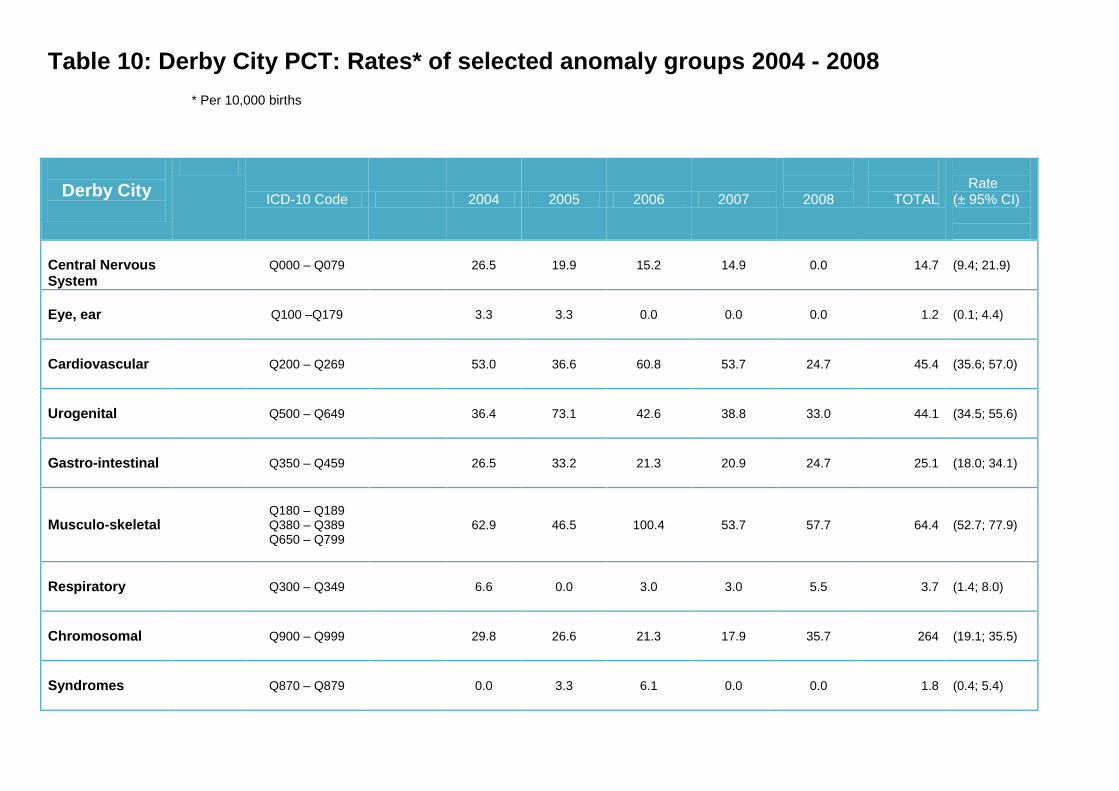
Table 10: Derby City PCT: Rates* of selected anomaly groups 2004 - 2008
* Per 10,000 births
Derby City
ICD-10 Code 2004 2005 2006 2007
2008
TOTAL
Rate (± 95% CI)
Central Nervous System
Q000 – Q079 26.5 19.9 15.2 14.9 0.0 14.7 (9.4; 21.9)
Eye, ear
Q100 –Q179 3.3 3.3 0.0 0.0 0.0
1.2
(0.1; 4.4)
Cardiovascular
Q200 – Q269 53.0 36.6 60.8 53.7 24.7 45.4 (35.6; 57.0)
Urogenital
Q500 – Q649 36.4 73.1 42.6 38.8 33.0
44.1
(34.5; 55.6)
Gastro-intestinal
Q350 – Q459 26.5 33.2 21.3 20.9 24.7 25.1 (18.0; 34.1)
Musculo-skeletal
Q180 – Q189 Q380 – Q389 Q650 – Q799
62.9 46.5 100.4 53.7 57.7 64.4 (52.7; 77.9)
Respiratory
Q300 – Q349 6.6 0.0 3.0 3.0 5.5 3.7 (1.4; 8.0)
Chromosomal
Q900 – Q999 29.8 26.6 21.3 17.9 35.7 264 (19.1; 35.5)
Syndromes
Q870 – Q879 0.0 3.3 6.1 0.0 0.0 1.8 (0.4; 5.4)
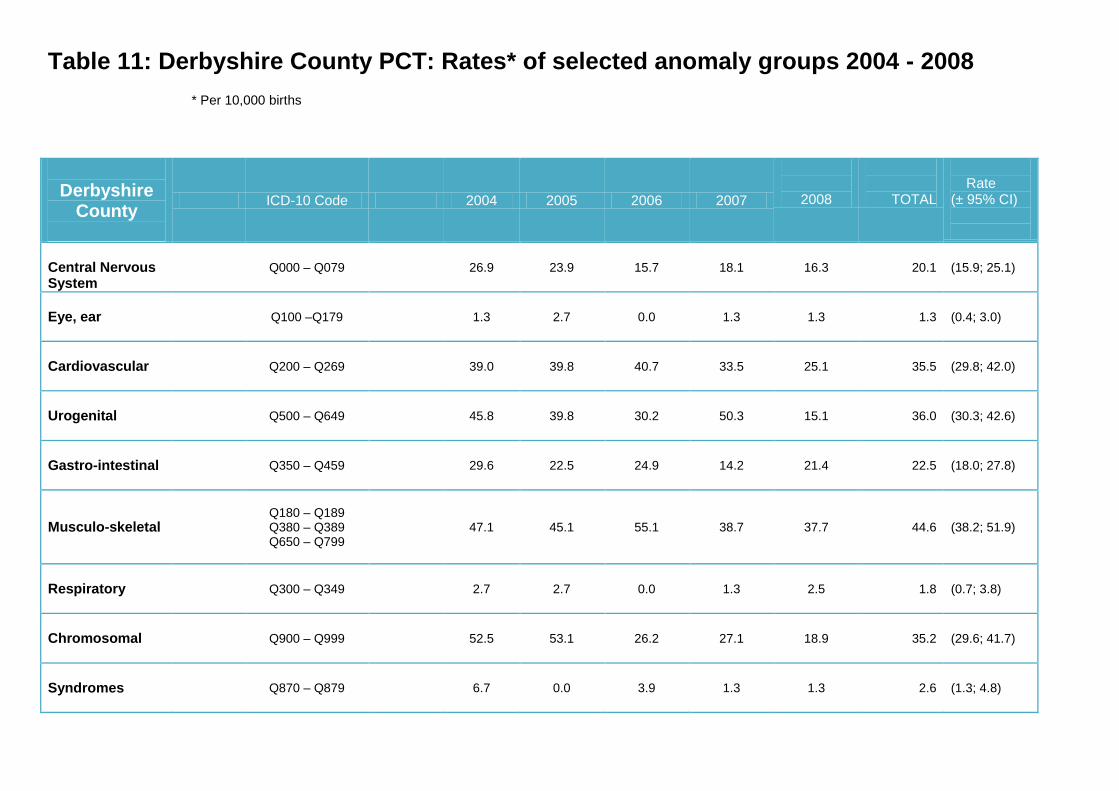
Table 11: Derbyshire County PCT: Rates* of selected anomaly groups 2004 - 2008
* Per 10,000 births
Derbyshire
County
ICD-10 Code 2004 2005 2006 2007
2008
TOTAL
Rate (± 95% CI)
Central Nervous System
Q000 – Q079 26.9 23.9 15.7 18.1 16.3 20.1 (15.9; 25.1)
Eye, ear
Q100 –Q179 1.3 2.7 0.0 1.3 1.3 1.3 (0.4; 3.0)
Cardiovascular
Q200 – Q269 39.0 39.8 40.7 33.5 25.1 35.5 (29.8; 42.0)
Urogenital
Q500 – Q649 45.8 39.8 30.2 50.3 15.1 36.0 (30.3; 42.6)
Gastro-intestinal
Q350 – Q459 29.6 22.5 24.9 14.2 21.4 22.5 (18.0; 27.8)
Musculo-skeletal
Q180 – Q189 Q380 – Q389 Q650 – Q799
47.1 45.1 55.1 38.7 37.7 44.6 (38.2; 51.9)
Respiratory
Q300 – Q349 2.7 2.7 0.0 1.3 2.5 1.8 (0.7; 3.8)
Chromosomal
Q900 – Q999 52.5 53.1 26.2 27.1 18.9 35.2 (29.6; 41.7)
Syndromes
Q870 – Q879 6.7 0.0 3.9 1.3
1.3
2.6 (1.3; 4.8)
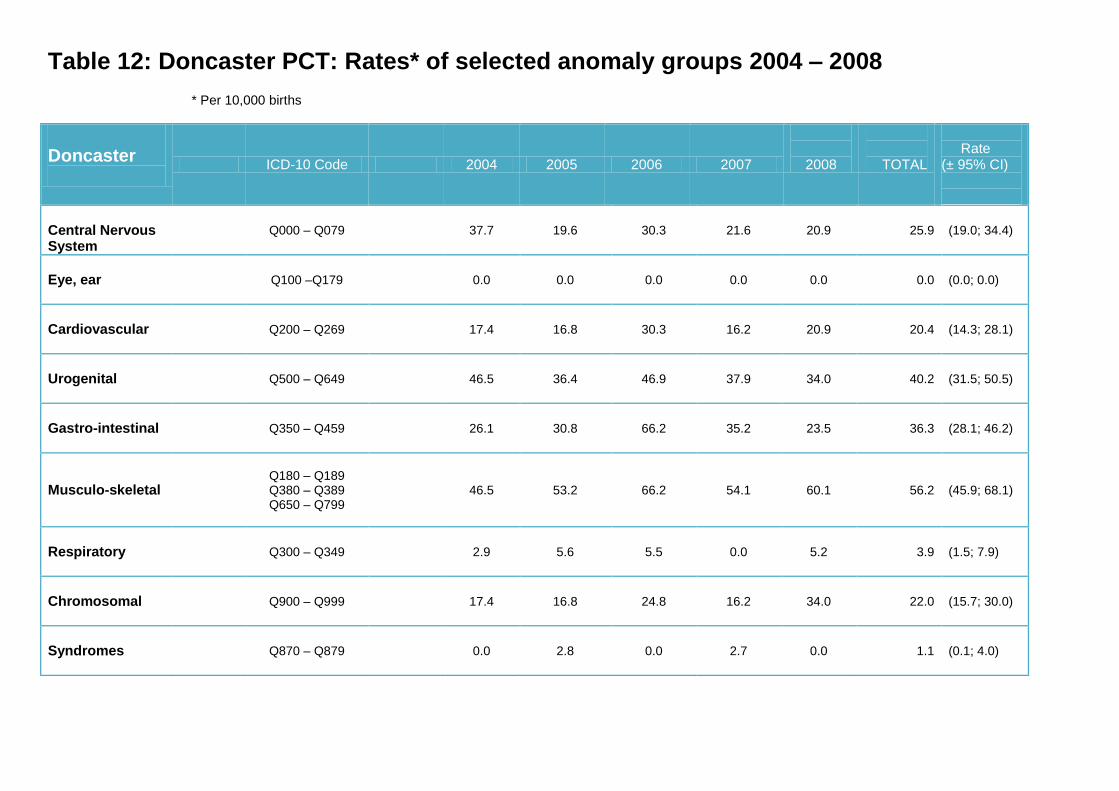
Table 12: Doncaster PCT: Rates* of selected anomaly groups 2004 – 2008
* Per 10,000 births
Doncaster
ICD-10 Code 2004 2005 2006 2007
2008
TOTAL
Rate (± 95% CI)
Central Nervous System
Q000 – Q079 37.7 19.6 30.3 21.6 20.9 25.9 (19.0; 34.4)
Eye, ear
Q100 –Q179 0.0 0.0 0.0 0.0 0.0 0.0 (0.0; 0.0)
Cardiovascular
Q200 – Q269 17.4 16.8 30.3 16.2 20.9 20.4 (14.3; 28.1)
Urogenital
Q500 – Q649 46.5 36.4 46.9 37.9 34.0 40.2 (31.5; 50.5)
Gastro-intestinal
Q350 – Q459 26.1 30.8 66.2 35.2 23.5 36.3 (28.1; 46.2)
Musculo-skeletal
Q180 – Q189 Q380 – Q389 Q650 – Q799
46.5 53.2 66.2 54.1
60.1
56.2 (45.9; 68.1)
Respiratory
Q300 – Q349 2.9 5.6 5.5 0.0 5.2
3.9
(1.5; 7.9)
Chromosomal
Q900 – Q999 17.4 16.8 24.8 16.2 34.0 22.0 (15.7; 30.0)
Syndromes
Q870 – Q879 0.0 2.8 0.0 2.7 0.0 1.1 (0.1; 4.0)
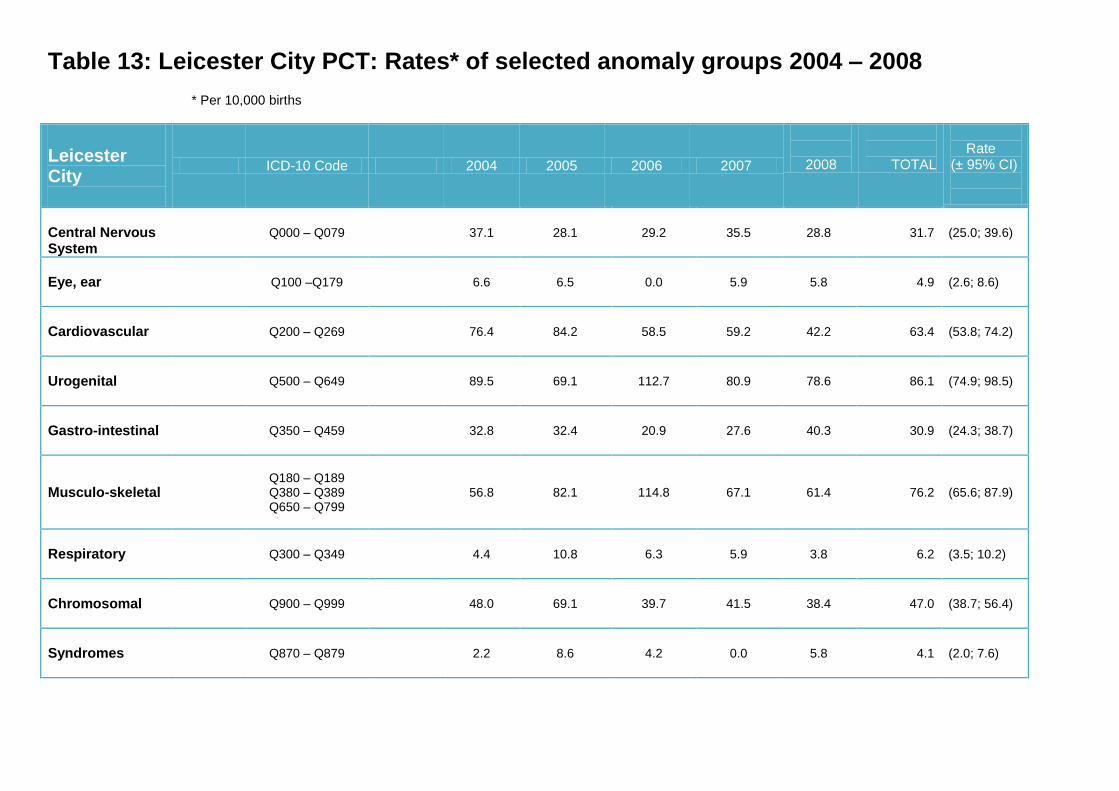
Table 13: Leicester City PCT: Rates* of selected anomaly groups 2004 – 2008
* Per 10,000 births
Leicester City
ICD-10 Code 2004 2005 2006 2007
2008
TOTAL
Rate (± 95% CI)
Central Nervous System
Q000 – Q079 37.1 28.1 29.2 35.5 28.8 31.7 (25.0; 39.6)
Eye, ear
Q100 –Q179 6.6 6.5 0.0 5.9 5.8 4.9 (2.6; 8.6)
Cardiovascular
Q200 – Q269 76.4 84.2 58.5 59.2 42.2
63.4
(53.8; 74.2)
Urogenital
Q500 – Q649 89.5 69.1 112.7 80.9 78.6 86.1 (74.9; 98.5)
Gastro-intestinal
Q350 – Q459 32.8 32.4 20.9 27.6 40.3 30.9 (24.3; 38.7)
Musculo-skeletal
Q180 – Q189 Q380 – Q389 Q650 – Q799
56.8 82.1 114.8 67.1 61.4 76.2 (65.6; 87.9)
Respiratory
Q300 – Q349 4.4 10.8 6.3 5.9 3.8 6.2 (3.5; 10.2)
Chromosomal
Q900 – Q999 48.0 69.1 39.7 41.5 38.4 47.0 (38.7; 56.4)
Syndromes
Q870 – Q879 2.2 8.6 4.2 0.0 5.8 4.1 (2.0; 7.6)
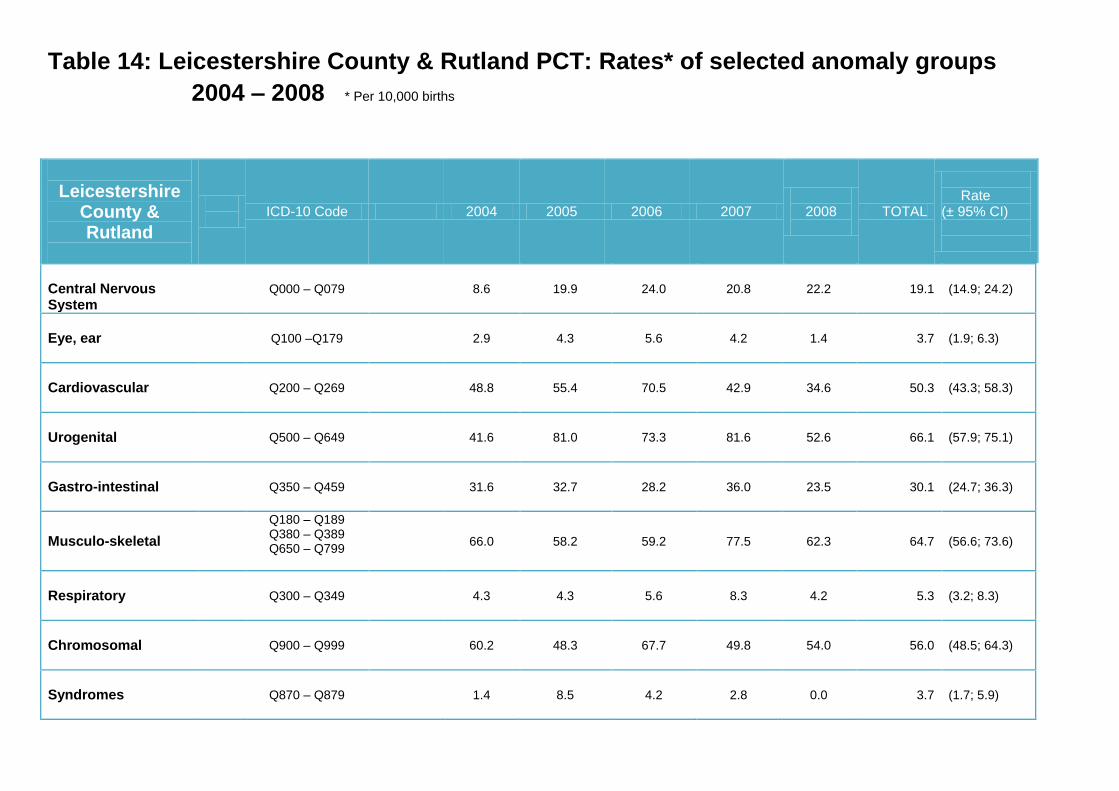
Table 14: Leicestershire County & Rutland PCT: Rates* of selected anomaly groups
2004 – 2008 * Per 10,000 births
Leicestershire
County & Rutland
ICD-10 Code 2004 2005 2006 2007
2008
TOTAL
Rate (± 95% CI)
Central Nervous System
Q000 – Q079 8.6 19.9 24.0 20.8 22.2 19.1 (14.9; 24.2)
Eye, ear
Q100 –Q179 2.9 4.3 5.6 4.2 1.4 3.7 (1.9; 6.3)
Cardiovascular
Q200 – Q269 48.8 55.4 70.5 42.9 34.6 50.3 (43.3; 58.3)
Urogenital
Q500 – Q649 41.6 81.0 73.3 81.6 52.6 66.1 (57.9; 75.1)
Gastro-intestinal
Q350 – Q459 31.6 32.7 28.2 36.0 23.5 30.1 (24.7; 36.3)
Musculo-skeletal
Q180 – Q189 Q380 – Q389 Q650 – Q799
66.0 58.2 59.2 77.5 62.3 64.7 (56.6; 73.6)
Respiratory
Q300 – Q349 4.3 4.3 5.6 8.3 4.2 5.3 (3.2; 8.3)
Chromosomal
Q900 – Q999 60.2 48.3 67.7 49.8 54.0 56.0 (48.5; 64.3)
Syndromes
Q870 – Q879 1.4 8.5 4.2 2.8 0.0 3.7 (1.7; 5.9)
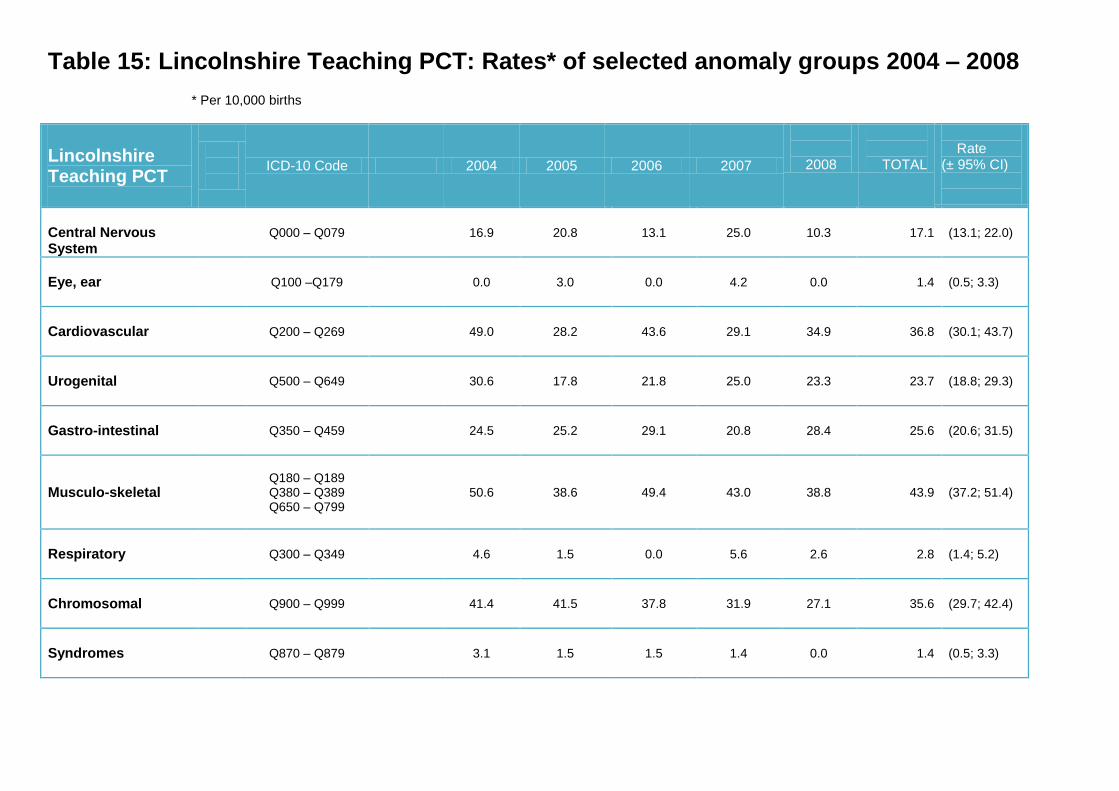
Table 15: Lincolnshire Teaching PCT: Rates* of selected anomaly groups 2004 – 2008
* Per 10,000 births
Lincolnshire Teaching PCT
ICD-10 Code 2004 2005 2006 2007
2008
TOTAL
Rate (± 95% CI)
Central Nervous System
Q000 – Q079 16.9 20.8 13.1 25.0 10.3 17.1 (13.1; 22.0)
Eye, ear
Q100 –Q179 0.0 3.0 0.0 4.2 0.0 1.4 (0.5; 3.3)
Cardiovascular
Q200 – Q269 49.0 28.2 43.6 29.1 34.9 36.8 (30.1; 43.7)
Urogenital
Q500 – Q649 30.6 17.8 21.8 25.0 23.3 23.7 (18.8; 29.3)
Gastro-intestinal
Q350 – Q459 24.5 25.2 29.1 20.8 28.4 25.6 (20.6; 31.5)
Musculo-skeletal
Q180 – Q189 Q380 – Q389 Q650 – Q799
50.6 38.6 49.4 43.0 38.8 43.9 (37.2; 51.4)
Respiratory
Q300 – Q349 4.6 1.5 0.0 5.6 2.6 2.8 (1.4; 5.2)
Chromosomal
Q900 – Q999 41.4 41.5 37.8 31.9 27.1 35.6 (29.7; 42.4)
Syndromes
Q870 – Q879 3.1 1.5 1.5 1.4 0.0 1.4 (0.5; 3.3)
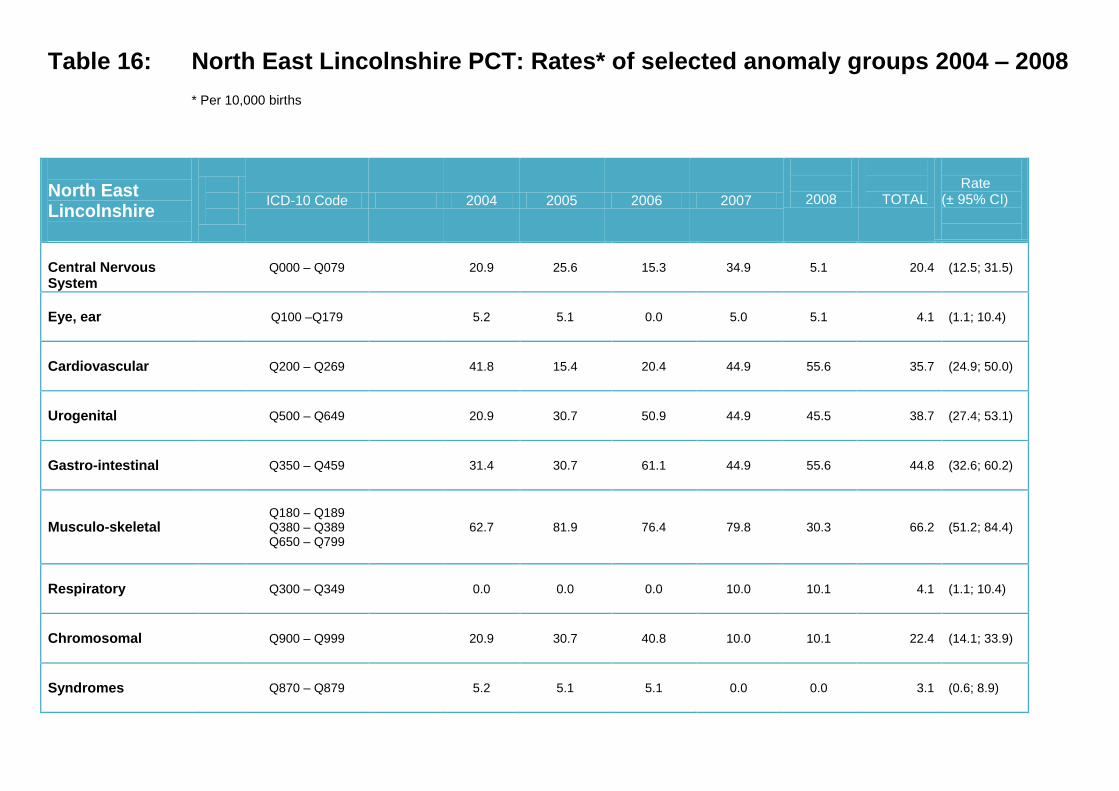
Table 16: North East Lincolnshire PCT: Rates* of selected anomaly groups 2004 – 2008
* Per 10,000 births
North East Lincolnshire
ICD-10 Code 2004 2005 2006 2007
2008
TOTAL
Rate (± 95% CI)
Central Nervous System
Q000 – Q079 20.9 25.6 15.3 34.9 5.1 20.4 (12.5; 31.5)
Eye, ear
Q100 –Q179 5.2 5.1 0.0 5.0 5.1 4.1 (1.1; 10.4)
Cardiovascular
Q200 – Q269 41.8 15.4 20.4 44.9 55.6 35.7 (24.9; 50.0)
Urogenital
Q500 – Q649 20.9 30.7 50.9 44.9 45.5 38.7 (27.4; 53.1)
Gastro-intestinal
Q350 – Q459 31.4 30.7 61.1 44.9 55.6 44.8 (32.6; 60.2)
Musculo-skeletal
Q180 – Q189 Q380 – Q389 Q650 – Q799
62.7 81.9 76.4 79.8 30.3 66.2 (51.2; 84.4)
Respiratory
Q300 – Q349 0.0 0.0 0.0 10.0 10.1 4.1 (1.1; 10.4)
Chromosomal
Q900 – Q999 20.9 30.7 40.8 10.0 10.1 22.4 (14.1; 33.9)
Syndromes
Q870 – Q879 5.2 5.1 5.1 0.0 0.0 3.1 (0.6; 8.9)
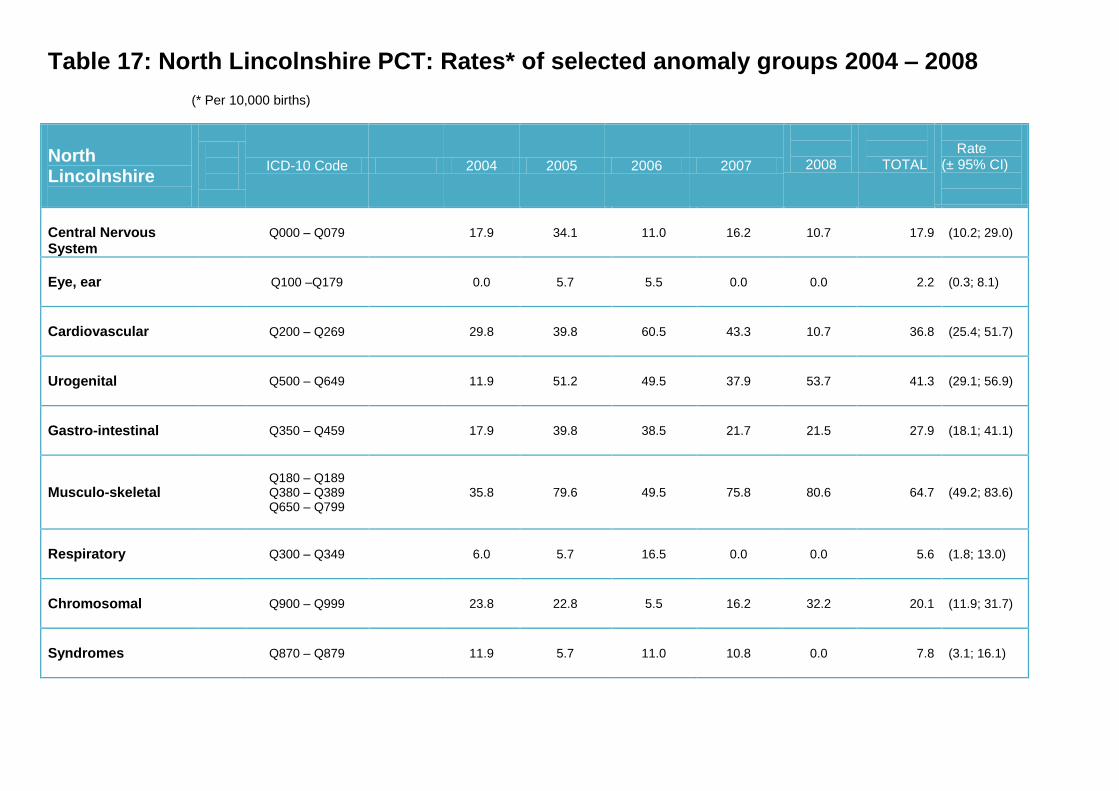
Table 17: North Lincolnshire PCT: Rates* of selected anomaly groups 2004 – 2008
(* Per 10,000 births)
North Lincolnshire
ICD-10 Code 2004 2005 2006 2007
2008
TOTAL
Rate (± 95% CI)
Central Nervous System
Q000 – Q079 17.9 34.1 11.0 16.2 10.7 17.9 (10.2; 29.0)
Eye, ear
Q100 –Q179 0.0 5.7 5.5 0.0 0.0 2.2 (0.3; 8.1)
Cardiovascular
Q200 – Q269 29.8 39.8 60.5 43.3 10.7 36.8 (25.4; 51.7)
Urogenital
Q500 – Q649 11.9 51.2 49.5 37.9 53.7 41.3 (29.1; 56.9)
Gastro-intestinal
Q350 – Q459 17.9 39.8 38.5 21.7 21.5 27.9 (18.1; 41.1)
Musculo-skeletal
Q180 – Q189 Q380 – Q389 Q650 – Q799
35.8 79.6 49.5 75.8 80.6 64.7 (49.2; 83.6)
Respiratory
Q300 – Q349 6.0 5.7 16.5 0.0 0.0 5.6 (1.8; 13.0)
Chromosomal
Q900 – Q999 23.8 22.8 5.5 16.2 32.2 20.1 (11.9; 31.7)
Syndromes
Q870 – Q879 11.9 5.7 11.0 10.8 0.0 7.8 (3.1; 16.1)
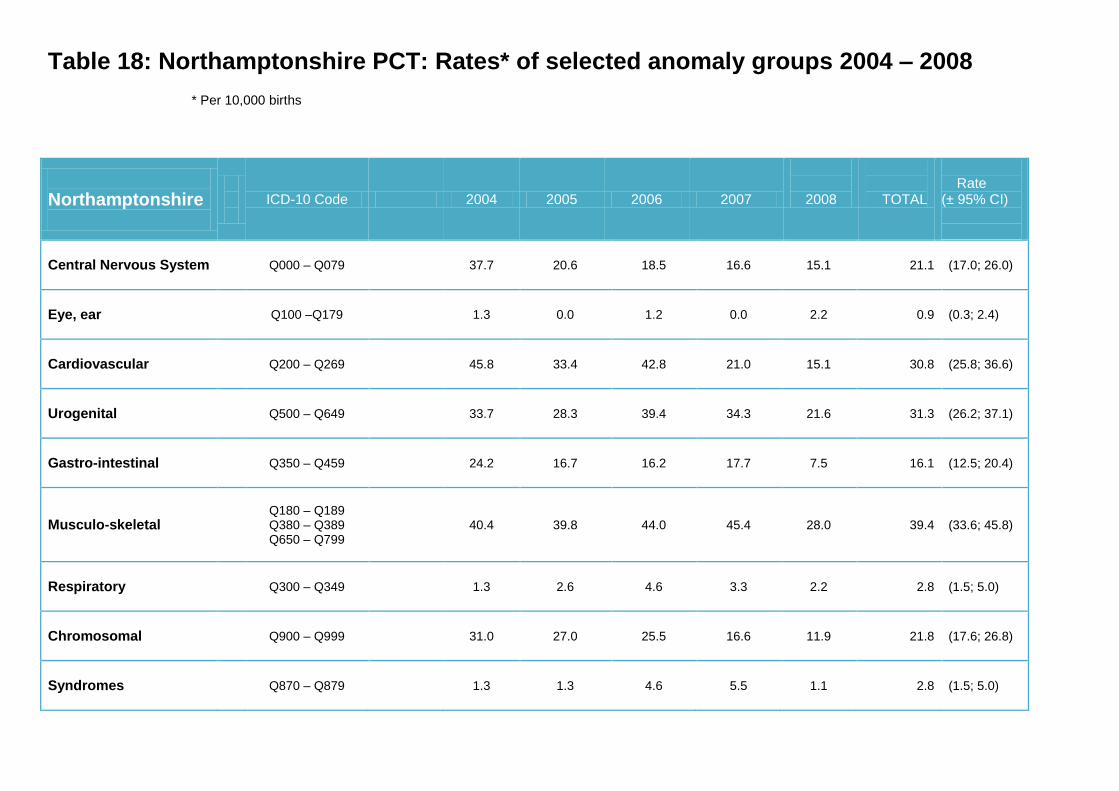
Table 18: Northamptonshire PCT: Rates* of selected anomaly groups 2004 – 2008
* Per 10,000 births
Northamptonshire
ICD-10 Code 2004 2005 2006 2007
2008
TOTAL
Rate (± 95% CI)
Central Nervous System
Q000 – Q079 37.7 20.6 18.5 16.6 15.1 21.1 (17.0; 26.0)
Eye, ear
Q100 –Q179 1.3 0.0 1.2 0.0 2.2 0.9 (0.3; 2.4)
Cardiovascular
Q200 – Q269 45.8 33.4 42.8 21.0 15.1 30.8 (25.8; 36.6)
Urogenital
Q500 – Q649 33.7 28.3 39.4 34.3 21.6 31.3 (26.2; 37.1)
Gastro-intestinal
Q350 – Q459 24.2 16.7 16.2 17.7 7.5 16.1 (12.5; 20.4)
Musculo-skeletal
Q180 – Q189 Q380 – Q389 Q650 – Q799
40.4 39.8 44.0 45.4 28.0 39.4 (33.6; 45.8)
Respiratory
Q300 – Q349 1.3 2.6 4.6 3.3 2.2 2.8 (1.5; 5.0)
Chromosomal
Q900 – Q999 31.0 27.0 25.5 16.6 11.9 21.8 (17.6; 26.8)
Syndromes
Q870 – Q879 1.3 1.3 4.6 5.5 1.1 2.8 (1.5; 5.0)
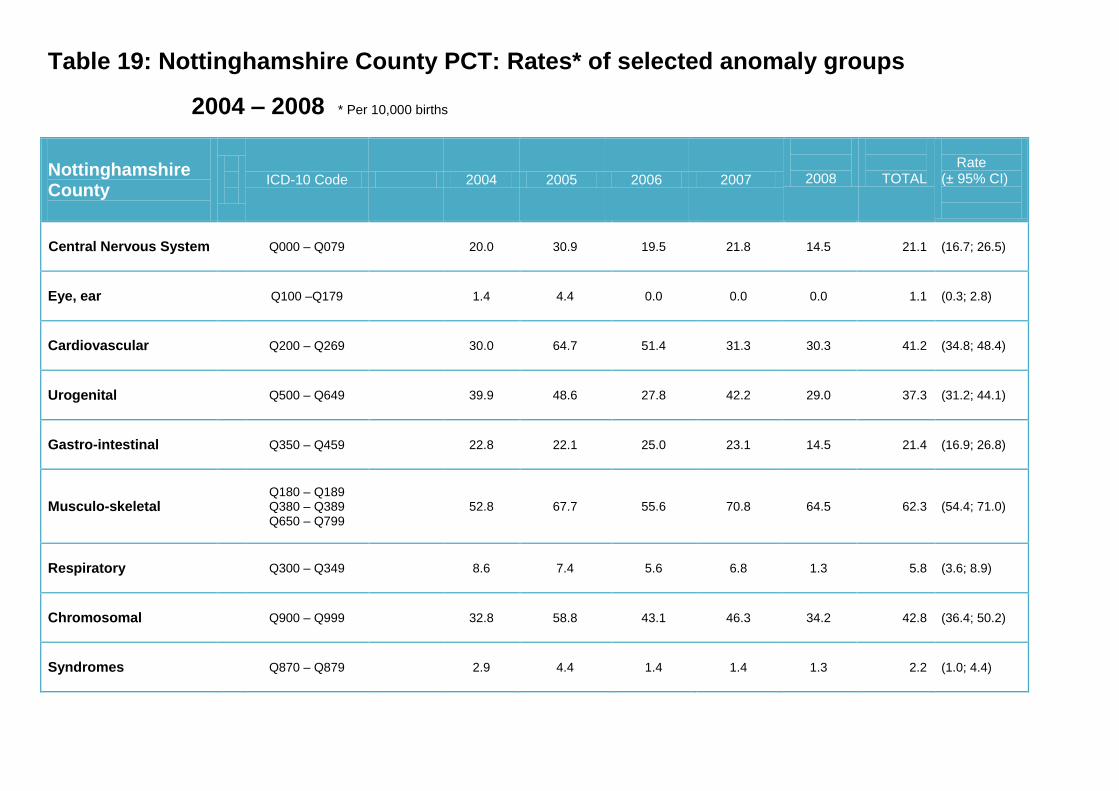
Table 19: Nottinghamshire County PCT: Rates* of selected anomaly groups
2004 – 2008 * Per 10,000 births
Nottinghamshire County
ICD-10 Code 2004 2005 2006 2007
2008
TOTAL
Rate (± 95% CI)
Central Nervous System
Q000 – Q079 20.0 30.9 19.5 21.8
14.5
21.1 (16.7; 26.5)
Eye, ear
Q100 –Q179 1.4 4.4 0.0 0.0 0.0 1.1 (0.3; 2.8)
Cardiovascular
Q200 – Q269 30.0 64.7 51.4 31.3 30.3 41.2 (34.8; 48.4)
Urogenital
Q500 – Q649 39.9 48.6 27.8 42.2 29.0 37.3 (31.2; 44.1)
Gastro-intestinal
Q350 – Q459 22.8 22.1 25.0 23.1 14.5 21.4 (16.9; 26.8)
Musculo-skeletal
Q180 – Q189 Q380 – Q389 Q650 – Q799
52.8 67.7 55.6 70.8 64.5 62.3 (54.4; 71.0)
Respiratory
Q300 – Q349 8.6 7.4 5.6 6.8 1.3 5.8 (3.6; 8.9)
Chromosomal
Q900 – Q999 32.8 58.8 43.1 46.3 34.2 42.8 (36.4; 50.2)
Syndromes
Q870 – Q879 2.9 4.4 1.4 1.4 1.3 2.2 (1.0; 4.4)
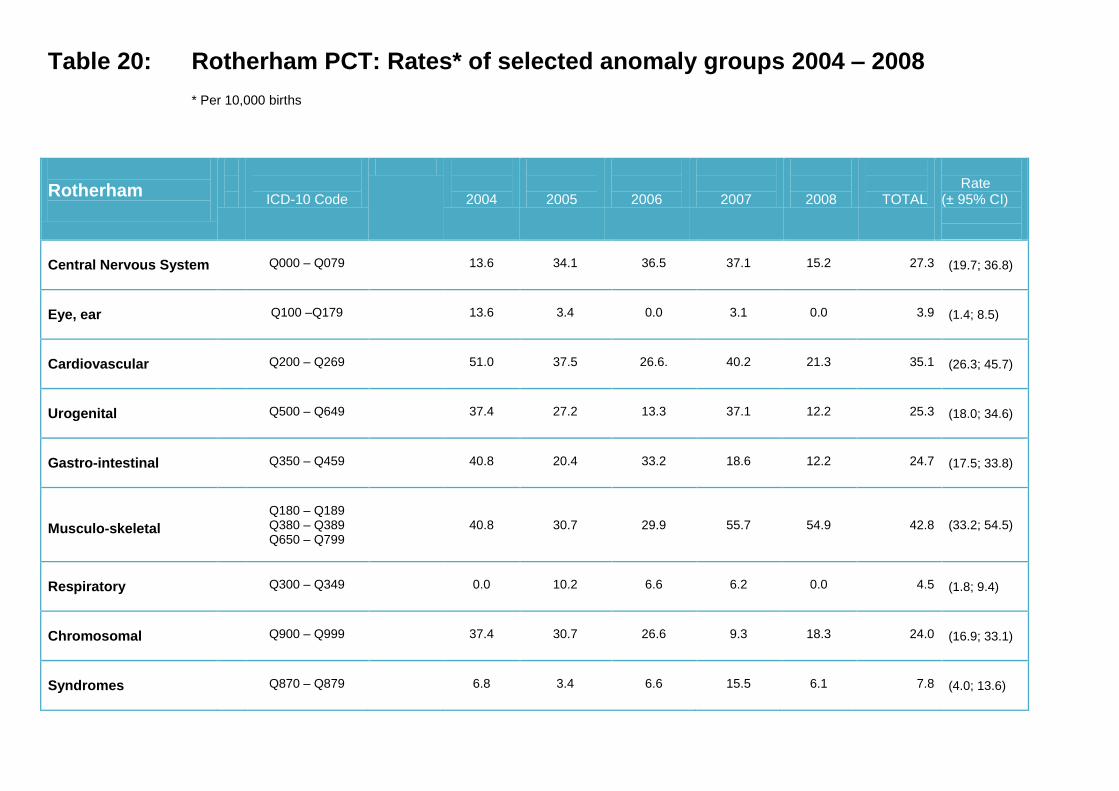
Table 20: Rotherham PCT: Rates* of selected anomaly groups 2004 – 2008
* Per 10,000 births
Rotherham
ICD-10 Code
2004
2005
2006
2007
2008
TOTAL
Rate (± 95% CI)
Central Nervous System
Q000 – Q079
13.6
34.1
36.5
37.1
15.2
27.3 (19.7; 36.8)
Eye, ear
Q100 –Q179
13.6
3.4
0.0
3.1
0.0
3.9 (1.4; 8.5)
Cardiovascular
Q200 – Q269
51.0
37.5
26.6.
40.2
21.3
35.1 (26.3; 45.7)
Urogenital
Q500 – Q649
37.4
27.2
13.3
37.1
12.2
25.3 (18.0; 34.6)
Gastro-intestinal
Q350 – Q459
40.8
20.4
33.2
18.6
12.2
24.7 (17.5; 33.8)
Musculo-skeletal
Q180 – Q189 Q380 – Q389 Q650 – Q799
40.8
30.7
29.9
55.7
54.9
42.8
(33.2; 54.5)
Respiratory
Q300 – Q349
0.0
10.2
6.6
6.2
0.0
4.5 (1.8; 9.4)
Chromosomal
Q900 – Q999
37.4
30.7
26.6
9.3
18.3
24.0 (16.9; 33.1)
Syndromes
Q870 – Q879
6.8
3.4
6.6
15.5
6.1
7.8 (4.0; 13.6)
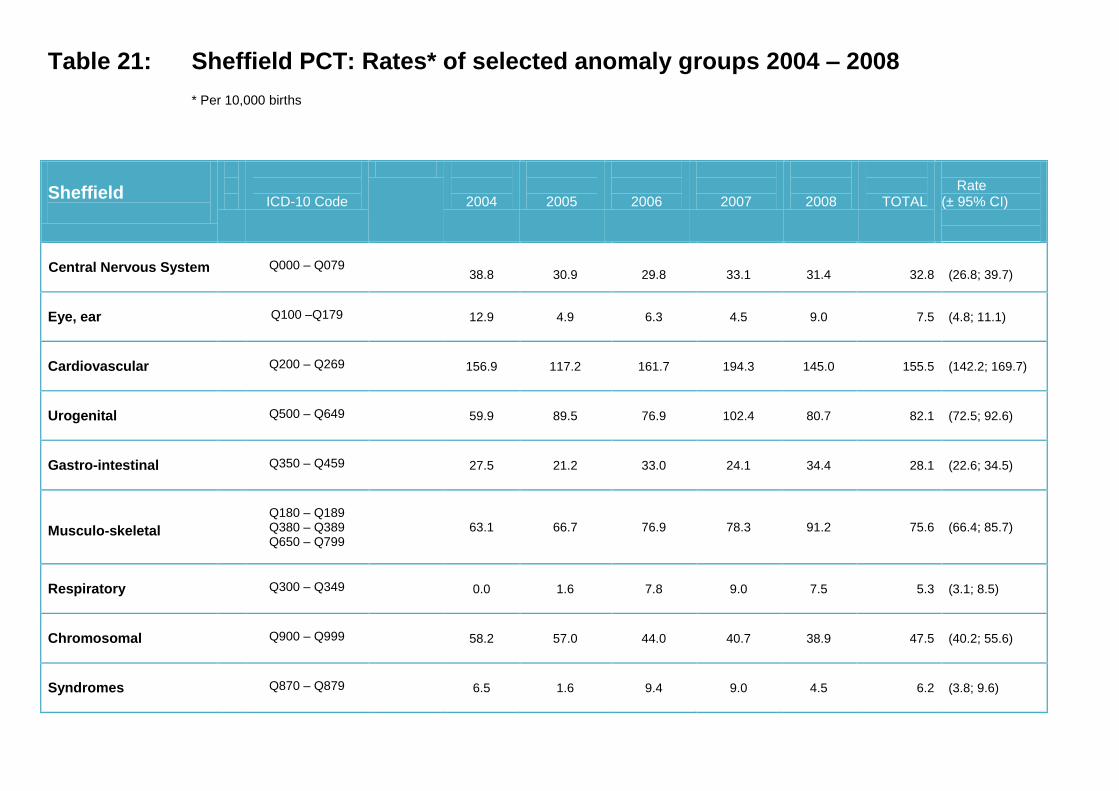
Table 21: Sheffield PCT: Rates* of selected anomaly groups 2004 – 2008
* Per 10,000 births
Sheffield
ICD-10 Code
2004
2005
2006
2007
2008
TOTAL
Rate (± 95% CI)
Central Nervous System
Q000 – Q079
38.8
30.9
29.8
33.1
31.4
32.8 (26.8; 39.7)
Eye, ear
Q100 –Q179
12.9 4.9 6.3 4.5 9.0 7.5 (4.8; 11.1)
Cardiovascular
Q200 – Q269
156.9 117.2 161.7 194.3 145.0 155.5 (142.2; 169.7)
Urogenital
Q500 – Q649
59.9 89.5 76.9 102.4 80.7 82.1 (72.5; 92.6)
Gastro-intestinal
Q350 – Q459
27.5 21.2 33.0 24.1 34.4 28.1 (22.6; 34.5)
Musculo-skeletal
Q180 – Q189 Q380 – Q389 Q650 – Q799
63.1 66.7 76.9 78.3 91.2 75.6 (66.4; 85.7)
Respiratory
Q300 – Q349
0.0 1.6 7.8 9.0 7.5 5.3 (3.1; 8.5)
Chromosomal
Q900 – Q999
58.2 57.0 44.0 40.7 38.9 47.5 (40.2; 55.6)
Syndromes
Q870 – Q879
6.5 1.6 9.4 9.0 4.5 6.2 (3.8; 9.6)


![Clinical Study ...Tabriz Registry of Congenital Anomalies (TRoCA) covers an annual average of 20000 births in the northwest of Iran, including live births and stillbirths [5]. As for](https://img.pdfslide.us/doc/110x75/60f8ba9ef5348146752bd7c7/clinical-study-tabriz-registry-of-congenital-anomalies-troca-covers-an-annual.jpg)