Embed Size (px)
Citation preview
Turn Down
Heatthe
Confronting the New Climate Normal
Turn Do
wn the H
eat C
onfronting the New
Clim
ate Norm
al
Latin America and the CaribbeanP
ublic
Dis
clos
ure
Aut
horiz
edP
ublic
Dis
clos
ure
Aut
horiz
edP
ublic
Dis
clos
ure
Aut
horiz
edP
ublic
Dis
clos
ure
Aut
horiz
edP
ublic
Dis
clos
ure
Aut
horiz
edP
ublic
Dis
clos
ure
Aut
horiz
edP
ublic
Dis
clos
ure
Aut
horiz
edP
ublic
Dis
clos
ure
Aut
horiz
ed
Turn Down
Heatthe
Confronting the New Climate Normal
Latin America and the Caribbean
Turn Down The heaT: ConfronTing The new ClimaTe normal
B
© 2014 International Bank for Reconstruction and Development / The World Bank1818 H Street NW, Washington DC 20433Telephone: 202-473-1000; Internet: www.worldbank.org
Some rights reserved
1 2 3 4 17 16 15 14
This work was prepared for The World Bank by the Potsdam Institute for Climate Impact Research and Climate Analytics. The find-ings, interpretations, and conclusions expressed in this work do not necessarily reflect the views of The World Bank, its Board of Ex-ecutive Directors, or the governments they represent. The World Bank does not guarantee the accuracy of the data included in this commissioned work. The boundaries, colors, denominations, and other information shown on any map in this work do not imply any judgment on the part of The World Bank concerning the legal status of any territory or the endorsement or acceptance of such boundaries. This is an extract from the World Bank Group’s “Turn Down the Heat Report – Confronting the New Climate Normal” with a focus on the Latin America and the Caribbean Region.
For full bibliographic references please refer to the complete report.
Nothing herein shall constitute or be considered to be a limitation upon or waiver of the privileges and immunities of The World Bank, all of which are specifically reserved.
Rights and Permissions
This work is available under the Creative Commons Attribution—NonCommercial—NoDerivatives 3.0 IGO license (CC BY-NC-ND 3.0 IGO) http://creativecommons.org/licenses/by-nc-nd/3.0/igo. Under the Creative Commons—NonCommercial—NoDerivatives license, you are free to copy, distribute, and transmit this work, for noncommercial purposes only, under the following conditions:
Attribution—Please cite the work as follows: World Bank. 2014. Turn Down the Heat: Confronting the New Climate Normal. Washing-ton, DC: World Bank. License: Creative Commons Attribution—NonCommercial—NoDerivatives 3.0 IGO (CC BY-NC-ND 3.0 IGO).
Noncommercial—You may not use this work for commercial purposes.
No Derivative Works—You may not alter, transform, or build upon this work.
Third-party content—The World Bank does not necessarily own each component of the content contained within the work. The World Bank therefore does not warrant that the use of any third-party-owned individual component or part contained in the work will not infringe on the rights of those third parties. The risk of claims resulting from such infringement rests solely with you. If you wish to re-use a component of the work, it is your responsibility to determine whether permission is needed for that re-use and to obtain permission from the copyright owner. Examples of components can include, but are not limited to, tables, figures, or images.
All queries on rights and licenses should be addressed to the Publishing and Knowledge Division, The World Bank, 1818 H Street NW, Washington, DC 20433, USA; fax: 202-522-2625; e-mail: [email protected].
The following items from the full report are used with permission and require further permission for reuse. Please refer to the cap-tion or note corresponding to each item:
Figures 2.2, 2.4, 2.9, 3.10, 3.14, 3.15, 3.21, 4.13, 4.14, 4.19, 4.21, 4.22, 5.11, 5.12, 5.13, 5.14, 5.15, 5.16, 5.17, 5.18, 5.19, 5.20, 5.21.
ISBN: 978-1-4648-0437-3
Cover photos: photos 1, 2, 3, 5, and 7 © The World Bank Group; photo 4 (forestry), © istockphoto, used with permission, further permission for reuse; photos 6 and 8, © Erick Fernandes (floating houses in Peru and jaguar in Amazon)/The World Bank Group.
Cover design: Gregory Wlosinski/General Services Department—Printing and Multimedia, The World Bank Group.
C
Contents
Latin America and the Caribbean 13
1 Regional Summary 131.1 Regional Patterns of Climate Change 141.2 Regional Sea-Level Rise 151.3 Sector-based and Thematic Impacts 151.4 Overview of Regional Development Narratives 18
2 Introduction 182.1 Social, Economic and Demographic Profile of the Latin America
and Caribbean Region 202.2 Vulnerabilities to Climate Change in the Latin America
and Caribbean Region 202.3 Vulnerabilities Faced by Rural Populations 202.4 Urban Settlements and Marginalized Populations 21
3 Regional Patterns of Climate Change 263.1 Projected Temperature Changes 263.2 Heat Extremes 263.3 Regional Precipitation Projections 293.4 Extreme Precipitation and Droughts 293.5 Aridity 313.6 Tropical Cyclones/Hurricanes 323.7 Regional Sea-level Rise 35
4 Regional Impacts 374.1 Glacial Retreat and Snowpack Changes 374.2 Water Resources, Water Security, and Floods 414.3 Climate Change Impacts on Agriculture 474.4 Climate Change Impacts on Biodiversity 524.5 Amazon Rainforest Dieback and Tipping Point 544.6 Fisheries and Coral Reefs 574.7 Human Health 624.8 Migration 644.9 Human Security 664.10 Coastal Infrastructure 674.11 Energy Systems 69
5 Regional Development Narratives 745.1 Overarching Development Narratives 745.2 Sub-regional Development Narratives 78
6 Synthesis Table – Latin America and the Caribbean 81

D
Figures Figure 1.1: Multi-model mean temperature anomaly for Latin America and
the Caribbean for RCP2.6 (2°C world, left) and RCP8.5 (4°C world, right) for the austral summer months (DJF) 14
Figure 1.2: Multi-model mean of the percentage change in the aridity index 15 Figure 1.4: Temperature projections for the Latin American
and Caribbean land area 27 Figure 1.5: Multi-model mean temperature anomaly for Latin America
and the Caribbean 28 Figure 1.6: Multi-model mean of the percentage of austral summer
months (DJF) in the time period 2071-2099 with temperatures greater than 3-sigma (top row) and 5-sigma (bottom row) 29
Figure 1.7: Multi-model mean and individual models of the percentage of Latin American and Caribbean land area warmer than 3-sigma (top) and 5-sigma (bottom) 30
Figure 1.8: Multi-model mean of the percentage change in austral summer (DJF, top), winter (JJA, middle) and annual (bottom) precipitation 32
Figure 1.9: Multi-model mean of the percentage change in the annual-mean of monthly potential evapotranspiration for RCP2.6 (2°C world, left) and RCP8.5 (4°C world, right) for Latin America and the Caribbean by 2071-2099 relative to 1951-1980. 33
Figure 1.10: Multi-model mean of the percentage change in the aridity index 35 Figure 1.11: Change in average rate of occurrence of Category 4 and 5
tropical cyclones per hurricane season (August-October) at about 2.5°C warming globally above pre-industrial levels by the end of the 21st century compared to the present-day 36
Figure 1.12: Patterns of regional sea-level rise 37 Figure 1.13: Regional anomaly pattern and its contributions in the
median RCP8.5 scenario 38 Figure 1.14: Sea level projections for selected cities 39 Figure 1.15: Compilation of mean annual area loss rates for different
time periods for glaciated areas between Venezuela and Bolivia 40 Figure 1.16: Ice loss from outlet glaciers on the Patagonian Ice Field
in southern South America since the Little Ice Age 41 Figure 1.17: Cumulative regional surface mass balance relative to the
1986-2005 mean from the model forced with CMIP5 projections up to the year 2100. SLE = Sea-level equivalent 44
Figure 1.18: Changes in seasonal total runoff in 4 IPCC climate-change scenarios with respect to the 1961-1990 mean monthly runoff 50
Figure 1.19: Aggregate impacts on crop yields in the LAC region with adaptation, computed by the AZS-BioMA platform under 2020 and 2050 NCAR GCM for A1B scenario. 50
Figure 1.20: Meta-analysis of crop yield reductions 56 Figure 1.21: Simulated precipitation changes in Eastern Amazonia from
the 24 IPCC-AR4 GCMs with regional warming levels of 2-4.5 K (left panel). Simulated changes in biomass from LPJmL forced by the 24 IPCC-AR4 climate scenarios assuming strong CO2 fertilization effects (middle panel, CLIM+CO2) and no CO2 fertilization effects (CLIM only, right panel) 60
Figure 1.22: Change in maximum catch potential for Latin American and Caribbean waters 75
E
Figure 1.23: Sub-regional risks for development in Latin America and the Caribbean (LAC) under 4°C warming in 2100 compared to pre-industrial temperatures. 111
Tables Table 1.1: Basic Socioeconomic Indicators of LAC Countries 19 Table 1.2: Total Population and Indigenous Population Census 2000 23 Table 1.3: Percentage of Latin American and Caribbean Population
Living in Urban Areas and Below Five Meters of Elevation 25 Table 1.4: Multi-model mean of the percentage of land area in Latin
America and the Caribbean which is classified as hyper arid, arid, semi-arid and sub-humid 33
Table 1.5: Sea-level rise between 1986-2005 and 2081-2100 for the RCP2.6 (1.5°C world) and RCP8.5 (4°C world) in selected locations of the LAC region 35
Table 1.6: Projected Changes in Yields and Productivity Induced by Climate Change 49
Table 1.7: Summary of Crop Yield Responses to Climate Change, Adaptation Measures, and CO2 Fertilization 50
Table 1.8: Projected losses from sea-level rise 68 Table 1.9: Cumulative loss for the period 2020-2025 for Latin American
and Caribbean sub-regions exposed to tropical cyclones 69 Table 1.10: Electricity production from hydroelectric and
thermoelectric sources 70 Table 1.11: Projected temperature and hydrologic changes
in the Rio Lempa River 71 Table 1.12: Maximum hydropower energy potential 72 Table 1.13: Climate change-related stressors projected to affect
hydroelectricity generation 73 Table 1.14: Natural gas production for LAC countries in 2012 and oil
production in 2013 73 Table 1.15: Synthesis table of climate change impacts in LAC under
different warming levels 81
Boxes Box 1.1: Hurricane Mitch’s Impact in Urban Areas 21 Box 1.2: The Case of Mexico City 22 Box 1.3: Water Security in the Mexico City Metropolitan Area 42 Box 1.4: Glacial Lake Outbursts 43 Box 1.5: Water Security in Quito, La Paz, Bogotá, and Lima 44 Box 1.6: Water from the Cordillera Blanca 44 Box 1.7: Water Security in the Central Andes 45 Box 1.8: Water Security and Glacial melt in La Paz and El Alto, Bolivia 45 Box 1.9: Surface Ozone Concentrations 48 Box 1.10: Critical Ecosystem Services of High Andean Mountain Ecosystems 52 Box 1.11: Freshwater Fisheries – Vulnerability Factors to Climate Change 59 Box 1.12: Distress Migration during Hurricane Mitch 66
F
Foreword from the Full ReportDramatic climate changes and weather extremes are already affecting millions of people around the world, damaging crops and coastlines and putting water security at risk.
Across the three regions studied in the report, record-breaking temperatures are occurring more fre-quently, rainfall has increased in intensity in some places, while drought-prone regions like the Mediter-ranean are getting dryer. A significant increase in tropical North Atlantic cyclone activity is affecting the Caribbean and Central America.
There is growing evidence that warming close to 1.5°C above pre-industrial levels is locked-in to the Earth’s atmospheric system due to past and predicted emissions of greenhouse gases, and climate change impacts such as extreme heat events may now be unavoidable.
As the planet warms, climatic conditions, heat and other weather extremes which occur once in hundreds of years, if ever, and considered highly unusual or unprecedented today would become the “new climate normal” as we approach 4°C—a frightening world of increased risks and global instability.
The consequences for development would be severe as crop yields decline, water resources change, diseases move into new ranges, and sea levels rise. Ending poverty, increasing global prosperity and reduc-ing global inequality, already difficult, will be much harder with 2°C warming, but at 4°C there is serious doubt whether these goals can be achieved at all.
For this report, the third in the Turn Down the Heat series, we turned again to the scientists at the Potsdam Institute for Climate Impact Research and Climate Analytics. We asked them to look at the likely impacts of present day (0.8°C), 2°C and 4°C warming on agricultural production, water resources, cities and ecosystems across Latin America and the Caribbean, Middle East and North Africa, and parts of Europe and Central Asia.
Their findings are alarming.In Latin America and the Caribbean, heat extremes and changing precipitation patterns will have adverse
effects on agricultural productivity, hydrological regimes and biodiversity. In Brazil, at 2°C warming, crop yields could decrease by up to 70 percent for soybean and up to 50 percent for wheat. Ocean acidification, sea level rise, tropical cyclones and temperature changes will negatively impact coastal livelihoods, tour-ism, health and food and water security, particularly in the Caribbean. Melting glaciers would be a hazard for Andean cities.
In the Middle East and North Africa, a large increase in heat-waves combined with warmer average tem-peratures will put intense pressure on already scarce water resources with major consequences for regional food security. Crop yields could decrease by up to 30 percent at 1.5–2°C and by almost 60 percent at 3–4°C. At the same time, migration and climate-related pressure on resources might increase the risk of conflict.
In the Western Balkans and Central Asia, reduced water availability in some places becomes a threat as temperatures rise toward 4°C. Melting glaciers in Central Asia and shifts in the timing of water flows
Foreword From the Full report
G
will lead to less water resources in summer months and high risks of torrential floods. In the Balkans, a higher risk of drought results in potential declines for crop yields, urban health, and energy generation. In Macedonia, yield losses are projected of up to 50 percent for maize, wheat, vegetables and grapes at 2°C warming. In northern Russia, forest dieback and thawing of permafrost threaten to amplify global warming as stored carbon and methane are released into the atmosphere, giving rise to a self-amplifying feedback loop.
Turn Down the Heat: Confronting the New Climate Normal builds on our 2012 report, which concluded the world would warm by 4°C by the end of this century with devastating consequences if we did not take concerted action now. It complements our 2013 report that looked at the potential risks to development under different warming scenarios in Sub-Saharan Africa, South East Asia and South Asia, and which warned that we could experience a 2°C world in our lifetime.
Many of the worst projected climate impacts outlined in this latest report could still be avoided by holding warming below 2°C. But, this will require substantial technological, economic, institutional and behavioral change. It will require leadership at every level of society.
Today the scientific evidence is overwhelming, and it’s clear that we cannot continue down the current path of unchecked, growing emissions. The good news is that there is a growing consensus on what it will take to make changes to the unsustainable path we are currently on.
More and more voices are arguing that is possible to grow greener without necessarily growing slower. Today, we know that action is urgently needed on climate change, but it does not have to come at the expense of economic growth. We need smart policy choices that stimulate a shift to clean public transport and energy efficiency in factories, buildings and appliances can achieve both growth and climate benefits.
This last report in the Turn Down the Heat series comes at a critical moment. Earlier this year, the UN Secretary General’s Climate Summit unleased a new wave of optimism. But our reports make clear that time is of the essence.
Governments will gather first in Lima and then Paris for critical negotiations on a new climate treaty. Inside and outside of the conference halls, global leaders will need to take difficult decisions that will require, in some instances, short term sacrifice but ultimately lead to long term gains for all.
At the World Bank Group we will use our financial capacity to help tackle climate change. We will innovate and bring forward new financial instruments. We will use our knowledge and our convening power. We will use our evidence and data to advocate and persuade. In short, we will do everything we can to help countries and communities build resilience and adapt to the climate impacts already being felt today and ensure that finance flows to where it is most needed.
Our response to the challenge of climate change will define the legacy of our generation. The stakes have never been higher.
Dr. Jim Yong KimPresident, World Bank Group
H
Abbreviations°C degrees Celsius$ United States Dollars AI Aridity IndexAOGCM Atmosphere-Ocean General Circulation ModelAR4 Fourth Assessment Report of the
Intergovernmental Panel on Climate ChangeAR5 Fifth Assessment Report of the Intergovernmental
Panel on Climate ChangeBAU Business as UsualCaCO3 Calcium CarbonateCAT Climate Action TrackerCMIP5 Coupled Model Intercomparison Project Phase 5CO2 Carbon DioxideDGVM Dynamic Global Vegetation ModelDIVA Dynamic Interactive Vulnerability AssessmentDJF December, January, and February (the winter
season of the northern hemisphere)ECA Europe and Central AsiaECS Equilibrium Climate SensitivityENSO El-Niño/Southern Oscillation FAO Food and Agricultural Organization FPU Food Productivity UnitsGCM General Circulation ModelGDP Gross Domestic ProductGFDRR Global Facility for Disaster Reduction and RecoveryGLOF Glacial Lake Outburst FloodHCS Humboldt Current System IAM Integrated Assessment ModelIEA International Energy AgencyIPCC Intergovernmental Panel on Climate ChangeISI-MIP Inter-Sectoral Impact Model Intercomparison
ProjectITCZ Intertropical Convergence Zone
JJA June, July, and August (the summer season of the northern hemisphere; also known as the boreal summer)
LAC Latin America and the CaribbeanLDC Least Developed CountriesMAGICC Model for the Assessment of Greenhouse Gas
Induced Climate ChangeMCMA The Mexico City Metropolitan Area MENA Middle East and North AfricaMGIC Mountain Glaciers and Ice CapsNAO North Atlantic OscillationNDVI Normalized Differenced Vegetation Index (used as
a proxy for terrestrial gross primary production) NH Northern HemisphereNPP Net Primary Production OECD Organization for Economic Cooperation and
DevelopmentPDSI Palmer Drought Severity IndexPgC Petagrams of Carbon (1 PgC = 1 billion tons of
carbon) ppm Parts Per MillionPPP Purchasing Power Parity (a weighted currency
based on the price of a basket of basic goods, typically given in US dollars)
RCM Regional Climate ModelRCP Representative Concentration Pathway SCM Simple Climate ModelSLR Sea-level RiseSRES IPCC Special Report on Emissions ScenariosSREX IPCC Special Report on Managing the Risks of Extreme
Events and Disasters to Advance Climate Change Adaptation

AbbreviAtions
I
TgC Teragrams of Carbon (1 TgC = 1 million tons of carbon)
UNCCD United Nations Convention to Combat Desertification
UNDP United Nations Development ProgrammeUNEP United Nations Environment ProgrammeUNFCCC United Nations Framework Convention on Climate
Change
UNHCR United Nations High Commissioner for RefugeesUSAID United States Agency for International
DevelopmentWBG World Bank GroupWGI Working Group I (also WGII, WGIII)WHO World Health Organization
J
Glossary Aridity Index: The Aridity Index (AI) is an indicator designed for identifying structurally arid regions; that is, regions with a long-term average precipitation deficit. AI is defined as total annual precipitation divided by potential evapotranspiration, with the latter a measure of the amount of water a representative crop type would need as a function of local conditions such as temperature, incoming radiation, and wind speed, over a year to grow, which is a standardized measure of water demand.
Biome: A biome is a large geographical area of distinct plant and animal groups, one of a limited set of major habitats classified by climatic and predominant vegetative types. Biomes include, for example, grasslands, deserts, evergreen or deciduous forests, and tundra. Many different ecosystems exist within each broadly defined biome, all of which share the limited range of climatic and environmental conditions within that biome.
C3/C4 plants: C3 and C4 refer to two types of photosynthetic biochemical pathways. C3 plants include more than 85 percent of plants (e.g., most trees, wheat, rice, yams, and potatoes) and respond well to moist conditions and to additional CO2 in the atmosphere. C4 plants (e.g., savanna grasses, maize, sorghum, millet, and sugarcane) are more efficient in water and energy use and outperform C3 plants in hot and dry conditions.
CAT: The Climate Action Tracker is an independent, science-based assessment that tracks the emissions commitments of and actions by individual countries. The estimates of future emissions deducted from this assessment serve to analyze warming scenarios that could result from current policy: (i) CAT Reference BAU: a lower reference business-as-usual scenario that includes existing climate policies but not pledged emissions reductions; and (ii) CAT Current Pledges: a scenario additionally incorporating reductions currently pledged internationally by countries.
CO2 fertilization: The CO2 fertilization effect refers to the effect of increased levels of atmospheric CO2 on plant growth. It may increase the rate of photosynthesis mainly in C3 plants and increase water use efficiency, thereby causing increases in agricultural pro-ductivity in grain mass and/or number. This effect may to some extent offset the negative impacts of climate change on crop yields, although grain protein content may decline. Long-term effects are uncertain as they heavily depend on a potential physiological long-term acclimation to elevated CO2 and other limiting factors, including soil nutrients, water, and light.
CMIP5: The Coupled Model Intercomparison Project Phase 5 (CMIP5) brought together 20 state-of-the-art GCM groups, which generated a large set of comparable climate-projection data. The project provided a framework for coordinated climate change experi-ments and includes simulations for assessment in the IPCC AR5.
Development narratives: Development narratives highlight the implications of climate change impacts on regional development. The Turn Down the Heat series, and in particular this report, discuss the potential climate change impacts on particularly vulnerable groups along distinct storylines—the so called development nar-ratives. These development narratives were developed for each region in close cooperation with regional World Bank specialists. They provide an integrated, often cross-sectoral analysis of climate change impacts and development implications at the sub-regional or regional level. Furthermore, the development narratives add to the report by allowing the science-based evidence of physical and biophysical impacts to be drawn out into robust develop-ment storylines to characterize the plausible scenarios of risks and opportunities—showcasing how science and policy interface.
GCM: A General Circulation Model is the most advanced type of climate model used for projecting changes in climate due to
GlossAry
K
increasing greenhouse gas concentrations, aerosols, and external forcing (like changes in solar activity and volcanic eruptions). These models contain numerical representations of physical pro-cesses in the atmosphere, ocean, cryosphere, and land surface on a global three-dimensional grid, with the current generation of GCMs having a typical horizontal resolution of 100–300 km.
GDP: Gross Domestic Product is the sum of the gross value added by all resident producers in the economy plus any product taxes and minus any subsidies not included in the value of the product. It is calculated without deductions for depreciation of fabricated assets or for depletion and degradation of natural resources.
GDP PPP: This is GDP on a purchasing power parity basis divided by population. Whereas PPP estimates for OECD countries are quite reliable, PPP estimates for developing countries are often rough approximations.
Highly unusual and Unprecedented: In this report, highly
unusual and unprecedented heat extremes are defined using thresholds based on the historical variability of the current local climate. The absolute level of the threshold depends on the natural year-to-year variability in the base period (1951–1980), which is captured by the standard deviation (sigma). Highly unusual heat extremes are defined as 3-sigma events. For a normal distribution, 3-sigma events have a return time of 740 years. The 2012 U.S. heat wave and the 2010 Russian heat wave classify as 3-sigma and thus highly unusual events. Unprecedented heat extremes are defined as 5-sigma events. They have a return time of several million years. Monthly temperature data do not necessarily fol-low a normal distribution (for example, the distribution can have long tails, making warm events more likely) and the return times can be different from the ones expected in a normal distribution. Nevertheless, 3-sigma events are extremely unlikely and 5-sigma events have almost certainly never occurred over the lifetime of key ecosystems and human infrastructure.
Hyper-aridity: This refers to land areas with very low Aridity Index (AI) scores, generally coinciding with the great deserts. There is no universally standardized value for hyper-aridity, and values between 0 and 0.05 are classified in this report as hyper-arid.
IPCC AR4, AR5: The Intergovernmental Panel on Climate Change (IPCC) is the leading body of global climate change assessments. It comprises hundreds of leading scientists worldwide and on a regular basis publishes assessment reports which provide a com-prehensive overview of the most recent scientific, technical, and socioeconomic information on climate change and its implications. The Fourth Assessment Report (AR4) was published in 2007. The Fifth Assessment Report (AR5) was published in 2013/2014.
ISI-MIP: The first Inter-Sectoral Impact Model Intercomparison Project (ISI-MIP) is a community-driven modeling effort which provides cross-sectoral global impact assessments based on the newly developed climate Representative Concentration Pathways and socioeconomic scenarios. More than 30 models across five sectors (agriculture, water resources, biomes, health, and infra-structure) were incorporated in this modeling exercise.
Pre-industrial Level (what it means to have present 0.8°C warm-ing): Pre-industrial level refers to the level of warming before/at the onset of industrialization. The instrumental temperature records show that the 20-year average of global-mean, near-surface air temperature in 1986–2005 was about 0.6°C higher than the aver-age over 1851–1879. There are, however, considerable year-to-year variations and uncertainties in the data. In addition, the 20-year average warming over 1986–2005 is not necessarily representa-tive of present-day warming. Fitting a linear trend over the period 1901–2010 gives a warming of 0.8°C since “early industrialization.” Global mean, near-surface air temperatures in the instrumental records of surface-air temperature have been assembled dating back to about 1850. The number of measurement stations in the early years is small and increases rapidly with time. Industrializa-tion was well on its way by 1850 and 1900, which implies using 1851–1879 as a base period, or 1901 as a start for linear trend analysis might lead to an underestimate of current and future warming. However, global greenhouse-gas emissions at the end of the 19th century were still small and uncertainties in temperature reconstructions before this time are considerably larger.
RCP: Representative Concentration Pathways are based on carefully selected scenarios for work on integrated assess-ment modeling, climate modeling, and modeling and analysis of impacts. Nearly a decade of new economic data, informa-tion about emerging technologies, and observations of such environmental factors as land use and land cover change are reflected in this work. Rather than starting with detailed socio-economic storylines to generate emissions scenarios, the RCPs are consistent sets of projections of only the components of radiative forcing (the change in the balance between incoming and outgoing radiation to the atmosphere caused primarily by changes in atmospheric composition) that are meant to serve as inputs for climate modeling. These radiative forcing trajectories are not associated with unique socioeconomic or emissions scenarios; instead, they can result from different combina-tions of economic, technological, demographic, policy, and institutional futures. RCP2.6, RCP4.5, RCP6 and RCP8.5 refer, respectively, to a radiative forcing of +2.6 W/m², +4.5 W/m², +6 W/m² and +8.5 W/m² in the year 2100 relative to pre-industrial conditions.
Turn Down The heaT: ConfronTing The new ClimaTe normal
L
RCP2.6: RCP2.6 refers to a scenario which is representative of the literature on mitigation scenarios aiming to limit the increase of global mean temperature to 2°C above pre-industrial levels. This emissions path is used by many studies that have been assessed for the IPCC 5th Assessment Report and is the underlying low emissions scenario for impacts assessed in other parts of this report. In this report, the RCP2.6 is referred to as a 2°C world (with the exception of sea-level rise, where the subset of model used actually leads to 1.5°C world—).
RCP8.5: RCP8.5 refers to a scenario with a no-climate-policy base-line with comparatively high greenhouse gas emissions which is used by many studies that have been assessed for the IPCC Fifth Assessment Report (AR5). This scenario is also the underlying high-emissions scenario for impacts assessed in other parts of this report. In this report, the RCP8.5 is referred to as a 4°C world above the pre-industrial baseline period.
Severe and extreme: These terms indicate uncommon (negative) consequences. These terms are often associated with an additional qualifier like “highly unusual” or “unprecedented” that has a specific quantified meaning.
SRES: The Special Report on Emissions Scenarios, published by the IPCC in 2000, has provided the climate projections for the Fourth Assessment Report (AR4) of the Intergovernmental Panel on Climate Change. The scenarios do not include mitigation assumptions. The SRES study included consideration of 40 different scenarios, each making different assumptions about the driving forces determining future greenhouse gas emissions. Scenarios were grouped into four families (A1FI, A2, B1 and B2), corresponding to a wide range of high- and low-emissions scenarios.
SREX: The IPCC published a special report on Managing the Risks of Extreme Events and Disasters to Advance Climate Change Adaptation (SREX) in 2012. The report provides an assessment of the physical and social factors shaping vulnerability to climate-related disasters and gives an overview of the potential for effective disaster risk management.
Tipping element: Following Lenton et al. (2008), the term tipping element describes large scale components of the Earth system pos-sibly passing a tipping point. A tipping point “commonly refers to a critical threshold at which a tiny perturbation can qualitatively alter the state or development of a system” (Lenton et al. 2008). The consequences of such shifts for societies and ecosystems are likely to be severe.
Virtual water: A measure of the water resources used in the pro-duction of agricultural commodities. International trade in such commodities thereby implies a transfer of virtual water resources from one country to another embedded in the products.
WGI, WGII, WG III: IPCC Working Group I assesses the physical scientific aspects of the climate system and climate change. IPCC Working Group II assesses the vulnerability of socio-economic and natural systems to climate change, negative and positive consequences of climate change, and options for adapting to it. IPCC Working Group III assesses the options for mitigating climate change through limiting or preventing greenhouse gas emissions and enhancing activities that remove them from the atmosphere.
13
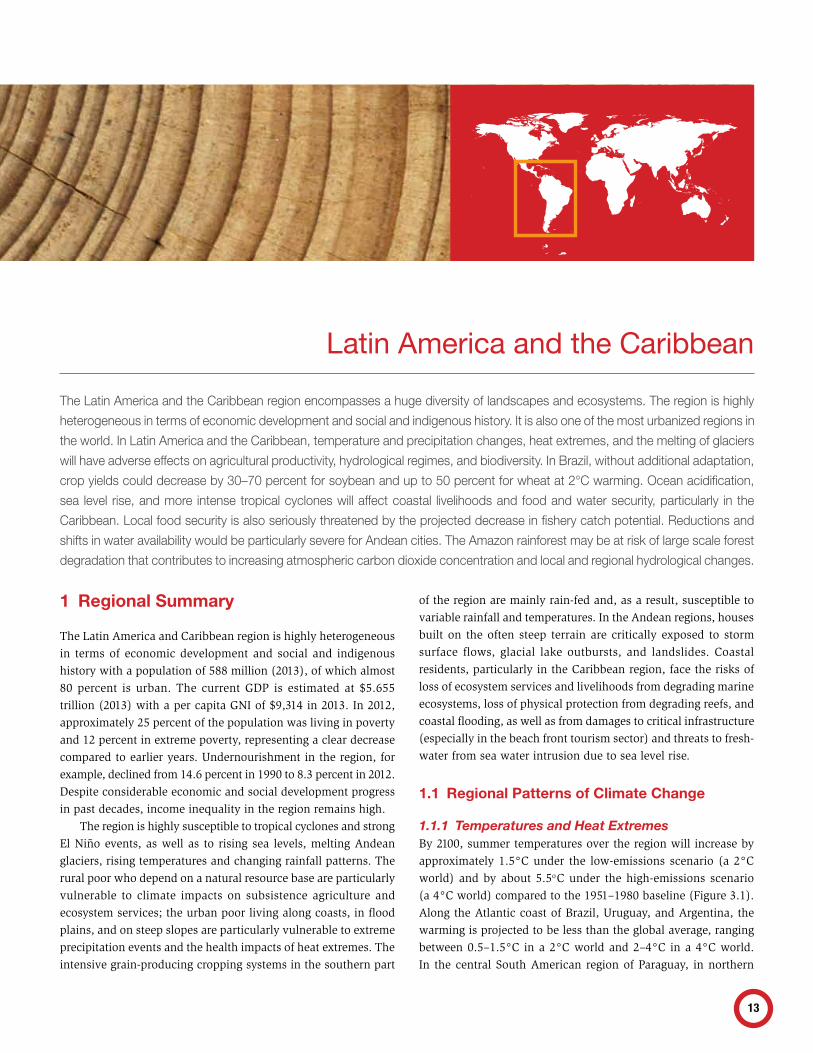
Latin America and the Caribbeanthe latin America and the Caribbean region encompasses a huge diversity of landscapes and ecosystems. the region is highly
heterogeneous in terms of economic development and social and indigenous history. it is also one of the most urbanized regions in
the world. in latin America and the Caribbean, temperature and precipitation changes, heat extremes, and the melting of glaciers
will have adverse effects on agricultural productivity, hydrological regimes, and biodiversity. in brazil, without additional adaptation,
crop yields could decrease by 30–70 percent for soybean and up to 50 percent for wheat at 2°C warming. ocean acidification,
sea level rise, and more intense tropical cyclones will affect coastal livelihoods and food and water security, particularly in the
Caribbean. local food security is also seriously threatened by the projected decrease in fishery catch potential. reductions and
shifts in water availability would be particularly severe for Andean cities. the Amazon rainforest may be at risk of large scale forest
degradation that contributes to increasing atmospheric carbon dioxide concentration and local and regional hydrological changes.
1 Regional Summary
The Latin America and Caribbean region is highly heterogeneous in terms of economic development and social and indigenous history with a population of 588 million (2013), of which almost 80 percent is urban. The current GDP is estimated at $5.655 trillion (2013) with a per capita GNI of $9,314 in 2013. In 2012, approximately 25 percent of the population was living in poverty and 12 percent in extreme poverty, representing a clear decrease compared to earlier years. Undernourishment in the region, for example, declined from 14.6 percent in 1990 to 8.3 percent in 2012. Despite considerable economic and social development progress in past decades, income inequality in the region remains high.
The region is highly susceptible to tropical cyclones and strong El Niño events, as well as to rising sea levels, melting Andean glaciers, rising temperatures and changing rainfall patterns. The rural poor who depend on a natural resource base are particularly vulnerable to climate impacts on subsistence agriculture and ecosystem services; the urban poor living along coasts, in flood plains, and on steep slopes are particularly vulnerable to extreme precipitation events and the health impacts of heat extremes. The intensive grain-producing cropping systems in the southern part
of the region are mainly rain-fed and, as a result, susceptible to variable rainfall and temperatures. In the Andean regions, houses built on the often steep terrain are critically exposed to storm surface flows, glacial lake outbursts, and landslides. Coastal residents, particularly in the Caribbean region, face the risks of loss of ecosystem services and livelihoods from degrading marine ecosystems, loss of physical protection from degrading reefs, and coastal flooding, as well as from damages to critical infrastructure (especially in the beach front tourism sector) and threats to fresh-water from sea water intrusion due to sea level rise.
1.1 Regional Patterns of Climate Change
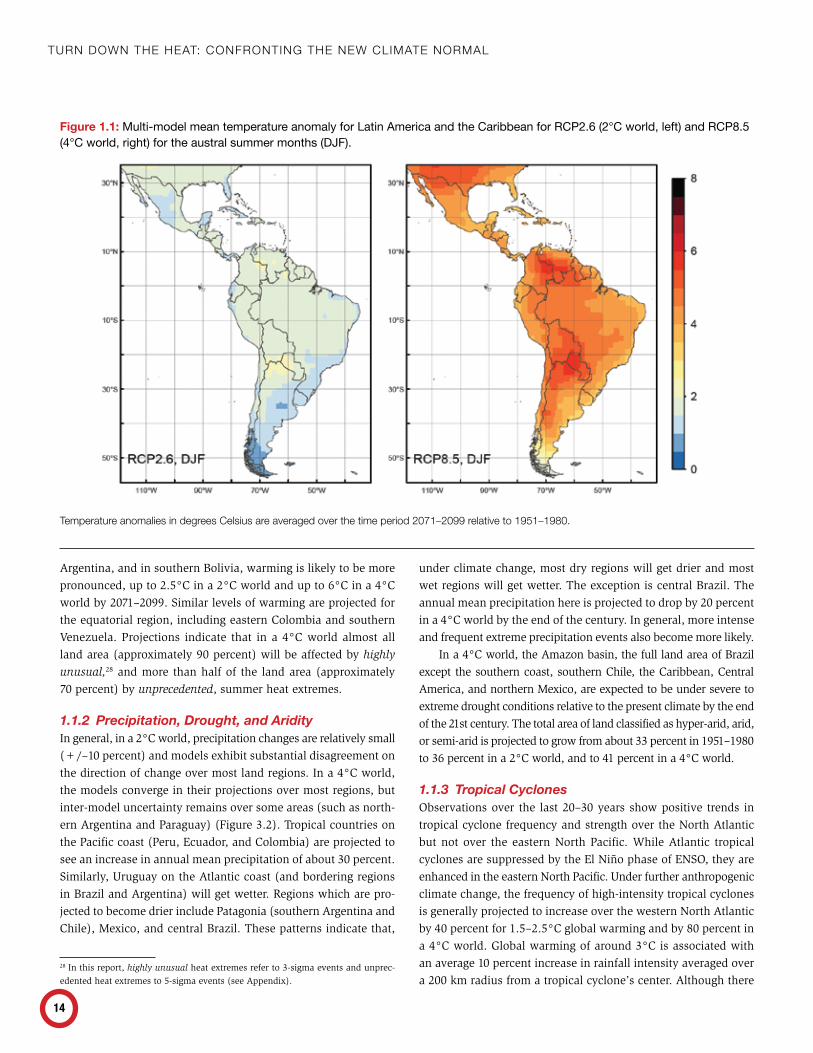
1.1.1 Temperatures and Heat ExtremesBy 2100, summer temperatures over the region will increase by approximately 1.5°C under the low-emissions scenario (a 2°C world) and by about 5.5o C under the high-emissions scenario (a 4°C world) compared to the 1951–1980 baseline (Figure 3.1). Along the Atlantic coast of Brazil, Uruguay, and Argentina, the warming is projected to be less than the global average, ranging between 0.5–1.5°C in a 2°C world and 2–4°C in a 4°C world. In the central South American region of Paraguay, in northern
Turn Down The heaT: ConfronTing The new ClimaTe normal
14
Argentina, and in southern Bolivia, warming is likely to be more pronounced, up to 2.5°C in a 2°C world and up to 6°C in a 4°C world by 2071–2099. Similar levels of warming are projected for the equatorial region, including eastern Colombia and southern Venezuela. Projections indicate that in a 4°C world almost all land area (approximately 90 percent) will be affected by highly
unusual,28 and more than half of the land area (approximately 70 percent) by unprecedented, summer heat extremes.
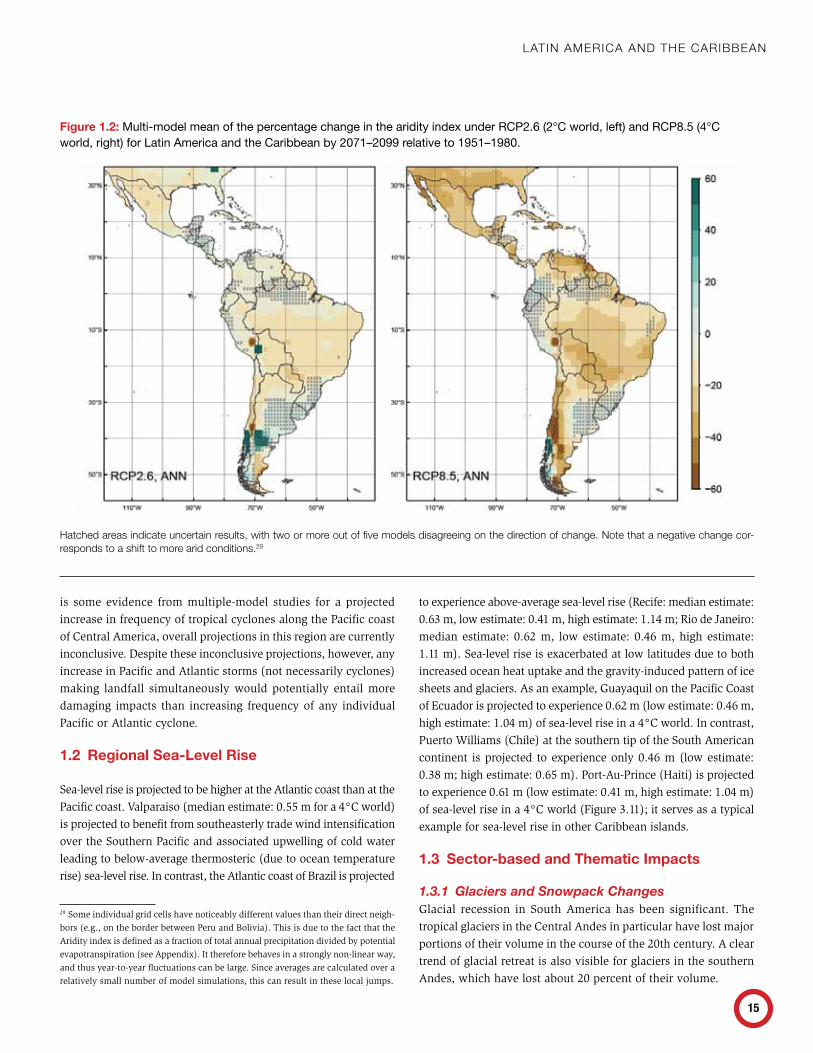
1.1.2 Precipitation, Drought, and AridityIn general, in a 2°C world, precipitation changes are relatively small (+/–10 percent) and models exhibit substantial disagreement on the direction of change over most land regions. In a 4°C world, the models converge in their projections over most regions, but inter-model uncertainty remains over some areas (such as north-ern Argentina and Paraguay) (Figure 3.2). Tropical countries on the Pacific coast (Peru, Ecuador, and Colombia) are projected to see an increase in annual mean precipitation of about 30 percent. Similarly, Uruguay on the Atlantic coast (and bordering regions in Brazil and Argentina) will get wetter. Regions which are pro-jected to become drier include Patagonia (southern Argentina and Chile), Mexico, and central Brazil. These patterns indicate that,
28 In this report, highly unusual heat extremes refer to 3-sigma events and unprec-edented heat extremes to 5-sigma events (see Appendix).
under climate change, most dry regions will get drier and most wet regions will get wetter. The exception is central Brazil. The annual mean precipitation here is projected to drop by 20 percent in a 4°C world by the end of the century. In general, more intense and frequent extreme precipitation events also become more likely.
In a 4°C world, the Amazon basin, the full land area of Brazil except the southern coast, southern Chile, the Caribbean, Central America, and northern Mexico, are expected to be under severe to extreme drought conditions relative to the present climate by the end of the 21st century. The total area of land classified as hyper-arid, arid, or semi-arid is projected to grow from about 33 percent in 1951–1980 to 36 percent in a 2°C world, and to 41 percent in a 4°C world.
1.1.3 Tropical CyclonesObservations over the last 20–30 years show positive trends in tropical cyclone frequency and strength over the North Atlantic but not over the eastern North Pacific. While Atlantic tropical cyclones are suppressed by the El Niño phase of ENSO, they are enhanced in the eastern North Pacific. Under further anthropogenic climate change, the frequency of high-intensity tropical cyclones is generally projected to increase over the western North Atlantic by 40 percent for 1.5–2.5°C global warming and by 80 percent in a 4°C world. Global warming of around 3°C is associated with an average 10 percent increase in rainfall intensity averaged over a 200 km radius from a tropical cyclone’s center. Although there
Figure 1.1: Multi-model mean temperature anomaly for Latin America and the Caribbean for RCP2.6 (2°C world, left) and RCP8.5 (4°C world, right) for the austral summer months (DJF).
temperature anomalies in degrees Celsius are averaged over the time period 2071–2099 relative to 1951–1980.
lAtin AmeriCA And the CAribbeAn
15
Figure 1.2: Multi-model mean of the percentage change in the aridity index under RCP2.6 (2°C world, left) and RCP8.5 (4°C world, right) for Latin America and the Caribbean by 2071–2099 relative to 1951–1980.
hatched areas indicate uncertain results, with two or more out of five models disagreeing on the direction of change. note that a negative change cor-responds to a shift to more arid conditions.29
is some evidence from multiple-model studies for a projected increase in frequency of tropical cyclones along the Pacific coast of Central America, overall projections in this region are currently inconclusive. Despite these inconclusive projections, however, any increase in Pacific and Atlantic storms (not necessarily cyclones) making landfall simultaneously would potentially entail more damaging impacts than increasing frequency of any individual Pacific or Atlantic cyclone.29
1.2 Regional Sea-Level Rise
Sea-level rise is projected to be higher at the Atlantic coast than at the Pacific coast. Valparaiso (median estimate: 0.55 m for a 4°C world) is projected to benefit from southeasterly trade wind intensification over the Southern Pacific and associated upwelling of cold water leading to below-average thermosteric (due to ocean temperature rise) sea-level rise. In contrast, the Atlantic coast of Brazil is projected
29 Some individual grid cells have noticeably different values than their direct neigh-bors (e.g., on the border between Peru and Bolivia). This is due to the fact that the Aridity index is defined as a fraction of total annual precipitation divided by potential evapotranspiration (see Appendix). It therefore behaves in a strongly non-linear way, and thus year-to-year fluctuations can be large. Since averages are calculated over a relatively small number of model simulations, this can result in these local jumps.
to experience above-average sea-level rise (Recife: median estimate: 0.63 m, low estimate: 0.41 m, high estimate: 1.14 m; Rio de Janeiro: median estimate: 0.62 m, low estimate: 0.46 m, high estimate: 1.11 m). Sea-level rise is exacerbated at low latitudes due to both increased ocean heat uptake and the gravity-induced pattern of ice sheets and glaciers. As an example, Guayaquil on the Pacific Coast of Ecuador is projected to experience 0.62 m (low estimate: 0.46 m, high estimate: 1.04 m) of sea-level rise in a 4°C world. In contrast, Puerto Williams (Chile) at the southern tip of the South American continent is projected to experience only 0.46 m (low estimate: 0.38 m; high estimate: 0.65 m). Port-Au-Prince (Haiti) is projected to experience 0.61 m (low estimate: 0.41 m, high estimate: 1.04 m) of sea-level rise in a 4°C world (Figure 3.11); it serves as a typical example for sea-level rise in other Caribbean islands.
1.3 Sector-based and Thematic Impacts
1.3.1 Glaciers and Snowpack ChangesGlacial recession in South America has been significant. The tropical glaciers in the Central Andes in particular have lost major portions of their volume in the course of the 20th century. A clear trend of glacial retreat is also visible for glaciers in the southern Andes, which have lost about 20 percent of their volume.
Turn Down The heaT: ConfronTing The new ClimaTe normal
16
The recession of the tropical glaciers in the Central Andes will continue as rapidly as it has in recent decades. Even for low or intermediate emissions scenarios inducing a global warming of 2–3°C above pre-industrial levels, two comprehensive studies con-sistently project a glacial volume loss of 78–97 percent. Both studies predict an almost complete deglaciation (93–100 percent) for a 4°C world. Other studies are slightly less dramatic; irrespective of the temperature evolution in the next decades, however, large parts of the glaciers of the tropical Andes will be gone long before the end of the century. In the Southern Andes, the model spread for the 2–3°C global warming ranges from 22–59 percent glacier volume loss; a comparison for individual scenarios is difficult. In a 4°C world, models project a glacier volume retreat of 44–74 percent by 2100.
Monitoring of snow cover in the high altitudes of Chile and Argentina since 1950 shows no significant trend (possible trends are hard to identify in the records, since the inter-annual variabil-ity is large and clearly modulated by ENSO). The lack of reliable projections for snowpack and snow cover changes in the Andes is an important research gap.
1.3.2 Water Resources, Water Security, and FloodsAlthough the magnitude of the change varies, there is a high agreement on decreasing mean annual runoff and discharge in Central America. Water stress may increase, especially in arid areas with high population densities and during the dry season. In the Caribbean, runoff projections are of low confidence due to lack of data. However, freshwater availability may decrease for several reasons, such as sea-level rise leading to an intrusion of sea water into coastal aquifers. Regionally, the risk of flooding and mudslides with high mortality rates is high. Although floods often seem to be associated with land-use change, more severe flooding events may also occur in the context of climate change.
Higher variability of seasonal discharge is projected for the Tropical Andes. Decreased streamflow during the dry season has already been observed, and may decrease further as a result of ongoing glacier retreat. However, streamflow during the wet sea-son may increase. The Andean region could experience a higher flood risk in a 4°C world (e.g. due to accelerated glacier melting). In the Amazon Basin, runoff and discharge projections for most parts of the Amazon basin are diverging. For the western part of the basin a likely increase in streamflow, runoff, flood zone, and inundation time are projected. In southern most South America, a decrease in mean runoff is projected.
Although the Latin America and Caribbean region has an abundance of freshwater resources, many cities depend on local rivers, aquifers, lakes, and glaciers that may be affected by climate change—and freshwater supplies might not be enough to meet demand. For example, Guadalajara (Mexico) and many Andean cities are expected to face increasing water stress and, if the current demand continues, low-income groups who already lack adequate access to water will face more challenges.
1.3.3 Climate Change Impacts on Agriculture, Livestock, and Food SecurityThe results of the climate change impact projections on crop yields differ among studies, but most authors agree that climate change will very likely decrease agricultural yields of important food crops in the Latin America and Caribbean region. An exception is the projected increase in yield of irrigated/flooded rice in some regions. The few available studies on climate change impacts on livestock indicate that beef and dairy cattle production will decline under increasing temperatures, as heat stress is a major influenc-ing factor of cattle productivity. Sheep seem to cope better with warmer and drier conditions than cattle and pigs.
1.3.4 Climate Change Impacts on BiodiversityClimate change-induced negative effects on biodiversity, from range contractions to extinctions, are very likely in a warmer than 2°C world. As the adaptive capacity of affected species and eco-systems is hard to project or quantify, models need to use simpli-fied approaches as implemented in bioclimatic envelope models, species-distribution models, and dynamic global vegetation models.
One clear trend regarding future warming levels is that the more temperature is projected to increase, the more species diver-sity is affected. Mountainous regions in the tropics (e.g., cloud forests) are projected to become very vulnerable due to the high number of endemic and highly specialized species which might face mountaintop extinction. Most models do not take biotic interactions (e.g., food-web interactions, species competition) or resource limitations into account. Therefore, the realized ecological niche of species within an ecosystem might become much smaller than what is potentially possible according to climatic and other environmental conditions, leading to shifts in ecological zones.
1.3.5 Amazon Rainforest Degradation, Dieback, and Tipping PointOverall, the most recent studies suggest that the Amazon dieback is an unlikely, but possible, future for the Amazon region. Projected future precipitation and the effects of CO2 fertilization on tropical tree growth remain the processes with the highest uncertainty. Climate-driven changes in dry season length and recurrence of extreme drought years, as well as the impact of fires on forest degradation, add to the list of unknowns for which combined effects still remain to be investigated in an integrative study across the Amazon. A critical tipping point has been identified at around 40 percent deforesta-tion, when altered water and energy feedbacks between remaining tropical forest and climate may lead to a decrease in precipitation.
A basin-wide Amazon forest dieback caused by feedbacks between climate and the global carbon cycle is a potential tipping point of high impact if regional temperatures increase by more than 4°C and global mean temperatures increase by more than 3°C toward the end of the 21st century. Recent analyses have, how-ever, downgraded this probability from 21 percent to 0.24 percent
lAtin AmeriCA And the CAribbeAn
17
for the 4°C regional warming level when coupled carbon-cycle climate models are adjusted to better represent the inter-annual variability of tropical temperatures and related CO2 emissions. This holds true, however, only when the CO2 fertilization effect is realized as implemented in current vegetation models. Moreover, large-scale forest degradation as a result of increasing drought may impair ecosystem services and functions, including the regional hydrological cycle, even without a forest dieback.
1.3.6 Fisheries and Coral ReefsTogether with ocean acidification and hypoxia, which are very likely to become more pronounced under high-emissions scenarios, the possibility of more extreme El Niño events poses substantial risks to the world’s richest fishery grounds. Irrespective of single events, the gradual warming of ocean waters has been observed and is further expected to affect fisheries (particularly at a local scale).
Generally, fish populations are migrating poleward toward colder waters. Projections indicate an increase in catch potential of up to 100 percent in the south of Latin America. Off the coast of Uruguay, the southern tip of Baja California, and southern Brazil the maximum catch potential is projected to decrease by more than 50 percent. Caribbean waters and parts of the Atlantic coast of Central America may see declines in the range of 5–50 percent. Along the coasts of Peru and Chile, fish catches are projected to decrease by up to 30°percent, but there are increases expected toward the south.
Irrespective of the sensitivity threshold chosen, and irrespective of the emissions scenario, by the year 2040, Caribbean coral reefs are expected to experience annual bleaching events. While some species and particular locations appear to be more resilient to such events, it is clear that the marine ecosystems of the Caribbean are facing large-scale changes with far-reaching consequences for associated livelihood activities as well as for the coastal protection provided by healthy coral reefs.
1.3.7 HealthThe Latin America and Caribbean region faces increased risks of morbidity and mortality caused by infectious diseases and extreme weather events. Observed patterns of disease transmission associ-ated with different parts of the ENSO cycle offer clues as to how changes in temperature and precipitation might affect the incidence of a particular disease in a particular location. Projections of how malaria incidence in the region could be affected by climate change over the rest of the century are somewhat inconsistent, with some studies pointing to increased incidence and others to decreased incidence. Such uncertainty also characterizes studies of the rela-tionship between climate change and malaria globally and reflects the complexity of the environmental factors influencing the disease.
1.3.8 Migration and SecurityWhile migration is not a new phenomenon in the region, it is expected to accelerate under climate change. There are many areas in the Latin America and Caribbean Region prone to extreme events,
including droughts, floods, landslides, and tropical cyclones; all of these extreme events can induce migration.
Examples indicate that drought-induced migration is already occurring in some regions. The largest level of climate migration is likely to occur in areas where non-environmental factors (e.g., poor governance, political persecution, population pressures, and poverty) are already present and putting migratory pressures on local populations.
The region is considered to be at low risk of armed conflict. However, in the context of high social and economic inequality and migration flows across countries, disputes regarding access to resources, land, and wealth are persistent. Climate change could increase the risk of conflict in the region through more resource scarcity, more migration, increasing instability, and increasing frequency and intensity of natural disasters.
1.3.9 Coastal InfrastructureBy 2050, coastal flooding with a sea-level rise of 20 cm could generate approximately $940 million of mean annual losses in the 22 largest coastal cities in the Latin America and Caribbean region, and about $1.2 billion with a sea-level rise of 40 cm. The Caribbean region is particularly vulnerable to climate change due to its low-lying areas and the population’s dependence on coastal and marine economic activity. In a scenario leading to a 4°C world and featuring 0.89–1.4 m of sea-level rise, tropical cyclones in the Caribbean alone could generate an extra $22 billion by 2050 (and $46 billion by 2100) in storm and infrastructure damages and tourism losses, compared to a scenario leading to a 2°C world. The potential increase in tropical cyclone intensity may increase port downtime for ships and, therefore, increase shipping costs. Beach tourism is particularly exposed to direct and indirect climate change stressors, including sea-level rise, modified tropical storm patterns, heightened storm surges, and coastal erosion. Coastal tourist resorts are potentially two-to-three times more exposed to climate change-related stressors than inland touristic resorts.
1.3.10 EnergyThe assessment of the current literature on climate change impacts on energy in Latin America and the Caribbean shows that there are only a few studies, most of which make strong assumptions about such key issues as seasonality of water supply for hydro-power. These studies are more qualitative than quantitative and important gaps remain. There is also a lack of studies with respect to the impacts of climate change impacts on renewable energies.
In general, the impacts of climate change on energy demand are less well studied than those on energy supply—and, yet, demand and supply interact in a dynamic way. For example, the concomitant increase in energy demand during heat extremes and the decrease in energy supply through reduced river flow and low efficiencies may put existing energy systems under increasing pressure in the future.
Turn Down The heaT: ConfronTing The new ClimaTe normal
18
1.4 Overview of Regional Development Narratives
The development narratives build on the climate change impacts ana-lyzed in this report (see Table 1.15: Synthesis table of climate change impacts in LAC under different warming levels) and are presented in more detail in Section 5. Climate change impacts have manifold direct and indirect implications for development in the region. These impacts occur on a continuum from rural to urban; not only are there many climate impacts directly affecting rural spaces leading for example to reduced agricultural productivity or altered hydrological regimes, but these impacts also affect urban areas through changing ecosystem services, migration flows, and so forth. Development will likewise be impacted as the challenges of a changing climate mount and interact with socioeconomic factors. In particular, glacial melt and changing river flows, extreme events, and risks to food production systems will put human livelihoods under pressure.
Climate change impacts are and will continue to affect devel-opment across the region in several ways. First, changes to the hydrological cycle endanger the stability of freshwater supplies and ecosystem services. An altered hydrological system due to changing runoff, glacial melt, and snowpack changes will affect the ecosystem services that the rural population depends on, freshwater supplies in cities, and such major economic activities as mining and hydropower. Second, climate change places at risk both large-scale agricultural production for export and small-scale agriculture for regional food production. Third, a stronger prevalence of extreme events affects both rural and urban communities, particularly in coastal regions.
At the sub-regional level, the following climate-development interactions are particularly important. In Central America and the Caribbean, extreme events threaten livelihoods and damage infrastructure. In the Andes, changes in water resource availability challenge the rural and urban poor. In the Amazon, the risks of a tipping point, forest degradation, and biodiversity loss threaten local communities. Hydrological changes may affect the wider region. The Southern Cone faces risks to export commodities from loss of production from intensive agriculture. In the Mexican dry subtropical regions and northeastern Brazil, increasing drought stress threatens rural livelihoods and health.
2 Introduction
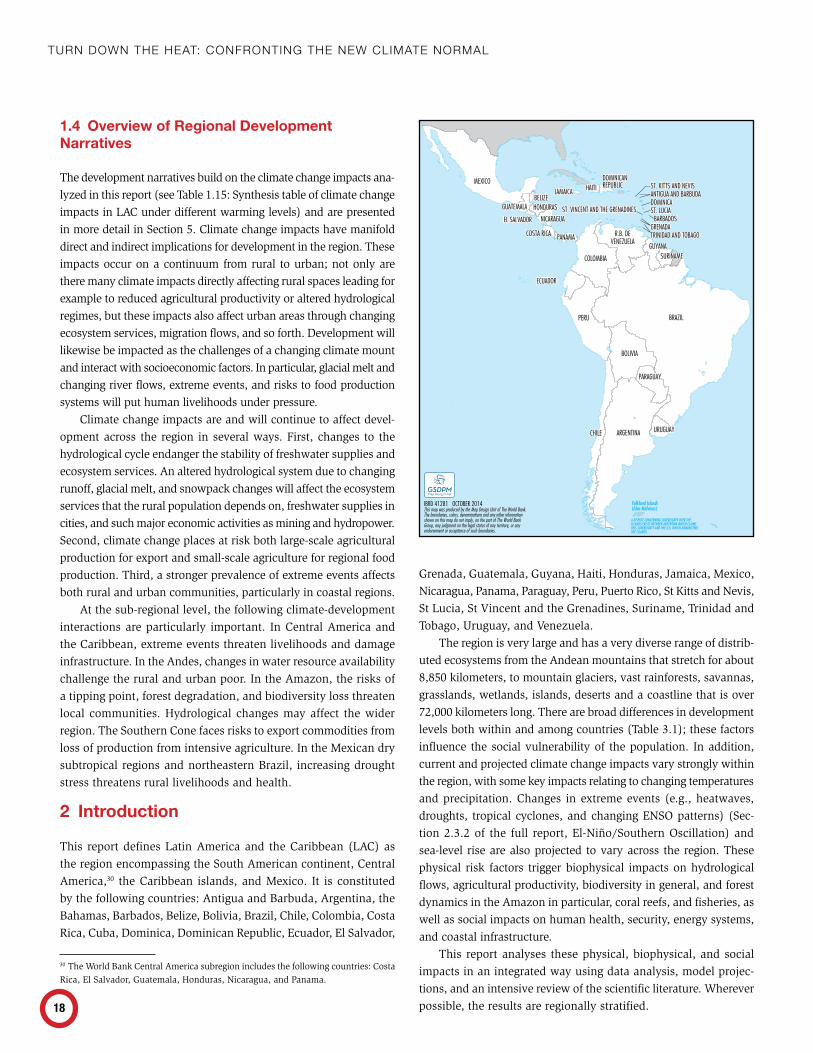
This report defines Latin America and the Caribbean (LAC) as the region encompassing the South American continent, Central America,30 the Caribbean islands, and Mexico. It is constituted by the following countries: Antigua and Barbuda, Argentina, the Bahamas, Barbados, Belize, Bolivia, Brazil, Chile, Colombia, Costa Rica, Cuba, Dominica, Dominican Republic, Ecuador, El Salvador,
30
Grenada, Guatemala, Guyana, Haiti, Honduras, Jamaica, Mexico, Nicaragua, Panama, Paraguay, Peru, Puerto Rico, St Kitts and Nevis, St Lucia, St Vincent and the Grenadines, Suriname, Trinidad and Tobago, Uruguay, and Venezuela.
The region is very large and has a very diverse range of distrib-uted ecosystems from the Andean mountains that stretch for about 8,850 kilometers, to mountain glaciers, vast rainforests, savannas, grasslands, wetlands, islands, deserts and a coastline that is over 72,000 kilometers long. There are broad differences in development levels both within and among countries (Table 3.1); these factors influence the social vulnerability of the population. In addition, current and projected climate change impacts vary strongly within the region, with some key impacts relating to changing temperatures and precipitation. Changes in extreme events (e.g., heatwaves, droughts, tropical cyclones, and changing ENSO patterns) (Sec-tion 2.3.2 of the full report, El-Niño/Southern Oscillation) and sea-level rise are also projected to vary across the region. These physical risk factors trigger biophysical impacts on hydrological flows, agricultural productivity, biodiversity in general, and forest dynamics in the Amazon in particular, coral reefs, and fisheries, as well as social impacts on human health, security, energy systems, and coastal infrastructure.
This report analyses these physical, biophysical, and social impacts in an integrated way using data analysis, model projec-tions, and an intensive review of the scientific literature. Wherever possible, the results are regionally stratified.
BRAZIL
CHILE
COSTA RICA PANAMA
ECUADOR
EL SALVADOR
GUATEMALA
HAITIDOMINICANREPUBLIC
JAMAICA
HONDURAS
BOLIVIA
PERU
COLOMBIA
R.B. DEVENEZUELA
BELIZE
NICARAGUA
GUYANASURINAME
MEXICO
URUGUAYARGENTINA
PARAGUAY
GRENADABARBADOS
ST. LUCIADOMINICAANTIGUA AND BARBUDAST. KITTS AND NEVIS
TRINIDAD AND TOBAGO
ST. VINCENT AND THE GRENADINES
A DISPUTE CONCERNING SOVEREIGNTY OVER THEISLANDS EXISTS BETWEEN ARGENTINA WHICH CLAIMSTHIS SOVEREIGNTY AND THE U.K. WHICH ADMINISTERSTHE ISLANDS.
Falkland Islands(Islas Malvinas)
IBRD 41281 OCTOBER 2014This map was produced by the Map Design Unit of The World Bank.The boundaries, colors, denominations and any other informationshown on this map do not imply, on the part of The World BankGroup, any judgment on the legal status of any territory, or anyendorsement or acceptance of such boundaries.
GSDPMMap Design Unit
30 The World Bank Central America subregion includes the following countries: Costa Rica, El Salvador, Guatemala, Honduras, Nicaragua, and Panama.
19
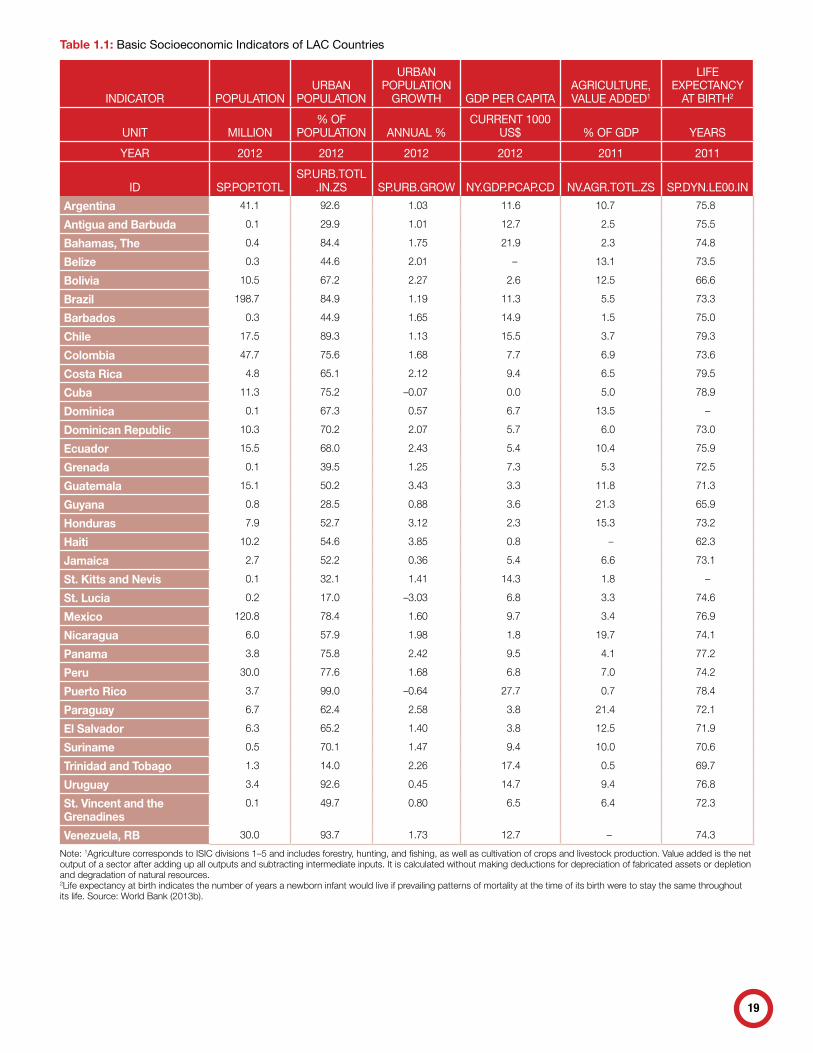
Table 1.1: Basic Socioeconomic Indicators of LAC Countries
INDICATOR POPULATIONURBAN
POPULATION
URBAN POPULATION
GROWTH GDP PER CAPITAAGRICULTURE, VALUE ADDED1
LIFE ExPECTANCY
AT BIRTH2
UNIT MILLION% OF
POPULATION ANNUAL %CURRENT 1000
US$ % OF GDP YEARSYEAR 2012 2012 2012 2012 2011 2011
ID SP.POP.TOTLSP.URB.TOTL
.IN.ZS SP.URB.GROW NY.GDP.PCAP.CD NV.AGR.TOTL.ZS SP.DYN.LE00.INArgentina 41.1 92.6 1.03 11.6 10.7 75.8
Antigua and Barbuda 0.1 29.9 1.01 12.7 2.5 75.5
Bahamas, The 0.4 84.4 1.75 21.9 2.3 74.8
Belize 0.3 44.6 2.01 – 13.1 73.5
Bolivia 10.5 67.2 2.27 2.6 12.5 66.6
Brazil 198.7 84.9 1.19 11.3 5.5 73.3
Barbados 0.3 44.9 1.65 14.9 1.5 75.0
Chile 17.5 89.3 1.13 15.5 3.7 79.3
Colombia 47.7 75.6 1.68 7.7 6.9 73.6
Costa Rica 4.8 65.1 2.12 9.4 6.5 79.5
Cuba 11.3 75.2 –0.07 0.0 5.0 78.9
Dominica 0.1 67.3 0.57 6.7 13.5 –
Dominican Republic 10.3 70.2 2.07 5.7 6.0 73.0
Ecuador 15.5 68.0 2.43 5.4 10.4 75.9
Grenada 0.1 39.5 1.25 7.3 5.3 72.5
Guatemala 15.1 50.2 3.43 3.3 11.8 71.3
Guyana 0.8 28.5 0.88 3.6 21.3 65.9
Honduras 7.9 52.7 3.12 2.3 15.3 73.2
Haiti 10.2 54.6 3.85 0.8 – 62.3
Jamaica 2.7 52.2 0.36 5.4 6.6 73.1
St. Kitts and Nevis 0.1 32.1 1.41 14.3 1.8 –
St. Lucia 0.2 17.0 –3.03 6.8 3.3 74.6
Mexico 120.8 78.4 1.60 9.7 3.4 76.9
Nicaragua 6.0 57.9 1.98 1.8 19.7 74.1
Panama 3.8 75.8 2.42 9.5 4.1 77.2
Peru 30.0 77.6 1.68 6.8 7.0 74.2
Puerto Rico 3.7 99.0 –0.64 27.7 0.7 78.4
Paraguay 6.7 62.4 2.58 3.8 21.4 72.1
El Salvador 6.3 65.2 1.40 3.8 12.5 71.9
Suriname 0.5 70.1 1.47 9.4 10.0 70.6
Trinidad and Tobago 1.3 14.0 2.26 17.4 0.5 69.7
Uruguay 3.4 92.6 0.45 14.7 9.4 76.8
St. Vincent and the Grenadines
0.1 49.7 0.80 6.5 6.4 72.3
Venezuela, RB 30.0 93.7 1.73 12.7 – 74.3
note: 1Agriculture corresponds to isiC divisions 1–5 and includes forestry, hunting, and fishing, as well as cultivation of crops and livestock production. value added is the net output of a sector after adding up all outputs and subtracting intermediate inputs. it is calculated without making deductions for depreciation of fabricated assets or depletion and degradation of natural resources.2life expectancy at birth indicates the number of years a newborn infant would live if prevailing patterns of mortality at the time of its birth were to stay the same throughout its life. source: world bank (2013b).
Turn Down The heaT: ConfronTing The new ClimaTe normal
20
2.1 Social, Economic and Demographic Profile of the Latin America and Caribbean Region
The Latin America and Caribbean Region comprises a population of 588 million (in 2013) of which almost 80 percent is urban. The current GDP is estimated at US$ 5.655 trillion (in 2013) with a GNI per capita of US$ 9,314 in 2013. In 2012, approximately 28.2 per-cent of the population were living in poverty and 11.3 percent in extreme poverty or deprivation (ECLAC 2014). These figures represent a decrease of about 1.4 percent in the poverty rate with respect to 2011 (ECLAC 2014). Although the number of people living in poverty in the region has been going down slowly, in absolute terms, this means that 164 million people were poor—of whom 66 million were extremely poor (ECLAC 2014).
Despite progress in the past decade and a growing middle class now surpassing the number of poor, inequality in the region remains high, and may be stagnating. Thirty eight percent of the population live just above the poverty line on an income of $4–10 per day (Fereira et al. 2013).
Income inequalities in the region affect vulnerability to cli-mate change, as the poor are more likely to be exposed to both climate and economic shocks and limited ability to prepare for or mitigate impacts. Haldén (2007) notes that disparities and divi-sions could impede growth and undermine adaptation strategies, with the additional risk that substantial inequality might also destabilize societies and increase the likelihood of conflict in the light of climate change and variability (see Section 2.5, Social Vulnerability to Climate Change). These income inequalities are further exacerbated by gender, spatial, and ethnic inequalities. Ethnicity correlates closely with poverty. In seven countries for which data are available, the poverty rate is 1.2–3.4 times higher for indigenous and afrodescendent groups than for the rest of the population (ECLAC and UNFPA 2009). Furthermore, while indig-enous peoples in LAC represent 10 percent of the population, their income levels and human development indicators (e.g., education and health status) have consistently fallen behind those of the rest of the population (Hall and Patrinos 2005).
The region’s population is expected to rise to 622 million in 2015 and to 700 million by 2030. The distribution of the population is increasingly urban. In 2010, the urban population accounted for 78.8 percent of the total; this number is projected to rise to 83.4 per-cent by 2030 (ECLAC 2014). The concentration of poverty in urban settlements is a central determinant of vulnerability to climate change. In addition, differences in fertility levels of social groups in Latin America and the Caribbean show that the poor segments of the urban population contribute most to urban growth, exacerbating the contribution of predominantly poor rural-urban migrants. Residents
in densely populated low-income settlements (Ravallion et al. 2008) are more likely to be adversely affected by climate extremes.
2.2 Vulnerabilities to Climate Change in the Latin America and Caribbean Region
In the LAC region, climate change is expected to accentuate pre-existing socioeconomic vulnerabilities. People living in low-lying coastal areas, slums (Douglas et al. 2008), and certain popula-tion groups (such as poor (Ahmed et al. 2009; Hertel et al. 2010) and women-led households (Kumar and Quisumbing 2011)), are particularly exposed to shocks and future climate change risks.
Several socioeconomic and physical factors can contribute to increasing the vulnerability of populations to climate change. For example, poverty hinders households’ adaptive capacity (Kelly and Adger 2000). According to Calvo (2013), the following character-istics of the population in the LAC region increase the exposure to climate change impacts and the likelihood of being affected by economic shocks: (1) one third of the population can be classified as poor or extremely poor, so that any shock can push them into further poverty; (2) there are more children in poor and extremely poor households given the higher fertility rates amongst the poor, so that shocks can have particularly adverse consequences for children, given that they are at a stage of life with greater needs and dependency; and (3) poor households have members with fewer years of formal education, which can limit their capacity to adapt to climate change impacts or macroeconomic shocks.
2.3 Vulnerabilities Faced by Rural Populations
Even though urban and rural areas have both experienced poverty reduction, the gap between the rural and urban experience is still wide. In 2010, the rural poverty rate was twice as high as that of urban areas; when considering extreme poverty, it was four times as high (IFAD 2013). Close to 60 percent of the population in extreme poverty lives in rural areas (RIMISP 2011). Many rural people in the region continue to live on less than $2 per day and have poor access to financial services, markets, training, and other opportunities. The rural poor are thus more likely to feel the impacts of climate change and variability given their dependency on small-hold, rain-fed agriculture and other environmental resources that are particularly susceptible to the effects of climate change (Hoffman and Grigera 2013). Moreover, these populations have limited political influence and are less able to leverage govern-ment support to help curb the effects of climate change (Hardoy and Pandiella 2009). The dependence of the rural population on land as a source of food and income, coupled with lack of physi-cal and financial adaptive capacity, means that poor farmers are
lAtin AmeriCA And the CAribbeAn
21
also at increased risk of harm from slow-onset change (Rossing and Rubin 2011).
2.4 Urban Settlements and Marginalized Populations
In addition to high levels of urbanization, in many countries in the region a high proportion of the urban population lives in a few very large cities. National economies, employment patterns, and government capacities—many of which are highly centralized—are also very dependent on these large cities. This makes them extremely vulnerable (Hardoy and Pandiella 2009). Based on two global model studies, Ahmed et al. (2009), Hertel et al. (2010), and Skoufias et al. (2011) estimate that urban salaried workers will be the most affected by climate change given the increase in prices of food resulting from reduced agricultural production. Increasing pressure on rural economic activities induced by droughts, heat waves, or floods—also driven by future climate change impacts—could result in a greater rural exodus and add further pressure on human and economic development in cities (Marengo et al. 2012, 2013; Vörösmarty et al. 2002).
Spatial vulnerability within urban centers is a major source of risk. There are particularly hazardous areas within Latin American cities where settlements have been built, including flood plains (Calvo 2013). These settlements already face infrastructural problems that affect water supplies, sanitation, and solid waste management as they were built for less populated cities. This leaves these areas at greater risk of flooding and other disasters (Hardoy and Pandiella 2009) (Box 3.1). In 2004, for example, 14 percent of the population in the LAC region (more than 125 million people) did not have access to improved sanitation, and an even-higher percentage lacked good quality sanitation and drainage. Limited access to sanitation and freshwater sources is also a key source of vulnerability as this increases the risk of the spread of water-borne diseases (McMichael and Lindgren 2011; McMichael et al. 2012).
Houses in informal settlements are built incrementally with deficient materials and no attention to building or zoning regula-tions. As a result, a significant share of the population is exposed to flooding, contamination of groundwater by salt water, and constraints on the availability and quality of drinking water, as well as to a rising sea level (Magrin et al. 2007). In addition, the impacts of extreme weather events are more severe in areas that have been previously affected and have not yet been able to recover properly, with cumulative effects that are difficult to overcome. Limited disaster preparation and a lack of planning compound the problems (Martí 2006).
A great deal of urban expansion in the region has taken place over floodplains, on mountain slopes, and in other zones
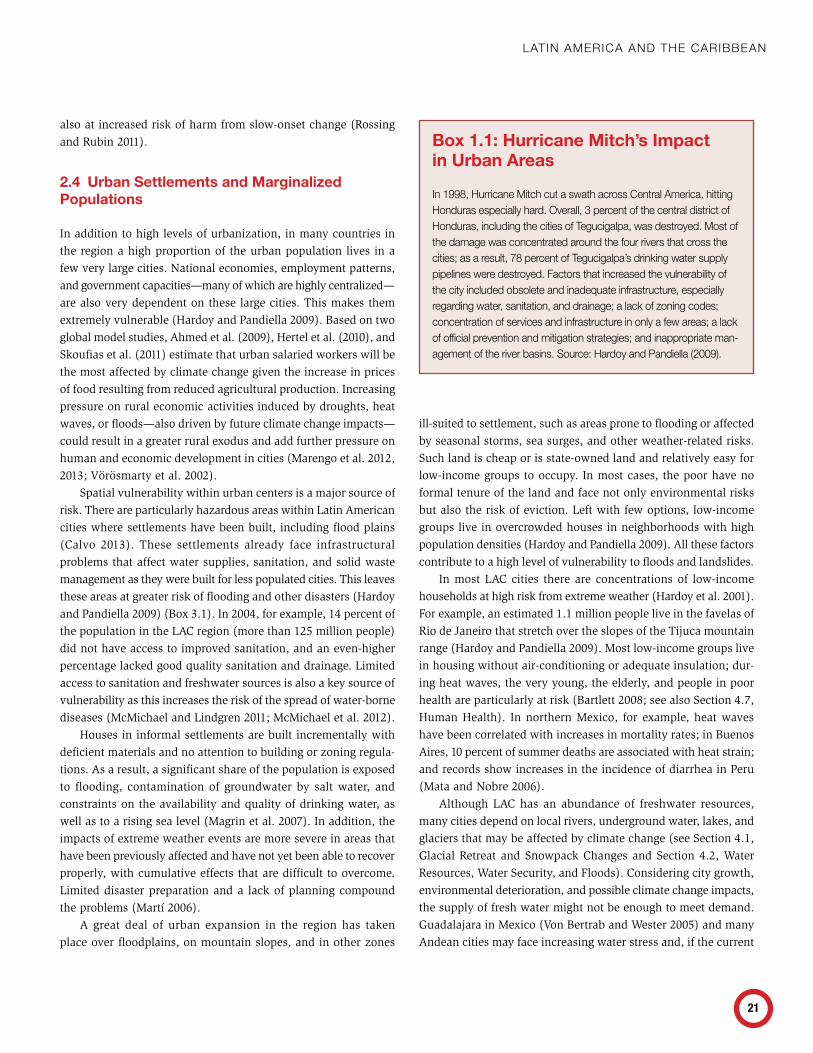
Box 1.1: Hurricane Mitch’s Impact in Urban Areas
in 1998, hurricane mitch cut a swath across Central America, hitting honduras especially hard. overall, 3 percent of the central district of honduras, including the cities of tegucigalpa, was destroyed. most of the damage was concentrated around the four rivers that cross the cities; as a result, 78 percent of tegucigalpa’s drinking water supply pipelines were destroyed. Factors that increased the vulnerability of the city included obsolete and inadequate infrastructure, especially regarding water, sanitation, and drainage; a lack of zoning codes; concentration of services and infrastructure in only a few areas; a lack of official prevention and mitigation strategies; and inappropriate man-agement of the river basins. source: hardoy and pandiella (2009).
ill-suited to settlement, such as areas prone to flooding or affected by seasonal storms, sea surges, and other weather-related risks. Such land is cheap or is state-owned land and relatively easy for low-income groups to occupy. In most cases, the poor have no formal tenure of the land and face not only environmental risks but also the risk of eviction. Left with few options, low-income groups live in overcrowded houses in neighborhoods with high population densities (Hardoy and Pandiella 2009). All these factors contribute to a high level of vulnerability to floods and landslides.
In most LAC cities there are concentrations of low-income households at high risk from extreme weather (Hardoy et al. 2001). For example, an estimated 1.1 million people live in the favelas of Rio de Janeiro that stretch over the slopes of the Tijuca mountain range (Hardoy and Pandiella 2009). Most low-income groups live in housing without air-conditioning or adequate insulation; dur-ing heat waves, the very young, the elderly, and people in poor health are particularly at risk (Bartlett 2008; see also Section 4.7, Human Health). In northern Mexico, for example, heat waves have been correlated with increases in mortality rates; in Buenos Aires, 10 percent of summer deaths are associated with heat strain; and records show increases in the incidence of diarrhea in Peru (Mata and Nobre 2006).
Although LAC has an abundance of freshwater resources, many cities depend on local rivers, underground water, lakes, and glaciers that may be affected by climate change (see Section 4.1, Glacial Retreat and Snowpack Changes and Section 4.2, Water Resources, Water Security, and Floods). Considering city growth, environmental deterioration, and possible climate change impacts, the supply of fresh water might not be enough to meet demand. Guadalajara in Mexico (Von Bertrab and Wester 2005) and many Andean cities may face increasing water stress and, if the current
Turn Down The heaT: ConfronTing The new ClimaTe normal
22
situation continues, low-income groups who already lack adequate access to water will be even less likely to obtain it. Quito is likely to face water shortages as a result of glacier retreat (Hardoy and Pandiella 2009). In Santiago de Chile, an estimated 40 percent reduction in precipitation would impact water supply in a city that is expecting a 30 percent population growth by 2030 (Heinrichs
and Krellenberg 2011). A similar situation exists in Sao Paulo, where the local catchment of Alto Tiete provides just 10 percent of the water supply for 11 million people and where urban areas are expanding over agricultural and natural areas; this is impact-ing the area’s storm-water retention capacity, thereby making the city more prone to flood events (Heinrichs and Krellenberg 2011).
2.4.1 Gender and Age-specific VulnerabilitiesIn the context of a male-dominated, patriarchal society, gender and age are important aspects of vulnerability in the LAC region. Many women and children are particularly vulnerable to the effects of climate change as they have limited access to resources and fewer capabilities and opportunities for participating in decision and policy making (Hardoy and Pandiella 2009). The most vulnerable groups seldom have an influential voice with regard to disaster preparedness or response, and their needs receive little attention.
Economic dependency places women and children in a particularly disadvantaged situation, and climate change could exacerbate the problem. According to ECLAC and UNFPA (2009), poverty is 1.7 times higher among minors under 15 than in adults, and 1.15 times greater among women than men. For example, in Uruguay poverty is 3.1 times higher among children than adults; in Chile, it is 1.8 times greater; and, in Nicaragua, it is 1.3 times greater. Sudden-onset disasters or a worsening of drought condi-tions have the potential to trigger severe acute malnutrition with greater effects on women and children (see Section 2.5, Social Vulnerability to Climate Change).
There are various ways in which women can be affected by climate change differently than men. One way is through the rise in domestic violence in the context of environmental disasters. Gender-based violence is already a significant problem for women in LAC, where most studies estimate that prevalent physical vio-lence between intimate partners affects between 20–50 percent of women. While there are important differences in the estimates, studies similarly find that 8–26 percent of women and girls report having been sexually abused (Morrison et al. 2004). Moser and Rogers (2005) indicate that rapid socioeconomic changes—such as those that can occur as a result of climate shocks—might have destabilizing effects within families, leading to an increased risk of domestic violence. Although evidence of the effects of climate-induced disasters in the region remains mixed and limited, accounts of gender-based violence have been found in Nicaragua after Hur-ricane Mitch, in the Dominican Republic after Tropical Storm Noel, and in Guatemala after Tropical Storm Agatha (Bizzarri 2012).
Some groups of indigenous women are also particularly vulnerable given their involvement in specific activities. Within indigenous populations in the Colombian Amazon, for example, impacts on horticulture would affect mainly women as they are traditionally in charge of this activity (Kronik and Verner 2010). However, not all gender differences are necessarily worse for women and children. For example, in the case of indigenous
Box 1.2: The Case of Mexico City
mexico City provides a good case study for examining the potential future impacts of climate change on urban areas in the region. the main climate-related risk factors in mexico City stem from increased dry-spell periods and heat waves (see section 3.2, heat extremes).
Greater mexico City, with about 20 million inhabitants, is among the most highly populated cities on the planet. despite a very high Gdp per capita, the city exhibits a very large income inequality, with about 13 percent of the population lacking enough money to meet minimum food needs and approximately 23 percent unable to access education or affordable health care (ibarrarán 2011).
According to un-habitat, mexico City is already exposed to several environmental challenges: the urban region is rapidly expanding, increasing the demand for space, infrastructure, water, and energy. this taxes already-deficient water supplies and an inad-equate sewage system. waste management is similarly challenging, as collection, transportation, and adequate final disposal are limited compared to the daily volume of waste produced by the 20 million inhabitants of the city.
in addition to these preexisting socioeconomic and environmen-tal vulnerabilities, climate change stressors are projected to increase mexico City’s overall vulnerability. Four principal climate-related stressors are projected to affect mexico City: (1) the higher fre-quency of heat waves and hotter days; (2) the decreased instance of cooler days; (3) the increased occurrence of flash floods; and (4) the extension of summer droughts (ibarrarán 2011). An increase in the frequency of heat waves could have two potential consequences in mexico City. First, the steadily growing elderly population will be particularly exposed as they are more sensitive to heat extremes than the rest of the population (Gasparrini and Armstrong 2011). second, in response to heat waves, the population could purchase more air conditioning and cooling systems. this may put power plants under severe stress, particularly as they work less efficiently under higher temperatures. the extension of the summer droughts is projected to increase mexico City’s water stress situation (novelo and tapia 2011; romero lankao 2010). Furthermore, the increased occurrence and extension of summer droughts may disproportion-ately impact the rural population, who may then be more inclined to migrate to cities to find less climate-dependent economic activities (ibarrarán 2011). As a consequence, the population of mexico’s urban areas is expected to grow, putting more pressure on the urban environments and resources.
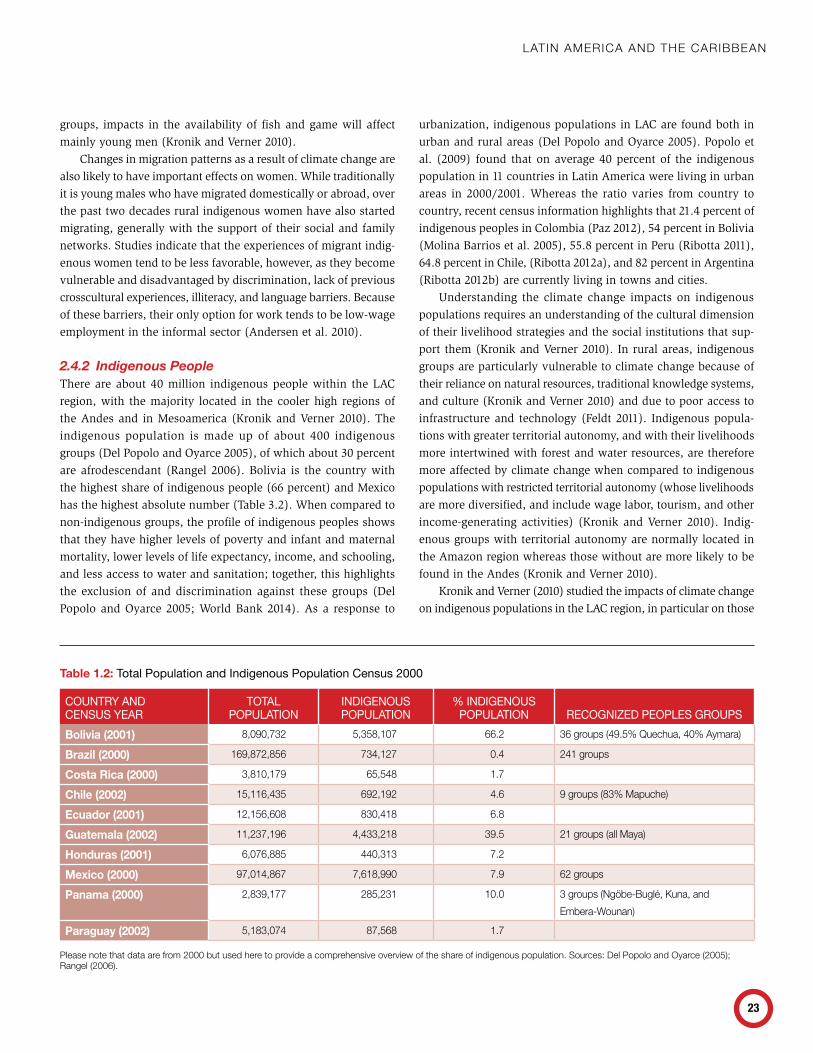
lAtin AmeriCA And the CAribbeAn
23
groups, impacts in the availability of fish and game will affect mainly young men (Kronik and Verner 2010).
Changes in migration patterns as a result of climate change are also likely to have important effects on women. While traditionally it is young males who have migrated domestically or abroad, over the past two decades rural indigenous women have also started migrating, generally with the support of their social and family networks. Studies indicate that the experiences of migrant indig-enous women tend to be less favorable, however, as they become vulnerable and disadvantaged by discrimination, lack of previous crosscultural experiences, illiteracy, and language barriers. Because of these barriers, their only option for work tends to be low-wage employment in the informal sector (Andersen et al. 2010).
2.4.2 Indigenous PeopleThere are about 40 million indigenous people within the LAC region, with the majority located in the cooler high regions of the Andes and in Mesoamerica (Kronik and Verner 2010). The indigenous population is made up of about 400 indigenous groups (Del Popolo and Oyarce 2005), of which about 30 percent are afrodescendant (Rangel 2006). Bolivia is the country with the highest share of indigenous people (66 percent) and Mexico has the highest absolute number (Table 3.2). When compared to non-indigenous groups, the profile of indigenous peoples shows that they have higher levels of poverty and infant and maternal mortality, lower levels of life expectancy, income, and schooling, and less access to water and sanitation; together, this highlights the exclusion of and discrimination against these groups (Del Popolo and Oyarce 2005; World Bank 2014). As a response to
urbanization, indigenous populations in LAC are found both in urban and rural areas (Del Popolo and Oyarce 2005). Popolo et al. (2009) found that on average 40 percent of the indigenous population in 11 countries in Latin America were living in urban areas in 2000/2001. Whereas the ratio varies from country to country, recent census information highlights that 21.4 percent of indigenous peoples in Colombia (Paz 2012), 54 percent in Bolivia (Molina Barrios et al. 2005), 55.8 percent in Peru (Ribotta 2011), 64.8 percent in Chile, (Ribotta 2012a), and 82 percent in Argentina (Ribotta 2012b) are currently living in towns and cities.
Understanding the climate change impacts on indigenous populations requires an understanding of the cultural dimension of their livelihood strategies and the social institutions that sup-port them (Kronik and Verner 2010). In rural areas, indigenous groups are particularly vulnerable to climate change because of their reliance on natural resources, traditional knowledge systems, and culture (Kronik and Verner 2010) and due to poor access to infrastructure and technology (Feldt 2011). Indigenous popula-tions with greater territorial autonomy, and with their livelihoods more intertwined with forest and water resources, are therefore more affected by climate change when compared to indigenous populations with restricted territorial autonomy (whose livelihoods are more diversified, and include wage labor, tourism, and other income-generating activities) (Kronik and Verner 2010). Indig-enous groups with territorial autonomy are normally located in the Amazon region whereas those without are more likely to be found in the Andes (Kronik and Verner 2010).
Kronik and Verner (2010) studied the impacts of climate change on indigenous populations in the LAC region, in particular on those
Table 1.2: Total Population and Indigenous Population Census 2000
COUNTRY AND CENSUS YEAR
TOTAL POPULATION
INDIGENOUS POPULATION
% INDIGENOUS POPULATION RECOGNIZED PEOPLES GROUPS
Bolivia (2001) 8,090,732 5,358,107 66.2 36 groups (49.5% Quechua, 40% Aymara)
Brazil (2000) 169,872,856 734,127 0.4 241 groups
Costa Rica (2000) 3,810,179 65,548 1.7
Chile (2002) 15,116,435 692,192 4.6 9 groups (83% mapuche)
Ecuador (2001) 12,156,608 830,418 6.8
Guatemala (2002) 11,237,196 4,433,218 39.5 21 groups (all maya)
Honduras (2001) 6,076,885 440,313 7.2
Mexico (2000) 97,014,867 7,618,990 7.9 62 groups
Panama (2000) 2,839,177 285,231 10.0 3 groups (ngöbe-buglé, Kuna, and
embera-wounan)
Paraguay (2002) 5,183,074 87,568 1.7
please note that data are from 2000 but used here to provide a comprehensive overview of the share of indigenous population. sources: del popolo and oyarce (2005); rangel (2006).
Turn Down The heaT: ConfronTing The new ClimaTe normal
24
living in the Amazon, the Andes, the Caribbean, and in Central America. In the Colombian Amazon, they found the biggest direct impacts related to changes in the seasonal cycle (i.e., floods, and dry and rainy periods): river flooding affects fish and turtle reproduction, thereby impacting the food security of indigenous populations; changes in periods during which important local fruits ripen and the succession of dry and rainy seasons affect the harvests of wild fruits; and changes in the length of the dry season affects agriculture productivity, particularly in alluvial plateaus gar-dens. Increases in temperature and changes in precipitation affect mainly horticulture, favoring specific crops such as cassava but threatening harvest diversity (Echeverri 2009). Climate change and climate variability is also apparent in the ‘decoupling’ of ecological markers from seasonal changes (whereby seasons appear to occur significantly late or early), affecting livelihood decision-making in particular for indigenous peoples. This may affect the credibility of elders and traditional leaders, as their authority to predict the natural seasonality is challenged (Kronik and Verner 2010).
In the indigenous Andes, rising temperatures can increase demand for water. At the same time, higher evapotranspiration rates and glacial retreat are expected to reduce the water supply; restricting pasture land availability in the dry season, and poten-tially provoking conflict over land use (Kronik and Verner 2010). In the Bolivian Altiplano, however, Aymara communities have declared that high-elevation zones have now become productive, as changing climatic conditions have turned the area into arable land (Kronik and Verner 2010).
Indigenous populations in the Andes are not only subjected to biophysical vulnerability. In the rural Andes, social marginalization and social determinants that limit the ability to improve terms of labor, education and access to technical assistance, undermine the adaptive capacity of the indigenous population (McDowell and Hess 2012). In Palca (Bolivia), for example, farmers are not only vulnerable due to the retreat of the Mururata glacier and the resulting impact on water supply but also to historical margin-alization due to the lack of official identity cards, land titles, or access to bilingual (Aymara-Spanish) basic education (McDowell and Hess 2012).
In the Caribbean and Central America, an increase in the frequency of some natural disasters (e.g., hurricanes) could limit the access of indigenous populations to key crop, forest, and fish resources (Kronik and Verner 2010); slow onset changes, meanwhile, could decrease the productivity of traditional varieties of maize, generating pressure to switch to more commercial varieties (Kronik and Verner 2010). Given that rural areas are mainly populated by indigenous groups—especially those that are most remote—means that they are the most likely to be affected. This is exacerbated by the strong dependence of indigenous groups on natural resources as well as by their reliance on traditional farming techniques. In contrast to the situation of rural indigenous populations, the
vulnerability of indigenous groups living in urban areas is more related to the social conditions they face (e.g., discrimination and social exclusion) than linked to their livelihoods.
2.4.3 Risk for Populations in Coastal AreasCoastal communities in the region are particularly exposed to climate change extremes and sea-level rise (Trab Nielsen 2010). The region’s 64,000 km coastline is one of the most densely populated in the world (Sale et al. 2008). Coastal states have more than 521 million residents, of whom two-thirds (348 million) live within 200 km of the coastline. More than 8.4 million people in LAC live in the path of hurricanes, and roughly 29 million live in low-elevation coastal zones where they are highly vulnerable to sea-level rise, storm surges, and coastal flooding (McGranahan et al. 2007; UNEP 2007). For example, several countries have a large section of their urban population living in areas where elevation is below five meters above sea level (CIESIN 2011). In Belize, the Bahamas, Antigua and Barbuda, and Suriname, between 15 and 62 percent of the urban population live below five meters above sea level (Table 3.3). This low elevation significantly increases the urban population’s exposure to sea-level rise, storm surges, and modified tropical storm patterns.
Furthermore, human activities such as overfishing, marine pollution, and coastal development have eroded the ecosystems in many coastal areas to a level where they no longer provide buffers to climate extremes. Climate change and variability are likely to compound the damage to ecosystems and to human settlements, directly through more intense and frequent storms and sea-level rise and indirectly through the further degradation of the ecosystems (Trab Nielsen 2010).
Coastal communities at greatest risk from climate change and variability are generally those that rely on natural resources for a living, occupy marginal lands, and have limited access to the livelihood assets that are necessary for building resilience to climate change. They include communities that rely on coastal tourism and on fisheries. They also include much of the region’s large population of urban slum dwellers (Trab Nielsen 2010).
More than 50 percent of the Caribbean population lives along the coastline, and around 70 percent live in coastal cities (Mimura et al. 2007; UNEP 2008). Many economic activities (e.g., tourism) are also concentrated in coastal areas (UNEP 2008). Pressures arise on the islands over limited land resources as people are dependent on these natural resources for economic development and their livelihoods. The GDP of the region is generated mainly from two sectors—tourism and agriculture. Both are highly vul-nerable to climate-induced hazards, including flooding, sea-level rise, storms, and coastal erosion (Karmalkar et al. 2013). Small islands are especially vulnerable to extreme events (UNEP 2008).
The east coast of Mexico and Central America, and the Caribbean, are strongly affected by wind storms and cyclones
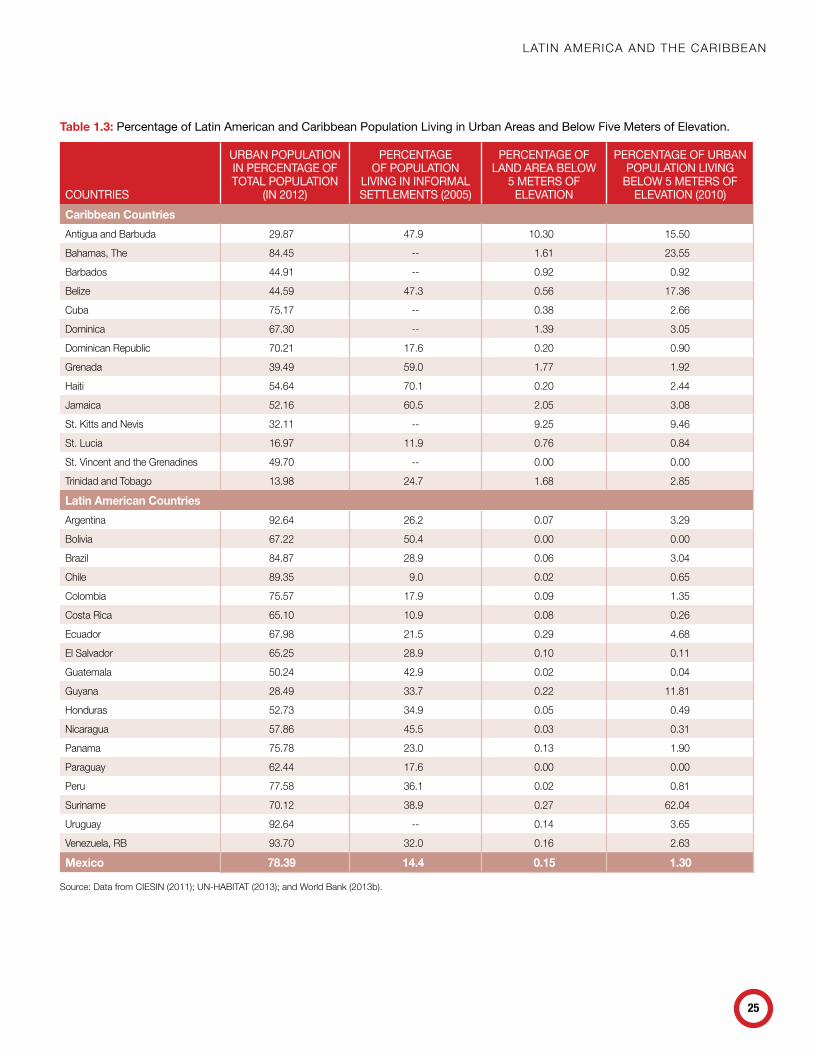
lAtin AmeriCA And the CAribbeAn
25
Table 1.3: Percentage of Latin American and Caribbean Population Living in Urban Areas and Below Five Meters of Elevation.
COUNTRIES
URBAN POPULATION IN PERCENTAGE OF TOTAL POPULATION
(IN 2012)
PERCENTAGE OF POPULATION
LIVING IN INFORMAL SETTLEMENTS (2005)
PERCENTAGE OF LAND AREA BELOW
5 METERS OF ELEVATION
PERCENTAGE OF URBAN POPULATION LIVING
BELOW 5 METERS OF ELEVATION (2010)
Caribbean Countries
Antigua and barbuda 29.87 47.9 10.30 15.50
bahamas, the 84.45 -- 1.61 23.55
barbados 44.91 -- 0.92 0.92
belize 44.59 47.3 0.56 17.36
Cuba 75.17 -- 0.38 2.66
dominica 67.30 -- 1.39 3.05
dominican republic 70.21 17.6 0.20 0.90
Grenada 39.49 59.0 1.77 1.92
haiti 54.64 70.1 0.20 2.44
Jamaica 52.16 60.5 2.05 3.08
st. Kitts and nevis 32.11 -- 9.25 9.46
st. lucia 16.97 11.9 0.76 0.84
st. vincent and the Grenadines 49.70 -- 0.00 0.00
trinidad and tobago 13.98 24.7 1.68 2.85
Latin American Countries
Argentina 92.64 26.2 0.07 3.29
bolivia 67.22 50.4 0.00 0.00
brazil 84.87 28.9 0.06 3.04
Chile 89.35 9.0 0.02 0.65
Colombia 75.57 17.9 0.09 1.35
Costa rica 65.10 10.9 0.08 0.26
ecuador 67.98 21.5 0.29 4.68
el salvador 65.25 28.9 0.10 0.11
Guatemala 50.24 42.9 0.02 0.04
Guyana 28.49 33.7 0.22 11.81
honduras 52.73 34.9 0.05 0.49
nicaragua 57.86 45.5 0.03 0.31
panama 75.78 23.0 0.13 1.90
paraguay 62.44 17.6 0.00 0.00
peru 77.58 36.1 0.02 0.81
suriname 70.12 38.9 0.27 62.04
uruguay 92.64 -- 0.14 3.65
venezuela, rb 93.70 32.0 0.16 2.63
Mexico 78.39 14.4 0.15 1.30
source: data from Ciesin (2011); un-hAbitAt (2013); and world bank (2013b).
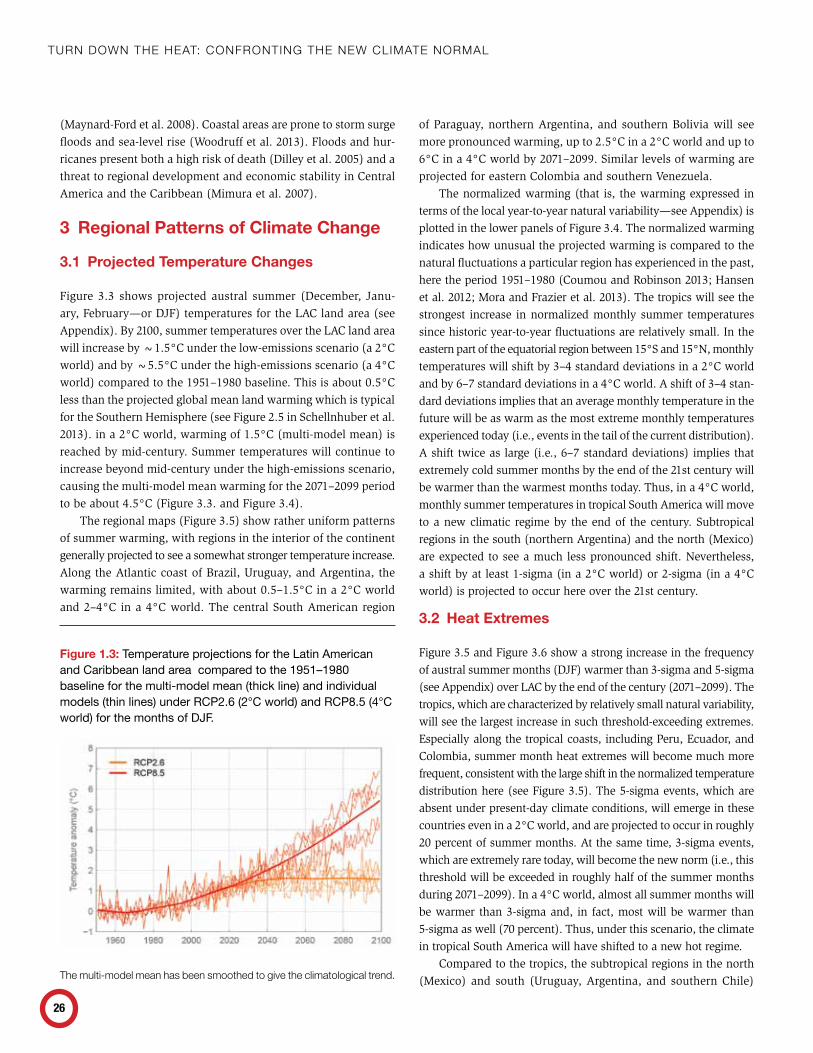
Turn Down The heaT: ConfronTing The new ClimaTe normal
26
(Maynard-Ford et al. 2008). Coastal areas are prone to storm surge floods and sea-level rise (Woodruff et al. 2013). Floods and hur-ricanes present both a high risk of death (Dilley et al. 2005) and a threat to regional development and economic stability in Central America and the Caribbean (Mimura et al. 2007).
3 Regional Patterns of Climate Change
3.1 Projected Temperature Changes
Figure 3.3 shows projected austral summer (December, Janu-ary, February—or DJF) temperatures for the LAC land area (see Appendix). By 2100, summer temperatures over the LAC land area will increase by ~1.5°C under the low-emissions scenario (a 2°C world) and by ~5.5°C under the high-emissions scenario (a 4°C world) compared to the 1951–1980 baseline. This is about 0.5°C less than the projected global mean land warming which is typical for the Southern Hemisphere (see Figure 2.5 in Schellnhuber et al. 2013). in a 2°C world, warming of 1.5°C (multi-model mean) is reached by mid-century. Summer temperatures will continue to increase beyond mid-century under the high-emissions scenario, causing the multi-model mean warming for the 2071–2099 period to be about 4.5°C (Figure 3.3. and Figure 3.4).
The regional maps (Figure 3.5) show rather uniform patterns of summer warming, with regions in the interior of the continent generally projected to see a somewhat stronger temperature increase. Along the Atlantic coast of Brazil, Uruguay, and Argentina, the warming remains limited, with about 0.5–1.5°C in a 2°C world and 2–4°C in a 4°C world. The central South American region
of Paraguay, northern Argentina, and southern Bolivia will see more pronounced warming, up to 2.5°C in a 2°C world and up to 6°C in a 4°C world by 2071–2099. Similar levels of warming are projected for eastern Colombia and southern Venezuela.
The normalized warming (that is, the warming expressed in terms of the local year-to-year natural variability—see Appendix) is plotted in the lower panels of Figure 3.4. The normalized warming indicates how unusual the projected warming is compared to the natural fluctuations a particular region has experienced in the past, here the period 1951–1980 (Coumou and Robinson 2013; Hansen et al. 2012; Mora and Frazier et al. 2013). The tropics will see the strongest increase in normalized monthly summer temperatures since historic year-to-year fluctuations are relatively small. In the eastern part of the equatorial region between 15°S and 15°N, monthly temperatures will shift by 3–4 standard deviations in a 2°C world and by 6–7 standard deviations in a 4°C world. A shift of 3–4 stan-dard deviations implies that an average monthly temperature in the future will be as warm as the most extreme monthly temperatures experienced today (i.e., events in the tail of the current distribution). A shift twice as large (i.e., 6–7 standard deviations) implies that extremely cold summer months by the end of the 21st century will be warmer than the warmest months today. Thus, in a 4°C world, monthly summer temperatures in tropical South America will move to a new climatic regime by the end of the century. Subtropical regions in the south (northern Argentina) and the north (Mexico) are expected to see a much less pronounced shift. Nevertheless, a shift by at least 1-sigma (in a 2°C world) or 2-sigma (in a 4°C world) is projected to occur here over the 21st century.
3.2 Heat Extremes
Figure 3.5 and Figure 3.6 show a strong increase in the frequency of austral summer months (DJF) warmer than 3-sigma and 5-sigma (see Appendix) over LAC by the end of the century (2071–2099). The tropics, which are characterized by relatively small natural variability, will see the largest increase in such threshold-exceeding extremes. Especially along the tropical coasts, including Peru, Ecuador, and Colombia, summer month heat extremes will become much more frequent, consistent with the large shift in the normalized temperature distribution here (see Figure 3.5). The 5-sigma events, which are absent under present-day climate conditions, will emerge in these countries even in a 2°C world, and are projected to occur in roughly 20 percent of summer months. At the same time, 3-sigma events, which are extremely rare today, will become the new norm (i.e., this threshold will be exceeded in roughly half of the summer months during 2071–2099). In a 4°C world, almost all summer months will be warmer than 3-sigma and, in fact, most will be warmer than 5-sigma as well (70 percent). Thus, under this scenario, the climate in tropical South America will have shifted to a new hot regime.
Compared to the tropics, the subtropical regions in the north (Mexico) and south (Uruguay, Argentina, and southern Chile)
Figure 1.3: Temperature projections for the Latin American and Caribbean land area compared to the 1951–1980 baseline for the multi-model mean (thick line) and individual models (thin lines) under RCP2.6 (2°C world) and RCP8.5 (4°C world) for the months of DJF.
the multi-model mean has been smoothed to give the climatological trend.
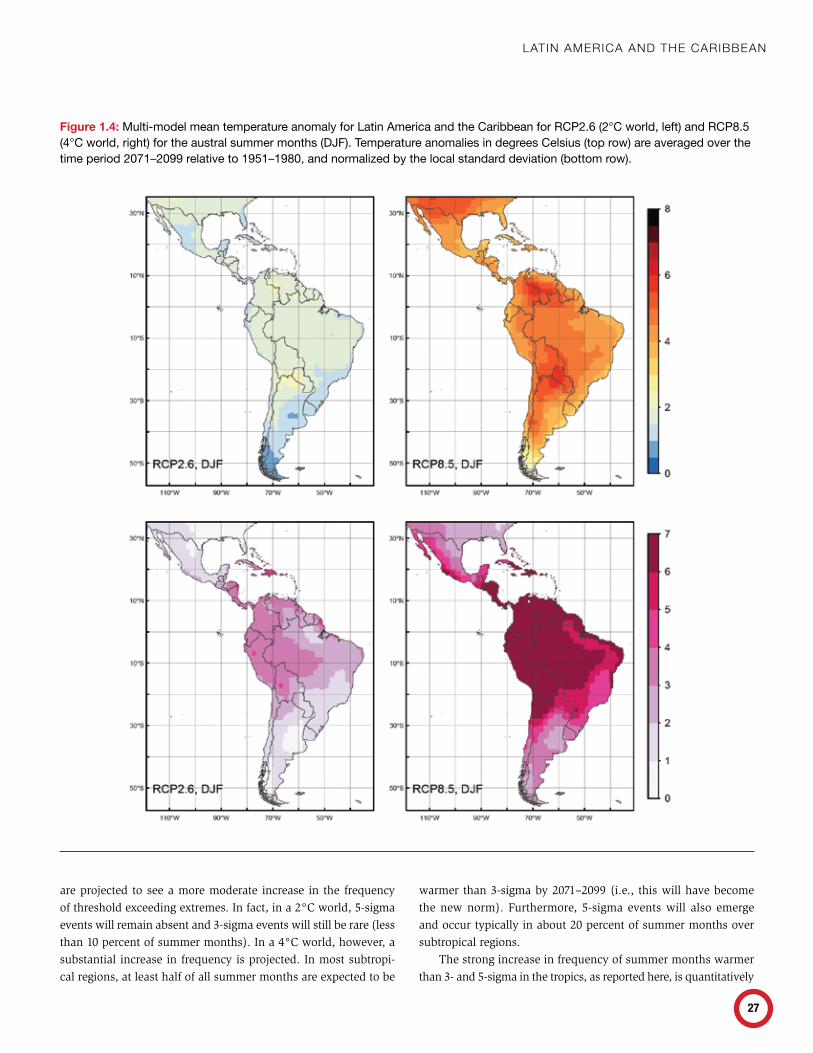
lAtin AmeriCA And the CAribbeAn
27
Figure 1.4: Multi-model mean temperature anomaly for Latin America and the Caribbean for RCP2.6 (2°C world, left) and RCP8.5 (4°C world, right) for the austral summer months (DJF). Temperature anomalies in degrees Celsius (top row) are averaged over the time period 2071–2099 relative to 1951–1980, and normalized by the local standard deviation (bottom row).
are projected to see a more moderate increase in the frequency of threshold exceeding extremes. In fact, in a 2°C world, 5-sigma events will remain absent and 3-sigma events will still be rare (less than 10 percent of summer months). In a 4°C world, however, a substantial increase in frequency is projected. In most subtropi-cal regions, at least half of all summer months are expected to be
warmer than 3-sigma by 2071–2099 (i.e., this will have become the new norm). Furthermore, 5-sigma events will also emerge and occur typically in about 20 percent of summer months over subtropical regions.
The strong increase in frequency of summer months warmer than 3- and 5-sigma in the tropics, as reported here, is quantitatively
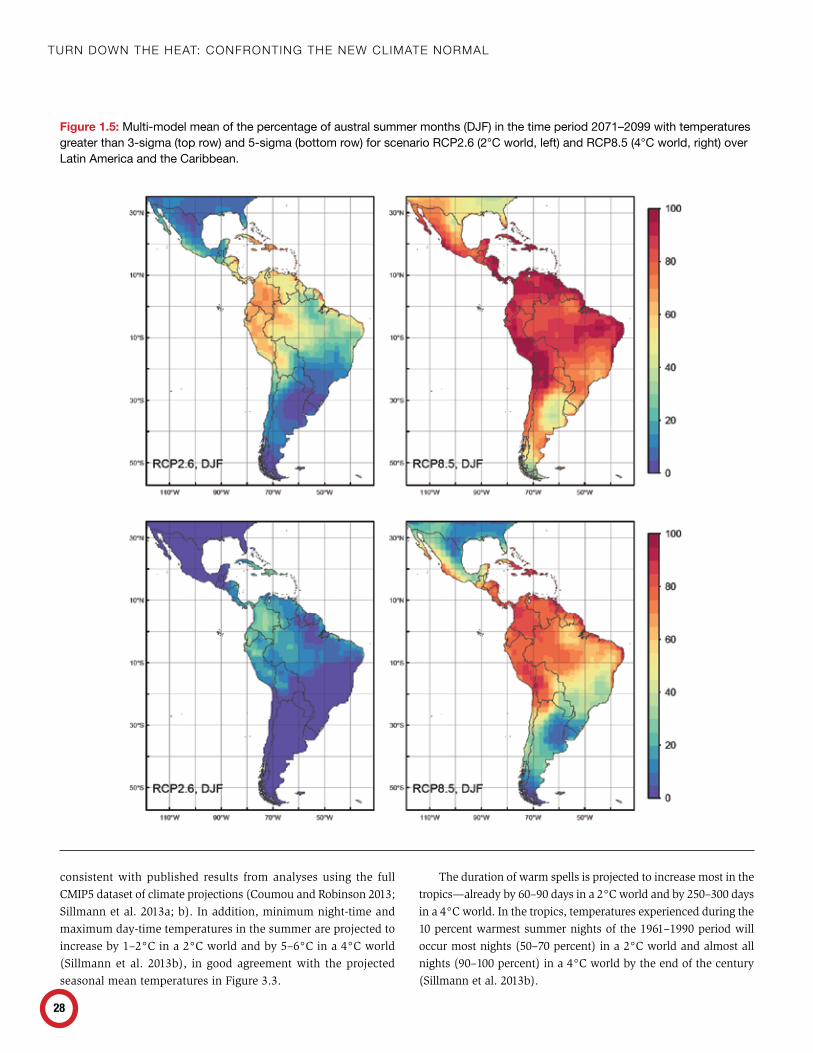
Turn Down The heaT: ConfronTing The new ClimaTe normal
28
Figure 1.5: Multi-model mean of the percentage of austral summer months (DJF) in the time period 2071–2099 with temperatures greater than 3-sigma (top row) and 5-sigma (bottom row) for scenario RCP2.6 (2°C world, left) and RCP8.5 (4°C world, right) over Latin America and the Caribbean.
consistent with published results from analyses using the full CMIP5 dataset of climate projections (Coumou and Robinson 2013; Sillmann et al. 2013a; b). In addition, minimum night-time and maximum day-time temperatures in the summer are projected to increase by 1–2°C in a 2°C world and by 5–6°C in a 4°C world (Sillmann et al. 2013b), in good agreement with the projected seasonal mean temperatures in Figure 3.3.
The duration of warm spells is projected to increase most in the tropics—already by 60–90 days in a 2°C world and by 250–300 days in a 4°C world. In the tropics, temperatures experienced during the 10 percent warmest summer nights of the 1961–1990 period will occur most nights (50–70 percent) in a 2°C world and almost all nights (90–100 percent) in a 4°C world by the end of the century (Sillmann et al. 2013b).
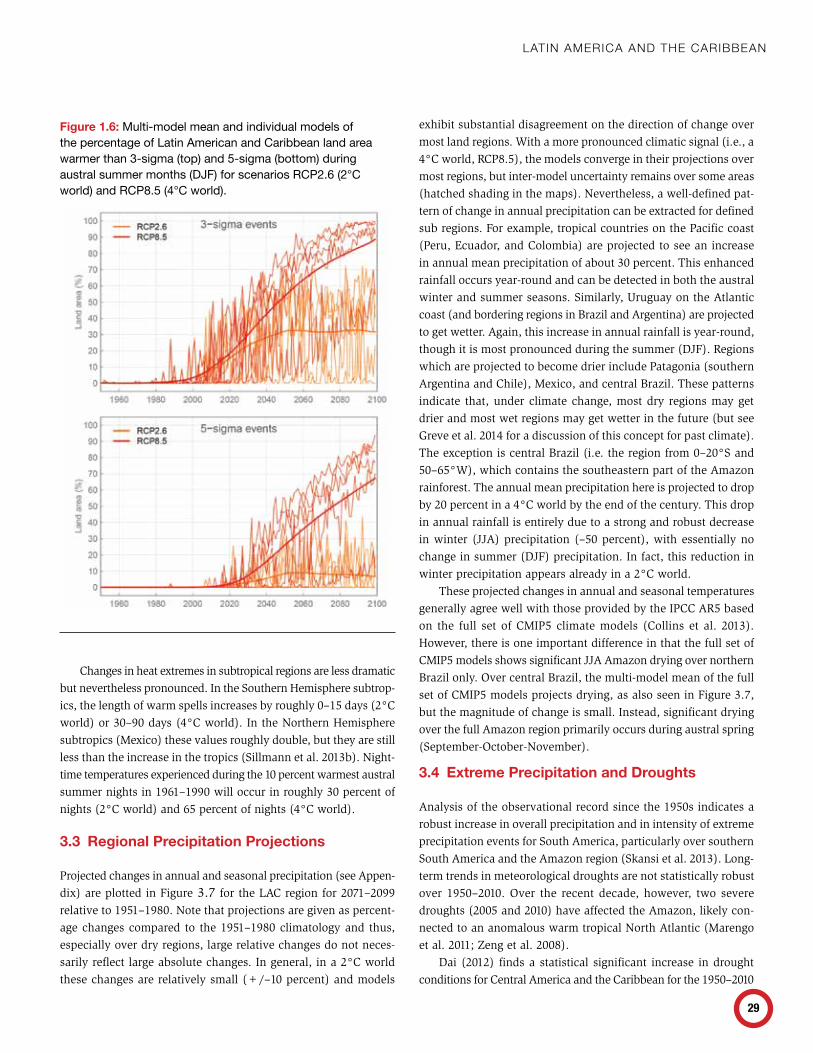
lAtin AmeriCA And the CAribbeAn
29
Figure 1.6: Multi-model mean and individual models of the percentage of Latin American and Caribbean land area warmer than 3-sigma (top) and 5-sigma (bottom) during austral summer months (DJF) for scenarios RCP2.6 (2°C world) and RCP8.5 (4°C world).
Changes in heat extremes in subtropical regions are less dramatic but nevertheless pronounced. In the Southern Hemisphere subtrop-ics, the length of warm spells increases by roughly 0–15 days (2°C world) or 30–90 days (4°C world). In the Northern Hemisphere subtropics (Mexico) these values roughly double, but they are still less than the increase in the tropics (Sillmann et al. 2013b). Night-time temperatures experienced during the 10 percent warmest austral summer nights in 1961–1990 will occur in roughly 30 percent of nights (2°C world) and 65 percent of nights (4°C world).
3.3 Regional Precipitation Projections
Projected changes in annual and seasonal precipitation (see Appen-dix) are plotted in Figure 3.7 for the LAC region for 2071–2099 relative to 1951–1980. Note that projections are given as percent-age changes compared to the 1951–1980 climatology and thus, especially over dry regions, large relative changes do not neces-sarily reflect large absolute changes. In general, in a 2°C world these changes are relatively small (+/–10 percent) and models
exhibit substantial disagreement on the direction of change over most land regions. With a more pronounced climatic signal (i.e., a 4°C world, RCP8.5), the models converge in their projections over most regions, but inter-model uncertainty remains over some areas (hatched shading in the maps). Nevertheless, a well-defined pat-tern of change in annual precipitation can be extracted for defined sub regions. For example, tropical countries on the Pacific coast (Peru, Ecuador, and Colombia) are projected to see an increase in annual mean precipitation of about 30 percent. This enhanced rainfall occurs year-round and can be detected in both the austral winter and summer seasons. Similarly, Uruguay on the Atlantic coast (and bordering regions in Brazil and Argentina) are projected to get wetter. Again, this increase in annual rainfall is year-round, though it is most pronounced during the summer (DJF). Regions which are projected to become drier include Patagonia (southern Argentina and Chile), Mexico, and central Brazil. These patterns indicate that, under climate change, most dry regions may get drier and most wet regions may get wetter in the future (but see Greve et al. 2014 for a discussion of this concept for past climate). The exception is central Brazil (i.e. the region from 0–20°S and 50–65°W), which contains the southeastern part of the Amazon rainforest. The annual mean precipitation here is projected to drop by 20 percent in a 4°C world by the end of the century. This drop in annual rainfall is entirely due to a strong and robust decrease in winter (JJA) precipitation (–50 percent), with essentially no change in summer (DJF) precipitation. In fact, this reduction in winter precipitation appears already in a 2°C world.
These projected changes in annual and seasonal temperatures generally agree well with those provided by the IPCC AR5 based on the full set of CMIP5 climate models (Collins et al. 2013). However, there is one important difference in that the full set of CMIP5 models shows significant JJA Amazon drying over northern Brazil only. Over central Brazil, the multi-model mean of the full set of CMIP5 models projects drying, as also seen in Figure 3.7, but the magnitude of change is small. Instead, significant drying over the full Amazon region primarily occurs during austral spring (September-October-November).
3.4 Extreme Precipitation and Droughts
Analysis of the observational record since the 1950s indicates a robust increase in overall precipitation and in intensity of extreme precipitation events for South America, particularly over southern South America and the Amazon region (Skansi et al. 2013). Long-term trends in meteorological droughts are not statistically robust over 1950–2010. Over the recent decade, however, two severe droughts (2005 and 2010) have affected the Amazon, likely con-nected to an anomalous warm tropical North Atlantic (Marengo et al. 2011; Zeng et al. 2008).
Dai (2012) finds a statistical significant increase in drought conditions for Central America and the Caribbean for the 1950–2010
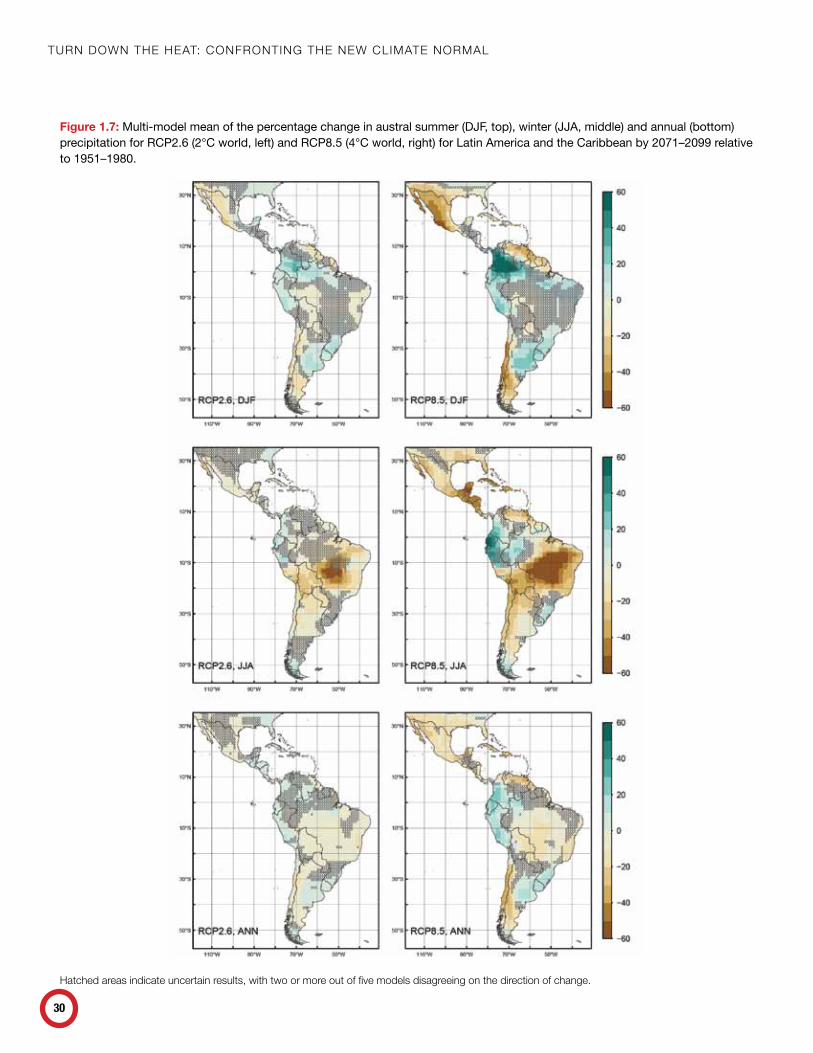
Turn Down The heaT: ConfronTing The new ClimaTe normal
30
Figure 1.7: Multi-model mean of the percentage change in austral summer (DJF, top), winter (JJA, middle) and annual (bottom) precipitation for RCP2.6 (2°C world, left) and RCP8.5 (4°C world, right) for Latin America and the Caribbean by 2071–2099 relative to 1951–1980.
hatched areas indicate uncertain results, with two or more out of five models disagreeing on the direction of change.
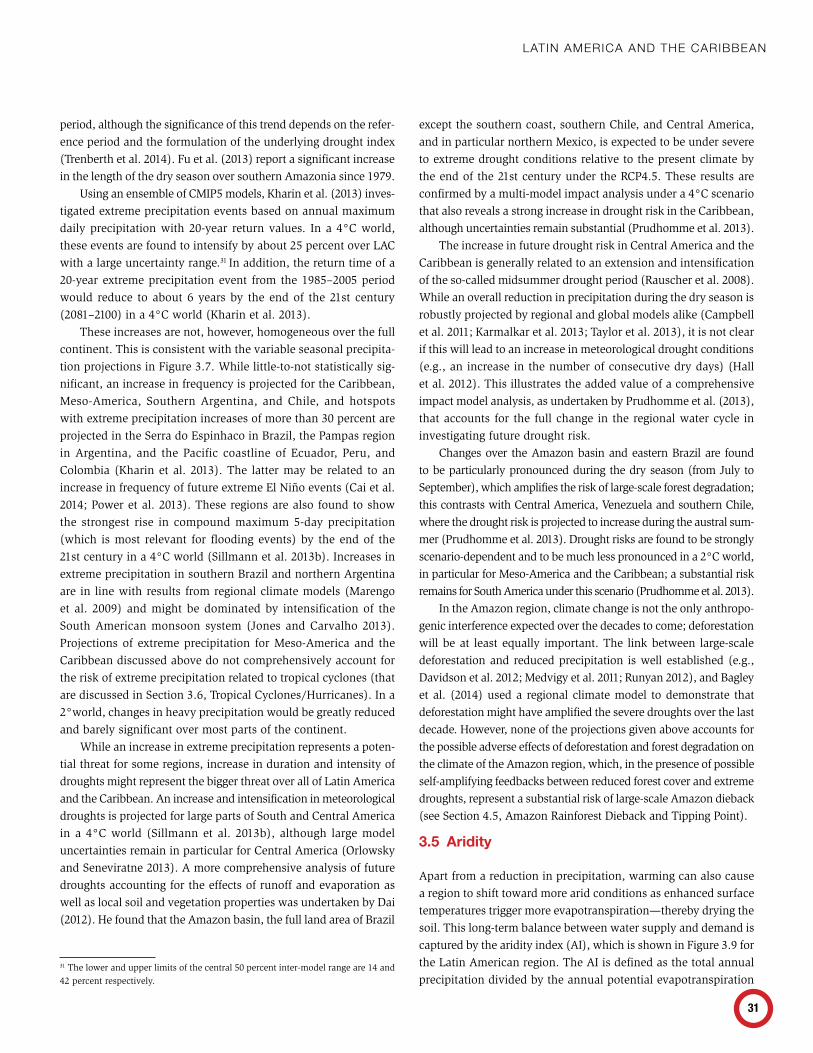
lAtin AmeriCA And the CAribbeAn
31
period, although the significance of this trend depends on the refer-ence period and the formulation of the underlying drought index (Trenberth et al. 2014). Fu et al. (2013) report a significant increase in the length of the dry season over southern Amazonia since 1979.
Using an ensemble of CMIP5 models, Kharin et al. (2013) inves-tigated extreme precipitation events based on annual maximum daily precipitation with 20-year return values. In a 4°C world, these events are found to intensify by about 25 percent over LAC with a large uncertainty range.31 In addition, the return time of a 20-year extreme precipitation event from the 1985–2005 period would reduce to about 6 years by the end of the 21st century (2081–2100) in a 4°C world (Kharin et al. 2013).
These increases are not, however, homogeneous over the full continent. This is consistent with the variable seasonal precipita-tion projections in Figure 3.7. While little-to-not statistically sig-nificant, an increase in frequency is projected for the Caribbean, Meso-America, Southern Argentina, and Chile, and hotspots with extreme precipitation increases of more than 30 percent are projected in the Serra do Espinhaco in Brazil, the Pampas region in Argentina, and the Pacific coastline of Ecuador, Peru, and Colombia (Kharin et al. 2013). The latter may be related to an increase in frequency of future extreme El Niño events (Cai et al. 2014; Power et al. 2013). These regions are also found to show the strongest rise in compound maximum 5-day precipitation (which is most relevant for flooding events) by the end of the 21st century in a 4°C world (Sillmann et al. 2013b). Increases in extreme precipitation in southern Brazil and northern Argentina are in line with results from regional climate models (Marengo et al. 2009) and might be dominated by intensification of the South American monsoon system (Jones and Carvalho 2013). Projections of extreme precipitation for Meso-America and the Caribbean discussed above do not comprehensively account for the risk of extreme precipitation related to tropical cyclones (that are discussed in Section 3.6, Tropical Cyclones/Hurricanes). In a 2°world, changes in heavy precipitation would be greatly reduced and barely significant over most parts of the continent.
While an increase in extreme precipitation represents a poten-tial threat for some regions, increase in duration and intensity of droughts might represent the bigger threat over all of Latin America and the Caribbean. An increase and intensification in meteorological droughts is projected for large parts of South and Central America in a 4°C world (Sillmann et al. 2013b), although large model uncertainties remain in particular for Central America (Orlowsky and Seneviratne 2013). A more comprehensive analysis of future droughts accounting for the effects of runoff and evaporation as well as local soil and vegetation properties was undertaken by Dai (2012). He found that the Amazon basin, the full land area of Brazil
31 The lower and upper limits of the central 50 percent inter-model range are 14 and 42 percent respectively.
except the southern coast, southern Chile, and Central America, and in particular northern Mexico, is expected to be under severe to extreme drought conditions relative to the present climate by the end of the 21st century under the RCP4.5. These results are confirmed by a multi-model impact analysis under a 4°C scenario that also reveals a strong increase in drought risk in the Caribbean, although uncertainties remain substantial (Prudhomme et al. 2013).
The increase in future drought risk in Central America and the Caribbean is generally related to an extension and intensification of the so-called midsummer drought period (Rauscher et al. 2008). While an overall reduction in precipitation during the dry season is robustly projected by regional and global models alike (Campbell et al. 2011; Karmalkar et al. 2013; Taylor et al. 2013), it is not clear if this will lead to an increase in meteorological drought conditions (e.g., an increase in the number of consecutive dry days) (Hall et al. 2012). This illustrates the added value of a comprehensive impact model analysis, as undertaken by Prudhomme et al. (2013), that accounts for the full change in the regional water cycle in investigating future drought risk.
Changes over the Amazon basin and eastern Brazil are found to be particularly pronounced during the dry season (from July to September), which amplifies the risk of large-scale forest degradation; this contrasts with Central America, Venezuela and southern Chile, where the drought risk is projected to increase during the austral sum-mer (Prudhomme et al. 2013). Drought risks are found to be strongly scenario-dependent and to be much less pronounced in a 2°C world, in particular for Meso-America and the Caribbean; a substantial risk remains for South America under this scenario (Prudhomme et al. 2013).
In the Amazon region, climate change is not the only anthropo-genic interference expected over the decades to come; deforestation will be at least equally important. The link between large-scale deforestation and reduced precipitation is well established (e.g., Davidson et al. 2012; Medvigy et al. 2011; Runyan 2012), and Bagley et al. (2014) used a regional climate model to demonstrate that deforestation might have amplified the severe droughts over the last decade. However, none of the projections given above accounts for the possible adverse effects of deforestation and forest degradation on the climate of the Amazon region, which, in the presence of possible self-amplifying feedbacks between reduced forest cover and extreme droughts, represent a substantial risk of large-scale Amazon dieback (see Section 4.5, Amazon Rainforest Dieback and Tipping Point).
3.5 Aridity
Apart from a reduction in precipitation, warming can also cause a region to shift toward more arid conditions as enhanced surface temperatures trigger more evapotranspiration—thereby drying the soil. This long-term balance between water supply and demand is captured by the aridity index (AI), which is shown in Figure 3.9 for the Latin American region. The AI is defined as the total annual precipitation divided by the annual potential evapotranspiration
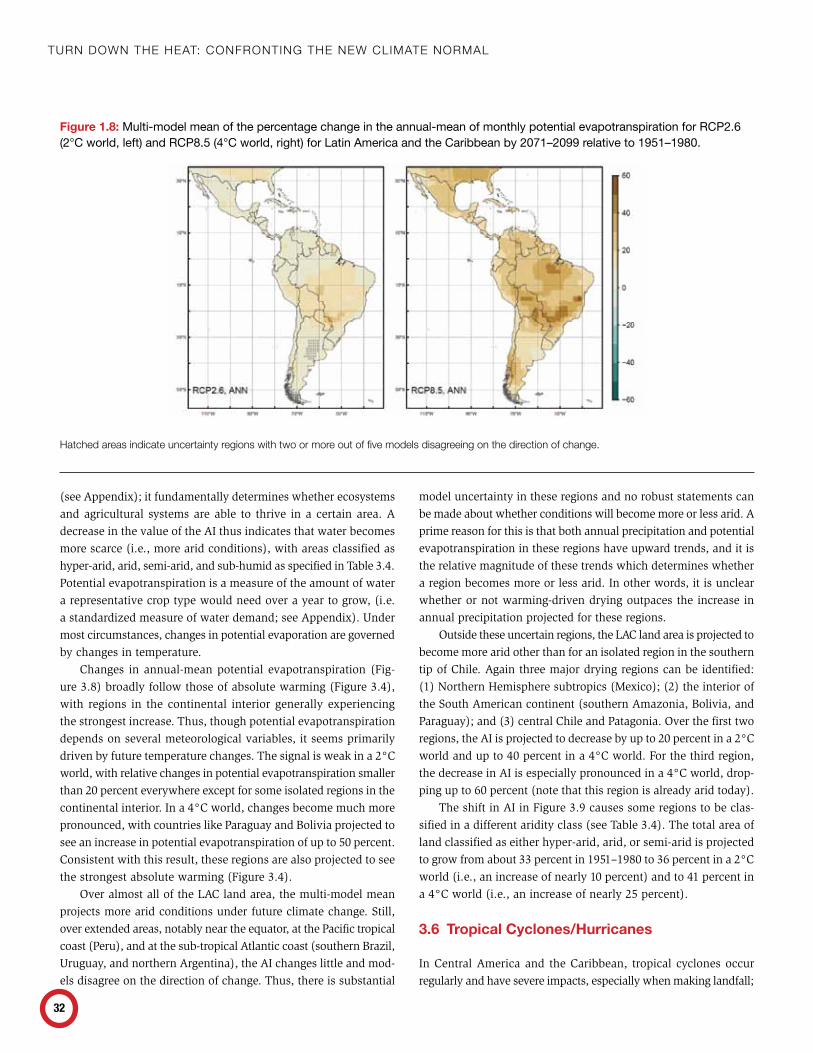
Turn Down The heaT: ConfronTing The new ClimaTe normal
32
(see Appendix); it fundamentally determines whether ecosystems and agricultural systems are able to thrive in a certain area. A decrease in the value of the AI thus indicates that water becomes more scarce (i.e., more arid conditions), with areas classified as hyper-arid, arid, semi-arid, and sub-humid as specified in Table 3.4. Potential evapotranspiration is a measure of the amount of water a representative crop type would need over a year to grow, (i.e. a standardized measure of water demand; see Appendix). Under most circumstances, changes in potential evaporation are governed by changes in temperature.
Changes in annual-mean potential evapotranspiration (Fig-ure 3.8) broadly follow those of absolute warming (Figure 3.4), with regions in the continental interior generally experiencing the strongest increase. Thus, though potential evapotranspiration depends on several meteorological variables, it seems primarily driven by future temperature changes. The signal is weak in a 2°C world, with relative changes in potential evapotranspiration smaller than 20 percent everywhere except for some isolated regions in the continental interior. In a 4°C world, changes become much more pronounced, with countries like Paraguay and Bolivia projected to see an increase in potential evapotranspiration of up to 50 percent. Consistent with this result, these regions are also projected to see the strongest absolute warming (Figure 3.4).
Over almost all of the LAC land area, the multi-model mean projects more arid conditions under future climate change. Still, over extended areas, notably near the equator, at the Pacific tropical coast (Peru), and at the sub-tropical Atlantic coast (southern Brazil, Uruguay, and northern Argentina), the AI changes little and mod-els disagree on the direction of change. Thus, there is substantial
model uncertainty in these regions and no robust statements can be made about whether conditions will become more or less arid. A prime reason for this is that both annual precipitation and potential evapotranspiration in these regions have upward trends, and it is the relative magnitude of these trends which determines whether a region becomes more or less arid. In other words, it is unclear whether or not warming-driven drying outpaces the increase in annual precipitation projected for these regions.
Outside these uncertain regions, the LAC land area is projected to become more arid other than for an isolated region in the southern tip of Chile. Again three major drying regions can be identified: (1) Northern Hemisphere subtropics (Mexico); (2) the interior of the South American continent (southern Amazonia, Bolivia, and Paraguay); and (3) central Chile and Patagonia. Over the first two regions, the AI is projected to decrease by up to 20 percent in a 2°C world and up to 40 percent in a 4°C world. For the third region, the decrease in AI is especially pronounced in a 4°C world, drop-ping up to 60 percent (note that this region is already arid today).
The shift in AI in Figure 3.9 causes some regions to be clas-sified in a different aridity class (see Table 3.4). The total area of land classified as either hyper-arid, arid, or semi-arid is projected to grow from about 33 percent in 1951–1980 to 36 percent in a 2°C world (i.e., an increase of nearly 10 percent) and to 41 percent in a 4°C world (i.e., an increase of nearly 25 percent).
3.6 Tropical Cyclones/Hurricanes
In Central America and the Caribbean, tropical cyclones occur regularly and have severe impacts, especially when making landfall;
Figure 1.8: Multi-model mean of the percentage change in the annual-mean of monthly potential evapotranspiration for RCP2.6 (2°C world, left) and RCP8.5 (4°C world, right) for Latin America and the Caribbean by 2071–2099 relative to 1951–1980.
hatched areas indicate uncertainty regions with two or more out of five models disagreeing on the direction of change.
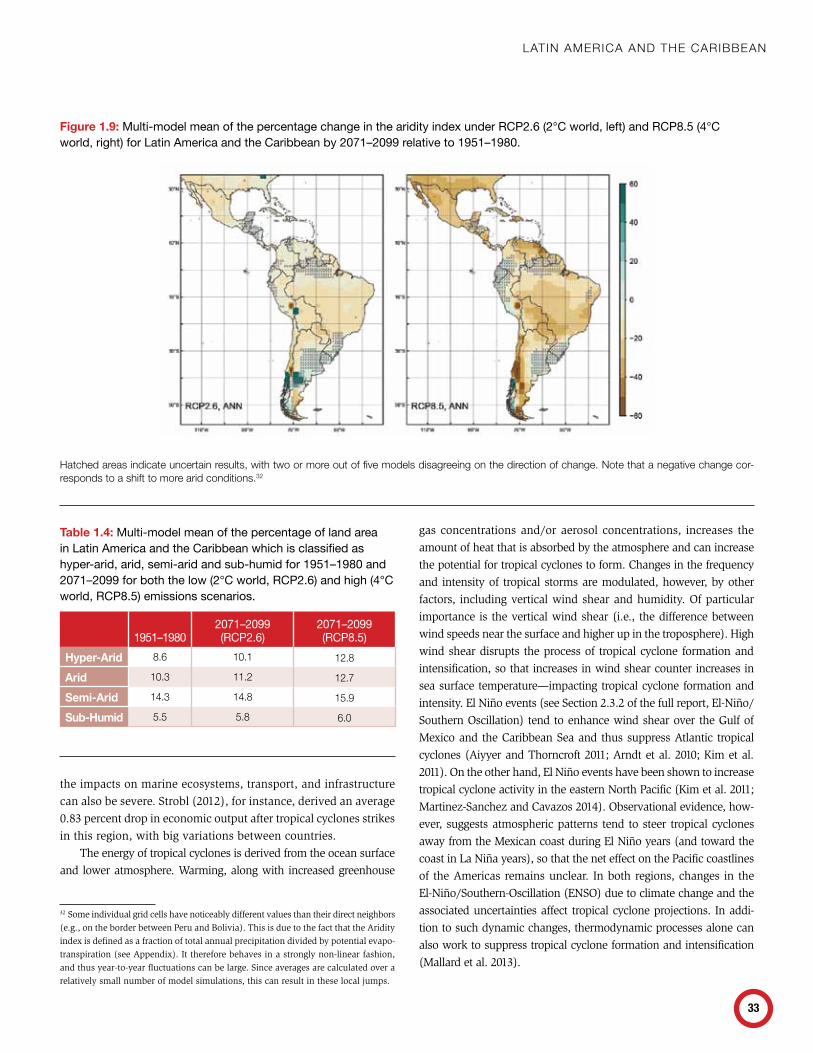
lAtin AmeriCA And the CAribbeAn
33
the impacts on marine ecosystems, transport, and infrastructure can also be severe. Strobl (2012), for instance, derived an average 0.83 percent drop in economic output after tropical cyclones strikes in this region, with big variations between countries.32
The energy of tropical cyclones is derived from the ocean surface and lower atmosphere. Warming, along with increased greenhouse
32 Some individual grid cells have noticeably different values than their direct neighbors (e.g., on the border between Peru and Bolivia). This is due to the fact that the Aridity index is defined as a fraction of total annual precipitation divided by potential evapo-transpiration (see Appendix). It therefore behaves in a strongly non-linear fashion, and thus year-to-year fluctuations can be large. Since averages are calculated over a relatively small number of model simulations, this can result in these local jumps.
gas concentrations and/or aerosol concentrations, increases the amount of heat that is absorbed by the atmosphere and can increase the potential for tropical cyclones to form. Changes in the frequency and intensity of tropical storms are modulated, however, by other factors, including vertical wind shear and humidity. Of particular importance is the vertical wind shear (i.e., the difference between wind speeds near the surface and higher up in the troposphere). High wind shear disrupts the process of tropical cyclone formation and intensification, so that increases in wind shear counter increases in sea surface temperature—impacting tropical cyclone formation and intensity. El Niño events (see Section 2.3.2 of the full report, El-Niño/Southern Oscillation) tend to enhance wind shear over the Gulf of Mexico and the Caribbean Sea and thus suppress Atlantic tropical cyclones (Aiyyer and Thorncroft 2011; Arndt et al. 2010; Kim et al. 2011). On the other hand, El Niño events have been shown to increase tropical cyclone activity in the eastern North Pacific (Kim et al. 2011; Martinez-Sanchez and Cavazos 2014). Observational evidence, how-ever, suggests atmospheric patterns tend to steer tropical cyclones away from the Mexican coast during El Niño years (and toward the coast in La Niña years), so that the net effect on the Pacific coastlines of the Americas remains unclear. In both regions, changes in the El-Niño/Southern-Oscillation (ENSO) due to climate change and the associated uncertainties affect tropical cyclone projections. In addi-tion to such dynamic changes, thermodynamic processes alone can also work to suppress tropical cyclone formation and intensification (Mallard et al. 2013).
Figure 1.9: Multi-model mean of the percentage change in the aridity index under RCP2.6 (2°C world, left) and RCP8.5 (4°C world, right) for Latin America and the Caribbean by 2071–2099 relative to 1951–1980.
hatched areas indicate uncertain results, with two or more out of five models disagreeing on the direction of change. note that a negative change cor-responds to a shift to more arid conditions.32
Table 1.4: Multi-model mean of the percentage of land area in Latin America and the Caribbean which is classified as hyper-arid, arid, semi-arid and sub-humid for 1951–1980 and 2071–2099 for both the low (2°C world, RCP2.6) and high (4°C world, RCP8.5) emissions scenarios.
1951–19802071–2099 (RCP2.6)
2071–2099 (RCP8.5)
Hyper-Arid 8.6 10.1 12.8
Arid 10.3 11.2 12.7
Semi-Arid 14.3 14.8 15.9
Sub-Humid 5.5 5.8 6.0
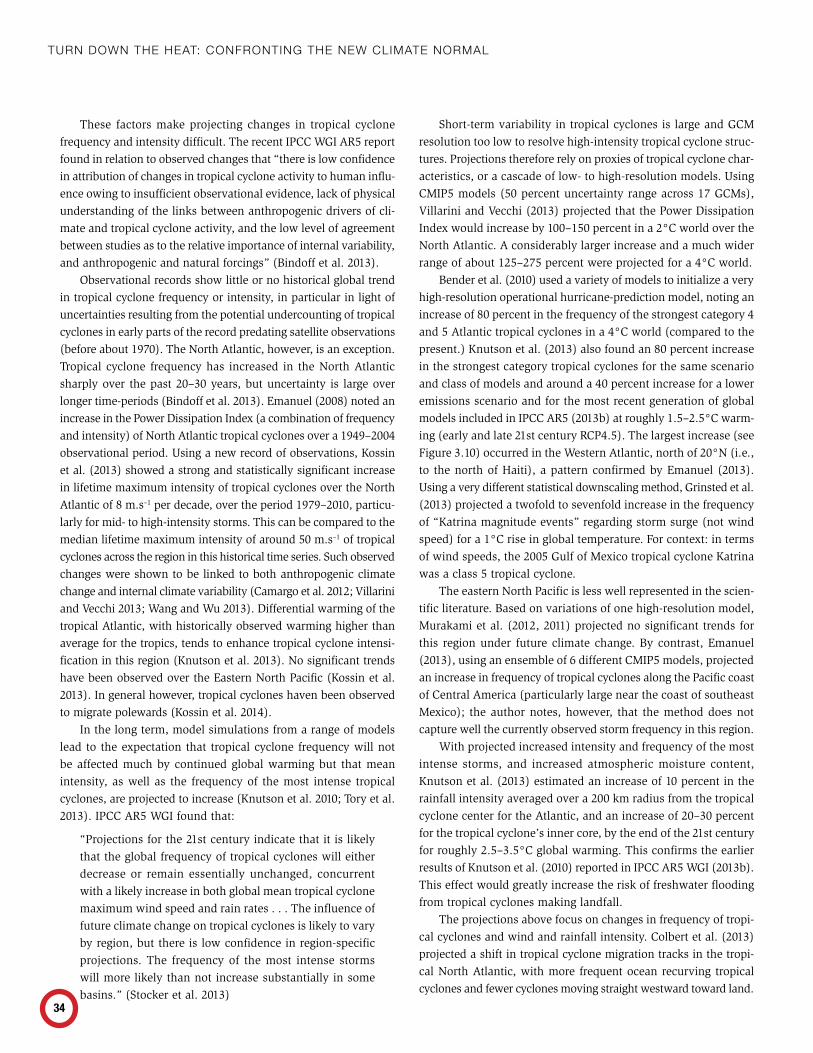
Turn Down The heaT: ConfronTing The new ClimaTe normal
34
These factors make projecting changes in tropical cyclone frequency and intensity difficult. The recent IPCC WGI AR5 report found in relation to observed changes that “there is low confidence in attribution of changes in tropical cyclone activity to human influ-ence owing to insufficient observational evidence, lack of physical understanding of the links between anthropogenic drivers of cli-mate and tropical cyclone activity, and the low level of agreement between studies as to the relative importance of internal variability, and anthropogenic and natural forcings” (Bindoff et al. 2013).
Observational records show little or no historical global trend in tropical cyclone frequency or intensity, in particular in light of uncertainties resulting from the potential undercounting of tropical cyclones in early parts of the record predating satellite observations (before about 1970). The North Atlantic, however, is an exception. Tropical cyclone frequency has increased in the North Atlantic sharply over the past 20–30 years, but uncertainty is large over longer time-periods (Bindoff et al. 2013). Emanuel (2008) noted an increase in the Power Dissipation Index (a combination of frequency and intensity) of North Atlantic tropical cyclones over a 1949–2004 observational period. Using a new record of observations, Kossin et al. (2013) showed a strong and statistically significant increase in lifetime maximum intensity of tropical cyclones over the North Atlantic of 8 m.s–1 per decade, over the period 1979–2010, particu-larly for mid- to high-intensity storms. This can be compared to the median lifetime maximum intensity of around 50 m.s–1 of tropical cyclones across the region in this historical time series. Such observed changes were shown to be linked to both anthropogenic climate change and internal climate variability (Camargo et al. 2012; Villarini and Vecchi 2013; Wang and Wu 2013). Differential warming of the tropical Atlantic, with historically observed warming higher than average for the tropics, tends to enhance tropical cyclone intensi-fication in this region (Knutson et al. 2013). No significant trends have been observed over the Eastern North Pacific (Kossin et al. 2013). In general however, tropical cyclones haven been observed to migrate polewards (Kossin et al. 2014).
In the long term, model simulations from a range of models lead to the expectation that tropical cyclone frequency will not be affected much by continued global warming but that mean intensity, as well as the frequency of the most intense tropical cyclones, are projected to increase (Knutson et al. 2010; Tory et al. 2013). IPCC AR5 WGI found that:
“Projections for the 21st century indicate that it is likely that the global frequency of tropical cyclones will either decrease or remain essentially unchanged, concurrent with a likely increase in both global mean tropical cyclone maximum wind speed and rain rates . . . The influence of future climate change on tropical cyclones is likely to vary by region, but there is low confidence in region-specific projections. The frequency of the most intense storms will more likely than not increase substantially in some basins.” (Stocker et al. 2013)
Short-term variability in tropical cyclones is large and GCM resolution too low to resolve high-intensity tropical cyclone struc-tures. Projections therefore rely on proxies of tropical cyclone char-acteristics, or a cascade of low- to high-resolution models. Using CMIP5 models (50 percent uncertainty range across 17 GCMs), Villarini and Vecchi (2013) projected that the Power Dissipation Index would increase by 100–150 percent in a 2°C world over the North Atlantic. A considerably larger increase and a much wider range of about 125–275 percent were projected for a 4°C world.
Bender et al. (2010) used a variety of models to initialize a very high-resolution operational hurricane-prediction model, noting an increase of 80 percent in the frequency of the strongest category 4 and 5 Atlantic tropical cyclones in a 4°C world (compared to the present.) Knutson et al. (2013) also found an 80 percent increase in the strongest category tropical cyclones for the same scenario and class of models and around a 40 percent increase for a lower emissions scenario and for the most recent generation of global models included in IPCC AR5 (2013b) at roughly 1.5–2.5°C warm-ing (early and late 21st century RCP4.5). The largest increase (see Figure 3.10) occurred in the Western Atlantic, north of 20°N (i.e., to the north of Haiti), a pattern confirmed by Emanuel (2013). Using a very different statistical downscaling method, Grinsted et al. (2013) projected a twofold to sevenfold increase in the frequency of “Katrina magnitude events” regarding storm surge (not wind speed) for a 1°C rise in global temperature. For context: in terms of wind speeds, the 2005 Gulf of Mexico tropical cyclone Katrina was a class 5 tropical cyclone.
The eastern North Pacific is less well represented in the scien-tific literature. Based on variations of one high-resolution model, Murakami et al. (2012, 2011) projected no significant trends for this region under future climate change. By contrast, Emanuel (2013), using an ensemble of 6 different CMIP5 models, projected an increase in frequency of tropical cyclones along the Pacific coast of Central America (particularly large near the coast of southeast Mexico); the author notes, however, that the method does not capture well the currently observed storm frequency in this region.
With projected increased intensity and frequency of the most intense storms, and increased atmospheric moisture content, Knutson et al. (2013) estimated an increase of 10 percent in the rainfall intensity averaged over a 200 km radius from the tropical cyclone center for the Atlantic, and an increase of 20–30 percent for the tropical cyclone’s inner core, by the end of the 21st century for roughly 2.5–3.5°C global warming. This confirms the earlier results of Knutson et al. (2010) reported in IPCC AR5 WGI (2013b). This effect would greatly increase the risk of freshwater flooding from tropical cyclones making landfall.
The projections above focus on changes in frequency of tropi-cal cyclones and wind and rainfall intensity. Colbert et al. (2013) projected a shift in tropical cyclone migration tracks in the tropi-cal North Atlantic, with more frequent ocean recurving tropical cyclones and fewer cyclones moving straight westward toward land.
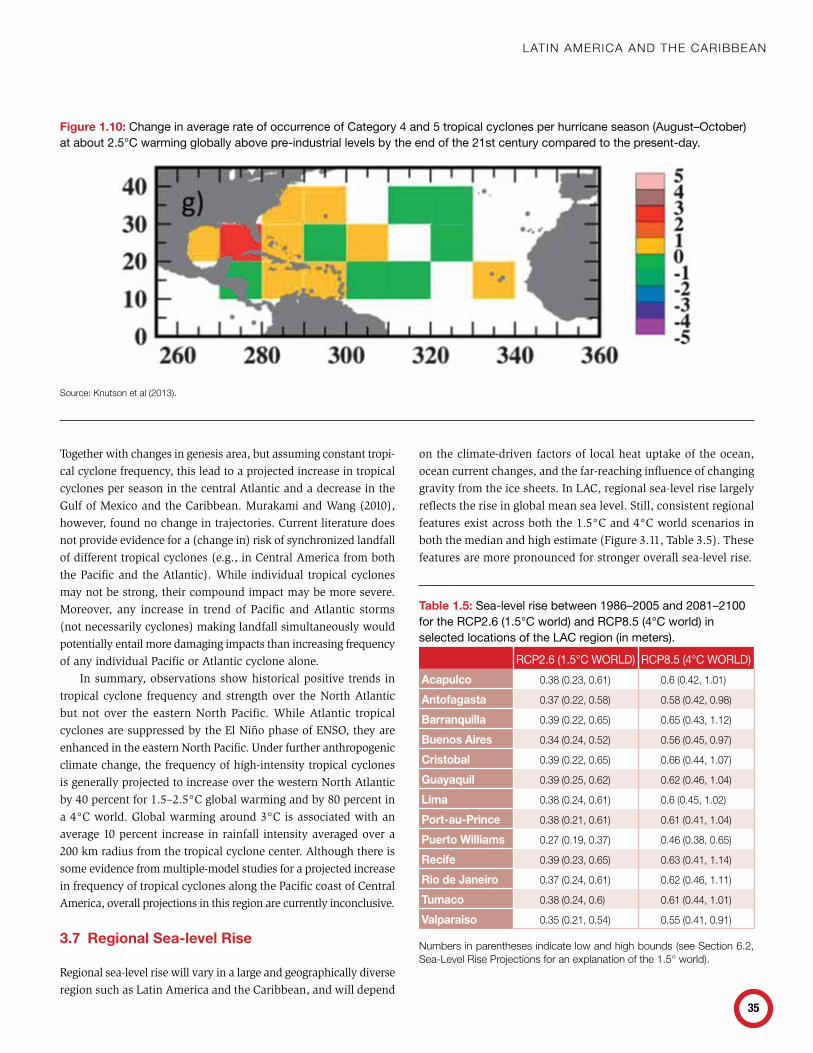
lAtin AmeriCA And the CAribbeAn
35
Figure 1.10: Change in average rate of occurrence of Category 4 and 5 tropical cyclones per hurricane season (August–October) at about 2.5°C warming globally above pre-industrial levels by the end of the 21st century compared to the present-day.
source: Knutson et al (2013).
Together with changes in genesis area, but assuming constant tropi-cal cyclone frequency, this lead to a projected increase in tropical cyclones per season in the central Atlantic and a decrease in the Gulf of Mexico and the Caribbean. Murakami and Wang (2010), however, found no change in trajectories. Current literature does not provide evidence for a (change in) risk of synchronized landfall of different tropical cyclones (e.g., in Central America from both the Pacific and the Atlantic). While individual tropical cyclones may not be strong, their compound impact may be more severe. Moreover, any increase in trend of Pacific and Atlantic storms (not necessarily cyclones) making landfall simultaneously would potentially entail more damaging impacts than increasing frequency of any individual Pacific or Atlantic cyclone alone.
In summary, observations show historical positive trends in tropical cyclone frequency and strength over the North Atlantic but not over the eastern North Pacific. While Atlantic tropical cyclones are suppressed by the El Niño phase of ENSO, they are enhanced in the eastern North Pacific. Under further anthropogenic climate change, the frequency of high-intensity tropical cyclones is generally projected to increase over the western North Atlantic by 40 percent for 1.5–2.5°C global warming and by 80 percent in a 4°C world. Global warming around 3°C is associated with an average 10 percent increase in rainfall intensity averaged over a 200 km radius from the tropical cyclone center. Although there is some evidence from multiple-model studies for a projected increase in frequency of tropical cyclones along the Pacific coast of Central America, overall projections in this region are currently inconclusive.
3.7 Regional Sea-level Rise
Regional sea-level rise will vary in a large and geographically diverse region such as Latin America and the Caribbean, and will depend
on the climate-driven factors of local heat uptake of the ocean, ocean current changes, and the far-reaching influence of changing gravity from the ice sheets. In LAC, regional sea-level rise largely reflects the rise in global mean sea level. Still, consistent regional features exist across both the 1.5°C and 4°C world scenarios in both the median and high estimate (Figure 3.11, Table 3.5). These features are more pronounced for stronger overall sea-level rise.
Table 1.5: Sea-level rise between 1986–2005 and 2081–2100 for the RCP2.6 (1.5°C world) and RCP8.5 (4°C world) in selected locations of the LAC region (in meters).
RCP2.6 (1.5°C WORLD) RCP8.5 (4°C WORLD)Acapulco 0.38 (0.23, 0.61) 0.6 (0.42, 1.01)
Antofagasta 0.37 (0.22, 0.58) 0.58 (0.42, 0.98)
Barranquilla 0.39 (0.22, 0.65) 0.65 (0.43, 1.12)
Buenos Aires 0.34 (0.24, 0.52) 0.56 (0.45, 0.97)
Cristobal 0.39 (0.22, 0.65) 0.66 (0.44, 1.07)
Guayaquil 0.39 (0.25, 0.62) 0.62 (0.46, 1.04)
Lima 0.38 (0.24, 0.61) 0.6 (0.45, 1.02)
Port-au-Prince 0.38 (0.21, 0.61) 0.61 (0.41, 1.04)
Puerto Williams 0.27 (0.19, 0.37) 0.46 (0.38, 0.65)
Recife 0.39 (0.23, 0.65) 0.63 (0.41, 1.14)
Rio de Janeiro 0.37 (0.24, 0.61) 0.62 (0.46, 1.11)
Tumaco 0.38 (0.24, 0.6) 0.61 (0.44, 1.01)
Valparaiso 0.35 (0.21, 0.54) 0.55 (0.41, 0.91)
numbers in parentheses indicate low and high bounds (see section 6.2, sea-level rise projections for an explanation of the 1.5° world).
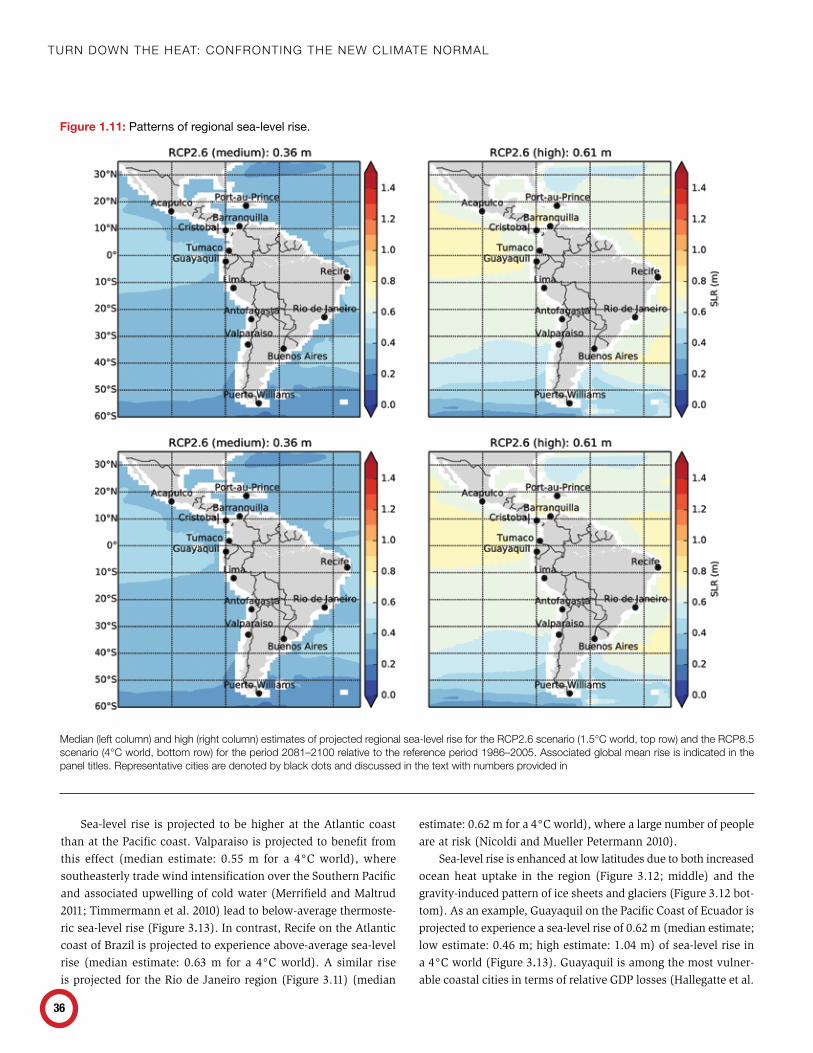
Turn Down The heaT: ConfronTing The new ClimaTe normal
36
Sea-level rise is projected to be higher at the Atlantic coast than at the Pacific coast. Valparaiso is projected to benefit from this effect (median estimate: 0.55 m for a 4°C world), where southeasterly trade wind intensification over the Southern Pacific and associated upwelling of cold water (Merrifield and Maltrud 2011; Timmermann et al. 2010) lead to below-average thermoste-ric sea-level rise (Figure 3.13). In contrast, Recife on the Atlantic coast of Brazil is projected to experience above-average sea-level rise (median estimate: 0.63 m for a 4°C world). A similar rise is projected for the Rio de Janeiro region (Figure 3.11) (median
Figure 1.11: Patterns of regional sea-level rise.
median (left column) and high (right column) estimates of projected regional sea-level rise for the rCp2.6 scenario (1.5°C world, top row) and the rCp8.5 scenario (4°C world, bottom row) for the period 2081–2100 relative to the reference period 1986–2005. Associated global mean rise is indicated in the panel titles. representative cities are denoted by black dots and discussed in the text with numbers provided in
estimate: 0.62 m for a 4°C world), where a large number of people are at risk (Nicoldi and Mueller Petermann 2010).
Sea-level rise is enhanced at low latitudes due to both increased ocean heat uptake in the region (Figure 3.12; middle) and the gravity-induced pattern of ice sheets and glaciers (Figure 3.12 bot-tom). As an example, Guayaquil on the Pacific Coast of Ecuador is projected to experience a sea-level rise of 0.62 m (median estimate; low estimate: 0.46 m; high estimate: 1.04 m) of sea-level rise in a 4°C world (Figure 3.13). Guayaquil is among the most vulner-able coastal cities in terms of relative GDP losses (Hallegatte et al.
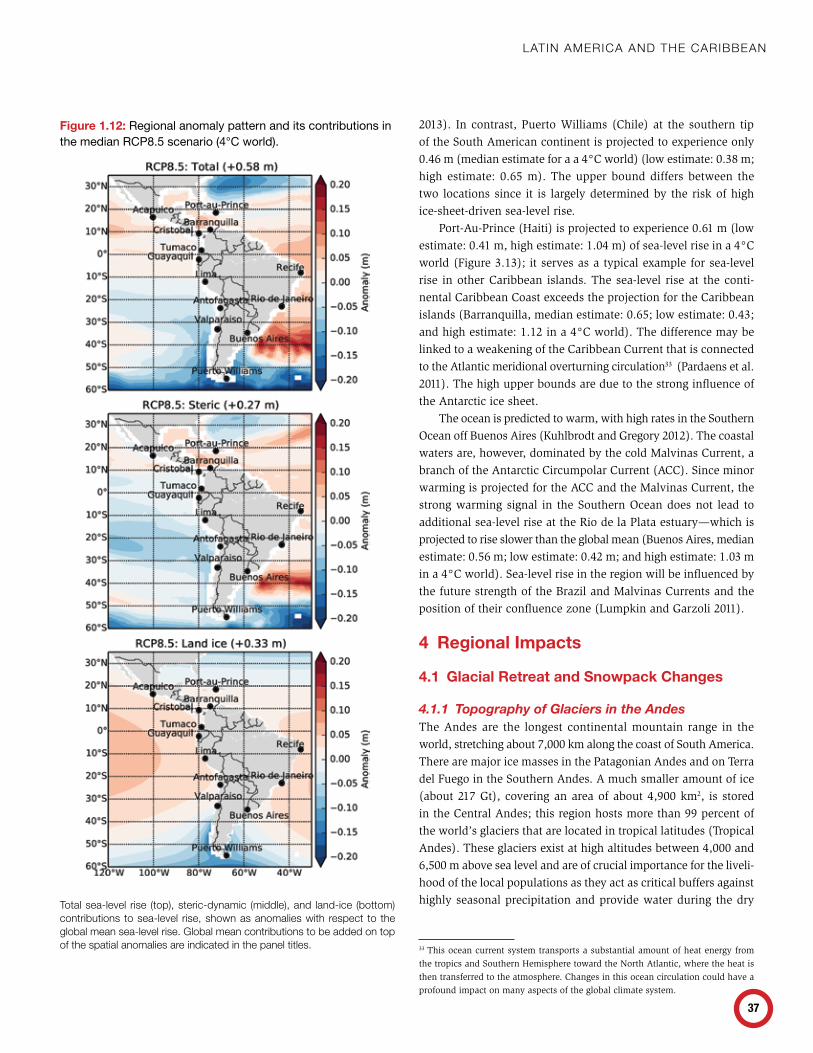
lAtin AmeriCA And the CAribbeAn
37
Figure 1.12: Regional anomaly pattern and its contributions in the median RCP8.5 scenario (4°C world).
total sea-level rise (top), steric-dynamic (middle), and land-ice (bottom) contributions to sea-level rise, shown as anomalies with respect to the global mean sea-level rise. Global mean contributions to be added on top of the spatial anomalies are indicated in the panel titles.
2013). In contrast, Puerto Williams (Chile) at the southern tip of the South American continent is projected to experience only 0.46 m (median estimate for a a 4°C world) (low estimate: 0.38 m; high estimate: 0.65 m). The upper bound differs between the two locations since it is largely determined by the risk of high ice-sheet-driven sea-level rise.
Port-Au-Prince (Haiti) is projected to experience 0.61 m (low estimate: 0.41 m, high estimate: 1.04 m) of sea-level rise in a 4°C world (Figure 3.13); it serves as a typical example for sea-level rise in other Caribbean islands. The sea-level rise at the conti-nental Caribbean Coast exceeds the projection for the Caribbean islands (Barranquilla, median estimate: 0.65; low estimate: 0.43; and high estimate: 1.12 in a 4°C world). The difference may be linked to a weakening of the Caribbean Current that is connected to the Atlantic meridional overturning circulation33 (Pardaens et al. 2011). The high upper bounds are due to the strong influence of the Antarctic ice sheet.
The ocean is predicted to warm, with high rates in the Southern Ocean off Buenos Aires (Kuhlbrodt and Gregory 2012). The coastal waters are, however, dominated by the cold Malvinas Current, a branch of the Antarctic Circumpolar Current (ACC). Since minor warming is projected for the ACC and the Malvinas Current, the strong warming signal in the Southern Ocean does not lead to additional sea-level rise at the Rio de la Plata estuary—which is projected to rise slower than the global mean (Buenos Aires, median estimate: 0.56 m; low estimate: 0.42 m; and high estimate: 1.03 m in a 4°C world). Sea-level rise in the region will be influenced by the future strength of the Brazil and Malvinas Currents and the position of their confluence zone (Lumpkin and Garzoli 2011).
4 Regional Impacts
4.1 Glacial Retreat and Snowpack Changes
4.1.1 Topography of Glaciers in the AndesThe Andes are the longest continental mountain range in the world, stretching about 7,000 km along the coast of South America. There are major ice masses in the Patagonian Andes and on Terra del Fuego in the Southern Andes. A much smaller amount of ice (about 217 Gt), covering an area of about 4,900 km2, is stored in the Central Andes; this region hosts more than 99 percent of the world’s glaciers that are located in tropical latitudes (Tropical Andes). These glaciers exist at high altitudes between 4,000 and 6,500 m above sea level and are of crucial importance for the liveli-hood of the local populations as they act as critical buffers against highly seasonal precipitation and provide water during the dry
33 This ocean current system transports a substantial amount of heat energy from the tropics and Southern Hemisphere toward the North Atlantic, where the heat is then transferred to the atmosphere. Changes in this ocean circulation could have a profound impact on many aspects of the global climate system.
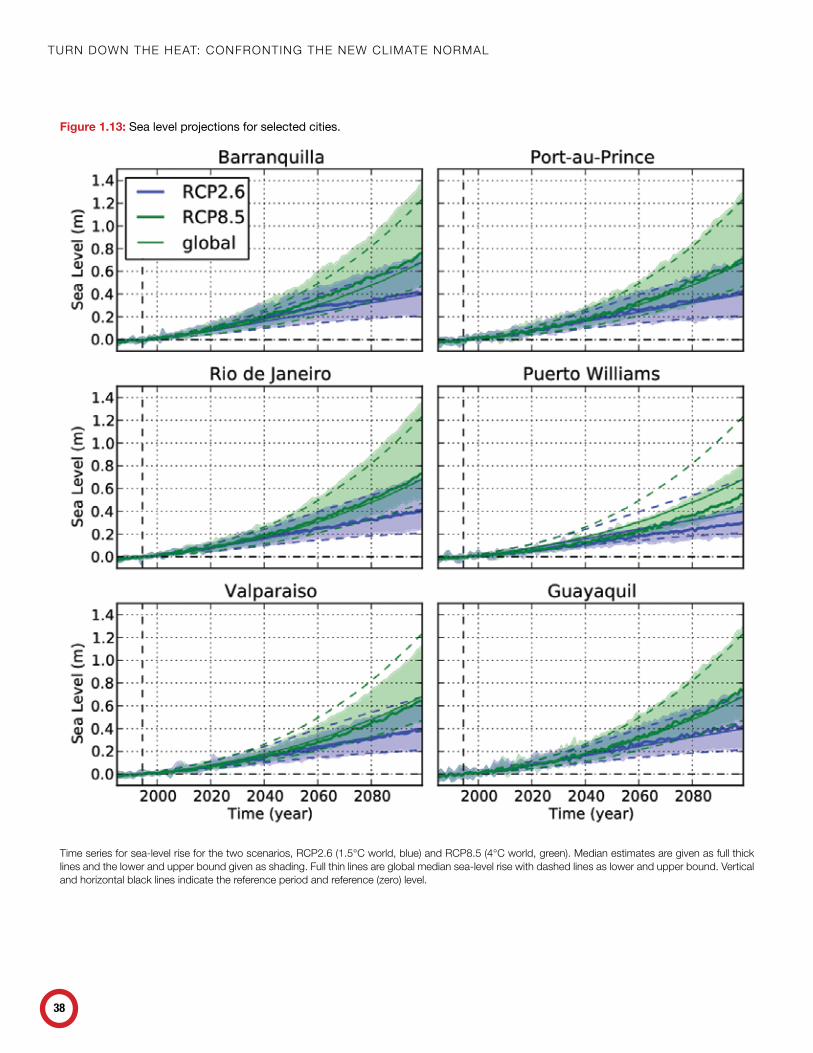
Turn Down The heaT: ConfronTing The new ClimaTe normal
38
Figure 1.13: Sea level projections for selected cities.
time series for sea-level rise for the two scenarios, rCp2.6 (1.5°C world, blue) and rCp8.5 (4°C world, green). median estimates are given as full thick lines and the lower and upper bound given as shading. Full thin lines are global median sea-level rise with dashed lines as lower and upper bound. vertical and horizontal black lines indicate the reference period and reference (zero) level.
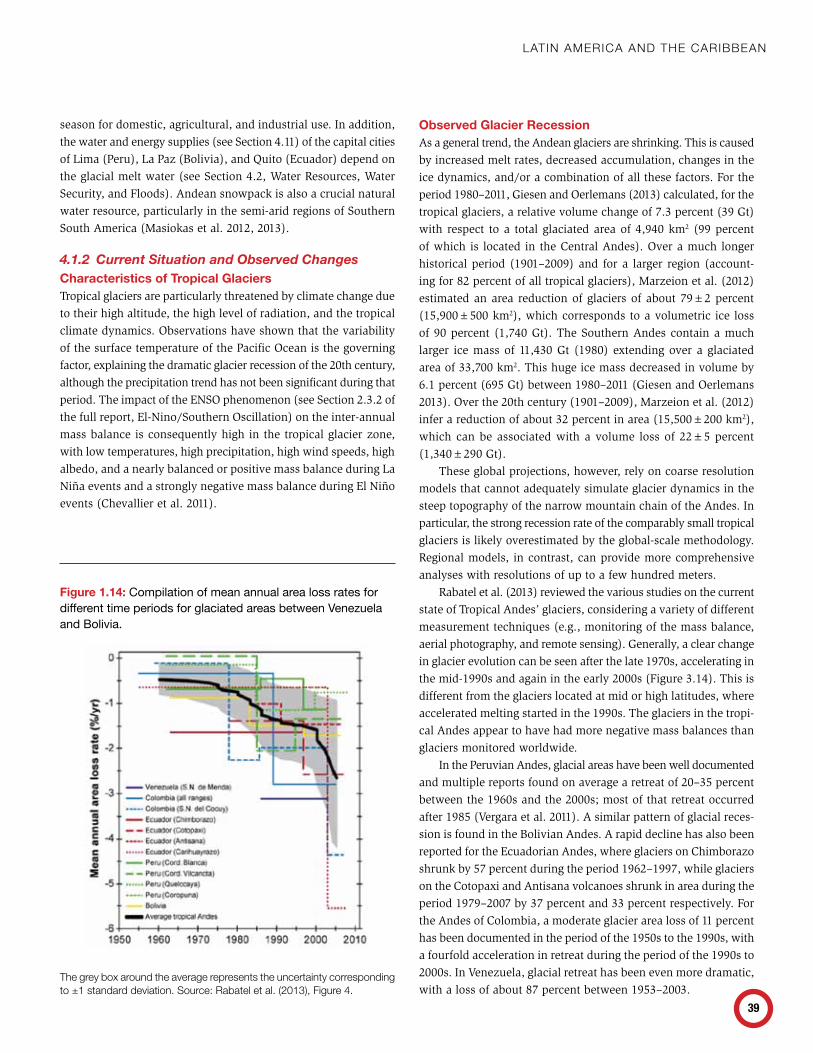
lAtin AmeriCA And the CAribbeAn
39
season for domestic, agricultural, and industrial use. In addition, the water and energy supplies (see Section 4.11) of the capital cities of Lima (Peru), La Paz (Bolivia), and Quito (Ecuador) depend on the glacial melt water (see Section 4.2, Water Resources, Water Security, and Floods). Andean snowpack is also a crucial natural water resource, particularly in the semi-arid regions of Southern South America (Masiokas et al. 2012, 2013).
4.1.2 Current Situation and Observed ChangesCharacteristics of Tropical GlaciersTropical glaciers are particularly threatened by climate change due to their high altitude, the high level of radiation, and the tropical climate dynamics. Observations have shown that the variability of the surface temperature of the Pacific Ocean is the governing factor, explaining the dramatic glacier recession of the 20th century, although the precipitation trend has not been significant during that period. The impact of the ENSO phenomenon (see Section 2.3.2 of the full report, El-Nino/Southern Oscillation) on the inter-annual mass balance is consequently high in the tropical glacier zone, with low temperatures, high precipitation, high wind speeds, high albedo, and a nearly balanced or positive mass balance during La Niña events and a strongly negative mass balance during El Niño events (Chevallier et al. 2011).
Observed Glacier RecessionAs a general trend, the Andean glaciers are shrinking. This is caused by increased melt rates, decreased accumulation, changes in the ice dynamics, and/or a combination of all these factors. For the period 1980–2011, Giesen and Oerlemans (2013) calculated, for the tropical glaciers, a relative volume change of 7.3 percent (39 Gt) with respect to a total glaciated area of 4,940 km2 (99 percent of which is located in the Central Andes). Over a much longer historical period (1901–2009) and for a larger region (account-ing for 82 percent of all tropical glaciers), Marzeion et al. (2012) estimated an area reduction of glaciers of about 79±2 percent (15,900±500 km2), which corresponds to a volumetric ice loss of 90 percent (1,740 Gt). The Southern Andes contain a much larger ice mass of 11,430 Gt (1980) extending over a glaciated area of 33,700 km2. This huge ice mass decreased in volume by 6.1 percent (695 Gt) between 1980–2011 (Giesen and Oerlemans 2013). Over the 20th century (1901–2009), Marzeion et al. (2012) infer a reduction of about 32 percent in area (15,500±200 km2), which can be associated with a volume loss of 22±5 percent (1,340±290 Gt).
These global projections, however, rely on coarse resolution models that cannot adequately simulate glacier dynamics in the steep topography of the narrow mountain chain of the Andes. In particular, the strong recession rate of the comparably small tropical glaciers is likely overestimated by the global-scale methodology. Regional models, in contrast, can provide more comprehensive analyses with resolutions of up to a few hundred meters.
Rabatel et al. (2013) reviewed the various studies on the current state of Tropical Andes’ glaciers, considering a variety of different measurement techniques (e.g., monitoring of the mass balance, aerial photography, and remote sensing). Generally, a clear change in glacier evolution can be seen after the late 1970s, accelerating in the mid-1990s and again in the early 2000s (Figure 3.14). This is different from the glaciers located at mid or high latitudes, where accelerated melting started in the 1990s. The glaciers in the tropi-cal Andes appear to have had more negative mass balances than glaciers monitored worldwide.
In the Peruvian Andes, glacial areas have been well documented and multiple reports found on average a retreat of 20–35 percent between the 1960s and the 2000s; most of that retreat occurred after 1985 (Vergara et al. 2011). A similar pattern of glacial reces-sion is found in the Bolivian Andes. A rapid decline has also been reported for the Ecuadorian Andes, where glaciers on Chimborazo shrunk by 57 percent during the period 1962–1997, while glaciers on the Cotopaxi and Antisana volcanoes shrunk in area during the period 1979–2007 by 37 percent and 33 percent respectively. For the Andes of Colombia, a moderate glacier area loss of 11 percent has been documented in the period of the 1950s to the 1990s, with a fourfold acceleration in retreat during the period of the 1990s to 2000s. In Venezuela, glacial retreat has been even more dramatic, with a loss of about 87 percent between 1953–2003.
Figure 1.14: Compilation of mean annual area loss rates for different time periods for glaciated areas between Venezuela and Bolivia.
the grey box around the average represents the uncertainty corresponding to ±1 standard deviation. source: rabatel et al. (2013), Figure 4.
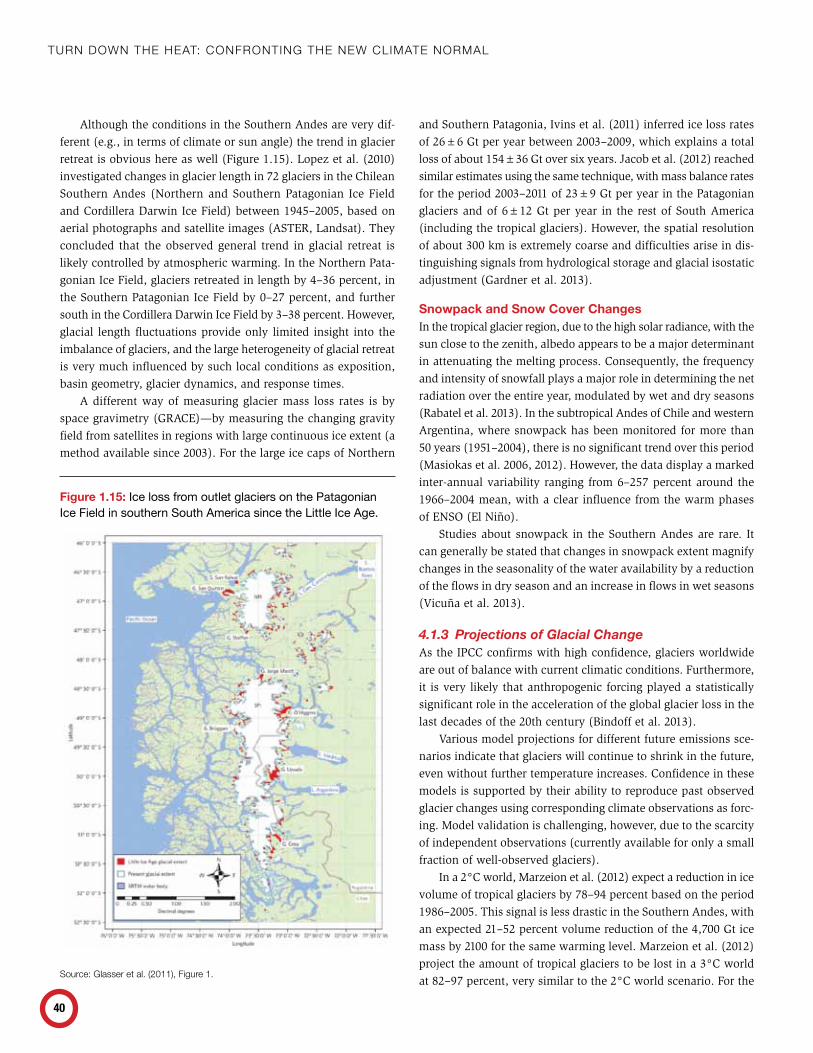
Turn Down The heaT: ConfronTing The new ClimaTe normal
40
Although the conditions in the Southern Andes are very dif-ferent (e.g., in terms of climate or sun angle) the trend in glacier retreat is obvious here as well (Figure 1.15). Lopez et al. (2010) investigated changes in glacier length in 72 glaciers in the Chilean Southern Andes (Northern and Southern Patagonian Ice Field and Cordillera Darwin Ice Field) between 1945–2005, based on aerial photographs and satellite images (ASTER, Landsat). They concluded that the observed general trend in glacial retreat is likely controlled by atmospheric warming. In the Northern Pata-gonian Ice Field, glaciers retreated in length by 4–36 percent, in the Southern Patagonian Ice Field by 0–27 percent, and further south in the Cordillera Darwin Ice Field by 3–38 percent. However, glacial length fluctuations provide only limited insight into the imbalance of glaciers, and the large heterogeneity of glacial retreat is very much influenced by such local conditions as exposition, basin geometry, glacier dynamics, and response times.
A different way of measuring glacier mass loss rates is by space gravimetry (GRACE)—by measuring the changing gravity field from satellites in regions with large continuous ice extent (a method available since 2003). For the large ice caps of Northern
and Southern Patagonia, Ivins et al. (2011) inferred ice loss rates of 26±6 Gt per year between 2003–2009, which explains a total loss of about 154±36 Gt over six years. Jacob et al. (2012) reached similar estimates using the same technique, with mass balance rates for the period 2003–2011 of 23±9 Gt per year in the Patagonian glaciers and of 6±12 Gt per year in the rest of South America (including the tropical glaciers). However, the spatial resolution of about 300 km is extremely coarse and difficulties arise in dis-tinguishing signals from hydrological storage and glacial isostatic adjustment (Gardner et al. 2013).
Snowpack and Snow Cover ChangesIn the tropical glacier region, due to the high solar radiance, with the sun close to the zenith, albedo appears to be a major determinant in attenuating the melting process. Consequently, the frequency and intensity of snowfall plays a major role in determining the net radiation over the entire year, modulated by wet and dry seasons (Rabatel et al. 2013). In the subtropical Andes of Chile and western Argentina, where snowpack has been monitored for more than 50 years (1951–2004), there is no significant trend over this period (Masiokas et al. 2006, 2012). However, the data display a marked inter-annual variability ranging from 6–257 percent around the 1966–2004 mean, with a clear influence from the warm phases of ENSO (El Niño).
Studies about snowpack in the Southern Andes are rare. It can generally be stated that changes in snowpack extent magnify changes in the seasonality of the water availability by a reduction of the flows in dry season and an increase in flows in wet seasons (Vicuña et al. 2013).
4.1.3 Projections of Glacial ChangeAs the IPCC confirms with high confidence, glaciers worldwide are out of balance with current climatic conditions. Furthermore, it is very likely that anthropogenic forcing played a statistically significant role in the acceleration of the global glacier loss in the last decades of the 20th century (Bindoff et al. 2013).
Various model projections for different future emissions sce-narios indicate that glaciers will continue to shrink in the future, even without further temperature increases. Confidence in these models is supported by their ability to reproduce past observed glacier changes using corresponding climate observations as forc-ing. Model validation is challenging, however, due to the scarcity of independent observations (currently available for only a small fraction of well-observed glaciers).
In a 2°C world, Marzeion et al. (2012) expect a reduction in ice volume of tropical glaciers by 78–94 percent based on the period 1986–2005. This signal is less drastic in the Southern Andes, with an expected 21–52 percent volume reduction of the 4,700 Gt ice mass by 2100 for the same warming level. Marzeion et al. (2012) project the amount of tropical glaciers to be lost in a 3°C world at 82–97 percent, very similar to the 2°C world scenario. For the
Figure 1.15: Ice loss from outlet glaciers on the Patagonian Ice Field in southern South America since the Little Ice Age.
source: Glasser et al. (2011), Figure 1.
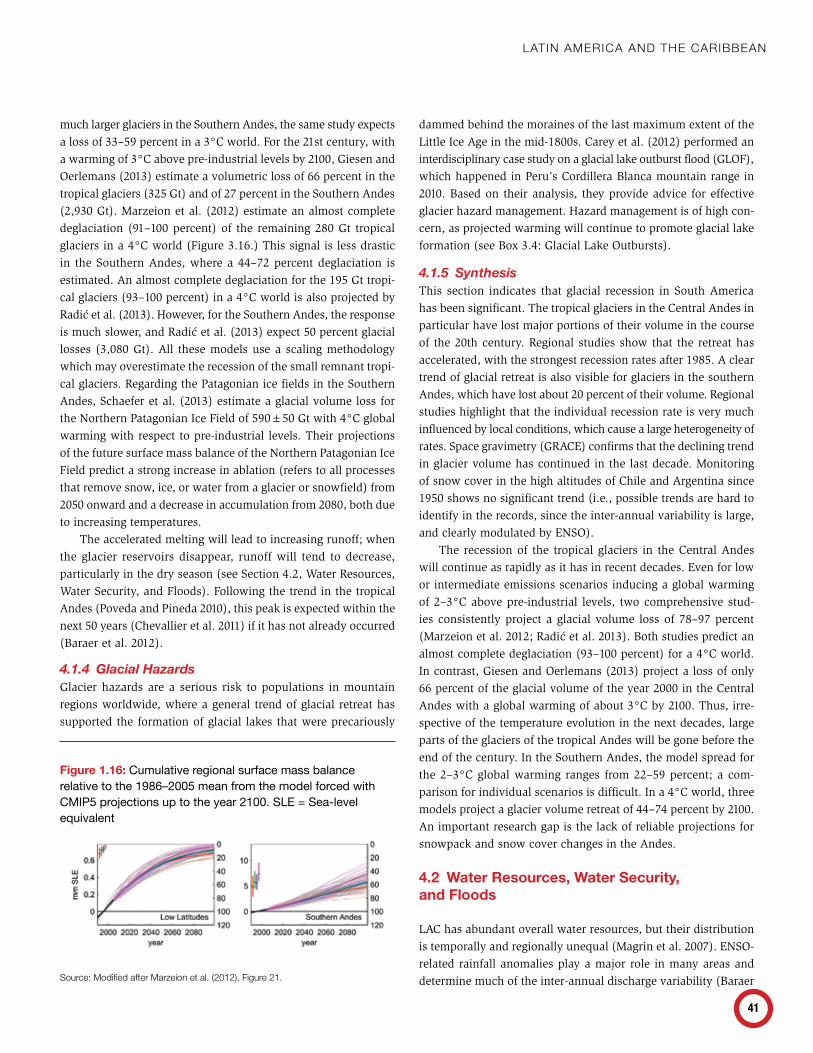
lAtin AmeriCA And the CAribbeAn
41
much larger glaciers in the Southern Andes, the same study expects a loss of 33–59 percent in a 3°C world. For the 21st century, with a warming of 3°C above pre-industrial levels by 2100, Giesen and Oerlemans (2013) estimate a volumetric loss of 66 percent in the tropical glaciers (325 Gt) and of 27 percent in the Southern Andes (2,930 Gt). Marzeion et al. (2012) estimate an almost complete deglaciation (91–100 percent) of the remaining 280 Gt tropical glaciers in a 4°C world (Figure 3.16.) This signal is less drastic in the Southern Andes, where a 44–72 percent deglaciation is estimated. An almost complete deglaciation for the 195 Gt tropi-cal glaciers (93–100 percent) in a 4°C world is also projected by Radic et al. (2013). However, for the Southern Andes, the response is much slower, and Radic et al. (2013) expect 50 percent glacial losses (3,080 Gt). All these models use a scaling methodology which may overestimate the recession of the small remnant tropi-cal glaciers. Regarding the Patagonian ice fields in the Southern Andes, Schaefer et al. (2013) estimate a glacial volume loss for the Northern Patagonian Ice Field of 590±50 Gt with 4°C global warming with respect to pre-industrial levels. Their projections of the future surface mass balance of the Northern Patagonian Ice Field predict a strong increase in ablation (refers to all processes that remove snow, ice, or water from a glacier or snowfield) from 2050 onward and a decrease in accumulation from 2080, both due to increasing temperatures.
The accelerated melting will lead to increasing runoff; when the glacier reservoirs disappear, runoff will tend to decrease, particularly in the dry season (see Section 4.2, Water Resources, Water Security, and Floods). Following the trend in the tropical Andes (Poveda and Pineda 2010), this peak is expected within the next 50 years (Chevallier et al. 2011) if it has not already occurred (Baraer et al. 2012).
4.1.4 Glacial HazardsGlacier hazards are a serious risk to populations in mountain regions worldwide, where a general trend of glacial retreat has supported the formation of glacial lakes that were precariously
dammed behind the moraines of the last maximum extent of the Little Ice Age in the mid-1800s. Carey et al. (2012) performed an interdisciplinary case study on a glacial lake outburst flood (GLOF), which happened in Peru’s Cordillera Blanca mountain range in 2010. Based on their analysis, they provide advice for effective glacier hazard management. Hazard management is of high con-cern, as projected warming will continue to promote glacial lake formation (see Box 3.4: Glacial Lake Outbursts).
4.1.5 SynthesisThis section indicates that glacial recession in South America has been significant. The tropical glaciers in the Central Andes in particular have lost major portions of their volume in the course of the 20th century. Regional studies show that the retreat has accelerated, with the strongest recession rates after 1985. A clear trend of glacial retreat is also visible for glaciers in the southern Andes, which have lost about 20 percent of their volume. Regional studies highlight that the individual recession rate is very much influenced by local conditions, which cause a large heterogeneity of rates. Space gravimetry (GRACE) confirms that the declining trend in glacier volume has continued in the last decade. Monitoring of snow cover in the high altitudes of Chile and Argentina since 1950 shows no significant trend (i.e., possible trends are hard to identify in the records, since the inter-annual variability is large, and clearly modulated by ENSO).
The recession of the tropical glaciers in the Central Andes will continue as rapidly as it has in recent decades. Even for low or intermediate emissions scenarios inducing a global warming of 2–3°C above pre-industrial levels, two comprehensive stud-ies consistently project a glacial volume loss of 78–97 percent (Marzeion et al. 2012; Radic et al. 2013). Both studies predict an almost complete deglaciation (93–100 percent) for a 4°C world. In contrast, Giesen and Oerlemans (2013) project a loss of only 66 percent of the glacial volume of the year 2000 in the Central Andes with a global warming of about 3°C by 2100. Thus, irre-spective of the temperature evolution in the next decades, large parts of the glaciers of the tropical Andes will be gone before the end of the century. In the Southern Andes, the model spread for the 2–3°C global warming ranges from 22–59 percent; a com-parison for individual scenarios is difficult. In a 4°C world, three models project a glacier volume retreat of 44–74 percent by 2100. An important research gap is the lack of reliable projections for snowpack and snow cover changes in the Andes.
4.2 Water Resources, Water Security, and Floods
LAC has abundant overall water resources, but their distribution is temporally and regionally unequal (Magrin et al. 2007). ENSO-related rainfall anomalies play a major role in many areas and determine much of the inter-annual discharge variability (Baraer
Figure 1.16: Cumulative regional surface mass balance relative to the 1986–2005 mean from the model forced with CMIP5 projections up to the year 2100. SLE = Sea-level equivalent
source: modified after marzeion et al. (2012), Figure 21.
Turn Down The heaT: ConfronTing The new ClimaTe normal
42
et al. 2012; Cortés et al. 2011; Krol and Bronstert 2007; Mata et al. 2001; Poveda 2004; Ronchail et al. 2005; Shi et al. 2013; Vicuña et al. 2010; Vuille et al. 2008). Large parts of the region are char-acterized by inter-annual/seasonal rainfall variability through the oscillation of the Intertropical Convergence Zone (Garreaud et al. 2009). Due to the unreliable rainfall, groundwater resources and water from glacier and snowmelt play a crucial role in supply-ing local water (Chevallier et al. 2011; Hirata and Conicelli 2012; Vuille et al. 2008).
LAC suffers from widespread floods and landslides (Maynard-Ford et al. 2008) which result from different origins (Dilley et al. 2005). Heavy precipitation events in the context of ENSO or tropical cyclones can lead to disastrous floods, especially in regions with steep terrains such as in the Andes and Central America (IPCC 2012; Mata et al. 2001; Mimura et al. 2007; Poveda et al. 2001). Coastal areas in the Caribbean and Central America suffer from flooding as a result of storm surges and tropical cyclones (Dilley et al. 2005; Woodruff et al. 2013). In the Andes, glacial lake outbursts pres-ent a permanent hazard for Andean cities (Chevallier et al. 2011).
In many parts of the region there is no clear trend in future discharges due to the uncertainties in rainfall projections in dif-ferent GCMs (see also Section 3.3, Regional Precipitation Projec-tions) and the diverging results of different impact models (Bravo et al. 2013; Davie et al. 2013; Döll and Schmied 2012; Hidalgo et al. 2013; Imbach et al. 2012; Krol and Bronstert 2007; Malhi et al. 2009; Rowell 2011; Schewe et al. 2013).
4.2.1 Central America and MexicoMilly et al. (2005) modeled a decrease in river runoff for Central America of up to 10 percent for the 20th century. Hidalgo et al. (2013) projected mean annual runoff to decrease by 10–30 percent by the end of the 21st century with a median of 3°C regional warming. The same tendencies were shown in Imbach et al. (2012), who found decreases in annual runoff in 61–71 percent of the area (notably in central Yucatan Peninsula, the mountains of Nicaragua, Honduras, and Guatemala) in a 2°C warmer world, depending on the sub-region and the emissions scenario. Increases were projected only for just one percent of the area, mainly along the southern edge. Evapotranspiration was projected to increase more than 20 percent in more humid areas (e.g., Costa Rica, Panama) whereas northern areas were projected to experience no change. Fabrega et al. (2013) found precipitation increases by 5 percent or more for most regions of Panama—but with no statistically significant changes in total runoff in a 3°C world. Maurer et al. (2009) modeled the inflow of two reservoirs in the Rio Lempa basin. They found decreases of 13 percent in total annual reservoir inflow in a 2°C world and of 24 percent in a 4°C world, implying potential reductions in hydro-power capacities. Low flow years might occur more frequently, especially under a higher warming (Maurer et al. 2009).
Global studies mostly confirm this picture. Milly et al. (2005) projected a decrease in river runoff in Central America of 5–20 per-cent for the middle of the 21st century with 3°C global warming. Nakaegawa et al. (2013) also found that the total annual runoff decreases for Mexico and Central America from 2075–2099 with 3°C warming. For the Rio Grande, annual discharge decreases by more than 20 percent. In a 3°C world, Mesoamerica also experiences a strong decrease in discharge in the study of Schewe et al. (2013).
Portmann et al. (2013) reported a mean decrease across several GCMs of more than 10 percent in groundwater recharge in a 4°C world for Central America. The projected changes were much less pronounced when assuming lower global mean temperature increases of 2–3°C.
4.2.2 CaribbeanThe assessment of water resources in the Caribbean relies more on assumptions and extrapolations from climatological data than on long-term hydrometric measurements, especially for the smaller islands (Cashman 2013; FAO 2003). Water provisioning is espe-cially difficult on islands which rely mainly on a single source of water (such as groundwater in Barbados, Bahamas, Antigua and
Box 1.3: Water Security in the Mexico City Metropolitan Area
the mexico City metropolitan Area (mCmA) faces frequent climate-related hazards. these include extremes of water and heat, with floods on the one side and heat waves and droughts on the other. the most common extreme events from 1980–2006 were floods resulting from heavy precipitation events (romero lankao 2010). up to 42 percent of the population in mCmA was estimated to be vulnerable to climate change and natural hazards. Forty percent of those live in so-called “high-risk areas” which are characterized by very steep slopes of over 15 degrees where landslides can occur after heavy precipitation events (baker 2012). exponential popula-tion growth in mCmA during the 20th century also contributed to the high vulnerability to flooding and water shortages (brun 2007).
Currently water is provided from the mexico City basin aquifer, with one-third transferred from external water basins (romero lankao 2010). overextraction of groundwater in combination with locally unfavorable soil conditions (heavily saturated clay) have caused parts of the city to subside and thus suffer more frequent flooding (baker 2012; romero lankao 2010). Another problem for long-term water security is related to groundwater contamination of the mexico City basin aquifer, most probably due to surface waste-water (brun 2007)
the projection of temperature increases, more frequent and prolonged dry spells, and a (probable) precipitation decrease will harm water security and increase water dependencies in the grow-ing mCmA. the water security of the water-providing external areas will also be affected (magrin et al. 2007; romero lankao 2010; sosa-rodriguez 2013).
lAtin AmeriCA And the CAribbeAn
43
Barbuda, and Jamaica, or surface water in Trinidad and Tobago, Grenada, St. Vincent and the Grenadines, St. Lucia, Dominica, and elsewhere)(Cashman 2013; Gencer 2013).
The lack of long-term measured stream flows in the Caribbean renders the evaluation of hydrological models in the region dif-ficult, and future projections of runoff have only low confidence (Hidalgo et al. 2013). A combination of lower precipitation, high abstraction rates, and sea-level rise may lead to intrusion of saline sea water into coastal groundwater aquifers (Cashman et al. 2010; Cashman 2013). Another hydrological hazard regarding climate change is more severe flooding events related to tropical cyclones (Cashman et al. 2010).
4.2.3 Northern South America (Colombia)Restrepo et al. (2014) found significant discharge increases for the Mulatos, Magdalena (at Calamar), Canal del Dique, and Fundación rivers, especially from 2000 to 2010. Regional studies of climate-related hydrologic impacts are limited, as access to and quantity of observational climate data is limited (Hoyos et al. 2013). Reanalysis or simulated/reconstructed datasets have been used, but Hoyos et al. (2013) reported substantial differences between climatologi-cal datasets and observed values. Nakaegawa and Vergara (2010) found a trend of decreasing mean annual river discharge due to increased evapotranspiration in the Magdalena Basin in a 3°C world. Monthly mean river discharge decreased significantly in April, October, and November at Puerto Berrio. It is important, however, to note that mean precipitation was overestimated by about 35 percent for the GCMs used.
4.2.4 AndesIn mountainous regions, winter precipitation accumulated as snow and ice, similar to groundwater reserves, helps to buffer water short-ages resulting from little or seasonal rainfall (Masiokas et al. 2006; Viviroli et al. 2011; Vuille et al. 2008). Downstream regions with low summer precipitation in particular benefit from this temporal water storage (Masiokas et al. 2013; Viviroli et al. 2011). Glacier retreat thus endangers water security in these areas (Vuille et al. 2008). Current accelerated melting rates, however, imply a short-term local surge in water—and higher river flow peaks can cause landslides and floods. Massive flood events have been associated with glacial lake outburst (Chevallier et al. 2011) (see Box 3.4).
4.2.5 Tropical AndesBaraer et al. (2012) analyzed historical streamflow records for the Cordillera Blanca over the period 1990–2009; they showed that discharge was decreasing annually and during the dry season. The trends were attributed to glacier retreat. Meltwater contrib-utes 10–20 percent to the total annual discharge of the Río Santa (Cordillera Blanca), but may rise to over 40 percent during the dry season (Baraer et al. 2012). In the period from 1990–2009, the overall glaciered area was decreasing by 0.81 percent annually;
this is around 30 percent higher than what was measured during the 1930–2009 period (Baraer et al. 2012).
Kinouchi et al. (2013) simulated the glacier melt and runoff in a headwater catchment of the Cordillera Real in Bolivia. They applied different 1–1.5°C temperature increase scenarios by 2050 and found only small changes in annual runoff. The seasonal variation was, however, modified significantly. Under their projec-tions, streamflow during the dry and early wet season was reduced (e.g., because of snowmelt decrease, and during the wet season it increased, especially in January and February). Baraer et al.(2012) projected that once the glaciers have melted, the average dry season discharge may decrease more than 60 percent in Parón and Llanga-nuco and up to 70 percent at La Balsa—with serious implications for water supplies during the dry season. Juen et al. (2007) found little changes in total annual discharge by 2050 and 2080 in the Llanganuco catchment, but they did find a bigger amplitude of discharge seasonality (with a risk of very low flows during the dry season). They concluded that a smaller glacier size causes decreasing glacier melting, but that this decrease is supplemented by an increase in direct runoff from non-glaciered areas. Wet sea-son discharge was projected to increase from 10–26 percent and dry season discharge to decrease from 11–23 percent for warming >1.5°C in 2050 and >2°C in 2080 depending on the emissions scenario and timeframe (see Figure 3.17). For the northern half of the Andes, a very likely increase in flood frequency in a 4°C world was projected (Hirabayashi et al. 2013).
4.2.6 Central AndesThe Andes in Central Chile and central western Argentina are characterized by a direct relationship between the amount of snow accumulated in winter and river discharge released during spring-summer (Masiokas et al. 2006), and around 85 percent of the observed river flow variance over 60 years in the area can be explained by snowpack records (Masiokas et al. 2010, 2013).
The inter-annual variability of snowpack extent is enormous, varying from zero percent to over 400 percent of the long-term mean (Masiokas et al. 2006, 2010, 2013). Freshwater availability is thus strongly dependent on mountain snowpack. In very dry
Box 1.4: Glacial Lake Outbursts
Glacial lake outburst floods (GloFs) originate from various causes. First, increasing glacier melting raises the water levels of lakes, eventually resulting in an overflow of water or the breaking of dams. second, ice instability may cause an avalanche of seracs into a lake, leading to suddenly higher water levels and the breaking of dams. ice instability might increase with increasing temperatures. third, glacier retreat may trigger major rock slides. it is important to note that the Andes belong to a region of high seismic activity, which can contribute to GloFs. (Chevallier et al. 2011; Kaser et al. 2003).
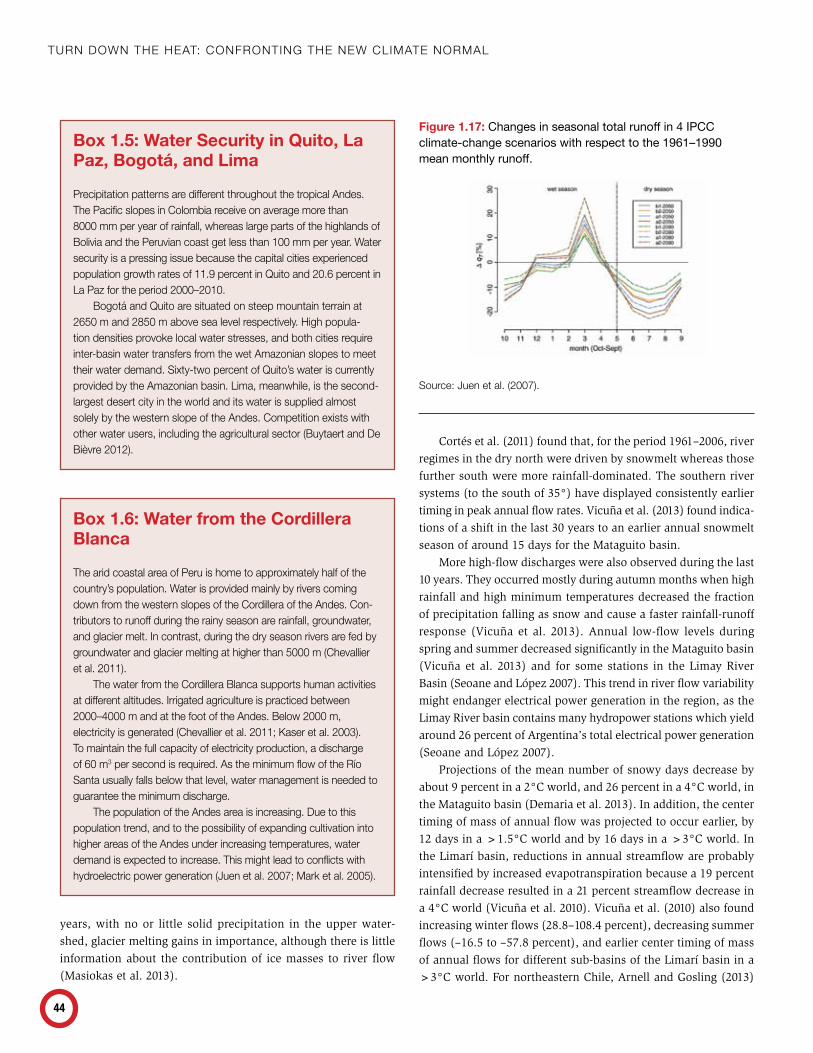
Turn Down The heaT: ConfronTing The new ClimaTe normal
44
years, with no or little solid precipitation in the upper water-shed, glacier melting gains in importance, although there is little information about the contribution of ice masses to river flow (Masiokas et al. 2013).
Cortés et al. (2011) found that, for the period 1961–2006, river regimes in the dry north were driven by snowmelt whereas those further south were more rainfall-dominated. The southern river systems (to the south of 35°) have displayed consistently earlier timing in peak annual flow rates. Vicuña et al. (2013) found indica-tions of a shift in the last 30 years to an earlier annual snowmelt season of around 15 days for the Mataguito basin.
More high-flow discharges were also observed during the last 10 years. They occurred mostly during autumn months when high rainfall and high minimum temperatures decreased the fraction of precipitation falling as snow and cause a faster rainfall-runoff response (Vicuña et al. 2013). Annual low-flow levels during spring and summer decreased significantly in the Mataguito basin (Vicuña et al. 2013) and for some stations in the Limay River Basin (Seoane and López 2007). This trend in river flow variability might endanger electrical power generation in the region, as the Limay River basin contains many hydropower stations which yield around 26 percent of Argentina’s total electrical power generation (Seoane and López 2007).
Projections of the mean number of snowy days decrease by about 9 percent in a 2°C world, and 26 percent in a 4°C world, in the Mataguito basin (Demaria et al. 2013). In addition, the center timing of mass of annual flow was projected to occur earlier, by 12 days in a >1.5°C world and by 16 days in a >3°C world. In the Limarí basin, reductions in annual streamflow are probably intensified by increased evapotranspiration because a 19 percent rainfall decrease resulted in a 21 percent streamflow decrease in a 4°C world (Vicuña et al. 2010). Vicuña et al. (2010) also found increasing winter flows (28.8–108.4 percent), decreasing summer flows (–16.5 to –57.8 percent), and earlier center timing of mass of annual flows for different sub-basins of the Limarí basin in a >3°C world. For northeastern Chile, Arnell and Gosling (2013)
Box 1.5: Water Security in Quito, La Paz, Bogotá, and Lima
precipitation patterns are different throughout the tropical Andes. the pacific slopes in Colombia receive on average more than 8000 mm per year of rainfall, whereas large parts of the highlands of bolivia and the peruvian coast get less than 100 mm per year. water security is a pressing issue because the capital cities experienced population growth rates of 11.9 percent in Quito and 20.6 percent in la paz for the period 2000–2010.
bogotá and Quito are situated on steep mountain terrain at 2650 m and 2850 m above sea level respectively. high popula-tion densities provoke local water stresses, and both cities require inter-basin water transfers from the wet Amazonian slopes to meet their water demand. sixty-two percent of Quito’s water is currently provided by the Amazonian basin. lima, meanwhile, is the second-largest desert city in the world and its water is supplied almost solely by the western slope of the Andes. Competition exists with other water users, including the agricultural sector (buytaert and de bièvre 2012).
Figure 1.17: Changes in seasonal total runoff in 4 IPCC climate-change scenarios with respect to the 1961–1990 mean monthly runoff.
source: Juen et al. (2007).
Box 1.6: Water from the Cordillera Blanca
the arid coastal area of peru is home to approximately half of the country’s population. water is provided mainly by rivers coming down from the western slopes of the Cordillera of the Andes. Con-tributors to runoff during the rainy season are rainfall, groundwater, and glacier melt. in contrast, during the dry season rivers are fed by groundwater and glacier melting at higher than 5000 m (Chevallier et al. 2011).
the water from the Cordillera blanca supports human activities at different altitudes. irrigated agriculture is practiced between 2000–4000 m and at the foot of the Andes. below 2000 m, electricity is generated (Chevallier et al. 2011; Kaser et al. 2003). to maintain the full capacity of electricity production, a discharge of 60 m3 per second is required. As the minimum flow of the río santa usually falls below that level, water management is needed to guarantee the minimum discharge.
the population of the Andes area is increasing. due to this population trend, and to the possibility of expanding cultivation into higher areas of the Andes under increasing temperatures, water demand is expected to increase. this might lead to conflicts with hydroelectric power generation (Juen et al. 2007; mark et al. 2005).
lAtin AmeriCA And the CAribbeAn
45
simulated a decreasing mean annual runoff for warming higher than 1°C over 21 GCMs. Projections by Döll (2009) also showed a reduced groundwater recharge for the central Andes region by the 2050s with 2°C warming.
4.2.7 Amazon BasinEspinoza Villar et al. (2009) found significant decreasing mean and minimum annual runoffs from 1990–2005 for southern Andean rivers (Peru, Bolivia) and increasing mean and maximum annual runoffs for northern Andean Rivers (Ecuador) draining into the Amazon. For the southern Amazon, Li et al. (2008) found more dry events during 1970–1999. Espinoza Villar et al. (2009) reported decreasing mean annual discharge and monthly minimum dis-charge from 1974–2004 for Tapajós in the southeastern Amazon, the Peruvian Amazon Rivers, and the upstream Madeira.
Guimberteau et al. (2013) analyzed the impacts of climate change on extreme streamflow over several Amazonian sub-basins by the middle of this century for a 2°C global warming scenario. They found that low flows would become more pronounced. The trend is significant at the Madeira and Xingu rivers, with JJA precipitation decreases of 9 percent and 22 percent respectively. At Porto Velho, the decrease in median low flows is about 30 percent; at Altamira, it is about 50 percent. In addition, Tosiyuki Nakaegawa et al. (2013) found total annual runoff decreases in the southern half of the Amazon River in a 3°C world. Average annual runoff varied from –72 percent to +6 percent in a 3°C world for the Bolivian part of the Amazon (Alto Beni), assuming no land use change (Fry et al. 2012). Nevertheless the projected ground-water recharge was consistently negative (–96 percent to –27 percent) because potential evapotranspiration increases.
Malhi et al.(2009) found an increase in dry-season intensity in eastern Amazonia in a 3° world and seasonal increased water stress because of climate change and deforestation. Langerwisch et al. (2013) found shifts in flood patterns in a 3° world. The duration of flooding at the end of the 21st century was projected to be 0.5–1 months shorter than for 1961–1990. The probability of three successive extreme wet years decreased by up to 30 percent (Langerwisch et al. 2013).
Median high flows in the western part of the Amazon basin increase by 5–25 percent by the middle of this century for a warming of 2°C; this trend is not, however, significant (Guimberteau et al. 2013). In a 2°C world, the increase in high flow was projected to be lower than in a warmer than 3°C world; low flows increase 10–30 percent under a 4° warming scenario (Guimberteau et al. 2013). The flood zone is consistently projected to increase with a 2–3 month longer inundation time in a 3°C world over several GCMs (Langerwisch et al. 2013). The average runoff and the maximum runoff increased in two subcatchments of the Paute basin for a 2°C global warming scenario from 2045–65 (Mora and Campozano et al. 2013). Exbrayat et al. (2014) also found increases in annual runoff for a catchment in the Ecuadorian Andes by 2100; they also showed a high variability of runoff projections depending on the choice of GCM, emissions scenario, and hydrological model. Similarly, Buytaert et al. (2009) showed that, due to the wide range of GCM projections, the projected average monthly discharges diverge considerably in the Paute River system in Ecuador under a 1°C increase by 2030.
Box 1.7: Water Security in the Central Andes
in the Andes, between latitudes 30 and 37° lie two major cities, santiago de Chile (Chile) and mendoza (Argentina). human activi-ties in these cities are almost completely dependent on meltwater, especially in the drier Argentinean foothills which receive only around 200 mm of annual precipitation (masiokas et al. 2013).
snowmelt is very important for water supply, hydroelectric generation, and viniculture in large parts of Chile (demaria et al. 2013). the central valley of Chile contains the majority of the coun-try’s reservoir storage and supplies water to several large towns. water demand results as well from agriculture, as 75 percent of the irrigated area in Chile is located here (demaria et al. 2013). the Central valley suffers from high inter-annual rainfall variability, with conditions being wetter during el niño years and drier during el niña years (Cortés et al. 2011). in years with above-average rainfall, farmers irrigate annual crops (e.g., orchards, vineyards) with surface water, whereas in below-average rainfall years they are forced to use groundwater. the use of groundwater has recently reached unsus-tainable levels, and the Chilean water authorities have therefore restricted water extraction. decreasing annual rainfall as a result of climate change would put even more pressure on agriculture and water resources (Arumí et al. 2013).
Box 1.8: Water Security and Glacial Melt in La Paz and El Alto, Bolivia
la paz and el Alto receive 80 percent of their water from the tuni Condoriri range. the contribution of glacier ice melt could be from 30–40 percent (world bank 2008) up to 60 percent (painter 2007). since water demand has risen in recent years, the water manage-ment of both cities is very much challenged (Jeschke et al. 2012; shi et al. 2013). Almost the entire energy supply of la paz is sup-plied by hydroelectric power which comes mainly from two glacier ranges—in the Zongo valley and Charquiri (painter 2007). the glaciers of the Cordillera real encompass 55 percent of the bolivian glaciers. between 1963–2006 they lost more than 40 percent of their volume (soruco et al. 2009) and they are further declining (liu et al. 2013). it has been postulated that water demand might soon surpass water supply in el Alto (shi et al. 2013). Future water and energy supply will be increasingly critical due to rising demand, in combination with decreasing tropical glacier volumes (rabatel et al. 2013; vuille et al. 2008).

Turn Down The heaT: ConfronTing The new ClimaTe normal
46
For the northernmost Amazon and the river mouth region, river flow and runoff coefficients decrease with a global warm-ing of 2°C in 2045–2065 (Guimberteau et al. 2013). In the same study, median low flows decrease by 20 percent for the Japura and Negro river and 55 percent at the Río Branco.
At the main stem of the Amazon River the runoff coefficient is projected to slightly decrease at Óbidos (the last station of the Amazon before the mouth) with a warming of 2°C by 2050 (Guimberteau et al. 2013). Median low flow is projected to decrease by 10 percent, but this trend is uncertain. In a 4°C world, Guim-berteau et al. (2013) projected that low flows and high flows would each increase by five percent at Óbidos. Döll and Schmied (2012), however, projected the mean river discharge of the downstream part of the Amazon to increase for under a 2°C warming by 2050 in one GCM but decrease in another GCM.
4.2.8 Northeast BrazilKrol and Bronstert (2007) found that a decrease in precipitation by the end of the 21st century would significantly decrease the runoff of the Jaguaribe River and the stored volume in the Ceará reservoir. In contrast, an increase of precipitation by 50 percent did not significantly increase river runoff because of an accompany-ing increase in water demand. Döll and Schmied (2012) projected the seasonality of river discharge in northeastern Brazil to remain stable but also that mean river discharge would decrease by the middle of the 21st century under a 2°C global warming scenario.
Due to uncertainty in the GCM projections, there is no clear signal about the relative change of annual discharge for northeastern South America under 2°C warming (Schewe et al. 2013). Portmann et al. (2013) projected both strong decreases and increases in mean groundwater discharge for northeastern Brazil in a 4°C world depending on the GCM. Assuming different warming scenarios with varying levels of decreasing rainfall, Montenegro and Ragab (2010) projected strong decreases in groundwater recharge of up to 77 percent and streamflows of up to 72 percent for a subcatch-ment of the Sao Francisco River Basin.
4.2.9 Río de la PlataThe Río de la Plata region experienced a 10–30 percent increase in river runoff during the 20th century (García and Vargas 1998; Jaime and Menéndez 2002; Menéndez and Berbery 2005; Milly et al. 2005). There is no consensus, however, among river runoff projections for the Río de la Plata and its tributaries because the projected direction of rainfall trend varies among GCMs. Milly et al. (2005) modeled an increase in mean relative runoff for the Rio de la Plata region of 20–50 percent for the middle of the 21st century and using a 3°C warming scenario. River flow projec-tions in the upper Paraguay River basin varied from ±10 percent by 2030 for a 1.5° warming scenario and by ±20 percent by 2070 for a 2°C warming scenario (Bravo et al. 2013). For a 3°C world, Nakaegawa et al. (2013) projected increasing discharge
from January–May at Corrientes on the Paraná River—but not at Posadas which lies further upstream. Nóbrega et al. (2011) found that for the Río Grande, a tributary of the Paraná, for every 1°C temperature rise annual flow increased by 8–9 percent in relation to 1961–1990. Assuming 2°C warming, mean river flow ranged from –20 percent to +18 percent.
Camilloni et al. (2013) projected an increase in frequency and duration of river flooding in a >3°C world in the Uruguay and Paraná basins. Hirabayashi et al. (2013) showed a decrease in the 20th century 100-year return period for floods for the Parana in a 4°C world, but there was little consistency across the 11 GCMs used.
Besides river floods, storm surge floods present a major hazard for Buenos Aires. Barros et al. (2005; 2008) found a greater inland reach of recurrent storm surge floods by 2070 under a 3°C global warming scenario. Assuming no changes in population distribu-tion, permanent coastal flooding due to sea-level rise will play a minor role and will affect rather sparsely populated areas at the coast of Buenos Aires and its surroundings. In contrast, Pousa et al. (2013) projected that sea-level rise could aggravate the impact of storm surge floods in Buenos Aires.
4.2.10 Southernmost South AmericaMilly et al. (2005) simulated a decrease in mean relative runoff of up to 10 percent, which is in agreement with observed 20th century trends for southernmost South America. They projected a decrease in mean relative runoff of 10–30 percent for southernmost South America for the middle of the 21st century with 3°C global warm-ing. Schewe et al. (2013) found similar results for a >2°C world.
4.2.11 SynthesisENSO-related rainfall anomalies play a major role in many areas in LAC and determine much of the inter-annual discharge variabil-ity. In Central America, there is a high agreement on decreasing mean annual runoff and discharge, although the magnitude of the change varies (Arnell and Gosling 2013; Hidalgo et al. 2013; Imbach et al. 2012; Maurer et al. 2009; Milly et al. 2005; Nakae-gawa et al. 2013; Schewe et al. 2013). The trend seems to be more pronounced for the northern than for the southern part of Central America (Hidalgo et al. 2013; Imbach et al. 2012). Therefore, water stress may increase, especially in arid areas with high population densities and during the dry season.
The Caribbean lacks long-term measured stream flow data. Runoff projections are therefore of low confidence (Cashman 2013; FAO 2003; Hidalgo et al. 2013). However, freshwater availability may decrease for several reasons. Sea-level rise (Mimura et al. 2007) may lead to an intrusion of sea water into coastal aquifers (Cashman et al. 2010; Cashman 2013) and summer precipitation is projected to decrease (Mimura et al. 2007). Regionally the risk of flooding and mudslides with high mortality rates is high (Cashman 2013; Edwards 2011; Williams 2010). Although floods often seem to be associated with land-use change, more severe
lAtin AmeriCA And the CAribbeAn
47
flooding events may also occur in the context of climate change (Cashman et al. 2010; IPCC 2012).
In Northern South America (Colombia), there are only a limited number of regional hydrological impact studies available for northern South America, and rainfall projections are uncertain. Conclusions about projected hydrological impacts are therefore of low confidence.
In the Andes, higher discharge seasonality is projected for the Tropical Andes. Streamflows during the dry season may decrease because of ongoing glacier retreat (Baraer et al. 2012; Juen et al. 2007; Kinouchi et al. 2013). Lower dry season discharge has already been observed during the past two decades (Baraer et al. 2012). However, streamflow during the wet season may increase (Juen et al. 2007; Kinouchi et al. 2013). The region has a high flood risk (e.g., due to accelerated glacier melting; see Box 3.4: Glacial Lake Outbursts) (Carey 2005; Hirabayashi et al. 2013). For the Central Andes, more streamflow was observed and projected to occur at earlier dates locally (Cortés et al. 2011; Vicuña et al. 2013; Demaria et al. 2013). Lower dry season discharges may cause significant water supply problems in urban areas.
Amazon Basin: Runoff and discharge projections for most parts of the Amazon basin are diverging, especially for the southern and eastern areas. The main reasons for this are the high vari-ability of rainfall projections using different GCMs and uncertain-ties introduced by hydrological impact models. However, for the western part of the basin a likely increase in streamflow, runoff, flood zone, and inundation time was projected (Guimberteau et al. 2013; Langerwisch et al. 2013; Mora and Campozano et al. 2013).
Northeast Brazil: The direction of discharge and groundwater recharge trends vary due to diverging rainfall projections under different GCMs (Döll and Schmied 2012; Krol and Bronstert 2007; Portmann et al. 2013; Schewe et al. 2013).
Río de la Plata: There are no consistent river runoff projections for the basin because the directions of rainfall projections vary among the GCMs (Bravo et al. 2013; Milly et al. 2005; Nakaegawa et al. 2013; Nóbrega et al. 2011).
Southernmost South America: A decrease of mean runoff was projected with a high confidence (Milly et al. 2005; Schewe et al. 2013).
4.3 Climate Change Impacts on Agriculture
4.3.1 Temperature Sensitivity Crop ThresholdsAgriculture is one of the most climate dependent human activities, and the development and growth of plants is affected to a very large extent by temperature. Every plant has a range between a maximum and minimum temperature in which the plant can exist and an optimum temperature at which growth is at its optimal rate (Hatfield et al. 2011). Crops often require different temperatures in their numerous development stages and are very sensitive to temperatures above the optimum, especially during the pollination
phase (Hatfield et al. 2011). Generally, warmer temperatures act to decrease the development phase of perennial crops, resulting in earlier crop flowering and reduced seed sets (Craufurd and Wheeler 2009). When temperatures increase above the maximum, plant growth and yields can be drastically reduced (Ackerman and Stanton 2013; Berg et al. 2013; Luo 2011).
The optimum seasonal average temperature for maximum grain yield is 15°C for wheat, 18°C for maize, 22°C for soybeans, and 23°C for rice (Hatfield et al. 2011; Lobell and Gourdji 2012). Hatfield et al. (2011) also identified average temperatures leading to a total crop failure: 34°C for wheat, 35°C for maize, 39°C for soybeans, and 35°C for rice. Short intervals of a few days above the optimum average temperature can lead to strong yield decreases (Ackerman and Stanton 2013). Teixeira et al. (2013) project an increasing occurrence of heat stress for maize, rice, and soybeans in Latin America. Lobell and Gourdji (2012) estimate global yield declines of 3–8 percent per °C of temperature increase based on a literature review. It is, however, important to note that there are numerous knowledge gaps concerning plant reactions to tem-peratures above their optimum averages (Craufurd and Wheeler 2009; Porter et al. 2014). Moreover, plants are somewhat capable of adapting to changing climatic conditions—and it is unclear if climate change will alter growing conditions too fast for crops to adapt on their own (Ackerman and Stanton 2013).
4.3.2 Plant DiseasesHow pests and diseases will spread under future climate condi-tions, and how severe the effects will be on yields and production quantities, is unclear. Already today crop diseases are respon-sible for losses of 10 percent or more of global food production (Chakraborty and Newton 2011; Ghini et al. 2011; Luck et al. 2011).
Climate change is expected to alter the geographic distribution of insects and diseases in much of the world (Porter et al. 2014). The knowledge on climate change and plant diseases, however, is still very limited (Ghini et al. 2011; Luck et al. 2011). The impacts differ greatly between crops and pathogens as do the interactions among hosts, pathogens, microorganisms, and the climate (Ghini et al. 2011; Bebber et al. 2014). The existing knowledge base is inadequate to make generalizations about the behavior of crop diseases under a changing climate (Luck et al. 2011). Factors that are most likely to influence the development of plant diseases are increasing atmospheric CO2, increasing winter temperatures, and increasing humidity (Luck et al. 2011).
One recent example of the impact of plant diseases on agricul-ture in the LAC region is the outbreak of coffee leaf rust (Hemileia
vastratix), considered the most destructive coffee disease, in Central America during the 2012–13 growing season. Around 50 percent of the roughly one million ha under coffee production in the region were affected by the disease, reducing the production quantity by an estimated 17 percent in comparison to the previous year (Ghini et al. 2011; ICO 2013). The outbreak devastated small holder
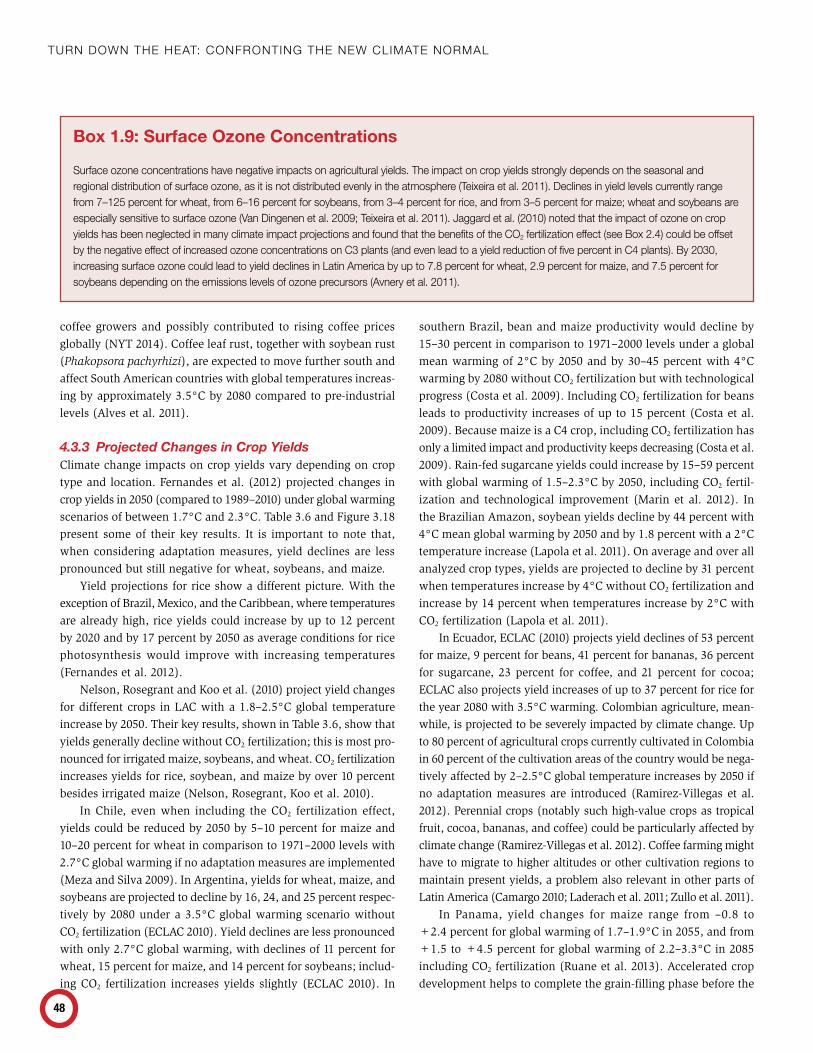
Turn Down The heaT: ConfronTing The new ClimaTe normal
48
coffee growers and possibly contributed to rising coffee prices globally (NYT 2014). Coffee leaf rust, together with soybean rust (Phakopsora pachyrhizi), are expected to move further south and affect South American countries with global temperatures increas-ing by approximately 3.5°C by 2080 compared to pre-industrial levels (Alves et al. 2011).
4.3.3 Projected Changes in Crop YieldsClimate change impacts on crop yields vary depending on crop type and location. Fernandes et al. (2012) projected changes in crop yields in 2050 (compared to 1989–2010) under global warming scenarios of between 1.7°C and 2.3°C. Table 3.6 and Figure 3.18 present some of their key results. It is important to note that, when considering adaptation measures, yield declines are less pronounced but still negative for wheat, soybeans, and maize.
Yield projections for rice show a different picture. With the exception of Brazil, Mexico, and the Caribbean, where temperatures are already high, rice yields could increase by up to 12 percent by 2020 and by 17 percent by 2050 as average conditions for rice photosynthesis would improve with increasing temperatures (Fernandes et al. 2012).
Nelson, Rosegrant and Koo et al. (2010) project yield changes for different crops in LAC with a 1.8–2.5°C global temperature increase by 2050. Their key results, shown in Table 3.6, show that yields generally decline without CO2 fertilization; this is most pro-nounced for irrigated maize, soybeans, and wheat. CO2 fertilization increases yields for rice, soybean, and maize by over 10 percent besides irrigated maize (Nelson, Rosegrant, Koo et al. 2010).
In Chile, even when including the CO2 fertilization effect, yields could be reduced by 2050 by 5–10 percent for maize and 10–20 percent for wheat in comparison to 1971–2000 levels with 2.7°C global warming if no adaptation measures are implemented (Meza and Silva 2009). In Argentina, yields for wheat, maize, and soybeans are projected to decline by 16, 24, and 25 percent respec-tively by 2080 under a 3.5°C global warming scenario without CO2 fertilization (ECLAC 2010). Yield declines are less pronounced with only 2.7°C global warming, with declines of 11 percent for wheat, 15 percent for maize, and 14 percent for soybeans; includ-ing CO2 fertilization increases yields slightly (ECLAC 2010). In
southern Brazil, bean and maize productivity would decline by 15–30 percent in comparison to 1971–2000 levels under a global mean warming of 2°C by 2050 and by 30–45 percent with 4°C warming by 2080 without CO2 fertilization but with technological progress (Costa et al. 2009). Including CO2 fertilization for beans leads to productivity increases of up to 15 percent (Costa et al. 2009). Because maize is a C4 crop, including CO2 fertilization has only a limited impact and productivity keeps decreasing (Costa et al. 2009). Rain-fed sugarcane yields could increase by 15–59 percent with global warming of 1.5–2.3°C by 2050, including CO2 fertil-ization and technological improvement (Marin et al. 2012). In the Brazilian Amazon, soybean yields decline by 44 percent with 4°C mean global warming by 2050 and by 1.8 percent with a 2°C temperature increase (Lapola et al. 2011). On average and over all analyzed crop types, yields are projected to decline by 31 percent when temperatures increase by 4°C without CO2 fertilization and increase by 14 percent when temperatures increase by 2°C with CO2 fertilization (Lapola et al. 2011).
In Ecuador, ECLAC (2010) projects yield declines of 53 percent for maize, 9 percent for beans, 41 percent for bananas, 36 percent for sugarcane, 23 percent for coffee, and 21 percent for cocoa; ECLAC also projects yield increases of up to 37 percent for rice for the year 2080 with 3.5°C warming. Colombian agriculture, mean-while, is projected to be severely impacted by climate change. Up to 80 percent of agricultural crops currently cultivated in Colombia in 60 percent of the cultivation areas of the country would be nega-tively affected by 2–2.5°C global temperature increases by 2050 if no adaptation measures are introduced (Ramirez-Villegas et al. 2012). Perennial crops (notably such high-value crops as tropical fruit, cocoa, bananas, and coffee) could be particularly affected by climate change (Ramirez-Villegas et al. 2012). Coffee farming might have to migrate to higher altitudes or other cultivation regions to maintain present yields, a problem also relevant in other parts of Latin America (Camargo 2010; Laderach et al. 2011; Zullo et al. 2011).
In Panama, yield changes for maize range from –0.8 to +2.4 percent for global warming of 1.7–1.9°C in 2055, and from +1.5 to +4.5 percent for global warming of 2.2–3.3°C in 2085 including CO2 fertilization (Ruane et al. 2013). Accelerated crop development helps to complete the grain-filling phase before the
Box 1.9: Surface Ozone Concentrations
surface ozone concentrations have negative impacts on agricultural yields. the impact on crop yields strongly depends on the seasonal and regional distribution of surface ozone, as it is not distributed evenly in the atmosphere (teixeira et al. 2011). declines in yield levels currently range from 7–125 percent for wheat, from 6–16 percent for soybeans, from 3–4 percent for rice, and from 3–5 percent for maize; wheat and soybeans are especially sensitive to surface ozone (van dingenen et al. 2009; teixeira et al. 2011). Jaggard et al. (2010) noted that the impact of ozone on crop yields has been neglected in many climate impact projections and found that the benefits of the Co2 fertilization effect (see box 2.4) could be offset by the negative effect of increased ozone concentrations on C3 plants (and even lead to a yield reduction of five percent in C4 plants). by 2030, increasing surface ozone could lead to yield declines in latin America by up to 7.8 percent for wheat, 2.9 percent for maize, and 7.5 percent for soybeans depending on the emissions levels of ozone precursors (Avnery et al. 2011).
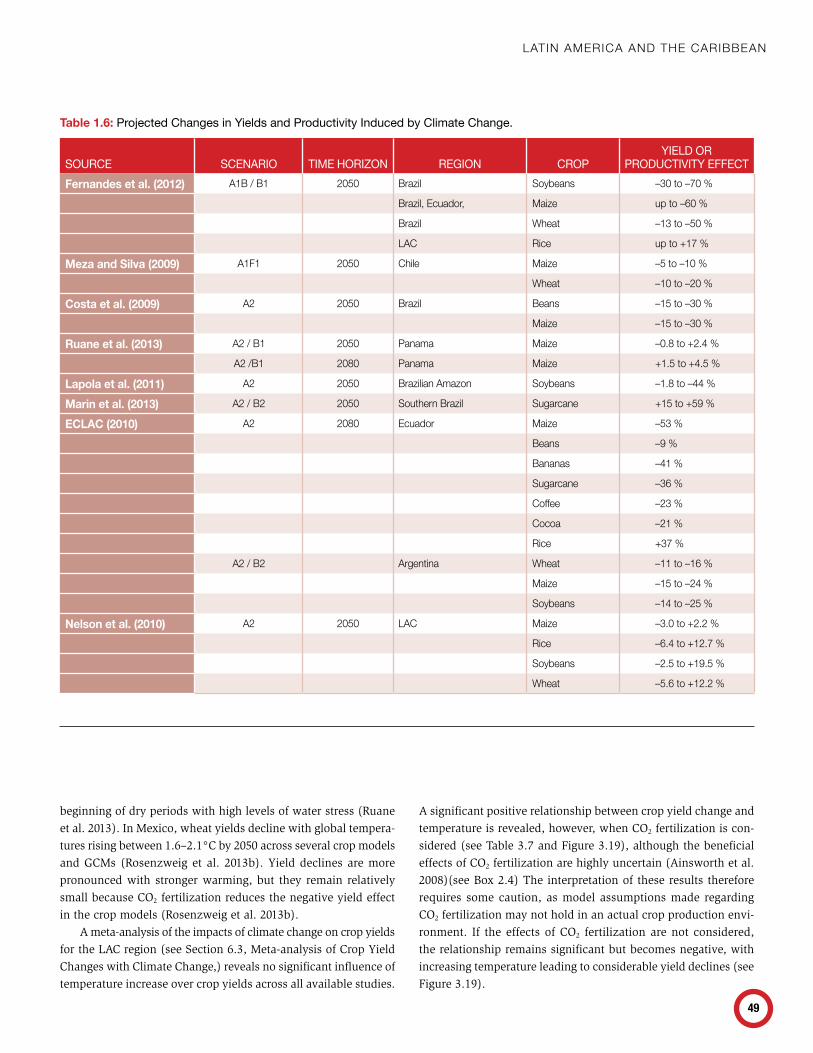
lAtin AmeriCA And the CAribbeAn
49
beginning of dry periods with high levels of water stress (Ruane et al. 2013). In Mexico, wheat yields decline with global tempera-tures rising between 1.6–2.1°C by 2050 across several crop models and GCMs (Rosenzweig et al. 2013b). Yield declines are more pronounced with stronger warming, but they remain relatively small because CO2 fertilization reduces the negative yield effect in the crop models (Rosenzweig et al. 2013b).
A meta-analysis of the impacts of climate change on crop yields for the LAC region (see Section 6.3, Meta-analysis of Crop Yield Changes with Climate Change,) reveals no significant influence of temperature increase over crop yields across all available studies.
A significant positive relationship between crop yield change and temperature is revealed, however, when CO2 fertilization is con-sidered (see Table 3.7 and Figure 3.19), although the beneficial effects of CO2 fertilization are highly uncertain (Ainsworth et al. 2008)(see Box 2.4) The interpretation of these results therefore requires some caution, as model assumptions made regarding CO2 fertilization may not hold in an actual crop production envi-ronment. If the effects of CO2 fertilization are not considered, the relationship remains significant but becomes negative, with increasing temperature leading to considerable yield declines (see Figure 3.19).
Table 1.6: Projected Changes in Yields and Productivity Induced by Climate Change.
SOURCE SCENARIO TIME HORIZON REGION CROPYIELD OR
PRODUCTIVITY EFFECTFernandes et al. (2012) A1b / b1 2050 brazil soybeans –30 to –70 %
brazil, ecuador, maize up to –60 %
brazil wheat –13 to –50 %
lAC rice up to +17 %
Meza and Silva (2009) A1F1 2050 Chile maize –5 to –10 %
wheat –10 to –20 %
Costa et al. (2009) A2 2050 brazil beans –15 to –30 %
maize –15 to –30 %
Ruane et al. (2013) A2 / b1 2050 panama maize –0.8 to +2.4 %
A2 /b1 2080 panama maize +1.5 to +4.5 %
Lapola et al. (2011) A2 2050 brazilian Amazon soybeans –1.8 to –44 %
Marin et al. (2013) A2 / b2 2050 southern brazil sugarcane +15 to +59 %
ECLAC (2010) A2 2080 ecuador maize –53 %
beans –9 %
bananas –41 %
sugarcane –36 %
Coffee –23 %
Cocoa –21 %
rice +37 %
A2 / b2 Argentina wheat –11 to –16 %
maize –15 to –24 %
soybeans –14 to –25 %
Nelson et al. (2010) A2 2050 lAC maize –3.0 to +2.2 %
rice –6.4 to +12.7 %
soybeans –2.5 to +19.5 %
wheat –5.6 to +12.2 %
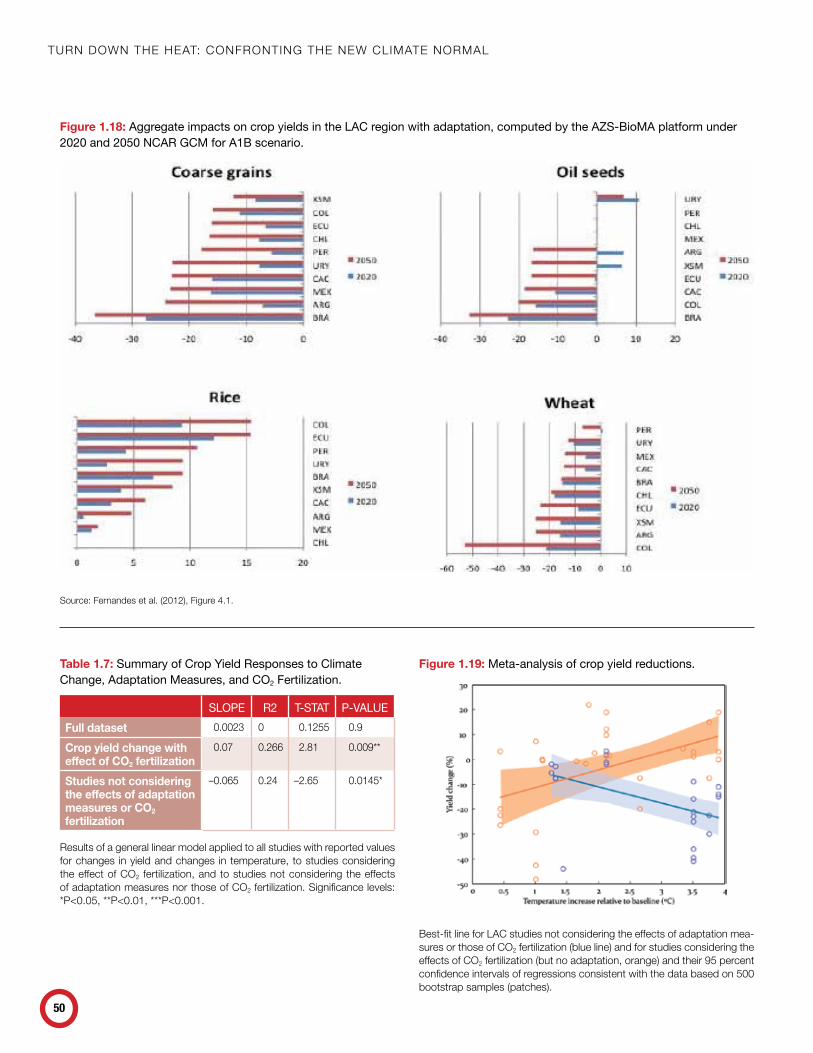
Turn Down The heaT: ConfronTing The new ClimaTe normal
50
Figure 1.19: Meta-analysis of crop yield reductions.
best-fit line for lAC studies not considering the effects of adaptation mea-sures or those of Co2 fertilization (blue line) and for studies considering the effects of Co2 fertilization (but no adaptation, orange) and their 95 percent confidence intervals of regressions consistent with the data based on 500 bootstrap samples (patches).
Table 1.7: Summary of Crop Yield Responses to Climate Change, Adaptation Measures, and CO2 Fertilization.
SLOPE R2 T-STAT P-VALUEFull dataset 0.0023 0 0.1255 0.9
Crop yield change with effect of CO2 fertilization
0.07 0.266 2.81 0.009**
Studies not considering the effects of adaptation measures or CO2 fertilization
–0.065 0.24 –2.65 0.0145*
results of a general linear model applied to all studies with reported values for changes in yield and changes in temperature, to studies considering the effect of Co2 fertilization, and to studies not considering the effects of adaptation measures nor those of Co2 fertilization. significance levels: *p<0.05, **p<0.01, ***p<0.001.
Figure 1.18: Aggregate impacts on crop yields in the LAC region with adaptation, computed by the AZS-BioMA platform under 2020 and 2050 NCAR GCM for A1B scenario.
source: Fernandes et al. (2012), Figure 4.1.
lAtin AmeriCA And the CAribbeAn
51
To conclude, the possible effects of climate change on crop yields in the region are very diverse. Yield impacts differ among regions and crops and also among different GCMs, emissions sce-narios, and crop models (see Table 3.6) (Berg et al. 2013). Most of the effects of rising temperatures are expected to be negative, even if lessened CO2 fertilization (which introduces large uncertainties into the impact projections). For some crops, however, increasing temperatures might have positive effects, such as increasing yields for rice and sugarcane.
4.3.4 Climate Change Impacts on LivestockThe livestock sector in the LAC region is of high economic importance, especially in major livestock producing and export-ing countries Brazil and Argentina (ECLAC et al. 2012), and the impacts of climate change on livestock systems in developing countries are diverse (Thornton et al. 2009). Climate change can severely impact the quantity and quality of feed, as rising tem-peratures, increasing atmospheric CO2 concentrations, and changes in precipitation patterns influence the availability of nutrients, the productivity of grasslands, and the composition of pastures. Furthermore, heat stress directly affects livestock productivity. Cattle, in particular, are susceptible to high temperatures. Heat stress is known to reduce food intake and milk production and also to affect reproduction, growth, and cattle mortality rates (Porter et al. 2014). Higher temperatures are also closely linked to growing water demand for livestock, increasing the competition and demand for water in water-scarce regions. More scientific research is needed, meanwhile, on the effects of climate change on livestock diseases and livestock biodiversity.
4.3.5 Projected Impacts on LivestockWith a 2.7°C warming by 2060, livestock species choice (i.e., the adoption of new livestock) is projected to decline across Argen-tina, Brazil, Chile, Colombia, Ecuador, Uruguay, and Venezuela by 3.2 percent for beef cattle; by 2.3 percent for dairy cattle; by 0.9 percent for chicken; and by 0.5 percent for pigs. Meanwhile, the adoption of sheep species is projected to increase by an aver-age of 7 percent across the region, and by more in Colombia (11.3 percent), Chile (14.45 percent), and Ecuador (19.27 percent) (Seo et al. 2010).
With a lower warming of 1.3–2.3°C by 2060, the pattern of declining livestock species choice for beef cattle, dairy cattle, chicken, and pigs, and the increasing choice of sheep, remains the same but is less pronounced (Seo et al. 2010). According to Seo et al. (2010), the choice of sheep increases with increasing temperatures and decreasing precipitation because sheep are better adapted to these conditions than other livestock species. In Paraguay, beef cattle production is projected to increase by 4.4 percent by 2020, but then decline by 7.4 percent by 2050 and 27.1 percent by 2080 in a scenario leading to 3.5°C regional warming (ECLAC 2010). Beef cattle production is projected to decline by 1.5 percent by
2020, by 16.2 percent by2050, and by 22.1 percent by 2080 with 2.9°C regional warming (ECLAC 2010).
4.3.6 Climate Change Impacts on Food SecurityNelson, Rosegrant and Koo et al. (2010) project that international crop prices will increase significantly even when ignoring climate change—mainly driven by population growth, income growth, and demand for biofuels. The price of wheat is projected to increase by 39 percent, rice by 62 percent, maize by 63 percent, and soybeans by 72 percent. Including climate change with global mean temperature increasing by 2.5 °C by 2050, and without CO2 fertilization, would accelerate price increases by an additional 94–111 percent for wheat, 32–37 percent for rice, 52–55 percent for maize, and 11–14 percent for soybeans. Including CO2 fertilization would lead to less severe price increases by 2050 (Nelson, Rose-grant, Koo et al. 2010). These results are confirmed by the IPCC AR5 report: Increasing food prices as a consequence of changing climatic conditions are to be expected by 2050 without taking the CO2 fertilization effect into account; including elevated CO2 will temper price increases (Porter et al. 2014).
Climate change poses great risks to the economic develop-ment of Latin America and the Caribbean; it not only threatens economic growth but also poverty reduction and food security (ECLAC 2010). Without climate change, calorie availability would be expected to increase by 3.7 percent, up to 2,985 calories per capita in 2050 in LAC (Nelson, Rosegrant, Koo et al. 2010). How-ever, with climate change and without CO2 fertilization, per capita calorie availability in 2050 is expected to drop below the value for the year 2000 (2,879 calories per capita) (Nelson, Rosegrant, Koo et al. 2010). These projections show that climate change threatens food security, especially for people with low incomes, as access to food is highly dependent on income (FAO 2013). The cascading impacts of warming that reduce productivity in other sectors apart from agriculture can further reduce economic output and negatively affect incomes (Porter et al. 2014). Results from a Brazilian study (Assad et al. 2013) on climate change impacts on agriculture to 2030 project that Brazil could face a reduction of approximately 11 million hectares of high quality agricultural land as a result of climate change with the South Region (current grain belt) being the worst impacted losing ~5 million ha of ‘low climate risk’ crop land. The increase in climate risk in the south could be partially offset by transferring grain production to the central region currently occupied by low productivity pastures (sub regional reallocation). Intensification of livestock and pasture systems will also offset projected losses due to climate change. In general, however, the production declines can be expected to impact prices, domestic demand, and net exports of most crops/livestock products. Simulations from this study across all the climate change scenarios suggest that rising staple and export crop and beef prices could double the agricultural contribution to Brazil’s economy.
Turn Down The heaT: ConfronTing The new ClimaTe normal
52
4.3.7 SynthesisThe results of the climate change impact projections on crop yields differ among studies, but most authors agree that climate change will very likely decrease agricultural yields of important food crops in LAC (see Table 3.6) (ECLAC 2010; Fernandes et al. 2012; Nelson, Rosegrant, Koo et al. 2010). An exception is the possible yield development of rice in some regions (ECLAC 2010; Fernandes et al. 2012; Nelson, Rosegrant, Koo et al. 2010). Although studies on climate change impacts on livestock are scarce (Thornton et al. 2009), the few studies that are available indicate that beef and dairy cattle production will decline under increasing temperatures, as heat stress is a major influencing factor of cattle productivity (Seo et al. 2010; Thornton et al. 2009). Sheep production could become more important in the future, as sheep are better adapted to warmer and drier conditions than cattle and pigs (Seo et al. 2010).
4.4 Climate Change Impacts on Biodiversity
4.4.1 Current Status and Current Threats to BiodiversityBiodiversity, the diversity of genes, populations, species, communi-ties, ecosystems, and biomes, is the foundation for all ecosystem processes (MEA 2005). Climate change is a major threat to biodi-versity, as species have evolved to live within specific temperature ranges that may be surpassed faster than species are able to adapt.
South America is a biodiversity hotspot, particularly due to the large extent of tropical rainforests (MEA 2005; Myers et al. 2000) and the continent’s long geographical isolation until approxi-mately 3 million years ago—which together have nurtured a high number of endemic species. Habitat destruction and fragmenta-tion by land-use change as well as the commercial exploitation of species groups are currently larger threats to biodiversity than climate change (e.g., Hof et al. 2011). Land-use change is expected to have a greater impact on plants than climate change by 2050, after which climate change becomes increasingly important for species loss (MEA 2005; Vuuren et al. 2006).
4.4.2 Impacts of Future Climate Change on BiodiversityForecasts of future changes in biodiversity are generally alarming (e.g., Bellard et al. 2012; Foden et al. 2013). Using a global meta-analysis, MacLean and Wilson (2011) found a mean extinction probability of 10 percent by 2100 across taxa, regions, and warming
levels. Warren et al. (2013) found that, globally, 57 percent of plants and 34 percent of animals will lose greater than 50 percent of their habitat in a 4°C world.
A comparative review of different model predictions across taxa and regions revealed a large variability in the predicted ranges of biodiversity loss, especially at the local level (Bellard et al. 2012). One reason for this variability is that there is still high uncertainty about the capacity of species to buffer the effects of climate change (Moritz and Agudo 2013). Nonetheless, Scholes et al. (2014) state that there is “high confidence that climate change will contribute to increased extinction risk for terrestrial and freshwater species over the coming century.”
4.4.3 Projections of Potential Future Shifts in Ecosystems and EcoregionsThe G200 ecoregions (Olson and Dinerstein 2002) located in Latin America and the Caribbean may experience severe climate change in the future (Beaumont et al. 2010). Li et al. (2013) found strong local climatic changes in the ecoregions Coastal Venezuela Montane Forests, Amazon River and Flooded Forests, and Atlantic Dry Forests for 2–4°C global warming. Further, 38.4 percent of the surface of the biodiversity hotspot of Tumbes-Choco-Magdalena and 11.5 percent of the Mesoamerican biodiversity hotspot will be experiencing no-analogue climates in a warmer than 2°C world (Garcia-Lopez et al. 2013).
Heyder et al. (2011) find a range of small to severe eco-system changes for the whole South American continent in their projections for a 2°C and warmer world. In a 4°C world, results of one dynamic vegetation model show severe ecosystem changes for more than 33 percent of the area in 21 out of 26 distinct biogeographic regions in South America (Gerten et al. 2013). Warszawski et al. (2013), meanwhile, projected such severe ecosystem changes in a 3°C world in South America (notably in Amazon, Guyana moist forests, and Brazilian Cer-rado) when applying an ensemble of seven dynamic vegeta-tion models. Imbach et al. (2012) projected that such severe ecosystem changes at global mean warming levels greater than 3°C would lead to a considerable decrease in tree cover, indi-cated by a change in leaf area index of more than 20 percent across 77–89 percent of the area. Bellard et al. (2014) projected that out of 723 Caribbean islands, 63 and 356 of them will be entirely submerged under one and six meters of sea-level rise, respectively. They also found that 165 of the islands will be at
Box 1.10: Critical Ecosystem Services of High Andean Mountain Ecosystems
A highly critical ecosystem service provided by the lAC region is that of carbon storage. For example the ecosystems of the Andean mountains, including tropical montane cloud forests, the high-altitude wetlands, and the páramos ecosystem, store large amounts of carbon. despite the fact that they cover a mere 3 percent of global land area they store about 30 percent of the global carbon stock of terrestrial ecosystems (peña et al. 2011). Further, numerous large cities (such as Quito, bogota or la paz) extract part of their water supply from páramos areas.
lAtin AmeriCA And the CAribbeAn
53
least half-submerged (i.e., having lost more than 50 percent of their area) under one meter of sea-level rise, and 533 under six meters of sea-level rise. While a six meter sea-level rise is not realistically expected to happen within this century, a one meter sea-level rise is within the range of sea-level rise projected under a global mean warming of 4°C at the end of this century (see Section 3.7, Regional Sea-level Rise).
4.4.4 Projections of Habitat Changes, Species Range and Distribution Shifts, and Extinction Risks for Species and Species GroupsMicroorganismsLittle is known about the consequences of future climate change on microbial biodiversity due to the complex microbial feedback loops within the climate system (Singh et al. 2010). The ratio between heterotrophic soil bacteria and fungi will likely be affected (Rinnan et al. 2007). Generally, temperature increase stimulates microbial growth and accelerates decomposition, which leads to an increase in heterotrophic respiration (Davidson and Janssens 2006).
Invertebrates Insects act as pollinators to ensure plant fertilization, but they may also emerge as pests. Climate change affects temperature-driven reproductive cycles of many insect populations. In a 4°C world, Deutsch et al. (2008) projected a range contraction of 20 percent for tropical insects, because tropical insects will face near-lethal temperatures much faster than those in temperate climates. Estay et al. (2009) projected an increase in insect population densities of grain pests in Chile of 10–14 percent in a 3°C world and 12–22 percent in a 4°C world.
Amphibians and ReptilesDue to the difficulties in entangling the relative contributions of climate versus land use change, Scholes et al. (2014) stated that “due to low agreement among studies, there is only medium
confidence in detection of extinctions and attribution of Central American amphibian extinctions to climate change.” Amphibians are particularly vulnerable because, due to their permeable skin, they depend on constant water availability at least during some periods of their life cycle. Loyola et al. (2013) found that most of the 444 amphibian species in the Atlantic Forest Biodiversity hotspot in Brazil could increase their range, while 160 species would face range contractions with 1.9°C global warming in 2050. A more recent projection for 2050 includes different dispersal scenarios for the amphibians in this region and projects a majority of the 430 amphibian species would face range contractions accompanied by an overall species loss with 1.9°C global warming (Lemes et al. 2014). Already in a 2°C world, 85–95 percent of species face net loss in range size, and 13–15 percent of species would lose 100 percent of their current range depending on the modeled dispersal limitation (Lawler et al. 2009). In a 4°C world, most ecoregions are projected to experience at least 30 percent species turnover, and many in western South America and Central America
to experience at least 50 percent species turnover, so that future communities would bear little resemblance to the currently estab-lished ones (Lawler et al. 2009). In a greater than 3°C world, the entire LAC region would experience high bioclimatic unsuitability for amphibians in general (many grid cells between 50–80 percent loss). In the Northern Andes, 166 frog species (73 percent of local frog fauna) and, in Central America, 211 species (66 percent of local salamander fauna), would lose their local climatic suitability between 2070–2099 (Hof et al. 2011).
Based on historical data, Sinervo et al. (2010) assume that if the rate of change in maximum air temperature at 99 Mexican weather stations continues unabated by 2080, 56 percent of the viviparous lizard species would go extinct by 2050 and 66 percent by 2080; of the oviparous species, 46 percent would go extinct by 2050 and 61 percent by 2080. By 2080, the predicted loss of suitable areas for the royal ground snake (Liophis reginae) is 30 percent (Mesquita et al. 2013).
Sea-level rise will affect the reproductive behavior of sea turtles, which return to the same nesting sites every breeding season and therefore rely on relatively constant shorelines for laying their eggs. Fish et al. (2005) predict a 14/31/50 percent habitat loss of nest-ing sites for endangered sea turtles by 2050 under 0.2/0.5/0.9 m sea-level rise respectively on Bonaire Island. Narrow and shallow beaches are predicted to be most vulnerable, but turtles seem to prefer steep slopes which might to some extent alleviate climate change impacts at their preferred nesting sites.
BirdsBirds are most diverse in the tropics where they typically have smaller home ranges than migratory birds in temperate zones (Jetz et al. 2007). This renders tropical bird diversity especially vulner-able to extinctions caused by climate change and accompanying habitat destruction. Anciaes et al. (2006) projected that 50 percent of 49 neotropical manakin (passerine bird) species will have lost more than 80 percent of their current habitat by around 2055 with mean global warming of 2°C. For a similar time frame and warming scenario, Souza et al. (2011) projected that 44 of 51 endemic Brazil-ian Atlantic forest bird species would lose their distribution area by 2050, which corresponds to a habitat reduction of 45 percent of the original area. The study assumes that the entire area of the Atlantic forest is suitable for these bird species. However, about 80 percent of the Atlantic forest is already deforested, and most remaining forest areas are fragmented and isolated. Twenty-six Cerrado bird species face 14–80 percent range contractions under a no-dispersal scenario, and they face a 5 percent range increase to a 74 percent range decrease under a full-dispersal scenario in a 3°C world (Marini et al. 2009).
MarsupialsMost of the 55 marsupial species found in Brazil inhabit forested areas and are therefore exposed to both climate change and land use change caused by deforestation. Loyola et al. (2012) found that marsupial species in Brazil face range contractions of
Turn Down The heaT: ConfronTing The new ClimaTe normal
54
67 percent of their original habitat with mean global warming of approximately 2°C by 2050.
MammalsSchloss et al. (2012) projected that up to 39 percent of the mammals in the Neotropics would be unable to keep pace with climate-change velocity due to their limited dispersal abilities in a 4°C world. Torres, Jayat and Pacheco (2012) projected an at least 33 percent habitat loss for the maned wolf (Chrysocyon brachyurus) in Central South America with 2°C global warming by 2050.
Plant SpeciesPlants are especially vulnerable to climate change because indi-vidual plants cannot migrate to avoid thermal stress. As a result, their dispersal mode will largely determine to what extent they may be able to adapt to changing climatic conditions. Moreover, plants directly respond to elevated atmospheric CO2 levels (see Box 2.4)—but the degree to which some plant species may ben-efit from rising CO2 levels is still being debated (Cox et al. 2013; Rammig et al. 2010).
Brazil is the country with the largest number of vascular plant species (>50,000) on Earth (ICSU-LAC 2010, p.57). Most future projections paint a bleak picture for plant biodiversity, mostly due to land-use change as a result of deforestation and, increasingly, the impacts of climate change. Simon et al (2013) projected a reduction in geographic distribution of 78 percent (±7 percent) in a >2°C world for 110 Brazilian Cerrado plant species. Feeley et al (2012) projected a loss of suitable habitat area in the Amazon region of between 8.2–81.5 percent in a 2°C world and 11.6–98.7 percent in a 4°C world, and a change in plant species richness between –4.1 percent to –89.8 percent in a 2°C world and –25.0 percent to complete loss for the studied species in a 4°C world. In Mexico, even common species are under threat, and great differences in species response (0.1–64 percent loss) to regional warming above 1.5°C in 2050 even among related tree species (e.g., oak trees) are being projected (Gómez-Mendoza and Arriaga 2007).
Species GroupsMost studies on range contractions focus on single species or spe-cies groups; fewer studies have attempted to project the impact of future climate change at the community or biome level. Rojas-Soto et al. (2012) projected a reduction of 54–76 percent in the extent of the Mexican cloud forest with 2°C global warming by 2050. They concluded that this reduction forces tree communities to move about 200 m to higher elevations. Similarly, Ponce-Reyes et al. (2012) projected a 68 percent loss of suitable area for cloud forests in Mexico with a global warming of 3°C by 2080. Alarm-ingly, 90 percent of the cloud forest that is currently protected will not be climatically suitable for this ecosystem by 2080. As a consequence, climate change may lead to the extinction of 9 of the 37 vertebrate species restricted to Mexican cloud forests. With an increase of global mean temperature of 0.8–1.7°C by 2050,
2–5 percent of mammal species, 2–4 percent of bird species, and 1–7 percent of butterfly species in Mexico, as well as 38–66 per-cent of plant species in the Brazilian Cerrado, would go extinct (Thomas et al. 2004). At a warming of 1.8–2.0°C, these values increase to 2–8 percent, 3–5 percent, and 3–7 percent respectively. With an increase in global mean temperature of greater than 2°C, 44–79 percent of plant species in Amazonia are projected to go extinct (Thomas et al. 2004).
SynthesisClimate change induced negative effects on biodiversity, from range contractions to extinctions, are very likely in a warmer than 2°C world. Climate change impacts on local biodiversity by 2100 will depend on the balance between the number of species abandoning an area and those facing local extinctions versus the number of species invading that same area due to thermal stress. Species and species communities are possibly threatened by range contractions, extinctions, predator/prey disruptions, and phenology changes due to climate and land use changes. Their opportunity to survive in this changing environment lies in their capacity to adapt to these new conditions or to migrate to avoid them. As the adaptive capacity of affected species and ecosystems is hard to project or quantify, models need to use simplified approaches as implemented in bioclimatic envelope models, species-distribution models, and dynamic global vegetation models.
One clear trend regarding future warming levels is that the more temperatures are projected to increase, the more species diversity is affected. Mountainous regions in the tropics (e.g., cloud forests) are projected to become very vulnerable due to their high number of endemic and highly specialized species which might face mountaintop extinctions. Most models do not take biotic interactions (e.g., food-web interactions, species competition) and resource limitations into account. Therefore, the realized ecologi-cal niche of species within an ecosystem might be much smaller than what is potentially possible according to climatic and other environmental conditions leading to shifts in ecological zones.
4.5 Amazon Rainforest Dieback and Tipping Point
Old-growth rainforests in the Amazon basin store approximately 100 billion tons of carbon in their biomass (Malhi et al. 2006; Saatchi et al. 2011). Through evapotranspiration, Amazon rainfor-ests recycle 28–48 percent of precipitation and contribute to local rainfall (van der Ent et al. 2010). A loss of these forest ecosystems due to climate change would release an enormous amount of carbon into the atmosphere and reduce their evapotranspiration potential (thereby reducing atmospheric moisture); this would lead to strong climate feedbacks (Betts et al. 2004; Costa and Pires 2010; Cox et al. 2004). These climate feedbacks, in combination with large-scale deforestation, put the Amazon rainforest on the list of potential tipping elments in the Earth system (Lenton et al. 2008).
lAtin AmeriCA And the CAribbeAn
55
Factors Leading to Forest Dieback and Potential FeedbacksObservations of the Current PeriodCurrent observations show that forests in Amazonia are adapted to seasonal drought (Davidson et al. 2012) mainly due to the ability to access deep soil water through deep rooting systems (Nepstad et al. 1994). It has been long debated, however, whether the productivity of tropical rainforests during the dry season is more limited by precipitation or by cloud cover. Depending on the method used, remote sensing or modeling, seasonal droughts were thought to enhance productivity either by more light entering the canopy through reduced cloud cover, or by the combined effects of several interconnected processes (Brando et al. 2010; Huete et al. 2006). These findings have been challenged by remote sensing experts who ascribe greening effects to saturation of the satellite sensor used (Samanta et al. 2011) or to changes in the optical constellation of the sensor (near-infrared reflectance) (Morton et al. 2014). Recent evidence from a large-scale and long-term experiment suggests that the feedbacks between climatic extreme events such as droughts and forest fires increase the likelihood of an Amazon dieback (Brando et al. 2014).
Extreme weather events in the Amazon may have several causes. The drought events in 2005 and 2010 were not related to El Niño but rather to high Atlantic sea-surface temperatures (Marengo et al. 2011). Cox et al. (2008) found the gradient between northern and southern tropical Atlantic lead to a warmer and drier atmosphere over the Amazon. Atypically low rainfall inflicted water stress on 1.9 million km² (2005) and 3.0 million km² (2010) of forest area (Lewis et al. 2011). As a result, approximately 2.5 million km² (2005) and 3.2 million km² (2010) of forest area were affected by increased tree mortality and reduced tree growth due to water stress (Lewis et al. 2011). These two droughts are thought to have reversed the currently assumed role of the intact forest as a carbon sink and lead to decreased carbon storage of approximately 1.6 Pg carbon (2005) and 2.2 Pg carbon (2010) compared to non-drought years (Lewis et al. 2011; Phillips et al. 2009).34 The 2005 drought reversed a long-term carbon sink in 136 permanent measurement plots (Phillips et al. 2009).
Two multi-year rainfall exclusion experiments in Caxiuanã and Tapajós National Forest generated remarkably similar results of drought-induced tree mortality. These experiments demonstrated that once deep soil water is depleted, wood production is reduced by up to 62 percent, aboveground net primary productivity declines by 41 percent, and mortality rates for trees almost double (Brando et al. 2008; Costa and Pires 2010; Nepstad et al. 2007). Thus, an increase in extreme droughts in the Amazon region (medium con-fidence for Central South America in the IPCC SREX)(IPCC 2012) or a prolonged dry season (Fu et al. 2013) may have the potential
34 The combination of reduced uptake of carbon due to the drought and loss of carbon due to drought induced tree mortality and decomposition committed over several years.
to cause large-scale forest dieback and to increase atmospheric CO2 concentrations.
Extreme drought events in combination with land use changes lead to an increased frequency in forest fires because the flamma-bility of forests increases with a more open forest canopy (i.e., as it allows more radiation to dry out the forest surface and enhance fire spread) (Ray et al. 2005). Fires were twice as frequent in 2005 as during the average of the previous seven years and they were spatially concentrated in the arc of deforestation in the southern Amazon (Zeng et al. 2008). Increasing fires resulting from defor-estation, pasture renewal, and other land-use-related activities increase the vulnerability of the Amazon rainforest to fire and cause changes in forest composition and productivity (Brando et al. 2012; Morton et al. 2013). This interplay of factors is thought to initiate a positive bidirectional feedback loop between fire and forest which could initialize forest transformation into savannahs and contribute to the Amazon tipping point (Nepstad et al. 2001, 2008). Basin-wide measurements show that the combined effects of fire and drought can change the Amazon into a carbon source (e.g., with 0.48 PgC emitted in 2010); it remains carbon-neutral, meanwhile, during wet years (Gatti et al. 2014).
Deforestation is feared to influence the lateral moisture transport from coastal to inland areas because convective precipitation is responsible for recycling precipitation locally. Walker et al. (2009) showed that the current distribution of conservation areas in the Amazon basin, which cover approximately 37 percent of the area, would be sufficient to maintain regional moisture transport and recycling of precipitation when considering different deforesta-tion rates. Influences of dynamic vegetation on water fluxes and eventual carbon-climate feedbacks were not part of this study.
Future ProjectionsWater StressThe Maximum Climatological Water Deficit (MCWD) (Aragão et al. 2007) is an indicator for drought intensity and plant water stress and correlates to tree mortality. For the period 2070–2099, 17 out of 19 GCMs project increased water stress for Amazon rainforests in a 3°C world (which implies a mean regional warming of 5°C) (Malhi et al. 2009). Ten of 19 GCM projections passed the approximate bioclimatic threshold from rainforest to seasonal forest (MCWD<–200 mm). Similarly, Zelazowski et al. (2011) projected water stress for forests to increase from 1980–2100 with an increase in global mean temperature of 2–4°C above pre-industrial levels. They found that humid tropical forests of Amazonia would retreat by 80 percent for two out of 17 GCMs. Seven other models projected at least a 10 percent contraction of the current extent of humid tropical forest.
Changes in Forest Cover Hirota et al. (2010) simulated potential changes in Amazon for-est cover. At a regional temperature increase of 2°C, forest cover decreased by 11 percent along with a 20 percent reduction in precipitation in the Western Amazon forest (66°W). At a regional
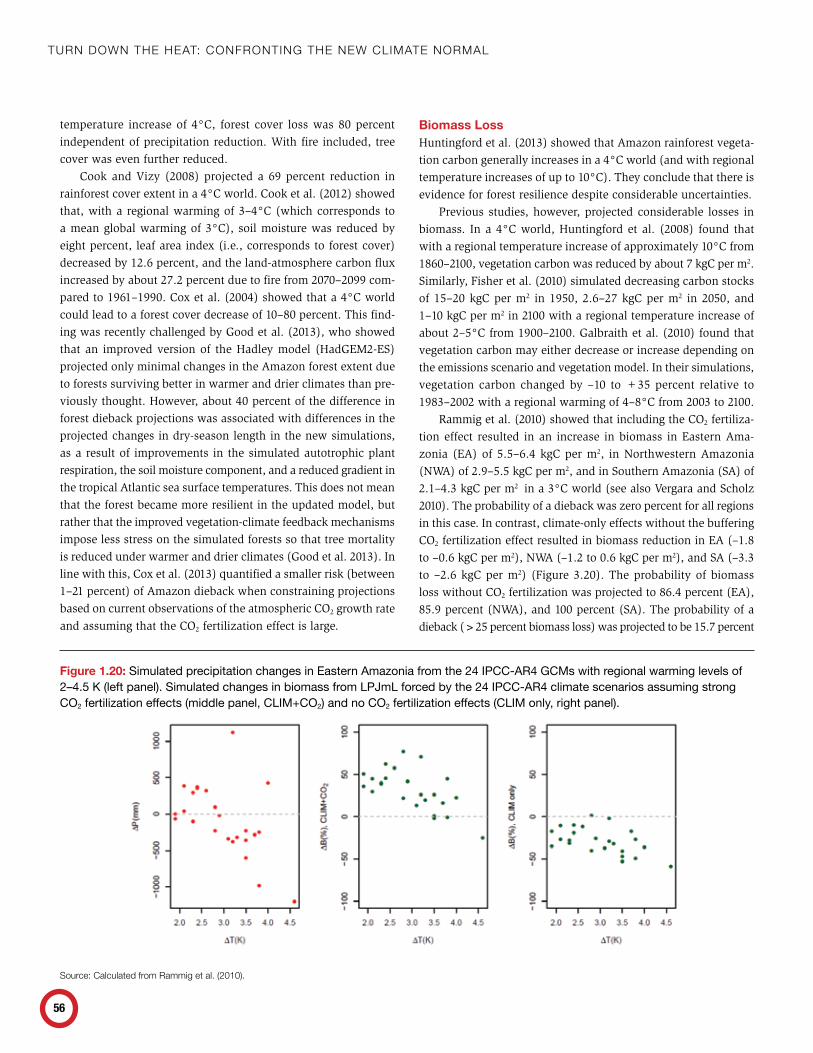
Turn Down The heaT: ConfronTing The new ClimaTe normal
56
temperature increase of 4°C, forest cover loss was 80 percent independent of precipitation reduction. With fire included, tree cover was even further reduced.
Cook and Vizy (2008) projected a 69 percent reduction in rainforest cover extent in a 4°C world. Cook et al. (2012) showed that, with a regional warming of 3–4°C (which corresponds to a mean global warming of 3°C), soil moisture was reduced by eight percent, leaf area index (i.e., corresponds to forest cover) decreased by 12.6 percent, and the land-atmosphere carbon flux increased by about 27.2 percent due to fire from 2070–2099 com-pared to 1961–1990. Cox et al. (2004) showed that a 4°C world could lead to a forest cover decrease of 10–80 percent. This find-ing was recently challenged by Good et al. (2013), who showed that an improved version of the Hadley model (HadGEM2-ES) projected only minimal changes in the Amazon forest extent due to forests surviving better in warmer and drier climates than pre-viously thought. However, about 40 percent of the difference in forest dieback projections was associated with differences in the projected changes in dry-season length in the new simulations, as a result of improvements in the simulated autotrophic plant respiration, the soil moisture component, and a reduced gradient in the tropical Atlantic sea surface temperatures. This does not mean that the forest became more resilient in the updated model, but rather that the improved vegetation-climate feedback mechanisms impose less stress on the simulated forests so that tree mortality is reduced under warmer and drier climates (Good et al. 2013). In line with this, Cox et al. (2013) quantified a smaller risk (between 1–21 percent) of Amazon dieback when constraining projections based on current observations of the atmospheric CO2 growth rate and assuming that the CO2 fertilization effect is large.
Biomass LossHuntingford et al. (2013) showed that Amazon rainforest vegeta-tion carbon generally increases in a 4°C world (and with regional temperature increases of up to 10°C). They conclude that there is evidence for forest resilience despite considerable uncertainties.
Previous studies, however, projected considerable losses in biomass. In a 4°C world, Huntingford et al. (2008) found that with a regional temperature increase of approximately 10°C from 1860–2100, vegetation carbon was reduced by about 7 kgC per m2. Similarly, Fisher et al. (2010) simulated decreasing carbon stocks of 15–20 kgC per m2 in 1950, 2.6–27 kgC per m2 in 2050, and 1–10 kgC per m2 in 2100 with a regional temperature increase of about 2–5°C from 1900–2100. Galbraith et al. (2010) found that vegetation carbon may either decrease or increase depending on the emissions scenario and vegetation model. In their simulations, vegetation carbon changed by –10 to +35 percent relative to 1983–2002 with a regional warming of 4–8°C from 2003 to 2100.
Rammig et al. (2010) showed that including the CO2 fertiliza-tion effect resulted in an increase in biomass in Eastern Ama-zonia (EA) of 5.5–6.4 kgC per m2, in Northwestern Amazonia (NWA) of 2.9–5.5 kgC per m2, and in Southern Amazonia (SA) of 2.1–4.3 kgC per m2 in a 3°C world (see also Vergara and Scholz 2010). The probability of a dieback was zero percent for all regions in this case. In contrast, climate-only effects without the buffering CO2 fertilization effect resulted in biomass reduction in EA (–1.8 to –0.6 kgC per m2), NWA (–1.2 to 0.6 kgC per m2), and SA (–3.3 to –2.6 kgC per m2) (Figure 3.20). The probability of biomass loss without CO2 fertilization was projected to 86.4 percent (EA), 85.9 percent (NWA), and 100 percent (SA). The probability of a dieback (>25 percent biomass loss) was projected to be 15.7 percent
Figure 1.20: Simulated precipitation changes in Eastern Amazonia from the 24 IPCC-AR4 GCMs with regional warming levels of 2–4.5 K (left panel). Simulated changes in biomass from LPJmL forced by the 24 IPCC-AR4 climate scenarios assuming strong CO2 fertilization effects (middle panel, CLIM+CO2) and no CO2 fertilization effects (CLIM only, right panel).
source: Calculated from rammig et al. (2010).
lAtin AmeriCA And the CAribbeAn
57
(EA), 1.1 percent (NWA), and 61 percent (SA) (Rammig et al. 2010). These results imply that understanding the still uncertain strength of the CO2 fertilization effect is critical for an accurate prediction of the Amazon tipping point; it therefore urgently requires further empirical verification by experimental data from the Amazon region.
Deforestation and forest degradation, for example from selec-tive logging (Asner et al. 2005), are also factors which crucially influence future changes in vegetation carbon. Gumpenberger et al. (2010) found relative changes in carbon stocks of –35 percent to +40 percent in a protection scenario without deforestation and –55 percent to –5 percent with 50 percent deforestation in a 4°C world. Poulter et al. (2010) found a 24.5 percent agreement of projections for a decrease in biomass in simulations with 9 GCMs in a 4°C world.
Large-Scale Moisture TransportSeveral studies show that changes in moisture transport and regional precipitation are strongly linked to deforestation. Costa and Pires (2010) found in simulation runs with a coupled climate-vegetation model that precipitation was reduced in 9–11 of 12 months under different deforestation scenarios (based on Soares-Filho et al. 2006). Sampaio et al. (2007) performed simulations with a coupled climate-vegetation model for different agricultural regimes and deforesta-tion scenarios of 20–100 percent for the Amazon basin (based on Soares-Filho et al. 2006). When replacing forest with pasture, they projected a 0.8°C increase in regional temperature and a 0.2 percent reduction in precipitation at 20 percent deforestation levels. At 40 per-cent deforestation levels, regional temperatures increased by 1.7°C and precipitation was reduced by –2.2 percent. At 50–80 percent deforestation, regional temperatures increased by 1.8–2–1°C and precipitation decreased by 5.8–14.9 percent. When replacing forest with soybeans at 50 percent deforestation, regional temperatures increased by 2.9°C and precipitation decreased by 4.6 percent. At 80–100 percent deforestation, regional temperatures increased by 3.7–4.2°C and precipitation decreased by 19.2–25.8 percent.
FireStudies projecting future fires in the Amazon are still scarce. Fires are projected to increase along major roads in the southern and southwestern part of Amazonia with a 1.8°C global warming by 2040–2050 (Silvestrini et al. 2011; Soares-Filho et al. 2012). High rates of deforestation would contribute to an increasing fire occur-rence of 19 percent by 2050, whereas climate change alone would account for a 12 percent increase (Silvestrini et al. 2011). Drought and anthropogenic fire incidences could significantly increase the risk of future fires especially at the southern margin of the Amazon (Brando et al. 2014). If deforestation can be excluded in protected areas, future fire risk would be evenly reduced, emphasizing the management option to increase carbon storage when avoiding or reducing forest degradation (Silvestrini et al. 2011; Soares-Filho et al. 2012).
4.5.1 SynthesisIntensive research efforts over the past decades have enormously improved the understanding and interaction of processes linking climate, vegetation dynamics, land-use change, and fire in the Amazon. However, the identification of the processes and the quantification of thresholds at which an irreversible approach toward a tipping point is triggered (e.g., a potential transition from forest to savannah) are still incomplete.
Overall, the most recent studies suggest that the Amazon dieback is an unlikely, but possible, future for the Amazon region (Good et al. 2013). Projected future precipitation and the effects of CO2 fertilization on tropical tree growth remain the processes with the highest uncertainty. Climate-driven changes in dry season length and recurrence of extreme drought years, as well as the impact of fires on forest degradation, add to the list of unknowns for which combined effects still remain to be investigated in an integrative study across the Amazon. A critical tipping point has been identified at around 40 percent deforestation, when altered water and energy feedbacks between remaining tropical forest and climate may lead to a decrease in precipitation (Sampaio et al. 2007).
A basin-wide Amazon forest dieback caused by feedbacks between climate and the global carbon cycle is a potential tipping point of high impact. Such a climate impact has been proposed if regional temperatures increase by more than 4°C and global mean temperatures increase by more than 3°C toward the end of the 21st century. Recent analyses have, however, downgraded the probability from 21 percent to 0.24 percent for the 4°C regional warming level when coupled carbon-cycle climate models are adjusted to better represent the inter-annual variability of tropical temperatures and related CO2 emissions (Cox et al. 2013). This holds true, however, only when the CO2 fertilization effect is realized as implemented in current vegetation models (Rammig et al. 2010). Moreover, large-scale forest degradation as a result of increasing drought may already impair ecosystem services and functions without a forest dieback necessarily to occur.
4.6 Fisheries and Coral Reefs
4.6.1 Vulnerability to Climate ChangeSignificant impacts of human origin, such as changes in tempera-ture, salinity, oxygen content, and pH levels, have been observed for the oceans over the past 60 years (Pörtner et al. 2014). Such changes can have direct and indirect impacts on fishery resources and food security (for example, as fish prey reacts sensitively to ocean acidification or habitat is lost due to coral reef degradation) (Turley and Boot 2010).
The Humboldt Current System off the coast of Peru and Chile sustains one of the richest fisheries grounds in the world and is highly sensitive to climate variability such as that resulting from ENSO. The Eastern Pacific region’s fishery is dominated by catches of small pelagic fish which respond sensitively to changes
Turn Down The heaT: ConfronTing The new ClimaTe normal
58
in oceanographic conditions. Peru and Colombia are among the eight countries whose fisheries are most vulnerable to climate change (Allison et al. 2009; Magrin et al. 2014).
The Caribbean Sea and parts of the South Atlantic, in contrast to the Eastern Pacific, sustain vast coral reefs (see Section 4.6.2 Coral Reefs). The Caribbean Sea sustains a more diverse but less productive fishery (UBC 2011).
Uncertain Climate Change Effects on the Intensity of Coastal UpwellingSeveral effects of climate change on upwelling and related ecosystem functioning have been hypothesized—and they point in opposite directions. One hypothesis is that a decrease in productivity may be driven by a globally warmer ocean in the future, as observed under El Niño conditions. However, sea-surface temperatures have not been observed to increase in the Humboldt Current System over the last 60 years (Hoegh-Guldberg et al. 2014). The hypothesis is further contradicted by data indicating higher productivity during warm interglacial periods (Chavez and Messié 2009) and a projected weakening of trade winds and associated El Niño events (Bakun et al. 2010). However, particularly the latter projections are highly uncertain. As described in Section 2.3.2 of the full report, El-Niño/Southern Oscillation, projections on the frequency and intensity of future El Niño events are uncertain.
An increase in productivity, in turn, has been hypothesized to occur due to a stronger land-sea temperature gradient—the land surface warms faster than the ocean waters—leading to stronger winds driving stronger upwelling (Bakun 1990; Chavez and Messié 2009). However, analysis has been unable to determine whether or not the recorded intensification of winds at the eastern sides of the world’s oceans is due to inconsistencies in measurement techniques over long time scales. Comparison with non-upwelling regions, however, indicates that the wind intensification is more pronounced in upwelling regions (Bakun et al. 2010). Analysis of changes in coastal biomass shows an upward trend of waters within the Humboldt Current System for 1998–2007, particularly for the Peruvian coast. In contrast, the southern part of the California Cur-rent System (south of 30°N off the coast of Baja California) shows a negative trend (Demarcq 2009). Moreover, whether increased upwelling would lead to higher productivity depends on nutrient availability—and changing physical conditions may disturb the natural food web structure.
Physiological Effects of Ocean Acidification on Marine SpeciesThe IPCC states with high confidence that rising CO2 levels will increasingly affect marine organisms (Pörtner et al. 2014). A meta-analysis of 228 studies revealed overall negative impacts of ocean acidification not only on calcification but also on survival, growth, development, and abundance (Kroeker et al. 2013). Wittmann and Pörtner (2013) conducted a meta-analysis of existing studies to determine responses for a range of future CO2 concentrations. The
ranges include 500–600 μatm, which is associated with warming of more than 2°C in 2100 and 851–1,370 μatm, which is associated with 4°C warming. They found differential responses for coral species, with 38 percent and 44 percent of all species studied exhibiting sensitivity to both scenarios. Echinoderms and mollusks both exhibit high sensitivity to ocean acidification as they have low metabolic rates and depend on calcium carbonate for shell formation. Wittmann and Pörtner (2013) stated that most species studied will be affected in a 4°C world, but that the effects will be visible before that. In fact, nearly 50 percent of all species studied show sensitivity to a 2°C warming. While crustaceans appear to be relatively resilient, with about a third of species affected in a 4°C scenario, the effects on fish are already significant in a relatively low CO2 concentration scenario; more than 40 percent of species are affected. This figure nearly doubles for the high scenario. However, Wittmann and Pörtner (2013) stress that their investigation into fish species´ sensitivity is biased toward reef fish.
Species Interaction and Ecosystem EffectsIt is important to note that the effects of ocean acidification do not act in isolation; rather, they act in concert with such changes as rising sea-surface temperatures, changes in salinity, and decreas-ing nutrient availability due to enhanced stratification. These further interact with non-climatic pressures such as pollution and overfishing (Hoegh-Guldberg et al. 2014). For example, increasing temperatures may lead to a drastic narrowing of species’ thermal tolerance window—with effects such as delayed spawning migra-tion or mortality (Pörtner and Farrell 2008).
Sensitivity to ocean acidification can further narrow this toler-ance window (Wittmann and Pörtner 2013). Such combined effects are to date little understood and knowledge remains limited due to limits on experimental settings and the limited ability to discern anthropogenic effects in a setting of high natural variability such as the Humboldt Current System (Hoegh-Guldberg et al. 2014). The expected synergistic effects of multiple pressures mean, however, that assessments remain conservative for a single or a subset of pressures (Wittmann and Pörtner 2013).
A further potential risk factor for biological productivity and fisheries is the effect of climate-induced changes on species interac-tion, which can occur due to the differential responses of species to changing environmental cues. For example, phytoplankton and zooplankton biomass changes may affect fish biomass (Taylor et al. 2012b). Different sensitivities to increasing CO2 concentration may lead to remarkable shifts in species composition (Turley and Gattuso 2012). Similarly, asynchronous responses to warming may lead to mismatches in the predator-prey relationship. Such effects have been detected to modify species interactions at five trophic levels (Pörtner et al. 2014). For the Humboldt Current System, changes in the intensity of coastal upwelling add yet another factor that may endanger the balance of various species interactions. It has been hypothesized that the predator-prey
lAtin AmeriCA And the CAribbeAn
59
relationship between phyto- and zooplankton could be disrupted due to excessive offshore transportation of zooplankton. If in such a scenario overfishing would not allow for small pelagic fish to control phytoplankton growth, sedimentation of organic matter may contribute to hypoxia, red tides, and the accumulation of methane (Bakun et al. 2010).
Projections of Changes to Coastal UpwellingThe direction and magnitude of upwelling changes remains uncertain, particularly for the Humboldt Current System. Wang et al. (2010) showed that results diverge for different models. With approximately 1.5°C global warming in 2030–2039, projec-tions show an overall increase in the decadal averaged upwell-ing index (July) for the California Current when compared to 1980–1989 for most of the GCMs analyzed. For the Humboldt Current System, however, there is very little agreement among models both in terms of direction and magnitude of change. Wang et al. (2010) observed that the factors driving coastal upwelling systems are too local to be captured by the coarse resolution of global models.
Projected Changes to Fisheries Catch Potential In response to changing oceanic conditions, including seawater temperature and salinity, fish stocks have been observed in, and are further expected to shift to, higher latitudes (Perry et al. 2005). This ultimately affects local fisheries in the tropics and subtropics. A further climate impact on the productivity of fisheries is the reduction in productivity at the base of the food chain due to the stronger stratification of warming waters (Behrenfeld et al. 2006). In fact, primary productivity has been shown to have declined by 6 percent since the early 1980s (Gregg 2003). Declining pH levels and increasing hypoxia may further negatively impact fisheries (Cheung et al. 2011).
No regional projections of future fishery catches appear to exist. A global study that considers the habitat preference of 1,066 commercially caught species and projects changes to pri-mary productivity computes the expected changes in fish species distribution and regional patterns of maximum catch potential by 2055 in a scenario leading to warming of approximately 2°C in 2050 (and 4°C by 2100) (Cheung et al. 2010).
Results of Cheung et al. (2010) for LAC indicate a mixed picture (see Figure 3.21). Concurrent with the expectation of fish popula-tions migrating poleward into colder waters, the waters further offshore of the southern part of the Latin American continent are expected to see an up to 100 percent increase in catch potential. Catch potentials are expected to decrease by 15–50 percent along the Caribbean coasts and by more than 50 percent off the Ama-zonas estuary and the Rio de la Plata. Furthermore, the Caribbean waters and parts of the Atlantic coast of Central America are expected to see declines in the range of 5–50 percent, with the waters around Cuba, Haiti, the Dominican Republic, and Puerto Rico, as well as Trinidad and Tobago, St. Lucia, and Barbados, particularly severely affected. Along the coasts of Peru and Chile,
fish catch is projected to decrease by up to 30°percent, but there are also increases towards the south.
There are, however, inherent uncertainties in the projections presented here. Cheung et al (2010) pointed out that important factors, such as expected declines in ocean pH (ocean acidifica-tion), direct human pressures, and local processes which escape the coarse resolution of global models, are not taken into account. Incorporating the effects of decreasing ocean pH and reduced oxygen availability in the northeast Atlantic yields catch potentials that are 20–30 percent lower relative to simulations not considering these factors (Cheung et al. 2011).
Taking into consideration the effects of species interaction on redistribution and abundance, Fernandes et al. (2013) report latitudinal shifts in the North Atlantic to be 20 percent lower than reported by the bioclimatic envelope model developed by Cheung et al. (2010). A further limitation of the studies is that results are given as 10-year averages and consequently do not take into con-sideration abrupt transitions as observed under El Niño conditions. It should also be noted that not all captured species are included in these calculations, with small-scale fisheries possibly not taken into account (Estrella Arellano and Swartzman 2010). Finally, it needs to be taken into account that local changes in fish population distribution are likely to affect the small-scale sector most severely, as artisanal fishers will not have the means to capture the benefits of higher productivity at higher latitudes further offshore.
For the Exclusive Economic Zone of the Humboldt Current System, Blanchard et al. (2012) projected a 35 percent decline in
Box 1.11: Freshwater Fisheries—Vulnerability Factors to Climate Change
the freshwater fishery of the Amazon river is an important source of protein for the local population. According to the FAo, annual per capita fish consumption in the Amazon basin may exceed 30 kg, which is significantly higher than in areas remote from freshwater sources where consumption has been estimated at around 9 kg per person per year (FAo 2010). As such, the river and its hydrological network provide an important source of proteins and minerals for the local population.
those resources may be under threat from climate change (Ficke et al. 2007) as rising water temperatures may exceed species’ temperature tolerance window. in addition, warmer waters are asso-ciated with higher toxicity of common pollutants (e.g., heavy metals) and lower oxygen solubility; this may negatively affect exposed organisms. in addition, “blackwaters” such as the Amazon varzèa lakes, depend on seasonal flooding for nutrient replenishment and for toxins to be flushed out. reduced river flow and a reduced size of the flood plain may further lead to a reduced habitat for spawning (Ficke et al. 2007).
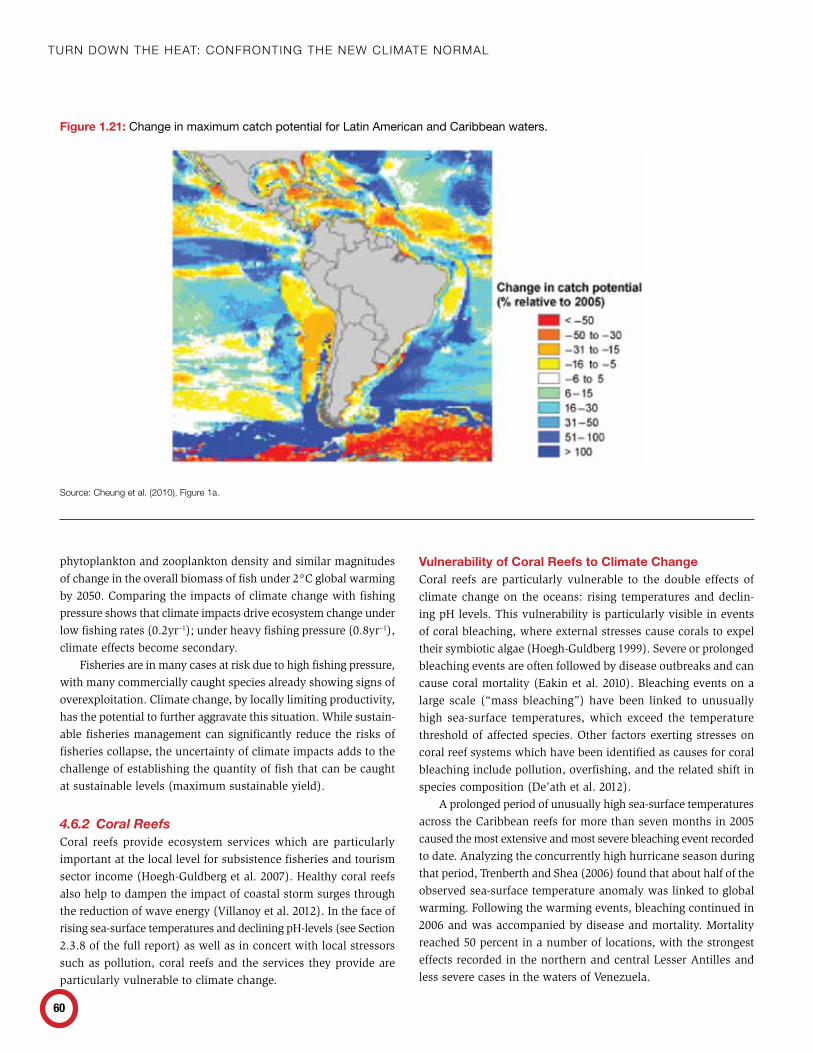
Turn Down The heaT: ConfronTing The new ClimaTe normal
60
phytoplankton and zooplankton density and similar magnitudes of change in the overall biomass of fish under 2°C global warming by 2050. Comparing the impacts of climate change with fishing pressure shows that climate impacts drive ecosystem change under low fishing rates (0.2yr–1); under heavy fishing pressure (0.8yr–1), climate effects become secondary.
Fisheries are in many cases at risk due to high fishing pressure, with many commercially caught species already showing signs of overexploitation. Climate change, by locally limiting productivity, has the potential to further aggravate this situation. While sustain-able fisheries management can significantly reduce the risks of fisheries collapse, the uncertainty of climate impacts adds to the challenge of establishing the quantity of fish that can be caught at sustainable levels (maximum sustainable yield).
4.6.2 Coral ReefsCoral reefs provide ecosystem services which are particularly important at the local level for subsistence fisheries and tourism sector income (Hoegh-Guldberg et al. 2007). Healthy coral reefs also help to dampen the impact of coastal storm surges through the reduction of wave energy (Villanoy et al. 2012). In the face of rising sea-surface temperatures and declining pH-levels (see Section 2.3.8 of the full report) as well as in concert with local stressors such as pollution, coral reefs and the services they provide are particularly vulnerable to climate change.
Vulnerability of Coral Reefs to Climate ChangeCoral reefs are particularly vulnerable to the double effects of climate change on the oceans: rising temperatures and declin-ing pH levels. This vulnerability is particularly visible in events of coral bleaching, where external stresses cause corals to expel their symbiotic algae (Hoegh-Guldberg 1999). Severe or prolonged bleaching events are often followed by disease outbreaks and can cause coral mortality (Eakin et al. 2010). Bleaching events on a large scale (“mass bleaching”) have been linked to unusually high sea-surface temperatures, which exceed the temperature threshold of affected species. Other factors exerting stresses on coral reef systems which have been identified as causes for coral bleaching include pollution, overfishing, and the related shift in species composition (De’ath et al. 2012).
A prolonged period of unusually high sea-surface temperatures across the Caribbean reefs for more than seven months in 2005 caused the most extensive and most severe bleaching event recorded to date. Analyzing the concurrently high hurricane season during that period, Trenberth and Shea (2006) found that about half of the observed sea-surface temperature anomaly was linked to global warming. Following the warming events, bleaching continued in 2006 and was accompanied by disease and mortality. Mortality reached 50 percent in a number of locations, with the strongest effects recorded in the northern and central Lesser Antilles and less severe cases in the waters of Venezuela.
Figure 1.21: Change in maximum catch potential for Latin American and Caribbean waters.
source: Cheung et al. (2010), Figure 1a.
lAtin AmeriCA And the CAribbeAn
61
Hurricanes, while posing a direct threat to coral reef structures, have also been found to cool the surrounding waters and thereby reduce the warming signal and the risk of severe bleaching (Eakin et al. 2010). The effect of hurricanes on coral reefs may thus be positive in the sense that vertical mixing and upwelling caused by tropical cyclones may reduce heat stress for coral reefs. This effect was reconstructed for the 2005 anomaly, for which Carrigan and Puotinen (2014) found that nearly 75 percent of the assessed area experienced cooling from tropical cyclones. They estimated that this lead to around a quarter of reefs not experiencing stresses above critical thresholds, outweighing the negative effects of direct damage (e.g., through breakage). While they pointed out that the relatively frequent occurrence of tropical cyclones may have sup-ported the development of relatively resistant coral reef species, it remains unclear whether such resistance will persist in the face of a projected increase in the intensity and frequency of tropical cyclones, particularly as such developments would be concur-rent with changes to ocean chemistry deleterious to coral reefs. Dove et al. (2013) point out that expected reductions in reef net calcification, associated with changes in ocean chemistry under a high atmospheric CO2 concentration, will significantly hinder the recovery of coral reefs after damages related to extreme events.
Projections of Climate Change Impacts on Coral ReefsBased on observations and laboratory experiments, thresholds have been identified which enable the projection of risk of bleaching events in the future. The decrease in calcium carbonate saturation and concurrent pH levels poses another threat to reef-building corals (Section 2.3.8 of the full report). Taking into consideration both the projected decrease in the availability of calcium carbonate and increase in sea-surface temperatures, Meissner et al. (2012) projected that most coral reef locations in the Caribbean sea and western Atlantic will be subject to a 60–80 percent probability of annual bleaching events with 2°C warming by 2050, with areas at the coast of Guyana, Suriname, and French Guiana being exposed to a 100 percent probability. In contrast, under 1.5°C warming by 2050, most locations in the Caribbean sea have a comparably low risk of 20–40 percent probability of annual bleaching events, with the waters of Guyana, Suriname, French Guiana, and the north Pacific being at slightly higher risk (up to 60 percent probability).
By the year 2100, almost all coral reef locations are expected to be subject to severe bleaching events occurring on an annual basis in a 4°C world. Exceptions are major upwelling regions, which experience a risk of 50 percent. Compared to impacts in the year 2050, the Caribbean sea experiences more locations under risk in 2100 despite no significant further increase in emissions and temperatures, highlighting the long-term impact of climate change on marine ecosystems even under emissions stabiliza-tion. A potentially limiting assumption made by Meissner et al. (2012) is that no changes in the frequency or amplitude of El Niño events is expected.
The study from Meissner et al. (2012) is based on a single Earth System Model. Van Hooidonk et al. (2013) used a large ensemble of climate models to analyze the onset of bleaching conditions for different emissions scenarios. With warming leading to a 2°C world, the median year in which bleaching events start to occur annually is 2046. While this median applies to most regions within the Caribbean, some parts experience bleaching 5–15 years ear-lier. These include the northern coast of Venezuela and Colombia as well as the coast of Panama. With warming leading to a 4°C world, the median year in which annual bleaching starts to occur is 2040 (with no earlier onset in the Caribbean region). Generally, the reefs in the northern waters of the Caribbean Sea appear to be less sensitive than those in the south. However, as Caldeira (2013) points out, those reefs at the higher latitude fringes of the tropical coral range (both north and south of the tropics) are likely to be more heavily affected by ocean acidification.
Buddemeier et al. (2011) computed coral losses in the Caribbean for three different scenarios, which would lead to a 2°C, 3°C, and 4°C world by 2100. Temperature trajectories diverge around 2050, by which time warming reaches about 1.2°C. A comparison of all trajectories shows little difference between scenarios in terms of coral cover. By 2020, live coral reef cover is projected to have halved from its initial state. By the year 2050, live coral cover is less than five percent; in 2100, it is less than three percent, with no divergence among emissions scenarios. Notably, a 5–10 per-cent live coral cover is assumed as the threshold below which the ecosystem no longer represents a coral reef (but is instead a shallow-water ecosystem that contains individual coral organ-isms). Assuming a scenario in which corals are able to adapt by gaining an additional 1°C of heat tolerance, the loss of live coral cover below five percent is prolonged by around 30 years. Bud-demeier et al. (2011) noted that results can be extrapolated for the wider Southeast Caribbean, albeit with the caveat that the assumed high mortality rate of 50 percent was lower in regions outside the Virgin Islands.
The modeling projections of future bleaching events and loss of coral cover presented above are based on changes in marine chemistry and thermology. While the adaptive potential of coral reef species remains uncertain, it should be noted that further impacts impeding the resilience of coral reefs are not included in these future estimates. These include potential impacts that are likely to change in frequency and/or magnitude under future warming, such as hurricanes and the variability of extreme tem-peratures. Taking these uncertainties into account, Buddemeier et al. (2011) concluded that the presented projections are likely unduly optimistic, which leads the authors to predict that the “highly diverse, viable reef communities in the Eastern Caribbean seem likely to disappear within the lifetime of a single human generation.” According to some estimates, a 90 percent loss of coral reef cover would lead to direct economic losses of $8.712 billion (2008 value) (Vergara et al. 2009).
Turn Down The heaT: ConfronTing The new ClimaTe normal
62
Overall, while there are limitations to the projections of the state of coral reefs in the future, a bleak picture emerges from the available studies. Irrespective of the sensitivity threshold chosen, and indeed irrespective of the emissions scenario, by the year 2040 Caribbean coral reefs are expected to experience annual bleaching events. This is in accordance with Frieler et al. (2012) showing that, at the global scale, the global mean temperature at which almost 90 percent of coral reefs are at risk of extinction is 1.5°C above pre-industrial levels.
4.6.3 SynthesisThe rich fishery grounds of the Humboldt Current System in the Eastern Pacific react strongly to fluctuations in oceanic condi-tions related to the El Niño/Southern Oscillation (ENSO), during which the upwelling of nutrient-rich waters is suppressed by the influx of warm surface waters. Together with ocean acidification and hypoxia, which are very likely to become more pronounced under high-emissions scenarios, the possibility of more extreme El Niño events pose substantial risks to the world’s richest fishery grounds. Irrespective of single events, the gradual warming of ocean waters has been observed and is further expected to affect fisheries particularly at a local scale. Generally, fish populations are migrating poleward towards colder waters. Projections taking into consideration such responses indicate an increase of catch potential by up to 100 percent in the south of Latin America. Off the coast of Uruguay, the southern tip of Baja California and southern Brazil the maximum catch potential is projected to decrease by more than 50 percent. Caribbean waters may see declines in the range of 5–50 percent, with the waters around Cuba, Haiti, the Dominican Republic, and Puerto Rico, as well as Trinidad and Tobago, St Lucia, and Barbados, particularly severely affected. Along the coasts of Peru and Chile, fish catch is projected to decrease by up to 30°percent, but there are also increases towards the south.
It stands to reason that the communities directly affected by local decreases in maximum catch potential would not gain from catch potentials increasing elsewhere. They may also be the ones whose livelihoods would be most affected by the expected deleteri-ous effects of ocean acidification and warming on tropical coral reefs. Irrespective of the sensitivity threshold chosen and indeed irrespective of the emissions scenario, by the year 2040 Caribbean coral reefs are expected to experience annual bleaching events. While some species and particular locations appear to be more resilient to such events than others, it is clear that the marine ecosystems of the Caribbean are facing large-scale changes with far reaching consequences for associated livelihood activities as well as for the coastal protection provided by healthy coral reefs.
4.7 Human Health
The main human health risks in Latin America and the Caribbean include vector-borne diseases such as malaria, dengue fever,
leishmaniasis, and fascioliasis, and food- and water-borne diseases such as cholera and childhood diarrheal disease. Many of these diseases have been found to be sensitive to changes in weather patterns brought about by ENSO. This indicates that disease transmission in LAC could prove highly responsive to changes in temperature and precipitation patterns induced by climate change. Extreme weather events, including heat waves, hurricanes, floods, and landslides, also cause injuries and fatalities in Latin America, and these in turn can lead to outbreaks of disease.
4.7.1 Vector-Borne DiseasesDengue fever is widespread in Latin America, with much of the region providing highly suitable climatic conditions to the primary mosquito vector, Aedes aegypti. There has recently been a reemer-gence and marked increase in the incidence of dengue fever and dengue haemorrhagic fever in countries that had been declared free of the illness following successful elimination programs in the 1950s and 1960s (Tapia-Conyer et al. 2009).
Climate change is expected to play a contributing role in determining the incidence of the disease (Confalonieri et al. 2007), although it is often difficult to separate the impact of climate change from the impacts of urbanization and population mobil-ity (Barclay 2008). In Brazil, the country with the largest number of cases in the world, a greater intensity of transmission of the disease has been observed during the hot, rainy months of the year (Teixeira et al. 2009). Between 2001–2009 in Rio de Janeiro, a 1°C increase in monthly minimum temperature was associated with a 45 percent increase in dengue fever cases the following month, and a 10 mm increase in precipitation with a 6 percent increase (Gomes et al. 2012). Analysis from Mexico points to a correlation between increases in the number of reported cases and increases in rainfall, sea-surface temperature, and weekly minimum temperature (Hurtado-Diaz et al. 2007). A study in Puerto Rico, based on analysis of a 20-year period, likewise finds a positive relationship between monthly changes in temperature and precipitation and monthly changes in dengue transmission (Johansson et al. 2009). Projections by Colon-Gonzalez et al (2013), holding all other factors constant, point to an upsurge in dengue incidence in Mexico of 12 percent by 2030, 22 percent by 2050, and 33 percent by 2080 with a warming scenario leading to a 3°C world in 2100; or 18 percent by 2030, 31 percent by 2050, and 40 percent by 2080 with a warming scenario leading to a 4°C world by 2100. In general, increases in minimum temperatures play the most decisive role in influencing dengue incidence, with a sharp increase observed when minimum temperatures reach or exceed 18°C (Colon-Gonzales et al. 2013).
It appears, however, that climatic conditions alone cannot account for rates of disease occurrence. Based on temperature-based mechanistic modeling for the period 1998–2011, Carbajo et al.(2012) found that temperature can estimate annual transmission risk but cannot adequately explain the occurrence of the disease on a
lAtin AmeriCA And the CAribbeAn
63
national scale; geographic and demographic variables also appear to play a critical role.
Malaria is endemic in Latin America, and rates of transmission have increased over recent decades. This resurgence is associated in part with local environmental changes in the region, such as extensive deforestation in the Amazon basin (Moreno 2006). Periodic epidemics have also been associated with the warm phases of ENSO (Arevalo-Herrera et al. 2012; Mantilla et al. 2009; Poveda et al. 2011).
It is possible that high temperatures could cause malaria to spread into high altitude cities (e.g., Quito, Mexico City) where it has not been seen for decades (Moreno 2006). Evidence shows an increasing spread of malaria to higher elevations in northwest Colombia during the last three decades due to rising temperatures, indicating high risks under future warming (Siraj et al. 2014). The connection between malaria and climate change, however, is unclear given the complexity of factors involved. Indeed, it is likely that the effect of climate change on malaria patterns will not be uniform. While incidence could increase in some areas, it is also possible that it may decrease in others—for example, in the Amazon, in Central America, and elsewhere where decreases in precipitation are projected (Haines et al. 2006) (see Section 3.3, Regional Precipitation Projections).
Caminade et al. (2014) projected a lengthening of the malaria transmission season in the highlands of Central America and southern Brazil by the 2080s, but a shortening in the tropical regions of South America. This spatial differentiation is signifi-cantly more pronounced with warming leading to a 4°C world than to a 2°C world.
Earlier projections, however, offer mixed results. Béguin et al. (2011) projected an expansion of malarial area by 2050 in Brazil and isolated areas near the west coast of the continent under approximately 2°C of global warming, although this is only if climatic and not socioeconomic changes are taken into account. Van Lieshout et al. (2004), in contrast, found reductions in the size of the population exposed to malaria for at least three months of the year in all the scenarios they considered, and a reduction in exposure to malaria for at least one month of the year in a 4°C world (but not in a 3°C world). This study, meanwhile, projects an expansion of the malarial zone southward beyond its current southernmost distribution in South America—a finding consistent with Caminade et al. (2014).
Leishmaniasis is a skin disease carried by sandflies that takes two main forms: cutaneous and visceral. Both are found through much of the Americas from northern Argentina to southern Texas, excluding the Caribbean states (WHO 2014). A spatial analysis by Valderrama-Ardilla et al. (2010) of a five-year outbreak of cutaneous leishmaniasis in Colombia beginning in 2003 identified temperature as a statistically significant variable. The study concluded, however, that climatic variables alone could not explain the spatial variation of the disease. A positive association has been reported between
the ENSO cycle and annual incidence of cutaneous leishmaniasis in Colombia (Gomez et al. 2006) and visceral leishmaniasis in Brazil (Franke et al. 2002). A study from Colombia of both types of the disease also identified an increase in occurrence during El Niño and a decrease during La Niña (Cardenas et al. 2006). These findings suggest that an increased frequency of drought conditions is likely to increase the incidence of leishmaniasis (Cardenas et al. 2006).
Fascioliasis, a disease caused by flatworms and carried by snails as an intermediate host, is a major human health problem in the Andean countries of Bolivia, Peru, Chile, and Ecuador (Mas-Coma 2005). Cases have also been reported in Argentina, Peru, Venezuela, Brazil, Mexico, Guatemala, and Cuba (Mas-Coma et al. 2014). The host infection incidence of fascioliasis is strongly dependent on weather factors, including air temperature, rainfall, and/or potential evapotranspiration. Temperature increases associated with climate change may lead to higher infection and transmission rates and cause an expansion of the endemic zone, while increases in precipitation could, for example, increase the contamination risk window presently linked to the November-April rainy season (Mas-Coma et al. 2009).
4.7.2 Food- and Water-Borne DiseasesCholera is transmitted primarily by fecal contamination of food and water supplies. Outbreaks are therefore often associated with warm temperatures, flooding, and drought, all of which can aid contamination. Climatic variables have been shown to be decisive in determining the extent of outbreaks (Koelle 2009). A recent study of the relationship between rainfall and the dynamics of the cholera epidemic in Haiti, for example, shows a strong relationship whereby increased rainfall is followed by increased cholera risk 4–7 days later (Eisenberg et al. 2013). In South America, ENSO can be a driving factor in cholera outbreaks in coastal areas because the El Niño phase provides warm estuarine waters with levels of salinity, pH, and nutrients suitable for the blooming of the V. Chol-
erae pathogen (Martinez-Urtaza et al. 2008; Salazar-Lindo 2008).Rates of childhood diarrheal disease have also been shown to
be influenced by ambient temperature—and by ENSO in particular. This was observed during the 1997–1998 El Niño event in Peru. During that particularly warm winter, in which ambient tempera-tures reached more than 5°C above normal, hospital admissions for diarrheal disease among children increased by 200 percent over the previous rate (Checkley et al. 2000). The relative risk of diarrheal disease in South America is expected to increase by 5–13 percent for the period 2010–39 with 1.3°C warming, and by 14–36 percent for the period 2070–99 with 3.1°C warming (Kolstad and Johansson 2011).
4.7.3 Impacts of Extreme Temperature EventsUnusually high or low temperatures can potentially increase morbidity and mortality, particularly in vulnerable groups such as the elderly and the very young. A strong correlation has been found between unusually cold periods and excess deaths in Santiago, Chile, for example. In a time-series regression analysis, Muggeo
Turn Down The heaT: ConfronTing The new ClimaTe normal
64
and Hajat (2009) estimated a 2.4 percent increase in all-cause deaths among the above-65 age group for every 1°C decrease below a cold threshold identified in their model. Cold-related risks to human health would therefore be reduced if climate change results in a reduction in extreme cold events.
Urban populations tend to be the most vulnerable to extreme heat events due to the urban heat island effect, in which the built environment amplifies temperatures. In northern Mexico, heat waves have been correlated with increases in mortality rates (Mata and Nobre 2006); in Buenos Aires, 10 percent of summer deaths are associated with heat strain (de Garin and Bejaran 2003). Excessive heat exposure can cause or exacerbate a range of health conditions, including dehydration, kidney disease, and cardiovascular and respiratory illnesses (Kjellstrom et al. 2010). Increased rates of hospital admissions of kidney disease patients have been documented during heat waves (Kjellstrom et al. 2010). Heat stress has been identified as a particular danger for work-ers in Central America and one that coincides with high rates of kidney disease in some populations (Kjellstrom and Crowe 2011).
4.7.4 Impacts of Flooding and LandslidesTorrential rain and resulting floods are among the main natural hazards in the region and cause widespread injury and loss of life, livelihood, and property (Mata and Nobre 2006). Catastrophic flooding has affected Mexico, Venezuela, Colombia, Brazil, Chile, Argentina, and Uruguay in recent years (WHO/WMO 2012). Flood-ing can have multiple indirect health impacts, including the spread of water-borne disease through water supply contamination and via the creation of stagnant pools that serve as habitats for disease vectors such as malaria and dengue mosquitoes. Landslides and mudslides can also be a consequence of flooding; these tend to be exacerbated by factors such as deforestation and poor urban planning. Flash floods and landslides are a particular danger for informal settlements located on steep slopes and on alluvial plains (Hardoy and Pandiella 2009).
Glacial lake outburst floods (see Box 3.4) also pose a risk to populations located in the Andean region (Carey et al. 2012). The historical impacts of glacial lake outburst floods in Peru’s Cordillera Blanca mountain range illustrate the potential for catastrophic loss of life during periods of glacial retreat; many thousands of deaths have resulted from flooding, most notably in incidents in 1941, 1945, and 1950 (Carey et al. 2012). The projection of further glacial melting in the Andes (see Section 4.1, Glacial Retreat and Snowpack Changes) means that flooding continues to pose a risk to human populations.
4.7.5 SynthesisThe literature on the potential climate change impacts on human health in the LAC region shows increased risks of morbidity and mortality caused by infectious disease and extreme weather events. Observed patterns of disease transmission associated with different parts of the ENSO cycle seem to offer valuable clues as
to how changes in temperature and precipitation might affect the incidence of a particular disease in a particular location.
Projections of how malaria incidence in LAC could be affected by climate change over the rest of the century are somewhat inconsistent, with some studies pointing to increased incidence and others to decreased incidence. Such uncertainty also characterizes studies of the relationship between climate change and malaria globally and reflects the complexity of the environmental factors influencing the disease. Little quantitative data is available on the future impacts of extreme weather events on human health, although studies based on historical data, such as that of Muggeo and Hajat (2009), have revealed a link between extreme temperatures and increased rates of mortality in vulnerable sub-populations.
4.8 Migration
While migration is not a new phenomenon in the region, it is expected to accelerate under climate change. There are many areas in LAC prone to extreme events, including droughts, floods, landslides, and tropical cyclones, all of which can induce migra-tion. Faced with severe impacts, migration might seem like the only option for finding alternative livelihoods (Andersen et al. 2010). However, migration typically causes an economic strain on both internal and external migrants (Raleigh et al. 2008), and not everyone whose livelihood is threatened can afford to migrate. The very poorest who do not have the necessary resources to migrate can get trapped in a situation of ever-increasing poverty.
The transition from temporary to permanent migration resulting from climate events can be facilitated by the existence of strong migration ties and networks (e.g., between LAC and the United States) (Deprez 2010). There are also important pull factors, which have been a major determinant of emigration in the past, including more and better paid job opportunities and better access to services. They incentivize migration, particularly to North America or to countries within LAC with stronger economies. The question to be assessed over time is whether climate change will make push factors more important than pull factors.
The scientific literature on the interaction between migration and climate change is limited in terms of future projections. There is, however, a growing body of literature on the demographic, economic, and social processes of the interactions of climate and migration (Piguet et al. 2011; Tamer and Jäger 2010). Migration is considered an adaptive response to maintain livelihoods under conditions of change. Assunção and Feres (2009) show that an increase in poverty levels by 3.2 percent through changes in agricultural productivity induced by regional warming of 1.5°C in 2030–2049 is reduced to two percent if sectoral and geographic labor mobility is allowed for. This means that migration can reduce the potential impact of climate change on poverty (Andersen et al. 2010).
The projections of environmentally-induced migration agree that most of the movement is likely to occur within the same
lAtin AmeriCA And the CAribbeAn
65
country or region (Deprez 2010). The largest trend in migration continues to be major movements from rural areas to urban areas. Given the well-established migration channels between most LAC countries and the United States, however, the impacts of climate change may increase South-North migration flows.
There are no official statistics to show how many migrants in LAC are moving in response to climate-related or other envi-ronmental factors (Andersen et al. 2010). Although functioning as an adaptive strategy, environmentally-induced migration has strong negative impacts on transitory areas and final destinations. For example, the International Organization for Migration reports that “rapid and unplanned urbanization has serious implications for urban welfare and urban services”, particularly in cities with “limited infrastructure and absorption capacity” (IOM 2009). For areas of origin, the general consensus for LAC seems to be that the impact of environmentally induced migration is overwhelmingly negative (Deprez 2010).
4.8.1 DroughtThe effects of drought on migration have not been fully researched. Perch-Nielsen et al. (2008) explained that drought is the “most complex and least understood natural hazard,” and that there are a number of adaptive measures households might take before resorting to migration. Nevertheless, scenarios based on projec-tions of Mexico–United States migration rates (Feng et al. 2010) and of Brazilian internal migration (Barbieri et al. 2010) suggest that drought will lead to increased emigration along established migration routes and the depopulation of rural areas (Faist and Schade 2013). Other examples of drought-induced migration include the flow of migrants from Brazil’s and Argentina’s north-east regions to the state capitals and to the south-central regions (Andersen et al. 2010). Examples indicate that drought-induced migration is already occurring in some regions. In Northeastern Brazil, a primarily agricultural region, spikes in the rate of migra-tion to rapidly growing coastal cities or to the country’s central and southern regions have been observed following decreases in crop yields in years of severe drought (Bogardi 2008). Barbieri et al. (2010) projected emigration rates in Brazil from rural areas and found that depopulation is expected to occur—especially with increasing temperatures. This study, meanwhile, finds the biggest increase in migration coming from productive agricultural areas that support a large labor force.
4.8.2 Sea-Level Rise and HurricanesProjections considering the impacts of sea-level rise on migration in Latin America and the Caribbean are sparse (Deprez 2010). There is more research, however, on the impact of hurricanes. Although projections posit that migration resulting from hurricanes will continue to be mostly temporal and internal (Andersen et al. 2010), stronger hurricane impacts in the Caribbean will increas-ingly drive households that have repeatedly suffered from these
events to consider permanent domestic, regional, or international migration (ECLAC 2001). In 1998, Hurricane Mitch affected sev-eral Central American countries and displaced up to two million people either temporarily or permanently. The impact was highly differentiated by country, with much lower displacement rates in Belize compared to Nicaragua, Honduras, and El Salvador, and a 300 percent increase in international emigration from Honduras (Glantz and Jamieson 2000; McLeman and Hunter 2011). Although the number of migrants has decreased over time, it has so far remained above the level prior to the hurricane (McLeman 2011).
4.8.3 Exacerbating FactorsThe largest level of climate migration is likely to occur in areas where non-environmental factors (e.g., poor governance, political persecution, population pressures, and poverty) are already present and already putting migratory pressures on local populations. In addi-tion, poverty and an unequal geographical population distribution heighten people’s vulnerability to biophysical climate change impacts, thus compounding the potential for further migration (Deprez 2010).
4.8.4 Social Effects of Climate-Induced MigrationSimilar to traditional migrants, climate migrants with more edu-cation and skills are able to benefit the most from migration. Benefits to migrants and their families can include, for example, the possibility of finding better jobs. But migration can also have a strong negative social impact on those who stay behind, par-ticularly on the poorest who typically do not have the resources to migrate and therefore risk being trapped in an adverse situation with limited coping strategies (Andersen et al. 2010). In addition, climate-change-induced labor migration can have implications on families left behind (e.g., challenges to children resulting from being raised in single parent homes with limited economic resources). In addition, climate change may induce greater levels of female migration; in the context of gender-based discrimination, these women may face more challenges settling down and finding adequate housing and stable jobs (Deprez 2010).
Labor migration can also provide benefits to migrants and their families. Migration can generate an increase in a family’s financial assets, as work in the new location often pays better. This contributes to better living conditions if the family is able to migrate together or generates remittances that can be sent back to help the family left behind.
Despite some benefits, climate migrants face significant risks. For example, the cost of migration (including travel, food, and housing) can be very high and result in a worse financial situa-tion for the family. There is also evidence that migrants’ working and housing standards can, in some cases, be very poor (such as in marginalized areas, informal settlements, and slums) with possible negative effects on health (Andersen et al. 2010). Further, migrants who do not have networks or social capital in their new location can be socially isolated or discriminated against, resulting
Turn Down The heaT: ConfronTing The new ClimaTe normal
66
in tensions or conflict. In addition, ties to families and networks in the communities of origin may deteriorate while they are away (Andersen et al. 2010).
In the case of climate-related evacuations, the social effects are mostly negative (see Box 3.12: Distress Migration during Hur-ricane Mitch). These include serious damage to physical assets (e.g., housing and livestock), and to other natural resources in the community of origin. In many cases, natural disasters can also contribute to financial and health problems (Andersen et al. 2010).
Migration contributes strongly to structural and sociodemo-graphic change in LAC cities. Migrants tend to come from similar locations and settle in the same areas which usually are marginal areas in urban areas where they might have social capital or social networks (Vignoli 2012). This contributes to creating social vulnerability to climate change by increasing spatial segregation at the destination, or by modifying social networks of migrant households in their origin (Pinto da Cunha 2011; Vignoli 2012). As a result, immigrant populations may lack the knowledge of disaster risk management plans, especially if they are new to urban areas and had not encountered disaster management plans in the rural areas where they migrated from (Adamo 2013).
4.9 Human Security
The LAC region is considered to be at low risk of armed conflict, with the incidence of armed conflicts declining substantially in the last 15 years (Rubin 2011). With the downfall of many military regimes in the 1980s, and continued economic integration, the region has achieved relative stability (Rubin 2011). However, in the context of high social and economic inequalities and migration flows across countries, disputes regarding access to resources, land, and wealth are persistent.
Several countries in the region have also faced political instability in the past few years. For example, Bolivia has seen some internal social movements calling for the independence of some regions; and there are important challenges related to the drug trade which has become increasingly violent, particularly in Mexico (Necco Carlomagno 2012). In fact, the activities of criminal groups and organized crime syndicates in countries like Brazil and Mexico are a major source of some of the most significant conflicts (Rubin 2011).
Climate change could aggravate these situations, further increasing conflicts over the use of resources. Socioeconomic disparities could be exacerbated, and in the worst case scenario, government capacities could be insufficient to face these along with natural disasters and climate-related challenges (McLeman 2011). In some Latin American countries where criminal organi-zations already have significant power, such security gaps can enable them to increase their influence, further weakening the capacity of the state (Carius and Maas 2009). It is important to note that in the past, environmental degradation has often been used as a pretext for conflicts that are in fact caused by underlying ethnic tensions and injustices associated with an unequal geographical distribution of the population and income inequality (Deprez 2010).
In this context, Rubin (2011) suggests four ways in which climate change could increase the risk of conflict in LAC:
• More resource scarcity. Climate change is likely to exacerbate resource scarcities. Increasing scarcity of food, water, forests, energy, and land could intensify competition over the remaining resources, triggering internal unrest and even border conflicts.
• More migration. The LAC region has important migration dynamics that are being exacerbated by climate change as households face increased resource scarcities, rising sea levels, and more (and more intense) natural disasters. Larger flows of migrants could potentially destabilize destination countries.
• Increasing instability. Climate change and variability may undermine the capacity of the state by increasing the cost of infrastructure in remote rural areas, limiting the reach of the state. This could be aggravated by the rising costs of disaster management (e.g., an increase in the level of agricultural subsidies needed to maintain adequate food production) as well as by the general need for increased adaptation spending. These limits in state capacity might result in a weakening of the relationship between the state and its citizens.
• Increasing frequency and intensity of natural disasters. The chaotic conditions that follow in the wake of natural disasters may provide opportunities for rebel groups to challenge the government’s authority.
The empirical literature is inconclusive regarding the linkages between climate change and an increasing risk of conflict globally.
Box 1.12: Distress Migration during Hurricane Mitch
A typical example of distress migration took place when hurricane mitch struck Central America in 1998. honduras evacuated 45,000 citizens from bay island. the government of belize issued a red alert and asked citizens on offshore islands to leave for the mainland. much of belize City was evacuated. Guatemala issued a red alert as well. by the time mitch made landfall those evacuated along the western Caribbean coastline included 100,000 in honduras, 10,000 in Guatemala, and 20,000 in the mexican state of Quintana roo. despite this, nearly 11,000 people were killed and more than 11,000 were still missing by the end of 1998. in all, 2.7 million were left homeless or missing. the flooding caused damage estimated at over $5 billion (1998 dollars; $6.5 billion in 2008 dollars). source: Andersen et al. (2010).
lAtin AmeriCA And the CAribbeAn
67
Rubin (2011) suggests, however, that while resource scarcity in isola-tion from other socioeconomic factors does not necessarily increase the risk of conflict, it often acts as a catalyst or driver, amplifying the existing (often traditional) causes of conflict. In this sense, Haldén (2007) notes that disparities in standards of living and income can be problematic for several reasons: (1) disparities and divisions might by themselves impede growth and undermine adaptation strategies; (2) substantial inequality might also destabilize societ-ies and increase the risk of conflict in the light of climate change and variability; and (3) the differences between large segments of the populations imply that climate change will have very unequal impacts on the population, further exacerbating tensions. This is particularly relevant in the LAC region, which has one of the most unequal income distributions in the world (Fereira et al. 2013).
Large inequalities among groups (differentiated along ethnic, religious, political, or geographical lines) increase the risk of violent conflict and high individual income inequality is a driver of crime (Dahlberg and Gustavsson 2005; Fajnzylber et al. 2002; Østby 2007). In the case of Bolivia, for example, highly unequal distributions of natural resources create tensions among regions. In response to the nationalization of gas and oil reserves, the resource-rich regions of Santa Cruz, Tarija, Beni, and Pando (comprising 35 percent of the Bolivian population) unsuccessfully sought autonomy. Violent disputes erupted between the government and the regions seeking autonomy (Rubin 2011); this has since subsided due to the 2010 Autonomies Law and other agreements.
Relatively small populations can have a tremendous impact on the environment (Hoffman and Grigera 2013). There are examples–notably in the Amazon basin—where the rural poor have turned to illicit extractive activities (e.g., illegal logging) because they lack legal or formal alternatives. The effects of climate change and environmental degradation, along with the rapid growth of the extractive industry, is expected to take the greatest toll on the most vulnerable—small-hold farmers, indigenous populations, and the poor (Hoffman and Grigera 2013). The resulting increase in resource competition, (particularly for water and land)—together with increasing market pressure on landholders with tenuous legal tenure—is expected to exacerbate existing inequities and tensions surrounding the proper and equitable allocation of the region’s natural wealth (Hoffman and Grigera 2013).
Climate change could also increase violence in small com-munal or household settings. One example is gender-based vio-lence, which is already widespread in Latin America (Morrison et al. 2004). Although there is little research on this topic, there are some studies (e.g., Harris and Hawrylyshyn 2012) which indicate that climate change (by transforming livelihoods and social structures) could spur social violence in non-conflict situations. Moser and Rogers (2005) showed how rapid socio-economic changes might have a destabilizing effect not only on societies but also within families, leading to an increased risk of domestic violence.
4.10 Coastal Infrastructure
Coastal areas, infrastructure, and cities are all vulnerable to cli-mate change. This is particularly true for the Caribbean region due to its low-lying areas and the population’s dependence on coastal and marine economic activities (Bishop and Payne 2012). Tropical cyclones and sea-level rise represent the main risks as their combination can severely affect economic development (and have generated significant losses and damages in past decades). For example, category 5 Tropical Cyclone Ike generated approxi-mately $19 billion in damages, including $7.3 billion in Cuba alone (Brown et al. 2010).
Overall losses induced by climate change stressors such as increased wind speed, storm surge, and coastal flooding could amount to 6 percent of GDP in some Caribbean countries (CCRIF 2010). Climate change-related impacts, including local sea-level rise, increased hurricane intensity, and modified precipitation and temperature patterns could increase current economic losses by 33–50 percent by the 2030s (CCRIF 2010).
4.10.1 Impacts of Sea-Level Rise on Coastal CitiesSeveral studies (Brecht et al. 2012; Hallegatte et al. 2013; Hanson et al. 2011) have recently estimated the potential costs of sea-level rise, and the modification of storm patterns and land subsidence (which is not induced by climate change), for coastal cities in LAC. Hallegatte et al. (2013) found that, by 2050, coastal flooding could generate approximately $940 million of mean annual losses in the 22 largest coastal cities in the region with a sea-level rise of 20 cm, and about $1.2 billion with a sea-level rise of 40 cm (Table 3.8). The study likely underestimates the overall impact as it only assesses the costs of climate change on the largest coastal cities.
4.10.2 Impacts on Port InfrastructurePort infrastructures are particularly vulnerable to the direct and indirect consequences of climate change (Becker et al. 2013). Becker et al. (2013) identified sea-level rise, higher storm surges, river floods, and droughts as the main direct impacts, and coastal erosion, which could undermine port buildings and construction, as one of the indirect impacts of climate change. The potential increase in tropical cyclone intensity may increase ships’ port downtime and, therefore, increase shipping costs (Chhetri et al. 2013; Esteban et al. 2012).
Port infrastructure is crucial to economic development as international trade is principally channeled through ports. Fur-thermore, in Caribbean countries, port infrastructure plays a very significant role as they often are the only vector for trade in goods and assets (Bishop and Payne 2012). Impacts on seaports will also have indirect consequences on local economies as import disruptions generate price increases for imported goods and export disruptions lead to revenues and incomes decreasing at the national level (Becker et al. 2012).

Turn Down The heaT: ConfronTing The new ClimaTe normal
68
4.10.3 Impacts on Tourism ActivitiesTourism in the region, especially beach tourism in the Caribbean, is projected to be affected by the impacts of climate change (Hyman 2013). The total contribution of travel and tourism in the Caribbean was about 14 percent of the regional GDP and directly supported approximately 650,000 jobs (World Travel and Tourism Council 2013). As a result, the impact of climate change on tourism could detrimen-tally affect regional economic development (Simpson et al. 2011, 2010).
Beach tourism is particularly exposed to several direct and indirect climate change stressors, including sea-level rise, modi-fied tropical storm pattern, heightened storm surges, and coastal erosion (Simpson et al. 2011). In a study comparing the vulner-ability of four different tourist destinations in Jamaica, Hyman (2013) found that coastal tourist resorts are two-to-three times more exposed to climate change-related stressors than inland touristic resorts.
Table 1.8: Projected losses from sea-level rise under two different sea-level-rise scenarios and land subsidence in the largest LAC cities.
20 CM SEA-LEVEL RISE AND SUBSIDENCE (NO
ADAPTATION)40 CM SEA-LEVEL RISE AND SUBSIDENCE
(NO ADAPTATION)
URBAN AGGLOMERATIONMEAN ANNUAL
LOSS (M$)
MEAN INCREASE DUE TO SLR AND SUBSIDENCE COMPARED TO CURRENT
LOSSESMEAN ANNUAL
LOSS (M$)
MEAN INCREASE DUE TO SLR AND SUBSIDENCE
COMPARED TO CURRENT LOSSES
La Habana (Cuba) 9 5939% 21 13660%
Port-au-Prince (Haiti) 8 1090% 11 1482%
San Juan (Puerto Rico) 1.680 2365% 4.238 6118%
Santo Domingo (Dominican Republic)
263 1166% 410 1880%
Baixada Santista (Brazil) 274 3041% 467 5256%
Barranquilla (Colombia) 87 1782% 102 2106%
Belém (Brazil) 93 698% 586 4955%
Buenos Aires (Argentina) 161 268% 592 1257%
Panama City (Panama) 431 916% 451 962%
Fortaleza (Brazil) 52 2762% 108 5814%
Grande Vitória (Brazil) 2.643 1289% 10.096 5208%
Guayaquil (Ecuador) 31.288 1012% 32.267 1047%
Lima (Peru) 39 1009% 48 1254%
Maceió (Brazil) 54 887% 283 5025%
Maracaibo (Venezuela) 67 1086% 588 10238%
Montevideo (Uruguay) 50 258% 180 1181%
Natal (Brazil) 150 1505% 487 5100%
Porto Alegre (Brazil) 71 641% 483 4918%
Recife (Brazil) 259 1279% 970 5063%
Rio de Janeiro (Brazil) 411 1088% 1.803 5108%
Salvador (Brazil) 245 4903% 262 5248%
San Jose (Costa Rica) 10 551% 67 4133%
Total 2769.6 6164.4
Source: hallegatte et al. (2013).
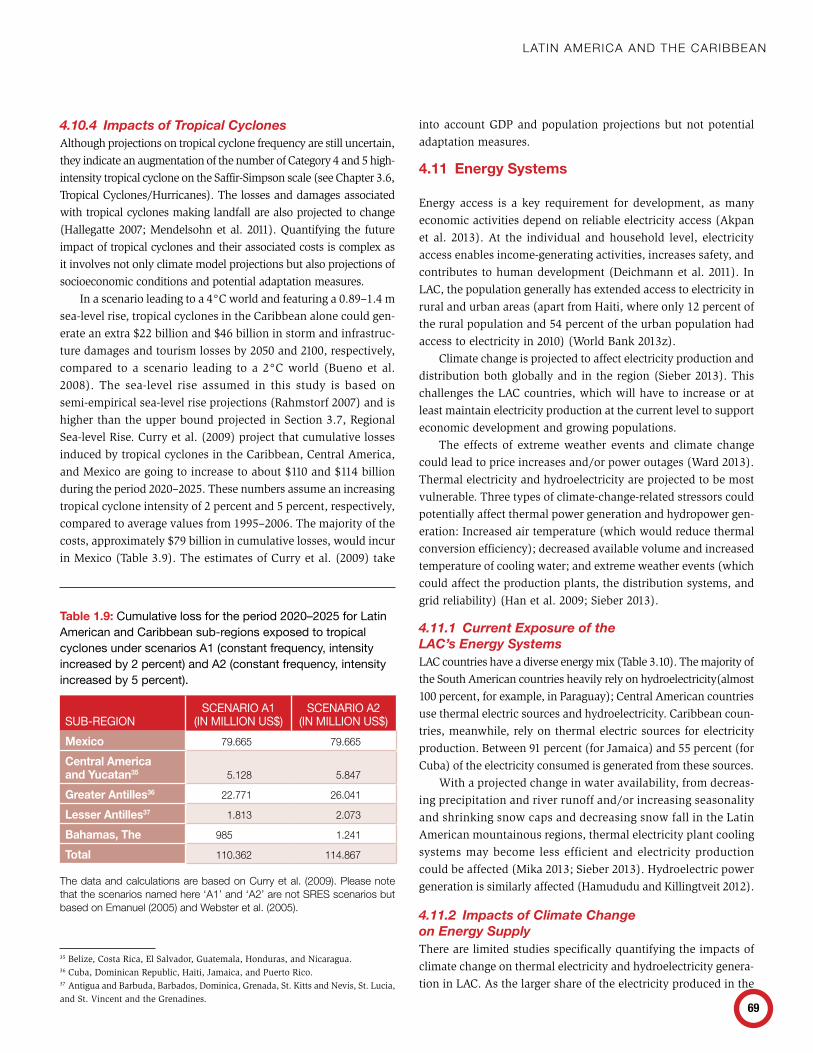
lAtin AmeriCA And the CAribbeAn
69
4.10.4 Impacts of Tropical CyclonesAlthough projections on tropical cyclone frequency are still uncertain, they indicate an augmentation of the number of Category 4 and 5 high-intensity tropical cyclone on the Saffir-Simpson scale (see Chapter 3.6, Tropical Cyclones/Hurricanes). The losses and damages associated with tropical cyclones making landfall are also projected to change (Hallegatte 2007; Mendelsohn et al. 2011). Quantifying the future impact of tropical cyclones and their associated costs is complex as it involves not only climate model projections but also projections of socioeconomic conditions and potential adaptation measures. 35 36 37
In a scenario leading to a 4°C world and featuring a 0.89–1.4 m sea-level rise, tropical cyclones in the Caribbean alone could gen-erate an extra $22 billion and $46 billion in storm and infrastruc-ture damages and tourism losses by 2050 and 2100, respectively, compared to a scenario leading to a 2°C world (Bueno et al. 2008). The sea-level rise assumed in this study is based on semi-empirical sea-level rise projections (Rahmstorf 2007) and is higher than the upper bound projected in Section 3.7, Regional Sea-level Rise. Curry et al. (2009) project that cumulative losses induced by tropical cyclones in the Caribbean, Central America, and Mexico are going to increase to about $110 and $114 billion during the period 2020–2025. These numbers assume an increasing tropical cyclone intensity of 2 percent and 5 percent, respectively, compared to average values from 1995–2006. The majority of the costs, approximately $79 billion in cumulative losses, would incur in Mexico (Table 3.9). The estimates of Curry et al. (2009) take
35 Belize, Costa Rica, El Salvador, Guatemala, Honduras, and Nicaragua. 36 Cuba, Dominican Republic, Haiti, Jamaica, and Puerto Rico.37 Antigua and Barbuda, Barbados, Dominica, Grenada, St. Kitts and Nevis, St. Lucia, and St. Vincent and the Grenadines.
into account GDP and population projections but not potential adaptation measures.
4.11 Energy Systems
Energy access is a key requirement for development, as many economic activities depend on reliable electricity access (Akpan et al. 2013). At the individual and household level, electricity access enables income-generating activities, increases safety, and contributes to human development (Deichmann et al. 2011). In LAC, the population generally has extended access to electricity in rural and urban areas (apart from Haiti, where only 12 percent of the rural population and 54 percent of the urban population had access to electricity in 2010) (World Bank 2013z).
Climate change is projected to affect electricity production and distribution both globally and in the region (Sieber 2013). This challenges the LAC countries, which will have to increase or at least maintain electricity production at the current level to support economic development and growing populations.
The effects of extreme weather events and climate change could lead to price increases and/or power outages (Ward 2013). Thermal electricity and hydroelectricity are projected to be most vulnerable. Three types of climate-change-related stressors could potentially affect thermal power generation and hydropower gen-eration: Increased air temperature (which would reduce thermal conversion efficiency); decreased available volume and increased temperature of cooling water; and extreme weather events (which could affect the production plants, the distribution systems, and grid reliability) (Han et al. 2009; Sieber 2013).
4.11.1 Current Exposure of the LAC’s Energy SystemsLAC countries have a diverse energy mix (Table 3.10). The majority of the South American countries heavily rely on hydroelectricity(almost 100 percent, for example, in Paraguay); Central American countries use thermal electric sources and hydroelectricity. Caribbean coun-tries, meanwhile, rely on thermal electric sources for electricity production. Between 91 percent (for Jamaica) and 55 percent (for Cuba) of the electricity consumed is generated from these sources.
With a projected change in water availability, from decreas-ing precipitation and river runoff and/or increasing seasonality and shrinking snow caps and decreasing snow fall in the Latin American mountainous regions, thermal electricity plant cooling systems may become less efficient and electricity production could be affected (Mika 2013; Sieber 2013). Hydroelectric power generation is similarly affected (Hamududu and Killingtveit 2012).
4.11.2 Impacts of Climate Change on Energy SupplyThere are limited studies specifically quantifying the impacts of climate change on thermal electricity and hydroelectricity genera-tion in LAC. As the larger share of the electricity produced in the
Table 1.9: Cumulative loss for the period 2020–2025 for Latin American and Caribbean sub-regions exposed to tropical cyclones under scenarios A1 (constant frequency, intensity increased by 2 percent) and A2 (constant frequency, intensity increased by 5 percent).
SUB-REGIONSCENARIO A1
(IN MILLION US$)SCENARIO A2
(IN MILLION US$)Mexico 79.665 79.665
Central America and Yucatan35 5.128 5.847
Greater Antilles36 22.771 26.041
Lesser Antilles37 1.813 2.073
Bahamas, The 985 1.241
Total 110.362 114.867
the data and calculations are based on Curry et al. (2009). please note that the scenarios named here ‘A1’ and ‘A2’ are not sres scenarios but based on emanuel (2005) and webster et al. (2005).
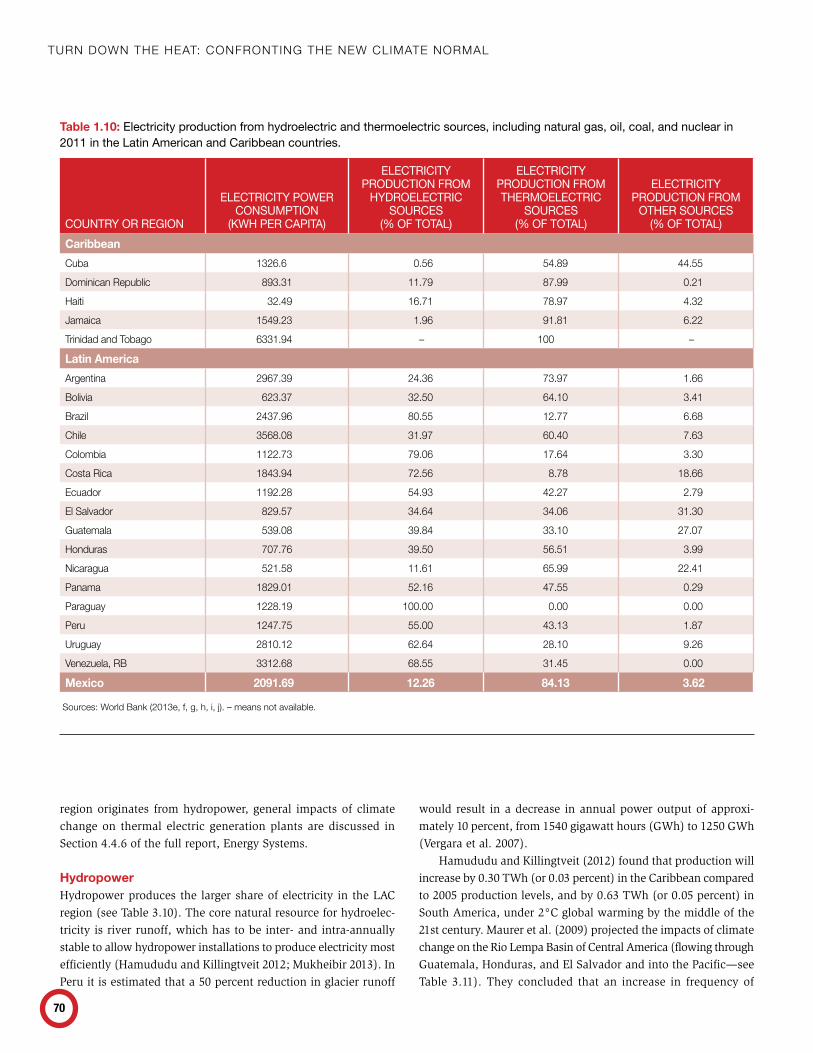
Turn Down The heaT: ConfronTing The new ClimaTe normal
70
region originates from hydropower, general impacts of climate change on thermal electric generation plants are discussed in Section 4.4.6 of the full report, Energy Systems.
HydropowerHydropower produces the larger share of electricity in the LAC region (see Table 3.10). The core natural resource for hydroelec-tricity is river runoff, which has to be inter- and intra-annually stable to allow hydropower installations to produce electricity most efficiently (Hamududu and Killingtveit 2012; Mukheibir 2013). In Peru it is estimated that a 50 percent reduction in glacier runoff
would result in a decrease in annual power output of approxi-mately 10 percent, from 1540 gigawatt hours (GWh) to 1250 GWh (Vergara et al. 2007).
Hamududu and Killingtveit (2012) found that production will increase by 0.30 TWh (or 0.03 percent) in the Caribbean compared to 2005 production levels, and by 0.63 TWh (or 0.05 percent) in South America, under 2°C global warming by the middle of the 21st century. Maurer et al. (2009) projected the impacts of climate change on the Rio Lempa Basin of Central America (flowing through Guatemala, Honduras, and El Salvador and into the Pacific—see Table 3.11). They concluded that an increase in frequency of
Table 1.10: Electricity production from hydroelectric and thermoelectric sources, including natural gas, oil, coal, and nuclear in 2011 in the Latin American and Caribbean countries.
COUNTRY OR REGION
ELECTRICITY POWER CONSUMPTION
(KWH PER CAPITA)
ELECTRICITY PRODUCTION FROM
HYDROELECTRIC SOURCES
(% OF TOTAL)
ELECTRICITY PRODUCTION FROM THERMOELECTRIC
SOURCES (% OF TOTAL)
ELECTRICITY PRODUCTION FROM
OTHER SOURCES (% OF TOTAL)
Caribbean
Cuba 1326.6 0.56 54.89 44.55
dominican republic 893.31 11.79 87.99 0.21
haiti 32.49 16.71 78.97 4.32
Jamaica 1549.23 1.96 91.81 6.22
trinidad and tobago 6331.94 – 100 –
Latin America
Argentina 2967.39 24.36 73.97 1.66
bolivia 623.37 32.50 64.10 3.41
brazil 2437.96 80.55 12.77 6.68
Chile 3568.08 31.97 60.40 7.63
Colombia 1122.73 79.06 17.64 3.30
Costa rica 1843.94 72.56 8.78 18.66
ecuador 1192.28 54.93 42.27 2.79
el salvador 829.57 34.64 34.06 31.30
Guatemala 539.08 39.84 33.10 27.07
honduras 707.76 39.50 56.51 3.99
nicaragua 521.58 11.61 65.99 22.41
panama 1829.01 52.16 47.55 0.29
paraguay 1228.19 100.00 0.00 0.00
peru 1247.75 55.00 43.13 1.87
uruguay 2810.12 62.64 28.10 9.26
venezuela, rb 3312.68 68.55 31.45 0.00
Mexico 2091.69 12.26 84.13 3.62
sources: world bank (2013e, f, g, h, i, j). – means not available.
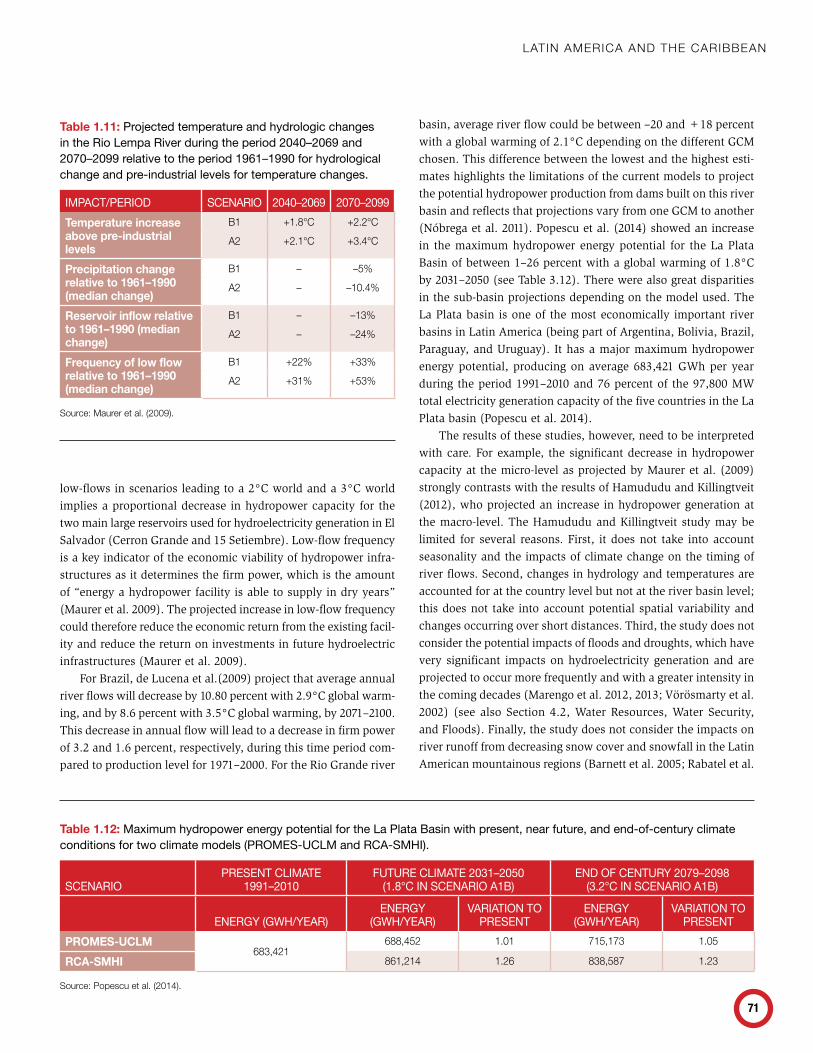
lAtin AmeriCA And the CAribbeAn
71
low-flows in scenarios leading to a 2°C world and a 3°C world implies a proportional decrease in hydropower capacity for the two main large reservoirs used for hydroelectricity generation in El Salvador (Cerron Grande and 15 Setiembre). Low-flow frequency is a key indicator of the economic viability of hydropower infra-structures as it determines the firm power, which is the amount of “energy a hydropower facility is able to supply in dry years” (Maurer et al. 2009). The projected increase in low-flow frequency could therefore reduce the economic return from the existing facil-ity and reduce the return on investments in future hydroelectric infrastructures (Maurer et al. 2009).
For Brazil, de Lucena et al.(2009) project that average annual river flows will decrease by 10.80 percent with 2.9°C global warm-ing, and by 8.6 percent with 3.5°C global warming, by 2071–2100. This decrease in annual flow will lead to a decrease in firm power of 3.2 and 1.6 percent, respectively, during this time period com-pared to production level for 1971–2000. For the Rio Grande river
basin, average river flow could be between –20 and +18 percent with a global warming of 2.1°C depending on the different GCM chosen. This difference between the lowest and the highest esti-mates highlights the limitations of the current models to project the potential hydropower production from dams built on this river basin and reflects that projections vary from one GCM to another (Nóbrega et al. 2011). Popescu et al. (2014) showed an increase in the maximum hydropower energy potential for the La Plata Basin of between 1–26 percent with a global warming of 1.8°C by 2031–2050 (see Table 3.12). There were also great disparities in the sub-basin projections depending on the model used. The La Plata basin is one of the most economically important river basins in Latin America (being part of Argentina, Bolivia, Brazil, Paraguay, and Uruguay). It has a major maximum hydropower energy potential, producing on average 683,421 GWh per year during the period 1991–2010 and 76 percent of the 97,800 MW total electricity generation capacity of the five countries in the La Plata basin (Popescu et al. 2014).
The results of these studies, however, need to be interpreted with care. For example, the significant decrease in hydropower capacity at the micro-level as projected by Maurer et al. (2009) strongly contrasts with the results of Hamududu and Killingtveit (2012), who projected an increase in hydropower generation at the macro-level. The Hamududu and Killingtveit study may be limited for several reasons. First, it does not take into account seasonality and the impacts of climate change on the timing of river flows. Second, changes in hydrology and temperatures are accounted for at the country level but not at the river basin level; this does not take into account potential spatial variability and changes occurring over short distances. Third, the study does not consider the potential impacts of floods and droughts, which have very significant impacts on hydroelectricity generation and are projected to occur more frequently and with a greater intensity in the coming decades (Marengo et al. 2012, 2013; Vörösmarty et al. 2002) (see also Section 4.2, Water Resources, Water Security, and Floods). Finally, the study does not consider the impacts on river runoff from decreasing snow cover and snowfall in the Latin American mountainous regions (Barnett et al. 2005; Rabatel et al.
Table 1.12: Maximum hydropower energy potential for the La Plata Basin with present, near future, and end-of-century climate conditions for two climate models (PROMES-UCLM and RCA-SMHI).
SCENARIOPRESENT CLIMATE
1991–2010FUTURE CLIMATE 2031–2050
(1.8°C IN SCENARIO A1B)END OF CENTURY 2079–2098
(3.2°C IN SCENARIO A1B)
ENERGY (GWH/YEAR)ENERGY
(GWH/YEAR)VARIATION TO
PRESENTENERGY
(GWH/YEAR)VARIATION TO
PRESENTPROMES-UCLM
683,421688,452 1.01 715,173 1.05
RCA-SMHI 861,214 1.26 838,587 1.23
source: popescu et al. (2014).
Table 1.11: Projected temperature and hydrologic changes in the Rio Lempa River during the period 2040–2069 and 2070–2099 relative to the period 1961–1990 for hydrological change and pre-industrial levels for temperature changes.
IMPACT/PERIOD SCENARIO 2040–2069 2070–2099Temperature increase above pre-industrial levels
b1 +1.8°C +2.2°C
A2 +2.1°C +3.4°C
Precipitation change relative to 1961–1990 (median change)
b1 – –5%
A2 – –10.4%
Reservoir inflow relative to 1961–1990 (median change)
b1 – –13%
A2 – –24%
Frequency of low flow relative to 1961–1990 (median change)
b1 +22% +33%
A2 +31% +53%
source: maurer et al. (2009).
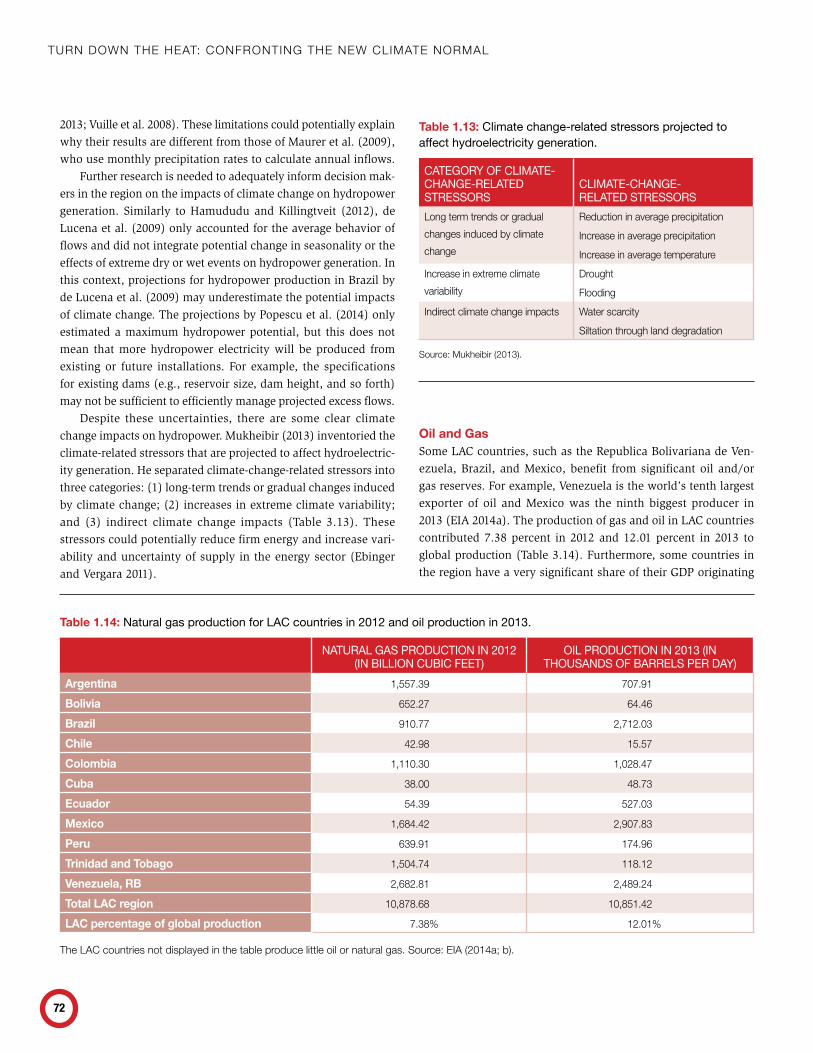
Turn Down The heaT: ConfronTing The new ClimaTe normal
72
2013; Vuille et al. 2008). These limitations could potentially explain why their results are different from those of Maurer et al. (2009), who use monthly precipitation rates to calculate annual inflows.
Further research is needed to adequately inform decision mak-ers in the region on the impacts of climate change on hydropower generation. Similarly to Hamududu and Killingtveit (2012), de Lucena et al. (2009) only accounted for the average behavior of flows and did not integrate potential change in seasonality or the effects of extreme dry or wet events on hydropower generation. In this context, projections for hydropower production in Brazil by de Lucena et al. (2009) may underestimate the potential impacts of climate change. The projections by Popescu et al. (2014) only estimated a maximum hydropower potential, but this does not mean that more hydropower electricity will be produced from existing or future installations. For example, the specifications for existing dams (e.g., reservoir size, dam height, and so forth) may not be sufficient to efficiently manage projected excess flows.
Despite these uncertainties, there are some clear climate change impacts on hydropower. Mukheibir (2013) inventoried the climate-related stressors that are projected to affect hydroelectric-ity generation. He separated climate-change-related stressors into three categories: (1) long-term trends or gradual changes induced by climate change; (2) increases in extreme climate variability; and (3) indirect climate change impacts (Table 3.13). These stressors could potentially reduce firm energy and increase vari-ability and uncertainty of supply in the energy sector (Ebinger and Vergara 2011).
Oil and GasSome LAC countries, such as the Republica Bolivariana de Ven-ezuela, Brazil, and Mexico, benefit from significant oil and/or gas reserves. For example, Venezuela is the world’s tenth largest exporter of oil and Mexico was the ninth biggest producer in 2013 (EIA 2014a). The production of gas and oil in LAC countries contributed 7.38 percent in 2012 and 12.01 percent in 2013 to global production (Table 3.14). Furthermore, some countries in the region have a very significant share of their GDP originating
Table 1.14: Natural gas production for LAC countries in 2012 and oil production in 2013.
NATURAL GAS PRODUCTION IN 2012 (IN BILLION CUBIC FEET)
OIL PRODUCTION IN 2013 (IN THOUSANDS OF BARRELS PER DAY)
Argentina 1,557.39 707.91
Bolivia 652.27 64.46
Brazil 910.77 2,712.03
Chile 42.98 15.57
Colombia 1,110.30 1,028.47
Cuba 38.00 48.73
Ecuador 54.39 527.03
Mexico 1,684.42 2,907.83
Peru 639.91 174.96
Trinidad and Tobago 1,504.74 118.12
Venezuela, RB 2,682.81 2,489.24
Total LAC region 10,878.68 10,851.42
LAC percentage of global production 7.38% 12.01%
the lAC countries not displayed in the table produce little oil or natural gas. source: eiA (2014a; b).
Table 1.13: Climate change-related stressors projected to affect hydroelectricity generation.
CATEGORY OF CLIMATE-CHANGE-RELATED STRESSORS
CLIMATE-CHANGE- RELATED STRESSORS
long term trends or gradual
changes induced by climate
change
reduction in average precipitation
increase in average precipitation
increase in average temperature
increase in extreme climate
variability
drought
Flooding
indirect climate change impacts water scarcity
siltation through land degradation
source: mukheibir (2013).
lAtin AmeriCA And the CAribbeAn
73
from oil and natural gas rents (defined as the difference between value of natural gas or oil production and the total cost of produc-tion); in Venezuela and Trinidad and Tobago, for example, about 30 percent of 2012 GDP in 2012 came from oil and gas rents (World Bank 2013e; f). The assessment of climate change impacts on oil and gas presented here focuses on direct impacts and does not consider the possible decrease in fossil fuel assets value induced by future mitigation policies, which would contribute to a reduction in fossil fuel demand at the global level (IPCC 2014d).
Off-shore platforms and on-shore infrastructures are susceptible to climate related impacts, such as sea-level rise and coastal ero-sion that could damage extraction, storage and refining facilities (Dell and Pasteris 2010) and also to extreme weather events such as tropical cyclones which could lead to extraction and production disruption and platform evacuation (Cruz and Krausmann 2013). For example, in the aftermath of tropical cyclones Katrina and Rita in 2005, 109 oil platforms and five drilling rigs were damaged leading to interruptions in production (Knabb et al. 2005). Cozzi and Gül (2013) identify two key climate related risks for the LAC region: sea-level rise and an increase in storm activity (particularly for Brazil). These risks would mainly lead to an increase in the shutdown time of coastal refineries and an increase in offshore platform costs, which will have to be more resistant to high-speed winds associated with tropical cyclones (Cozzi and Gül 2013).
Wind and Solar EnergySolar and wind energy sources play an important role in climate change mitigation strategies to reduce global emissions from fossil fuel combustion. Even though wind and solar energy still play a very minor role in LAC, significant development of the sector is projected (Bruckner et al. 2014). In this context, a more precise understanding of the effect of climate change on these energy sources is of great significance.
For wind energy, the main climate change impact relates to changing wind patterns and how climate change will affect inter- and intra-annual variability and geographical distribution of wind (Arent et al. 2014). Despite significant progress, GCMs and RCMs still do not produce very precise projections for inter-annual, sea-sonal, or diurnal wind variability (Arent et al. 2014). Furthermore, specific studies estimating the effects of climate change on wind patterns and therefore wind energy in LAC are still missing (Pryor and Barthelmie 2013). However, drawing on conclusions from Pryor and Barthelmie (2013) for the United States and Europe stating that “generally, the magnitude of projected changes over Europe and the contiguous USA are within the ‘conservative’ estimates embedded within the Wind Turbine Design Standards,” it can be assumed that future climate change may not significantly affect wind energy supply. Pryor and Barthelmie (2013) nonetheless highlight the need for more research in this area to better quantify the effects of long-term climate change and extreme events on wind energy supplies.
Solar energy installations are subject to two types of climate-related impacts: reduced insulation induced by cloudiness, which decreases heat or electricity output, and extreme weather events such as windstorms or hail, which could damage production units and their mounting structures (Arent et al. 2014). According to Arent et al. (2014), gradual climate change and extreme weather events “do not pose particular constraints to the future deploy-ment of solar technologies.” Studies estimating projected impacts of climate change and extreme weather events on solar energy outputs are not available.
4.11.3 Impacts of Tropical Cyclones on Power OutagesThe Caribbean and Central American regions are particularly exposed to the impacts of tropical cyclones and a higher frequency of high-intensity tropical cyclones is projected (see Section 3.6, Tropical Cyclones/Hurricanes). Strong winds, heavy precipitation, and floods associated with tropical cyclones have the capacity to disrupt and even damage essential power generation and distribu-tion infrastructures leading to power outages. A growing number of studies have developed models to estimate and forecast the risks of power outages to energy systems in order to improve disaster assistance and recovery (Cao et al. 2013; Han et al. 2009; Nateghi et al. 2013; Quiring et al. 2013). However, studies and models spe-cifically quantifying or taking into account the projected effect of climate change on tropical cyclones intensity and frequency and the potential disruptions to power generation and distribution in the Caribbean and Central American countries are lacking.
4.11.4 Effects of Climate Change on Energy DemandClimate change will also affect energy demand. Increasing tempera-tures and heat extremes (see Sections 3.1, Projected Temperature Changes, and 3.3.2, Heat Extremes) lead to a higher demand for air conditioning (Cozzi and Gül 2013); on the other hand, demand for heating may decrease. At the global level, Isaac and van Vuuren (2009) estimated that by 2100 in a 4°C world the number of cooling degree days will rise from 12,800 during the period 1971–1991 to 19,451, (a 51.9 percent increase) while demand for heating (measured in heating degree days) was projected to remain almost constant. At the regional level, they project that by 2100 demand for heating is going to decrease by 34 percent compared to the 1971–1991 period—from 364 to 240 heating degree days. They project the demand for cooling to increase by 48 percent, from 1802 to 2679 cooling degree days.
4.11.5 SynthesisThe assessment of the current literature on climate change impacts on energy in LAC shows that there are only a few studies, most of which make strong assumptions about key issues such as seasonality of water supply for hydropower. These studies are more qualitative
Turn Down The heaT: ConfronTing The new ClimaTe normal
74
than quantitative, and important gaps remain. However, in general substantial climate change impacts can be expected for the energy sector. There is also a lack of studies with respect to the impacts of climate change impacts on renewable energies. In general, the impacts of climate change on energy demand is less well studied than those on energy supply—and, yet, demand and supply interact in a dynamic way. For example, the concomitant increase in energy demand during heat extremes and the decrease of energy supply through reduced river flow and low efficiencies may put existing energy systems under increasing pressure in the future.
5 Regional Development Narratives
In this section, implications of climate change for regional devel-opment are discussed in order to relate climate change impacts to existing and future vulnerabilities in the LAC region. The develop-ment narratives are split into overarching development narratives across the region and in sub-regional development narratives. It is important to note that each development narratives presents only one of the many possible ways in which climate change can put key development trajectories at risk. Table 1.15 summarizes the key climate change impacts under different warming levels in the Latin American and the Caribbean region and Figure 3.22 summarizes the key sub-regional impacts.
5.1 Overarching Development Narratives
5.1.1 Changes to the Hydrological Cycle Endanger the Stability of Freshwater Supplies and Ecosystem ServicesAn altered hydrological system due to changing runoff, glacial melt, and snowpack changes will affect the ecosystem services that the rural population depends on, freshwater provisioning in cities, and major economic activities such as mining and hydropower.
Throughout the 20th century the tropical glaciers in the Central Andes have lost large amounts of their volume (see Section 4.1, Glacial Retreat and Snowpack Changes). As land surface tempera-tures rise, this trend is expected to accelerate possibly leading to an almost complete deglaciation of 93–100 percent in a 4°C world. In concert with decreasing snowpack, changes to precipitation pat-terns, and higher evaporation, increasing glacial melt will impact the timing and magnitude of river flows. In general, runoff is projected to increase during the wet season, increasing flood risk (see Section 4.2, Water Resources, Water Security, and Floods). Accelerated melting rates may lead to a localized short-term surge in water supply that might lead to unsustainable dependency (Vuille 2013). For example, in the area known as Callejon de Huaylas in the central highlands of Peru, climate-change-induced glacier retreat
will add water stress to an area in which agriculture has already shifted toward more water-intensive irrigated crop production since the 1990s (Bury et al. 2011). As the glacier reservoirs gradually disappear, however, runoff will tend to decrease (particularly in the dry season). The peak in runoff is expected to be reached in about 20–50 years from now (Chevallier et al. 2011) if it has not yet peaked already (Baraer et al. 2012).
Changes to river flow translate into risks to stable water supplies for much of the region. Diminishing downriver water flow will also undermine hydropower generation; crucial to the economic development of the continent (Hoffman and Grigera 2013) (Section 4.11). Current studies project that by 2050, up to 50 million people in the vast lowland area fed by Andean glacial melt, will be affected by the loss of dry season water for drink-ing, agriculture, sanitation, and hydropower (Cushing and Kopas 2011). Deforestation and land degradation can furthermore alter the water cycle and possibly endanger water availability (Buytaert et al. 2006; Viviroli et al. 2011).
Changes to the seasonal cycle of water availability affect the ecosystems that rely on a stable water supply. Consequently eco-system services are put at risk. For example, freshwater fisheries may be exposed to climate-related risks as decreasing river flows reduce the floodplain for spawning and the natural seasonal flood-ing of lakes is reduced. A projected decrease in annual precipita-tion and increasing risk of drought will in turn increase the risk of large-scale forest degradation, not only in the Amazon, with a loss of associated ecosystem services.
In the Andes in particular, water stress will reduce pasture land availability in the dry season and increase the potential for conflict over land use (Kronik and Verner 2010). Social conflicts over water rights and water access may increase in the Peruvian Andes between farming communities and mining companies. Moreover, higher river flow peaks can lead to landslides and devas-tating floods associated with glacial lake outburst (Chevallier et al. 2011)—with direct consequences for human lives and settlements.
Cities are highly vulnerable as continuous urbanization and population growth increases water demand (Hunt and Watkiss 2011) and as they depend on ecosystem services provided by surround-ing areas. The high Andean moorlands (known as páramos—see Box 3.10, Critical Ecosystem Services of High Andean Mountain Ecosystems), which are key ecosystems able to stock large amounts of carbon on the ground and act as water regulators, are threatened by temperature rise, precipitation changes, and increasing human activity. Major population centers, such as Bogota and Quito, rely on páramo water as a significant supply source. The melting of the Andean glaciers, increasingly unpredictable seasonal rainfall patterns, and the overuse of underground reserves are affecting the urban centers of the highlands (e.g., La Paz, El Alto, and Cusco),
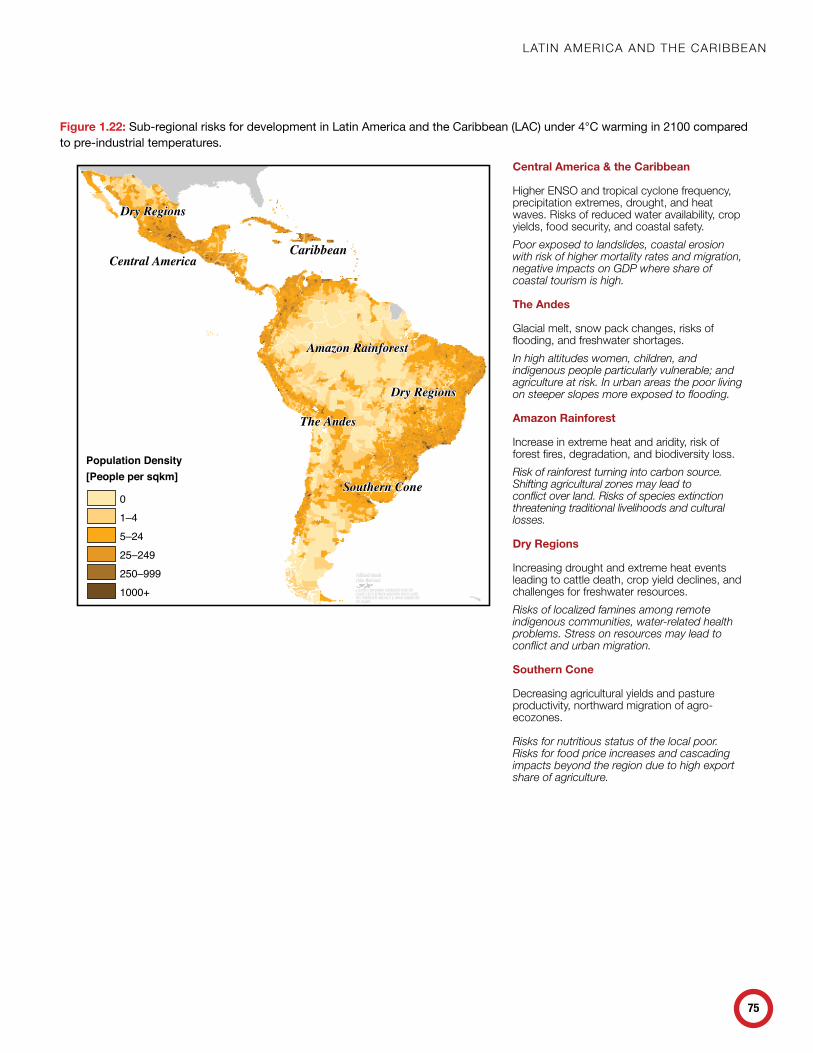
lAtin AmeriCA And the CAribbeAn
75
Figure 1.22: Sub-regional risks for development in Latin America and the Caribbean (LAC) under 4°C warming in 2100 compared to pre-industrial temperatures.
Central America & the Caribbean
higher enso and tropical cyclone frequency, precipitation extremes, drought, and heat waves. risks of reduced water availability, crop yields, food security, and coastal safety.
Poor exposed to landslides, coastal erosion with risk of higher mortality rates and migration, negative impacts on GDP where share of coastal tourism is high.
The Andes
Glacial melt, snow pack changes, risks of flooding, and freshwater shortages.
In high altitudes women, children, and indigenous people particularly vulnerable; and agriculture at risk. In urban areas the poor living on steeper slopes more exposed to flooding.
Amazon Rainforest
increase in extreme heat and aridity, risk of forest fires, degradation, and biodiversity loss.
Risk of rainforest turning into carbon source. Shifting agricultural zones may lead to conflict over land. Risks of species extinction threatening traditional livelihoods and cultural losses.
Dry Regions
increasing drought and extreme heat events leading to cattle death, crop yield declines, and challenges for freshwater resources.
Risks of localized famines among remote indigenous communities, water-related health problems. Stress on resources may lead to conflict and urban migration.
Southern Cone
decreasing agricultural yields and pasture productivity, northward migration of agro-ecozones.
Risks for nutritious status of the local poor. Risks for food price increases and cascading impacts beyond the region due to high export share of agriculture.
A DISPUTE CONCERNING SOVEREIGNTY OVER THEISLANDS EXISTS BETWEEN ARGENTINA WHICH CLAIMSTHIS SOVEREIGNTY AND THE U.K. WHICH ADMINISTERSTHE ISLANDS.
Falkland Islands(Islas Malvinas)
Central America
Dry Regions
Amazon Rainforest
The Andes
Southern Cone
Dry Regions
Southern Cone
Dry RegionsDry Regions
Amazon Rainforest
The Andes
Central AmericaCaribbean
Population Density[People per sqkm]
01–45–2425–249250–9991000+
Turn Down The heaT: ConfronTing The new ClimaTe normal
76
which rely to some extent on glacial melt for dry season water supplies and are already facing dire shortages. The arid coastal plain of Peru faces similar challenges. Water shortage has become a huge risk and a source of tension in Lima, which is dependent on water from the Andes. In Santiago de Chile, meanwhile, an estimated 40 percent reduction in precipitation will impact water supplies in a city that is expecting a 30 percent population growth by 2030 (Heinrichs and Krellenberg 2011). Quito is another city that will face water shortages as a result of glacier retreat (Hardoy and Pandiella 2009).
Freshwater in coastal areas is particularly exposed to the risks associated with sea-level rise. Here, a substantial section of the population is exposed to repeated flooding, contamination of groundwater by salt water, and constraints on the availability and quality of drinking water (Magrin et al. 2007). Low-income groups who already lack adequate access to water will be even less able likely to obtain it unless there is a considerable improvement in the provision of basic services.
5.1.2 Climate Change Places at Risk Both Large-Scale Agricultural Production for Export and Small-Scale Agriculture for Regional Food ProductionLatin America and the Caribbean is a climatically highly heteroge-neous region. As a result, agricultural production systems and their outputs differ greatly among climatic zones and countries, as will the impacts of climate change on agricultural production. Despite the relatively low contribution of agriculture (10–12 percent) to the total GDP, agriculture plays a vital role for the LAC economy, with 30–40 percent of the labor force engaged in the agricultural sector (IAASTD 2009). However, the numbers and proportion of the sector comprised by subsistence and commercial agriculture, differ greatly among the LAC countries.
Climate change is expected to have different impacts over different timeframes (see Section 4.3, Climate Change Impacts on Agriculture). In the short run, expected changes in agricultural outputs in the region are likely to be heterogeneous, with some regions and crops seeing gains and others losses (Table 1.15). In the long run, however, larger reductions in agriculture are expected with important impacts on livelihoods (Calvo 2013; Sanchez and Soria 2008; Samaniego 2009) despite uncertainties with regard to the importance of CO2 fertilization and potential adaptation. Overall, the potential risks estimated for the agricultural sector in LAC are substantial, particularly during the second half of the 21st century.
By putting agricultural production at risk, climate change threatens an important regional export. LAC plays a vital role in global agriculture (IFPRI 2012). The two biggest exporters of agricultural products in Latin America are Brazil and Argentina (Chaherli and Nash 2013). Agricultural production in LAC countries
has increased by roughly three percent per annum since the early 1990s (IFPRI 2012). In LAC, large parts of agriculture are rain-fed and therefore very vulnerable to climatic variations such as droughts and changing precipitation patterns. Only 10.5 mil-lion ha of agricultural area are irrigated, amounting to roughly 0.6 percent of the total agricultural area. Of those 10.5 million ha of irrigated area, 3.5 million are located in Brazil, amounting to 1.3 percent of Brazil’s agricultural area (FAOSTAT 2013; Oliveira et al. 2009). Changing precipitation patterns and extreme events could therefore affect important parts of the economy. Moreover, Hoffman and Grigera (2013) calculate that for the Amazon and Cerrado regions, shifting rainfall patterns and temperature rises due to climate change will lead to more frequent droughts and forest fires in the dry season and floods in the rainy season, threatening the growth of monoculture agribusiness and the livelihoods of small-holder farmers and ranchers.
Besides the implications of climate change for large-scale agriculture, there is also evidence that climate change will strongly affect small-to-medium-scale agriculture and regional food security as well as indigenous communities. This is par-ticularly true for rural communities who heavily rely on sub-sistence farming and the urban poor who are most hard-hit by rising food prices. A projected 15–50 percent decline in fishery catch potential along the Caribbean coast, and by more than 50 percent off the Amazonas estuary and the Rio de la Plata (Cheung et al. 2010), together with widespread coral reef loss, further adds to the challenge of maintaining a healthy diet for the poorest in the region. Coral reef loss and more frequent extreme events could also affect the viability of the tourism industry, with significant implications for livelihoods across different socio-economic groups.
Overall undernourishment in the region has decreased. In 1990, roughly 65 million people (14.6 percent of the population) were undernourished; by 2012, the number decreased to 49 mil-lion people (8.3 percent of the population) (FAO 2012a). The LAC countries most affected by undernourishment are Haiti, Bolivia, Guatemala, Nicaragua, and Paraguay. In all five countries more than 20 percent of the population are undernourished (FAO 2012a). However, population growth and changing nutritional patterns are expected to increase global food demand by 60 percent by 2050 (FAO 2012a). As a result, increased agricultural production is essential to maintain the currently positive trend of decreasing undernourishment. The expected negative effects of climate change on agriculture (Table 1.15) will make the challenge of achieving food security in LAC all the more difficult. According to one study, without adaptation measures climate change is likely to stall the projected decline in child undernourishment in LAC by 5 percent by 2050 (Nelson et al. 2009). This study does not take into account the impacts on food resources other than agricultural crops; it
lAtin AmeriCA And the CAribbeAn
77
therefore may underestimate the multidimensional impacts that climate change has on food security.
There are potentially direct consequences of climate change on the levels of poverty and food security in the region. According to an exploratory modeling study by Galindo et al. (2013) an average decline of six percent in agricultural production due to climate change by 2025 would result in 22.6 percent and 15.7 percent fewer people overcoming the $1.25 and $2 per day poverty lines respectively, given losses in livelihoods. This means a total of 6.7–8.6 million people who would remain under the poverty line as a result of climate change impacts on agriculture. In addition, important indirect effects resulting from reductions in agricultural yields include risks to agro-industrial supply chains. Given the exploratory nature of this study, however, exact numbers have to be interpreted with care.
5.1.3 A Stronger Prevalence of Extreme Events Affects Both Rural and Urban Communities, Particularly in Coastal RegionsA changing frequency and intensity of extreme events, such as drought, heat extremes, tropical cyclones, and heavy precipitation, will have strong implications for the urban and rural populations of the region, with particular vulnerability patterns shaping the risks of different population groups.
The LAC region is heavily exposed to the effects of strong ENSO events, including extreme precipitation and disastrous flooding, especially in the Andes and Central America where steep terrains are common (IPCC 2012; Mata et al. 2001; Mimura et al. 2007; Poveda et al. 2001). Glacial lake outbursts present a further permanent hazard for Andean cities (Chevallier et al. 2011). Along the Caribbean and Central American coasts, tropical cyclones and rising sea levels expose the population to storm surges and coastal inundation (Dilley et al. 2005; Woodruff et al. 2013). Although the scientific evidence is limited, there are studies indicating an increase of 80 percent in the frequency of the strongest category 4 and 5 Atlantic Tropical Cyclones (Bender et al. 2010; Knutson et al. 2013) and a doubling in the frequency of extreme El Niño events above 20th century levels (Cai et al. 2014). The latter two projections are especially wor-risome as they concur with a sea-level rise up to 110 cm (see Section 3.7, Regional Sea-level Rise). A poleward migration of tropical cyclones as recently observed (Kossin et al. 2014) could potentially lead to less damage to tropical coasts but countries would also benefit less from the water replenishment that cyclone rainfall brings and areas currently less exposed to tropical cyclones would face additional risks.
The vulnerability of people exposed to extreme events is shaped by a multitude of non-climatic factors. Some socioeco-nomic factors shaping vulnerability are the same for rural and
urban populations, including social marginalization and limited access to resources. However, conditions such as dense and poorly constructed housing in urban areas or high, direct dependence on ecosystem services among rural indigenous populations result in specific vulnerability patterns for different population groups.
Despite these differences in vulnerabilities, climate impacts also act along an urban-rural continuum. For example cities depend on the surrounding landscape to provide ecosystem services and the rural population benefits from remittances sent from urban to rural areas. However, the effectiveness of remittances in support-ing adaptive capacity under rising impacts is open to question, as both demand on the receiving end and exposure to climate risks on the sending end are expected to rise.
The rural poor are likely to feel the impacts of climate change and variability most directly given their dependency on rain-fed agriculture and other environmental resources (e.g., forests and fish) which are particularly susceptible to the effects of climate change in general and extremes in particular. Moreover, these populations have limited political voice and are less able to leverage government support to help curb the effects of climate change (Prato and Longo 2012; Hardoy & Pandiella, 2009). Rural poverty in the LAC region has declined considerably over the past two decades—both in terms of the numbers of people who live in poverty and the rate of poverty among rural populations—with many countries in the region showing positive trends both in poverty reduction and in a better distribution of income. That said, many rural people in the region continue to live on less than $2 per day and have poor access to financial services, markets, training, and other opportunities. There is a strong concentra-tion of extreme poverty among landless farmers and indigenous peoples, particularly among women and children; indeed, close to 60 percent of the population in extreme poverty live in rural areas (RIMISP 2011).
Extreme events will also strongly impact the urban poor as urban areas are also a focal point of climate change impacts from extreme events (Vörösmarty et al. 2013). In 2010, the urban popu-lation accounted for 78.8 percent of the total population (ECLAC 2014). National economies, employment patterns, and government capacities—many of which are highly centralized—are also very dependent on large cities; this makes them extremely vulnerable to the effects of extreme events (Hardoy and Pandiella 2009).
Urbanization in the region includes unplanned, haphazard expansion of cities (UN Habitat 2012) over floodplains, mountain slopes, or areas prone to flooding or affected by seasonal storms, sea surges, and other weather-related risks (Hardoy and Pandiella 2009). Houses in informal settlements are frequently built with inadequate materials, which make them damp and cold in the winter and very hot in the summer (Hardoy and Pandiella 2009). Hence, there are concentrations of low-income households at high
Turn Down The heaT: ConfronTing The new ClimaTe normal
78
risk from extreme weather (Hardoy et al. 2001). For example, an estimated 1.1 million people live in the favelas of Rio de Janeiro that sprawl over the slopes of the Tijuca mountain range, making them particularly at risk from mudslides (Hardoy and Pandiella 2009).
Moreover, most low-income people live in housing without air conditioning or adequate insulation; during heat waves, the very young, pregnant women, the elderly, and people in poor health are particularly at risk (Bartlett 2008) (see also Section 4.7, Human Health). In northern Mexico, heat waves have been correlated with increases in mortality rates; in Buenos Aires, 10 percent of summer deaths are associated with heat strain; in Peru, records show a correlation between excessive heat and increases in the incidence of diarrhea (Mata and Nobre 2006). Such effects may be compounded by a climate-change-related increase in the broad geographic areas and microclimates in which certain vector-borne diseases, such as malaria and dengue fever, can flourish (Costello et al. 2009).
Adverse socioeconomic conditions in concert with exposure to climate change impacts undermine the development of adaptive capacity. People living in informal urban settlements without legal tenure rights—who are generally from poor and socially excluded communities (including marginalized ethnic groups)—in principle have limited means or incentive to attempt to climate-proof their houses (Moser et al. 2010). A lack of accountability to the citizens and a very limited scope for public participation in decision making means that poorer areas are deprioritised for infrastructural upgrad-ing, and thus frequently have inadequate infrastructure (e.g., storm drains) to cope with extreme events (Hardoy and Pandiella 2009). Furthermore, the impacts of extreme weather events are often more severe in areas that have been previously affected or have not yet been fully recovered from previous a previous extreme event; these cumulative effects are difficult to overcome (Hardoy and Pandiella 2009; Hardoy and Romero Lankao 2011). Damage to housing as a result of extreme weather can lead to loss of key assets used in urban informal sector businesses (Moser et al. 2010), further undermining the buildup of resilience and increasing the risk of poverty traps.
5.2 Sub-regional Development Narratives
5.2.1 Central America and the Caribbean—Extreme Events as a Threat to LivelihoodsIn a 4°C world, the Central American and Caribbean countries are projected to be at risk from higher ENSO and tropical cyclone frequency, drought and heat extremes, and precipitation extremes (Table 1.15). The impacts of tropical cyclones will be exacerbated by rising sea levels fostering storm surges. Moreover, by the year 2040, Caribbean coral reefs are expected to experience annual bleaching events due to sea-level rise, ocean warming, and sedimentation from flood events, which will diminish the coastal
protection provided by healthy coral reefs. Altogether these impacts may augment impacts on coastal infrastructure (including beach erosion), thus threatening transport, settlements, and tourism. In combination with an up to 50 percent decrease in fish catch potential under a 4°C world (Cheung et al. 2010), damage to coral reefs threatens artisanal fisheries that support local livelihoods.
Infrastructure in the Caribbean is already highly vulnerable to natural hazards, and important assets (including airports) are often low-lying. Further climate change impacts may affect the condition of infrastructure, increasing failures and maintenance costs. The high vulnerability to hurricanes and tropical storms in low-lying states could further increase with a growing population, putting growing numbers of assets at risk, exacerbating pervasive poverty/inequality and potentially leading to displacement of a greater proportion of the population, as was observed in the wake of Hurricane Mitch (Glantz and Jamieson 2000; McLeman and Hunter 2011). Ultimately, due to the small size of many Caribbean islands, more frequent natural disasters may cause severe setbacks to the overall economy. However, not only coastal areas are at high risk. In Central America and the Caribbean, the poor are often living on steep slopes or close to rivers; they are therefore espe-cially exposed to landslides and floods. Such hydro-meteorological events may damage the poor quality (often informal) residential structures of vulnerable communities, which could in turn lead to higher mortality rates and population displacement. More generally, intensified non-climate stressors related to land use change and ecosystem degradation could impair the resilience and the ability to cope with the impacts of extreme hydro-meteorological events.
Climate extremes (e.g., drought, heat waves) in combination with long-term decreases in precipitation may reduce crop yields in Central America and Caribbean countries and affect food secu-rity and market prices. This is particularly relevant in the case of coffee crops, which are important for the livelihoods of workers and small farmers in Central America.
There are several studies projecting reduced runoff and ground-water recharge in a 4°C world (Table 1.15), which will reduce water availability. This may disproportionately affect the lives of women responsible for managing household water resources, as well as the health and wellbeing of vulnerable members of poor households (e.g., infants, the chronically ill, and the elderly). Ultimately, water stress could increase conflicts over land, affect food security, and provoke climate-induced migration. Additionally, Central America is heavily dependent on hydropower to generate electricity; it is expected that energy security could become an issue.
5.2.2 The Andes—Changing Water Resources Challenge the Rural and Urban PoorClimate change already affects and will further affect water resources in the Andes (Table 1.15). These resources are already scarce as
lAtin AmeriCA And the CAribbeAn
79
a result of insufficient management and degradation of critical ecosystems (including the páramo and cloud forests). Increas-ing temperatures leading to higher evapotranspiration, changing precipitation patterns, and more extreme precipitation events all directly affect river runoff. Moreover, glacial melt and snow pack changes are important components of the regional hydrological balance. Increased glacial melt may increase water availability in the next few decades while reducing it thereafter. Both glacial melt and snowmelt affect the amount and seasonality of water flows. These changes threaten the water supply for hydropower, agriculture, and domestic use. This is particularly relevant because many large cities and populations are located at high altitudes or in arid regions in the lowlands where alternative sources of water are not abundant and where the urban poor are already suffering from limited access to water. Moreover, the regional energy mix strongly depends on hydropower; higher risks of power outages may impact household and community welfare. In addition, subsistence farming and cattle herding in the highlands, as well as large-scale agriculture in the coastal areas, depend on water coming from the mountains. While a decreasing water supply is an important risk to food security and poverty levels in general, women and children who are often in charge of agriculture in high-altitude communities are at particular risk of increasing poverty and water-scarcity-related conflicts. The same applies to indigenous people whose traditional water management systems are likely to be affected and whose livelihoods are already threatened. Other water-dependent activities, such as large-scale or artisanal mining, may be affected as well. These stresses could exacerbate the cur-rent urbanization trend, leading to further rural-urban migration and amplifying the risks to the urban poor.
Besides these more gradual changes, extreme hydrological events (such as an intensification of ENSO, extreme precipitation, high flows, and glacial lake outburst floods) increase the risk for natural disasters, erosion, and landslides. While such events may generally decrease GDP, the impact across different layers of the population is uneven, with the urban poor living on steep slopes typically at the highest risk.
5.2.3 The Amazon—Risk of Tipping Point, Forest Degradation, and Biodiversity Loss Threatens Local CommunitiesDespite an improved understanding of processes linking climate, vegetation, land-use change, and fire in the Amazon, the identifica-tion of the processes and the quantification of thresholds at which an irreversible approach toward a tipping point is triggered (i.e., a potential transition from forest to savannah) is still incomplete. Overall the most recent studies suggest that forest dieback is an unlikely, but possible, future for the Amazon region (Good et al. 2013). Should such die-back occur, the livelihoods of forest-dwelling
and forest-fringe communities would be at particular risk, which could, in turn, spur additional migration of affected groups to cities, and could also open up forest regions to settlers, spurring additional deforestation.
Besides the risk of a tipping point, climate change is expected to contribute to forest degradation and biodiversity loss. There are variable rainfall patterns and significant differences in rain-fall projections between the northern and southern zones of the Amazon. In a 4°C world, in the southern zone, winter annual precipitation is likely to decrease while evapotranspiration and aridity is expected to increase (see Section 3.3). This puts the southern part of the forest at increased fire risk.
Increasing fires will not only lead to large emissions of CO2 but, in combination with deforestation, declining rainfall, and forest drying, may also draw the agricultural frontier northwards. This threatens the livelihoods of forest-dependent communities and could lead to land-use conflicts between existing communi-ties and newly arriving farmers. In addition, timber harvest from concessions could be negatively affected. Moreover, increasing fires in the Amazon threaten rural and urban settlements and the resulting smoke/haze could aggravate respiratory disease for both forest dwellers and urban residents in central Brazil.
Negative effects of climate change on biodiversity resulting from habitat contractions and extinctions are very likely in a warmer than 2°C world. In combination with increasing forest degrada-tion, changes in the range of certain species will affect resource availability for indigenous populations that are very reliant on native plants and animals. This could increase malnutrition among children and the elderly and undermine traditional knowledge of ecosystems, impacting the community social structure and the value placed on traditional knowledge. Altogether, these changes may push local communities to expand subsistence agriculture as an alternative livelihood strategy or to migrate to other forest areas, thereby amplifying forest degradation and threatening existing protected areas.
5.2.4 Southern Cone—Risks to Export Commodities from Intensive AgricultureThe Southern Cone countries are currently a major grain and livestock producing region for local and global markets (Chaherli and Nash 2013). The region has experienced significant climate shocks, mainly related to ENSO, which have resulted in floods or droughts at critical phases of the crop cycle. Moreover, despite small and uncertain increases in precipitation, the region faces increasing evapotranspiration rates under a 4°C world, (see Sec-tion 3.3). This highlights the high risks to agricultural production from climate change in a 4°C world; this is particularly true for rain-fed agriculture, which is prevalent in more than 98 percent of Brazil’s agricultural area (FAOSTAT 2013; Oliveira et al. 2009).
Turn Down The heaT: ConfronTing The new ClimaTe normal
80
The results of agricultural modeling studies differ in the severity of the climate change impact, but most agree that climate change will very likely decrease agricultural yields for important food crops in Latin America in the absence of adaptation measures and persistent CO2 fertilization (ECLAC 2010; Fernandes et al. 2012; Nelson, Rosegrant, Koo et al. 2010) (see also Section 4.3, Climate Change Impacts on Agriculture). Moreover, while CO2 fertiliza-tion may increases yields, there is some evidence of it decreasing protein contents in major grains (Müller et al. 2014; Myers et al. 2014). For sugarcane, there might be beneficial effects with yield increases (Table 1.15). Moreover, agro-ecozones in Brazil, includ-ing major grain belts, may move northward (to central Brazil) to already cleared lands in the Cerrado region; Assad et al. (2013) project displacement of poorly productive and degraded pasture with intensive multicrop grain cropping and intensified pastures.
The impacts on agriculture and livestock (Table 1.15) may lead to increasing food prices that could entail trade impacts and stresses on other regions’ food production systems and may alter dietary patterns (especially of the poor). Alongside price risks, reduced nutrient contents (especially protein) could also raise the risk of malnutrition in children. Opportunities may arise from the reshuffling of agricultural zones as plantation forestry, horticultural crops, and biofuel production from sugarcane may be able to expand on lands that become unsuitable for grain crops. Reduced crop and livestock productivity can be moderated via adaptation measures and climate-smart technologies (e.g., improved varieties and breeds, irrigation, conservation agriculture, liming, and fertil-izers to enhance crop rooting depth). These intensification and climate-smart innovations would, however, require a significant upgrading of knowledge and extensive field testing.
5.2.5 Dry Regions (Mexican Dry Subtropics and North Eastern Brazil)—Increasing Drought Stress Threatening Rural Livelihoods and HealthThere has been significant development progress in these regions in recent decades, which has lifted a number of communities out of extreme poverty. The possibility of increasing droughts, however, threatens to force many of these populations back into extreme poverty.
The Central and Northern arid areas in Mexico and the semi-arid areas in Mexico and Northeast Brazil are already under water stress and are sensitive to inter-annual climate variability. For example, parts of northeast Brazil are situated within the so-called
“drought polygon,” an area characterized by a semi-arid climate that suffers from recurrent droughts (Krol and Bronstert 2007). Parts of this region in Brazil have been identified as having socio-climatic hotspots, given the naturally limited water availability, a relatively low human development index, a high population density (Torres and Lapola et al. 2012), and existing conflicts over water (Araújo and Knight 2005; Krol et al. 2006). Especially in a 4°C world, dry regions in Mexico and Brazil face strong increases in highly unusual heat extremes and aridity leading to more intense and longer drought events (Table 1.15). Northeast Brazil is particularly impacted by ENSO-related droughts; these may become more frequent in a 4°C world. In dryland Brazil, urban migration to rapidly growing coastal cities in the northeastern states is highly likely to be the result of the loss of agricultural income (Mendelsohn 2007).
In these dry regions, increasing drought events may lead to problems for urban water supply or widespread cattle deaths. In addition, small-hold family farmers in rural areas may experience lower productivity or even lose entire harvests, threatening their livelihoods. A decline in agricultural productivity may cause local-ized famines, especially among remote indigenous communities (particularly in Northern Mexico), and possibly result in long-term impacts on the household nutritional status.
Increases in irrigated agriculture, if not well integrated with long-term water resource planning and management, pose another risk as they will exacerbate issues of water availability and also concentrate wealth. A diminished drinking water supply in rural communities may also lead to an increasing reliance on water trucks that occasionally deliver contaminated water (resulting in illness and death). Moreover, the need to search for drinking water and the associated health problems associated with low-quality drinking water could decrease the work force and income in rural areas, leading to increased crime, social exclusion, and other problems related to rural-urban migration during drought events. Increasing water stress may also lead to further over-exploitation of aquifers in the Northern part of Mexico. This in turn would lead to the release of groundwater minerals, affecting groundwater quality, and, in coastal aquifers, lead to sea water intrusion. In general, hydropower and energy systems will be stressed across these dry regions. Direct damages from droughts and secondary impacts on the agriculture sector and related labor markets may result in negative GDP growth rates in the agriculture sector.
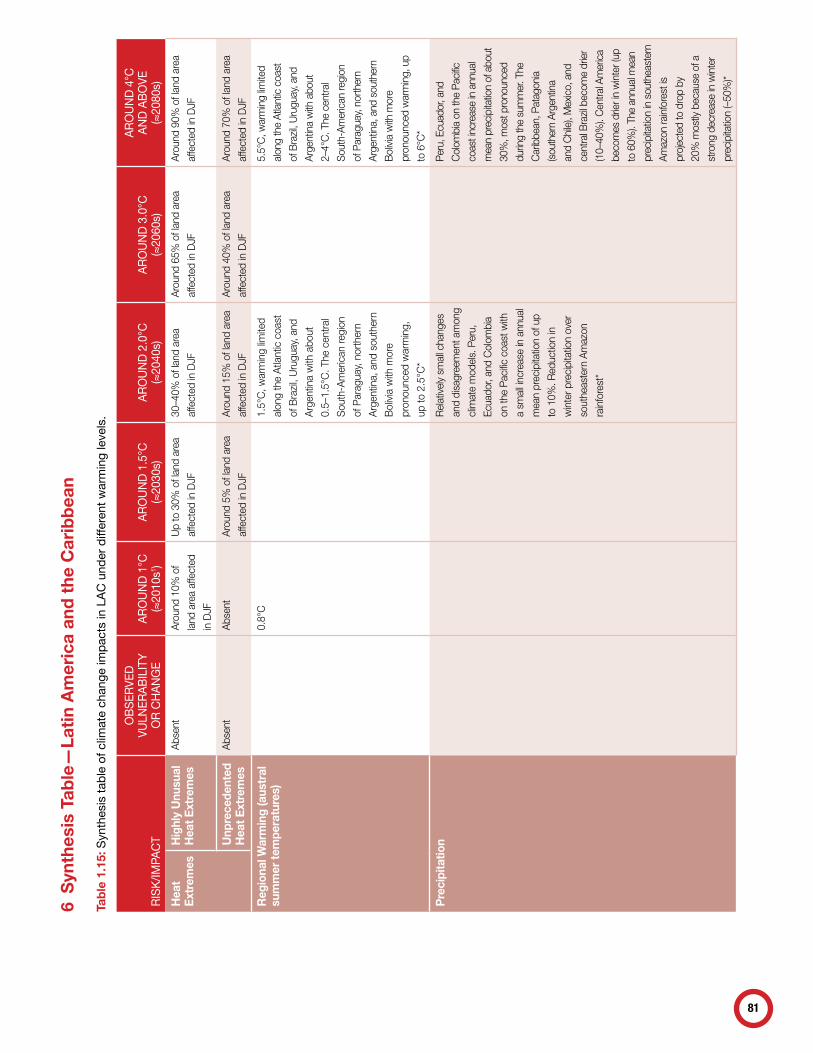
81
6 S
ynth
esis
Tab
le—
Lati
n A
mer
ica
and
the
Car
ibb
ean
Tab
le 1
.15:
Syn
thes
is ta
ble
of c
limat
e ch
ange
impa
cts
in L
AC u
nder
diff
eren
t war
min
g le
vels
.
RISK
/IMPA
CT
OBSE
RVED
VU
LNER
ABIL
ITY
OR
CHA
NGE
AROU
ND 1
°C(≈2010
s1 )AR
OUND
1.5
°C(≈2030
s)AR
OUND
2.0
°C(≈2040
s)AR
OUND
3.0
°C(≈2060
s)
AROU
ND 4
°C
AND
ABOV
E(≈2080
s)H
eat
Ext
rem
esH
ighl
y U
nusu
al
Hea
t Ext
rem
esAb
sent
Arou
nd 1
0% o
f
land
are
a af
fect
ed
in d
JF
up
to 3
0% o
f lan
d ar
ea
affe
cted
in d
JF
30–4
0% o
f lan
d ar
ea
affe
cted
in d
JF
Arou
nd 6
5% o
f lan
d ar
ea
affe
cted
in d
JF
Arou
nd 9
0% o
f lan
d ar
ea
affe
cted
in d
JF
Unp
rece
dent
ed
Hea
t Ext
rem
esAb
sent
Abse
ntAr
ound
5%
of l
and
area
affe
cted
in d
JF
Arou
nd 1
5% o
f lan
d ar
ea
affe
cted
in d
JF
Arou
nd 4
0% o
f lan
d ar
ea
affe
cted
in d
JF
Arou
nd 7
0% o
f lan
d ar
ea
affe
cted
in d
JF
Reg
iona
l War
min
g (a
ustr
al
sum
mer
tem
pera
ture
s)0.
8°C
1.5°
C, w
arm
ing
limite
d
alon
g th
e A
tlant
ic c
oast
of b
razi
l, u
rugu
ay, a
nd
Arg
entin
a w
ith a
bout
0.5–
1.5°
C. t
he c
entra
l
sou
th-A
mer
ican
regi
on
of p
arag
uay,
nor
ther
n
Arg
entin
a, a
nd s
outh
ern
bol
ivia
with
mor
e
pron
ounc
ed w
arm
ing,
up to
2.5
°C*
5.5°
C, w
arm
ing
limite
d
alon
g th
e At
lant
ic c
oast
of b
razil
, uru
guay
, and
Arge
ntin
a w
ith a
bout
2–4°
C. t
he c
entra
l
sout
h-Am
eric
an re
gion
of p
arag
uay,
north
ern
Arge
ntin
a, a
nd s
outh
ern
bol
ivia
with
mor
e
pron
ounc
ed w
arm
ing,
up
to 6
°C*
Pre
cipi
tatio
nr
elat
ivel
y sm
all c
hang
es
and
disa
gree
men
t am
ong
clim
ate
mod
els.
per
u,
ecua
dor,
and
Col
ombi
a
on th
e pa
cific
coa
st w
ith
a sm
all in
crea
se in
ann
ual
mea
n pr
ecip
itatio
n of
up
to 1
0%. r
educ
tion
in
win
ter p
reci
pita
tion
over
sout
heas
tern
Am
azon
rain
fore
st*
peru
, ecu
ador
, and
Col
ombi
a on
the
paci
fic
coas
t inc
reas
e in
ann
ual
mea
n pr
ecip
itatio
n of
abo
ut
30%
, mos
t pro
noun
ced
durin
g th
e su
mm
er. t
he
Car
ibbe
an, p
atag
onia
(sou
ther
n Ar
gent
ina
and
Chi
le),
mex
ico,
and
cent
ral b
razil
bec
ome
drie
r
(10–
40%
). C
entra
l Am
eric
a
beco
mes
drie
r in
win
ter (
up
to 6
0%).
the
annu
al m
ean
prec
ipita
tion
in s
outh
east
ern
Amaz
on ra
info
rest
is
proj
ecte
d to
dro
p by
20%
mos
tly b
ecau
se o
f a
stro
ng d
ecre
ase
in w
inte
r
prec
ipita
tion
(–50
%)*
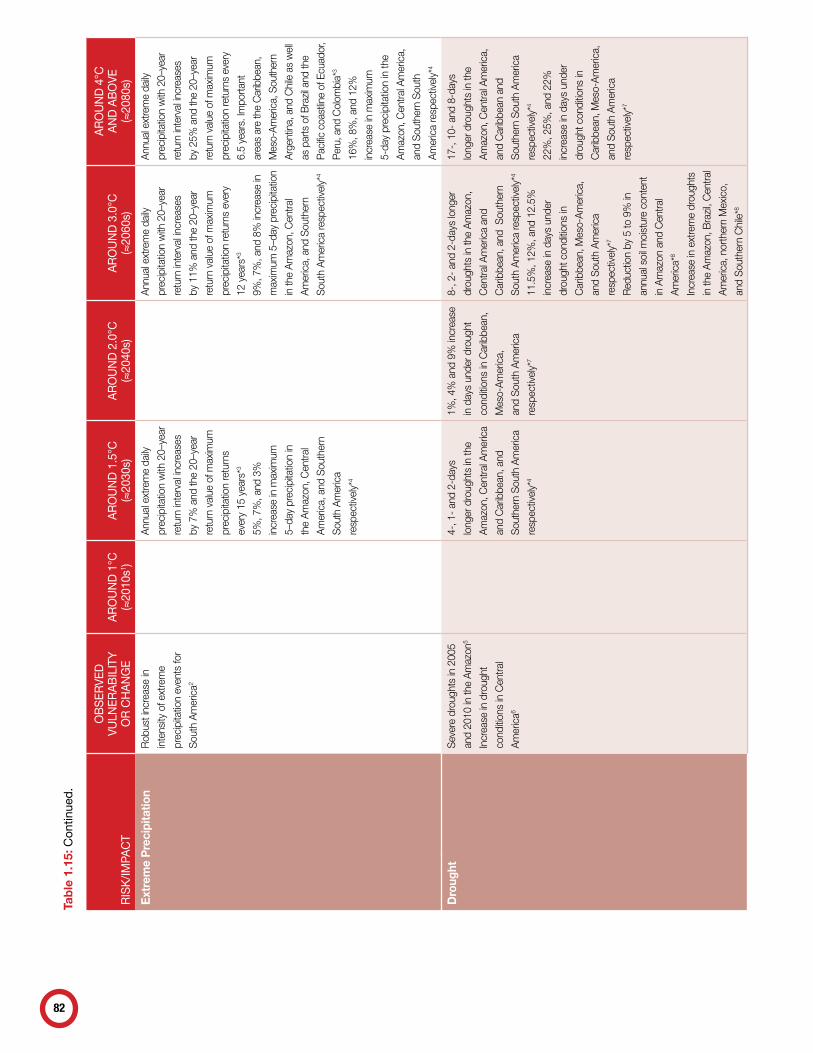
82
RISK
/IMPA
CT
OBSE
RVED
VU
LNER
ABIL
ITY
OR
CHA
NGE
AROU
ND 1
°C(≈2010
s1 )AR
OUND
1.5
°C(≈2030
s)AR
OUND
2.0
°C(≈2040
s)AR
OUND
3.0
°C(≈2060
s)
AROU
ND 4
°C
AND
ABOV
E(≈2080
s)E
xtre
me
Pre
cipi
tatio
nr
obus
t inc
reas
e in
inte
nsity
of e
xtre
me
prec
ipita
tion
even
ts fo
r
sout
h Am
eric
a2
Annu
al e
xtre
me
daily
prec
ipita
tion
with
20–
year
retu
rn in
terv
al in
crea
ses
by 7
% a
nd th
e 20
–yea
r
retu
rn v
alue
of m
axim
um
prec
ipita
tion
retu
rns
ever
y 15
yea
rs*3
5%, 7
%, a
nd 3
%
incr
ease
in m
axim
um
5–da
y pr
ecip
itatio
n in
the
Amaz
on, C
entra
l
Amer
ica,
and
sou
ther
n
sout
h Am
eric
a
resp
ectiv
ely*
4
Annu
al e
xtre
me
daily
prec
ipita
tion
with
20–
year
retu
rn in
terv
al in
crea
ses
by 1
1% a
nd th
e 20
–yea
r
retu
rn v
alue
of m
axim
um
prec
ipita
tion
retu
rns
ever
y
12 y
ears
*3
9%, 7
%, a
nd 8
% in
crea
se in
max
imum
5–d
ay p
reci
pita
tion
in th
e Am
azon
, Cen
tral
Amer
ica,
and
sou
ther
n
sout
h Am
eric
a re
spec
tivel
y*4
Annu
al e
xtre
me
daily
prec
ipita
tion
with
20–
year
retu
rn in
terv
al in
crea
ses
by 2
5% a
nd th
e 20
–yea
r
retu
rn v
alue
of m
axim
um
prec
ipita
tion
retu
rns
ever
y
6.5
year
s. im
porta
nt
area
s ar
e th
e C
arib
bean
,
mes
o-Am
eric
a, s
outh
ern
Arge
ntin
a, a
nd C
hile
as
wel
l
as p
arts
of b
razil
and
the
paci
fic c
oast
line
of e
cuad
or,
peru
, and
Col
ombi
a*3
16%
, 8%
, and
12%
incr
ease
in m
axim
um
5-da
y pr
ecip
itatio
n in
the
Amaz
on, C
entra
l Am
eric
a,
and
sout
hern
sou
th
Amer
ica
resp
ectiv
ely*
4
Dro
ught
seve
re d
roug
hts
in 2
005
and
2010
in th
e Am
azon
5
incr
ease
in d
roug
ht
cond
ition
s in
Cen
tral
Amer
ica6
4-, 1
- an
d 2-
days
long
er d
roug
hts
in th
e
Amaz
on, C
entra
l Am
eric
a
and
Car
ibbe
an, a
nd
sout
hern
sou
th A
mer
ica
resp
ectiv
ely*
4
1%, 4
% a
nd 9
% in
crea
se
in d
ays
unde
r dro
ught
cond
ition
s in
Car
ibbe
an,
mes
o-Am
eric
a,
and
sout
h Am
eric
a
resp
ectiv
ely*
7
8-, 2
- an
d 2-
days
long
er
drou
ghts
in th
e Am
azon
,
Cen
tral A
mer
ica
and
Car
ibbe
an, a
nd s
outh
ern
sout
h Am
eric
a re
spec
tivel
y*4
11.5
%, 1
2%, a
nd 1
2.5%
incr
ease
in d
ays
unde
r
drou
ght c
ondi
tions
in
Car
ibbe
an, m
eso-
Amer
ica,
and
sout
h Am
eric
a
resp
ectiv
ely*
7
red
uctio
n by
5 to
9%
in
annu
al s
oil m
oist
ure
cont
ent
in A
maz
on a
nd C
entra
l
Amer
ica*
8
incr
ease
in e
xtre
me
drou
ghts
in th
e Am
azon
, bra
zil,
Cen
tral
Amer
ica,
nor
ther
n m
exic
o,
and
sout
hern
Chi
le*8
17-,
10-
and
8-d
ays
long
er d
roug
hts
in th
e
Amaz
on, C
entra
l Am
eric
a,
and
Car
ibbe
an a
nd
sout
hern
sou
th A
mer
ica
resp
ectiv
ely*
4
22%
, 25%
, and
22%
incr
ease
in d
ays
unde
r
drou
ght c
ondi
tions
in
Car
ibbe
an, m
eso-
Amer
ica,
and
sout
h Am
eric
a
resp
ectiv
ely*
7
Tab
le 1
.15:
Con
tinue
d.

83
RISK
/IMPA
CT
OBSE
RVED
VU
LNER
ABIL
ITY
OR
CHA
NGE
AROU
ND 1
°C(≈2010
s1 )AR
OUND
1.5
°C(≈2030
s)AR
OUND
2.0
°C(≈2040
s)AR
OUND
3.0
°C(≈2060
s)
AROU
ND 4
°C
AND
ABOV
E(≈2080
s)A
ridity
33%
of l
and
area
hyp
er-
arid
, arid
, or s
emi-a
rid
36%
of l
and
area
hyp
er-
arid
, arid
, or s
emi-a
rid
(incr
ease
of a
bout
10%
)*
41%
of l
and
area
hyp
er-
arid
, arid
, or s
emi-a
rid
(incr
ease
of a
bout
25%
)*
Sea
-lev
el R
ise
Abo
ve
Pre
sent
(198
5–20
05)
med
ian
estim
ate
acro
ss
the
regi
on 0
.27–
0.39
m,
with
hig
hest
sea
-leve
l
rise
on th
e At
lant
ic C
oast
and
low
est o
n th
e tip
of
the
Amer
ican
con
tinen
t.
max
imum
0.6
5 m
sea
-
leve
l ris
e in
rec
ife*
med
ian
estim
ate
acro
ss th
e
regi
on 0
.46–
0.66
m, w
ith
high
est s
ea-le
vel r
ise
on th
e
Atla
ntic
Coa
st a
nd lo
wes
t
on th
e tip
of t
he A
mer
ican
cont
inen
t. m
axim
um
1.14
m s
ea-le
vel-r
ise
and
1.4
m in
rio
de
Jane
iro a
nd
bar
ranq
uilla
on
the
Atla
ntic
Coa
st b
y 21
00*
El N
iño
Sou
ther
n O
scill
atio
n (E
NS
O)
enso
has
nev
er b
een
as
varia
ble
as d
urin
g th
e la
st
few
dec
ades
9
dou
blin
g of
freq
uenc
y of
extre
me
el n
iño
even
ts*10
Trop
ical
Cyc
lone
str
opic
al c
yclo
ne
frequ
ency
incr
ease
in th
e
nor
th A
tlant
ic11
pow
er d
issi
patio
n
inde
x in
crea
sing
by
100–
150%
*12
incr
ease
of 4
0% in
the
frequ
ency
of t
he
stro
nges
t Atla
ntic
tro
pica
l
Cyc
lone
s*13
pow
er d
issi
patio
n in
dex
incr
easi
ng b
y 12
5–27
5%*12
incr
ease
of 8
0% in
the
frequ
ency
of t
he s
trong
est
cate
gory
4 a
nd 5
Atla
ntic
trop
ical
Cyc
lone
s*14
Gla
cier
sS
outh
ern
And
esu
p to
22%
loss
of g
laci
al
volu
me15
,16
red
uctio
n in
gla
cier
leng
th b
y 3.
6–36
%
(nor
ther
n pa
tago
nian
ice
Fiel
d), 0
.4–2
7% (s
outh
ern
pata
goni
an ic
e Fi
eld)
,
and
2.5–
38%
(Cor
dille
ra
dar
win
ice
Fiel
d)17
31.7
% lo
ss o
f gla
cial
area
15
23–2
6.6
Gt/y
r gla
cial
mas
s lo
ss ra
te o
ver
pata
goni
an ic
e Fi
elds
18
1.88
Gt/y
r ann
ual
calv
ing
loss
in n
orth
ern
pata
goni
an ic
e Fi
eld19
21–5
2% lo
ss o
f gla
cial
volu
me*
15
27–5
9% lo
ss o
f gla
cial
volu
me*
15, 1
6, 2
0
44–7
2% lo
ss o
f gla
cier
volu
me*
15, 2
0
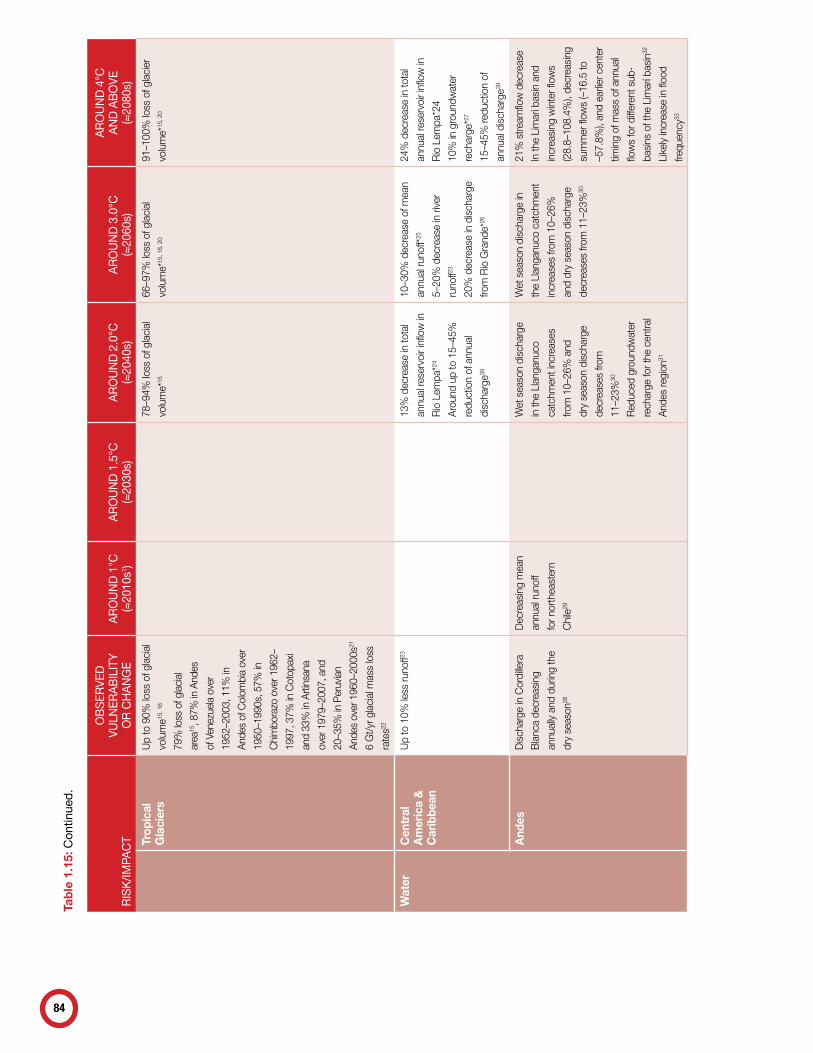
84
RISK
/IMPA
CT
OBSE
RVED
VU
LNER
ABIL
ITY
OR
CHA
NGE
AROU
ND 1
°C(≈2010
s1 )AR
OUND
1.5
°C(≈2030
s)AR
OUND
2.0
°C(≈2040
s)AR
OUND
3.0
°C(≈2060
s)
AROU
ND 4
°C
AND
ABOV
E(≈2080
s)Tr
opic
al
Gla
cier
su
p to
90%
loss
of g
laci
al
volu
me15
, 16
79%
loss
of g
laci
al
area
15, 8
7% in
And
es
of v
enez
uela
ove
r
1952
–200
3, 1
1% in
Ande
s of
Col
ombi
a ov
er
1950
–199
0s, 5
7% in
Chi
mbo
razo
ove
r 196
2–
1997
, 37%
in C
otop
axi
and
33%
in A
rtins
ana
over
197
9–20
07, a
nd
20–3
5% in
per
uvia
n
Ande
s ov
er 1
960–
2000
s21
6 G
t/yr g
laci
al m
ass
loss
rate
s22
78–9
4% lo
ss o
f gla
cial
volu
me*
15
66–9
7% lo
ss o
f gla
cial
volu
me*
15, 1
6, 2
0
91–1
00%
loss
of g
laci
er
volu
me*
15, 2
0
Wat
erC
entr
al
Am
eric
a &
C
arib
bean
up
to 1
0% le
ss ru
noff23
13%
dec
reas
e in
tota
l
annu
al re
serv
oir i
nflo
w in
rio
lem
pa*24
Arou
nd u
p to
15–
45%
redu
ctio
n of
ann
ual
disc
harg
e39
10–3
0% d
ecre
ase
of m
ean
annu
al ru
noff*
25
5–20
% d
ecre
ase
in ri
ver
runo
ff23
20%
dec
reas
e in
dis
char
ge
from
rio
Gra
nde*
26
24%
dec
reas
e in
tota
l
annu
al re
serv
oir i
nflo
w in
rio
lem
pa*2
4
10%
in g
roun
dwat
er
rech
arge
*27
15–4
5% re
duct
ion
of
annu
al d
isch
arge
39
And
esd
isch
arge
in C
ordi
llera
bla
nca
decr
easi
ng
annu
ally
and
dur
ing
the
dry
seas
on28
dec
reas
ing
mea
n
annu
al ru
noff
for n
orth
east
ern
Chi
le29
wet
sea
son
disc
harg
e
in th
e ll
anga
nuco
catc
hmen
t inc
reas
es
from
10–
26%
and
dry
seas
on d
isch
arge
decr
ease
s fro
m
11–2
3%30
red
uced
gro
undw
ater
rech
arge
for t
he c
entra
l
Ande
s re
gion
31
wet
sea
son
disc
harg
e in
the
llan
ganu
co c
atch
men
t
incr
ease
s fro
m 1
0–26
%
and
dry
seas
on d
isch
arge
decr
ease
s fro
m 1
1–23
%30
21%
stre
amflo
w d
ecre
ase
in th
e li
mar
í bas
in a
nd
incr
easi
ng w
inte
r flo
ws
(28.
8–10
8.4%
), de
crea
sing
sum
mer
flow
s (–
16.5
to
–57.
8%),
and
earli
er c
ente
r
timin
g of
mas
s of
ann
ual
flow
s fo
r diff
eren
t sub
-
basi
ns o
f the
lim
arí b
asin
32
like
ly in
crea
se in
floo
d
frequ
ency
33
Tab
le 1
.15:
Con
tinue
d.
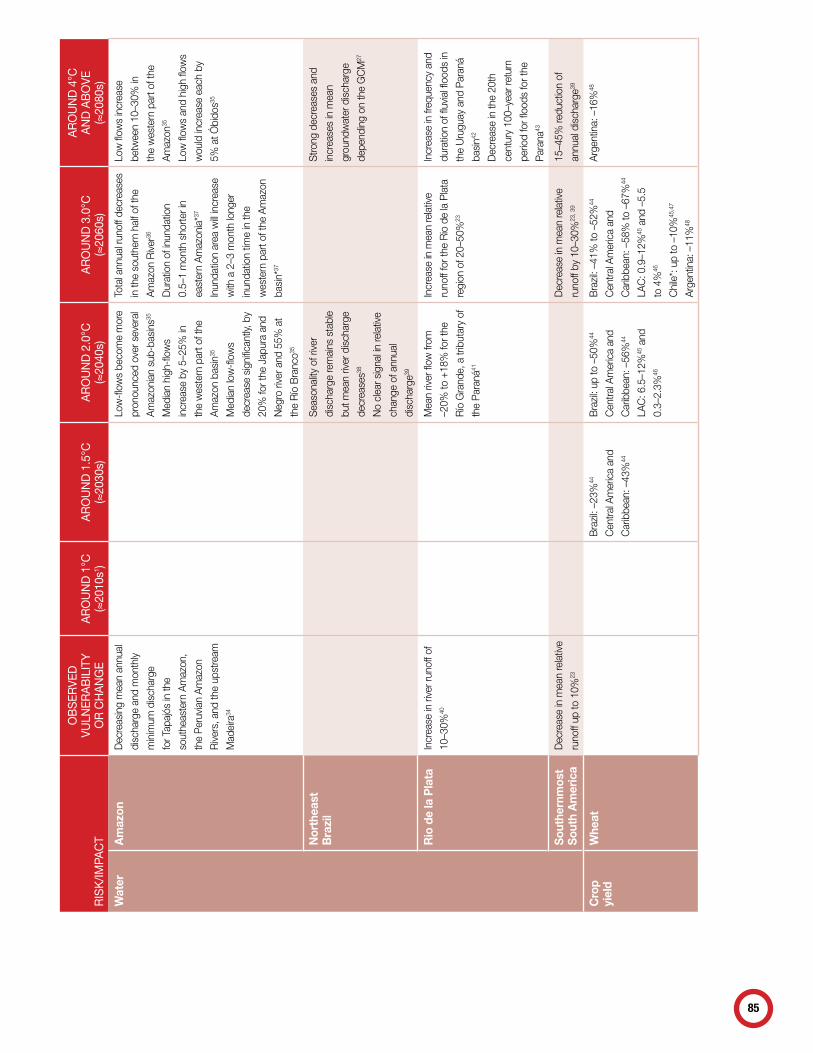
85
RISK
/IMPA
CT
OBSE
RVED
VU
LNER
ABIL
ITY
OR
CHA
NGE
AROU
ND 1
°C(≈2010
s1 )AR
OUND
1.5
°C(≈2030
s)AR
OUND
2.0
°C(≈2040
s)AR
OUND
3.0
°C(≈2060
s)
AROU
ND 4
°C
AND
ABOV
E(≈2080
s)W
ater
Am
azon
dec
reas
ing
mea
n an
nual
disc
harg
e an
d m
onth
ly
min
imum
dis
char
ge
for t
apaj
ós in
the
sout
heas
tern
Am
azon
,
the
peru
vian
Am
azon
riv
ers,
and
the
upst
ream
mad
eira
34
low
-flow
s be
com
e m
ore
pron
ounc
ed o
ver s
ever
al
Amaz
onia
n su
b-ba
sins
35
med
ian
high
-flow
s
incr
ease
by
5–25
% in
the
wes
tern
par
t of t
he
Amaz
on b
asin
35
med
ian
low
-flow
s
decr
ease
sig
nific
antly
, by
20%
for t
he J
apur
a an
d
neg
ro ri
ver a
nd 5
5% a
t
the
río
bra
nco35
tota
l ann
ual r
unof
f dec
reas
es
in th
e so
uthe
rn h
alf o
f the
Amaz
on r
iver
36
dur
atio
n of
inun
datio
n
0.5–
1 m
onth
sho
rter i
n
east
ern
Amaz
onia
*37
inun
datio
n ar
ea w
ill in
crea
se
with
a 2
–3 m
onth
long
er
inun
datio
n tim
e in
the
wes
tern
par
t of t
he A
maz
on
basi
n*37
low
flow
s in
crea
se
betw
een
10–3
0% in
the
wes
tern
par
t of t
he
Amaz
on35
low
flow
s an
d hi
gh fl
ows
wou
ld in
crea
se e
ach
by
5% a
t Óbi
dos35
Nor
thea
st
Bra
zil
seas
onal
ity o
f riv
er
disc
harg
e re
mai
ns s
tabl
e
but m
ean
river
dis
char
ge
decr
ease
s38
no
clea
r sig
nal in
rela
tive
chan
ge o
f ann
ual
disc
harg
e39
stro
ng d
ecre
ases
and
incr
ease
s in
mea
n
grou
ndw
ater
dis
char
ge
depe
ndin
g on
the
GC
m27
Rio
de
la P
lata
incr
ease
in ri
ver r
unof
f of
10–3
0%40
mea
n riv
er fl
ow fr
om
–20%
to +
18%
for t
he
río
Gra
nde,
a tr
ibut
ary
of
the
para
ná41
incr
ease
in m
ean
rela
tive
runo
ff fo
r the
rio
de
la p
lata
regi
on o
f 20–
50%
23
incr
ease
in fr
eque
ncy
and
dura
tion
of fl
uvia
l flo
ods
in
the
uru
guay
and
par
aná
basi
n42
dec
reas
e in
the
20th
cent
ury
100–
year
retu
rn
perio
d fo
r flo
ods
for t
he
para
na43
Sou
ther
nmos
t S
outh
Am
eric
ad
ecre
ase
in m
ean
rela
tive
runo
ff up
to 1
0%23
dec
reas
e in
mea
n re
lativ
e
runo
ff by
10–
30%
23, 3
9
15–4
5% re
duct
ion
of
annu
al d
isch
arge
39
Cro
p yi
eld
Whe
atb
razi
l: –2
3%44
Cen
tral A
mer
ica
and
Car
ibbe
an: –
43%
44
bra
zil:
up to
–50
%44
Cen
tral A
mer
ica
and
Car
ibbe
an: –
56%
44
lAC
: 6.5
–12%
45 a
nd
0.3–
2.3%
46
bra
zil:
–41%
to –
52%
44
Cen
tral A
mer
ica
and
Car
ibbe
an: –
58%
to –
67%
44
lAC
: 0.9
–12%
45 a
nd –
5.5
to 4
%46
Chi
le*:
up to
–10
%45
,47
Arge
ntin
a: –
11%
48
Arge
ntin
a: –
16%
48
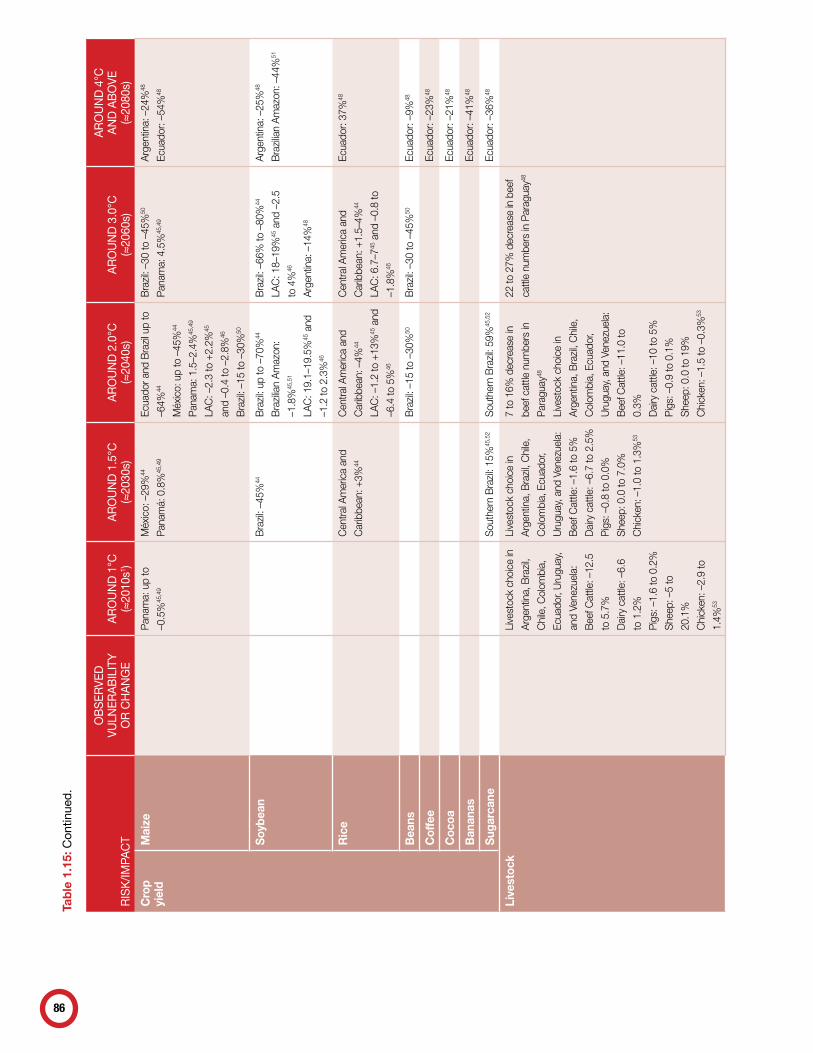
86
RISK
/IMPA
CT
OBSE
RVED
VU
LNER
ABIL
ITY
OR
CHA
NGE
AROU
ND 1
°C(≈2010
s1 )AR
OUND
1.5
°C(≈2030
s)AR
OUND
2.0
°C(≈2040
s)AR
OUND
3.0
°C(≈2060
s)
AROU
ND 4
°C
AND
ABOV
E(≈2080
s)C
rop
yiel
dM
aize
pana
ma:
up
to
–0.5
%45
,49
méx
ico:
–29
%44
pana
má:
0.8
%45
,49
ecua
dor a
nd b
razi
l up
to
–64%
44
méx
ico:
up
to –
45%
44
pana
ma:
1.5
–2.4
%45
,49
lAC
: –2.
3 to
+2.
2%45
and
–0.4
to –
2.8%
46
bra
zil:
–15
to –
30%
50
bra
zil:
–30
to –
45%
50
pana
ma:
4.5
%45
,49
Arge
ntin
a: –
24%
48
ecua
dor:
–54%
48
Soy
bean
bra
zil:
–45%
44b
razi
l: up
to –
70%
44
bra
zilia
n Am
azon
:
–1.8
%45
,51
lAC
: 19.
1–19
.5%
45 a
nd
–1.2
to 2
.3%
46
bra
zil:
–66%
to –
80%
44
lAC
: 18–
19%
45 a
nd –
2.5
to 4
%46
Arge
ntin
a: –
14%
48
Arge
ntin
a: –
25%
48
bra
zilia
n Am
azon
: –44
%51
Ric
eC
entra
l Am
eric
a an
d
Car
ibbe
an: +
3%44
Cen
tral A
mer
ica
and
Car
ibbe
an: –
4%44
lAC
: –1.
2 to
+13
%45
and
–6.4
to 5
%46
Cen
tral A
mer
ica
and
Car
ibbe
an: +
1.5–
4%44
lAC
: 6.7
–745
and
–0.
8 to
–1.8
%46
ecua
dor:
37%
48
Bea
nsb
razi
l: –1
5 to
–30
%50
b
razi
l: –3
0 to
–45
%50
ec
uado
r: –9
%48
Cof
fee
ecua
dor:
–23%
48
Coc
oaec
uado
r: –2
1%48
Ban
anas
ecua
dor:
–41%
48
Sug
arca
neso
uthe
rn b
razi
l: 15
%45
,52
sout
hern
bra
zil:
59%
45,5
2ec
uado
r: –3
6%48
Live
stoc
kli
vest
ock
choi
ce in
Arge
ntin
a, b
razi
l,
Chi
le, C
olom
bia,
ecua
dor,
uru
guay
,
and
vene
zuel
a:
bee
f Cat
tle: –
12.5
to 5
.7%
dai
ry c
attle
: –6.
6
to 1
.2%
pigs
: –1.
6 to
0.2
%
shee
p: –
5 to
20.1
%
Chi
cken
: –2.
9 to
1.4%
53
live
stoc
k ch
oice
in
Arge
ntin
a, b
razi
l, C
hile
,
Col
ombi
a, e
cuad
or,
uru
guay
, and
ven
ezue
la:
bee
f Cat
tle: –
1.6
to 5
%
dai
ry c
attle
: –6.
7 to
2.5
%
pigs
: –0.
8 to
0.0
%
shee
p: 0
.0 to
7.0
%
Chi
cken
: –1.
0 to
1.3
%53
7 to
16%
dec
reas
e in
beef
cat
tle n
umbe
rs in
para
guay
48
live
stoc
k ch
oice
in
Arge
ntin
a, b
razi
l, C
hile
,
Col
ombi
a, e
cuad
or,
uru
guay
, and
ven
ezue
la:
bee
f Cat
tle: –
11.0
to
0.3%
dai
ry c
attle
: –10
to 5
%
pigs
: –0.
9 to
0.1
%
shee
p: 0
.0 to
19%
Chi
cken
: –1.
5 to
–0.
3%53
22 to
27%
dec
reas
e in
bee
f
cattl
e nu
mbe
rs in
par
agua
y48
Tab
le 1
.15:
Con
tinue
d.
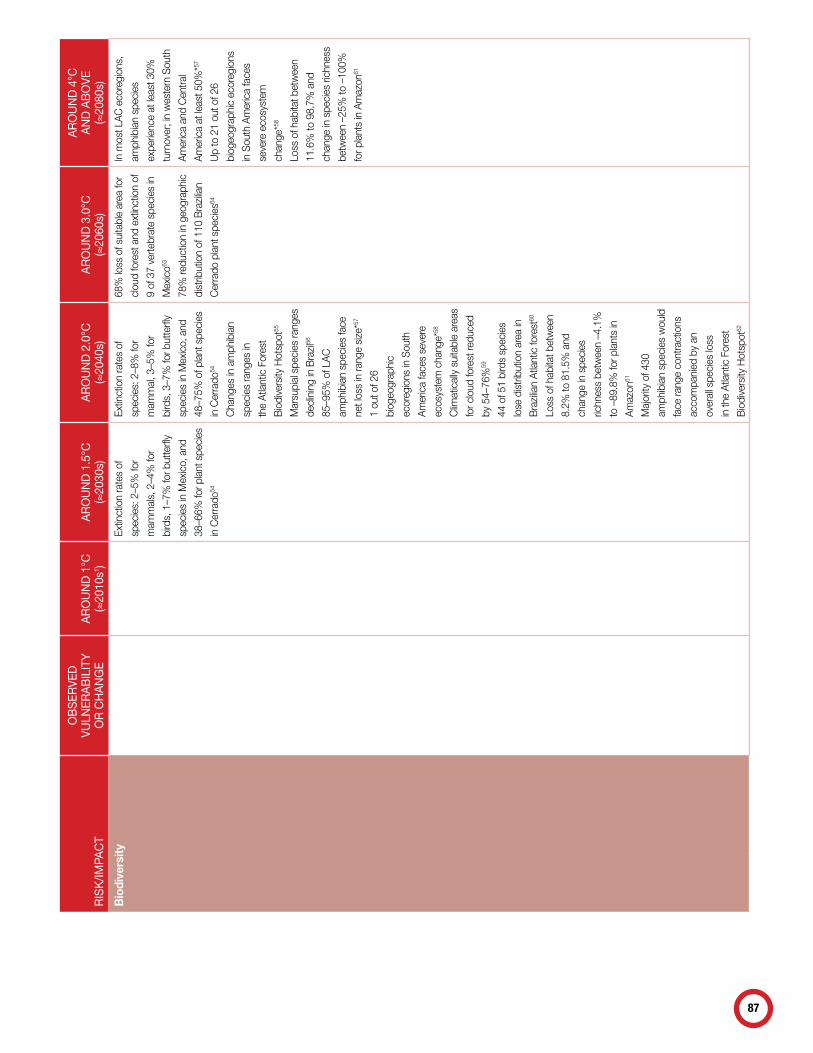
87
RISK
/IMPA
CT
OBSE
RVED
VU
LNER
ABIL
ITY
OR
CHA
NGE
AROU
ND 1
°C(≈2010
s1 )AR
OUND
1.5
°C(≈2030
s)AR
OUND
2.0
°C(≈2040
s)AR
OUND
3.0
°C(≈2060
s)
AROU
ND 4
°C
AND
ABOV
E(≈2080
s)B
iodi
vers
ityex
tinct
ion
rate
s of
spec
ies:
2–5
% fo
r
mam
mal
s, 2
–4%
for
bird
s, 1
–7%
for b
utte
rfly
spec
ies
in m
exic
o, a
nd
38–6
6% fo
r pla
nt s
peci
es
in C
erra
do54
extin
ctio
n ra
tes
of
spec
ies:
2–8
% fo
r
mam
mal
, 3–5
% fo
r
bird
s, 3
–7%
for b
utte
rfly
spec
ies
in m
exic
o, a
nd
48–7
5% o
f pla
nt s
peci
es
in C
erra
do54
Cha
nges
in a
mph
ibia
n
spec
ies
rang
es in
the
Atla
ntic
For
est
bio
dive
rsity
hot
spot
55
mar
supi
al s
peci
es ra
nges
decl
inin
g in
bra
zil56
85–9
5% o
f lAC
amph
ibia
n sp
ecie
s fa
ce
net l
oss
in ra
nge
size
*57
1 ou
t of 2
6
biog
eogr
aphi
c
ecor
egio
ns in
sou
th
Amer
ica
face
s se
vere
ecos
yste
m c
hang
e*58
Clim
atic
ally
sui
tabl
e ar
eas
for c
loud
fore
st re
duce
d
by 5
4–76
%59
44 o
f 51
bird
s sp
ecie
s
lose
dis
tribu
tion
area
in
bra
zilia
n At
lant
ic fo
rest
60
loss
of h
abita
t bet
wee
n
8.2%
to 8
1.5%
and
chan
ge in
spe
cies
richn
ess
betw
een
–4.1
%
to –
89.8
% fo
r pla
nts
in
Amaz
on61
maj
ority
of 4
30
amph
ibia
n sp
ecie
s w
ould
face
rang
e co
ntra
ctio
ns
acco
mpa
nied
by
an
over
all s
peci
es lo
ss
in th
e At
lant
ic F
ores
t
bio
dive
rsity
hot
spot
62
68%
loss
of s
uita
ble
area
for
clou
d fo
rest
and
ext
inct
ion
of
9 of
37
verte
brat
e sp
ecie
s in
mex
ico63
78%
redu
ctio
n in
geo
grap
hic
dist
ribut
ion
of 1
10 b
razi
lian
Cer
rado
pla
nt s
peci
es64
in m
ost l
AC e
core
gion
s,
amph
ibia
n sp
ecie
s
expe
rienc
e at
leas
t 30%
turn
over
; in
wes
tern
sou
th
Amer
ica
and
Cen
tral
Amer
ica
at le
ast 5
0%*57
up
to 2
1 ou
t of 2
6
biog
eogr
aphi
c ec
oreg
ions
in s
outh
Am
eric
a fa
ces
seve
re e
cosy
stem
chan
ge*58
loss
of h
abita
t bet
wee
n
11.6
% to
98.
7% a
nd
chan
ge in
spe
cies
rich
ness
betw
een
–25%
to –
100%
for p
lant
s in
Am
azon
61
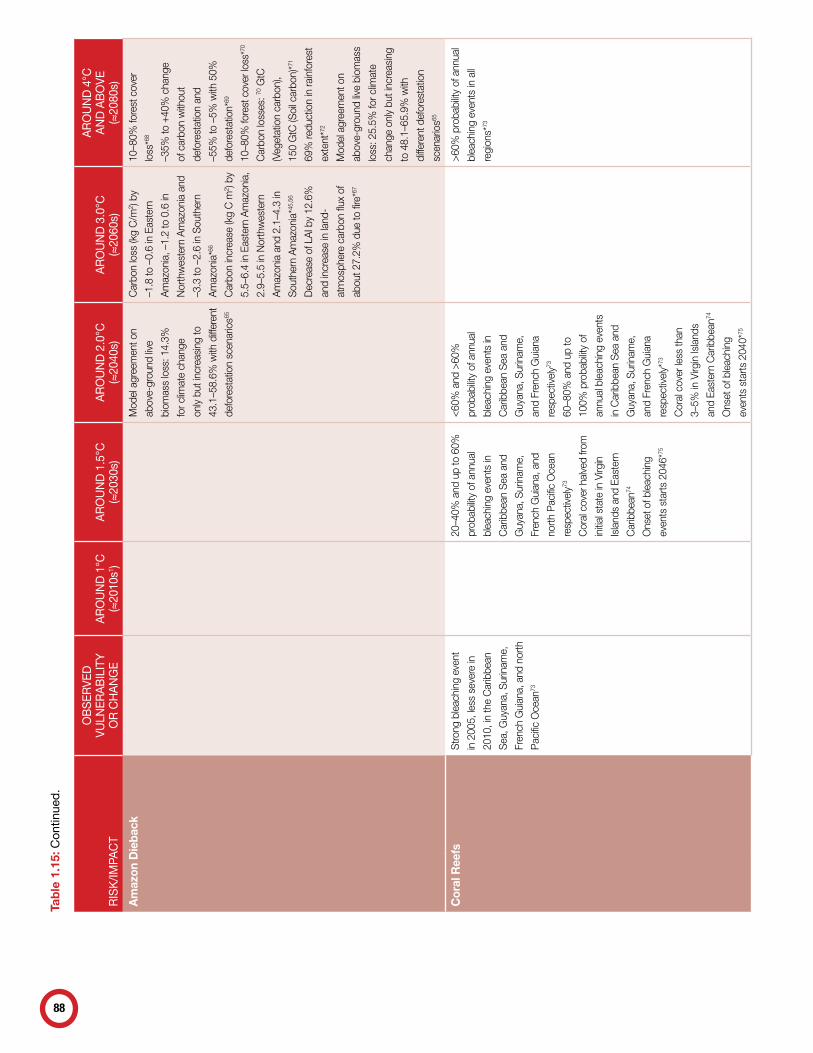
88
RISK
/IMPA
CT
OBSE
RVED
VU
LNER
ABIL
ITY
OR
CHA
NGE
AROU
ND 1
°C(≈2010
s1 )AR
OUND
1.5
°C(≈2030
s)AR
OUND
2.0
°C(≈2040
s)AR
OUND
3.0
°C(≈2060
s)
AROU
ND 4
°C
AND
ABOV
E(≈2080
s)A
maz
on D
ieba
ckm
odel
agr
eem
ent o
n
abov
e-gr
ound
live
biom
ass
loss
: 14.
3%
for c
limat
e ch
ange
only
but
incr
easi
ng to
43.1
–58.
6% w
ith d
iffer
ent
defo
rest
atio
n sc
enar
ios65
Car
bon
loss
(kg
C/m
2 ) by
–1.8
to –
0.6
in e
aste
rn
Amaz
onia
, –1.
2 to
0.6
in
nor
thw
este
rn A
maz
onia
and
–3.3
to –
2.6
in s
outh
ern
Amaz
onia
*66
Car
bon
incr
ease
(kg
C m
2 ) by
5.5–
6.4
in e
aste
rn A
maz
onia
,
2.9–
5.5
in n
orth
wes
tern
Amaz
onia
and
2.1
–4.3
in
sout
hern
Am
azon
ia*45
,56
dec
reas
e of
lAi
by
12.6
%
and
incr
ease
in la
nd-
atm
osph
ere
carb
on fl
ux o
f
abou
t 27.
2% d
ue to
fire
*67
10–8
0% fo
rest
cov
er
loss
*68
–35%
to +
40%
cha
nge
of c
arbo
n w
ithou
t
defo
rest
atio
n an
d
–55%
to –
5% w
ith 5
0%
defo
rest
atio
n*69
10–8
0% fo
rest
cov
er lo
ss*70
Car
bon
loss
es: 70
GtC
(veg
etat
ion
carb
on),
150
GtC
(soi
l car
bon)
*71
69%
redu
ctio
n in
rain
fore
st
exte
nt*72
mod
el a
gree
men
t on
abov
e-gr
ound
live
biom
ass
loss
: 25.
5% fo
r clim
ate
chan
ge o
nly
but i
ncre
asin
g
to 4
8.1–
65.9
% w
ith
diffe
rent
def
ores
tatio
n
scen
ario
s65
Cor
al R
eefs
stro
ng b
leac
hing
eve
nt
in 2
005,
less
sev
ere
in
2010
, in
the
Car
ibbe
an
sea,
Guy
ana,
sur
inam
e,
Fren
ch G
uian
a, a
nd n
orth
paci
fic o
cean
73
20–4
0% a
nd u
p to
60%
prob
abilit
y of
ann
ual
blea
chin
g ev
ents
in
Car
ibbe
an s
ea a
nd
Guy
ana,
sur
inam
e,
Fren
ch G
uian
a, a
nd
north
pac
ific o
cean
resp
ectiv
ely73
Cor
al c
over
hal
ved
from
initi
al s
tate
in v
irgin
isla
nds
and
east
ern
Car
ibbe
an74
ons
et o
f ble
achi
ng
even
ts s
tarts
204
6*75
<60%
and
>60
%
prob
abilit
y of
ann
ual
blea
chin
g ev
ents
in
Car
ibbe
an s
ea a
nd
Guy
ana,
sur
inam
e,
and
Fren
ch G
uian
a
resp
ectiv
ely73
60–8
0% a
nd u
p to
100%
pro
babi
lity
of
annu
al b
leac
hing
eve
nts
in C
arib
bean
sea
and
Guy
ana,
sur
inam
e,
and
Fren
ch G
uian
a
resp
ectiv
ely*
73
Cor
al c
over
less
than
3–5%
in v
irgin
isla
nds
and
east
ern
Car
ibbe
an74
ons
et o
f ble
achi
ng
even
ts s
tarts
204
0*75
>60%
pro
babi
lity
of a
nnua
l
blea
chin
g ev
ents
in a
ll
regi
ons*
73
Tab
le 1
.15:
Con
tinue
d.
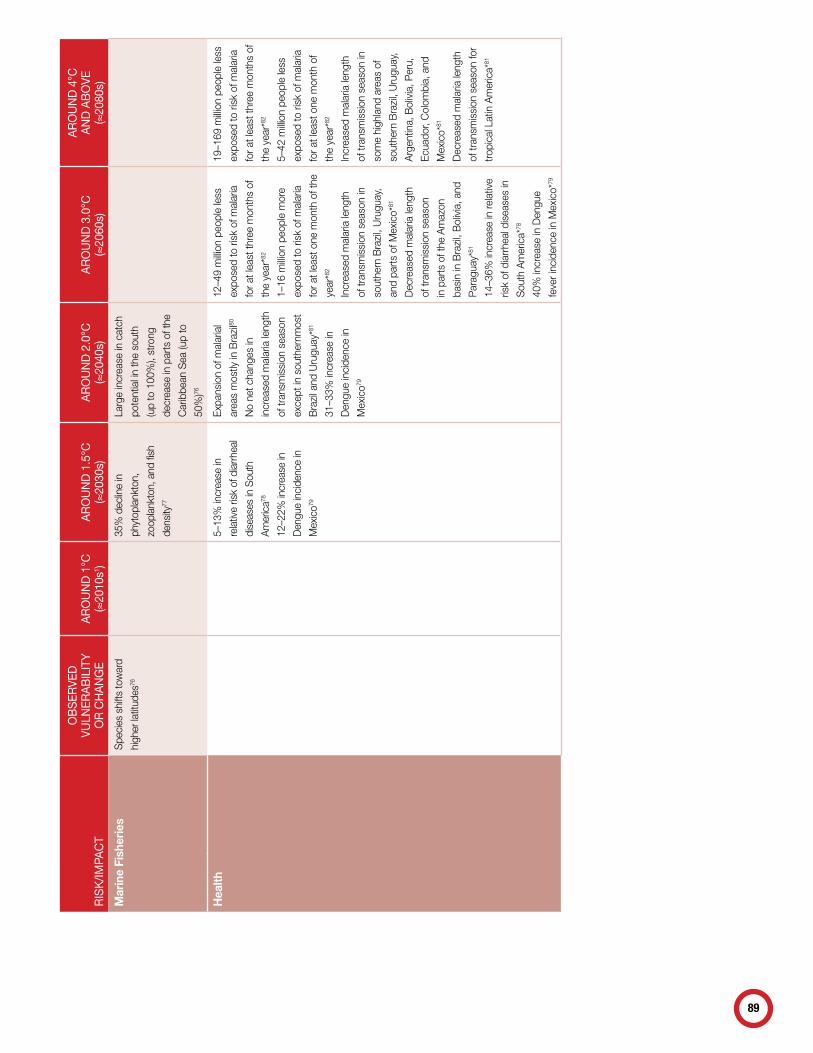
89
RISK
/IMPA
CT
OBSE
RVED
VU
LNER
ABIL
ITY
OR
CHA
NGE
AROU
ND 1
°C(≈2010
s1 )AR
OUND
1.5
°C(≈2030
s)AR
OUND
2.0
°C(≈2040
s)AR
OUND
3.0
°C(≈2060
s)
AROU
ND 4
°C
AND
ABOV
E(≈2080
s)M
arin
e Fi
sher
ies
spec
ies
shift
s to
war
d
high
er la
titud
es76
35%
dec
line
in
phyt
opla
nkto
n,
zoop
lank
ton,
and
fish
dens
ity77
larg
e in
crea
se in
cat
ch
pote
ntia
l in
the
sout
h
(up
to 1
00%
), st
rong
decr
ease
in p
arts
of t
he
Car
ibbe
an s
ea (u
p to
50%
)76
Hea
lth5–
13%
incr
ease
in
rela
tive
risk
of d
iarrh
eal
dise
ases
in s
outh
Amer
ica78
12–2
2% in
crea
se in
den
gue
inci
denc
e in
mex
ico79
expa
nsio
n of
mal
aria
l
area
s m
ostly
in b
razi
l80
no
net c
hang
es in
incr
ease
d m
alar
ia le
ngth
of tr
ansm
issi
on s
easo
n
exce
pt in
sou
ther
nmos
t
bra
zil a
nd u
rugu
ay*81
31–3
3% in
crea
se in
den
gue
inci
denc
e in
mex
ico79
12–4
9 m
illion
peo
ple
less
expo
sed
to ri
sk o
f mal
aria
for a
t lea
st th
ree
mon
ths
of
the
year
*82
1–16
milli
on p
eopl
e m
ore
expo
sed
to ri
sk o
f mal
aria
for a
t lea
st o
ne m
onth
of t
he
year
*82
incr
ease
d m
alar
ia le
ngth
of tr
ansm
issi
on s
easo
n in
sout
hern
bra
zil,
uru
guay
,
and
parts
of m
exic
o*81
dec
reas
ed m
alar
ia le
ngth
of tr
ansm
issi
on s
easo
n
in p
arts
of t
he A
maz
on
basi
n in
bra
zil,
bol
ivia
, and
par
agua
y*81
14–3
6% in
crea
se in
rela
tive
risk
of d
iarr
heal
dis
ease
s in
sou
th A
mer
ica*
78
40%
incr
ease
in d
engu
e
feve
r inc
iden
ce in
mex
ico*
79
19–1
69 m
illion
peo
ple
less
expo
sed
to ri
sk o
f mal
aria
for a
t lea
st th
ree
mon
ths
of
the
year
*82
5–42
milli
on p
eopl
e le
ss
expo
sed
to ri
sk o
f mal
aria
for a
t lea
st o
ne m
onth
of
the
year
*82
incr
ease
d m
alar
ia le
ngth
of tr
ansm
issi
on s
easo
n in
som
e hi
ghla
nd a
reas
of
sout
hern
bra
zil,
uru
guay
,
Arg
entin
a, b
oliv
ia, p
eru,
ecua
dor,
Col
ombi
a, a
nd
mex
ico*
81
dec
reas
ed m
alar
ia le
ngth
of tr
ansm
issi
on s
easo
n fo
r
tropi
cal l
atin
Am
eric
a*81
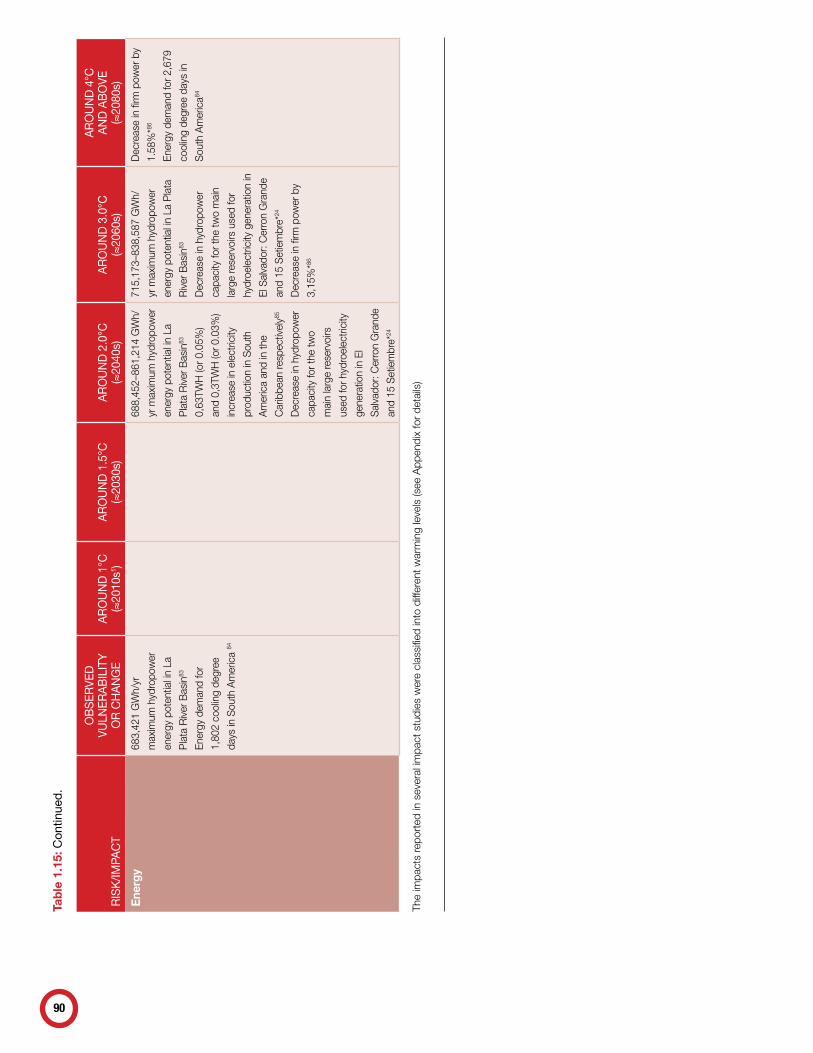
90
RISK
/IMPA
CT
OBSE
RVED
VU
LNER
ABIL
ITY
OR
CHA
NGE
AROU
ND 1
°C(≈2010
s1 )AR
OUND
1.5
°C(≈2030
s)AR
OUND
2.0
°C(≈2040
s)AR
OUND
3.0
°C(≈2060
s)
AROU
ND 4
°C
AND
ABOV
E(≈2080
s)E
nerg
y68
3,42
1 G
wh/
yr
max
imum
hyd
ropo
wer
ener
gy p
oten
tial i
n la
pla
ta r
iver
bas
in83
ener
gy d
eman
d fo
r
1,80
2 co
olin
g de
gree
days
in s
outh
Am
eric
a 84
688,
452–
861,
214
Gw
h/
yr m
axim
um h
ydro
pow
er
ener
gy p
oten
tial i
n la
pla
ta r
iver
bas
in83
0,63
twh
(or 0
.05%
)
and
0,3t
wh
(or 0
.03%
)
incr
ease
in e
lect
ricity
prod
uctio
n in
sou
th
Am
eric
a an
d in
the
Car
ibbe
an re
spec
tivel
y85
dec
reas
e in
hyd
ropo
wer
capa
city
for t
he tw
o
mai
n la
rge
rese
rvoi
rs
used
for h
ydro
elec
trici
ty
gene
ratio
n in
el
sal
vado
r: C
erro
n G
rand
e
and
15 s
etie
mbr
e*24
715,
173–
838,
587
Gw
h/
yr m
axim
um h
ydro
pow
er
ener
gy p
oten
tial i
n la
pla
ta
riv
er b
asin
83
dec
reas
e in
hyd
ropo
wer
capa
city
for t
he tw
o m
ain
larg
e re
serv
oirs
use
d fo
r
hydr
oele
ctric
ity g
ener
atio
n in
el s
alva
dor:
Cer
ron
Gra
nde
and
15 s
etie
mbr
e*24
dec
reas
e in
firm
pow
er b
y
3,15
%*86
dec
reas
e in
firm
pow
er b
y
1.58
%*86
ener
gy d
eman
d fo
r 2,6
79
cool
ing
degr
ee d
ays
in
sou
th A
mer
ica84
the
impa
cts
repo
rted
in s
ever
al im
pact
stu
dies
wer
e cl
assi
fied
into
diff
eren
t war
min
g le
vels
(see
App
endi
x fo
r de
tails
)
Tab
le 1
.15:
Con
tinue
d.
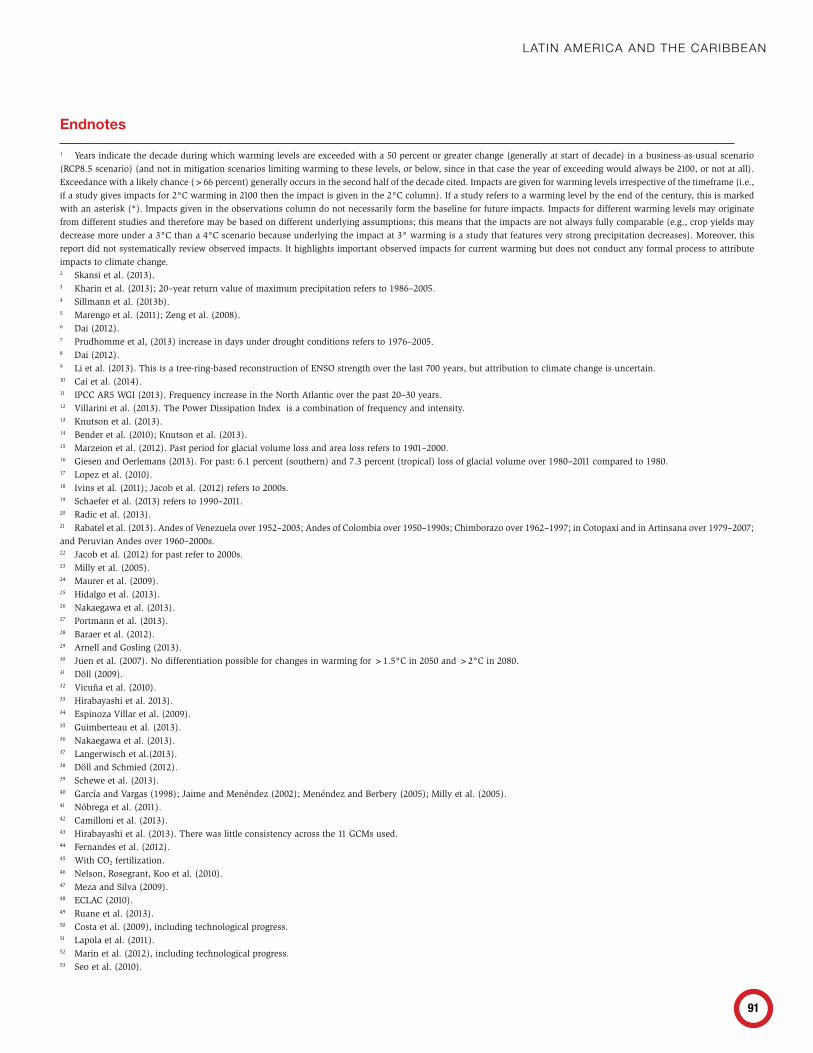
91
lAtin AmeriCA And the CAribbeAn
Endnotes
1 Years indicate the decade during which warming levels are exceeded with a 50 percent or greater change (generally at start of decade) in a business-as-usual scenario (RCP8.5 scenario) (and not in mitigation scenarios limiting warming to these levels, or below, since in that case the year of exceeding would always be 2100, or not at all). Exceedance with a likely chance (>66 percent) generally occurs in the second half of the decade cited. Impacts are given for warming levels irrespective of the timeframe (i.e., if a study gives impacts for 2°C warming in 2100 then the impact is given in the 2°C column). If a study refers to a warming level by the end of the century, this is marked with an asterisk (*). Impacts given in the observations column do not necessarily form the baseline for future impacts. Impacts for different warming levels may originate from different studies and therefore may be based on different underlying assumptions; this means that the impacts are not always fully comparable (e.g., crop yields may decrease more under a 3°C than a 4°C scenario because underlying the impact at 3° warming is a study that features very strong precipitation decreases). Moreover, this report did not systematically review observed impacts. It highlights important observed impacts for current warming but does not conduct any formal process to attribute impacts to climate change.2 Skansi et al. (2013).3 Kharin et al. (2013); 20–year return value of maximum precipitation refers to 1986–2005.4 Sillmann et al. (2013b).5 Marengo et al. (2011); Zeng et al. (2008).6 Dai (2012). 7 Prudhomme et al, (2013) increase in days under drought conditions refers to 1976–2005.8 Dai (2012). 9 Li et al. (2013). This is a tree-ring-based reconstruction of ENSO strength over the last 700 years, but attribution to climate change is uncertain.10 Cai et al. (2014). 11 IPCC AR5 WGI (2013). Frequency increase in the North Atlantic over the past 20–30 years.12 Villarini et al. (2013). The Power Dissipation Index is a combination of frequency and intensity.13 Knutson et al. (2013).14 Bender et al. (2010); Knutson et al. (2013).15 Marzeion et al. (2012). Past period for glacial volume loss and area loss refers to 1901–2000.16 Giesen and Oerlemans (2013). For past: 6.1 percent (southern) and 7.3 percent (tropical) loss of glacial volume over 1980–2011 compared to 1980.17 Lopez et al. (2010).18 Ivins et al. (2011); Jacob et al. (2012) refers to 2000s.19 Schaefer et al. (2013) refers to 1990–2011.20 Radic et al. (2013).21 Rabatel et al. (2013). Andes of Venezuela over 1952–2003; Andes of Colombia over 1950–1990s; Chimborazo over 1962–1997; in Cotopaxi and in Artinsana over 1979–2007; and Peruvian Andes over 1960–2000s.22 Jacob et al. (2012) for past refer to 2000s.23 Milly et al. (2005).24 Maurer et al. (2009).25 Hidalgo et al. (2013).26 Nakaegawa et al. (2013).27 Portmann et al. (2013).28 Baraer et al. (2012).29 Arnell and Gosling (2013). 30 Juen et al. (2007). No differentiation possible for changes in warming for >1.5°C in 2050 and >2°C in 2080.31 Döll (2009).32 Vicuña et al. (2010).33 Hirabayashi et al. 2013).34 Espinoza Villar et al. (2009).35 Guimberteau et al. (2013).36 Nakaegawa et al. (2013).37 Langerwisch et al.(2013).38 Döll and Schmied (2012).39 Schewe et al. (2013).40 García and Vargas (1998); Jaime and Menéndez (2002); Menéndez and Berbery (2005); Milly et al. (2005).41 Nóbrega et al. (2011).42 Camilloni et al. (2013).43 Hirabayashi et al. (2013). There was little consistency across the 11 GCMs used.44 Fernandes et al. (2012).45 With CO2 fertilization.46 Nelson, Rosegrant, Koo et al. (2010).47 Meza and Silva (2009).48 ECLAC (2010).49 Ruane et al. (2013).50 Costa et al. (2009), including technological progress.51 Lapola et al. (2011).52 Marin et al. (2012), including technological progress.53 Seo et al. (2010).
Turn Down The heaT: ConfronTing The new ClimaTe normal
92
54 Thomas et al. (2004). Mammal species (n=96), bird species (n= 186), and butterfly species (n=41) in Mexico all with dispersal; plant species in Cerrado (n=163) without dispersal. The study was criticized by Harte et al. (2004) for overestimating potential extinction rates by using a common species-area exponent z for all species which may not be justified.55 Loyola et al. (2013).56 Loyola et al. (2012).57 Lawler et al. (2009).58 Gerten et al. (2013).59 Rojas-Soto et al. (2012).60 Souza et al. (2011).61 Feeley et al. (2012). Large range stems from different assumption about deforestation, land-use, and adaptation and migration potentials.62 Lemes et al. (2014).63 Ponce-Reyes et al. (2012).64 Simon et al. (2013).65 Poulter et al. (2010).66 Rammig et al. (2010).67 Cook et al. (2012).68 Zelazowski et al. (2011).69 Gumpenberger et al. (2010).70 Cox et al. (2004).71 Betts et al. (2004).72 Cook and Vizy (2008).73 Meissner et al. (2012).74 Buddemeier et al. (2011).75 Van Hooidonk et al. (2013).76 Cheung et al. (2010).77 Blanchard et al. (2012).78 Kolstad and Johansson (2011), compared to 1961–1990 levels.79 Colon-Gonzalez et al. (2013), compared to 2000.80 Beguin et al. (2011).81 Caminade et al. (2014).82 Van Lieshout et al. (2004).83 Popescu et al. (2014).84 Isaac and van Vuuren (2009).85 Hamududu and Killingtveit (2013), compared to 2005 levels.86 De Lucena et al. (2009), compared to 1971–2000.


Turn Down
Heatthe
Confronting the New Climate Normal
Turn Do
wn the H
eat C
onfronting the New
Clim
ate Norm
al
Latin America and the Caribbean