Embed Size (px)
Citation preview

Confronting Multiple Confronting Multiple Oppressions:Oppressions:
Examining the Needs of People Examining the Needs of People with Disabilities who are of with Disabilities who are of Hispanic / Latino descentHispanic / Latino descent
Kimberly Taylor, Joel Irizarry &Kimberly Taylor, Joel Irizarry &
Kris Balfanz-VertizKris Balfanz-Vertiz
Schwab Rehabilitation HospitalSchwab Rehabilitation Hospital
Chicago, ILChicago, IL
Funded by Hollister, Inc.Funded by Hollister, Inc.

Study SettingStudy Setting
Schwab Rehabilitation HospitalSchwab Rehabilitation Hospital
Extended Services DepartmentExtended Services Department
Centro de Vida IndependienteCentro de Vida Independiente

PWD are among the poorest & most stigmatized people in the world
Hispanic population is the fastest Hispanic population is the fastest growing minority group in the U.S.growing minority group in the U.S.
24.0% of working-age Hispanics have 24.0% of working-age Hispanics have a disability; compare to 18.6% in a disability; compare to 18.6% in CaucasiansCaucasians

Health disparities are seen in many Health disparities are seen in many areas including vaccinations, areas including vaccinations, insurance coverage, some types of insurance coverage, some types of cancer, HIV, hepatitis, diabetes, & TB.cancer, HIV, hepatitis, diabetes, & TB.
Neither health nor social services Neither health nor social services have increased at same rate as need.have increased at same rate as need.
Employment is associated with Employment is associated with increased life satisfaction and Quality increased life satisfaction and Quality of Life (QOL) scores.of Life (QOL) scores.
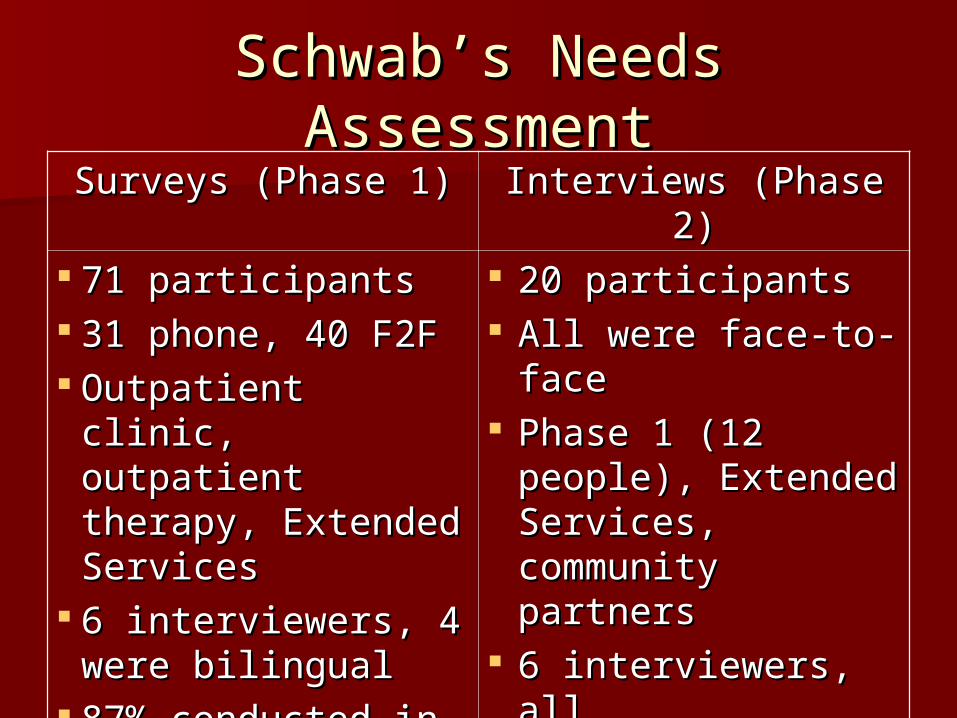
Schwab’s Needs Schwab’s Needs AssessmentAssessment
Surveys (Phase 1)Surveys (Phase 1) Interviews (Phase 2)Interviews (Phase 2) 71 participants71 participants 31 phone, 40 F2F31 phone, 40 F2F Outpatient clinic, Outpatient clinic,
outpatient therapy, outpatient therapy, Extended ServicesExtended Services
6 interviewers, 4 6 interviewers, 4 were bilingualwere bilingual
87% conducted in 87% conducted in English; 13% English; 13% SpanishSpanish
20 participants20 participants All were face-to-All were face-to-
faceface Phase 1 (12 Phase 1 (12
people), Extended people), Extended Services, Services, community partnerscommunity partners
6 interviewers, all 6 interviewers, all conversationally conversationally bilingual – 3 fluentbilingual – 3 fluent
80% in English; 20% 80% in English; 20% in Spanishin Spanish

Primary Domains StudiedPrimary Domains Studied
DemographicsDemographics EmploymentEmployment EducationEducation HousingHousing Benefits & Social ServicesBenefits & Social Services TransportationTransportation Health & MedicalHealth & Medical

DemographicsDemographics
SurveysSurveys InterviewsInterviews
ParticipaParticipant Sexnt Sex
82% male82% male
18% female18% female80% male80% male
20% female20% female
ParticipaParticipant Agent Age
Median age: 37Median age: 37
(18-84)(18-84)Median age: 29Median age: 29
(20-47)(20-47)
ParticipaParticipant nt
EthnicityEthnicity
69% Mexican69% Mexican
24% Puerto Rican24% Puerto Rican
7% Ecuadorian7% Ecuadorian
55% Mexican55% Mexican
35% Puerto 35% Puerto RicanRican
15% Guatemalan15% Guatemalan

DemographicsDemographics
SurveysSurveys InterviewsInterviews
Marital Marital statusstatus
32% Married32% Married
49% Single 49% Single (never (never been married)been married)
16% separated, 16% separated, divorced or divorced or widowedwidowed
3% other3% other
15% Married15% Married
70% Single 70% Single (never (never been married)been married)
15% separated, 15% separated, divorced or divorced or widowedwidowed
ChildrenChildren 61% have 61% have childrenchildren
15% have 15% have childrenchildren
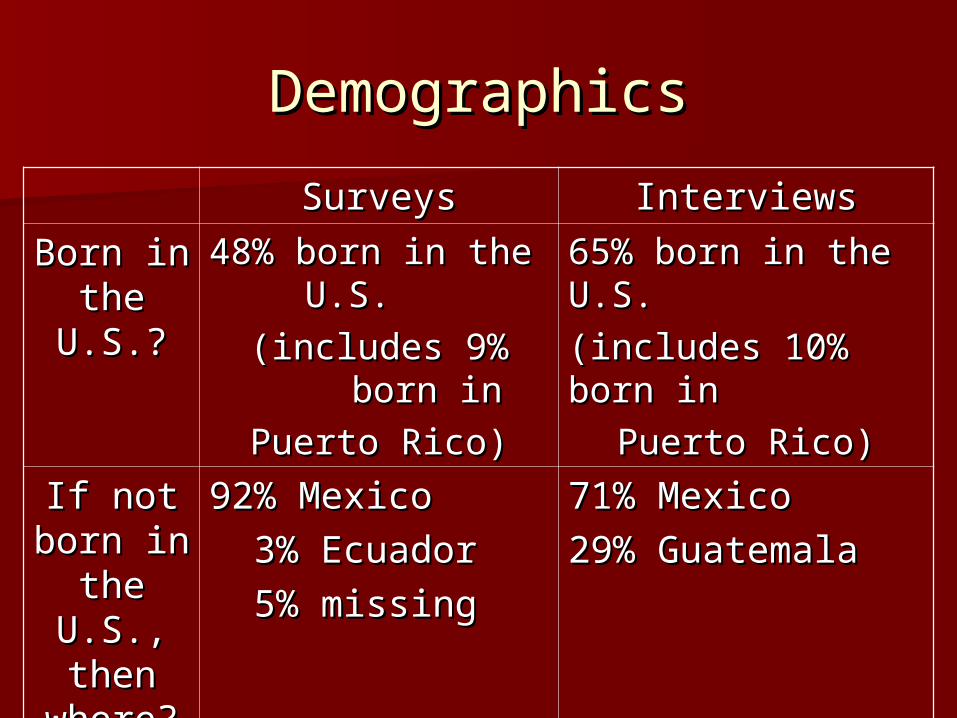
DemographicsDemographics
SurveysSurveys InterviewsInterviews
Born in Born in the the
U.S.?U.S.?
48% born in the 48% born in the U.S.U.S.
(includes 9% born (includes 9% born inin
Puerto Rico)Puerto Rico)
65% born in the 65% born in the U.S.U.S.
(includes 10% born (includes 10% born inin
Puerto Rico)Puerto Rico)
If not If not born in born in
the the U.S., U.S., then then
where?where?
92% Mexico92% Mexico
3% Ecuador3% Ecuador
5% missing5% missing
71% Mexico71% Mexico
29% Guatemala29% Guatemala

DemographicsDemographicsSurveysSurveys InterviewsInterviews
If not born If not born in the U.S., in the U.S., how long how long
have have participants participants been here?been here?
Median: 21 yearsMedian: 21 years
(“Just arrived” to (“Just arrived” to
65 years)65 years)
Median: 13.5 yearsMedian: 13.5 years
(3 – 28 years)(3 – 28 years)
If not born If not born here, what here, what is residency is residency
or or immigration immigration
status?status?
38% Legal 38% Legal residentresident
32% Naturalized 32% Naturalized citizencitizen
19% 19% UndocumenUndocumented residentted resident
5% visa5% visa
5% unknown5% unknown
13% Legal resident13% Legal resident
13% Naturalized 13% Naturalized citizencitizen
63% Undocumented 63% Undocumented residentresident
13% unknown13% unknown

DemographicsDemographicsSurveysSurveys InterviewsInterviews
What is your What is your disability?disability?
36% SCI36% SCI
16% Stroke16% Stroke
12% Mobility12% Mobility
8% BI8% BI
6% Amputee6% Amputee
27% other27% other
80% SCI80% SCI
5% Mobility5% Mobility
5% Hard of 5% Hard of hearinghearing
5% Polio5% Polio
5% Spinal Bifida5% Spinal Bifida
Acquired or Acquired or congenital?congenital?
If acquired, If acquired, when?when?
97% were acquired.97% were acquired.
Median: 5 years Median: 5 years ago.ago.
(3 mos. – 30 years)(3 mos. – 30 years)
90% were 90% were acquired.acquired.
Median: 6 years Median: 6 years ago.ago.
(1 – 36 years)(1 – 36 years)

How did participant acquire disability?
Survey
43%
29%
21%
7% 0%
GSW
MVA
Stroke
Disease
Fall
Interview
77%
11%
0%
6% 6%

Demographics (Survey)Demographics (Survey)
Language – Language – SpeakSpeak
English: English:
57% fluent, 34% some, 9% 57% fluent, 34% some, 9% nonenone
Spanish: Spanish:
87% fluent, 10% some, 3% 87% fluent, 10% some, 3% nonenone
Language – Language – Read and WriteRead and Write
English:English:
54% fluent, 19% some, 27% 54% fluent, 19% some, 27% nonenone
Spanish:Spanish:
66% fluent, 19% some, 15% 66% fluent, 19% some, 15% nonenone
BilingualismBilingualism - 29% are fluent speakers of - 29% are fluent speakers of both Spanish & English.both Spanish & English.
- 88% speak at least “some” of - 88% speak at least “some” of the language in which they are the language in which they are not fluent.not fluent.

ResultsResults::Employment & Employment &
EducationEducation

Employment: Pre/Post Injury(Survey)
10% 14%
85%
20%
0%
10%
20%
30%
40%
50%
60%
70%
80%
90%
100%
Prior to Injury Since injury
Part-time Full-time

Employment (Survey)Employment (Survey)
For those who are working, what is the best For those who are working, what is the best part of having a job and/or working?part of having a job and/or working?
29% Getting a paycheck; supporting 29% Getting a paycheck; supporting family and/or myselffamily and/or myself
29% Helping others29% Helping others
14% Meeting new people14% Meeting new people

Employment (Interview)Employment (Interview)
Of the 8 interviewees who currently Of the 8 interviewees who currently have a job, 7 stated that they got the have a job, 7 stated that they got the interview because of contacts at a interview because of contacts at a rehab hospital.rehab hospital.
3 stated that having a disability was 3 stated that having a disability was an advantage for their job, because an advantage for their job, because they work at a rehab hospital or as a they work at a rehab hospital or as a medical supply vendor.medical supply vendor.

Employment (Interview)Employment (Interview)
Why are you not working?Why are you not working?
25% said they were discriminated against, 25% said they were discriminated against, because employers think they cannot work, because employers think they cannot work, due to having a disabiitydue to having a disabiity
25% said it was because of their legal status.25% said it was because of their legal status.
17% said it was because they have a 17% said it was because they have a pressure sore that needs to heal first.pressure sore that needs to heal first.

Employment (Survey)Employment (Survey)
How important is it How important is it to you to find to you to find employment?employment?
67% Very important67% Very important
16% Important16% Important
12% Neutral12% Neutral
6% Unimportant6% Unimportant
Are you satisfied Are you satisfied with your ability to with your ability to find employment?find employment?
9% Very Satisfied9% Very Satisfied
15% Satisfied15% Satisfied
21% Neutral21% Neutral
40% Dissatisfied40% Dissatisfied
16% Very 16% Very dissatisfieddissatisfied

Employment (Survey)Employment (Survey)
Top 5 Obstacles to Working
– Health Status / Disability (56%)– Lack of Job Opportunities (34%)– Transportation (30%)– Lack of Knowledge about Opportunities
(30%)– Inability to leave house independently,
due to inaccessibility (16%)

Education (Survey)Education (Survey)
45% of participants dropped out 45% of participants dropped out before entering the 9before entering the 9thth grade. grade.
37% graduated high school.37% graduated high school. 18% have some post-secondary 18% have some post-secondary
education.education. 5% graduated college.5% graduated college.

Education (Survey)
19%
72%
0%
10%
20%
30%
40%
50%
60%
70%
80%
90%
100%
Attending School Want to Attend School

Education (Interview)
What is the best part of attending school?
40%
40%
20%
Likes learning
Social interaction
Furthering my education

Top 5 Obstacles to Top 5 Obstacles to Education & Employment Education & Employment
(Survey)(Survey)EmploymentEmployment
Health status / disability Health status / disability (56%)(56%)
Lack of job opportunities Lack of job opportunities (34%)(34%)
Transportation (30%)Transportation (30%) Lack of knowledge Lack of knowledge
about opportunities about opportunities (30%)(30%)
Inability to leave house Inability to leave house independently, due to independently, due to inaccessibility (16%)inaccessibility (16%)
EducationEducation
Health status / disability Health status / disability (37%)(37%)
Transportation (27%)Transportation (27%) Lack of knowledge Lack of knowledge
about opportunities about opportunities (25%)(25%)
Inability to leave house Inability to leave house independently, due to independently, due to inaccessibility (16%)inaccessibility (16%)
Family obligations Family obligations (15%)(15%)

Housing (survey)Housing (survey)
How long lived in How long lived in your your neighborhood?neighborhood?
Average 9 years (range: Average 9 years (range: 3 months to 53 years)3 months to 53 years)
Rent/ownRent/own 61% Rent61% Rent
39% Own39% Own
Is your name on Is your name on the the lease/mortgage?lease/mortgage?
53% Yes53% Yes
47% No47% No
Who lives with Who lives with participant?participant?
86% Family86% Family
2% Friends2% Friends
10% Live alone10% Live alone
2% Residential care -2% Residential care -OtherOther
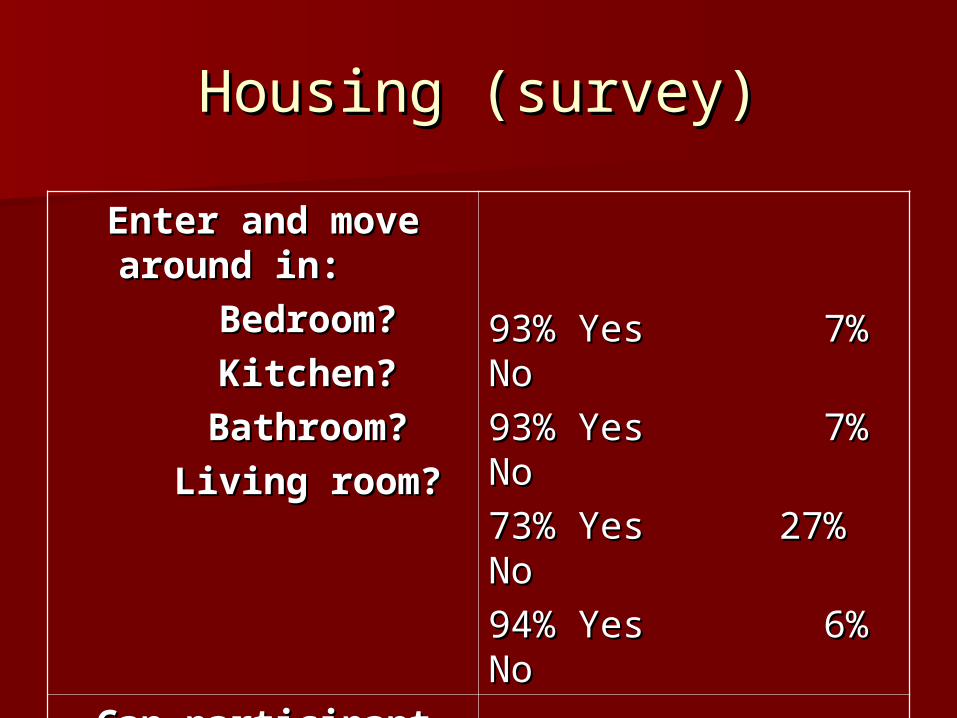
Housing (survey)Housing (survey)
Enter and move Enter and move around in: around in:
Bedroom?Bedroom?
Kitchen?Kitchen?
Bathroom?Bathroom?
Living room?Living room?
93% Yes 7% No93% Yes 7% No
93% Yes 7% No93% Yes 7% No
73% Yes 27% No73% Yes 27% No
94% Yes 6% No94% Yes 6% No
Can participant Can participant enter & exit home enter & exit home
alone?alone?71% Yes 29% No71% Yes 29% No

Social Services (Survey)Social Services (Survey)
Are you entitled to Are you entitled to ANY financial ANY financial benefits?benefits?
41% Yes41% Yes
23% No23% No
36% “I don’t know” 36% “I don’t know” or no responseor no response
If yes, receiving If yes, receiving them?them?
75% Yes75% Yes
25% No25% No
If yes, where get If yes, where get information on information on financial benefits? financial benefits? (Top 3)(Top 3)
27% Family or 27% Family or FriendsFriends
27% Hospital27% Hospital
12% Social security 12% Social security officeoffice

Social Services (Survey)Social Services (Survey)
ServiceService Are you Are you eligible?eligible?
Do you use it?Do you use it?
YesYes NoNo ?? YesYes NoNo ??
Public Aid/TANFPublic Aid/TANF 46%46% 27%27% 27%27% 38%38% 57%57% 6%6%
Link CardLink Card 3636 3939 2626 2424 7474 11
DRSDRS 1414 2121 6464 77 8282 1111
SSISSI 4242 3131 2727 3838 5555 55
SSDISSDI 3333 3434 3333 2424 6464 1111
Section 8 Section 8 housinghousing
66 4141 5353 11 8181 1717
IDPA/MedicaidIDPA/Medicaid 4444 2323 3333 4040 6060 --
Worker’s compWorker’s comp 55 6363 3232 33 8484 1313

Social Services: DRS Social Services: DRS (interview)(interview)
65% of 65% of intervieweinterviewe
es had es had spoken to spoken to
DRS & DRS & 60% had 60% had opened opened cases.cases.
Services ReceivedServices Received IntervieweeIntervieweess
Homemaker onlyHomemaker only 00Education onlyEducation only 66Vocation onlyVocation only 11Homemaker & Homemaker & EducationEducation
11
Homemaker & vocationHomemaker & vocation 11Homemaker, education Homemaker, education & vocation& vocation
11

Social Services: DRS Social Services: DRS (interview)(interview)
CommentsComments:: One person who only spoke Spanish at the time One person who only spoke Spanish at the time
of his DRS interview was interviewed in English.of his DRS interview was interviewed in English. Everyone who has been to a DRS office says it Everyone who has been to a DRS office says it
was accessible.was accessible. Of those who gave a judgment of their Of those who gave a judgment of their
experience:experience:– 38% said good overall38% said good overall– 31% said okay31% said okay– 31% said it was bad31% said it was bad
23% stated staff was rude or ignored them.23% stated staff was rude or ignored them. 38% stated that, at least with some staff, it takes 38% stated that, at least with some staff, it takes
too long to get services.too long to get services.

Transportation (Survey)Average Number of Days per Week Participants Leave Home
8%
31%
20%
41%
0%
5%
10%
15%
20%
25%
30%
35%
40%
45%
0 1-2 3-4 5-7
Number of days per week

Transportation (Interview)
Reasons for Leaving Home
0
5
10
15
20
25
30
0-2 days out ofhouse
3-4 days out ofhouse
5-7 days out ofhouse
Family outings
Church
Volunteering
School
Errands & obligations
Looking for work
Work
Recreation / social
Doctor / Hospital

Transportation (Survey)
How satisfied are you with your ability to leave home?
18%
30%
14%
27%
11%
Very satisf ied
Satisf ied
Neutral
Dissatisf ied
Very dissatisf ied

Transportation (Survey)Transportation (Survey)Source of Source of transportation…transportation…
How get to…How get to…
StoreStore DoctoDoctorr
Family & Family & FriendsFriends
WorWorkk
DriveDrive 25%25% 27%27% 25%25% 16%16%
Family or friendsFamily or friends 30%30% 38%38% 38%38% 4%4%
Public trans – Public trans – main linesmain lines
7%7% 11%11% 6%6% 3%3%
Public trans – Public trans – CDT CDT
-- 11%11% 4%4% 4%4%
MedicarMedicar -- 4%4% -- --
Walk/rollWalk/roll 18%18% 4%4% 4%4% 1%1%
I don’t go thereI don’t go there 20%20% 3%3% 23%23% 72%72%

Transportation (Interview)
Satisfaction with Transportation Choices
0
5
10
15
20
25
CTA Paratransit
Very satisfied Somewhat satisfied Neutral Dissatisfied Don't use

Medical (Survey)Medical (Survey)
Currently have a Currently have a regular doctor?regular doctor?
79% Yes79% Yes
21% No21% No
Seen doctor in Seen doctor in last 12 months?last 12 months?
86% Yes86% Yes
14% No14% No
Have insurance?Have insurance? 80% Yes80% Yes
20% No20% No
If yes, type of If yes, type of insurance?insurance?
57% Public aid57% Public aid
34% Medicare34% Medicare
14% Private insurance 14% Private insurance through employmentthrough employment

Medical (Survey)Medical (Survey)
YesYes NoNo
Do you see a Do you see a dentist dentist regularly?regularly?
31%31% 69%69%
Do you have Do you have see an eye see an eye doctor doctor regularly?regularly?
38%38% 62%62%

Medical (survey)Medical (survey)How pay for How pay for prescriptions?prescriptions?
Note: 69% take Note: 69% take medication or medication or perform a medical perform a medical procedure daily. procedure daily.
52% Insurance partial 52% Insurance partial coverage coverage
27% Insurance full 27% Insurance full coveragecoverage
22% Out of pocket22% Out of pocket
What do you do What do you do if you need to if you need to see a doctor?see a doctor?
47% Call my doctor47% Call my doctor
32% Go to emergency 32% Go to emergency roomroom
9% Call my family9% Call my family
10% Other or nothing10% Other or nothing

Medical (interview)Medical (interview)
80% of interviewees stated that they had 80% of interviewees stated that they had experienced health care issues that were experienced health care issues that were obstacles to other parts of their life.obstacles to other parts of their life.
25% had UTIs. (“You can continue with 25% had UTIs. (“You can continue with your life.)your life.)
20% had pressure sores. (“I couldn’t leave 20% had pressure sores. (“I couldn’t leave home;” “I had to withdraw from school.”)home;” “I had to withdraw from school.”)
Other issues included broken limbs (“It’s Other issues included broken limbs (“It’s hard to get around in a manual chair with hard to get around in a manual chair with a broken arm”); obesity due to lack of a broken arm”); obesity due to lack of exercise, and difficulty breathing.exercise, and difficulty breathing.

SummarySummary
Many of these issues complicate other Many of these issues complicate other ones:ones:
Inaccessible homeInaccessible home: can’t go to work or : can’t go to work or schoolschool
UnemployedUnemployed: limited insurance & : limited insurance & finances to take care of healthfinances to take care of health
Health issuesHealth issues: can’t leave home to : can’t leave home to access social services to gain new access social services to gain new transportation options, learn about transportation options, learn about benefits, or attend schoolbenefits, or attend school

Now what???Now what???Why do you choose to use certain services?Why do you choose to use certain services?
(interview)(interview)
ComfortComfort – Building is accessible & I feel socially – Building is accessible & I feel socially accepted there.accepted there.
LocationLocation - It’s conveniently located somewhere - It’s conveniently located somewhere where I need to go for other reasons (e.g., school, where I need to go for other reasons (e.g., school, hospital).hospital).
QualityQuality - The services are good; I get what I need. - The services are good; I get what I need.
CostCost - It’s free. - It’s free.

What can we do to make your What can we do to make your disability / healthcare status disability / healthcare status
less of an obstacle?less of an obstacle?
Educate people on how to take care of their bodies.Educate people on how to take care of their bodies. Help people get into home schoolingHelp people get into home schooling Show people examples of successful living for PWDShow people examples of successful living for PWD Find resources for people who are undocumentedFind resources for people who are undocumented Provide transportationProvide transportation Provide mentoring servicesProvide mentoring services Train people on new life skillsTrain people on new life skills Provide recreational areasProvide recreational areas
(interview)(interview)

How can we share info?How can we share info?Workshops at hospital
Newsletter
Fliers or brochures
Hospital case managers / receive info as inpatients
Peer mentors
Doctors
Letters to homes
Outpatient clinic
"Just keep telling people"
Advertise services in newspaper
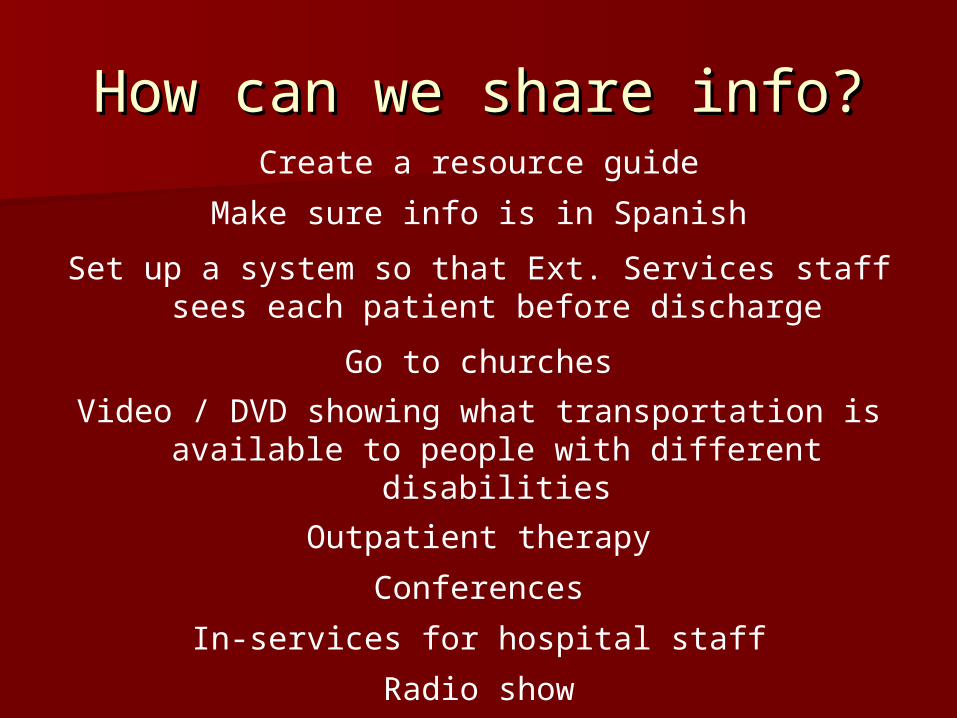
How can we share info?How can we share info?Create a resource guide
Make sure info is in Spanish
Set up a system so that Ext. Services staff sees each patient before discharge
Go to churches
Video / DVD showing what transportation is available to people with different disabilities
Outpatient therapy
Conferences
In-services for hospital staff
Radio show

QUESTIONS???QUESTIONS???

DiscussionDiscussion
How could your program better How could your program better meet the needs of Hispanic meet the needs of Hispanic individuals with disabilities? individuals with disabilities?
How does what you’ve seen How does what you’ve seen here today impact your daily here today impact your daily work?work?

For more information, please contact: For more information, please contact: Kimberly TaylorKimberly Taylor Manager of Program Development, Manager of Program Development,
Evaluation & Research Evaluation & Research 773-522-2010, ext. 5176773-522-2010, ext. 5176 [email protected]@sinai.org
Joel IrizarryJoel Irizarry Disability Resource CoordinatorDisability Resource Coordinator 773-522-5863773-522-5863 [email protected]@sinai.org