Embed Size (px)
Citation preview
Configure Blue Coat ProxySG to Upload Log Files to CTA System Last updated: October 26, 2017
Contents Conventions
Introduction
Prerequisites
Requirements
Components Used
Configure
Configure the Proxy
User Authentication
Configure DNS
Next Steps
Troubleshooting
Conventions
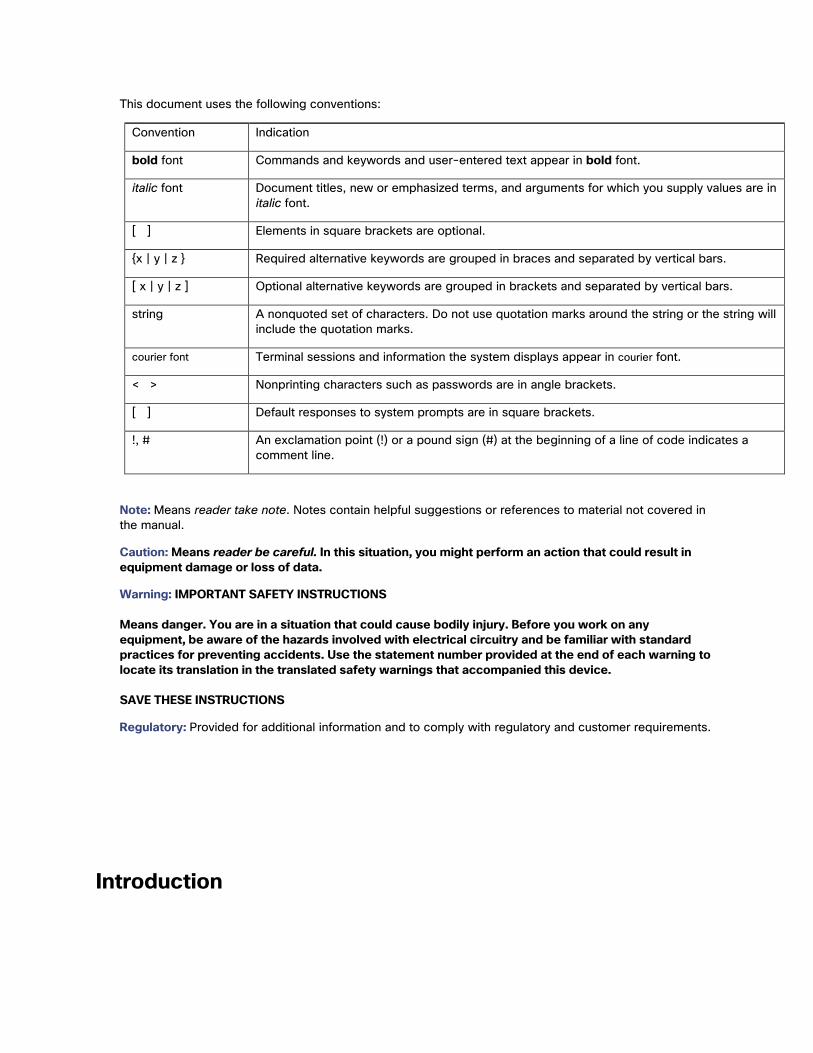
This document uses the following conventions:
Convention Indication
bold font Commands and keywords and user-entered text appear in bold font.
italic font Document titles, new or emphasized terms, and arguments for which you supply values are in italic font.
[ ] Elements in square brackets are optional.
{x | y | z } Required alternative keywords are grouped in braces and separated by vertical bars.
[ x | y | z ] Optional alternative keywords are grouped in brackets and separated by vertical bars.
string A nonquoted set of characters. Do not use quotation marks around the string or the string will include the quotation marks.
courier font Terminal sessions and information the system displays appear in courier font.
< > Nonprinting characters such as passwords are in angle brackets.
[ ] Default responses to system prompts are in square brackets.
!, # An exclamation point (!) or a pound sign (#) at the beginning of a line of code indicates a comment line.
Note: Means reader take note. Notes contain helpful suggestions or references to material not covered in the manual.
Caution: Means reader be careful. In this situation, you might perform an action that could result in equipment damage or loss of data.
Warning: IMPORTANT SAFETY INSTRUCTIONS Means danger. You are in a situation that could cause bodily injury. Before you work on any equipment, be aware of the hazards involved with electrical circuitry and be familiar with standard practices for preventing accidents. Use the statement number provided at the end of each warning to locate its translation in the translated safety warnings that accompanied this device. SAVE THESE INSTRUCTIONS
Regulatory: Provided for additional information and to comply with regulatory and customer requirements.
Introduction
This document describes how to configure a Blue Coat ProxySG to upload its log files to the Cisco Cognitive Threat Analytics (CTA) system. Once the log files have been uploaded to the system, CTA analyzes the data and reports findings to the CTA portal.
Prerequisites
Requirements
Cisco ScanCenter is the administration portal into Cisco Cloud Web Security. You must first create a device account in Cisco ScanCenter for your Blue Coat ProxySG.
• Log in to Cisco ScanCenter • Click the Threats tab • Click the global settings menu icon in the upper-right corner of the page • Click Device Accounts • Choose Automatic upload method
For further information, refer to the “Proxy Device Uploads" section of the Cisco ScanCenter Administrator Guide.
Once the device account is created, copy this information from the Add Device Account page in Cisco ScanCenter to paste into your proxy configuration:
• HTTPS host: etr.cloudsec.sco.cisco.com • HTTPS path • Device username generated for your proxy device, case sensitive, different per
proxy device • Device password, case sensitive
In order to access your Blue Coat ProxySG, you need:
• Hostname or IP address of your Blue Coat ProxySG • Login credentials to the Blue Coat ProxySG
o Default username is admin o No default password, must be configured
• Web browser with JavaTM plug-in, Blue Coat does NOT support Google Chrome, Opera, or Safari
Caution: The information in this document was created from devices in a lab environment. If your network is live, understand the potential impact of any configuration command.
Components Used
The information in this document was tested on this hardware:
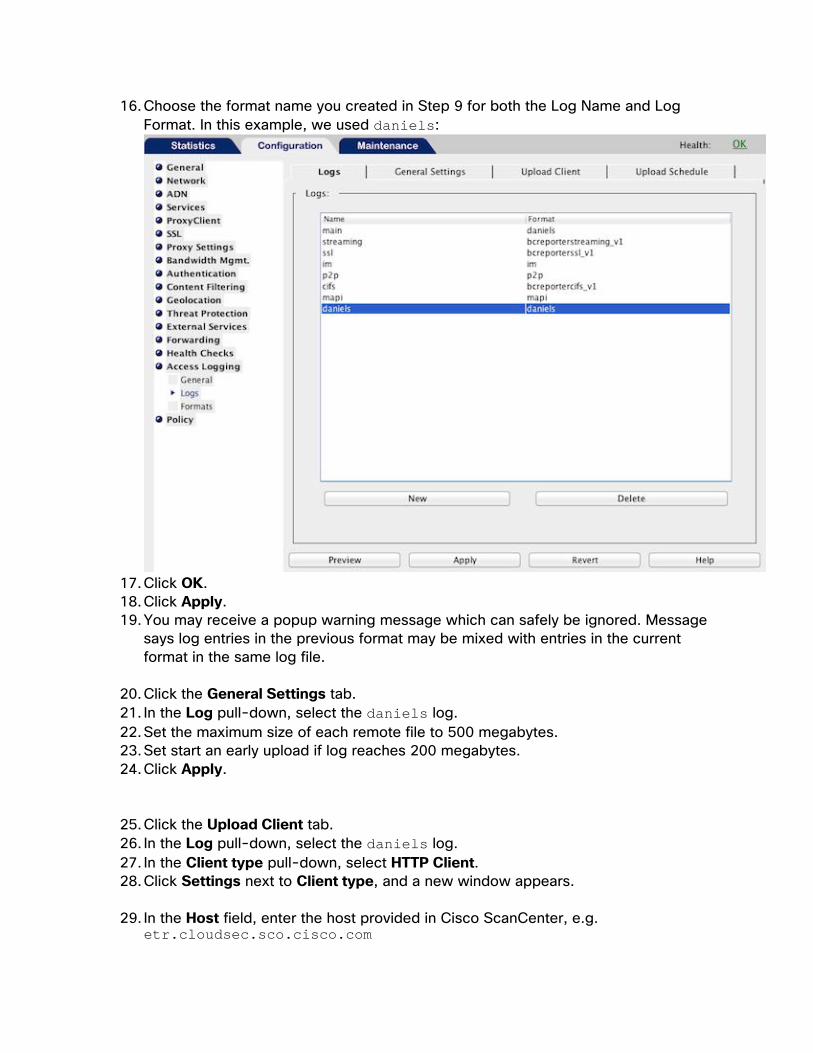
• Blue Coat ProxySG 600
The information in this document was tested on these software versions:
• SGOS 6.5.7.5 • SGOS 6.5.6.1
Note: Other versions are currently not supported as they may not work properly when uploading to CTA.
Configure
Configure the Proxy
1. Point your web browser to your Blue Coat ProxySG: a. https://sg_600.hostname:8082/ or b. https://a.b.c.d:8082/ where a.b.c.d is the proxy’s IP address
2. If needed, accept the insecure HTTPS certificate to proceed. 3. Log in as admin. 4. If needed, accept the JavaTM security warning to proceed.
5. Navigate to Configuration > Access Logging > General. 6. Select the Enable Access Logging check box, and click Apply.
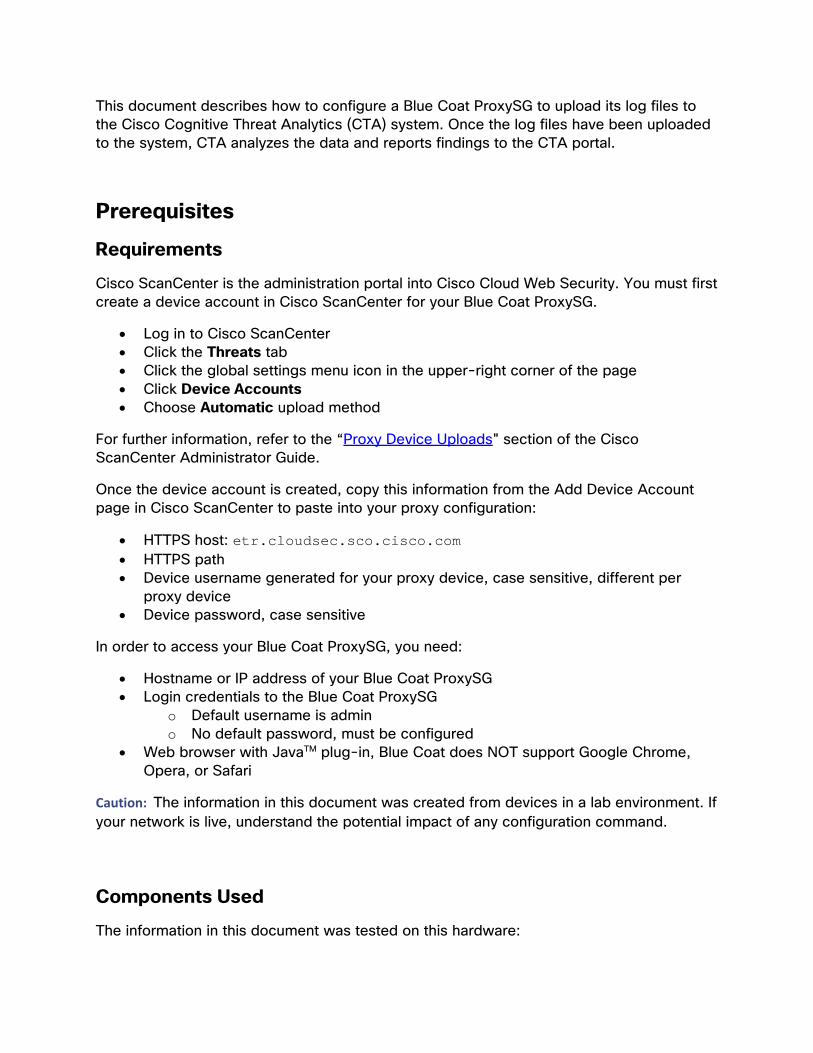
7. Navigate to Configuration > Access Logging > Formats. 8. Click New to create a new format entry. 9. Enter a unique name in the Format Name field. In this example, we used daniels:
10. Click the radio button for W3C Extended Log File Format (ELFF) string and paste
the following string into the field: timestamp time-taken c-ip cs-username s-ip s-port c-port cs-uri cs-bytes sc-bytes sc-bodylength sc-headerlength cs-bodylength cs-headerlength cs(User-Agent) rs(Content-Type) cs-method sc-status cs(Referer) cs-ip r-ip r-port rs(Location) s-action
11. Click the OK. 12. Click the Apply.
13. Navigate to Configuration > Access Logging > Logs. 14. Click the Logs tab. 15. Click New to create a new log entry.
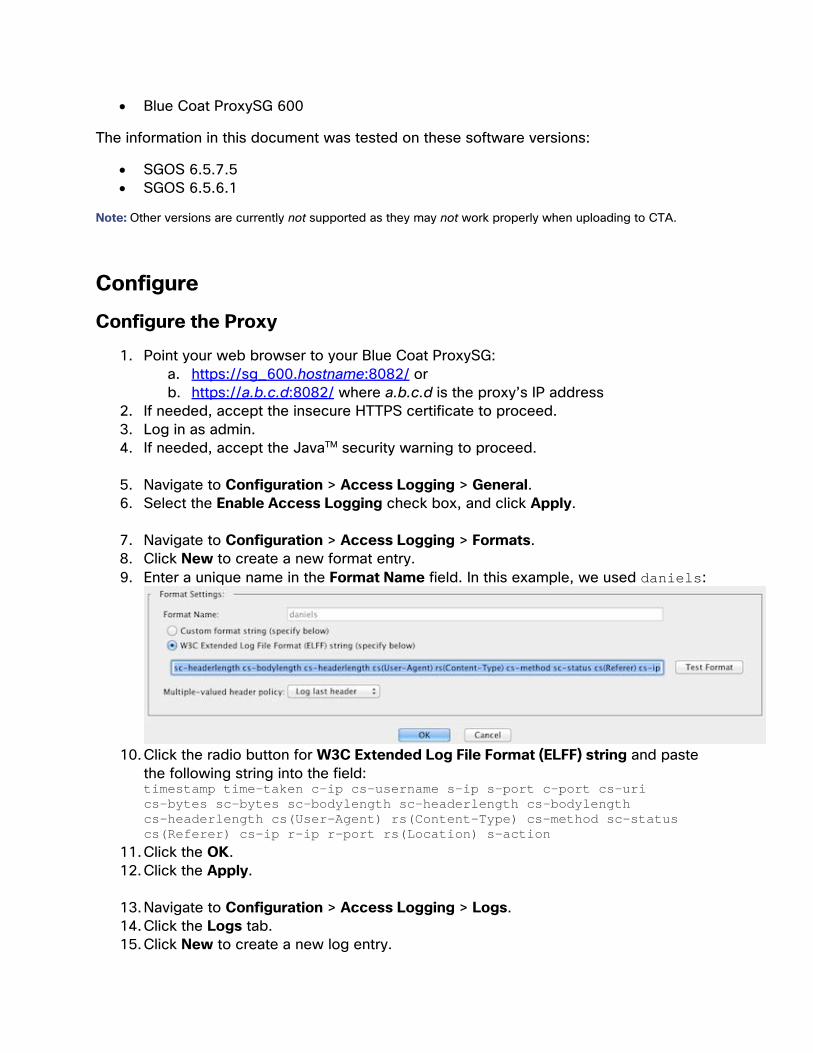
16. Choose the format name you created in Step 9 for both the Log Name and Log Format. In this example, we used daniels:
17. Click OK. 18. Click Apply. 19. You may receive a popup warning message which can safely be ignored. Message
says log entries in the previous format may be mixed with entries in the current format in the same log file.
20. Click the General Settings tab. 21. In the Log pull-down, select the daniels log. 22. Set the maximum size of each remote file to 500 megabytes. 23. Set start an early upload if log reaches 200 megabytes. 24. Click Apply.
25. Click the Upload Client tab. 26. In the Log pull-down, select the daniels log. 27. In the Client type pull-down, select HTTP Client. 28. Click Settings next to Client type, and a new window appears.
29. In the Host field, enter the host provided in Cisco ScanCenter, e.g.
etr.cloudsec.sco.cisco.com
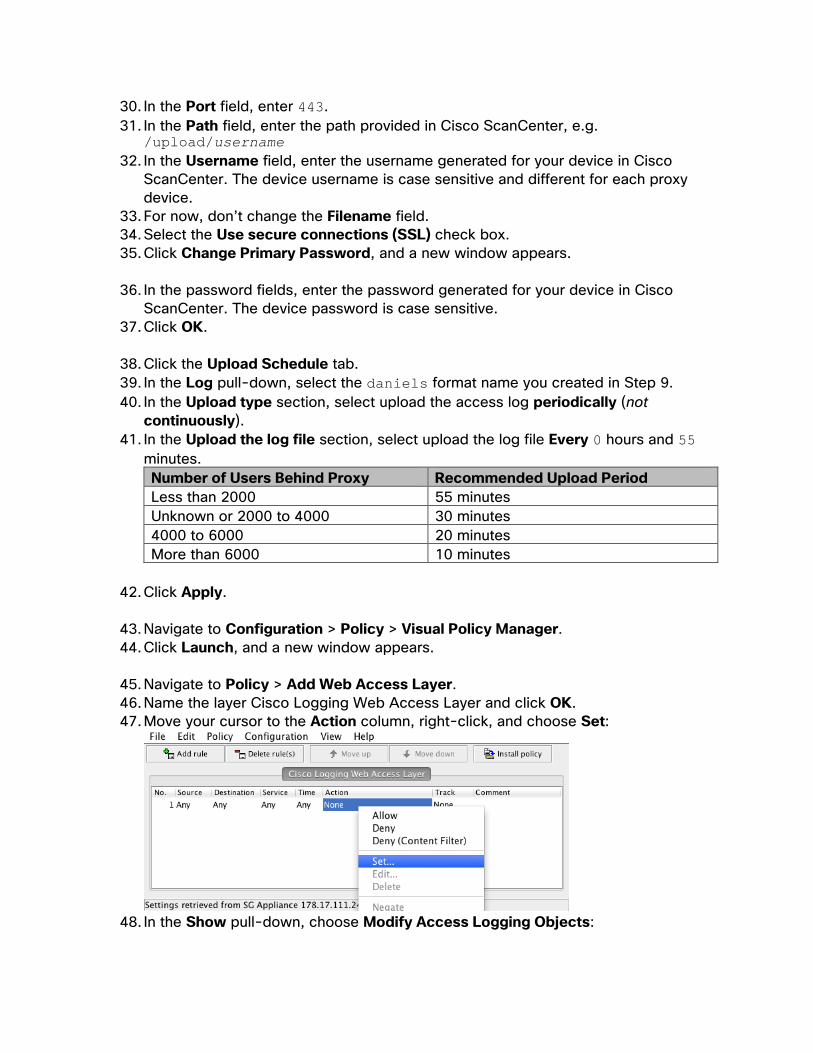
30. In the Port field, enter 443. 31. In the Path field, enter the path provided in Cisco ScanCenter, e.g.
/upload/username 32. In the Username field, enter the username generated for your device in Cisco
ScanCenter. The device username is case sensitive and different for each proxy device.
33. For now, don’t change the Filename field. 34. Select the Use secure connections (SSL) check box. 35. Click Change Primary Password, and a new window appears.
36. In the password fields, enter the password generated for your device in Cisco
ScanCenter. The device password is case sensitive. 37. Click OK.
38. Click the Upload Schedule tab. 39. In the Log pull-down, select the daniels format name you created in Step 9. 40. In the Upload type section, select upload the access log periodically (not
continuously). 41. In the Upload the log file section, select upload the log file Every 0 hours and 55
minutes. Number of Users Behind Proxy Recommended Upload Period Less than 2000 55 minutes Unknown or 2000 to 4000 30 minutes 4000 to 6000 20 minutes More than 6000 10 minutes
42. Click Apply.
43. Navigate to Configuration > Policy > Visual Policy Manager. 44. Click Launch, and a new window appears.
45. Navigate to Policy > Add Web Access Layer. 46. Name the layer Cisco Logging Web Access Layer and click OK. 47. Move your cursor to the Action column, right-click, and choose Set:
48. In the Show pull-down, choose Modify Access Logging Objects:
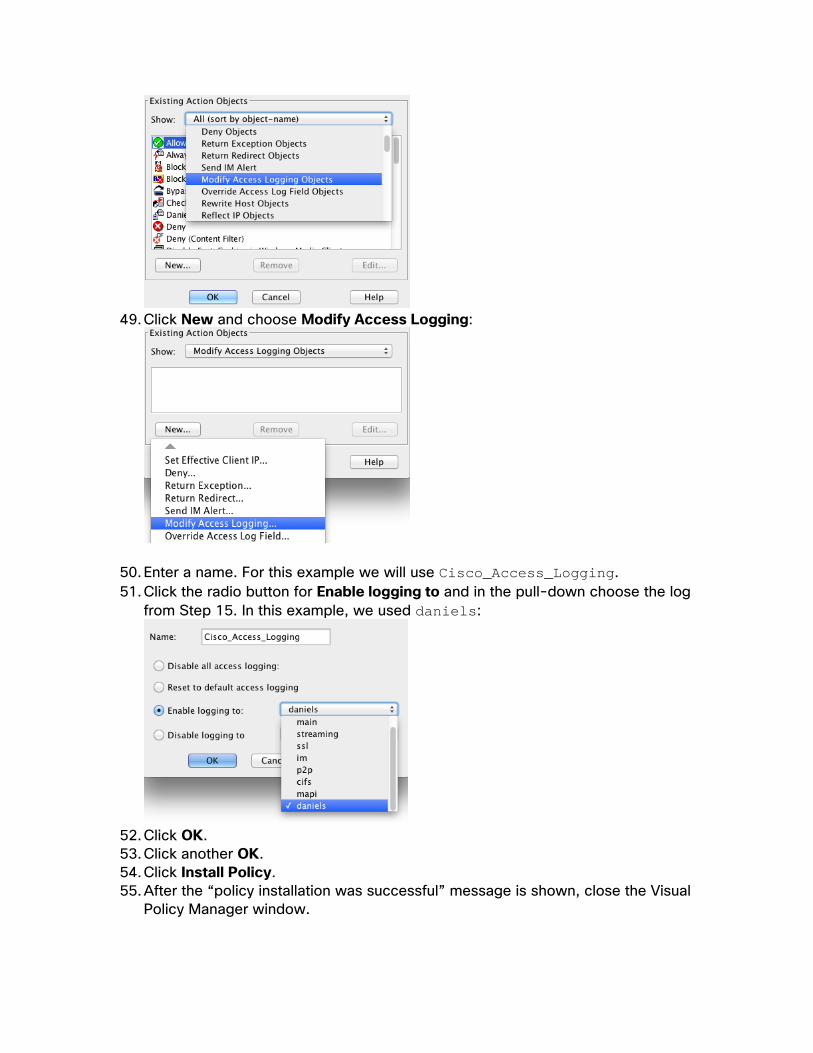
49. Click New and choose Modify Access Logging:
50. Enter a name. For this example we will use Cisco_Access_Logging. 51. Click the radio button for Enable logging to and in the pull-down choose the log
from Step 15. In this example, we used daniels:
52. Click OK. 53. Click another OK. 54. Click Install Policy. 55. After the “policy installation was successful” message is shown, close the Visual
Policy Manager window.
User Authentication
In order to get user details for access logs, users must be authenticated. Follow these steps to set up LDAP authentication.
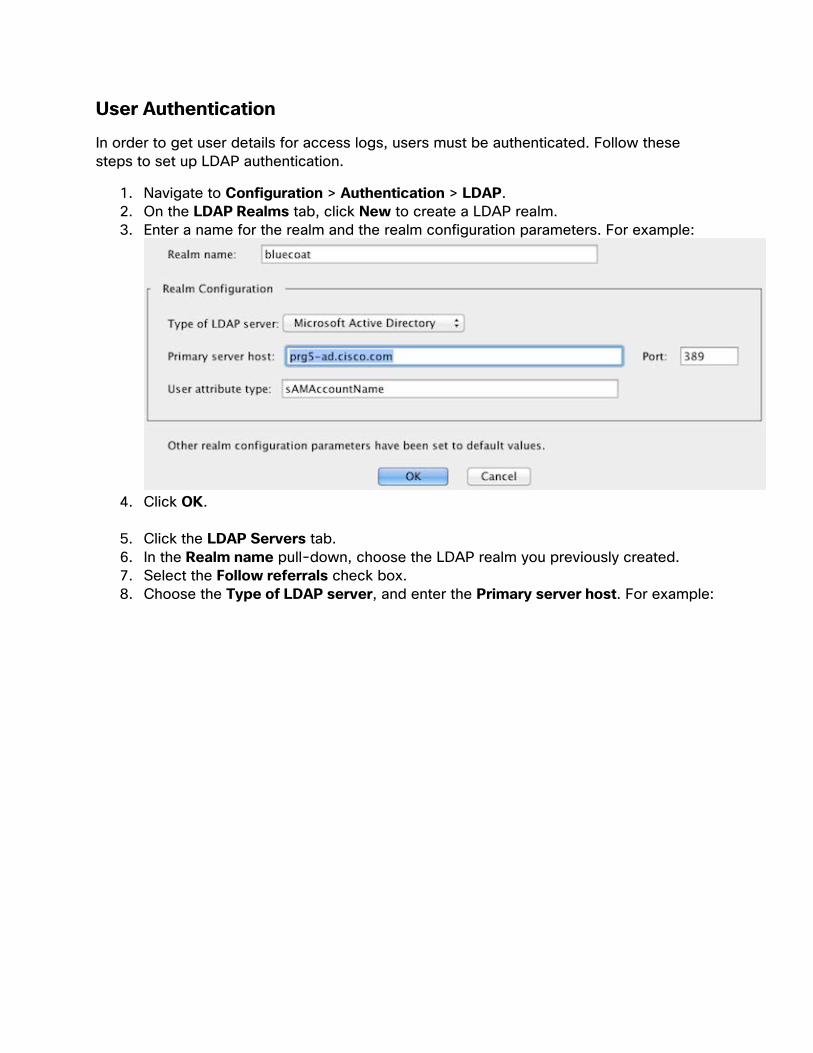
1. Navigate to Configuration > Authentication > LDAP. 2. On the LDAP Realms tab, click New to create a LDAP realm. 3. Enter a name for the realm and the realm configuration parameters. For example:
4. Click OK.
5. Click the LDAP Servers tab. 6. In the Realm name pull-down, choose the LDAP realm you previously created. 7. Select the Follow referrals check box. 8. Choose the Type of LDAP server, and enter the Primary server host. For example:
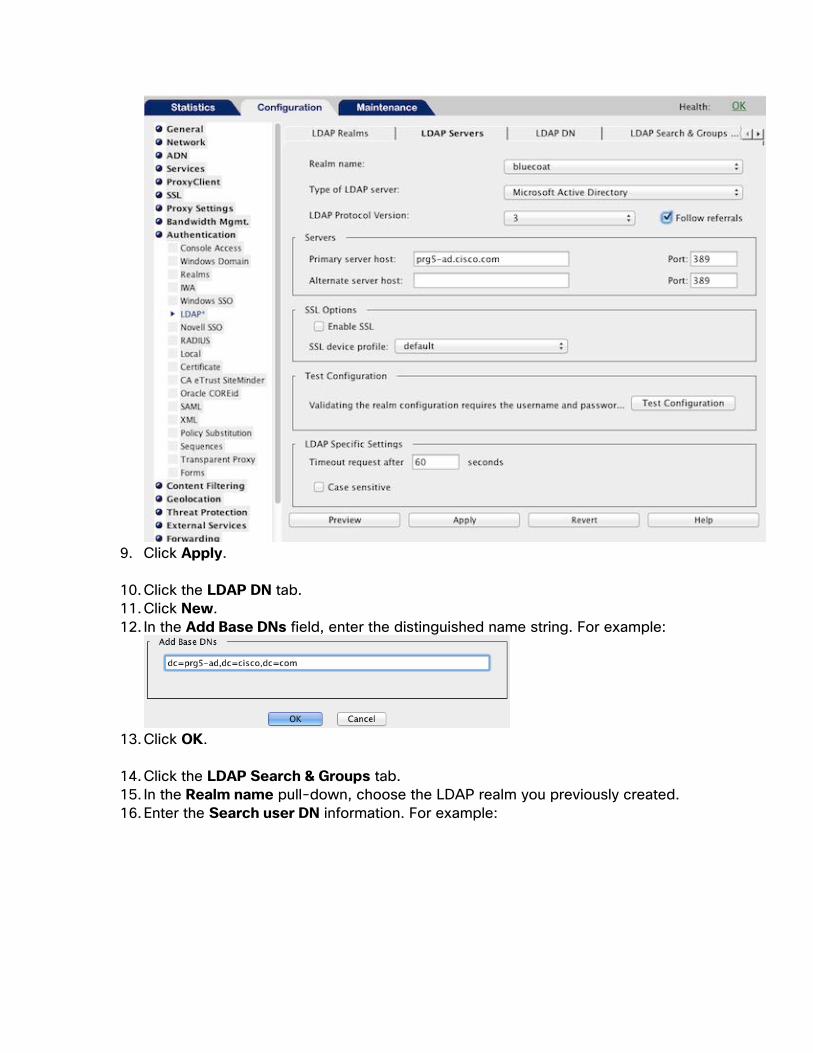
9. Click Apply.
10. Click the LDAP DN tab. 11. Click New. 12. In the Add Base DNs field, enter the distinguished name string. For example:
13. Click OK.
14. Click the LDAP Search & Groups tab. 15. In the Realm name pull-down, choose the LDAP realm you previously created. 16. Enter the Search user DN information. For example:
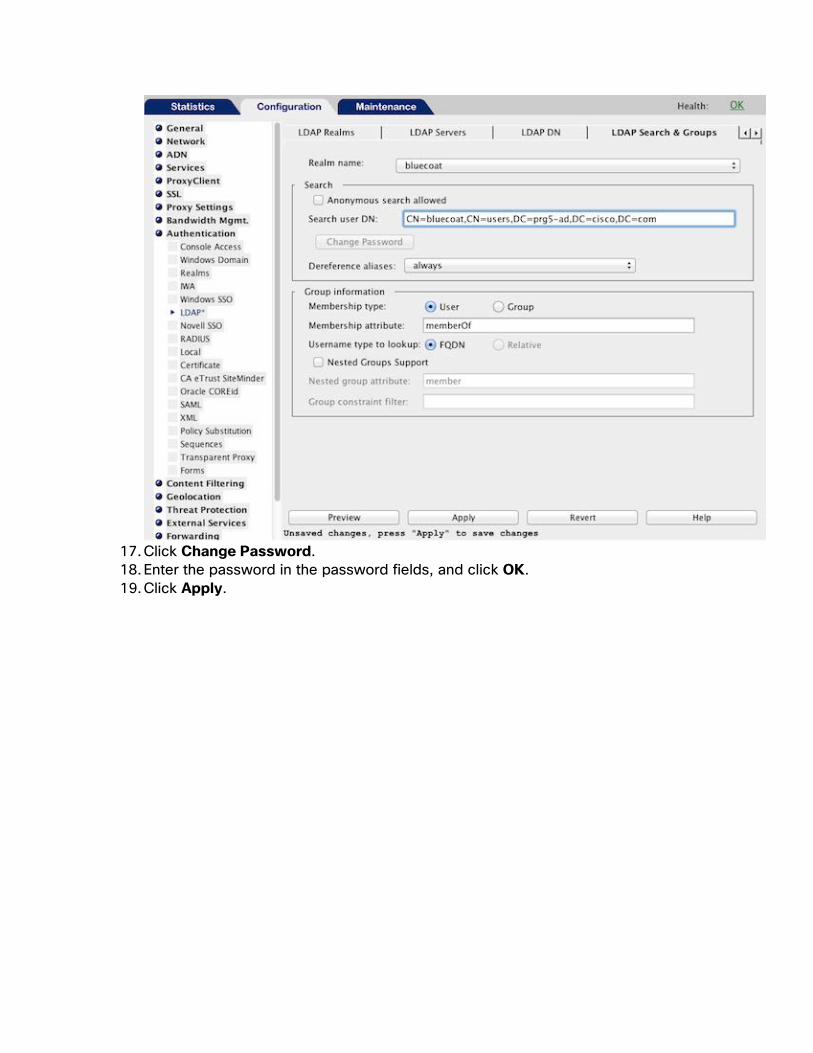
17. Click Change Password. 18. Enter the password in the password fields, and click OK. 19. Click Apply.
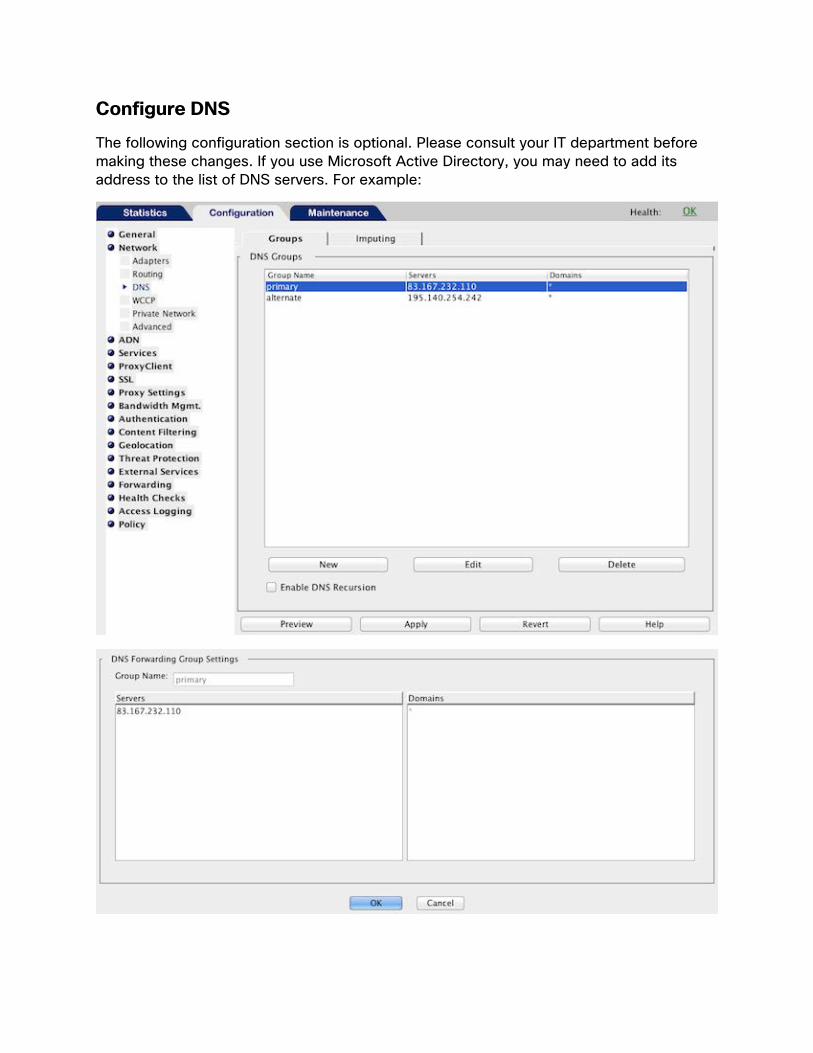
Configure DNS
The following configuration section is optional. Please consult your IT department before making these changes. If you use Microsoft Active Directory, you may need to add its address to the list of DNS servers. For example:
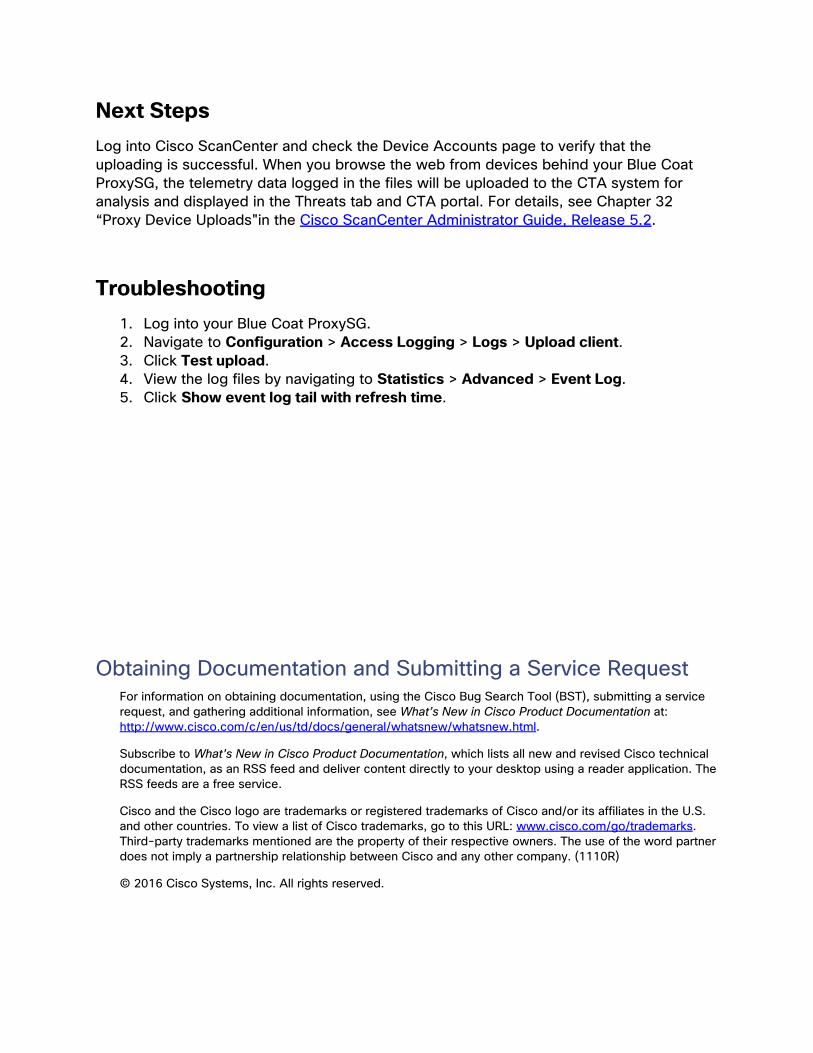
Next Steps Log into Cisco ScanCenter and check the Device Accounts page to verify that the uploading is successful. When you browse the web from devices behind your Blue Coat ProxySG, the telemetry data logged in the files will be uploaded to the CTA system for analysis and displayed in the Threats tab and CTA portal. For details, see Chapter 32 “Proxy Device Uploads"in the Cisco ScanCenter Administrator Guide, Release 5.2.
Troubleshooting 1. Log into your Blue Coat ProxySG. 2. Navigate to Configuration > Access Logging > Logs > Upload client. 3. Click Test upload. 4. View the log files by navigating to Statistics > Advanced > Event Log. 5. Click Show event log tail with refresh time.
Obtaining Documentation and Submitting a Service Request For information on obtaining documentation, using the Cisco Bug Search Tool (BST), submitting a service request, and gathering additional information, see What’s New in Cisco Product Documentation at: http://www.cisco.com/c/en/us/td/docs/general/whatsnew/whatsnew.html.
Subscribe to What’s New in Cisco Product Documentation, which lists all new and revised Cisco technical documentation, as an RSS feed and deliver content directly to your desktop using a reader application. The RSS feeds are a free service.
Cisco and the Cisco logo are trademarks or registered trademarks of Cisco and/or its affiliates in the U.S. and other countries. To view a list of Cisco trademarks, go to this URL: www.cisco.com/go/trademarks. Third-party trademarks mentioned are the property of their respective owners. The use of the word partner does not imply a partnership relationship between Cisco and any other company. (1110R)
© 2016 Cisco Systems, Inc. All rights reserved.