Embed Size (px)
Citation preview
Slide 1
Private Banking – An Insider’s View
Date: 9th November 2006
Produced by: Jeremy Parlons
CONFIDENTIAL
Slide 2
1. Evolution of different business models
2. What are clients looking for?
3. Delivering the promise
4. Where is the industry going?
Contents
Slide 3
Evolution of different business models
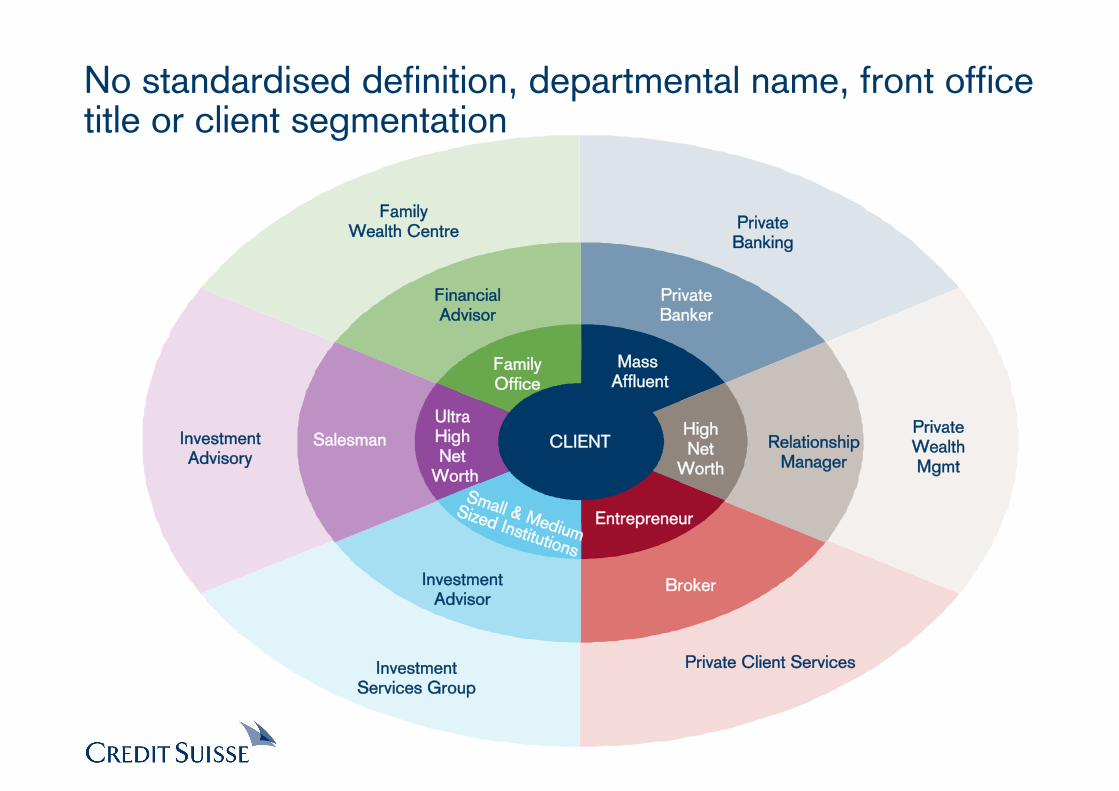
PrivateBanking
PrivateWealthMgmt
Private Client ServicesInvestmentServices Group
InvestmentAdvisory
FamilyWealth Centre
CLIENT
PrivateBanker
RelationshipManager
InvestmentAdvisor
FinancialAdvisor
Salesman
Broker
Mass Affluent
HighNet
Worth
Ultra High Net
Worth
Entrepreneur
FamilyOffice
Small & MediumSized Institutions
No standardised definition, departmental name, front office title or client segmentation
Slide 5
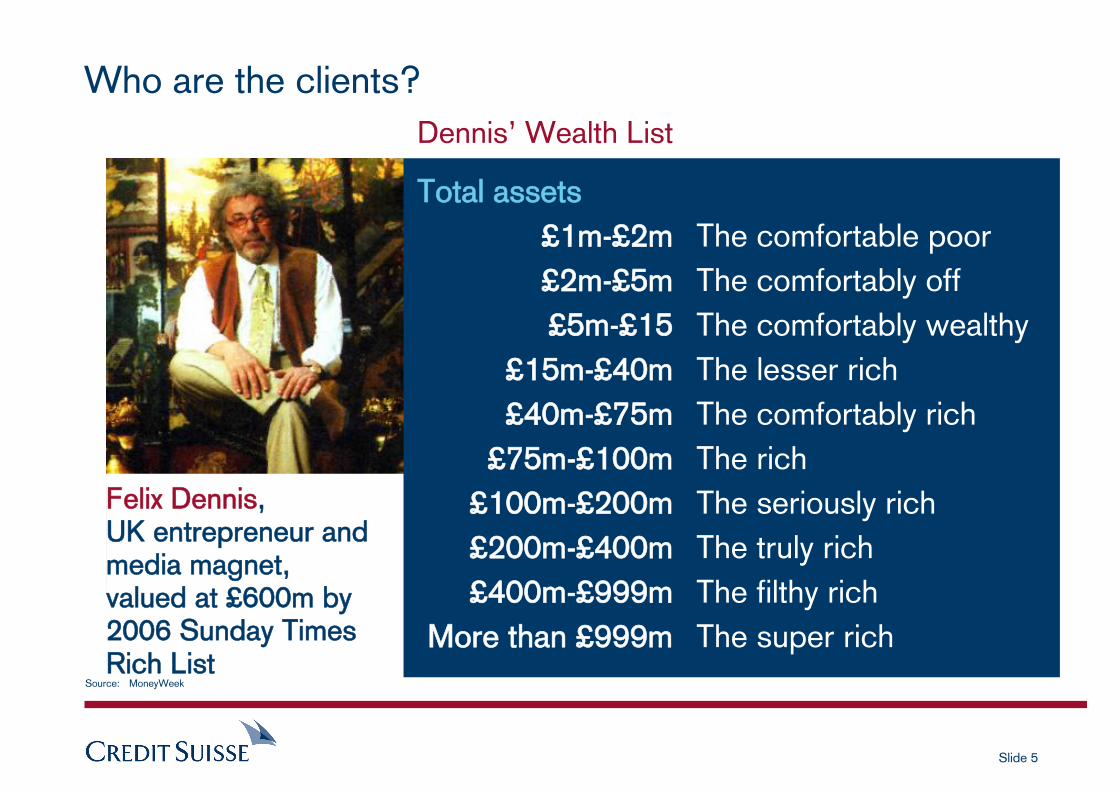
Who are the clients?
Felix Dennis, UK entrepreneur and media magnet, valued at £600m by 2006 Sunday Times Rich List
Total assets£1m-£2m£2m-£5m£5m-£15
£15m-£40m£40m-£75m
£75m-£100m£100m-£200m£200m-£400m£400m-£999m
More than £999m
The comfortable poorThe comfortably offThe comfortably wealthyThe lesser richThe comfortably richThe richThe seriously richThe truly richThe filthy richThe super rich
Dennis’ Wealth List
Source: MoneyWeek
Slide 6
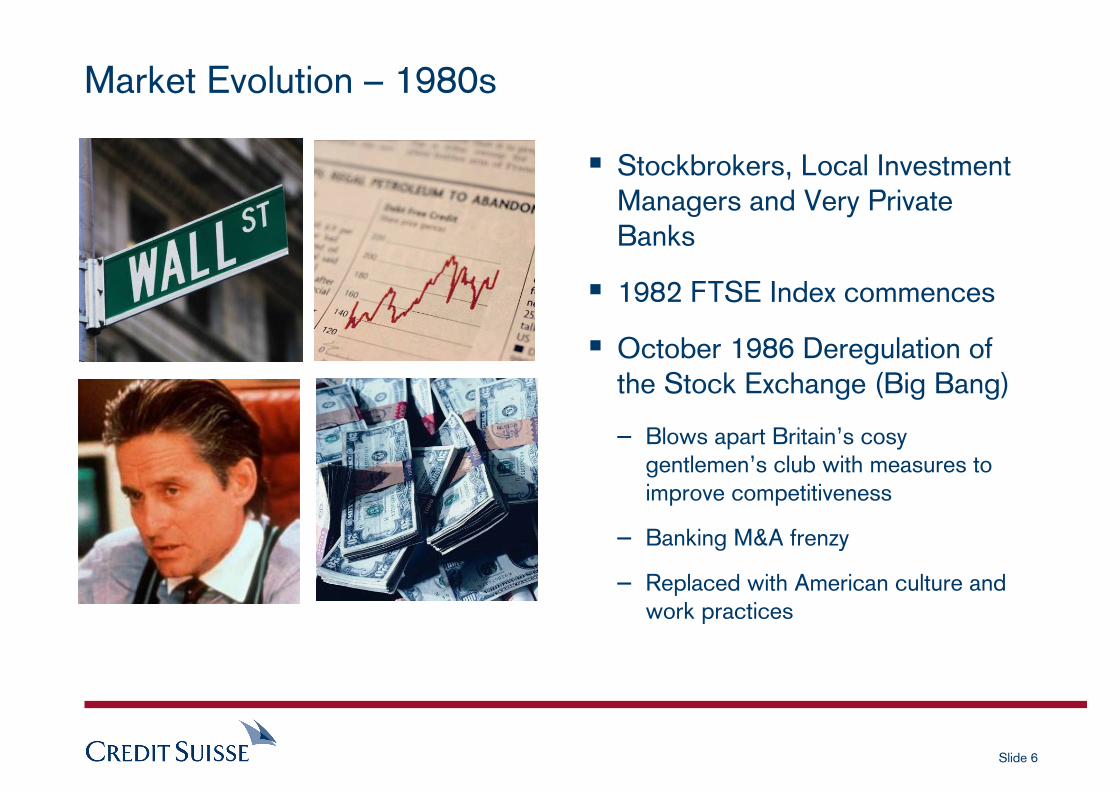
Market Evolution – 1980s
Stockbrokers, Local Investment Managers and Very Private Banks
1982 FTSE Index commences
October 1986 Deregulation of the Stock Exchange (Big Bang)
– Blows apart Britain’s cosy gentlemen’s club with measures to improve competitiveness
– Banking M&A frenzy
– Replaced with American culture and work practices
Slide 7
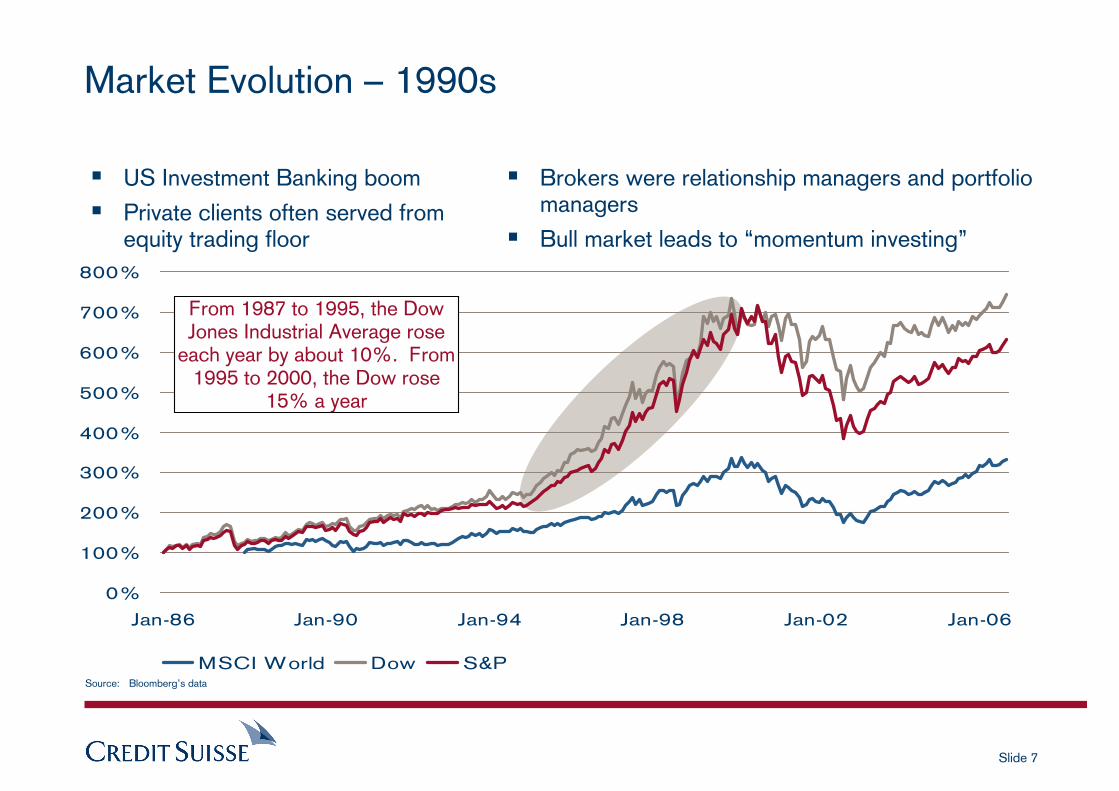
Market Evolution – 1990s
Source: Bloomberg’s data
US Investment Banking boomPrivate clients often served from equity trading floor
Brokers were relationship managers and portfolio managersBull market leads to “momentum investing”
0%
100%
200%
300%
400%
500%
600%
700%
800%
Jan-86 Jan-90 Jan-94 Jan-98 Jan-02 Jan-06
MSCI World Dow S&P
From 1987 to 1995, the Dow Jones Industrial Average rose
each year by about 10%. From 1995 to 2000, the Dow rose
15% a year
Slide 8
0%
100%
200%
300%
400%
500%
600%
700%
800%
Jan-86 Jan-90 Jan-94 Jan-98 Jan-02 Jan-06
MSCI World Dow S&P
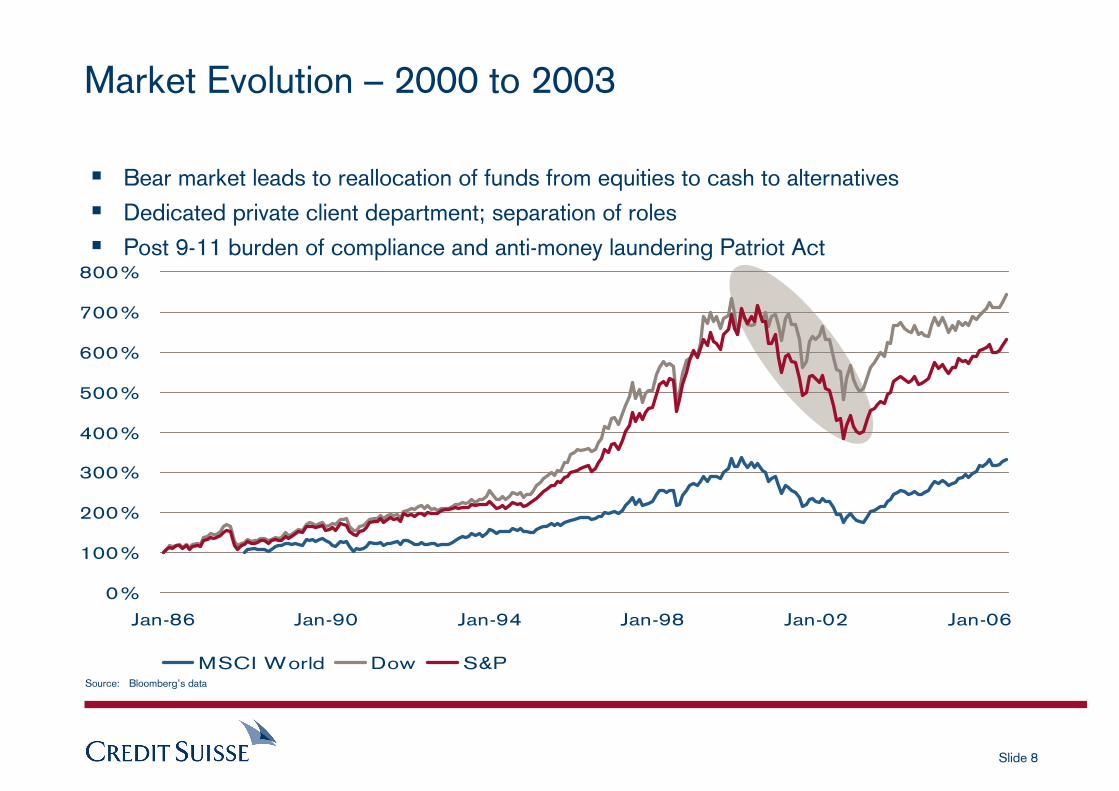
Market Evolution – 2000 to 2003
Source: Bloomberg’s data
Bear market leads to reallocation of funds from equities to cash to alternativesDedicated private client department; separation of rolesPost 9-11 burden of compliance and anti-money laundering Patriot Act
Slide 9
0%
100%
200%
300%
400%
500%
600%
700%
800%
Jan-86 Jan-90 Jan-94 Jan-98 Jan-02 Jan-06
MSCI World Dow S&P
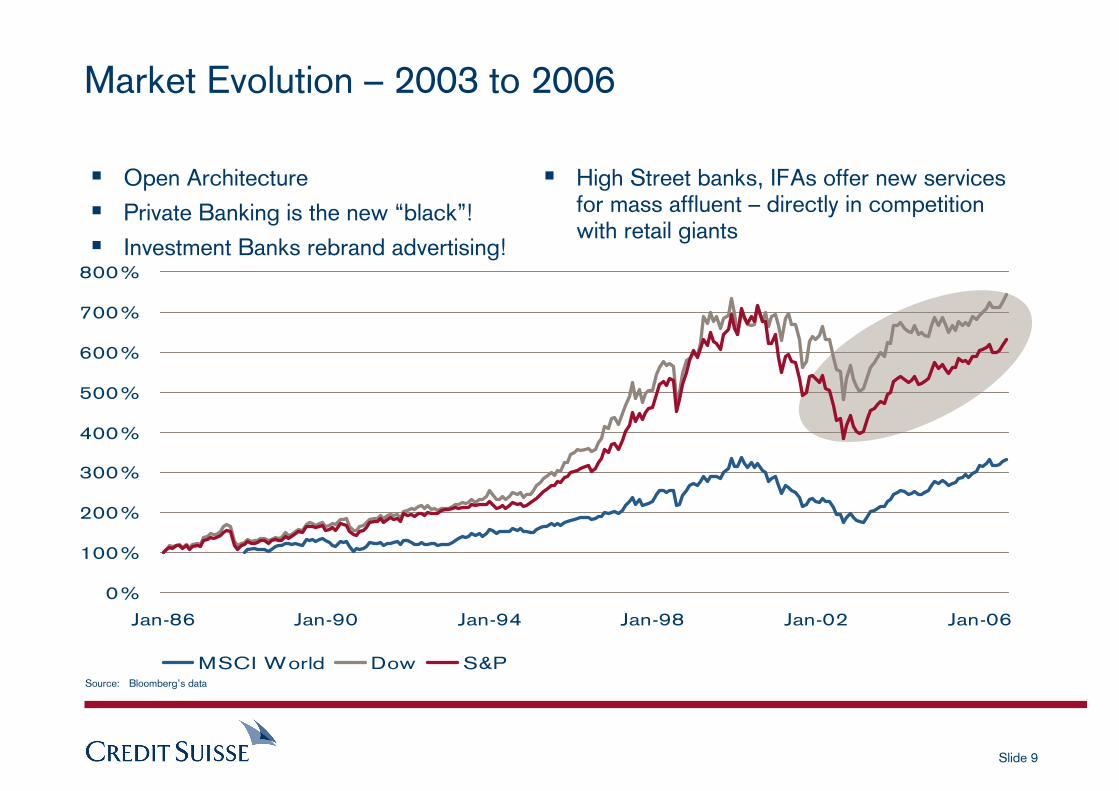
Market Evolution – 2003 to 2006
Source: Bloomberg’s data
Open ArchitecturePrivate Banking is the new “black”!Investment Banks rebrand advertising!
High Street banks, IFAs offer new services for mass affluent – directly in competition with retail giants
Slide 10
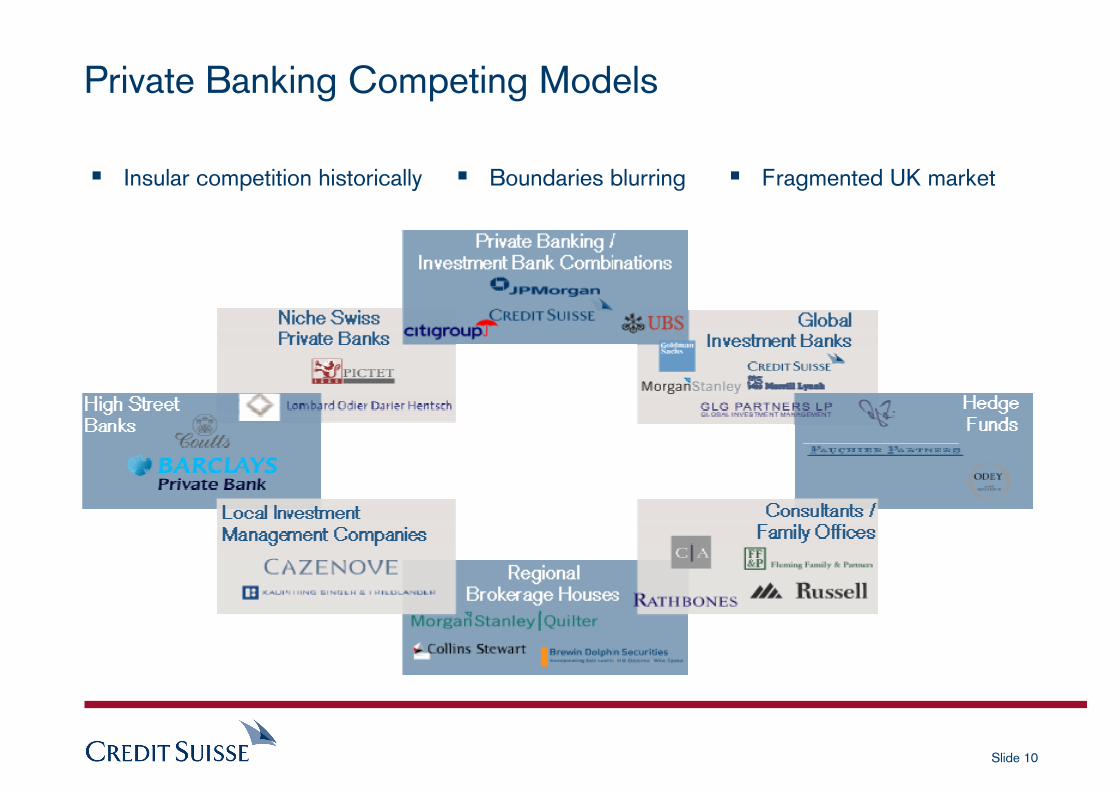
Private Banking Competing Models
Insular competition historically Fragmented UK marketBoundaries blurring

Slide 11
What are clients looking for?
Slide 12
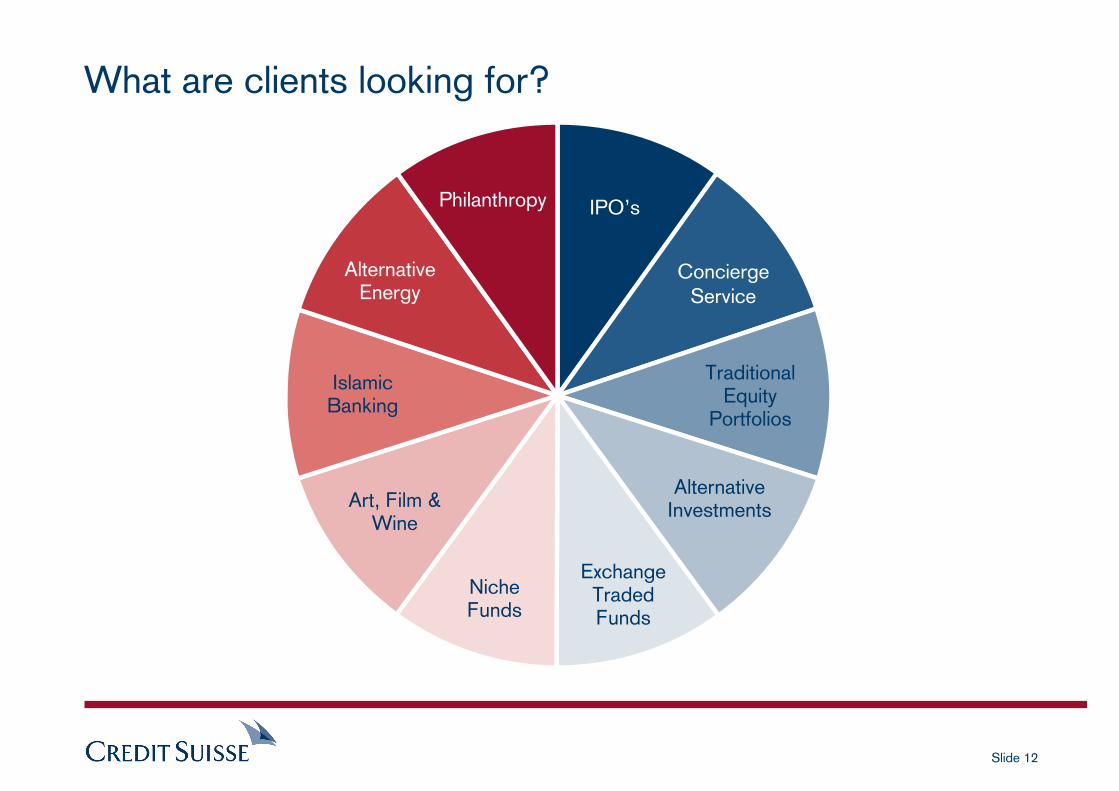
What are clients looking for?
IPO’s
ConciergeService
TraditionalEquity
Portfolios
AlternativeInvestments
ExchangeTradedFunds
NicheFunds
Art, Film & Wine
IslamicBanking
AlternativeEnergy
Philanthropy
Slide 13
IPOs
IPOs fallen out of favour in last 6 months
Decline in new LSE admissions and several large floats pulled
What has gone wrong?
– Overloaded investment banking pipeline
– Too many private equity firms seeking to exit
– Erratic performance: Clipper Windpower, Kazakymys 888, Qinetiq
– Hedge funds are the new flippers
– Lack of traditional equity demand
– Real action on the Alternative Investment Market (AIM) - where as August this year there had been 298 floatations
Changing face of Exchanges worldwide
Slide 14
Concierge Service
Clients are no longer looking for an “old-school concierge” service from their Private BankFocus on investment opportunities rather than sporting events, theatre tickets and hotel bookings Dedicated concierge services outside of Private Banks have sprung up to cater to this cash rich, time poor clientele
“New concierge” means offering the right products and services– Deepening client relationships is all about flexibility and how you perceive the
gate-keeper role
Slide 15
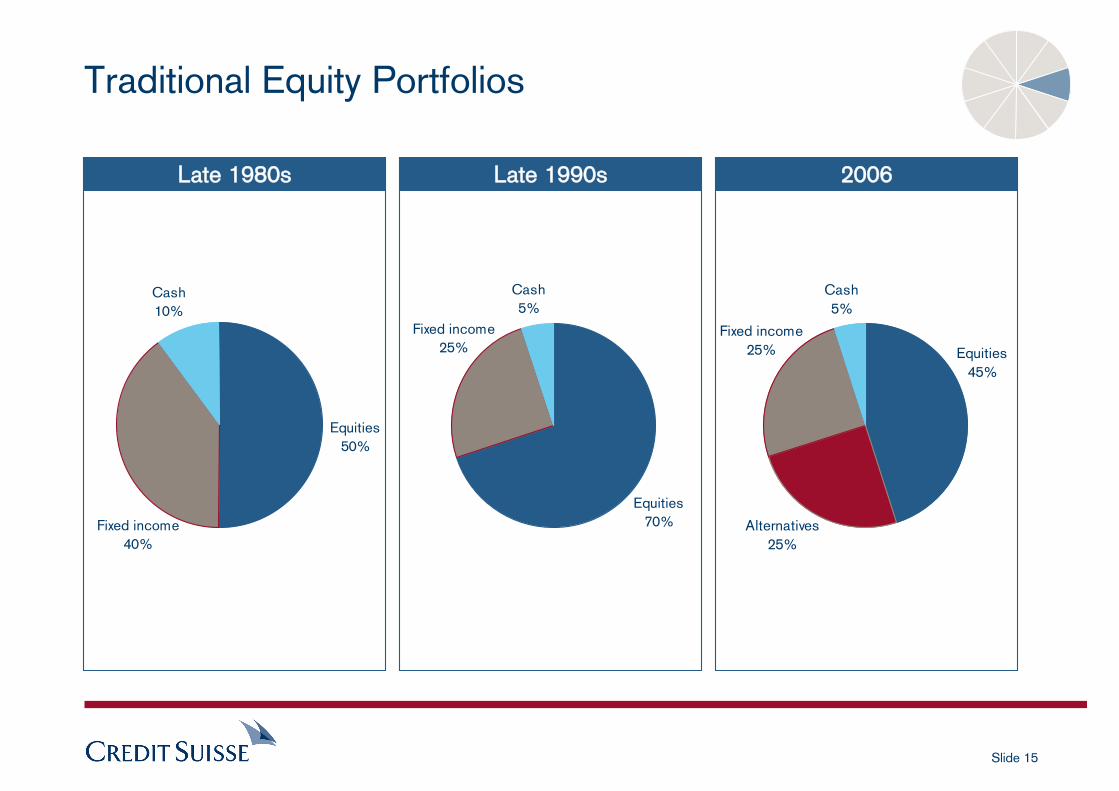
Traditional Equity Portfolios
Late 1990sLate 1980s 2006
Cash5%
Equities70%
Fixed income25%
Cash5%
Equities45%
Fixed income25%
Alternatives25%
Cash10%
Fixed income40%
Equities50%
Slide 16
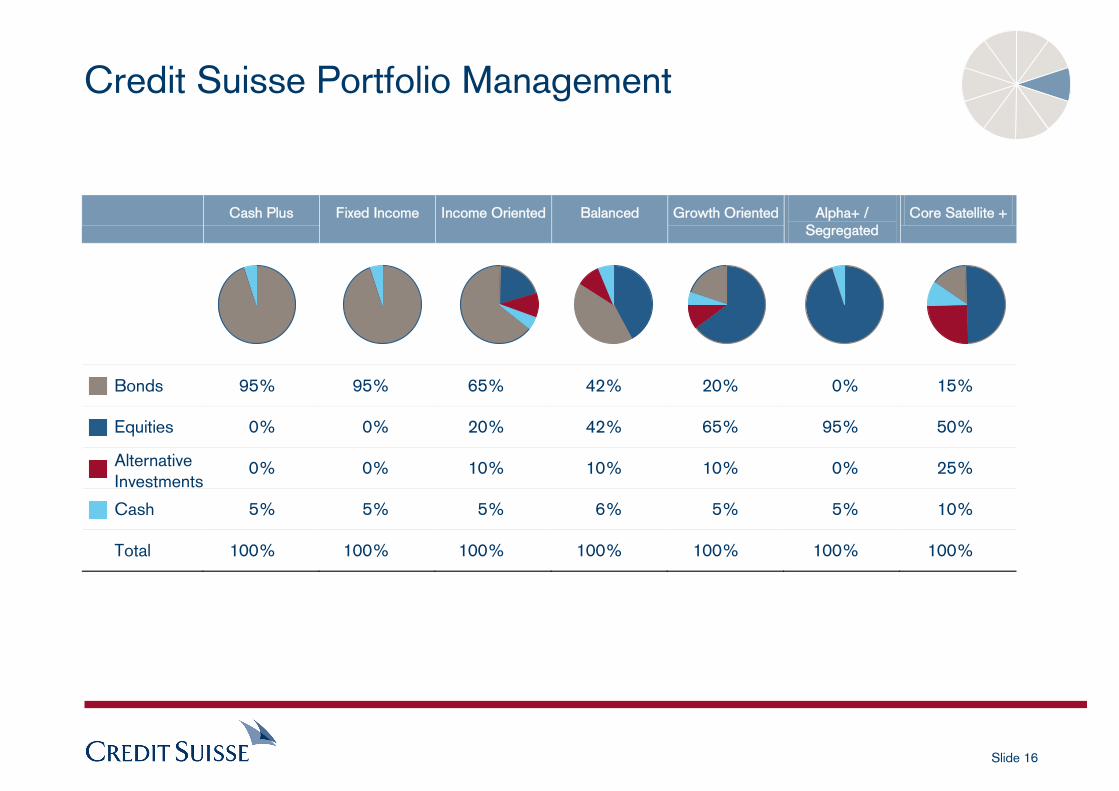
Credit Suisse Portfolio Management
Cash Plus Fixed Income Income Oriented Balanced Growth Oriented Alpha+ / Segregated
Core Satellite +
Bonds 95% 95% 65% 42% 20% 0% 15%
Equities 0% 0% 20% 42% 65% 95% 50%
Alternative Investments
0% 0% 10% 10% 10% 0% 25%
Cash 5% 5% 5% 6% 5% 5% 10%
Total 100% 100% 100% 100% 100% 100% 100%
Slide 17
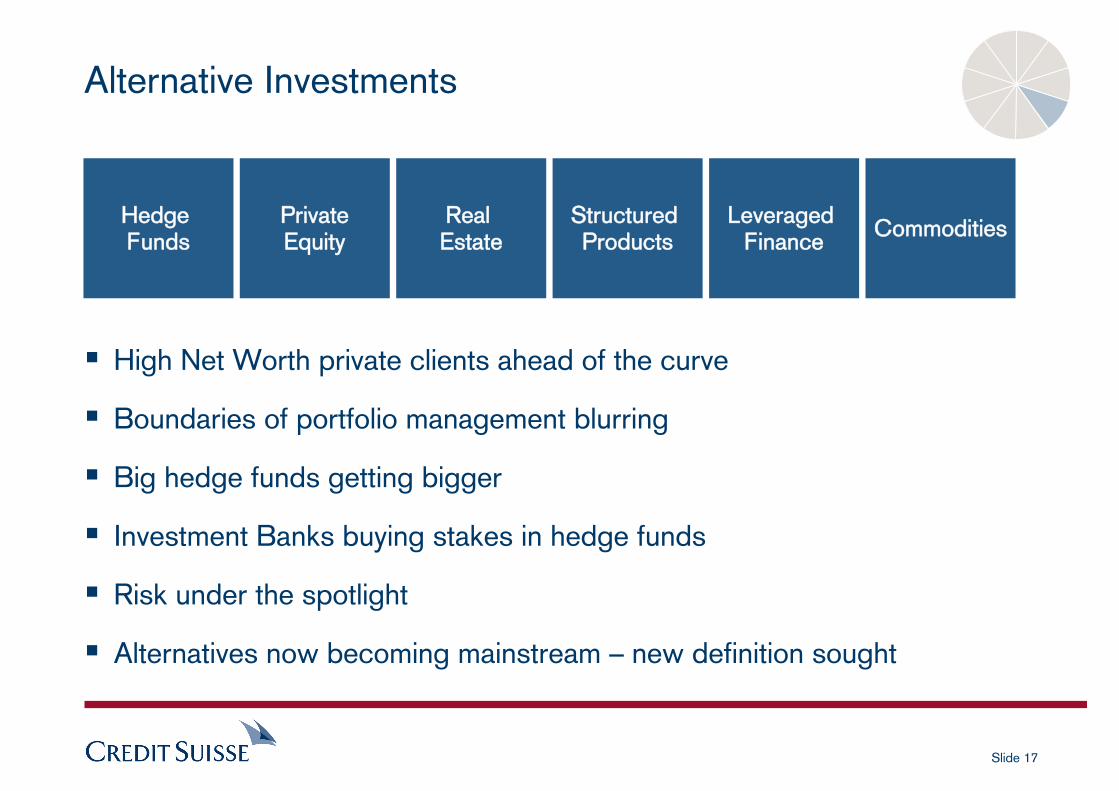
Alternative Investments
Hedge Funds
PrivateEquity
Real Estate
Structured Products
Leveraged Finance Commodities
High Net Worth private clients ahead of the curve
Boundaries of portfolio management blurring
Big hedge funds getting bigger
Investment Banks buying stakes in hedge funds
Risk under the spotlight
Alternatives now becoming mainstream – new definition sought
Slide 18
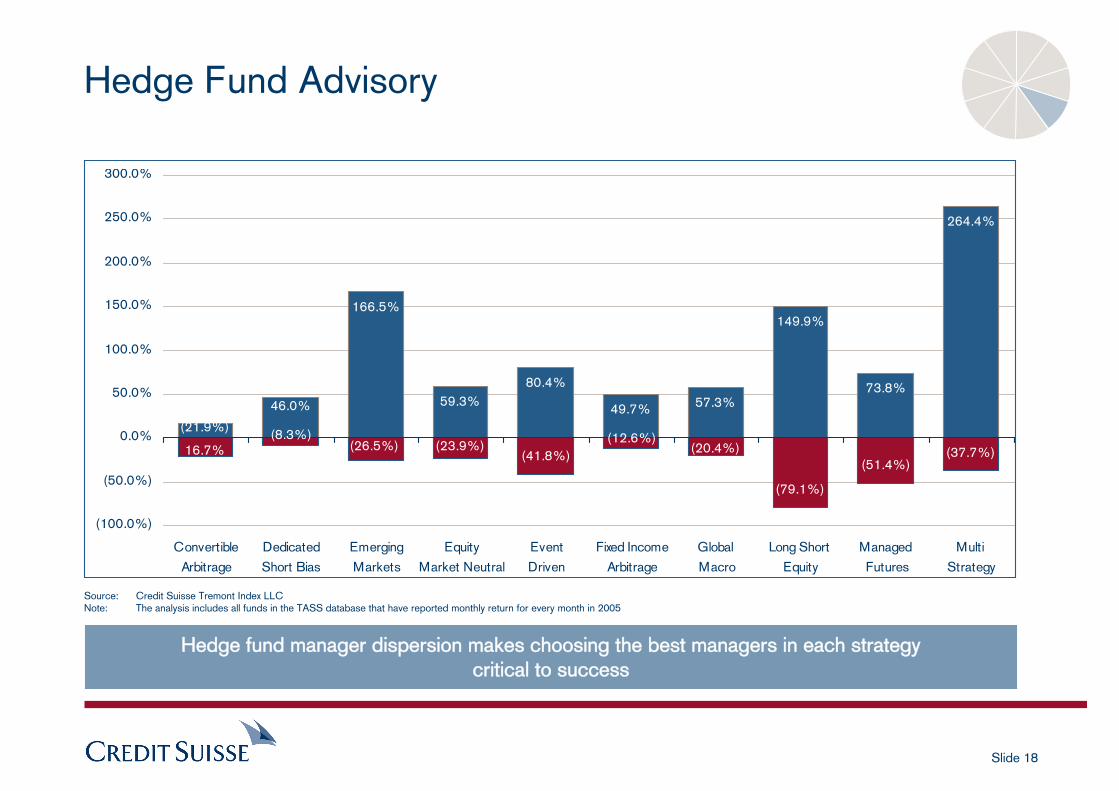
Hedge Fund Advisory
(41.8%)
(79.1%)
(51.4%)(37.7%)
166.5%
59.3%80.4%
49.7% 57.3%
149.9%
73.8%
264.4%
(8.3%)(21.9%)
(20.4%)(12.6%)(26.5%) (23.9%)
46.0%
16.7%
(100.0%)
(50.0%)
0.0%
50.0%
100.0%
150.0%
200.0%
250.0%
300.0%
Convertible
Arbitrage
Dedicated
Short Bias
Emerging
Markets
Equity
Market Neutral
Event
Driven
Fixed Income
Arbitrage
Global
Macro
Long Short
Equity
Managed
Futures
Multi
Strategy
Source: Credit Suisse Tremont Index LLCNote: The analysis includes all funds in the TASS database that have reported monthly return for every month in 2005
Hedge fund manager dispersion makes choosing the best managers in each strategycritical to success
Slide 19
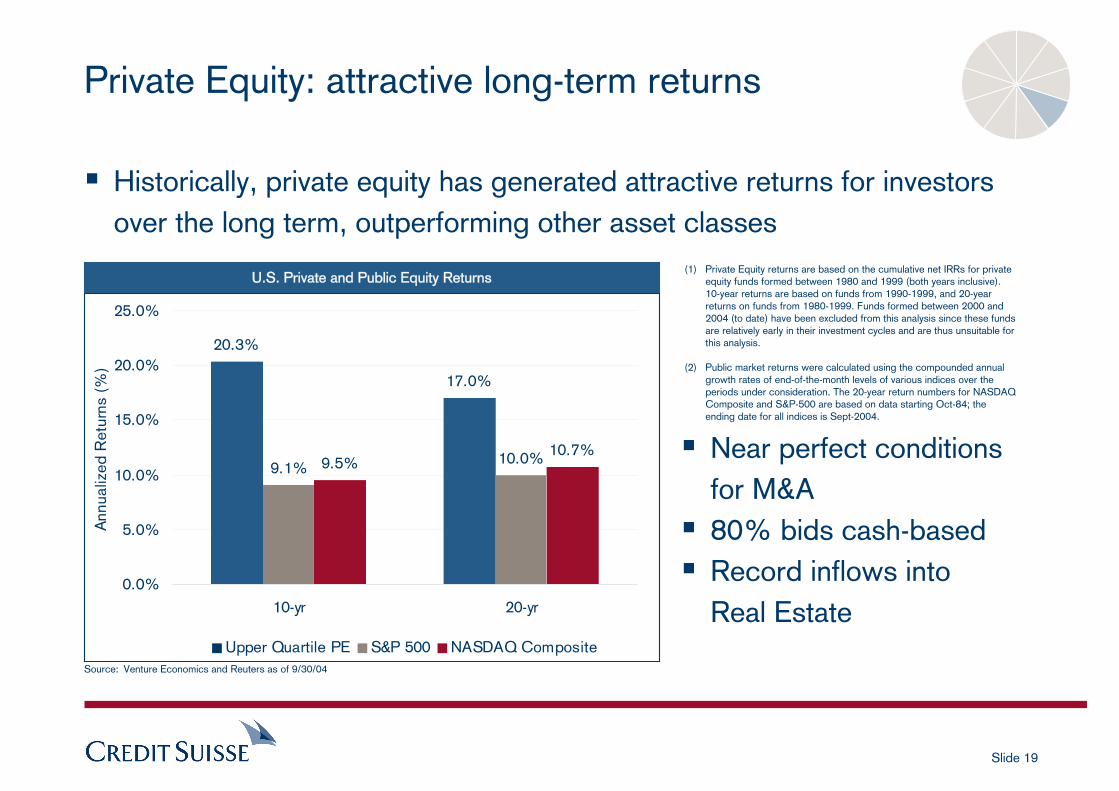
20.3%
17.0%
9.1%10.0%9.5%
10.7%
0.0%
5.0%
10.0%
15.0%
20.0%
25.0%
10-yr 20-yr
Ann
ualiz
ed R
etur
ns (
%)
Upper Quartile PE S&P 500 NASDAQ Composite
Private Equity: attractive long-term returns
Historically, private equity has generated attractive returns for investors over the long term, outperforming other asset classes
Source: Venture Economics and Reuters as of 9/30/04
(1) Private Equity returns are based on the cumulative net IRRs for private equity funds formed between 1980 and 1999 (both years inclusive). 10-year returns are based on funds from 1990-1999, and 20-year returns on funds from 1980-1999. Funds formed between 2000 and 2004 (to date) have been excluded from this analysis since these funds are relatively early in their investment cycles and are thus unsuitable for this analysis.
(2) Public market returns were calculated using the compounded annual growth rates of end-of-the-month levels of various indices over the periods under consideration. The 20-year return numbers for NASDAQ Composite and S&P-500 are based on data starting Oct-84; the ending date for all indices is Sept-2004.
U.S. Private and Public Equity Returns
Near perfect conditions for M&A80% bids cash-basedRecord inflows into Real Estate
Slide 20
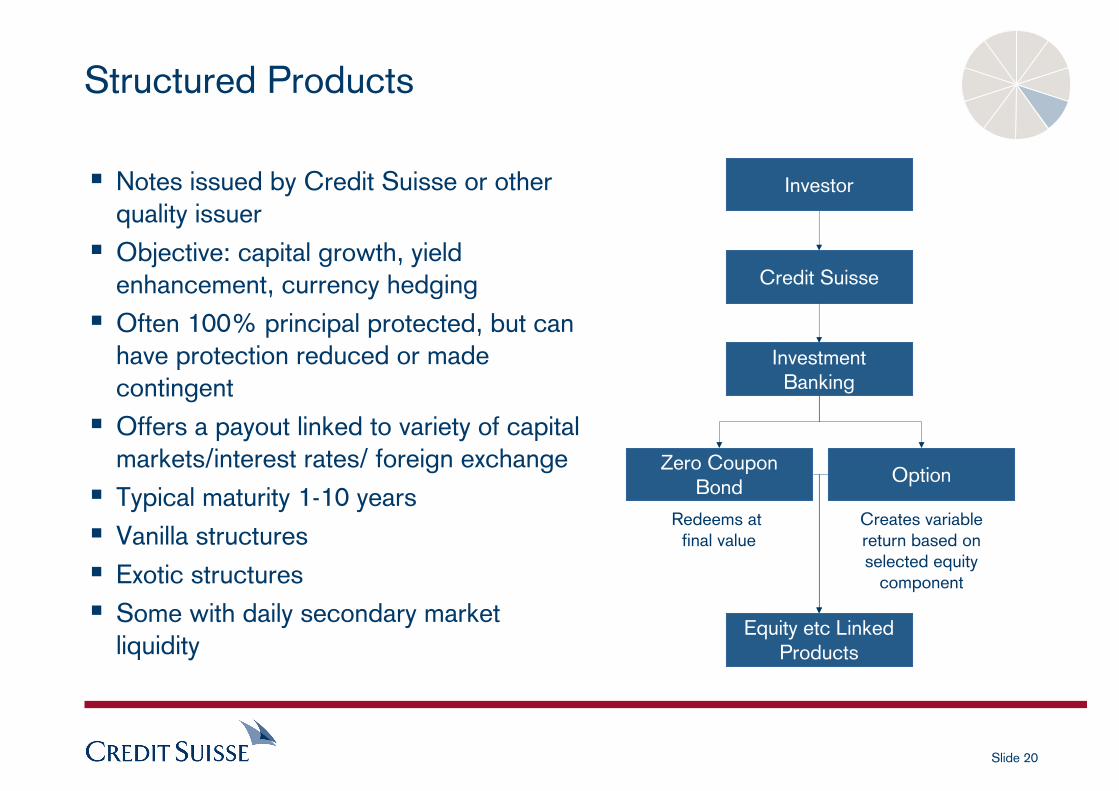
Structured Products
Notes issued by Credit Suisse or other quality issuerObjective: capital growth, yield enhancement, currency hedgingOften 100% principal protected, but can have protection reduced or made contingentOffers a payout linked to variety of capital markets/interest rates/ foreign exchangeTypical maturity 1-10 yearsVanilla structuresExotic structuresSome with daily secondary market liquidity
Investor
Credit Suisse
InvestmentBanking
Equity etc LinkedProducts
Zero Coupon Bond
Redeems at final value
Option
Creates variablereturn based onselected equity
component
Slide 21
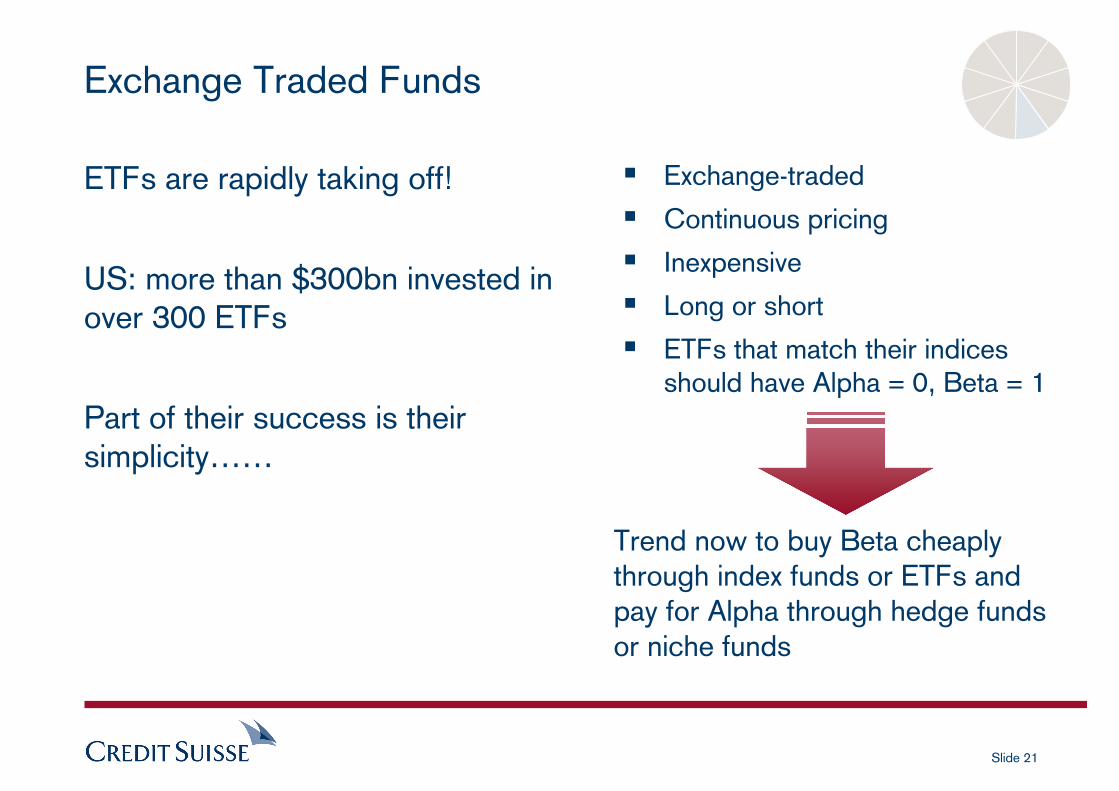
Exchange Traded Funds
ETFs are rapidly taking off!
US: more than $300bn invested in over 300 ETFs
Part of their success is their simplicity……
Trend now to buy Beta cheaply through index funds or ETFs and pay for Alpha through hedge funds or niche funds
Exchange-traded
Continuous pricing
Inexpensive
Long or short
ETFs that match their indices should have Alpha = 0, Beta = 1
Slide 22
Niche Funds
Decline in appetite for traditional portfolio management has not led to the death of fund management
Explosion in niche funds by boutiques
Investment refocus to multi-manager funds
The hardest issue for clients is:
– How to find these managers
– How to separate the “stars” from the “dogs”
– How to be convinced that the management are incentivized enough to continually
ensure stellar performances, post fees!
_P O L A R _ T H A M E S R I V E R _ B D T _ A R T E M I S _ F I N D L A Y P A R K _ T H A M E S R I V ER
Slide 23
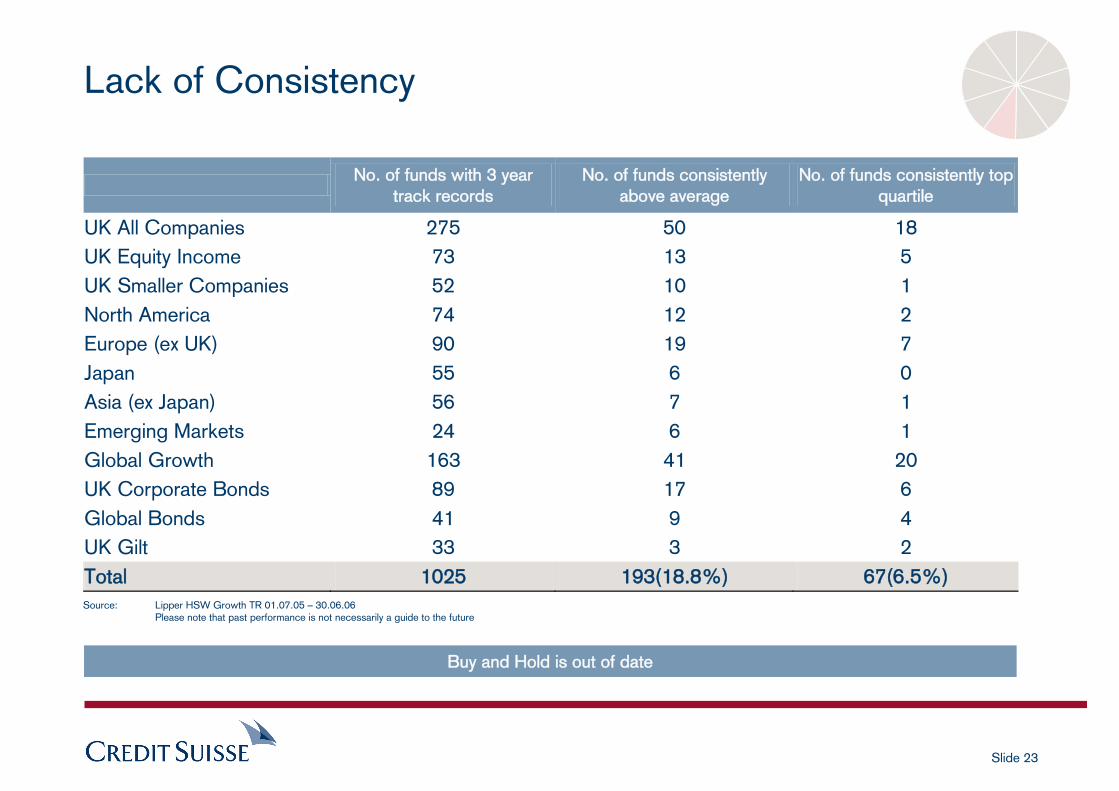
Lack of Consistency
Source: Lipper HSW Growth TR 01.07.05 – 30.06.06 Please note that past performance is not necessarily a guide to the future
No. of funds with 3 year
track records No. of funds consistently
above average No. of funds consistently top
quartile
UK All Companies 275 50 18 UK Equity Income 73 13 5 UK Smaller Companies 52 10 1 North America 74 12 2 Europe (ex UK) 90 19 7 Japan 55 6 0 Asia (ex Japan) 56 7 1 Emerging Markets 24 6 1 Global Growth 163 41 20 UK Corporate Bonds 89 17 6 Global Bonds 41 9 4 UK Gilt 33 3 2 Total 1025 193(18.8%) 67(6.5%)
Buy and Hold is out of date
Slide 24
Art, Film & Wine
Deemed alternative but not quite institutionalized yet
Four factors are worth noting overall
i. The perpetual desire for new investment opportunities
ii. Volatile risk/return metrics
iii. The rise of Asian and Emerging European wealth affecting supply/demand
iv. The emergence of private equity and hedge fund involvement

Slide 25
Art
Record sales in Asian art due to new wealth creation
– China: 300,000 millionaires
– Singapore, Taiwan and Hong Kong: 170,000 millionaires
As well as many savvy non-Asian buyers
– At Christie’s Hong Kong, a 14th-century Ming porcelain vase sold for a
record $10.2m to the American gambling magnate, Steve Wynn
– London has just hosted the fourth annual contemporary Frieze Art fair
UBS closed Art Banking
Slide 26
Film
Tightening of attractive UK tax breaks
Studios need more capital
– as the average cost of a film is now around $75m, with a studio releasing 8-16 films a
year
Hedge funds and private equity know this and evaluate film production “slates” in a similar way to investing in a basket of stocks
Paramount struck a $300m financing deal with Dresdner Kleinwort
Variable returns depending on box-office “hit” or “dud”
CS: Brass Hats, Ingenious Media
Slide 27
Wine
One of the hottest non-traditional investment commodities
The Bordeaux 2005 is being touted as the “vintage of the century”
– According to the London International Vitners’ Exchange, the price of
Chateau Petrus 1998 surged 86% from £8,230 last July to £16,150
– Premier Cru Fine Wine Investment: £10,000 invested in January 1990
would be worth today £90,000, compared with the meager return of
£40,000 on an All Share Index Tracker
– In Vino Veritas!
Chateaux Lafite, Chateaux Mouton-Rothschild,
Chateaux Latour, Chateaux Haut-Brion
– DTI closed 18 wine investment funds
Slide 28
Islamic Banking
Koran prohibits “gharar” (financial speculation or risk taking) Koran prohibits “riba” (interest or extortionate interest)
Islamic sentiment has risen fuelled by
– geopolitical events, Middle East oil boom, infrastructure frenzy
“Sharia” (Islamic Law) compliant investment boom
Emergence of “Sukuks” (Islamic bonds)
HSBC & Lloyds TSB offer Islamic mortgages
Islamic Bank of Britain just launched the first compliant savings account
Credit Suisse: Trade Finance and Sukuks
Slide 29
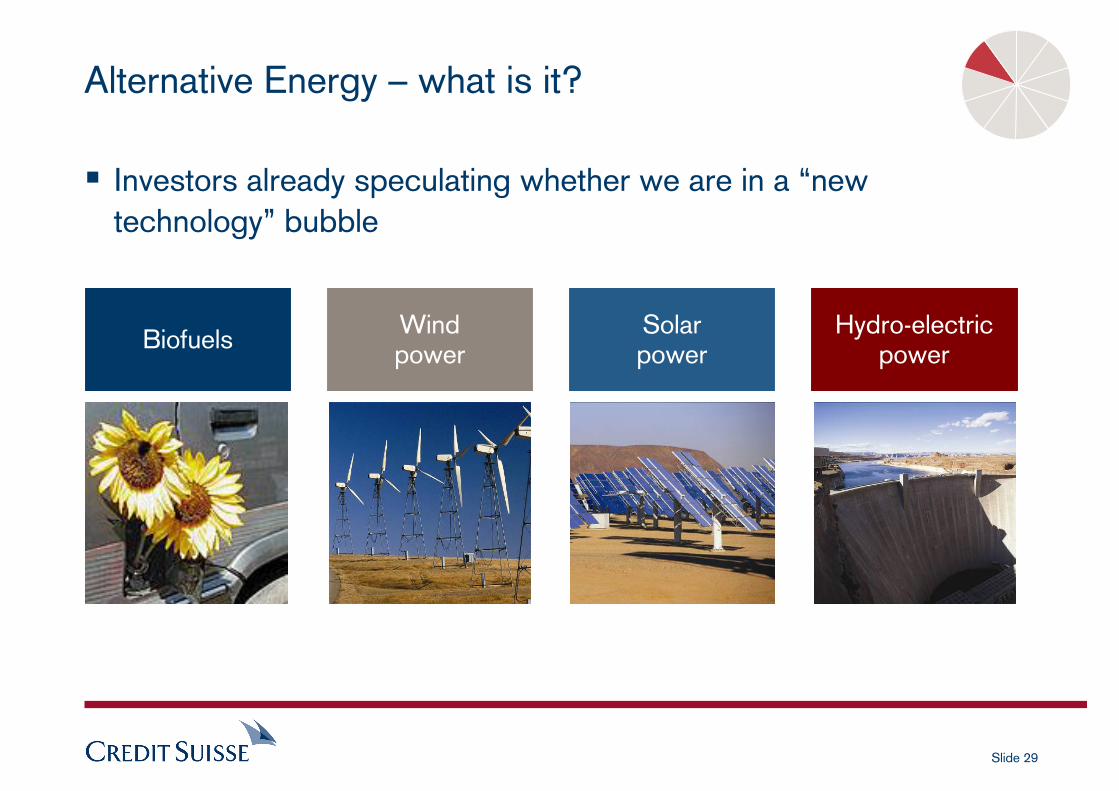
Alternative Energy – what is it?
Biofuels Wind power
Solar power
Hydro-electric power
Investors already speculating whether we are in a “new technology” bubble
Slide 30
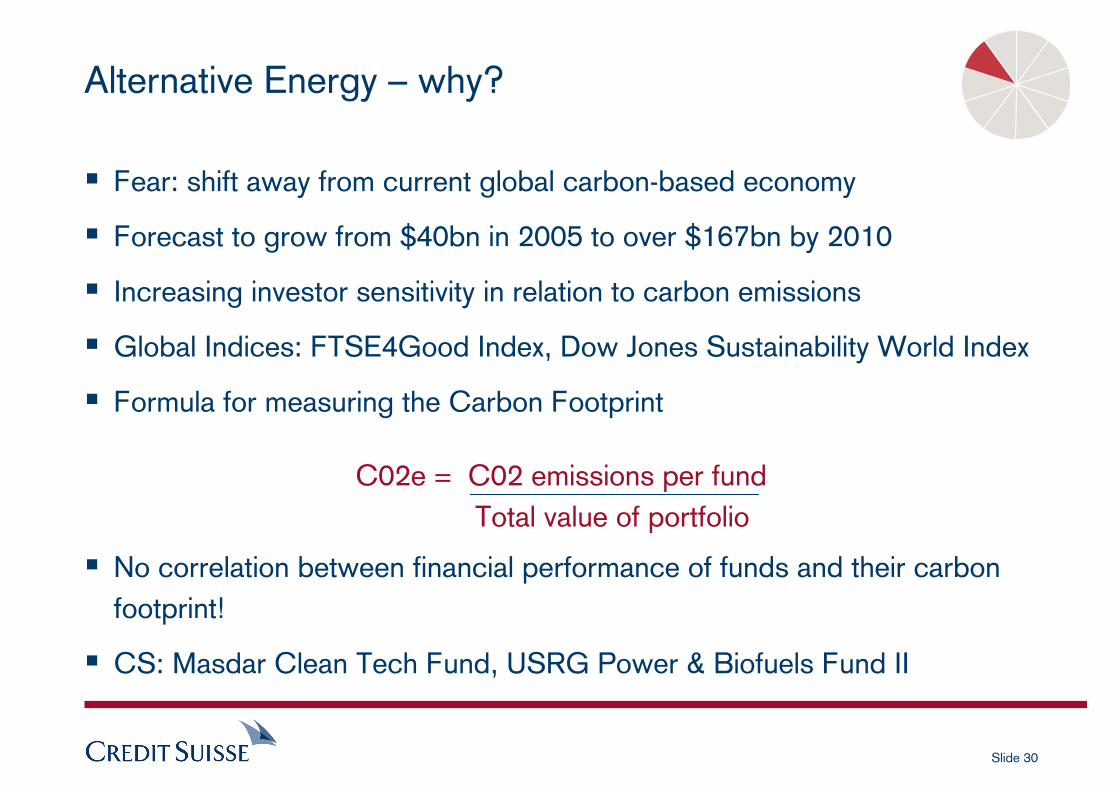
Fear: shift away from current global carbon-based economy
Forecast to grow from $40bn in 2005 to over $167bn by 2010
Increasing investor sensitivity in relation to carbon emissions
Global Indices: FTSE4Good Index, Dow Jones Sustainability World Index
Formula for measuring the Carbon Footprint
No correlation between financial performance of funds and their carbon footprint!
CS: Masdar Clean Tech Fund, USRG Power & Biofuels Fund II
Alternative Energy – why?
C02e = C02 emissions per fundTotal value of portfolio
Slide 31
Slide 32
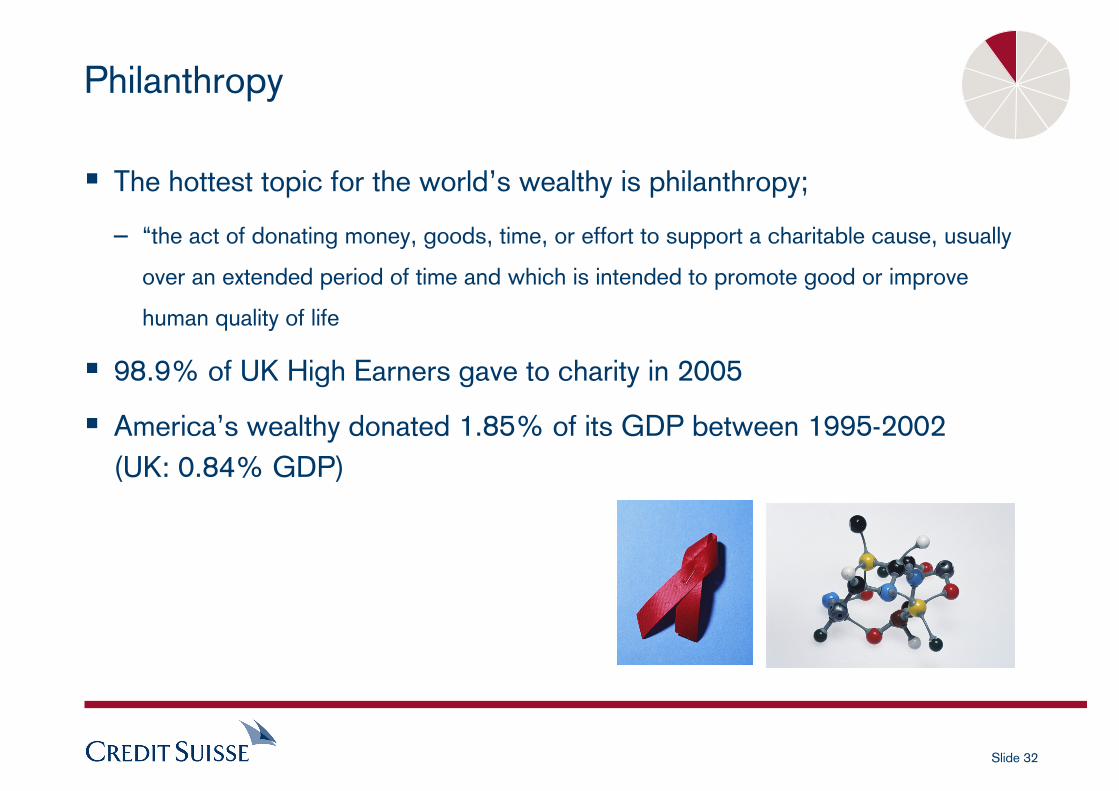
Philanthropy
The hottest topic for the world’s wealthy is philanthropy;
– “the act of donating money, goods, time, or effort to support a charitable cause, usually
over an extended period of time and which is intended to promote good or improve
human quality of life
98.9% of UK High Earners gave to charity in 2005
America’s wealthy donated 1.85% of its GDP between 1995-2002 (UK: 0.84% GDP)
Slide 33
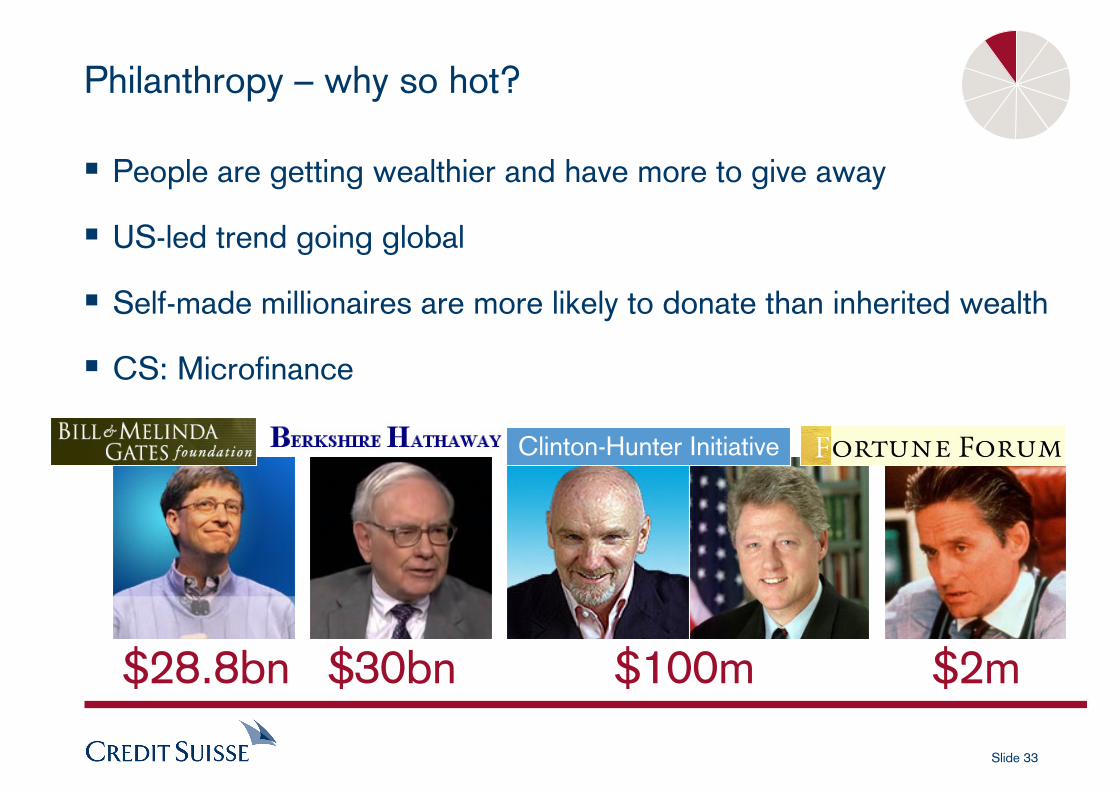
Philanthropy – why so hot?
People are getting wealthier and have more to give away
US-led trend going global
Self-made millionaires are more likely to donate than inherited wealth
CS: Microfinance
$28.8bn
Clinton-Hunter Initiative
$30bn $100m $2m

Slide 34
Delivering the promise
Slide 35
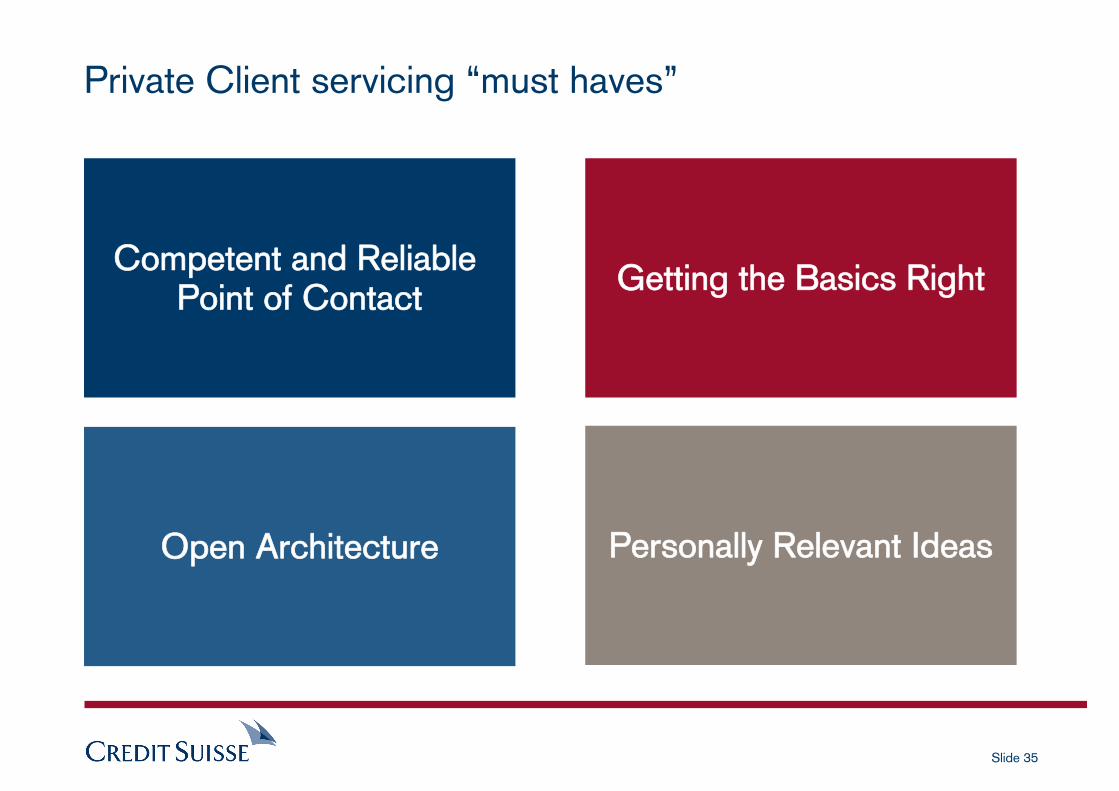
Private Client servicing “must haves”
Competent and Reliable Point of Contact
Open Architecture
Getting the Basics Right
Personally Relevant Ideas
Slide 36
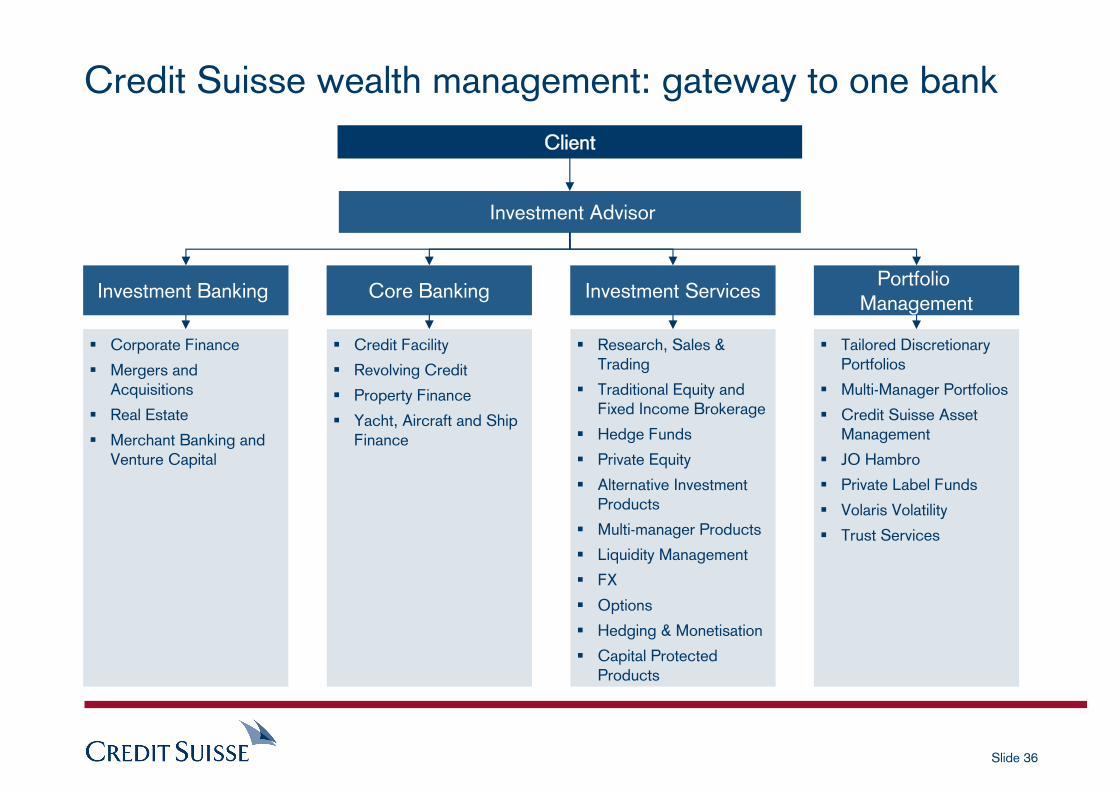
Credit Suisse wealth management: gateway to one bank
Credit Facility
Revolving Credit
Property Finance
Yacht, Aircraft and Ship Finance
Tailored Discretionary Portfolios
Multi-Manager Portfolios
Credit Suisse Asset Management
JO Hambro
Private Label Funds
Volaris Volatility
Trust Services
Research, Sales & Trading
Traditional Equity and Fixed Income Brokerage
Hedge Funds
Private Equity
Alternative Investment Products
Multi-manager Products
Liquidity Management
FX
Options
Hedging & Monetisation
Capital Protected Products
Core BankingPortfolio
ManagementInvestment Services
Client
Corporate Finance
Mergers and Acquisitions
Real Estate
Merchant Banking and Venture Capital
Investment Banking
Investment Advisor
Slide 37
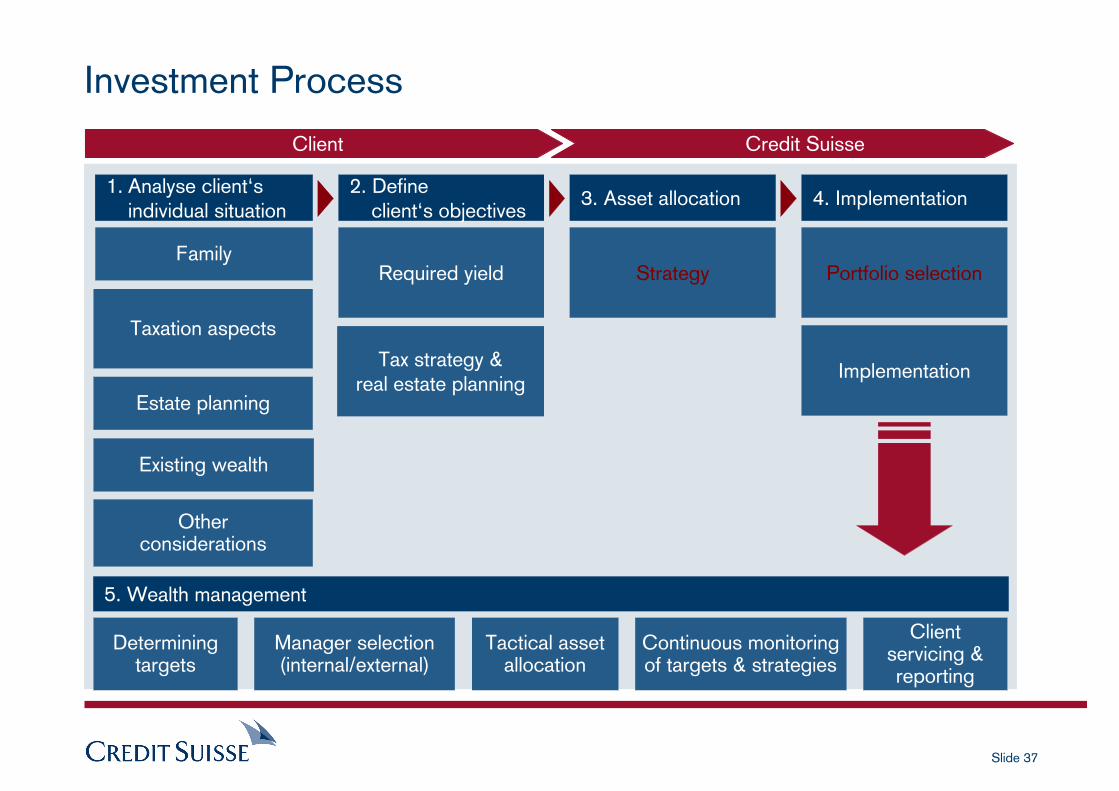
Investment Process
Family
1. Analyse client‘sindividual situation
Required yield
2. Defineclient‘s objectives
Portfolio selection
4. Implementation
5. Wealth management
Strategy
3. Asset allocation
Taxation aspects
Estate planning
Existing wealth
Otherconsiderations
Tax strategy & real estate planning
Implementation
Determiningtargets
Manager selection(internal/external)
Tactical assetallocation
Continuous monitoringof targets & strategies
Client servicing & reporting
Client Credit Suisse
Slide 38
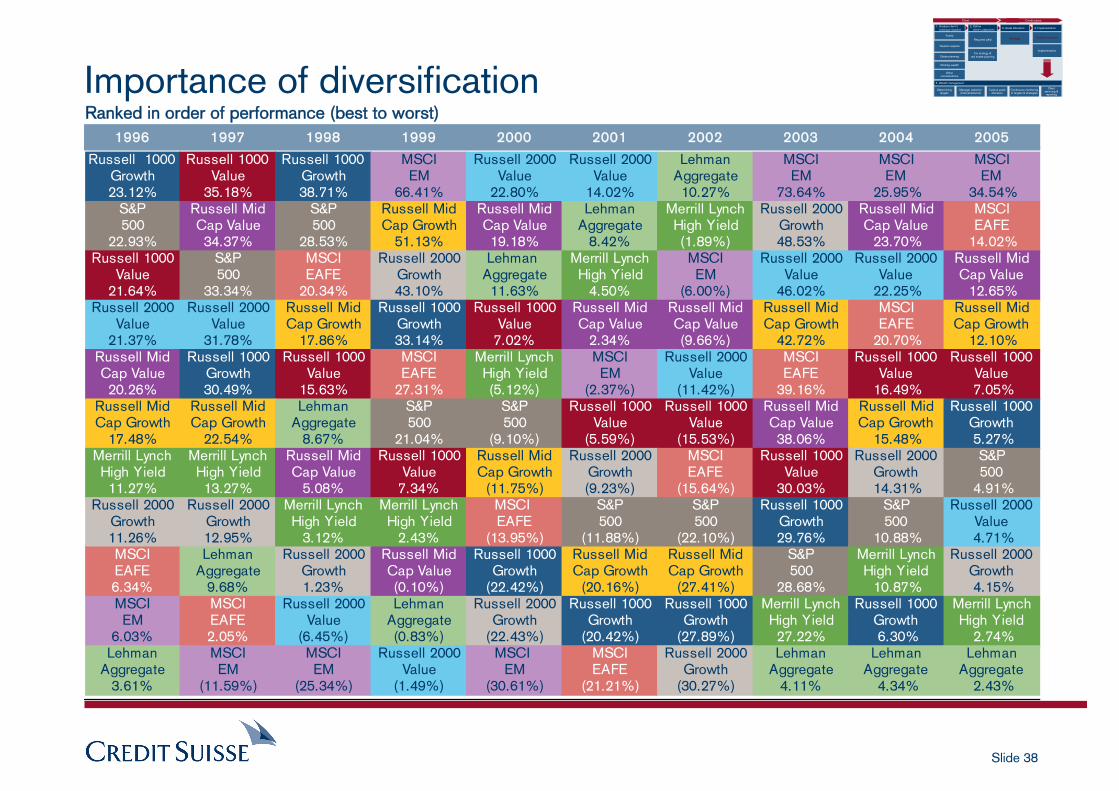
Importance of diversification1996 1997 1998 1999 2000 2001 2002 2003 2004 2005
Russell 1000 Russell 1000 Russell 1000 MSCI Russell 2000 Russell 2000 Lehman MSCI MSCI MSCIGrowth Value Growth EM Value Value Aggregate EM EM EM23.12% 35.18% 38.71% 66.41% 22.80% 14.02% 10.27% 73.64% 25.95% 34.54%
S&P Russell Mid S&P Russell Mid Russell Mid Lehman Merrill Lynch Russell 2000 Russell Mid MSCI500 Cap Value 500 Cap Growth Cap Value Aggregate High Yield Growth Cap Value EAFE
22.93% 34.37% 28.53% 51.13% 19.18% 8.42% (1.89%) 48.53% 23.70% 14.02% Russell 1000 S&P MSCI Russell 2000 Lehman Merrill Lynch MSCI Russell 2000 Russell 2000 Russell Mid
Value 500 EAFE Growth Aggregate High Yield EM Value Value Cap Value21.64% 33.34% 20.34% 43.10% 11.63% 4.50% (6.00%) 46.02% 22.25% 12.65%
Russell 2000 Russell 2000 Russell Mid Russell 1000 Russell 1000 Russell Mid Russell Mid Russell Mid MSCI Russell MidValue Value Cap Growth Growth Value Cap Value Cap Value Cap Growth EAFE Cap Growth
21.37% 31.78% 17.86% 33.14% 7.02% 2.34% (9.66%) 42.72% 20.70% 12.10% Russell Mid Russell 1000 Russell 1000 MSCI Merrill Lynch MSCI Russell 2000 MSCI Russell 1000 Russell 1000Cap Value Growth Value EAFE High Yield EM Value EAFE Value Value20.26% 30.49% 15.63% 27.31% (5.12%) (2.37%) (11.42%) 39.16% 16.49% 7.05%
Russell Mid Russell Mid Lehman S&P S&P Russell 1000 Russell 1000 Russell Mid Russell Mid Russell 1000Cap Growth Cap Growth Aggregate 500 500 Value Value Cap Value Cap Growth Growth
17.48% 22.54% 8.67% 21.04% (9.10%) (5.59%) (15.53%) 38.06% 15.48% 5.27% Merrill Lynch Merrill Lynch Russell Mid Russell 1000 Russell Mid Russell 2000 MSCI Russell 1000 Russell 2000 S&PHigh Yield High Yield Cap Value Value Cap Growth Growth EAFE Value Growth 50011.27% 13.27% 5.08% 7.34% (11.75%) (9.23%) (15.64%) 30.03% 14.31% 4.91%
Russell 2000 Russell 2000 Merrill Lynch Merrill Lynch MSCI S&P S&P Russell 1000 S&P Russell 2000Growth Growth High Yield High Yield EAFE 500 500 Growth 500 Value11.26% 12.95% 3.12% 2.43% (13.95%) (11.88%) (22.10%) 29.76% 10.88% 4.71% MSCI Lehman Russell 2000 Russell Mid Russell 1000 Russell Mid Russell Mid S&P Merrill Lynch Russell 2000EAFE Aggregate Growth Cap Value Growth Cap Growth Cap Growth 500 High Yield Growth6.34% 9.68% 1.23% (0.10%) (22.42%) (20.16%) (27.41%) 28.68% 10.87% 4.15% MSCI MSCI Russell 2000 Lehman Russell 2000 Russell 1000 Russell 1000 Merrill Lynch Russell 1000 Merrill LynchEM EAFE Value Aggregate Growth Growth Growth High Yield Growth High Yield
6.03% 2.05% (6.45%) (0.83%) (22.43%) (20.42%) (27.89%) 27.22% 6.30% 2.74% Lehman MSCI MSCI Russell 2000 MSCI MSCI Russell 2000 Lehman Lehman Lehman
Aggregate EM EM Value EM EAFE Growth Aggregate Aggregate Aggregate3.61% (11.59%) (25.34%) (1.49%) (30.61%) (21.21%) (30.27%) 4.11% 4.34% 2.43%
Ranked in order of performance (best to worst)
Family
1. Analyse client‘sindividual situation
Required yield
2. Defineclient‘s objectives
Portfolio selection
4. Implementation
5. Wealth management
Strategy
3. Asset allocation
Taxation aspects
Estate planning
Existing wealth
Otherconsiderations
Tax strategy & real estate planning
Implementation
Determiningtargets
Manager selection(internal/external)
Tactical assetallocation
Continuous monitoringof targets & strategies
Client servicing & reporting
Client Credit suisse
Slide 39
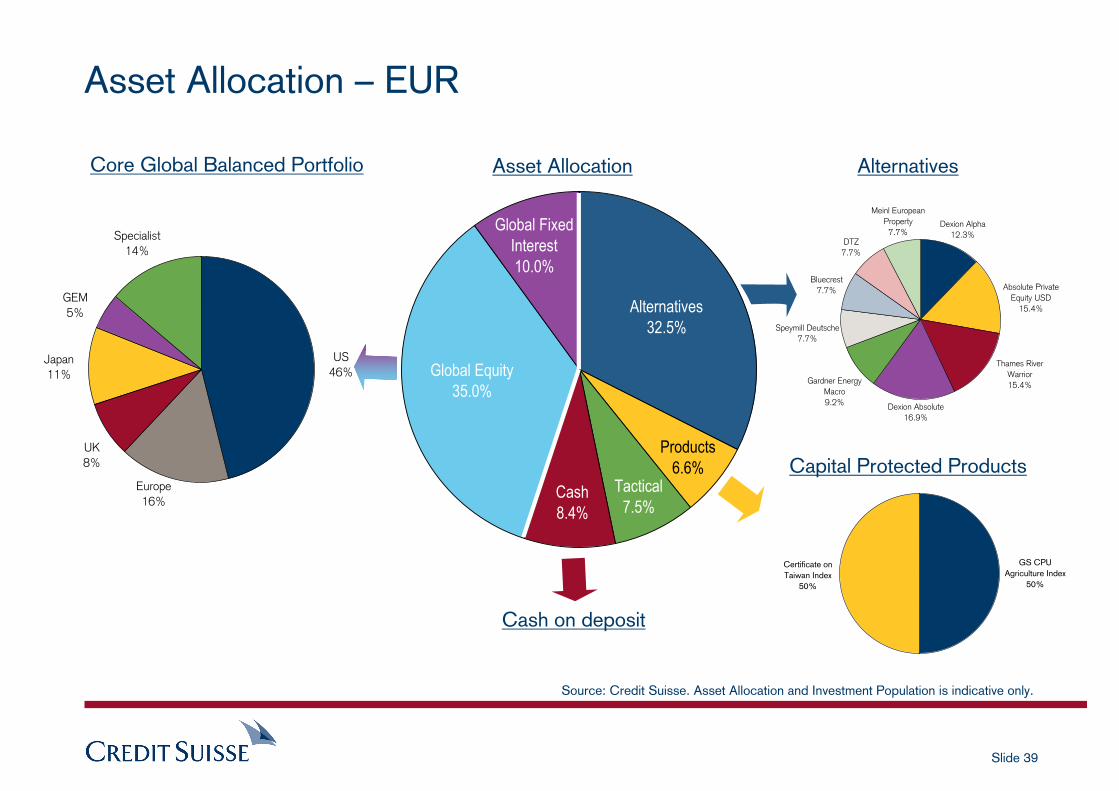
GEM5%
Japan11%
UK8%
Europe16%
US46%
Specialist14%
Global Equity35.0%
Cash8.4%
Tactical7.5%
Products6.6%
Alternatives32.5%
Global Fixed Interest10.0%
Asset Allocation – EUR
Bluecrest7.7%
DTZ7.7%
Meinl European Property
7.7%
Speymill Deutsche7.7%
Gardner Energy Macro9.2%
Dexion Alpha12.3%
Absolute Private Equity USD
15.4%
Thames River Warrior15.4%
Dexion Absolute16.9%
Certificate on Taiwan Index
50%
GS CPU Agriculture Index
50%
Asset AllocationCore Global Balanced Portfolio Alternatives
Capital Protected Products
Cash on deposit
Source: Credit Suisse. Asset Allocation and Investment Population is indicative only.
Slide 40
Where is the industry going?
Slide 41
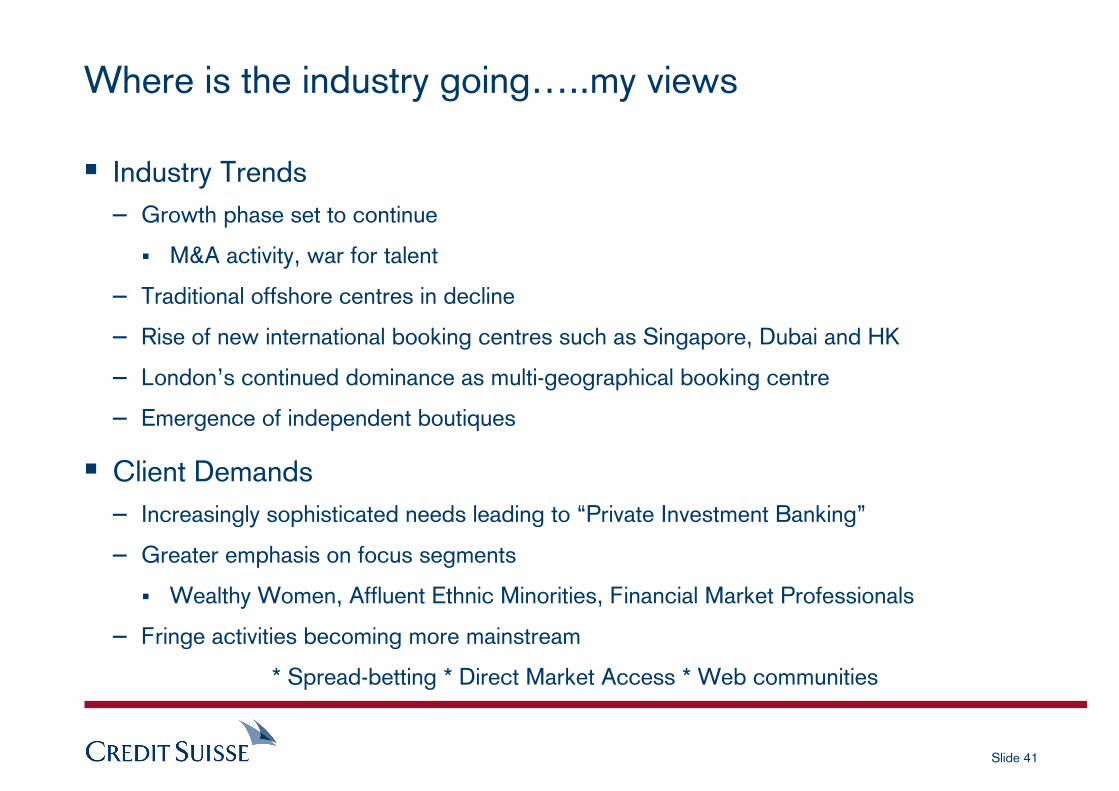
Where is the industry going…..my views
Industry Trends– Growth phase set to continue
M&A activity, war for talent
– Traditional offshore centres in decline
– Rise of new international booking centres such as Singapore, Dubai and HK
– London’s continued dominance as multi-geographical booking centre
– Emergence of independent boutiques
Client Demands– Increasingly sophisticated needs leading to “Private Investment Banking”
– Greater emphasis on focus segments
Wealthy Women, Affluent Ethnic Minorities, Financial Market Professionals
– Fringe activities becoming more mainstream
* Spread-betting * Direct Market Access * Web communities
Slide 42
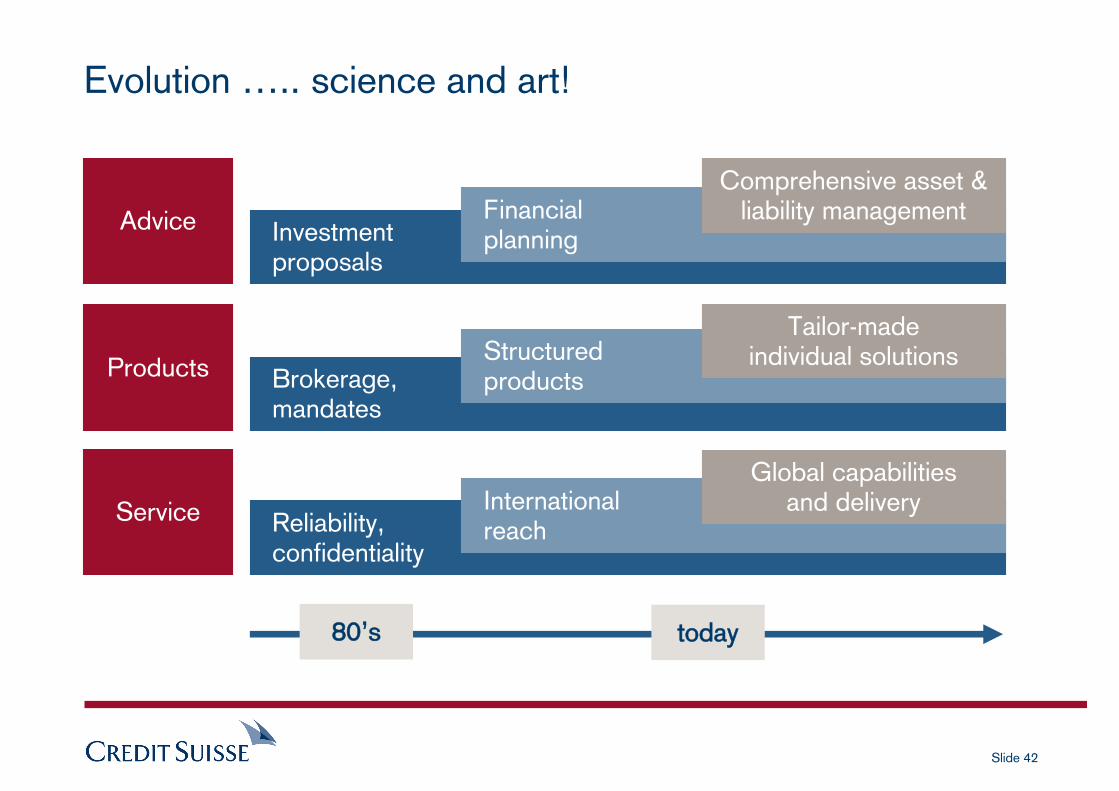
Investment proposals
Brokerage,mandates
Reliability,confidentiality
Evolution ….. science and art!
Advice
Products
Service
Financial planning
Structured products
Internationalreach
Comprehensive asset & liability management
Tailor-made individual solutions
Global capabilities and delivery
80’s today

Slide 43
Slide 44
NAME: JEREMY PARLONS
TITLE: VICE PRESIDENT
COMPANY: CREDIT SUISSE
DIRECT: +44 (0)20 7888 5294
MOBILE: +44 (0)7990 675328
FAX: +44 (0)20 7883 4562
EMAIL: [email protected]
If you have any queries regarding this presentation or about further services from Credit Suisse, please do not hesitate to contact us.
Slide 45
Important information
This document is provided to you for your information and discussion only. It is not a solicitation or an offer to buy or sell any security or other financial instrument. Any information including facts, opinions or quotations, may be condensed or summarised and is expressed as of the date of writing. The information may change without notice and Credit Suisse (UK) Limited and Credit Suisse Securities (Europe) Limited (together “Credit Suisse”) are under no obligation to ensure that such updates are brought to your attention.
The price and value of investments mentioned and any income that might accrue could fall or rise or fluctuate. Past performance is not a guide to future performance. If an investment is denominated in a currency other than your base currency, changes in the rate of exchange may have an adverse effect on value, price or income. This document and any related recommendations or strategies may not be suitable for you; you should ensure that you fully understand the potential risks and rewards and independently determine that it is suitable for you given your objectives, experience, financial resources and any other relevant circumstances. You should consult with such advisor(s) as you consider necessary to assist you in making these determinations. Nothing in this document constitutes investment, legal, accounting or tax advice, or a representation that any investment or strategy is suitable or appropriate to your individual circumstances, or otherwise constitutes a personal recommendation to you.
Credit Suisse does not advise on the tax consequences of investments and you are advised to contact a tax advisor should you have any questions in this regard. The levels and basis of taxation are dependent on individual circumstances and are subject to change.
This document may relate to investments or services of an entity/person outside the UK, or to other matters which are not regulated by the FSA, or in respect of which the protections of the FSA for private customers and/or the UK Financial Services Compensation Scheme may not be available. Further details as to where this may be the case are available on request in respect of this document. This document has been prepared from sources Credit Suisse believes to be reliable but we do not guarantee its accuracy or completeness and do not accept liability for any loss arising from its use. Credit Suisse reserves the right to remedy any errors that may be present in this document.
Credit Suisse its affiliates and/or their employees may have a position or holding, or other material interest or effect transactions in any securities mentioned or options thereon, or other investments related thereto and from time to time may add to or dispose of such investments. Credit Suisse may be providing, or have provided within the previous 12 months, significant advice or investment services in relation to the investment concerned or a related investment to any company or issuer mentioned. Some investments referred to in this document will be offered by a single entity or an associate of Credit Suisse or Credit Suisse may be the only market maker in such investments.
This document is intended only for the person to whom it is issued by Credit Suisse. It may not be reproduced either in whole, or in part, without our written permission. The distribution of this document and the offer and sale of the investment in certain jurisdictions may be forbidden or restricted by law or regulation.
Investments may have no public market or only a restricted secondary market. Where a secondary market exists, it is not possible to predict the price at which investments will trade in the market or whether such market will be liquid or illiquid. As such investments will not be listed or traded on any exchange, pricing information may be more difficult to obtain and the liquidity of the investments may be adversely affected. A holder may be able to realise value prior to an investment’s maturity date only at a price in an available secondary market.
The issuer of the investment may have entered into contracts with third parties to create the indicated returns and/or any applicable capital protection (in part or in full). In the event of default by the issuer of the investment, and/or any third party the investment any income derived from such contracts is not guaranteed and you may get back none of, or less than, what was originally invested.
Any capital protection given is usually an inherent part of the product; provided through the use of options, futures or other derivative products. You may have to accept smaller returns on an investment relative to a direct investment in the underlying index, basket, etc. because of the costs involved in providing the capital protection. Such capital protection normally only applies if the investment is held until maturity. The amount of initial capital to be repaid may be geared, which means that a fall in the underlying index or securities may result in a larger reduction in the amount repaid to investors.
Where this document relates to packaged products (such as regulated collective investment schemes), any advice offered to private customers is based on a selection of products from the whole of the market. Where this document relates to emerging markets you should refer to Part 2 of Section C of Credit Suisse’s Terms and Conditions. Additional information is, subject to duties of confidentiality, available from Credit Suisse upon request.
Credit Suisse (UK) Limited and Credit Suisse Securities (Europe) Limited are associated but independent legal and regulated entities within the Credit Suisse Group and are authorised and regulated by the Financial Services Authority for the conduct of investment business in the United Kingdom. The registered addresses of Credit Suisse (UK) Limited and Credit Suisse Securities (Europe) Limited are Five Cabot Square, London, E14 4QR and One Cabot Square, London, E14 4QJ respectively. If you have any questions regarding the document, please contact your Advisor.
© Credit Suisse (UK) Limited 2006.
As at 16 January 2006