Embed Size (px)
Citation preview
Confidential
Trends of infection-related hospitalization rates in a large
Canadian cohort of chronic dialysis patients accounting for dialysis-vintage
Journal: CMAJ Open
Manuscript ID: CMAJOpen-2012-0027
Manuscript Type: Cohort (retrospective)
Date Submitted by the Author: 21-Nov-2012
Complete List of Authors: Lafrance, Jean-Philippe; Hôpital Maisonneuve-Rosemont, Service de néphrologie Rahme, Elham; Research Institute for McGill University Health Centre , Medicine Iqbal, Sameena; McGill University Health Centre, nephrology Elftouh, Naoual; Hôpital Maisonneuve-Rosemont, Service de néphrologie Laurin, Louis-Philippe; Hôpital Maisonneuve-Rosemont, Service de néphrologie Vallée, Michel; Hôpital Maisonneuve-Rosemont, Service de néphrologie
Keywords: Epidemiology, Infectious diseases, Nephrology
More Detailed Keywords:
Abstract:
Background: After cardiovascular disease, infection is the second leading cause of hospitalization among patients receiving chronic dialysis. How dialysis vintage influence infection-related hospitalization (IRH) rates and trends remains unclear. Our objective was to describe IRH rate trends among chronic dialysis patients, with a focus on dialysis vintage. Methods: Using provincial administrative databases, we built a retrospective cohort of all adult chronic dialysis patients (hemodialysis and peritoneal dialysis) between 2001 and 2007. We evaluated IRH rate trends according to dialysis vintage using stratification and standardization. Results: 9822 patients (mean age=66.3±14.7 years, and 40% female) were followed for a median time of 2.1 (1.0-3.9) years. Between 2001 and 2007, IRH remained stable (0.20 to 0.19 /p-y; P=0.7). All-cause hospitalization rates decreased by 23% (1.53 to 1.18 /p-y; P<0.001) and cardiovascular admissions rates by 47% (0.45 to 0.24 /p-y; P<0.001). IRH remained stable throughout dialysis vintage (Pinteraction=0.12). Both all-cause and cardiovascular hospitalizations rates decreased with time on dialysis (Pinteraction<0.001). Standardization of hospitalization rates with age and sex, or dialysis vintage did not change interpretation of trends. Interpretation: We found a decreasing trend of all-cause and cardiovascular hospitalization rates among patients on chronic dialysis, independently of age and sex, or dialysis vintage. Differently, trend of IRH remained stable, leading to an increase of the proportion of admissions related to infections. Hospitalizations are potentially preventable; therefore understanding epidemiology of IRH may inform future studies on prevention of this serious outcome.
For Peer Review Only

Confidential
Page 1 of 25
For Peer Review Only
123456789101112131415161718192021222324252627282930313233343536373839404142434445464748495051525354555657585960
Confidential
1
Title: Trends of infection-related hospitalization rates in a large Canadian cohort of chronic
dialysis patients accounting for dialysis-vintage
Authors:
Jean-Philippe Lafrance1,2,3
; Elham Rahme4,5
; Sameena Iqbal4,6
; Naoual Elftouh1; Louis-Philippe
Laurin3; Michel Vallée
2,3
Affiliations:
1- Centre de recherche Hôpital Maisonneuve-Rosemont, Montréal, Canada
2- Département de Médecine, Université de Montréal, Montréal, Canada
3- Service de néphrologie, Hôpital Maisonneuve-Rosemont, Montréal, Canada
4- Department of Medicine, McGill University, Montreal, Quebec, Canada
5- Research Institute, McGill University Health Centre, Montreal, Quebec, Canada
6- Division of Nephrology, McGill University Health Centre, Montréal, Québec, Canada
Corresponding Author:
Jean-Philippe Lafrance
Service de néphrologie, Hôpital Maisonneuve-Rosemont
5415, boul. de l’Assomption
Montréal (Québec)
Canada, H1T 2M4
Phone: 514-252-3400 x7737
Fax: 514-251-7094
Email: [email protected]
Running Title: Hospitalization rates among dialysis patients
Word Count:
Abstract: 235 words; Manuscript: 2499 words
Page 2 of 25
For Peer Review Only
123456789101112131415161718192021222324252627282930313233343536373839404142434445464748495051525354555657585960
Confidential
2
Abstract
Background: After cardiovascular disease, infection is the second leading cause of
hospitalization among patients receiving chronic dialysis. How dialysis vintage influence
infection-related hospitalization (IRH) rates and trends remains unclear. Our objective was to
describe IRH rate trends among chronic dialysis patients, with a focus on dialysis vintage.
Methods: Using provincial administrative databases, we built a retrospective cohort of all adult
chronic dialysis patients (hemodialysis and peritoneal dialysis) between 2001 and 2007. We
evaluated IRH rate trends according to dialysis vintage using stratification and standardization.
Results: 9822 patients (mean age=66.3±14.7 years, and 40% female) were followed for a median
time of 2.1 (1.0-3.9) years. Between 2001 and 2007, IRH remained stable (0.20 to 0.19 /p-y;
P=0.7). All-cause hospitalization rates decreased by 23% (1.53 to 1.18 /p-y; P<0.001) and
cardiovascular admissions rates by 47% (0.45 to 0.24 /p-y; P<0.001). IRH remained stable
throughout dialysis vintage (Pinteraction=0.12). Both all-cause and cardiovascular hospitalizations
rates decreased with time on dialysis (Pinteraction<0.001). Standardization of hospitalization rates
with age and sex, or dialysis vintage did not change interpretation of trends.
Interpretation: We found a decreasing trend of all-cause and cardiovascular hospitalization
rates among patients on chronic dialysis, independently of age and sex, or dialysis vintage.
Differently, trend of IRH remained stable, leading to an increase of the proportion of admissions
related to infections. Hospitalizations are potentially preventable; therefore understanding
epidemiology of IRH may inform future studies on prevention of this serious outcome.
Keywords: Renal Dialysis; Kidney Failure, Chronic; Epidemiology; Hospitalization; Infection;
Cardiovascular diseases.
Page 3 of 25
For Peer Review Only
123456789101112131415161718192021222324252627282930313233343536373839404142434445464748495051525354555657585960
Confidential
3
Introduction
End-stage renal disease (ESRD) is the last stage of kidney failure. ESRD is irreversible; to survive,
patients with ESRD require a renal replacement therapy. The two modalities of renal
replacement therapy are dialysis (including hemodialysis and peritoneal dialysis) and kidney
transplantation. Chronic dialysis is associated with a high burden of morbidity requiring frequent
and longer hospital admissions.1,2
Studies conducted in the United States (US) reported high
frequencies of infection-related hospitalizations (IRH) and associated morbidity and mortality in
the dialysis population.1,3-7
While rates of all-cause hospitalization remained fairly stable, rates
of IRH among dialysis patients increased by 30.6% between 1994 and 2009 in the US.1 These
findings were at the origin of programs recognizing the need to decrease the use of
hemodialysis tunnelled catheters, one of the main causes of infection in this population.1,8
Similar studies have not been conducted in Canada. US estimates may not apply to the Canadian
population because dialysis populations significantly differ between the two countries.1,8
Among
others, varying factors are: demographics (including age and race),1,8,9
vascular access use,10
and
mortality rates.1,8
Patients initiating dialysis have a poor five-year survival rate of around 40%.8 Because patients
with major co-morbidities or older patients have a higher mortality rate, patients who survived a
few years of dialysis (prevalent patients) greatly differ than patients initiating dialysis (incident
patients). Therefore, one could hypothesize that hospitalization rates would decrease with time
on dialysis. However, other factors come into play such as catheter removal, arising of
cardiovascular and other complications (which would increase hospitalization rates), or kidney
transplants. In brief, how IRH rates vary with dialysis vintage when all those factors are
combined remains unpredictable and not well described. Because proportion of incident and
Page 4 of 25
For Peer Review Only
123456789101112131415161718192021222324252627282930313233343536373839404142434445464748495051525354555657585960
Confidential
4
prevalent patients may change over time, reporting hospitalization rates without controlling for
dialysis vintage may confound results. Until now, trends of IRH rates were usually reported for
prevalent patients and not for incident patients. While the United-States Renal Data System
(USRDS) annual report recently presented data on incident patients, only first-year
hospitalization rates were reported.1 Because IRH are potentially preventable, it is important to
assess their frequency and associated risk factors to inform prevention strategies aiming to
improve patient care.
The aim of this study was to describe population-based incidence rate trends from 2001 to 2007
of IRH among incident and prevalent dialysis patients, with a focus on dialysis vintage.
Methods
Study population and data sources
We obtained data from provincial health services administrative databases. Virtually all eight
millions residents of Québec, Canada, are covered for their physician and hospital services by a
universal single-payer health care system (Régie de l’assurance maladie du Québec, RAMQ). The
RAMQ physician fee-for-service claims databases include all visits, diagnosis codes (International
Classification of Diseases, 9th
Revision, ICD-9) and procedures during in- or outpatient
encounters. Primary diagnoses (coded by medical archivists using ICD-9 or ICD-10 after 2006) for
each hospitalization was obtained from the hospital discharge summary database. Discharge
summary data in Quebec have been validated for a number of conditions including hip
fracture,11
stroke,12
myocardial infarction13
and injuries.14
For these conditions data accuracy
was generally high.
Study cohort
We included in the study cohort all adult (≥18 years old) patients who were on chronic dialysis
(hemodialysis or peritoneal dialysis) between January 1, 2001 and December 31, 2007. Both
Page 5 of 25
For Peer Review Only
123456789101112131415161718192021222324252627282930313233343536373839404142434445464748495051525354555657585960
Confidential
5
incident (new patients initiating dialysis during the study period) and prevalent (patients already
on dialysis at the beginning of the study) patients were included. While limiting the cohort to
only incident patients would have resulted in a simpler cohort, including prevalent patients
allowed having patients with different dialysis vintages starting in 2001, and therefore was
essential to evaluate trends over the entire study period. We excluded patients who had less
than 90 days of follow-up after chronic dialysis initiation, or had a prior kidney transplant. The
90-day criterion was used to ensure only maintenance dialysis patients were kept and to have a
cohort comparable to other chronic dialysis cohorts. Patients were followed from January 1,
2001 or chronic dialysis initiation until death, kidney transplantation, or end of the study
(December 31, 2007).
Admission categories
We identified all admissions during study follow-up. Hospitalizations at the time of dialysis
initiation were excluded. Each admission was categorized using ICD-9 or -10 according to the
primary diagnosis on the discharge sheet in three mutually exclusive categories: Infection,
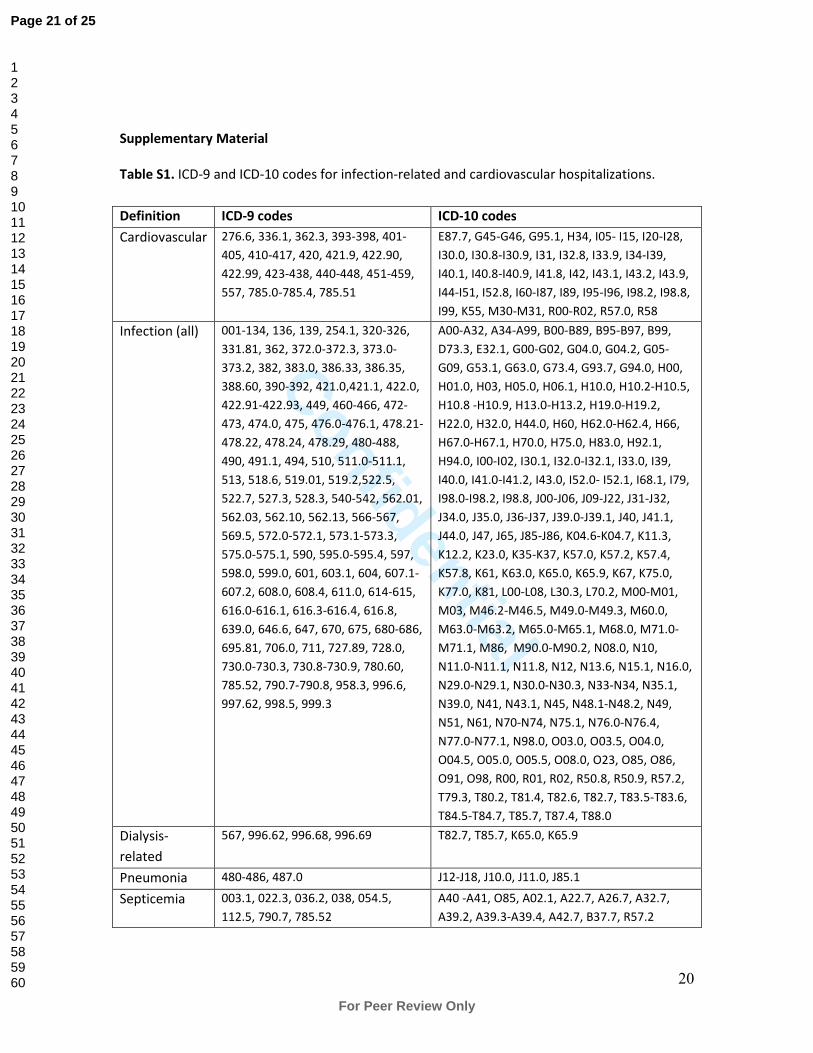
cardiovascular, or other cause (see Table S1 for specific codes). While the focus of this study was
IRH, we included cardiovascular hospitalization because it is the principal cause of
hospitalization in that population. Infections were further subdivided in dialysis-related
infections, pneumonia, septicemia, and other infections (see Table S1).
Dialysis vintage
A dialysis vintage status was attributed to each patient for every calendar year. This variable was
categorized according to the number of years the patient has been on dialysis: <1 year, ≥1 and
<2 years, ≥2 and <3 years… If a patient initiated dialysis in the calendar year of interest, he was
attributed the status <1 year. Since we had no access to data before January 1, 1999, patients
with dialysis codes in January 1999 were assumed to have started dialysis in 1998 or before.
Page 6 of 25
For Peer Review Only
123456789101112131415161718192021222324252627282930313233343536373839404142434445464748495051525354555657585960
Confidential
6
These patients were categorized as ≥3 years in 2001, ≥4 years in 2002, ≥5 years in 2003, et
cetera.
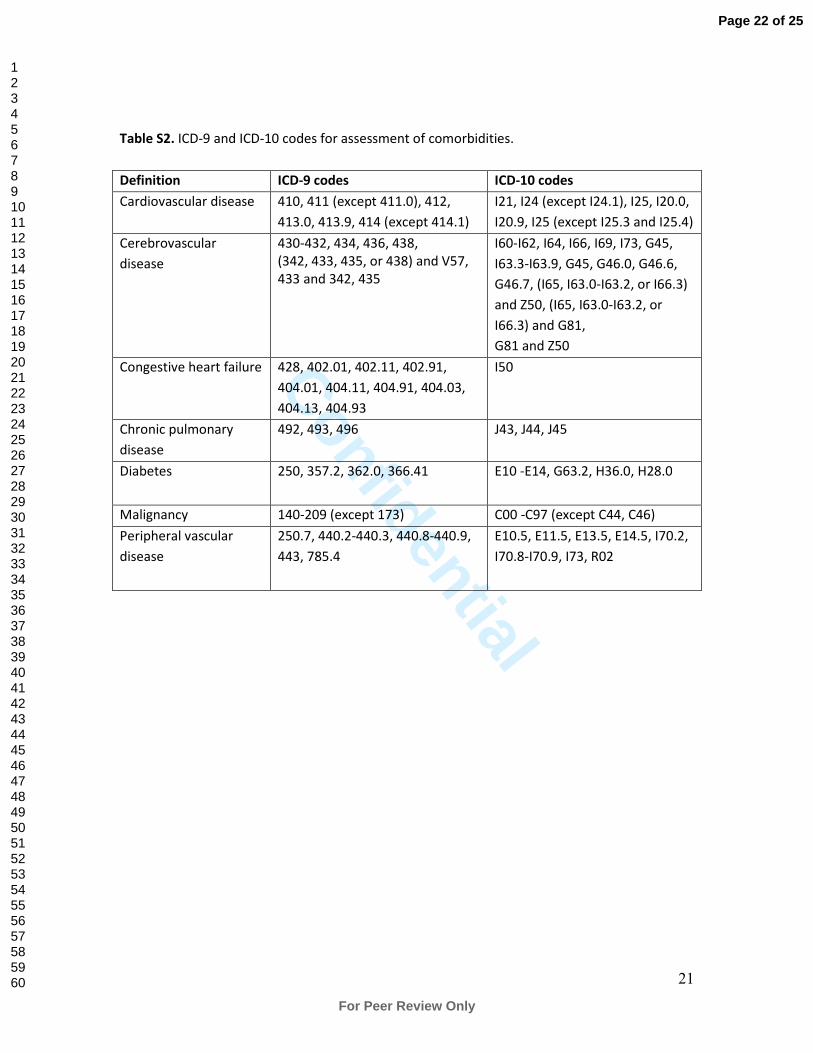
Co-morbidities
Co-morbidities were assessed at the beginning of follow-up using ICD-9 codes in the two years
prior to cohort entry, and included: cardiovascular disease, cerebrovascular disease, congestive
heart failure, chronic pulmonary disease, diabetes, malignancy, and peripheral vascular disease
(see Table S2 for specific codes).
Statistical analysis
Unadjusted admission rates were calculated by dividing the number of admissions by the total
patient-years (p-y) of follow-up (number of days between dialysis initiation and end of follow-up
summed over all study patients divided by 365.25 days). 95% confidence intervals (CI) for rates
were calculated using a Poisson distribution. Linear trends were tested using the Mantel trend
statistic.15
Dialysis vintage-standardized rates were produced using the whole cohort person-
time distribution, and using dialysis vintage strata (<1, 1, 2, ≥3 years) that were common
throughout all calendar years. We also calculated age and sex standardized rates using the same
reference population, and using four age strata (<55, 55-64, 65-74, ≥75). Because of a
prohibitive increase in number of strata, we were not able to calculate adjusted rates for both
dialysis vintage and demographics. However, statistical interaction between dialysis vintage and
calendar time was evaluated by including a multiplicative term (calendar_year*dialysis_vintage)
in a Poisson multivariate regression model. All analyses were done using SAS 9.2 (Cary, North
Carolina).
Sensitivity analyses
To ensure robustness of hospitalization rates trends with dialysis vintage, we conduct a similar
analysis but using survival-modeling techniques. To model and plot how instantaneous risk of
Page 7 of 25
For Peer Review Only
123456789101112131415161718192021222324252627282930313233343536373839404142434445464748495051525354555657585960
Confidential
7
hospitalization varied with time from dialysis initiation (baseline hazard function), a counting-
process Cox regression model for recurrent events with the Breslow estimator was used.16
We
also redid all analysis where we excluded patients initiating dialysis before January 1999, since
their dialysis initiation date was unknown. Finally, we analyses were redone by dialysis modality.
Ethical considerations
This study was approved by Maisonneuve-Rosemont Hospital and Government of Québec
(Commission d’accès à l’information) ethics committees, and informed consent was waived.
Results
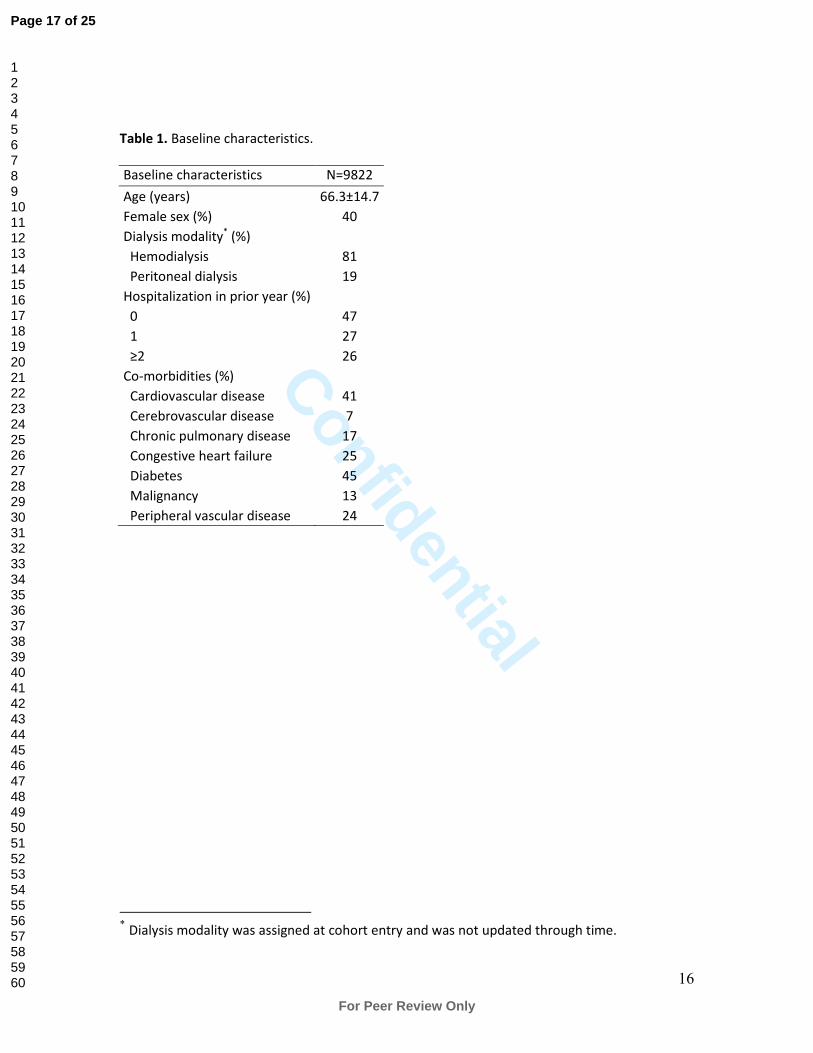
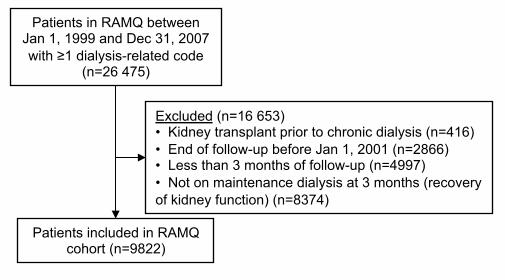
We included 9822 patients in the cohort (Figure 1). Baseline characteristics are presented in
Table 1. Mean age was 66.3 (±14.7) years, 40% were female, and 81% were on hemodialysis at
90 days of follow-up. Diabetes and cardiovascular disease were the most prevalent co-
morbidities at 45% and 41%, respectively. Incident patients (n=6767) represented 69% of the
whole cohort.
Patients were followed for a median time of 2.1 (interquartile range (IR): 1.0-3.9) years. During
the entire follow-up, we identified 35 246 admissions. Recurrent admissions for a given patient
were frequent: No admissions, 1181 patients (12%); one admission, 1923 patients (20%); two
admissions, 1645 patients (17%); three or more admissions, 5073 patients (52%). The median
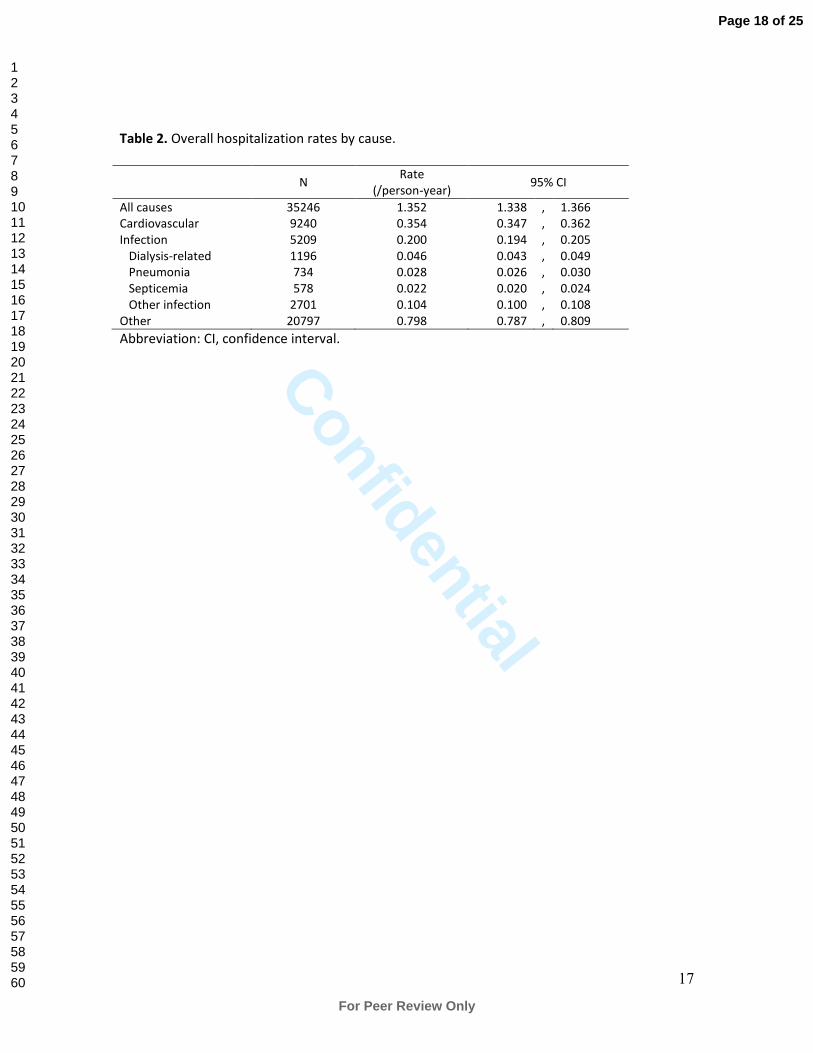
length of stay was 4 days (IR: 1-12 days). Overall rates of admissions are given in Table 2. As
expected, cardiovascular-related hospitalizations were the most frequent (0.354 /p-y), followed
by IRH (0.200 /p-y). Among IRH, dialysis-related infections were the most frequent reason of
hospitalization (0.046 /p-y).
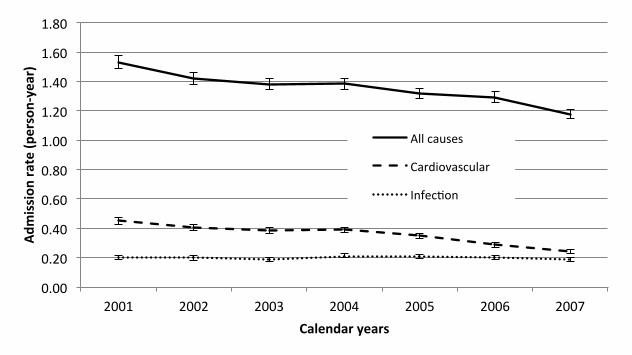
Trends of rates by calendar time are shown on Table 3 and Figure 2. While between 2001 and
2007 all-cause hospitalization rates decreased by 23% (1.53 to 1.18 /p-y) (P trend <0.001) and
cardiovascular admissions rates decreased by 47% (0.45 to 0.24 /p-y) (P trend <0.001), IRH
Page 8 of 25
For Peer Review Only
123456789101112131415161718192021222324252627282930313233343536373839404142434445464748495051525354555657585960
Confidential
8
remained stable (P trend = 0.73). Therefore, the proportion of admissions related to infections
increased from 13 to 16% of all admissions.
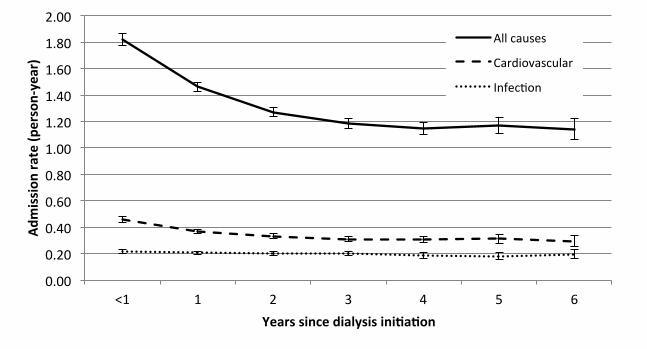
As shown on Figure 3, IRH remained fairly stable throughout dialysis vintage (P trend=0.12).
Differently, all-cause and cardiovascular hospitalizations rates decreased with time on dialysis (P
trend <0.001 for both). For both, most of the downward slope was in the first three years of
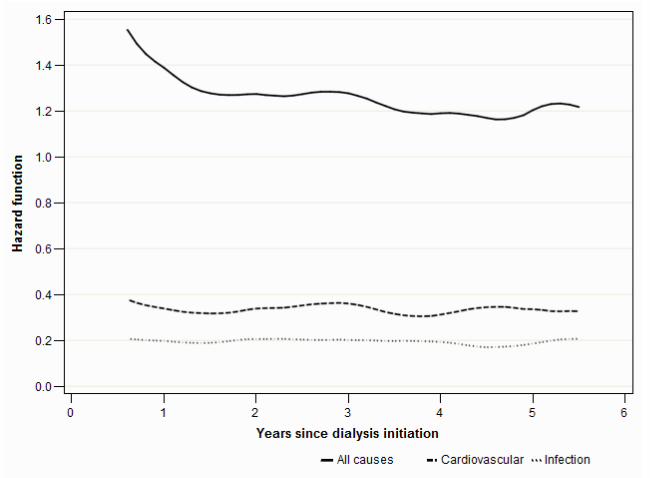
dialysis initiation. Findings from these trends were also supported by the modeled baseline
hazard function (Figure 4).
Interaction between calendar time and dialysis vintage was not statistically significant for IRH
(P=0.85). However, this interaction was statistically significant for all-cause hospitalizations rates
(P<0.001), meaning that hospitalization rate trends over calendar years varied with dialysis
vintage categories. Interaction was significant for cardiovascular (P=0.04). However, dialysis
vintage-standardized rates were highly similar to unadjusted rates (Table 3), signifying that this
interaction did not influence much trends over time. Age and sex adjusted rates were also very
similar to unadjusted rates (Table 3).
The sensitivity analysis where we excluded patients who initiated dialysis before January 1999
led to similar results (data not shown). Trends between hemodialysis and peritoneal patients
were similar (data not shown).
Interpretation
This study describes in a large cohort of Canadian chronic dialysis patients trends of IRH and
impact of dialysis vintage. We found stable rates of IRH, but decreasing rates of all-cause and
cardiovascular hospitalizations over time. Therefore, hospitalization’s burden attributable to
infection increased over the years. Similarly, we found decreasing rates of all-cause and
cardiovascular hospitalizations with dialysis vintage, but not with IRH. While we found
interaction between calendar time and dialysis vintage for all-cause and cardiovascular
Page 9 of 25
For Peer Review Only
123456789101112131415161718192021222324252627282930313233343536373839404142434445464748495051525354555657585960
Confidential
9
hospitalizations, trends of dialysis-vintage adjusted hospitalization rates were very similar to
unadjusted rates.
All-cause and IRH rates among patients on dialysis have not been studied in Canada. The USRDS
annual report showed slightly decreasing all-cause hospitalization rates trends: from 1.97 to
1.90 /p-y between 2001 and 2007.1 Those rates are higher than what we are reporting, but
comparisons should be use with caution because of case-mix differences between populations,
as dialysis populations significantly differ between countries.1,8,17
Infection-related and
cardiovascular hospitalizations were also higher in the US at 0.46 /p-y and 0.56 /p-y,
respectively, for hemodialysis patients on 2007.1 Both rates were relatively stable between 2001
and 2007.1
Why IRH are not decreasing between 2001 and 2007 remains unclear, and should be the focus
of further studies. It may be explained by increasing prevalence of diabetes in the chronic
dialysis population. Furthermore, despite that vascular access-related bloodstream infections
are recognized as a major cause of infections in the dialysis population and that catheter use
(instead of arteriovenous shunts) is the principal risk factor for those infections, proportion of
catheter use increased from 76.8% to 82.6% among incident hemodialysis patients in Canada
between 2001 and 2009.8,10,18
Other reported risk factors for IRH are: older age,19-21
female sex,21
black race,19,20
no insurance,19
smoking,22
diabetes,5,19-21,23
high co-morbidity score,5 heart
failure,21
pulmonary disease,21
lower serum albumin,5,19-21
decreased hematocrit levels,24
higher
use of erythropoietin,24
and corticosteroid use.22
Decreasing trends in all-cause hospitalizations over calendar time may be explained by the fact
that some interventions, such as vascular access or cardiovascular procedures, which used to be
done in an inpatient setting, are now done in an outpatient setting. Decreasing trends in
Page 10 of 25
For Peer Review Only
123456789101112131415161718192021222324252627282930313233343536373839404142434445464748495051525354555657585960
Confidential
10
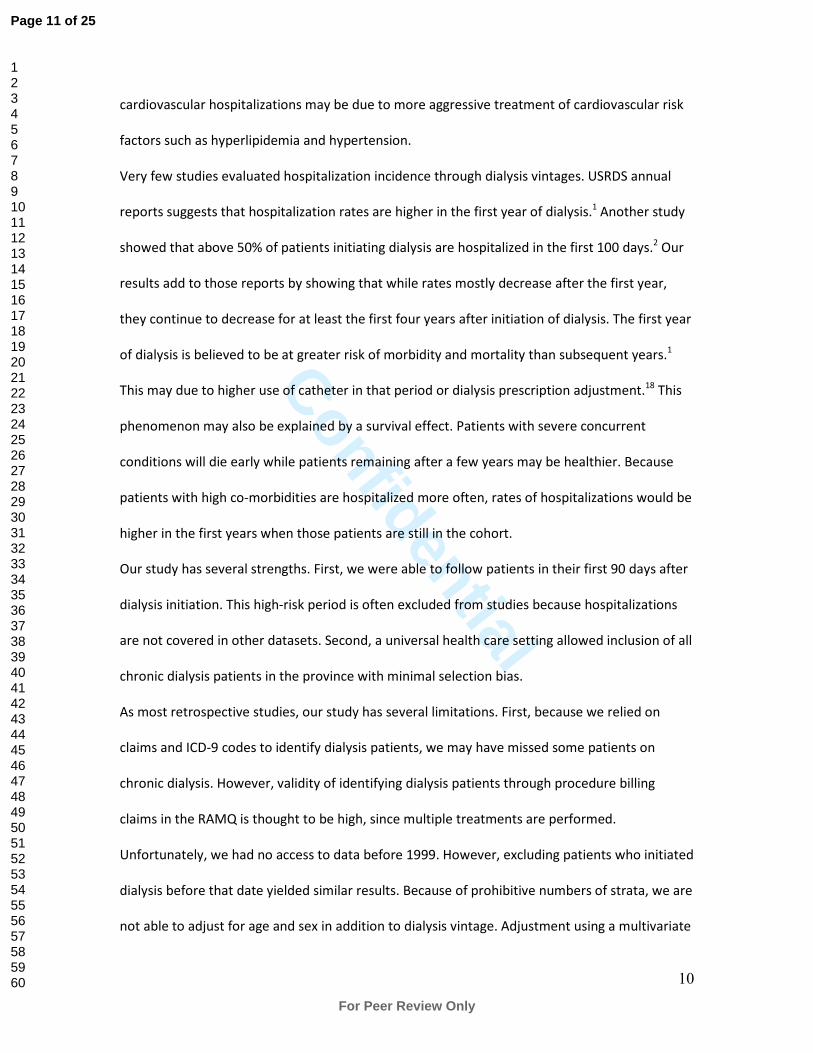
cardiovascular hospitalizations may be due to more aggressive treatment of cardiovascular risk
factors such as hyperlipidemia and hypertension.
Very few studies evaluated hospitalization incidence through dialysis vintages. USRDS annual
reports suggests that hospitalization rates are higher in the first year of dialysis.1 Another study
showed that above 50% of patients initiating dialysis are hospitalized in the first 100 days.2 Our
results add to those reports by showing that while rates mostly decrease after the first year,
they continue to decrease for at least the first four years after initiation of dialysis. The first year
of dialysis is believed to be at greater risk of morbidity and mortality than subsequent years.1
This may due to higher use of catheter in that period or dialysis prescription adjustment.18
This
phenomenon may also be explained by a survival effect. Patients with severe concurrent
conditions will die early while patients remaining after a few years may be healthier. Because
patients with high co-morbidities are hospitalized more often, rates of hospitalizations would be
higher in the first years when those patients are still in the cohort.
Our study has several strengths. First, we were able to follow patients in their first 90 days after
dialysis initiation. This high-risk period is often excluded from studies because hospitalizations
are not covered in other datasets. Second, a universal health care setting allowed inclusion of all
chronic dialysis patients in the province with minimal selection bias.
As most retrospective studies, our study has several limitations. First, because we relied on
claims and ICD-9 codes to identify dialysis patients, we may have missed some patients on
chronic dialysis. However, validity of identifying dialysis patients through procedure billing
claims in the RAMQ is thought to be high, since multiple treatments are performed.
Unfortunately, we had no access to data before 1999. However, excluding patients who initiated
dialysis before that date yielded similar results. Because of prohibitive numbers of strata, we are
not able to adjust for age and sex in addition to dialysis vintage. Adjustment using a multivariate
Page 11 of 25
For Peer Review Only
123456789101112131415161718192021222324252627282930313233343536373839404142434445464748495051525354555657585960
Confidential
11
model would be an alternative to overcome this issue, but would only give an estimate of the
trend and not actual rates, which are a lot easier to interpret clinically. Nevertheless, age
distribution and sex proportion did not change significantly during the observed period. In
addition, age-sex adjusted rates were almost identical to unadjusted rates, which confirms
previous findings where hospitalization rates were similar between elderly and younger patients
on hemodialysis.1,25
While many factors may change over time and with dialysis vintage, the goal
of this analysis was to evaluate the resulting effect on IRH of those changes occurring with
dialysis vintage. Adjusting for intermediate factors such as co-morbidities could take away the
effect from dialysis vintage. Further studies are needed to investigate mechanisms or explaining
factors between dialysis vintage and IRH rates.
In summary, we found a decreasing trend of all-cause and cardiovascular hospitalization rates
among patients on chronic dialysis, independently of age and sex, or dialysis vintage. Differently,
trend of IRH remained stable over time, leading to an increase of the proportion of admissions
related to infections from 13 to 16% of all admissions. While both all-cause and cardiovascular
hospitalizations rates decreased with dialysis vintage, IRH rates remained stable. Understanding
epidemiology of IRH among patients receiving chronic dialysis may inform future studies on
prevention of this common and serious outcome.
Acknowledgements:
This work was supported by a Fonds de la recherche en santé du Québec (FRSQ) operating
grant. Dr. Lafrance is supported by a KRESCENT New Investigator Award.
Disclosure
None to declare.
Page 12 of 25
For Peer Review Only
123456789101112131415161718192021222324252627282930313233343536373839404142434445464748495051525354555657585960
Confidential
12
References
1. U.S. Renal Data System. USRDS 2011 Annual Data Report: Atlas of Chronic Kidney
Disease and End-Stage Renal Disease in the United States. Bethesda, MD: National
Institutes of Health, National Institute of Diabetes and Digestive and Kidney
Diseases;2011.
2. Quinn MP, Cardwell CR, Rainey A, et al. Patterns of hospitalisation before and following
initiation of haemodialysis: a 5 year single centre study. Postgrad Med J. Jun
2011;87(1028):389-393.
3. Chavers BM, Solid CA, Gilbertson DT, Collins AJ. Infection-related hospitalization rates in
pediatric versus adult patients with end-stage renal disease in the United States. J Am
Soc Nephrol. Mar 2007;18(3):952-959.
4. Rayner HC, Pisoni RL, Bommer J, et al. Mortality and hospitalization in haemodialysis
patients in five European countries: results from the Dialysis Outcomes and Practice
Patterns Study (DOPPS). Nephrol Dial Transplant. Jan 2004;19(1):108-120.
5. Allon M, Depner TA, Radeva M, et al. Impact of Dialysis Dose and Membrane on
Infection-Related Hospitalization and Death: Results of the HEMO Study. J Am Soc
Nephrol. July 1, 2003 2003;14(7):1863-1870.
6. Allon M, Radeva M, Bailey J, et al. The spectrum of infection-related morbidity in
hospitalized haemodialysis patients. Nephrol Dial Transplant. Jun 2005;20(6):1180-1186.
7. Dalrymple LS, Mohammed SM, Mu Y, et al. Risk of cardiovascular events after infection-
related hospitalizations in older patients on dialysis. Clin J Am Soc Nephrol. Jul
2011;6(7):1708-1713.
Page 13 of 25
For Peer Review Only
123456789101112131415161718192021222324252627282930313233343536373839404142434445464748495051525354555657585960
Confidential
13
8. Canadian Institute for Health Information. Treatment of End-Stage Organ Failure in
Canada, 2000 to 2009 (2011 Annual Report). Ottawa: CIHI;2011.
9. Canaud B, Tong L, Tentori F, et al. Clinical Practices and Outcomes in Elderly
Hemodialysis Patients: Results from the Dialysis Outcomes and Practice Patterns Study
(DOPPS). Clin J Am Soc Nephrol. July 1, 2011 2011;6(7):1651-1662.
10. Ethier J, Mendelssohn DC, Elder SJ, et al. Vascular access use and outcomes: an
international perspective from the Dialysis Outcomes and Practice Patterns Study.
Nephrol Dial Transplant. Oct 2008;23(10):3219-3226.
11. Levy AR, Mayo NE, Grimard G. Rates of transcervical and pertrochanteric hip fractures in
the province of Quebec, Canada, 1981-1992. Am J Epidemiol. Aug 15 1995;142(4):428-
436.
12. Mayo NE, Goldberg MS, Levy AR, Danys I, Korner-Bitensky N. Changing rates of stroke in
the province of Quebec, Canada: 1981-1988. Stroke. May 1991;22(5):590-595.
13. Jollis JG, Ancukiewicz M, DeLong ER, Pryor DB, Muhlbaier LH, Mark DB. Discordance of
databases designed for claims payment versus clinical information systems. Implications
for outcomes research. Ann Intern Med. Oct 15 1993;119(8):844-850.
14. Tamblyn R, Reid T, Mayo N, McLeod P, Churchill-Smith M. Using medical services claims
to assess injuries in the elderly: sensitivity of diagnostic and procedure codes for injury
ascertainment. J Clin Epidemiol. Feb 2000;53(2):183-194.
15. Rothman K, Greenland S, Lash T. Modern Epidemiology. Third ed. Philadelphia:
Lippincott Williams & Wilkins; 2008.
16. Andersen PK, Borgan O, Gill RD, Keiding N. Statistical Models Based on Counting
Processes. Berlin: Springer; 1993.
Page 14 of 25
For Peer Review Only
123456789101112131415161718192021222324252627282930313233343536373839404142434445464748495051525354555657585960
Confidential
14
17. Goodkin DA, Young EW, Kurokawa K, Prutz KG, Levin NW. Mortality among hemodialysis
patients in Europe, Japan, and the United States: case-mix effects. Am J Kidney Dis. Nov
2004;44(5 Suppl 2):16-21.
18. Lafrance JP, Iqbal S, Lelorier J, et al. Vascular access-related bloodstream infections in
First Nations, community and teaching Canadian dialysis units, and other centre-level
predictors. Nephron Clin Pract. 2010;114(3):c204-212.
19. Powe NR, Jaar B, Furth SL, Hermann J, Briggs W. Septicemia in dialysis patients:
incidence, risk factors, and prognosis. Kidney Int. Mar 1999;55(3):1081-1090.
20. Aslam N, Bernardini J, Fried L, Burr R, Piraino B. Comparison of Infectious Complications
between Incident Hemodialysis and Peritoneal Dialysis Patients. Clin J Am Soc Nephrol.
November 2006 2006;1(6):1226-1233.
21. Dalrymple LS, Johansen KL, Chertow GM, et al. Infection-related hospitalizations in older
patients with ESRD. Am J Kidney Dis. Sep 2010;56(3):522-530.
22. Franklin J, Lunt M, Bunn D, Symmons D, Silman A. Risk and predictors of infection
leading to hospitalisation in a large primary-care-derived cohort of patients with
inflammatory polyarthritis. Ann Rheum Dis. Mar 2007;66(3):308-312.
23. Shah BR, Hux JE. Quantifying the risk of infectious diseases for people with diabetes.
Diabetes Care. Feb 2003;26(2):510-513.
24. Nissenson AR, Dylan ML, Griffiths RI, Yu HT, Dubois RW. Septicemia in patients with
ESRD is associated with decreased hematocrit and increased use of erythropoietin. Clin J
Am Soc Nephrol. May 2006;1(3):505-510.
25. Sun Y, Kassam H, Adeniyi M, et al. Hospital admissions in elderly patients on chronic
hemodialysis. Int Urol Nephrol. Dec 2011;43(4):1229-1236.
Page 15 of 25
For Peer Review Only
123456789101112131415161718192021222324252627282930313233343536373839404142434445464748495051525354555657585960

Confidential
15
Page 16 of 25
For Peer Review Only
123456789101112131415161718192021222324252627282930313233343536373839404142434445464748495051525354555657585960
Confidential
16
Table 1. Baseline characteristics.
Baseline characteristics N=9822
Age (years) 66.3±14.7
Female sex (%) 40
Dialysis modality* (%)
Hemodialysis 81
Peritoneal dialysis 19
Hospitalization in prior year (%)
0 47
1 27
≥2 26
Co-morbidities (%)
Cardiovascular disease 41
Cerebrovascular disease 7
Chronic pulmonary disease 17
Congestive heart failure 25
Diabetes 45
Malignancy 13
Peripheral vascular disease 24
* Dialysis modality was assigned at cohort entry and was not updated through time.
Page 17 of 25
For Peer Review Only
123456789101112131415161718192021222324252627282930313233343536373839404142434445464748495051525354555657585960
Confidential
17
Table 2. Overall hospitalization rates by cause.
N Rate
(/person-year) 95% CI
All causes 35246 1.352 1.338 , 1.366
Cardiovascular 9240 0.354 0.347 , 0.362
Infection 5209 0.200 0.194 , 0.205
Dialysis-related 1196 0.046 0.043 , 0.049
Pneumonia 734 0.028 0.026 , 0.030
Septicemia 578 0.022 0.020 , 0.024
Other infection 2701 0.104 0.100 , 0.108
Other 20797 0.798 0.787 , 0.809
Abbreviation: CI, confidence interval.
Page 18 of 25
For Peer Review Only
123456789101112131415161718192021222324252627282930313233343536373839404142434445464748495051525354555657585960

Confidential
18
Table 3. Hospitalization rates (per person-year) by calendar year, standardized by age-sex, and
dialysis vintage.
Year N All causes Infection Cardiovascular
Crude Age-sex* Vintage
† Crude Age-sex Vintage Crude Age-sex Vintage
2001 4232 1.53 1.54 1.52 0.20 0.20 0.20 0.45 0.45 0.45
2002 4383 1.42 1.42 1.41 0.20 0.20 0.20 0.41 0.41 0.40
2003 4492 1.38 1.38 1.38 0.19 0.19 0.19 0.38 0.38 0.38
2004 4570 1.38 1.38 1.39 0.21 0.21 0.21 0.39 0.39 0.39
2005 4753 1.32 1.32 1.32 0.21 0.21 0.21 0.35 0.35 0.35
2006 4921 1.29 1.30 1.31 0.20 0.20 0.20 0.29 0.29 0.29
2007 4822 1.18 1.18 1.19 0.19 0.19 0.19 0.24 0.24 0.24
P trend <0.001 0.7 <0.001
* Adjusted for age and sex considering the whole cohort distribution as the reference
population. † Adjusted for dialysis vintage considering the whole cohort distribution as the reference
population.
Page 19 of 25
For Peer Review Only
123456789101112131415161718192021222324252627282930313233343536373839404142434445464748495051525354555657585960
Confidential
19
Legends to Figures
Figure 1. Derivation of cohort. Excluded patients with less than 3 months of follow-up represent
patients who died or reached end of study period before 90 days.
Figure 2. Unadjusted admission rates by calendar years.
Figure 3. Unadjusted admission rates by dialysis vintage.
Figure 4. Hazard function for all-cause and cause-specific admissions using recurrent
hospitalizations (counting-process Cox regression model).
Page 20 of 25
For Peer Review Only
123456789101112131415161718192021222324252627282930313233343536373839404142434445464748495051525354555657585960
Confidential
20
Supplementary Material
Table S1. ICD-9 and ICD-10 codes for infection-related and cardiovascular hospitalizations.
Definition ICD-9 codes ICD-10 codes
Cardiovascular 276.6, 336.1, 362.3, 393-398, 401-
405, 410-417, 420, 421.9, 422.90,
422.99, 423-438, 440-448, 451-459,
557, 785.0-785.4, 785.51
E87.7, G45-G46, G95.1, H34, I05- I15, I20-I28,
I30.0, I30.8-I30.9, I31, I32.8, I33.9, I34-I39,
I40.1, I40.8-I40.9, I41.8, I42, I43.1, I43.2, I43.9,
I44-I51, I52.8, I60-I87, I89, I95-I96, I98.2, I98.8,
I99, K55, M30-M31, R00-R02, R57.0, R58
Infection (all) 001-134, 136, 139, 254.1, 320-326,
331.81, 362, 372.0-372.3, 373.0-
373.2, 382, 383.0, 386.33, 386.35,
388.60, 390-392, 421.0,421.1, 422.0,
422.91-422.93, 449, 460-466, 472-
473, 474.0, 475, 476.0-476.1, 478.21-
478.22, 478.24, 478.29, 480-488,
490, 491.1, 494, 510, 511.0-511.1,
513, 518.6, 519.01, 519.2,522.5,
522.7, 527.3, 528.3, 540-542, 562.01,
562.03, 562.10, 562.13, 566-567,
569.5, 572.0-572.1, 573.1-573.3,
575.0-575.1, 590, 595.0-595.4, 597,
598.0, 599.0, 601, 603.1, 604, 607.1-
607.2, 608.0, 608.4, 611.0, 614-615,
616.0-616.1, 616.3-616.4, 616.8,
639.0, 646.6, 647, 670, 675, 680-686,
695.81, 706.0, 711, 727.89, 728.0,
730.0-730.3, 730.8-730.9, 780.60,
785.52, 790.7-790.8, 958.3, 996.6,
997.62, 998.5, 999.3
A00-A32, A34-A99, B00-B89, B95-B97, B99,
D73.3, E32.1, G00-G02, G04.0, G04.2, G05-
G09, G53.1, G63.0, G73.4, G93.7, G94.0, H00,
H01.0, H03, H05.0, H06.1, H10.0, H10.2-H10.5,
H10.8 -H10.9, H13.0-H13.2, H19.0-H19.2,
H22.0, H32.0, H44.0, H60, H62.0-H62.4, H66,
H67.0-H67.1, H70.0, H75.0, H83.0, H92.1,
H94.0, I00-I02, I30.1, I32.0-I32.1, I33.0, I39,
I40.0, I41.0-I41.2, I43.0, I52.0- I52.1, I68.1, I79,
I98.0-I98.2, I98.8, J00-J06, J09-J22, J31-J32,
J34.0, J35.0, J36-J37, J39.0-J39.1, J40, J41.1,
J44.0, J47, J65, J85-J86, K04.6-K04.7, K11.3,
K12.2, K23.0, K35-K37, K57.0, K57.2, K57.4,
K57.8, K61, K63.0, K65.0, K65.9, K67, K75.0,
K77.0, K81, L00-L08, L30.3, L70.2, M00-M01,
M03, M46.2-M46.5, M49.0-M49.3, M60.0,
M63.0-M63.2, M65.0-M65.1, M68.0, M71.0-
M71.1, M86, M90.0-M90.2, N08.0, N10,
N11.0-N11.1, N11.8, N12, N13.6, N15.1, N16.0,
N29.0-N29.1, N30.0-N30.3, N33-N34, N35.1,
N39.0, N41, N43.1, N45, N48.1-N48.2, N49,
N51, N61, N70-N74, N75.1, N76.0-N76.4,
N77.0-N77.1, N98.0, O03.0, O03.5, O04.0,
O04.5, O05.0, O05.5, O08.0, O23, O85, O86,
O91, O98, R00, R01, R02, R50.8, R50.9, R57.2,
T79.3, T80.2, T81.4, T82.6, T82.7, T83.5-T83.6,
T84.5-T84.7, T85.7, T87.4, T88.0
Dialysis-
related
567, 996.62, 996.68, 996.69 T82.7, T85.7, K65.0, K65.9
Pneumonia 480-486, 487.0 J12-J18, J10.0, J11.0, J85.1
Septicemia 003.1, 022.3, 036.2, 038, 054.5,
112.5, 790.7, 785.52
A40 -A41, O85, A02.1, A22.7, A26.7, A32.7,
A39.2, A39.3-A39.4, A42.7, B37.7, R57.2
Page 21 of 25
For Peer Review Only
123456789101112131415161718192021222324252627282930313233343536373839404142434445464748495051525354555657585960
Confidential
21
Table S2. ICD-9 and ICD-10 codes for assessment of comorbidities.
Definition ICD-9 codes ICD-10 codes
Cardiovascular disease 410, 411 (except 411.0), 412,
413.0, 413.9, 414 (except 414.1)
I21, I24 (except I24.1), I25, I20.0,
I20.9, I25 (except I25.3 and I25.4)
Cerebrovascular
disease
430-432, 434, 436, 438,
(342, 433, 435, or 438) and V57,
433 and 342, 435
I60-I62, I64, I66, I69, I73, G45,
I63.3-I63.9, G45, G46.0, G46.6,
G46.7, (I65, I63.0-I63.2, or I66.3)
and Z50, (I65, I63.0-I63.2, or
I66.3) and G81,
G81 and Z50
Congestive heart failure 428, 402.01, 402.11, 402.91,
404.01, 404.11, 404.91, 404.03,
404.13, 404.93
I50
Chronic pulmonary
disease
492, 493, 496 J43, J44, J45
Diabetes 250, 357.2, 362.0, 366.41 E10 -E14, G63.2, H36.0, H28.0
Malignancy 140-209 (except 173) C00 -C97 (except C44, C46)
Peripheral vascular
disease
250.7, 440.2-440.3, 440.8-440.9,
443, 785.4
E10.5, E11.5, E13.5, E14.5, I70.2,
I70.8-I70.9, I73, R02
Page 22 of 25
For Peer Review Only
123456789101112131415161718192021222324252627282930313233343536373839404142434445464748495051525354555657585960
Confidential
Patients in RAMQ between Jan 1, 1999 and Dec 31, 2007 with ≥1 dialysis-related code
(n=26 475)
Excluded (n=16 653) • Kidney transplant prior to chronic dialysis (n=416) • End of follow-up before Jan 1, 2001 (n=2866) • Less than 3 months of follow-up (n=4997) • Not on maintenance dialysis at 3 months (recovery of kidney function) (n=8374)
Patients included in RAMQ cohort (n=9822)
Page 23 of 25
For Peer Review Only
123456789101112131415161718192021222324252627282930313233343536373839404142434445464748495051525354555657585960
Confidential
Figure 2
Figure 3.
0.00
0.20
0.40
0.60
0.80
1.00
1.20
1.40
1.60
1.80
2001 2002 2003 2004 2005 2006 2007
Admission
rate (p
erson-‐year)
Calendar years
All causes
Cardiovascular
Infec<on
0.00
0.20
0.40
0.60
0.80
1.00
1.20
1.40
1.60
1.80
2.00
<1 1 2 3 4 5 6
Admission
rate (p
erson-‐year)
Years since dialysis ini6a6on
All causes
Cardiovascular
Infec<on
Page 24 of 25
For Peer Review Only
123456789101112131415161718192021222324252627282930313233343536373839404142434445464748495051525354555657585960
Confidential
Figure 2
Figure 3.
0.00
0.20
0.40
0.60
0.80
1.00
1.20
1.40
1.60
1.80
2001 2002 2003 2004 2005 2006 2007
Admission
rate (p
erson-‐year)
Calendar years
All causes
Cardiovascular
Infec<on
0.00
0.20
0.40
0.60
0.80
1.00
1.20
1.40
1.60
1.80
2.00
<1 1 2 3 4 5 6
Admission
rate (p
erson-‐year)
Years since dialysis ini6a6on
All causes
Cardiovascular
Infec<on
Page 25 of 25
For Peer Review Only
123456789101112131415161718192021222324252627282930313233343536373839404142434445464748495051525354555657585960
Confidential
Page 26 of 25
For Peer Review Only
123456789101112131415161718192021222324252627282930313233343536373839404142434445464748495051525354555657585960